ERRATUM: Photogrammetric set-up for the analysis of particle motion in aerosol under microgravity...
13
Meas. Sci. Technol. 10 (1999) 921–933. Printed in the UK PII: S0957-0233(99)02090-1 Photogrammetric set-up for the analysis of particle motion in aerosol under microgravity conditions O Dupont†, F Dubois†, A Vedernikov†, J C Legros†, J Willneff‡ and C Lockowandt§ † Universit´ e Libre de Bruxelles, Microgravity Research Centre, CP 165/62; 50 av F D Roosevelt, 1050 Bruxelles, Belgium ‡ Institute of Geodesy and Photogrammetry, ETH-Hoenggerberg CH-8093 Zurich, Switzerland § Swedish Space Corporation, Albygatan 107, S-171 04 Solna, Sweden E-mail: [email protected], [email protected] and [email protected] Received 23 February 1999, in final form and accepted for publication 13 July 1999 Abstract. An optical set-up to investigate the motion of aerosol particles under microgravity conditions has been designed and manufactured. It provides accurate measurement of 3D coordinates of up to 1000 particles, discrimination between particles of different nature and estimation of the angular velocity of small aerosol crystals. A photogrammetric technique is applied to track independently moving particles, using the acquisition and processing of stereoscopic image sequences. The optical scheme of the set-up is based on a unique objective that collects the light coming from different directions from the back- and front-illuminated aerosol, and transfers it to four different cameras. Driving parameters for the optical head design and image quality are discussed. The set-up performance was verified on optical test objects, aerosol simulators and also real aerosol under microgravity conditions during parabolic flight. The set-up has been designed for use in the JET experiment on board the Maser 8 sounding rocket. The experiment aims at the first direct observation of the chemojet motion of free-flying small growing crystals. Investigation of chemojet motion along with elaboration of the image analysis technique is focused on the development of highly sensitive, real-time, non-perturbative analysis of the reactions on the surface of aerosol particles. Keywords: 3D particle tracking, 3D velocimetry, photogrammetry, crystal growth 1. Introduction Aerosols proliferate in natural and technogenic processes, filling the Earth’s atmosphere and cosmic space. Usually, aerosols are in a nonequilibrium state, the particles having some kind of physico-chemical interaction with the gas; such as sublimation, absorption, or a topochemical or catalytic reaction. It was shown recently that, in such cases, free- flying aerosol particles undergo not only random but also oriented momentum exchange with the gas atoms/molecules (Vedernikov and Melikhov 1994, Melikhov and Vedernikov 1995). The latter arises because the rate of any process is non-uniform along the surface of a particle and is time dependent. Although chemojet motion can be much more intensive than Brownian motion, it is still very weak. The accuracy of determination of the chemojet motion parameters is extremely sensitive to gravity because of the hydrodynamic influence of sedimentation. Only broad features can be estimated on Earth. Experimentation in microgravity conditions removes this limitation and allows us not only to investigate this new phenomenon but also to develop on its basis a highly sensitive, real-time, non- perturbative research tool for the analysis of reactions on the surface of aerosol particles. This paper describes the optical concept, its design and hardware, as well as the photogrammetric method to be used in the JET experiment aiming to investigate chemojet motion. The experiment is to be realized in a European Space Agency (ESA) module for the Maser 8 sounding rocket developed by the Swedish Space Corporation to be launched in 1999 at Esrange, Sweden. Peculiarities of the JET experiment are briefly described in section 2, where the scientific requirements for the optical set-up are formulated. Section 3 deals with 3D particle tracking velocimetry (3D PTV), which was found to be the most suitable measurement technique. It allows one to track independently moving particles and to measure the velocity distribution functions of two kinds of particles, presenting elastic and inelastic collisions respectively. 3D PTV can be considered as a typical application field of digital photogrammetry involving the acquisition and processing of stereoscopic image sequences of moving particles. The reactor chamber 0957-0233/99/100921+13$30.00 © 1999 IOP Publishing Ltd 921
Transcript of ERRATUM: Photogrammetric set-up for the analysis of particle motion in aerosol under microgravity...

Meas. Sci. Technol.10 (1999) 921–933. Printed in the UK PII: S0957-0233(99)02090-1
Photogrammetric set-up for theanalysis of particle motion in aerosolunder microgravity conditions
O Dupont †, F Dubois †, A Vedernikov †, J C Legros †, J Willneff ‡and C Lockowandt §
† Universite Libre de Bruxelles, Microgravity Research Centre, CP 165/62; 50 av F DRoosevelt, 1050 Bruxelles, Belgium‡ Institute of Geodesy and Photogrammetry, ETH-Hoenggerberg CH-8093 Zurich,Switzerland§ Swedish Space Corporation, Albygatan 107, S-171 04 Solna, Sweden
E-mail: [email protected], [email protected] [email protected]
Received 23 February 1999, in final form and accepted for publication 13 July 1999
Abstract. An optical set-up to investigate the motion of aerosol particles under microgravityconditions has been designed and manufactured. It provides accurate measurement of 3Dcoordinates of up to 1000 particles, discrimination between particles of different nature andestimation of the angular velocity of small aerosol crystals. A photogrammetric technique isapplied to track independently moving particles, using the acquisition and processing ofstereoscopic image sequences. The optical scheme of the set-up is based on a unique objectivethat collects the light coming from different directions from the back- and front-illuminatedaerosol, and transfers it to four different cameras. Driving parameters for the optical headdesign and image quality are discussed. The set-up performance was verified on optical testobjects, aerosol simulators and also real aerosol under microgravity conditions duringparabolic flight. The set-up has been designed for use in the JET experiment on board theMaser 8 sounding rocket. The experiment aims at the first direct observation of the chemojetmotion of free-flying small growing crystals. Investigation of chemojet motion along withelaboration of the image analysis technique is focused on the development of highly sensitive,real-time, non-perturbative analysis of the reactions on the surface of aerosol particles.
Keywords: 3D particle tracking, 3D velocimetry, photogrammetry, crystal growth
1. Introduction
Aerosols proliferate in natural and technogenic processes,filling the Earth’s atmosphere and cosmic space. Usually,aerosols are in a nonequilibrium state, the particles havingsome kind of physico-chemical interaction with the gas; suchas sublimation, absorption, or a topochemical or catalyticreaction. It was shown recently that, in such cases, free-flying aerosol particles undergo not only random but alsooriented momentum exchange with the gas atoms/molecules(Vedernikov and Melikhov 1994, Melikhov and Vedernikov1995). The latter arises because the rate of any processis non-uniform along the surface of a particle and is timedependent. Although chemojet motion can be much moreintensive than Brownian motion, it is still very weak.The accuracy of determination of the chemojet motionparameters is extremely sensitive to gravity because ofthe hydrodynamic influence of sedimentation. Only broadfeatures can be estimated on Earth. Experimentation inmicrogravity conditions removes this limitation and allowsus not only to investigate this new phenomenon but also
to develop on its basis a highly sensitive, real-time, non-perturbative research tool for the analysis of reactions onthe surface of aerosol particles. This paper describes theoptical concept, its design and hardware, as well as thephotogrammetric method to be used in the JET experimentaiming to investigate chemojet motion. The experiment is tobe realized in a European Space Agency (ESA) module forthe Maser 8 sounding rocket developed by the Swedish SpaceCorporation to be launched in 1999 at Esrange, Sweden.
Peculiarities of the JET experiment are briefly describedin section 2, where the scientific requirements for the opticalset-up are formulated.
Section 3 deals with 3D particle tracking velocimetry(3D PTV), which was found to be the most suitablemeasurement technique. It allows one to track independentlymoving particles and to measure the velocity distributionfunctions of two kinds of particles, presenting elastic andinelastic collisions respectively. 3D PTV can be consideredas a typical application field of digital photogrammetryinvolving the acquisition and processing of stereoscopicimage sequences of moving particles. The reactor chamber
0957-0233/99/100921+13$30.00 © 1999 IOP Publishing Ltd 921

O Dupontet al
(RC) is viewed from four different directions to avoidambiguities and to obtain a high tracking reliability oflong particle trajectories. Thus, the spatial coordinatesof each particle are retrieved by triangulation between thesimultaneously recorded images. The velocity of eachparticle is straightforwardly computed using the particledisplacements calculated from successive maps of particlepositions and the time delaytacq between them. Suchmeasurements give rise to an accurate estimation of the3D velocities and this approach thus yields an individualidentification of the particles, unlike the Doppler method.
A description of the imaging system, light source andgeneral architecture of the sounding rocket module is givenin section 4. The optical design is based on a specialconfiguration that allows us to simultaneously record fourpictures of the RC with a unique objective collecting the lightfrom different directions and transferring it to the differentcameras with the help of a set of mirrors. The experimentchamber is illuminated from two sides along the optical axis.Background illumination is used to determine the positionsof the particles in the visualized volume of the RC. Frontillumination facilitates discrimination between referenceparticles and crystals as well as yielding information aboutrotation of the aerosol crystals.
The set-up performance was verified on several opticaltest objects, aerosol simulators, and also real aerosol undermicrogravity conditions during parabolic flight. Results ofthe experimental tests are presented in section 5. It was foundthat the optical system and photogrammetric technique meetthe scientific requirements.
2. Description of the experimental system
The primary goal of the JET experiment is to carry out thefirst direct observation of chemojet motion and to verifythe available theoretical model. Crystal growth by physicalvapour transport is chosen as an example of the physico-chemical process responsible for the oriented momentumexchange between gas and aerosol particles. In thisexperiment the aerosol comprises two types of particles ofabout the same size—urotropine crystals and glass balloonscoated with gold. The latter do not grow under the conditionsof the experiment and are used as reference particles, notsubject to chemojet motion. Urotropine monocrystals arecolourless, having various prismatic shapes with flat faces.The change of their size during the experiment is estimatedto be less than 30%. Both types of particles are prepared onEarth and placed in a special container providing separatestorage of each particle in a closed microscopic volume. Theparticles are injected at the beginning of the experimentalrun. The total number of particles in the container does notexceed 1024.
The process is investigated in a parallelepipedic RC filledwith a binary mixture of urotropine vapour and argon. Twoopposite faces of the chamber are used for the visualizationof the aerosol, two other faces are for the particle container,injection unit and mechanical elements, while the last twoopposite faces are connected to the source of urotropinevapour. Oversaturated urotropine vapour concentration iscreated shortly before the launch of the rocket in order to
provide crystal growth. After the beginning of microgravityconditions, both types of particle are injected into the RCwhere they are visualized by the optical unit. The images ofthe aerosol are recorded by an onboard video recorder andtransmitted to Earth in real time through a telemetry channel.
Theoretical analysis shows that crystals exhibitingchemojet motion should have a random distribution ofvelocity vectors in space, a high spread of velocity values andtime variation of both transitional and rotational motion. Inparticular, some of the crystals will rotate and have negligibletransitional component, some will move almost linearly, andsome will stay at rest. Such probabilistic behaviour requiresmotion analysis of a relatively large number of particles.
This is the first time that chemojet motion has beeninvestigated in microgravity conditions, where it shoulddominate over other types of motion. Consequently, onecan expect a high deviation of the actual experimentalvalues from the theoretical predictions. In addition,one cannot exclude the presence of components otherthan chemojet motion due to microgravity disturbances,electrostatic charging, Brownian transitional and rotationalmovement, etc. Therefore, the motion of the particles has tobe analysed by versatile methods and with high accuracy.
The following inequality has to be satisfied:
L3D � d > vctacq > δr (1)
whereL3D is the mean distance between particles in theaerosol,d is the mean crystal size,vc is the mean expectedcrystal velocity due to the chemojet motion,tacq is theacquisition period, andδr is the error of the particlecoordinate determination. The inequality (1) requires thatthe concentration of the number of particles, the acquisitionperiod and the error of the particle coordinate determinationshould be low enough to detect displacements less than theparticle size and to track trajectory changes of each particlemoving independently in the region where collisions arenegligible.
Taking into account heat and mass transport limitations,the main experimental parameters are found to be as follows.Mean crystal size is about 40× 10−6 m with mean expectedvelocityvc of the order of 50× 10−6 m s−1. Mean diameterof the reference particles is about 60× 10−6 m. The RCsubjected to visual analysis is 14×10−3 m height, 11×10−3 mwide and 10×10−3 m deep along the optical axis. The spacedensity of the particles in the aerosol is expected to be nohigher than 400 cm−3, which givesL3D = 1.4×10⁻³ m. Tomeet the inequality expressed in equation (1), the acquisitiontime tacq is taken to be 0.2 s.
Bearing in mind the above-mentioned quantitativeparameters, the optical unit and image processing systemshould provide the following major functions:
• Accurate measurement of the 3D coordinates of eachaerosol particle in the experimental volume, the totalnumber of which will not exceed 1000.• Discrimination between the two types of particles.• Discrimination between rotating and non-rotating
crystals.
922

Photogrammetric set-up for sounding rocket
3. The photogrammetric method
With the development of solid state sensor imaging devicesand powerful computer platforms, new image processingtechniques providing solutions for a large number of 3Dmeasurement tasks have become possible in the past twodecades. While computer vision often deals with qualitativeimage understanding tasks, digital photogrammetry aims atthe derivation of accurate 3D metric information from digitalimages (Grun 1994). By the use of self-calibrating bundleadjustment techniques, 3D object coordinates are determinedfrom multiple images of a scene, simultaneously with themeasurement of the camera parameters such as the CCDorientation and CCD calibration.
The basic equation of photogrammetric 3D coordinatedetermination is the collinearity equation (see, e.g., Slama1980), which simply states that object point, cameraprojective centre and image point lie on a straight line.This mathematical formulation has to be extended to meetthe physical realities. Effects caused by lens distortionand analogue-to-digital conversion are usually compensatedfor by a set of additional parameters. These have tobe determined in the system calibration together with theparameters of orientation of the cameras with respect tothe scene and related to the non-homotetic relation betweenthe scene and its image (distortions). Lens distortion iscompensated for by a set of five additional parametersmodelling radial and decentring distortion (Brown 1971).Compensation for electronic effects, generally the unknowndifference between the pixel rate of a camera and the clockrate of a frame grabber, is often achieved with an affinetransformation using two parameters (El-Hakim 1986). Thecomplete set of parameters has to be determined in a systemcalibration before, during or after the image acquisition ofan actual measurement task. The most flexible way ofdetermining this set of parameters is the self-calibratingbundle adjustment (Brown 1976), where the 3D objectcoordinates, camera orientation data and camera calibrationparameters are determined simultaneously, based only onimage coordinate measurements and at least one scaleinformation in object space.
3.1. The mathematical model
The fundamental mathematical theorem of photogrammetric3D particle coordinate determination is the collinearitycondition, which states that object point, camera projectivecentre and image point lie in a straight line (figure 1).This mathematical formulation, containing three coordinatesX0, Y0, Z0 of the projective centre and three anglesω, ϕ, κdescribing the direction of the optical axes, applies to apinhole camera model and does not consider any opticaldistortions. Therefore, this mathematical approach has tobe extended to meet the physical realities by introducing thefollowing parameters and model extensions:
• The camera constantcst (computational imaging width).• The principal point coordinatesxH , yH , which show
strong deviations from the sensor centre in the chosencamera design.
• Different clock rates between camera and frame grabber,causing a horizontal scale factorsx , which deviates fromone.• The different windows in the optical paths causing a
twice-broken beam to be handled in the collinearityequation.• Compensation of the lens distortion: usually a part of
the camera calibration. This effect can be neglected heredue to the specifications of the chosen lens system (seesection 4).
All these effects are strictly modelled in the 3D PTVimplementation. The parameterscst , xH , yH , sx and the lensdistortion are used to model the camera and are the elementsof the interior orientation. The exterior orientation is theset of the six parametersX0, Y0, Z0, ω, ϕ, κ describing thelocation and orientation of the camera referring to the objectcoordinate system. The mathematical model can be used inthree different modes.
• Spatial resection: the parameters of the exteriororientationX0, Y0, Z0, ω, ϕ, κ and the camera modelcst , xH , yH , sx are determined in the calibrationprocedure from images of a reference body.• Spatial intersection: after calibration of the system and
the establishment of multi-view correspondences, 3Dparticle coordinates can be determined based on theorientation and camera model parameters.• Bundle adjustment: using multiple images of a scene
from each camera, taken under different orientations,object point coordinates, camera orientation parametersand camera model parameters can be determinedsimultaneously, based only on image space informationand a minimum of one size information in object spaceto retrieve the magnification factor.
3.2. Data processing
Figure 2 outlines the data flow of 3D PTV data processing.The subtraction of a background image without tracersgrabbed at the beginning of each sequence is the first stepof the fully automatic data processing chain. Its purposeis to eliminate the global contrast and to remove someinhomogeneities of the background intensity introducedby effects of the illumination. After that, particles canbe detected by thresholding, and their location in imagespace can be determined with subpixel accuracy by acentroid operator. In order to split particles which arepartly overlapping in an image, a modified thresholdingoperator has been developed which searches for localmaxima in the images and splits overlapping particle imagesat local minima (Maas 1992). The most critical stepof the automatic data processing is the establishment ofstereoscopic correspondences between different images ofan object. Particle features (like size, shape, and colour) donot usually allow for a reliable distinction between matchingcandidates. Furthermore, the imaging process influencesthese features. Thus the only information that can be usedfor the establishment of correspondences is the geometricinformation provided by the epipolar line. Knowing theorientation parameters of the cameras from the calibration
923

O Dupontet al
Figure 1. Definition of the mathematical symbols used in the photogrammetric method.
Figure 2. Data flows of the 3D particle tracking velocimetry.
procedure, proceeding from a pointP ′ in one image, anepipolar line in another image can be defined on which
the corresponding point has to be found. The length ofthe line can be restricted if approximate knowledge aboutthe depth range in object space is available. Adding atolerance width to this epipolar line segment, the search areafor the corresponding particle image becomes a narrow 2Dwindow in image space. However, with a large number ofparticles there may be multiple candidates on an epipolarline. Regarding the possible ambiguities, the chosen four-camera arrangement can be considered as ideal: it reducesthe number of remaining ambiguities to almost zero, and iteven allows a reliable determination of most of those particleswhich are completely hidden in one of the four images (Maas1996).
In the next step, the 3D coordinates of all particles can bedetermined by spatial intersection. The standard deviationsof the determined coordinates in planimetry and depth aredepending on the intersection angle of the homologeous rays.Due to the volume limitation of the sounding rocket module,the optimal camera arrangement (90◦ angles between theoptical axes) could not be realized (Virant and Dracos1996). The redundant information provided by the three-or four-times measurement of two image coordinates for thedetermination of three object space coordinates allows usto perform a least-squares adjustment for each individualpoint, thus providing additional precision estimates. Thephotogrammetric determination of particle coordinates isdescribed elsewhere (Maaset al 1993, Maas and Grun1995). As fewer ambiguities can be expected when trackingis performed in 3D space, the establishment of temporalcorrespondences (tracking) is the last step in the processingchain outlined here. The principle of the temporal trackingis similar to the treatment of spatial ambiguities during theestablishment of multi-image correspondences. Proceedingfrom a particle position at a time instantti , a searchvolume around an approximate location at time instantti+1 iscalculated using some rough pre-knowledge about the flow
924

Photogrammetric set-up for sounding rocket
under examination. If a local correlation of velocity vectorscan be assumed, this information can be used to suppress theambiguities. Furthermore, possibly available information onmaximum expected Lagrangian accelerations can be used topropagate possible links into the sets of data at time instantti+2, ti+3, etc, where a reduced search volume can be defined.Possible links betweenti and ti+1 can thus be confirmed orrejected. The tracking procedure is described in more detailby Papantoniou and Dracos (1989) and Maliket al (1993).
3.3. The potential of 3D PTV
With an image format of 720× 576 pixels, the methodallows the determination of velocity vectors of more than1000 particles per time instant using a four-camera system(Stueret al 1999, Stuer, 1999). The relative accuracy of thevector components are approximately 1:4000 (the standarddeviation ofX andY coordinates over the field of view); theaccuracy of the depth componentZ is typically a factor of twoto three worse than the components perpendicular to the mainviewing direction. These figures are valid under controlledconditions. Sub-optimal illumination conditions, complexflows, temperature gradients or image noise may lead to asevere degradation of the potential. In addition to the 3Dvector fields, PTV is also capable of determining particletrajectories, when storage capacity for image sequences isavailable. The length of the trajectories also depends on theseeding density. With a lower number of particles in theobservation volume the probability of ‘losing’ particles dueto unsolved ambiguities in the detection, the establishmentof correspondences or in the tracking procedure, decreases.In practice, particles could be traced over several hundredframes if the number of particles in the observation volumewas kept small. For a statistically reliable analysis of particlemovement, long particle trajectories with a sufficient densityover the whole object volume have to be determined. Due tothe bounded number of particles in the particle bin the lossof data is reduced to a minimum by the use of four cameras(Virant and Dracos 1996).
4. Optical design
3D PTV requires that the RC be viewed from four differentdirections (see figure 3). All of the views are used toretrieve the 3D coordinates of the particles, and one view todiscriminate reference particles from crystals. Two opticalwindows limit the volume of the RC along thez-axis. Theangle between the viewing directions and thez-axis is fixedto 22.5◦ due to mechanical constraints linked to the design ofthe RC. The available surface to fix the RC and its relatedequipment, the illumination and the imaging modules islimited to the flange of the sounding rocket that has a diameterof 0.4 m.
Several optical configurations were identified tosimultaneously record different pictures of the RC. We listthem in the order of increasing use of common opticalelements between the optical paths. The first is the standardoptical set-up used in photogrammetry where a CCD camerawith its optics is used for each viewing direction. Thisleads to an optical layout comprised of four CCDs and
Figure 3. Viewing direction with respect to the experimentchamber.
four objectives. In the second arrangement the numberof objectives is reduced to one, which collects light fromdifferent directions and transfers it to the different cameraswith the help of a set of mirrors. The third arrangementinvolves the replacement of the multiple standard cameras bya unique high-resolution (1k×1k pixel) CCD array, portionsof which are used for the different images. This third opticallayout leads to a very compact and mechanically rigid systembut its drawback is the high data rate downlink from therocket to the Earth. Thus it was the second solution that weselected, as being the best compromise between the opticalrequirements, mass and volume reduction and data handling.
Both background and front illumination of the RC hasto be used, to meet contradictory scientific requirements.Background illumination is used for the determinationof the position of all the particles in the visualizationvolume. Front illumination makes it possible to discriminatebetween reference particles and crystals on the basis of theoptimization of the colour reflected by the reference particlesand absorbed or transmitted by the growing crystals. This isachieved by adding coloured filters in front of the sources andof the CCD. A thermal analysis of the illumination subsystemis performed in order to prevent overheating of the experimentchamber, which could disturb crystal growth.
4.1. The imaging subsystem
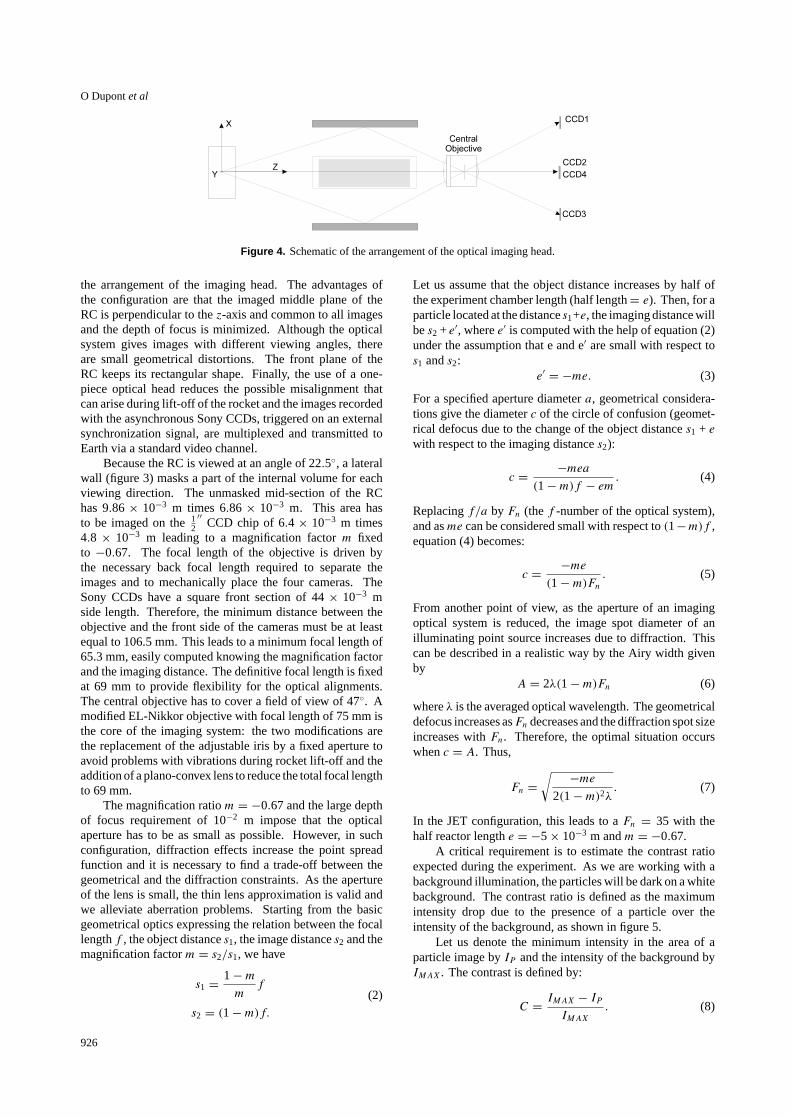
The optical concept selected uses a central objective, placedon the z-axis, which images the RC to the four differentcameras. Four mirrors, placed at mid-distance betweenthe RC and the objective, redirect the optical paths intothe objective. Behind the objective, a set of five mirrorsredirects the optical paths to the cameras. Figure 4 shows
925
O Dupontet al
Figure 4. Schematic of the arrangement of the optical imaging head.
the arrangement of the imaging head. The advantages ofthe configuration are that the imaged middle plane of theRC is perpendicular to thez-axis and common to all imagesand the depth of focus is minimized. Although the opticalsystem gives images with different viewing angles, thereare small geometrical distortions. The front plane of theRC keeps its rectangular shape. Finally, the use of a one-piece optical head reduces the possible misalignment thatcan arise during lift-off of the rocket and the images recordedwith the asynchronous Sony CCDs, triggered on an externalsynchronization signal, are multiplexed and transmitted toEarth via a standard video channel.
Because the RC is viewed at an angle of 22.5◦, a lateralwall (figure 3) masks a part of the internal volume for eachviewing direction. The unmasked mid-section of the RChas 9.86× 10−3 m times 6.86× 10−3 m. This area hasto be imaged on the12
′′CCD chip of 6.4 × 10−3 m times
4.8 × 10−3 m leading to a magnification factorm fixedto −0.67. The focal length of the objective is driven bythe necessary back focal length required to separate theimages and to mechanically place the four cameras. TheSony CCDs have a square front section of 44× 10−3 mside length. Therefore, the minimum distance between theobjective and the front side of the cameras must be at leastequal to 106.5 mm. This leads to a minimum focal length of65.3 mm, easily computed knowing the magnification factorand the imaging distance. The definitive focal length is fixedat 69 mm to provide flexibility for the optical alignments.The central objective has to cover a field of view of 47◦. Amodified EL-Nikkor objective with focal length of 75 mm isthe core of the imaging system: the two modifications arethe replacement of the adjustable iris by a fixed aperture toavoid problems with vibrations during rocket lift-off and theaddition of a plano-convex lens to reduce the total focal lengthto 69 mm.
The magnification ratiom = −0.67 and the large depthof focus requirement of 10−2 m impose that the opticalaperture has to be as small as possible. However, in suchconfiguration, diffraction effects increase the point spreadfunction and it is necessary to find a trade-off between thegeometrical and the diffraction constraints. As the apertureof the lens is small, the thin lens approximation is valid andwe alleviate aberration problems. Starting from the basicgeometrical optics expressing the relation between the focallengthf , the object distances1, the image distances2 and themagnification factorm = s2/s1, we have
s1 = 1−mm
f
s2 = (1−m)f.(2)
Let us assume that the object distance increases by half ofthe experiment chamber length (half length= e). Then, for aparticle located at the distances1+e, the imaging distance willbes2 + e′, wheree′ is computed with the help of equation (2)under the assumption that e and e′ are small with respect tos1 ands2:
e′ = −me. (3)
For a specified aperture diametera, geometrical considera-tions give the diameterc of the circle of confusion (geomet-rical defocus due to the change of the object distances1 + ewith respect to the imaging distances2):
c = −mea(1−m)f − em. (4)
Replacingf/a by Fn (thef -number of the optical system),and asme can be considered small with respect to(1−m)f ,equation (4) becomes:
c = −me(1−m)Fn . (5)
From another point of view, as the aperture of an imagingoptical system is reduced, the image spot diameter of anilluminating point source increases due to diffraction. Thiscan be described in a realistic way by the Airy width givenby
A = 2λ(1−m)Fn (6)
whereλ is the averaged optical wavelength. The geometricaldefocus increases asFn decreases and the diffraction spot sizeincreases withFn. Therefore, the optimal situation occurswhenc = A. Thus,
Fn =√ −me
2(1−m)2λ. (7)
In the JET configuration, this leads to aFn = 35 with thehalf reactor lengthe = −5× 10⁻³ m andm = −0.67.
A critical requirement is to estimate the contrast ratioexpected during the experiment. As we are working with abackground illumination, the particles will be dark on a whitebackground. The contrast ratio is defined as the maximumintensity drop due to the presence of a particle over theintensity of the background, as shown in figure 5.
Let us denote the minimum intensity in the area of aparticle image byIP and the intensity of the background byIMAX. The contrast is defined by:
C = IMAX − IPIMAX
. (8)
926

Photogrammetric set-up for sounding rocket
Figure 5. Definition of the particle image contrast.
Figure 6. Estimation of the contrast ratio due to impulse responseof the imaging system.
The ideal image contrast of a particle illuminated bybackground lighting is 1. However, the image enlargementdue to the diffraction and a defocus from the depth of focustolerance leads to a convolution process that decreases thecontrast. We first evaluate the contrast ratio due to thediffraction process.
An incoherent imaging system is characterized by theimpulse response of the optical system:
Irealistic(x, y) =∫ ∫
p(x − x ′, y − y ′)Iideal(x ′, y ′) dx ′ dy ′
(9)wherep(x, y) is the impulse response due to diffraction. Itswidth is related to the Airy diameterA and for the sake ofsimplicity we assume that it presents a conical shape. Theparticles have a diameter of 40µm and are imaged with amagnification ratio of−0.67. Therefore, the diameter of anideal image of a particle isl = 26.8 µm. With Fn = 35,the Airy discA = 58µm is larger thanl and the contrast isexpected to be smaller than 1 (figure 6).
When the impulse response is perfectly aligned onthe ideal image of a particle, the cylinder defined by theboundary of the perfect image separates the volume of theconical impulse response into two sub-volumes,V1 andV2,according to whether they are inside or outside the cylinder.Geometrical considerations allow us to obtain that:
C = 1− V2
V1 + V2. (10)
By replacing V1 and V2 with the usual expressions ofgeometry yields
C = 3l2A− 2l3
A3. (11)
With l = 26.8 µm, A = 58 µm (Fn = 35), we obtainC = 0.44. The reduction of the contrast due to a defocusis obtained in a very similar way, except that the impulseresponse is a cylinder with a width given by equation (5).
Thus, whenc = 57.3 µm (Fn = 35), the contrastwill be C = 0.2. As the diameter of the confusion circleis zero in the centre of the cell and as it increases whenapproaching the window of the cell, the contrast ratio dueto a defocus will depend on the position of the particle insidethe cell. Due to the fact that the impulse response resultingfrom a defocus is a disc, the combination of the diffractionand defocus effects near the window gives a contrast levelmainly determined by the defocus effect. The combinationof defocus and diffraction leads to a contrast decreasing from0.55 (when the particle is perfectly focused in the medianplane of the cell) to approximately 0.2 (particle located onthe window).
The role of the contrast is of importance to the accuracyof determination of the positions of the particles. As weare working with a background illumination, the particledetection uses images with inverted contrast in order to havebright particles on a dark background. If the recording systemis adjusted to use the full range of 255 grey levels, the contrastratio will reduce the number of available grey levels accordingto
Ngrey = 255C. (12)
The requested accuracy on the position (half-crystalsize or 20µm) requires us to use a sub-pixel accuracymeasurement (about14 pixel) based on measurement ofthe barycentre of light distribution. Reduction of thenumber of available grey levels increases digitization noise.Estimates show that the error of the position determination isproportional toC−1.
However, the problem of reduced accuracy due to thecontrast can partially be overcome. By using a digitizer withan adjustable range of digitization levels, it is possible to takeadvantage of the full contrast range of the particles images.
4.2. The illumination and particle discriminationsubsystem
The illumination system includes back and front illuminationof two different ranges of colour. The purpose ofthe two types of illumination is to discriminate JET-sensitive and reference particles using the difference insurface characteristics: reference particles give rise tohigher-intensity retrodiffused light. In this scheme, thediscrimination of the particles is based on an intensityanalysis which compares the maximum intensity with respectto a threshold: i.e. if retrodiffused light is higher than thethreshold, a particle will be identified as a reference particle,and as an active particle otherwise. For this purpose high-quality coloured filters are used.
One type of filter is placed in the path of the frontillumination and in front of the corresponding CCD imageplane. Another type is used with the back illumination andthe three remaining CCD image planes. The two types offilter are selected to reduce the crosstalk intensity to less than1%.
927

O Dupontet al
The light source is a quartz tungsten halogen lamp of150 W coupled to a ‘one-split-in-two’ fibre bundle, reducingthe constraints on the source position with respect to theoptical head.
A thermal analysis was performed on the illuminationmodule. The quartz tungsten halogen light source generatesheat that burns the input plane of the light bundle and perturbsthe thermal regulation of the RC. Because the rocket moduleis at very low pressure during the experiment run, no forcedairflow can be used to cool down the system. Therefore,the heat capacity of the lamp and filters housing was used toabsorb the heat given off by conduction and an anti-caloricdevice made by the stacking of different filters blocks theheat radiated. The light emitted by the lamp first crosses a‘hot mirror’ that reflects radiation between 800 and 1050 nm,then a water volume that absorbs wavelength above 1050 nmand then the Schott KG2 anti-caloric filter, 3 mm thick. Thehot mirror and the KG2 filter also serve as windows for thewater volume. Figure 7 shows the mechanical design ofthe illumination subassembly. The selection of the colouredfilters for the particle discrimination is based on the spectralrange of the quartz tungsten halogen light source and on thespectral response of the CCD camera. A set of filters fromSchott was selected: a short-wavelength filter (Schott BG12)for the back illumination and a long-wavelength filter (SchottOG550) for the front illumination.
4.3. Implementation of the optical head in the JETmodule
A general view of the optical head is given in figure 8. Themodified objective occupies the central position. To the leftof it, four mirrors reflect the four viewing directions towardsthe objective. The light bundle extremity providing the frontillumination is placed along thez-axis between the mirrors. Itis bent in such a way that no obstruction is caused to the fourfields of views. Behind the objective, four mirrors, positionedin a plane at 45◦ with respect to thez-axis, reflect the light tothe four cameras. A fifth mirror is added to serve the fourthcamera in the space previously left free between the CCDs 1,2 and 3. The optical head is a parallelepiped of 80× 10−3 mtimes 80×10−3 m front surface and 210×10−3 m long fromthe output plane of the light bundle to the end of the CCDblock. The four cameras are attached by four independentand adjustable brackets to the structure.
The cameras are synchronized and the images arecaptured simultaneously by all four cameras. The imagesare stored in four separate memories and multiplexed to astandard video signal. A fifth image is also multiplexed intothe video signal. This image contains a binary sequence codethat is used as a time code during the analysis of the images.The video sequence is stored on S-VHS videotape by theonboard video recorder. All functions are controlled with anonboard computer that can be pre-programmed for variousexperiment profiles or operated in real time via telecommand.The computer also functions as a data acquisition systemstoring all relevant data.
The experiment is positioned in front of the opticalhead (see figure 9). The RC has two windows. The frontwindow is the observation window and also serves as aninlet for the front illumination. The back window is used
for the back illumination. The windows have double andtriple glasses (the interior window is sapphire) for optimalthermal properties. The particle bin is placed along one ofthe sides that are opened to the injection system. Crystalsand reference particles are kept there before injection. Thecompartments of source of reagent gas (SRG) are placed at thetop and bottom of the RC. Both SRG compartments are filledwith urotropine powder to supply the RC with oversaturatedvapour. The temperature in the SRG compartments is higherthan in the RC, providing urotropine diffusive flux to the RC.Each SRG compartment ends with a bellows controlling thepressure in the experiment unit. The interfaces between theRC and the SRGs prevent particles from leaving the RC.They also play the role of a thermal barrier, maintaininga temperature difference between the RC and the SRGs ofup to 25 K and temperature gradients in the RC and SRGcompartments lower than 0.13 K. The experiment unit isheated with four heaters placed on the RC: one heater oneach SRG and two heaters placed on the outer front window.The heaters are controlled individually. In the experiment thetemperature in the RC is kept at 100◦C.
At the beginning of the microgravity experiment,particles are injected in the RC with the injection unit.The latter comprises a motor/spring-controlled piston placedbehind the particle bin. A spring moves the piston and the gasflow pushes particles out of the particle bin into the RC. Thevortex of the gas stream contributes to a statistically uniformdistribution of the particles in the RC.
The optical unit is activated shortly before the launch inorder to prevent overheating of the water filter. Images ofthe RC are recorded throughout the period of microgravityconditions until the end of the experiment.
5. Experimental results
The experimental verification of the performance of theoptical head was performed in four steps. The first step wascharacterization of the imaging quality and its comparisonwith that expected. Secondly, the performance of thephotogrammetric algorithm was verified using the opticalhead with a reference target inserted in the RC. Finally, testson aerosol simulators were performed on the ground and onreal aerosols during parabolic flight using both hardware andsoftware. The test results are reported sequentially.
5.1. Optical alignment and resolution tests
The optical head is screwed to the rocket flange and itsposition is fixed with respect to the RC. Therefore, the totaldistance between the mid-plane of the RC and the camerasis fixed. There are two adjustments to be made. The first istranslation of the objective inside the optical head for focusadjustment. The second adjustment step is the alignment ofeach individual CCD with respect to the object. Due to themechanical architecture of the system, no other adjustmentsare required.
The resolution of the optical system is verified with aUSAF target that consists of group of line-space patternswhose spatial frequency increases as the sixth root of two.The depth of focus of the system was simultaneously verified
928

Photogrammetric set-up for sounding rocket
Figure 7. Mechanical design of the illumination subassembly: 1, quartz tungsten halogen lamp; 2, hot mirror; 3, water volume; 4, KG2filter; 5, light bundle.
Figure 8. Mechanical design of the imaging optical head: 1, objective; 2, light bundle for front illumination; 3, mirrors; 4, CCDs; 5,mirrors; 6, RC; 7, additional mirror.
by displacing by±5× 10⁻³ m the USAF target with respectto the mid-plane of the RC. Looking to the image of theresolution target, 14.3 line pairs per millimetre are resolvedleading to a resolution of 35µm on the total depth of theexperimental cell at 50% of modulation.
The resolution of the optical system is also verified bymeasuring two point spread functions: the first simulates thevisualization of a reference particle illuminated by the frontlight source. This was achieved by creating a bright spot
with a 10µm diameter pinhole illuminated from behind. Themid-height width of the point spread function is 40µm. Thesecond simulates the visualization of particles on a brightbackground. This was performed by measuring the intensitydistribution of a dark spot illuminated with the back-lightsystem. The mid-height width of the point spread functionis 50 µm. The values are in good agreement with thevalue found by numerical simulations and with the resolutionmeasured experimentally with the USAF target.
929

O Dupontet al
Figure 9. General view of the JET sounding rocket module: 1, optical head; 2, CCDs; 3, electronic module; 4, rocket flange; 5, RC.
Regarding the calibration of the camera, it was foundthat there was a strong dependence of the intensity recordedby the camera with respect to the angle and the orientationfrom which the light arrives. This is of crucial importancein the present design because each camera has light arrivingwith a different orientation: i.e. CCD 1 is illuminated fromthe left, CCD 2 from the right, CCD 3 from the top and CCD4 from the bottom. Figure 10 shows that the light intensityrecorded by the Sony camera depends strongly on the angleand the orientation. The experimental test conditions are: noshutter, no IR filter and manual gain at the maximum value.The behaviour of the Sony camera was also compared withcameras of other manufacturers. The tests showed that thisproblem is inherent to CCDs, but unfortunately the effect ismore pronounced in Sony cameras.
5.2. Performance of the 3D PTV
In order to define epipolar lines for the establishment ofcorrespondences and to compute 3D particle coordinates, theorientation and calibration parameters of the system have to
be determined in a calibration procedure. This calibrationis performed by a photogrammetric technique using imagesof a 3D reference body with discrete targets. Using themathematical model of spatial resection, the orientation andcalibration parameters of a camera can be determined fromone single image of the calibration reference body undersuitable illumination, if the 3D coordinates of the targets areknown.
The calibration reference body was fabricated by thespark erosion technique in aluminium with 48 mechanicallygenerated reference points in the anodized surface. Tocalibrate the system in its actual configuration the calibrationbody should be put into the experiment cell prior to launch.A second calibration should also be performed after flight.
The four-camera system was calibrated by spatialresection using the image quadruplet shown in figure 3.As the mathematical model does not contain mirrors, theoptical paths were ‘unfolded’ for further processing, leadingto a configuration with four virtual projection centres andfour virtual camera positions with a convergent cameraarrangement and principal point coordinates deviating
930

Photogrammetric set-up for sounding rocket
Figure 10. Calibration curve of the Sony camera.
strongly from the centre of the image.From each calibration image, more than 20 points of the
reference body were detected and used for the determinationof the photogrammetric parameters. Only the central partof the reference body is in the field of view of the cameras.Those points that were detected were nearly visible in allfour images. As a conclusion the observable object volume israther small, but the field of view of the four cameras is almostidentical. The calibration yielded the following results:
• The standard deviation of unit weight was between 3.16–3.52µm for three of the four images, but for the decisivecamera the value was 6.82 µm. This does not fullyexploit the accuracy potential of the cameras and themethod, but can be considered satisfactory.• The camera constant could not be determined. This is
due to the extremely narrow opening angle, which leadsto high correlations between parameters of exterior andinterior orientations. The mathematical model depictsan over-parametrization to the chosen configuration.Therefore, the camera constant can be introduced as afixed parameter with a value of 108.83 mm computedfrom the parameters of the optical system, and the effectsof deviations from this value are covered by parametersof the exterior orientation.• The principal point is turned outward by between 28 and
42 mm, depending on the camera lying far outside theactual image format.• No other significant parameters could be determined.
From the parameters of the exterior and interiororientation of the cameras and the limitation of the objectvolume in thez-dimension, a field of view of each cameracan be calculated. The values for each camera are listed intable 1. These values are 3D coordinates referring to theposition of the calibration body during the acquisition of thecalibration images.
5.3. Tests on aerosol simulators
Discrimination of the two types of particles was verified withan aerosol simulator comprised of a glass plate with crystalsand glass balloons on top of it. Urotropine crystals weregrown directly on a glass plate from oversaturated urotropinevapour in a vacuum chamber using a two-zone technique.
Mass crystallization took place after spontaneous nucleationon the bottom window. Parameters of crystallization wereadjusted to obtain crystals having a mean size and surfacenumber density equal to the expected density during theflight. Different types of defect crystals were left on thetest sample to assess their image properties: they accountedfor about 20% of the total number of crystals. Crystals largerthan 60µm and most of the crystals smaller then 30µmwere removed mechanically from the glass window. Then,reference particles were added on the test sample. The sizeand quality of each particle was analysed with a microscopeto relate them to the images obtained with the optical head.
It was found that the intensity of the light reflected byreference particles changes in quite a restricted range, beingalways above the background level. Variation of intensitywas produced by change of the shape of the reference particlesand uniformity of the coating. This leads to the necessity ofaccurate pre-flight control of the particle shapes and qualityof coating.
About 95% of the crystalline particles are seen as darkspots on a grey background. For specific orientations (withinan angle variation of less than 5◦), crystals produce brightspots on the image. The intensity of such reflections lieswithin a wide range up to saturation level. It is supposedthat such a high level of reflected intensity results from thefull internal reflections from the inside surfaces of crystalfaces and/or in combination with reflections from the glasswindows. Some of the crystals have reflection intensitywithin the range of brightness of reference particles. Themean number of crystals that may be confused with referenceparticles due to this effect is estimated to be about 5%.
In spite of all precautions, there are found to be severaltypes of non-perfect monocrystals in the flight aerosol. Thismay arise because of aggregation, breaking down of thecrystals during insertion, surface deterioration because ofsublimation at the beginning of the introduction, formationof large-scale growth defects on the crystals during growth,etc. These types of defect crystals were identified in the testsample and it was found that their image properties coincidewith the properties of ordinary crystals within the accuracyrequirements.
931

O Dupontet al
Table 1. Camera fields of view.
Z minimum: 0 mm Z maximum: 10 mm
CCD Upper left Upper right Lower left Lower right Upper left Upper right Lower left Lower right
1 10.9/2.2 11.0/9.5 1.2/2.3 1.3/9.5 11/−1.8 11.2/5.8 0.8/−1.8 0.9/5.92 9.3/0.2 9.3/7.4 — −0.6/7.3 13.5/0.1 13.5/7.7 3.0/0.0 2.9/7.6
−0.6/0.23 13.4/0.4 13.3/7.4 3.5/0.3 3.4/7.4 9.5/0.3 9.5/7.8 −1.0/0.2 —
−1.0/7.74 11/−1.6 11/5.6 1.3/— 1.4/5.6 11.2/2.2 11.2/10 1.0/2.3 1.0/10
1.6
Figure 11. 3D reconstruction of particle trajectories during injection test in parabolic flight.
5.4. Tests on aerosol under microgravity conditions
The overall functioning of the optical system and 3D PTVperformance was tested on real aerosol composed of onetype of particles—glass balloons. In order to prevent rapidsedimentation of the particles the tests were performed inmicrogravity conditions during parabolic flights at Bordeauxin 1998. The parabolic flights were characterized by arelatively high level of microgravity disturbances of up to10−2–10−1 g. Sometimes displacement of particles betweensequential image acquisition was close to the mean distancebetween the particles in the aerosol: in such situations 3DPTV was not applicable. Such a problem cannot arise in theexperiment on the sounding rocket, which has a higher qualityof microgravity uniformity (better than 10−5 g). The injectionsystem was also tested during these parabolic flights. Thenumber of particles injected in the observation volume variedin a wide range depending on the injection parameters butwas always several times lower than 1000, the limitationimposed by the 3D PTV method. Taking into account theabove-mentioned facts, optical tests were mostly focused onchecking general performance of the system and its accuracy,and on getting reference data before the rocket experiment.
In all, ten image sequences over around 100 time steps(which equate to 5 s in time) were analysed. Acquiredbefore the injection, the background images were used toeliminate global contrast and to remove any variation ofbackground light intensities from the sequence images. Withthis approach, the same parameters for particle detectioncould be used for all four cameras because the differences inthe illumination were homogenized to a common level. Afterthe image pre-processing the particles appeared as brightstains on a more or less dark background. The differencebetween the grey levels of the imaged particles and thebackground was of the order of 10–30 times. Dependingon the sequence, up to 300 particles could be detected in theimages and up to 170 particles could be determined per timestep. The standard deviation of unit weight was 7–11µm.The standard deviation of the 3D coordinate determinationby spatial intersection was between 0.007/0.007/0.017 and0.010/0.010/0.025 mm inX/Y/Z. The ratio between thestandard deviations in depth and planimetry coordinatesconfirmed the predicted factor of 2.4.
After calculation of the 3D coordinates of each time step,tracking was applied to obtain trajectories in the velocity
932

Photogrammetric set-up for sounding rocket
field. An example of the resulting visualization is shownin figure 11. The density of the velocity field and thelength of the trajectories varied considerably from sequenceto sequence. The maximum number of tracked particles wasabout 100, but there were also sequences where almost notrajectories were found, which should be attributed to theperiods of high-level microgravity perturbations that werementioned at the beginning of this section.
6. Conclusions
A compact, rigid and easily adjustable optical system hasbeen designed to obtain 3D trajectories of the microscopicaerosol particles under microgravity conditions. The 3Dcoordinates of crystals and reference particles are retrievedusing the photogrammetric method. The discriminationbetween the two kinds of particles is performed opticallywith appropriate coloured filters.
Crystal rotation is controlled by temporal analysis of thelight intensity reflected by the crystals.
The optical system provides an observation volume ofabout 0.6 cm3 with a depth of focus of 10−2 m. The opticalresolution is kept constant along the complete depth of theRC by the balancing of diffraction and defocus effects.
Evaluation of the images by 3D PTV allows one totrack about 1000 independently moving particles, which issufficiently higher than the number of particles anticipated inthe observation volume of the JET experiment and the numberof particles registered in the ground tests. The standarddeviation of the 3D coordinate determination was found to bebetween 0.007 and 0.011 mm for the planimetry coordinatesand from 0.017 to 0.025 mm for the coordinate along theoptical axis.
Due to correlation effects, the accuracy of a velocityvector derived from a particle trajectory will be better thanthe accuracy of the absolute position.
The combination of the compact optical system and thephotogrammetric technique have been successfully tested onthe ground and during parabolic flights and are seen to meetthe scientific requirements.
It is important to note that the optical system wasdeveloped to meet particular requirements of the JETexperiment. Most of the above-mentioned characteristicscould be considerably changed or improved for otherapplications.
Acknowledgments
This work was supported by the European Space AgencyProdex Programme, and by the Belgian Programme on
Interuniversity Poles of Attraction (PAI 4-06) initiated by theBelgian State, Prime Minister’s Office, Federal Office forScientific, Technical and Cultural Affairs.
References
Brown D 1971 Close-range camera calibrationPhoto. Engng378——1976 The bundle adjustment—progress and prospectsIAPRS
vol 21, part 3El-Hakim S F 1986: Real-time image metrology with CCD
camerasPhotogramm. Engng Remote Sens.521757–66Grun A 1994 Digital close-range photogrammetry—progress
through automationKeynote Paper, ISPRS Com. V Symp.(Melbourne, March 1–4) IAPRSvol 30, part V
Maas H-G 1996 Contributions of digital photogrammetry to 3-DPTV Three-Dimensional Velocity and Vorticity Measuringand Image Analysis Techniquesed Th Dracos (Dordrecht:Kluwer) pp 191–207
——1992 Complexity analysis for the determination of densespatial target fieldsRobust Computer Visioned Forstner andRuwiede (Karlsruhe: Wichmann)
Maas H-G and Grun A 1995 Digital photogrammetric techniquesfor high-resolution 3D flow velocity measurementsOpt.Engng341970–6
Maas H-G, Grun A and Papantoniou D 1993 Particle tracking inthree-dimensional turbulent flows—Part I: Photogrammetricdetermination of particle coordinatesExp. Fluids15133–46
Malik N, Dracos T and Papantoniou D 1993 Particle tracking inthree-dimensional turbulent flows–Part II: Particle trackingExp. Fluids15279–94
Melikhov I V and Vedernikov A A 1995 Jet growth(non-Brownian) random walk of crystals in aerosolsDokl.Phys. Chem.340505–8
Papantoniou D and Dracos T 1989 Analysing 3-dimensionalturbulent motions in open channel flow by use of stereoscopyand particle trackingAdvances in Turbulencevol 2,ed Hernholz and Fiedler (Heidelberg: Springer)
Slama C (ed) 1980Manual of Photogrammetry(Falls Church, VA:American Society of Photogrammetry)
Stuer H 1999 Separation on a forward facing stepPhD ThesisNr.13132 ETH Zurich, Switzerland
Stuer H, Maas H-G, Virant M and Becker J 1999 A volumetric 3Dmeasurement tool for velocity field diagnostics inmicro-gravity experimentsMeas. Sci. Technol.10904
Vedernikov A A and Melikhov I V 1994Motion of growingcrystals in gas in short-term microgravity experiments (Proc.Int. Workshop on Short-Term Experiments under StronglyReduced Gravity Conditions (Bremen, Germany, July 4–7)pp 263–7
Virant M and Dracos Th 1996 Establishment of a videogrammetricPTV systemThree-Dimensional Velocity and VorticyMeasuring and Image Analysis Techniquesed Th Dracos(Dordrecht: Kluwer) pp 229–54
933