Epimerase-Deficiency Galactosemia Is Not a Binary Condition
14
www.ajhg.org Openo et al.: Epimerase-Deficiency Galactosemia 89 Epimerase-Deficiency Galactosemia Is Not a Binary Condition Kimberly K. Openo, 1 Jenny M. Schulz, 2,* Claudia A. Vargas, 1,† Corey S. Orton, 3 Michael P. Epstein, 1 Rhonda E. Schnur, 4 Fernando Scaglia, 5 Gerard T. Berry, 6 Gary S. Gottesman, 8 Can Ficicioglu, 7 Alfred E. Slonim, 9 Richard J. Schroer, 10 Chunli Yu, 1 Vanessa E. Rangel, 1 Jennifer Keenan, 4 Kerri Lamance, 5 and Judith L. Fridovich-Keil 1 1 Department of Human Genetics, Emory University School of Medicine, 2 Graduate Program in Nutrition Health Sciences, Emory University, and 3 Emory College, Atlanta; 4 Division of Genetics, Department of Pediatrics, Cooper University Hospital/Robert Wood Johnson Medical School, Camden, NJ; 5 Department of Molecular and Human Genetics, Texas Children’s Hospital and Baylor College of Medicine, Houston; 6 Jefferson Medical College and 7 Division of Metabolism, Children’s Hospital of Philadelphia, Philadelphia; 8 SSM Cardinal Glennon Children’s Hospital, St. Louis, MO; 9 Columbia University Medical School, New York; and 10 Greenwood Genetics Center, Greenwood, SC Epimerase-deficiency galactosemia results from the impairment of UDP-galactose 4 -epimerase (GALE), the third enzyme in the Leloir pathway of galactose metabolism. Originally identified as a clinically benign “peripheral” condition with enzyme impairment restricted to circulating blood cells, GALE deficiency was later demonstrated also to exist in a rare but clinically severe “generalized” form, with enzyme impairment affecting a range of tissues. Isolated cases of clinically and/or biochemically intermediate cases of epimerase deficiency have also been reported. We report here studies of 10 patients who, in the neonatal period, received the diagnosis of hemolysate epimerase deficiency. We have characterized these patients with regard to three parameters: (1) GALE activity in transformed lymphoblasts, representing a “nonperipheral” tissue, (2) metabolic sensitivity of those lymphoblasts to galactose challenge in culture, and (3) evidence of normal versus abnormal galactose metabolism in the patients themselves. Our results demonstrate two important points. First, whereas some of the patients studied exhibited near-normal levels of GALE activity in lymphoblasts, consistent with a diagnosis of peripheral epimerase deficiency, many did not. We detected a spectrum of GALE activity levels ranging from 15%–64% of control levels, demonstrating that epimerase deficiency is not a binary condition; it is a continuum disorder. Second, lymphoblasts demonstrating the most severe reduction in GALE activity also demonstrated abnormal metabolite levels in the presence of external galactose and, in some cases, also in the absence of galactose. These abnormalities included elevated galactose-1P, elevated UDP-galactose, and deficient UDP-glucose. Moreover, some of the patients themselves also demonstrated metabolic abnormalities, both on and off galactose-restricted diet. Long-term follow-up studies of these and other patients will be required to elucidate the clinical significance of these biochemical abnormalities and the potential impact of dietary intervention on outcome. Received August 26, 2005; accepted for publication October 11, 2005; electronically published November 14, 2005. Address for correspondence and reprints: Dr. Judith L. Fridovich-Keil, Department of Human Genetics, Emory University School of Medicine, Room 325.2 Whitehead Building, 615 Michael Street, Atlanta, GA 30322. E-mail: [email protected] * Present affiliation: Clinical Care Options LLC, Atlanta. † Present affiliation: Medical College of Georgia, Augusta, GA. Am. J. Hum. Genet. 2006;78:89–102. 2005 by The American Society of Human Genetics. All rights reserved. 0002-9297/2006/7801-0010$15.00 In both prokaryotes and eukaryotes, galactose is me- tabolized predominantly via the Leloir pathway, a series of reactions catalyzed by the enzymes galactokinase (GALK [EC 2.7.1.6]), galactose-1-phosphate uridylyl- transferase (GALT [EC 2.7.7.12]), and UDP-galactose 4 -epimerase (GALE [EC 5.1.3.2]) (fig. 1) (Holton et al. 2000). Impairment of any of these three enzymes in hu- mans results in galactosemia, although the symptoms and severity depend on the identity of the enzyme im- paired and the extent of the deficiency, among other factors. The first clinically recognized form of galactosemia was profound transferase deficiency (MIM 230400), re- ported by Goppert (1917). This so-called classic galac- tosemia occurs with a frequency of 1/30,000 to 1/60,000 live births in the United States and in other multiethnic populations, and it is panethnic. If untreated, classic ga- lactosemia can lead to rapid neonatal demise. Symptoms progress from vomiting and diarrhea to cataracts and failure to thrive to hepatomegaly, liver dysfunction with bleeding diathesis, and Escherichia coli sepsis, culmi- nating in neonatal death (Holton et al. 2000). Classic galactosemia is often detected presymptomatically in most industrialized nations by newborn screening and is treated by lifelong dietary restriction of galactose. Al- though this intervention resolves the acute and poten- tially lethal symptoms of classic galactosemia, unfortu- nately, a spectrum of complications persist, including ataxia, learning disabilities, and verbal dyspraxia in 130% of patients and primary ovarian failure in 180% of females (Waggoner et al. 1990). The pathophysiology of classic galactosemia remains unclear, hindering the development of more-effective therapies. The second form of galactosemia to be recognized
Transcript of Epimerase-Deficiency Galactosemia Is Not a Binary Condition

www.ajhg.org Openo et al.: Epimerase-Deficiency Galactosemia 89
Epimerase-Deficiency Galactosemia Is Not a Binary ConditionKimberly K. Openo,1 Jenny M. Schulz,2,* Claudia A. Vargas,1,† Corey S. Orton,3Michael P. Epstein,1 Rhonda E. Schnur,4 Fernando Scaglia,5 Gerard T. Berry,6Gary S. Gottesman,8 Can Ficicioglu,7 Alfred E. Slonim,9 Richard J. Schroer,10 Chunli Yu,1Vanessa E. Rangel,1 Jennifer Keenan,4 Kerri Lamance,5 and Judith L. Fridovich-Keil1
1Department of Human Genetics, Emory University School of Medicine, 2Graduate Program in Nutrition Health Sciences, Emory University,and 3Emory College, Atlanta; 4Division of Genetics, Department of Pediatrics, Cooper University Hospital/Robert Wood Johnson MedicalSchool, Camden, NJ; 5Department of Molecular and Human Genetics, Texas Children’s Hospital and Baylor College of Medicine, Houston;6Jefferson Medical College and 7Division of Metabolism, Children’s Hospital of Philadelphia, Philadelphia; 8SSM Cardinal Glennon Children’sHospital, St. Louis, MO; 9Columbia University Medical School, New York; and 10Greenwood Genetics Center, Greenwood, SC
Epimerase-deficiency galactosemia results from the impairment of UDP-galactose 4′-epimerase (GALE), the thirdenzyme in the Leloir pathway of galactose metabolism. Originally identified as a clinically benign “peripheral”condition with enzyme impairment restricted to circulating blood cells, GALE deficiency was later demonstratedalso to exist in a rare but clinically severe “generalized” form, with enzyme impairment affecting a range of tissues.Isolated cases of clinically and/or biochemically intermediate cases of epimerase deficiency have also been reported.We report here studies of 10 patients who, in the neonatal period, received the diagnosis of hemolysate epimerasedeficiency. We have characterized these patients with regard to three parameters: (1) GALE activity in transformedlymphoblasts, representing a “nonperipheral” tissue, (2) metabolic sensitivity of those lymphoblasts to galactosechallenge in culture, and (3) evidence of normal versus abnormal galactose metabolism in the patients themselves.Our results demonstrate two important points. First, whereas some of the patients studied exhibited near-normallevels of GALE activity in lymphoblasts, consistent with a diagnosis of peripheral epimerase deficiency, many didnot. We detected a spectrum of GALE activity levels ranging from 15%–64% of control levels, demonstrating thatepimerase deficiency is not a binary condition; it is a continuum disorder. Second, lymphoblasts demonstrating themost severe reduction in GALE activity also demonstrated abnormal metabolite levels in the presence of externalgalactose and, in some cases, also in the absence of galactose. These abnormalities included elevated galactose-1P,elevated UDP-galactose, and deficient UDP-glucose. Moreover, some of the patients themselves also demonstratedmetabolic abnormalities, both on and off galactose-restricted diet. Long-term follow-up studies of these and otherpatients will be required to elucidate the clinical significance of these biochemical abnormalities and the potentialimpact of dietary intervention on outcome.
Received August 26, 2005; accepted for publication October 11, 2005; electronically published November 14, 2005.Address for correspondence and reprints: Dr. Judith L. Fridovich-Keil, Department of Human Genetics, Emory University School of Medicine,
Room 325.2 Whitehead Building, 615 Michael Street, Atlanta, GA 30322. E-mail: [email protected]* Present affiliation: Clinical Care Options LLC, Atlanta.† Present affiliation: Medical College of Georgia, Augusta, GA.
Am. J. Hum. Genet. 2006;78:89–102. � 2005 by The American Society of Human Genetics. All rights reserved. 0002-9297/2006/7801-0010$15.00
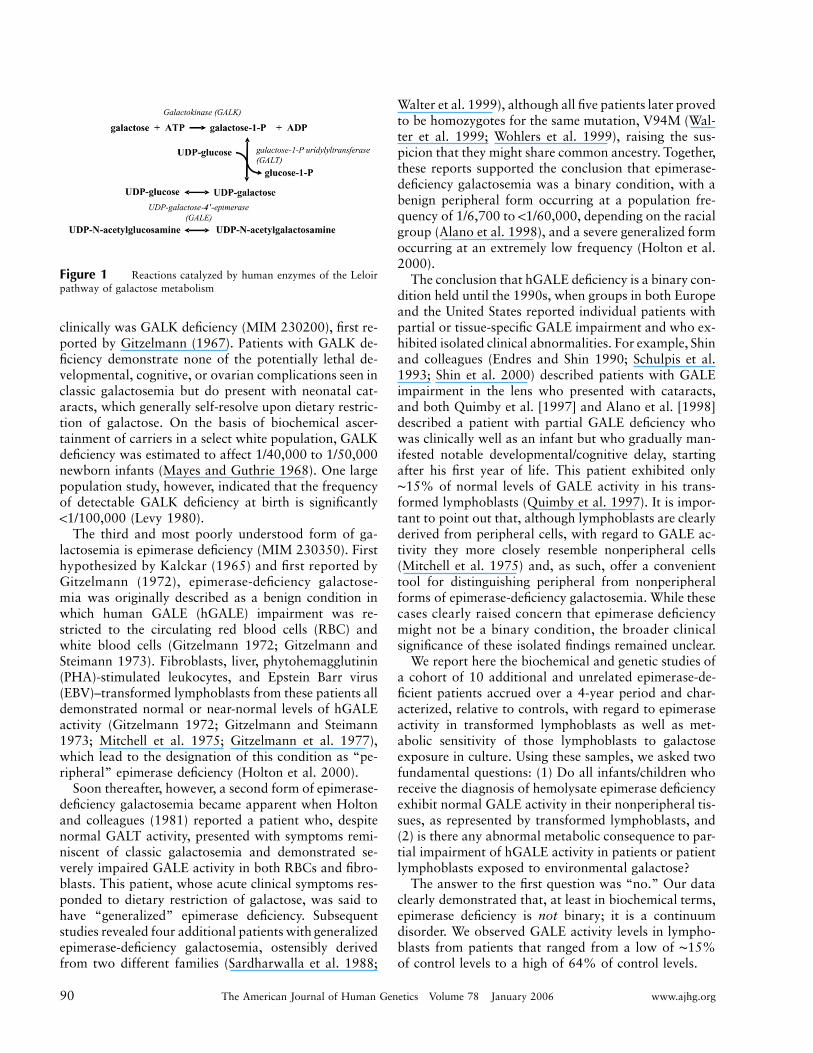
In both prokaryotes and eukaryotes, galactose is me-tabolized predominantly via the Leloir pathway, a seriesof reactions catalyzed by the enzymes galactokinase(GALK [EC 2.7.1.6]), galactose-1-phosphate uridylyl-transferase (GALT [EC 2.7.7.12]), and UDP-galactose4′-epimerase (GALE [EC 5.1.3.2]) (fig. 1) (Holton et al.2000). Impairment of any of these three enzymes in hu-mans results in galactosemia, although the symptomsand severity depend on the identity of the enzyme im-paired and the extent of the deficiency, among otherfactors.
The first clinically recognized form of galactosemiawas profound transferase deficiency (MIM 230400), re-ported by Goppert (1917). This so-called classic galac-tosemia occurs with a frequency of 1/30,000 to 1/60,000live births in the United States and in other multiethnicpopulations, and it is panethnic. If untreated, classic ga-
lactosemia can lead to rapid neonatal demise. Symptomsprogress from vomiting and diarrhea to cataracts andfailure to thrive to hepatomegaly, liver dysfunction withbleeding diathesis, and Escherichia coli sepsis, culmi-nating in neonatal death (Holton et al. 2000). Classicgalactosemia is often detected presymptomatically inmost industrialized nations by newborn screening andis treated by lifelong dietary restriction of galactose. Al-though this intervention resolves the acute and poten-tially lethal symptoms of classic galactosemia, unfortu-nately, a spectrum of complications persist, includingataxia, learning disabilities, and verbal dyspraxia in130% of patients and primary ovarian failure in 180%of females (Waggoner et al. 1990). The pathophysiologyof classic galactosemia remains unclear, hindering thedevelopment of more-effective therapies.
The second form of galactosemia to be recognized
90 The American Journal of Human Genetics Volume 78 January 2006 www.ajhg.org
Figure 1 Reactions catalyzed by human enzymes of the Leloirpathway of galactose metabolism
clinically was GALK deficiency (MIM 230200), first re-ported by Gitzelmann (1967). Patients with GALK de-ficiency demonstrate none of the potentially lethal de-velopmental, cognitive, or ovarian complications seen inclassic galactosemia but do present with neonatal cat-aracts, which generally self-resolve upon dietary restric-tion of galactose. On the basis of biochemical ascer-tainment of carriers in a select white population, GALKdeficiency was estimated to affect 1/40,000 to 1/50,000newborn infants (Mayes and Guthrie 1968). One largepopulation study, however, indicated that the frequencyof detectable GALK deficiency at birth is significantly!1/100,000 (Levy 1980).
The third and most poorly understood form of ga-lactosemia is epimerase deficiency (MIM 230350). Firsthypothesized by Kalckar (1965) and first reported byGitzelmann (1972), epimerase-deficiency galactose-mia was originally described as a benign condition inwhich human GALE (hGALE) impairment was re-stricted to the circulating red blood cells (RBC) andwhite blood cells (Gitzelmann 1972; Gitzelmann andSteimann 1973). Fibroblasts, liver, phytohemagglutinin(PHA)-stimulated leukocytes, and Epstein Barr virus(EBV)–transformed lymphoblasts from these patients alldemonstrated normal or near-normal levels of hGALEactivity (Gitzelmann 1972; Gitzelmann and Steimann1973; Mitchell et al. 1975; Gitzelmann et al. 1977),which lead to the designation of this condition as “pe-ripheral” epimerase deficiency (Holton et al. 2000).
Soon thereafter, however, a second form of epimerase-deficiency galactosemia became apparent when Holtonand colleagues (1981) reported a patient who, despitenormal GALT activity, presented with symptoms remi-niscent of classic galactosemia and demonstrated se-verely impaired GALE activity in both RBCs and fibro-blasts. This patient, whose acute clinical symptoms res-ponded to dietary restriction of galactose, was said tohave “generalized” epimerase deficiency. Subsequentstudies revealed four additional patients with generalizedepimerase-deficiency galactosemia, ostensibly derivedfrom two different families (Sardharwalla et al. 1988;
Walter et al. 1999), although all five patients later provedto be homozygotes for the same mutation, V94M (Wal-ter et al. 1999; Wohlers et al. 1999), raising the sus-picion that they might share common ancestry. Together,these reports supported the conclusion that epimerase-deficiency galactosemia was a binary condition, with abenign peripheral form occurring at a population fre-quency of 1/6,700 to !1/60,000, depending on the racialgroup (Alano et al. 1998), and a severe generalized formoccurring at an extremely low frequency (Holton et al.2000).
The conclusion that hGALE deficiency is a binary con-dition held until the 1990s, when groups in both Europeand the United States reported individual patients withpartial or tissue-specific GALE impairment and who ex-hibited isolated clinical abnormalities. For example, Shinand colleagues (Endres and Shin 1990; Schulpis et al.1993; Shin et al. 2000) described patients with GALEimpairment in the lens who presented with cataracts,and both Quimby et al. [1997] and Alano et al. [1998]described a patient with partial GALE deficiency whowas clinically well as an infant but who gradually man-ifested notable developmental/cognitive delay, startingafter his first year of life. This patient exhibited only∼15% of normal levels of GALE activity in his trans-formed lymphoblasts (Quimby et al. 1997). It is impor-tant to point out that, although lymphoblasts are clearlyderived from peripheral cells, with regard to GALE ac-tivity they more closely resemble nonperipheral cells(Mitchell et al. 1975) and, as such, offer a convenienttool for distinguishing peripheral from nonperipheralforms of epimerase-deficiency galactosemia. While thesecases clearly raised concern that epimerase deficiencymight not be a binary condition, the broader clinicalsignificance of these isolated findings remained unclear.
We report here the biochemical and genetic studies ofa cohort of 10 additional and unrelated epimerase-de-ficient patients accrued over a 4-year period and char-acterized, relative to controls, with regard to epimeraseactivity in transformed lymphoblasts as well as met-abolic sensitivity of those lymphoblasts to galactoseexposure in culture. Using these samples, we asked twofundamental questions: (1) Do all infants/children whoreceive the diagnosis of hemolysate epimerase deficiencyexhibit normal GALE activity in their nonperipheral tis-sues, as represented by transformed lymphoblasts, and(2) is there any abnormal metabolic consequence to par-tial impairment of hGALE activity in patients or patientlymphoblasts exposed to environmental galactose?
The answer to the first question was “no.” Our dataclearly demonstrated that, at least in biochemical terms,epimerase deficiency is not binary; it is a continuumdisorder. We observed GALE activity levels in lympho-blasts from patients that ranged from a low of ∼15%of control levels to a high of 64% of control levels.
www.ajhg.org Openo et al.: Epimerase-Deficiency Galactosemia 91
The answer to the second question was “yes.” Ourresults demonstrated that lymphoblasts with as much as35% residual GALE activity nonetheless exhibited met-abolic abnormalities upon exposure to environmentalgalactose. Furthermore, some of the patients from whomthose lymphoblasts were derived also demonstratedabnormal galactose metabolites. The relationship be-tween these metabolic abnormalities and the possibilityof clinical abnormalities later in life remains unclear.Long-term clinical follow-up studies of significantlylarger numbers of patients with partial GALE defi-ciency will be required to address this question.
Material and Methods
Study Subjects
All patients were ascertained by referral, and we obtainedtheir consent in accordance with Emory University Institu-tional Review Board Protocol 618–99 (primary investigator:Fridovich-Keil). Controls were ascertained as anonymousblood samples from nongalactosemic individuals. All hemo-lysate biochemical data were generated in clinical labs, asnoted, and all clinical follow-up data were reported by refer-ring health care professionals.
Lymphoblast Culture
EBV-transformed lymphoblasts were prepared and culturedfrom patient or control blood samples as described elsewhere(Neitzel 1986), with a substitution of interleukin-2 in place ofcyclosporine. Transformed lymphoblasts were maintained inRPMI 1640 medium containing 11.1 mM glucose (2 g/liter)and 0.3 g/liter L-glutamine and were supplemented with pen-icillin (100 U/ml), streptomycin (100 mg/ml), 25 mM HEPES(Cellgro), and 10% (v/v) fetal bovine serum (Gibco). All cellswere maintained at 37�C in a humidified 5% CO2 incubator(NuAire).
GALT and GALE Enzyme Analyses
Soluble protein lysates were prepared from 0.15 g trans-formed lymphoblast cell pellets as follows. Cells were har-vested by centrifugation, were washed with 1# PBS to removeresidual medium, and were resuspended in 300 ml of 100-mMglycine buffer (pH 8.7) containing protease inhibitor cocktail(Roche). Cells were disrupted on ice by three 15-s exposuresto a Misonix Sonicator 3000 with microtip at output level 1.0.Insoluble debris was removed from each sample by centrifu-gation in an Eppendorf 5415D at 13.2 rpm at 4�C, and thesupernatant was passed over a P-30 Bio-Spin Column (Bio-Rad) to remove small molecules before further analysis. Proteinconcentrations were determined using the Bio-Rad protein as-say reagent with BSA as the standard, as recommended by themanufacturer.
Both GALT and GALE activities were measured in samplesof each cell lysate by use of enzymatic assay procedures, es-sentially as described elsewhere (Ross et al. 2004; Schulz et al.2005), with separation and quantification of reactants andproducts achieved by high-performance liquid chromatogra-
phy (HPLC). GALE assays were performed at 37�C with theuse of both UDP-galactose (UDP-Gal) and UDP-N-acetylga-lactosamine (UDP-GalNAc) substrates, with a 30-min incu-bation time and 7.5–30 mg total protein in a final volume of12.5 ml. UDP-Gal GALE activity assays contained 40 mM gly-cine, 0.4 mM UDP-Gal, and 8 mM NAD�. UDP-GalNAcGALE activity assays contained 40 mM glycine, 0.4 mM UDP-GalNAc, and 8 mM NAD�. GALT assays were performed at37�C for 60 min with the use of 50–100 mg total protein in125 mM glycylglycine (pH 7.5) and 4.1 mM UDP-glucose(UDP-Glc) in a final volume of 50 ml. GALT activity assaysfor each sample were performed in both the presence and ab-sence of 1 mM galactose 1-phosphate (Gal-1P) to reveal back-ground production of UDP-Gal (from UDP-Glc) by epimerase.To determine GALT activity, formation of UDP-Gal in theabsence of Gal-1P was subtracted from the amount of UDP-Gal produced in the presence of Gal-1P. All reactions wereinitiated by the addition of protein and were monitored toensure linearity. GALE and GALT reactions were stopped bythe addition of 237.5 ml or 450 ml, respectively, of chilled sterilewater and were then filtered (0.2-mm nylon filters [Alltech])and subjected to HPLC separation and quantification of sub-strates and products. Enzyme activity was defined by picomoleof product formed per microgram of protein per minute, underthe conditions described. HPLC separation and quantificationof enzymatic substrates and products was achieved as de-scribed elsewhere (Ross et al. 2004; Schulz et al. 2005).
Analysis of Metabolites from Lymphoblasts Cultured in thePresence versus the Absence of Environmental Galactose
Cells were cultured in the absence of galactose, as describedabove, until time zero, at which point ( ) the samples weret p 0harvested for both external and internal metabolites, and ga-lactose was added to the remainder of the culture for a finalconcentration of 0.5 mM. Cultures were harvested 24 h aftergalactose addition. At each time point, 50 ml of cell suspensionwas removed for protein determination by use of the BioRadDC system, as recommended by the manufacturer. To monitorexternal galactose, 250 ml of culture medium was added di-rectly into 500 ml 60% MeOH at �20�C, was mixed, and wascentrifuged briefly at 13,200 rpm at 4�C in an Eppendorf5415C microcentrifuge to remove cellular debris. Then, 375ml of supernatant was dried under vacuum without heat, wasrehydrated in 390 ml sterile Milli-Q water, and was filteredbefore HPLC fractionation. Internal metabolites were ex-tracted from 10-ml samples of cell suspension harvested bycentrifugation at 3,500 rpm in Sorvall RT6000B at room tem-perature and were washed once with PBS before further ma-nipulation. Samples were prepared using a modified form ofthe procedure described elsewhere by our laboratory (Ross etal. 2004; Schulz et al. 2005) and originally described by Smitset. al (1998).
In brief, each washed cell pellet was resuspended in 1.1 mlcold PBS, of which 100 ml were used for protein determinationvia the Bio-Rad DC protein assay, as recommended by themanufacturer. Cells from the remaining 1 ml of suspensionwere collected by high-speed centrifugation at 4�C in an Ep-pendorf 5415C microcentrifuge. Intracellular metabolites wereextracted by vigorous agitation of the cells for 45 min at 4�C

92 The American Journal of Human Genetics Volume 78 January 2006 www.ajhg.org
Table 1
PCR Primers Used
The table is available in its entirety in the onlineedition of The American Journal of Human Genetics.
Table 2
PCR Programs Used to Amplify Segments of thehGALE Gene
The table is available in its entirety in the onlineedition of The American Journal of Human Genetics.
in a final volume of an 875-ml 4:2:1 mixture of CHCl3/MeOH/water. The aqueous layer was collected after repeated high-speed centrifugation for 10 min at 4�C. The remaining organicphase was back-extracted a second time with 125 ml MeOHand 125 ml water. Aqueous layers were combined and driedunder vacuum without heat (for ∼6 h). Each dried metabolitepellet was rehydrated with a volume of sterile Milli-Q watercalculated from the protein level measured for that cell sus-pension, with the use of 1 ml of water for every 5 mg of proteindetected. Rehydrated samples were filtered through 0.2-mmnylon filters (Alltech) before being loaded into the HPLCautosampler.
HPLC analysis was performed using a DX600 or ISC2500HPLC system (Dionex), each consisting of a Dionex AS50autosampler, a Dionex GP50 gradient pump, and a DionexED50 electrochemical detector. As described elsewhere, car-bohydrates were separated on a CarboPac PA10 column (250# 4 mm) with an amino-trap (50 # 14 mm) placed beforethe analysis column and a borate-trap (50 # 4 mm) placedbefore the injector port to remove trace amounts of boratefrom the mobile phase buffers (Ross et al. 2004; Schulz et al.2005). For all samples, 20 ml were injected into a 25-ml injec-tion loop. Samples were maintained at 4�C in the autosamplertray, and the chromatography was performed at roomtemperature.
Mobile phase buffers for the separation of carbohydrateswere used as described above. Flow rate was maintained at0.8–1.0 ml/min. To prevent carbonate contamination of theanalysis column, a 50% sodium hydroxide solution containing!0.04% sodium carbonate was used to prepare mobile phasebuffers (Fisher). Buffers were degassed and maintained undera helium atmosphere.
All carbohydrate metabolites were separated as describedelsewhere (Ross et al. 2004; Schulz et al. 2005). In brief, hex-oses and hexose-phosphates were separated using buffers A(15 mM NaOH) and B (50 mM NaOH/1 M NaAC) mixedusing a low-salt gradient procedure with flow rate of 1 ml/min. The sample injection occurred at . Gradient 1: 98%t p 0A and 2% B (�10 to 8 min), a linear increase of B to 30%(8–15 min), a linear increase of B to 50% (15–25 min), hold50% A and 50% B (25–30 min), and a linear decrease of Bto 2% (30–35 min). External galactose was determined usinga low-salt gradient procedure with a flow rate of 1 ml/min.Gradient 2: 98% B and 2% B (�5 to 5 min), a linear increaseof B to 50% (5–10 min), hold 50% A and 50% B (10–15min), and a linear decrease of B to 2% (15–17 min). UDP-hexoses were separated using a high-salt gradient procedurewith a flow rate of 0.8 ml/min. Gradient 3: 50% A and 50%B for (�5 to 1 min), a linear increase of B to 70% (1–22 min),hold 30% A and 70% B (22–27 min), and a linear decreaseof B to 50%. Carbohydrates were detected and were quantifiedas described elsewhere (Ross et al. 2004; Schulz et al. 2005).
Mutational Analysis of the hGALE Locus
Genomic DNA was isolated from lymphoblast cells, as de-scribed elsewhere, by use of phenol/chloroform extraction (Da-vis et al. 1994). The GALE locus, including all introns andsegments stretching from 430 bp upstream of the start codonto 491 bp downstream of the stop codon, were PCR amplifiedin seven overlapping fragments by use of an MJ Research PTC-150 minicycler with Eppendorf TripleMaster enzyme (Brink-mann), in accordance with the manufacturer’s recommenda-tions. PCR primer sequences are presented in table 1. All PCRprograms included a 5-min initial denaturation (at 94�C) fol-lowed by 32 cycles of denaturation, annealing, and extension.The annealing temperatures and extension times used to am-plify each fragment varied according to primer melting tem-perature and anticipated product size (see table 2). After am-plification, PCR products were verified on 1% agarose gelsand were purified using the PureLink PCR Purification Kit(Invitrogen), in accordance with the manufacturer’s instruc-tions. Sequencing reactions were performed by Macrogen.
Statistical Methods
We conducted tests of normality for enzyme activity levelsseparately in cases and controls, using a Shapiro-Wilk (Shapiroand Wilk 1965) test, as implemented in SAS PROC UNIVAR-IATE. We also estimated and tested the correlation betweenthe activity levels of different enzymes separately in cases andcontrols, using a Spearman correlation coefficient (Hotellingand Pabst 1936), as implemented in SAS PROC CORR. Fi-nally, for a particular enzyme, we examined whether the ac-tivity levels differed across different groups, using either aKolmogorov-Smirnov test (Kolmogorov 1941) (assuming twogroups) or a Kruskal-Wallis test (Kruskal 1952) (assumingmore than two groups), as implemented in SAS PROCNPAR1WAY. For the Kolmogorov-Smirnov and Kruskal-Wal-lis tests, we determined exact P values to ensure valid inferencein the presence of a small sample size.
Results
Defining the Normal Range of hGALE Activity inHuman Lymphoblasts
Before initiating studies of hGALE activity in lym-phoblasts derived from patients with RBC hGALE im-pairment, we first sought to define the range of hGALEactivity in lymphoblasts derived from control subjects.Toward this end, we established 10 control lines andcharacterized each with regard to both hGALE andhGALT activities. Because normal hGALE catalyzesboth the interconversion of UDP-Gal/UDP-Glc and the
www.ajhg.org Openo et al.: Epimerase-Deficiency Galactosemia 93
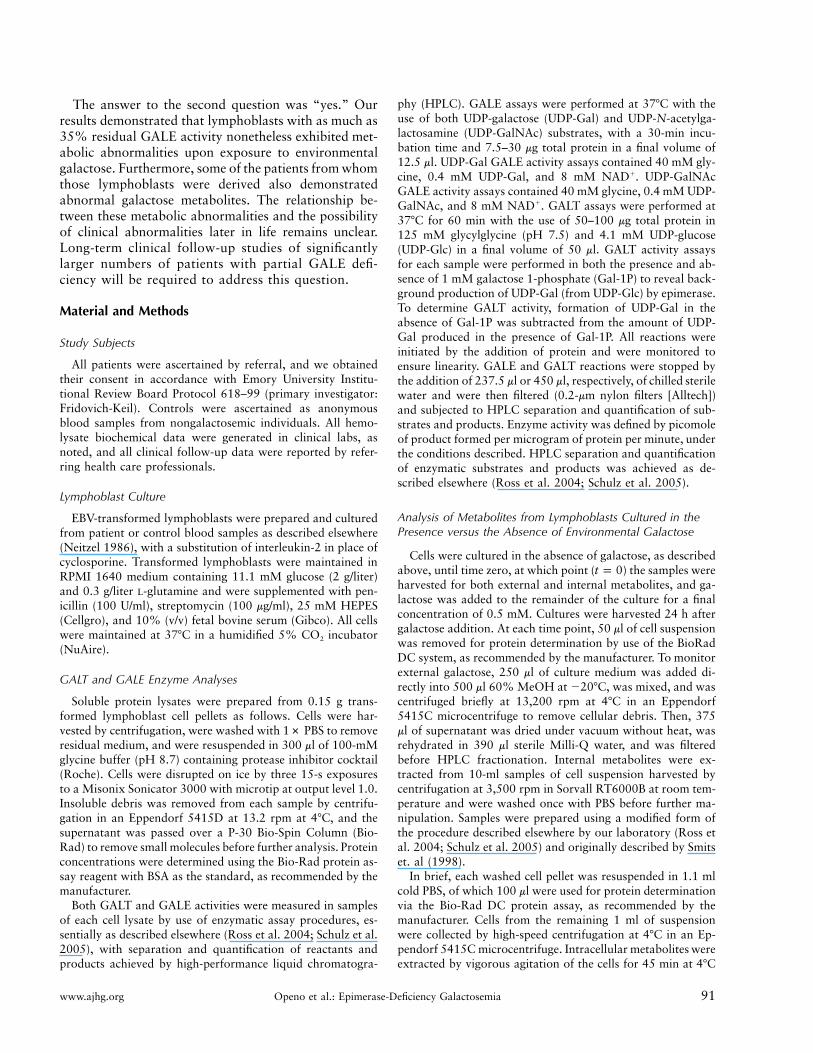
Figure 2 Enzyme activities in control lymphoblasts. Values plotted represent average specific activity � SEM ( ). Numbers listedN � 3above each bar are normalized to the mean of the set. C1–C10 designate the individual control cell lines studied. A, hGALE activity with regardto UDP-Gal. B, hGALE activity with regard to UDP-GalNAc. C, hGALT activity.
interconversion of UDP-GalNAc/UDP-GlcNAc (Piller etal. 1983; Schulz et al. 2004), we measured both reac-tions. Our results, presented in figure 2, demonstratethree important points.
First, while hGALE activity values with regard to anyone substrate (UDP-Gal or UDP-GalNAc) and any onecell line were highly reproducible, even across separatecell harvests, these values varied from line to line. Forexample, GALE activity values with regard to UDP-Galdiffered by up to almost a factor of two in pairwisecomparisons between samples. The height of each barplotted in figure 2 represents the hGALE specific activityfor that sample; the number listed over each bar rep-resents the same value normalized to the mean of theentire set. Results from Shapiro-Wilk tests ( )P p .0083suggest that these values are not normally distributed,although these tests are likely sensitive to the small sam-ple size considered in the study. With the assumptionthat these control lymphoblast lines biochemically reflectthe individuals from whom they were derived, as appearsto be the case for patient lymphoblasts characterized
elsewhere with regard to hGALE (Quimby et al. 1997),this observation suggests that healthy subjects exhibitlevels of hGALE activity that vary by up to a factor oftwo. In comparison, activities measured for a single cellline harvested and assayed at different times varied byno more than 15% (data not shown). The genetic, en-vironmental, or other factors that underlie this individ-ual-to-individual variation remain unclear.
The second important point illustrated in figure 2 isthat, whereas hGALE activity levels in different cell linesvaried for both substrates, they varied much less withregard to UDP-GalNAc than with regard to UDP-Gal.Furthermore, there was modest, albeit not statisticallysignificant, evidence to suggest that the hGALE activitiestoward the two substrates were correlated (Spearmancorrelation 0.507; ).P p .130
The third point illustrated in figure 2 is that, despitevariations in hGALE activity, the hGALT activities de-tected in these same cell lines varied by !1.5-fold. Fur-thermore, as expected, there was no evidence for positivecorrelation between either the UDP-Gal or the UDP-
94 The American Journal of Human Genetics Volume 78 January 2006 www.ajhg.org
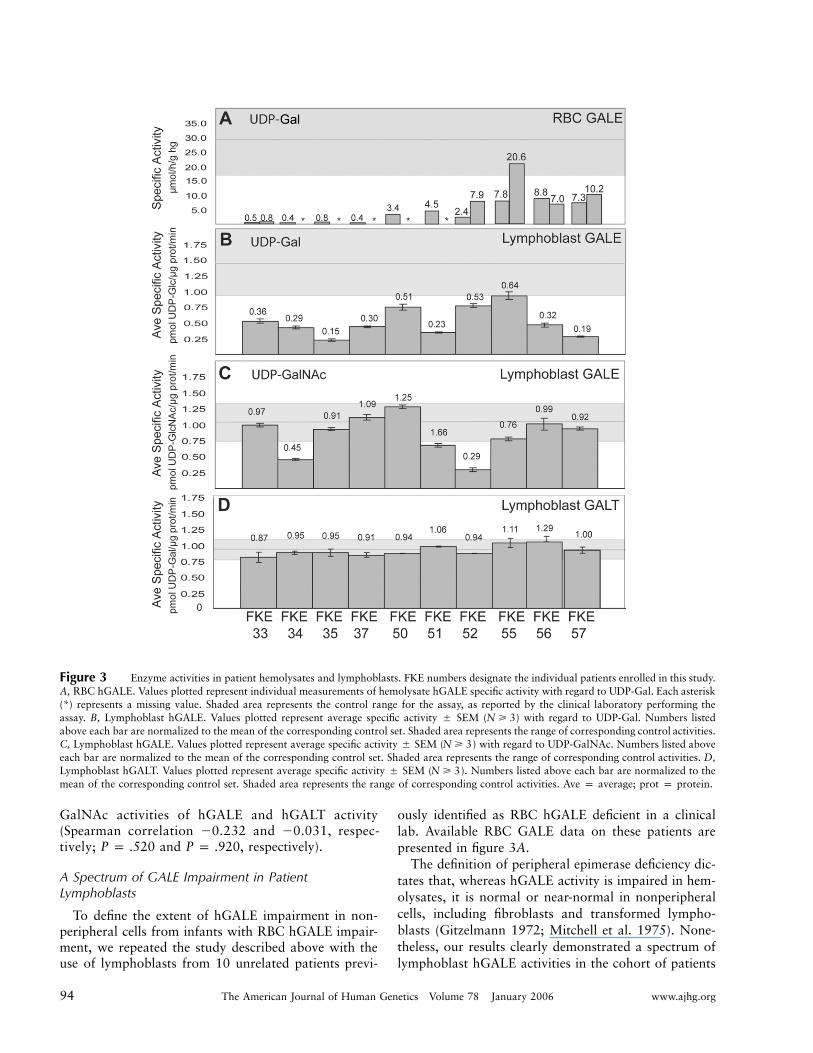
Figure 3 Enzyme activities in patient hemolysates and lymphoblasts. FKE numbers designate the individual patients enrolled in this study.A, RBC hGALE. Values plotted represent individual measurements of hemolysate hGALE specific activity with regard to UDP-Gal. Each asterisk(*) represents a missing value. Shaded area represents the control range for the assay, as reported by the clinical laboratory performing theassay. B, Lymphoblast hGALE. Values plotted represent average specific activity � SEM ( ) with regard to UDP-Gal. Numbers listedN � 3above each bar are normalized to the mean of the corresponding control set. Shaded area represents the range of corresponding control activities.C, Lymphoblast hGALE. Values plotted represent average specific activity � SEM ( ) with regard to UDP-GalNAc. Numbers listed aboveN � 3each bar are normalized to the mean of the corresponding control set. Shaded area represents the range of corresponding control activities. D,Lymphoblast hGALT. Values plotted represent average specific activity � SEM ( ). Numbers listed above each bar are normalized to theN � 3mean of the corresponding control set. Shaded area represents the range of corresponding control activities. Ave p average; prot p protein.
GalNAc activities of hGALE and hGALT activity(Spearman correlation �0.232 and �0.031, respec-tively; and , respectively).P p .520 P p .920
A Spectrum of GALE Impairment in PatientLymphoblasts
To define the extent of hGALE impairment in non-peripheral cells from infants with RBC hGALE impair-ment, we repeated the study described above with theuse of lymphoblasts from 10 unrelated patients previ-
ously identified as RBC hGALE deficient in a clinicallab. Available RBC GALE data on these patients arepresented in figure 3A.
The definition of peripheral epimerase deficiency dic-tates that, whereas hGALE activity is impaired in hem-olysates, it is normal or near-normal in nonperipheralcells, including fibroblasts and transformed lympho-blasts (Gitzelmann 1972; Mitchell et al. 1975). None-theless, our results clearly demonstrated a spectrum oflymphoblast hGALE activities in the cohort of patients
www.ajhg.org Openo et al.: Epimerase-Deficiency Galactosemia 95
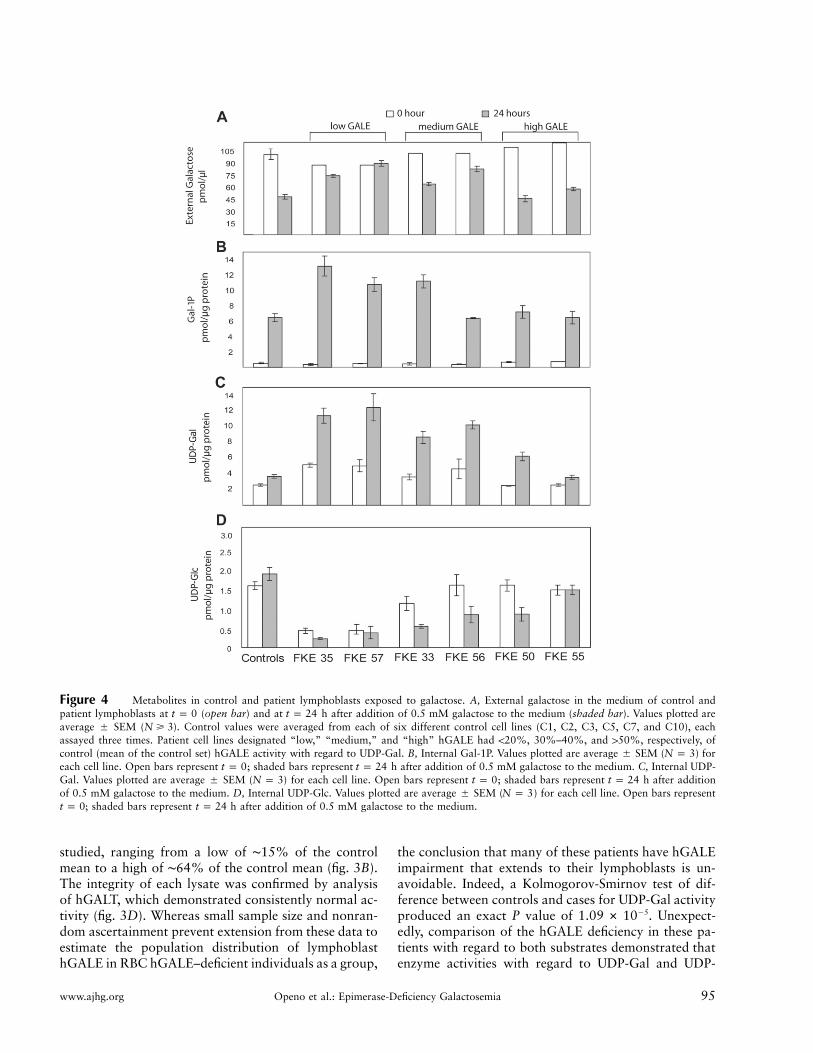
Figure 4 Metabolites in control and patient lymphoblasts exposed to galactose. A, External galactose in the medium of control andpatient lymphoblasts at (open bar) and at h after addition of 0.5 mM galactose to the medium (shaded bar). Values plotted aret p 0 t p 24average � SEM ( ). Control values were averaged from each of six different control cell lines (C1, C2, C3, C5, C7, and C10), eachN � 3assayed three times. Patient cell lines designated “low,” “medium,” and “high” hGALE had !20%, 30%–40%, and 150%, respectively, ofcontrol (mean of the control set) hGALE activity with regard to UDP-Gal. B, Internal Gal-1P. Values plotted are average � SEM ( ) forN p 3each cell line. Open bars represent ; shaded bars represent h after addition of 0.5 mM galactose to the medium. C, Internal UDP-t p 0 t p 24Gal. Values plotted are average � SEM ( ) for each cell line. Open bars represent ; shaded bars represent h after additionN p 3 t p 0 t p 24of 0.5 mM galactose to the medium. D, Internal UDP-Glc. Values plotted are average � SEM ( ) for each cell line. Open bars representN p 3
; shaded bars represent h after addition of 0.5 mM galactose to the medium.t p 0 t p 24
studied, ranging from a low of ∼15% of the controlmean to a high of ∼64% of the control mean (fig. 3B).The integrity of each lysate was confirmed by analysisof hGALT, which demonstrated consistently normal ac-tivity (fig. 3D). Whereas small sample size and nonran-dom ascertainment prevent extension from these data toestimate the population distribution of lymphoblasthGALE in RBC hGALE–deficient individuals as a group,
the conclusion that many of these patients have hGALEimpairment that extends to their lymphoblasts is un-avoidable. Indeed, a Kolmogorov-Smirnov test of dif-ference between controls and cases for UDP-Gal activityproduced an exact P value of . Unexpect-�51.09 # 10edly, comparison of the hGALE deficiency in these pa-tients with regard to both substrates demonstrated thatenzyme activities with regard to UDP-Gal and UDP-
96 The American Journal of Human Genetics Volume 78 January 2006 www.ajhg.org
GalNAc were not significantly correlated (correlation0.030; . Indeed, the patient exhibiting theP p .9338most severe impairment with regard to UDP-Gal(FKE35, ∼15% of control) demonstrated essentially nor-mal activity with regard to UDP-GalNAc (∼90% of con-trol). Conversely, the patient exhibiting the most se-vere impairment with regard to UDP-GalNAc (FKE52,∼29% of control) exhibited one of the higher activitieswith regard to UDP-Gal (∼53% of control).
Finally, data presented in figure 3A and 3B illustratethat, whereas the RBC hGALE values reported for these10 patients varied by 120-fold, they showed no signif-icant evidence of correlation with the lymphoblasthGALE activities detected (correlation 0.280; P p
). There are many possible explanations for this lack.434of correlation among the RBC hGALE activity valuesdetermined in the clinical labs, ranging from differencesin the expression or function of different hGALE allelesin different cell types to the potential impact of diet orother biological factors or even to varying shipping andhandling conditions or differing assay conditions. In-deed, the fact that repeat clinical assays on two of thepatients in this study varied internally by close to a factorof 3 (FKE52 and FKE55) demonstrates the inherent var-iability in these values.
Metabolic Consequence of Partial GALE Impairment inHuman Lymphoblasts
Whereas studies of GALE enzyme activity in vitro areuseful, the more important parameter to measure is themetabolism of galactose in living cells. Toward that end,we monitored the metabolic response of selected controland patient lymphoblasts cultured in the presence andabsence of 0.5 mM galactose. In brief, cells cultured instandard RPMI 1640 medium (containing 11.1 mM glu-cose) were divided into duplicate flasks at time zero, and0.5 mM galactose was added to one flask from each set.External galactose and internal Gal-1P, UDP-Gal, andUDP-Glc were then monitored in samples harvested at0 h and 24 h from these cultures (fig. 4). Twelve lineswere studied, including six control and six patient lines.The control lines were selected to represent the spectrumof hGALE values evident in the control population stud-ied (C1, C2, C3, C5, C7, and C10). The patient lym-phoblasts were selected to include the two “lowesthGALE UDP-Gal activity” lines (FKE35 and FKE57),two “intermediate hGALE activity” lines (FKE33 andFKE56), and the two “highest hGALE activity” lines(FKE50 and FKE55).
With regard to external metabolites, by 24 h, all thecontrol lines had consumed ∼50% of their galactose. Incontrast, the two patient lines with the lowest hGALEactivity had each consumed less than ∼15% of theirgalactose. The patient lines with the intermediate and
highest level hGALE activity had each consumed be-tween ∼19% and ∼50% of their galactose (fig. 4A). AKruskal-Wallis test of difference between the four groupsmonitored (control and patient low, medium, and high)demonstrated that, whereas, as expected, there was nosignificant difference in the starting ( ) external ga-t p 0lactose values for the four cultures (exact ),P p .3817by 24 h, the levels of galactose remaining for the differentgroups of cells were significantly different from one an-other (exact ).P p .0088
With regard to internal metabolites, many of the pa-tient lines again displayed abnormalities. For example,whereas all of the control cell lines accumulated 6–7pmol Gal-1P/mg protein after exposure to galactose, themost severely hGALE-impaired patient lines accumu-lated nearly twice that amount (fig. 4B). Similarly,whereas galactose exposure had little effect on UDP-Galaccumulation in control lymphoblasts, UDP-Gal levelsin the patient cells essentially doubled in the presence ofgalactose for all but those with the highest hGALE ac-tivity. It is interesting to note that even basal UDP-Gallevels (in the absence of galactose exposure) were higherin the more severely affected patient lines, perhaps re-flecting the altered metabolism of sugars scavenged fromserum glycoproteins and glycolipids. Finally, whereasevery control line demonstrated either unchanged or el-evated UDP-Glc in response to galactose exposure, al-most every patient line demonstrated depressed UDP-Glc after exposure to galactose. A Kruskal-Wallis test ofdifference between the four groups at 24 h was highlysignificant (exact ). Although the quantitativeP p .0046distinctions between control and patient lines for theseinternal metabolites were not huge, given the limitednature of the hGALE impairment, they were nonethelessremarkable.
RBC Metabolic Consequences of Partial GALEImpairment in Patients on Normal versus Galactose-Restricted Diets
Our lymphoblast studies clearly suggested that partialimpairment of hGALE can result in metabolic abnor-malities for cells exposed to galactose in culture. None-theless, how well do these results mimic the metabolicreality for patients? To address this question, we col-lected as much dietary and metabolic information aspossible with regard to the patients enrolled in this study.Although this information was unavailable for some pa-tients, for others we were able to learn if and whendietary restriction of galactose was initiated and/or dis-continued and how RBC Gal-1P values responded tothese changes in diet. The results were striking. In brief,whereas all the patients presumably exhibited elevatedRBC galactose plus Gal-1P levels as neonates on normaldiet—which is, in part, how they were ascertained by
www.ajhg.org Openo et al.: Epimerase-Deficiency Galactosemia 97
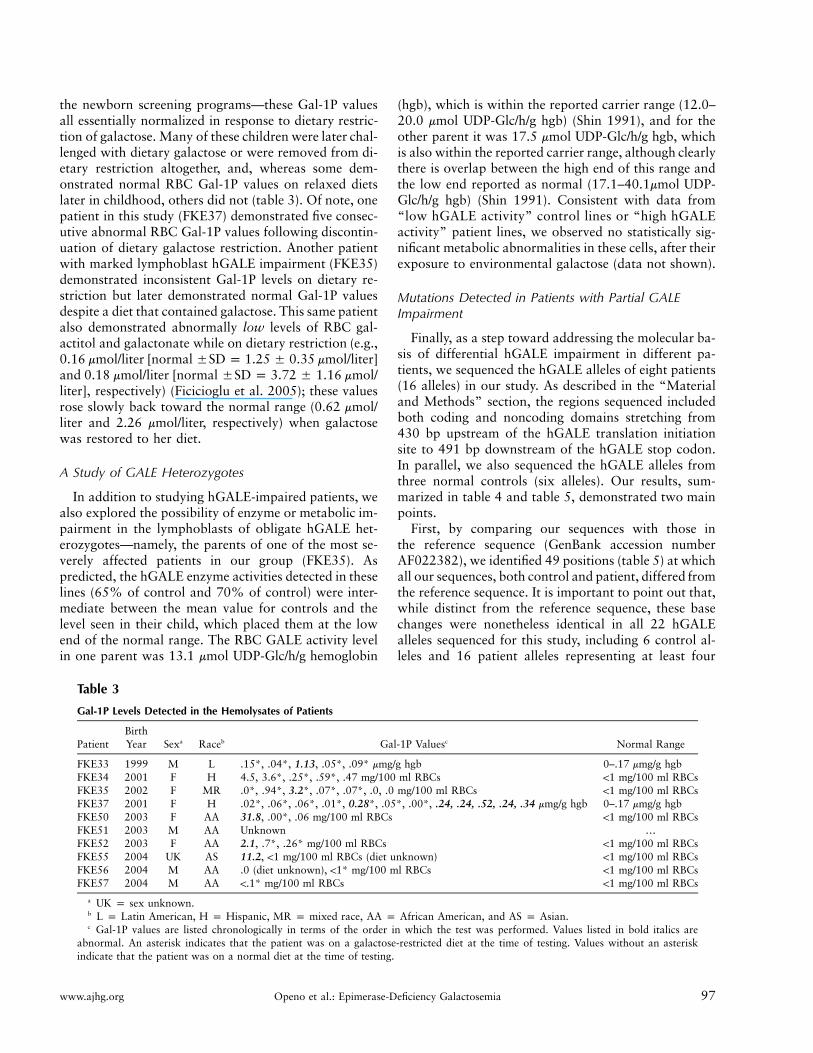
Table 3
Gal-1P Levels Detected in the Hemolysates of Patients
PatientBirthYear Sexa Raceb Gal-1P Valuesc Normal Range
FKE33 1999 M L .15*, .04*, 1.13, .05*, .09* mmg/g hgb 0–.17 mmg/g hgbFKE34 2001 F H 4.5, 3.6*, .25*, .59*, .47 mg/100 ml RBCs !1 mg/100 ml RBCsFKE35 2002 F MR .0*, .94*, 3.2*, .07*, .07*, .0, .0 mg/100 ml RBCs !1 mg/100 ml RBCsFKE37 2001 F H .02*, .06*, .06*, .01*, 0.28*, .05*, .00*, .24, .24, .52, .24, .34 mmg/g hgb 0–.17 mmg/g hgbFKE50 2003 F AA 31.8, .00*, .06 mg/100 ml RBCs !1 mg/100 ml RBCsFKE51 2003 M AA Unknown …FKE52 2003 F AA 2.1, .7*, .26* mg/100 ml RBCs !1 mg/100 ml RBCsFKE55 2004 UK AS 11.2, !1 mg/100 ml RBCs (diet unknown) !1 mg/100 ml RBCsFKE56 2004 M AA .0 (diet unknown), !1* mg/100 ml RBCs !1 mg/100 ml RBCsFKE57 2004 M AA !.1* mg/100 ml RBCs !1 mg/100 ml RBCs
a UK p sex unknown.b L p Latin American, H p Hispanic, MR p mixed race, AA p African American, and AS p Asian.c Gal-1P values are listed chronologically in terms of the order in which the test was performed. Values listed in bold italics are
abnormal. An asterisk indicates that the patient was on a galactose-restricted diet at the time of testing. Values without an asteriskindicate that the patient was on a normal diet at the time of testing.
the newborn screening programs—these Gal-1P valuesall essentially normalized in response to dietary restric-tion of galactose. Many of these children were later chal-lenged with dietary galactose or were removed from di-etary restriction altogether, and, whereas some dem-onstrated normal RBC Gal-1P values on relaxed dietslater in childhood, others did not (table 3). Of note, onepatient in this study (FKE37) demonstrated five consec-utive abnormal RBC Gal-1P values following discontin-uation of dietary galactose restriction. Another patientwith marked lymphoblast hGALE impairment (FKE35)demonstrated inconsistent Gal-1P levels on dietary re-striction but later demonstrated normal Gal-1P valuesdespite a diet that contained galactose. This same patientalso demonstrated abnormally low levels of RBC gal-actitol and galactonate while on dietary restriction (e.g.,0.16 mmol/liter [normal �SD p 1.25 � 0.35 mmol/liter]and 0.18 mmol/liter [normal �SD p 3.72 � 1.16 mmol/liter], respectively) (Ficicioglu et al. 2005); these valuesrose slowly back toward the normal range (0.62 mmol/liter and 2.26 mmol/liter, respectively) when galactosewas restored to her diet.
A Study of GALE Heterozygotes
In addition to studying hGALE-impaired patients, wealso explored the possibility of enzyme or metabolic im-pairment in the lymphoblasts of obligate hGALE het-erozygotes—namely, the parents of one of the most se-verely affected patients in our group (FKE35). Aspredicted, the hGALE enzyme activities detected in theselines (65% of control and 70% of control) were inter-mediate between the mean value for controls and thelevel seen in their child, which placed them at the lowend of the normal range. The RBC GALE activity levelin one parent was 13.1 mmol UDP-Glc/h/g hemoglobin
(hgb), which is within the reported carrier range (12.0–20.0 mmol UDP-Glc/h/g hgb) (Shin 1991), and for theother parent it was 17.5 mmol UDP-Glc/h/g hgb, whichis also within the reported carrier range, although clearlythere is overlap between the high end of this range andthe low end reported as normal (17.1–40.1mmol UDP-Glc/h/g hgb) (Shin 1991). Consistent with data from“low hGALE activity” control lines or “high hGALEactivity” patient lines, we observed no statistically sig-nificant metabolic abnormalities in these cells, after theirexposure to environmental galactose (data not shown).
Mutations Detected in Patients with Partial GALEImpairment
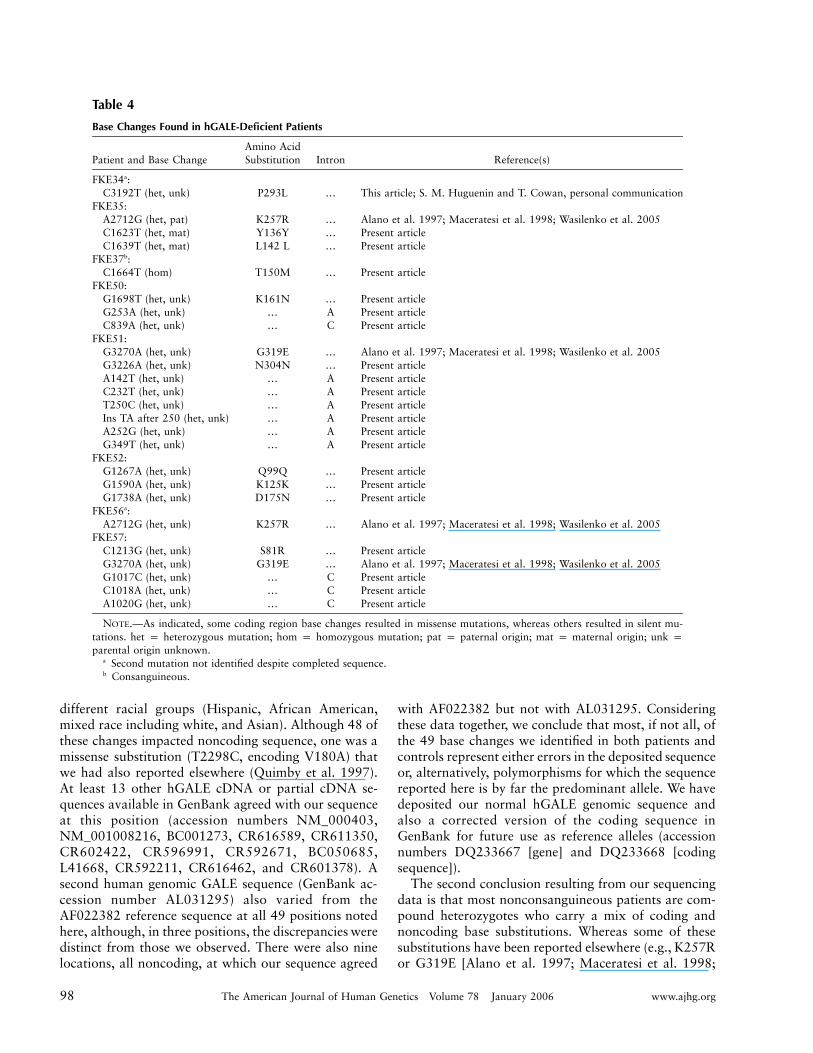
Finally, as a step toward addressing the molecular ba-sis of differential hGALE impairment in different pa-tients, we sequenced the hGALE alleles of eight patients(16 alleles) in our study. As described in the “Materialand Methods” section, the regions sequenced includedboth coding and noncoding domains stretching from430 bp upstream of the hGALE translation initiationsite to 491 bp downstream of the hGALE stop codon.In parallel, we also sequenced the hGALE alleles fromthree normal controls (six alleles). Our results, sum-marized in table 4 and table 5, demonstrated two mainpoints.
First, by comparing our sequences with those inthe reference sequence (GenBank accession numberAF022382), we identified 49 positions (table 5) at whichall our sequences, both control and patient, differed fromthe reference sequence. It is important to point out that,while distinct from the reference sequence, these basechanges were nonetheless identical in all 22 hGALEalleles sequenced for this study, including 6 control al-leles and 16 patient alleles representing at least four
98 The American Journal of Human Genetics Volume 78 January 2006 www.ajhg.org
Table 4
Base Changes Found in hGALE-Deficient Patients
Patient and Base ChangeAmino AcidSubstitution Intron Reference(s)
FKE34a:C3192T (het, unk) P293L … This article; S. M. Huguenin and T. Cowan, personal communication
FKE35:A2712G (het, pat) K257R … Alano et al. 1997; Maceratesi et al. 1998; Wasilenko et al. 2005C1623T (het, mat) Y136Y … Present articleC1639T (het, mat) L142 L … Present article
FKE37b:C1664T (hom) T150M … Present article
FKE50:G1698T (het, unk) K161N … Present articleG253A (het, unk) … A Present articleC839A (het, unk) … C Present article
FKE51:G3270A (het, unk) G319E … Alano et al. 1997; Maceratesi et al. 1998; Wasilenko et al. 2005G3226A (het, unk) N304N … Present articleA142T (het, unk) … A Present articleC232T (het, unk) … A Present articleT250C (het, unk) … A Present articleIns TA after 250 (het, unk) … A Present articleA252G (het, unk) … A Present articleG349T (het, unk) … A Present article
FKE52:G1267A (het, unk) Q99Q … Present articleG1590A (het, unk) K125K … Present articleG1738A (het, unk) D175N … Present article
FKE56a:A2712G (het, unk) K257R … Alano et al. 1997; Maceratesi et al. 1998; Wasilenko et al. 2005
FKE57:C1213G (het, unk) S81R … Present articleG3270A (het, unk) G319E … Alano et al. 1997; Maceratesi et al. 1998; Wasilenko et al. 2005G1017C (het, unk) … C Present articleC1018A (het, unk) … C Present articleA1020G (het, unk) … C Present article
NOTE.—As indicated, some coding region base changes resulted in missense mutations, whereas others resulted in silent mu-tations. het p heterozygous mutation; hom p homozygous mutation; pat p paternal origin; mat p maternal origin; unk pparental origin unknown.
a Second mutation not identified despite completed sequence.b Consanguineous.
different racial groups (Hispanic, African American,mixed race including white, and Asian). Although 48 ofthese changes impacted noncoding sequence, one was amissense substitution (T2298C, encoding V180A) thatwe had also reported elsewhere (Quimby et al. 1997).At least 13 other hGALE cDNA or partial cDNA se-quences available in GenBank agreed with our sequenceat this position (accession numbers NM_000403,NM_001008216, BC001273, CR616589, CR611350,CR602422, CR596991, CR592671, BC050685,L41668, CR592211, CR616462, and CR601378). Asecond human genomic GALE sequence (GenBank ac-cession number AL031295) also varied from theAF022382 reference sequence at all 49 positions notedhere, although, in three positions, the discrepancies weredistinct from those we observed. There were also ninelocations, all noncoding, at which our sequence agreed
with AF022382 but not with AL031295. Consideringthese data together, we conclude that most, if not all, ofthe 49 base changes we identified in both patients andcontrols represent either errors in the deposited sequenceor, alternatively, polymorphisms for which the sequencereported here is by far the predominant allele. We havedeposited our normal hGALE genomic sequence andalso a corrected version of the coding sequence inGenBank for future use as reference alleles (accessionnumbers DQ233667 [gene] and DQ233668 [codingsequence]).
The second conclusion resulting from our sequencingdata is that most nonconsanguineous patients are com-pound heterozygotes who carry a mix of coding andnoncoding base substitutions. Whereas some of thesesubstitutions have been reported elsewhere (e.g., K257Ror G319E [Alano et al. 1997; Maceratesi et al. 1998;
www.ajhg.org Openo et al.: Epimerase-Deficiency Galactosemia 99
Table 5
Base Changes Relative to the hGALE ReferenceSequence Found in All Patient and Control Alleles
The table is available in its entirety in the onlineedition of The American Journal of Human Genetics.
Wasilenko et al. 2005] and P293L [S. M. Huguenin andT. Cowan, personal communication]), the majority iden-tified in this study (table 4) were novel. Future studieswill explore the functional significance of these substi-tution mutations.
Discussion
The data reported here demonstrate two fundamentalpoints with regard to epimerase-deficiency galactosemia.First, biochemical hGALE deficiency is not a binary con-dition; it is a continuum disorder. Not all the infantsascertained for this study with RBC epimerase deficiencyexhibited normal hGALE activity in nonperipheral cells.We propose to apply the term “intermediate GALE de-ficiency” to patients who exhibit partial impairment ofhGALE activity in nonperipheral cells, such as lympho-blasts. It is also important to note that many patientlines demonstrated impairment of hGALE activity, notonly with regard to UDP-Gal but also with regard toUDP-GalNAc. Considering the importance of both re-actions to the maintenance of normal UDP-sugar poolsin mammalian cells, it remains unknown which loss ofactivity plays the greater role in defining patient outcomein epimerase-deficiency galactosemia. More in-depth andlong-term studies of these and other patients may helpto address this question. Finally, it is important to stressthat, whereas all the patients ascertained exhibited RBChGALE impairment, there was no statistically significantcorrelation between the degree of RBC hGALE impair-ment and the degree of lymphoblast hGALE deficiencyobserved. This is an important point, because it under-scores the reality that RBC hGALE activity level cannotbe used to distinguish peripheral from intermediate orother forms of epimerase-deficiency galactosemia. Thispoint further raises the possibility of tissue-specific fac-tors that influence either expression or function ofhGALE. This concept is fully consistent with previousreports of tissue-specific GALE impairment in patientswith peripheral epimerase deficiency (Gitzelmann 1972;Gitzelmann and Steimann 1973; Mitchell et al. 1975;Gitzelmann et al. 1977). One likely factor that may con-tribute to loss of GALE activity in RBCs relative to fi-broblasts or lymphoblasts is compromised stability. In-deed, we have previously demonstrated evidence ofinstability in the proteins encoded by a small number ofhGALE alleles derived from patients with ostensibly pe-ripheral GALE deficiency (Wohlers et al. 1999). The pos-
sibility of other factors that contribute as tissue-specificmodifiers of hGALE expression or function remains anopen question.
Second, many of the intermediate hGALE deficiencylymphoblast lines studied here and at least some of thepatients from whom these lines were derived demon-strated metabolic evidence of impaired galactose metab-olism both in vitro and in vivo, in the presence of en-vironmental galactose, and, in some cases, also in theabsence of galactose. The most notable metabolic ab-normalities observed in the presence of environmentalgalactose included markedly elevated Gal-1P and UDP-Gal and depressed UDP-Glc. The most notable meta-bolic abnormalities observed in patient cells cultured inthe absence of environmental galactose included mildlyelevated UDP-Gal and depressed UDP-Glc. It is impor-tant to point out that, whereas no free galactose wasintentionally added to the medium bathing these cells,their medium did contain 10% fetal bovine serum, whichis rich in glycoproteins and glycolipids that could serveas substrates for a salvage pathway (Krieger et al. 1989),thereby providing a “backdoor” supply of low levels ofexogenous galactose to the cells. The ratio of UDP-Glc/UDP-Gal detected in control lymphoblasts cultured inboth the presence and absence of galactose was between0.5 and 0.67; this value is low compared with the 1.4ratio reported elsewhere for human lymphoblasts(Wehrli et al. 2001). The basis for this disparity remainsunknown but may reflect differences in the culture con-ditions used or in the procedures used for cell harvest,sample preparation, or analysis. What is striking is thatthe UDP-Glc-to-UDP-Gal ratio in the more severelyhGALE-impaired patient cells was close to 0.1 in theabsence of galactose and close to 0.02 in the presenceof galactose. This is an extremely abnormal ratio andcould have significant implications for the ability of thesecells to synthesize normal glycoproteins and glycolipids.
As mentioned above, one patient with low lympho-blast hGALE activity was also monitored with regardto RBC galactitol and galactonate, both while on dietaryrestriction of galactose and then again after the intro-duction of dietary galactose. This patient demonstratedabnormally low levels of both metabolites in the absenceof dietary galactose, and both values essentially nor-malized in response to treatment with dietary galactose.This result is striking not only because it serves as furtherevidence of abnormal galactose metabolism in vivo in apatient with intermediate GALE deficiency but also be-cause this result is the opposite of what is seen for pa-tients with transferase-deficiency galactosemia. Patientswith even partial (Duarte/classic compound heterozy-gous galactosemia) GALT deficiency often demonstrateelevated, not depressed, levels of RBC galactitol and gal-actonate relative to age-matched controls (Yager et al.2003; Ficicioglu et al. 2005).
100 The American Journal of Human Genetics Volume 78 January 2006 www.ajhg.org
At present, the clinical significance of all these met-abolic abnormalities remains unclear but, given thatsome of the patients on normal diets (e.g., FKE37 andFKE52) demonstrated Gal-1P levels indistinguishablefrom those seen in treated patients with classic galac-tosemia, the concern remains that at least some patientswith intermediate hGALE deficiency who are not treatedmay be at risk for long-term complications. Given thathGALE-deficiency in most patients is never diagnosedor, if it is diagnosed, those patients are lost to follow-up at an early age, the long-term outcome for most pa-tients is never ascertained. Future large-scale, longitu-dinal studies will be required to address this issue.Unfortunately, states that drop total galactose (Gal �Gal-1P) screening from their newborn profiles will fur-ther exacerbate the current problem, since all patientswith epimerase-deficiency galactosemia will demonstratenormal GALT activity and will, therefore, slip throughan abbreviated screen undetected.
Impact of Impaired GALE in Mammalian Cells
Few studies have explored the biochemical or phe-notypic impact of GALE impairment in mammalian cellscultured in the presence or absence of exogenous galac-tose (Robinson et al. 1963, 1966; Kingsley et al. 1986a,1986b; Krieger et al. 1989; Schulz et al. 2005). Perhapsthe best studied of these cells are the Chinese hamsterovary (CHO) cell–derived ldlD line, originally selectedon the basis of impaired LDL receptor function by Krie-ger and colleagues (1981). Subsequent studies (Kingsleyet al. 1986a; Krieger et al. 1989) defined this phenotypeas secondary to a complete loss of GALE activity, re-sulting in the abnormal processing of both N- and O-linked glycoproteins, including the LDL receptor. Thesestudies further demonstrated that, whereas supplemen-tation of the culture medium with low levels of galactoseand GalNAc restored both glycoprotein processing andLDL receptor function, supplementation of the mediumwith 1125 mM galactose resulted in impaired ldlD cellgrowth. Normal CHO cells exposed to galactose in par-allel demonstrated no growth abnormalities (Krieger etal. 1989).
Recent studies from our laboratory both confirmedand extended these earlier reports (Schulz et al. 2005).In particular, we demonstrated that not only ldlD cellsalone, which exhibit no detectable GALE activity, butalso ldlD cells transfected to express low (5%–10% ofwild-type) levels of hGALE are growth impaired in thepresence of 250 mM galactose. We further demonstratedthat both ldlD cells and ldlD cells expressing low levelsof hGALE accumulate abnormally high levels of Gal-1Pand UDP-Gal and abnormally low levels of UDP-Glcupon exposure to 250 mM galactose. Both wild-typeCHO and ldlD cells transfected to express wild-type lev-
els of hGALE did not display these abnormalities (Schulzet al. 2005).
The quantitative relationship between the level ofGALE expression and both the requirement for and thesensitivity to exogenous galactose in mammalian cellsremains unclear. The most severely hGALE-impaired pa-tients reported to date (Walter et al. 1999) are all ho-mozygous for the V94M mutation associated with atleast 5% residual activity (Wohlers et al. 1999; Wohlersand Fridovich-Keil 2000). These cells fail to demonstrateabnormal LDL receptor structure or function in culture(Kingsley et al. 1986b), although these patients clearlydisplay a spectrum of metabolic and other abnormalities,some likely related to hGALE dysfunction, others likelynot related (Walter et al. 1999). Finally, results reportedhere demonstrate that patients and/or their cells withintermediate levels of hGALE impairment can displayabnormally high levels of Gal-1P in the presence of ga-lactose and abnormally high levels of UDP-Gal and lowlevels of UDP-Glc even in the absence of galactose. Thesedata clearly support the conclusion originally put for-ward by Kalckar (1965) that, unlike patients with classicgalactosemia, GALE-deficient patients may require atleast a limited amount of dietary galactose for normalhomeostasis.
Our studies of ldlD cells demonstrated that uridinesupplementation resolved some but not all of the growthand metabolic abnormalities in these GALE-deficientcells upon exposure to exogenous galactose (Schulz etal. 2005). Studies are currently under way to test theimpact of uridine supplementation on patient cells.
Mutations in hGALE
From hGALE sequence analysis of eight of the patientsin this study, we identified 23 distinct base changes, ofwhich 20 were novel (table 4). All of the changes iden-tified were found in the heterozygous or compound het-erozygous state, except for a T150M missense substi-tution, which was found in the homozygous state in onepatient of consanguineous origin. Of the six novel mis-sense substitution mutations reported here, only one,K161N, impacts a residue that is fully conserved amongthe human, rat, yeast, and E. coli GALE sequences.Nonetheless, most of the amino acid substitutions arethemselves nonconservative.
Surprisingly, most patients did not demonstrate pre-cisely two mutations. Five patients (FKE35, FKE50,FKE51, FKE52, and FKE57) each demonstrated threeor more base changes, the majority of which were eithernoncoding or silent substitutions. Future studies will berequired to dissect the functional significance of each ofthese base changes and to define each as either a causalmutation or a neutral polymorphism. Two additionalpatients (FKE34 and FKE56) each demonstrated only a
www.ajhg.org Openo et al.: Epimerase-Deficiency Galactosemia 101
single heterozygous mutation, despite complete sequenc-ing of the hGALE locus. The absence of a second de-tectable mutation in each of these patients remains un-explained, although either of two possibilities may apply.First, there may be a second mutation that was not de-tected by our sequencing strategy. Extreme upstream ordownstream regulatory mutations outside the targetedarea, for example, would not have been detected. Al-ternatively, a partial gene deletion may have precludedPCR amplification of portions of one GALE allele, al-though the fact that one mutation was detected in theheterozygous state in each of these patients rules out thepossibility of a full hGALE gene deletion. Future studieswill address this question. The second possible expla-nation is that the two heterozygous “patients” are ac-tually heterozygote carriers, and there is no second mu-tation. Parental studies will be required to address thispossibility.
Acknowledgments
Our first and most important acknowledgment is to the pa-tients and families who participated in this study. Without theirselfless generosity, none of this work would have been possible.We also thank Stanton Segal, Stephen Shear, Deborah Boylan,Virginia Proud, Heather Creswick, Rebecca Sanders, and UrielCastaneda for their contributions to this work. This projectwas supported by grant awards from the National Institutesof Health (to J.L.F.-K.), as well as by funds from the Achieve-ment Rewards for College Scientists Foundation (to J.M.S.).This work is respectfully dedicated to the memory of Dr. Mi-chael Palmieri.
Web ResourcesAccession numbers and URLs for data presented herein are asfollows:
ExPASy, http://us.expasy.org/ (for GALK [EC 2.7.1.6], GALT [EC2.7.7.12], and GALE [EC 5.1.3.2])
GenBank, http://www.ncbi.nlm.nih.gov/Genbank/ (for hGALE refer-ence sequences [accession numbers AF022382, NM_000403,NM_001008216, BC001273, CR616589, CR611350, CR602422,CR596991, CR592671, BC050685, L41668, CR592211,CR616462, CR601378, AL031295, DQ233667, and DQ233668])
Online Mendelian Inheritance in Man (OMIM), http://www.ncbi.nlm.nih.gov/entrez/Omim/
ReferencesAlano A, Almashanu S, Chinsky JM, Costeas P, Blitzer MG, Wulfsberg
EA, Cowan TM (1998) Molecular characterization of a unique pa-tient with epimerase-deficiency galactosaemia. J Inher Metab Dis21:341–350
Alano A, Almashanu S, Maceratesi P, Reichardt J, Panny S, CowanTM (1997) UDP-galactose-4-epimerase deficiency among African-Americans: evidence for multiple alleles. J Investig Med 45:191A
Davis L, Kuehl M, Battey J (1994) Basic methods in molecular biology.2nd ed. Appleton and Lange, Norwalk, CT
Endres W, Shin YS (1990) Cataract and metabolic disease. J InherMetab Dis 13:509–516
Ficicioglu C, Yager C, Segal S (2005) Galactitol and galactonate inred blood cells of children with the Duarte/galactosemia genotype.Mol Genet Metab 84:152–159
Gitzelmann R (1967) Hereditary galactokinase deficiency, a newly rec-ognized cause of juvenile cataracts. Pediatr Res 1:14–23
——— (1972) Deficiency of uridine diphosphate galactose 4-epimer-ase in blood cells of an apparently healthy infant. Helv Paediat Acta27:125–130
Gitzelmann R, Steimann B (1973) Uridine diphosphate galactose 4-epimerase deficiency. Helv Paediat Acta 28:497–510
Gitzelmann R, Steinmann B, Mitchell B, Haigis E (1977) Uridine di-phosphate galactose 4′-epimerase deficiency. IV. Report of eight casesin three families. Helv Paediat Acta 31:441–452
Goppert (1917) Galaktosurie nach Milchzuckergabe bei angeborenem,familiaerem chronischem Leberleiden. Klin Wschr 54:473–477
Holton JB, Gillett MG, MacFaul R, Young R (1981) Galactosemia: anew severe variant due to uridine diphosphate galactose-4-epimerasedeficiency. Arch Dis Child 56:885–887
Holton JB, Walter JH, Tyfield LA (2000) Galactosaemia. In: ScriverCR, Beaudet AL, Sly SW, Valle D, Childs B, Kinzler KW, VogelsteinB (eds) Metabolic and molecular bases of inherited disease. Mc-Graw-Hill, New York, pp 1553–1587
Hotelling H, Pabst M (1936) Rank correlation and tests of significanceinvolving no assumption of normality. Ann Math Statist 7:29–43
Kalckar HM (1965) Galactose metabolism and cell “sociology.” Sci-ence 150:305–313
Kingsley D, Kozarsky KF, Hobbie L, Krieger M (1986a) Reversibledefects in O-linked glycosylation and LDL receptor expression in aUDP-Gal/UDP-GalNAc 4-epimerase deficient mutant. Cell 44:749–759
Kingsley DM, Krieger M, Holton JB (1986b) Structure and functionof low-density lipoprotein receptors in epimerase-deficient galac-tosemia. N Engl J Med 314:1257–1258
Kolmogorov A (1941) Confidence limits for an unknown distributionfunction. Ann Math Stat 12:461–463
Krieger M, Brown MS, Goldstein JL (1981) Isolation of Chinese ham-ster cell mutants defective in the receptor-mediated endocytosis oflow density lipoprotein. J Mol Biol 150:167–184
Krieger M, Reddy P, Kozarsky K, Kingsley D, Hobbie L, Penman M(1989) Analysis of the synthesis, intracellular sorting, and functionof glycoproteins using a mammalian cell mutant with reversibleglycosylation defects. Methods Cell Biol 32:57–84
Kruskal W (1952) A nonparametric test for the several sample prob-lem. Ann Math Stat 23:525–540
Levy H (1980) Screening for galactosemia. In: Burman D, Holton JB,Pennock CA (eds) Inherited disorders of carbohydrate metabolism.MTP Press, Lancaster, pp 133–139
Maceratesi P, Daude N, Dallapiccola B, Novelli G, Allen R, OkanoY, Reichardt J (1998) Human UDP-galactose 4′ epimerase (GALE)gene and identification of five missense mutations in patients withepimerase-deficiency galactosemia. Mol Genet Metab 63:26–30
Mayes J, Guthrie R (1968) Detection of heterozygotes for galactoki-nase deficiency in a human population. Biochem Genet 2:219–230
Mitchell B, Haigis E, Steinmann B, Gitzelmann R (1975) Reversal ofUDP-galactose 4-epimerase deficiency of human leukocytes in cul-ture. Proc Nat Acad Sci 72:5026–5030
Neitzel H (1986) A routine method for the establishment of permanentgrowing lymphoblastoid cell lines. Hum Genet 73:320–326
Piller F, Hanlon MH, Hill RL (1983) Co-purification and character-ization of UDP-glucose 4-epimerase and UDP-N-acetylglucosamine4-epimerase from porcine submaxillary glands. J Biol Chem 258:10774–10778
Quimby BB, Alano A, Almashanu S, DeSandro AM, Cowan TM,Fridovich-Keil JL (1997) Characterization of two mutations asso-
102 The American Journal of Human Genetics Volume 78 January 2006 www.ajhg.org
ciated with epimerase-deficiency galactosemia using a yeast expres-sion system for human UDP-galactose-4-epimerase. Am J Hum Ge-net 61:590–598
Robinson E, Kalckar H, Troedson H (1966) Metabolic inhibitions ofmammaliam uridine diphosphate galactose-4-epimerase in cell cul-tures and tumor cells. J Biol Chem 241:2737–2758
Robinson EA, Kalckar HM, Troedsson H (1963) On the loss of uridinediphosphogalactose-4-epimerase activity in L cell cultures and intumor cells. Biochem Biophys Res Com 13:313–319
Ross KL, Davis CN, Fridovich-Keil JL (2004) Differential roles of theLeloir pathway enzymes and metabolites in defining galactose sen-sitivity in yeast. Mol Genet Metab 83:103–116
Sardharwalla IB, Wraith JE, Bridge C, Fowler B, Roberts SA (1988)A patient with severe type of epimerase deficiency galactosemia. JInher Metab Dis 11:249–251
Schulpis KH, Papakonstantinou ED, Koidou A, Michelakakis H, Tza-mouranis J, Patsouras A, Shin Y (1993) UDP galactose-4-epimerasedeficiency in a 5.5-year-old girl with a unilateral cataract. J InherMetab Dis 16:903–904
Schulz J, Ross K, Malmstrom K, Krieger M, Fridovich-Keil J (2005)Mediators of galactose sensitivity in UDP-galactose 4′-epimerase-impaired mammalian cells. J Biol Chem 280:13493–13502
Schulz J, Watson A, Sanders R, Ross K, Thoden J, Holden H, Fri-dovich-Keil J (2004) Determinants of function and substrate spec-ificity in human UDP-galactose 4′-epimerase. J Biol Chem 279:32796–32803
Shapiro S, Wilk M (1965) An analysis of variance test for normality(complete samples). Biometrika 52:591–611
Shin Y (1991) Diagnosis of galactosemia and the metabolites. In:Holmes FA (ed) Techniques in diagnostic human biochemical ge-netics: a laboratory manual. Wiley-Liss, New York, pp 280
Shin YS, Korenke GC, Huddke P, Knerr I, Podskarbi T (2000) UDPga-
lactose epimerase in lens and fibroblasts: activity expression in pa-tients with cataracts and mental retardation. J Inherit Metab Dis23:383–386
Smits HP, Cohen A, Buttler T, Nielsen J, Olsson L (1998) Cleanupand analysis of sugar phosphates in biological extracts by usingsolid-phase extraction and anion-exchange chromatography withpulsed amperometric detection. Anal Biochem 261:36–42
Waggoner DD, Buist NRM, Donnell GN (1990) Long-term prognosisin galactosemia: results of a survey of 350 cases. J Inher Metab Dis13:802–818
Walter JH, Roberts REP, Besley GTN, Wraith JE, Cleary MA, HoltonJB, MacFaul R (1999) Generalised uridine diphosphate galactose-4-epimerase deficiency. Arch Dis Child 80:374–376
Wasilenko J, Lucas M, Thoden J, Holden H, Fridovich-Keil J (2005)Functional characterization of the K257R and G319E hGALE allelesfound in patients with ostensibly peripheral epimerase deficiencygalactosemia. Mol Genet Metab 84:32–38
Wehrli S, Reynolds R, Chen J, Yager C, Segal S (2001) Galactosemetabolism in normal human lymphoblasts studied by (1)H, (13)Cand (31)P NMR spectroscopy of extracts. NMR Biomed 14:192–198
Wohlers T, Fridovich-Keil JL (2000) Studies of the V94M-substitutedhuman UDP-galactose-4-epimerase enzyme associated with gener-alized epimerase-deficiency galactosemia. J Inher Metab Dis 23:713–729
Wohlers TM, Christacos NC, Harreman MT, Fridovich-Keil JL (1999)Identification and characterization of a mutation, in the human UDPgalactose-4-epimerase gene, associated with generalized epimerase-deficiency galactosemia. Am J Hum Genet 64:462–470
Yager C, Chen J, Reynolds R, Segal S (2003) Galactitol and galactonatein red blood cells of galactosemic patients. Mol Genet Metab 80:283–289