Dynamic thermodiffusion model for binary liquid mixtures
11
Dynamic thermodiffusion model for binary liquid mixtures Morteza Eslamian and M. Ziad Saghir * Department of Mechanical and Industrial Engineering, Ryerson University, Toronto, Ontario, Canada M5B 2K3 Received 22 April 2009; revised manuscript received 1 June 2009; published 20 July 2009 Following the nonequilibrium thermodynamics approach, we develop a dynamic model to emulate thermo- diffusion process and propose expressions for estimating the thermal diffusion factor in binary nonassociating liquid mixtures. Here, we correlate the net heat of transport in thermodiffusion with parameters, such as the mixture temperature and pressure, the size and shape of the molecules, and mobility of the components, because the molecules have to become activated before they can move. Based on this interpretation, the net heat of transport of each component can be somehow related to the viscosity and the activation energy of viscous flow of the same component defined in Eyring’s reaction-rate theory S. Glasstone, K. J. Laidler, and H. Eyring, The Theory of Rate Processes: The Kinetics of Chemical Reactions, Viscosity, Diffusion and Electrochemical Phenomena McGraw-Hill, New York, 1941. This modeling approach is different from that of Haase and Kempers, in which thermodiffusion is considered as a function of the thermostatic properties of the mixture such as enthalpy. In simulating thermodiffusion, by correlating the net heat of transport with the activation energy of viscous flow, effects of the above mentioned parameters are accounted for, to some extent of course. The model developed here along with Haase-Kempers and Drickamer-Firoozabadi models linked with the Peng-Robinson equation of sate are evaluated against the experimental data for several recent non- associating binary mixtures at various temperatures, pressures, and concentrations. Although the model pre- diction is still not perfect, the model is simple and easy to use, physically justified, and predicts the experi- mental data very good and much better than the existing models. DOI: 10.1103/PhysRevE.80.011201 PACS numbers: 66.10.cd I. INTRODUCTION Spatial temperature gradient within a mixture of two or more components may cause mass diffusion: a process called thermodiffusion or Soret effect. In a mixture with a uniform temperature or small spatial temperature gradient, thermod- iffusion is negligible and mass diffusion occurs if a concen- tration gradient exists within the mixture. Thermodiffusion has applications in several important processes in nature and technology exemplified by its crucial role in planning for oil extraction from the hydrocarbon reservoirs, which are sub- jected to relatively large temperature gradients 1,2. Ther- modiffusion is also important in isotropic separation of liq- uids 3, in emerging applications such as particle and molecule manipulation by temperature gradient thermo- phoresis4,5, etc. Probably, the most accurate way of ob- taining the thermal diffusion coefficients is by conducting experiments. However, obtaining accurate experimental data is challenging and expensive and, in some cases, impractical. Molecular-dynamics simulation 5,6 may also provide qualitative and semiquantitative results but is doable only for simple molecules and is also considered as time consuming and expensive. As a result, the development of theoretical models to predict the thermal diffusion coefficients with minimum effort is important for the design and control of pertinent processes and systems. Most of the classical ther- modiffusion models developed for liquid mixtures are based on the nonequilibrium thermodynamics approach such as Drickamer and co-workers models 7–9, Haase 10 and Kempers 11,12 models, Firoozabadi and co-workers model 13,14, and Guy model 15. Other approaches have been employed as well, such as the hydrodynamic and Brownian motion theory 16–19, fluctuation theory 20, kinetics theory 6, and so on. In a recent publication 21, we re- viewed the existing thermodiffusion models, where we evaluated the merits of each model and classified the models as those needing a matching parameter, usually to be sup- plied from the outside of thermodynamics, and models that are rather self-reliant or independent. From another perspec- tive, the models may be considered as either dynamic or static 22. The static models rely on the thermostatic prop- erties of the mixture, such as partial molar enthalpies only and, therefore, are similar to the nonmatching parameter models; whereas the dynamic models are those that regard the thermodiffusion phenomenon as dependent on the dy- namic characteristics of the mixture and mass flow, as well as the mixture properties. Although not exactly the same, the dynamic models are similar to the matching parameter mod- els. The best example of the matching parameter models are Drickamer and co-workers 7–9 and Firoozabadi and co- workers 13,14 models provided that the matching param- eter is considered variable and mixture and temperature/ pressure dependent. In these models, assigning a constant value to the matching parameter turns them into a static model. Examples of the nonmatching parameter or static models are Haase 10 and Kempers 11,12 models. The predictions of the available models may be very dif- ferent from one another and from the experimental data and reliable models even for binary mixtures are still lacking. This is because the thermodiffusion phenomenon in nonideal liquid mixtures is not understood adequately. Therefore, one of our goals in this paper is to elucidate some physical as- pects of thermodiffusion as a dynamic process. In particular, starting from the linear nonequilibrium thermodynamics, we * Corresponding author. [email protected] PHYSICAL REVIEW E 80, 011201 2009 1539-3755/2009/801/01120111 ©2009 The American Physical Society 011201-1
Transcript of Dynamic thermodiffusion model for binary liquid mixtures

Dynamic thermodiffusion model for binary liquid mixtures
Morteza Eslamian and M. Ziad Saghir*Department of Mechanical and Industrial Engineering, Ryerson University, Toronto, Ontario, Canada M5B 2K3
�Received 22 April 2009; revised manuscript received 1 June 2009; published 20 July 2009�
Following the nonequilibrium thermodynamics approach, we develop a dynamic model to emulate thermo-diffusion process and propose expressions for estimating the thermal diffusion factor in binary nonassociatingliquid mixtures. Here, we correlate the net heat of transport in thermodiffusion with parameters, such as themixture temperature and pressure, the size and shape of the molecules, and mobility of the components,because the molecules have to become activated before they can move. Based on this interpretation, the netheat of transport of each component can be somehow related to the viscosity and the activation energy ofviscous flow of the same component defined in Eyring’s reaction-rate theory �S. Glasstone, K. J. Laidler, andH. Eyring, The Theory of Rate Processes: The Kinetics of Chemical Reactions, Viscosity, Diffusion andElectrochemical Phenomena �McGraw-Hill, New York, 1941��. This modeling approach is different from thatof Haase and Kempers, in which thermodiffusion is considered as a function of the thermostatic properties ofthe mixture such as enthalpy. In simulating thermodiffusion, by correlating the net heat of transport with theactivation energy of viscous flow, effects of the above mentioned parameters are accounted for, to some extentof course. The model developed here along with Haase-Kempers and Drickamer-Firoozabadi models linkedwith the Peng-Robinson equation of sate are evaluated against the experimental data for several recent non-associating binary mixtures at various temperatures, pressures, and concentrations. Although the model pre-diction is still not perfect, the model is simple and easy to use, physically justified, and predicts the experi-mental data very good and much better than the existing models.
DOI: 10.1103/PhysRevE.80.011201 PACS number�s�: 66.10.cd
I. INTRODUCTION
Spatial temperature gradient within a mixture of two ormore components may cause mass diffusion: a process calledthermodiffusion or Soret effect. In a mixture with a uniformtemperature or small spatial temperature gradient, thermod-iffusion is negligible and mass diffusion occurs if a concen-tration gradient exists within the mixture. Thermodiffusionhas applications in several important processes in nature andtechnology exemplified by its crucial role in planning for oilextraction from the hydrocarbon reservoirs, which are sub-jected to relatively large temperature gradients �1,2�. Ther-modiffusion is also important in isotropic separation of liq-uids �3�, in emerging applications such as particle andmolecule manipulation by temperature gradient �thermo-phoresis� �4,5�, etc. Probably, the most accurate way of ob-taining the thermal diffusion coefficients is by conductingexperiments. However, obtaining accurate experimental datais challenging and expensive and, in some cases, impractical.Molecular-dynamics simulation �5,6� may also providequalitative and semiquantitative results but is doable only forsimple molecules and is also considered as time consumingand expensive. As a result, the development of theoreticalmodels to predict the thermal diffusion coefficients withminimum effort is important for the design and control ofpertinent processes and systems. Most of the classical ther-modiffusion models developed for liquid mixtures are basedon the nonequilibrium thermodynamics approach such asDrickamer and co-workers models �7–9�, Haase �10� andKempers �11,12� models, Firoozabadi and co-workers model
�13,14�, and Guy model �15�. Other approaches have beenemployed as well, such as the hydrodynamic and Brownianmotion theory �16–19�, fluctuation theory �20�, kineticstheory �6�, and so on. In a recent publication �21�, we re-viewed the existing thermodiffusion models, where weevaluated the merits of each model and classified the modelsas those needing a matching parameter, usually to be sup-plied from the outside of thermodynamics, and models thatare rather self-reliant or independent. From another perspec-tive, the models may be considered as either dynamic orstatic �22�. The static models rely on the thermostatic prop-erties of the mixture, such as partial molar enthalpies onlyand, therefore, are similar to the nonmatching parametermodels; whereas the dynamic models are those that regardthe thermodiffusion phenomenon as dependent on the dy-namic characteristics of the mixture and mass flow, as wellas the mixture properties. Although not exactly the same, thedynamic models are similar to the matching parameter mod-els. The best example of the matching parameter models areDrickamer and co-workers �7–9� and Firoozabadi and co-workers �13,14� models provided that the matching param-eter is considered variable and mixture and temperature/pressure dependent. In these models, assigning a constantvalue to the matching parameter turns them into a staticmodel. Examples of the nonmatching parameter or staticmodels are Haase �10� and Kempers �11,12� models.
The predictions of the available models may be very dif-ferent from one another and from the experimental data andreliable models even for binary mixtures are still lacking.This is because the thermodiffusion phenomenon in nonidealliquid mixtures is not understood adequately. Therefore, oneof our goals in this paper is to elucidate some physical as-pects of thermodiffusion as a dynamic process. In particular,starting from the linear nonequilibrium thermodynamics, we*Corresponding author. [email protected]
PHYSICAL REVIEW E 80, 011201 �2009�
1539-3755/2009/80�1�/011201�11� ©2009 The American Physical Society011201-1
revisit and modify a model originally developed by Tichaceket al. �9� and propose several dynamic expressions for thecalculation of the thermal diffusion factor in a binary mix-ture. The predictive power of the proposed expressions isexamined against a large number of experimental data forbinary nonassociating mixtures and also against the Haase-Kempers and Drickamer-Firoozabadi models linked with thePeng-Robinson equation of state �PR-EOS� �23�.
II. MODEL DEVELOPMENT
Thermodiffusion in nonideal systems, such as liquid mix-tures, is usually dealt with nonequilibrium thermodynamics.Starting from the Gouy-Stodola theorem in classic thermo-dynamics and assuming that the small elements of the systemare in local equilibrium, an expression for the volumetric rateof entropy generation may be derived for a given system andused to define the conjugate forces and fluxes �24–26�. Inlinear nonequilibrium thermodynamics, for transport and rateprocesses, the heat and mass �molar� fluxes are assumed tobe linear functions of forces, such as the gradients of tem-perature and chemical potentials. For an n-component mix-ture subjected to a body force, one can write the molar dif-fusion flux of component i with respect to component n andthe mean molar velocity frame of reference, ji �mole /m2s�,
as a function of the appropriate thermodynamic forces forheat and mass transfer, i.e., � ln T and �T��k�, and the netheat of transport of n−1 components as follows �24�:
ji = − �k=1
n−1
Lik��Qk� − Qn
�� � ln T + �T��k − �n�� , �1�
where Lik are the phenomenological coefficients, Qi� �J/mole�
is the net heat of transport of component i, which is the heatflow per mole of the diffusing component i, required to beabsorbed during mass diffusion by the local region to keepthe temperature constant. The net heat of transport in Eq. �1�is based on the diffusion flow ji referred to the mean molarvelocity. The flux of the component n, jn is obtained differ-ently and, based on the fact that in a mean molar frame ofreference, the sum of all diffusive fluxes is zero. Note thatdepending on the choice of the reference component, the fluxof component i would be written in n−1 different form. Fora binary system, however, there will be only one independentflux and there is only one choice for the reference compo-nent.
Equation �1� may be used for any multicomponent sys-tem. For a binary nonhomogeneous, nonisothermal system,experimentalists usually use the following form of the diffu-
1
2
3
4
5
6
7
8
S T(10-
3K-
1 )
Toluene-nHexaneT = 5 ⁰C
0
1
2
3
4
5
6
7
8
0 0.2 0.4 0.6 0.8 1
S T(10-
3K-
1 )
Mole Fraction (Toluene)
Expt. Data [36] Drickamer-FiroozabadiHaase-Kempers This Work, Eq. 5This Work, Eq. 6 This Work, Eq. 8
Toluene-nHexaneT = 5 ⁰C
1
2
3
4
5
6
7
S T(10-
3K-
1 )
Toluene-nHexaneT = 45 ⁰C
0
1
2
3
4
5
6
7
0 0.2 0.4 0.6 0.8 1
S T(10-
3K-
1 )
Mole Fraction (Toluene)
Expt. Data [36] Drickamer-FiroozabadiHaase-Kempers This Work, Eq. 5This Work, Eq. 6 This Work, Eq. 8
Toluene-nHexaneT = 45 ⁰C
(a) (b)
FIG. 1. �Color online� Experimental data and model prediction of the variation in the Soret coefficient ST of toluene-n-hexane mixtureversus mole fraction of toluene at �a� 5 °C and �b� 45 °C.
4-3-2-10123456
S T(10-
3K-
1 )
Benzene-CyclohexaneT = 10 ⁰C
-4-3-2-10123456
0.1 0.3 0.5 0.7 0.9
S T(10-
3K-
1 )
Mole Fraction (Benzene)
Expt. Data [37] Drickamer-FiroozabadiHaase-Kempers This Work, Eq. 5This Work, Eq. 6 This Work, Eq. 8
Benzene-CyclohexaneT = 10 ⁰C
-2
-1
0
1
2
3
4
5
S T(10-
3K-
1 )
Benzene-CyclohexaneT = 40 ⁰C
-3
-2
-1
0
1
2
3
4
5
0.1 0.3 0.5 0.7 0.9
S T(10-
3K-
1 )
Mole Fraction (Benzene)
Expt. Data [37] Expt. Data [9]Drickamer-Firoozabadi Haase-KempersThis Work, Eq. 5 This Work, Eq. 6
Benzene-CyclohexaneT = 40 ⁰C
(b)(a)
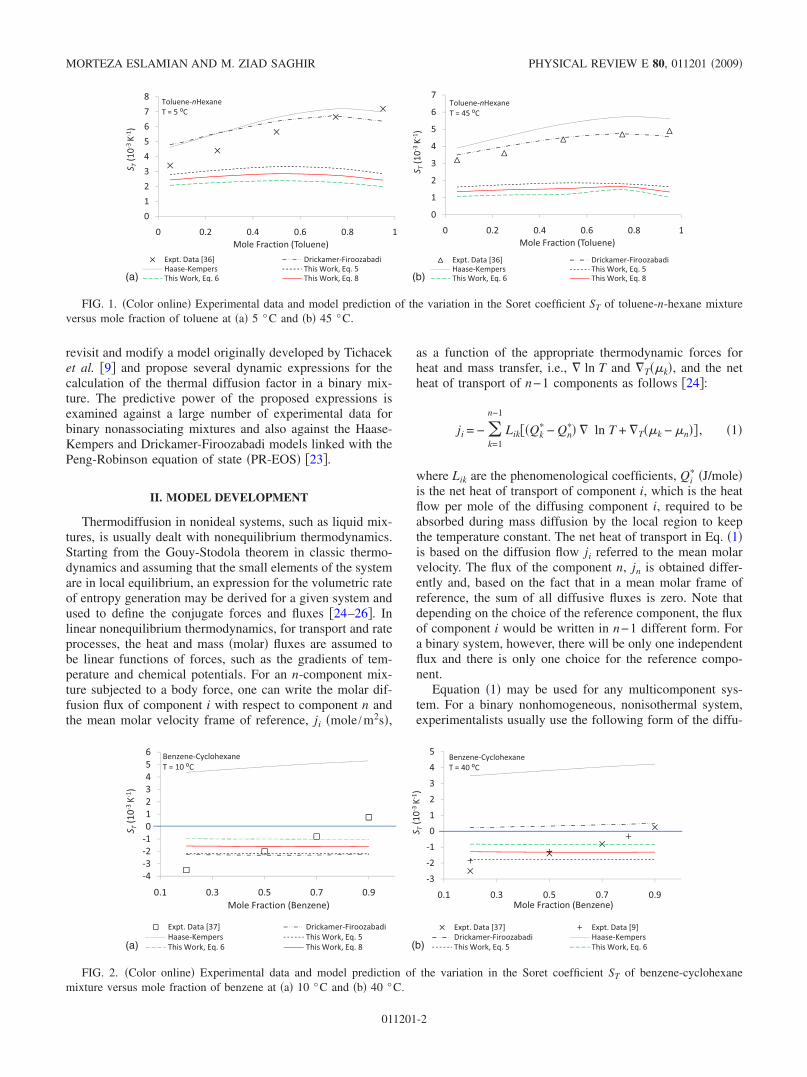
FIG. 2. �Color online� Experimental data and model prediction of the variation in the Soret coefficient ST of benzene-cyclohexanemixture versus mole fraction of benzene at �a� 10 °C and �b� 40 °C.
MORTEZA ESLAMIAN AND M. ZIAD SAGHIR PHYSICAL REVIEW E 80, 011201 �2009�
011201-2
sive molar flux equation incorporating the thermal diffusionparameters:
j1 = − cDM��x1 +�x1x2
T� T� = − c�DM � x1 + x1x2DT � T� ,
�2�
where c is the molar density �mole /m3�, x1 and x2 are themole fractions of components 1 and 2, DM is the Fickian ormolecular mass diffusion coefficient �m2 /s�, � is the thermaldiffusion factor �nondimensional�, DT is the thermal diffu-sion coefficient �m2 /s K�, and �T and �x are spatial tem-perature and concentration gradients. Note that following theGibbs-Duhem equation, the gradients of chemical potentialor concentration, temperature, and pressure are interrelated;therefore, in a nonisothermal and nonhomogenous systemthat is specified here, the pressure cannot be constant andthere will be mass diffusion due to pressure gradient as well.This indicates that in Eq. �2�, we have neglected the massdiffusion due to a pressure gradient. This may be justifiedbecause in typical applications, pressure diffusion comparedto other effects is negligible. The complete form of the massflux due to all forces is given by Firoozabadi and co-workersin Refs. �13,14�.
In a binary system, thermal diffusion factor and coeffi-cient are related to one another and to the Soret coefficient STthrough the following equation:
� = TST = TDT
DM. �3�
At the presence of a spatial temperature gradient �T, atsteady-state mass transfer condition, the molar flux j1 �andalso j2� vanishes. This condition combined with Eqs. �1� and�2� and the Gibbs-Duhem relation at constant pressure andtemperature ��xid�i=0� results in the following approximateequation for the thermal diffusion factor in a binary system:
� =Q1
� − Q2�
x1���1/�x1�. �4�
Based on the chosen convention for the sign of � and DT inEq. �2�, in a binary mixture if � �of component 1� obtainedfrom Eq. �4� is positive, component 1 is enriched on the coldside.
Modeling of the net heat of transport has been the sourceof a great deal of confusion and discrepancies. Still a clearsimulation for this quantity is lacking. The magnitude of thenet heat of transport in thermodiffusion is a function of sev-eral local and global parameters, such as the mixture tem-
4
6
8
10
12
14
16
18
S T(10-
3K-
1 )
Benzene-nHeptaneT = 20 ⁰C
2
4
6
8
10
12
14
16
18
0.2 0.4 0.6 0.8 1
S T(10-
3K-
1 )
Mole Fraction (Benzene)Expt. Data [38] Drickamer-FiroozabadiHaase-Kempers This Work, Eq. 5This Work, Eq. 6 This Work, Eq. 8
Benzene-nHeptaneT = 20 ⁰C
2
4
6
8
10
12
14
16
S T(10-
3K-
1 )
Benzene-nHeptaneT = 40 ⁰C
0
2
4
6
8
10
12
14
16
0.2 0.3 0.4 0.5 0.6 0.7 0.8 0.9 1
S T(10-
3K-
1 )
Mole Fraction (Benzene)
Expt. Data [38] Drickamer-FiroozabadiHaase-Kempers This Work, Eq. 5This Work, Eq. 6 This Work, Eq. 8
Benzene-nHeptaneT = 40 ⁰C
(a) (b)
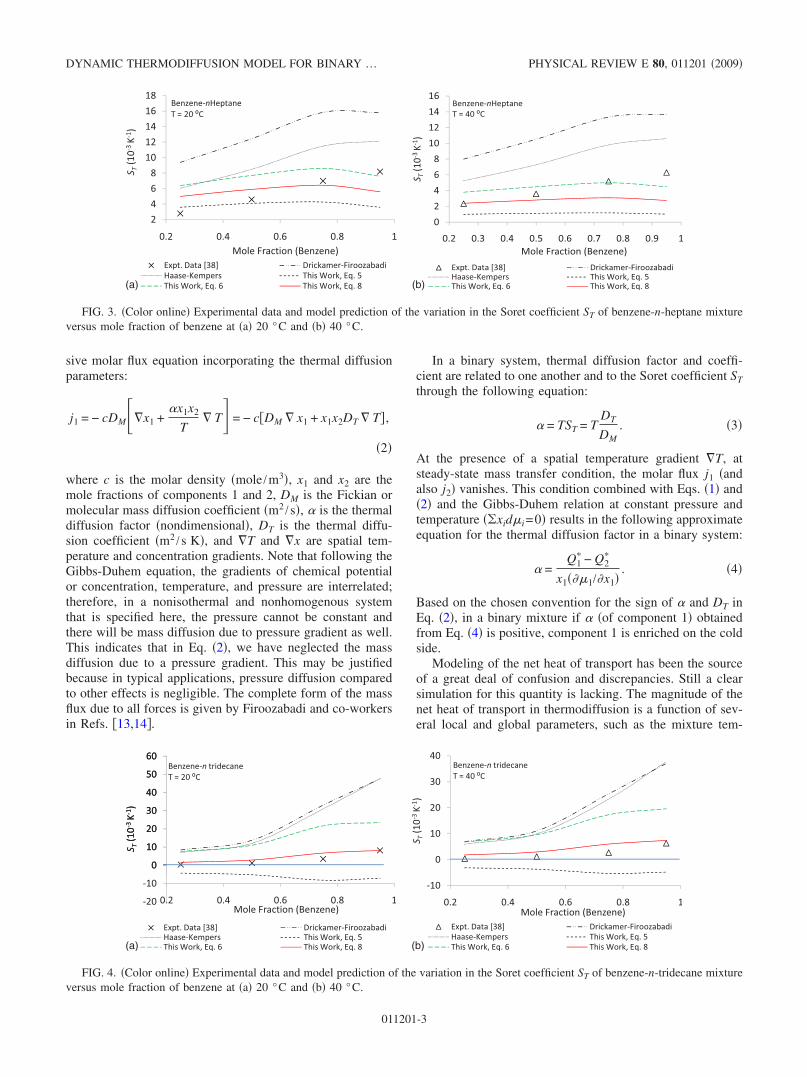
FIG. 3. �Color online� Experimental data and model prediction of the variation in the Soret coefficient ST of benzene-n-heptane mixtureversus mole fraction of benzene at �a� 20 °C and �b� 40 °C.
0
10
20
30
40
50
60
S T(10-
3K-
1 )
Benzene-n tridecaneT = 20 ⁰C
-20
-10
0
10
20
30
40
50
60
0.2 0.4 0.6 0.8 1
S T(10-
3K-
1 )
Mole Fraction (Benzene)
Expt. Data [38] Drickamer-FiroozabadiHaase-Kempers This Work, Eq. 5This Work, Eq. 6 This Work, Eq. 8
Benzene-n tridecaneT = 20 ⁰C
0
10
20
30
40
S T(10-
3K-
1 )
Benzene-n tridecaneT = 40 ⁰C
-10
0
10
20
30
40
0.2 0.4 0.6 0.8 1
S T(10-
3K-
1 )
Mole Fraction (Benzene)Expt. Data [38] Drickamer-FiroozabadiHaase-Kempers This Work, Eq. 5This Work, Eq. 6 This Work, Eq. 8
Benzene-n tridecaneT = 40 ⁰C
(a) (b)
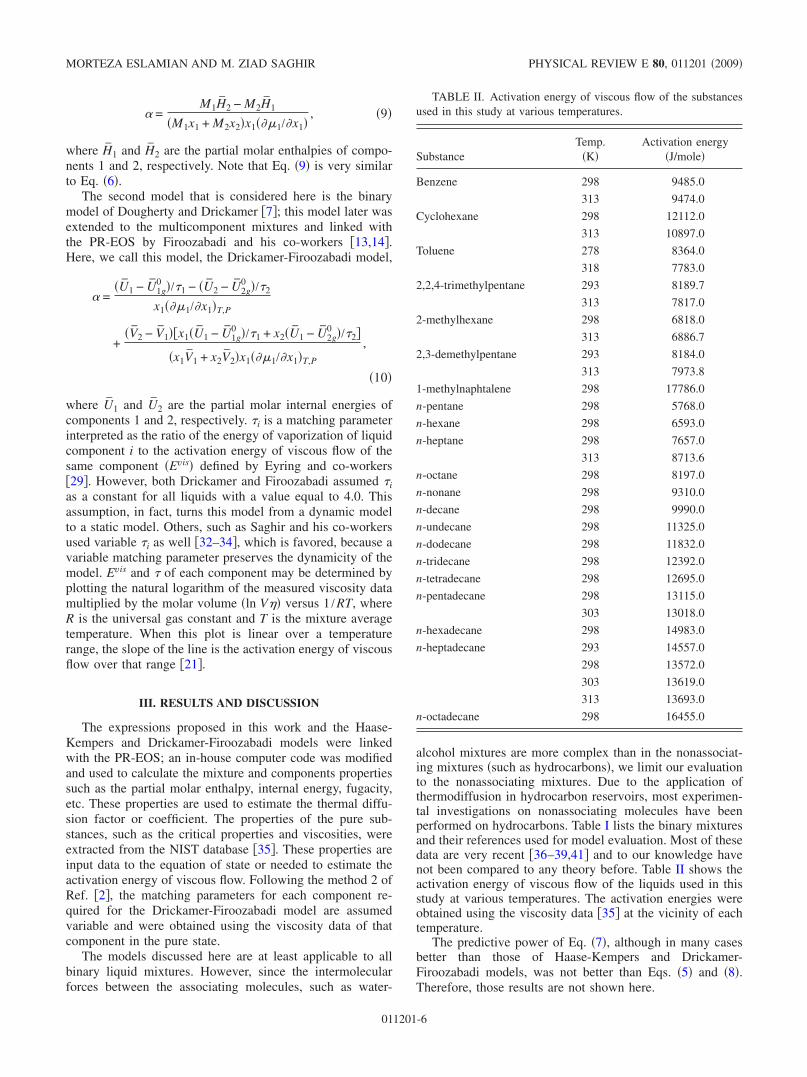
FIG. 4. �Color online� Experimental data and model prediction of the variation in the Soret coefficient ST of benzene-n-tridecane mixtureversus mole fraction of benzene at �a� 20 °C and �b� 40 °C.
DYNAMIC THERMODIFFUSION MODEL FOR BINARY … PHYSICAL REVIEW E 80, 011201 �2009�
011201-3

perature and pressure, the size, density and shape of the mol-ecules, and mobility or viscosity of the components. Staticmodels, such as those of Haase �10� and Kempers �11,12�,neglect the dependence of the heat of transport on the mo-bility of the components. Dynamic models of Dougherty andDrickamer �7,8� and Firoozabadi and co-workers �13,14�consider these effects but not adequately. Assigning a con-stant value to the matching parameter removes the dynamic-ity of the model.
Here, inspired from the work of Tichacek et al. �9�, wecorrelate the net heat of transport with the activation energyof viscous flow. First, we may assume that the net heat oftransport of each component equals the activation energy ofviscous flow of that component in pure form, at the givenmixture pressure and temperature �Evis�. Therefore, Eq. �4�may be written as follows:
� =E1
vis − E2vis
x1���1/�x1�. �5�
The molecular features that influence the thermodiffusion,such as the molecular size, shape, density, and moments ofinertia �27,28�—to some extent—directly affect the viscositydata and, as a result, the activation energy of viscous flow,which is obtained directly from the viscosity data �29�. Herewe are obtaining the activation energy of viscous flow of aliquid species in its pure state. In fact, to our knowledge,there is no theory that would define the activation energy ofa component in a mixture. Besides, correlating and simulat-ing the thermodiffusion phenomenon with viscous flow arean approximation, but it is a legitimate approach supportedby physical evidence. As pointed out by Tichacek et al. �9�and followed by Artola et al. �6�, a better agreement may beobtained if the net heat of transport is approximated by theactivation energy of self-diffusion, which is of course noteasy to determine.
Our calculations using the PR-EOS show that the denomi-nator of Eq. �5�, i.e., x1���1 /�x1�=x2���2 /�x2�, is rather in-sensitive to the species mole fractions x1 and x2. Also, sincewe obtain the activation energy of viscous flow of a compo-nent in the pure state, Eq. �5� predicts that varying the mix-
ture compositions should have a minimum effect on the ther-mal diffusion factor. This is not supported by some of theexperimental observations, as shown in the next section.Nevertheless, Eq. �5� should be able to provide an averagevalue for the thermal diffusion factor in a mixture, when therelative molar fractions of the two components change.
In order to introduce the effects of mole fractions andmolecular weights, a nonequilibrium thermodynamics ap-proach similar to that of Dougherty and Drickamer �8� maybe followed, where they modified Eq. �5� slightly to improveits accuracy by incorporating the effect of the species molefractions. Again, here assuming that net heat of transportequals the activation energy of viscous flow of the samecomponent in pure condition at the same pressure and tem-perature, the following equation is obtained:
� =M2E1
vis − M1E2vis
�M1x1 + M2x2�x1���1/�x1�, �6�
where M1 and M2 are the molecular weights of components1 and 2. Similarly, in a molar volume frame of reference �9�,Eq. �6� may be written as follows:
0
5
10
15
20
25
30
S T(10-
3K-
1 )
Benzene-2,2,4-trimethylpentaneT = 20 ⁰C
-5
0
5
10
15
20
25
30
0.1 0.3 0.5 0.7 0.9
S T(10-
3K-
1 )
Mole Fraction (Benzene)Expt. Data [38] Drickamer-FiroozabadiHaase-Kempers This Work, Eq. 5This Work, Eq. 6 This Work, Eq. 8
Benzene-2,2,4-trimethylpentaneT = 20 ⁰C
0
5
10
15
20
25
S T(10-
3K-
1 )
Benzene-2,2,4-trimethylpentaneT = 40 ⁰C
-5
0
5
10
15
20
25
0.1 0.3 0.5 0.7 0.9
S T(10-
3K-
1 )
Mole Fraction (Benzene)
Expt. Data [38] Drickamer-FiroozabadiHaase-Kempersi This Work, Eq. 5This Work, Eq. 6 This Work, Eq. 8
Benzene-2,2,4-trimethylpentaneT = 40 ⁰C
(b)(a)
FIG. 5. �Color online� Experimental data and model prediction of the variation in the Soret coefficient ST of benzene-2,2,4-trimethylpentane mixture versus the mole fraction of benzene at �a� 20 °C and �b� 40 °C.
-6-5-4-3-2-101234
S T(10-
3K-
1 )
nC5-nC10T= 27 ⁰C
-7-6-5-4-3-2-101234
0.1 0.3 0.5 0.7 0.9
S T(10-
3K-
1 )
Mole Fraction of C5Expt. Data [39] Drickamer-FiroozabadiHaase-Kempers This Work, Eq. 5This Work, Eq. 6 This Work, Eq. 8
nC5-nC10T= 27 ⁰C
FIG. 6. �Color online� Experimental data and model predictionof the variation in the Soret coefficient ST of nC5-nC10 mixtureversus the mole fraction of pentane.
MORTEZA ESLAMIAN AND M. ZIAD SAGHIR PHYSICAL REVIEW E 80, 011201 �2009�
011201-4

� =V2E1
vis − V1E2vis
�V1x1 + V2x2�x1���1/�x1�, �7�
where V1 and V2 are the partial molar volumes of compo-nents 1 and 2. Equation �7� is similar to that proposed byTichacek et al. �9�, where they modeled the net of transportas a fraction of the activation energy of viscous flow Eh
vis.They argued that the net heat of transport is that part of theactivation energy of viscous flow that is transported with themoving molecules. However, since Eh
vis cannot be calculatedsystematically, Tichacek’s model has not received much at-tention by others. Note that Eqs. �6� and �7� are similar toHaase and Kempers expressions, as well. The difference isthat in Haase and Kempers expressions, the molar enthalpyhas the same role as the activation energy of viscous flow inEqs. �6� and �7�. Since the molar enthalpy is a thermostaticproperty, Haase or Kempers model is a static model�21,22,30�, whereas our expressions are dynamic becausethey relate thermodiffusion to a dynamic property, i.e., vis-cosity.
Careful consideration of the other thermodiffusion modelsparticularly those of Artola et al. �6� and Debuschewitz andKöhler �31� revealed that these workers support this idea thatthe thermal diffusion factor in isotopic and other mixturesmay be comprised of two or more terms, each of whichresponsible for different contributions, such as chemical in-teractions, molecular size and shape, etc. Therefore, similarto Artola’s expression �6�, here we propose the followingequation for estimating the thermal diffusion factor, theweighted average of Eqs. �5� and �6�:
� = AM2E1
vis − M1E2vis
�M1x1 + M2x2�x1���1/�x1�+ B
E1vis − E2
vis
x1���1/�x1�. �8�
In Eq. �8�, we have divided the thermal diffusion factor intotwo parts: the first term on the right-hand side has the mo-
lecular and to some extent the mole fraction effects, whereasthe second term accounts for the difference in the activationenergy of viscous flow and therefore incorporates somechemical effects. At this time, we cannot theoretically deter-mine the values of A and B and, therefore, assume A=B= 1
2 ,which corresponds to using the arithmetic mean of Eqs. �5�and �6�. Evaluation of a broad range of hydrocarbon experi-mental data �next section� revealed that, in most cases, Eq.�8� with A=B= 1
2 exhibits the best predictive power.We have studied the predictive ability of the expressions
developed here along with two other models, i.e., Kempers�11,12� and Shukla-Firoozabadi �13�. Kempers expressionswere derived in a mass and volume frames of reference�11,12�. The expression written in a volume frame of refer-ence highly overestimates the thermal diffusion factor and,therefore, for brevity it is not considered in the figures.Kempers expression written in a mass frame of reference isin fact the speculative expression of Haase �10� mathemati-cally derived by Kempers �11,12�. Here we use a simplifiedversion of this expression and call it the Haase-Kempersmodel. Note that in contrast to the other models, such asthose of Drickamer �7–9�, Firoozabadi �13�, and Guy �15�,Haase’s expression for the overall thermal diffusion factor ofa real mixture incorporates a “kinetic term,” on account ofthe contribution of the ideal-gas state at the same tempera-ture as the nonideal mixture under consideration. Later,Kempers followed the same approach and added this term inhis expression in his second paper �12�. As pointed out byKempers, in most cases the kinetic contribution is negligible.Kempers, instead of the direct calculation of this term, usedit as a tuning parameter to calibrate his model for a bettermatch with the experimental data. Here, neglecting the ki-netic term and the properties of the initial states, the Haase-Kempers expression in a mass frame of reference is writtenas follows:
TABLE I. List of the experimental data used in this study.
Binary mixtureTemperature
�°C� Mole fraction of first component Reference
toluene-n-hexane 5, 45 0.05,0.25,0.5,0.75,0.95 �36�benzene-cyclohexane 10, 40 0.2,0.5,0.7,0.9 �37�, �9�benzene-n-heptane 20,40 0.25,0.5,0.75,0.95 �38�benzene-n-tridecane 20, 40 0.25,0.5,0.75,0.95 �38�benzene-2,2,4-trimethylpentane 20, 40 0.15,0.25,0.5,0.75,0.95 �38�nCi-nC12, i: 5, 18 25 Mass fraction of Ci=0.5 �2�nC5-nC10 27 0.2,0.5,0.8 �39�2-methylhexane-benzene 20,25,30,40 0.5 �38�2,3-demethylpentane-benzene 20,30,40 0.5 �38�nCi-benzene, i: 7–17 30 0.5 �38�nC17-benzene 20,30,40 0.017 �38�methane-n-butanea 121,46 0.4 �40�nC10-nCi, i: 5–18 25 Mass fraction of C10=0.25,0.75 �41�1-methylnaphtaline-nCi, i: 5–18 25 Mass fraction of 1-methylnaphtaline=0.25,0.75 �41�aThe pressure of methane-n-butane mixture ranges from 10 to 20 MPa, and for the rest of the mixtures is theatmospheric pressure.
DYNAMIC THERMODIFFUSION MODEL FOR BINARY … PHYSICAL REVIEW E 80, 011201 �2009�
011201-5
� =M1H2 − M2H1
�M1x1 + M2x2�x1���1/�x1�, �9�
where H1 and H2 are the partial molar enthalpies of compo-nents 1 and 2, respectively. Note that Eq. �9� is very similarto Eq. �6�.
The second model that is considered here is the binarymodel of Dougherty and Drickamer �7�; this model later wasextended to the multicomponent mixtures and linked withthe PR-EOS by Firoozabadi and his co-workers �13,14�.Here, we call this model, the Drickamer-Firoozabadi model,
� =�U1 − U1g
0 �/�1 − �U2 − U2g0 �/�2
x1���1/�x1�T,P
+�V2 − V1��x1�U1 − U1g
0 �/�1 + x2�U1 − U2g0 �/�2�
�x1V1 + x2V2�x1���1/�x1�T,P
,
�10�
where U1 and U2 are the partial molar internal energies ofcomponents 1 and 2, respectively. �i is a matching parameterinterpreted as the ratio of the energy of vaporization of liquidcomponent i to the activation energy of viscous flow of thesame component �Evis� defined by Eyring and co-workers�29�. However, both Drickamer and Firoozabadi assumed �ias a constant for all liquids with a value equal to 4.0. Thisassumption, in fact, turns this model from a dynamic modelto a static model. Others, such as Saghir and his co-workersused variable �i as well �32–34�, which is favored, because avariable matching parameter preserves the dynamicity of themodel. Evis and � of each component may be determined byplotting the natural logarithm of the measured viscosity datamultiplied by the molar volume �ln V�� versus 1 /RT, whereR is the universal gas constant and T is the mixture averagetemperature. When this plot is linear over a temperaturerange, the slope of the line is the activation energy of viscousflow over that range �21�.
III. RESULTS AND DISCUSSION
The expressions proposed in this work and the Haase-Kempers and Drickamer-Firoozabadi models were linkedwith the PR-EOS; an in-house computer code was modifiedand used to calculate the mixture and components propertiessuch as the partial molar enthalpy, internal energy, fugacity,etc. These properties are used to estimate the thermal diffu-sion factor or coefficient. The properties of the pure sub-stances, such as the critical properties and viscosities, wereextracted from the NIST database �35�. These properties areinput data to the equation of state or needed to estimate theactivation energy of viscous flow. Following the method 2 ofRef. �2�, the matching parameters for each component re-quired for the Drickamer-Firoozabadi model are assumedvariable and were obtained using the viscosity data of thatcomponent in the pure state.
The models discussed here are at least applicable to allbinary liquid mixtures. However, since the intermolecularforces between the associating molecules, such as water-
alcohol mixtures are more complex than in the nonassociat-ing mixtures �such as hydrocarbons�, we limit our evaluationto the nonassociating mixtures. Due to the application ofthermodiffusion in hydrocarbon reservoirs, most experimen-tal investigations on nonassociating molecules have beenperformed on hydrocarbons. Table I lists the binary mixturesand their references used for model evaluation. Most of thesedata are very recent �36–39,41� and to our knowledge havenot been compared to any theory before. Table II shows theactivation energy of viscous flow of the liquids used in thisstudy at various temperatures. The activation energies wereobtained using the viscosity data �35� at the vicinity of eachtemperature.
The predictive power of Eq. �7�, although in many casesbetter than those of Haase-Kempers and Drickamer-Firoozabadi models, was not better than Eqs. �5� and �8�.Therefore, those results are not shown here.
TABLE II. Activation energy of viscous flow of the substancesused in this study at various temperatures.
SubstanceTemp.
�K�Activation energy
�J/mole�
Benzene 298 9485.0
313 9474.0
Cyclohexane 298 12112.0
313 10897.0
Toluene 278 8364.0
318 7783.0
2,2,4-trimethylpentane 293 8189.7
313 7817.0
2-methylhexane 298 6818.0
313 6886.7
2,3-demethylpentane 293 8184.0
313 7973.8
1-methylnaphtalene 298 17786.0
n-pentane 298 5768.0
n-hexane 298 6593.0
n-heptane 298 7657.0
313 8713.6
n-octane 298 8197.0
n-nonane 298 9310.0
n-decane 298 9990.0
n-undecane 298 11325.0
n-dodecane 298 11832.0
n-tridecane 298 12392.0
n-tetradecane 298 12695.0
n-pentadecane 298 13115.0
303 13018.0
n-hexadecane 298 14983.0
n-heptadecane 293 14557.0
298 13572.0
303 13619.0
313 13693.0
n-octadecane 298 16455.0
MORTEZA ESLAMIAN AND M. ZIAD SAGHIR PHYSICAL REVIEW E 80, 011201 �2009�
011201-6

A. Effect of temperature and concentration
As the first mixture, Fig. 1 shows the model and experi-mental data of the variation in the Soret coefficient fortoluene-n-hexane mixture versus the mole fraction of tolu-ene. In all figures, a positive value for the Soret coefficientST, thermal diffusion coefficient DT, and thermal diffusionfactor � indicates that the first component �A� in the binarymixture A-B is concentrated on the cold side. For this mix-ture, the Drickamer-Firoozabadi model is superior at bothtemperatures. Haase-Kempers and Eq. �7� of this work �notshown� can also satisfactorily predict the experimental data.Our other proposed expressions, i.e., Eqs. �5�, �6�, and �8�underestimate the Soret coefficient for this particular mix-ture. Now, if we consider the isotopic benzene-cyclohexanemixture �similar molecular weights�, particularly at 40 °C,the Haase-Kempers and Drickamer-Firoozabadi models evencannot predict the sign of the Soret coefficient �see Fig. 2�.Our proposed expressions and, particularly Eq. �8�, can pre-dict the sign and the average value of the Soret coefficientfairly good. However, for this isotopic mixture, none of themodels can predict the significant change in the Soret coef-ficient with mole fractions. They rather predict an averagevalue for the Soret coefficient over a range of various mole
fractions. Haase-Kempers model, which is the most staticmodel tested here, is the least favored model in predictingthe experimental data. Figure 2 shows that at a very highconcentration of benzene, the direction of mass transferchanges. Two sets of experimental data are shown in Fig.2�b�, one dates back to 50 years ago �9�, and a recent one�38�; there is a very good agreement between these two setsof experimental data.
To further investigate the predictive power of the models,we have shown the experimental data and model predictionsfor benzene-n-heptane mixture at 20 °C and 40 °C �Fig. 3�.The Soret coefficient of benzene is positive and increaseswith the increase in benzene mole fraction. All models canpredict this behavior to some extent. However, our proposedexpressions also predict the magnitude of the Soret coeffi-cient rather well. Equation �8� is in particular the best. Simi-lar results are shown for benzene-n-tridecane mixture in Fig.4. Note that even though benzene has a smaller molecularweight, the Soret coefficient of benzene inbenzene-n-tridecane mixture is positive, which indicates thatbenzene migrates to the cold side. n-tridecane is forced tomove in the opposite direction and goes to the hot side.Therefore, we may state that benzene is the dominant ormore mobile component as it moves in the direction of heattransfer from hot to cold side, which may be considered asthe more natural direction of mass transfer, as well. Normalalkanes, such as n-heptane and n-tridecane, are linear hydro-carbons, whereas benzene is an aromatic hydrocarbon with acyclic nonlinear structure and a high density. Compared tothe normal alkanes with comparable molecular weights, suchas n-pentane and n-hexane, benzene is more viscous and,therefore, has larger activation energy of viscous flow. Inthermodiffusion of binary mixtures, our model �Eq. �5�� pre-dicts that the component that has the higher activation energyof viscous flow moves in the direction of heat flow, i.e.,moves to the cold side. This may be a reason for the unusualbehavior of benzene that despite its small molecular weightin benzene-n-heptane and even in benzene-n-tridecane mix-tures, it migrates to the cold side. Therefore, here to clarifythis general agreement in thermodiffusion literature “that theheavier component goes to the cold side,” we may empha-size that the denser species or the more viscous species morelikely migrate to the cold side. The Haase-Kempers and
-12
-10
-8
-6
-4
-2
0
S T(10-
3K-
1 )
2Methylhexane-BenzeneMole �raction o� 2 MH=0.5
-14
-12
-10
-8
-6
-4
-2
0
15 20 25 30 35 40 45
S T(10-
3K-
1 )
Temperat�re ⁰CExpt. Data [38] Drickamer-FiroozabadiHaase-Kempers This Work, Eq. 5This Work, Eq. 6 This Work, Eq. 8
2Methylhexane-BenzeneMole �raction o� 2 MH=0.5
-12
-10
-8
-6
-4
-2
0
S T(10-
3K-
1 )
2,3Demethylpentane-BenzeneMole �raction o� 2 3 DM� = 0 5
-14
-12
-10
-8
-6
-4
-2
0
15 20 25 30 35 40 45
S T(10-
3K-
1 )
Temperat�re ⁰CExpt. Data [38] Drickamer-FiroozabadiHaase-Kempers This Work, Eq. 5This Work, Eq. 6 This Work, Eq. 8
2,3Demethylpentane-BenzeneMole �raction o� 2,3 DM� = 0.5
(a) (b)
FIG. 7. �Color online� Experimental data and model prediction of the variation in the Soret coefficient ST of �a� 2-methylhexane-benzenemixture and �b� 2,3-demethylpentane-benzene mixture with temperature.
80
-60
-40
-20
0
20
S T(10-
3K-
1 )
C17-BenzeneMole fraction of C17 = 0.017
-100
-80
-60
-40
-20
0
20
15 20 25 30 35 40 45
S T(10-
3K-
1 )
Temperature ⁰CExpt. Data [38] Drickamer-FiroozabadiHaase-Kempers This Work, Eq. 5This Work, Eq. 6 This Work, Eq. 8
C17-BenzeneMole fraction of C17 = 0.017
FIG. 8. �Color online� Experimental data and model predictionof the variation in the Soret coefficient ST of heptadecane-benzenemixture versus temperature for given mole fractions.
DYNAMIC THERMODIFFUSION MODEL FOR BINARY … PHYSICAL REVIEW E 80, 011201 �2009�
011201-7
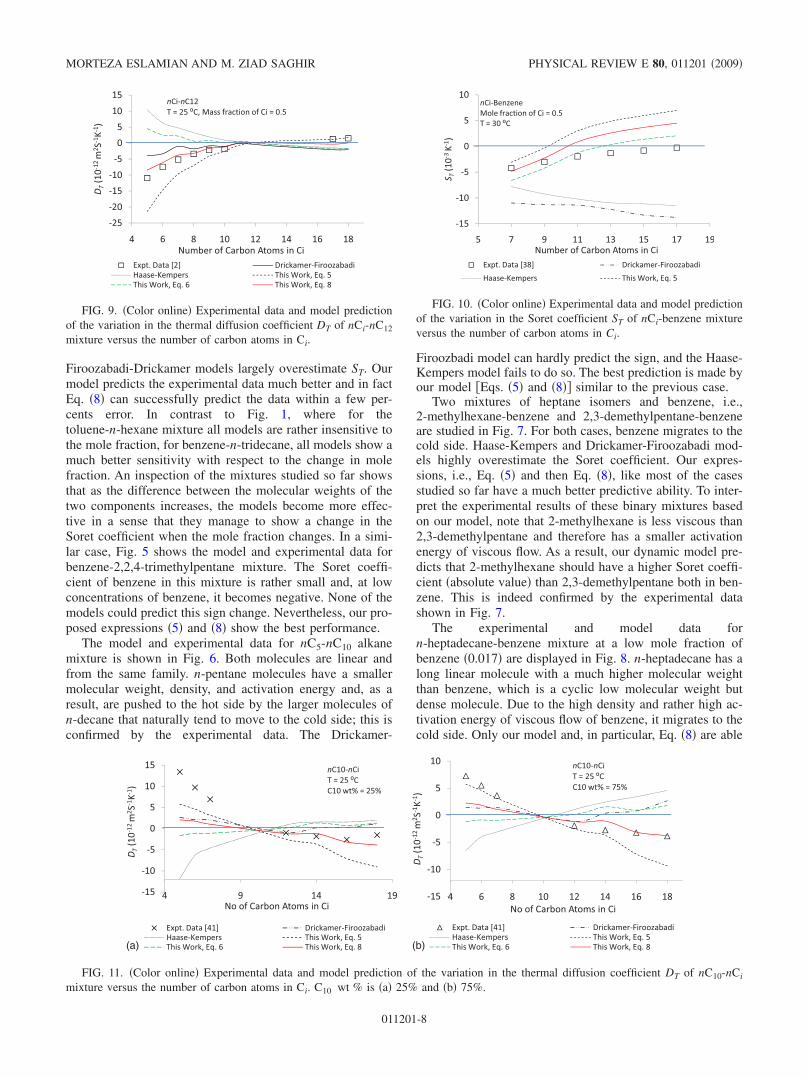
Firoozabadi-Drickamer models largely overestimate ST. Ourmodel predicts the experimental data much better and in factEq. �8� can successfully predict the data within a few per-cents error. In contrast to Fig. 1, where for thetoluene-n-hexane mixture all models are rather insensitive tothe mole fraction, for benzene-n-tridecane, all models show amuch better sensitivity with respect to the change in molefraction. An inspection of the mixtures studied so far showsthat as the difference between the molecular weights of thetwo components increases, the models become more effec-tive in a sense that they manage to show a change in theSoret coefficient when the mole fraction changes. In a simi-lar case, Fig. 5 shows the model and experimental data forbenzene-2,2,4-trimethylpentane mixture. The Soret coeffi-cient of benzene in this mixture is rather small and, at lowconcentrations of benzene, it becomes negative. None of themodels could predict this sign change. Nevertheless, our pro-posed expressions �5� and �8� show the best performance.
The model and experimental data for nC5-nC10 alkanemixture is shown in Fig. 6. Both molecules are linear andfrom the same family. n-pentane molecules have a smallermolecular weight, density, and activation energy and, as aresult, are pushed to the hot side by the larger molecules ofn-decane that naturally tend to move to the cold side; this isconfirmed by the experimental data. The Drickamer-
Firoozbadi model can hardly predict the sign, and the Haase-Kempers model fails to do so. The best prediction is made byour model �Eqs. �5� and �8�� similar to the previous case.
Two mixtures of heptane isomers and benzene, i.e.,2-methylhexane-benzene and 2,3-demethylpentane-benzeneare studied in Fig. 7. For both cases, benzene migrates to thecold side. Haase-Kempers and Drickamer-Firoozabadi mod-els highly overestimate the Soret coefficient. Our expres-sions, i.e., Eq. �5� and then Eq. �8�, like most of the casesstudied so far have a much better predictive ability. To inter-pret the experimental results of these binary mixtures basedon our model, note that 2-methylhexane is less viscous than2,3-demethylpentane and therefore has a smaller activationenergy of viscous flow. As a result, our dynamic model pre-dicts that 2-methylhexane should have a higher Soret coeffi-cient �absolute value� than 2,3-demethylpentane both in ben-zene. This is indeed confirmed by the experimental datashown in Fig. 7.
The experimental and model data forn-heptadecane-benzene mixture at a low mole fraction ofbenzene �0.017� are displayed in Fig. 8. n-heptadecane has along linear molecule with a much higher molecular weightthan benzene, which is a cyclic low molecular weight butdense molecule. Due to the high density and rather high ac-tivation energy of viscous flow of benzene, it migrates to thecold side. Only our model and, in particular, Eq. �8� are able
-20
-15
-10
-5
0
5
10
15DT(10-
12m
2 S-1K-
1 )nCi-nC12T = 25 ⁰C, Mass fraction of Ci = 0.5
-25
-20
-15
-10
-5
0
5
10
15
4 6 8 10 12 14 16 18
DT(10-
12m
2 S-1K-
1 )
Number of Carbon Atoms in CiExpt. Data [2] Drickamer-FiroozabadiHaase-Kempers This Work, Eq. 5This Work, Eq. 6 This Work, Eq. 8
nCi-nC12T = 25 ⁰C, Mass fraction of Ci = 0.5
FIG. 9. �Color online� Experimental data and model predictionof the variation in the thermal diffusion coefficient DT of nCi-nC12
mixture versus the number of carbon atoms in Ci.
-10
-5
0
5
10
S T(10-
3K-
1 )
nCi-BenzeneMole fraction of Ci = 0.5T = 30 ⁰C
-15
-10
-5
0
5
10
5 7 9 11 13 15 17 19
S T(10-
3K-
1 )
Number of Carbon Atoms in CiExpt. Data [38] Drickamer-Firoozabadi
Haase-Kempers This Work, Eq. 5
nCi-BenzeneMole fraction of Ci = 0.5T = 30 ⁰C
FIG. 10. �Color online� Experimental data and model predictionof the variation in the Soret coefficient ST of nCi-benzene mixtureversus the number of carbon atoms in Ci.
-10
-5
0
5
10
15
DT(10-
12m
2 S-1K-
1 )
nC10-nCiT = 25 ⁰CC10 wt% = 25%
-15
-10
-5
0
5
10
15
4 9 14 19
DT(10-
12m
2 S-1K-
1 )
No o Carbon Atoms in Ci
Expt. Data [41] Drickamer-FiroozabadiHaase-Kempers This Work, Eq. 5This Work, Eq. 6 This Work, Eq. 8
nC10-nCiT = 25 ⁰CC10 wt% = 25%
-10
-5
0
5
10
DT(10-
1 2m
2 S-1K-
1 )
nC10-nCiT = 25 ⁰CC10 wt% = 75%
-15
-10
-5
0
5
10
4 6 8 10 12 14 16 18
DT(10-
1 2m
2 S-1K-
1 )
No o Carbon Atoms in Ci
Expt. Data [41] Drickamer-FiroozabadiHaase-Kempers This Work, Eq. 5This Work, Eq. 6 This Work, Eq. 8
nC10-nCiT = 25 ⁰CC10 wt% = 75%
(a) (b)
FIG. 11. �Color online� Experimental data and model prediction of the variation in the thermal diffusion coefficient DT of nC10-nCi
mixture versus the number of carbon atoms in Ci. C10 wt % is �a� 25% and �b� 75%.
MORTEZA ESLAMIAN AND M. ZIAD SAGHIR PHYSICAL REVIEW E 80, 011201 �2009�
011201-8

to predict the experimental data satisfactorily.
B. Effect of number of carbon atoms
In the foregoing experimental data, the variation in theSoret coefficient versus either temperature or mole fractionwas studied. In the experimental data discussed in this sec-tion, the temperature and pressure, and either the mole ormass fraction of one of the species is constant, and the num-ber of the carbon atoms of the second species in the mixturechange. These cases can provide a measure of the overallcapability of each model in predicting the experimental data.In Fig. 9, model and experimental data for thermal diffusioncoefficient of binary nCi-nC12 mixtures are considered,where i varies from 5 �n-pentane� to 18 �n-octadecane�, andmass fraction of Ci in all mixtures equals to 0.5. To convertthe model thermal diffusion factors to thermal diffusion co-efficients, the molecular diffusion coefficients were esti-mated using the Hayduk and Minhas correlation �42�. Asexpected and confirmed by the experimental observations, inthose nCi-nC12 mixtures whose first component, i.e., Ci islighter �has less density� than C12, Ci is concentrated on thehot side; otherwise, it is enriched on the cold side. This isbecause all species in nCi-nC12 are from the same familywith similar molecular structures and, therefore, we can pre-dict the sign of the Soret coefficient based on the molecularweight only, i.e., we can safely state that the larger moleculeis concentrated on the cold side. Haase-Kempers model can-not even predict the sign of the thermal diffusion coefficient.Drickamer-Firoozabadi model is fairly good for nC5-nC12 tonC11-nC12 mixtures but fails to predict the mass transfer di-rection for nC17-nC12 and nC18-nC12 mixtures. As before, thebest prediction is made by our two expressions �5� and �8�.Equation �5� is more accurate for nC17-nC12 and nC18-nC12mixtures, whereas Eq. �8� is better for nC5-nC12 tonC11-nC12 mixtures.
In a similar case, for nCi-benzene mixtures �Fig. 10�, ourexpressions satisfactorily predict the trend of the variation inthe Soret coefficient. The Haase-Kempers and Drickamer-Firoozabadi models predict an opposite trend for the Soretcoefficient. Figures 11 and 12 show the variations in thethermal diffusion coefficient DT of nC10-nCi and
1-methylnaphtaline-nCi mixtures, respectively. Only our ex-pressions can satisfactorily predict the sign change; calcula-tions made using Eq. �8� fairly match with the experimentaldata.
C. Effect of pressure
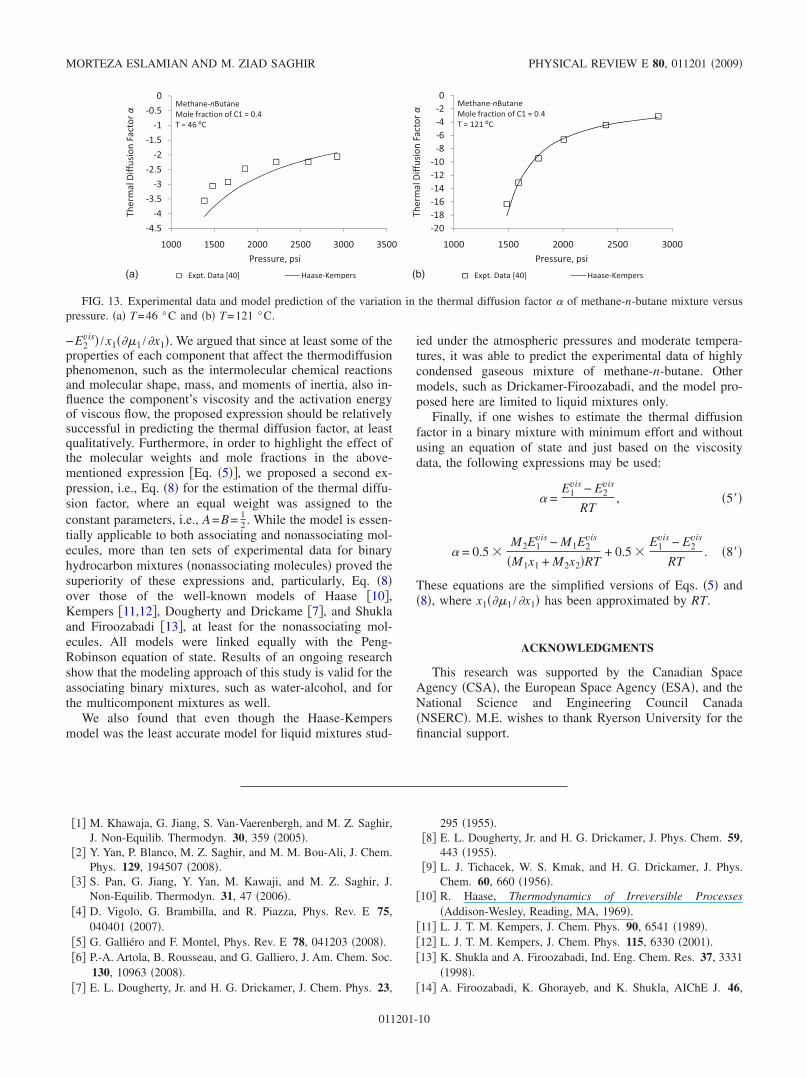
Analysis of the above-mentioned data showed that, inmost cases, Eq. �8� is the superior expression for the estima-tion of the thermal diffusion factor for a large family ofhydrocarbon binary mixtures. However, a prerequisite for us-ing Eq. �8� is that at given mixture pressure and temperature,the pure components have to be in the liquid phase, so thattheir activation energies of viscous flow can be estimated.The same restriction applies to the Drickamer-Firoozabadimodel, as well. On the other hand, the Haase-Kempersmodel is applicable to nonliquid mixtures as well. Havingsaid that the Haase-Kempers model is the least-favoredmodel in estimating the thermal diffusion factor of the hy-drocarbon mixtures studied above, note that for themethane-n-butane mixture at high pressures, this modelworks very well �see Fig. 13�. As argued before, the Haase-Kempers expression has been derived for the asymptoticcondition, where the mixture is assumed to be at the thermo-static or equilibrium condition. Therefore, one may arguethat for a mixture at very high pressures, mixture compo-nents are compressed and close to the ideal limit of beingstatic and that is why the Haase-Kempers model can predictthe experimental data in this condition rather well.
IV. CONCLUSIONS
In this study, inspired from the work of Tichacek et al. �9�and following the nonequilibrium thermodynamic principles,we introduced a dynamic model to simulate thermodiffusionprocess and proposed expressions for the estimation of ther-mal diffusion factor in binary liquid mixtures. In this model,the net heat of transport of each component defined in non-equilibrium thermodynamics was correlated with the activa-tion energy of viscous flow to be obtained readily from theviscosity data. As the first approximation, the thermal diffu-sion factor was expressed by this expression �= �E1
vis
10
20
30
40
50
60
70
DT(10-
12m
2 S-1K-
1 )
1-Methylnaphtaline-nCiT = 25 ⁰C1-Methylnaphtalenewt% = 0.25
0
10
20
30
40
50
60
70
4 6 8 10 12 14 16 18 20
DT(10-
12m
2 S-1K-
1 )
No o Carbon atoms in Ci
Expt. Data [41] Drickamer-FiroozabadiHaase-Kempers This Work, Eq. 5This Work, Eq. 6 This Work, Eq. 8
1-Methylnaphtaline-nCiT = 25 ⁰C1-Methylnaphtalenewt% = 0.25
5
10
15
20
25
30
DT(10-
12m
2 S-1K-
1 )
1-Methylnaphtaline-nCiT = 25 ⁰C1-Methylnaphtalene wt% = 0.75
0
5
10
15
20
25
30
4 6 8 10 12 14 16 18 20
DT(10-
12m
2 S-1K-
1 )
No o Carbon atoms in Ci
Expt. Data [41] Drickamer-FiroozabadiHaase-Kempers This Work, Eq. 5This Work, Eq. 6 This Work, Eq. 8
1-Methylnaphtaline-nCiT = 25 ⁰C1-Methylnaphtalene wt% = 0.75
(a) (b)
FIG. 12. �Color online� Experimental data and model prediction of the variation in the thermal diffusion coefficient DT of1-methylnaphtaline-nCi mixture versus the number of carbon atoms in Ci. 1-methylnaphtalene wt % is �a� 0.25% and �b� 0.75%.
DYNAMIC THERMODIFFUSION MODEL FOR BINARY … PHYSICAL REVIEW E 80, 011201 �2009�
011201-9
−E2vis� /x1���1 /�x1�. We argued that since at least some of the
properties of each component that affect the thermodiffusionphenomenon, such as the intermolecular chemical reactionsand molecular shape, mass, and moments of inertia, also in-fluence the component’s viscosity and the activation energyof viscous flow, the proposed expression should be relativelysuccessful in predicting the thermal diffusion factor, at leastqualitatively. Furthermore, in order to highlight the effect ofthe molecular weights and mole fractions in the above-mentioned expression �Eq. �5��, we proposed a second ex-pression, i.e., Eq. �8� for the estimation of the thermal diffu-sion factor, where an equal weight was assigned to theconstant parameters, i.e., A=B= 1
2 . While the model is essen-tially applicable to both associating and nonassociating mol-ecules, more than ten sets of experimental data for binaryhydrocarbon mixtures �nonassociating molecules� proved thesuperiority of these expressions and, particularly, Eq. �8�over those of the well-known models of Haase �10�,Kempers �11,12�, Dougherty and Drickame �7�, and Shuklaand Firoozabadi �13�, at least for the nonassociating mol-ecules. All models were linked equally with the Peng-Robinson equation of state. Results of an ongoing researchshow that the modeling approach of this study is valid for theassociating binary mixtures, such as water-alcohol, and forthe multicomponent mixtures as well.
We also found that even though the Haase-Kempersmodel was the least accurate model for liquid mixtures stud-
ied under the atmospheric pressures and moderate tempera-tures, it was able to predict the experimental data of highlycondensed gaseous mixture of methane-n-butane. Othermodels, such as Drickamer-Firoozabadi, and the model pro-posed here are limited to liquid mixtures only.
Finally, if one wishes to estimate the thermal diffusionfactor in a binary mixture with minimum effort and withoutusing an equation of state and just based on the viscositydata, the following expressions may be used:
� =E1
vis − E2vis
RT, �5��
� = 0.5 �M2E1
vis − M1E2vis
�M1x1 + M2x2�RT+ 0.5 �
E1vis − E2
vis
RT. �8��
These equations are the simplified versions of Eqs. �5� and�8�, where x1���1 /�x1� has been approximated by RT.
ACKNOWLEDGMENTS
This research was supported by the Canadian SpaceAgency �CSA�, the European Space Agency �ESA�, and theNational Science and Engineering Council Canada�NSERC�. M.E. wishes to thank Ryerson University for thefinancial support.
�1� M. Khawaja, G. Jiang, S. Van-Vaerenbergh, and M. Z. Saghir,J. Non-Equilib. Thermodyn. 30, 359 �2005�.
�2� Y. Yan, P. Blanco, M. Z. Saghir, and M. M. Bou-Ali, J. Chem.Phys. 129, 194507 �2008�.
�3� S. Pan, G. Jiang, Y. Yan, M. Kawaji, and M. Z. Saghir, J.Non-Equilib. Thermodyn. 31, 47 �2006�.
�4� D. Vigolo, G. Brambilla, and R. Piazza, Phys. Rev. E 75,040401 �2007�.
�5� G. Galliéro and F. Montel, Phys. Rev. E 78, 041203 �2008�.�6� P.-A. Artola, B. Rousseau, and G. Galliero, J. Am. Chem. Soc.
130, 10963 �2008�.�7� E. L. Dougherty, Jr. and H. G. Drickamer, J. Chem. Phys. 23,
295 �1955�.�8� E. L. Dougherty, Jr. and H. G. Drickamer, J. Phys. Chem. 59,
443 �1955�.�9� L. J. Tichacek, W. S. Kmak, and H. G. Drickamer, J. Phys.
Chem. 60, 660 �1956�.�10� R. Haase, Thermodynamics of Irreversible Processes
�Addison-Wesley, Reading, MA, 1969�.�11� L. J. T. M. Kempers, J. Chem. Phys. 90, 6541 �1989�.�12� L. J. T. M. Kempers, J. Chem. Phys. 115, 6330 �2001�.�13� K. Shukla and A. Firoozabadi, Ind. Eng. Chem. Res. 37, 3331
�1998�.�14� A. Firoozabadi, K. Ghorayeb, and K. Shukla, AIChE J. 46,
-3.5
-3
-2.5
-2
-1.5
-1
-0.5
0
herm
alDi�sionFactor
α
Methane-nB�taneMole raction o C1 = 0.4T = 46 ⁰C
-4.5
-4
-3.5
-3
-2.5
-2
-1.5
-1
-0.5
0
1000 1500 2000 2500 3000 3500
ThermalDi�sionFactor
α
ress�re, psi
Expt. Data [40] Haase-Kempers
Methane-nB�taneMole raction o C1 = 0.4T = 46 ⁰C
-16-14-12-10-8-6-4-20
herm
alDi�sionFactor
α
Methane-nB�taneMole raction o C1 = 0.4T = 121 ⁰C
-20-18-16-14-12-10-8-6-4-20
1000 1500 2000 2500 3000
ThermalDi�sionFactor
α
ress�re, psi
Expt. Data [40] Haase-Kempers
Methane-nB�taneMole raction o C1 = 0.4T = 121 ⁰C
(b)(a)
FIG. 13. Experimental data and model prediction of the variation in the thermal diffusion factor � of methane-n-butane mixture versuspressure. �a� T=46 °C and �b� T=121 °C.
MORTEZA ESLAMIAN AND M. ZIAD SAGHIR PHYSICAL REVIEW E 80, 011201 �2009�
011201-10
892 �2000�.�15� A. G. Guy, Int. J. Thermophys. 7, 563 �1986�.�16� J. Kreft and Y.-L. Chen, Phys. Rev. E 76, 021912 �2007�.�17� S. N. Semenov and M. E. Schimpf, Phys. Rev. E 72, 041202
�2005�.�18� H. Brenner, Phys. Rev. E 74, 036306 �2006�.�19� K. I. Morozov, Phys. Rev. E 79, 031204 �2009�.�20� A. A. Shapiro, Physica A 332, 151 �2004�.�21� M. Eslamian and Z. Saghir, J. Non-Equilib. Thermodyn. 34,
97 �2009�.�22� B. Faissat, K. Knudsen, E. H. Stenby, and F. Montel, Fluid
Phase Equilib. 100, 209 �1994�.�23� D. Y. Peng and D. B. Robinson, Ind. Eng. Chem. Fundam. 15,
59 �1976�.�24� Y. Demirel and S. I. Sandler, Int. J. Heat Mass Transfer 44,
2439 �2001�.�25� S. Kjelstrup and D. Bedeaux, Non-Equilibrium Thermodynam-
ics of Heterogeneous Systems �World Scientific, Singapore,2008�.
�26� S. R. de Groot and P. Mazur, Non-Equilibrium Thermodynam-ics �Dover, New York, 1984�.
�27� S. Wiegand, H. Ning, and R. Kita, J. Non-Equilib. Thermodyn.32, 193 �2007�.
�28� G. Galliero, B. Duguay, J.-P. Caltagirone, and F. Montel, FluidPhase Equilib. 208, 171 �2003�.
�29� S. Glasstone, K. J. Laidler, and H. Eyring, The Theory of RateProcesses: The Kinetics of Chemical Reactions, Viscosity, Dif-fusion and Electrochemical Phenomena �McGraw-Hill, New
York, 1941�.�30� J. Farago, B. Rousseau, and P.-A. Artola, J. Chem. Phys. 125,
164508 �2006�.�31� C. Debuschewitz and W. Köhler, Phys. Rev. Lett. 87, 055901
�2001�.�32� S. Pan, M. Z. Saghir, M. Kawaji, G. Jiang, and Y. Yan, J.
Chem. Phys. 126, 014502 �2007�.�33� S. Pan, Y. Yan, T. J. Jaber, M. Kawaji, and M. Z. Saghir, J.
Non-Equilib. Thermodyn. 32, 241 �2007�.�34� M. Z. Saghir, G. Jiang, S. O. Derawi, E. H. Stenby, and M.
Kawaji, Eur. Phys. J. E 15, 241 �2004�.�35� Thermodynamic properties of hydrocarbon mixtures database,
National Institute of Standards and Technology �NIST�, ver-sion 3.2.
�36� K. J. Zhang, M. E. Briggs, R. W. Gammon, and J. V. Sengers,J. Chem. Phys. 104, 6881 �1996�.
�37� G. Wittko and W. Kohler, EPL 78, 46007 �2007�.�38� P. Polyakov, J. Luettmer-Strathmann, and S. Wiegand, J. Phys.
Chem. B 110, 26215 �2006�.�39� A. Perronace, C. Leppla, F. Leroy, B. Rousseau, and S. Wie-
gand, J. Chem. Phys. 116, 3718 �2002�.�40� W. M. Rutherford and J. G. Roof, J. Phys. Chem. 63, 1506
�1959�.�41� A. Leahy-Dios, L. Zhuo, and A. Firoozabadi, J. Phys. Chem. B
112, 6442 �2008�.�42� W. Hayduk and B. S. Minhas, Can. J. Chem. Eng. 60, 295
�1982�.
DYNAMIC THERMODIFFUSION MODEL FOR BINARY … PHYSICAL REVIEW E 80, 011201 �2009�
011201-11