Ternary liquid-liquid equilibria for mixtures of 1-methyl-3-octylimidazolium chloride+ an alkanol+...
11
Fluid Phase Equilibria 247 (2006) 158–168 Ternary liquid–liquid equilibria for mixtures of toluene + n-heptane + an ionic liquid G. Wytze Meindersma ∗ , Anita J.G. Podt, Andr´ e B. de Haan 1 Separation Technology, University of Twente, Faculty of Science and Technology, P.O. Box 217, 7500 AE Enschede, The Netherlands Received 16 January 2006; received in revised form 5 July 2006; accepted 6 July 2006 Available online 10 July 2006 Abstract This research has been focused on a study of sulfolane and four ionic liquids as solvents in liquid–liquid extraction. Liquid–liquid equilibria data were obtained for mixtures of (sulfolane or 4-methyl-N-butylpyridinium tetrafluoroborate ([mebupy]BF 4 ) or 1-ethyl-3-methylimidazolium ethylsulfate ([emim]C 2 H 5 SO 4 ) or 1,3-dimethylimidazolium methylsulfate ([mmim]CH 3 SO 4 ) or 1-butyl-3-methylimidazolium methylsulfate ([bmim]CH 3 SO 4 )) + toluene + n-heptane at T = 313.2 and 348.2 K and p = 0.1 MPa. The experimental data for the binary and ternary systems were well correlated with the NRTL model. The toluene/heptane selectivity values were higher with all four ionic liquids tested than with sulfolane, which is one of the most common solvents for extraction of aromatic hydrocarbons from mixtures of aromatic and aliphatic hydrocarbons used in industry. The ionic liquid [mebupy]BF 4 showed an optimal combination of a high toluene distribution coefficient and a high toluene/n-heptane selectivity. These values were for the range of toluene concentrations below 55 mol% at 313.2 K and below 45 mol% at 348.2 K higher than those with sulfolane. The ionic liquid [mebupy]BF 4 is, therefore, a suitable solvent to replace sulfolane for an industrial extraction process for the separation of aromatic and aliphatic hydrocarbons. © 2006 Elsevier B.V. All rights reserved. Keywords: Ionic liquids; Liquid–liquid equilibria; NRTL model; Aromatic/aliphatic separation; Sulfolane 1. Introduction The separation of aromatic hydrocarbons (benzene, toluene, ethylbenzene and xylenes) from C 4 –C 10 aliphatic hydrocarbon mixtures is challenging since these hydrocarbons have boil- ing points in a close range and several combinations form azeotropes. The conventional processes for the separation of these aromatic and aliphatic hydrocarbon mixtures are liquid extraction, suitable for the range of 20–65 wt.% aromatic con- tent, extractive distillation for the range of 65–90 wt.% aromatics and azeotropic distillation for high aromatic content, >90 wt.% [1]. This implicates that there are no suitable separation pro- cesses available for process streams with an aromatic content below 20 wt.%. Typical solvents used are polar components such as sulfolane [2–9], N-methyl pyrrolidone (NMP) [8], N-formyl ∗ Corresponding author. Tel.: +31 53 4892607; fax: +31 53 4894821. E-mail address: [email protected] (G.W. Meindersma). 1 Present address: Process Systems Engineering Group, Eindhoven University of Technology, Department of Chemical Engineering and Chemistry, P.O. Box 513, 5600 MB Eindhoven, The Netherlands. morpholine (NFM), ethylene glycols [9–11] or propylene car- bonate [9]. Those solvents require additional distillation steps to separate the extraction solvent from both the extract and raffinate phases, and to purify the solvent, with, consequently, additional investments and energy consumption. Overviews of the use of extraction and extractive distillation for the separation of aro- matic hydrocarbons from aliphatic hydrocarbons can be found elsewhere [12–15]. Replacement of volatile solvents in the separation of aro- matic and aliphatic hydrocarbons by non-volatile ionic liquids can offer several advantages: less complex processes and a more simple regeneration of the solvent. In order to apply these ionic liquids in the chemical process industry, thermodynamic data need to be available for designing a proper separation process. We have investigated several combinations of ionic liquids and binary mixtures of toluene and n-heptane in order to determine thermodynamic data for the design of an extraction process suit- able for separating aromatic and aliphatic hydrocarbons. Liquid–liquid equilibrium (LLE) data are essential for the design of extraction equipment and/or for the calculation of the thermodynamic limit of a given separation. In the existing 0378-3812/$ – see front matter © 2006 Elsevier B.V. All rights reserved. doi:10.1016/j.fluid.2006.07.002
-
Upload
independent -
Category
Documents
-
view
2 -
download
0
Transcript of Ternary liquid-liquid equilibria for mixtures of 1-methyl-3-octylimidazolium chloride+ an alkanol+...

A
de(
hftas©
K
1
emiateta[cba
oP
0d
Fluid Phase Equilibria 247 (2006) 158–168
Ternary liquid–liquid equilibria for mixtures oftoluene + n-heptane + an ionic liquid
G. Wytze Meindersma ∗, Anita J.G. Podt, Andre B. de Haan 1
Separation Technology, University of Twente, Faculty of Science and Technology, P.O. Box 217, 7500 AE Enschede, The Netherlands
Received 16 January 2006; received in revised form 5 July 2006; accepted 6 July 2006Available online 10 July 2006
bstract
This research has been focused on a study of sulfolane and four ionic liquids as solvents in liquid–liquid extraction. Liquid–liquid equilibriaata were obtained for mixtures of (sulfolane or 4-methyl-N-butylpyridinium tetrafluoroborate ([mebupy]BF4) or 1-ethyl-3-methylimidazoliumthylsulfate ([emim]C2H5SO4) or 1,3-dimethylimidazolium methylsulfate ([mmim]CH3SO4) or 1-butyl-3-methylimidazolium methylsulfate[bmim]CH3SO4)) + toluene + n-heptane at T = 313.2 and 348.2 K and p = 0.1 MPa.
The experimental data for the binary and ternary systems were well correlated with the NRTL model. The toluene/heptane selectivity values wereigher with all four ionic liquids tested than with sulfolane, which is one of the most common solvents for extraction of aromatic hydrocarbonsrom mixtures of aromatic and aliphatic hydrocarbons used in industry. The ionic liquid [mebupy]BF4 showed an optimal combination of a high
oluene distribution coefficient and a high toluene/n-heptane selectivity. These values were for the range of toluene concentrations below 55 mol%t 313.2 K and below 45 mol% at 348.2 K higher than those with sulfolane. The ionic liquid [mebupy]BF4 is, therefore, a suitable solvent to replaceulfolane for an industrial extraction process for the separation of aromatic and aliphatic hydrocarbons.2006 Elsevier B.V. All rights reserved.
hatic
mbspieme
mcs
eywords: Ionic liquids; Liquid–liquid equilibria; NRTL model; Aromatic/alip
. Introduction
The separation of aromatic hydrocarbons (benzene, toluene,thylbenzene and xylenes) from C4–C10 aliphatic hydrocarbonixtures is challenging since these hydrocarbons have boil-
ng points in a close range and several combinations formzeotropes. The conventional processes for the separation ofhese aromatic and aliphatic hydrocarbon mixtures are liquidxtraction, suitable for the range of 20–65 wt.% aromatic con-ent, extractive distillation for the range of 65–90 wt.% aromaticsnd azeotropic distillation for high aromatic content, >90 wt.%1]. This implicates that there are no suitable separation pro-
esses available for process streams with an aromatic contentelow 20 wt.%. Typical solvents used are polar components suchs sulfolane [2–9], N-methyl pyrrolidone (NMP) [8], N-formyl∗ Corresponding author. Tel.: +31 53 4892607; fax: +31 53 4894821.E-mail address: [email protected] (G.W. Meindersma).
1 Present address: Process Systems Engineering Group, Eindhoven Universityf Technology, Department of Chemical Engineering and Chemistry,.O. Box 513, 5600 MB Eindhoven, The Netherlands.
lnWbta
dt
378-3812/$ – see front matter © 2006 Elsevier B.V. All rights reserved.oi:10.1016/j.fluid.2006.07.002
separation; Sulfolane
orpholine (NFM), ethylene glycols [9–11] or propylene car-onate [9]. Those solvents require additional distillation steps toeparate the extraction solvent from both the extract and raffinatehases, and to purify the solvent, with, consequently, additionalnvestments and energy consumption. Overviews of the use ofxtraction and extractive distillation for the separation of aro-atic hydrocarbons from aliphatic hydrocarbons can be found
lsewhere [12–15].Replacement of volatile solvents in the separation of aro-
atic and aliphatic hydrocarbons by non-volatile ionic liquidsan offer several advantages: less complex processes and a moreimple regeneration of the solvent. In order to apply these ioniciquids in the chemical process industry, thermodynamic dataeed to be available for designing a proper separation process.e have investigated several combinations of ionic liquids and
inary mixtures of toluene and n-heptane in order to determinehermodynamic data for the design of an extraction process suit-
ble for separating aromatic and aliphatic hydrocarbons.Liquid–liquid equilibrium (LLE) data are essential for theesign of extraction equipment and/or for the calculation ofhe thermodynamic limit of a given separation. In the existing

hase
l[ei13tifhoaii(ofipba
wh((r1wi
ttdptttset
a
eamfa
2
fmSaoT9t>D
faD1irmittraSa
aoT
Fd
G.W. Meindersma et al. / Fluid P
iterature, hardly any data are found on LLE with ionic liquids16–27]. There are only four references concerning liquid–liquidquilibria for an aromatic and an aliphatic hydrocarbon withonic liquids [16–19]. Selvan et al. [17] used the ionic liquids-ethyl-3-methylimidazolium triiodide ([emim]I3) and 1-butyl--methylimidazolium triiodide ([bmim]I3) for the extraction ofoluene from a mixture of toluene and heptane. However, theseonic liquids are very corrosive and, therefore, not suitableor industrial applications [28]. Letcher and Deenadayalu [18]ave investigated ternary liquid–liquid equilibria for mixturesf 1-octyl-3-methylimidazolium chloride ([omim]Cl), benzenend an alkane at T = 298.2 K. Letcher and Reddy [19] havenvestigated ternary liquid–liquid equilibria for mixtures of theonic liquids 1-hexyl-3-methylimidazolium tetrafluoroborate[hmim]BF4) and 1-hexyl-3-methylimidazolium hexafluorob-rate ([hmim]PF6), and benzene and an alkane with the goal tond an alternative for [hmim]PF6, which can decompose in theresence of water and at elevated temperatures to form HF. Allenzene/heptane selectivities measured with these ionic liquidsre too low (S < 10) to be of industrial interest.
In a previous paper [29], three suitable ionic liquidsere identified for the separation of aromatic and aliphaticydrocarbons, notably 1,3-dimethylimidazolium methylsulfate[mmim]CH3SO4), 1-ethyl-3-methylimidazolium ethylsulfate[emim]C2H5SO4) and 4-methyl-N-butylpyridinium tetrafluo-oborate ([mebupy]BF4). In this paper, also the ionic liquid-butyl-3-methylimidazolium methylsulfate ([bmim]CH3SO4)as investigated. The structures of these ionic liquids are given
n Fig. 1.Since there are no thermodynamic data available for
hese ILs, LLE data must be determined in order to evaluatehe process performance. In this study, experimental LLEata over a wide composition range were gathered and thehase compositions were correlated by using the non-randomwo-liquid (NRTL) model for four ionic liquid systems:oluene + n-heptane + 1,3-dimethylimidazolium methylsulfate,oluene + n-heptane + 1-butyl-3-methylimidazolium methyl-ulfate, toluene + n-heptane + 1-ethyl-3-methyl-imidazolium
thylsulfate, toluene + n-heptane + 4-methyl-N-butylpyridiniumetrafluoroborate at T = 313.2 and 348.2 K and p = 0.1 MPa.The solvent sulfolane is used as a comparison for this sep-ration, because it is one of the most common solvents for
eNaT
ig. 1. Structures of 4-methyl-N-butylpyridinium tetrafluoroborate ([mebupy]imethylimidazolium methylsulfate ([mmim]CH3SO4) and 1-butyl-3-methylimidazo
Equilibria 247 (2006) 158–168 159
xtraction of aromatic hydrocarbons from mixtures of aromaticnd aliphatic hydrocarbons used in industry [2–9]. LLE experi-ents were also carried out with sulfolane, because relevant data
or the range in toluene concentrations below 20 mol% were notvailable.
. Experimental
The ionic liquids 1,3-dimethylimidazolium methylsul-ate ([mmim]CH3SO4) (98%), 1-butyl-3-methylimidazoliumethylsulfate ([bmim]CH3SO4) (98%) were purchased fromolvent Innovation. Sulfolane (>98%), diethylsulfate (>99%)nd the ionic liquid 4-methyl-N-butylpyridinium tetrafluorob-rate ([mebupy]BF4) (>97%) were purchased from Fluka.oluene (p.a., 99.9%), n-heptane (p.a., >99%), n-hexane (p.a.,9%), 1-butanol (p.a., >99%) and 1-methylimidazole (for syn-hesis, >99%) were purchased from Merck. Acetone (p.a.,99.5%) was purchased from Acros and acetone-d6, (99.5 at.%), for NMR analysis, was purchased from Aldrich.The ionic liquid 1-ethyl-3-methylimidazolium ethylsul-
ate was prepared from 1-methylimidazole and diethylsulfateccording to the procedure described by Holbrey et al. [30].iethylsulfate (116 mL) was added drop-wise to a mixture of-methylimidazole (70 mL) in toluene (400 mL), cooled in ance-bath under argon. After addition of the diethylsulfate, theeaction mixture was stirred at room temperature for 5 h. For-ation of two phases occurred: the toluene solution and a denser
onic liquid phase. The upper, organic phase was decanted andhe lower, ionic liquid phase, was three times washed witholuene (total amount of toluene: 200 mL), dried at 75 ◦C undereduced pressure (0 bar) in a rotary evaporator and finally invacuum exsiccator to remove any residual organic solvents.amples of this ionic liquid were dissolved in acetone-d6 andnalysed by 1H NMR (Varian 300 MHz).
Our equilibrium experiments were carried out with regener-ted ionic liquids, except, of course, the first experiment. Evap-rating the organic compounds from the extract during 1 h at= 348.2 K under reduced pressure in a rotary evaporator could
asily regenerate the ionic liquid used. Visible inspection of theMR spectra of both the original ionic liquid and the regener-
ted product showed no differences between the two samples.he water content of the ionic liquid was about 0.1 wt.%.
BF4), 1-ethyl-3-methylimidazolium ethylsulfate ([emim]C2H5SO4), 1,3-lium methylsulfate ([bmim]CH3SO4).

1 hase
jtastscwMe
avw51pmw
3
pphapm
sm(pnoabfv
ecpaod
4
thll
u
τ
wt(bA
mwllpfl
pip
x
wpγ
a
vnlpvcleiwp
0htntuTtdTtl
60 G.W. Meindersma et al. / Fluid P
Liquid–liquid equilibrium experiments were carried out inacketed vessels with a volume of approximately 70 mL. Theop of a vessel was closed using a PVC cover, through which
stirrer shaft passed. Both the cover and the opening for thehaft were sealed in order to prevent intrusion of moisture fromhe environment. Two stainless steel propellers on the stirrerhaft were used with an electronic stirrer (Heidolph RZR 2051ontrol), in order to thoroughly mix both phases. The vesselsere jacketed to circulate water from a water bath (Julabo F32-W) in order to maintain the temperature inside the vessels at
ither 313.2 or 348.2 K.For each experiment, 20 mL of the ionic liquid or sulfolane
nd 10 mL of a toluene/n-heptane mixture were placed into theessel. The temperature and the ratio of toluene in n-heptaneere varied. We established that equilibrium was reached withinmin. This was done for one IL by taking samples after 5, 10,5, 30, 65 and 120 min and analysing them. In order to avoid thisrocedure for the other ternary mixtures, the extraction experi-ents were continued for 20 min. After stirring, the two phasesere allowed to settle for about 1 h.
. Analysis
Samples (approximately 0.5 mL) were taken from bothhases. 1-Butanol (0.5 mL) was added to each sample to avoidhase splitting and to maintain a homogeneous mixture, and n-exane was added to samples as an internal standard for the GCnalysis, 0.2 mL to the raffinate phase and 0.1 mL to the extracthase samples. A more detailed description of the analyticalethod can be found in a previous publication [29].The concentrations of toluene and n-heptane in the
amples were analysed by a Varian CP-3800 gas chro-atograph with an Alltech Econo-Cap EC-Wax column
30 m × 0.32 mm × 0.25 �m) and with a Varian 8200 AutoSam-ler. Because the ionic liquid has no vapour pressure, it cannotot be analysed by GC. The IL is collected in a pre-column inrder not to disrupt the analysis. In a ternary mixture, one has tonalyse only two components and the third one, the IL, can thene determined by subtracting the sum of the measured molarractions of the aromatic and the aliphatic hydrocarbons from aalue of 1.
Measurements were carried out in duplicate in order toxclude exceptions in the measurements that could lead to wrongonclusions. The deviance in the calibration curves of 1% and aossible contamination of the gas chromatograph can also causevariance in the mole fractions (estimated on 1%). The averagesf the two measurements were used in our results. The averageeviation in the compositions is about 2.5%.
. Data correlation
The determined phase equilibrium data for the described sys-
ems were correlated with the NRTL model. Several authorsave used this model to describe their measurements ofiquid–liquid equilibria and vapour–liquid equilibria with ioniciquids [17–27,31]. The binary interactions were calculatedwtwt
Equilibria 247 (2006) 158–168
sing Eq. (1):
ij = aij + bij/T, Gij = exp(−αijτij), αij = αji (1)
here τij and Gij are NRTL parameters, which are calculated viahe non-randomness parameter αij and the parameters aij and bij
K). The model parameters of the NRTL equation (αij, aij, aji,ij (K) and bji (K)) were determined via data regression usingSPEN Plus 12.1.Seiler et al. [30] have also used ASPEN Plus to determine the
odel parameters for the NRTL equation for a VLE of ethanol,ater and the ionic liquid [emim]BF4. In their work, the ionic
iquid is treated as a non-dissociating component. Since the ioniciquid has no vapour pressure and its concentration in the vapourhase is close to zero, the parameter regression is not asked toulfil the equation for the equality of the fugacity for the ioniciquid.
The objective function for the regression of the NRTL-arameters is the equality of the activity for each componentn both phases. With the assumption of equilibrium in the liquidhase, the referring equation is:
Ri = γE
i
γRi
xEi (2)
here xRi is the composition of component i in the raffinate
hase, xEi the composition of component i in the extract phase,
Ei the activity coefficient of component i in the extract phasend γR
i the activity coefficient of component i in raffinate phase.For the component ionic liquid, this equation contains two
alues, which are close to zero: its concentration in the raffi-ate phase (xR
IL) and the value of 1/γRIL. The value of γR
IL is veryarge because the concentration of the ionic liquid in the raffinatehase is very small and its concentration in the extract phase isery large. Therefore, to circumvent numerical problems, theonstraints for the ionic liquid for the parameter regression areeft out, just as in the parameter regression carried out by Seilert al. [31]. Also, where the concentrations of the ionic liquidn the raffinate phase could not be detected, the concentrationsere set to 10−6 mole fraction in order to avoid numericalroblems.
The value of the non-random parameter αij was set to.3 for the toluene + n-heptane, toluene + sulfolane and n-eptane + sulfolane systems and was regressed for the combina-ions with the ionic liquids, because the standard value gave erro-eous results. For ionic systems, αij has usually another valuehan 0.3. Other authors who investigated LLE data with ILs alsosed other values for αij than the standard value of 0.3 [17–20].he binary interaction parameters for toluene + n-heptane for
he ionic liquid systems were determined by regression of twoata sets of the system toluene + n-heptane + [mebupy]BF4 at= 313.2 and 348.2 K. These parameters were then used in
he determination of the interaction parameters (toluene + ioniciquid and n-heptane + ionic liquid) of the other ternary systems
ith ionic liquids. The binary interaction parameters foroluene + n-heptane, obtained with [mebupy]BF4 as solvent,ere not suitable for the calculation of the tie lines for
he ternary system toluene + n-heptane + sulfolane, probably

G.W. Meindersma et al. / Fluid Phase Equilibria 247 (2006) 158–168 161
Table 1Experimental tie lines and toluene/n-heptane selectivity of the system toluene(1) + n-heptane (2) + sulfolane (3) in mole fractions at p = 0.1 MPa
n-Heptane-rich phase Sulfolane-rich phase Experimentalselectivity
x1 x2 x3 x1 x2 x3
313.2 K0.0335 0.9628 0.0037 0.0095 0.0088 0.9818 31.010.0591 0.9318 0.0091 0.0186 0.0095 0.9720 30.850.0845 0.9114 0.0042 0.0279 0.0102 0.9619 29.530.1149 0.8798 0.0054 0.0342 0.0099 0.9559 26.480.1503 0.8439 0.0059 0.0516 0.0118 0.9366 24.590.1772 0.8159 0.0069 0.0522 0.0102 0.9376 23.540.2521 0.7334 0.0145 0.0915 0.0139 0.8946 19.110.3064 0.6812 0.0125 0.1145 0.0156 0.8700 16.360.4142 0.5665 0.0193 0.1612 0.0173 0.8216 12.780.5149 0.4585 0.0266 0.2254 0.0213 0.7533 9.420.6001 0.3594 0.0405 0.2924 0.0261 0.6815 6.700.6437 0.3006 0.0557 0.3301 0.0333 0.6366 4.63
348.2 K0.0330 0.9603 0.0067 0.0104 0.0121 0.9775 24.910.0967 0.8942 0.0091 0.0317 0.0155 0.9529 18.970.1178 0.8731 0.0091 0.0376 0.0153 0.9471 18.270.1878 0.7967 0.0155 0.0614 0.0160 0.9226 16.320.1922 0.7953 0.0125 0.0675 0.0172 0.9153 16.200.2506 0.7335 0.0159 0.0855 0.0180 0.8965 13.870.3005 0.6805 0.0189 0.1081 0.0207 0.8712 11.800.4073 0.5661 0.0266 0.1590 0.0214 0.8196 10.330.5032 0.4524 0.0444 0.2305 0.0272 0.7424 7.6300
bTmsott
5
5l
hii
TTTTT
d
S
Table 2Experimental tie lines and toluene/n-heptane selectivity of the system toluene(1) + n-heptane (2) + [mebupy]BF4 (3) in mole fractions at p = 0.1 MPa
n-Heptane-rich phase [mebupy]BF4-rich phase Experimentalselectivity
x1 x2 x3 x1 x2 x3
313.2 K0.0000 1.0000 0.0000 0.0000 0.0095 0.9905 –0.0367 0.9633 0.0000 0.0162 0.0080 0.9758 53.090.0645 0.9306 0.0049 0.0290 0.0079 0.9631 52.910.1021 0.8979 0.0000 0.0448 0.0079 0.9473 49.630.1388 0.8590 0.0023 0.0594 0.0077 0.9328 47.670.1558 0.8442 0.0000 0.0730 0.0088 0.9182 45.220.2319 0.7681 0.0000 0.1112 0.0091 0.8798 40.570.3183 0.6817 0.0000 0.1481 0.0085 0.8433 37.130.4162 0.5838 0.0000 0.1916 0.0084 0.8000 32.050.5653 0.4347 0.0000 0.2630 0.0082 0.7288 24.630.6638 0.3362 0.0000 0.2982 0.0070 0.6948 21.480.7759 0.2241 0.0000 0.3538 0.0062 0.6400 16.430.9011 0.0989 0.0000 0.4496 0.0041 0.5464 12.141.0000 0.0000 0.0000 0.5158 0.0000 0.4842 –
348.2 K0.0000 0.9951 0.0049 0.0000 0.0118 0.9882 –0.0402 0.9598 0.0000 0.0166 0.0156 0.9678 26.150.0404 0.9531 0.0066 0.0182 0.0126 0.9692 34.260.0701 0.9299 0.0000 0.0334 0.0113 0.9553 39.320.1077 0.8923 0.0000 0.0483 0.0107 0.9410 37.430.1478 0.8522 0.0000 0.0669 0.0112 0.9218 34.330.2069 0.7804 0.0126 0.0929 0.0121 0.8950 28.980.2771 0.7229 0.0000 0.1008 0.0110 0.8882 23.870.3303 0.6600 0.0097 0.1455 0.0114 0.8431 25.590.4211 0.5719 0.0071 0.1836 0.0113 0.8050 22.040.5302 0.4668 0.0031 0.2307 0.0106 0.7587 19.1501
wheh
tjmaba3[w3dds
tt
.5933 0.3456 0.0612 0.3119 0.0375 0.6506 4.85
.6274 0.2924 0.0802 0.3529 0.0443 0.6028 3.71
ecause the ionic liquids are ionic and sulfolane is not.herefore, the binary interaction parameters for the ternaryixture toluene + n-heptane + sulfolane were determined
eparately. Also, the values of the binary interaction parametersf toluene + n-heptane, obtained by regression for the mixtureoluene + n-heptane + sulfolane, could not be used to calculatehe tie lines of the ternary mixtures with the ionic liquids.
. Results and discussion
.1. Ternary mixtures with toluene + heptane + an ioniciquid or sulfolane
The compositions of the conjugate phases, the toluene/n-eptane selectivity and the tie-line results of the ternary mixturesnvestigated at T = 313.2 and 348.2 K and p = 0.1 MPa are givenn the following tables and figures:
oluene + n-heptane + sulfolane Table 1 and Figs. 2–5oluene + n-heptane + [mebupy]BF4 Table 2 and Figs. 6 and 7oluene + n-heptane + [emim]C2H5SO4 Table 3 and Figs. 8 and 9oluene + n-heptane + [mmim]CH3SO4 Table 4 and Figs. 10 and 11oluene + n-heptane + [bmim]CH3SO4 Table 5 and Figs. 12 and 13
The selectivity (S) of the ionic liquid (IL) or sulfolane was
etermined from the equation:= xE1 /xE
2
xR1 /xR
2
(3)
ptFg
.5920 0.4080 0.0000 0.2420 0.0099 0.7481 16.85
.0000 0.0000 0.0000 0.4911 0.0000 0.5089 –
here x1 and x2 refer to mole fractions of the toluene and n-eptane, respectively, and superscripts E and R refer to thextract (sulfolane or IL-rich) phase and to the raffinate (n-eptane-rich) phase, respectively.
The solvent sulfolane is used as a comparison for the extrac-ion of aromatic hydrocarbons. The compositions of the con-ugate phases and the toluene/heptane selectivity of the ternary
ixture toluene + n-heptane + sulfolane T = 313.2 and 348.2 Knd p = 0.1 MPa are given in Table 1. The tie-line results haveeen plotted in Fig. 2. In Fig. 3, our own experimental datand LLE data from literature [2–4] are shown at T = 313.2 and48.2 K. Our experimental data and the data from Tripathi et al.2] and Rawat and Gulati [3] at 313.2 K are in good agreementith each other, but the data from De Fre and Verhoeye [4] at48.2 K differ from our own. Both the toluene and the heptaneistribution coefficients measured by De Fre are higher than ourata at higher toluene concentrations and the toluene/n-heptaneelectivity is lower than our data for all toluene concentrations.
In Fig. 4, the experimental tie lines of the ternary sys-em toluene + n-heptane + sulfolane and of the ternary sys-em toluene + n-heptane + [mebupy]BF4 and at T = 313.2 K and
= 0.1 MPa are shown in order to compare these two solvents forhe separation of toluene from toluene/n-heptane mixtures. Fromig. 4, it is clear from the straight binodal lines in the ternary dia-ram that the IL [mebupy]BF4 hardly dissolves in the heptane

162 G.W. Meindersma et al. / Fluid Phase Equilibria 247 (2006) 158–168
Table 3Experimental tie lines and toluene/n-heptane selectivity of the system toluene(1) + n-heptane (2) + [emim]C2H5SO4 (3) in mole fractions at p = 0.1 MPa
n-Heptane-rich phase [emim]C2H5SO4-rich phase Experimentalselectivity
x1 x2 x3 x1 x2 x3
313.2 K0.0000 0.9934 0.0066 0.0000 0.0051 0.9949 –0.0590 0.9320 0.0090 0.0140 0.0040 0.9820 55.290.1070 0.8770 0.0160 0.0240 0.0039 0.9721 50.440.1590 0.8190 0.0220 0.0360 0.0038 0.9602 48.800.2120 0.7770 0.0110 0.0470 0.0037 0.9493 46.560.2600 0.7270 0.0130 0.0550 0.0036 0.9414 42.720.3131 0.6651 0.0218 0.0695 0.0036 0.9269 41.140.3634 0.6046 0.0144 0.0853 0.0039 0.9108 37.460.4139 0.5643 0.0139 0.1029 0.0038 0.8933 37.630.4705 0.5110 0.0185 0.0964 0.0031 0.9005 33.600.5174 0.4688 0.0137 0.1079 0.0036 0.8885 27.040.5542 0.4290 0.0168 0.1165 0.0038 0.8797 23.660.6446 0.3489 0.0065 0.1238 0.0030 0.8732 22.400.6664 0.3065 0.0114 0.1429 0.0029 0.8542 23.540.7396 0.2593 0.0011 0.1492 0.0025 0.8483 21.100.7646 0.2284 0.0070 0.1645 0.0024 0.8331 20.220.8179 0.1769 0.0099 0.1692 0.0022 0.8286 16.280.8646 0.1320 0.0034 0.1849 0.0018 0.8133 15.790.9189 0.0954 0.0089 0.1724 0.0013 0.8262 10.040.9694 0.0518 0.0084 0.2034 0.0008 0.7958 5.610.9675 0.0000 0.0325 0.1790 0.0000 0.8210 –
348.2 K0.0000 0.9913 0.0087 0.0000 0.0052 0.9948 –0.0601 0.9364 0.0035 0.0124 0.0054 0.9822 35.550.1059 0.8675 0.0266 0.0229 0.0058 0.9713 32.140.1395 0.8231 0.0375 0.0333 0.0056 0.9611 34.800.2096 0.7547 0.0357 0.0465 0.0059 0.9476 28.360.2456 0.7129 0.0415 0.0536 0.0054 0.9410 28.690.3102 0.6694 0.0204 0.0682 0.0055 0.9263 26.830.3504 0.6204 0.0292 0.0721 0.0055 0.9224 23.180.3829 0.5842 0.0328 0.0826 0.0052 0.9122 24.200.4482 0.5229 0.0289 0.0943 0.0041 0.9016 26.650.5033 0.4693 0.0274 0.1101 0.0046 0.8853 22.200.5391 0.4335 0.0274 0.1220 0.0042 0.8738 23.620.5876 0.3850 0.0274 0.1190 0.0039 0.8770 19.910.6401 0.3386 0.0213 0.1335 0.0034 0.8632 21.030.6766 0.2980 0.0254 0.1421 0.0038 0.8541 16.340.7399 0.2416 0.0185 0.1543 0.0028 0.8430 18.110.7922 0.1874 0.0203 0.1612 0.0026 0.8362 14.500.8150 0.1531 0.0320 0.1775 0.0022 0.8203 15.120.8888 0.0850 0.0262 0.1826 0.0015 0.8159 12.0200
pvaTsttsc
iT
Table 4Experimental tie lines and toluene/n-heptane selectivity of the system toluene(1) + n-heptane (2) + [mmim]CH3SO4 (3) in mole fractions at p = 0.1 MPa
n-Heptane-rich phase [mmim]CH3SO4-rich phase Experimentalselectivity
x1 x2 x3 x1 x2 x3
313.2 K0.0000 1.0000 0.0000 0.0028 0.0000 0.9972 –0.0608 0.9325 0.0067 0.0052 0.0013 0.9936 61.350.1075 0.8902 0.0023 0.0083 0.0011 0.9895 62.480.1788 0.8183 0.0028 0.0158 0.0011 0.9826 65.740.2270 0.7725 0.0005 0.0194 0.0011 0.9786 60.020.3193 0.6768 0.0039 0.0268 0.0010 0.9721 56.810.3432 0.6568 0.0000 0.0285 0.0010 0.9700 54.540.3960 0.6007 0.0034 0.0316 0.0009 0.9675 53.260.4694 0.5278 0.0028 0.0365 0.0010 0.9625 41.040.5157 0.4843 0.0000 0.0427 0.0008 0.9565 50.120.5574 0.4426 0.0000 0.0478 0.0010 0.9512 37.960.6101 0.3899 0.0000 0.0501 0.0009 0.9490 35.580.6558 0.3442 0.0000 0.0560 0.0007 0.9433 41.990.7254 0.2746 0.0000 0.0591 0.0010 0.9400 22.370.7253 0.2747 0.0000 0.0628 0.0007 0.9365 33.980.8049 0.1951 0.0000 0.0629 0.0007 0.9360 21.780.8386 0.1614 0.0000 0.0721 0.0008 0.9271 17.350.8943 0.1057 0.0000 0.0740 0.0007 0.9253 12.490.9431 0.0569 0.0000 0.0830 0.0006 0.9164 8.350.9614 0.0386 0.0000 0.0790 0.0005 0.9207 6.341.0000 0.0000 0.0000 0.0971 0.0000 0.9029 –
348.2 K0.0000 0.9947 0.0053 0.0000 0.0012 0.9988 –0.0595 0.9036 0.0370 0.0039 0.0013 0.9948 46.360.1242 0.8571 0.0188 0.0101 0.0012 0.9886 56.280.1725 0.8072 0.0203 0.0126 0.0014 0.9860 42.850.2326 0.7476 0.0198 0.0184 0.0011 0.9805 54.110.2727 0.7133 0.0139 0.0219 0.0013 0.9768 41.440.3349 0.6496 0.0155 0.0266 0.0012 0.9722 40.340.3885 0.5972 0.0143 0.0278 0.0009 0.9713 47.960.4367 0.5473 0.0160 0.0346 0.0011 0.9643 39.460.4806 0.4862 0.0332 0.0404 0.0010 0.9583 42.430.5356 0.4519 0.0126 0.0434 0.0008 0.9558 46.030.5901 0.3889 0.0210 0.0423 0.0009 0.9562 33.510.6651 0.3349 0.0000 0.0499 0.0006 0.9495 41.950.6977 0.2965 0.0058 0.0616 0.0007 0.9377 41.090.7452 0.2540 0.0008 0.0622 0.0006 0.9372 34.100.7853 0.2143 0.0004 0.0659 0.0005 0.9336 34.770.8285 0.1715 0.0000 0.0716 0.0007 0.9277 21.490.8760 0.1240 0.0000 0.0768 0.0005 0.9227 21.580.9242 0.0758 0.0000 0.0787 0.0004 0.9209 15.1001
apst[os
.9417 0.0440 0.0143 0.1844 0.0011 0.8145 7.94
.9627 0.0000 0.0373 0.1808 0.0000 0.8192 –
hase and that the concentration of n-heptane in the IL phase isery low. The toluene distribution coefficient with the IL remainst the same level, independent of the toluene concentration.he miscibility gap between n-heptane and sulfolane becomesmaller at higher toluene concentrations. This means that theoluene distribution coefficient with sulfolane increases with theoluene concentration, but the toluene/n-heptane selectivity withulfolane decreases with increasing toluene concentration, as
an be seen in Fig. 5.The maximum solubility of toluene in the ionic liquids testeds the highest for [mebupy]BF4, as can be seen in Table 6.he solubility of n-heptane in all ionic liquids is very low
aTDt
.9611 0.0389 0.0000 0.0826 0.0003 0.9171 12.03
.0000 0.0000 0.0000 0.1047 0.0000 0.8953 –
nd increases somewhat with temperature, as can be seen com-aring the results at 313.2 and 348.2 K in Table 6. The lowolubility of n-heptane in the ILs is the cause of the scat-ering of the experimental selectivity data, especially withmmim]CH3SO4 (Fig. 11), since small errors in the analysesf n-heptane in the IL-phase will then have a large effect on theelectivity.
The solubility of the ionic liquids in n-heptane is also low
nd it also increases with temperature, as can be seen in Table 6.his means that not much IL is lost in the raffinate phase.ue to the low solubility of n-heptane in [mmim]CH3SO4, theoluene/heptane selectivities are higher with this IL than for the
G.W. Meindersma et al. / Fluid Phase Equilibria 247 (2006) 158–168 163
Table 5Experimental tie lines and toluene/n-heptane selectivity of the system toluene(1) + n-heptane (2) + [bmim]CH3SO4 (3) in mole fractions at p = 0.1 MPa
n-Heptane-rich phase [bmim]CH3SO4-rich phase Experimentalselectivityx1 x2 x3 x1 x2 x3
313.2 K0.0000 1.0000 0.0000 0.0000 0.0128 0.9872 –0.0152 0.9848 0.0000 0.0041 0.0106 0.9854 24.860.0553 0.9447 0.0000 0.0191 0.0093 0.9716 35.020.0863 0.9137 0.0000 0.0289 0.0098 0.9613 31.170.1288 0.8649 0.0063 0.0440 0.0092 0.9468 32.130.1451 0.8549 0.0000 0.0482 0.0090 0.9428 31.750.2969 0.7030 0.0001 0.0960 0.0087 0.8953 26.260.4327 0.5672 0.0001 0.1350 0.0076 0.8574 23.190.5458 0.4531 0.0011 0.1673 0.0072 0.8255 19.260.6927 0.3059 0.0014 0.2185 0.0057 0.7758 16.860.8207 0.1792 0.0001 0.2518 0.0044 0.7439 12.610.9976 0.0024 0.0000 0.3474 0.0001 0.6526 12.081.0000 0.0000 0.0000 0.3222 0.0000 0.6778 –
348.2 K0.0000 1.0000 0.0000 0.0000 0.0117 0.9883 –0.0178 0.9822 0.0000 0.0041 0.0116 0.9843 19.400.0562 0.9437 0.0000 0.0189 0.0107 0.9704 29.530.0918 0.9082 0.0000 0.0290 0.0103 0.9608 27.960.1359 0.8615 0.0026 0.0426 0.0110 0.9463 24.530.1528 0.8472 0.0000 0.0476 0.0101 0.9423 26.080.3008 0.6992 0.0000 0.0926 0.0099 0.8975 21.790.4366 0.5634 0.0000 0.1313 0.0092 0.8595 18.440.5494 0.4441 0.0065 0.1684 0.0096 0.8220 14.170.7075 0.2886 0.0038 0.2245 0.0071 0.7684 12.940.8243 0.1754 0.0003 0.2387 0.0044 0.7569 11.540.9967 0.0033 0.0000 0.3431 0.0001 0.6567 9.211
tHvl
aitmshag
F(c
5
dCeemany cases. Also, the experimental toluene/n-heptane selec-
TS
I
[[[[
.0000 0.0000 0.0000 0.3166 0.0000 0.6834 –
hree other ILs, as can be seen in comparing Fig. 14a and b.owever, since the solubility of toluene in [mmim]CH3SO4 isery low, the toluene distribution coefficient in this IL is alsoow.
In Fig. 14, the experimental toluene/n-heptane selectivitiest T = 313.2 and 348.2 K are shown for sulfolane and the fouronic liquids tested. From Fig. 14a and b it is obvious that theoluene/n-heptane selectivity with the four ILs investigated is
uch higher than with sulfolane. Considering the relatively higholubility of toluene in [mebupy]BF4 and the high toluene/n-eptane selectivity, [mebupy]BF is the best solvent for the
4romatic/aliphatic separation of the four ionic liquids investi-ated.tbC
able 6olubility data in mole fractions, taken from Tables 2–5
onic liquid Temperature
Toluene in IL, maximum n-Hept
313.2 K 348.2 K 313.2 K
mebupy]BF4 0.52 0.49 0.0072emim]C2H5SO4 0.18 0.18 0.0030mmim]CH3SO4 0.10 0.10 0.0009bmim]CH3SO4 0.32 0.32 0.0074
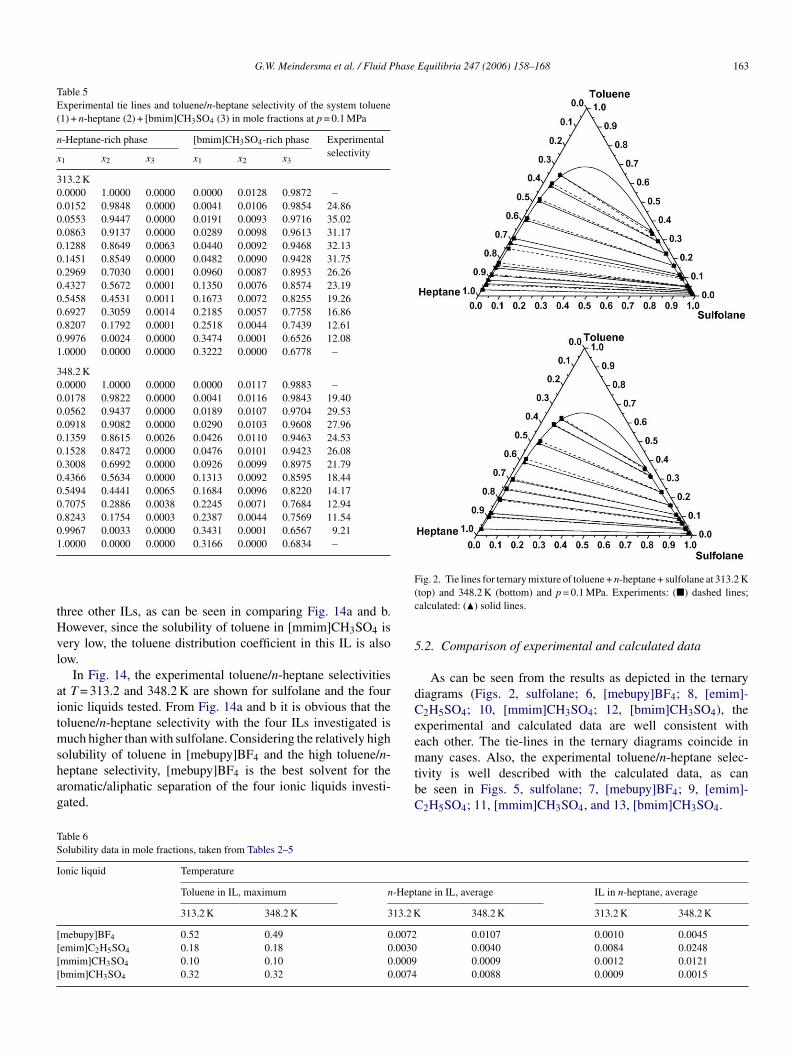
ig. 2. Tie lines for ternary mixture of toluene + n-heptane + sulfolane at 313.2 Ktop) and 348.2 K (bottom) and p = 0.1 MPa. Experiments: (�) dashed lines;alculated: (�) solid lines.
.2. Comparison of experimental and calculated data
As can be seen from the results as depicted in the ternaryiagrams (Figs. 2, sulfolane; 6, [mebupy]BF4; 8, [emim]-2H5SO4; 10, [mmim]CH3SO4; 12, [bmim]CH3SO4), thexperimental and calculated data are well consistent withach other. The tie-lines in the ternary diagrams coincide in
ivity is well described with the calculated data, as cane seen in Figs. 5, sulfolane; 7, [mebupy]BF4; 9, [emim]-2H5SO4; 11, [mmim]CH3SO4, and 13, [bmim]CH3SO4.
ane in IL, average IL in n-heptane, average
348.2 K 313.2 K 348.2 K
0.0107 0.0010 0.00450.0040 0.0084 0.02480.0009 0.0012 0.01210.0088 0.0009 0.0015

164 G.W. Meindersma et al. / Fluid Phase Equilibria 247 (2006) 158–168
Fig. 3. Tie lines for ternary mixture of toluene + n-heptane + sulfolane at 313.2 K(top) and 348.2 K (bottom) and p = 0.1 MPa. Experiments: (�), calculated bin-odal line: solid line. Literature data from [2] (�), [3] (�) (top), [4] (�) (bottom);binodal line: dashed line.
Fig. 4. Ternary diagram of the system toluene + n-heptane + [mebupy]BF4 (�)(solid lines) and toluene + n-heptane + sulfolane (�) (dashed lines) at T = 313.2 Kand p = 0.1 MPa.
Fig. 5. Experimental and calculated toluene/n-heptane selectivity with sul-folane. (�) Experiments 313.2 K, (—) calculated 313.2 K; (�) experiments348.2 K, (- - -) calculated 348.2 K.
Fig. 6. Tie lines for ternary mixture of toluene + n-heptane + [mebupy]BF4 at313.2 K (top) and 348.2 K (bottom) and p = 0.1 MPa. Experiments: (�) dashedlines; calculated: (�) solid lines.

G.W. Meindersma et al. / Fluid Phase Equilibria 247 (2006) 158–168 165
F[i
md
R
Fac
F[i
wvide a designation for the component, phase and the tie lines,respectively. The value k designates the number of tie lines. The
ig. 7. Experimental and calculated toluene/n-heptane selectivity withmebupy]BF4. (�) Experiments 313.2 K, (—) calculated 313.2 K; (�) exper-ments 348.2 K, (- - -) calculated 348.2 K.
In Table 7, all interaction parameters determined by the NRTLodel are given. The root mean square deviation, RMSD, is
efined as:
MSD ={∑
i
∑l
∑m(xexp
ilm − xcalcilm )
2
6k
}1/2
(4)
ig. 8. Tie lines for the ternary system toluene + n-heptane + [emim]C2H5SO4
t T = 313.2 K (top) and 348.2 K (bottom). Experiments: (�) dashed lines; cal-ulated: (�) solid lines.
vi
Fac
ig. 9. Experimental and calculated toluene/n-heptane selectivity withemim]C2H5SO4. (�) Experiments 313.2 K, (—) calculated 313.2 K; (�) exper-ments 348.2 K, (- - -) calculated 348.2 K.
here x is the mole fraction and the subscripts i, l and m pro-
alues of the RMSD of the systems under investigation are listedn Table 8.
ig. 10. Tie lines for the ternary mixture toluene + n-heptane + [mmim]CH3SO4
t T = 313.2 K (top) and 348.2 K (bottom). Experiments: (�) dashed lines; cal-ulated: (�) solid lines.

166 G.W. Meindersma et al. / Fluid Phase Equilibria 247 (2006) 158–168
F[i
avN0
Fac
F[i
at
ig. 11. Experimental and calculated toluene/n-heptane selectivity withmmim]CH3SO4. (�) Experiments 313.2 K, (—) calculated 313.2 K; (�) exper-ments 348.2 K, (- - -) calculated 348.2 K.
The values of RMSD in Table 8 provide a measure of theccuracy of the correlations. As can be inferred from these
alues, a good correlation of the experimental values with theRTL model was obtained. Most of the RMSD values are below.015 with exception for toluene + n-heptane + [bmim]CH3SO4ig. 12. Tie lines for the ternary mixture toluene + n-heptane + [bmim]CH3SO4
t T = 313.2 K (top) and 348.2 K (bottom). Experiments: (�) dashed lines; cal-ulated: (�) solid lines.
didfsttaatn
FT(
ig. 13. Experimental and calculated toluene/n-heptane selectivity withbmim]CH3SO4. (�) Experiments 313.2 K, (—) calculated 313.2 K; (�) exper-ments 348.2 K, (- - -) calculated 348.2 K.
t 313.2 K, caused by keeping the binary interaction parame-ers for toluene + n-heptane with [bmim]CH3SO4 fixed to thoseetermined for the ionic liquid [mebupy]BF4. If these binarynteraction parameters are also regressed from experimentalata, then a value of the RMSD of 0.0040 can be obtainedor toluene + n-heptane + [bmim]CH3SO4. Also for the otherystems, smaller RMSD values can be obtained if all binaryoluene + n-heptane interaction parameters are regressed fromhe experimental data for each individual ionic liquid. However,
s indicated earlier, we intended to use the same binary inter-ction parameters for toluene + n-heptane for all ionic liquidsested, because we expected similar effects of the third compo-ent (the ionic liquid) on the binary interaction parameters ofig. 14. Toluene/n-heptane selectivities with sulfolane and ionic liquids at= 313.2 K (a) and (b) 348.2 K. (�) [mmim]CH3SO4, (�) [emim]C2H5SO4,
�) [mebupy]BF4, (�) [bmim]CH3SO4, ( ) sulfolane.

G.W. Meindersma et al. / Fluid Phase Equilibria 247 (2006) 158–168 167
Table 7Regressed NRTL binary interaction parameters for the description of the systems toluene (1) + n-heptane (2) + an ionic liquid (3) at 313.2 and 348.2 K
Binary parameter aij aji bij (K) bji (K) αij
Toluene + n-heptane (IL) 3.914 15.185 −880.0 −4674 0.3Toluene + [mmim]CH3SO4 −34.065 43.029 6934 −8436 0.0074n-Heptane + [mmim]CH3SO4 −25.010 14.476 6751 −2020 −0.3429Toluene + [emim]C2H5SO4 3.428 −0.815 737.2 51.69 0.1450n-Heptane + [emim]C2H5SO4 2.636 13.57 −1527 −2181 −0.3250Toluene + [mebupy]BF4 −11.704 21.989 4394 −6659 0.3519n-Heptane + [mebupy]BF4 −29.032 4.918 6364 1112 −0.0998Toluene + [bmim]CH3SO4 4.735 −1.725 −980.7 473.8 −0.7002n-Heptane + [bmim]CH3SO4 −9.342 1.768 −1591 2607 −0.0708Toluene + n-heptane (sulfolane) 0.269 −0.756 31.74 48.41 0.3Toluene + sulfolane −1.057 0.428n-Heptane + sulfolane −0.039 −0.215
Table 8Value of the root mean square deviation for the ternary mixtures of toluene(1) + n-heptane (2) + an ionic liquid (3)
Ternary system Temperature (K) RMSD
Toluene + n-heptane + [mebupy]BF4 313.2 0.0134348.2 0.0035
Toluene + n-heptane + [emim]C2H5SO4 313.2 0.0091348.2 0.0133
Toluene + n-heptane + [mmim]CH3SO4 313.2 0.0084348.2 0.0088
T
tshs
6
vl[
mfiib
ihuscuassf
LabGpSTx
Gα
γ
τ
SER
R
[[
[
[
[14] T. Hombourger, L. Gouzien, P. Mikitenko, P. Bonfils, Solvent extraction
oluene + n-heptane + [bmim]CH3SO4 313.2 0.0171348.2 0.0148
oluene + n-heptane. Because we expected a different effect ofulfolane on the binary interaction parameters of toluene + n-eptane, these binary interaction parameters were determinedeparately.
. Conclusions
Ternary data for the systems toluene + n-heptane + a sol-ent were collected for the solvents sulfolane and the ioniciquids [mebupy]BF4, [emim]C2H5SO4, [mmim]CH3SO4 andbmim]CH3SO4.
All experimental data were well correlated with the NRTLodel, as can be seen by comparing the experimental and thetted data in the ternary diagrams for the five systems under
nvestigation. The RMSD values of the correlations are generallyelow 0.015.
The experimental and calculated aromatic/aliphatic selectiv-ties are in good agreement with each other. The toluene/n-eptane selectivity values were higher with all four ionic liq-ids tested than with sulfolane. The ionic liquid [mebupy]BF4howed an optimal combination of a high toluene distributionoefficient and a high toluene/n-heptane selectivity. These val-es were for the range of toluene concentrations below 55 mol%
t 313.2 K and below 45 mol% at 348.2 K higher than those withulfolane. The ionic liquid [mebupy]BF4 is, therefore, a suitableolvent to replace sulfolane for an industrial extraction processor the separation of aromatic and aliphatic hydrocarbons.[[
1017 −165.7 0.31365 1188 0.3
ist of symbolsNRTL model parameter in Aspen PlusNRTL model parameter in Aspen Plus (K)NRTL parameterpressure (Pa)selectivitytemperature (K)mole fraction
reek symbolsnon-randomness parameter in NRTL modelactivity coefficientNRTL parameter
uperscriptsextract phaseraffinate phase
eferences
[1] K. Weissermel, H.-J. Arpe, Industrial Organic Chemistry, 4th completelyrevised ed., Wiley/VCH, Weinheim, Dusseldorf, 2003, pp. 313–336.
[2] R.P. Tripathi, A.R. Ram, P.B. Rao, J. Chem. Eng. Data 20 (1975) 261–264.[3] B.S. Rawat, I.B. Gulati, J. Appl. Chem. Biotechnol. 26 (1976) 425–435.[4] R.M. De Fre, L.A. Verhoeye, J. Appl. Chem. Biotechnol. 26 (1976)
469–487.[5] J. Chen, L.-P. Duan, J.-G. Mi, W.-Y. Feio, Z.-C. Li, Fluid Phase Equilib.
173 (2000) 109–119.[6] J. Chen, Z.-C. Li, L.P. Duan, J. Chem. Eng. Data 45 (2000) 689–692.[7] Y.J. Choi, K.W. Cho, B.W. Cho, Y.-K. Yeo, Ind. Eng. Chem. Res. 41 (2002)
5504–5509.[8] R. Krishna, A.N. Goswami, S.M. Nanoti, B.S. Rawat, M.K. Khana, J.
Dobhal, Indian J. Technol. 25 (1987) 602–606.[9] Y. Yorulmaz, F. Karpuzcu, Chem. Eng. Res. Des. 63 (1985) 184–190.10] W. Wang, Z.M. Gou, S.L. Zhu, J. Chem. Eng. Data 43 (1) (1998) 81–83.11] T.A. Al-Sahhaf, E. Kapetanovic, Fluid Phase Equilib. 118 (2) (1996)
271–285.12] S.H. Ali, H.M.S. Lababidi, S.Q. Merchant, M.A. Fahim, Fluid Phase Equi-
lib. 214 (2003) 25–38.13] B. Firnhaber, G. Emmerich, F. Ennenbach, U. Ranke, Erdol Erdgas Kohle
116 (5) (2000) 254–260.
in the oil industry, in: J.P. Wauquier (Ed.), Petroleum Refining, EditionsTechnip, Paris, 2000, pp. 359–456 (Chapter 7).
15] S.H. Hamid, M.A. Ali, Energy Sour. 18 (1996) 65–84.16] J. Gmehling, M. Krummen, DE 101 54 052 A1, 10-07-2003.

1 hase
[
[[[[
[
[
[
[
[
[
[
[
68 G.W. Meindersma et al. / Fluid P
17] M.S. Selvan, M.D. McKinley, R.H. Dubois, J.L. Atwood, J. Chem. Eng.Data 45 (5) (2000) 841–845.
18] T.M. Letcher, N. Deenadayalu, J. Chem. Thermodyn. 35 (1) (2003) 67–76.19] T.M. Letcher, P. Reddy, J. Chem. Thermodyn. 37 (5) (2005) 415–421.20] A. Arce, O. Rodrıguez, A. Soto, J. Chem. Eng. Data 49 (3) (2004) 514–517.21] A. Arce, O. Rodrıguez, A. Soto, Ind. Eng. Chem. Res. 43 (26) (2004)
8323–8327.22] A. Arce, E. Rodil, O. Rodrıguez, A. Soto, Proceedings of CHISA 2004,
Prague, Czech Republic, 22–26 August, Czech Society of Chemical Engi-neering, Prague, Czech Republic, 2004, P3-141.
23] T.M. Letcher, P. Reddy, Fluid Phase Equilib. 219 (2) (2004) 107–
112.24] T.M. Letcher, N. Deenadayalu, B. Soko, D. Ramjugernath, P.K. Naicker,J. Chem. Eng. Data 48 (4) (2003) 904–907.
25] A. Heintz, J.K. Lehmann, C. Wertz, J. Jacquemin, J. Chem. Eng. Data 50(3) (2005) 956–960.
[
[
Equilibria 247 (2006) 158–168
26] R. Kato, M. Krummen, J. Gmehling, Fluid Phase Equilib. 224 (1) (2004)47–54.
27] M. Seiler, C. Jork, A. Kavarnou, W. Arlt, R. Hirsch, AIChE J. 50 (10)(2004) 2439–2454.
28] G.W. Meindersma, J.G. Podt, M.G. Meseguer, A.B. S de Haan, in:R.D. Rogers, K. Seddon (Eds.), Proceedings of ACS Symposium Series902, Ionic Liquids IIIB, Fundamentals, Progress, Challenges, and Oppor-tunities, American Chemical Society, Washington, 2005, pp. 57–71(Chapter 5).
29] G.W. Meindersma, J.G. Podt, A.B. de Haan, Fuel Process. Technol. 87 (1)(2005) 59–70.
30] J.D. Holbrey, W.M. Reichert, R.P. Swatloski, G.A. Broker, W.R. Pitner,K.R. Seddon, R.D. Rogers, Green Chem. 4 (2002) 407–413.
31] M. Seiler, C. Jork, T. Schneider, W. Arlt, Proceedings of the Interna-tional Conference on Distillation and Absorption, Baden-Baden, Septem-ber 30–October 10, 2002.