Module 25 Ternary Phase Diagram Lecture 25 Ternary Phase ...
18
NPTEL Phase II : IIT Kharagpur : Prof. R. N. Ghosh, Dept of Metallurgical and Materials Engineering | | 1 Module 25 Ternary Phase Diagram Lecture 25 Ternary Phase Diagram
-
Upload
khangminh22 -
Category
Documents
-
view
2 -
download
0
Transcript of Module 25 Ternary Phase Diagram Lecture 25 Ternary Phase ...
NPTEL Phase II : IIT Kharagpur : Prof. R. N. Ghosh, Dept of Metallurgical and Materials Engineering | |
1
Module 25
Ternary Phase Diagram
Lecture 25
Ternary Phase Diagram

NPTEL Phase II : IIT Kharagpur : Prof. R. N. Ghosh, Dept of Metallurgical and Materials Engineering | |
2
Keywords: Composition triangle, ternary isomorphous system, vertical & horizontal section,
ternary eutectic
Introduction
We are now familiar with binary phase diagrams. It is like a map in a two dimensional space
representing temperature and composition where there are several domains separated by
boundaries. Within each domain a particular phase or at best a maximum of 2 phases can
coexist. It may also have isotherms representing 3 phase equilibrium. We have looked at
different types of hypothetical phase diagrams and a specific binary phase diagram
representing iron – carbon system. Phase diagrams help us interpret the structures of metal
and alloys. This gives a rough estimate of its properties as well. However, most commercial
alloys have more than two components. This is where we need higher orders of phase diagram.
Let us first look at ternary diagram which is used to represent the stability of different phases if
the alloy consists of 3 components.
Composition triangle:
In a binary phase diagram the horizontal axis is used to represent the composition. This is
enough because we need to specify the amount of one component only. The amount of the
other is obtained by subtracting it from 100. In a ternary system we need to specify the
amounts of two components. Therefore we need two axes. The amount of the third can be
obtained by subtracting the sum total of the two from100. This is best done using a
composition triangle. This is illustrated in slide 1.

NPTEL Phase II : IIT Kharagpur : Prof. R. N. Ghosh, Dept of Metallurgical and Materials Engineering | |
3
Composition triangle
%A = CQ
%B = PX
%C = AP
PX = PQ
AP+PQ+QC = 100
A B
C
xP
Q
10
10
20
20 80 90%B
90
80
10
90
80
An equilateral triangle is used to represent the composition of a ternary alloy. Slide 1 shows
such a triangle. Three vertices are named after the three components A, B & C. These three
points represent 100% A, B and C respectively. The three sides of the triangle represent the
compositions of the 3 binary alloys. At every point on the line BC (the side opposite the vertex
A) has 0% A. The each side of the triangle has been subdivided into 10 parts by a set of points.
Join these as shown in slide 1. The entire space is now divided into a set of small equilateral
triangles. These can be further subdivided depending on the needs. Smaller divisions are
needed for more precise location of the composition of the alloy. Let us consider an alloy
represented by the point X as shown in the slide. What is its composition? How could this be
read from the diagram? For example % A is read by measuring the distance from the side (BC)
opposite the vertex A. It is equal to 30% (=CQ). Note that the lines are drawn at intervals of
10%. % B is read from the side AC. This is equal to 30% (=PX). %C is read from the side AB. This
is equal to 40% (=AP). Note that the sum of the three is 100.
Ternary isomorphous system:
Let us consider a ternary system consisting of 3 components A, B & C. These are soluble in all
proportions in both liquid and solid state. This is the characteristic of an isomorphous system.
Slide 2 shows the nature of the respective binary phase diagrams.
Slide 1
NPTEL Phase II : IIT Kharagpur : Prof. R. N. Ghosh, Dept of Metallurgical and Materials Engineering | |
4
A B
C
L
L
L
Ternary isomorphous system
TmA
TmA
TmB
TmB
TmC TmC
Liquidus SolidusSolidus
Solidus
Liquiidus
Liquiidus
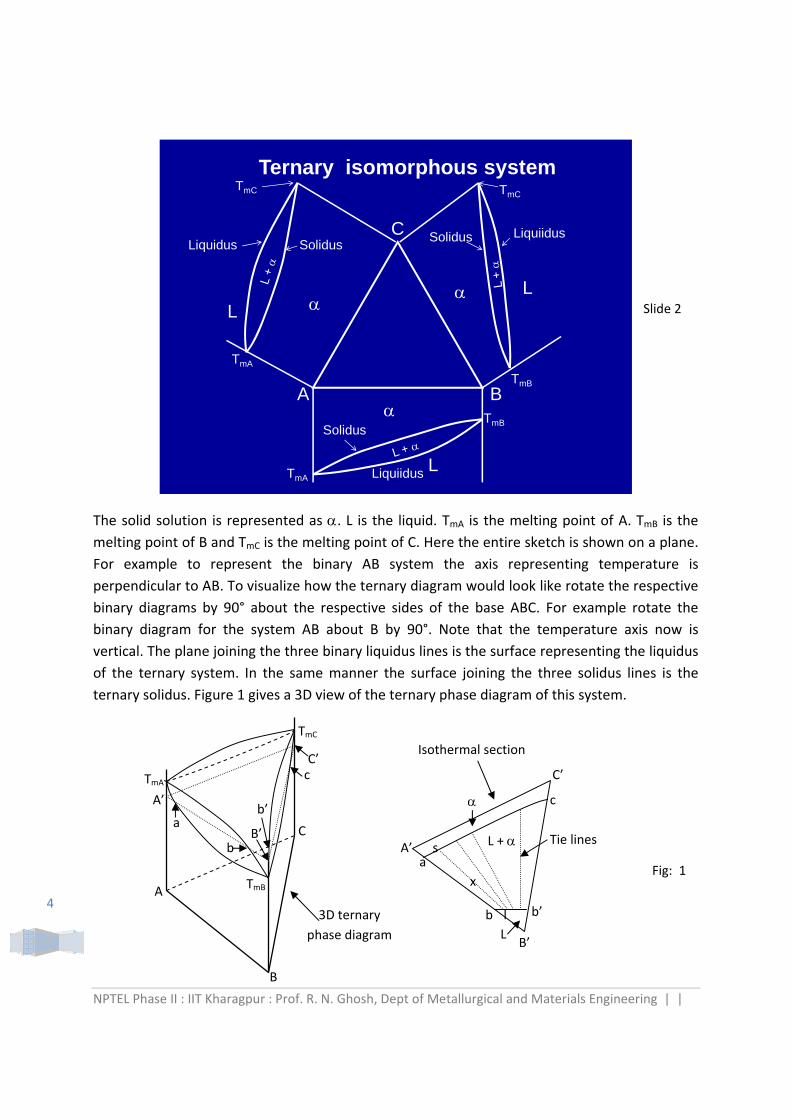
The solid solution is represented as . L is the liquid. TmA is the melting point of A. TmB is the
melting point of B and TmC is the melting point of C. Here the entire sketch is shown on a plane.
For example to represent the binary AB system the axis representing temperature is
perpendicular to AB. To visualize how the ternary diagram would look like rotate the respective
binary diagrams by 90° about the respective sides of the base ABC. For example rotate the
binary diagram for the system AB about B by 90°. Note that the temperature axis now is
vertical. The plane joining the three binary liquidus lines is the surface representing the liquidus
of the ternary system. In the same manner the surface joining the three solidus lines is the
ternary solidus. Figure 1 gives a 3D view of the ternary phase diagram of this system.
Slide 2
Fig: 1
A’
B’
C’
L +
L
a
c
b b’
A
B
C
TmB
TmA
TmC
A’
C’
B’ a
c
b
b’
Tie lines
3D ternary
phase diagram
Isothermal section
x
s
l
NPTEL Phase II : IIT Kharagpur : Prof. R. N. Ghosh, Dept of Metallurgical and Materials Engineering | |
5
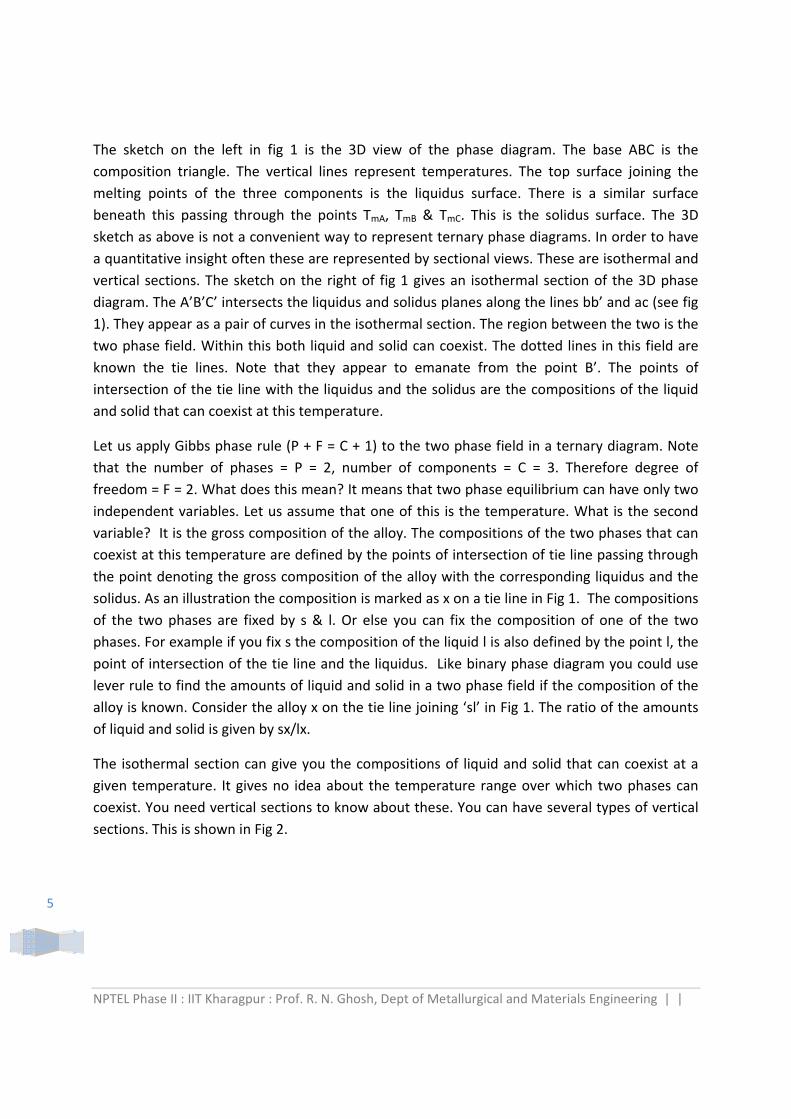
The sketch on the left in fig 1 is the 3D view of the phase diagram. The base ABC is the
composition triangle. The vertical lines represent temperatures. The top surface joining the
melting points of the three components is the liquidus surface. There is a similar surface
beneath this passing through the points TmA, TmB & TmC. This is the solidus surface. The 3D
sketch as above is not a convenient way to represent ternary phase diagrams. In order to have
a quantitative insight often these are represented by sectional views. These are isothermal and
vertical sections. The sketch on the right of fig 1 gives an isothermal section of the 3D phase
diagram. The A’B’C’ intersects the liquidus and solidus planes along the lines bb’ and ac (see fig
1). They appear as a pair of curves in the isothermal section. The region between the two is the
two phase field. Within this both liquid and solid can coexist. The dotted lines in this field are
known the tie lines. Note that they appear to emanate from the point B’. The points of
intersection of the tie line with the liquidus and the solidus are the compositions of the liquid
and solid that can coexist at this temperature.
Let us apply Gibbs phase rule (P + F = C + 1) to the two phase field in a ternary diagram. Note
that the number of phases = P = 2, number of components = C = 3. Therefore degree of
freedom = F = 2. What does this mean? It means that two phase equilibrium can have only two
independent variables. Let us assume that one of this is the temperature. What is the second
variable? It is the gross composition of the alloy. The compositions of the two phases that can
coexist at this temperature are defined by the points of intersection of tie line passing through
the point denoting the gross composition of the alloy with the corresponding liquidus and the
solidus. As an illustration the composition is marked as x on a tie line in Fig 1. The compositions
of the two phases are fixed by s & l. Or else you can fix the composition of one of the two
phases. For example if you fix s the composition of the liquid l is also defined by the point l, the
point of intersection of the tie line and the liquidus. Like binary phase diagram you could use
lever rule to find the amounts of liquid and solid in a two phase field if the composition of the
alloy is known. Consider the alloy x on the tie line joining ‘sl’ in Fig 1. The ratio of the amounts
of liquid and solid is given by sx/lx.
The isothermal section can give you the compositions of liquid and solid that can coexist at a
given temperature. It gives no idea about the temperature range over which two phases can
coexist. You need vertical sections to know about these. You can have several types of vertical
sections. This is shown in Fig 2.

NPTEL Phase II : IIT Kharagpur : Prof. R. N. Ghosh, Dept of Metallurgical and Materials Engineering | |
6
Figure 2 shows the orientations lines XY & AX on the composition triangle. An imaginary vertical
plane passing through these would intersect the surfaces representing the solidus and the
liquidus. The trace of these on a plane is the vertical section of the ternary diagram.
The sketch on the left of fig 3 gives a 3D ternary phase diagram of an isomorphous system. The
sketch on the right gives a vertical section of the same. The vertical plane is represented by
/abb’a’/ in the 3D ternary diagram. Note the points of intersections of the line aa’ (normal to
the plane ABC) with the solidus and the liquidus . These are p & q. The points of intersection of
the line bb’ are m & n. The locations of these are marked on the line aa’ and bb’ as p, q, m & n
in the sketch on the right. Get the points of intersections of a set of vertical lines between
points a & b on the ternary diagram to draw the lines representing the liquidus and the solidus
in the diagram on the right. This is how a vertical section can be drawn (see fig 3).
aaa
T
a b
Vertical section
Fig: 3
L +
3D ternary
phase diagram
a’
a
b
b’
A
B
C
TmB
TmA
TmC
p
q
m
n
p
m
q
n L
a’ b’
A B
C
Y X
C
A B
X
C
Fig 2
A BY
X

NPTEL Phase II : IIT Kharagpur : Prof. R. N. Ghosh, Dept of Metallurgical and Materials Engineering | |
7
A B
C
L
L
L
Ternary eutectic
TmA
TmA
TmC TmC
TmB
TmB
Ternary eutectic:
Let us consider a ternary alloy consisting of three components A, B & C. The 3 binary alloys form
3 different eutectics. These are shown along the respective sides of the composition triangle as
shown in slide 3. The terminal solid solutions are represented as , & . Let the binary eutectic temperatures be denoted as T, T and T. The ternary eutectic represents 4 phase
equilibrium where a liquid transforms into a mixture of 3 phases. This is represented as:
L = (1)
Recall Gibbs phase rule (P + F = C + 1). The number of phases = 4, the number of components =
C = 3. Therefore the degree of freedom = F = 0. This means such equilibrium can exist only at a
fixed temperature between 4 phases having fixed compositions. Let the eutectic temperature
be represented as TE. Since each of the four phases should have fixed compositions let these be
represented as E, E and E. An isothermal section at the eutectic transformation temperature
would therefore look like the sketch given in Fig 4. Note that E represents the composition of the
liquid which could remain in equilibrium with solids E, E and E at the eutectic temperature.
Slide 3

NPTEL Phase II : IIT Kharagpur : Prof. R. N. Ghosh, Dept of Metallurgical and Materials Engineering | |
8
Imagine that the 3 binary eutectic phase diagrams shown in slide 3 are rotated by 90° about the
respective edges of the composition triangle so that the temperature axes become
perpendicular to the base. This gives a three dimensional view of the ternary diagram. It is
shown in slide 4.
A
B
C
TmA
TmB
TmC
E
E
E
EE1
E2
E3
Look at the top surface of the liquidus. It has 3 curved segments. These are TmA E1 E E3, TmB E2 E
E1 & TmC E2 E E3. Its appearance from the top would look like the sketch in slide 5. The curved
lines are the temperature contours (trace of the isothermal planes with the surface
representing the liquidus.
A B
C
E
Fig 4
Slide 4

NPTEL Phase II : IIT Kharagpur : Prof. R. N. Ghosh, Dept of Metallurgical and Materials Engineering | |
9
Projection of liquidus surface on a horizontal isotherm
P + F = C +1
L =
A B
C
E1
E3E3
T1
T1
T1 T1
T1
T1
T2
T2
T2
T2
T2T2
T3 T3
T3
T3T3
T3
T4
T4
E
The temperature contours are marked as T1, T2, T3, & T4. Note that T1 >T2 > T3 > T4. E denotes the
eutectic where 4 phases can co‐exist. The eutectic is the last liquid to solidify. The curves E1E
denotes the curve along which the liquidus surface coming down from the melting points of A &
B intersect.
3D representation is often difficult to interpret. Isothermal sections are used to represent the
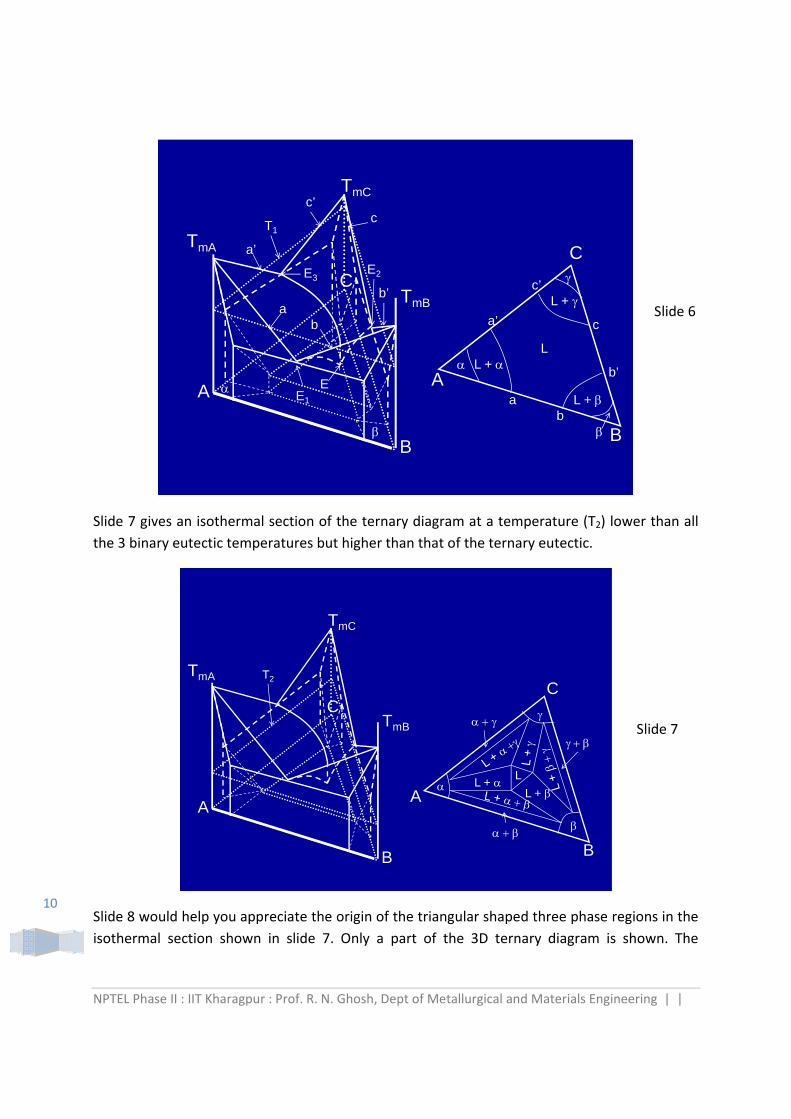
domains of expected phases as a function of composition. Slide 6 gives a typical sectional the
ternary eutectic diagram by a plane at T = T1.
Slide 5
NPTEL Phase II : IIT Kharagpur : Prof. R. N. Ghosh, Dept of Metallurgical and Materials Engineering | |
10
A
B
C
b’
A
B
C
TmA
TmB
TmC
T1
L L +
L +
L +
a
a’
a
a’b
b
b’
c
c
c’
c’
E
E2E3
E1
Slide 7 gives an isothermal section of the ternary diagram at a temperature (T2) lower than all
the 3 binary eutectic temperatures but higher than that of the ternary eutectic.
A
B
C
TmA
TmB
TmC
T2
A
B
C
L
L + L +
Slide 8 would help you appreciate the origin of the triangular shaped three phase regions in the
isothermal section shown in slide 7. Only a part of the 3D ternary diagram is shown. The
Slide 6
Slide 7

NPTEL Phase II : IIT Kharagpur : Prof. R. N. Ghosh, Dept of Metallurgical and Materials Engineering | |
11
triangle EEE is the plane denoting the ternary eutectic reaction isotherm. The point E is the
composition of the eutectic (the last liquid to solidify).
A B
C
TmA
L
L +
L +
L
E
E1
TmB
Slide 9 shows an isothermal section at a temperature lower than the ternary eutectic. Only the
alloy having a definite composition E will solidify as a mixture of three phases called ternary
eutectic. The regions away from this point may have all the three phases having different
structural features. There may be primary phase, binary eutectic and ternary eutectic. The
vertical section such as the one given in slide 10 shows how the structure would vary as move
from point a to b.
A
B
C
TmA
TmB
TmC
A
B
C
Slide 8
Slide 9

NPTEL Phase II : IIT Kharagpur : Prof. R. N. Ghosh, Dept of Metallurgical and Materials Engineering | |
12
Ternary eutectic: vertical section
A
B
C
TmA
TmB
TmC
a
b
a’
b’
L
L
LL
a’
a
b’
bu v w x
The sketch on the left in slide 10 is the 3D view of the ternary phase diagram. The sketch on the
right is the vertical section along the plane a’abb’. If the alloy composition lies between a & u it
would consist of primary and binary eutectic . If it is between u & v it would have primary , binary eutectic () and ternary eutectic. Between v & w the alloy will have binary eutectic () and ternary eutectic & so on.
U:V:W = VN:UM:MN
A B
C
U
V
W
MN
Slide 11 illustrates the method of estimating the amounts of phases in a 3 phase region. The
sketch in slide 11 shows a triangle UVW where three phases viz. U, V & W can coexist. Let the
Slide 10
Slide 11

NPTEL Phase II : IIT Kharagpur : Prof. R. N. Ghosh, Dept of Metallurgical and Materials Engineering | |
13
alloy composition be represented by the point within UVW. Draw 3 lines parallel to the three
sides of the triangle UVW but passing through the point as shown in the sketch. The amounts of
the three phases are given by U:V:W = VN:UM:MN.
Higher order phase diagrams:
Binary phase diagrams can be drawn easily in a two dimensional space. We need a three
dimensional space to represent ternary diagrams. However commercial alloys may have much
more than 3 alloy elements. It would be impossible to represent this in a physical space.
However they may be mathematically represented in a higher order space. Let us consider an
isomorphous system consisting of n alloy elements. The elements have unlimited solubility in
both solid and liquid state. Gibbs free energy is a measure of the stability of a phase. The free
energy of a solution is given by the sum total of the individual free energy of the components
and the free energy of mixing. In an isomorphous system there are only two different
constituents the solid () and the liquid (L). The free energies of the two are given by the following set of equations:
∑ ∑ (2)
∑ ∑ (3)
For simplicity let us assume that the solutions are ideal so that the activity can be taken to be equal to
the respective mole fractions . Recall the expressions used to calculate binary isomorphous
phase diagram from the thermodynamic properties of the two components. This can be extended to a
ternary isomorphous system as follows:
∆ (4)
∆ (5)
∆ (6)
1 (7)
1 (8)
To find the compositions of the liquid and solid that can coexist at a temperature we need to
know the melting point and the latent heats of fusion of the three components. Therefore at a
given temperature T the functions FA, FB, & FC can be calculated. Note that there are six
unknowns ( , , , , , ). But there are only 5 equations. To solve it we need
another equation. At a given temperature we can have at best two phases. Let the weight

NPTEL Phase II : IIT Kharagpur : Prof. R. N. Ghosh, Dept of Metallurgical and Materials Engineering | |
14
fraction of solid ( be W and that of the liquid (L) be WL. The total free energy of the system
can therefore be represented as:
(9)
1 (10)
Let us now evolve a strategy to minimize the total free energy. For a given composition of the
solid use the equation set 4‐6 to find the composition of the liquid. Once these are known the
free energies of the solid and the liquid can be estimated. Find what combination of the weight
fraction solid and weight fraction liquid the total free energy is the lowest. This is how W & WL
at every point of the composition triangle can be estimated.
The same concept can be extended to a ternary eutectic system as well. Let us find the
temperature at which eutectic reaction would take place in a ternary system consisting of three
metals A, B & C. Assume that they are miscible in all proportion in the liquid state but they are
insoluble in the solid state. Recall the expressions that were used to find the eutectic
temperature in a binary system. In a ternary system we would have an additional equation.
These are given in slide 12 along with the data used to estimate the eutectic temperature.
ln
ln
ln
l mA mAA A
l mB mBB B
l mC mCC C
H TG RT N
TH T
G RT NT
H TG RT N
T
Ternary eutectic: Estimation of eutectic temperature
TmA 1200
HmA 10000
TmB 1000
HmB 10000
TmC 800
HmC 10000
T NA NB NC511.3015 0.257968 0.315455 0.426577
The solids are assumed to be immiscible. Therefore the partial molar free energies of the
components are equal to zero ( ̅ ̅ ̅ 0 . We have 4 unknowns. These are the
eutectic temperature and the composition of the eutectic liquid ( , , ). Note that we have
Slide 12

NPTEL Phase II : IIT Kharagpur : Prof. R. N. Ghosh, Dept of Metallurgical and Materials Engineering | |
15
another equation that the atom fraction A, B & C in the liquid is equal to 1. The table in slide 12
gives a set of values for the melting points and latent heats of fusion of the three metals. This
can be solved using a simple iterative scheme using spreadsheet. If the melting points and the
latent heats of fusion of the three components are identical the eutectic composition will be
given by NA = NB = NC = 0.333.
The method described above is generic. It can be extended to higher order systems. The
approach is similar even in the cases where the solutions do not follow Raoult’s law. The
appropriate solution model or data on activity coefficients are to be included in the expressions
defining the equilibrium between respective phases. In short more numbers of thermodynamic
parameters are to be taken into account. Several extensive computer databases on a wide
range of materials are now available. They are linked with solvers and post processors which
can generate and display different forms of phase stability diagrams on binary, ternary or
higher order system. Two of the most widely used packages for generating phase diagrams are
Thermocalc & Factsage. These are equipped with user friendly computer interfaces with
adequate help levels. They are being widely used to evaluate multi‐component phase diagrams.
The packages may differ in details. However all of them are based on the concept of
minimization of Gibbs free energy.
Summary:
In this module we have learnt ternary phase diagrams. This gives a geometrical display of the
domains of the stability of various phases as a function of temperature and composition. An
equilateral triangle is used to represent the composition of the alloy. The transformation
temperatures are displayed on the lines perpendicular to the point representing the alloy. We
looked at the basic features of a ternary isomorphous and a ternary eutectic system. 3D
representation is often difficult to use. Isothermal & vertical sections are more convenient to
use. The former gives a display of the domains where different phases are to be found at a
given temperature. The latter gives the transformation temperatures for a set of alloys along a
line on the composition triangle. A number of such diagrams were presented. The problem
associated with display of phase diagrams of higher order systems was discussed. It can only be
represented mathematically in a higher order space. How to assess the stability of various
phases in such a system has been discussed.
Exercise:
1. Sketch a composition triangle to represent composition of a ternary alloy and locate the
alloys having following compositions (a) 20A 40B 40C (b) 60A20B20C
NPTEL Phase II : IIT Kharagpur : Prof. R. N. Ghosh, Dept of Metallurgical and Materials Engineering | |
16
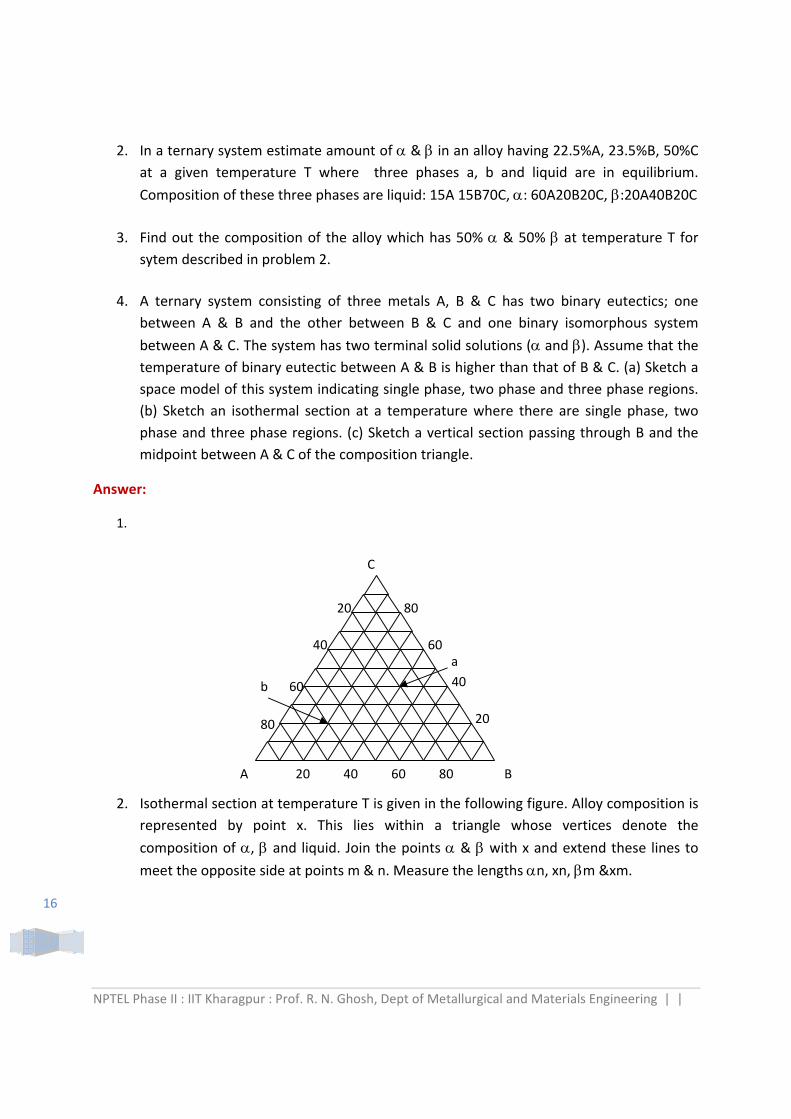
2. In a ternary system estimate amount of & in an alloy having 22.5%A, 23.5%B, 50%C at a given temperature T where three phases a, b and liquid are in equilibrium.
Composition of these three phases are liquid: 15A 15B70C, : 60A20B20C,:20A40B20C
3. Find out the composition of the alloy which has 50% & 50% at temperature T for
sytem described in problem 2.
4. A ternary system consisting of three metals A, B & C has two binary eutectics; one
between A & B and the other between B & C and one binary isomorphous system
between A & C. The system has two terminal solid solutions (and ). Assume that the
temperature of binary eutectic between A & B is higher than that of B & C. (a) Sketch a
space model of this system indicating single phase, two phase and three phase regions.
(b) Sketch an isothermal section at a temperature where there are single phase, two
phase and three phase regions. (c) Sketch a vertical section passing through B and the
midpoint between A & C of the composition triangle.
Answer:
1.
2. Isothermal section at temperature T is given in the following figure. Alloy composition is
represented by point x. This lies within a triangle whose vertices denote the
composition of , and liquid. Join the points & with x and extend these lines to meet the opposite side at points m & n. Measure the lengths n, xn, m &xm.
A B
C
20 40 60 80
20
40
60
8020
40
60
80
b
a

NPTEL Phase II : IIT Kharagpur : Prof. R. N. Ghosh, Dept of Metallurgical and Materials Engineering | |
17
3. Alloy having 50% is the mid point of tie line of the above diagram. In this
case it is 40%A 30%B 30%C
A B
C
20 40 60 80
20
40
60
80 20
40
60
80
+L
L
x
m n % 100
% 100

NPTEL Phase II : IIT Kharagpur : Prof. R. N. Ghosh, Dept of Metallurgical and Materials Engineering | |
18
4. Sketch of the 3‐D model of this system:
(a)
(b) (c)
L
B
L LL
A B
C
L
L+
+L
L +
a
A B
C
D E
F
G
P
Q
o m n
Note: line joining eutectic point P with Q
is above the surface joining DEFG. There
is a surface joining lines DE with FG
passing through line PQ. Triangle mno is a
section of the region between these two
surfaces.