ChemInform Abstract: The 1300 °C Isothermal Section in the Nb-Sn-C Ternary Phase Diagram
7
The 13001C Isothermal Section in the Ti–In–C Ternary Phase Diagram A. Ganguly and M. W. Barsoum w Department of Materials Science and Engineering, Drexel University, Philadelphia, Pennsylvania 19104 J. Schuster Department of Physical Chemistry, University of Vienna, Vienna, Austria In this paper we map out the 13001C isothermal section in the Ti–In–C ternary system. Two ternary compounds exist: Ti 2 InC a and Ti 3 InC d . At 13001C TiC x is in equilibrium with all phases, Ti 3 InC d is in equilibrium with all the phases except C, and Ti 2 InC is in equilibrium with all phases except Ti and C. The range of d in Ti 3 InC d varies from 0.95 to 0.8. A correlation was found between d and the lattice parameters of this phase. The maximum solubilities of In and C in Ti are 14 and 4 at.%, re- spectively. Similarly, a in Ti 2 InC a varies from 0.85 to 1. The dissolution of B470.3 at.% In in TiC x reduces the C concen- tration to 24 at.%. In the In-rich corner, a liquid region exists. I. Introduction O VER the past several years it has been shown that the ternary carbides and nitrides, the so-called MAX phases, with the general chemistry M n11 AX n —where M is an early transition metal, A is an A group element and X is C- and/or N-constitute a new class of solids best described as polycrystalline nanolam- inates. 1–6 The M n11 AX n phases are layered hexagonal (space group D 4 6h -P6 3 /mmc) with two formula units per unit cell. Among those phases is Ti 2 InC, which was first reported upon by Jeitschko et al. 7 and recently synthesized in bulk and char- acterized. 8 The MAX phases are of considerable interest because some of them combine many of the best attributes of metal and ceramics. They are all good conductors of heat and electricity, elastically stiff and yet most readily machinable. Some, such as Ti 2 AlC and Ti 3 SiC 2 , are lightweight and oxidation- and creep-resistant. More germane to this work is our previous paper 8 where we have shown Ti 2 InC to have a room temperature resistivity of 0.2 mO m, a thermal expansion coefficient of 9.5 10 6 K 1 , and a room temperature thermal conductivity of 27 W/mK. As far as we are aware, the Ti–In–C ternary phase diagram does not exist. To date, the ternary phases known to exist, how- ever, are Ti 2 InC 7,8 and Ti 3 InC d . 9 The latter has a perovskite structure 9 and will henceforth be denoted as the P-phase. Until quite recently, the Ti–In binary had not been charted; it now has been published. 10 At 13001C the only stable phase is Ti 3 In. It is also instructive to review the closely related Ti–Sn–C 11 and Nb–Sn–C 12 ternary phase diagrams. In the Nb–Sn–C sys- tem, the only ternary phase that exists at 13001C is Nb 2 SnC, which is in equilibrium with all phases except Nb, Nb 2 C, or C. 12 Nb 2 SnC is not a line compound, but exists over a range of sto- ichiometries. At 13001C the only stable phase in the Nb–Sn bi- nary system is Nb 3 Sn, with a stability range from 18 to 25 at.% Sn. 13 The solubility of Sn in Nb at that temperature is B3 at.%. Similarly the only stable ternary at 12001C in the Ti–Sn–C is Ti 2 SnC, which is more or less a line compound with the com- position Ti 1.99 Sn 1.02 C. 11 The purpose of this paper is to chart out the 13001C isother- mal section of the Ti–In–C system. The emphasis is on the solid phases, and consequently, the details of the diagram in the vi- cinity of In-rich corner have not been mapped out. II. Experimental Details Table I lists the compositions explored. The starting materials, all acquired from Alfa-Aesar (Karlsruhe, Germany and Ward Hill, MA) were In (325 mesh, 99.99%), Ti (325 mesh, 99%), and graphite (325 mesh, 99.9995%) powders. The purities, based on metal basis alone, are those specified by the manufac- turer. Powder blends of the various compositions were weighed and milled using small alumina balls for 20–30 min. Roughly 10–12 g of the ball-milled powders were poured in borosilicate glass tubes, well tapped, and sealed under vacuum. The sealed samples were placed in a box furnace in air, heated at 101C/min to 5501C—held there for 2 h, and then heated again at a rate of 51C/min to 6501C and held there for 9 h. The collapsed tubes were in turn placed in a hot isostatic press or HIP and heated at 101C/min to 6501C at which time the rate of heating was reduced to 21C/min up to 7501C. The pressure was then applied (B50 MPa) and the heating resumed at 101C/min up to 13001C. The pressure at 13001C was B100 MPa. The samples were held at 13001C for 6 h (with the exception of sample I, which was held for 12 h) before cooling. These times were the longest the HIP could be run with technical supervision (i.e., during working hours). The temperature chosen for this work was a compromise between maximizing the reaction kinetics and staying below the decomposition temperatures of Ti 2 InC a and the P-phase. After the runs, the glass was mechanically removed and the samples were mounted and polished down to 1 mm diamond for microstructural evaluation. The chemical compositions were measured in a field emission scanning electron microscope (FESEM; XL-30, FEI-Philips, Hillsboro, OR) equipped with an energy dispersive spectroscope (EDS; Edax Inc., Mahwah, NJ). Measurements were carried out using an accelerating volt- age of 12 kV. The C content was measured using a JEOL mi- croprobe (JXA-733, JEOL USA Inc., Peabody, MA) equipped with a wavelength dispersive spectroscope (WDS), optimized for high accuracy in quantitative analysis. The accelerating voltage and probe currents were 15 kV and 25 nA, respectively. The accurate measurement of C concentrations in binary transition metal carbides is nontrivial. The problem becomes more severe for ternary carbides. Calibration using a known standard is imperative in the case of microprobe analysis. Hence, before examining compositions I, G, and L, a predom- inantly single-phase Ti 2 InC sample whose composition was pre- viously measured to be 47.6 at.% Ti, 24.3 at.% In, and 28 at.% C was used as a standard. When the Ti:In:C atomic ratios were remeasured—on a different instrument—for the same sample, J ournal J. Am. Ceram. Soc., 88 [5] 1290–1296 (2005) DOI: 10.1111/j.1551-2916.2005.00240.x 1290 B. Derby—contributing editor Partially funded by the Division of Materials Research (# 0072067) of the National Science Foundation. w Author to whom correspondence should be addressed. e-mail: [email protected] Manuscript No. 10926. Received March 18, 2004; approved October 25, 2004.
-
Upload
independent -
Category
Documents
-
view
1 -
download
0
Transcript of ChemInform Abstract: The 1300 °C Isothermal Section in the Nb-Sn-C Ternary Phase Diagram

The 13001C Isothermal Section in the Ti–In–C Ternary Phase Diagram
A. Ganguly and M. W. Barsoumw
Department of Materials Science and Engineering, Drexel University, Philadelphia, Pennsylvania 19104
J. Schuster
Department of Physical Chemistry, University of Vienna, Vienna, Austria
In this paper we map out the 13001C isothermal section in theTi–In–C ternary system. Two ternary compounds exist: Ti2InCaand Ti3InCd. At 13001C TiCx is in equilibrium with all phases,Ti3InCd is in equilibrium with all the phases except C, andTi2InC is in equilibrium with all phases except Ti and C. Therange of d in Ti3InCd varies from 0.95 to 0.8. A correlation wasfound between d and the lattice parameters of this phase. Themaximum solubilities of In and C in Ti are 14 and 4 at.%, re-spectively. Similarly, a in Ti2InCa varies from � 0.85 to 1. Thedissolution of B470.3 at.% In in TiCx reduces the C concen-tration to � 24 at.%. In the In-rich corner, a liquid regionexists.
I. Introduction
OVER the past several years it has been shown that the ternarycarbides and nitrides, the so-called MAX phases, with the
general chemistry Mn11AXn—where M is an early transitionmetal, A is an A group element and X is C- and/or N-constitutea new class of solids best described as polycrystalline nanolam-inates.1–6 The Mn11AXn phases are layered hexagonal (spacegroup D4
6h-P63/mmc) with two formula units per unit cell.Among those phases is Ti2InC, which was first reported uponby Jeitschko et al.7 and recently synthesized in bulk and char-acterized.8
TheMAX phases are of considerable interest because some ofthem combine many of the best attributes of metal and ceramics.They are all good conductors of heat and electricity, elasticallystiff and yet most readily machinable. Some, such as Ti2AlCand Ti3SiC2, are lightweight and oxidation- and creep-resistant.More germane to this work is our previous paper8 where wehave shown Ti2InC to have a room temperature resistivity of0.2 mO �m, a thermal expansion coefficient of 9.5� 10�6 K�1,and a room temperature thermal conductivity of � 27 W/mK.
As far as we are aware, the Ti–In–C ternary phase diagramdoes not exist. To date, the ternary phases known to exist, how-ever, are Ti2InC
7,8 and Ti3InCd.9 The latter has a perovskite
structure9 and will henceforth be denoted as the P-phase. Untilquite recently, the Ti–In binary had not been charted; it now hasbeen published.10 At 13001C the only stable phase is Ti3In.
It is also instructive to review the closely related Ti–Sn–C11
and Nb–Sn–C12 ternary phase diagrams. In the Nb–Sn–C sys-tem, the only ternary phase that exists at 13001C is Nb2SnC,which is in equilibrium with all phases except Nb, Nb2C, or C.
12
Nb2SnC is not a line compound, but exists over a range of sto-ichiometries. At 13001C the only stable phase in the Nb–Sn bi-nary system is Nb3Sn, with a stability range from 18 to 25 at.%
Sn.13 The solubility of Sn in Nb at that temperature isB3 at.%.Similarly the only stable ternary at 12001C in the Ti–Sn–C isTi2SnC, which is more or less a line compound with the com-position Ti1.99Sn1.02C.
11
The purpose of this paper is to chart out the 13001C isother-mal section of the Ti–In–C system. The emphasis is on the solidphases, and consequently, the details of the diagram in the vi-cinity of In-rich corner have not been mapped out.
II. Experimental Details
Table I lists the compositions explored. The starting materials,all acquired from Alfa-Aesar (Karlsruhe, Germany and WardHill, MA) were In (�325 mesh, 99.99%), Ti (�325 mesh, 99%),and graphite (�325 mesh, 99.9995%) powders. The purities,based on metal basis alone, are those specified by the manufac-turer. Powder blends of the various compositions were weighedand milled using small alumina balls for 20–30 min. Roughly10–12 g of the ball-milled powders were poured in borosilicateglass tubes, well tapped, and sealed under vacuum. The sealedsamples were placed in a box furnace in air, heated at 101C/minto 5501C—held there for 2 h, and then heated again at a rate of51C/min to 6501C and held there for 9 h. The collapsed tubeswere in turn placed in a hot isostatic press or HIP and heated at101C/min to 6501C at which time the rate of heating was reducedto 21C/min up to 7501C. The pressure was then applied (B50MPa) and the heating resumed at 101C/min up to 13001C. Thepressure at 13001C was B100 MPa. The samples were held at13001C for 6 h (with the exception of sample I, which was heldfor 12 h) before cooling. These times were the longest the HIPcould be run with technical supervision (i.e., during workinghours). The temperature chosen for this work was a compromisebetween maximizing the reaction kinetics and staying below thedecomposition temperatures of Ti2InCa and the P-phase.
After the runs, the glass was mechanically removed and thesamples were mounted and polished down to 1 mm diamond formicrostructural evaluation. The chemical compositions weremeasured in a field emission scanning electron microscope(FESEM; XL-30, FEI-Philips, Hillsboro, OR) equipped withan energy dispersive spectroscope (EDS; Edax Inc., Mahwah,NJ). Measurements were carried out using an accelerating volt-age of 12 kV. The C content was measured using a JEOL mi-croprobe (JXA-733, JEOL USA Inc., Peabody, MA) equippedwith a wavelength dispersive spectroscope (WDS), optimized forhigh accuracy in quantitative analysis. The accelerating voltageand probe currents were 15 kV and 25 nA, respectively.
The accurate measurement of C concentrations in binarytransition metal carbides is nontrivial. The problem becomesmore severe for ternary carbides. Calibration using a knownstandard is imperative in the case of microprobe analysis.Hence, before examining compositions I, G, and L, a predom-inantly single-phase Ti2InC sample whose composition was pre-viously measured to be 47.6 at.% Ti, 24.3 at.% In, and 28 at.%C was used as a standard. When the Ti:In:C atomic ratios wereremeasured—on a different instrument—for the same sample,
JournalJ. Am. Ceram. Soc., 88 [5] 1290–1296 (2005)
DOI: 10.1111/j.1551-2916.2005.00240.x
1290
B. Derby—contributing editor
Partially funded by the Division of Materials Research (# 0072067) of the NationalScience Foundation.
wAuthor to whom correspondence should be addressed. e-mail: [email protected]
Manuscript No. 10926. Received March 18, 2004; approved October 25, 2004.
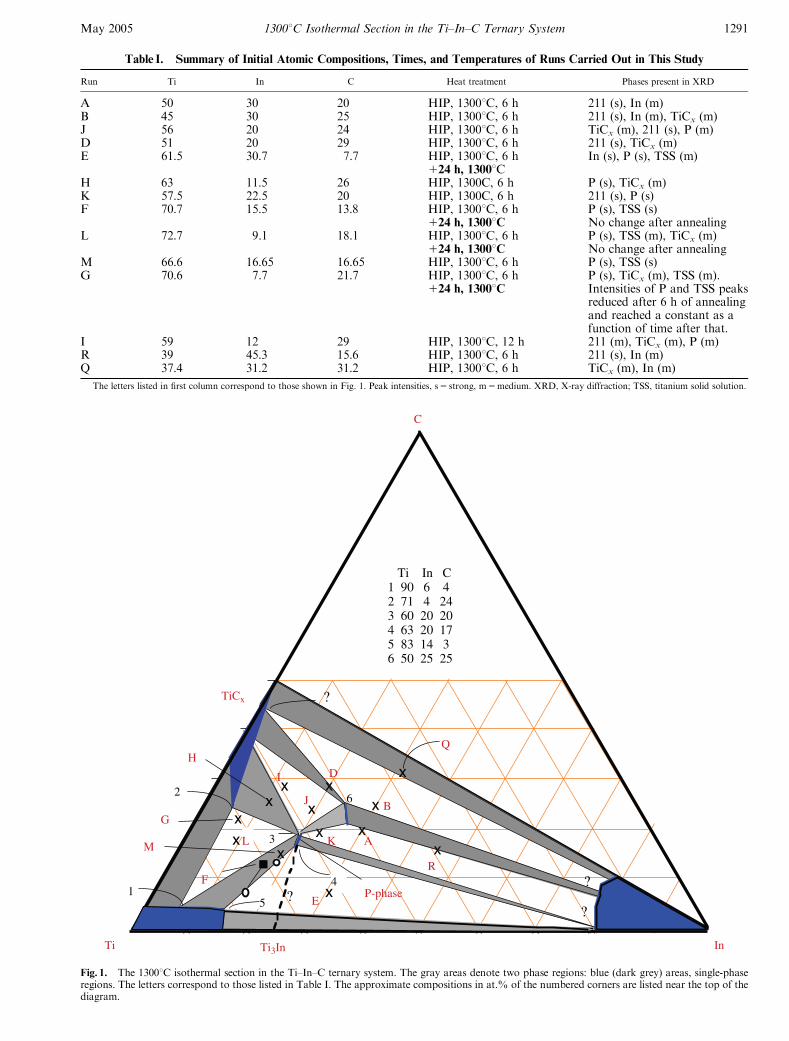
Table I. Summary of Initial Atomic Compositions, Times, and Temperatures of Runs Carried Out in This Study
Run Ti In C Heat treatment Phases present in XRD
A 50 30 20 HIP, 13001C, 6 h 211 (s), In (m)B 45 30 25 HIP, 13001C, 6 h 211 (s), In (m), TiCx (m)J 56 20 24 HIP, 13001C, 6 h TiCx (m), 211 (s), P (m)D 51 20 29 HIP, 13001C, 6 h 211 (s), TiCx (m)E 61.5 30.7 7.7 HIP, 13001C, 6 h In (s), P (s), TSS (m)
124 h, 13001CH 63 11.5 26 HIP, 1300C, 6 h P (s), TiCx (m)K 57.5 22.5 20 HIP, 1300C, 6 h 211 (s), P (s)F 70.7 15.5 13.8 HIP, 13001C, 6 h P (s), TSS (s)
124 h, 13001C No change after annealingL 72.7 9.1 18.1 HIP, 13001C, 6 h P (s), TSS (m), TiCx (m)
124 h, 13001C No change after annealingM 66.6 16.65 16.65 HIP, 13001C, 6 h P (s), TSS (s)G 70.6 7.7 21.7 HIP, 13001C, 6 h P (s), TiCx (m), TSS (m).
124 h, 13001C Intensities of P and TSS peaksreduced after 6 h of annealingand reached a constant as afunction of time after that.
I 59 12 29 HIP, 13001C, 12 h 211 (m), TiCx (m), P (m)R 39 45.3 15.6 HIP, 13001C, 6 h 211 (s), In (m)Q 37.4 31.2 31.2 HIP, 13001C, 6 h TiCx (m), In (m)
The letters listed in first column correspond to those shown in Fig. 1. Peak intensities, s5 strong, m5medium. XRD, X-ray diffraction; TSS, titanium solid solution.
E5
L
x
x
x
Ti3In
x
R
Q
A
BJ
H
I D
G
TiCx
F
M
Ti
x
P-phase
xx
xx
xx
x
?
?1
Ti In C1 90 6 42 71 4 243 60 20 204 63 20 175 83 14 36 50 25 25
2
3
4x
K
6
In
C
?
?
Fig. 1. The 13001C isothermal section in the Ti–In–C ternary system. The gray areas denote two phase regions: blue (dark grey) areas, single-phaseregions. The letters correspond to those listed in Table I. The approximate compositions in at.% of the numbered corners are listed near the top of thediagram.
May 2005 13001C Isothermal Section in the Ti–In–C Ternary System 1291
the results were B44.7:22.2:33.1. Thus, the following correctionfactors were used: for Ti –47.6/44.7 B1.1; for In –24.3/22.2B1.1. The situation for C was slightly more complicated; basedon the work in this paper, we believe that the value of 28 at.% Creported previously was too high. The correct value should be 25vol%. Hence, the correction factor for C was B25/33 � 0.76 inall other compositions. The compositions reported in Table IIare the corrected values.
Phase identifications were performed on polished cross-sec-tions using an X-ray diffractometer (Siemens D 500, Madison,WI). X-ray diffraction (XRD) scans were made with CuKa1 ra-diation (40 kV and 30 mA) at a rate of 61 (2y)/min using a stepof 0.051. To measure the lattice parameters, whenever possible,powdered samples were obtained by drilling the core of thesamples. For the samples for which the majority phase was notthe machinable 211 phase, powders were made by crushing witha pestle and mortar. Si powder was added as an internal stand-ard. The step size and time were 0.0081 and 1 s, respectively. Thea- and c-lattice parameters for Ti2InC were calculated from thepositions of the (110) and (0, 0, 12) reflections, respectively. Thelattice parameters of the P-phase were calculated from the po-sitions of the peaks within a 2y range of 201–801.
III. Results and Discussion
A summary of the runs carried out in this work and the resultingphases are listed in Table I. For the most part, the samples werefully dense. Runs J and I were comparable in composition, butthe former was held at temperature for 6 h, while the latter washeld for 12 h. The resulting XRD patterns were similar, indicat-ing that in general 6 h were sufficient to obtain the phases presentat any given composition. Despite these observations, composi-tions E, L, G, and F (Table I) were further annealed in an Aratmosphere at 13001C for 24 h in a tube furnace to ensure equi-librium and obtain accurate values for the lattice parameters.
The EDS and microprobe results of select phases in somecrucial compositions are listed in Table II. As discussed in Ex-perimental Details, the microprobe results had to be corrected.Based on these results and those summarized in Table I, wemapped out the 13001C equilibrium isothermal section (Fig. 1).The letters in the figure correspond to the compositions listed inTable I. Light gray areas denote two phase regions, blue areas orlines, single-phase regions. Based on this figure, we concludethat TiCx is in equilibrium with all phases; the P-phase is inequilibrium with all the phases except C, and Ti2InCa is in equi-
Table II. Summary of EDS and l-Probe Results on Selected Runs
Run
TSS Ti3InCd (P-phase) TiCx
EDS Ti:In Microrpobew Ti:In:C EDS Ti:In Microprobew Ti:In:C EDS Ti:In Microprobew Ti:In:C
I NA NA 6071:20.570.4:19.570.8 6070.4:40:0.4
F 86.471:1371 82.770.6:13.870.2:3.670.4 7671.3:2471.3 6371.0:20.370.2:16.770.7 N/A N/A
L 93.570.3:6.570.3 89.970.3:6.470.03:3.770.3 7671:2471 6071.0:19.770.4:19.871.3 9570.8:570.8
G 93.670.9:6.470.8 90.270.8:5.170.1:4.770.8 7870.1:22.170.1 61.270.6:18.870.6:20.070.4 9572.3:4.572.3 7171:4.471:24.570.3wCorrected (see Experimental Details). TSS, titanium solid solution; EDS, energy dispersive spectroscope; NA, not applicable.
100 µm
Ti2InC
Ti0.6C0.4
a
P
100 µm
Ti0.6C0.4P
100 µm
P
Ti0.72In0.04C0.24
TSS
100 µm
P
TSS
c d
b
Fig. 2. Backscattered micrograph of runs (a) I, (b) H, where dark gray areas denote Ti0.6C0.4 while the matrix is the P phase. (c) L, and (d) F.
1292 Journal of the American Ceramic Society—Ganguly et al. Vol. 88, No. 5
librium with all phases except Ti and C. In the In-rich corner, aliquid region exists.
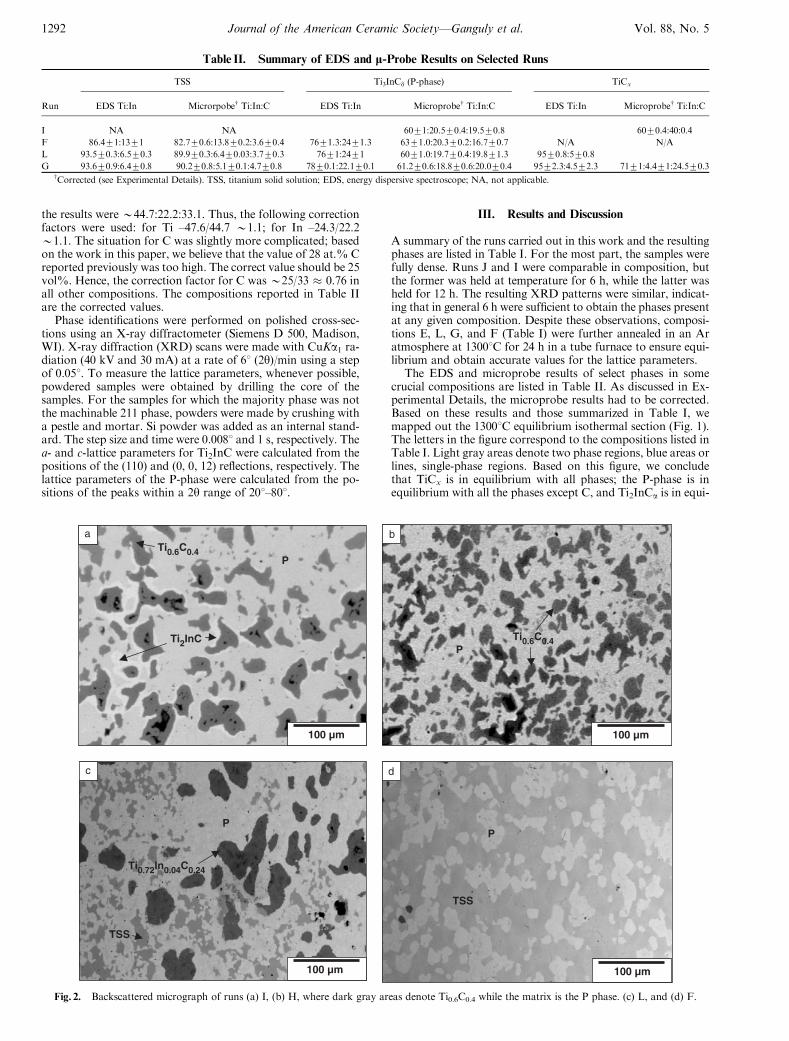
Backscattered FESEM images of samples made in runs I, H,L, and F are shown in Figs. 2(a)–(d), respectively. The XRDspectra of runs E, F, L, and I are shown in Figs. 3(a)–(d), re-spectively. Combining the XRD results, FESEM micrographs,EDS and microprobe results (Table II), we conclude that:
(a) Backscattered FESEM micrograph of run I (Fig. 2(a))clearly shows the presence of the P-phase, along with Ti2InCaand Ti0.6C0.4, establishing that triangle in the ternary diagram.The XRD patterns obtained from this run (Fig. 3(d)) confirmthe FESEM results.
(b) Figure 2(b) shows the presence of only two phases in runH confirmed by XRD (not shown). The same is true of runs A,D, F, and M.
(c) Run L (Fig. 2(c)) confirmed that TiCx containing someIn, the P-phase, and a titanium solid solution (TSS) are in equi-librium. The microstructure of the run G (not shown) was foundto be very similar to that of L. The In content of the Ti phasein run L was 6.4 at.%, that in G � 5.1 at.% for an average of� 6 at.%. Similarly, the C content varied from 3.7 to 4.7, for anaverage of � 4 at.%. TiCx in equilibrium with the TSS and Pcontains B4 at.% In, for a chemistry of � Ti0.71In0.04C0.25.When in equilibrium with the P-phase and Ti2InCa, its chemis-
try is Ti0.6C0.4. We did not measure the C content of this phasewhen in equilibrium with 211 and/or In, but its chemistry can beestimated from Fig. 1 based on the absence of 211 in run Q.
(d) Backscattered FESEM micrographs of sample F(Fig. 2(d)) showed clear evidence of two phases: a light phaseidentified as the P-phase, and a darker phase with a Ti:In atomicratio of � 6:1. Image analysis of this microstructure indicatedthat the molar ratio—as estimated from the volume fraction—ofthe TSS phase was � 3 times that of the P-phase. Using thisinformation, together with the composition of the P-phase mea-sured by a microprobe (Table II) implied that the location of Frun could not be that of the nominal composition (denoted by asolid square in Fig. 1), but rather slightly lower, where the opencircle is located. In other words, it is impossible to reconcile thevolume fractions of the two phases shown in Fig. 2(d) with thecompositions at the ends of the tie lines passing through it. Asimilar argument can be made vis-a-vis the M run. Other evi-dence for the validity of this approach is given below. Note thatany unreacted C—which in general was a problem—would re-sult in the aforementioned shift.
(1) Ti3InCd (P-Phase)
The Ti to In ratio in the P-phase was roughly constant and equalto � 3:1. Its C content, however, varied from 16.770.7 (run F)
30 40 50 60 70 80
Two Theta
Inte
nsit
y (A
rb. U
nits
)
(a)
(b)
(c)
(d)P
P
P
P P
P
P P
P
P
Si, used as internal standard.InTi2InC
Ti solid solution TiCx
Fig. 3. X-ray diffraction spectra of runs (a) E, (b) F, (c) L, and (d) I.
May 2005 13001C Isothermal Section in the Ti–In–C Ternary System 1293

to 20 at.% (runs I, J). According to Fig. 1, the lattice parametersof the P-phase calculated from runs I and J should be identicaland different from those of G and L, which in turn should bedifferent from those of F, M, and E. In other words, this phasecan best be represented by Ti3InCd, where d varies from 0.8 to0.95. These conclusions are in total accord with our lattice pa-rameter measurements of the P-phase in the various runs(Fig. 4(a)). A least-squares fit of the results shown in the topright in Fig. 4(a) yields:
aP ðAÞ ¼ 4:13þ 0:0053x; R > 0:99 (1)
where x is the C content in at.%. The composition of theP-phase in equilibrium with Ti2InCa and In was not measured.Instead we measured its lattice parameter (4.23 A) and usedEq. (1) to estimate its C content at � 18.9 at.%.
As noted above, Jeitschko et al.9 discovered Ti3InCd. In theiroriginal paper they did not measure the C content of their phase,but noted that it existed over a range of C concentrations. In theXRD card for the same phase, however, the d for the latticeparameter of 4.199 A is listed as 0.5.14 When those values areplotted in Fig. 4(a), they are in general agreement with our re-sults. Including this value in the least-squares fit yields (dashedline in Fig. 4(a)) the following relationship:
aPðAÞ ¼ 4:142þ 0:00475x; R > 0:99 (2)
At 0.8 the lowest values of d measured herein is significantlygreater than the 0.5 value—whose source is suspect-reportedpreviously. The reason for this discrepancy is not clear at thistime, but the fact that Jeitschko et al. worked at 7501C maypartially explain it. Note that the fact that the lattice parametersof the P-phase determined from E are identical with those of Fand M is incompatible with a P-phase whose composition ex-tends to d5 0.5. Table III summarizes the XRD results for theP-phase as determined from run F.
(2) TiCx
When the lattice parameters of this phase are plotted (Fig. 4(b))versus its C content and the results are compared with those ofthe binary TiCx,
15 the agreement is quite good over the entirerange (Fig. 4(b)). Note the compositions of runs D and B werenot measured, but must fall between 40 and 50 at.% C. A least-squares fit of all the results yields:
aTiCðAÞ ¼ 4:083þ 0:01x� 10�4x2; R2 > 0:98 (3)
Based on this fit it is fair to conclude that the small solubility ofIn in TiCx does not greatly affect the general trend in x with Ccontent.
As noted above, the chemistry of the TiCx phase in equilib-rium with P and TSS is � Ti0.71In0.04C0.25. This C content isone of the lowest ever reported for TiCx. Kerans et al.16 showedthat small additions of Sn resulted in a lowering of the C contentin TiCx to � 20 at.%. They also showed that in compacts con-taining 40 at.% C or greater there was no solubility of Sn inTiCx. This result applies herein as well; at 40 at.% C, the TiCx
phase contained no In. A summary of the XRD results of thisC-poor, In-containing TiC is shown in Table IV.
(3) Ti2InCa
The lattice parameters of Ti2InCa in runs B and J are almostidentical and sufficiently different from those of runs A and K tosupport the claim that the range of stoichiometry of this phase issubstantial (Table V). In a recent paper,8 the a and c lattice pa-rameters of a Ti1.96InC1.15 composition were reported to be3.134 and 14.077 A, respectively. The latter is identical to thelattice parameters measured herein for runs B and J (Table V).Furthermore, since composition B contains TiCx, the maximumconcentration of C in Ti2InC would appear to be � 25 at.%.Hence, despite careful calibration in the previous8 and the cur-
rent work, it is now apparent that the presence of Ti, In, and Cskews the C concentrations to higher values of C (see Experi-mental Details). Note that the lattice parameters of the sampleused as our standard8 and those of run B are identical (Table V),which is not too surprising since both contained unreacted Inas a second phase. Based on this and the previous work, we
Carbon content (at. %)
a-la
ttice
par
amet
er (
Å)
504540353025204.26
4.27
4.28
4.29
4.30
4.31
4.32
4.33
4.34
(c)
(b)
(a)
L
G
TiCx
I, J
B
D
This work
TiCx binary. Ref. 15
?
2.94
2.96
2.98
3.00
4.68
4.70
4.72
4.74
0 2 4 6 8 10 12 14
Indium content (at. %)
a-la
ttice
par
amet
er (
Å)
c-la
tt. p
aram
eter
(Å
)
L, G
L, G
Pure Ti
Pure Ti
F
Ti-solid solution
F
a-la
ttice
par
amet
er (
Å)
Carbon content (at. %)
4.19
4.2
4.21
4.22
4.23
4.24
10 12 14 16 18 20 22
a= 4.1418 + 0.00475 x
Ref. 9
Ti3InCδ
F, M, E
I, J
L,G
a = 4.13+ 0.00537 x
R > 0.99
R2 > 0.99
Fig. 4. Plot of lattice parameters of: (a) the P-phase for the runs E, F, I,J, L, and M, (b) TiCx for the runs J, I, and G as a function of C content(also included is the work of Rudy15), and (c) TSS as a function of Incontent for the runs L, F, and G and compared with those of a-Ti.
1294 Journal of the American Ceramic Society—Ganguly et al. Vol. 88, No. 5
estimate the highest C content in Ti2InC to be 25 at.%, acomposition characterized by a c-lattice parameter of 14.07770.001 A.
The Ti:In ratios in all Ti2InCa phases identified in the SEMand determined by EDS were 1.86 for runs A and K and � 1.97for runs J and D. The range of C compositions over which thisphase exists, however, is relatively large. The lack of the P-phasein run A implies the lower limit of a � 0.85 or 22 at.% C.
Here again, for reasons that are not entirely clear but prob-ably related to the lower temperatures used by Jeitschko et al.,7
their c-lattice parameters are significantly lower than thosemeasured here (Table V). Interestingly, the a-lattice parameteris a much weaker function of composition (Table V). Thesecomments notwithstanding, it is hereby acknowledged thatmore work is required to fully flesh out the range of stoichiome-tries over which Ti2InCa exists.
(4) TSS
The maximum solubility of In and C in Ti was measured to be� 14 at.% In and � 3 at.%, respectively (Table II). When thelattice parameters of the TSS are plotted as a function of Incontent (Fig. 4c) and compared with those of a-Ti, it is clear thatthe c-parameter increases before ultimately decreasing. The ef-fect of In content on the a-lattice parameter is similar, but theeffect is smaller. Table VI summarizes the XRD results for theIn-saturated Ti as determined from run F.
(5) Ti3In
The presence of TSS peaks in the XRD spectra of E togetherwith the absence of Ti3In peaks suggests that at 13001C, the
Ti3In phase is not stable. The presence of In, the P-phase, andTSS, with a Ti:In ratio well below 3:1, in composition E wasconfirmed by SEM as well. However, recently Gulay and Schus-ter10 reported that Ti3In was a stable phase at 13001C. The rea-son for this discrepancy is not clear at this time and more workis needed to understand it. The dashed line joining the P- andTi3In phases (Fig. 1) is drawn to reflect the ambiguity.
(6) In-Rich Corner
Backscattered FESEM micrographs of composition R suggest-ed a liquid phase formed at 13001C (Fig. 5). To confirm thisnotion, part of this sample was placed in a dilatometer andheated at 101C/min to 10001C. At � 9201C a sudden drop inthe expansion was observed. This drop was assumed to resultfrom the formation of a liquid phase, a conclusion bolstered bythe fact that XRD of the sample after the dilatometer runshowed no diffraction peaks. Note the very fine scale of themicrostructure shown in Fig. 5.
Not surprisingly, the isothermal sections in the Ti–Sn–C,11
Nb–Sn–C,12 and the system studied herein are comparable. Themajor differences are (i) the presence of two Nb–C binary phasesas compared with one in the other two, (ii) the presence of twoternary phases in the Ti–In diagram as compared with one eachin the other two systems, and (iii) the existence of two ternaryphases over homogeneity ranges as compared with one inNb–Sn and none in Ti–Sn. However, in all the three cases, the211 phase is not in equilibrium with the transition metal. Thislatter observation is true for all the MAX phases for which theternary diagrams have been determined to date bar none.
IV. Summary and Conclusions
In this paper we chart out the Ti–In–C ternary phase diagram at13001C. We confirm that in this system there are two ternarycompounds: Ti3InCd and Ti2InCa. The Ti3InCd phase is in equi-librium with all phases except C and exists over the range of dfrom 0.95 to 0.80. The Ti2InCa is in equilibrium with all phases
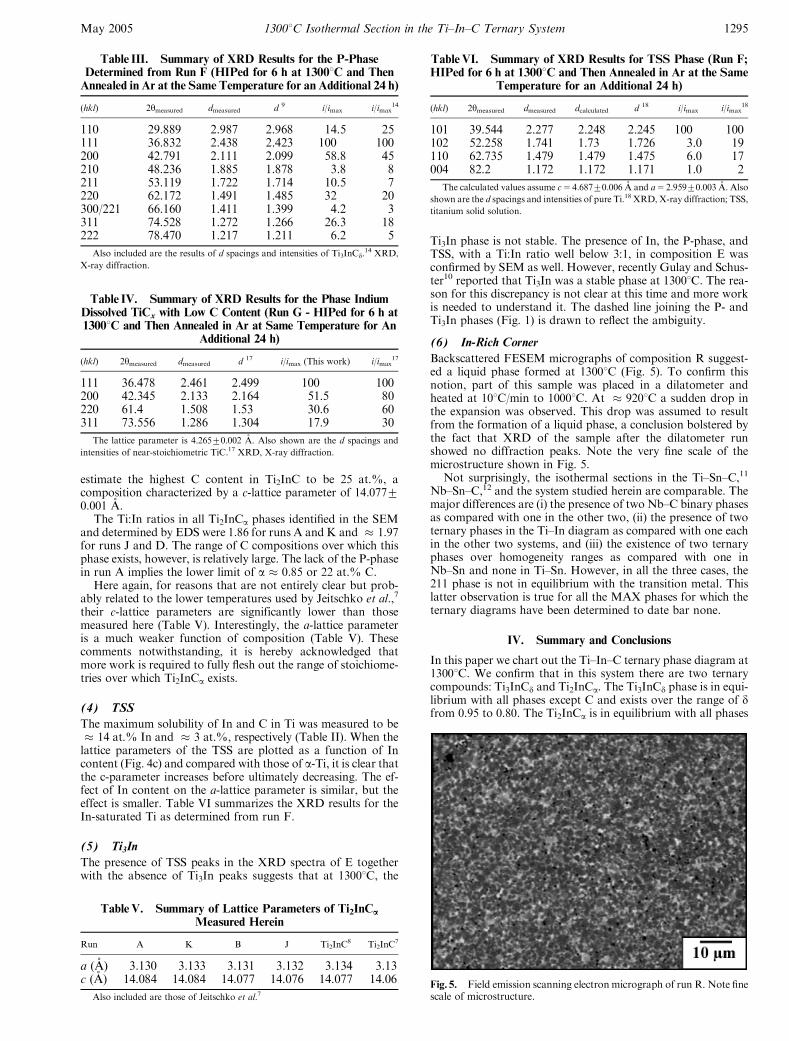
Table III. Summary of XRD Results for the P-PhaseDetermined from Run F (HIPed for 6 h at 13001C and ThenAnnealed in Ar at the Same Temperature for an Additional 24 h)
(hkl) 2ymeasured dmeasured d 9 i/imax i/imax14
110 29.889 2.987 2.968 14.5 25111 36.832 2.438 2.423 100 100200 42.791 2.111 2.099 58.8 45210 48.236 1.885 1.878 3.8 8211 53.119 1.722 1.714 10.5 7220 62.172 1.491 1.485 32 20300/221 66.160 1.411 1.399 4.2 3311 74.528 1.272 1.266 26.3 18222 78.470 1.217 1.211 6.2 5
Also included are the results of d spacings and intensities of Ti3InCd.14 XRD,
X-ray diffraction.
Table IV. Summary of XRD Results for the Phase IndiumDissolved TiCx with Low C Content (Run G - HIPed for 6 h at13001C and Then Annealed in Ar at Same Temperature for An
Additional 24 h)
(hkl) 2ymeasured dmeasured d 17 i/imax (This work) i/imax17
111 36.478 2.461 2.499 100 100200 42.345 2.133 2.164 51.5 80220 61.4 1.508 1.53 30.6 60311 73.556 1.286 1.304 17.9 30
The lattice parameter is 4.26570.002 A. Also shown are the d spacings and
intensities of near-stoichiometric TiC.17 XRD, X-ray diffraction.
TableV. Summary of Lattice Parameters of Ti2InCaMeasured Herein
Run A K B J Ti2InC8 Ti2InC
7
a (A) 3.130 3.133 3.131 3.132 3.134 3.13c (A) 14.084 14.084 14.077 14.076 14.077 14.06
Also included are those of Jeitschko et al.7
TableVI. Summary of XRD Results for TSS Phase (Run F;HIPed for 6 h at 13001C and Then Annealed in Ar at the Same
Temperature for an Additional 24 h)
(hkl) 2ymeasured dmeasured dcalculated d 18 i/imax i/imax18
101 39.544 2.277 2.248 2.245 100 100102 52.258 1.741 1.73 1.726 3.0 19110 62.735 1.479 1.479 1.475 6.0 17004 82.2 1.172 1.172 1.171 1.0 2
The calculated values assume c5 4.68770.006 A and a5 2.95970.003 A. Also
shown are the d spacings and intensities of pure Ti.18 XRD, X-ray diffraction; TSS,
titanium solid solution.
Fig. 5. Field emission scanning electronmicrograph of run R. Note finescale of microstructure.
May 2005 13001C Isothermal Section in the Ti–In–C Ternary System 1295

except Ti and C and exists over a range of a between 0.85 and 1.The TiCx phase is in equilibrium with all phases in the system.The dissolution of � 4 at.% In in TiCx results in the reductionof x to 0.24. The maximum solubilities of In and C in Ti are 14and 4 at.%, respectively.
Acknowledgment
Wewould also like to thankMr. S. Gupta for sealing the glass tubes. This workwas funded by NSF (DMR 0072067).
References
1M. W. Barsoum and T. El-Raghy, ‘‘Synthesis and Characterization of a Re-markable Ceramic: Ti3SiC2,’’ J. Am. Ceram. Soc., 79, 1953–6 (1996).
2M. W. Barsoum, D. Brodkin, and T. El-Raghy, ‘‘Layered Machinable Ceram-ics for High Temperature Applications,’’ Scripta Metall. Mater., 36, 535–41(1997).
3M. W. Barsoum, ‘‘The Mn11AXn Phases: A New Class of Solids: Thermody-namically Stable Nanolaminates,’’ Prog. Solid State Chem., 28, 201–81 (2000).
4M. W. Barsoum, G. Yaroschuck, and S. Tyagi, ‘‘Fabrication and Character-ization of M2SnC (M5Ti, Zr, Hf and Nb),’’ Scripta Mater., 37, 1583–91 (1997).
5T. El-Raghy, S. Chakraborty, and M. W. Barsoum, ‘‘Synthesis and Charac-terization of Hf2PbC, Zr2PbC, and M2SnC (M5Ti, Hf, Nb, or Zr),’’ J. Eur.Ceram. Soc., 20, 2619–25 (2000).
6M. W. Barsoum, T. El-Raghy, W. D. Porter, H. Wang, J. C. Ho, andS. Chakraborty, ‘‘Thermal Properties of Nb2SnC,’’ J. Appl. Phys., 88, 6316(2000).
7W. Jeitschko, H. Nowotny, and F. Benesovsky, ‘‘Die H Phasen Ti2InC, Hf2InCand Ti2GaC,’’ Monatsh Chem., 94, 1201–5 (1963).
8M. W. Barsoum, J. Golczewski, H. J. Seifert, and F. Aldinger, ‘‘Fabricationand Electrical and Thermal Properties of Ti2InC, Hf2InC and (Ti,Hf)2InC,’’J. Alloys Compounds, 340, 173–9 (2002).
9W. Jeitschko, H. Nowotny, and F. Benesovsky, ‘‘Die Kristallstruktur vonTi3InC, Ti3InN, Ti3TlC und Ti3TiN,’’ Monatsh Chem., 95, 436–8 (1964).
10L. D. Gulay and J. C. Schuster, ‘‘Investigation of the System Titanium–In-dium,’’ J. Alloys Compounds, 360, 137–42 (2003).
11H. Vincent, C. Vincent, B. F. Mentzen, S. Partor, and J. Bouix, ‘‘ChemicalInteraction Between C and Ti Dissolved in Liquid Sn: Crystal Structure and Re-activity of Ti2SnC with Al,’’ Mater. Sci. Eng., A256, 83–91 (1998).
12M. W. Barsoum, A. Ganguly, H. J. Seifert, and F. Aldinger, ‘‘The 13001CIsothermal Section in the Nb–Sn–C Phase Diagram,’’ J. Alloys Compounds, 337,202–7 (2002).
13T. B. Massalski (Ed.), Binary Alloy Phase Diagram, 2nd edition, ASM Inter-national, Ohio Park, 1990.
14XRD card # 28-0476.15E. Rudy, ‘‘Ternary Phase Equilibria in Transition Metal-B-C-Si Systems, Part
V,’’ Report No. AFML-TR-65-2, Air Force Materials Laboratory, Wright-Patterson AFB, Ohio, 1969.
16R. J. Kerans, K. S. Mazdiyasni, R. Ruh, and H. A. Lipsitt, ‘‘Solubility ofMetals in Substoichiometric TiC1�x,’’ J. Am. Ceram. Soc., 67, 34–8 (1984).
17XRD card # 32-1383.18XRD card # 5-0682. &
1296 Journal of the American Ceramic Society—Ganguly et al. Vol. 88, No. 5


![["Jewish Regional Organization in the Rhineland - the Kehillot Shum around 1300."] "Jüdische Regionalorganisation am Mittelrhein. Die Kehillot Schum um 1300."](https://static.fdokumen.com/doc/165x107/63356a48a1ced1126c0ac8ca/jewish-regional-organization-in-the-rhineland-the-kehillot-shum-around-1300.jpg)


