The physical implications of an isothermal model for the hot ...
27
NASA-TM-8617419850012779 NASA Technical Memorandum The Physical Implications of an Isothermal Model for the Hot Intracluster Medium Mark J. Henriksen and Richard Mushotzky MARCH 1985 LIBRARY COpy NI\S/\ ',I ,- ISdo 111111111111111111111111111111111111111111111 LANGLEY RESEARCH CENTER LIBRARY, NASA HAMPTO!'J, VIRGINIA NF00993
-
Upload
khangminh22 -
Category
Documents
-
view
5 -
download
0
Transcript of The physical implications of an isothermal model for the hot ...
NASA-TM-8617419850012779
NASA Technical Memorandum 86174'-----~---
The Physical Implications of an Isothermal Model for the Hot Intracluster Medium
Mark J. Henriksen and Richard Mushotzky
MARCH 1985
LIBRARY COpy NI\S/\ ~====~
',I '1~: ,- ISdo 111111111111111111111111111111111111111111111
LANGLEY RESEARCH CENTER
LIBRARY, NASA
HAMPTO!'J, VIRGINIA
NF00993
NASA Technical Memorandum 86174
The Physical Implications of an Isothermal Model for the Hot Intracluster Medium
Mark J. Henriksen
University of Maryland Col/ege Park, Maryland
Richard Mushotzky
Goddard Space Flight Center Greenbelt, Maryland
NI\S/\ National Aeronautics and Space Administration
SCientific and Technical Information Branch
1985
The Physical Implications of an Isothermal Model
for the Hot Intracluster Medium
Mark J. Henr1ksen1 and R1chard F. Mushotzky
Laboratory for H1gh Energy Astrophysics
NASA/Goddard Space Fl1ght Center
Greenbelt, Maryland 20771
ARSTRACT
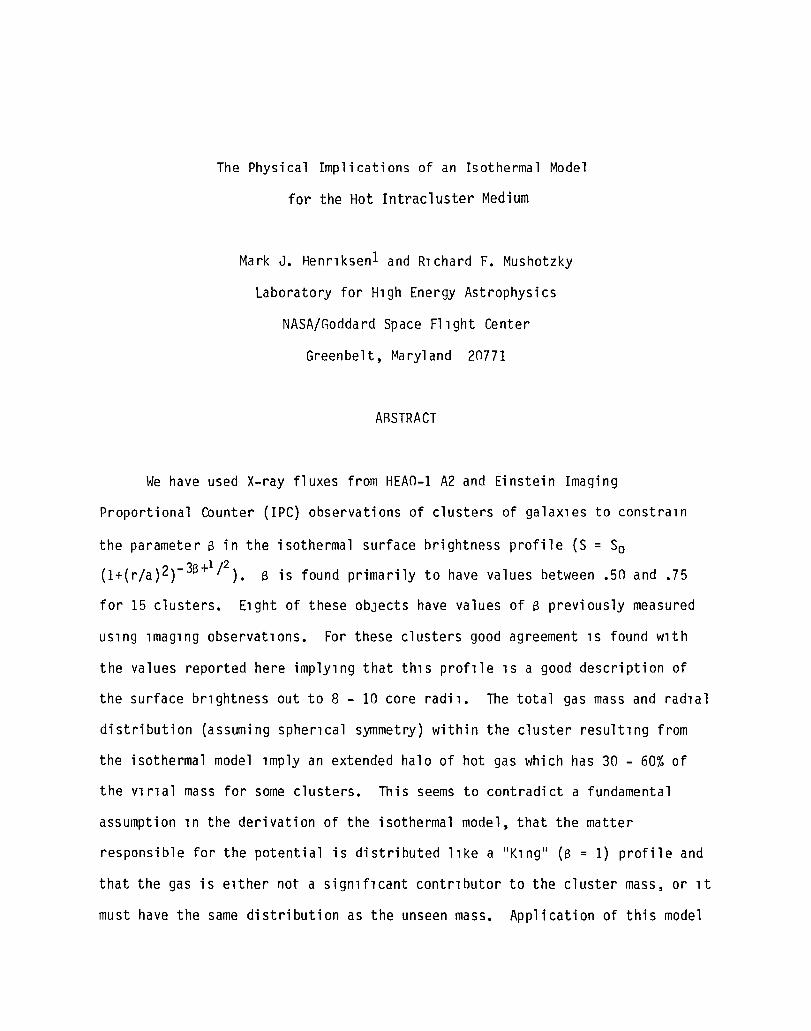
We have used X-ray fluxes from HEAO-l A2 and Einstein Imaging
Proportional Counter (IPC) observations of clusters of galax1es to constra1n
the parameter p in the isothermal surface brightness profile (5 = So
(1+(r/a)2)-38+1
/2
). 8 is found primarily to have values between .50 and .75
for 15 clusters. E1ght of these obJects have values of 8 previously measured
uS1ng 1mag1ng observat1ons. For these clusters good agreement 1S found w1th
the values reported here implY1ng that th1S prof1le 1S a good description of
the surface br1ghtness out to 8 - 10 core radi1. The total gas mass and rad1al
distribution (assuming spher1cal symmetry) within the cluster result1ng from
the isothermal model 1mply an extended halo of hot gas which has 30 - 60% of
the V1r1al mass for some clusters. This seems to contradict a fundamental
assumption 1n the derivation of the isothermal model, that the matter
responsible for the potential is distributed llke a IK1ng" (8 = 1) profile and
that the gas is e1ther not a sign1f1cant contr1butor to the cluster mass, or 1t
must have the same distribution as the unseen mass. Application of this model
to the X-ray data tells us that neither assumption about the gas is true.
Isothermal model fltS to the data conslstently give B less than 1,
implying that the gas component is more extended than the galaxy component.
However, using avallable optical data, we find no correlation between the HWHM
of the gas and gal aXles and there is no evidence of the narrow range of
acceptable pairs of these parameters which is predicted by the model uSlng the
observed range in B. Also no significant correlation is found between the gas
core radlus and the optical HWHM; parameters which must be equal for this model
to be self-conslstent. These lnconslstencles cast doubt upon physlcal
lnterpretatlons based on the isothermal model even though lt is useful as an
empirical description of the X-ray surface brlghtness.
Subject headings: galaxies: clusters of galaxies: intergalactic medium:
X-ray sources
1Also Dept. of Physics and Astronomy, Univ. of Maryland
2
I. INTRODUCTION
Less than a decade ago, spectroscopic studies of the dlffuse X-ray source
ln clusters of galaxies produced compelling evidence that the X-rays were
produced by thermal bremsstrahlung from a hot gas (Serlemitsos et ale 1977).
The initial models assumed that the gas was a self-gravitating isothermal
sphere since it seemed that the gas and galaxy masses were comparable.
However, since the gas mass was believed to be roughly 10% of the mass
necessary to bind the cluster (Lea et ale 1973), models were developed in which
the gas was trapped in the potential well formed by the unseen bindlng mass of
the cluster (Bahcall and SaraZln 1978; Cavaliere and Fusco-Femiano 1976). A
model often used in the analysis of X-ray imaginq data, the "S" model, (Jones
and Forman 1984; Ku et ale 1983; Gorenstein et ale 1979) was formulated under
the assumption that the unseen matter is dlstributed like the galaxies (Rood et
ale 1972) and that this radial distrlbution is roughly given by the King (King
1966) approximation to an isothermal sphere. The latter assumption is based
prlmarily on studies of the Coma cluster and may not apply to clusters in
general (Chincarlni 1979).
In this paper, we will use HEAO-l A2 and Einsteln IPC observatlons of 15
clusters of galaxles to measure the isothermal S model parameters. These
parameters wlll then be compared to those derived from model fits to the X-ray
images. We wlll then address the physlcal constraints imposed on this model by
the existing optical data, the implied gas mass, and the gas contribution to
the binding cluster mass.
3
II. OESCRIPTION OF THE ISOTHERMAL MOOEL
The E1nste1n Observatory was used extensively to measure the X-ray
surface brightness of clusters of galaxies. Much of these data have been
modeled (Ku et al. 1983; Jones and Forman 1984, hereafter JF) uS1ng the surface
brightness profile
(1)
described by Cavaliere and Fusco-Fem1ano (1976), in Wh1Ch S, a, and So are free
parameters. The special case of a self-gravitating isothermal sphere, B f1xed
at 1, was fit to a sample of clusters by Abramopoulos and Ku (1983) (hereafter
AK). This 1S a physically unreasonable situation 1f the gas mass is only 11%
of the virial mass, as determined by these authors, since the gas mass would
not be large enough to be self-gravitating and would have to respond to the
total cluster potent1al.
In this model, S is the ratio of the energy of the galaxies to that of
2 the gas, S = ~mHV /kT, where V 1S the line of s1ght velocity d1spersion of the
galaxies, kT is the temperature of the gas, and the parameter a is the X-ray
core rad1us. The value of S and core rad1us derived from f1tS to the data
determ1ne the relative extension of the galaxy and gas components:
s = O.I/[10g((h/a)2 + I)J + .17, (2)
where h 1S the half width at half maximum (HWHM) of the X-ray surface
br1ghtness and a is the HWHM of the galaxy counts. The form of the gas dens1ty
prof1le is
4
pip = (1 + (r/a)2)-3S/2 (3) o
III. METHOD OF ANALYSIS
The clusters analyzed here are those which have published fluxes from
large (3 0 x 1.50 ) and small (1 0 x 10 ) field of view experiments. The total xray luminosities (LT) in the 2 - 10 keV energy range (Mckee et ale 1980;
Picclnotti et ale 1982) have been measured for 40 clusters using the HEAO-1 A2
detectors (30 x 1.50 FOV). In addition, .5 - 3 keV luminosities within the
central region of the cluster (Lr) have been measured with the Einstein
Observatory's Imaging Proportional Counter (Giacconi et ale 1979). The
observed values of Lr used here are from the surveys of JF (who give the
luminosity within .5 Mpc of the cluster center) and AK (who give the luminosity
within 1.5 Mpc). The ratio of the luminosities LT/Lr depends only on a, a, and
the temperature (choice of the outside radius of the gas has only a weak effect
on the resulting luminosity ratio). The measured ratio can be corrected for
the relative dlfference in bremsstrahlung emission in the respective bandpasses
of the IPC and HEAO-1 detectors using the known temperatures of these clusters
(Mushotzky 1984). The temperature used in this correction is derived from
modeling the spectrum with a single component bremsstrahlung continuum plus Fe-
K line emission. The correction ranges from 3% for clusters whose temperature
is 8 keV to 26% at kT = 4 keV. Thus, for cooler clusters, such as A2199, an
uncertainty in the temperature would produce a more significant uncertainty in
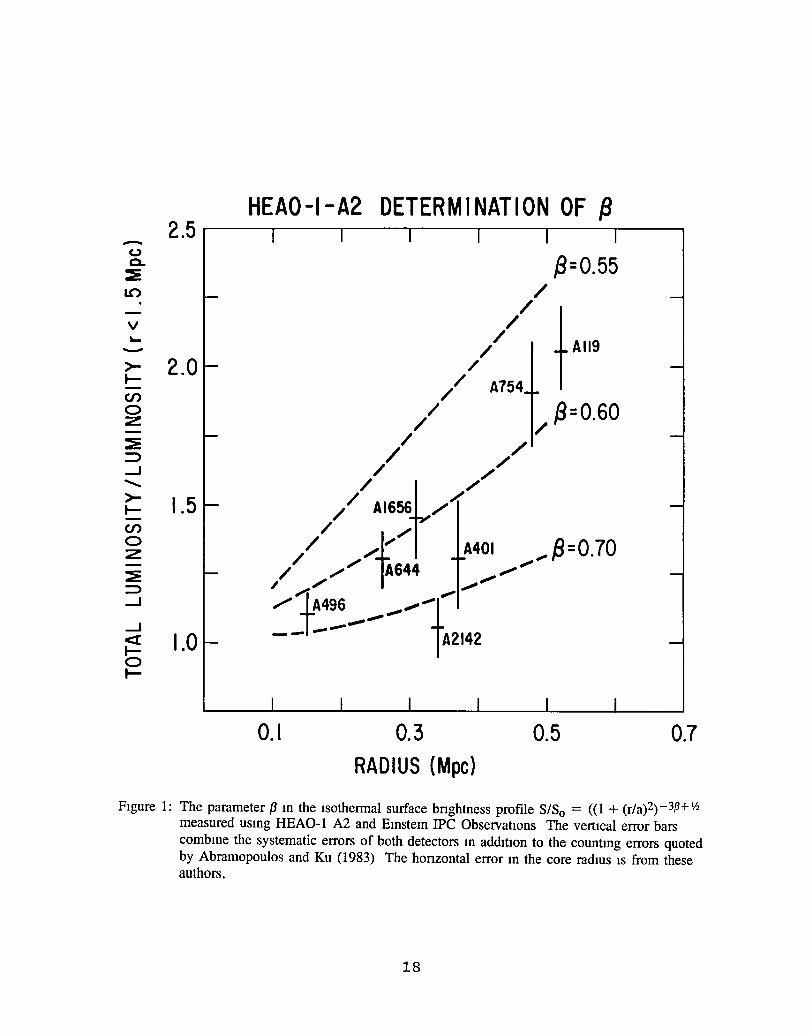
Utilizing the data in AK, we derive values of B not previously determined
for 7 clusters. The luminosity ratio and the core radius for each cluster is
5
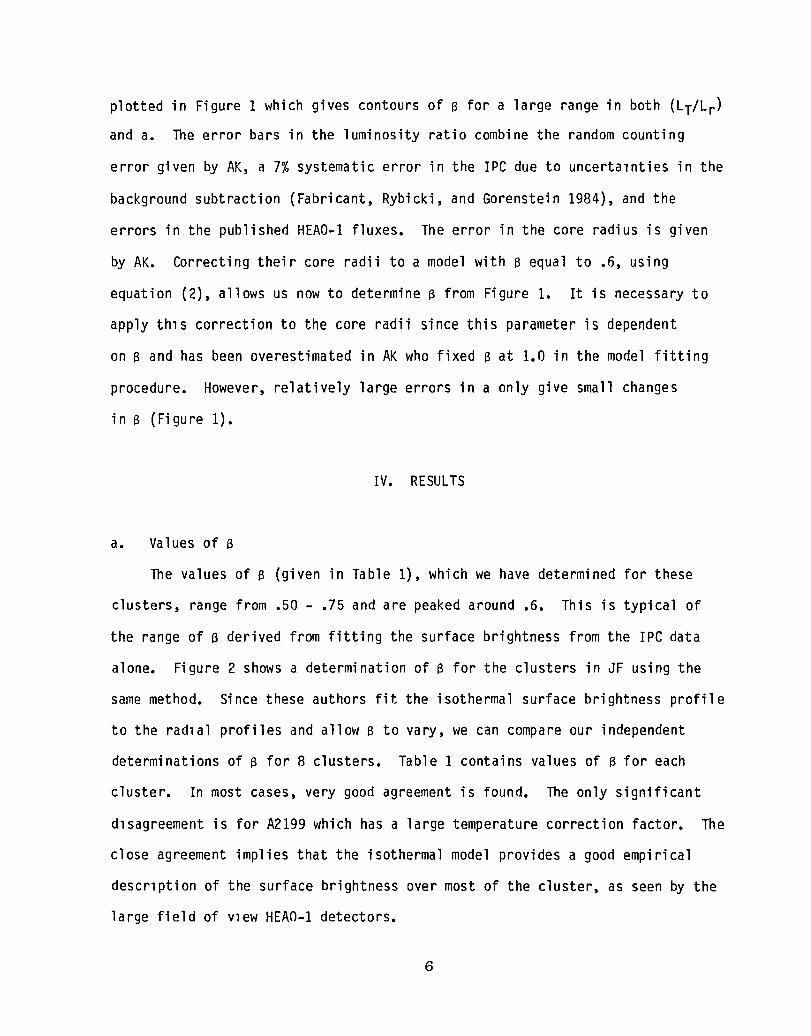
plotted in Figure 1 which gives contours of a for a large range in both (LT/Lr)
and a. The error bars in the luminosity ratio combine the random counting
error given by AK, a 7% systematic error in the IPC due to uncertalnties in the
background subtraction (Fabricant, Rybicki, and Gorenstein 1984), and the
errors in the published HEAO-l fluxes. The error in the core radius is given
by AK. Correcting their core radii to a model with a equal to .6, using
equation (2), allows us now to determine a from Figure 1. It is necessary to
apply thlS correction to the core radii since this parameter is dependent
on 8 and has been overestimated in AK who fixed 8 at 1.0 in the model fitting
procedure. However, relatively large errors in a only give small changes
i n 8 (Fi gu re 1).
IV. RESULTS
a. Values of a
The values of a (given in Table 1), which we have determined for these
clusters, range from .50 - .75 and are peaked around .6. This is typical of
the range of 8 derived from fitting the surface brightness from the IPC data
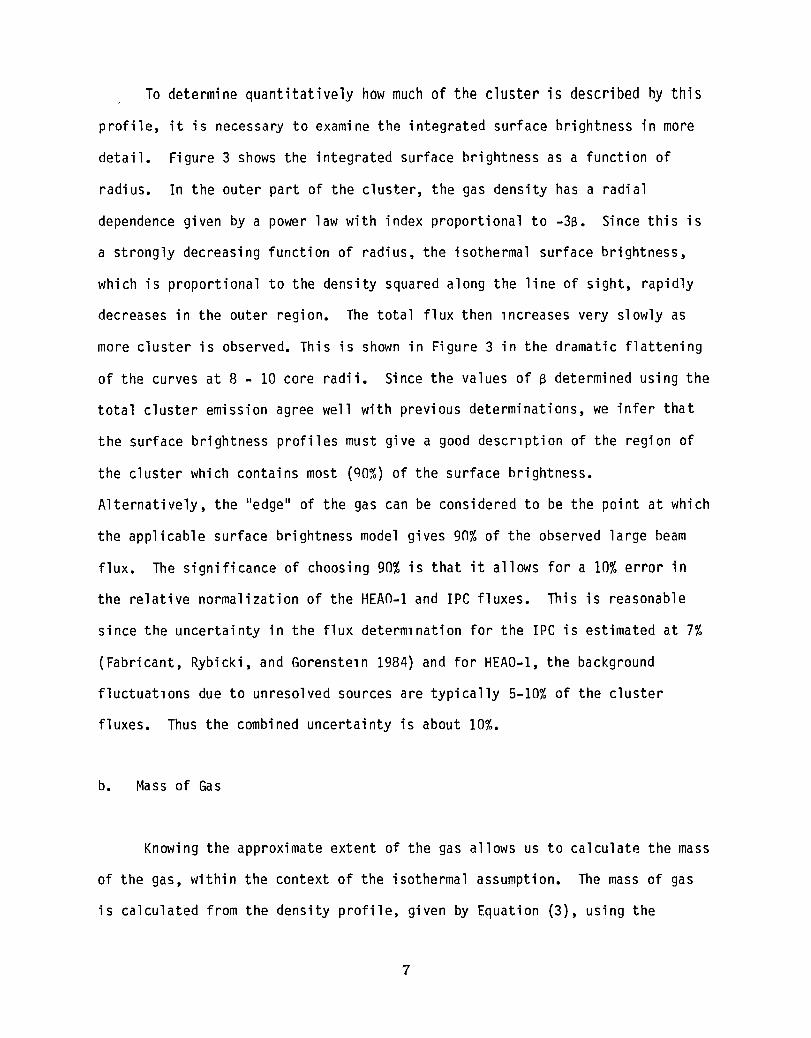
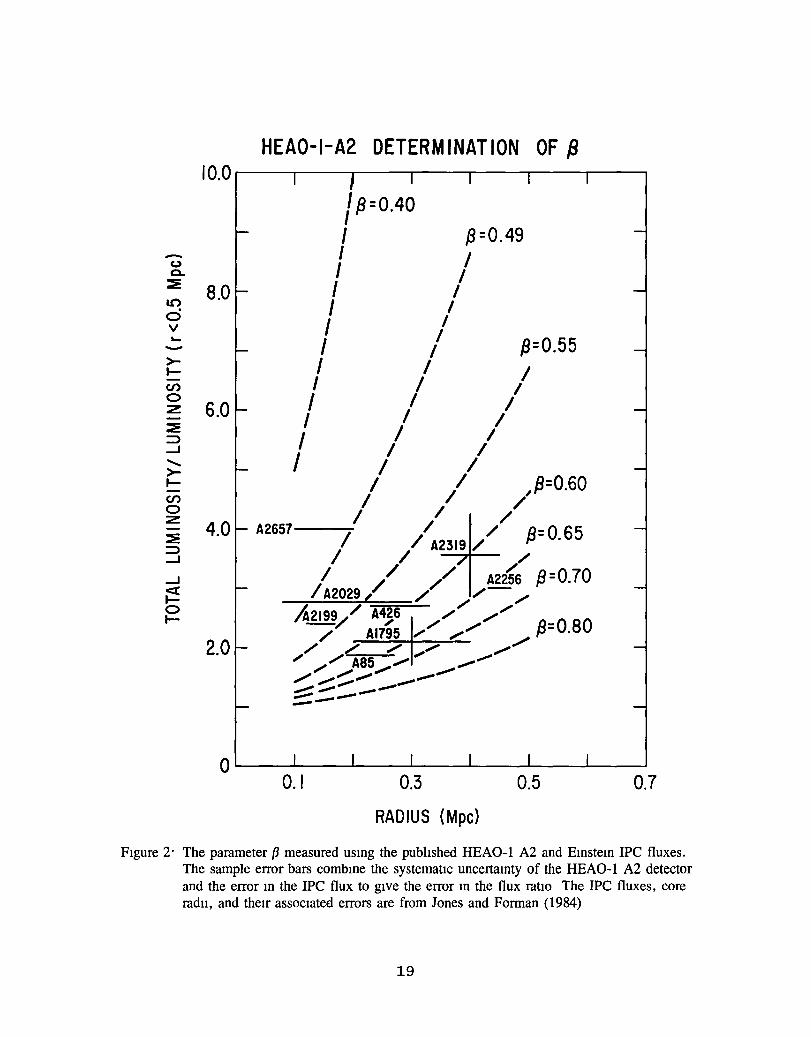
alone. Figure 2 shows a determination of 8 for the clusters in JF using the
same method. Since these authors fit the isothermal surface brightness profile
to the radlal profiles and allow B to vary, we can compare our independent
determinations of B for 8 clusters. Table 1 contains values of B for each
cluster. In most cases, very good agreement is found. The only Significant
dlsagreement is for A2199 which has a large temperature correction factor. The
close agreement implies that the isothermal model provides a good empirical
descrlption of the surface brightness over most of the cluster, as seen by the
large field of Vlew HEAO-l detectors.
6
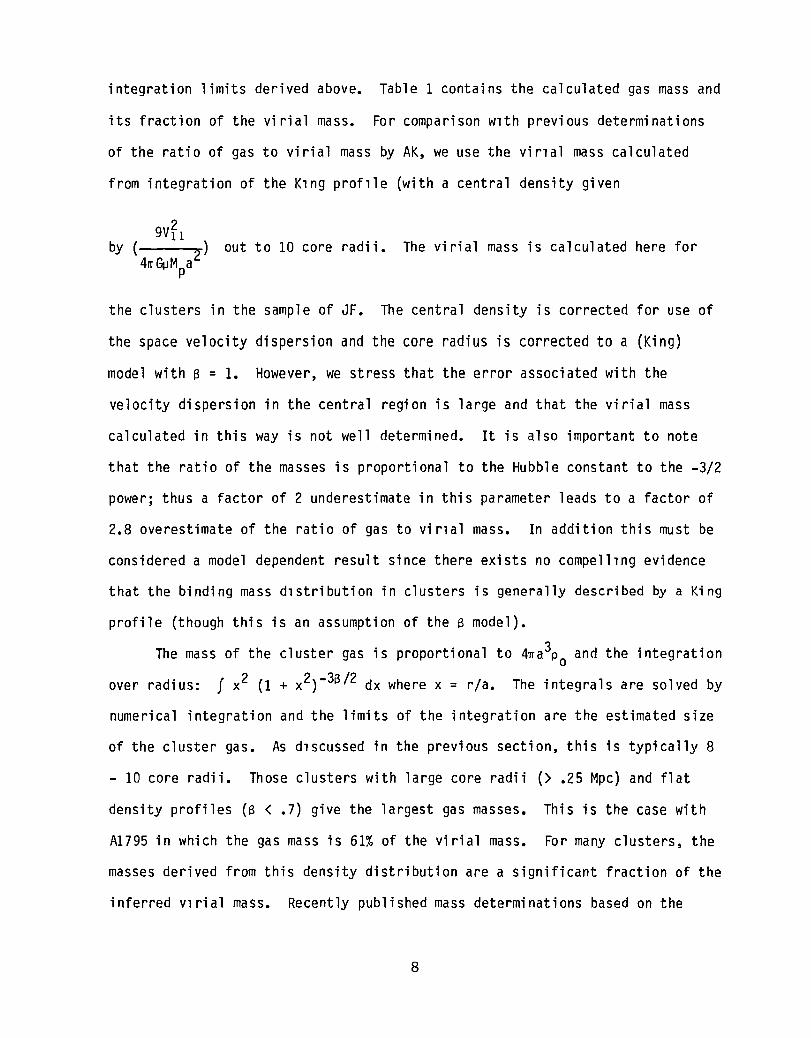
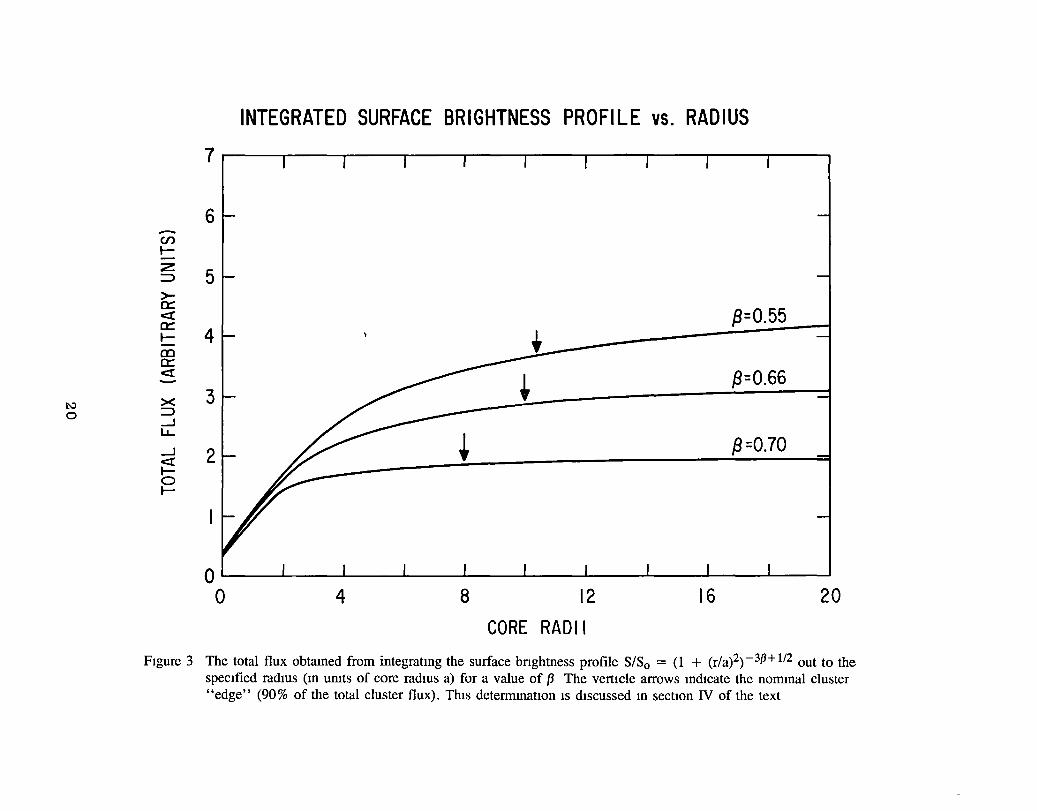
To determine quantitatively how much of the cluster is described by this
profile, it is necessary to examine the integrated surface brightness in more
detail. Figure 3 shows the integrated surface brightness as a function of
radius. In the outer part of the cluster, the gas density has a radial
dependence given by a power law with index proportional to -38. Since this is
a strongly decreasing function of radius, the isothermal surface brightness,
which is proportional to the density squared along the line of sight, rapidly
decreases in the outer region. The total flux then lncreases very slowly as
more cluster is observed. This is shown in Figure 3 in the dramatic flattening
of the curves at 8 - 10 core radii. Since the values of 8 determined using the
total cluster emission agree well with previous determinations, we infer that
the surface brightness profiles must give a good descrlption of the region of
the cluster which contains most (qO%) of the surface brightness.
Alternatively, the Iledge" of the gas can be considered to be the point at which
the applicable surface brightness model gives 90% of the observed large beam
flux. The significance of choosing 90% is that it allows for a 10% error in
the relative normalization of the HEAO-l and IPe fluxes. This is reasonable
since the uncertainty in the flux determlnation for the IPe is estimated at 7%
(Fabricant, Rybicki, and Gorensteln 1984) and for HEAO-l, the background
fluctuatlons due to unresolved sources are typically 5-10% of the cluster
fluxes. Thus the combined uncertainty is about 10%.
b. Mass of Gas
Knowing the approximate extent of the gas allows us to calculate the mass
of the gas, within the context of the isothermal assumption. The mass of gas
is calculated from the density profile, given by Equation (3), using the
7
integration limits derived above. Table 1 contains the calculated gas mass and
its fraction of the virial mass. For comparison wlth previous determinations
of the ratio of gas to virial mass by AK, we use the virlal mass calculated
from integration of the Klng proflle (with a central density given
9vfl by ( 2) out to 10 core radii. The virial mass is calculated here for
4rr GJ..IMpa
the clusters in the sample of JF. The central density is corrected for use of
the space velocity dispersion and the core radius is corrected to a (King)
model with a = 1. However, we stress that the error associated with the
velocity dispersion in the central region is large and that the virial mass
calculated in this way is not well determined. It is also important to note
that the ratio of the masses is proportional to the Hubble constant to the -3/2
power; thus a factor of 2 underestimate in this parameter leads to a factor of
2.8 overestimate of the ratio of gas to virlal mass. In addition this must be
considered a model dependent result since there exists no compelllng evidence
that the binding mass dlstribution in clusters is generally described by a King
profile (though this is an assumption of the p model).
The mass of the cluster gas is proportional to 4~a3po and the integration
over radius: J x2 (1 + x2)-3p/2 dx where x = rIa. The integrals are solved by
numerical integration and the limits of the integration are the estimated size
of the cluster gas. As dlscussed in the previous section, this is typically 8
- 10 core radii. Those clusters with large core radii (> .25 Mpc) and flat
density profiles (8 < .7) give the largest gas masses. This is the case with
A1795 in which the gas mass is 61% of the vi rial mass. For many clusters, the
masses derived from this density distribution are a significant fraction of the
inferred vlrial mass. Recently published mass determinations based on the
8
isothermal model which establish the gas mass to be typically 11% of the virial
mass (AK) underestimate the ratio of gas to virial mass required by this
model. These authors compare the gas mass within 5 core radii to the vlrial
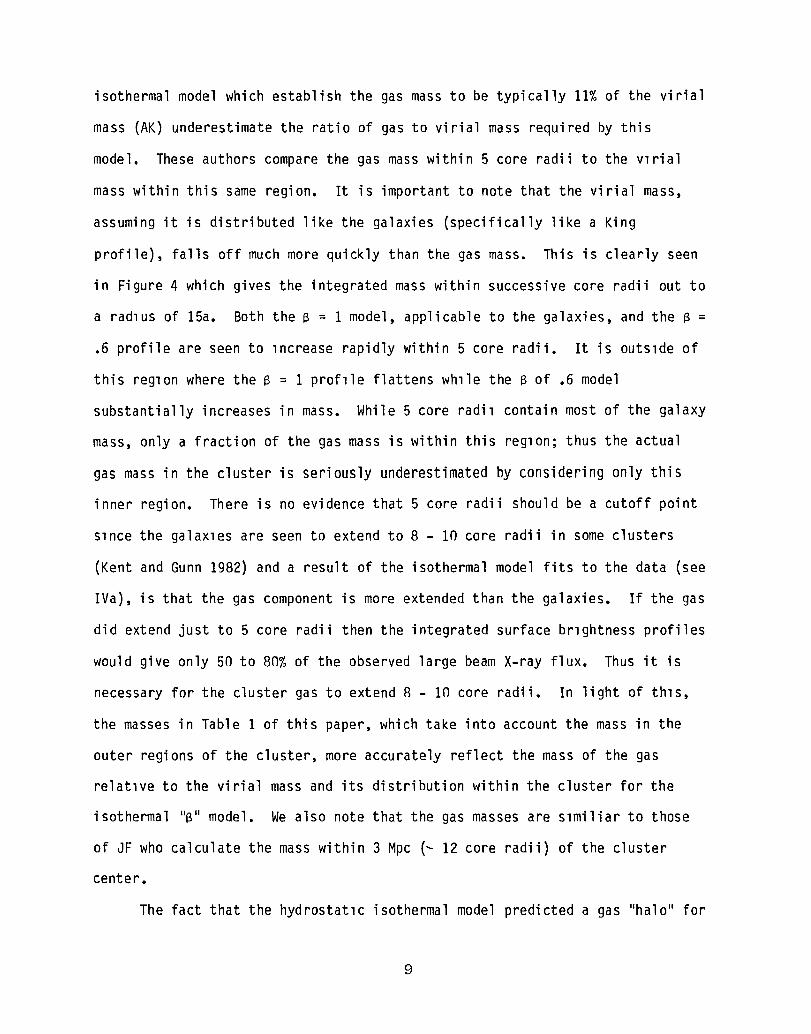
mass within this same region. It is important to note that the virial mass,
assuming it is distributed like the galaxies (specifically like a King
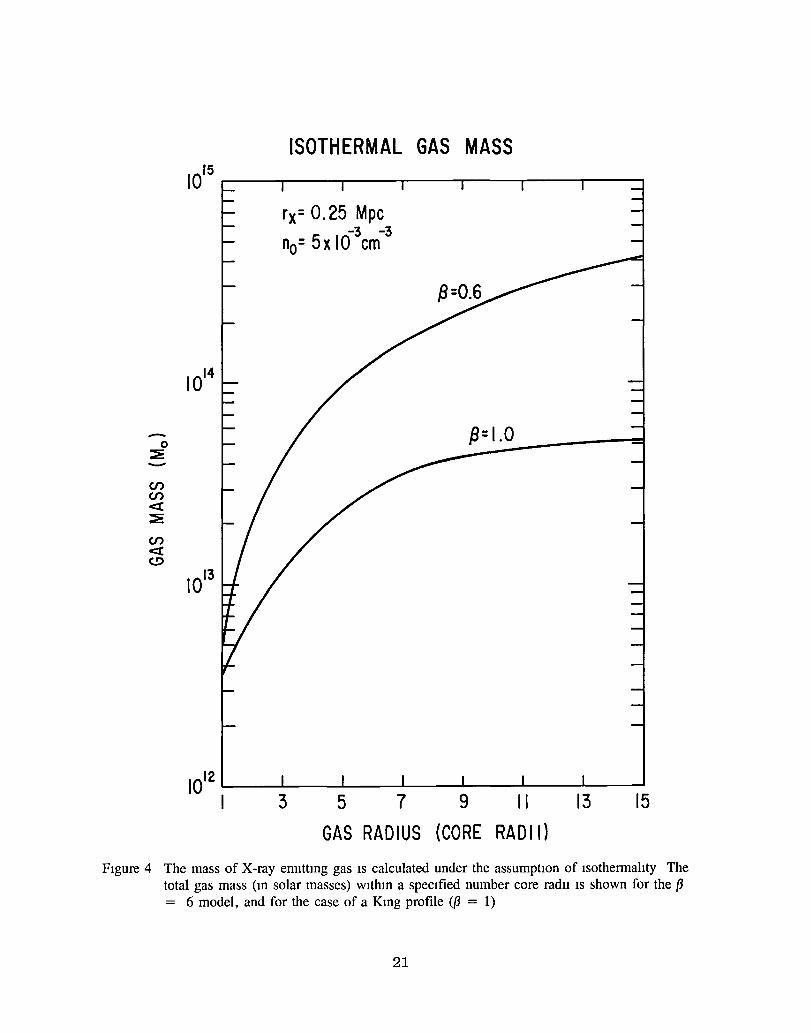
profile), falls off much more quickly than the gas mass. This is clearly seen
in Figure 4 which gives the integrated mass within successive core radii out to
a radlus of 15a. Both the ~ = 1 model, applicable to the galaxies, and the ~ =
.6 profile are seen to lncrease rapidly within 5 core radii. It is outslde of
this reglon where the a = 1 proflle flattens whlle the a of .6 model
substantially increases in mass. While 5 core radil contain most of the galaxy
mass, only a fraction of the gas mass is within this reglon; thus the actual
gas mass in the cluster is seriously underestimated by considering only this
inner region. There is no evidence that 5 core radii should be a cutoff point
Slnce the galaxles are seen to extend to 8 - 10 core radii in some clusters
(Kent and Gunn 1982) and a result of the isothermal model fits to the data (see
IVa), is that the gas component is more extended than the galaxies. If the gas
did extend just to 5 core radii then the integrated surface brlghtness profiles
would give only 50 to 80% of the observed large beam X-ray flux. Thus it is
necessary for the cluster gas to extend 8 - 10 core radii. In light of thlS,
the masses in Table 1 of this paper, which take into account the mass in the
outer regions of the cluster, more accurately reflect the mass of the gas
relatlve to the virial mass and its distribution within the cluster for the
isothermal "a" model. We also note that the gas masses are slmiliar to those
of JF who calculate the mass within 3 Mpc (- 12 core radii) of the cluster
center.
The fact that the hydrostatlc isothermal model predicted a gas "halo" for
9
Coma was pointed out by Gorenstein et al. (1979). In their analys1s, adiabatic
as well as isothermal models were able to adequately describe the data Wh1Ch
encompassed a small field of view (r < 25 1) at soft X-ray energies (.5 - 2
keV). Based on our determinations, which use data which extends out to 180 1,
we can conclude that if these clusters are isothermal then the surface
br1ghtness characterization requires that: (1) the gas be more extended than
the galaxies, which leads to the ratio of visible light to total mass
decreas1ng with radius (Stewart et al. 1984) and (2) the gas 1S a substantial
fraction of the virial mass for many clusters as was found previously for 0340-
538 (Ku et al. 1983).
c. Optical Structure
The 1nterpretat10n of e assumes that the density distr1bution of the
galaxies 1S well represented by an isothermal sphere. This result has not been
confirmed for clusters 1n general. In fact, an optical survey of rich clusters
by Geller and Beers (1982) f1nds that many clusters are asymmetric or have
substructure and that very few look like isothermal spheres. It is important
to note that the e model was developed at a p01nt in cluster analysis when the
optical properties of clusters (primar1ly Coma) were better determined than the
X-ray properties. Thus, the King approximation to an isothermal sphere, which
described the galaxy counts in Coma was used as a fundamental starting point
for the developement of a model for the X-ray emission. Originally, the scale
length in the e model fits to the X-ray data, the X-ray core radius, was f1xed
at the HWHM of the galaxy counts (Cavaliere 1978). The fact that in practice
the core radius is currently left as a free parameter reflects that during the
HEAD era, high quality X-ray data became available for a large sample of
10
clusters while comparable optical data was not available. Recent optical work
allows us to now check the self-consistency of this approach to the analysis of
the X-ray data by comparing constraints imposed by the optical data.
The X-ray and galaxy density distributions have a clearly defined
relationship in the isothermal model. The best fit X-ray core radius must be
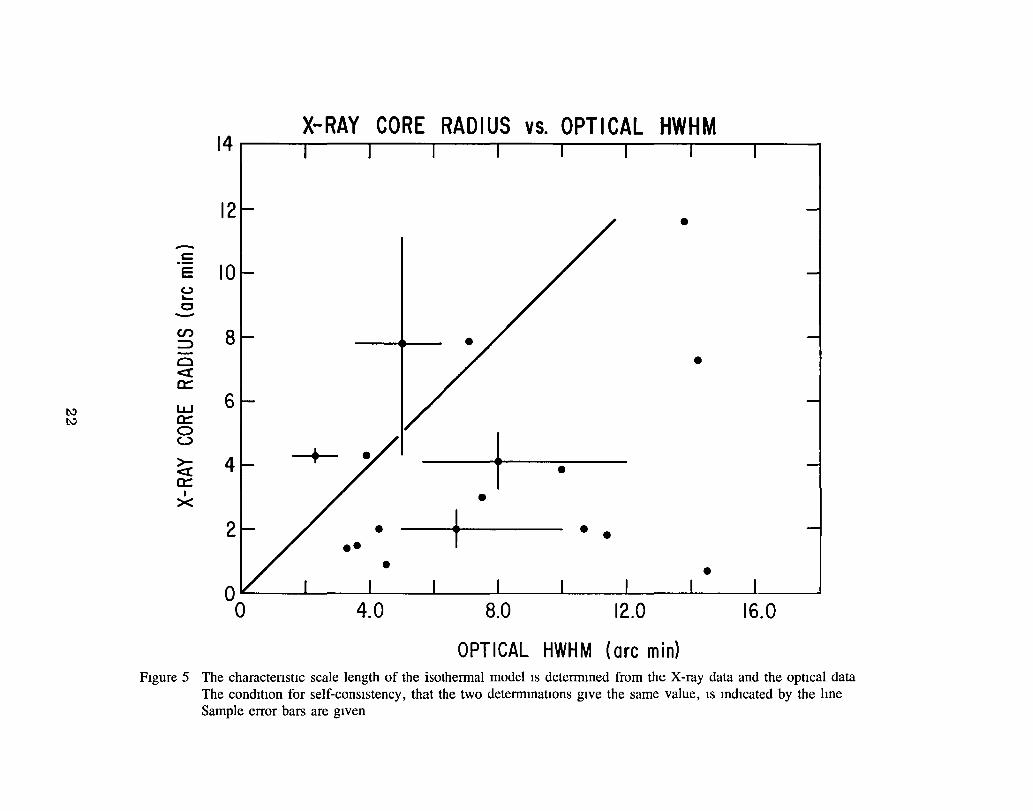
equal to the opt1cal HWHM for the model to be self consistent. In F1gure 5, we
show the best fit X-ray core radius and the optical HWHM for 17 clusters (those
clusters common to both the Jones and Forman sample and the Geller and Beers
sample). We have measured the optical HWHM from the contour maps published by
Geller and Beers. The error bars for this parameter in Figure 5 follow from
the 1 sigma errors given with the contours. As the figure shows, the Slze of
the error is significant. Th1S is due primarily to the low number of galaxies
in some of the clusters and the uncertainty in the background subtraction.
Even glven the large errors, one can read1ly see that few of the clusters
fulfill the condition for self-cons1stency, that the x-ray core radius equals
the opt1cal HWHM. A llnear correlation analysis shows that these two
paramaters are not strongly correlated (r=.28). Graph1cally, this condit10n is
shown 1n Figure 5, where the line represents equal scale length determinations,
and it is clear that the few clusters are seen to be consistent with the line
at the 1 sigma level. A simi liar result using published optical scale lengths
was found by Mushotzky (1984).
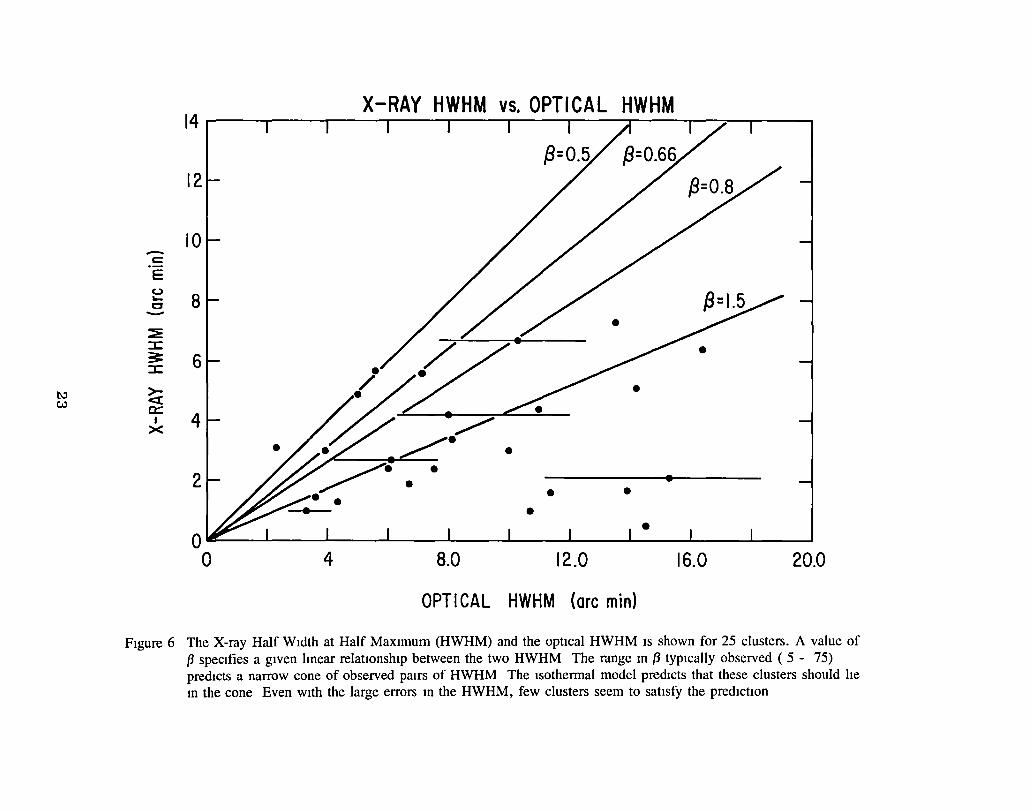
A model 1ndependent character1zation of the emission scale length, the
HWHM, is also not well correlated (r = .26) in the X-ray and optical. Using
the publ1shed values of ~, the X-ray core radius, and equation (2), the HWHM
for the gas component is calculated and plotted in F1g. 6 for 25 clusters (8 1n
AK and 17 in JF that are 1n Geller and Beers). The lack of a strong
correlation does not support the general conclusion based on the isothermal
11
model fits to the data that the X-ray emission is systematically more extended
than the optical (13 is less than 1.). If the components had thlS simple
relationship, one might expect to at least see a weak correlation on the scale
of the HWHM, since the observed range in 13 predlcts a well deflned range of
acceptable pairs of X-ray and optical HWHM.
Furthermore, the relatively small dispersion in 13 from X-ray surface
brightness analysis is not verified by determinations uSlng the velocity
dispersion and central temperature. The latter method shows a distribution
in e which includes many clusters with 13 > 1 (Mushotzky 1984); a case in which
the gas is less extended than the galaxies. Though this may be consistent with
the optical measurements, this is not seen in the imaging X-ray analysis. The
conflicting values of 13 have a number of possible explanations which are heyond
the scope of this paper.
v. OISOJSSION
The lsothermal model has been applied to much of the imaging and spectral
data. The validity of the physical interpretation of the results is doubtful
Slnce the existing optical data does not seem to confirm that the model is self
consistent. Another maJor inconsistency is assoclated wlth the isothermal gas
mass. The model implies gas masses WhlCh are a significant fractlon of the
blnding mass, and have a flatter density distributlon than the assumed binding
mass. Yet, in the derivation of the model the contribution of the gas to the
total cluster mass is neglected. We conclude then, that the model is a useful
empirical description of the data, but not necessarily a physically relevant
one. We suggest that this model does not unlquely describe the data. In fact,
non-isothermal models such as that described by Cavaliere and Fusco-Femiano
12
(1978) can also produce the observed small to large beam flux ratlos. However,
the increased number of parameters in this model (polytropic lndex, S, central
temperature, and core radius), allow for very little constraint on the
parameters using the flux ratios presented ln this paper. This particular
model, though useful in illustrating an alternative to the isothermal model, is
still lacking ln generallty, particularily in its use of a flxed cluster
potential. In a future paper, we will advocate a more general approach to the
analysis of the X-ray data which is independent of assumptions concerning the
distribution of galaxles or the binding cluster mass.
VI. SUMMARY
The following important points have been raised in this paper:
(1) Applicatlon of the isothermal model to measurements of the ratlo of large
to small beam fluxes from clusters of galaxles gives values of beta less
than 1. This is consistent with the results from X-ray lmaging data. We
interpret this to imply that the gas extends out to 8 - 10 core
radii, - 2-3 Mpc.
(2) The cluster scale lengths found using X-ray observations do not agree well
with those determined optically. In the derivation of the surface
brightness from the assumed cluster potential and galaxy denslty
distribution, the scale length is the same. This is not found for the 25
clusters analyzed here.
13
(3) The isothermal gas mass can be as large as 60% of the virial mass for some
clusters. This contradicts the fundamental assumption that the cluster
potential 1S determined by an unseen mass Wh1Ch is glven by the K1ng
approximat10n to an isothermal sphere. If the gas mass is a slgnificant
fraction of the total cluster mass and 1S given by a flatter density
distribut10n than th1S mass, it must be included in the assumed cluster
potential.
We conclude that the isothermal model is a non-physical model though it
has proven to be a useful empirical characterization for clusters. We advocate
the application of non-isothermal models in an attempt to arrive at cluster
models which may be more physically self-consistent.
14
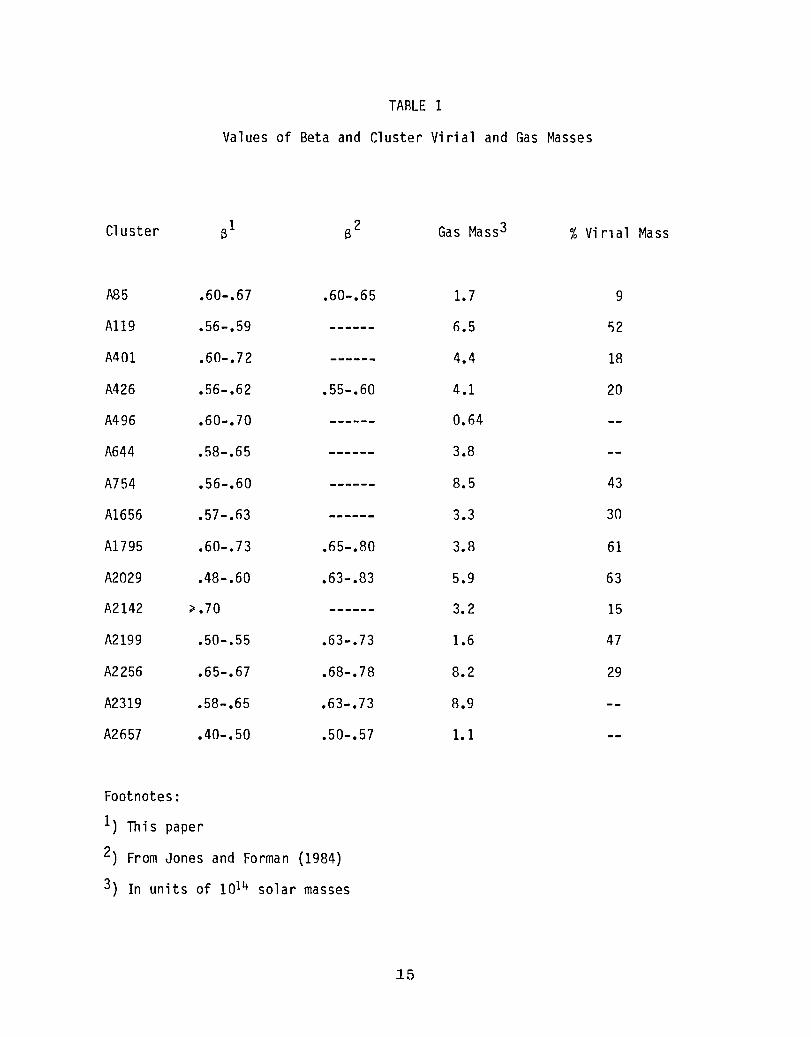
TARLE 1
Values of Beta and Cluster Virial and Gas Masses
Cl uster Gas Mass3 % Vi rlal Mass
A85 .60-.67 .60-.65 1.7 9
A119 .56-.59 ------ 0.5 1)2
MOl .60-.72 ------ 4.4 18
M26 .56-.62 .55-.60 4.1 20
M96 .60-.70 ------ 0.64
A644 .58-.65 ------ 3.8
A754 .56-.60 ------ 8.5 43
A1656 .57-.63 ------ 3.3 30
A1795 .60-.73 .65-.80 3.8 61
A2029 .48-.60 .63-.83 5.9 63
A2142 ;;..70 ------ 3.2 15
A2199 .50-.55 .63-.73 1.6 47
A2256 .65-.67 .68-.78 8.2 29
A2319 .58-.65 .63-.73 8.9
A2657 .40-.50 .50-.57 1.1
Footnotes:
1) This paper
2) From Jones and Forman (1984)
3) In units of 1014 solar masses
15
REFERENCES
Abramopoulos, F., and Ku, W.H.-M. 1983, Ap. J., 271, 446.
Bahcall, J.N., and Sarazin, C.L. 1978, Ap. J., 219, 78I.
Cavaliere, A., and Fusco-Femiano, R. 1976, Astron. and Astrophys., 49, 137.
Cavaliere, A., and Fusco-Femalno, R. 1978, Astron. and Astrophys., 70, 677.
Chincarini, G. 1979, in X-ray Astronomy, (eds) R. Giacconi and G. Setti,
nordrecht: O. Riedel, p. 197.
Fabricant, n., Rybickl, G., and Gorenstein, P. 1984, Ap. J., in press.
Geller, M.J., and Beers, T.C. 1982, PASP, 94, 421.
Gorenstein, P., Fabricant, D., Topka, K., Harnden, F.R. Jr. 1979, Ap. J., 230,
26.
Jones, C., and Forman, W. 1984, Ap. J., 276, 38.
Kent, S.M., and Gunn, J.E. 1982, Astr. J., 87, 945.
K 1 n g , I. R • 1966, As t r. J., 71, 64.
Ku, W.H.-M., Abramopoulos, F., Nulsen, P.E.J., Fabian, A.C., Stewart, G.C.,
Chincarlni, G.l., and Tarenghi, M. 1983, MNRAS, 203, 253.
Lea, S.M., Sllk, J.I., Kellogg, E., and Murray, S. 1973, Ap. J. {Letters},
184, LI05.
Mckee, J.D., Mushotzky, R.F., Boldt, E.A., Holt, S.S., Marshall, F.E., Pravdo,
S.H. and Serlemltsos, P.J. 1980, Ap. J., 242, 843.
Mushotzky, R.F. 1984, Physica Scripta, Vol. t7, 157.
Piccinotti G., Mushotzky, R.F., Boldt, E.A., Holt, S.S., Marshall, F.E.,
Serlemi tsos, P.,J. and Shafer, R.A. 1982, Ap. J., 253, 485.
Rood, H.J., Page, T.L., Kintner, E.C., and King, I.R. 1972, Ap. J., 175,
627.
Serlemitsos, P.J., Smith, B.W., Boldt, LA., Holt, S.S., and Swank, J.H. 1977,
Ap. J.(letters), 211, l63.
16
Stewart, G.C., Canizares, C.R., Fabian, A.C., and Nulsen, P.E.J. 1984, Ap. J.
278, 536.
17
2.5 -(.) 0-~ LO . v ~ ->- 2.0 ~
en 0 z ::E ::> .....J
" >- 1.5 ~
en 0 z -::E :::> .....J
.....J <t: 1.0 ~ 0 ~
HEAO-I-A2 DETERMINATION OF ~
/ /
/ /
/ / A754 /
/ /
/ / / /' / /' / ./
// AI656 ,//. / ./
/ ",./ A644 ". ", ~ A'" .,,'" / f.4~---"-f -- - A2142
0.1 0.3 RADIUS (Mpc)
fj=0.55 /
AII9
/ fj=0.60
0.5 0.7
Figure 1: The parameter f3 10 the Isothermal surface bnghtness profile S/So = «1 + (r/a)2)-3{JH'l measured usmg HEAO-I A2 and Emstem IPC ObservatIOns The vertical error bars combme the systematic errors of both detectors 10 additIon to the countmg errors quoted by Abramopoulos and Ku (1983) The honzontal error 10 the core radIUS IS from these authors.
18
-(.)
HEAO-I-A2 DETERM INATION OF P
1~=0.40 I I
~=0.49
I Q. I I :E to o V ... ->.-en o z :E :::> .....J ...... >.-en o z ::e :::> .....J
.....J
j:! o .-
8.0
6.0
4.0
2.0
I I I I I
I I
I
/ ~=0.55 I
I / / /
I I I I
I / I /
/ / I /
/ / / / ,~=0.60
/ / / / / /
A2657--/"":,,, //A2319 // ~=0.65 / / //
/ / // A2256 ~=0.70 / A2029 (/ / / /'
L / A426 // ", /A2199/ " / ,/ D=O 80
/ AI795 / ,,'/ ,., fJ •
/ .". ,/ "," "", ", /' A85"'" ."".."""" ,.,'" ./","'" --'"
"'''' ----:;::::", ----O~--~----~--~----~----~--~--~
0.1 0.3 0.5 0.7
RADIUS (Mpc)
Figure 2' The parameter {J measured usmg the pubbshed HEAO-l A2 and Emstem IPC fluxes. The sample error bars combme the systematic uncertamty of the HEAO-l A2 detector and the error m the IPC flux to give the error m the flux ratio The IPC fluxes, core radll, and their associated errors are from Jones and Forman (1984)
19
tv 0
INTEGRATED SURFACE BRIGHTNESS PROFILE vs. RADIUS
7~--~----~--~----~--~----~--~~---.----r----'
6 -en t-:z
5 :::::>
>-0:::
{3=0.55 « 0::: t- 4 CD 0::: « {3=0.66 x 3 :::::> .....J lL.
{3 =0.70 .....J 2 ~ 0 t-
OL---~--~----L----L--~----~--~----~--~--~
o 4 8 12 16 20
CORE RADII
Figure 3 The total flux obtamed from integratmg the surface bnghtness profile S/So = (1 + (r/a)2) -3/3+ 112 out to the specified radIUs (m umts of core radIUs a) for a value of f3 The verttcle arrows mdlcate the nommal cluster "edge" (90% of the total cluster flux). This determmatIon IS discussed m sectIOn IV of the text
-0 ::E -en en c::x: ::E
en c::x: (!)
1013
ISOTHERMAL GAS MASS
rx= 0.25 Mpe -3 -3
no= 5x 10 em
1012 L......-_--L.. __ ...I....-_----L... __ ...l-_--l. __ -l-_-----I
I 3 5 7 9 II 13 15
GAS RADIUS (CORE RADII)
Figure 4 The mass of X-ray eilllttmg gas IS calculated under the assumption of Isothermahty The total gas mass (10 solar masses) wlthm a specified number core radll IS shown for the f3 = 6 model, and for the case of a Kmg profile ({3 = 1)
21
t-:) t-:)
X-RAY CORE RADIUS vs. OPTICAL HWHM 14~--~--~~--~--~----~--~----~--~--~
12 • -c: E 10 u ~
c -en :::::> 8 -0 • c:x: c::
w 6 c:: 0 c:..:>
~ c::
4 + t • I
>< • 2 • • •
• O----~----~----~----~--~~--~----~----~--~ o 4.0 8.0 12.0 16.0
OPTICAL HWHM (arc min) FIgure 5 The charactenstIc scale length of the isothermal model IS determIned from the X-ray data and the optIcal data
The condItIon for self-consIstency, that the two determInatIOns gIve the same value, IS IndIcated by the hne Sample error bars are gIven
I\:)
w
X-RAY HWHM VS. OPTICAL HWHM 14~--.----r---.'---.----.---.----~--~~~--~
12
10 -c:: E C,,)
8 ... c
~ ::I: 3: 6 ::I:
~ 0:::
I 4 x
• 2 • • •
• O~--~--~----~--~----~---L----~--~--~--~
o 4 8.0 12.0 16.0 20.0
OPTI CAL HWHM (arc min)
Figure 6 The X-ray Half Width at Half Maximum (HWHM) and the optIcal HWHM IS shown for 25 clusters. A value of {3 specifies a given hnear relatIonship between the two HWHM The range In f3 typically observed ( 5 - 75) predicts a narrow cone of observed pairs of HWHM The Isothennal model predicts that these clusters should he In the cone Even with the large errors In the HWHM, few clusters seem to satisfy the predictIon
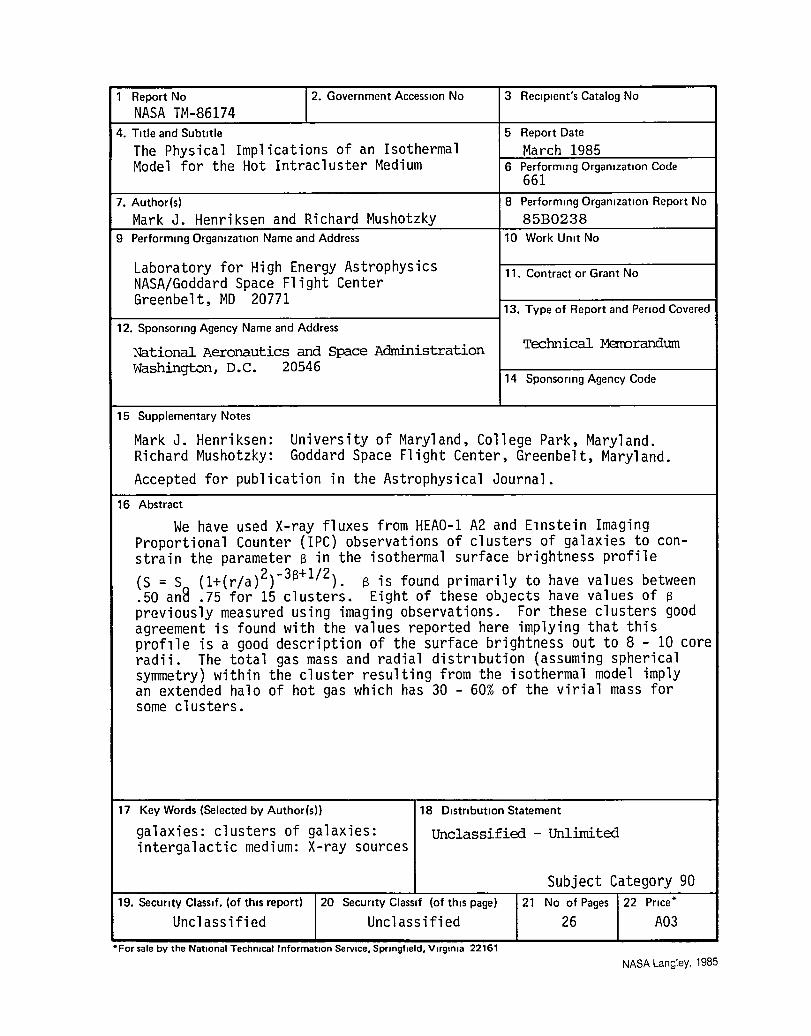
1 Report No 12. Government Accession No 3 RecIpient's Catalog No
NASA TM-86174 4. Title and Subtitle 5 Report Date
The Physical Implications of an Isothermal March 1985 Model for the Hot Intracluster Medium 6 Performing Organization Code
661 7. Author(s) 8 Performing Organization Report No
Mark J. Henriksen and Richard Mushotzky 85B0238 9 Performing Organization Name and Address 10 Work Unit No
Laboratory for High Energy Astrophysics 11. Contract or Grant No NASA/Goddard Space Flight Center Greenbelt, MD 20771
13. Type of Report and Period Covered
12. Sponsoring Agency Name and Address
National Aeronautics and Space Administration Technical Merrorandum
Washington, D. c. 20546 14 Sponsoring Agency Code
15 Supplementary Notes
Mark J. Henriksen: University of Maryland, College Park, Maryland. Richard Mushotzky: Goddard Space Flight Center, Greenbelt, Maryland. Accepted for publication in the Astrophysical Journal.
16 Abstract
We have used X-ray fluxes from HEAO-1 A2 and Elnstein Imaging Proportional Counter (IPC) observations of clusters of galaxies to con-strain the parameter 8 in the isothermal surface brightness profile (S = S (l+(r/a)2)-38+1/ 2). 8 is found primarily to have values between .50 an8 .75 for 15 clusters. Eight of these obJects have values of S previously measured using imaging observations. For these clusters good agreement is found with the values reported here implying that this proflle is a good description of the surface brightness out to 8 - 10 core radii. The total gas mass and radial distrlbution (assuming spherical symmetry) within the cluster resulting from the isothermal model imply an extended halo of hot gas which has 30 - 60% of the vi rial mass for some clusters.
17 Key Words (Selected by Author(s)) 18 Distribution Statement
galaxies: clusters of galaxies: Unclassified - Unlimited intergalactic medium: X-ray sources
Subject Category 90 19. Security Classlf. (of thiS report) 20 Security Classlf (of thiS page) 21 No of Pages 22 Price *
Unclassified Unclassified 26 A03 . For sale by the National Technical Information Service, Springfield, Virginia 22161
NASA Langley, 1985

End of Document