non-isothermal modeling of drying kinetics of ceramic tiles
39
1 NON-ISOTHERMAL MODELING OF DRYING KINETICS OF CERAMIC TILES Juan Carlos Jarque 1 , Carmen Segarra 1 , Vicente Cantavella 1 , Rosa Mondragón 2* 1 Instituto de Tecnología Cerámica. Universitat Jaume I. Campus de Riu Sec. 12071-Castellón de la Plana. Spain 2 Departamento de Ingeniería Mecánica y Construcción. Universitat Jaume I Campus de Riu Sec. 12071-Castellón de la Plana. Spain * Corresponding author. E-mail: [email protected]. Tel: +34 964728146. Fax: +34 964728106
-
Upload
khangminh22 -
Category
Documents
-
view
3 -
download
0
Transcript of non-isothermal modeling of drying kinetics of ceramic tiles

1
NON-ISOTHERMAL MODELING OF DRYING KINETICS OF CERAMIC
TILES
Juan Carlos Jarque1, Carmen Segarra1, Vicente Cantavella1, Rosa Mondragón2*
1 Instituto de Tecnología Cerámica. Universitat Jaume I.
Campus de Riu Sec. 12071-Castellón de la Plana. Spain
2 Departamento de Ingeniería Mecánica y Construcción. Universitat Jaume I
Campus de Riu Sec. 12071-Castellón de la Plana. Spain
* Corresponding author. E-mail: [email protected]. Tel: +34 964728146. Fax: +34
964728106

2
Abstract
The present study has been undertaken to optimise the drying stage in ceramic tile
manufacture. Tests were conducted to determine drying kinetics, establishing how air
temperature and relative humidity influenced this process. Tests show that surface
moisture content does not evolve as might be expected on the basis of the simple
assumption that the surface dries immediately and reaches equilibrium moisture content.
A non-isothermal model was proposed to model drying curves successfully. The
influence of drying temperature, bulk density of the shaped material and tile thickness
on the drying process and the parameters of the model was obtained.
Key words: Drying, kinetics, mass transfer, ceramic tiles, microstructure

3
1 Introduction
The basic drying operation has been widely studied. However, studies have
largely focused on identifying the material properties that most affect drying kinetics,
and on analysing how those properties vary with the temperature, moisture and
microstructure of the solid. These studies allow a comparative analysis of the materials
but the results are not readily extrapolable to industrial conditions. The knowledge of
the evolution of moisture content during drying is necessary for good control of quality
product and to optimize the drying conditions and the dryer selection.
In general, drying processes can be divided into two drying stages (1, 2). During
the first drying period the shaped solid enters the hot medium, undergoes sensible
heating up to wet bulb temperature and then evaporation from the surface starts. The
moisture migrates from the inner part of the solid, rapidly enough to maintain surface
saturation. This stage is also known as the constant rate period, since the change of
moisture per unit time remains steady. At the critical moisture content, the surface
cannot longer be maintained saturated by moisture migration and the second drying
period begins. In this period, called falling rate period, the evaporation occurs through
the pores of the solid, with the vapour diffusing out to the surface and the interface
temperature starts to increase. At this stage an internal diffusion resistance in the drying
material increasingly controls the speed of the drying process. This drying process ends
when the solid achieves the equilibrium moisture content with the surrounding medium.
Available models to describe the drying kinetics of thick materials like ceramic
tiles can be classified in general models (equilibrium drying model and characteristic
drying curve), lumped diffusion models and retreating front models (2). Several models
have been developed and applied to the drying of flat, porous materials, based on the
diffusion of water content trough the solid (3-8). Recently, models based on the Fick
4
differential diffusion equation were used to model the drying curves of clay tiles under
different experimental conditions (9-12). In these works an effective diffusion
coefficient was used to take into account all secondary types of mass transfer.
However, they assume that the drying process mainly occurs through the second drying
period due to the low moisture content, the moisture transport occurs only by diffusion
being the diffusion coefficient constant, and the temperature of the solid immediately
reaches the drying temperature having thus a constant value. Therefore, in these models
only the isothermal convective drying process is considered. The effect of temperature
variation on the ceramic tile drying process has only recently been considered (13-19).
These previous works perform simulations of the drying kinetics considering the surface
temperature and temperature profiles inside the solid.
Usually drying curves are monotonously decreasing functions with time and it is
not too difficult to describe such kind of functions, because many two parameter
functions may do well. However, in the case in which an excellent agreement between
experiment and model is obtained, it does not really say anything about the correctness
of the model (2). It is recommended that for approximate methods, that require a priori
information about the type of diffusion relationship, more physical information is
inserted.
Conventional isothermal models tend to display two drawbacks: 1) they fail to
reproduce correctly the behaviour of the pieces in the first drying stages, and 2) they
usually make the initial assumption that the surface moisture content of the piece is in
equilibrium with atmosphere at all times. However, this important assumption, though
reasonable in principle, has not been verified. The foregoing evidences the need to
apply a kinetic model which accounts for the first drying stages (which are the most
critical) and considers the evolution of the drying temperature with time.
5
In this work, a non-isothermal model was developed. The model assumes that
two processes take place during the drying of a ceramic tile: diffusion of water content
through the pores of the solid material and a water desorption process at the tile surface.
Both mechanisms being dependant on the drying conditions (temperature and relative
humidity of the drying air) and the tile properties (bulk density of the shaped solid and
microstructure).
The present study has been undertaken to optimise the drying stage in ceramic
tile manufacture. In this work, 150x150 mm tiles have been shaped and drying tests
have been carried out in a pilot-scaled dryer. Initially, the evolution of the tile
temperature has been obtained and the inaccuracy of the isothermal model has been
stated. Because of this a non-isothermal model was developed and used to model
experimental data of drying curves obtained under different experimental conditions of
temperature (T =40 ºC – 140 ºC), bulk density of the shaped solid ( = 1943 kg/m3 –
2150 kg/m3) and tile thickness (s = 8 mm – 10 mm). The dependence of drying kinetics
on the internal microstructure of the solid was established.
2 Materials and measurement techniques
2.1 Shaping and characterization of materials
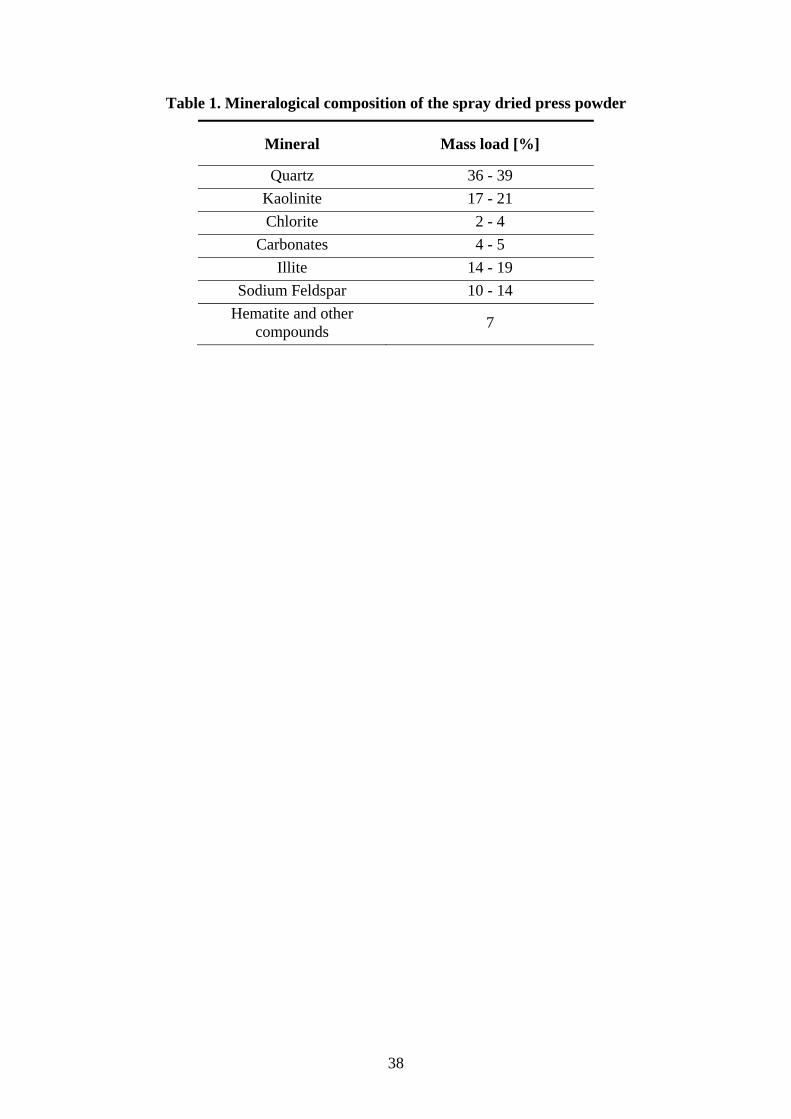
All the tests were conducted with an agglomerated press powder obtained
industrially by spray drying an aqueous suspension of ceramic raw materials. The raw
materials composition was a standard composition used in the manufacture of red-firing
stoneware tiles (hereafter, the stoneware composition). Table 1 shows the mineralogical
composition of the spray dried press powder, obtained by X-Ray Diffraction (XRD).
The size distribution of the agglomerates was measured by means of laser diffraction
with the help of a Mastersizer S (Malvern Instruments Ltd.). Figure 1 shows the results
obtained.

6
Test pieces were formed by uniaxial pressing in a semi-industrial hydraulic press
of 120 t of maximum pressing force, Maer 120T (Maer srl) that reproduces the
industrial forming process. The pieces measured 150 x150 mm, were of parallelepiped
geometry and had different thicknesses and densities. After shaping, the ceramic tiles
were stored in sealed plastic bags to maintain their moisture content until the drying test
was conducted. The bags were kept under controlled conditions of temperature
(T=20ºC) and high relative humidity (= 0.9) in order to avoid any possible
evaporation of water content. Tiles were weighted before and after the storage to check
no changes in the moisture content. Under the experimental conditions of this work, the
methodology provided good results and evaporation of water was avoided. However,
for higher moisture contents, other methodologies such as the use of metallised
packaging could be used as more effective vapour barrier, providing more reliable
results.
Press powders were shaped at three different moisture contents, X0, (5, 6 and 7%
kg water/kg dry solid) and three pressing pressures, P, (15, 25 and 40 MPa) providing
different thickness, bulk density and microstructure.
After the test pieces were pressed and dried in an oven at 120ºC for 2 h, they
were characterised, measuring their bulk density, , and the coefficient of permeability,
Kp. Bulk density was measured by the mercury displacement method. In this method the
test piece is immersed into a mercury containing receptacle, set on an electronic
balance. The upthrust of the immersed specimen is measured directly by the balance.
Bulk density is calculated from the expression:
Hgm
m 2
1 (1)

7
where m1 is the mass of the test piece, m2 is the upthrust registered by the balance and
Hg is the density of mercury.
The coefficient of permeability is measured by means of an experimental
assembly that measure the pressure loss when air circulates through the piece. The test
piece is introduced in the cell and air is forced to flow through the sample. It is
registered the time needed for a known volume of air to go through the test piece. The
resulting pressure loss at this air flow rate of air is also registered and used to calculate
the coefficient of permeability. The following equation has been obtained for porous
cylindrical samples form the Darcy’s general equation (25) :
)(
22
22
1
2
PP
P
S
hQµK va
p (2)
where a is the air viscosity, Qv is the air flow rate, h is the sample thickness, S is the air
inlet section, P1 is established as atmospheric pressure and P2 is defined as P2 = P1+P,
whereP is the pressure loss.
2.2 Measurement of tile surface moisture content
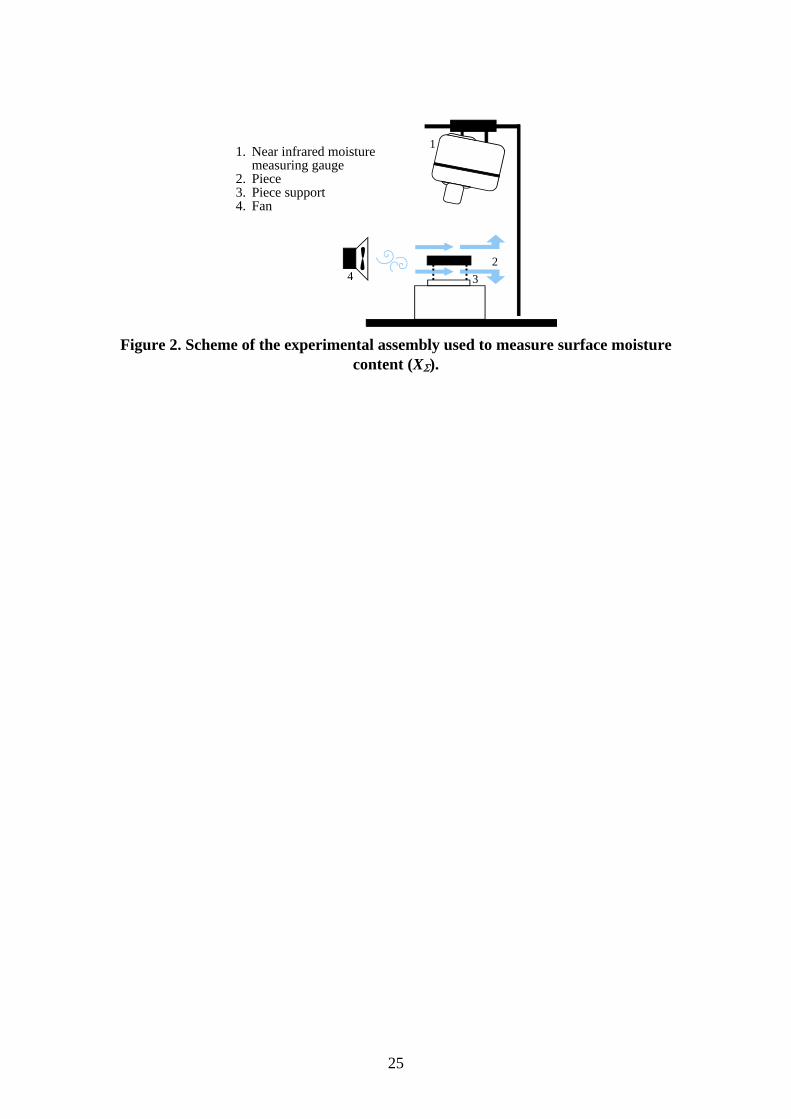
Tile surface moisture content was measured with a near infrared moisture sensor
MM710 (NDC Infrared Engineering) (calibrated for the material studied), logging the
moisture data as a function of time with an acquisition rate of 1 Hz. The test was carried
out with tiles pressed at the same initial moisture content (6%) and bulk density (2060
kg/m3). The experimental assembly used is schematically illustrated in Figure 2.
2.3 Drying
Drying tests were carried out in a pilot scale drier so the drying curves were
obtained under different experimental conditions. The experimental set-up (Figure 3) is
composed of a drying chamber with a grid where the wet tile is placed. The evolution of

8
the moisture content with time is registered by means of a balance connected to a
computer with an acquisition rate of 0.1 Hz. Temperature and humidity sensors are
connected to a PID control system acting on the heaters (two electrical heaters of 9 kW),
the water nebulizer or the inlet of external air. Type T thermocouples with an accuracy
of 0.1ºC and a relative humidity sensor with an accuracy of 2% were used. This
configuration allows to establish and to control simultaneously the experimental
conditions of temperature and relative humidity of the drying air.
3 Development and calibration of the thermal model
3.1 Analysis and limitations of the isothermal model
The model for drying kinetics of ceramic tiles under isothermal conditions
assumes that the drying mechanism is essentially diffusional through the pores of the
solid and that the effective diffusion coefficient D is independent of moisture content.
The evolution of moisture content (X) with time at any point in the piece may be
determined from (20):
XDt
X 2
(3)
To solve the foregoing equation it is necessary to specify the boundary
conditions which are obeyed at the top and bottom surfaces of the piece (The model
assumes that the surface of the piece immediately reaches the drying temperature and
the surface moisture content equals the equilibrium moisture with the surrounding air.
Thus the boundary conditions adopt the form:
aTT (4)
eXX (5)
where T is the surface temperature, Ta is the drying air temperature, X is the moisture
content at the tile surface and Xe is equilibrium moisture content with the surrounding

9
air. In addition, temperature in the isothermal model is assumed to be uniform
throughout the piece and to remain constant over time.
In order to study the applicability of the isothermal model, a series of laboratory
experiments were conducted. To analyse the first boundary condition (Equation 4), tile
top (TT) and bottom (TB) surface temperature and temperature inside the drying chamber
(Ta) were measured. The results are plotted in Figure 4. The figure shows that while the
air quickly reaches the set temperature, this is not the case with tile surface
temperatures. Therefore, although the gas temperature is constant, drying under these
conditions is non-isothermal.
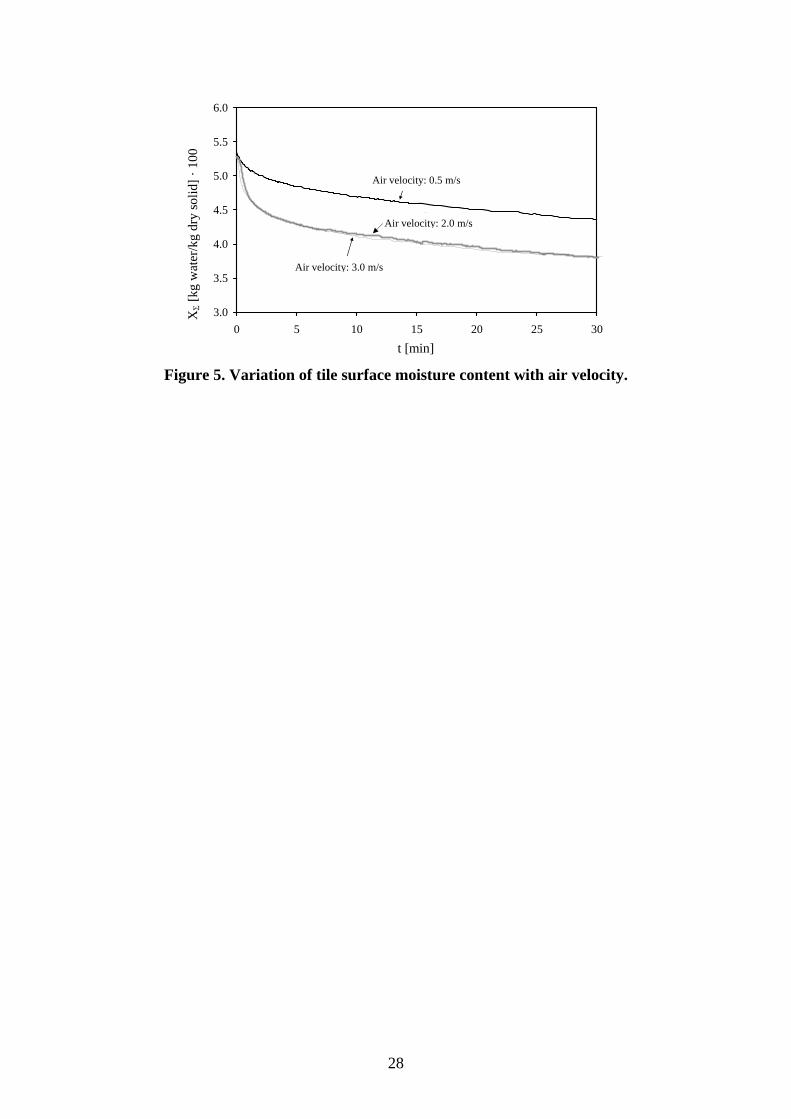
In order to verify the second boundary condition (Equation 5) tile surface
moisture content was measured with the experimental assembly depicted in Figure 2 at
different air velocities, v, (0.5, 2 and 3 m/s) in pieces with the same initial moisture
content and bulk density. Ambient conditions were: relative humidity 65% and
temperature 298 K. Results obtained are shown in Figure 5. It can be observed that the
surface moisture content is not constant and tile surface does not reach equilibrium
moisture content at any time, in contrast to the assumption in the second boundary
condition. The moisture content decreases continuously as the drying process takes
place and the surface temperature increases.
The fact that the drying rate increases when the air velocity is raised from 0.5 to
2 m/s is because the removal of water vapour from the tile surface is favoured by
convection (21). However, an additional rise in air velocity from 2 to 3 m/s does not
improve further drying, because under these conditions the process is controlled by the
migration of water from inside the solid, which is independent of air velocity.
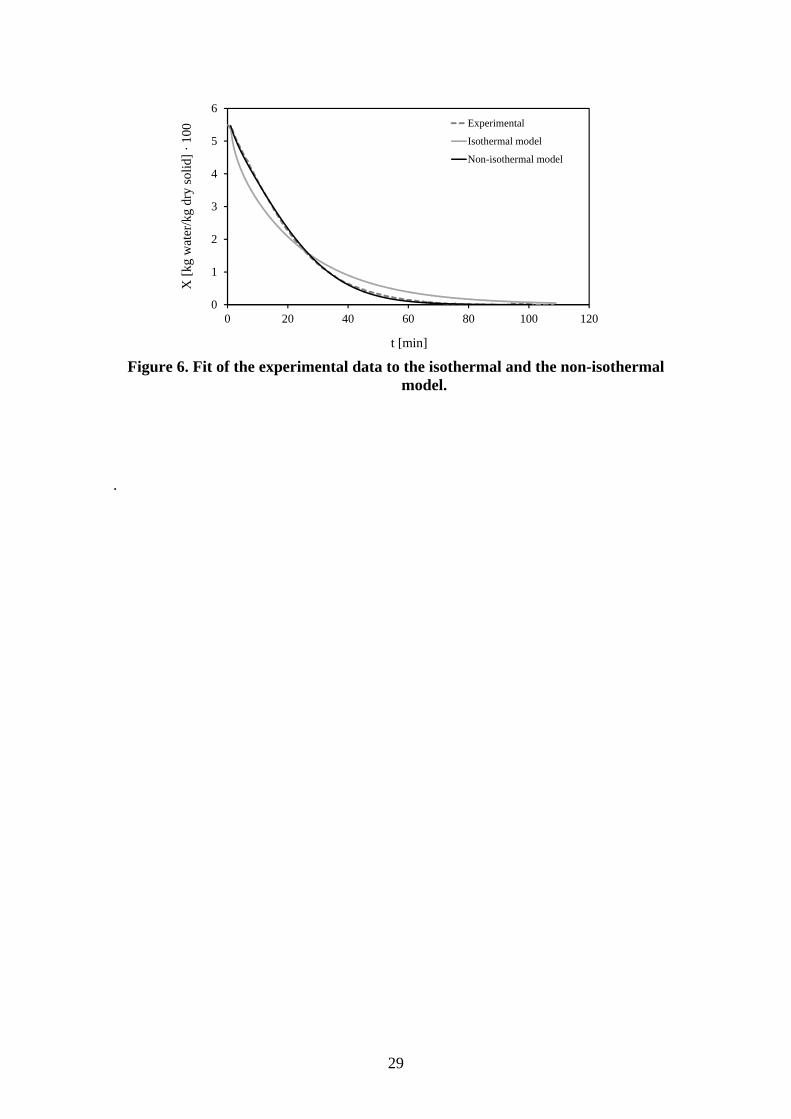
Once the assumed boundary conditions and hypotheses were checked to not be
valid, the isothermal model was expected to do not accurately fit the experimental data.

10
Figure 6 shows an experimental drying curve modelled using the isothermal model. It
can be observed that the model do not fit the experimental results. This confirms the
need, noted above, for the development of a non-isothermal model that reproduces more
accurately the ceramic tile drying process in industrial dryers (developed in next
sections but also shown in the figure).
3.2 Development of the non-isothermal model
The model for drying under non-isothermal conditions also assumes that the
moisture removal mechanism is essentially diffusional. Therefore, the following
equation can be applied:
)·( XDt
X
(6)
This expression allows determining the variation of moisture content in the tile
with time. On the other hand, the heat transfer equation in the tile can be written as (22):
Ep GTkt
Tc
2 (7)
where is the bulk density of the tile, cp is its specific heat and k is its thermal
conductivity. The heat generation term GE takes into account the variation of thermal
energy as a result of water evaporation. If LV is the enthalpy of vaporisation of water (at
the temperature considered), heat generation can be written as:
t
XL
GV
E
(8)
Combining all the expressions yields a system of equations in partial derivatives,
which adopts the form:
)·( XDtX
(9)
TXt
T 2)·( (10)
11
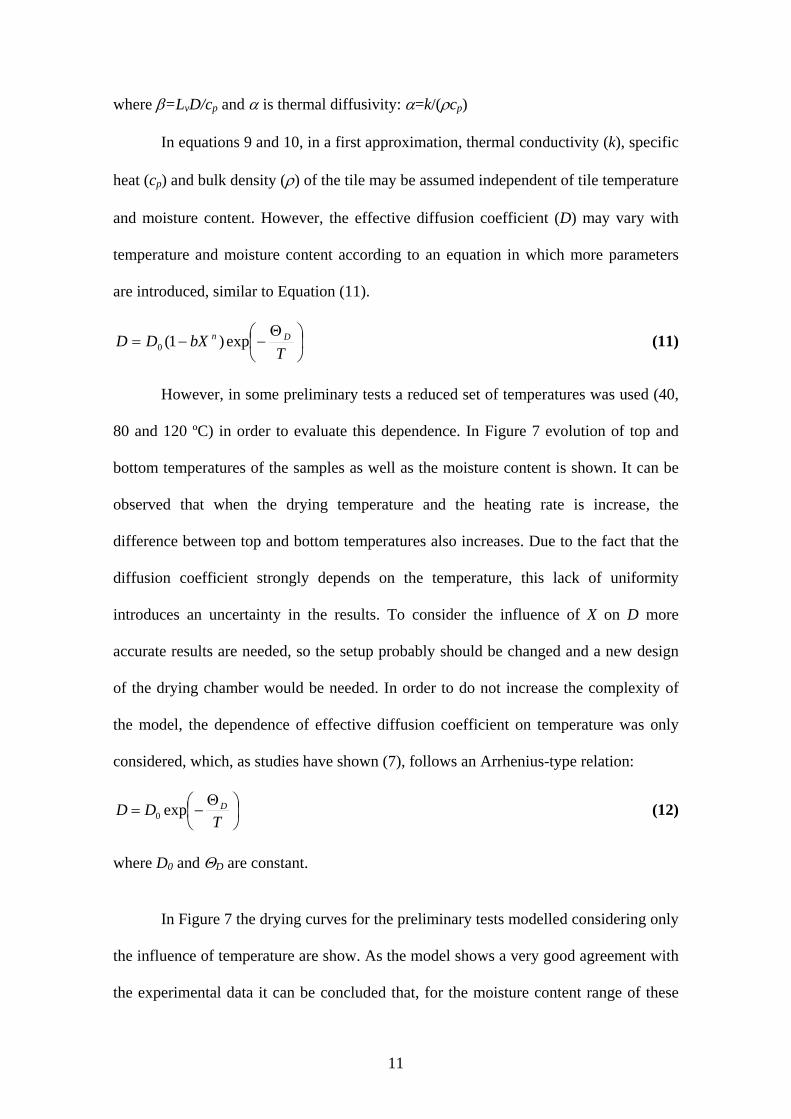
where =LvD/cp and is thermal diffusivity: =k/(cp)
In equations 9 and 10, in a first approximation, thermal conductivity (k), specific
heat (cp) and bulk density () of the tile may be assumed independent of tile temperature
and moisture content. However, the effective diffusion coefficient (D) may vary with
temperature and moisture content according to an equation in which more parameters
are introduced, similar to Equation (11).
TbXDD Dn exp)1(0 (11)
However, in some preliminary tests a reduced set of temperatures was used (40,
80 and 120 ºC) in order to evaluate this dependence. In Figure 7 evolution of top and
bottom temperatures of the samples as well as the moisture content is shown. It can be
observed that when the drying temperature and the heating rate is increase, the
difference between top and bottom temperatures also increases. Due to the fact that the
diffusion coefficient strongly depends on the temperature, this lack of uniformity
introduces an uncertainty in the results. To consider the influence of X on D more
accurate results are needed, so the setup probably should be changed and a new design
of the drying chamber would be needed. In order to do not increase the complexity of
the model, the dependence of effective diffusion coefficient on temperature was only
considered, which, as studies have shown (7), follows an Arrhenius-type relation:
TDD Dexp0 (12)
where D0 and D are constant.
In Figure 7 the drying curves for the preliminary tests modelled considering only
the influence of temperature are show. As the model shows a very good agreement with
the experimental data it can be concluded that, for the moisture content range of these
12
ceramic materials, the effective diffusion coefficient depended much more on
temperature than on moisture content, and the influence of this variable can be
neglected, thus reducing the complexity of the model while providing good results.
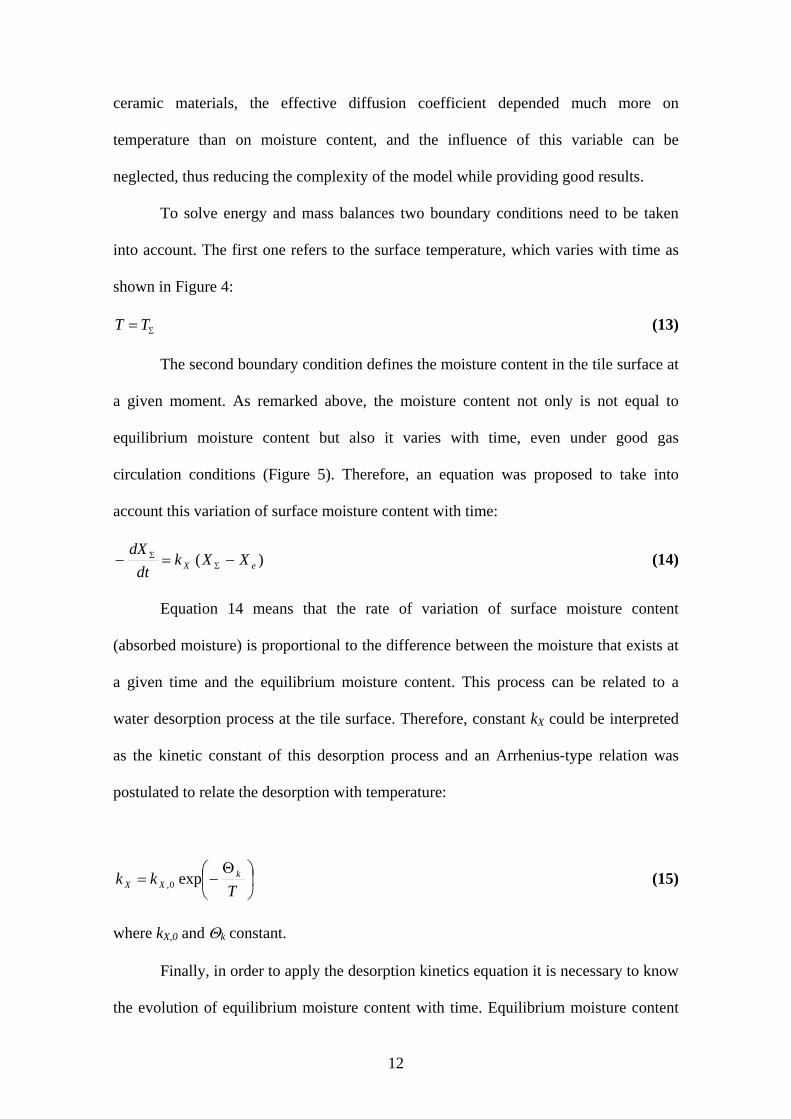
To solve energy and mass balances two boundary conditions need to be taken
into account. The first one refers to the surface temperature, which varies with time as
shown in Figure 4:
TT (13)
The second boundary condition defines the moisture content in the tile surface at
a given moment. As remarked above, the moisture content not only is not equal to
equilibrium moisture content but also it varies with time, even under good gas
circulation conditions (Figure 5). Therefore, an equation was proposed to take into
account this variation of surface moisture content with time:
)( eX XXkdt
dX
(14)
Equation 14 means that the rate of variation of surface moisture content
(absorbed moisture) is proportional to the difference between the moisture that exists at
a given time and the equilibrium moisture content. This process can be related to a
water desorption process at the tile surface. Therefore, constant kX could be interpreted
as the kinetic constant of this desorption process and an Arrhenius-type relation was
postulated to relate the desorption with temperature:
Tkk k
XX exp0, (15)
where kX,0 and k constant.
Finally, in order to apply the desorption kinetics equation it is necessary to know
the evolution of equilibrium moisture content with time. Equilibrium moisture content

13
depends on the temperature (T) and relative humidity () of the air in contact with the
piece. For a given temperature the relation Xe() is known as the equilibrium isotherm.
Although there are many expressions for Xe = Xe(,T), most of which are empirical or
semi-empirical, no valid equation could be found in the entire range of relative
humidities and air temperatures analysed, in the literature reviewed. The Henderson
isotherm, one of the most widely used isotherms in ceramic materials (23), entails the
problem that the parameters on which it depends are not constant over the entire range
of relative humidities, making it necessary to use two sets of parameters, for low and
high relative humidities, respectively.
From these previous considerations, a very simple empirical polynomial
expression was proposed to represent the equilibrium isotherm, Xe = Xe(). Regarding
that for = 0, Xe = 0 must be obeyed, the lowest-degree polynomial that fits the
experimental data adopted the form:
33
221 cccX e (16)
It was empirically established that for a given relative humidity the variation in
equilibrium moisture content fitted an exponential equation, which finally allowed the
derivation of the expression sought:
)(, 221
)( cceATX RTTXe (17)
where AX, , c1 and c2 are empirical constants and TR is the reference temperature (TR
=273 K).
4 Calibration of the non-isothermal model under laboratory conditions
In order to apply the developed model, the equilibrium isotherms as well as the
parameters kX,0, k, D0 and D need to be previously known. In addition, it was
necessary to analyse the influence of the drying cycle and the characteristics of the tile
14
on the parameters of the model. The system of differential equations (Equation 9 and
10) was solved using the implicit finite differences method (24) with the help of a
resolution algorithm programmed in C++.
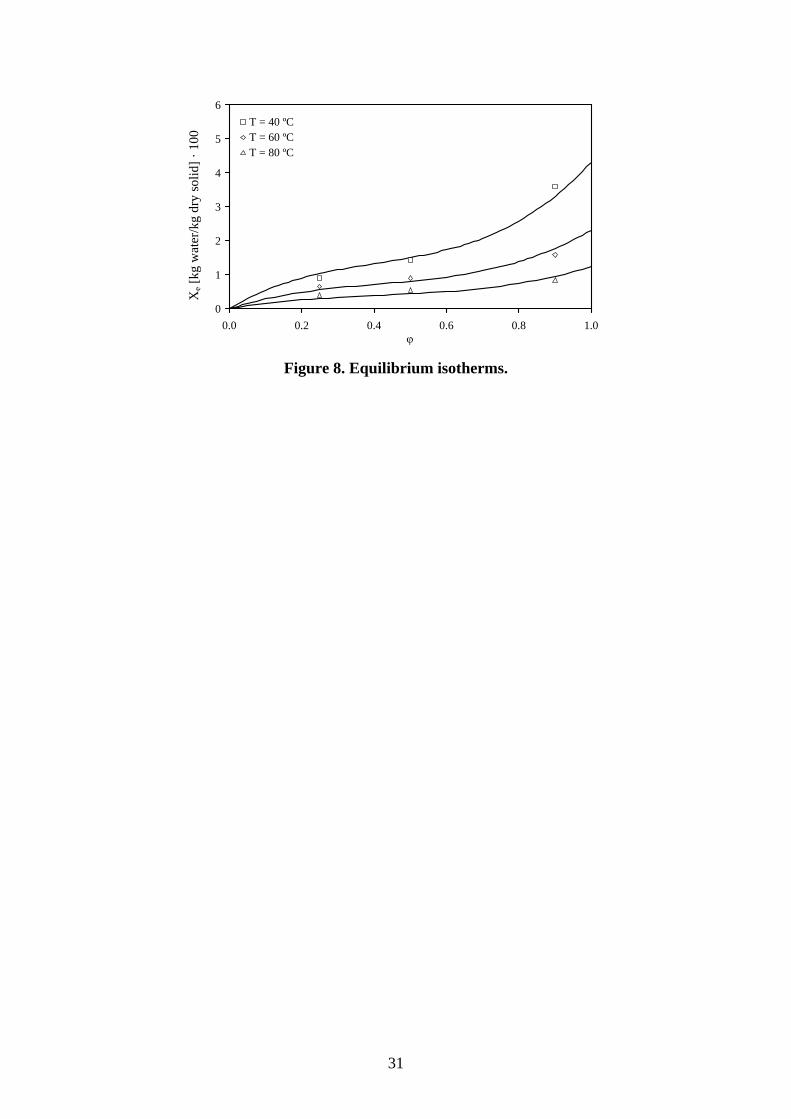
4.1 Equilibrium isotherm
The equilibrium moisture content of the spray-dried stoneware powder was
determined in a Heraeus Votsch HC 2020 climatic chamber. Tests were carried out at
three different temperatures (40ºC, 60ºC and 80ºC) and three relative humidities of the
air (0.25, 0.5 and 0.9).
Figure 8 shows the experimental results obtained together with the fitting of the
data to Equation 17. For the studied material, the parameters in the equation were as
follows: AX = 0.3291 kg water/kg dry solid; = 0.0311 K-1; c1 = 0.680; c2 = -1.226. This
correlation was used to determine the equilibrium moisture content between de ceramic
tile and the drying air under the different experimental conditions tested.
4.2 Desorption kinetics
As has been established before the drying kinetics comprises two steps: water
migration from inside the piece to the surface and desorption from the surface. The
former depends on the thickness of the piece, whereas the latter does not. Therefore, one
way of isolate both processes in order to study the desorption kinetics is to conduct
drying tests either with very thin pieces or with a layer of unshaped spray-dried powder.
In this work, the second option was chosen to determine the desorption coefficients.
In order to do that, quasi-isothermal tests were conducted (constant temperature
in the drying chamber but not in the solid surface). The material (spray-dried stoneware
powder) was spread on a tray set in the dryer chamber. The evolution of the moisture

15
content and the solid temperature during the drying process was registered by means of
the balance connected and a J-type thermocouple held to the sample. The test powders
had an initial moisture content of 6% and three drying cycles with different maximum
temperatures (40 ºC, 60 ºC and 80ºC) were selected.
Figure 9 shows the experimental drying curves for the spray-dried powders.
Data were fitted to Equation 14 and the desorption constant was obtained at different
temperatures. Finally, from Equation 15 the following values for the desorption
parameters were obtained: kX,0 = 100 s-1 and k = 3150 K.
The correlation resulting for the material tested can be used to model the
desorption process that takes place at the tile surface during the drying process, under
different experimental conditions of air temperature.
4.3 Drying kinetics
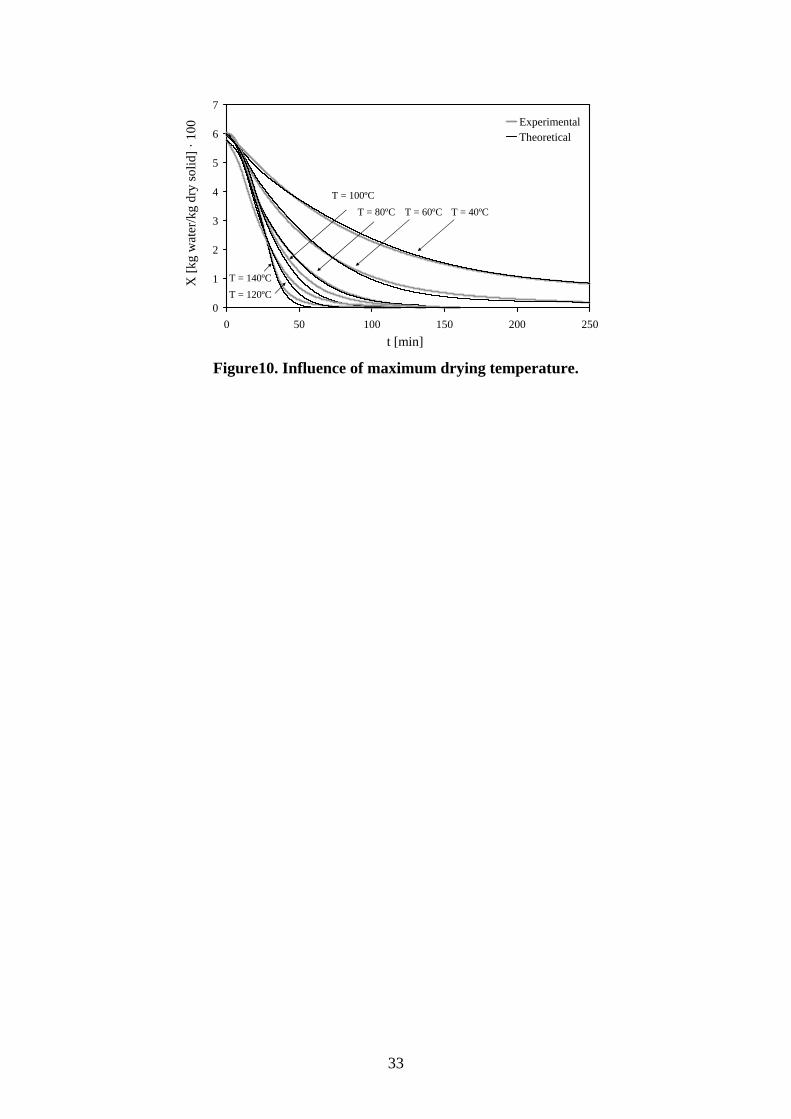
Influence of the drying temperature
Ceramic tiles were dried under different experimental conditions of drying
temperature in order to study its influence on the drying kinetics and the parameters of
the model proposed. In order to reproduce industrial drying, in which temperature does
not remain constant throughout the entire cycle, the pieces were heated from ambient
temperature to the maximum drying temperature (40, 60, 80, 100, 120 and 140ºC) at a
constant heating rate. The purpose was to reproduce the drying curves at different
temperatures, with the same set of parameters. If this was possible, the model would
probably be applicable to curves for arbitrary temperatures and, in particular, to the
temperature curve of an industrial dryer.
Tests were conducted in the pilot-scale dryer on test pieces pressed at 6% of
moisture content and a pressing pressure of 25 MPa. Under these conditions the
16
thickness of the shaped body and its bulk density were kept constant and equal to 8 mm
and 2060 kg/m3, respectively.
Figure 10 shows the drying curves obtained for the six temperatures analysed.
Experimental data were modelled using Equations 9 and 10, and the boundary
conditions established (Equations 13 and 14). From the fitting of the data, parameters in
the diffusion equation were found and the following values were obtained: D0 = 2.6·10-4
m2/s; D = 3800 K.
It can be observed that theoretical and experimental drying curves show a good
agreement. This means that parameters obtained for the desorption constant and the
diffusion coefficient can be introduced in the model proposed to simulate the drying
process of ceramic tiles dried at different temperature conditions, thus validating the
model. It can be observed some deviations of the model for high temperatures, that
could be avoid if non constant parameters were used. However, the difficulty of the
simulation would be increases. In this work a commitment between accuracy and
resolution difficulty has been achieved and the non-isothermal model, with constant
parameters, can be used to simulate the drying process accurately enough.
Influence of bulk density and tile thickness
The foregoing tests were focused on confirming the applicability of the kinetic
model at different maximum drying temperatures, without varying any characteristic of
the tiles. However, in industrial application, tile density and thickness may change; this
made it of interest to establish how the parameters of the drying model vary with these
changes.
In order to analyse the influence of the bulk density, , on the drying kinetics,
drying tests were conducted with pieces made of the same material (spray-dried
stoneware powder) shaped at different moisture contents (5, 6 and 7% kg water/kg dry

17
solid) and pressing pressures (15, 25 and 40 MPa), which yielded a wide range of bulk
densities (Table 2). The tile thickness (8 mm) and the drying temperature curve (120ºC)
were kept constant in every test.
In Figure 11 the drying curves obtained are shown. Experimental data were
modelled and the applicability of the model and the parameters previously obtained was
verified. It was found that parameters kX,0, k and D did not change with bulk density
and their values were constant (kX,0 = 100 s-1; k = 3150 K; D = 3800 K).
The fact that kX,0 and k remained constant was reasonable since they are related
to the desorption process; this occurs at the surface and must be independent, therefore,
of bulk density. The experimental results obtained corroborate that desorption kinetics
only depends on the sort of material and particle size distribution (specific surface area),
but not on the bulk density of the material, since the use of the same desorption
parameters allows the kinetic model to be fitted for pieces with different density.
However, the bulk density influences the internal microstructure and porosity of
the tile and the diffusion of water through it. Therefore, only the diffusion coefficient is
modified. In this case, the pre-exponential factor, D0, is the parameter that depends on
the bulk density. Table 2 shows the values obtained for each experimental condition
tested.
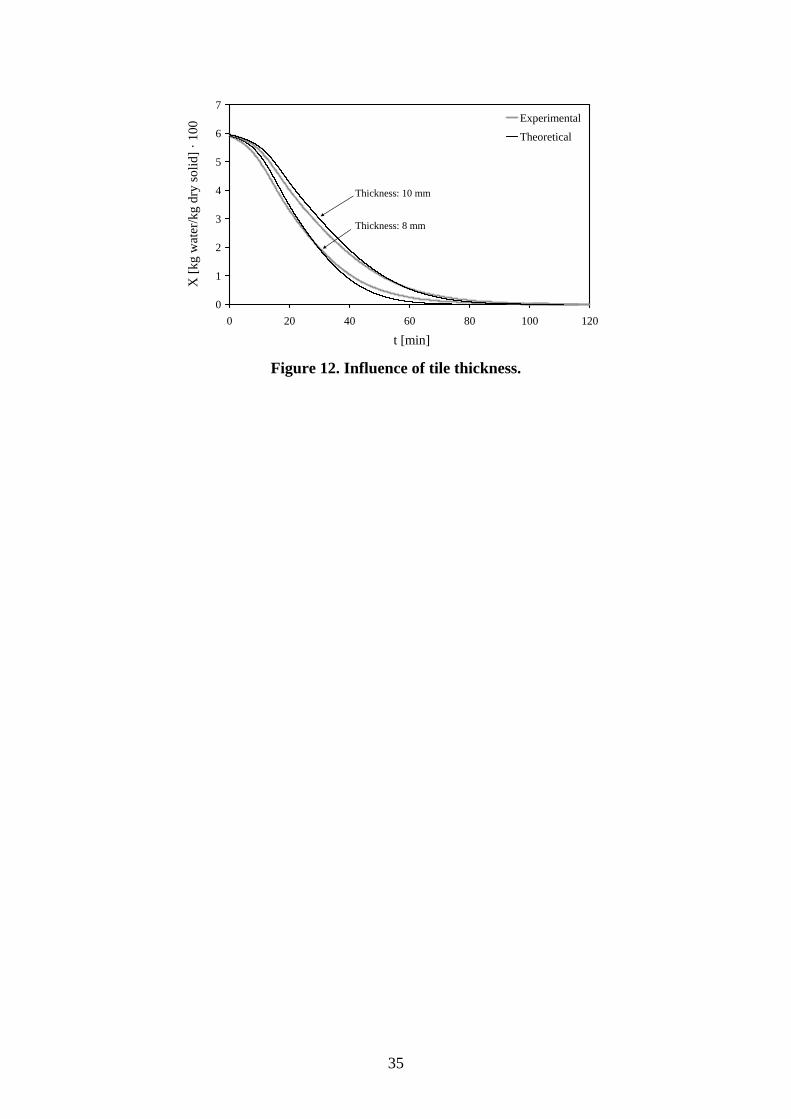
The influence of the tile thickness was analysed by performing tests with pieces
of two different thicknesses: 8 and 10 mm. The test pieces were shaped at a powder
moisture content of 6% and pressing pressure of 25 MPa and were dried in the at a
maximum drying temperature of 130ºC.
The drying curves are shown in Figure 12. Experimental data were modelled
using the non-isothermal model proposed showing a good agreement. The different
parameters of the model that are intrinsic characteristics of the material (kX,0, k and

18
D) and do not depend on the geometry of the piece, were the same found for the
previous test. However, when the tile thickness is modified but keeping constant the
shaping conditions (moisture content and pressing pressure) the bulk density changes
and the diffusion coefficient is modified as mentioned before.
From these results it can be concluded that drying curves obtained under
different experimental conditions of maximum temperature, bulk density and tile
thickness can be modelled using the non-isothermal model proposed. In all cases the
model present a good fit, being achieved the maximum deviation between experimental
a theoretical values at the early stages of drying, with relative errors lower than 10% in
all of them.
5 Relation between microstructure and drying kinetics
From the modelling of the drying curves it was concluded that the only variable
that depends on the internal microstructure of the ceramic tile and must be known in
order to simulate the drying curves, was the diffusion coefficient. Parameter D0 is the
only one that depends on tile bulk density () as shown in Table 2. Therefore, it is of
interest to obtain a correlation between both variables that can be introduced in the
drying model. In Figure 13 the logarithm of D0 is plotted versus the logarithm of the
bulk density and a linear relation was found:
lnln 0 DD baD (18)
On the other hand, the permeability coefficient, Kp, (obtained experimentally for
pieces with the same characteristics) also depends on bulk density and is a parameter
that can be used to characterize the internal microstructure of a ceramic tile. In Figure
13 it can be observed that the relation between both variables is also linear:
lnln KKp baK (19)

19
A direct relation between the diffusion coefficient and tile microstructure
(characterised by the permeability coefficient) is thus established. The two preceding
expressions then yield an interesting expression which relates the characteristic drying
parameter, D0, to a property (Kp) that quantifies the resistance to gas flow of a porous
material:
bpaKD 0 (20)
where constants a and b adopt the values 0.57 and 0.25, respectively, when D0 is
expressed in m2/s and Kp is expressed in m2.
6 Conclusions
In this work the drying kinetics of ceramic tiles was studied. Results showed that
the surface temperature of the piece does not reach immediately the drying temperature,
being the process non-isothermal. Besides, the surface moisture content also varies with
time and does not reach the equilibrium moisture content quickly.
A non-isothermal model was proposed to simulate drying curves under different
experimental conditions. The model assumes that two processes take place during the
drying of a ceramic tile: diffusion of water content through the pores of the solid
material and a water desorption process at the tile surface.
The desorption parameters were obtained from drying curves of a thin layer of
spray-dried powder and were checked to be constant and independent on the drying
conditions and the tile internal microstructure. The only variable depending on the bulk
density of the shaped material was the parameter D0 in the coefficient diffusion
equation. A correlation was found so it could be introduced in the model which was
validated showing good agreement with the experimental results.

20
Finally, a relationship between D0 and the tile permeability (Kp) was established.
This relation is especially interesting since it establishes a link between the ease of
drying and the resistance to gas flow of a porous material.
References
[1] Mujumdar, A.S. Handbook of Industrial Drying; Taylor and Francis, 2006.
[2] Coumans, W.J. Models for drying kinetics based on drying curves of slabs.
Chemical Engineering and Processing 2000, 39, 53-68.
[3] Scherer, G.W. Theory of drying. Journal of the American Ceramic Society 1990,
73, 3-14.
[4] Tomas, S.; Skansi, D.; Sokele, M. Convection drying of porous material.
Ceramics International 1994, 20, 9-16.
[5] Derdour, L.; Desmorieux, H. An analytical model for internal moisture content
during the decreasing drying rate period. AIChE Journal 2008, 54, 475-486.
[6] Chai, A.; Vakhguelt, A. Simulation on effects of porosity pattern arrangement of
porous media during drying. AIP Conference Proceedings 2012, 1440, 356-360.
[7] Escardino, A.; Gallego, M.A.; Felíu, C.; Barba, A.; Sánchez, E. Drying of
ceramic materials shaped by unidirectional pressing: I kinetic model. British
Ceramic Transactions 1993, 92 (5), 197-202.
[8] Sander, A.; Skansi, D.; Bolf, N. Heat and mass transfer models in convection
drying of clay slabs. Ceramics International 2003, 29 , 641-653.
[9] Vasic, M.; Radojevic, Z.; Grbavcic, Z. Calculation of the effective diffusion
coefficient during the drying of clay samples. Journal of the Serbian Chemical
Society 2012, 77 (4), 523-533.

21
[10] Vasic, M.; Grbavcic, Z.; Radojevic, Z. Analysis of moisture transfer during the
drying of clay tiles with particular reference to an estimation of the time-dependent
effective diffusivity. Drying Technology 2014, 32, 829-840.
[11] Vasic, M.; Grbavcic, Z.; Radojevic, Z. Determination of the moisture diffusivity
coefficient and mathematical modelling of drying. Chemical Engineering and
Processing: Process Intensification 2014, 76, 33-44.
[12] Vasic, M.; Radojevic, Z. Drying simulation of shrinkable clay tiles using variable
diffusivity model. Advanced Materials Research 2014, 837, 506-510.
[13] Pang, S.; Haslett, A.N. High-temperature kiln drying of softwood timber. The role
of mathematical modelling. In Mathematical modelling and numerical techniques
in drying technology, ed. I. Turner & A.S. Mujumbar. Marcel Dekker, New York,
1997, 179-220.
[14] Chemkhi, S.; Zagrouba, F.; Bellagi, A. Drying of ceramics: modelling of the
thermo-hydro elastic behaviour and experiments. Industrial Ceramics 2005, 25 (3),
149-156.
[15] Keum, YT.; Auh, KH. An efficient numerical method for incorporating phase
changes in ceramic drying process. Journal of Ceramic Processing Research 2002,
3 (3), 141-145.
[16] Mallol, G.; Cantavella, V.; Feliu, C.; Llorens, D. Study of ceramic tile drying under
non-isothermal conditions and its industrial application. Key Engineering Materials
2001, 213, 1755-1758.
[17] Belhamri, A. Characerization of the first falling rate period during drying of a
porous material. Drying Technology 21, 1235-1252, 2003.

22
[18] Chai, A.; Rigit, A.; Ung, H.H. Heat transfer and computational simulations on the
drying process of a kiln. Proceedings of the ASME Summer Heat Transfer
Conference 2005, 2, 583-588.
[19] Shokouhmand, H.; Hosseini, S.; Abdollahi, V. Numerical simulation of drying a
porous material using the lattice Boltzmann method. Journal of Porous Media
2012, 15, 303-315.
[20] Mujumdar, A.S. (Ed.). Advances in drying. Hemisphere: Washington, 1980.
[21] Barba, A.; Escardino, A.; Moreno, A.; Negre, F. Secado de soportes cerámicos para
pavimento de monococción. In XXX Congreso nacional de cerámica y vidrio.
1990.
[22] Incropera, F.P.; Lavine, A.S; DeWitt, D.P. Fundamentals of heat and mass transfer.
3rd ed. John Wiley & Sons: New York, 1990.
[23] Escardino, A.; Jarque, J.C.; Moreno, A.; Torre, J. Secado de materiales
cerámicos (I) consideraciones generales. Isotermas de equilibrio. Técnica
Cerámica 1990, 185, 452-462.
[24] Celia, M.A.; Gray, W.G. Numerical methods for differential equations:
fundamental concepts for scientific and engineering applications. Prentice-Hall:
Englewood Cliffs, 1991.
[25] Amoros, J.L.; Beltran, V.; Escardino, A.; Orts, M.J. Air permeability of fired
ceramic floor tile bodies. I. Influence of pressing variables and burning
temperature. Boletin de la Sociedad Española de Ceramica y Vidrio 1992, 31,
33-38.
23
Figure captions
Figure 1. Grain size distribution of the spray dried press powder.
Figure 2. Scheme of the experimental assembly used to measure surface moisture content (X).
Figure 3. Pilot scale dryer set-up.
Figure 4. Comparison of drying chamber temperature and tile surface temperature.
Figure 5. Variation of tile surface moisture content with air velocity.
Figure 6. Fit of the experimental data to the isothermal and the non-isothermal model.
Figure 7. Moisture and temperature evolution as a function of time for checking of influence of parameter on the diffusion coefficient.
Figure 8. Equilibrium isotherms.
Figure 9. Drying curves of spray dried powder. Modelling of the desorption process.
Figure 10. Influence of maximum drying temperature.
Figure 11. Influence of bulk density.
Figure 12. Influence of tile thickness.
Figure 13. Influence of bulk density on D0 and Kp.

24
0
10
20
30
40
50
60
70
80
90
100
10.0 100.0 1000.0
Diameter [µm]
Cu
mu
lati
ve v
olu
me
[%]
0
5
10
15
20
25
Fre
qu
ency
[%
]
Figure 1. Grain size distribution of the spray dried press powder.
25
11. Near infrared moisture
measuring gauge2. Piece3. Piece support4. Fan
2
34
Figure 2. Scheme of the experimental assembly used to measure surface moisture content (X).

26
1
2
3
4
5
6 678
910
11
12
13
14
1. Cámara de secado2. Soporte para piezas3. Tubo de pitot4. Balanza monoplato5. Adquisición datos6. Sensor temperatura7. Sensor humedad
8. Direccionadores de corriente9. Ventilador10. Batería resistencias eléctricas11. Sistema de nebulización de agua12. Válvula entrada aire externo13. Válvulas de recirculación14. Válvulas de purga
Figure 3. Pilot scale dryer set-up.
1. Drying chamber 2. Grid 3. Pitot tube 4. Balance 5. Data acquisition 6. Temperature sensor 7. Humidity sensor
8. Flow guides 9. Fan 10. Electric heaters 11. Water nebulizer 12. External air inlet 13. Recirculation valve 14. Purge valve

27
20
40
60
80
100
120
140
0 20 40 60 80 100 120
t (min)
T (
ºC)
T AmbT BotT Top
Figure 4. Comparison of drying chamber temperature and tile surface temperature.
t [min]
T [
ºC]
Ta
TB
TT
28
3.0
3.5
4.0
4.5
5.0
5.5
6.0
0 5 10 15 20 25 30t (min)
X
(kg
wat
er/k
g dr
y so
lid)
·100
.
Air speed: 0.5 m/s
Air speed: 3.0 m/s
Air speed: 2.0 m/s
Figure 5. Variation of tile surface moisture content with air velocity.
t [min]
X
[kg
wat
er/k
g dr
y so
lid]
· 10
0 Air velocity: 0.5 m/s
Air velocity: 2.0 m/s
Air velocity: 3.0 m/s
29
0
1
2
3
4
5
6
0 20 40 60 80 100 120
Experimental
Isothermal model
Non-isothermal model
Figure 6. Fit of the experimental data to the isothermal and the non-isothermal model.
.
t [min]
X [
kg w
ater
/kg
dry
solid
] ·
100

30
0
20
40
60
80
100
120
140
0
1
2
3
4
5
6
0 60 120 180 240 300 360 420
T [
ºC]
X [
%]
t [min]
Experimental
Theoretical
X80 X40X120
Tmax=40 ºC
Tmax=80 ºC
Tmax=120 ºC
Figure 7. Moisture and temperature evolution as a function of time for checking of influence of parameter on the diffusion coefficient.
31
0
1
2
3
4
5
6
0.0 0.2 0.4 0.6 0.8 1.0
Xe (
kg w
ater
/kg
dry
soli
d)·1
00
T = 40 ºCT = 60 ºCT = 80 ºC
Figure 8. Equilibrium isotherms.
Xe [
kg w
ater
/kg
dry
solid
] ·
100

32
0
1
2
3
4
5
6
7
0 20 40 60 80 100 120 140
t (min)
X (
kg w
ater
/kg
dry
solid
)·10
0
Experimental
Theoretical
T=40ºC
T = 60ºC
T = 80ºC
Figure 9. Drying curves of spray dried powder. Modelling of the desorption process.
t [min]
X [
kg w
ater
/kg
dry
solid
] ·
100
33
0
1
2
3
4
5
6
7
0 50 100 150 200 250t (min)
X (
kg w
ater
/kg
dry
soli
d)·1
00
ExperimentalTheoretical
T = 40ºC
T = 100ºC
T = 140ºC
T = 120ºC
T = 80ºC T = 60ºC
Figure10. Influence of maximum drying temperature.
t [min]
X [
kg w
ater
/kg
dry
solid
] ·
100

34
0
1
2
3
4
5
6
7
0 20 40 60 80 100 120t (min)
X (
kg w
ater
/kg
dry
solid
)·10
0
Experimental
Theoretical
= 2150 kg/m3
= 2060 kg/m3
= 2105 kg/m3
= 1943 kg/m3
= 2003 kg/m3
Figure 11. Influence of bulk density.
t [min]
X [
kg w
ater
/kg
dry
solid
] ·
100
35
0
1
2
3
4
5
6
7
0 20 40 60 80 100 120
t (min)
X (
kg w
ater
/kg
dry
soli
d)·1
00
Experimental
Theoretical
Thickness: 10 mm
Thickness: 8 mm
Figure 12. Influence of tile thickness.
t [min]
X [
kg w
ater
/kg
dry
solid
] ·
100

36
-37.5
-37.0
-36.5
-36.0
-35.5
-35.0
-34.5
-34.0
7.56 7.58 7.6 7.62 7.64 7.66 7.68
ln kg/m3)
ln K
p (m
2 )
-8.7
-8.6
-8.5
-8.4
-8.3
-8.2
-8.1
-8.0
-7.9
-7.8
ln D
0 (m
2 /s)
Fit of diffusionvs density
Fit of permeabilityvs density
Figure 13. Influence of bulk density on D0 and Kp.
ln [kg/m3]
ln K
p [m
2 ]
ln D
0 [m
2 /s]

37
Table captions
Table 1. Mineralogical composition of the spray dried press powder
Table 2. Bulk density and parameter D0 at different pressing pressure and moisture content.
38
Table 1. Mineralogical composition of the spray dried press powder
Mineral Mass load [%]
Quartz 36 - 39
Kaolinite 17 - 21
Chlorite 2 - 4
Carbonates 4 - 5
Illite 14 - 19
Sodium Feldspar 10 - 14
Hematite and other compounds
7

39
Table 2. Bulk density and parameter D0 at different pressing pressure and moisture content
P [MPa] X0 [kg water/kg dry solid]·
100
[kg/m3] D0[m2/s]·104
15 5 1943 3.6
15 7 2105 2.2
25 6 2060 2.6
40 5 2003 3.0
40 7 2150 2.0