EP7-A2 Interference Testing in Clin ical Chemistry ... - NextLab
120
™ (Formerly NCCLS) Providing NCCLS standards and guidelines, ISO/TC 212 standards, and ISO/TC 76 standards
-
Upload
khangminh22 -
Category
Documents
-
view
1 -
download
0
Transcript of EP7-A2 Interference Testing in Clin ical Chemistry ... - NextLab
™
(Formerly NCCLS) Providing NCCLS standards and guidelines,ISO/TC 212 standards, and ISO/TC 76 standards
Clinical and Laboratory Standards Institute Providing NCCLS standards and guidelines, ISO/TC 212 standards, and ISO/TC 76 standards Clinical and Laboratory Standards Institute (CLSI, formerly NCCLS) is an international, interdisciplinary, nonprofit, standards-developing, and educational organization that promotes the development and use of voluntary consensus standards and guidelines within the healthcare community. It is recognized worldwide for the application of its unique consensus process in the development of standards and guidelines for patient testing and related healthcare issues. Our process is based on the principle that consensus is an effective and cost-effective way to improve patient testing and healthcare services.
In addition to developing and promoting the use of voluntary consensus standards and guidelines, we provide an open and unbiased forum to address critical issues affecting the quality of patient testing and health care.
PUBLICATIONS
A document is published as a standard, guideline, or committee report.
Standard A document developed through the consensus process that clearly identifies specific, essential requirements for materials, methods, or practices for use in an unmodified form. A standard may, in addition, contain discretionary elements, which are clearly identified.
Guideline A document developed through the consensus process describing criteria for a general operating practice, procedure, or material for voluntary use. A guideline may be used as written or modified by the user to fit specific needs.
Report A document that has not been subjected to consensus review and is released by the Board of Directors.
CONSENSUS PROCESS
The CLSI voluntary consensus process is a protocol establishing formal criteria for:
• the authorization of a project
• the development and open review of documents
• the revision of documents in response to comments by users
• the acceptance of a document as a consensus standard or guideline.
Most documents are subject to two levels of consensus—“proposed” and “approved.” Depending on the need for field evaluation or data collection, documents may also be made available for review at an intermediate consensus level.
Proposed A consensus document undergoes the first stage of review by the healthcare community as a proposed standard or guideline. The document should receive a wide and thorough technical review, including an overall review of its scope, approach, and utility, and a line-by-line review of its technical and editorial content.
Approved An approved standard or guideline has achieved consensus within the healthcare community. It should be reviewed to assess the utility of the final document, to ensure attainment of consensus (i.e., that comments on earlier versions have been satisfactorily addressed), and to identify the need for additional consensus documents.
Our standards and guidelines represent a consensus opinion on good practices and reflect the substantial agreement by materially affected, competent, and interested parties obtained by following CLSI’s established consensus procedures. Provisions in CLSI standards and guidelines may be more or less stringent than applicable regulations. Consequently, conformance to this voluntary consensus document does not relieve the user of responsibility for compliance with applicable regulations.
COMMENTS
The comments of users are essential to the consensus process. Anyone may submit a comment, and all comments are addressed, according to the consensus process, by the committee that wrote the document. All comments, including those that result in a change to the document when published at the next consensus level and those that do not result in a change, are responded to by the committee in an appendix to the document. Readers are strongly encouraged to comment in any form and at any time on any document. Address comments to Clinical and Laboratory Standards Institute, 940 West Valley Road, Suite 1400, Wayne, PA 19087, USA.
VOLUNTEER PARTICIPATION
Healthcare professionals in all specialties are urged to volunteer for participation in CLSI projects. Please contact us at [email protected] or +610.688.0100 for additional information on committee participation.
EP7-A2 ISBN 1-56238-584-4
Volume 25 Number 27 ISSN 0273-3099
Interference Testing in Clinical Chemistry; Approved Guideline—Second Edition Robert J. McEnroe, PhD Mary F. Burritt, PhD Donald M. Powers, PhD Douglas W. Rheinheimer, MT Brian H. Wallace, PhD Abstract Clinical and Laboratory Standards Institute document EP7-A2—Interference Testing in Clinical Chemistry; Approved Guideline—Second Edition is intended to promote uniformity in the evaluation of interference characteristics of clinical laboratory measurement procedures. EP7 describes procedures for manufacturers to screen potentially interfering substances, to quantify interference effects, and to confirm interference in patient samples. This document also describes procedures for clinical laboratories to verify interference claims, and to investigate discrepant results caused by unsuspected interfering substances. Detailed examples are given. EP7 also contains background information on interference testing concepts, tables of recommended test concentrations for analytes and potential interference, and data collection and analysis worksheets. Clinical and Laboratory Standards Institute (CLSI). Interference Testing in Clinical Chemistry; Approved Guideline—Second Edition. CLSI document EP7-A2 (ISBN 1-56238-584-4). Clinical and Laboratory Standards Institute, 940 West Valley Road, Suite 1400, Wayne, Pennsylvania 19087-1898 USA, 2005.
The Clinical and Laboratory Standards Institute consensus process, which is the mechanism for moving a document through two or more levels of review by the healthcare community, is an ongoing process. Users should expect revised editions of any given document. Because rapid changes in technology may affect the procedures, methods, and protocols in a standard or guideline, users should replace outdated editions with the current editions of CLSI/NCCLS documents. Current editions are listed in the CLSI catalog, which is distributed to member organizations, and to nonmembers on request. If your organization is not a member and would like to become one, and to request a copy of the catalog, contact us at: Telephone: 610.688.0100; Fax: 610.688.0700; E-Mail:[email protected]; Website: www.clsi.org
Number 27 EP7-A2
ii
This publication is protected by copyright. No part of it may be reproduced, stored in a retrieval system, transmitted, or made available in any form or by any means (electronic, mechanical, photocopying, recording, or otherwise) without prior written permission from Clinical and Laboratory Standards Institute, except as stated below. Clinical and Laboratory Standards Institute hereby grants permission to reproduce limited portions of this publication for use in laboratory procedure manuals at a single site, for interlibrary loan, or for use in educational programs provided that multiple copies of such reproduction shall include the following notice, be distributed without charge, and, in no event, contain more than 20% of the document’s text.
Reproduced with permission, from CLSI publication EP7-A2—Interference Testing in Clinical Chemistry; Approved Guideline—Second Edition (ISBN 1-56238-584-4). Copies of the current edition may be obtained from Clinical and Laboratory Standards Institute, 940 West Valley Road, Suite 1400, Wayne, Pennsylvania 19087-1898, USA.
Permission to reproduce or otherwise use the text of this document to an extent that exceeds the exemptions granted here or under the Copyright Law must be obtained from Clinical and Laboratory Standards Institute by written request. To request such permission, address inquiries to the Executive Vice President, Clinical and Laboratory Standards Institute, 940 West Valley Road, Suite 1400, Wayne, Pennsylvania 19087-1898, USA. Copyright ©2005. Clinical and Laboratory Standards Institute. Suggested Citation (Clinical and Laboratory Standards Institute. Interference Testing in Clinical Chemistry; Approved Guideline—Second Edition. CLSI document EP7-A2 [ISBN 1-56238-584-4]. Clinical and Laboratory Standards Institute, 940 West Valley Road, Suite 1400, Wayne, Pennsylvania 19087-1898 USA, 2005.) Proposed Guideline August 1986 Approved Guideline December 2002 Approved Guideline—Second Edition November 2005 ISBN 1-56238-584-4 ISSN 0273-3099
Volume 25 EP7-A2
iii
Committee Membership Area Committee on Evaluation Protocols Luann Ochs, MS Chairholder Roche Diagnostics Corporation Indianapolis, Indiana Jan S. Krouwer, PhD Vice-Chairholder Krouwer Consulting Sherborn, Massachusetts George S. Cembrowski, MD, PhD Provincial Laboratory for Public Health Edmonton, Alberta, Canada David L. Duewer, PhD National Institute of Standards and Technology Gaithersburg, Maryland Anders Kallner, MD, PhD Karolinska Hospital Stockholm, Sweden Jacob (Jack) B. Levine, MBA Bayer Corporation Tarrytown, New York
Kristian Linnet, MD, PhD Psychiatric University Hospital Risskov, Denmark Kristen L. Meier, PhD FDA Center for Devices and Radiological Health Rockville, Maryland Daniel W. Tholen, MS Dan Tholen Statistical Consulting Traverse City, Michigan Advisors David A. Armbruster, PhD, DABCC, FACB Abbott Laboratories Abbott Park, Illinois R. Neill Carey, PhD, FACB Peninsula Regional Medical Center Salisbury, Maryland Carl C. Garber, PhD, FACB Quest Diagnostics, Incorporated Lyndhurst, New Jersey
Patricia E. Garrett, PhD Boston Biomedica, Inc. Portland, Maine Martin H. Kroll, MD Dallas VA Medical Center Dallas, Texas Donald M. Powers, PhD Powers Consulting Services Pittsford, New York Max Robinowitz, MD FDA Center for Devices and Radiological Health Rockville, Maryland Gian Alfredo Scassellati, PhD Ente Nazional Italiano Di Unificatione Turin, Italy Jack Zakowski, PhD Beckman Coulter, Inc. Brea, California
Working Group on Interference Testing Robert J. McEnroe, PhD Chairholder Roche Diagnostics Operations, Inc. Indianapolis, Indiana Mary E. Burritt, PhD Mayo Clinic Rochester, Minnesota Donald M. Powers, PhD Powers Consulting Services Pittsford, New York
Douglas W. Rheinheimer, MT FDA Center for Devices and Radiological Health Rockville, Maryland Brian H. Wallace, PhD LifeScan, Inc. Milpitas, California
Staff Clinical and Laboratory Standards Institute Wayne, Pennsylvania
John J. Zlockie, MBA Vice President, Standards Lois M. Schmidt, DA Staff Liaison
Donna M. Wilhelm Editor Melissa A. Lewis Assistant Editor

Number 27 EP7-A2
iv
Volume 25 EP7-A2
v
Contents
Abstract ....................................................................................................................................................i
Committee Membership........................................................................................................................ iii
Foreword.............................................................................................................................................. vii
1 Scope..........................................................................................................................................1
2 Introduction................................................................................................................................1 2.1 Measurement Procedures ..............................................................................................1 2.2 Concepts and Scientific Principles................................................................................2
3 Standard Precautions..................................................................................................................4
4 Definitions .................................................................................................................................5
5 Decision Criteria for Interference Testing .................................................................................8 5.1 Clinical Acceptability Criteria ......................................................................................9 5.2 Statistical Significance and Power................................................................................9 5.3 Analyte Test Concentrations.......................................................................................10 5.4 Potential Interfering Substances .................................................................................10 5.5 Interferent Test Concentrations...................................................................................11
6 Quality Assurance and Safety ..................................................................................................12 6.1 Training and Familiarization.......................................................................................12 6.2 Precision Verification .................................................................................................12 6.3 Trueness Verification..................................................................................................12 6.4 Carryover Assessment ................................................................................................12 6.5 Quality Control ...........................................................................................................12 6.6 Safety and Waste Disposal..........................................................................................13
7 Estimation of Interference Characteristics...............................................................................13 7.1 Interference Screen .....................................................................................................13 7.2 Characterization of Interference Effects .....................................................................20 7.3 Evaluating Combinations of Analyte and Interferent(s) .............................................26
8 Evaluating Interference Using Patient Specimens ...................................................................26 8.1 Experimental Design...................................................................................................26 8.2 Comparative Measurement Procedure........................................................................27 8.3 Patient Populations .....................................................................................................27 8.4 Experimental Procedure..............................................................................................28 8.5 Data Analysis..............................................................................................................28 8.6 Interpretation of Results..............................................................................................31
9 Establishing, Validating, and Verifying Interference Claims ..................................................31 9.1 Establishing Interference Claims ................................................................................32 9.2 Verifying Analytical Specificity .................................................................................34 9.3 Validating Analytical Specificity................................................................................35 9.4 Verifying Interference and Specificity Claims ...........................................................36
Number 27 EP7-A2
vi
Contents (Continued) 10 Investigating Discrepant Patient Results..................................................................................36
10.1 Verify System Performance........................................................................................37 10.2 Evaluate Sample Quality ............................................................................................37 10.3 Confirm the Original Result........................................................................................37 10.4 Identify Potentially Interfering Substances.................................................................38 10.5 Determine the Probable Interferent.............................................................................38 10.6 Characterize the Interference ......................................................................................39
References.............................................................................................................................................40
Appendix A. Guidelines for Specific Measurement Procedures .........................................................43
Appendix B. Analyte Test Concentrations ..........................................................................................46
Appendix C. Interferent Test Concentrations ......................................................................................49
Appendix D. Interference Test Concentrations for Endogenous Analytes ..........................................75
Appendix E. Worksheets .....................................................................................................................79
Appendix F. Calculation of Replicates for Dose-Response Tests .......................................................87
Appendix G. Preparation of Test Solutions for Interference Testing ..................................................90
Summary of Consensus Comments and Committee Responses ...........................................................96
Summary of Consensus/Delegate Comments and Committee Responses..........................................101
The Quality System Approach............................................................................................................104
Related CLSI/NCCLS Publications ....................................................................................................105
Volume 25 EP7-A2
vii
Foreword Interfering substances can be a significant source of error in clinical laboratory measurements.1-3 Such errors may, in some cases, represent a hazard to the patient. While precision is routinely monitored by internal quality control, and accuracy can be verified by comparison to reference materials or procedures, laboratories cannot easily detect error caused by interfering substances. Therefore, manufacturers of in vitro diagnostic (IVD) analytical systems must include evaluation of the effects of the potentially interfering substances in their risk analyses at the design stage. Although continuously improving the specificity of measurement procedures is a desirable goal, compromise is sometimes necessary to meet the needs of clinical laboratories. The purpose of this document is to enable manufacturers and laboratories to evaluate interfering substances in the context of medical needs and to inform their customers of known sources of medically significant error. This guideline identifies potential hazards to be evaluated in the risk management process described in ISO 14971.4 To accommodate the variety of existing and future measurement procedures, we provided guidance instead of rigid protocols. The subcommittee struck a balance between consistency of structured protocols and flexibility to accommodate the technology being evaluated. Laboratorians and manufacturers need to understand the scientific concepts, make informed choices, and work together toward the common goal of improving patient care. Clearly, identifying an interference effect, evaluating its medical significance, determining its underlying cause, and ultimately improving the measurement procedure requires close cooperation between laboratory and manufacturer. Background information is included to explain key chemical and statistical concepts. Please note that this document focuses on interference with analytical processes. It does not address physiological effects caused by drugs and their metabolites. The IFCC has issued a series of recommendations on drug effects5-7 that have been published as a compendium.8 Comprehensive literature surveys of the analytical and physiological effects of drugs and other substances have been published.9-11 The basic substance of EP7-A2 remains unchanged. A thorough review of the exogenous and endogenous compounds recommended for testing was performed. Each drug or drug metabolite was systematically categorized into specific drug classes. This guideline was developed to inform the reader and provide a logical approach to complete the evaluation of the effects of potentially interfering compounds on the measurement procedure test results. The guideline is intended to make the decision easier by basing it on reasonable, objective criteria. We now ask the reader to give us comments and suggestions. Each comment and suggestion will be considered carefully at the next revision. A Note on Terminology CLSI, as a global leader in standardization, is firmly committed to achieving global harmonization wherever possible. Harmonization is a process of recognizing, understanding, and explaining differences while taking steps to achieve worldwide uniformity. CLSI recognizes that medical conventions in the global metrological community have evolved differently in the United States, Europe, and elsewhere; that these differences are reflected in CLSI, ISO, and CEN documents; and that legally required use of terms, regional usage, and different consensus timelines are all obstacles to harmonization. Despite these obstacles, CLSI recognizes that harmonization of terms facilitates the global application of standards and is an area that needs immediate attention. Implementation of this policy must be an evolutionary and educational process that begins with new projects and revisions of existing documents. In order to align the usage of terminology in this document with that of ISO, the following terms are used in EP7-A2:
Number 27 EP7-A2
viii
The term trueness has replaced the term accuracy when referring to the closeness of agreement between the average value obtained from a large series of test results and an accepted reference value. Accuracy, in its metrological sense, refers to the closeness of the agreement between the result of a single measurement and a true value of a measurand, thus comprising both random and systematic effects. The term measurement procedure has replaced the terms method, analytical method, and analytical system for a set of operations used in the performance of particular measurements according to a given method. The term assay has been replaced by method, measurement procedure, measurement, analyze, and analysis as appropriate. At this time, due to user unfamiliarity, the term examination is not used in this edition of EP7. The terms specimen and sample are both used in this document, with specimen reserved for material collected directly from the patient, and sample reserved for aliquots of the patient specimen and for processed materials (e.g., PT samples, reference materials). The term analyte is used appropriately in this document. The term analyte is used to represent the particular component of interest to the patient diagnosis, while the term measurand is used to describe the specific quantity that is measured by a particular measurement procedure (i.e., the measurand describes what is actually causing the result of the measurement). This important difference can be subtle, since it can be due to the detection of different measurands in the procedures being compared. The term precision is a measure of “closeness of agreement between independent test/measurement results obtained under stipulated conditions.”12 The terms in this document are consistent with uses defined in the ISO 3534 and ISO 5725 series of standards. At this time, due to user unfamiliarity and for the sake of the practicability of the guideline, it is important to point out that the working group has chosen not to replace the term interfering substance or interferent with the VIM (International Vocabulary of Basic and General Terms in Metrology) term influence quantity (i.e., quantity that is not the measurand but that affects the result of the measurement). The users of EP7 should understand that the fundamental meanings of the terms are identical, and to facilitate understanding, the terms are defined along with their ISO counterparts in the guideline’s Definitions section. All terms and definitions will be reviewed again for consistency with international use, and revised appropriately during the next scheduled revision of this document. Key Words
Evaluation, hazard analysis, interference, interferent, matrix effects, performance claims, risk management, specificity, validation, verification
Volume 25 EP7-A2
©Clinical and Laboratory Standards Institute. All rights reserved. 1
Interference Testing in Clinical Chemistry; Approved Guideline—Second Edition
1 Scope This document is intended to serve two purposes: 1) to assist manufacturers and other developers of laboratory measurement procedures in characterizing
the susceptibility of measurement procedures to interfering substances, by offering scientifically valid experimental designs, by specifying the relevant substances and concentrations to be tested, and by clarifying appropriate data analysis and interpretation, so that potential hazards can be evaluated and meaningful interference claims may be provided to users; and
2) to assist clinical laboratories in investigating discrepant results due to interfering substances, by defining a systematic investigation strategy, by specifying data collection and analysis requirements, and by promoting greater cooperation between laboratory users and manufacturers, so that new interferences can be identified, disclosed, and ultimately eliminated.
This guideline is intended for manufacturers of in vitro diagnostic medical devices and clinical laboratories. Manufacturers and other developers of laboratory measurement procedures are responsible for characterizing the analytical performance of their procedures and analyzing hazards to patients caused by errors due to interfering substances. Manufacturers are required to provide information about interference susceptibility to those who use their systems. NOTE: The term “manufacturer,” for the purpose of this document, is used to mean anyone that develops a measurement procedure for use in a clinical laboratory. Clinical laboratories are responsible for ensuring that measurement procedures are specific enough to meet the needs of their physician clients. Laboratories should also investigate discrepant results, identify interfering substances, and provide objective feedback to the manufacturers who supply their analysis systems. 2 Introduction 2.1 Measurement Procedures Any measurement procedure, quantitative or qualitative, may be subject to interference. This document is written for a broad spectrum of measurement procedures and analyzers. Modification may be necessary to accommodate the particular characteristics of the procedure being evaluated. Two specific method principles (i.e., separation techniques and immunochemical measurement procedures) are discussed in Appendix A. 2.1.1 Specimen Type Interferences with measurement procedures that use serum, plasma, whole blood, cerebrospinal fluid, urine, and most other body fluids may be evaluated using this guideline. 2.1.2 Interfering Substances Potentially interfering substances may originate from the following endogenous and exogenous sources:
Number 27 EP7-A2
©Clinical and Laboratory Standards Institute. All rights reserved. 2
• metabolites produced in pathological conditions, such as diabetes mellitus, multiple myeloma, cholestatic hepatitis, etc.;
• compounds introduced during patient treatment, such as drugs, parenteral nutrition, plasma
expanders, anticoagulants, etc.; • substances ingested by the patient, such as alcohol, drugs of abuse, nutritional supplements, various
foods and drink, etc.; • substances added during sample preparation, such as anticoagulants, preservatives, stabilizers, etc.; • contaminants inadvertently introduced during sample handling from sources such as hand cream,
powdered gloves, serum separators, collection tube stoppers, etc.; and • the sample matrix itself, such as chemical and physical properties that differ from the ideal fresh
sample.13-16 2.2 Concepts and Scientific Principles 2.2.1 Contribution of Interference to Inaccuracy Inaccuracy (total analytical error) consists of three principal contributors: imprecision, method-specific bias, and sample-specific bias.17,18 Measurement procedure evaluations frequently estimate only the first two. Sample-specific bias (i.e., interference) is often viewed as an isolated problem with specific samples, rather than as a quantifiable characteristic of the procedure. From the standpoint of an evaluation, susceptibility to interference causes both systematic and random error, both of which can be quantified statistically as components of inaccuracy (total analytical error).19,20 • For a given patient population, the average concentration of interfering substances in the samples
may cause a systematic bias, which will be included in the estimate of bias. Individual deviations from this average bias contribute to the total random error observed in a comparison to a more specific measurement procedure. For some procedures, random interference effects exceed imprecision as the dominant source of random error.
• For an individual patient, interfering substances cause a bias dependent on their concentrations in the
patient’s specimen. The bias changes as the interferent concentration changes (e.g., due to clearance or metabolism). The resulting change in bias could be erroneously interpreted as a change in patient condition.
2.2.2 Clinical Relevance In laboratory medicine, interference has to be viewed from a clinical perspective. Clinical relevance determines whether an analytical effect is considered interference. The form of the analyte intended to be measured and its concentration basis must be clearly defined. Paradoxically, analytical results from some measurement procedures may reflect the true analyte concentrations, but not necessarily the clinically relevant values. For example, flame photometry and indirect potentiometry correctly measure the total concentration of sodium in an aliquot of plasma, regardless of the lipid concentration. However, if the lipid concentration is high, these procedures will falsely indicate hyponatremia in a patient with proper electrolyte balance. Direct potentiometry correctly reports normal sodium in this case, because it responds to sodium activity in the plasma water fraction, which is what the body regulates. Thus, overestimating the total sodium in the sample is appropriate from
Volume 25 EP7-A2
©Clinical and Laboratory Standards Institute. All rights reserved. 3
a clinical standpoint. It is important to define the clinically relevant concentration before attempting to interpret interference test results. 2.2.3 Preanalytical Effects A change in the analyte or its concentration prior to analysis is commonly termed a “preanalytical effect.” While such effects may “interfere” with the clinical use of a laboratory result, they are not analytical interference. Unless specified otherwise, a measurement procedure should measure all of the analyte existing in the sample at the time of analysis, regardless of its origin. Common examples of preanalytical effects are: • in vivo (physiological) drug effects, such as a change in circulating hormone concentration in
response to a drug; • chemical alteration of the analyte by hydrolysis, oxidation, photodecomposition, etc.; • physical alteration of the analyte, such as enzyme denaturation; • evaporation or dilution of the sample; and • contamination with additional analyte (e.g., salts from intravenous infusion, loss of glucose from
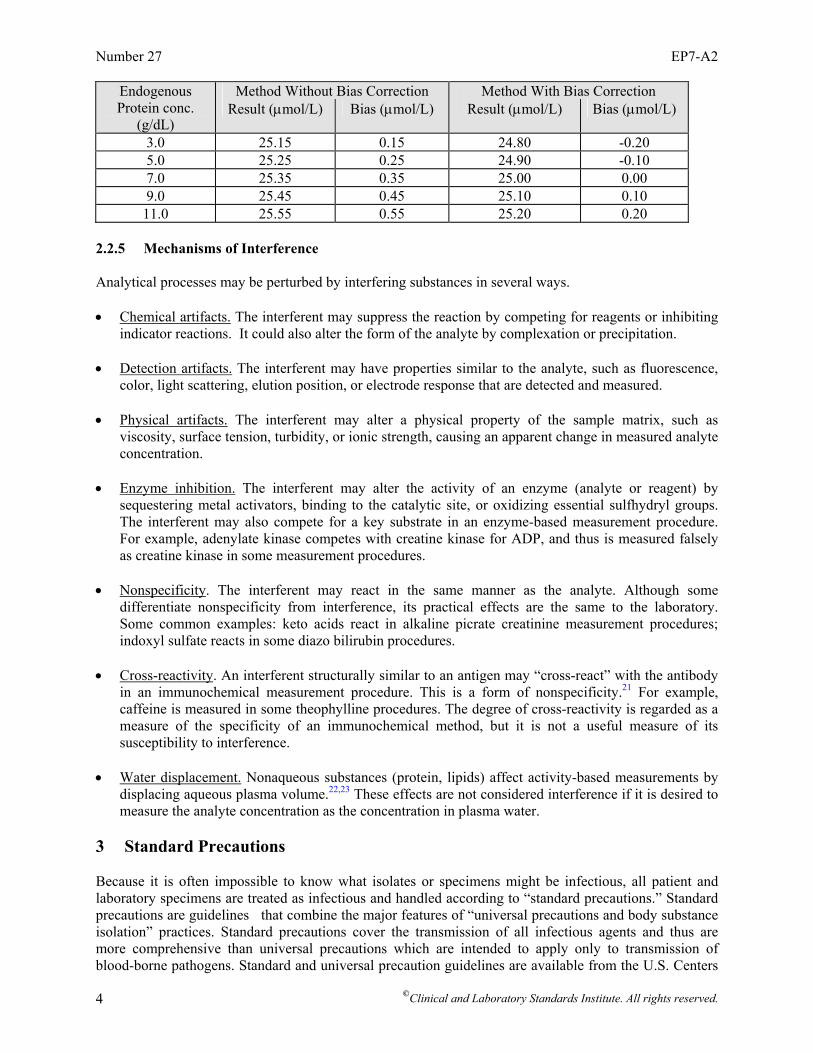
prolonged contact with the clot, or red cell contents from hemolysis). 2.2.4 Relative Interference Interference is calculated relative to the measurement of analyte in a control or base pool. In some cases, the control pool may contain a certain amount of endogenous interferent (i.e., the average concentration of the substance in the patient population from which the pool was obtained). Common examples are bilirubin, hemoglobin, protein, and lipids. Some measurement procedures compensate or correct for the average concentration of interfering substances, so that the interference effect is reduced in the patient population. Typical approaches include sample pretreatment, blanking, serum-based calibration, and mathematical correction. Error is introduced when the concentration of interfering substance in patient specimen is greater than or less than the average concentration in patient population. For example, a drug method affected by protein shows bias of 0.05 µmol/L per 1.0 g/dL protein. Since the average protein concentration in a serum sample is 7.0 g/dL, the average bias relative to a protein-free pool would be 0.35 µmol/L. If the average bias were eliminated by one of the measurement procedures mentioned above, however, the protein effect on an individual sample would be +0.05 µmol/L for each g/dL increase/decrease in protein concentration relative to an average protein concentration of 7.0 g/dL. The bias of a serum sample with 7.5 g/dL protein would be only +0.025 µmol/L, not 0.40 µmol/L. Unless the protein concentration in the sample were exactly 7.0 g/dL, the drug result for each patient specimen would show a small positive or negative bias, depending on its actual protein concentration. The following information expands on the example. Assume the true value of the hypothetical drug is 25.0 µmol/L, and the method is affected by protein to the extent described above. Note that the error due to protein ranges only +0.20 µmol/L in the bias-corrected measurement procedure, while the error ranges from +0.15 to +0.55 µmol/L in the nonbias-corrected measurement procedure.
Number 27 EP7-A2
©Clinical and Laboratory Standards Institute. All rights reserved. 4
Endogenous Method Without Bias Correction Method With Bias Correction Protein conc.
(g/dL) Result (µmol/L) Bias (µmol/L) Result (µmol/L) Bias (µmol/L)
3.0 25.15 0.15 24.80 -0.20 5.0 25.25 0.25 24.90 -0.10 7.0 25.35 0.35 25.00 0.00 9.0 25.45 0.45 25.10 0.10
11.0 25.55 0.55 25.20 0.20 2.2.5 Mechanisms of Interference Analytical processes may be perturbed by interfering substances in several ways. • Chemical artifacts. The interferent may suppress the reaction by competing for reagents or inhibiting
indicator reactions. It could also alter the form of the analyte by complexation or precipitation. • Detection artifacts. The interferent may have properties similar to the analyte, such as fluorescence,
color, light scattering, elution position, or electrode response that are detected and measured. • Physical artifacts. The interferent may alter a physical property of the sample matrix, such as
viscosity, surface tension, turbidity, or ionic strength, causing an apparent change in measured analyte concentration.
• Enzyme inhibition. The interferent may alter the activity of an enzyme (analyte or reagent) by
sequestering metal activators, binding to the catalytic site, or oxidizing essential sulfhydryl groups. The interferent may also compete for a key substrate in an enzyme-based measurement procedure. For example, adenylate kinase competes with creatine kinase for ADP, and thus is measured falsely as creatine kinase in some measurement procedures.
• Nonspecificity. The interferent may react in the same manner as the analyte. Although some
differentiate nonspecificity from interference, its practical effects are the same to the laboratory. Some common examples: keto acids react in alkaline picrate creatinine measurement procedures; indoxyl sulfate reacts in some diazo bilirubin procedures.
• Cross-reactivity. An interferent structurally similar to an antigen may “cross-react” with the antibody
in an immunochemical measurement procedure. This is a form of nonspecificity.21 For example, caffeine is measured in some theophylline procedures. The degree of cross-reactivity is regarded as a measure of the specificity of an immunochemical method, but it is not a useful measure of its susceptibility to interference.
• Water displacement. Nonaqueous substances (protein, lipids) affect activity-based measurements by
displacing aqueous plasma volume.22,23 These effects are not considered interference if it is desired to measure the analyte concentration as the concentration in plasma water.
3 Standard Precautions Because it is often impossible to know what isolates or specimens might be infectious, all patient and laboratory specimens are treated as infectious and handled according to “standard precautions.” Standard precautions are guidelines that combine the major features of “universal precautions and body substance isolation” practices. Standard precautions cover the transmission of all infectious agents and thus are more comprehensive than universal precautions which are intended to apply only to transmission of blood-borne pathogens. Standard and universal precaution guidelines are available from the U.S. Centers
Volume 25 EP7-A2
©Clinical and Laboratory Standards Institute. All rights reserved. 5
for Disease Control and Prevention (Garner JS. Hospital Infection Control Practices Advisory Committee. Guideline for isolation precautions in hospitals. Infect Control Hosp Epidemiol. 1996;17(1):53-80). For specific precautions for preventing the laboratory transmission of all infectious agents from laboratory instruments and materials and for recommendations for the management of exposure to all infectious disease, refer to the most current edition of CLSI document M29—Protection of Laboratory Workers From Occupationally Acquired Infections. 4 Definitions accuracy (of measurement) – closeness of the agreement between the result of a measurement and a true value of the measurand (VIM93)24; NOTE: See measurand below. alpha (α) error//Type I error – probability of falsely rejecting the null hypothesis that a substance does not interfere when it is true; NOTE: See confidence level below. alternative hypothesis – in Interference Testing, a statement to be tested at a specified power, that a substance causes interference greater than a specified limit (dalt); NOTE: See power and beta error below. analyte – component represented in the name of a measurable quantity (ISO 17511)25; NOTE 1: In the type of quantity “mass of protein in 24-hour urine,” “protein” is the analyte. In “amount of substance of glucose in plasma,” “glucose” is the analyte (ISO 17511)25; NOTE 2: The analyte is the particular component of interest to the patient. analytical specificity – ability of a measurement procedure to measure solely the measurand (ISO 17511).25 anomalous result – see discrepant result below. beta (β) error//Type II error – probability of falsely rejecting the alternative hypothesis that a substance causes interference when it is true; NOTE: See power below. bias – difference between the expectation of the test results and an accepted reference value (ISO 3534-1)26; NOTE: In this document the “accepted reference value” in Section 7 would be the result from the same measurement procedure in the absence of the interference. In Section 8, it would be the result from the comparative measurement procedure. clinical significance – in the context of an evaluation of measurement procedure, the importance of an error due to its potential to alter a physician’s diagnosis, treatment, or management of a patient. comparative measurement procedure – a well-characterized measurement procedure that serves as the basis for assigning the true concentration of an analyte in a sample in an evaluation of a measurement procedure. confidence level – the value (1 - α) of the probability associated with a confidence interval; NOTE 1: The probability is usually denoted as a percentage: 100 (1 - α) %; NOTE 2: See alpha error above. discrepant result//anomalous result//spurious result – result that is inconsistent to a clinically significant degree, with another result obtained from the same sample, with a result from another measurement procedure or with a well-substantiated clinical diagnosis. drug effect – term commonly used to describe the physiological influence of a drug on the in vivo concentration of a substance, as opposed to an in vitro effect on the analytical process.
Number 27 EP7-A2
©Clinical and Laboratory Standards Institute. All rights reserved. 6
endogenous interferent – physiologically occurring substance in a sample (e.g., bilirubin or hemoglobin) that causes interference with the analysis of another substance. exogenous interferent – substance originating outside the body (e.g., a drug or its metabolites, a specimen preservative, or a sample contaminant) that causes interference with the analysis of another substance in the specimen. factorial experiment – experimental design in which all possible treatment combinations formed from two or more factors, each being studied at two or more levels, are examined so that interactions (differential effects) as well as main effects can be estimated. imprecision – dispersion of independent results of measurements obtained under specified conditions; NOTE: It is expressed numerically as “standard deviation” or “coefficient of variation.” inaccuracy – numerical difference between a value and the true value; NOTE 1: See accuracy above; NOTE 2: See total analytical error below. interference – in Clinical Chemistry, a cause of clinically significant bias in the measured analyte concentration due to the effect of another component or property of the sample; NOTE: It may result from nonspecificity of the detection system, suppression of an indicator reaction, inhibition of the analyte (enzymes), or some other cause of specimen-dependent bias. interference claim – statement describing the effect that a substance may have on the results of a measurement procedure; NOTE: It is typically included in the product labeling under “Limitations of the Method.” interference criteria – maximum allowable interference resulting in the bias of measured analyte concentration from the true value that has the potential to alter a physician's diagnosis, treatment, or management of a patient. interference screen – in the evaluation of an analytical system, a series of tests performed with high concentrations of commonly occurring substances to identify those that are likely to cause interference. interference sensitivity – susceptibility of a measurement procedure to error caused by interference from other components or properties of the sample. interfering substance//interferent – this term is defined the way VIM defines “influence quantity” i.e., quantity that is not the measurand but that affects the result of the measurement (VIM93).24 matrix – all components of a material system, except the analyte (ISO 15193).27 matrix effect – influence of a property of the sample, other than the measurand, on the measurement of the measurand according to a specified measurement procedure and thereby on its measured value (ISO 17511)25; NOTE: Viscosity, surface tension, turbidity, ionic strength, and pH are common causes of matrix effects. measurand – particular quantity subject to measurement (VIM93)24; NOTE 1: This term and definition encompass all quantities, while the commonly used term analyte refers to a tangible entity subject to measurement (i.e., the measurand describes what is causing the result of the measurement [e.g., enzyme activity], and the analyte describes the particular component of interest to the patient); NOTE 2: See analyte above.

Volume 25 EP7-A2
©Clinical and Laboratory Standards Institute. All rights reserved. 7
method-specific bias – systematic error due to the characteristics and properties of the measurement procedure. nonspecificity – reactivity of an agent in a test system to substances other than the analyte of interest; NOTE: Nonspecificity is usually caused by antibodies, enzymes, ionophores, or reagents binding, complexing, or reacting with substances other than the analyte. null hypothesis – in Interference Testing, a statement to be tested at a specified confidence level, that a substance does not cause interference (dnull). one-sided test – statistical test of significance that is used when the alternative hypothesis states the direction (positive or negative) of the interference effect, such as +0.2 mg/dL bias at a creatinine concentration of 1.0 mg/dL. power – probability of not rejecting the alternative hypothesis that a substance causes interference when it is true; NOTE: The probability is usually denoted as a percentage, 100(1-β) %. precision (of measurement) – closeness of agreement between independent test results obtained under stipulated conditions (ISO 3534-1)26; NOTE: Precision is not typically represented as a numerical value but is expressed quantitatively in terms of imprecision—the standard deviation (SD) or the coefficient of variation (CV%) of the results in a set of replicate measurements. random specimen-dependent interference – variability caused by the presence of different concentrations of interfering substances in a population of patient specimens; NOTE 1: Random interference is quantified as the standard deviation of the biases of individual patient specimens19; NOTE 2: It is a component of Sy.x in regression analysis, and can be a significant contributor to total random error.17 repeatability (of results of measurements) – closeness of the agreement between the results of successive measurements of the same measurand carried out under the same conditions of measurement (VIM93)24; NOTE: Sometimes referred to as within-run precision. sample – one or more parts taken from a system and intended to provide information on the system, often to serve as a basis for decision on the system or its production (ISO 15189)28; NOTE: For example, a volume of serum taken from a larger volume of serum (ISO 15189).28 specificity – ability of a test or procedure to correctly identify or quantify an entity in the presence of interfering phenomena/influence quantities; NOTE 1: In the context of QC, the probability that a QC system will indicate absence of special cause variation (i.e., process error) when special cause variation is truly absent; 1 minus the probability of “false alarms” wherein QC data points exceed tolerance limits yet no error can be identified in the test system; NOTE 2: In Immunology, specificity is an antiserum quality defining its reactivity with defined antigens and lack of specificity is the inaccuracy introduced by cross-reacting and/or interfering substances, because cross-reacting substances compete with the analyte for antibody-binding sites. specimen (patient) – the discrete portion of a body fluid or tissue taken for examination, study, or analysis of one or more quantities or characteristics, to determine the character of the whole. specimen matrix – milieu in which the analyte exists; NOTE: Clinical specimen matrices include serum, plasma, urine, cerebrospinal fluid, and other body fluids. specimen-specific bias – difference between the measured value and the true value that results from a characteristic or property of the specimen, as opposed to a characteristic of the measurement procedure
Number 27 EP7-A2
©Clinical and Laboratory Standards Institute. All rights reserved. 8
(e.g., calibration, reagent instability); NOTE: It is the interference effect exhibited by an individual specimen. spurious result – see discrepant result above. statistical significance – importance due to the likelihood that an event did not occur by chance, based on a specified power and confidence level. therapeutic concentration – concentration of a drug that is effective in producing a desired clinical effect. total analytical error – consists of certain components and is quantified as a confidence interval with confidence level 90%, or 95%; NOTE 1: Conceptually the same as “inaccuracy;” NOTE 2: Seeks to estimate the largest likely error (of measurement) as defined by VIM: result of a measurement minus a true value (or accepted reference value); NOTE 3: Estimated from the distribution of differences in concentration between the test and reference measurement procedure. Example: 97.2% of the differences between the test and reference measurement procedure fell within the limits of ±4 mmol/L; hence the 95% total analytical error goal was met; NOTE 3: See inaccuracy above. (See the most current edition of CLSI/NCCLS document EP21—Estimation of Total Analytical Error for Clinical Laboratory Methods.) toxic concentration – concentration of a drug or other substance that is injurious to the patient. trueness – closeness of agreement between the average value obtained from a large series of test results and an accepted reference value; NOTE: The measure of trueness is usually expressed in terms of bias (ISO 3534-1).26 two-sided test – statistical test of significance that is used when the alternative hypothesis does not state the direction (positive or negative) of the interference effect, such as a ±0.2 mg/dL bias at a creatinine concentration of 1.0 mg/dL. Type I error – false rejection of the null hypothesis; NOTE: See alpha error above. Type II error – false rejection of the alternative hypothesis; NOTE: See beta error above. validation – confirmation through the provision of objective evidence, that requirements for a specific intended use or application have been fulfilled (ISO 9000)29; NOTE 1: WHO defines validation as “the action (or process) of proving that a procedure, process, system, equipment, or method used works as expected and achieves the intended result” (WHO-BS/95.1793)30; NOTE 2: The components of validation are quality control, proficiency testing, validation of employee competency, instrument calibration, and correlation with clinical findings. verification – confirmation through the provision of objective evidence that specified requirements have been fulfilled (ISO 9000)29; NOTE: A one-time process completed to determine or confirm test performance characteristics before the test system is used for patient testing. within-laboratory precision – see and use repeatability above. 5 Decision Criteria for Interference Testing Acceptability criteria must be decided prior to conducting an evaluation experiment to ensure objectivity. The evaluator has to decide what magnitude of analytical effect constitutes interference with the clinical use of the measurement results, since the appropriate experimental design for an interference test depends upon how large a discrepancy is considered clinically significant.
Volume 25 EP7-A2
©Clinical and Laboratory Standards Institute. All rights reserved. 9
In establishing acceptability criteria, the distinction must be made between clinical significance and statistical significance. Both are important in establishing useful criteria. 5.1 Clinical Acceptability Criteria The degree of allowable error caused by interference obviously depends on the medical use of the test results. Accuracy requirements (total allowable error) have been proposed for some analytes; the cited references represent a few examples.31-39 For other analytes, accuracy criteria may be established using one of the approaches described below. Limits for allowable interference can be developed by partitioning the accuracy (total allowable error) criteria into bias, imprecision, and interference components. The portion of the total error allowed for interference is the residual error after the bias and imprecision of the measurement procedure, as well as the physiological variability of the analyte, are subtracted (as variances). 5.1.1 Criteria Based on Physiological Variability One approach to establishing accuracy requirements is based on the physiological variability of the analyte.40,41 In principle, error limits are set such that analytical variability is minimized relative to the inherent variability of the analyte in the individual or the population (which depends on the clinical application of the analyte). This approach works well for physiologically controlled analytes. 5.1.2 Criteria Derived From Clinical Experience The consensus of clinical experts is frequently used to establish accuracy requirements. From their clinical experience, practitioners agree on the magnitude of an error that would influence their diagnosis or treatment decisions. Reasonable accuracy and interference criteria can be established from a cross-section of relevant clinical expertise. 5.1.3 Criteria Based on Analytical Variability Interference criteria can also be derived from the total long-term imprecision of the measurement procedure. If the effect, with high levels of the interferent in the patient samples, is small relative to the analytical variability (e.g., less than one standard deviation of it), then the increase of the total error caused by the interferent is not likely to affect clinical decisions significantly, and the substance would not be considered an interferent. 5.2 Statistical Significance and Power Before concluding that a substance interferes or does not interfere, the evaluator must be assured that the results are statistically significant. Adequate replication is required so that the test is performed with sufficient power to detect clinically significant interference, and with a sufficient confidence level to recognize when no clinically important bias exists. The statistical approach used in this guideline is called “hypothesis testing.” The evaluator decides in advance how much of a bias in a patient result would be clinically significant. The amount of this allowable bias will be referred to as the interference limit, or interference criterion. The null hypothesis that there is no interference (i.e., the bias does not exceed this limit) is then tested, as well as the alternative hypothesis that there is interference (i.e., the bias exceeds the limit). These statistical tests are made with predetermined statistical power (1 – β ) and confidence (1 – α ) levels. See Sections 7.1 to 7.1.6 to determine sample size based on power and confidence.
Number 27 EP7-A2
©Clinical and Laboratory Standards Institute. All rights reserved. 10
5.3 Analyte Test Concentrations Interference should be initially evaluated at two medical decision concentrations of the analyte. If cost or other practical considerations limit preliminary testing to only one concentration, be aware that it is possible to miss clinically significant interference at other analyte concentrations.42,43 Recommended test concentrations for many common analytes are given in Appendix B. Published critical or decision values were used when available. Selection of analyte test concentrations was somewhat arbitrary in the absence of medical consensus values, but standardization of interference claims is the important goal. The upper or lower limit of the reference range and a pathologic concentration were selected in most cases, guided by the clinical applications. 5.4 Potential Interfering Substances For a comprehensive measurement procedure characterization, begin by compiling a list of substances that have the potential to interfere. Consider substances that are likely to be present in patient specimens, based on knowledge of the chemistry of the procedure and its intended use. The following checklist is provided as a guide. • Common sample abnormalities, such as hemolysis, icterus, and lipemia. • Common prescription and over-the-counter drugs. • Abnormal biochemical metabolites expected in the patient population. • Medications most often prescribed in the patient population for which the test is ordered. • Drugs, including metabolites, which are likely to interfere with the measurement procedures because
of their chemical or physical properties. • Substances reported to interfere with similar measurement procedures. See the literature surveys by
Young et al9 and Tryding and Roos.10 • Sample additives, such as anticoagulants (heparin, EDTA, citrate, oxalate, etc.), and preservatives
(NaF, iodoacetate, HCl, etc.). • Substances that may contact specimens during collection and processing, such as serum separator
devices, specimen collection containers and their stoppers, catheters, catheter flush solutions, skin disinfectants, hand cleaners and lotions, glass washing detergents, powdered gloves, etc.
• Dietary substances known to affect certain tests (caffeine, beta-carotene, poppy seeds, etc.). The list may be quite extensive. The following can be eliminated with little risk of missing an important interferent. Be sure to document the rationale when potential interferents are ruled out. • Substances that have essentially identical composition and structure to ones already on the list.
However, all structural analogs should be tested in measurement procedures, based on the affinity of an antibody, enzyme, or other specific binding protein.
• Substances that have been shown not to interfere with measurement procedures, based on the same
scientific principle.

Volume 25 EP7-A2
©Clinical and Laboratory Standards Institute. All rights reserved. 11
• Compounds unlikely to interfere, based on expert knowledge of their chemical properties and the chemistry of the measurement procedure.
• Drugs prescribed at a dosage too low to cause interference, based on knowledge of the measurement
procedure. • Drugs cleared or metabolized so rapidly that they would not be present at an interfering concentration
at the time of analysis. 5.5 Interferent Test Concentrations To determine if a substance would interfere under “worst case” conditions, the comprehensive interference screen should be conducted at the highest concentrations that a laboratory would expect to observe among patient specimens submitted for analysis. The guidelines below are provided to assist in selecting appropriate test concentrations. Since both positive and negative effects might occur from different mechanisms (e.g., hemoglobin has catalase activity as well as strong absorbance in the visible spectrum), each substance should be tested at two different concentrations to avoid the possibility that competing effects might cancel at the concentrations tested. See Section 7.3 for a description of alternative experimental procedures that enable multiple concentrations of analyte and interferent(s) to be tested simultaneously. • Drugs and Metabolites For serum, plasma, and whole blood samples, test at least three times the highest concentration reported following a drug therapeutic dosage (acute peak concentration) or at the highest expected concentration, if known. If the expected blood concentration is not known, assume the therapeutic dose is distributed in 5 L of blood and test at least three times this concentration. See Appendix C for a table of recommended test concentrations for many common drugs. For urine, determine the maximum amount eliminated in 24 hours, and test at least three times this quantity per liter of urine. If the urinary elimination is unknown, test at least three times the maximum therapeutic dosage per liter of urine. • Endogenous Substances Identify the highest concentration expected in the intended patient population, and test at this concentration. See Appendix D for a table of recommended concentrations for testing some common endogenous constituents. • Anticoagulants and Preservatives For serum, plasma, and whole blood, test at five times the recommended additive concentration to simulate a “short draw” (i.e., partially filled blood collection tube). For urine, test at five times the amount of preservative recommended for a 24-hour collection per liter of urine. • Dietary Substances For serum, plasma, and whole blood, test at least three times the maximum expected concentration. For urine, test at five times the amount eliminated in 24 hours per liter of urine.
Number 27 EP7-A2
©Clinical and Laboratory Standards Institute. All rights reserved. 12
• Specimen Collection and Processing Devices Place the device in contact with a sample pool for 24 hours to extract any potentially interfering substances. The volume should be based on the “worst case” situation in actual use. Take precautions against sample evaporation and the loss of labile analytes, and include an appropriate control sample identical to the test sample and treated exactly the same way, except for contact with the test device. 6 Quality Assurance and Safety Before conducting an interference experiment, verify that: • instruments have been calibrated and maintained according to the manufacturer’s instructions; • the analytical system is in control and performing as expected; • all operators have been trained and demonstrate acceptable proficiency; and • laboratory safety procedures are being followed. Document compliance with the above requirements. 6.1 Training and Familiarization The individuals conducting the evaluation must be familiar with the operation of required instrumentation and be trained in the measurement procedure. Instruments must be properly maintained and repaired, and the manufacturer’s instructions must be followed. 6.2 Precision Verification The precision must be consistent with the manufacturer’s performance specifications. An estimate of repeatability is needed to determine the number of replicates required by the experiments in Section 7. If the repeatability is not known, the preliminary experiment described in the most current edition of CLSI/NCCLS document EP5—Evaluation of Precision Performance of Quantitative Measurement Methods should be performed. 6.3 Trueness Verification Bias of the measurement procedure should be determined by a suitable recovery44 or comparison of procedures experiment (see the most current edition of CLSI/NCCLS document EP9—Method Comparison and Bias Estimation Using Patient Samples for more information). Although a constant bias will not affect the interference studies, a proportional bias will cause interference to be under- or over-estimated at various analyte concentration levels. 6.4 Carryover Assessment Results could be affected by carryover from preceding samples. If carryover is present, the experiment must be designed to separate the carryover effect from the interference effect. 6.5 Quality Control The analytical system must be shown to be in stable operation before testing is begun. Performance should be monitored during the testing period by statistical quality control procedures. Follow the manufacturer’s instructions and refer to the most current edition of CLSI/NCCLS document C24—Statistical Quality Control for Quantitative Measurements: Principles and Definitions for further guidance.
Volume 25 EP7-A2
©Clinical and Laboratory Standards Institute. All rights reserved. 13
6.6 Safety and Waste Disposal For specific information on the safety, proper handling, and disposal of laboratory chemicals, refer to the manufacturer’s labeling and Material Safety Data Sheets (MSDS). This information can be obtained from the supplier. 7 Estimation of Interference Characteristics This section provides experimental procedures for evaluating the susceptibility of a measurement procedure to interfering substances. Although a laboratory may wish to follow these procedures as part of a thorough qualification of a new procedure, they are primarily intended for manufacturers to use in characterizing their procedures. There are two basic approaches to evaluating the susceptibility of a measurement procedure to interference. Each has advantages and inherent limitations, but they provide complementary information and should be used together. The two approaches are: • evaluating the effect of potentially interfering substances added to the sample of interest (see Sections
7.1 to 7.3); and • evaluating the bias of individual, representative patient specimens in comparison to a highly specific
comparative measurement procedure (see Section 8.2). 7.1 Interference Screen Adding a potentially interfering substance to a sample pool and evaluating bias relative to a control portion of the same pool is called “paired-difference testing.” Evaluating many potential interferents at relatively high concentrations to simulate “worst case” concentrations is called an “interference screen.” If no clinically significant effect is observed, the bias, if any, caused by the substance is unimportant and no further testing is performed. Substances that show a clinically significant effect are considered interferents, which are further evaluated to determine the relationship between the interferent concentration and the degree of interference. No practical interference testing strategy can identify all interfering substances. Some interferents (e.g., drug metabolites) may not be identified in the screen; other substances may be falsely classified as interferents (e.g., the form of the substance does not represent the naturally occurring form). An interference screen provides a standardized evaluation that complements studies of actual patient specimens. Two limitations of interference testing are recognized: • Properties of the compounds added to a serum pool may be different from those of the compound
naturally circulating in vivo.
• Different interference effects may offset at the concentrations of interferent and analyte tested. For this reason, hemoglobin should always be evaluated for interference at more than one concentration of bilirubin (see Section 5.5).
Data from authentic patient specimens can be used in conjunction with data from “spiked” samples to help ascertain the “truth.”
Number 27 EP7-A2
©Clinical and Laboratory Standards Institute. All rights reserved. 14
Recommended test levels are given in Appendix B for many common analytes. Each potential interferent should be tested at two analyte concentrations. If this is not practical, Appendix B identifies the preferred concentration to test. Carefully evaluate the potential for interaction, and test suspected substances at two analyte concentrations. 7.1.1 Experimental Design Both test and control pools are analyzed in the same manner as patient specimens, with adequate replication, within one analytical run. Sufficient replication is required in order to minimize the possibility of falsely rejecting the null hypothesis of no interference (in statistics, a “Type I error”), or falsely rejecting the alternative hypothesis that there is interference (a “Type II error”). The number of times each sample should be replicated depends on four factors: • magnitude of the smallest difference between the analyte test results that is considered clinically
significant; • confidence level with which the null hypothesis is tested; • power with which the alternative hypothesis is tested; and • repeatability of the measurement procedure. 7.1.2 Test Materials Sample preparations of test solutions for interference testing are provided in Appendix G. 7.1.2.1 Base Pool Prepare the base pool as follows: (1) Obtain fresh specimens of the appropriate type (serum, urine, etc.) from several healthy individuals
who are not taking medications. The pool should reflect, insofar as possible, the specimen matrix that is typically submitted for the analyte of interest.
(2) If suitable fresh specimens are not available, substitute frozen or lyophilized samples with due
caution. Processed control fluids, which may contain preservatives and stabilizers, as well as unrealistic analyte combinations, may demonstrate interference effects that differ from fresh human serum.45,46 The evaluator is responsible for validating that the test materials adequately simulate fresh clinical specimens. The most current edition of CLSI/NCCLS document EP14—Evaluation of Matrix Effects may be used for this purpose.
(3) Calculate the required pool volume, considering the measurement procedure’s sample volume
requirements, the number of substances to be tested, and the replication requirements.
(4) Determine the concentration of analyte in the base pool and adjust the test pools to the medical decision concentrations of the analyte, using suitably pure material. Avoid introducing other substances along with the analyte. See Appendix B for recommended analyte test concentrations.
Volume 25 EP7-A2
©Clinical and Laboratory Standards Institute. All rights reserved. 15
7.1.2.2 Stock Solution Prepare a stock solution of each potential interferent as follows: (1) Obtain a suitably pure form of the potential interferent, or the form that best approximates the
circulating form of the substance. If pharmaceutical-grade preparations must be used, keep in mind that they may contain excipients, preservatives, bactericides, fungicides, antioxidants, colorants, flavorings, metallic oxides, counter-ions, and fillers, any of which may be the true cause of an observed effect.
(2) Choose a solvent in which the test substance is sufficiently soluble. Check the Handbook of
Chemistry and Physics47 or the Merck Index48 for solubility of the test substances in these solvents. Verify that the solvent does not cause interference with the measurement procedure under evaluation. Some possible solvents are listed in order of general preference.
• reagent grade water (see the most current edition of CLSI document C3—Preparation and Testing of
Reagent Water in the Clinical Laboratory for detailed information); • diluted HCl or NaOH; • ethanol or methanol; • acetone; • dimethyl sulfoxide (DMSO); • other organic solvents.
(3) Dilute the sample matrix as little as possible, preferably no more than 5%, solubility permitting, by
preparing a concentrated stock solution at least 20 times the intended test concentration.
(4) Organic solvents require special consideration. Volatile solvents must be protected against evaporation. The stock solution should be prepared at the highest practical concentration. Many have very low solubility in water or can introduce artifacts by affecting the reagents or the reaction itself. Chloroform requires at least a 1:100 dilution in serum because of its low solubility. Ethanol at a concentration greater than 1 to 2% can denature antibodies.
Thoroughly document the preparation of the stock solution. NOTE: In some cases, interference may increase as the concentration of an endogenous substance (e.g., CO2, H+ [pH] or protein) decreases. To evaluate this effect, the concentration of potential interferent in the base pool must be lowered while maintaining the analyte concentration, and with minimal perturbation of the matrix. The control is prepared from the base pool, taking into account any dilution or additions. The approach used will depend on the nature of the analyte and interferent and must be validated by the evaluator.
7.1.2.3 Control Pool Prepare the control pool exactly as the test pool in all respects, except the test interferent is replaced with the same volume of solvent used to prepare the stock test pool. (1) If the test substance is present in the control pool (e.g., bilirubin), determine its concentration using a
suitable analytical measurement procedure.
Number 27 EP7-A2
©Clinical and Laboratory Standards Institute. All rights reserved. 16
(2) If the apparent analyte concentration in the control pool is unexpected compared to the base pool, evaluate the solvent as a potential interferent.
7.1.3 Replication Requirements The number of replicates required for the desired confidence and power depends on the statistical hypothesis being tested. • A two-sided test is used when the alternative hypothesis does not state the direction (positive or
negative) of the interference, such as ±0.2 mg/dL bias at a creatinine concentration of 1.0 mg/dL. • A one-sided test is used when the direction of interference (positive or negative) is included in the
alternative hypothesis, such as α-ketobutyrate causes +0.2 mg/dL bias at a creatinine concentration of 1.0 mg/dL.
7.1.3.1 Two-Sided Test For a two-sided test, reasonably assuming normal distribution of the measurement errors, a good approximation of the number of replicates required can be calculated from the following equation:
2max-12/-1 ]/)[(2 dszzn βα +=
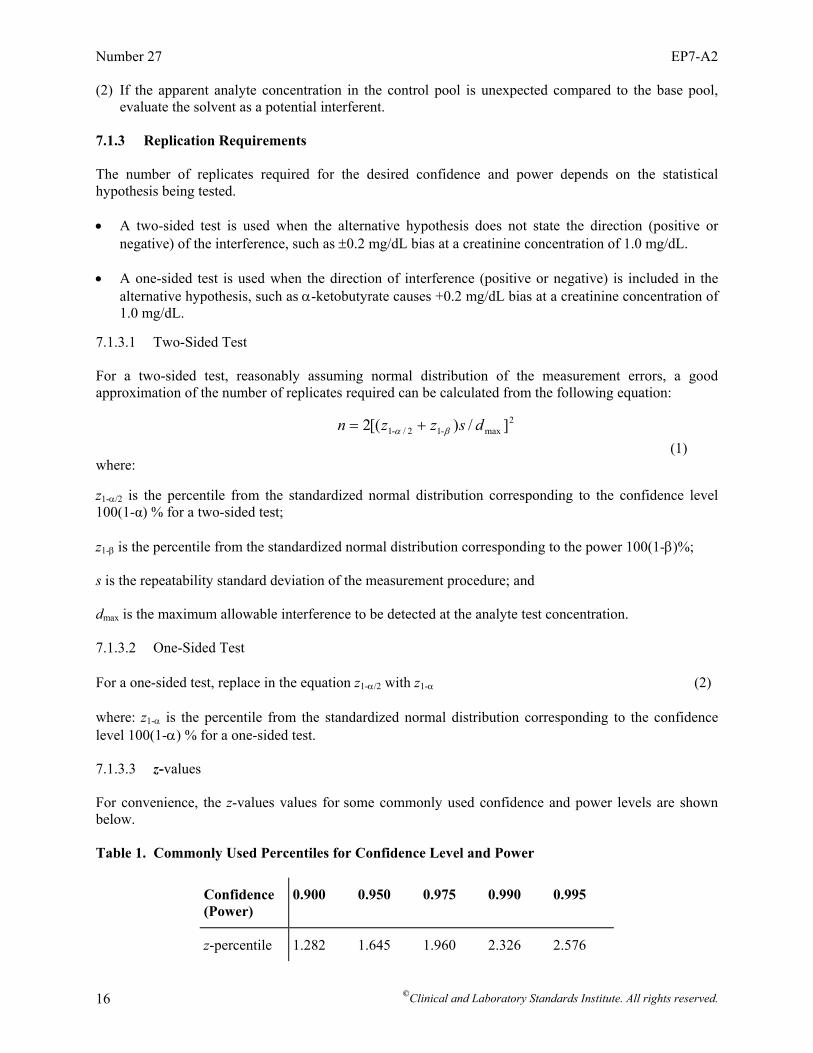
(1) where: z1-α/2 is the percentile from the standardized normal distribution corresponding to the confidence level 100(1-α) % for a two-sided test; z1-β is the percentile from the standardized normal distribution corresponding to the power 100(1-β)%; s is the repeatability standard deviation of the measurement procedure; and dmax is the maximum allowable interference to be detected at the analyte test concentration. 7.1.3.2 One-Sided Test For a one-sided test, replace in the equation z1-α/2 with z1-α (2) where: z1-α is the percentile from the standardized normal distribution corresponding to the confidence level 100(1-α) % for a one-sided test. 7.1.3.3 z-values For convenience, the z-values values for some commonly used confidence and power levels are shown below. Table 1. Commonly Used Percentiles for Confidence Level and Power
Confidence (Power)
0.900 0.950 0.975 0.990 0.995
z-percentile 1.282 1.645 1.960 2.326 2.576
Volume 25 EP7-A2
©Clinical and Laboratory Standards Institute. All rights reserved. 17
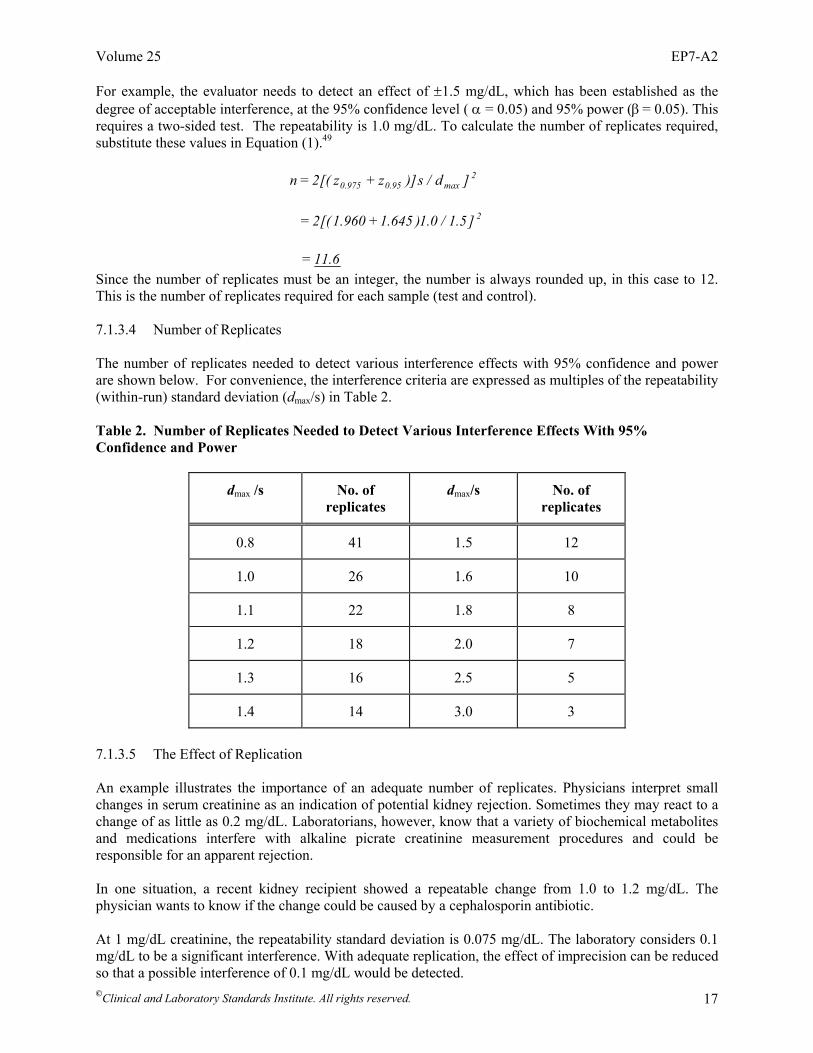
For example, the evaluator needs to detect an effect of ±1.5 mg/dL, which has been established as the degree of acceptable interference, at the 95% confidence level ( α = 0.05) and 95% power (β = 0.05). This requires a two-sided test. The repeatability is 1.0 mg/dL. To calculate the number of replicates required, substitute these values in Equation (1).49 2
max95.0975.0 ]d/s)]zz[(2n += 2]5.1/0.1)645.1960.1[(2 +=
6.11= Since the number of replicates must be an integer, the number is always rounded up, in this case to 12. This is the number of replicates required for each sample (test and control). 7.1.3.4 Number of Replicates The number of replicates needed to detect various interference effects with 95% confidence and power are shown below. For convenience, the interference criteria are expressed as multiples of the repeatability (within-run) standard deviation (dmax/s) in Table 2. Table 2. Number of Replicates Needed to Detect Various Interference Effects With 95% Confidence and Power
dmax /s No. of replicates
dmax/s No. of replicates
0.8 41 1.5 12
1.0 26 1.6 10
1.1 22 1.8 8
1.2 18 2.0 7
1.3 16 2.5 5
1.4 14 3.0 3
7.1.3.5 The Effect of Replication An example illustrates the importance of an adequate number of replicates. Physicians interpret small changes in serum creatinine as an indication of potential kidney rejection. Sometimes they may react to a change of as little as 0.2 mg/dL. Laboratorians, however, know that a variety of biochemical metabolites and medications interfere with alkaline picrate creatinine measurement procedures and could be responsible for an apparent rejection. In one situation, a recent kidney recipient showed a repeatable change from 1.0 to 1.2 mg/dL. The physician wants to know if the change could be caused by a cephalosporin antibiotic. At 1 mg/dL creatinine, the repeatability standard deviation is 0.075 mg/dL. The laboratory considers 0.1 mg/dL to be a significant interference. With adequate replication, the effect of imprecision can be reduced so that a possible interference of 0.1 mg/dL would be detected.
Number 27 EP7-A2
©Clinical and Laboratory Standards Institute. All rights reserved. 18
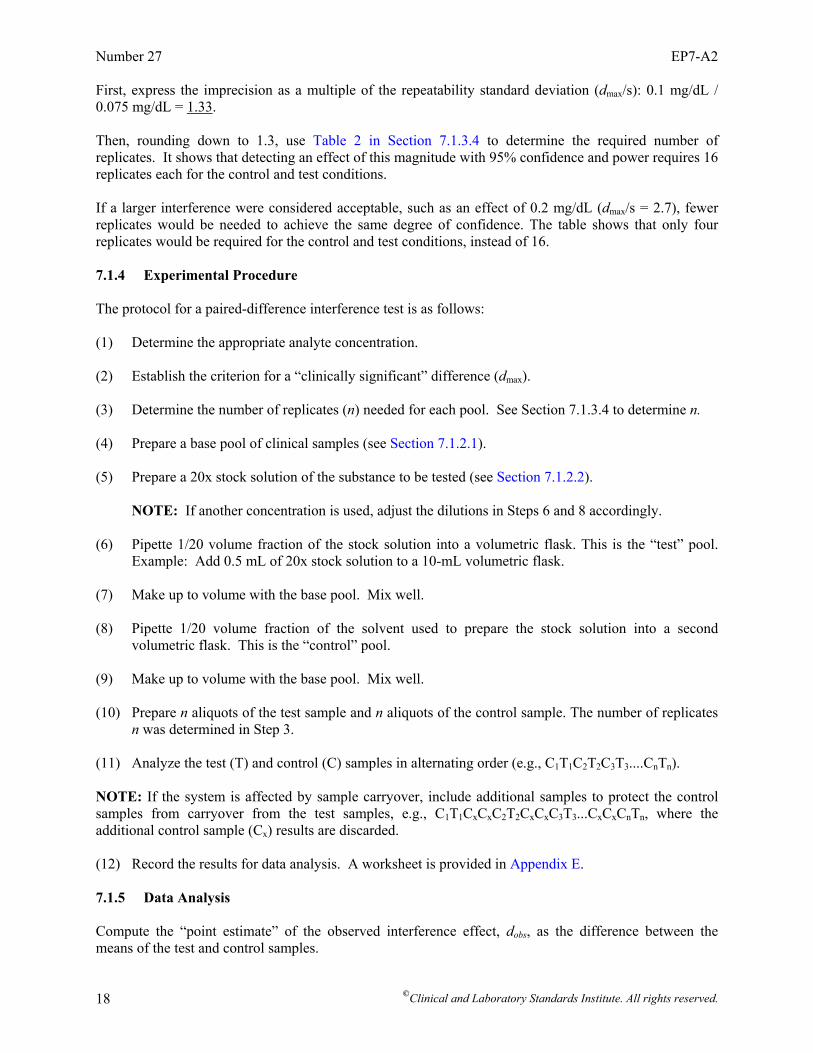
First, express the imprecision as a multiple of the repeatability standard deviation (dmax/s): 0.1 mg/dL / 0.075 mg/dL = 1.33. Then, rounding down to 1.3, use Table 2 in Section 7.1.3.4 to determine the required number of replicates. It shows that detecting an effect of this magnitude with 95% confidence and power requires 16 replicates each for the control and test conditions. If a larger interference were considered acceptable, such as an effect of 0.2 mg/dL (dmax/s = 2.7), fewer replicates would be needed to achieve the same degree of confidence. The table shows that only four replicates would be required for the control and test conditions, instead of 16. 7.1.4 Experimental Procedure The protocol for a paired-difference interference test is as follows: (1) Determine the appropriate analyte concentration.
(2) Establish the criterion for a “clinically significant” difference (dmax).
(3) Determine the number of replicates (n) needed for each pool. See Section 7.1.3.4 to determine n.
(4) Prepare a base pool of clinical samples (see Section 7.1.2.1).
(5) Prepare a 20x stock solution of the substance to be tested (see Section 7.1.2.2).
NOTE: If another concentration is used, adjust the dilutions in Steps 6 and 8 accordingly.
(6) Pipette 1/20 volume fraction of the stock solution into a volumetric flask. This is the “test” pool. Example: Add 0.5 mL of 20x stock solution to a 10-mL volumetric flask.
(7) Make up to volume with the base pool. Mix well.
(8) Pipette 1/20 volume fraction of the solvent used to prepare the stock solution into a second
volumetric flask. This is the “control” pool.
(9) Make up to volume with the base pool. Mix well.
(10) Prepare n aliquots of the test sample and n aliquots of the control sample. The number of replicates n was determined in Step 3.
(11) Analyze the test (T) and control (C) samples in alternating order (e.g., C1T1C2T2C3T3....CnTn). NOTE: If the system is affected by sample carryover, include additional samples to protect the control samples from carryover from the test samples, e.g., C1T1CxCxC2T2CxCxC3T3...CxCxCnTn, where the additional control sample (Cx) results are discarded. (12) Record the results for data analysis. A worksheet is provided in Appendix E. 7.1.5 Data Analysis Compute the “point estimate” of the observed interference effect, dobs, as the difference between the means of the test and control samples.
Volume 25 EP7-A2
©Clinical and Laboratory Standards Institute. All rights reserved. 19
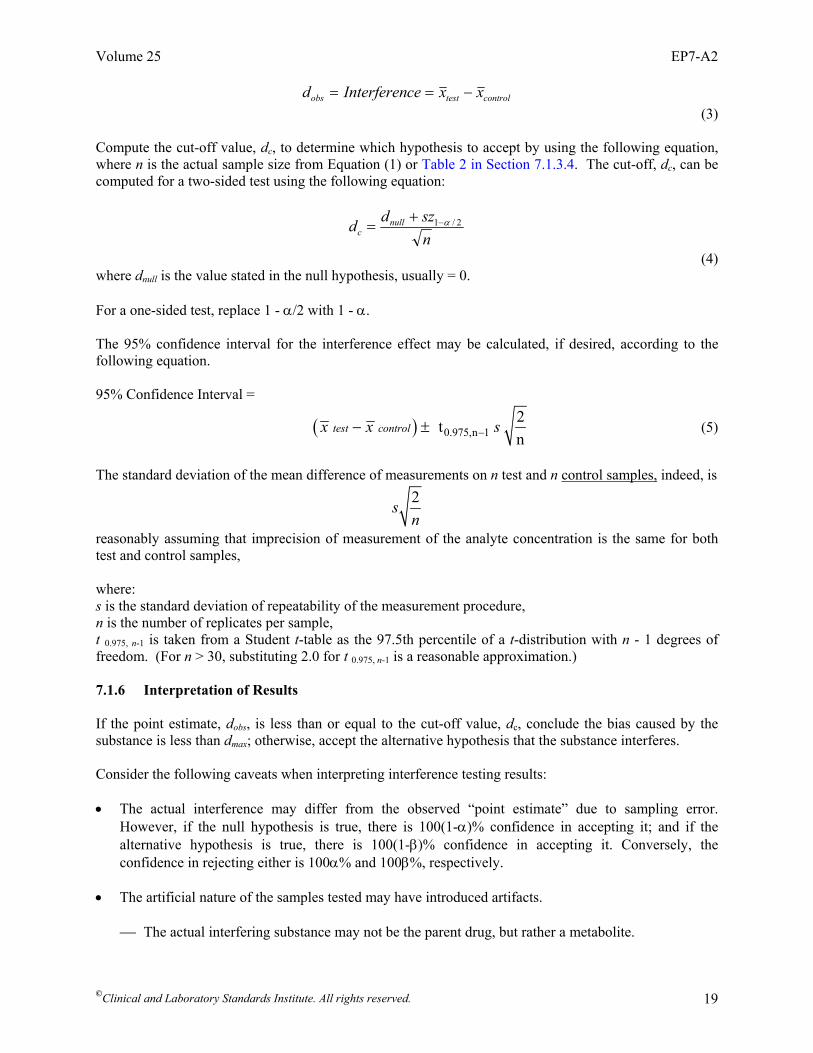
controltestobs xxceInterferend −== (3)
Compute the cut-off value, dc, to determine which hypothesis to accept by using the following equation, where n is the actual sample size from Equation (1) or Table 2 in Section 7.1.3.4. The cut-off, dc, can be computed for a two-sided test using the following equation:
nszdd null
c2/1 α−+
=
(4) where dnull is the value stated in the null hypothesis, usually = 0. For a one-sided test, replace 1 - α/2 with 1 - α. The 95% confidence interval for the interference effect may be calculated, if desired, according to the following equation. 95% Confidence Interval =
( ) 0.975,n 12tn
test controlx x s−− ± (5)
The standard deviation of the mean difference of measurements on n test and n control samples, indeed, is
2sn
reasonably assuming that imprecision of measurement of the analyte concentration is the same for both test and control samples,
where: s is the standard deviation of repeatability of the measurement procedure, n is the number of replicates per sample, t 0.975, n-1 is taken from a Student t-table as the 97.5th percentile of a t-distribution with n - 1 degrees of freedom. (For n > 30, substituting 2.0 for t 0.975, n-1 is a reasonable approximation.) 7.1.6 Interpretation of Results If the point estimate, dobs, is less than or equal to the cut-off value, dc, conclude the bias caused by the substance is less than dmax; otherwise, accept the alternative hypothesis that the substance interferes. Consider the following caveats when interpreting interference testing results: • The actual interference may differ from the observed “point estimate” due to sampling error.
However, if the null hypothesis is true, there is 100(1-α)% confidence in accepting it; and if the alternative hypothesis is true, there is 100(1-β)% confidence in accepting it. Conversely, the confidence in rejecting either is 100α% and 100β%, respectively.
• The artificial nature of the samples tested may have introduced artifacts.
⎯ The actual interfering substance may not be the parent drug, but rather a metabolite.
Number 27 EP7-A2
©Clinical and Laboratory Standards Institute. All rights reserved. 20
⎯ The test sample matrix may not represent the typical pathological samples for the analyte in question, and may introduce a matrix effect.
⎯ The substance added may not be identical to the interferent in pathological samples due, for
example, to protein binding, metal complexation, precipitation, or analyte heterogeneity.
• The arbitrary choice of test concentrations may not reveal interference.
⎯ An effect may only be expressed in synergy with other compounds.
⎯ Interference may exist at other concentrations of analyte and interferent, but not at the specific concentrations tested.
7.2 Characterization of Interference Effects If an interference effect is found at one or more analyte concentrations tested in Section 7.1, carry out a dose-response series to determine the degree of interference as a function of the interferent concentration. A dose-response series of interferent concentrations is prepared from admixtures of the highest interferent concentration pool and the control pool. 7.2.1 Experimental Design The dose-response experiment determines the relationship between the interferent concentration and the magnitude of interference, which permits estimation of the effect at any interferent concentration within the range tested. A series of test samples, systematically varying only in the concentration of interferent, is prepared by making quantitative volumetric admixtures of two pools, one at the highest concentration to be tested and the other at the lowest. All samples are analyzed together, in random order, under repeatability conditions. This is necessary to avoid run-to-run variables, such as calibration or reagent lot change, which would confound interpretation of the results. An advantage of testing multiple concentrations of interferent is that fewer replicates are required at each concentration to detect interference with the same statistical confidence. This is because the repeatability information obtained from all the samples is pooled in determining the confidence intervals. It is generally sufficient to conduct the dose-response series in triplicate at each test concentration. For those who wish to calculate the number of replicates required at each concentration to assure 95% confidence and power, the formula is given in Appendix F. 7.2.2 Test Materials 7.2.2.1 Base Pool Prepare a base pool as described in Section 7.1.2.1. 7.2.2.2 Stock Solution Prepare a stock solution of the potential interferent as described in Section 7.1.2.2.
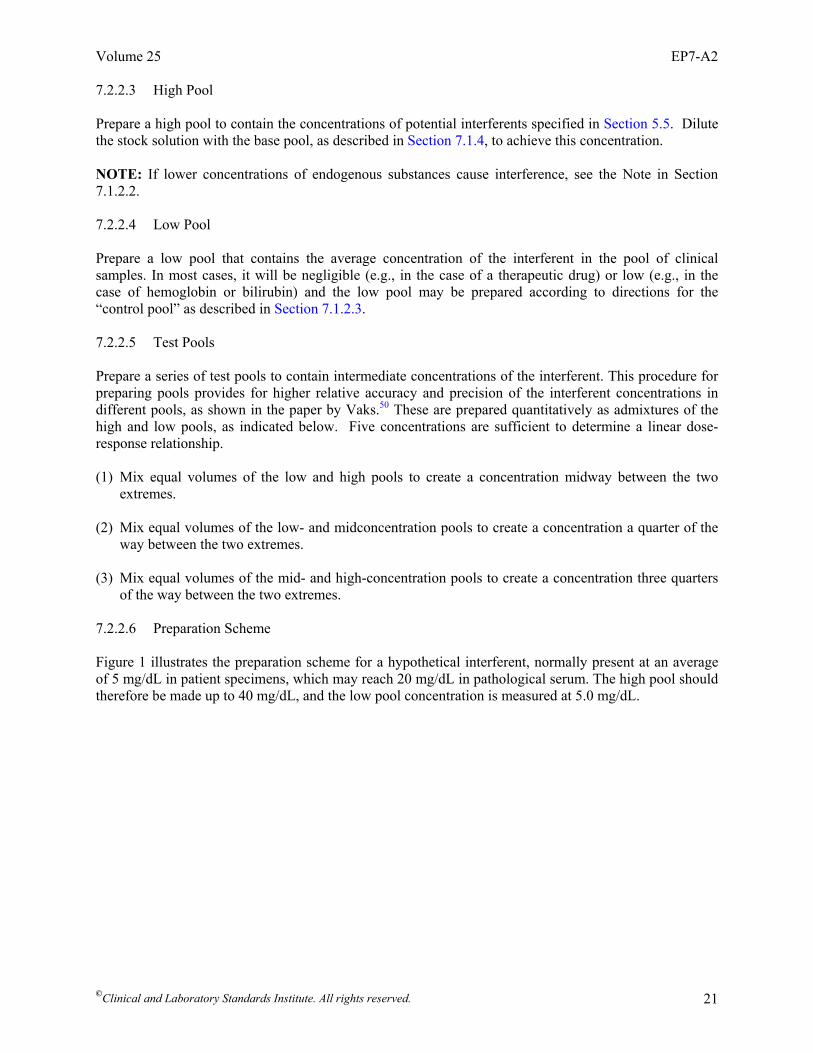
Volume 25 EP7-A2
©Clinical and Laboratory Standards Institute. All rights reserved. 21
7.2.2.3 High Pool Prepare a high pool to contain the concentrations of potential interferents specified in Section 5.5. Dilute the stock solution with the base pool, as described in Section 7.1.4, to achieve this concentration. NOTE: If lower concentrations of endogenous substances cause interference, see the Note in Section 7.1.2.2. 7.2.2.4 Low Pool Prepare a low pool that contains the average concentration of the interferent in the pool of clinical samples. In most cases, it will be negligible (e.g., in the case of a therapeutic drug) or low (e.g., in the case of hemoglobin or bilirubin) and the low pool may be prepared according to directions for the “control pool” as described in Section 7.1.2.3. 7.2.2.5 Test Pools Prepare a series of test pools to contain intermediate concentrations of the interferent. This procedure for preparing pools provides for higher relative accuracy and precision of the interferent concentrations in different pools, as shown in the paper by Vaks.50 These are prepared quantitatively as admixtures of the high and low pools, as indicated below. Five concentrations are sufficient to determine a linear dose-response relationship. (1) Mix equal volumes of the low and high pools to create a concentration midway between the two
extremes. (2) Mix equal volumes of the low- and midconcentration pools to create a concentration a quarter of the
way between the two extremes.
(3) Mix equal volumes of the mid- and high-concentration pools to create a concentration three quarters of the way between the two extremes.
7.2.2.6 Preparation Scheme Figure 1 illustrates the preparation scheme for a hypothetical interferent, normally present at an average of 5 mg/dL in patient specimens, which may reach 20 mg/dL in pathological serum. The high pool should therefore be made up to 40 mg/dL, and the low pool concentration is measured at 5.0 mg/dL.
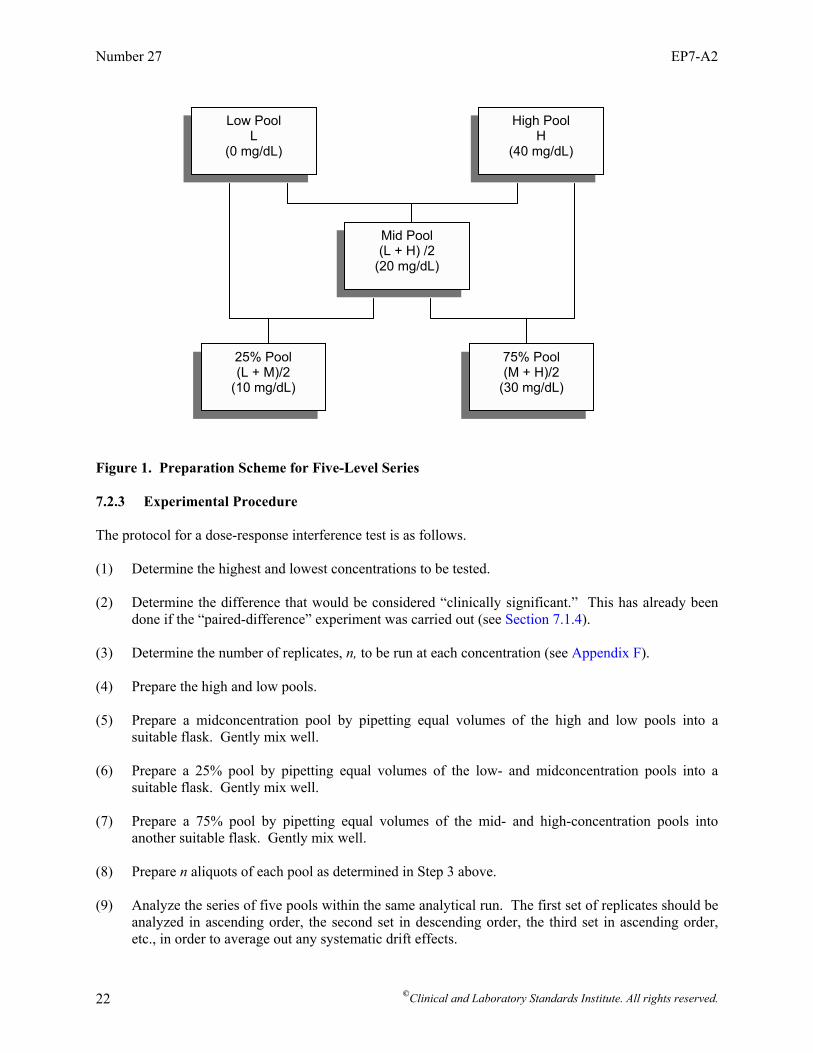
Number 27 EP7-A2
©Clinical and Laboratory Standards Institute. All rights reserved. 22
Figure 1. Preparation Scheme for Five-Level Series 7.2.3 Experimental Procedure The protocol for a dose-response interference test is as follows. (1) Determine the highest and lowest concentrations to be tested. (2) Determine the difference that would be considered “clinically significant.” This has already been
done if the “paired-difference” experiment was carried out (see Section 7.1.4). (3) Determine the number of replicates, n, to be run at each concentration (see Appendix F). (4) Prepare the high and low pools. (5) Prepare a midconcentration pool by pipetting equal volumes of the high and low pools into a
suitable flask. Gently mix well. (6) Prepare a 25% pool by pipetting equal volumes of the low- and midconcentration pools into a
suitable flask. Gently mix well. (7) Prepare a 75% pool by pipetting equal volumes of the mid- and high-concentration pools into
another suitable flask. Gently mix well. (8) Prepare n aliquots of each pool as determined in Step 3 above. (9) Analyze the series of five pools within the same analytical run. The first set of replicates should be
analyzed in ascending order, the second set in descending order, the third set in ascending order, etc., in order to average out any systematic drift effects.
Low Pool L
(0 mg/dL)
High Pool H
(40 mg/dL)
Mid Pool (L + H) /2
(20 mg/dL)
25% Pool (L + M)/2
(10 mg/dL)
75% Pool (M + H)/2
(30 mg/dL)
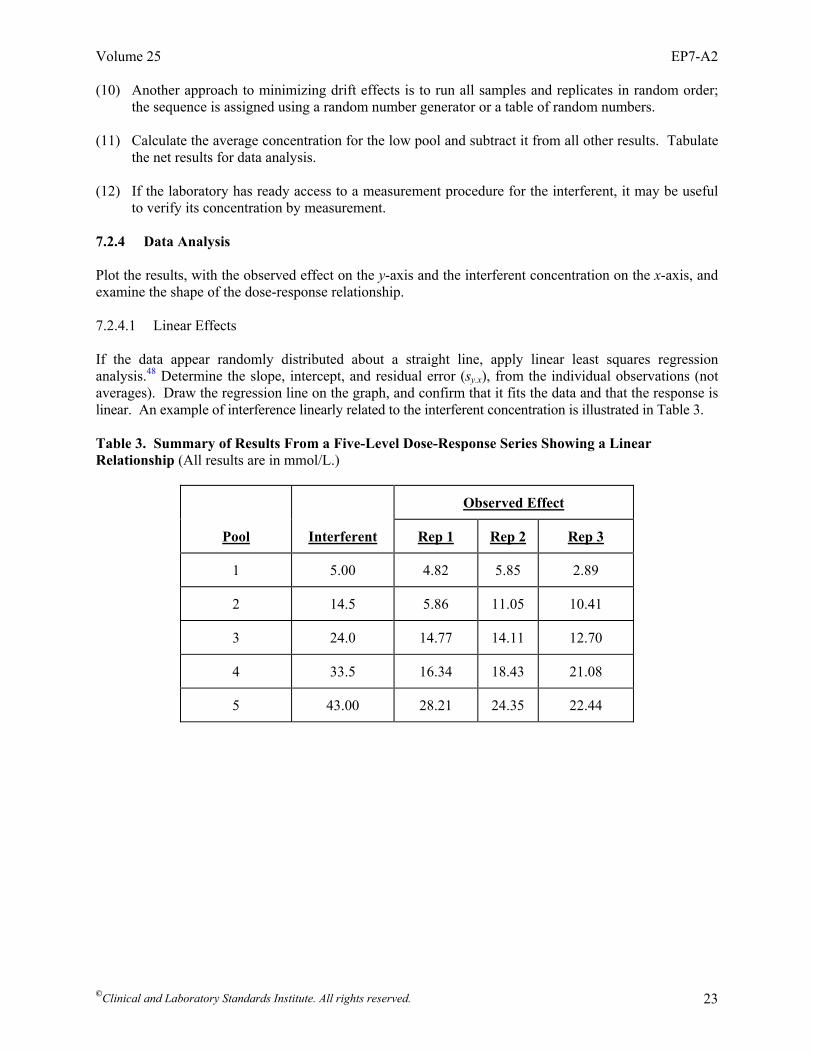
Volume 25 EP7-A2
©Clinical and Laboratory Standards Institute. All rights reserved. 23
(10) Another approach to minimizing drift effects is to run all samples and replicates in random order; the sequence is assigned using a random number generator or a table of random numbers.
(11) Calculate the average concentration for the low pool and subtract it from all other results. Tabulate
the net results for data analysis. (12) If the laboratory has ready access to a measurement procedure for the interferent, it may be useful
to verify its concentration by measurement. 7.2.4 Data Analysis Plot the results, with the observed effect on the y-axis and the interferent concentration on the x-axis, and examine the shape of the dose-response relationship. 7.2.4.1 Linear Effects If the data appear randomly distributed about a straight line, apply linear least squares regression analysis.48 Determine the slope, intercept, and residual error (sy.x), from the individual observations (not averages). Draw the regression line on the graph, and confirm that it fits the data and that the response is linear. An example of interference linearly related to the interferent concentration is illustrated in Table 3.
Table 3. Summary of Results From a Five-Level Dose-Response Series Showing a Linear Relationship (All results are in mmol/L.)
Observed Effect
Pool Interferent Rep 1 Rep 2 Rep 3
1 5.00 4.82 5.85 2.89
2 14.5 5.86 11.05 10.41
3 24.0 14.77 14.11 12.70
4 33.5 16.34 18.43 21.08
5 43.00 28.21 24.35 22.44
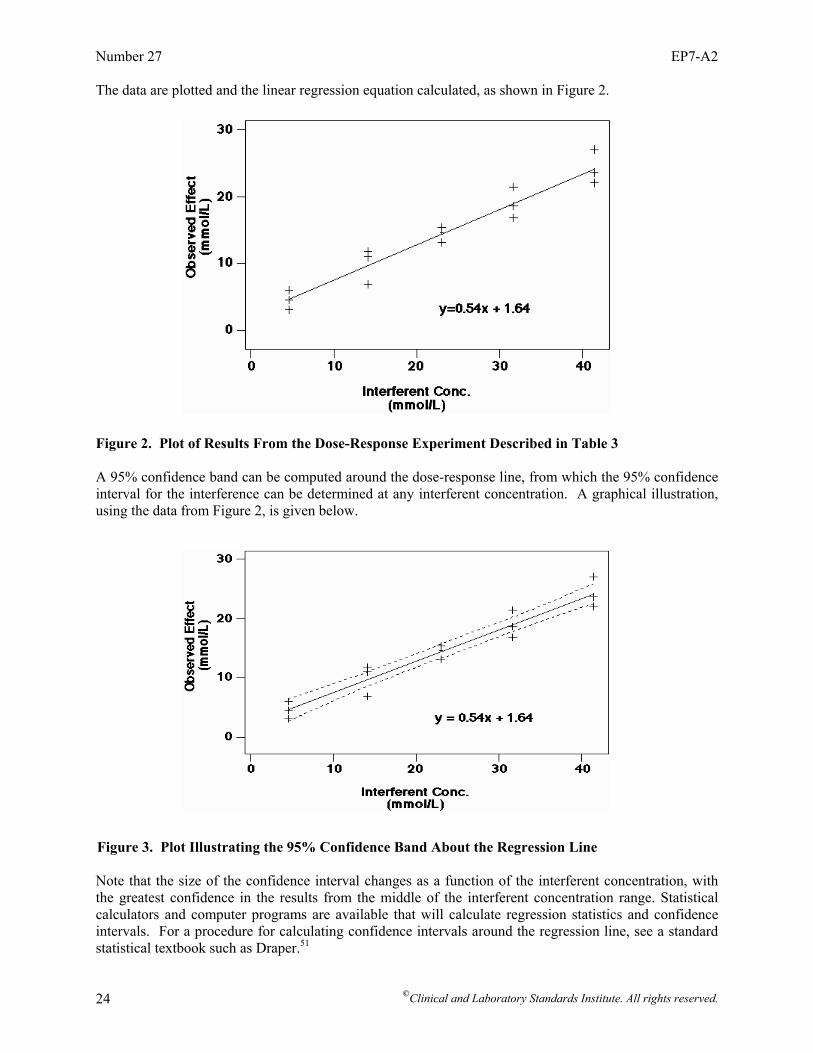
Number 27 EP7-A2
©Clinical and Laboratory Standards Institute. All rights reserved. 24
The data are plotted and the linear regression equation calculated, as shown in Figure 2. Figure 2. Plot of Results From the Dose-Response Experiment Described in Table 3
A 95% confidence band can be computed around the dose-response line, from which the 95% confidence interval for the interference can be determined at any interferent concentration. A graphical illustration, using the data from Figure 2, is given below. Figure 3. Plot Illustrating the 95% Confidence Band About the Regression Line Note that the size of the confidence interval changes as a function of the interferent concentration, with the greatest confidence in the results from the middle of the interferent concentration range. Statistical calculators and computer programs are available that will calculate regression statistics and confidence intervals. For a procedure for calculating confidence intervals around the regression line, see a standard statistical textbook such as Draper.51
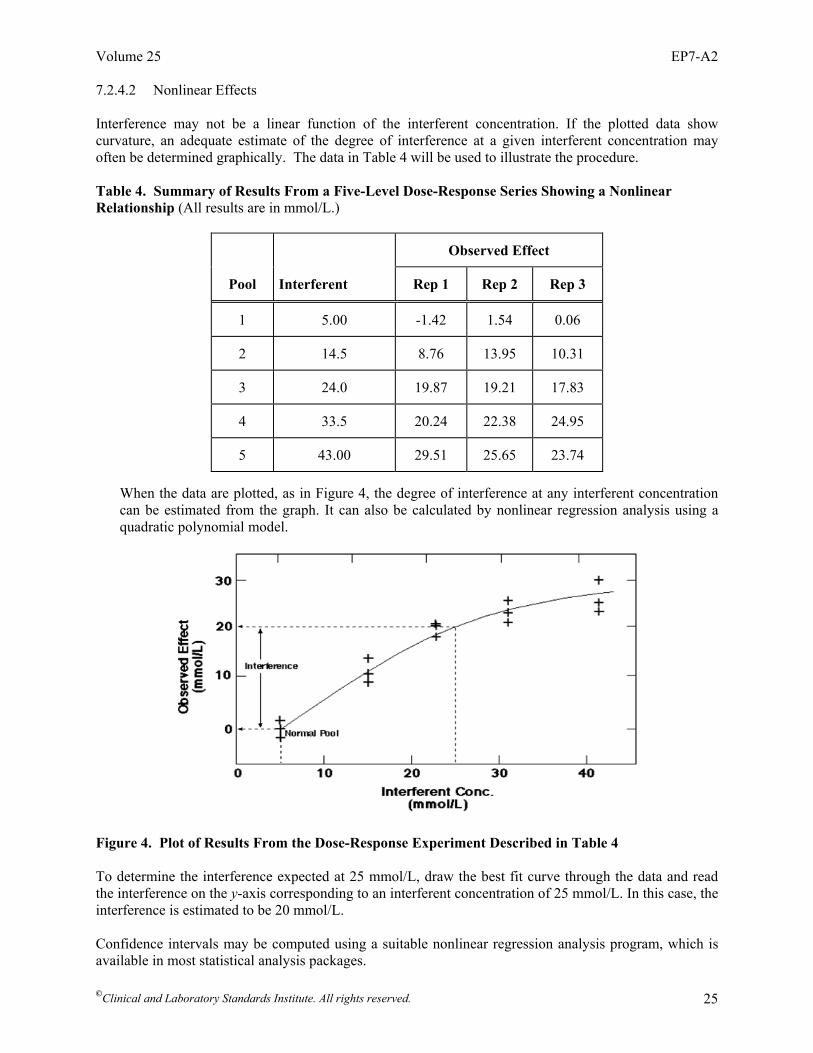
Volume 25 EP7-A2
©Clinical and Laboratory Standards Institute. All rights reserved. 25
7.2.4.2 Nonlinear Effects Interference may not be a linear function of the interferent concentration. If the plotted data show curvature, an adequate estimate of the degree of interference at a given interferent concentration may often be determined graphically. The data in Table 4 will be used to illustrate the procedure. Table 4. Summary of Results From a Five-Level Dose-Response Series Showing a Nonlinear Relationship (All results are in mmol/L.)
Observed Effect
Pool Interferent Rep 1 Rep 2 Rep 3
1 5.00 -1.42 1.54 0.06
2 14.5 8.76 13.95 10.31
3 24.0 19.87 19.21 17.83
4 33.5 20.24 22.38 24.95
5 43.00 29.51 25.65 23.74
When the data are plotted, as in Figure 4, the degree of interference at any interferent concentration can be estimated from the graph. It can also be calculated by nonlinear regression analysis using a quadratic polynomial model.
Figure 4. Plot of Results From the Dose-Response Experiment Described in Table 4 To determine the interference expected at 25 mmol/L, draw the best fit curve through the data and read the interference on the y-axis corresponding to an interferent concentration of 25 mmol/L. In this case, the interference is estimated to be 20 mmol/L. Confidence intervals may be computed using a suitable nonlinear regression analysis program, which is available in most statistical analysis packages.
Number 27 EP7-A2
©Clinical and Laboratory Standards Institute. All rights reserved. 26
7.2.5 Interpretation of Results If the relationship is linear, the regression slope represents the bias per unit of interferent. The y-intercept represents the correction for the endogenous interferent concentration, if any. The degree of interference can be estimated at any interferent concentration from the regression equation, or from the graph, whether the relationship is linear or nonlinear. Referring back to the data in Figure 2 for an example, since the slope is positive, the experiment showed the substance causes a positive interference. What is the magnitude of interference when the interferent is present at 25 mmol/L? From the regression equation, we determine that y = 0.82 x 25 mg/dL - 4.1 = 16.4 mmol/L (6) 7.3 Evaluating Combinations of Analyte and Interferent(s) Two (or more) potential interferents can be tested more efficiently in a single experiment, in which the concentrations of the test substances and the concentrations of analyte are varied systematically. The effects of the individual constituents are estimated by factorial analysis. The advantages are increased efficiency and more information; fewer analyses are required than for one-at-a-time testing, and interaction among interfering substances—as well as the analyte—can be evaluated. A potential disadvantage is that sample preparation is more complex, increasing the chance of human error. Application of factorial analysis to interference testing has been described by Kroll et al.52,53 For a more detailed description of multifactorial experimental designs, see Box, Hunter, and Hunter.54 8 Evaluating Interference Using Patient Specimens The interference screen described in Section 7.1 has obvious limitations. No matter how comprehensive, unexpected interferences may be encountered in patient specimens. To minimize the likelihood of this happening, specimens from relevant patient populations should be analyzed to evaluate inherent sample-to-sample variability. A reproducible “outlier” result associated with an individual sample gives a clear indication of an unknown interfering substance. A high degree of “scatter” caused by reproducible sample-related biases is also a good indication that interfering substances are present. Patient specimen results may also be used to confirm interference demonstrated in spiked pool testing. If bias is not observed in samples known to contain the substance in question, further investigation should be undertaken to reconcile the conflicting observations. 8.1 Experimental Design The experiment is based on analyzing two groups of patient specimens (i.e., a test group and a control group) on (1) the measurement procedure being evaluated, and (2) on a reference procedure27 or other qualified comparative measurement procedure. Biased results from patient subgroups relative to a control group indicate interference. NOTE: Detailed statistical procedures are not provided in this section.
Volume 25 EP7-A2
©Clinical and Laboratory Standards Institute. All rights reserved. 27
8.2 Comparative Measurement Procedure A well-characterized measurement procedure with low susceptibility to interferences is employed to establish the “true values” in the comparison study. Ideally, a reference procedure should be used for this purpose.27 If a reference procedure is not available, another qualified comparative measurement procedure (i.e., a procedure with good precision and specificity, preferably a different principle of measurement) may be used (see the most current edition of CLSI/NCCLS document EP9—Method Comparison and Bias Estimation Using Patient Samples for more information). If the comparative measurement procedure lacks sufficient specificity, the ability to draw definitive conclusions is compromised. The following situations are possible: • An observed bias in certain patient specimens could be due to interference with either measurement
procedure.
• Lack of bias between the two measurement procedures could be due to (1) similar sensitivity to the same interferent, or (2) neither procedure being affected by the interferent.
The relationship between the two measurement procedures (systematic bias) is determined from analysis of the control samples. 8.3 Patient Populations 8.3.1 Test Specimens Test specimens are selected from the patient populations of interest. They are known to contain one or more potential interferents (e.g., therapeutic drugs), are taken from patients diagnosed with specific conditions or diseases, or both. For example, patient specimens may be selected based on the following criteria: • relevant diseases (e.g., specimens from patients with cardiac, liver, or renal disorders);
• relevant medications (e.g., specimens from patients known to be taking the drugs of interest);
• uremic patients (e.g., predialysis), whose blood is likely to contain high concentrations of endogenous
metabolites or drugs; and
• other identifiable constituents (e.g., abnormal concentrations of bilirubin, hemoglobin, protein, lipids).
8.3.2 Control Samples Control samples must span the same range of analyte concentrations. They are selected because they are known not to contain the substance(s) or because they include substances associated with the diseases being tested. Control samples may be selected: • from patients not taking the drugs of interest;
• with normal concentrations of the potentially interfering substance;
• with the same or similar diagnosis; and/or
Number 27 EP7-A2
©Clinical and Laboratory Standards Institute. All rights reserved. 28
• with an analyte distribution similar to the test samples. Samples from the control group must be included in every run. 8.4 Experimental Procedure Each sample is run in duplicate by each measurement procedure. The number of test and control samples required depends on three factors: • the precision of the two measurement procedures; • the magnitude of the interference effect to be detected; and • the level of confidence required. If the effect is large and both measurement procedures have good precision, 10 to 20 samples in each group are sufficient. If more samples are needed to quantify the effect with desired level of confidence (i.e., the bias is so small that it is masked by imprecision) the effect is not likely to be of clinical significance. Please refer to the most current editions of CLSI/NCCLS document EP9—Method Comparison and Bias Estimation Using Patient Samples and CLSI document EP14—Evaluation of Matrix Effects, for additional statistically based procedures for determining the number of samples for this design. • Select the groups of test and control samples. • Select an appropriate reference or qualified comparative measurement procedure. • Analyze each sample in duplicate by both measurement procedures within as short a time span as
possible, usually within two hours. The time span must be justified (e.g., by analyte and procedure stability criteria), and the rationale must be documented. Follow these precautions:
⎯ Timing is especially important if the analyte or potential interferent is labile, if the matrix is
unstable (e.g., whole blood), or if microvolumes are used (because of sample evaporation). Special precautions are required in these cases.
⎯ Spread the runs over several days to reduce the contribution of day-to-day imprecision. Alternate
the sequence of the two runs each day; alternate (or randomize) control and test samples within each run.
⎯ Carefully set up the sequence of samples for testing if the measurement procedure is subject to
carryover.
⎯ Be alert to any systematic differences that might lead to a false indication of interference. • If a bias is observed, measure the concentration of the drug or other potential interferent in the
samples, if possible, to establish the relationship between bias and interferent concentration. 8.5 Data Analysis Visual inspection of plotted data will usually indicate if interference is present. Review the data from each group of selected patient specimens in comparison to its control group and assess whether there is systematic bias. If there is, evaluate the range of the differences between the selected patient results and the mean of the control results and compare it to the interference criteria. From this, decide whether interference is ruled out or further investigation is required. The procedure and examples below provide

Volume 25 EP7-A2
©Clinical and Laboratory Standards Institute. All rights reserved. 29
additional guidance, but determination of the cause of the interference is beyond the scope of this guideline. 8.5.1 Plotting Bias Versus the Comparative Measurement Procedure Value Steps to be followed when plotting bias versus the comparative measurement procedure value: (1) Tabulate the results for data analysis. Average the duplicate results for each sample.
(2) For each sample, calculate and record the average bias (test measurement procedure result minus
comparative measurement procedure result).
(3) Plot each point, with bias on the vertical axis and the comparative measurement procedure concentration on the horizontal axis. Use different plotting symbols for the test and control samples.
(4) Determine the Sy.x statistic for each group from linear regression analysis (with the comparative measurement procedure = x). This can be used to compute the 95% confidence intervals (see examples below).
8.5.2 Evaluating Bias for Possible Interference Some typical outcomes of this type of experiment are illustrated in Figure 5.
Figure 5(A-D). Four Possible Outcomes of Different Interference Tests Based on Patient Specimens (The variables are discussed in the text.) 8.5.3 Positive Bias Relative to the Control Group In Figure 5(A), the test group data (+) show a bias and are more variable than the control group data (•), which show a tighter scatter pattern and negligible bias to the comparative measurement procedure. In this example, the results suggest interference by some constituent of the test samples, but are not
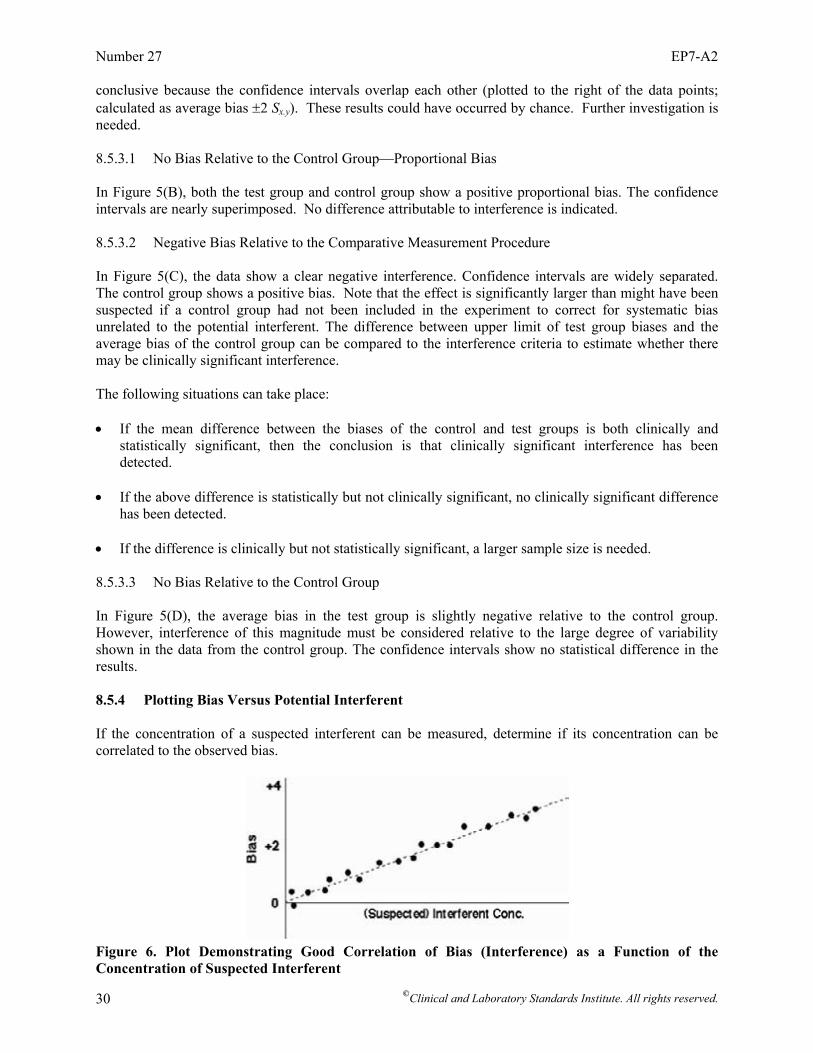
Number 27 EP7-A2
©Clinical and Laboratory Standards Institute. All rights reserved. 30
conclusive because the confidence intervals overlap each other (plotted to the right of the data points; calculated as average bias ±2 Sx.y). These results could have occurred by chance. Further investigation is needed. 8.5.3.1 No Bias Relative to the Control Group—Proportional Bias In Figure 5(B), both the test group and control group show a positive proportional bias. The confidence intervals are nearly superimposed. No difference attributable to interference is indicated. 8.5.3.2 Negative Bias Relative to the Comparative Measurement Procedure In Figure 5(C), the data show a clear negative interference. Confidence intervals are widely separated. The control group shows a positive bias. Note that the effect is significantly larger than might have been suspected if a control group had not been included in the experiment to correct for systematic bias unrelated to the potential interferent. The difference between upper limit of test group biases and the average bias of the control group can be compared to the interference criteria to estimate whether there may be clinically significant interference. The following situations can take place:
• If the mean difference between the biases of the control and test groups is both clinically and
statistically significant, then the conclusion is that clinically significant interference has been detected.
• If the above difference is statistically but not clinically significant, no clinically significant difference
has been detected. • If the difference is clinically but not statistically significant, a larger sample size is needed. 8.5.3.3 No Bias Relative to the Control Group In Figure 5(D), the average bias in the test group is slightly negative relative to the control group. However, interference of this magnitude must be considered relative to the large degree of variability shown in the data from the control group. The confidence intervals show no statistical difference in the results. 8.5.4 Plotting Bias Versus Potential Interferent If the concentration of a suspected interferent can be measured, determine if its concentration can be correlated to the observed bias.
Figure 6. Plot Demonstrating Good Correlation of Bias (Interference) as a Function of the Concentration of Suspected Interferent
Volume 25 EP7-A2
©Clinical and Laboratory Standards Institute. All rights reserved. 31
(1) Plot the bias (test measurement procedure result minus comparative measurement procedure result) on the vertical axis against the concentration of the potential interferent on the horizontal axis. Figure 6 illustrates an observed effect that correlates well with the potential concentration. Construction and interpretation of “bias plots” is found in the most current edition of CLSI/NCCLS document EP9—Method Comparison and Bias Estimation Using Patient Samples.
(2) Examine the plot of bias vs. suspected interferent concentration. If the relationship is linear and the
scatter is relatively constant over the range, then all the data can be analyzed together. The relationship between interference effect and interferent concentration can be determined by linear regression analysis, as described in Section 7.2.4.
An alternative approach, if the relationship is not linear: subset the data into smaller concentration ranges and calculate the average bias (interference) and average interferent concentration for each subset of data. This indicates the magnitude of interference due to the substance being tested. 8.6 Interpretation of Results Limitations of using patient specimens are chiefly related to the lack of control over test variables, and the requirement for a highly specific comparative measurement procedure for definitive interpretation of the results. • CAUTION: This experiment only demonstrates correlation of bias with a specific substance; it
does not prove a cause-effect relationship. The actual interferent could be a substance coincidentally present with the suspected interferent. For example, interference by a biochemical metabolite appearing as the consequence of a disease may be mistakenly attributed to a drug used to treat the disease.
• Labile constituents (e.g., acetoacetate, CO2) can be lost if the samples are not fresh. • Hospitalized patients usually receive multiple drugs (or multiple drug regimens) and may have
elevated concentrations of endogenous metabolites. • Prospectively grouping patients by disease and medication can be very difficult to accomplish. • The interferent may not be present in the sampled patient specimens. • The comparative measurement procedure may not be sufficiently well characterized with respect to
interference. It could also be affected by the same interferent. Nevertheless, this approach has proven valuable in providing clues to interfering substances that otherwise might be missed, and it may be the only approach that detects unsuspected interference by a drug metabolite. It also provides a means of confirming suspected interference in actual patient specimens. See Appendix A for special considerations for measurement procedures using separation techniques or immunochemical measurement procedures. 9 Establishing, Validating, and Verifying Interference Claims These guidelines may be used by manufacturers to characterize and verify specificity and to establish interference claims, and by clinical laboratories to validate manufacturers’ claims and validate that the specificity of their measurement procedures satisfies medical requirements. A well-characterized procedure allows a clinical laboratory to leverage manufacturers’ data to satisfy its own validation and
Number 27 EP7-A2
©Clinical and Laboratory Standards Institute. All rights reserved. 32
verification requirements. This section describes the essential requirements that must be met for an interference evaluation to conform to this protocol. Validation and verification are similar concepts that have been applied in slightly different ways in the clinical laboratory, medical device, and software industries. This has led to some confusion. This guideline uses the terms as defined in ISO 9001—Quality management systems—Requirements,55 ISO 15189—Medical laboratories – Particular requirements for quality and competence,56 and CLSI/NCCLS document HS1—A Quality Management System Model for Health Care. Both terms refer to the provision of objective evidence that certain requirements have been met. Validation means that users’ (or regulatory) requirements have been met (e.g., accuracy requirements for patients’ results), while verification means that specified criteria have been met (e.g., interference criteria or interference claims). 9.1 Establishing Interference Claims Interference is a limitation of the measurement procedure with respect to its intended use. For commercial procedures, substances known to interfere shall be disclosed in the instructions for use. Substances tested that do not interfere should also be disclosed so that the laboratory can verify the suitability of the procedure for the patient population it serves. The clinical laboratory requires the following information from the manufacturer: • the analyte and interferent concentrations covered by the claim;
• the names of the substances evaluated for potential interference;
• the chemical and/or generic names of known interfering substances;
• the criteria used to define clinically significant interference;
• the concentrations above which the substances interfere or below which they do not interfere;
• the interference observed with 95% confidence at specified analyte concentration(s); and
• the evaluation protocol (if CLSI document EP7 is not cited, describe the approach and specify the power and confidence level used to determine interference).
Three acceptable approaches are used in stating interference claims. (1) The interference claim may state the concentration of a substance above which it causes a bias
exceeding the interference criteria (power = 95%).
(2) The interference claim may state the concentration of a substance below which no interference was observed (confidence level = 95%).
(3) The interference claim may state only that a substance has been reported to interfere with the
measurement procedure. This statement is appropriate when quantitative information is not available. For example, a published report contains evidence that results from patients taking a certain medication do not agree with the true values. If the degree of error is clinically significant, the manufacturer should (1) investigate further to characterize and disclose the interference; or (2) disclose that the substance has been reported to interfere and cite the journal reference or other source of data.
Volume 25 EP7-A2
©Clinical and Laboratory Standards Institute. All rights reserved. 33
Information about substances tested and found not to interfere should be summarized and provided to users. It may be provided in the form of a “specificity” claim (see Section 9.1.2). Model statements for interference and specificity claims are given below. Other approaches are acceptable, but consistency is encouraged to facilitate interpretation by laboratories. 9.1.1 Interference Claims Example 1. Results of Interferent Concentration Series: The AST measurement procedure was evaluated for interference according to CLSI document EP7. The following common substances, when added to serum, interfered at the concentrations indicated. A bias exceeding 10% is considered a significant interference.*
Substance Tested Interfering concentration at
AST 25 U/L
Interfering concentration at
AST 200 U/L
Comments
Hemoglobin 250 g/dL 325 g/dL As hemolysis
N-Acetylcysteine 150 mg/mL 300 mg/mL Therapeutic IV dose is 180 mg/mL
*Upper limit of 95% confidence interval. CAUTION: Do not attempt to correct analyte results based on these results. The relationship between analyte and interferent has not been determined. Example 2. Bilirubin Measurement Procedure —Two-Level Interference Screen: The bilirubin measurement procedure was evaluated for interference according to CLSI document EP7. The following commonly occurring substances caused interference when added to serum at the analyte and interferent concentrations indicated. Bias exceeding 0.2 mg/dL is considered interference.
Interferent Interferent concentration
Analyte (mg/dL)
Bias* (mg/dL) Comments
Hemolysis (Hemoglobin)
300 g/dL
"
1.2
16.5
- 0.4
+ 0.5
Gross hemolysis
N-Acetylcysteine 90 mg/dL
"
1.2
16.5
< 0.2
-0.6
Therapeutic IV dose
Acetylsalicylic Acid 50 mg/dL
"
1.2
16.5
< 0.2
+ 0.3
Toxic dose
*Upper limit of 95% confidence interval. CAUTION: Do not attempt to correct analyte results based on these results. The relationship between analyte and interferent has not been determined.
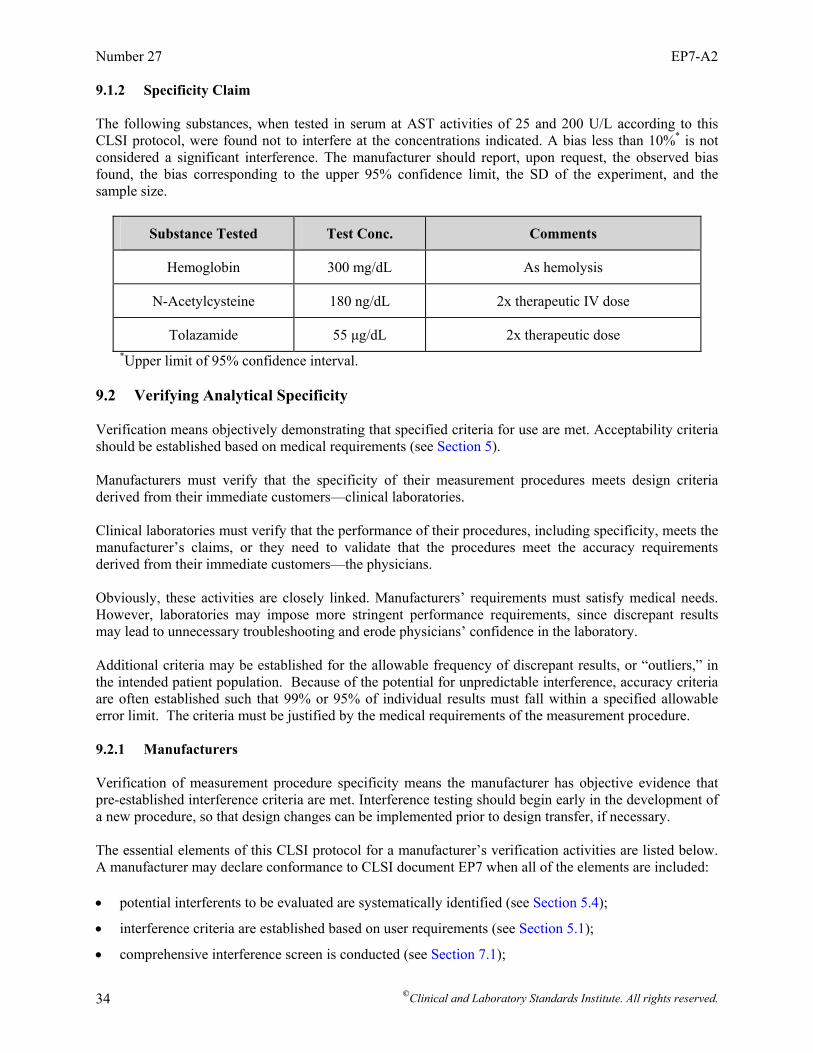
Number 27 EP7-A2
©Clinical and Laboratory Standards Institute. All rights reserved. 34
9.1.2 Specificity Claim The following substances, when tested in serum at AST activities of 25 and 200 U/L according to this CLSI protocol, were found not to interfere at the concentrations indicated. A bias less than 10%* is not considered a significant interference. The manufacturer should report, upon request, the observed bias found, the bias corresponding to the upper 95% confidence limit, the SD of the experiment, and the sample size.
Substance Tested Test Conc. Comments
Hemoglobin 300 mg/dL As hemolysis
N-Acetylcysteine 180 ng/dL 2x therapeutic IV dose
Tolazamide 55 µg/dL 2x therapeutic dose *Upper limit of 95% confidence interval.
9.2 Verifying Analytical Specificity Verification means objectively demonstrating that specified criteria for use are met. Acceptability criteria should be established based on medical requirements (see Section 5). Manufacturers must verify that the specificity of their measurement procedures meets design criteria derived from their immediate customers—clinical laboratories. Clinical laboratories must verify that the performance of their procedures, including specificity, meets the manufacturer’s claims, or they need to validate that the procedures meet the accuracy requirements derived from their immediate customers—the physicians. Obviously, these activities are closely linked. Manufacturers’ requirements must satisfy medical needs. However, laboratories may impose more stringent performance requirements, since discrepant results may lead to unnecessary troubleshooting and erode physicians’ confidence in the laboratory. Additional criteria may be established for the allowable frequency of discrepant results, or “outliers,” in the intended patient population. Because of the potential for unpredictable interference, accuracy criteria are often established such that 99% or 95% of individual results must fall within a specified allowable error limit. The criteria must be justified by the medical requirements of the measurement procedure. 9.2.1 Manufacturers Verification of measurement procedure specificity means the manufacturer has objective evidence that pre-established interference criteria are met. Interference testing should begin early in the development of a new procedure, so that design changes can be implemented prior to design transfer, if necessary. The essential elements of this CLSI protocol for a manufacturer’s verification activities are listed below. A manufacturer may declare conformance to CLSI document EP7 when all of the elements are included:
• potential interferents to be evaluated are systematically identified (see Section 5.4);
• interference criteria are established based on user requirements (see Section 5.1);
• comprehensive interference screen is conducted (see Section 7.1);
Volume 25 EP7-A2
©Clinical and Laboratory Standards Institute. All rights reserved. 35
• concentrations that cause interference are determined (see Section 7.2); and
• interference and specificity information required by laboratories is described in the product labeling/instructions for use (see Section 9.1).
9.2.2 Clinical Laboratories Verification of the measurement procedure’s specificity means the laboratory has objective evidence that its criteria for interference are met. The manufacturer’s criteria and data may be accepted by the laboratory for this purpose, if they apply to the patient population served by the laboratory. If a laboratory cannot rely on a manufacturer’s verification data or other sources of interference information, the laboratory must establish its own criteria and conduct its own evaluation of the most likely sources of interference. Section 9.2.1 lists the steps to follow to evaluate in order to declare conformance to this guideline. A laboratory may also need to verify that a particular interference claim is met. This subject is covered in Section 9.4. 9.3 Validating Analytical Specificity Validation means objectively demonstrating that customer requirements are met. The degree of validation should be commensurate with the risk of discrepant results caused by interfering substances. 9.3.1 Manufacturers Validation means providing objective evidence that the method’s specificity, including any limitations described in labeling claims, meets the functional needs of their immediate customers (e.g., clinical laboratories). Customer needs are typically related to the medical requirements for accuracy. The essential elements of this guideline for a manufacturer’s validation include evaluation of relevant patient populations. Section 7 describes how to confirm observed effects in natural patient specimens and how to evaluate relevant patient populations for unanticipated interfering substances. These validation activities are typically combined with the comparison of methods experiment in the most current edition of CLSI/NCCLS document EP9—Method Comparison and Bias Estimation Using Patient Samples during internal and external performance trials. 9.3.2 Clinical Laboratories Validation means providing objective evidence that the specificity of the method, including any limitations described in labeling claims, meets the medical needs of their immediate customers (e.g., physicians). Interference is a characteristic of the method and the clinical specimens, and a comprehensive interference evaluation may be beyond the capability of the laboratory. The laboratory may accept the manufacturer’s criteria and data if it can show that: 1) the substances tested by the manufacturer are relevant to its own population; 2) the criteria used to define interference are appropriate for the medical needs of its clients; and 3) the interference evaluation was conducted using scientifically valid experimental protocols. The rationale for using manufacturer’s criteria and data should be documented. If a laboratory cannot rely on a manufacturer’s validation data, it must conduct its own evaluation of relevant patient populations. Demonstration that results from representative patient specimens agree between the new measurement procedure and another commercial procedure may provide sufficient
Number 27 EP7-A2
©Clinical and Laboratory Standards Institute. All rights reserved. 36
validation. The evaluation protocol (e.g., CLSI/NCCLS document EP9— Method Comparison and Bias Estimation Using Patient Samples) and acceptance criteria (e.g., the percentage of individual patient results that must fall within a specified bias limit) must be established in advance. Discrepant results should be investigated as described in Section 10. 9.4 Verifying Interference and Specificity Claims Interference and specificity claims can be verified experimentally. The appropriate approach depends on the type of claim. 9.4.1 Maximum Interference Claim The interference may be claimed to be less than a stated maximum value. Example: The effect of 1 mg/dL magnesium on calcium results in the range 8 to 14 mg/dL is less than 0.2 mg/dL. To verify this statement, use the procedure in Section 7.1.4 to conduct a paired-difference experiment at the appropriate concentrations of magnesium and calcium. Compute the mean effect (xd). If it is less than 0.2 mg/dL, the claim is accepted; otherwise, it is rejected. 9.4.2 Observed Interference Claim The results of an interference test may be given. Example: In the presence of 1 mg/dL magnesium, calcium results in a normal serum pool were +0.14 mg/dL higher than the control value. To verify this claim, conduct a paired-difference experiment to test the null hypothesis that interference is less than or equal to 0.14 mg/dL. The alternate hypothesis is that it is greater. 9.4.3 Nonquantitative Interference Claims When interference is reported without quantitative information (for example, “Methotrexate has been reported to interfere with this measurement procedure”), statistical verification is not necessary. An experiment to characterize the degree of interference is described in Section 7.2. 9.4.4 Specificity Claim The statement, “Salicylate does not interfere with this measurement procedure,” can be verified experimentally. Conduct a paired-difference test (see Section 7.1.4) of the null hypothesis at the medical decision concentration of the analyte, setting reasonable criteria for interference (Section 5.1), and analyzing and interpreting the results as described in Sections 7.1.5 and 7.1.6. 10 Investigating Discrepant Patient Results Every laboratory occasionally encounters discrepant results. A result may be reported by physicians as inconsistent with a diagnosis or a previous result, or a discrepancy between two measurement procedures may be discovered in the laboratory. If a value for a specific patient is repeatable, and the procedure is properly standardized, the probable cause is interference. The following troubleshooting strategy may be followed to investigate a discrepant result. If interference is confirmed and the interfering substance can be identified, the laboratory should report its findings to the manufacturer and include the information in its procedure manual.

Volume 25 EP7-A2
©Clinical and Laboratory Standards Institute. All rights reserved. 37
NOTE: It is not possible to anticipate all of the possible scenarios a laboratory might encounter. These recommendations are intended as guidelines. They should be modified as necessary to accommodate particular circumstances. 10.1 Verify System Performance Before beginning the investigation, verify that the system is performing acceptably. Look for any indication of sporadic system malfunctions that could have caused the discrepant result. • Check quality control records and verify that the system has been operating consistently within
control limits. • Analyze freshly prepared quality control samples to verify that system performance is still within
control limits. • Confirm that the measurement procedure is properly calibrated and maintained. 10.2 Evaluate Sample Quality Next, check the sample for obvious problems. Look for any indication of abnormal characteristics that could explain the discrepant result. • Visually examine the sample for fibrin clots, hemolysis, elevated bilirubin, lipemia, turbidity, and
other visible abnormalities. If present, determine if it is consistent with the observed bias. • Verify that the specimen was collected, transported, and stored properly, using a recommended
collection procedure, compatible preservatives, anticoagulants, etc. If not, determine if this could be the probable cause.
• Rule out specimen mix-up and other specimen handling errors. If an error occurred, determine if it
explains the discrepancy. 10.3 Confirm the Original Result Confirm that the sample demonstrates sample-specific bias before proceeding further. Develop an investigation plan that makes the best use of the rest of the valuable sample remaining. • Repeat the analysis on the same sample to rule out random error (imprecision) or incidental error
(outlier) as a cause. • Check previous laboratory results from the same patient, if available. They may show a trend that
correlates with a specific medical intervention or other patient change. • Dilute and reanalyze the sample. If the calculated result after dilution is higher or lower than the one
from the undiluted sample, a positively or negatively interfering substance may be present. • Analyze the sample by a different principle of measurement, including other samples as controls. If
necessary, send them to another laboratory for analysis. • Collect and reanalyze another specimen from the same patient, and/or from patients with the same or
similar diagnosis and medications. Follow the investigation path suggested by the results.
Number 27 EP7-A2
©Clinical and Laboratory Standards Institute. All rights reserved. 38
10.4 Identify Potentially Interfering Substances If the discrepant result is confirmed, and the system is functioning properly, attempt to identify the interfering substance. • Review the product labeling for known interfering substances that may have been present.
• Determine the patient’s diagnosis and medical condition. Check for recent diagnostic procedures and treatments, such as surgery, anesthesia, transfusions, radiological procedures, and physical manipulations, such as prostatic massage.
• Review the patient’s medication records. Check for recently prescribed drugs, hyperalimentation,
radioisotopes, as well as over-the-counter medications and vitamins. • Determine if the patient is on an unusual diet, and if so, whether it is likely to be responsible for the
discrepant result. • Call the manufacturer and inquire whether other similar reports have been received. Report the
findings and request assistance in determining the cause. 10.5 Determine the Probable Interferent Once potentially interfering substances have been identified, test the most likely candidates. A quick, low-power experiment is suitable for detecting large effects and zeroing in on the probable interferent. (1) Collect 2 mL of serum from a healthy, drug-free person for each substance to be tested. (2) If the analyte is not normally present in healthy individuals, add a sufficient quantity to represent a
typical concentration. (3) Divide the fresh pool into 1-mL portions. (4) Prepare a concentrated stock solution of the substance to be tested. Aim for 50 to 100x the expected
serum concentration. (5) Add 50 µL of the stock solution to 1.0 mL of serum. Label it, “test sample.” (6) Add 50 µL of the solvent used to prepare the stock solution to another 1.0 mL of serum. Label it,
“control sample.” (7) Analyze each sample in duplicate in the same analytical run. (8) Calculate the difference between the test and control results. (9) If the difference exceeds the laboratory’s criteria for interference, rule out a chance occurrence due
to imprecision by comparing it to the repeatability (within-run precision) of the measurement procedure at that concentration (see calculation below). If the result exceeds the expected uncertainty due to imprecision, it suggests interference is the probable cause. If the results are negative, however, interference by yet unidentified substances (e.g., drug metabolites) cannot be ruled out.
Volume 25 EP7-A2
©Clinical and Laboratory Standards Institute. All rights reserved. 39
The uncertainty due to imprecision can be approximated from the known repeatability standard deviation at or near the analyte concentration tested. This assumes similar repeatability for the control and test samples. For duplicate measurements, use two standard deviations for 95% confidence.
2 2-2 2 ( / ) ( / )test control test controls s n s n= +
22 / 2controls≈
22 controls≈
22 controls≈
10.6 Characterize the Interference Once the probable interfering substance is determined, the laboratory should attempt to work with the manufacturer to confirm it and characterize its effect on the measurement procedure. The procedure in Section 7.2 is used for this purpose. Manufacturers have an obligation to investigate reports of clinically significant discrepancies57 and consequently depend on obtaining relevant data from customers. If a new interference is substantiated, the manufacturer is required to include the information in its product labeling for the benefit of all users.

Number 27 EP7-A2
©Clinical and Laboratory Standards Institute. All rights reserved. 40
References 1 Kroll MH, Elin RJ. Interference with clinical laboratory analyses (Review). Clin Chem. 1994;40(11):1996-2005. 2 Goodall I, Sykes S. The detection and assessment of interference in clinical biochemistry analysis. (Review). J Clin Biochem. 1990;11:150-
159. 3 Kaplan LA, Pesce AJ. Interferences in chemical analysis. In: Clinical Chemistry: Theory, Analysis and Correlation. 3rd ed. St. Louis, MO:
C.V. Mosby; 1996. 4 ISO. Medical devices - Application of risk management to medical devices. ISO 14971. Geneva: International Organization for
Standardization; 2000. 5 Sièst G, Dawkins SJ (IFCC Expert Panel on Drug Effects in Clinical Chemistry). Drug effects in clinical chemistry, part 1. The basic
concepts. J Clin Chem Clin Biochem. 1984;22:271-274. 6 Galteau MM, Sièst G (IFCC Expert Panel on Drug Effects in Clinical Chemistry). Drug effects in clinical chemistry, part 2. Guidelines for
evaluation of analytical interference. J Clin Chem Clin Biochem. 1984;22:275-279. 7 Sièst G, ed. Drug effects on laboratory test results. The Hague: Martinus Nijhoff Publishers; 1980. 8 Kallner A, Tryding N, eds. IFCC guidelines to the evaluation of drug effects in clinical chemistry. Scand J Clin Lab Invest. 1989;49(195):1-
29. 9 Young DS. Effects of Drugs on Clinical Laboratory Tests. 4th ed. Washington, DC: AACC Press; 1995. 10 Tryding N, Roos KA. Drug Interference and Drug Effects in Clinical Chemistry. 5th ed. Stockholm: Apoteksbolaget, Förlagsavdelningen,
S-105; 1989. 11 Tryding N. References to Drug Effects in Clinical Chemistry. Stockholm: Apoteksbolaget, Förlagsavdelningen, S-105; 1996. 12 ISO. Statistics – Vocabulary and symbols – Part 2: Statistical quality control. ISO 3534-2. Geneva: International Organization for
Standardization; 1993. 13 Lasky FD. Achieving accuracy for routine clinical chemistry methods by using patient specimen correlations to assign calibrator values: A
means of managing matrix effects. Arch Pathol Lab Med. 1993;117:412-419. 14 Eckfeldt JH, Copeland KR. Accuracy verification and identification of matrix effects. Arch Pathol Lab Med. 1993;117:381-386. 15 Rej R. Accurate enzyme activity measurements: Two decades of development in the commutability of enzyme quality-control materials.
Arch Pathol Lab Med. 1993;117:352-364. 16 Franzini C. Commutability of reference materials in clinical chemistry. J Int Fed Clin Chem. 1993;5:169-173. 17 Kringle RO, Bogavich M. Statistical procedures. In: Burtis CA, Ashwood ER, eds. Tietz Textbook of Clinical Chemistry. 3rd ed.
Philadelphia: W.B. Saunders Co.; 1999:265-309. 18 Krouwer JS. Estimating total analytical error and its sources: Techniques to improve method evaluation. Arch Pathol Lab Med.
1992;116:726-731. 19 Lawton WH, Sylvestre EA, Young-Ferraro BJ. Statistical comparison of multiple analytic procedures: Application to clinical chemistry.
Technometrics. 1979;21:397-409. 20 Krouwer JS. How to improve total error modeling by accounting for error sources beyond imprecision and bias. Clin Chem.
2001;47(7):1329-1331. 21 Krouwer JS. Improving the reporting of immunoassay specificity. Clin Chem. 1986;32:1980. 22 Apple FS, Koch DD, Graves S, Ladenson JH. Relationship between direct-potentiometric and flame-photometric measurement of sodium in
blood. Clin Chem. 1982;28:1931-1935. 23 Durst RA, Siggard-Andersen O. Electrochemistry. In: Burtis CA, Ashwood ER, eds. Tietz Textbook of Clinical Chemistry. 3rd ed.
Philadelphia: W.B. Saunders Co.; 1999. 24 ISO. International Vocabulary of Basic and General Terms in Metrology. Geneva: International Organization for Standardization; 1993. 25 ISO. In vitro diagnostic medical devices – Measurement of quantities in biological samples – Metrological traceability of values assigned
to calibrators and control materials. ISO 17511. Geneva: International Organization for Standardization; 2003. 26 ISO. Statistics – Vocabulary and symbols – Part 1: Probability and general statistical terms. ISO 3534-1. Geneva: International
Organization for Standardization; 1993.
Volume 25 EP7-A2
©Clinical and Laboratory Standards Institute. All rights reserved. 41
27 ISO. In vitro diagnostic systems—Measurement of quantities in samples of biological origin—Requirements and layout of reference
measurement procedures. ISO/DIS 15193. Geneva: International Organization for Standardization; 2001. 28 ISO. Medical laboratories – Particular requirements for quality and competence. ISO 15189. Geneva: International Organization for
Standardization; 2003. 29 ISO. Quality management systems – Fundamentals and vocabulary. ISO 9000. Geneva: International Organization for Standardization;
2000. 30 WHO. Expert Committee on Biological Standardization. Glossary of Terms for Biological Substances Used for Texts of the Requirements.
WHO unpublished document BS/95.1793. Geneva: World Health Organization; 1995. 31 Elevitch FR, ed. Analytical goals in clinical chemistry. Presented at CAP Aspen Conference, 1976. Skokie, Illinois: College of American
Pathologists; 1977. 32 Barnett RN. Analytic goals in clinical chemistry: The pathologist’s viewpoint. Pathologist. 1977;31:319-322. 33 World Association of Societies of Pathology. Proceedings of the Subcommittee on Analytical Goals in Clinical Chemistry. Analytical goals
in clinical chemistry: Their relationship to medical care. Am J Clin Pathol. 1979;71:624-630. 34 Fraser CG. Analytical goals in clinical biochemistry. Prog Clin Pathol. 1981;8:101-121. 35 National Cholesterol Education Program Laboratory Standardization Panel. Current status of blood cholesterol measurement in clinical
laboratories in the United States. Clin Chem. 1988;34:193-201. 36 Rej R, ed. Proceedings from the 1992 Clinical Chemistry Forum—Accuracy and precision goals in clinical chemistry testing: Can they be
defined by medical relevance? Clin Chem. 1993;39:1446-1544. 37 National Academy of Clinical Biochemistry Standards of Laboratory Practice Symposium on Thyroid Testing. Clin Chem. 1996;42:119-
192. 38 National Academy of Clinical Biochemistry Standards of Laboratory Practice Symposium on Therapeutic Drug Monitoring. Clin Chem.
1998;44:1072-1140. 39 Peterson PH, Fraser CG, Kallner A, Kenny D, eds. Strategies to set global analytical quality specifications in laboratory medicine. Scand J
Clin Lab Invest. 1999;59(7):475-586. 40 Ricós C, Alvarez V, Cava F, et al. Current databases on biological variation: Pros, cons and progress. Scand J Clin Lab Invest.
1999;59(7):491-500. 41 Fraser CG. Biological Variation: From Principles to Practice. Washington, DC: AACC Press; 2001. 42 Jay DW, Provasek D. Characterization and mathematical correction of hemolysis interference in selected Hitachi 717 assays. Clin Chem.
1993;39(9):1804-1810. 43 Kazmierczak SC, Catrou PG, Boudreau D. Simplified interpretive format for assessing test interference: Studies with hemoglobin-based
oxygen carrier solutions. Clin Chem. 1998;44(11):2347-2352. 44 Koch DD, Peters T. Selection and evaluation of methods. In: Burtis CA, Ashwood ER, eds. Tietz Textbook of Clinical Chemistry. 3rd ed.
Philadelphia: W.B. Saunders Co.; 1999:320-335. 45 Powers D. Overcoming the limitations of artificial specimens: Linkage to the performance of patient specimens. Clin Chem. 1995;12:1689-
1692. 46 Letellier G. Analytical interference of drugs in clinical chemistry: I. Study of 20 drugs on seven different instruments. Clin Biochem.
1985;18(6):345-351. 47 Lide DR, ed. CRC Handbook of Chemistry and Physics. Boca Raton, FL: CRC Press; 1994-1995. 48 Budavari S, ed. Merck Index and Encyclopedia of Chemicals, Drugs and Biologicals. 11th ed. Rahway, NJ: Merck & Co.; 1989. 49 Desu MM, Raghavarao D. Sample Size Methodology. San Diego: Academic Press, Inc.; 1990:7,9,30. 50 Vaks JE. Preparation of samples with equally spaced concentrations through mixing. Clin Chem. 1996;42(7):1074-1078. 51 Draper NR. Applied Regression Analysis. 2nd ed. New York: Wiley; 1981. 52 Kroll MH, Ruddell M, Blank DW, Elin RJ. A model for assessing interference. Clin Chem. 1987;33(7):1121-1123. 53 Kroll MH, Chesler R. Rationale for using multiple regression analysis with complex interferences. Eur J Clin Chem Clin Biochem.
1992;30(7):415-424.

Number 27 EP7-A2
©Clinical and Laboratory Standards Institute. All rights reserved. 42
54 Box GEP, Hunter WG, Hunter JS. Statistics for Experimenters. New York: John Wiley & Sons; 1978. 55 ISO. Quality management systems—Requirements. ISO 9001. Geneva: International Organization for Standardization; 2000. 56 ISO. Medical laboratories – Particular requirements for quality and competence. ISO 15189. Geneva: International Organization for
Standardization; 2003. 57 ISO. Quality systems—Medical devices—Particular requirements for the application of ISO 9001. ISO 13485. Geneva: International
Organization for Standardization; 2000.

Volume 25 EP7-A2
©Clinical and Laboratory Standards Institute. All rights reserved. 43
Appendix A. Guidelines for Specific Measurement Procedures A1. Guidelines for Measurement Procedures Based on Separation Techniques Separation techniques, such as chromatography and electrophoresis, are designed to be relatively free from interferences because the separation step resolves the analyte from potential interferents. Nevertheless, a systematic investigation of potentially interfering substances must be made during development of all separation techniques. Interference effects will usually fall into one of two categories: (1) The interferent is not separated from the analyte, and it enhances the signal, causing a falsely
increased result; or it quenches the signal, causing a falsely decreased result.
(2) The interferent may affect the readout obtained for the internal standard, which ultimately affects the final, calculated, analytical result.
Testing and reporting of the effect of interfering substances on separation techniques should include: • processing the appropriate sample “blank” (water, serum, solvent, etc.) through each of the steps of
the separation and detection technique. Sometimes an interferent will be manifested as a spurious signal (spot, peak, readout, etc.) at the location where the analyte or internal standard is usually found;
• testing solvent, reagents, containers or support media from different manufacturers or from different
lots or batches to define the conditions under which interferences may or may not be detected; and • noting migration time, elution pattern, location of spot or peak, speed and direction of movement, or
other physical manifestation, as appropriate, for any drugs, metabolites, or other exogenous or endogenous substances that can be detected within the time or space defined by the analyte and internal standard.
The choice of internal standard will sometimes be dictated by the location and intensity of any interfering substances in the system. By including two internal standards and checking the relative ratios of each to the other, interferents that masquerade as an internal standard may be detected. A2. Guidelines for Measurement Procedures Based on Immunochemical Principles Interference with immunochemical measurement procedures may generally be classified in a manner similar to that of other chemical reactions. As discussed in this document, various mechanisms may operate to cause either a falsely increased or decreased analytical result. Special attention must be given to the possibility that cross-reactivity or affinity of the antibody for compounds other than the analyte may exist. The specificity of the entire method depends upon the specificity of the antibody for the analyte in the environment where the analytical reaction(s) takes place. In addition to characterizing the cross-reactivity between analyte and interferent when a measurement procedure is first evaluated and developed, manufacturers should check cross-reactivity for each lot of antibody marketed. Because of the biological systems used in producing the antibody, changes in antibody affinity may be introduced after the initial assessment. It is important that this information be provided to users. In addition to analyte cross-reactive substances, the sample may contain endogenous human antibodies against the analyte or against the reagent antibodies used in the measurement procedures. For example, autoantibodies against thyroid can bind T4 or T3 and compete with the reagent antibody to produce an
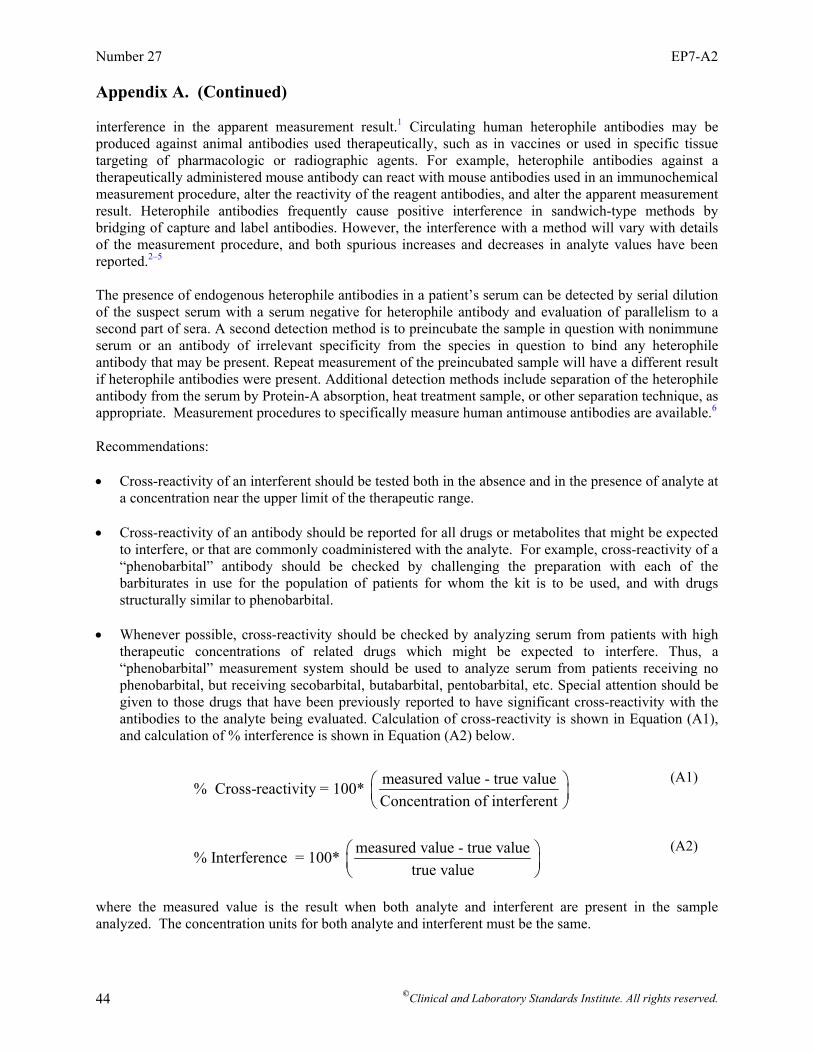
Number 27 EP7-A2
©Clinical and Laboratory Standards Institute. All rights reserved. 44
Appendix A. (Continued) interference in the apparent measurement result.1 Circulating human heterophile antibodies may be produced against animal antibodies used therapeutically, such as in vaccines or used in specific tissue targeting of pharmacologic or radiographic agents. For example, heterophile antibodies against a therapeutically administered mouse antibody can react with mouse antibodies used in an immunochemical measurement procedure, alter the reactivity of the reagent antibodies, and alter the apparent measurement result. Heterophile antibodies frequently cause positive interference in sandwich-type methods by bridging of capture and label antibodies. However, the interference with a method will vary with details of the measurement procedure, and both spurious increases and decreases in analyte values have been reported.2–5 The presence of endogenous heterophile antibodies in a patient’s serum can be detected by serial dilution of the suspect serum with a serum negative for heterophile antibody and evaluation of parallelism to a second part of sera. A second detection method is to preincubate the sample in question with nonimmune serum or an antibody of irrelevant specificity from the species in question to bind any heterophile antibody that may be present. Repeat measurement of the preincubated sample will have a different result if heterophile antibodies were present. Additional detection methods include separation of the heterophile antibody from the serum by Protein-A absorption, heat treatment sample, or other separation technique, as appropriate. Measurement procedures to specifically measure human antimouse antibodies are available.6 Recommendations: • Cross-reactivity of an interferent should be tested both in the absence and in the presence of analyte at
a concentration near the upper limit of the therapeutic range. • Cross-reactivity of an antibody should be reported for all drugs or metabolites that might be expected
to interfere, or that are commonly coadministered with the analyte. For example, cross-reactivity of a “phenobarbital” antibody should be checked by challenging the preparation with each of the barbiturates in use for the population of patients for whom the kit is to be used, and with drugs structurally similar to phenobarbital.
• Whenever possible, cross-reactivity should be checked by analyzing serum from patients with high
therapeutic concentrations of related drugs which might be expected to interfere. Thus, a “phenobarbital” measurement system should be used to analyze serum from patients receiving no phenobarbital, but receiving secobarbital, butabarbital, pentobarbital, etc. Special attention should be given to those drugs that have been previously reported to have significant cross-reactivity with the antibodies to the analyte being evaluated. Calculation of cross-reactivity is shown in Equation (A1), and calculation of % interference is shown in Equation (A2) below.
measured value - true value% Cross-reactivity = 100* Concentration of interferent
⎛ ⎞⎜ ⎟⎝ ⎠
(A1)
measured value - true value% Interference = 100* true value
⎛ ⎞⎜ ⎟⎝ ⎠
(A2)
where the measured value is the result when both analyte and interferent are present in the sample analyzed. The concentration units for both analyte and interferent must be the same.

Volume 25 EP7-A2
©Clinical and Laboratory Standards Institute. All rights reserved. 45
• Interference due to the possible presence in some patients’ serum of human heterophile antibodies against the reagent antibodies should be investigated and documented by a technique appropriate to the analytical system.
References for Appendix A 1. Howanitz PJ, Howanitz JH, Lamberson HV, Ennis KM. Incidence and mechanism of spurious
increases in serum thyrotropin. Clin Chem. 1982;28:427-431. 2. Thompson RJ, Jackson AP, Langlois N. Circulating antibodies to mouse monoclonal
immunoglobulins in normal subjects - Incidence, species specificity, and effects on a two-site assay for creatine kinase-MB isoenzyme. Clin Chem. 1986;32:476-481.
3. Primus FJ, Kelley EA, Hansen HJ, Goldenberg DM. “Sandwich”-type immunoassay for
carcinoembryonic antigen in patients receiving murine monoclonal antibodies for diagnosis and therapy. Clin Chem. 1988;34:261-264.
4. Vaidya HC, Beatty BG. Eliminating interference from heterophilic antibodies in a two-site
immunoassay for creatine kinase MB using F(ab')2 conjugate and polyclonal mouse IgG. Clin Chem. 1992;38:1737-1742.
5. Reinsberg J, Schultes B, Wagner U, Krebs D. Monitoring cancer antigen 125 in serum of ovarian
cancer patients after administration of 131I-labeled F(ab')2 fragments of OC125 antibody. Clin Chem. 1993;39:891-896.
6. Kricka LJ, Schmerfeld-Pruss D, Kaladas P, et al. Survey of methods for measuring human anti-mouse
antibodies. Clin Chim Acta. 1993;215:153-163.
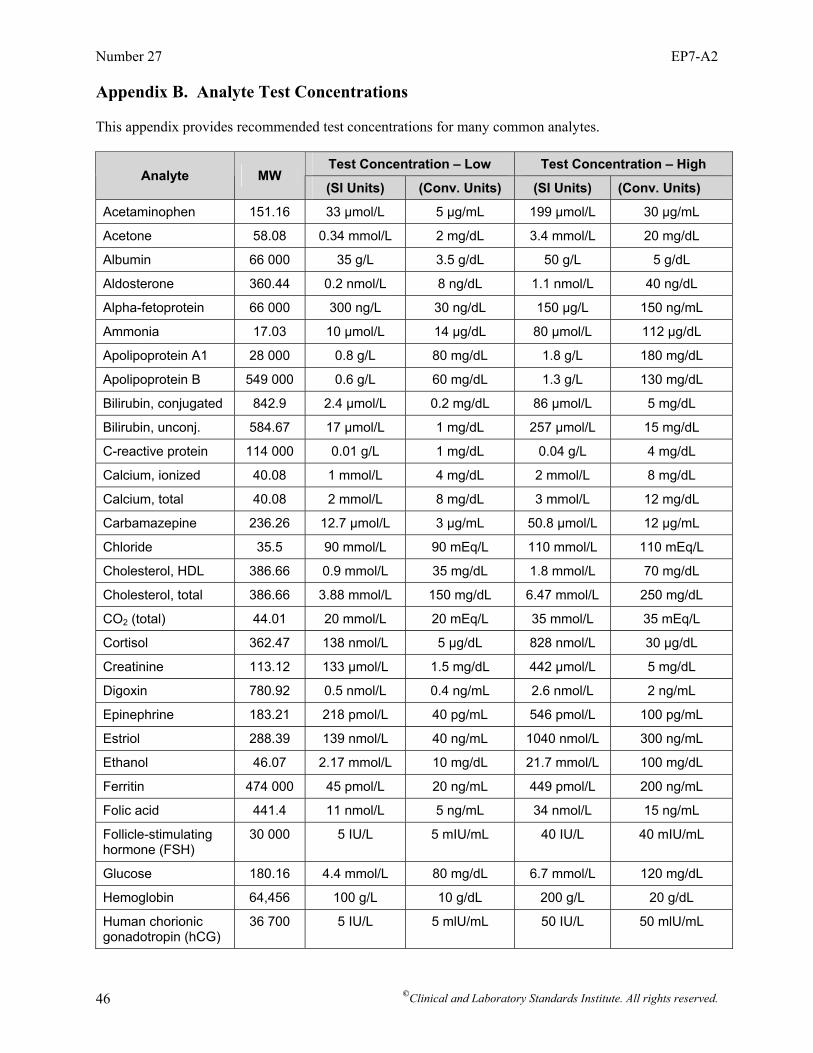
Number 27 EP7-A2
©Clinical and Laboratory Standards Institute. All rights reserved. 46
Appendix B. Analyte Test Concentrations This appendix provides recommended test concentrations for many common analytes.
Test Concentration – Low Test Concentration – High Analyte MW
(SI Units) (Conv. Units) (SI Units) (Conv. Units)
Acetaminophen 151.16 33 µmol/L 5 µg/mL 199 µmol/L 30 µg/mL
Acetone 58.08 0.34 mmol/L 2 mg/dL 3.4 mmol/L 20 mg/dL
Albumin 66 000 35 g/L 3.5 g/dL 50 g/L 5 g/dL
Aldosterone 360.44 0.2 nmol/L 8 ng/dL 1.1 nmol/L 40 ng/dL
Alpha-fetoprotein 66 000 300 ng/L 30 ng/dL 150 µg/L 150 ng/mL
Ammonia 17.03 10 µmol/L 14 µg/dL 80 µmol/L 112 µg/dL
Apolipoprotein A1 28 000 0.8 g/L 80 mg/dL 1.8 g/L 180 mg/dL
Apolipoprotein B 549 000 0.6 g/L 60 mg/dL 1.3 g/L 130 mg/dL
Bilirubin, conjugated 842.9 2.4 µmol/L 0.2 mg/dL 86 µmol/L 5 mg/dL
Bilirubin, unconj. 584.67 17 µmol/L 1 mg/dL 257 µmol/L 15 mg/dL
C-reactive protein 114 000 0.01 g/L 1 mg/dL 0.04 g/L 4 mg/dL
Calcium, ionized 40.08 1 mmol/L 4 mg/dL 2 mmol/L 8 mg/dL
Calcium, total 40.08 2 mmol/L 8 mg/dL 3 mmol/L 12 mg/dL
Carbamazepine 236.26 12.7 µmol/L 3 µg/mL 50.8 µmol/L 12 µg/mL
Chloride 35.5 90 mmol/L 90 mEq/L 110 mmol/L 110 mEq/L
Cholesterol, HDL 386.66 0.9 mmol/L 35 mg/dL 1.8 mmol/L 70 mg/dL
Cholesterol, total 386.66 3.88 mmol/L 150 mg/dL 6.47 mmol/L 250 mg/dL
CO2 (total) 44.01 20 mmol/L 20 mEq/L 35 mmol/L 35 mEq/L
Cortisol 362.47 138 nmol/L 5 µg/dL 828 nmol/L 30 µg/dL
Creatinine 113.12 133 µmol/L 1.5 mg/dL 442 µmol/L 5 mg/dL
Digoxin 780.92 0.5 nmol/L 0.4 ng/mL 2.6 nmol/L 2 ng/mL
Epinephrine 183.21 218 pmol/L 40 pg/mL 546 pmol/L 100 pg/mL
Estriol 288.39 139 nmol/L 40 ng/mL 1040 nmol/L 300 ng/mL
Ethanol 46.07 2.17 mmol/L 10 mg/dL 21.7 mmol/L 100 mg/dL
Ferritin 474 000 45 pmol/L 20 ng/mL 449 pmol/L 200 ng/mL
Folic acid 441.4 11 nmol/L 5 ng/mL 34 nmol/L 15 ng/mL
Follicle-stimulating hormone (FSH)
30 000 5 IU/L 5 mIU/mL 40 IU/L 40 mIU/mL
Glucose 180.16 4.4 mmol/L 80 mg/dL 6.7 mmol/L 120 mg/dL
Hemoglobin 64,456 100 g/L 10 g/dL 200 g/L 20 g/dL
Human chorionic gonadotropin (hCG)
36 700 5 IU/L 5 mlU/mL 50 IU/L 50 mlU/mL
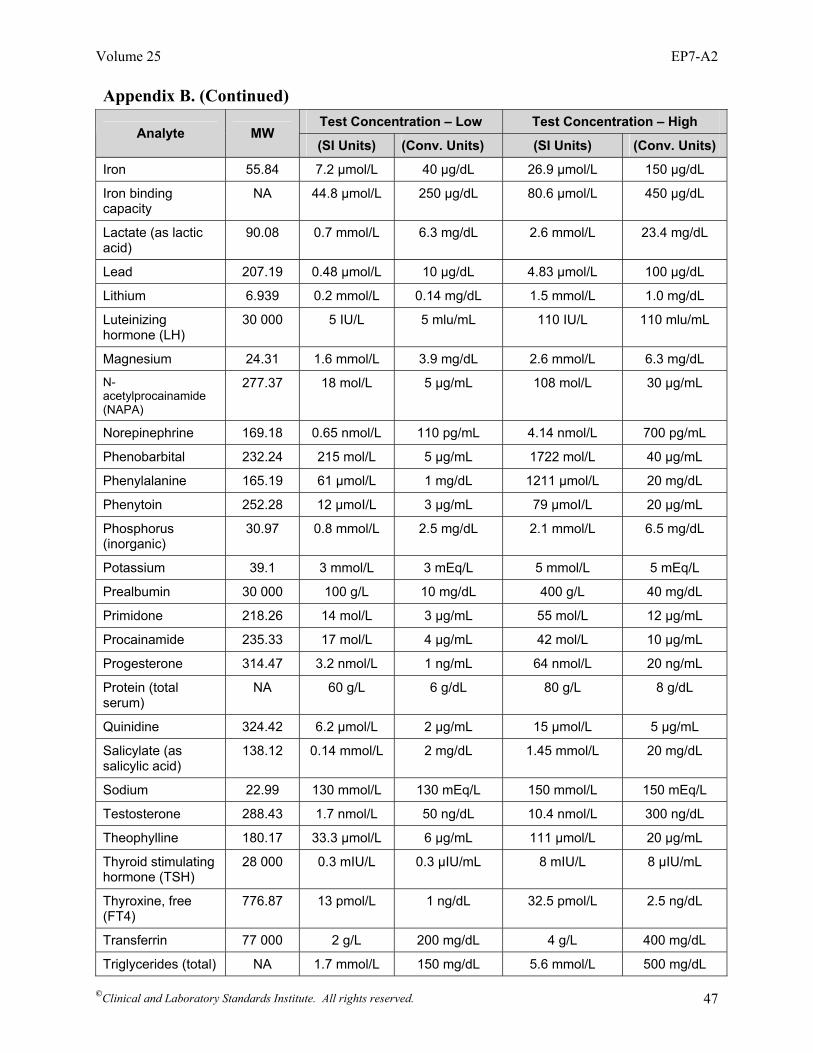
Volume 25 EP7-A2
©Clinical and Laboratory Standards Institute. All rights reserved. 47
Appendix B. (Continued)
Test Concentration – Low Test Concentration – High Analyte MW
(SI Units) (Conv. Units) (SI Units) (Conv. Units)
Iron 55.84 7.2 µmol/L 40 µg/dL 26.9 µmol/L 150 µg/dL
Iron binding capacity
NA 44.8 µmol/L 250 µg/dL 80.6 µmol/L 450 µg/dL
Lactate (as lactic acid)
90.08 0.7 mmol/L 6.3 mg/dL 2.6 mmol/L 23.4 mg/dL
Lead 207.19 0.48 µmol/L 10 µg/dL 4.83 µmol/L 100 µg/dL
Lithium 6.939 0.2 mmol/L 0.14 mg/dL 1.5 mmol/L 1.0 mg/dL
Luteinizing hormone (LH)
30 000 5 IU/L 5 mlu/mL 110 IU/L 110 mlu/mL
Magnesium 24.31 1.6 mmol/L 3.9 mg/dL 2.6 mmol/L 6.3 mg/dL
N-acetylprocainamide (NAPA)
277.37 18 mol/L 5 µg/mL 108 mol/L 30 µg/mL
Norepinephrine 169.18 0.65 nmol/L 110 pg/mL 4.14 nmol/L 700 pg/mL
Phenobarbital 232.24 215 mol/L 5 µg/mL 1722 mol/L 40 µg/mL
Phenylalanine 165.19 61 µmol/L 1 mg/dL 1211 µmol/L 20 mg/dL
Phenytoin 252.28 12 µmoI/L 3 µg/mL 79 µmoI/L 20 µg/mL
Phosphorus (inorganic)
30.97 0.8 mmol/L 2.5 mg/dL 2.1 mmol/L 6.5 mg/dL
Potassium 39.1 3 mmol/L 3 mEq/L 5 mmol/L 5 mEq/L
Prealbumin 30 000 100 g/L 10 mg/dL 400 g/L 40 mg/dL
Primidone 218.26 14 mol/L 3 µg/mL 55 mol/L 12 µg/mL
Procainamide 235.33 17 mol/L 4 µg/mL 42 mol/L 10 µg/mL
Progesterone 314.47 3.2 nmol/L 1 ng/mL 64 nmol/L 20 ng/mL
Protein (total serum)
NA 60 g/L 6 g/dL 80 g/L 8 g/dL
Quinidine 324.42 6.2 µmol/L 2 µg/mL 15 µmol/L 5 µg/mL
Salicylate (as salicylic acid)
138.12 0.14 mmol/L 2 mg/dL 1.45 mmol/L 20 mg/dL
Sodium 22.99 130 mmol/L 130 mEq/L 150 mmol/L 150 mEq/L
Testosterone 288.43 1.7 nmol/L 50 ng/dL 10.4 nmol/L 300 ng/dL
Theophylline 180.17 33.3 µmol/L 6 µg/mL 111 µmol/L 20 µg/mL
Thyroid stimulating hormone (TSH)
28 000 0.3 mIU/L 0.3 µIU/mL 8 mIU/L 8 µIU/mL
Thyroxine, free (FT4)
776.87 13 pmol/L 1 ng/dL 32.5 pmol/L 2.5 ng/dL
Transferrin 77 000 2 g/L 200 mg/dL 4 g/L 400 mg/dL
Triglycerides (total) NA 1.7 mmol/L 150 mg/dL 5.6 mmol/L 500 mg/dL
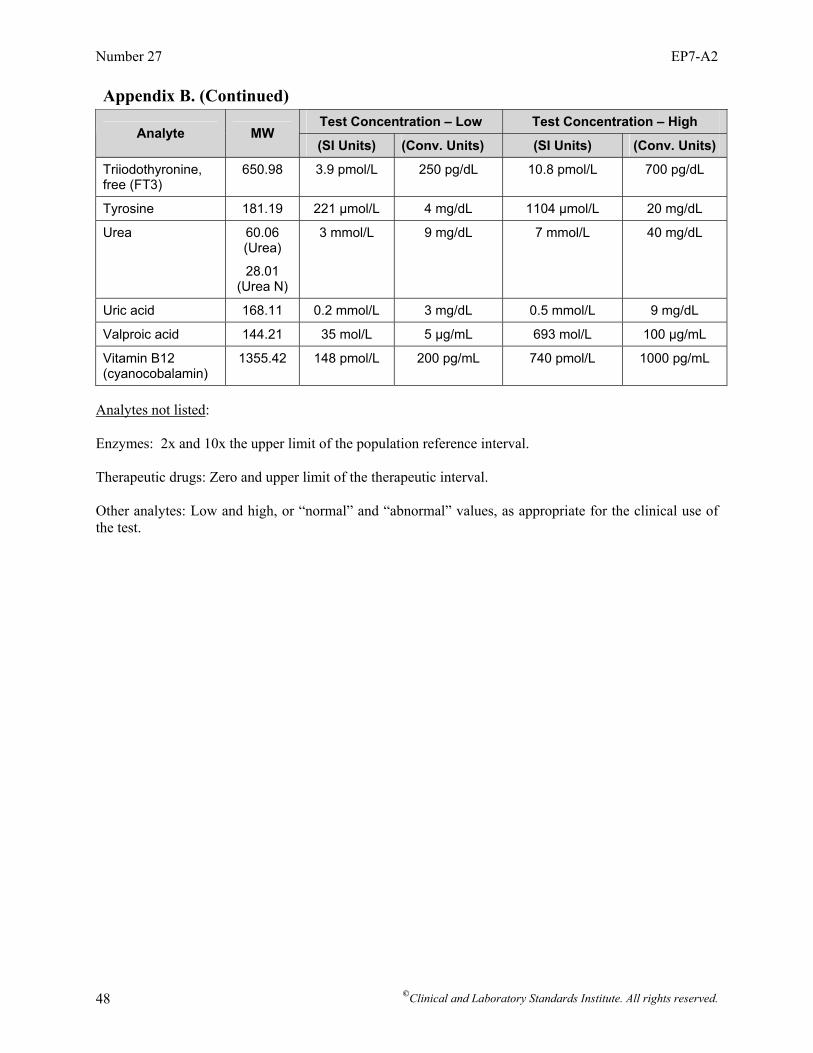
Number 27 EP7-A2
©Clinical and Laboratory Standards Institute. All rights reserved. 48
Appendix B. (Continued)
Test Concentration – Low Test Concentration – High Analyte MW
(SI Units) (Conv. Units) (SI Units) (Conv. Units)
Triiodothyronine, free (FT3)
650.98 3.9 pmol/L 250 pg/dL 10.8 pmol/L 700 pg/dL
Tyrosine 181.19 221 µmol/L 4 mg/dL 1104 µmol/L 20 mg/dL
Urea 60.06 (Urea)
28.01 (Urea N)
3 mmol/L 9 mg/dL 7 mmol/L 40 mg/dL
Uric acid 168.11 0.2 mmol/L 3 mg/dL 0.5 mmol/L 9 mg/dL
Valproic acid 144.21 35 mol/L 5 µg/mL 693 mol/L 100 µg/mL
Vitamin B12 (cyanocobalamin)
1355.42 148 pmol/L 200 pg/mL 740 pmol/L 1000 pg/mL
Analytes not listed: Enzymes: 2x and 10x the upper limit of the population reference interval. Therapeutic drugs: Zero and upper limit of the therapeutic interval. Other analytes: Low and high, or “normal” and “abnormal” values, as appropriate for the clinical use of the test.
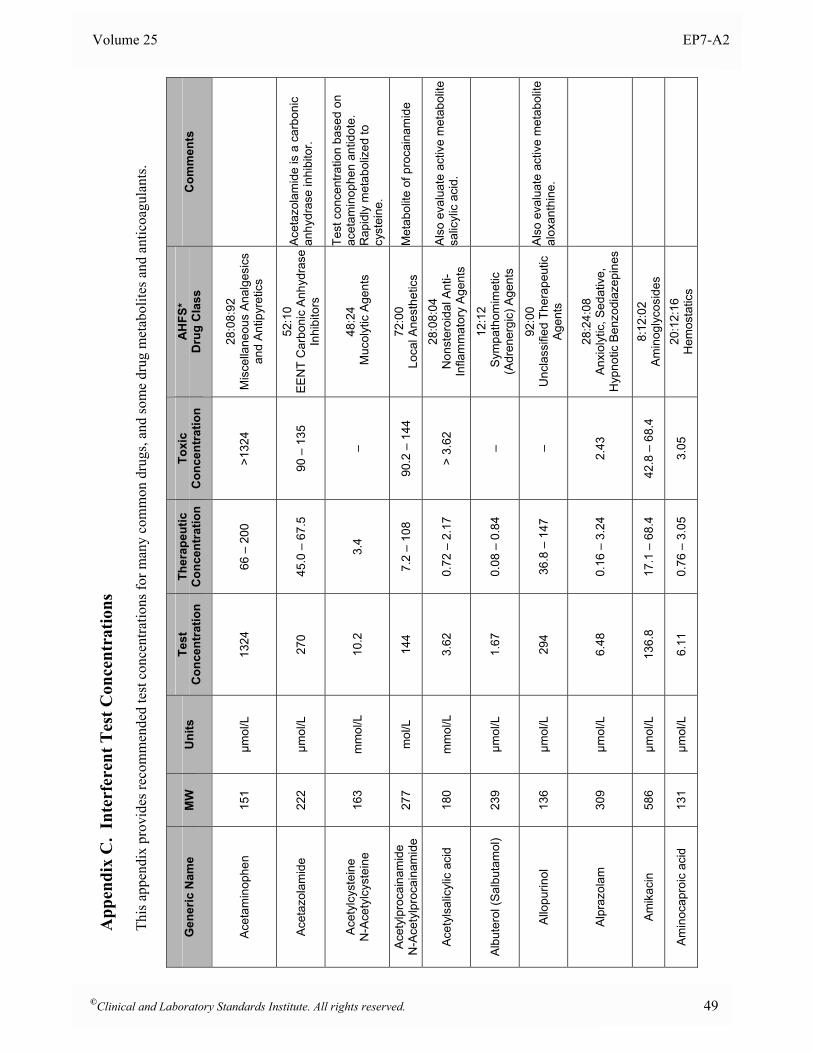
Volume 25 EP7-A2
App
endi
x C
. In
terf
eren
t Tes
t Con
cent
ratio
ns
Th
is a
ppen
dix
prov
ides
reco
mm
ende
d te
st c
once
ntra
tions
for m
any
com
mon
dru
gs, a
nd so
me
drug
met
abol
ites a
nd a
ntic
oagu
lant
s.
Gen
eric
Nam
e M
W
Uni
ts
Test
C
once
ntra
tion
Ther
apeu
tic
Con
cent
ratio
nTo
xic
Con
cent
ratio
n A
HFS
* D
rug
Cla
ss
Com
men
ts
Acet
amin
ophe
n 15
1 µm
ol/L
13
24
66 –
200
>1
324
28:0
8:92
M
isce
llane
ous
Anal
gesi
cs
and
Ant
ipyr
etic
s
Acet
azol
amid
e 22
2 µm
ol/L
27
0 45
.0 –
67.
5 90
– 1
35
52:1
0
EEN
T C
arbo
nic
Anhy
dras
e In
hibi
tors
Ace
tazo
lam
ide
is a
car
boni
c an
hydr
ase
inhi
bito
r.
Ace
tylc
yste
ine
N
-Ace
tylc
yste
ine
16
3 m
mol
/L
10.2
3.
4 –
48:2
4 M
ucol
ytic
Age
nts
Test
con
cent
ratio
n ba
sed
on
acet
amin
ophe
n an
tidot
e.
Rap
idly
met
abol
ized
to
cyst
eine
.
Acet
ylpr
ocai
nam
ide
N
-Ace
tylp
roca
inam
ide
27
7 m
ol/L
14
4 7.
2 –
108
90.2
– 1
44
72:0
0
Loca
l Ane
sthe
tics
Met
abol
ite o
f pro
cain
amid
e
Acet
ylsa
licyl
ic a
cid
180
mm
ol/L
3.
62
0.72
– 2
.17
> 3.
62
28:0
8:04
N
onst
eroi
dal A
nti-
Infla
mm
ator
y A
gent
s
Als
o ev
alua
te a
ctiv
e m
etab
olite
sa
licyl
ic a
cid.
Albu
tero
l (Sa
lbut
amol
) 23
9 µm
ol/L
1.
67
0.08
– 0
.84
– 12
:12
Sym
path
omim
etic
(A
dren
ergi
c) A
gent
s
Allo
purin
ol
136
µmol
/L
294
36.8
– 1
47
– 92
:00
U
ncla
ssifi
ed T
hera
peut
ic
Age
nts
Als
o ev
alua
te a
ctiv
e m
etab
olite
al
oxan
thin
e.
Alpr
azol
am
309
µmol
/L
6.48
0.
16 –
3.2
4 2.
43
28:2
4:08
A
nxio
lytic
, Sed
ativ
e,
Hyp
notic
Ben
zodi
azep
ines
Amik
acin
58
6 µm
ol/L
13
6.8
17.1
– 6
8.4
42.8
– 6
8.4
8:12
:02
A
min
ogly
cosi
des
Amin
ocap
roic
aci
d 13
1 µm
ol/L
6.
11
0.76
– 3
.05
3.05
20
:12:
16
Hem
osta
tics
©Clinical and Laboratory Standards Institute. All rights reserved. 49

Number 27 EP7-A2
App
endi
x C
. (C
ontin
ued)
Gen
eric
Nam
e M
W
Uni
ts
Test
C
once
ntra
tion
Ther
apeu
tic
Con
cent
ratio
nTo
xic
Con
cent
ratio
n A
HFS
* D
rug
Cla
ss
Com
men
ts
Am
inop
hylli
ne (s
ee
Theo
phyl
line)
–
– –
– –
86:1
6 R
espi
rato
ry S
moo
th M
uscl
e R
elax
ants
Am
inop
hylli
ne is
a m
odifi
ed
form
of t
heop
hylli
ne.
5-Am
inos
alic
ylic
aci
d
153
µmol
/L
26.1
13
.1
– 56
:00
Gas
troin
test
inal
Dru
gs
Met
abol
ite o
f sul
fasa
lazi
ne
Amin
osal
icyl
ic a
cid
p-Am
inos
alic
ylic
aci
d 15
3 m
mol
/L
5.22
0.
2 –
2.62
–
8:16
:04
Ant
itube
rcul
osis
Age
nt
Amio
daro
ne
682
µmol
/L
8.92
0.
74 –
4.4
6 3.
71 –
5.2
0 24
:08
M
isc.
Car
diac
Age
nts
Als
o ev
alua
te m
etab
olite
N-
dese
thyl
amio
daro
ne.
Amitr
ipty
line
27
7 µm
ol/L
3.
61
0.27
– 0
.90
1.81
– 3
.61
28:1
6:04
An
tidep
ress
ants
A
lso
eval
uate
met
abol
ite 1
0-hy
drox
ynor
tript
ylin
e.
Amlo
dipi
ne
409
nmol
/L
245
49 –
123
–
24:0
2 C
alci
um C
hann
el B
lock
ers
Amob
arbi
tal
226
µmol
/L
88.4
4.
42 –
22.
1 66
.3 –
88.
4 28
:24.
04
Anx
ioly
tic, S
edat
ive,
and
H
ypno
tic B
arbi
tura
tes
Amox
apin
e 31
4 µm
ol/L
3.
19
0.32
– 1
.60
1.6
28:1
6:04
An
tidep
ress
ants
Amox
icill
in
365
µmol
/L
206
8.22
– 6
8.5
– 08
:12:
16
Peni
cilli
ns
Am
phet
amin
e (d
- and
l- )
13
5 µm
ol/L
7.
4 1.
48
7.4
28:2
0
Res
pira
tory
and
Cer
ebra
l S
timul
ants
Ampi
cilli
n 34
9 µm
ol/L
15
2 7.
59 –
50.
6 –
08:1
2:16
Pe
nici
llins
Asco
rbic
aci
d (V
itam
in C
) 17
6 µm
ol/L
34
2 23
– 1
14
– 88
:12
Vita
min
s
Aste
miz
ole
459
µmol
/L
0.65
0.
22
– 04
:00
Antih
ista
min
e D
rugs
50 ©Clinical and Laboratory Standards Institute. All rights reserved.
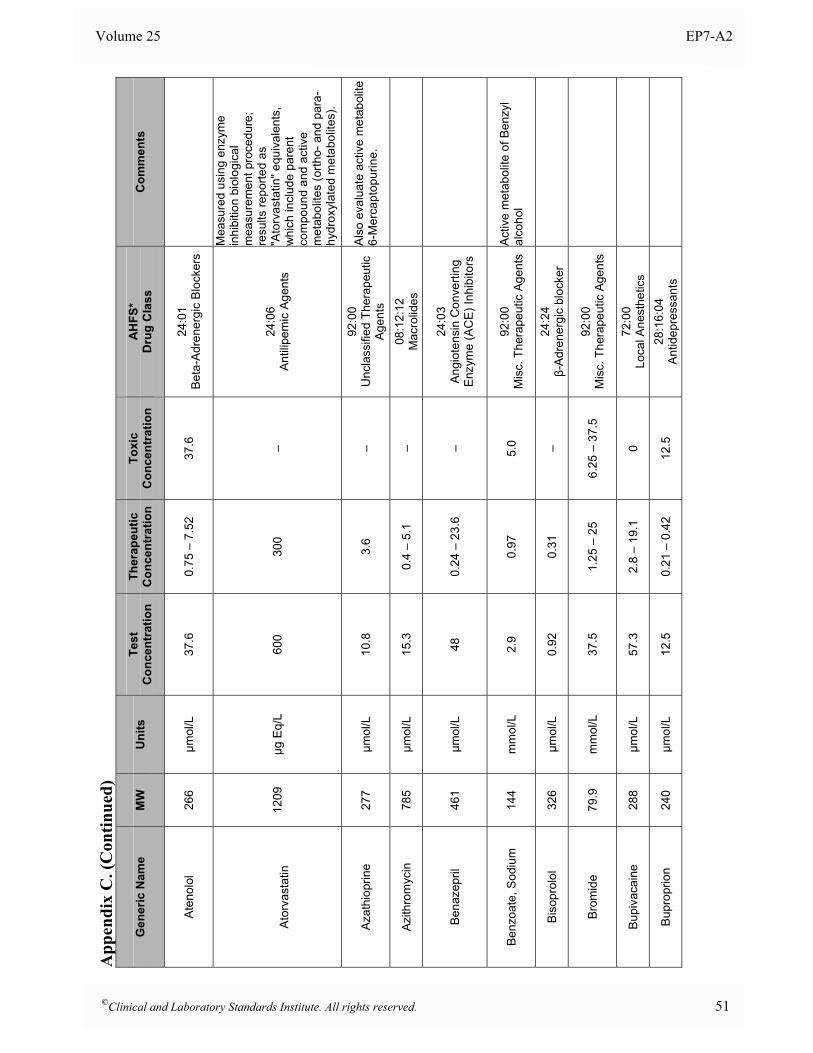
Volume 25 EP7-A2
App
endi
x C
. (C
ontin
ued)
Gen
eric
Nam
e M
W
Uni
ts
Test
C
once
ntra
tion
Ther
apeu
tic
Con
cent
ratio
nTo
xic
Con
cent
ratio
n A
HFS
* D
rug
Cla
ss
Com
men
ts
Aten
olol
26
6 µm
ol/L
37
.6
0.75
– 7
.52
37.6
24
:01
B
eta-
Adr
ener
gic
Blo
cker
s
A
torv
asta
tin
1209
µg
Eq/
L 60
0 30
0 –
24:0
6
Ant
ilipe
mic
Age
nts
Mea
sure
d us
ing
enzy
me
inhi
bitio
n bi
olog
ical
m
easu
rem
ent p
roce
dure
; re
sults
repo
rted
as
"Ato
rvas
tatin
" equ
ival
ents
, w
hich
incl
ude
pare
nt
com
poun
d an
d ac
tive
met
abol
ites
(orth
o- a
nd p
ara-
hydr
oxyl
ated
met
abol
ites)
.
Azat
hiop
rine
277
µmol
/L
10.8
3.
6 –
92:0
0
Unc
lass
ified
The
rape
utic
A
gent
s
Als
o ev
alua
te a
ctiv
e m
etab
olite
6-
Mer
capt
opur
ine.
Azith
rom
ycin
78
5 µm
ol/L
15
.3
0.4
– 5.
1 –
08:1
2:12
M
acro
lides
Bena
zepr
il 46
1 µm
ol/L
48
0.
24 –
23.
6 –
24:0
3
Ang
iote
nsin
Con
verti
ng
Enz
yme
(AC
E) I
nhib
itors
Ben
zoat
e, S
odiu
m
144
mm
ol/L
2.
9 0.
97
5.0
92:0
0
Mis
c. T
hera
peut
ic A
gent
s A
ctiv
e m
etab
olite
of B
enzy
l al
coho
l
Biso
prol
ol
326
µmol
/L
0.92
0.
31
– 24
:24
β-A
dren
ergi
c bl
ocke
r
Brom
ide
79.9
m
mol
/L
37.5
1.
25 –
25
6.25
– 3
7.5
92:0
0
Mis
c. T
hera
peut
ic A
gent
s
Bupi
vaca
ine
288
µmol
/L
57.3
2.
8 –
19.1
0
72:0
0
Loca
l Ane
sthe
tics
Bupr
oprio
n 24
0 µm
ol/L
12
.5
0.21
– 0
.42
12.5
28
:16:
04
Antid
epre
ssan
ts
©Clinical and Laboratory Standards Institute. All rights reserved. 51
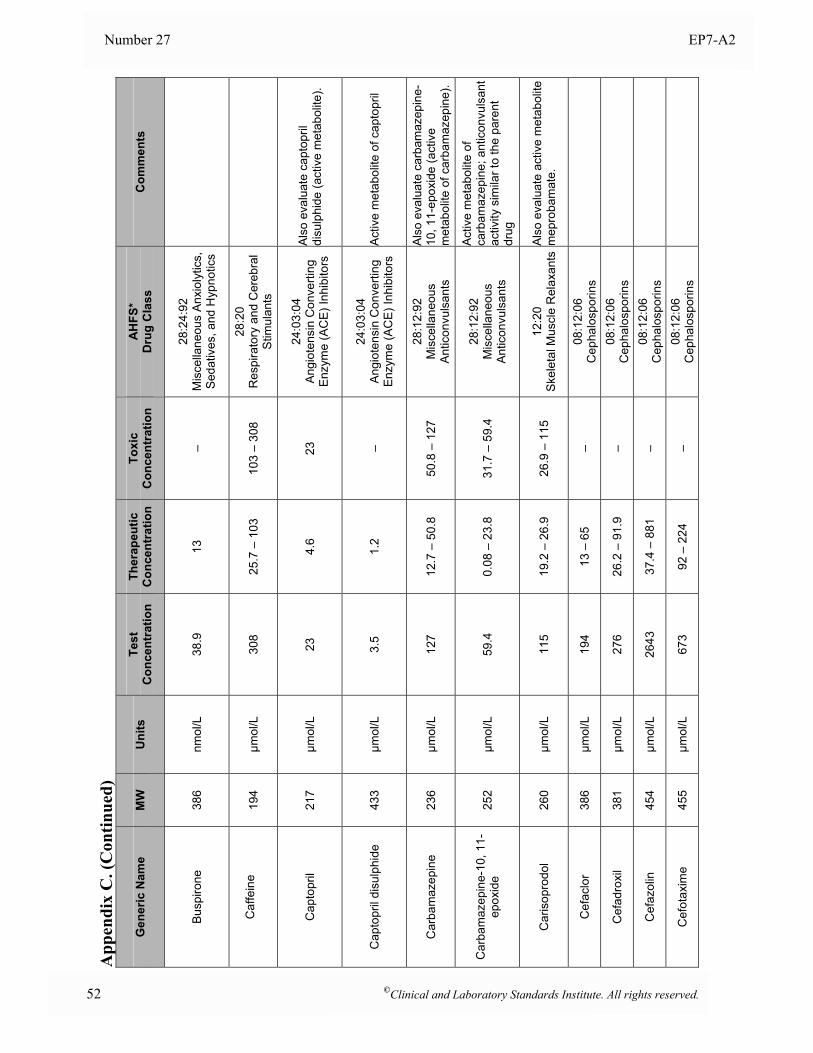
Number 27 EP7-A2
App
endi
x C
. (C
ontin
ued)
Gen
eric
Nam
e M
W
Uni
ts
Test
C
once
ntra
tion
Ther
apeu
tic
Con
cent
ratio
nTo
xic
Con
cent
ratio
n A
HFS
* D
rug
Cla
ss
Com
men
ts
Busp
irone
38
6 nm
ol/L
38
.9
13
– 28
:24:
92
Mis
cella
neou
s A
nxio
lytic
s,
Sed
ativ
es, a
nd H
ypno
tics
C
affe
ine
194
µmol
/L
308
25.7
– 1
03
103
– 30
8 28
:20
R
espi
rato
ry a
nd C
ereb
ral
Stim
ulan
ts
Cap
topr
il 21
7 µm
ol/L
23
4.
6 23
24
:03:
04
Ang
iote
nsin
Con
verti
ng
Enz
yme
(AC
E) I
nhib
itors
Als
o ev
alua
te c
apto
pril
disu
lphi
de (a
ctiv
e m
etab
olite
).
Cap
topr
il di
sulp
hide
43
3 µm
ol/L
3.
5 1.
2 –
24:0
3:04
A
ngio
tens
in C
onve
rting
E
nzym
e (A
CE
) Inh
ibito
rs
Act
ive
met
abol
ite o
f cap
topr
il
Car
bam
azep
ine
236
µmol
/L
127
12.7
– 5
0.8
50.8
– 1
27
28:1
2:92
M
isce
llane
ous
Ant
icon
vuls
ants
Als
o ev
alua
te c
arba
maz
epin
e-10
, 11-
epox
ide
(act
ive
met
abol
ite o
f car
bam
azep
ine)
.
Car
bam
azep
ine-
10, 1
1-ep
oxid
e
252
µmol
/L
59.4
0.
08 –
23.
8 31
.7 –
59.
4 28
:12:
92
Mis
cella
neou
s A
ntic
onvu
lsan
ts
Act
ive
met
abol
ite o
f ca
rbam
azep
ine;
ant
icon
vuls
ant
activ
ity s
imila
r to
the
pare
nt
drug
Car
isop
rodo
l 26
0 µm
ol/L
11
5 19
.2 –
26.
9 26
.9 –
115
12
:20
S
kele
tal M
uscl
e R
elax
ants
Als
o ev
alua
te a
ctiv
e m
etab
olite
m
epro
bam
ate.
Cef
aclo
r 38
6 µm
ol/L
19
4 13
– 6
5 –
08:1
2:06
C
epha
losp
orin
s
Cef
adro
xil
381
µmol
/L
276
26.2
– 9
1.9
– 08
:12:
06
Cep
halo
spor
ins
Cef
azol
in
454
µmol
/L
2643
37
.4 –
881
–
08:1
2:06
C
epha
losp
orin
s
Cef
otax
ime
455
µmol
/L
673
92 –
224
–
08:1
2:06
C
epha
losp
orin
s
52 ©Clinical and Laboratory Standards Institute. All rights reserved.

Volume 25 EP7-A2
App
endi
x C
. (C
ontin
ued)
Gen
eric
Nam
e M
W
Uni
ts
Test
C
once
ntra
tion
Ther
apeu
tic
Con
cent
ratio
nTo
xic
Con
cent
ratio
n A
HFS
* D
rug
Cla
ss
Com
men
ts
C
efox
itin
427
µmol
/L
1546
47
– 5
15
– 08
:12:
07
Mis
c β
Lact
ams
Cef
triax
one
555
µmol
/L
1460
90
– 4
86
– 08
:12:
06
Cep
halo
spor
ins
Cef
urox
ime
424
µmol
/L
1416
23
6 –
472
– 08
:12:
06
Cep
halo
spor
ins
C
epha
lexi
n 34
7 µm
ol/L
33
7 11
.5 –
112
–
08:1
2:06
C
epha
losp
orin
s
Cep
halo
thin
39
6 µm
ol/L
76
0 51
– 2
53
– 08
:12:
06
Cep
halo
spor
ins
Cep
hapi
rin s
odiu
m
445
µmol
/L
876
79 –
292
–
08:1
2:06
C
epha
losp
orin
s
Cet
irizi
ne
389
µmol
/L
7.7
2.6
– 04
:00
An
tihis
tam
ine
Dru
gs
Chl
oral
Hyd
rate
(see
m
etab
olite
Tr
ichl
oroe
than
ol)
165
NA
NA
NA
NA
28:2
4:92
M
isce
llane
ous
Anx
ioly
tics,
S
edat
ives
, and
Hyp
notic
s
Eva
luat
e ac
tive
met
abol
ite
2,2,
2-tri
chlo
roet
hano
l
Chl
oram
phen
icol
32
3 µm
ol/L
15
5 30
.9 –
77.
3 77
.3 –
124
08
:12:
08
Chl
oram
phen
icol
52
:04:
04 E
EN
T A
ntib
iotic
s
Chl
ordi
azep
oxid
e 30
0 µm
ol/L
33
.3
3.33
– 1
6.7
16.7
– 3
3.3
28:2
4:08
A
nxio
lytic
, Sed
ativ
e,
Hyp
notic
Ben
zodi
azep
ines
Chl
orot
hiaz
ide
296
µmol
/L
67.6
6.
76 –
33.
8 –
40:2
8
Diu
retic
s
Chl
orpr
omaz
ine
319
µmol
/L
6.3
0.03
– 1
.57
2.35
– 6
.27
28:1
6:08
An
tipsy
chot
ics/
Tran
quiliz
ers
Chl
orpr
opam
ide
277
mm
ol/L
2.
7 0.
1 –
1.3
0.7
– 2.
7 68
:20:
20
Sulfo
nylu
reas
©Clinical and Laboratory Standards Institute. All rights reserved. 53
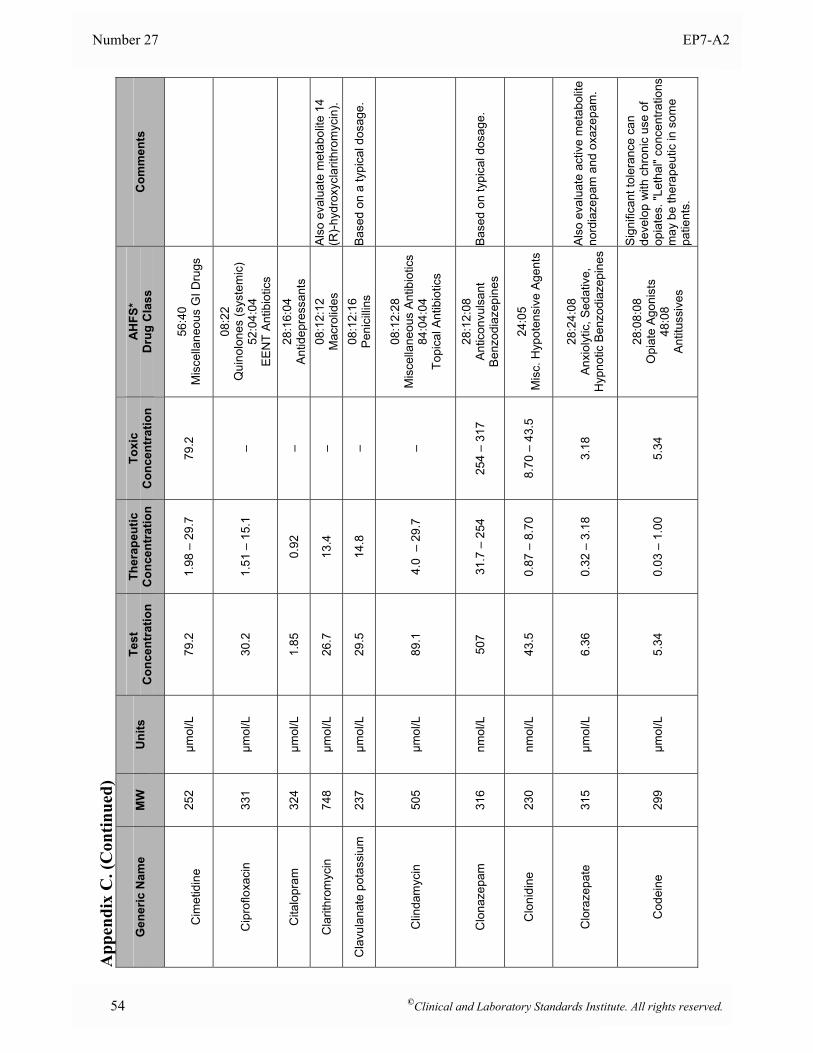
Number 27 EP7-A2
App
endi
x C
. (C
ontin
ued)
Gen
eric
Nam
e M
W
Uni
ts
Test
C
once
ntra
tion
Ther
apeu
tic
Con
cent
ratio
nTo
xic
Con
cent
ratio
n A
HFS
* D
rug
Cla
ss
Com
men
ts
C
imet
idin
e 25
2 µm
ol/L
79
.2
1.98
– 2
9.7
79.2
56
:40
M
isce
llane
ous
GI D
rugs
Cip
roflo
xaci
n 33
1 µm
ol/L
30
.2
1.51
– 1
5.1
–
08:2
2
Qui
nolo
nes
(sys
tem
ic)
52:0
4:04
E
EN
T A
ntib
iotic
s
Cita
lopr
am
324
µmol
/L
1.85
0.
92
– 28
:16:
04
Antid
epre
ssan
ts
Cla
rithr
omyc
in
748
µmol
/L
26.7
13
.4
– 08
:12:
12
Mac
rolid
es
Als
o ev
alua
te m
etab
olite
14
(R)-
hydr
oxyc
larit
hrom
ycin
).
Cla
vula
nate
pot
assi
um
237
µmol
/L
29.5
14
.8
– 08
:12:
16
Peni
cilli
ns
Bas
ed o
n a
typi
cal d
osag
e.
Clin
dam
ycin
50
5 µm
ol/L
89
.1
4.0
– 2
9.7
–
08:1
2:28
M
isce
llane
ous
Ant
ibio
tics
84:0
4:04
To
pica
l Ant
ibio
tics
Clo
naze
pam
31
6 nm
ol/L
50
7 31
.7 –
254
25
4 –
317
28:1
2:08
A
ntic
onvu
lsan
t B
enzo
diaz
epin
es
Base
d on
typi
cal d
osag
e.
Clo
nidi
ne
230
nmol
/L
43.5
0.
87 –
8.7
0 8.
70 –
43.
5 24
:05
M
isc.
Hyp
oten
sive
Age
nts
Clo
raze
pate
31
5 µm
ol/L
6.
36
0.32
– 3
.18
3.18
28
:24:
08
Anx
ioly
tic, S
edat
ive,
H
ypno
tic B
enzo
diaz
epin
es
Als
o ev
alua
te a
ctiv
e m
etab
olite
no
rdia
zepa
m a
nd o
xaze
pam
.
Cod
eine
29
9 µm
ol/L
5.
34
0.03
– 1
.00
5.34
28:0
8:08
O
piat
e A
goni
sts
48
:08
A
ntitu
ssiv
es
Sig
nific
ant t
oler
ance
can
de
velo
p w
ith c
hron
ic u
se o
f op
iate
s. "L
etha
l" co
ncen
tratio
ns
may
be
ther
apeu
tic in
som
e pa
tient
s.
54 ©Clinical and Laboratory Standards Institute. All rights reserved.
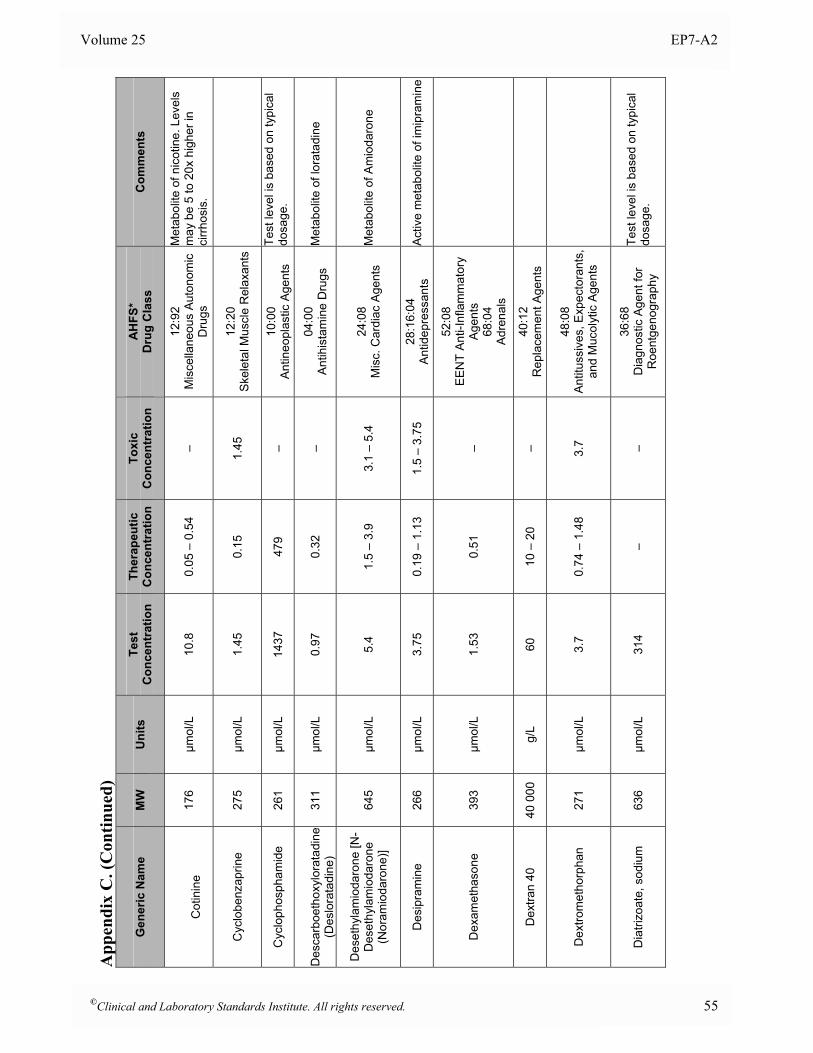
Volume 25 EP7-A2
App
endi
x C
. (C
ontin
ued)
Gen
eric
Nam
e M
W
Uni
ts
Test
C
once
ntra
tion
Ther
apeu
tic
Con
cent
ratio
nTo
xic
Con
cent
ratio
n A
HFS
* D
rug
Cla
ss
Com
men
ts
C
otin
ine
17
6 µm
ol/L
10
.8
0.05
– 0
.54
– 12
:92
M
isce
llane
ous
Auto
nom
ic
Dru
gs
Met
abol
ite o
f nic
otin
e. L
evel
s m
ay b
e 5
to 2
0x h
ighe
r in
cirrh
osis
.
Cyc
lobe
nzap
rine
275
µmol
/L
1.45
0.
15
1.45
12
:20
S
kele
tal M
uscl
e R
elax
ants
Cyc
loph
osph
amid
e 26
1 µm
ol/L
14
37
479
– 10
:00
A
ntin
eopl
astic
Age
nts
Test
leve
l is
base
d on
typi
cal
dosa
ge.
D
esca
rboe
thox
ylor
atad
ine
(Des
lora
tadi
ne)
311
µmol
/L
0.97
0.
32
– 04
:00
A
ntih
ista
min
e D
rugs
M
etab
olite
of l
orat
adin
e
Des
ethy
lam
ioda
rone
[N-
Des
ethy
lam
ioda
rone
(N
oram
ioda
rone
)] 64
5 µm
ol/L
5.
4 1.
5 –
3.9
3.1
– 5.
4 24
:08
M
isc.
Car
diac
Age
nts
Met
abol
ite o
f Am
ioda
rone
Des
ipra
min
e
266
µmol
/L
3.75
0.
19 –
1.1
3 1.
5 –
3.75
28
:16:
04
Antid
epre
ssan
ts
Act
ive
met
abol
ite o
f im
ipra
min
e
Dex
amet
haso
ne
393
µmol
/L
1.53
0.
51
–
52:0
8
EE
NT
Ant
i-Inf
lam
mat
ory
Age
nts
68
:04
A
dren
als
Dex
tran
40
40 0
00
g/L
60
10 –
20
– 40
:12
R
epla
cem
ent A
gent
s
Dex
trom
etho
rpha
n 27
1 µm
ol/L
3.
7 0.
74 –
1.4
8 3.
7 48
:08
A
ntitu
ssiv
es, E
xpec
tora
nts,
an
d M
ucol
ytic
Age
nts
Dia
trizo
ate,
sod
ium
63
6 µm
ol/L
31
4 –
– 36
:68
D
iagn
ostic
Age
nt fo
r R
oent
geno
grap
hy
Test
leve
l is
base
d on
typi
cal
dosa
ge.
©Clinical and Laboratory Standards Institute. All rights reserved. 55
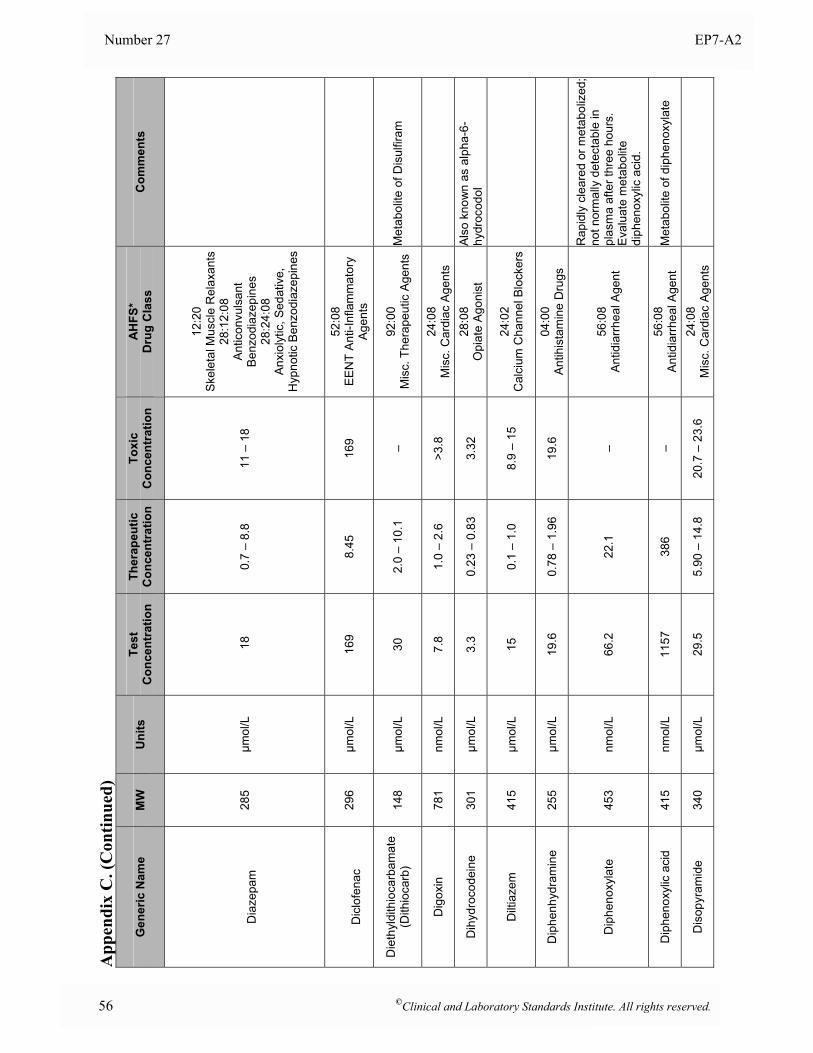
Number 27 EP7-A2
App
endi
x C
. (C
ontin
ued)
Gen
eric
Nam
e M
W
Uni
ts
Test
C
once
ntra
tion
Ther
apeu
tic
Con
cent
ratio
nTo
xic
Con
cent
ratio
n A
HFS
* D
rug
Cla
ss
Com
men
ts
D
iaze
pam
28
5 µm
ol/L
1
8 0.
7 –
8.8
11 –
18
12:2
0
Ske
leta
l Mus
cle
Rel
axan
ts
28:1
2:08
A
ntic
onvu
lsan
t B
enzo
diaz
epin
es
28:2
4:08
A
nxio
lytic
, Sed
ativ
e,
Hyp
notic
Ben
zodi
azep
ines
D
iclo
fena
c 29
6 µm
ol/L
16
9 8.
45
169
52:0
8
EE
NT
Ant
i-Inf
lam
mat
ory
Age
nts
Die
thyl
dith
ioca
rbam
ate
(Dith
ioca
rb)
148
µmol
/L
30
2.0
– 10
.1
– 92
:00
M
isc.
The
rape
utic
Age
nts
Met
abol
ite o
f Dis
ulfir
am
Dig
oxin
78
1 nm
ol/L
7.
8 1.
0 –
2.6
>3.8
24
:08
M
isc.
Car
diac
Age
nts
Dih
ydro
code
ine
30
1 µm
ol/L
3.
3 0.
23 –
0.8
3 3.
32
28:0
8 O
piat
e A
goni
st
Als
o kn
own
as a
lpha
-6-
hydr
ocod
ol
Dilt
iaze
m
415
µmol
/L
15
0.1
– 1.
0 8.
9 –
15
24:0
2
Cal
cium
Cha
nnel
Blo
cker
s
Dip
henh
ydra
min
e 25
5 µm
ol/L
19
.6
0.78
– 1
.96
19.6
04
:00
An
tihis
tam
ine
Dru
gs
Dip
heno
xyla
te
453
nmol
/L
66.2
22
.1
– 56
:08
Antid
iarrh
eal A
gent
Rap
idly
cle
ared
or m
etab
oliz
ed;
not n
orm
ally
det
ecta
ble
in
plas
ma
afte
r thr
ee h
ours
. E
valu
ate
met
abol
ite
diph
enox
ylic
aci
d.
Dip
heno
xylic
aci
d
415
nmol
/L
1157
38
6 –
56:0
8 An
tidia
rrhea
l Age
nt
Met
abol
ite o
f dip
heno
xyla
te
Dis
opyr
amid
e 34
0 µm
ol/L
29
.5
5.90
– 1
4.8
20.7
– 2
3.6
24:0
8
Mis
c. C
ardi
ac A
gent
s
56 ©Clinical and Laboratory Standards Institute. All rights reserved.
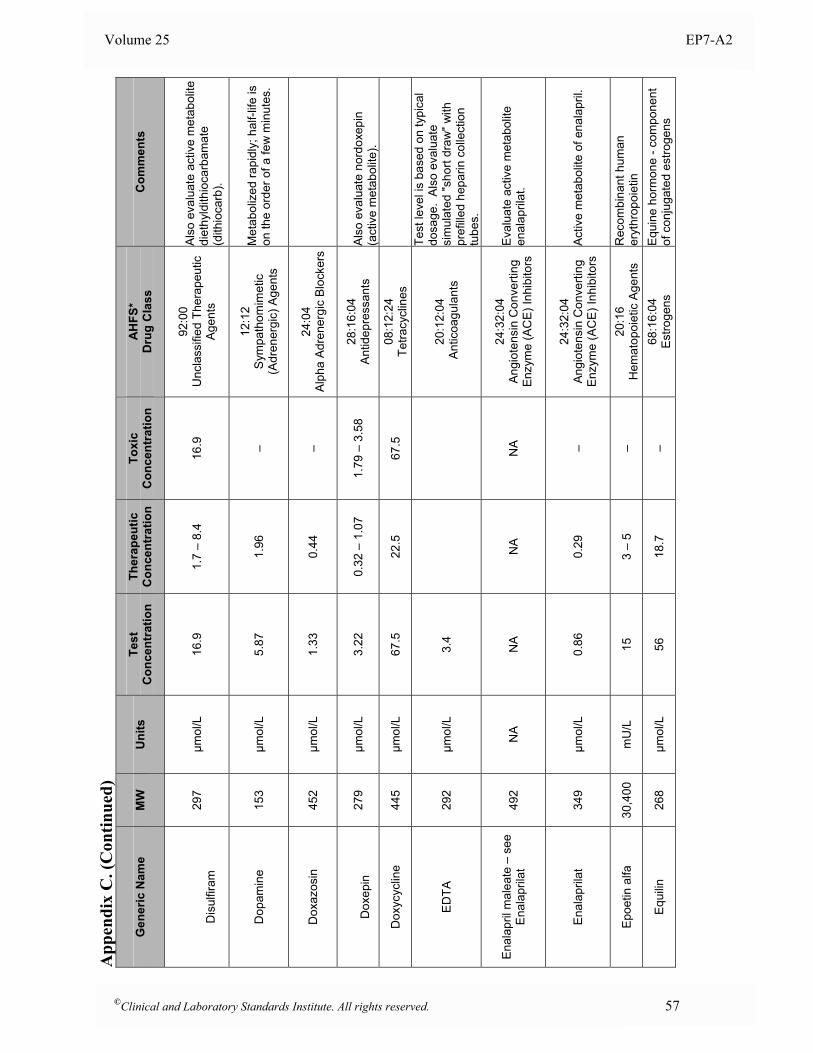
Volume 25 EP7-A2
App
endi
x C
. (C
ontin
ued)
Gen
eric
Nam
e M
W
Uni
ts
Test
C
once
ntra
tion
Ther
apeu
tic
Con
cent
ratio
nTo
xic
Con
cent
ratio
n A
HFS
* D
rug
Cla
ss
Com
men
ts
D
isul
firam
29
7 µm
ol/L
16
.9
1.7
– 8.
4 16
.9
92:0
0
Unc
lass
ified
The
rape
utic
A
gent
s
Als
o ev
alua
te a
ctiv
e m
etab
olite
di
ethy
ldith
ioca
rbam
ate
(dith
ioca
rb).
Dop
amin
e 15
3 µm
ol/L
5.
87
1.96
–
12:1
2
Sym
path
omim
etic
(A
dren
ergi
c) A
gent
s
Met
abol
ized
rapi
dly;
hal
f-life
is
on th
e or
der o
f a fe
w m
inut
es.
Dox
azos
in
452
µmol
/L
1.33
0.
44
– 24
:04
Al
pha
Adre
nerg
ic B
lock
ers
D
oxep
in
279
µmol
/L
3.22
0.
32 –
1.0
7 1.
79 –
3.5
8 28
:16:
04
Antid
epre
ssan
ts
Als
o ev
alua
te n
ordo
xepi
n (a
ctiv
e m
etab
olite
).
Dox
ycyc
line
445
µmol
/L
67.5
22
.5
67.5
08
:12:
24
Tetra
cycl
ines
EDTA
29
2 µm
ol/L
3.
4
20
:12:
04
Ant
icoa
gula
nts
Test
leve
l is
base
d on
typi
cal
dosa
ge.
Als
o ev
alua
te
sim
ulat
ed "s
hort
draw
" with
pr
efill
ed h
epar
in c
olle
ctio
n tu
bes.
Enal
april
mal
eate
– s
ee
Enal
april
at
492
NA
NA
NA
NA
24:3
2:04
A
ngio
tens
in C
onve
rting
E
nzym
e (A
CE
) Inh
ibito
rs
Eva
luat
e ac
tive
met
abol
ite
enal
april
at.
Enal
april
at
349
µmol
/L
0.86
0.
29
– 24
:32:
04
Ang
iote
nsin
Con
verti
ng
Enz
yme
(AC
E) I
nhib
itors
A
ctiv
e m
etab
olite
of e
nala
pril.
Epoe
tin a
lfa
30,4
00
mU
/L
15
3 –
5 –
20:1
6
Hem
atop
oiet
ic A
gent
s
Rec
ombi
nant
hum
an
eryt
hrop
oiet
in
Equi
lin
268
µmol
/L
56
18.7
–
68:1
6:04
E
stro
gens
E
quin
e ho
rmon
e - c
ompo
nent
of
con
juga
ted
estro
gens
©Clinical and Laboratory Standards Institute. All rights reserved. 57
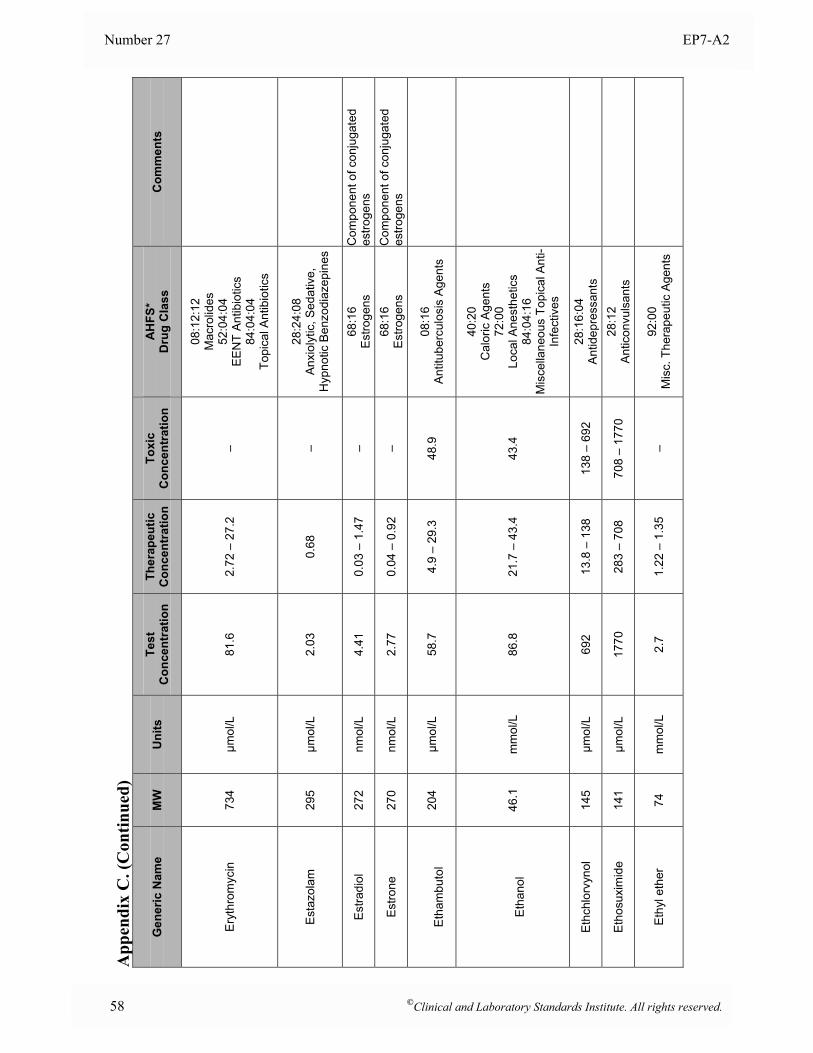
Number 27 EP7-A2
App
endi
x C
. (C
ontin
ued)
Gen
eric
Nam
e M
W
Uni
ts
Test
C
once
ntra
tion
Ther
apeu
tic
Con
cent
ratio
nTo
xic
Con
cent
ratio
n A
HFS
* D
rug
Cla
ss
Com
men
ts
Eryt
hrom
ycin
73
4 µm
ol/L
81
.6
2.72
– 2
7.2
–
08:1
2:12
M
acro
lides
52
:04:
04
EE
NT
Ant
ibio
tics
84:0
4:04
To
pica
l Ant
ibio
tics
Esta
zola
m
295
µmol
/L
2.03
0.
68
– 28
:24:
08
Anx
ioly
tic, S
edat
ive,
H
ypno
tic B
enzo
diaz
epin
es
Estra
diol
27
2 nm
ol/L
4.
41
0.03
– 1
.47
– 68
:16
E
stro
gens
C
ompo
nent
of c
onju
gate
d es
troge
ns
Estro
ne
270
nmol
/L
2.77
0.
04 –
0.9
2 –
68:1
6
Est
roge
ns
Com
pone
nt o
f con
juga
ted
estro
gens
E
tham
buto
l 20
4 µm
ol/L
58
.7
4.9
– 29
.3
48.9
08
:16
A
ntitu
berc
ulos
is A
gent
s
Et
hano
l 46
.1
mm
ol/L
86
.8
21.7
– 4
3.4
43.4
40:2
0
Cal
oric
Age
nts
72
:00
Lo
cal A
nest
hetic
s 84
:04:
16
Mis
cella
neou
s To
pica
l Ant
i-In
fect
ives
Ethc
hlor
vyno
l 14
5 µm
ol/L
69
2 13
.8 –
138
13
8 –
692
28:1
6:04
An
tidep
ress
ants
Etho
suxi
mid
e
141
µmol
/L
1770
28
3 –
708
708
– 17
70
28:1
2
Ant
icon
vuls
ants
Eth
yl e
ther
74
m
mol
/L
2.7
1.22
– 1
.35
– 92
:00
M
isc.
The
rape
utic
Age
nts
58 ©Clinical and Laboratory Standards Institute. All rights reserved.
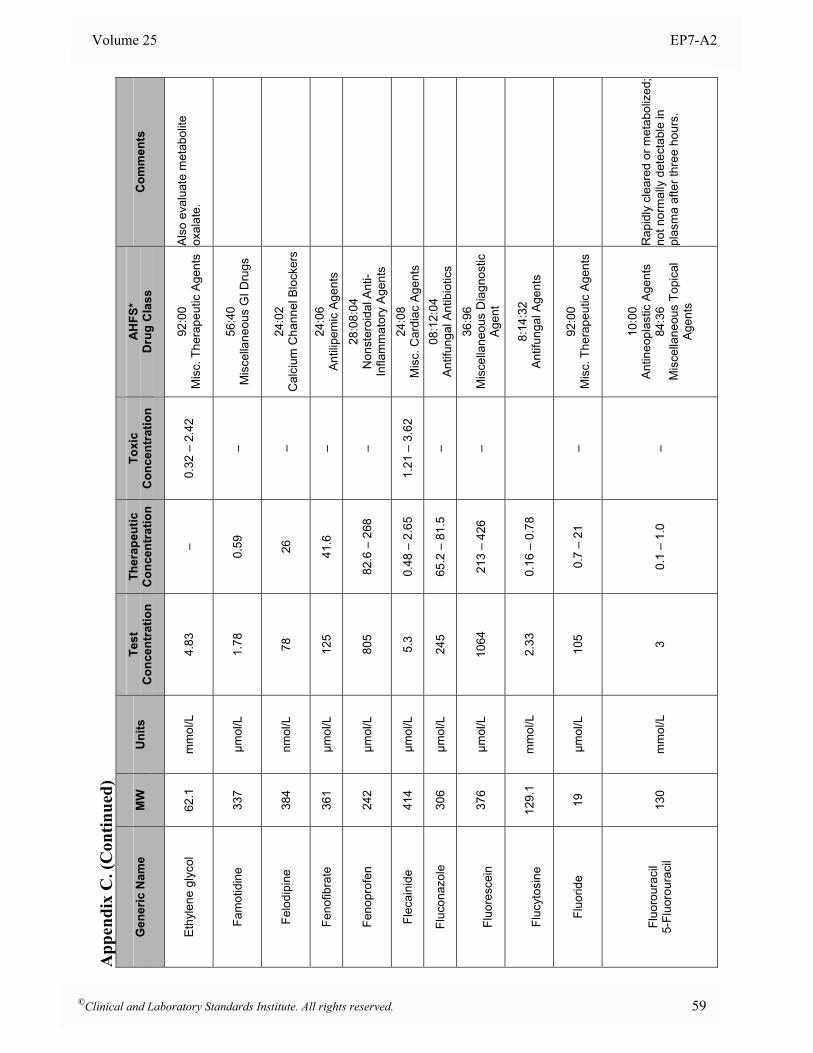
Volume 25 EP7-A2
App
endi
x C
. (C
ontin
ued)
Gen
eric
Nam
e M
W
Uni
ts
Test
C
once
ntra
tion
Ther
apeu
tic
Con
cent
ratio
nTo
xic
Con
cent
ratio
n A
HFS
* D
rug
Cla
ss
Com
men
ts
Ethy
lene
gly
col
62.1
m
mol
/L
4.83
–
0.32
– 2
.42
92:0
0
Mis
c. T
hera
peut
ic A
gent
s A
lso
eval
uate
met
abol
ite
oxal
ate.
Fam
otid
ine
337
µmol
/L
1.78
0.
59
– 56
:40
M
isce
llane
ous
GI D
rugs
Felo
dipi
ne
384
nmol
/L
78
26
– 24
:02
C
alci
um C
hann
el B
lock
ers
Feno
fibra
te
361
µmol
/L
125
41.6
–
24:0
6
Ant
ilipe
mic
Age
nts
Feno
prof
en
242
µmol
/L
805
82.6
– 2
68
– 28
:08:
04
Non
ster
oida
l Ant
i-In
flam
mat
ory
Age
nts
Flec
aini
de
414
µmol
/L
5.3
0.48
– 2
.65
1.21
– 3
.62
24:0
8
Mis
c. C
ardi
ac A
gent
s
Fluc
onaz
ole
306
µmol
/L
245
65.2
– 8
1.5
– 08
:12:
04
Ant
ifung
al A
ntib
iotic
s
Fl
uore
scei
n 37
6 µm
ol/L
10
64
213
– 42
6 –
36:9
6
Mis
cella
neou
s D
iagn
ostic
A
gent
Fl
ucyt
osin
e 12
9.1
mm
ol/L
2.
33
0.16
– 0
.78
8:
14:3
2 A
ntifu
ngal
Age
nts
Fluo
ride
19
µmol
/L
105
0.7
– 21
–
92:0
0
Mis
c. T
hera
peut
ic A
gent
s
Fluo
rour
acil
5-Fl
uoro
urac
il 13
0 m
mol
/L
3 0.
1 –
1.0
–
10:0
0
Ant
ineo
plas
tic A
gent
s
84:3
6
Mis
cella
neou
s To
pica
l A
gent
s
Rap
idly
cle
ared
or m
etab
oliz
ed;
not n
orm
ally
det
ecta
ble
in
plas
ma
afte
r thr
ee h
ours
.
©Clinical and Laboratory Standards Institute. All rights reserved. 59
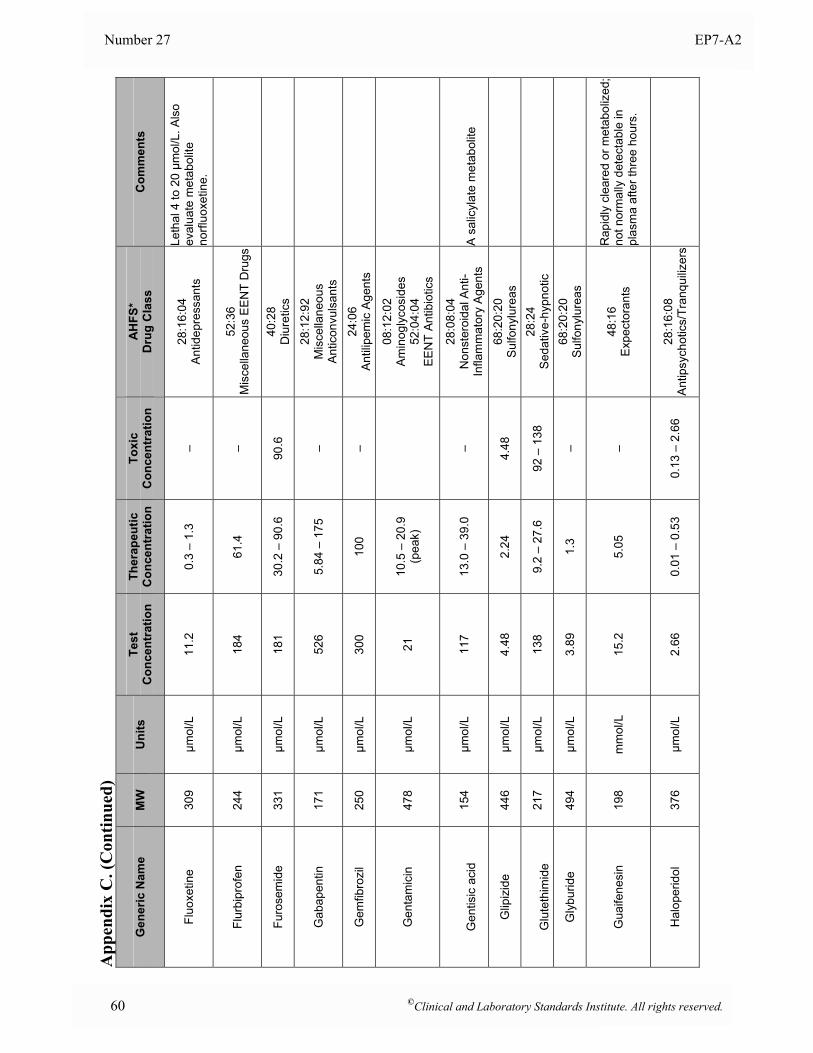
Number 27 EP7-A2
App
endi
x C
. (C
ontin
ued)
Gen
eric
Nam
e M
W
Uni
ts
Test
C
once
ntra
tion
Ther
apeu
tic
Con
cent
ratio
nTo
xic
Con
cent
ratio
n A
HFS
* D
rug
Cla
ss
Com
men
ts
Fluo
xetin
e
309
µmol
/L
11.2
0.
3 –
1.3
– 28
:16:
04
Antid
epre
ssan
ts
Leth
al 4
to 2
0 µm
ol/L
. Als
o ev
alua
te m
etab
olite
no
rfluo
xetin
e.
Flur
bipr
ofen
24
4 µm
ol/L
18
4 61
.4
– 52
:36
M
isce
llane
ous
EEN
T D
rugs
Furo
sem
ide
331
µmol
/L
181
30.2
– 9
0.6
90.6
40
:28
D
iure
tics
Gab
apen
tin
171
µmol
/L
526
5.84
– 1
75
– 28
:12:
92
Mis
cella
neou
s A
ntic
onvu
lsan
ts
Gem
fibro
zil
250
µmol
/L
300
100
– 24
:06
A
ntili
pem
ic A
gent
s
Gen
tam
icin
47
8 µm
ol/L
21
10
.5 –
20.
9 (p
eak)
08:1
2:02
A
min
ogly
cosi
des
52
:04:
04
EE
NT
Ant
ibio
tics
G
entis
ic a
cid
154
µmol
/L
117
13.0
– 3
9.0
– 28
:08:
04
Non
ster
oida
l Ant
i-In
flam
mat
ory
Age
nts
A s
alic
ylat
e m
etab
olite
Glip
izid
e 44
6 µm
ol/L
4.
48
2.24
4.
48
68:2
0:20
Su
lfony
lure
as
G
lute
thim
ide
21
7 µm
ol/L
13
8 9.
2 –
27.6
92
– 1
38
28:2
4 S
edat
ive-
hypn
otic
Gly
burid
e 49
4 µm
ol/L
3.
89
1.3
– 68
:20:
20
Sulfo
nylu
reas
Gua
ifene
sin
198
mm
ol/L
15
.2
5.05
–
48:1
6
Exp
ecto
rant
s
Rap
idly
cle
ared
or m
etab
oliz
ed;
not n
orm
ally
det
ecta
ble
in
plas
ma
afte
r thr
ee h
ours
.
Hal
oper
idol
37
6 µm
ol/L
2.
66
0.01
– 0
.53
0.13
– 2
.66
28:1
6:08
An
tipsy
chot
ics/
Tran
quiliz
ers
60 ©Clinical and Laboratory Standards Institute. All rights reserved.
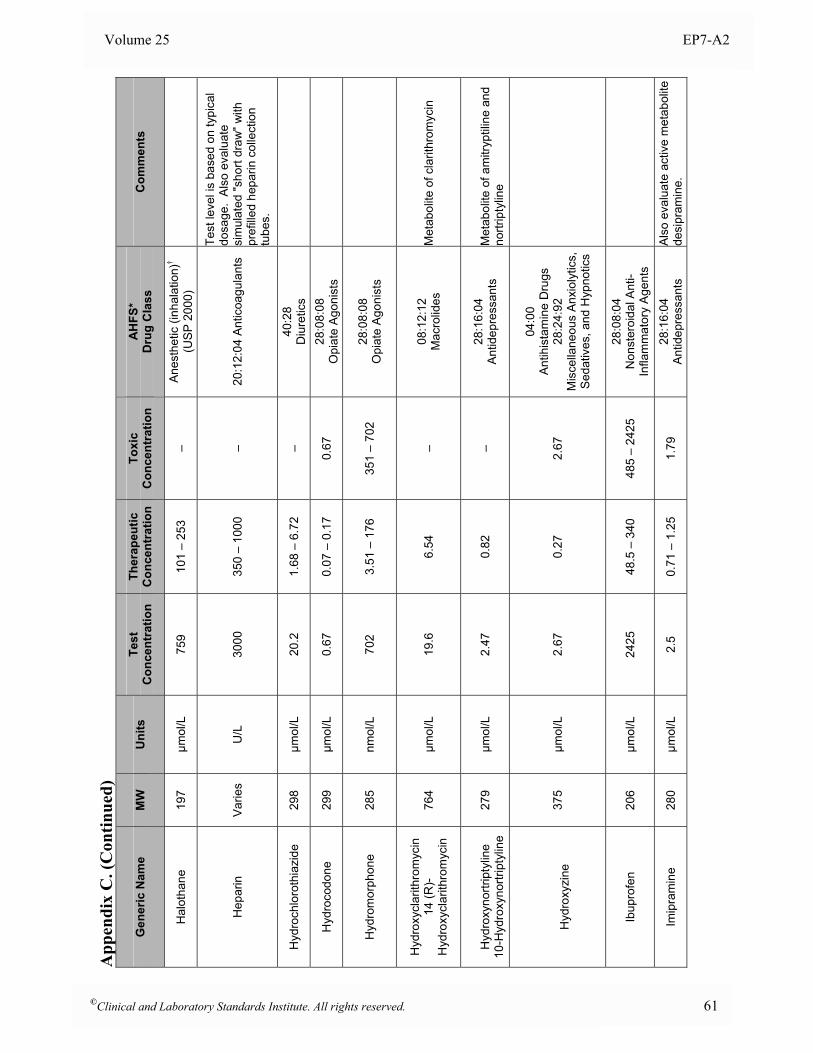
Volume 25 EP7-A2
App
endi
x C
. (C
ontin
ued)
Gen
eric
Nam
e M
W
Uni
ts
Test
C
once
ntra
tion
Ther
apeu
tic
Con
cent
ratio
nTo
xic
Con
cent
ratio
n A
HFS
* D
rug
Cla
ss
Com
men
ts
Hal
otha
ne
197
µmol
/L
759
101
– 25
3 –
Ane
sthe
tic (i
nhal
atio
n)†
(US
P 2
000)
Hep
arin
Va
ries
U/L
30
00
350
– 10
00
– 20
:12:
04 A
ntic
oagu
lant
s
Test
leve
l is
base
d on
typi
cal
dosa
ge.
Als
o ev
alua
te
sim
ulat
ed "s
hort
draw
" with
pr
efill
ed h
epar
in c
olle
ctio
n tu
bes.
Hyd
roch
loro
thia
zide
29
8 µm
ol/L
20
.2
1.68
– 6
.72
– 40
:28
D
iure
tics
Hyd
roco
done
29
9 µm
ol/L
0.
67
0.07
– 0
.17
0.67
28
:08:
08
Opi
ate
Ago
nist
s
Hyd
rom
orph
one
28
5 nm
ol/L
70
2 3.
51 –
176
35
1 –
702
28:0
8:08
O
piat
e A
goni
sts
Hyd
roxy
clar
ithro
myc
in
14 (R
)- H
ydro
xycl
arith
rom
ycin
76
4 µm
ol/L
19
.6
6.54
–
08:1
2:12
M
acro
lides
M
etab
olite
of c
larit
hrom
ycin
H
ydro
xyno
rtrip
tylin
e 10
-Hyd
roxy
nortr
ipty
line
279
µmol
/L
2.47
0.
82
– 28
:16:
04
Antid
epre
ssan
ts
Met
abol
ite o
f am
itryp
tilin
e an
d no
rtrip
tylin
e
H
ydro
xyzi
ne
375
µmol
/L
2.67
0.
27
2.67
04:0
0
Ant
ihis
tam
ine
Dru
gs
28:2
4:92
M
isce
llane
ous
Anx
ioly
tics,
S
edat
ives
, and
Hyp
notic
s
Ibup
rofe
n 20
6 µm
ol/L
24
25
48.5
– 3
40
485
– 24
25
28:0
8:04
N
onst
eroi
dal A
nti-
Infla
mm
ator
y A
gent
s
Imip
ram
ine
28
0 µm
ol/L
2.
5 0.
71 –
1.2
5 1.
79
28:1
6:04
An
tidep
ress
ants
A
lso
eval
uate
act
ive
met
abol
ite
desi
pram
ine.
©Clinical and Laboratory Standards Institute. All rights reserved. 61
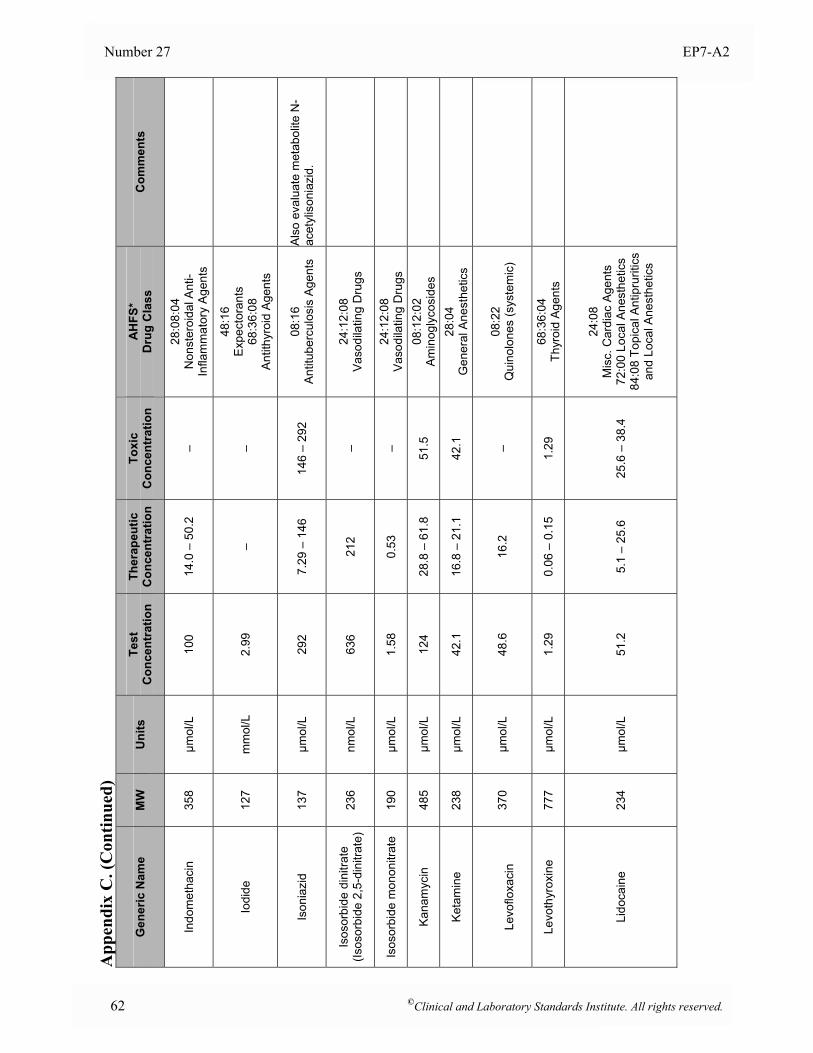
Number 27 EP7-A2
App
endi
x C
. (C
ontin
ued)
Gen
eric
Nam
e M
W
Uni
ts
Test
C
once
ntra
tion
Ther
apeu
tic
Con
cent
ratio
nTo
xic
Con
cent
ratio
n A
HFS
* D
rug
Cla
ss
Com
men
ts
Indo
met
haci
n 35
8 µm
ol/L
10
0 14
.0 –
50.
2 –
28:0
8:04
N
onst
eroi
dal A
nti-
Infla
mm
ator
y A
gent
s
Iodi
de
127
mm
ol/L
2.
99
– –
48:1
6
Exp
ecto
rant
s
68:3
6:08
A
ntith
yroi
d A
gent
s
Ison
iazi
d 13
7 µm
ol/L
29
2 7.
29 –
146
14
6 –
292
08:1
6
Ant
itube
rcul
osis
Age
nts
Als
o ev
alua
te m
etab
olite
N-
acet
ylis
onia
zid.
Isos
orbi
de d
initr
ate
(Isos
orbi
de 2
,5-d
initr
ate)
23
6 nm
ol/L
63
6 21
2 –
24:1
2:08
Va
sodi
latin
g D
rugs
Isos
orbi
de m
onon
itrat
e 19
0 µm
ol/L
1.
58
0.53
–
24:1
2:08
Va
sodi
latin
g D
rugs
Kana
myc
in
485
µmol
/L
124
28.8
– 6
1.8
51.5
08
:12:
02
Am
inog
lyco
side
s
Keta
min
e 23
8 µm
ol/L
42
.1
16.8
– 2
1.1
42.1
28
:04
G
ener
al A
nest
hetic
s
Le
voflo
xaci
n
370
µmol
/L
48.6
16
.2
– 08
:22
Q
uino
lone
s (s
yste
mic
)
Levo
thyr
oxin
e 77
7 µm
ol/L
1.
29
0.06
– 0
.15
1.29
68
:36:
04
Thyr
oid
Age
nts
Lido
cain
e 23
4 µm
ol/L
51
.2
5.1
– 25
.6
25.6
– 3
8.4
24:0
8
Mis
c. C
ardi
ac A
gent
s
72:0
0 Lo
cal A
nest
hetic
s84
:08
Topi
cal A
ntip
rurit
ics
and
Loca
l Ane
sthe
tics
62 ©Clinical and Laboratory Standards Institute. All rights reserved.
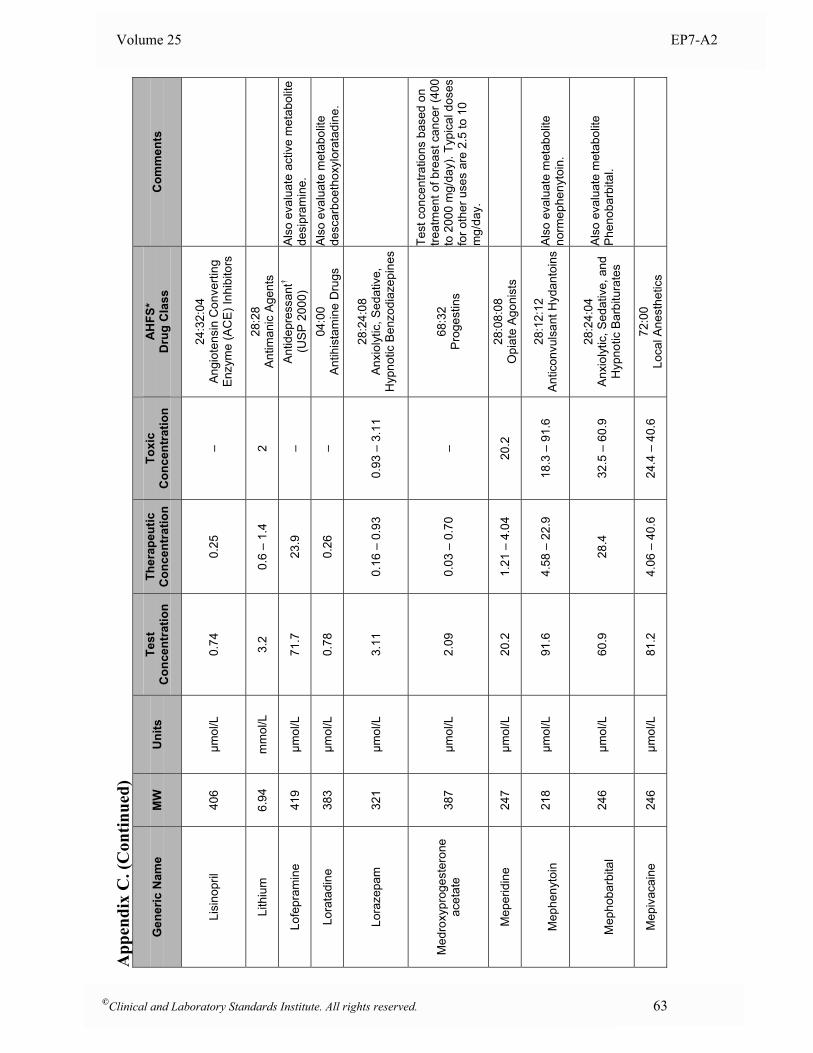
Volume 25 EP7-A2
App
endi
x C
. (C
ontin
ued)
Gen
eric
Nam
e M
W
Uni
ts
Test
C
once
ntra
tion
Ther
apeu
tic
Con
cent
ratio
nTo
xic
Con
cent
ratio
n A
HFS
* D
rug
Cla
ss
Com
men
ts
Lisi
nopr
il 40
6 µm
ol/L
0.
74
0.25
–
24:3
2:04
A
ngio
tens
in C
onve
rting
E
nzym
e (A
CE
) Inh
ibito
rs
Lith
ium
6.
94
mm
ol/L
3.
2 0.
6 –
1.4
2 28
:28
A
ntim
anic
Age
nts
Lofe
pram
ine
419
µmol
/L
71.7
23
.9
– An
tidep
ress
ant†
(US
P 2
000)
A
lso
eval
uate
act
ive
met
abol
ite
desi
pram
ine.
Lora
tadi
ne
383
µmol
/L
0.78
0.
26
– 04
:00
A
ntih
ista
min
e D
rugs
A
lso
eval
uate
met
abol
ite
desc
arbo
etho
xylo
rata
dine
.
Lora
zepa
m
321
µmol
/L
3.11
0.
16 –
0.9
3 0.
93 –
3.1
1 28
:24:
08
Anx
ioly
tic, S
edat
ive,
H
ypno
tic B
enzo
diaz
epin
es
Med
roxy
prog
este
rone
ac
etat
e 38
7 µm
ol/L
2.
09
0.03
– 0
.70
– 68
:32
P
roge
stin
s
Test
con
cent
ratio
ns b
ased
on
treat
men
t of b
reas
t can
cer (
400
to 2
000
mg/
day)
. Typ
ical
dos
es
for o
ther
use
s ar
e 2.
5 to
10
mg/
day.
Mep
erid
ine
247
µmol
/L
20.2
1.
21 –
4.0
4 20
.2
28:0
8:08
O
piat
e A
goni
sts
M
ephe
nyto
in
218
µmol
/L
91.6
4.
58 –
22.
9 18
.3 –
91.
6 28
:12:
12
Ant
icon
vuls
ant H
ydan
toin
s
Als
o ev
alua
te m
etab
olite
no
rmep
heny
toin
.
M
epho
barb
ital
246
µmol
/L
60.9
28
.4
32.5
– 6
0.9
28:2
4:04
A
nxio
lytic
, Sed
ativ
e, a
nd
Hyp
notic
Bar
bitu
rate
s
Als
o ev
alua
te m
etab
olite
P
heno
barb
ital.
Mep
ivac
aine
24
6 µm
ol/L
81
.2
4.06
– 4
0.6
24.4
– 4
0.6
72:0
0
Loca
l Ane
sthe
tics
©Clinical and Laboratory Standards Institute. All rights reserved. 63
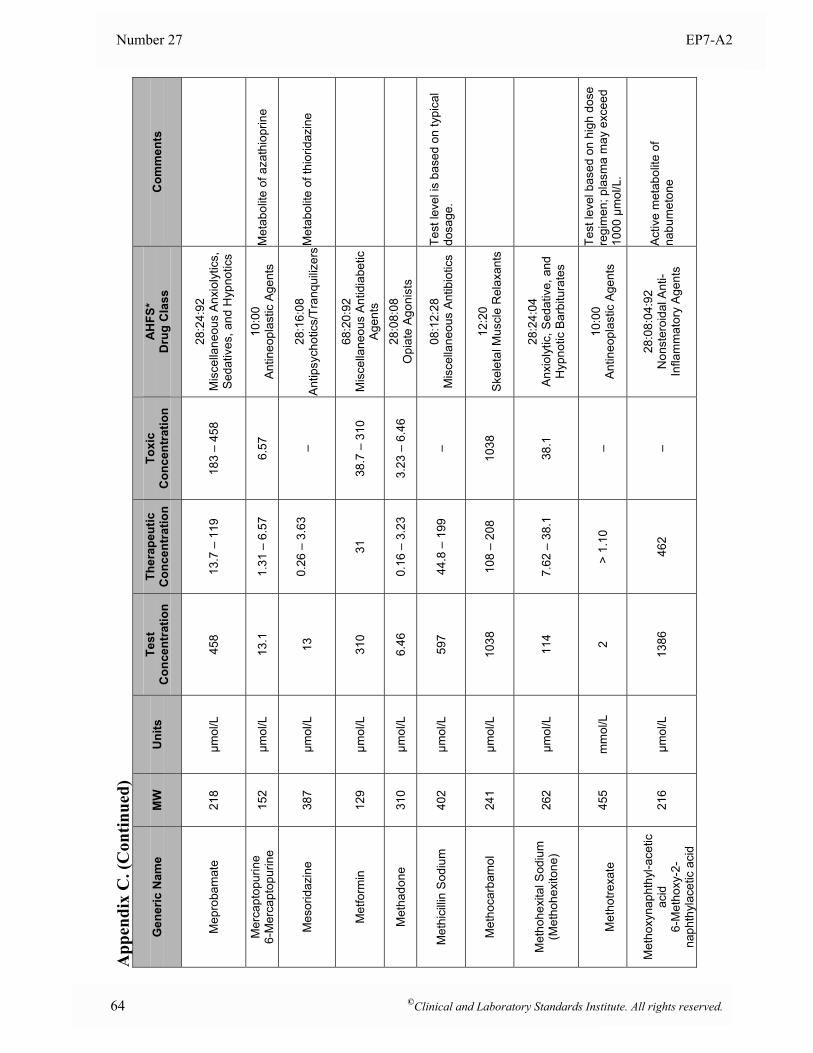
Number 27 EP7-A2
App
endi
x C
. (C
ontin
ued)
Gen
eric
Nam
e M
W
Uni
ts
Test
C
once
ntra
tion
Ther
apeu
tic
Con
cent
ratio
nTo
xic
Con
cent
ratio
n A
HFS
* D
rug
Cla
ss
Com
men
ts
Mep
roba
mat
e 21
8 µm
ol/L
45
8 13
.7 –
119
18
3 –
458
28:2
4:92
M
isce
llane
ous
Anx
ioly
tics,
S
edat
ives
, and
Hyp
notic
s
Mer
capt
opur
ine
6-M
erca
ptop
urin
e 15
2 µm
ol/L
13
.1
1.31
– 6
.57
6.57
10
:00
A
ntin
eopl
astic
Age
nts
Met
abol
ite o
f aza
thio
prin
e
Mes
orid
azin
e
387
µmol
/L
13
0.
26 –
3.6
3
–
28
:16:
08
Antip
sych
otic
s/Tr
anqu
ilizer
s
Met
abol
ite o
f thi
orid
azin
e
Met
form
in
129
µmol
/L
310
31
38.7
– 3
10
68:2
0:92
M
isce
llane
ous
Antid
iabe
tic
Age
nts
Met
hado
ne
310
µmol
/L
6.46
0.
16 –
3.2
3 3.
23 –
6.4
6 28
:08:
08
Opi
ate
Ago
nist
s
Met
hici
llin
Sod
ium
40
2 µm
ol/L
59
7 44
.8 –
199
–
08:1
2:28
M
isce
llane
ous
Ant
ibio
tics
Test
leve
l is
base
d on
typi
cal
dosa
ge.
Met
hoca
rbam
ol
241
µmol
/L
1038
10
8 –
208
1038
12
:20
S
kele
tal M
uscl
e R
elax
ants
Met
hohe
xita
l Sod
ium
(M
etho
hexi
tone
) 26
2 µm
ol/L
11
4 7.
62 –
38.
1 38
.1
28:2
4:04
A
nxio
lytic
, Sed
ativ
e, a
nd
Hyp
notic
Bar
bitu
rate
s
M
etho
trexa
te
455
mm
ol/L
2
> 1.
10
– 10
:00
A
ntin
eopl
astic
Age
nts
Test
leve
l bas
ed o
n hi
gh d
ose
regi
men
; pla
sma
may
exc
eed
1000
µm
ol/L
.
M
etho
xyna
phth
yl-a
cetic
ac
id
6-M
etho
xy-2
-na
phth
ylac
etic
aci
d
216
µmol
/L
1386
46
2 –
28:0
8:04
:92
Non
ster
oida
l Ant
i-In
flam
mat
ory
Age
nts
Act
ive
met
abol
ite o
f na
bum
eton
e
64 ©Clinical and Laboratory Standards Institute. All rights reserved.
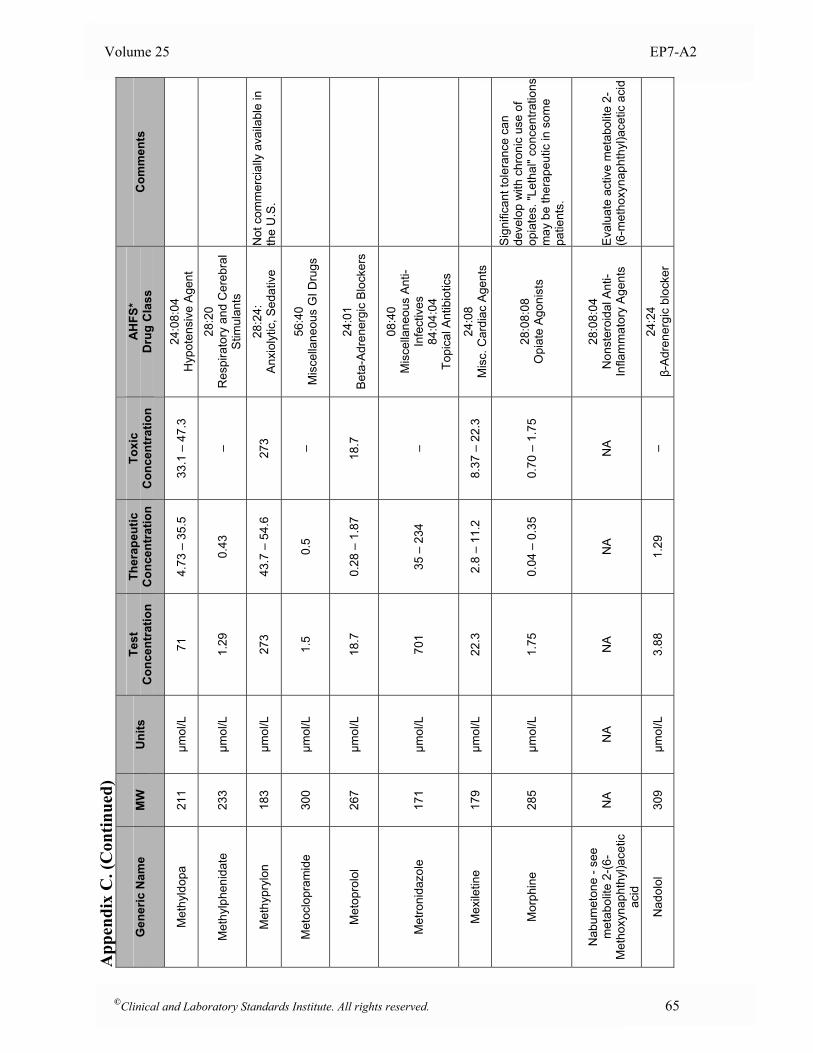
Volume 25 EP7-A2
App
endi
x C
. (C
ontin
ued)
Gen
eric
Nam
e M
W
Uni
ts
Test
C
once
ntra
tion
Ther
apeu
tic
Con
cent
ratio
nTo
xic
Con
cent
ratio
n A
HFS
* D
rug
Cla
ss
Com
men
ts
Met
hyld
opa
211
µmol
/L
71
4.73
– 3
5.5
33.1
– 4
7.3
24:0
8:04
H
ypot
ensi
ve A
gent
Met
hylp
heni
date
23
3 µm
ol/L
1.
29
0.43
–
28:2
0
Res
pira
tory
and
Cer
ebra
l S
timul
ants
Met
hypr
ylon
18
3 µm
ol/L
27
3 43
.7 –
54.
6 27
3 28
:24:
A
nxio
lytic
, Sed
ativ
e N
ot c
omm
erci
ally
ava
ilabl
e in
th
e U
.S.
Met
oclo
pram
ide
300
µmol
/L
1.5
0.5
– 56
:40
M
isce
llane
ous
GI D
rugs
Met
opro
lol
267
µmol
/L
18.7
0.
28 –
1.8
7 18
.7
24:0
1
Bet
a-A
dren
ergi
c B
lock
ers
Met
roni
dazo
le
171
µmol
/L
701
35 –
234
–
08:4
0
Mis
cella
neou
s An
ti-In
fect
ives
84
:04:
04
Topi
cal A
ntib
iotic
s
Mex
iletin
e
179
µmol
/L
22.3
2.
8 –
11.2
8.
37 –
22.
3 24
:08
M
isc.
Car
diac
Age
nts
Mor
phin
e 28
5 µm
ol/L
1.
75
0.04
– 0
.35
0.70
– 1
.75
28:0
8:08
O
piat
e A
goni
sts
Sig
nific
ant t
oler
ance
can
de
velo
p w
ith c
hron
ic u
se o
f op
iate
s. "L
etha
l" co
ncen
tratio
ns
may
be
ther
apeu
tic in
som
e pa
tient
s.
N
abum
eton
e - s
ee
met
abol
ite 2
-(6-
Met
hoxy
naph
thyl
)ace
tic
acid
NA
N
A
NA
N
A
NA
28
:08:
04
Non
ster
oida
l Ant
i-In
flam
mat
ory
Age
nts
Eva
luat
e ac
tive
met
abol
ite 2
-(6
-met
hoxy
naph
thyl
)ace
tic a
cid
Nad
olol
30
9 µm
ol/L
3.
88
1.29
–
24:2
4 β-
Adr
ener
gic
bloc
ker
©Clinical and Laboratory Standards Institute. All rights reserved. 65
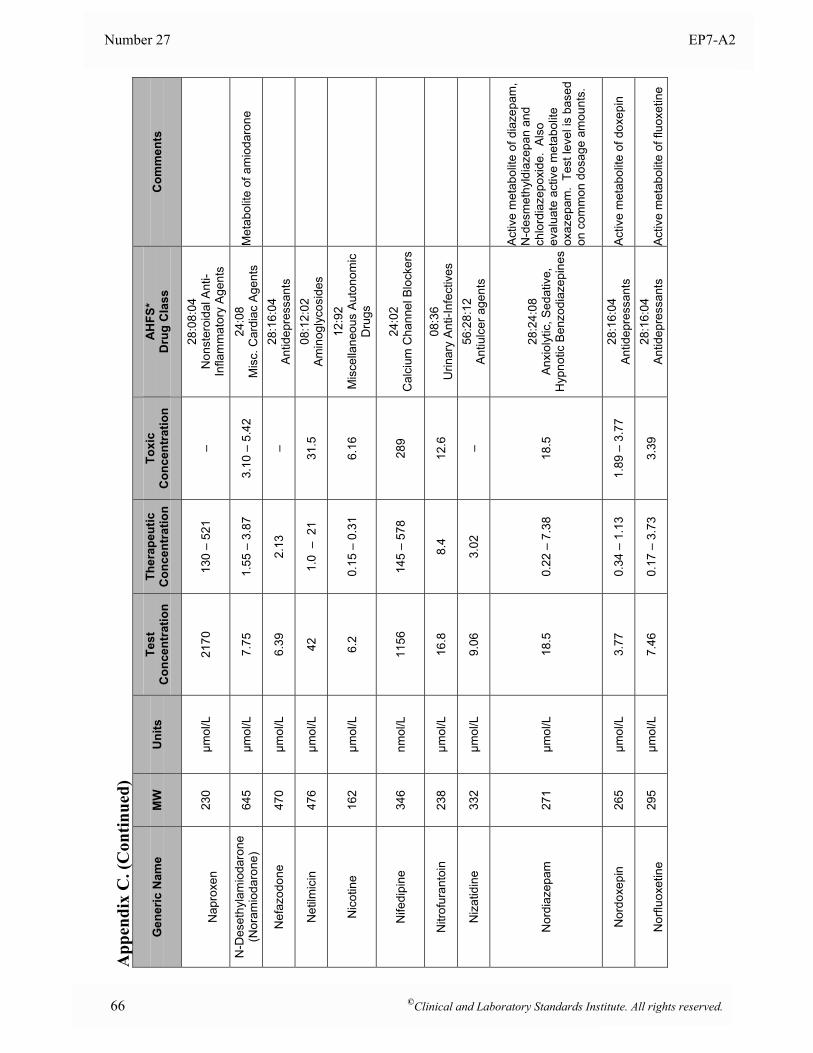
Number 27 EP7-A2
App
endi
x C
. (C
ontin
ued)
Gen
eric
Nam
e M
W
Uni
ts
Test
C
once
ntra
tion
Ther
apeu
tic
Con
cent
ratio
nTo
xic
Con
cent
ratio
n A
HFS
* D
rug
Cla
ss
Com
men
ts
N
apro
xen
230
µmol
/L
2170
13
0 –
521
– 28
:08:
04
Non
ster
oida
l Ant
i-In
flam
mat
ory
Age
nts
N-D
eset
hyla
mio
daro
ne
(Nor
amio
daro
ne)
645
µmol
/L
7.75
1.
55 –
3.8
7 3.
10 –
5.4
2 24
:08
M
isc.
Car
diac
Age
nts
Met
abol
ite o
f am
ioda
rone
Nef
azod
one
470
µmol
/L
6.39
2.
13
– 28
:16:
04
Antid
epre
ssan
ts
Net
ilmic
in
476
µmol
/L
42
1.0
– 2
1 31
.5
08:1
2:02
A
min
ogly
cosi
des
Nic
otin
e 16
2 µm
ol/L
6.
2 0.
15 –
0.3
1 6.
16
12:9
2
Mis
cella
neou
s Au
tono
mic
D
rugs
Nife
dipi
ne
346
nmol
/L
1156
14
5 –
578
289
24:0
2
Cal
cium
Cha
nnel
Blo
cker
s
Nitr
ofur
anto
in
238
µmol
/L
16.8
8.
4 12
.6
08:3
6
Urin
ary
Ant
i-Inf
ectiv
es
Niz
atid
ine
33
2 µm
ol/L
9.
06
3.02
–
56:2
8:12
A
ntiu
lcer
age
nts
Nor
diaz
epam
27
1 µm
ol/L
18
.5
0.22
– 7
.38
18.5
28
:24:
08
Anx
ioly
tic, S
edat
ive,
H
ypno
tic B
enzo
diaz
epin
es
Act
ive
met
abol
ite o
f dia
zepa
m,
N-d
esm
ethy
ldia
zepa
n an
d ch
lord
iaze
poxi
de.
Als
o ev
alua
te a
ctiv
e m
etab
olite
ox
azep
am.
Test
leve
l is
base
d on
com
mon
dos
age
amou
nts.
Nor
doxe
pin
26
5 µm
ol/L
3.
77
0.34
– 1
.13
1.89
– 3
.77
28:1
6:04
An
tidep
ress
ants
A
ctiv
e m
etab
olite
of d
oxep
in
N
orflu
oxet
ine
29
5 µm
ol/L
7.
46
0.17
– 3
.73
3.39
28
:16:
04
Antid
epre
ssan
ts
Act
ive
met
abol
ite o
f flu
oxet
ine
66 ©Clinical and Laboratory Standards Institute. All rights reserved.
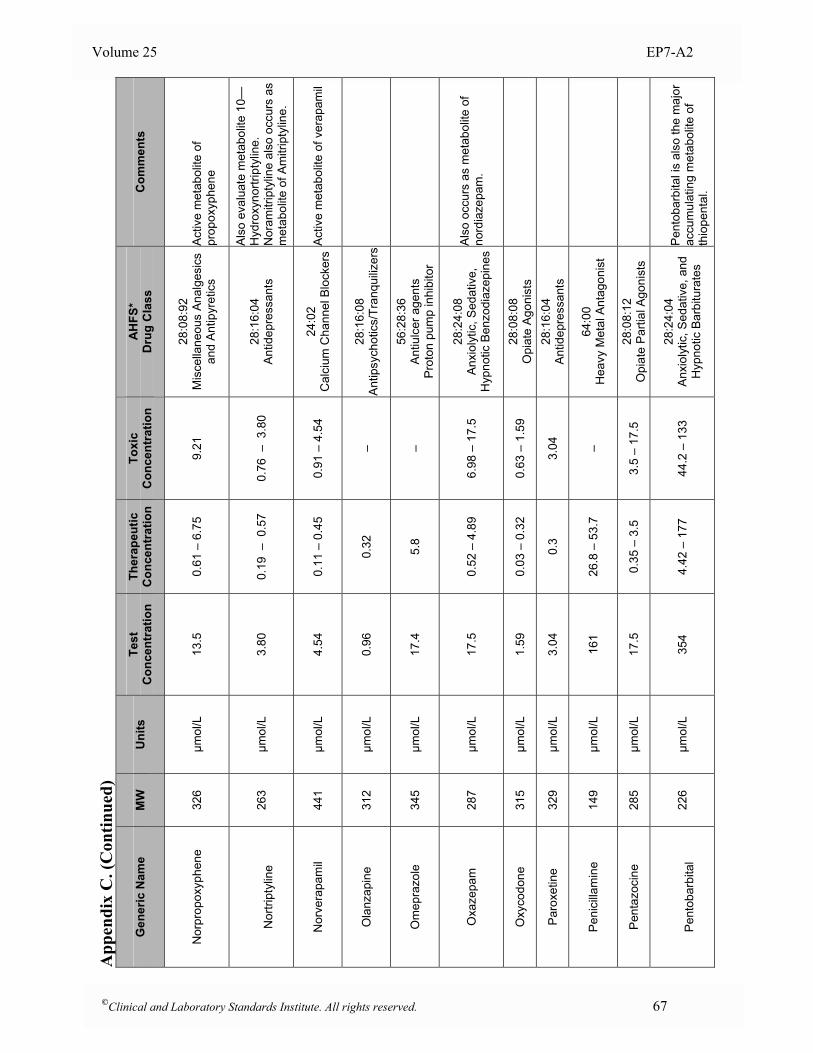
Volume 25 EP7-A2
App
endi
x C
. (C
ontin
ued)
Gen
eric
Nam
e M
W
Uni
ts
Test
C
once
ntra
tion
Ther
apeu
tic
Con
cent
ratio
nTo
xic
Con
cent
ratio
n A
HFS
* D
rug
Cla
ss
Com
men
ts
Nor
prop
oxyp
hene
32
6 µm
ol/L
13
.5
0.61
– 6
.75
9.21
28
:08:
92
Mis
cella
neou
s An
alge
sics
an
d A
ntip
yret
ics
Act
ive
met
abol
ite o
f pr
opox
yphe
ne
N
ortri
ptyl
ine
26
3 µm
ol/L
3.
80
0.19
– 0
.57
0.76
– 3
.80
28:1
6:04
An
tidep
ress
ants
Als
o ev
alua
te m
etab
olite
10—
Hyd
roxy
nortr
ipty
line.
N
oram
itrip
tylin
e al
so o
ccur
s as
m
etab
olite
of A
mitr
ipty
line.
Nor
vera
pam
il
441
µmol
/L
4.54
0.
11 –
0.4
5 0.
91 –
4.5
4 24
:02
C
alci
um C
hann
el B
lock
ers
Act
ive
met
abol
ite o
f ver
apam
il
Ola
nzap
ine
312
µmol
/L
0.96
0.
32
– 28
:16:
08
Antip
sych
otic
s/Tr
anqu
ilizer
s
Om
epra
zole
34
5 µm
ol/L
17
.4
5.8
– 56
:28:
36
Ant
iulc
er a
gent
s Pr
oton
pum
p in
hibi
tor
Oxa
zepa
m
287
µmol
/L
17.5
0.
52 –
4.8
9 6.
98 –
17.
5 28
:24:
08
Anx
ioly
tic, S
edat
ive,
H
ypno
tic B
enzo
diaz
epin
es
Als
o oc
curs
as
met
abol
ite o
f no
rdia
zepa
m.
Oxy
codo
ne
315
µmol
/L
1.59
0.
03 –
0.3
2 0.
63 –
1.5
9 28
:08:
08
Opi
ate
Ago
nist
s
Paro
xetin
e 32
9 µm
ol/L
3.
04
0.3
3.04
28
:16:
04
Antid
epre
ssan
ts
Peni
cilla
min
e 14
9 µm
ol/L
16
1 26
.8 –
53.
7 –
64:0
0 H
eavy
Met
al A
ntag
onis
t
Pent
azoc
ine
285
µmol
/L
17.5
0.
35 –
3.5
3.
5 –
17.5
28
:08:
12
Opi
ate
Par
tial A
goni
sts
P
ento
barb
ital
226
µmol
/L
354
4.42
– 1
77
44.2
– 1
33
28:2
4:04
A
nxio
lytic
, Sed
ativ
e, a
nd
Hyp
notic
Bar
bitu
rate
s
Pen
toba
rbita
l is
also
the
maj
or
accu
mul
atin
g m
etab
olite
of
thio
pent
al.
©Clinical and Laboratory Standards Institute. All rights reserved. 67
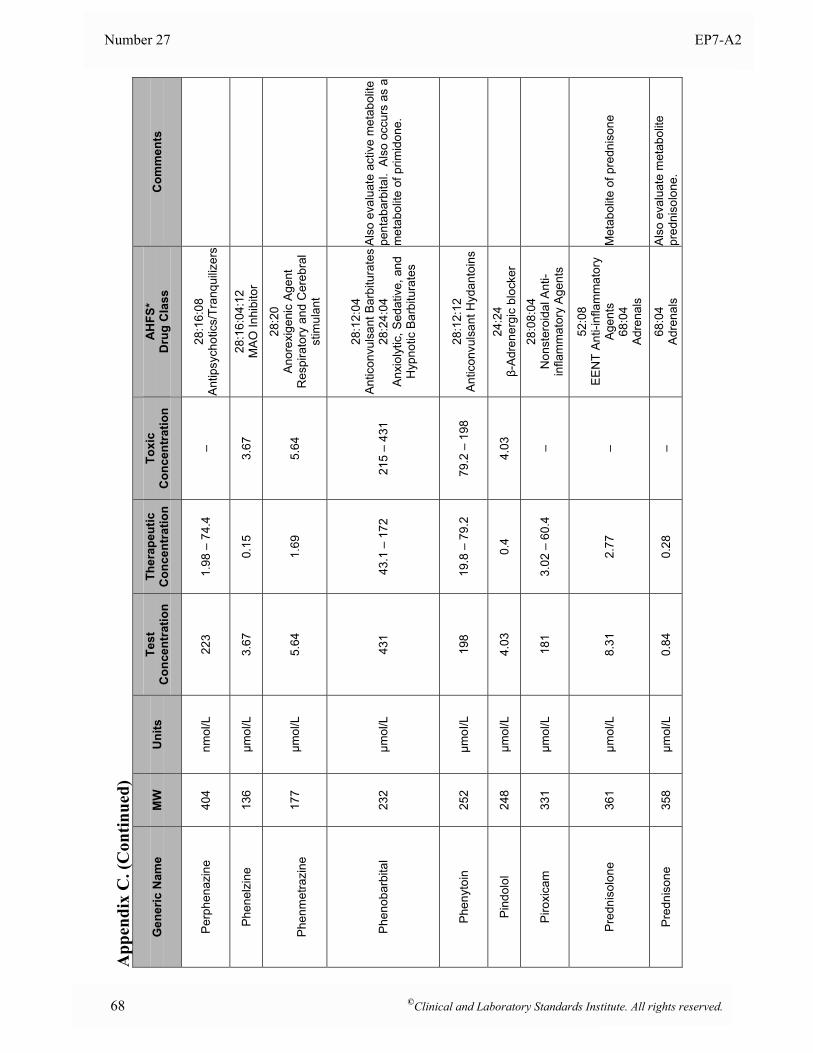
Number 27 EP7-A2
App
endi
x C
. (C
ontin
ued)
Gen
eric
Nam
e M
W
Uni
ts
Test
C
once
ntra
tion
Ther
apeu
tic
Con
cent
ratio
nTo
xic
Con
cent
ratio
n A
HFS
* D
rug
Cla
ss
Com
men
ts
Perp
hena
zine
40
4 nm
ol/L
22
3 1.
98 –
74.
4 –
28:1
6:08
An
tipsy
chot
ics/
Tran
quiliz
ers
Phen
elzi
ne
136
µmol
/L
3.67
0.
15
3.67
28
:16:
04:1
2
MA
O In
hibi
tor
Ph
enm
etra
zine
17
7 µm
ol/L
5.
64
1.69
5.
64
28:2
0 A
nore
xige
nic
Age
nt
Res
pira
tory
and
Cer
ebra
l st
imul
ant
Phen
obar
bita
l 23
2 µm
ol/L
43
1 43
.1 –
172
21
5 –
431
28:1
2:04
A
ntic
onvu
lsan
t Bar
bitu
rate
s 28
:24:
04
Anx
ioly
tic, S
edat
ive,
and
H
ypno
tic B
arbi
tura
tes
Als
o ev
alua
te a
ctiv
e m
etab
olite
pe
ntab
arbi
tal.
Als
o oc
curs
as
a m
etab
olite
of p
rimid
one.
Phen
ytoi
n 25
2 µm
oI/L
19
8 19
.8 –
79.
2 79
.2 –
198
28
:12:
12
Ant
icon
vuls
ant H
ydan
toin
s
Pind
olol
24
8 µm
ol/L
4.
03
0.4
4.03
24
:24
β-A
dren
ergi
c bl
ocke
r
Piro
xica
m
331
µmol
/L
181
3.02
– 6
0.4
– 28
:08:
04
Non
ster
oida
l Ant
i-in
flam
mat
ory
Age
nts
Pred
niso
lone
36
1 µm
ol/L
8.
31
2.77
–
52:0
8
EE
NT
Ant
i-inf
lam
mat
ory
Age
nts
68:0
4
Adr
enal
s
Met
abol
ite o
f pre
dnis
one
Pred
niso
ne
358
µmol
/L
0.84
0.
28
– 68
:04
A
dren
als
Als
o ev
alua
te m
etab
olite
pr
edni
solo
ne.
68 ©Clinical and Laboratory Standards Institute. All rights reserved.
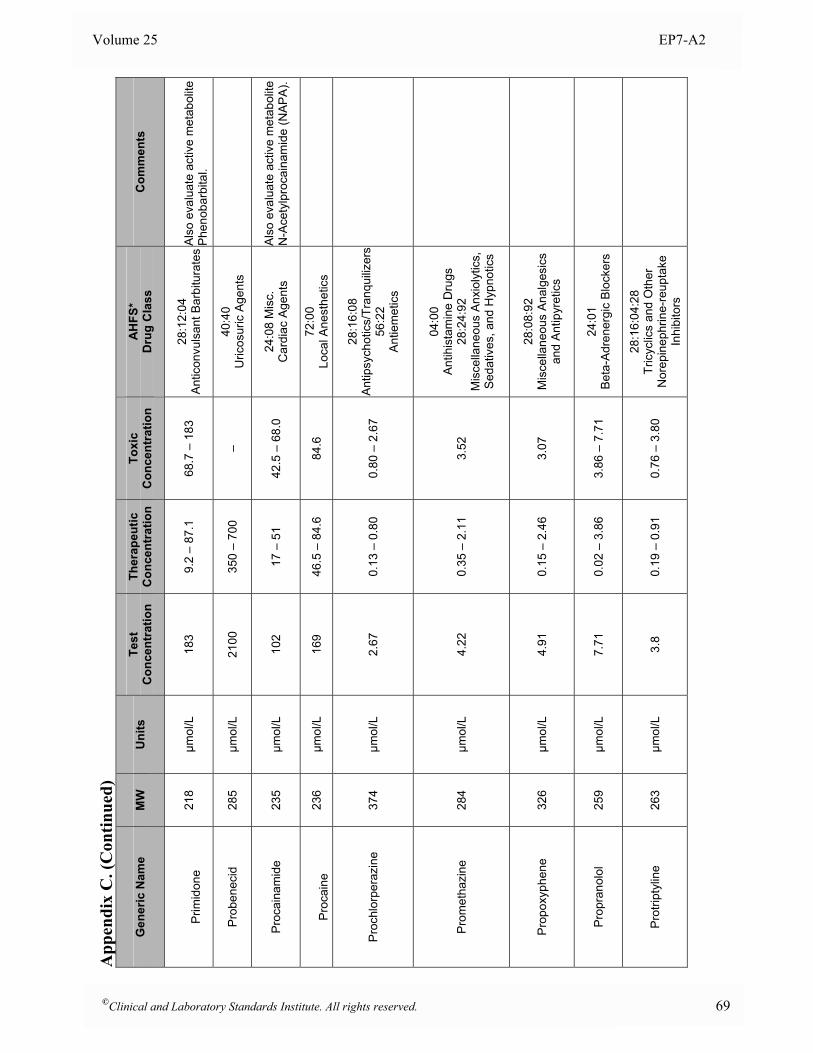
Volume 25 EP7-A2
App
endi
x C
. (C
ontin
ued)
Gen
eric
Nam
e M
W
Uni
ts
Test
C
once
ntra
tion
Ther
apeu
tic
Con
cent
ratio
nTo
xic
Con
cent
ratio
n A
HFS
* D
rug
Cla
ss
Com
men
ts
P
rimid
one
21
8 µm
ol/L
18
3 9.
2 –
87.1
68
.7 –
183
28
:12:
04
Ant
icon
vuls
ant B
arbi
tura
tes
Als
o ev
alua
te a
ctiv
e m
etab
olite
P
heno
barb
ital.
Prob
enec
id
285
µmol
/L
2100
35
0 –
700
– 40
:40
U
ricos
uric
Age
nts
Proc
aina
mid
e 23
5 µm
ol/L
10
2 17
– 5
1 42
.5 –
68.
0 24
:08
Mis
c.
Car
diac
Age
nts
Als
o ev
alua
te a
ctiv
e m
etab
olite
N
-Ace
tylp
roca
inam
ide
(NAP
A).
Pr
ocai
ne
236
µmol
/L
169
46.5
– 8
4.6
84.6
72
:00
Lo
cal A
nest
hetic
s
Proc
hlor
pera
zine
37
4 µm
ol/L
2.
67
0.13
– 0
.80
0.80
– 2
.67
28:1
6:08
A
ntip
sych
otic
s/Tr
anqu
ilizer
s 56
:22
A
ntie
met
ics
Prom
etha
zine
28
4 µm
ol/L
4.
22
0.35
– 2
.11
3.52
04:0
0
Ant
ihis
tam
ine
Dru
gs
28:2
4:92
M
isce
llane
ous
Anx
ioly
tics,
S
edat
ives
, and
Hyp
notic
s
Prop
oxyp
hene
32
6 µm
ol/L
4.
91
0.15
– 2
.46
3.07
28
:08:
92
Mis
cella
neou
s An
alge
sics
an
d A
ntip
yret
ics
Prop
rano
lol
259
µmol
/L
7.71
0.
02 –
3.8
6 3.
86 –
7.7
1 24
:01
B
eta-
Adr
ener
gic
Blo
cker
s
Prot
ripty
line
26
3 µm
ol/L
3.
8 0.
19 –
0.9
1 0.
76 –
3.8
0
28:1
6:04
:28
Tric
yclic
s an
d O
ther
N
orep
inep
hrin
e-re
upta
ke
Inhi
bito
rs
©Clinical and Laboratory Standards Institute. All rights reserved. 69
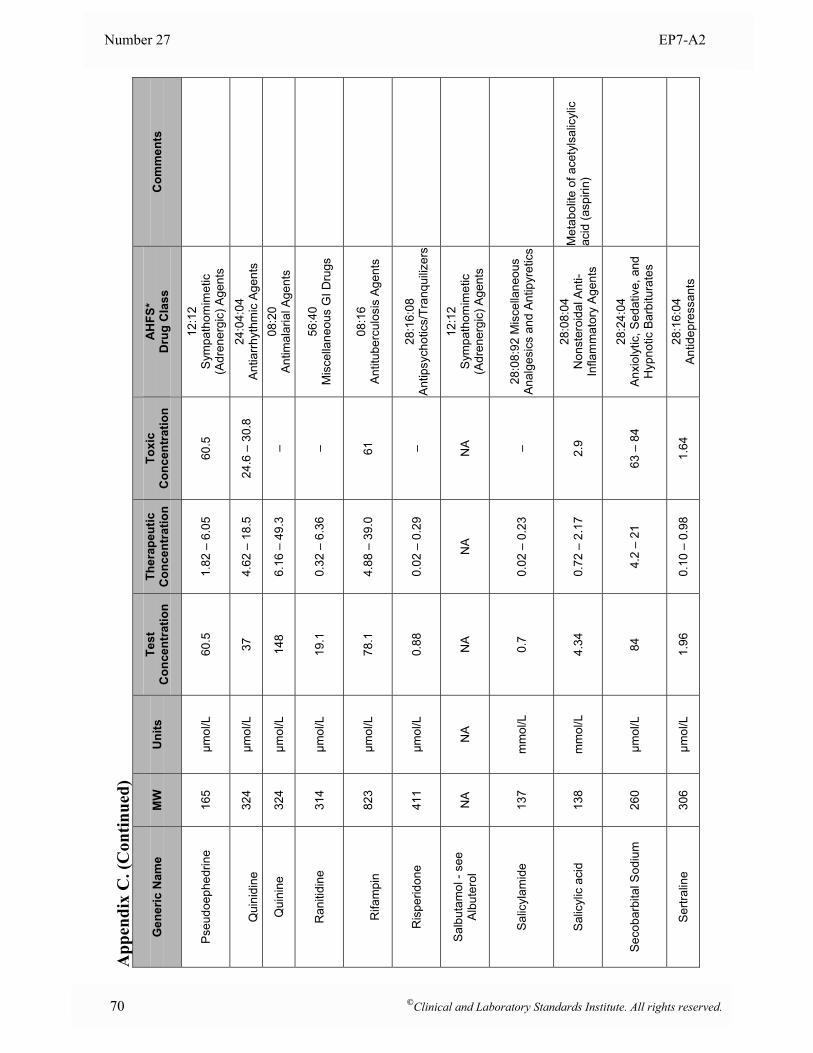
Number 27 EP7-A2
App
endi
x C
. (C
ontin
ued)
Gen
eric
Nam
e M
W
Uni
ts
Test
C
once
ntra
tion
Ther
apeu
tic
Con
cent
ratio
nTo
xic
Con
cent
ratio
n A
HFS
* D
rug
Cla
ss
Com
men
ts
Pseu
doep
hedr
ine
165
µmol
/L
60.5
1.
82 –
6.0
5 60
.5
12:1
2
Sym
path
omim
etic
(A
dren
ergi
c) A
gent
s
Q
uini
dine
32
4 µm
ol/L
37
4.
62 –
18.
5 24
.6 –
30.
8 24
:04:
04
Ant
iarrh
ythm
ic A
gent
s
Qui
nine
32
4 µm
ol/L
14
8 6.
16 –
49.
3 –
08:2
0
Ant
imal
aria
l Age
nts
Ran
itidi
ne
314
µmol
/L
19.1
0.
32 –
6.3
6 –
56:4
0
Mis
cella
neou
s G
I Dru
gs
R
ifam
pin
823
µmol
/L
78.1
4.
88 –
39.
0 61
08
:16
A
ntitu
berc
ulos
is A
gent
s
Ris
perid
one
411
µmol
/L
0.88
0.
02 –
0.2
9 –
28:1
6:08
An
tipsy
chot
ics/
Tran
quiliz
ers
Sal
buta
mol
- se
e A
lbut
erol
N
A
NA
N
A
NA
N
A
12:1
2
Sym
path
omim
etic
(A
dren
ergi
c) A
gent
s
Salic
ylam
ide
137
mm
ol/L
0.
7 0.
02 –
0.2
3 –
28:0
8:92
Mis
cella
neou
s A
nalg
esic
s an
d A
ntip
yret
ics
Salic
ylic
aci
d 13
8 m
mol
/L
4.34
0.
72 –
2.1
7 2.
9 28
:08:
04
Non
ster
oida
l Ant
i-In
flam
mat
ory
Age
nts
Met
abol
ite o
f ace
tyls
alic
ylic
ac
id (a
spiri
n)
Seco
barb
ital S
odiu
m
260
µmol
/L
84
4.2
– 21
63
– 8
4 28
:24:
04
Anx
ioly
tic, S
edat
ive,
and
H
ypno
tic B
arbi
tura
tes
Sertr
alin
e 30
6 µm
ol/L
1.
96
0.10
– 0
.98
1.64
28
:16:
04
Antid
epre
ssan
ts
70 ©Clinical and Laboratory Standards Institute. All rights reserved.
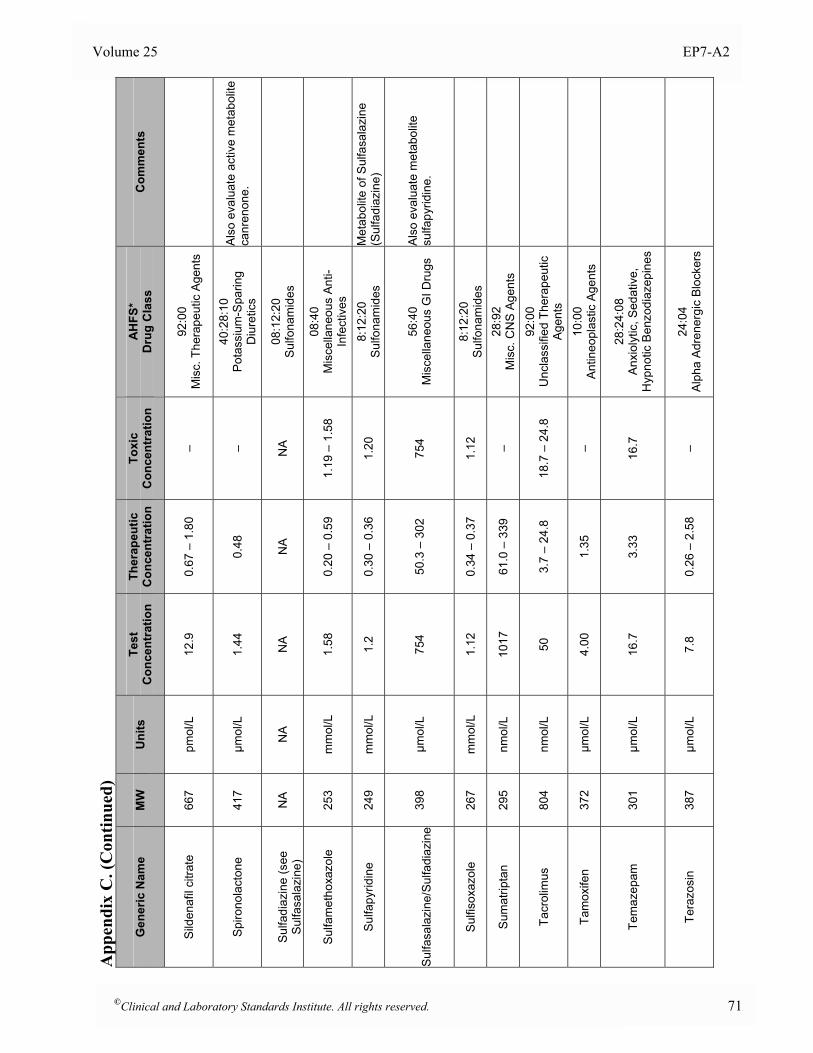
Volume 25 EP7-A2
App
endi
x C
. (C
ontin
ued)
Gen
eric
Nam
e M
W
Uni
ts
Test
C
once
ntra
tion
Ther
apeu
tic
Con
cent
ratio
nTo
xic
Con
cent
ratio
n A
HFS
* D
rug
Cla
ss
Com
men
ts
Sild
enaf
il ci
trate
66
7 pm
ol/L
12
.9
0.67
– 1
.80
– 92
:00
M
isc.
The
rape
utic
Age
nts
Spiro
nola
cton
e 41
7 µm
ol/L
1.
44
0.48
–
40:2
8:10
P
otas
sium
-Spa
ring
Diu
retic
s
Als
o ev
alua
te a
ctiv
e m
etab
olite
ca
nren
one.
Su
lfadi
azin
e (s
ee
Sulfa
sala
zine
) N
A
NA
N
A
NA
N
A
08:1
2:20
Su
lfona
mid
es
Sulfa
met
hoxa
zole
25
3 m
mol
/L
1.58
0.
20 –
0.5
9 1.
19 –
1.5
8 08
:40
M
isce
llane
ous
Anti-
Infe
ctiv
es
Sulfa
pyrid
ine
24
9 m
mol
/L
1.2
0.30
– 0
.36
1.20
8:
12:2
0 Su
lfona
mid
es
Met
abol
ite o
f Sul
fasa
lazi
ne
(Sul
fadi
azin
e)
Su
lfasa
lazi
ne/S
ulfa
diaz
ine
398
µmol
/L
754
50.3
– 3
02
754
56:4
0
Mis
cella
neou
s G
I Dru
gs
Als
o ev
alua
te m
etab
olite
su
lfapy
ridin
e.
Sulfi
soxa
zole
26
7 m
mol
/L
1.12
0.
34 –
0.3
7 1.
12
8:12
:20
Sulfo
nam
ides
Sum
atrip
tan
29
5 nm
ol/L
10
17
61.0
– 3
39
– 28
:92
M
isc.
CN
S A
gent
s
Tacr
olim
us
804
nmol
/L
50
3.7
– 24
.8
18.7
– 2
4.8
92:0
0
Unc
lass
ified
The
rape
utic
A
gent
s
Tam
oxife
n 37
2 µm
ol/L
4.
00
1.35
–
10:0
0
Ant
ineo
plas
tic A
gent
s
Tem
azep
am
301
µmol
/L
16.7
3.
33
16.7
28
:24:
08
Anx
ioly
tic, S
edat
ive,
H
ypno
tic B
enzo
diaz
epin
es
Tera
zosi
n 38
7 µm
ol/L
7.
8 0.
26 –
2.5
8 –
24:0
4
Alph
a Ad
rene
rgic
Blo
cker
s
©Clinical and Laboratory Standards Institute. All rights reserved. 71
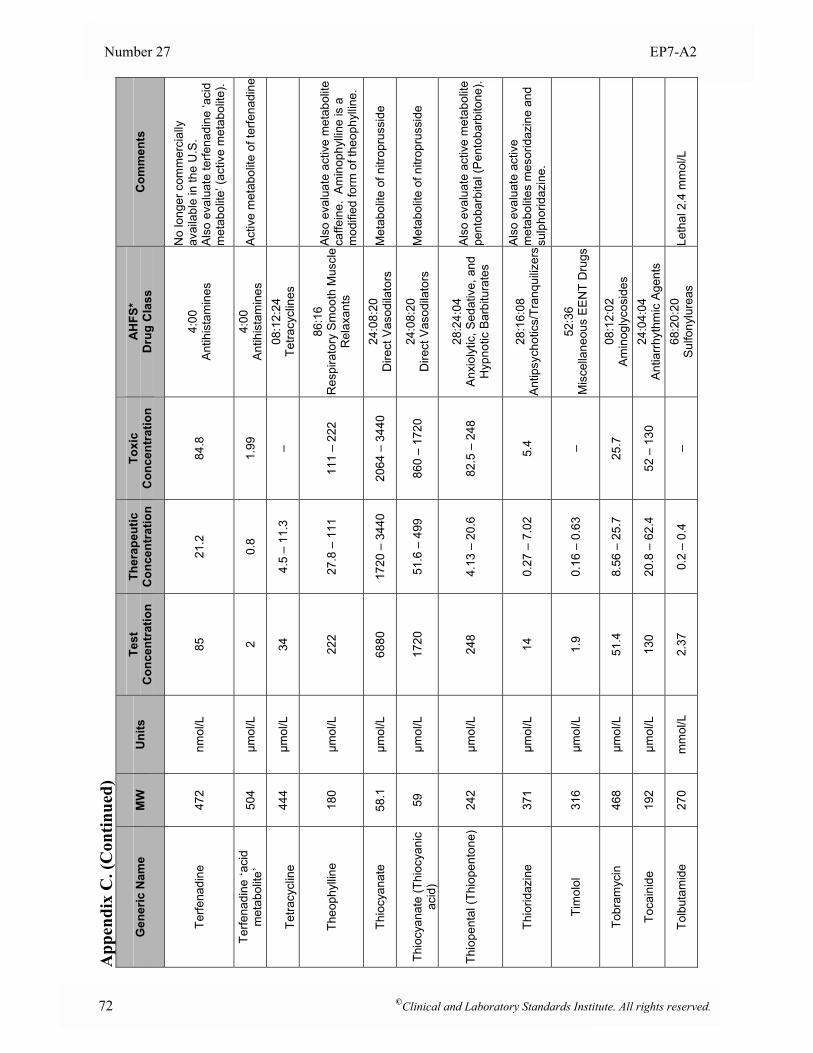
Number 27 EP7-A2
App
endi
x C
. (C
ontin
ued)
Gen
eric
Nam
e M
W
Uni
ts
Test
C
once
ntra
tion
Ther
apeu
tic
Con
cent
ratio
nTo
xic
Con
cent
ratio
n A
HFS
* D
rug
Cla
ss
Com
men
ts
Terfe
nadi
ne
472
nmol
/L
85
21.2
84
.8
4:00
An
tihis
tam
ines
No
long
er c
omm
erci
ally
av
aila
ble
in th
e U
.S.
Als
o ev
alua
te te
rfena
dine
‘aci
d m
etab
olite
’ (ac
tive
met
abol
ite).
Terfe
nadi
ne ‘a
cid
met
abol
ite’
504
µmol
/L
2 0.
8 1.
99
4:00
An
tihis
tam
ines
A
ctiv
e m
etab
olite
of t
erfe
nadi
ne
Te
tracy
clin
e 44
4 µm
ol/L
34
4.
5 –
11.3
–
08:1
2:24
Te
tracy
clin
es
Theo
phyl
line
180
µmol
/L
222
27.8
– 1
11
111
– 22
2 86
:16
R
espi
rato
ry S
moo
th M
uscl
e R
elax
ants
Als
o ev
alua
te a
ctiv
e m
etab
olite
ca
ffein
e. A
min
ophy
lline
is a
m
odifi
ed fo
rm o
f the
ophy
lline
.
Thio
cyan
ate
58.1
µm
ol/L
68
80
1720
– 3
440
2064
– 3
440
24:0
8:20
D
irect
Vas
odila
tors
M
etab
olite
of n
itrop
russ
ide
Th
iocy
anat
e (T
hioc
yani
c ac
id)
59
µmol
/L
1720
51
.6 –
499
86
0 –
1720
24
:08:
20
Dire
ct V
asod
ilato
rs
Met
abol
ite o
f nitr
opru
ssid
e
Thio
pent
al (T
hiop
ento
ne)
242
µmol
/L
248
4.13
– 2
0.6
82.5
– 2
48
28:2
4:04
A
nxio
lytic
, Sed
ativ
e, a
nd
Hyp
notic
Bar
bitu
rate
s
Als
o ev
alua
te a
ctiv
e m
etab
olite
pe
ntob
arbi
tal (
Pen
toba
rbito
ne).
Thio
ridaz
ine
371
µmol
/L
14
0.27
– 7
.02
5.4
28:1
6:08
An
tipsy
chot
ics/
Tran
quiliz
ersA
lso
eval
uate
act
ive
met
abol
ites
mes
orid
azin
e an
d su
lpho
ridaz
ine.
Tim
olol
31
6 µm
ol/L
1.
9 0.
16 –
0.6
3 –
52:3
6
Mis
cella
neou
s EE
NT
Dru
gs
Tobr
amyc
in
468
µmol
/L
51.4
8.
56 –
25.
7 25
.7
08:1
2:02
A
min
ogly
cosi
des
Toca
inid
e
192
µmol
/L
130
20.8
– 6
2.4
52 –
130
24
:04:
04
Ant
iarrh
ythm
ic A
gent
s
Tolb
utam
ide
270
mm
ol/L
2.
37
0.2
– 0.
4 –
68:2
0:20
Su
lfony
lure
as
Leth
al 2
.4 m
mol
/L
72 ©Clinical and Laboratory Standards Institute. All rights reserved.
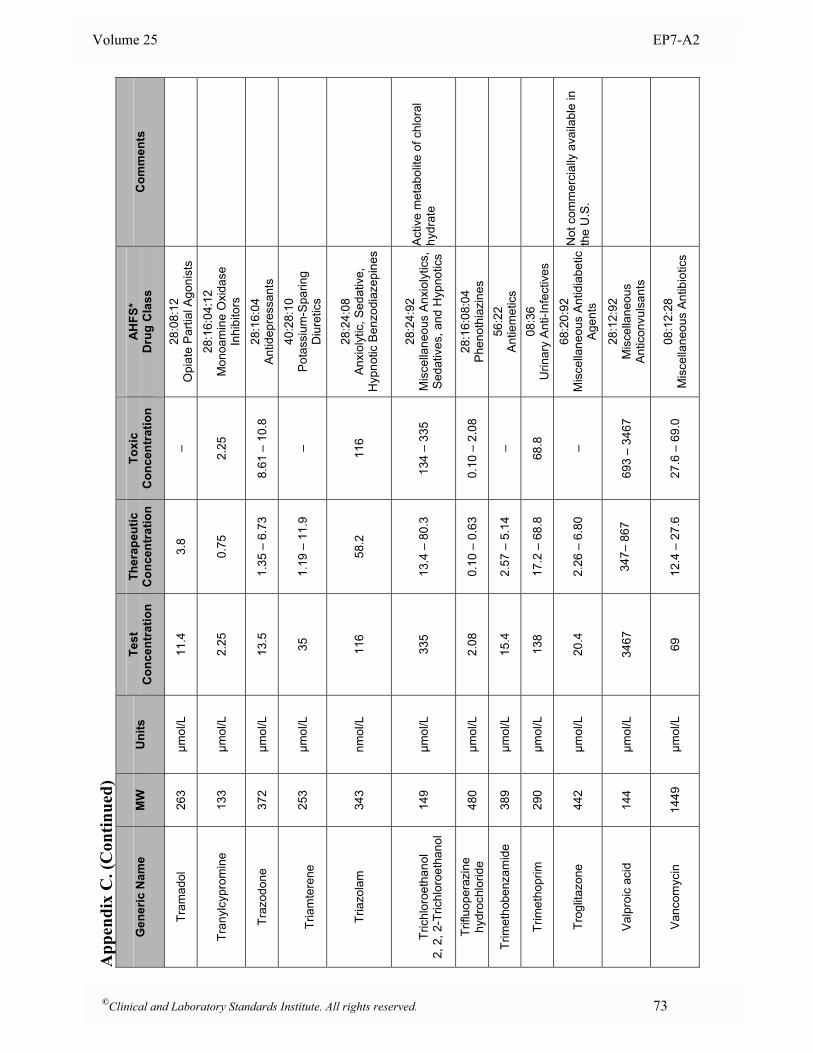
Volume 25 EP7-A2
App
endi
x C
. (C
ontin
ued)
Gen
eric
Nam
e M
W
Uni
ts
Test
C
once
ntra
tion
Ther
apeu
tic
Con
cent
ratio
nTo
xic
Con
cent
ratio
n A
HFS
* D
rug
Cla
ss
Com
men
ts
Tram
adol
26
3 µm
ol/L
11
.4
3.8
– 28
:08:
12
Opi
ate
Par
tial A
goni
sts
Tran
ylcy
prom
ine
13
3 µm
ol/L
2.
25
0.75
2.
25
28:1
6:04
:12
Mon
oam
ine
Oxi
dase
In
hibi
tors
Traz
odon
e 37
2 µm
ol/L
13
.5
1.35
– 6
.73
8.61
– 1
0.8
28:1
6:04
An
tidep
ress
ants
Tr
iam
tere
ne
253
µmol
/L
35
1.19
– 1
1.9
– 40
:28:
10
Pot
assi
um-S
parin
g D
iure
tics
Tria
zola
m
343
nmol
/L
116
58.2
11
6 28
:24:
08
Anx
ioly
tic, S
edat
ive,
H
ypno
tic B
enzo
diaz
epin
es
Tr
ichl
oroe
than
ol
2, 2
, 2-T
richl
oroe
than
ol
149
µmol
/L
335
13.4
– 8
0.3
134
– 33
5 28
:24:
92
Mis
cella
neou
s A
nxio
lytic
s,
Sed
ativ
es, a
nd H
ypno
tics
Act
ive
met
abol
ite o
f chl
oral
hy
drat
e
Trifl
uope
razi
ne
hydr
ochl
orid
e 48
0 µm
ol/L
2.
08
0.10
– 0
.63
0.10
– 2
.08
28:1
6:08
:04
Ph
enot
hiaz
ines
Trim
etho
benz
amid
e 38
9 µm
ol/L
15
.4
2.57
– 5
.14
– 56
:22
A
ntie
met
ics
Trim
etho
prim
29
0 µm
ol/L
13
8 17
.2 –
68.
8 68
.8
08:3
6
Urin
ary
Ant
i-Inf
ectiv
es
Trog
litaz
one
442
µmol
/L
20.4
2.
26 –
6.8
0 –
68:2
0:92
M
isce
llane
ous
Antid
iabe
tic
Age
nts
Not
com
mer
cial
ly a
vaila
ble
in
the
U.S
.
Valp
roic
aci
d 14
4 µm
ol/L
34
67
34
7– 8
67
69
3 –
3467
28
:12:
92
Mis
cella
neou
s A
ntic
onvu
lsan
ts
Vanc
omyc
in
1449
µm
ol/L
69
12
.4 –
27.
6 27
.6 –
69.
0 08
:12:
28
Mis
cella
neou
s A
ntib
iotic
s
©Clinical and Laboratory Standards Institute. All rights reserved. 73
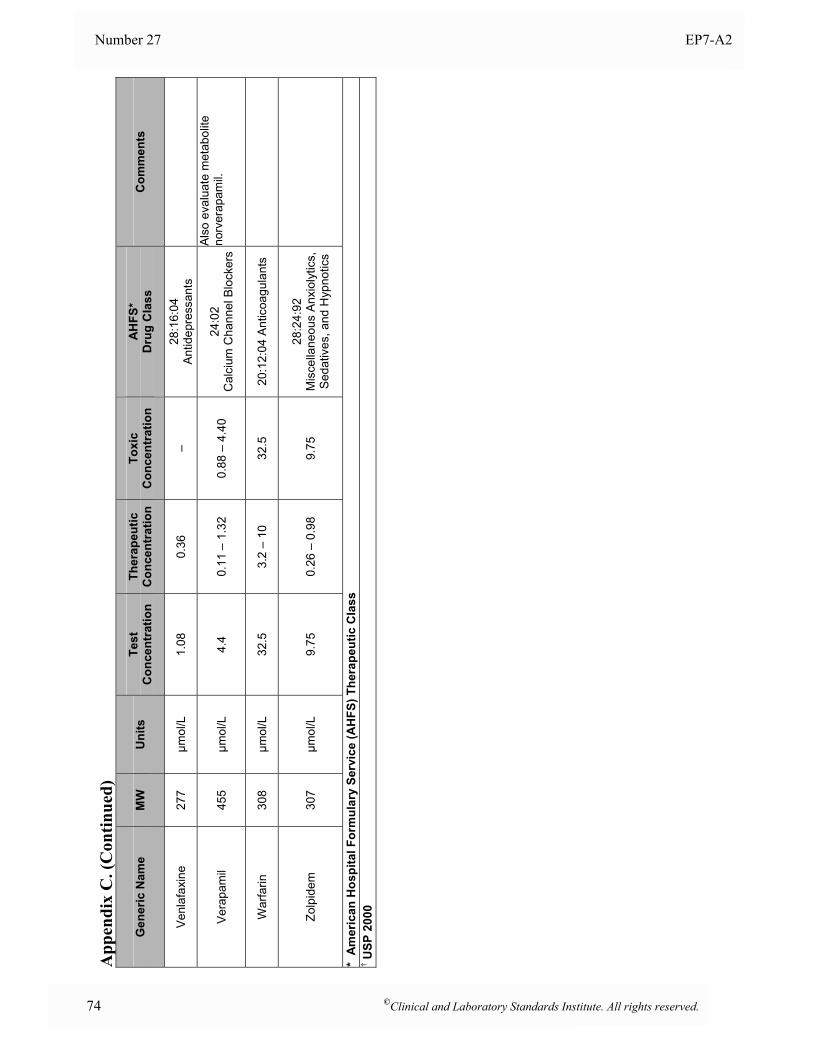
Number 27 EP7-A2
74 ©Clinical and Laboratory Standards Institute. All rights reserved.
App
endi
x C
. (C
ontin
ued)
Gen
eric
Nam
e M
W
Uni
ts
Test
C
once
ntra
tion
Ther
apeu
tic
Con
cent
ratio
nTo
xic
Con
cent
ratio
n A
HFS
* D
rug
Cla
ss
Com
men
ts
Venl
afax
ine
277
µmol
/L
1.08
0.
36
– 28
:16:
04
Antid
epre
ssan
ts
Vera
pam
il 45
5 µm
ol/L
4.
4 0.
11 –
1.3
2 0.
88 –
4.4
0 24
:02
C
alci
um C
hann
el B
lock
ers
Als
o ev
alua
te m
etab
olite
no
rver
apam
il.
War
farin
30
8 µm
ol/L
32
.5
3.2
– 10
32
.5
20:1
2:04
Ant
icoa
gula
nts
Zolp
idem
30
7 µm
ol/L
9.
75
0.26
– 0
.98
9.75
28
:24:
92
Mis
cella
neou
s A
nxio
lytic
s,
Sed
ativ
es, a
nd H
ypno
tics
* A
mer
ican
Hos
pita
l For
mul
ary
Serv
ice
(AH
FS) T
hera
peut
ic C
lass
† U
SP 2
000
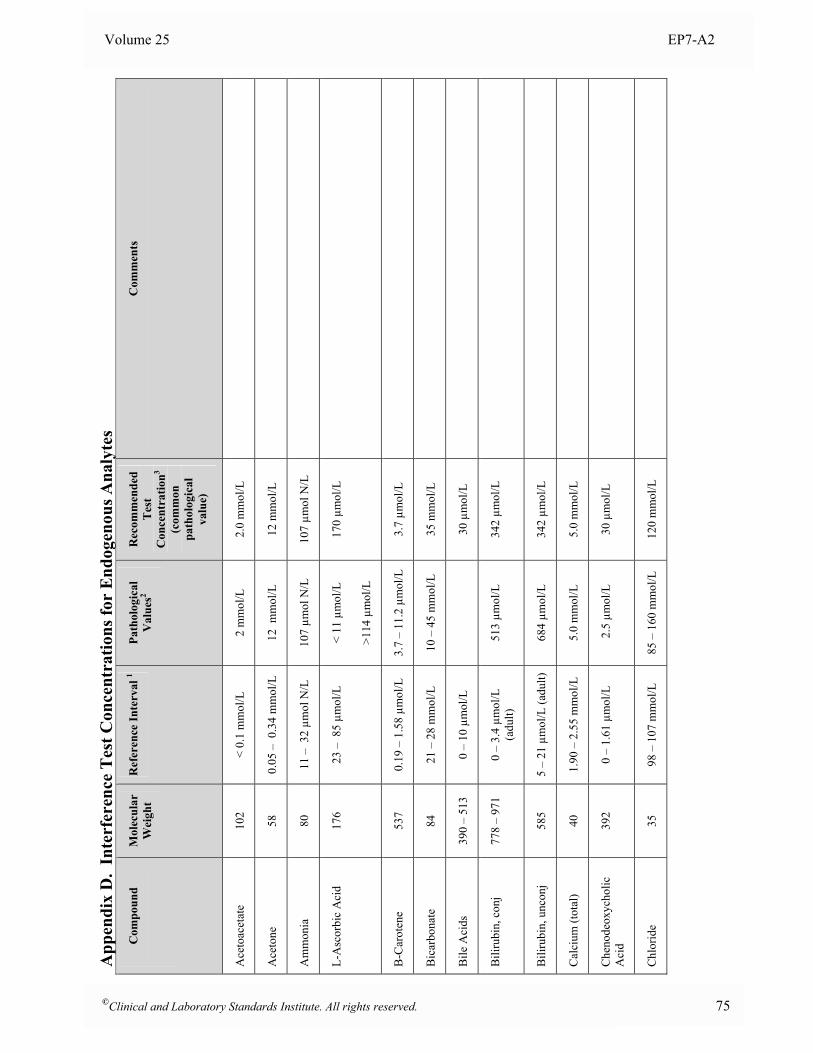
Volume 25 EP7-A2
App
endi
x D
. In
terf
eren
ce T
est C
once
ntra
tions
for
End
ogen
ous A
naly
tes
Com
poun
d
Mol
ecul
ar
Wei
ght
Ref
eren
ce In
terv
al 1
Path
olog
ical
V
alue
s2 R
ecom
men
ded
Tes
t C
once
ntra
tion3
(com
mon
pa
thol
ogic
al
valu
e)
Com
men
ts
Ace
toac
etat
e 10
2 <
0.1
mm
ol/L
2
mm
ol/L
2.
0 m
mol
/L
Ace
tone
58
0.
05 –
0.3
4 m
mol
/L
12 m
mol
/L
12 m
mol
/L
Am
mon
ia
80
11 –
32
µmol
N/L
10
7 µm
ol N
/L
107
µmol
N/L
L-A
scor
bic
Aci
d 17
6 23
– 8
5 µm
ol/L
<
11 µ
mol
/L
>114
µm
ol/L
170
µmol
/L
B-C
arot
ene
537
0.19
– 1
.58
µmol
/L
3.7
– 11
.2 µ
mol
/L
3.7
µmol
/L
Bic
arbo
nate
84
21
– 2
8 m
mol
/L
10 –
45
mm
ol/L
35
mm
ol/L
Bile
Aci
ds
390
– 51
3 0
– 10
µm
ol/L
30 µ
mol
/L
Bili
rubi
n, c
onj
778
– 97
1 0
– 3.
4 µm
ol/L
(a
dult)
51
3 µm
ol/L
34
2 µm
ol/L
Bili
rubi
n, u
ncon
j 58
5 5
– 21
µm
ol/L
(adu
lt)
684
µmol
/L
342
µmol
/L
Cal
cium
(tot
al)
40
1.90
– 2
.55
mm
ol/L
5.
0 m
mol
/L
5.0
mm
ol/L
Che
node
oxyc
holic
A
cid
392
0 –
1.61
µm
ol/L
2
.5 µ
mol
/L
30 µ
mol
/L
Chl
orid
e 35
98
– 1
07 m
mol
/L
85 –
160
mm
ol/L
12
0 m
mol
/L
©Clinical and Laboratory Standards Institute. All rights reserved. 75
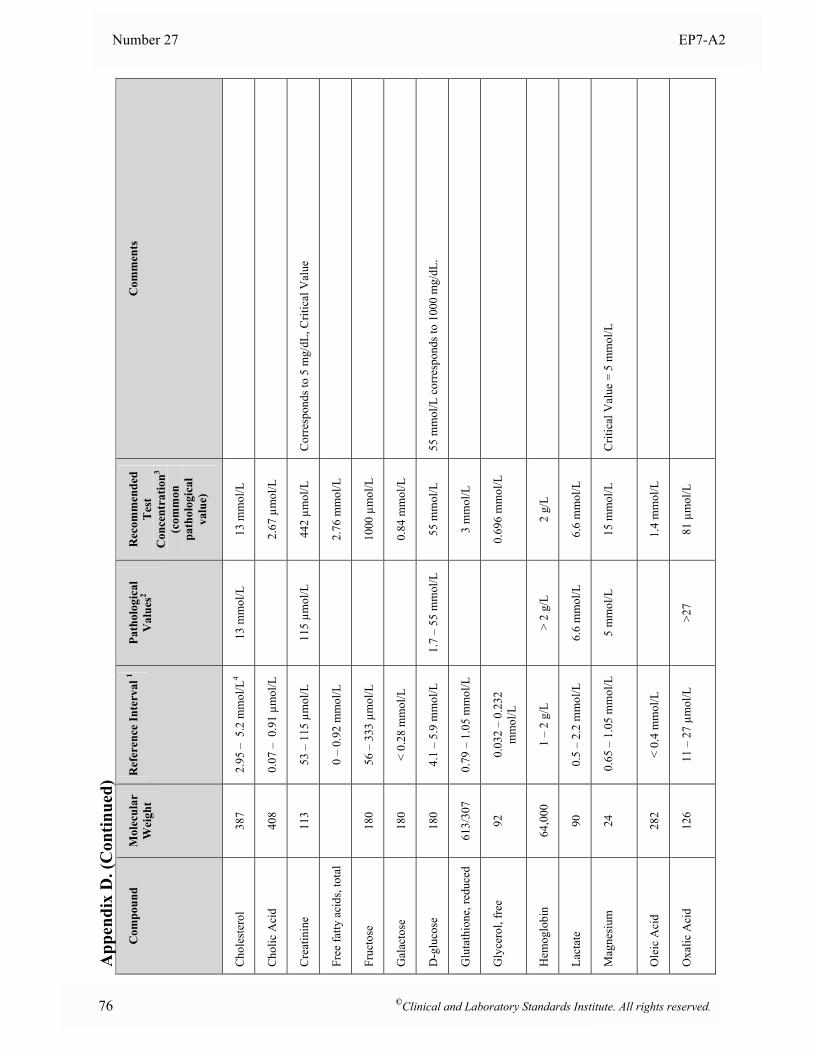
Number 27 EP7-A2
76 ©Clinical and Laboratory Standards Institute. All rights reserved.
App
endi
x D
. (C
ontin
ued)
Com
poun
d
Mol
ecul
ar
Wei
ght
Ref
eren
ce In
terv
al 1
Path
olog
ical
V
alue
s2 R
ecom
men
ded
Tes
t C
once
ntra
tion3
(com
mon
pa
thol
ogic
al
valu
e)
Com
men
ts
Cho
lest
erol
38
7 2.
95 –
5.2
mm
ol/L
4 13
mm
ol/L
13
mm
ol/L
Cho
lic A
cid
408
0.07
– 0
.91
µmol
/L
2.
67 µ
mol
/L
Cre
atin
ine
113
53 –
115
µm
ol/L
11
5 µm
ol/L
44
2 µm
ol/L
C
orre
spon
ds to
5 m
g/dL
, Crit
ical
Val
ue
Free
fatty
aci
ds, t
otal
0 –
0.92
mm
ol/L
2.76
mm
ol/L
Fruc
tose
18
0 56
– 3
33 µ
mol
/L
10
00 µ
mol
/L
Gal
acto
se
180
< 0.
28 m
mol
/L
0.
84 m
mol
/L
D-g
luco
se
180
4.1
– 5.
9 m
mol
/L
1.7
– 55
mm
ol/L
55
mm
ol/L
55
mm
ol/L
cor
resp
onds
to 1
000
mg/
dL.
Glu
tath
ione
, red
uced
61
3/30
7 0.
79 –
1.0
5 m
mol
/L
3
mm
ol/L
Gly
cero
l, fr
ee
92
0.03
2 –
0.23
2 m
mol
/L
0.
696
mm
ol/L
Hem
oglo
bin
64
,000
1
– 2
g/L
> 2
g/L
2 g/
L
Lact
ate
90
0.5
– 2.
2 m
mol
/L
6.6
mm
ol/L
6.
6 m
mol
/L
Mag
nesi
um
24
0.65
– 1
.05
mm
ol/L
5
mm
ol/L
15
mm
ol/L
C
ritic
al V
alue
= 5
mm
ol/L
Ole
ic A
cid
282
< 0.
4 m
mol
/L
1.
4 m
mol
/L
Oxa
lic A
cid
126
11 –
27
µmol
/L
>2
7 81
µm
ol/L
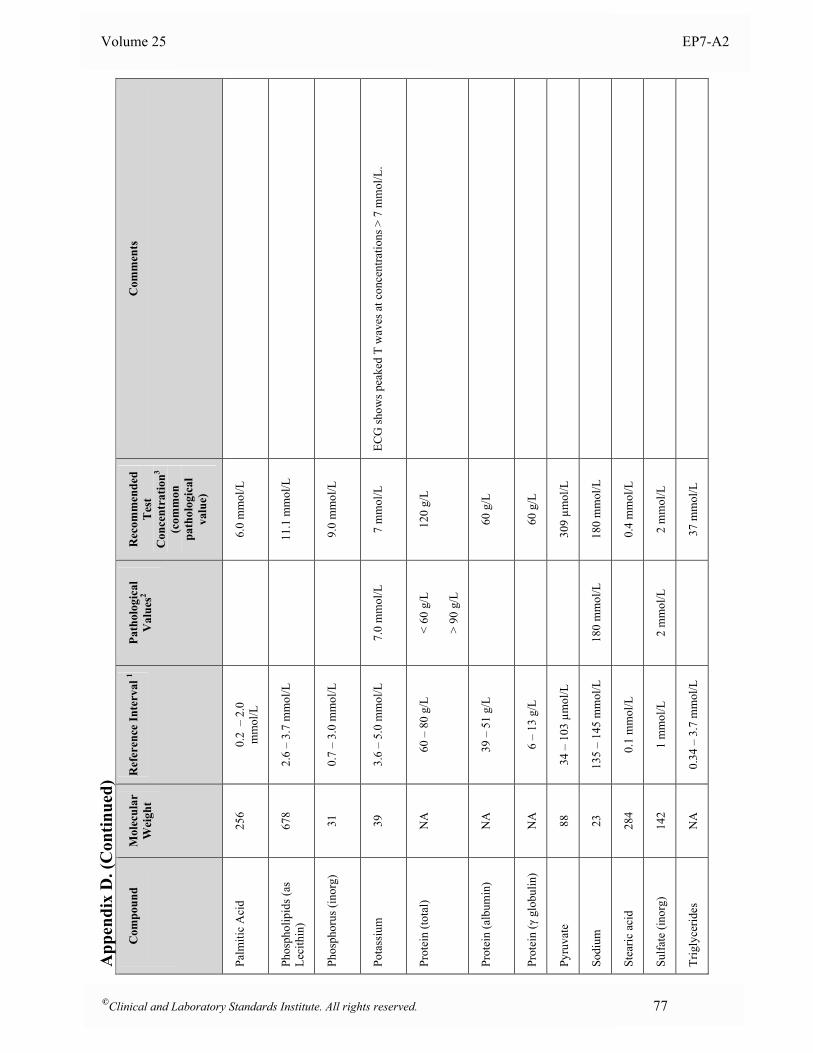
Volume 25 EP7-A2
App
endi
x D
. (C
ontin
ued)
Com
poun
d
Mol
ecul
ar
Wei
ght
Ref
eren
ce In
terv
al 1
Path
olog
ical
V
alue
s2 R
ecom
men
ded
Tes
t C
once
ntra
tion3
(com
mon
pa
thol
ogic
al
valu
e)
Com
men
ts
Palm
itic
Aci
d 25
6 0.
2 –
2.0
m
mol
/L
6.
0 m
mol
/L
Phos
phol
ipid
s (as
Le
cith
in)
678
2.6
– 3.
7 m
mol
/L
11
.1 m
mol
/L
Phos
phor
us (i
norg
) 31
0.
7 –
3.0
mm
ol/L
9.
0 m
mol
/L
Pota
ssiu
m
39
3.6
– 5.
0 m
mol
/L
7.
0 m
mol
/L
7 m
mol
/L
ECG
show
s pea
ked
T w
aves
at c
once
ntra
tions
> 7
mm
ol/L
.
Prot
ein
(tota
l) N
A
60 –
80
g/L
<
60 g
/L
> 90
g/L
120
g/L
Prot
ein
(alb
umin
) N
A
39 –
51
g/L
60 g
/L
Prot
ein
(γ g
lobu
lin)
NA
6
– 13
g/L
60 g
/L
Pyru
vate
88
34
– 1
03 µ
mol
/L
30
9 µm
ol/L
Sodi
um
23
135
– 14
5 m
mol
/L
180
mm
ol/L
18
0 m
mol
/L
Stea
ric a
cid
284
0.1
mm
ol/L
0.4
mm
ol/L
Sulfa
te (i
norg
) 14
2 1
mm
ol/L
2
mm
ol/L
2
mm
ol/L
Trig
lyce
rides
N
A
0.34
– 3
.7 m
mol
/L
37
mm
ol/L
©Clinical and Laboratory Standards Institute. All rights reserved. 77
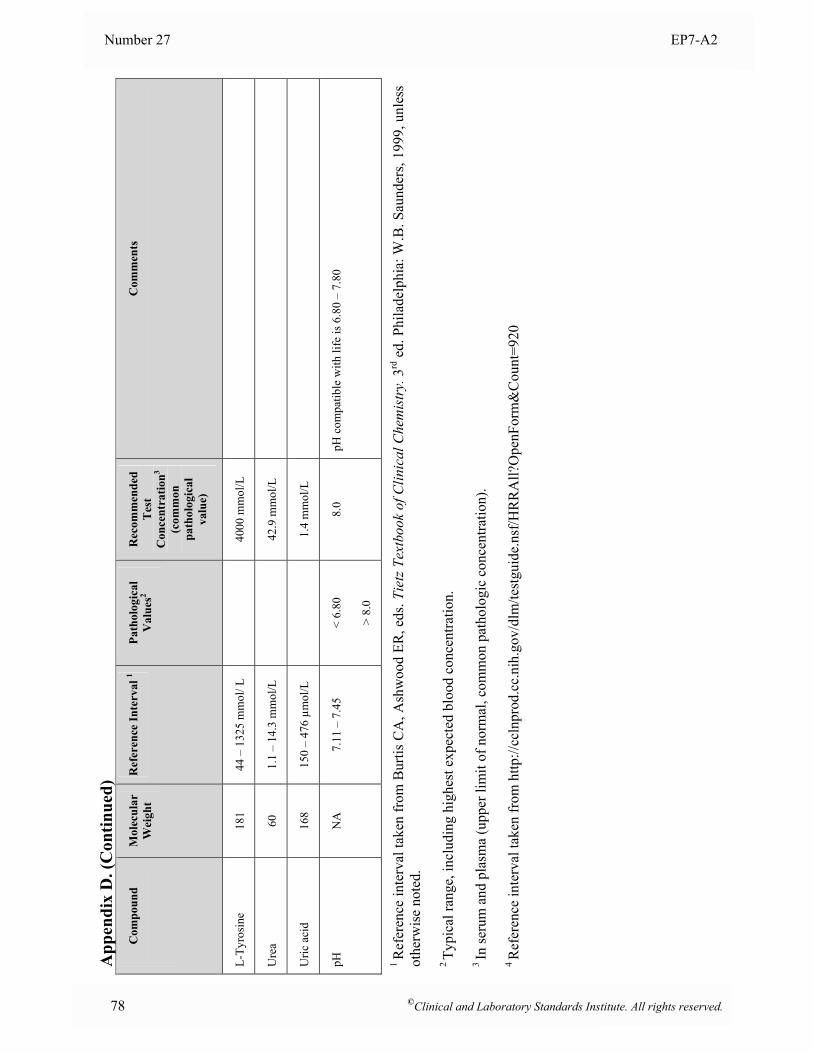
Number 27 EP7-A2
78 ©Clinical and Laboratory Standards Institute. All rights reserved.
App
endi
x D
. (C
ontin
ued)
Com
poun
d
Mol
ecul
ar
Wei
ght
Ref
eren
ce In
terv
al 1
Path
olog
ical
V
alue
s2 R
ecom
men
ded
Tes
t C
once
ntra
tion3
(com
mon
pa
thol
ogic
al
valu
e)
Com
men
ts
L-Ty
rosi
ne
181
44 –
132
5 m
mol
/ L
40
00 m
mol
/L
Ure
a 60
1.
1 –
14.3
mm
ol/L
42.9
mm
ol/L
Uric
aci
d 16
8 15
0 –
476
µmol
/L
1.
4 m
mol
/L
pH
NA
7.
11 –
7.4
5 <
6.80
> 8.
0
8.0
pH c
ompa
tible
with
life
is 6
.80
– 7.
80
1 R
efer
ence
inte
rval
take
n fr
om B
urtis
CA
, Ash
woo
d ER
, eds
. Tie
tz T
extb
ook
of C
linic
al C
hem
istr
y. 3
rd e
d. P
hila
delp
hia:
W.B
. Sau
nder
s, 19
99, u
nles
s ot
herw
ise
note
d.
2 Ty
pica
l ran
ge, i
nclu
ding
hig
hest
exp
ecte
d bl
ood
conc
entra
tion.
3 In
seru
m a
nd p
lasm
a (u
pper
lim
it of
nor
mal
, com
mon
pat
holo
gic
conc
entra
tion)
.
4 R
efer
ence
inte
rval
take
n fr
om h
ttp://
ccln
prod
.cc.
nih.
gov/
dlm
/test
guid
e.ns
f/HR
RA
ll?O
penF
orm
&C
ount
=920
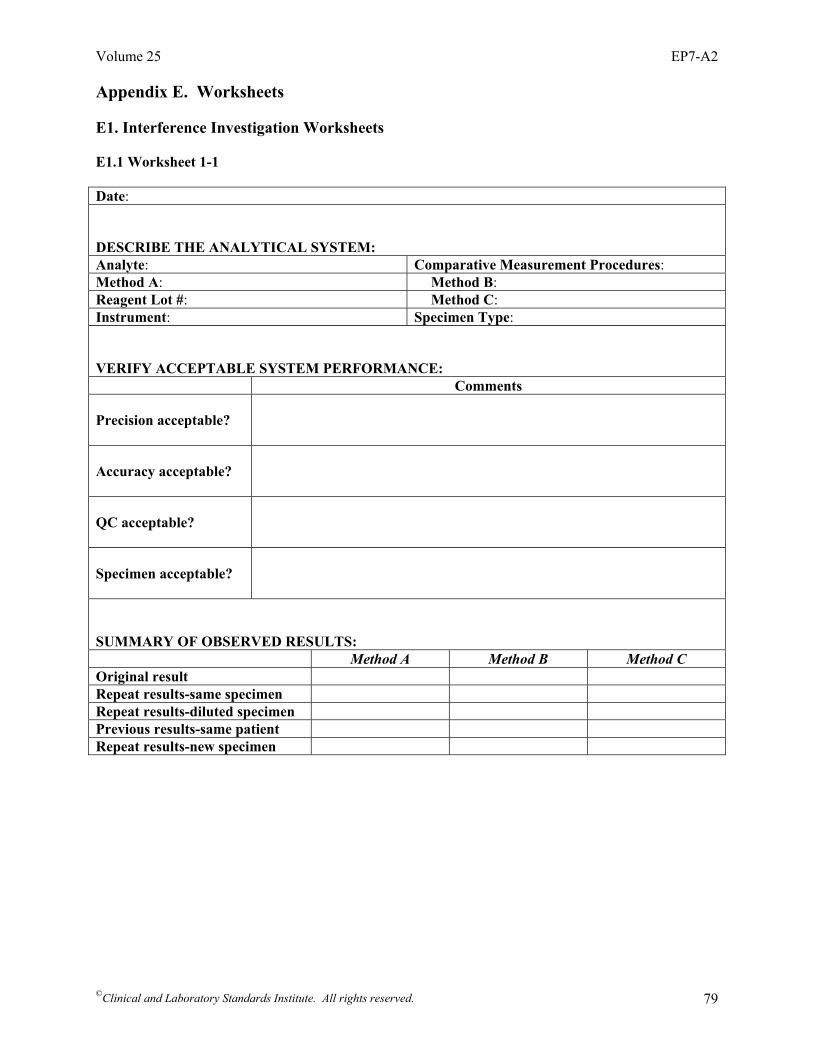
Volume 25 EP7-A2
©Clinical and Laboratory Standards Institute. All rights reserved. 79
Appendix E. Worksheets E1. Interference Investigation Worksheets E1.1 Worksheet 1-1 Date: DESCRIBE THE ANALYTICAL SYSTEM: Analyte: Comparative Measurement Procedures: Method A: Method B: Reagent Lot #: Method C: Instrument: Specimen Type: VERIFY ACCEPTABLE SYSTEM PERFORMANCE: Comments Precision acceptable?
Accuracy acceptable?
QC acceptable?
Specimen acceptable?
SUMMARY OF OBSERVED RESULTS: Method A Method B Method C Original result Repeat results-same specimen Repeat results-diluted specimen Previous results-same patient Repeat results-new specimen
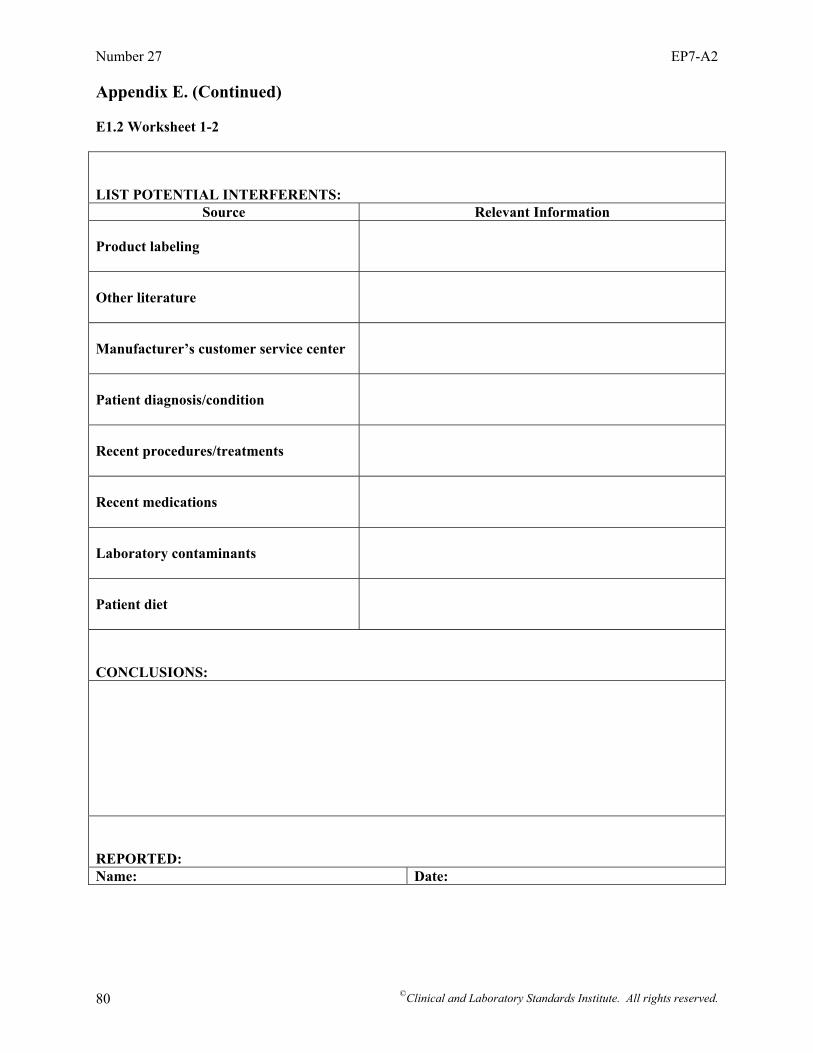
Number 27 EP7-A2
©Clinical and Laboratory Standards Institute. All rights reserved. 80
Appendix E. (Continued) E1.2 Worksheet 1-2 LIST POTENTIAL INTERFERENTS:
Source Relevant Information Product labeling
Other literature
Manufacturer’s customer service center
Patient diagnosis/condition
Recent procedures/treatments
Recent medications
Laboratory contaminants
Patient diet
CONCLUSIONS: REPORTED: Name: Date:
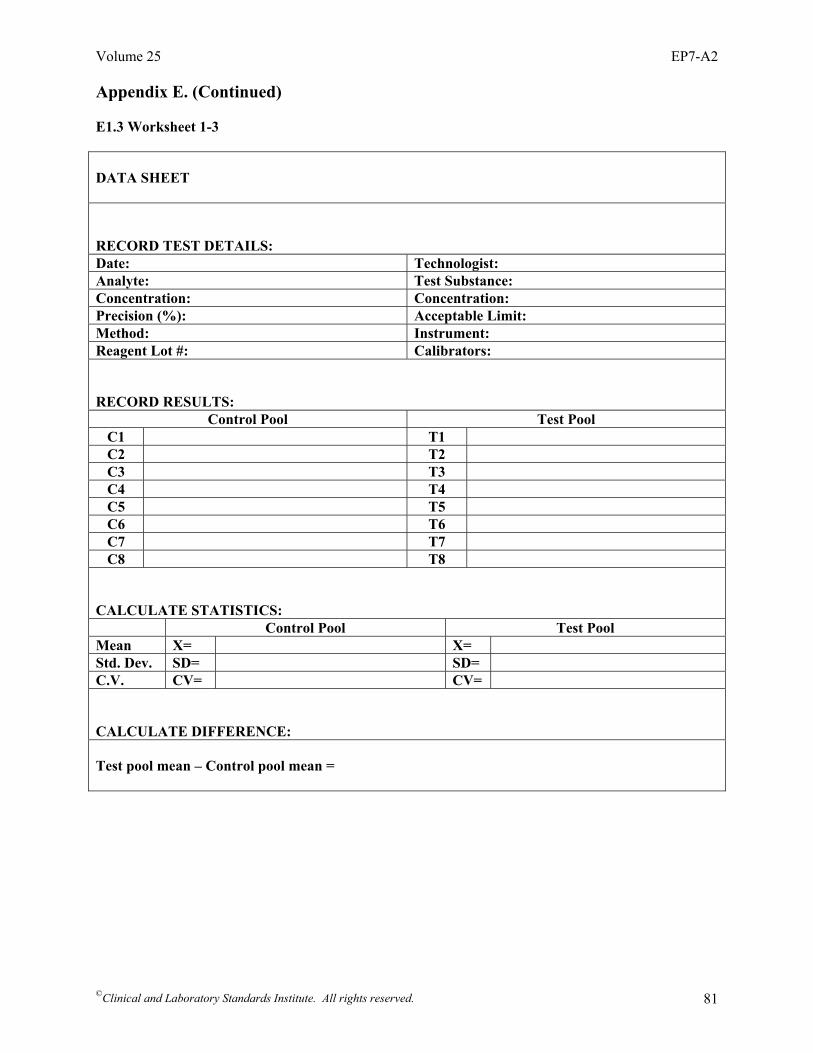
Volume 25 EP7-A2
©Clinical and Laboratory Standards Institute. All rights reserved. 81
Appendix E. (Continued) E1.3 Worksheet 1-3 DATA SHEET RECORD TEST DETAILS: Date: Technologist: Analyte: Test Substance: Concentration: Concentration: Precision (%): Acceptable Limit: Method: Instrument: Reagent Lot #: Calibrators: RECORD RESULTS:
Control Pool Test Pool C1 T1 C2 T2 C3 T3 C4 T4 C5 T5 C6 T6 C7 T7 C8 T8
CALCULATE STATISTICS: Control Pool Test Pool Mean X= X= Std. Dev. SD= SD= C.V. CV= CV= CALCULATE DIFFERENCE: Test pool mean – Control pool mean =
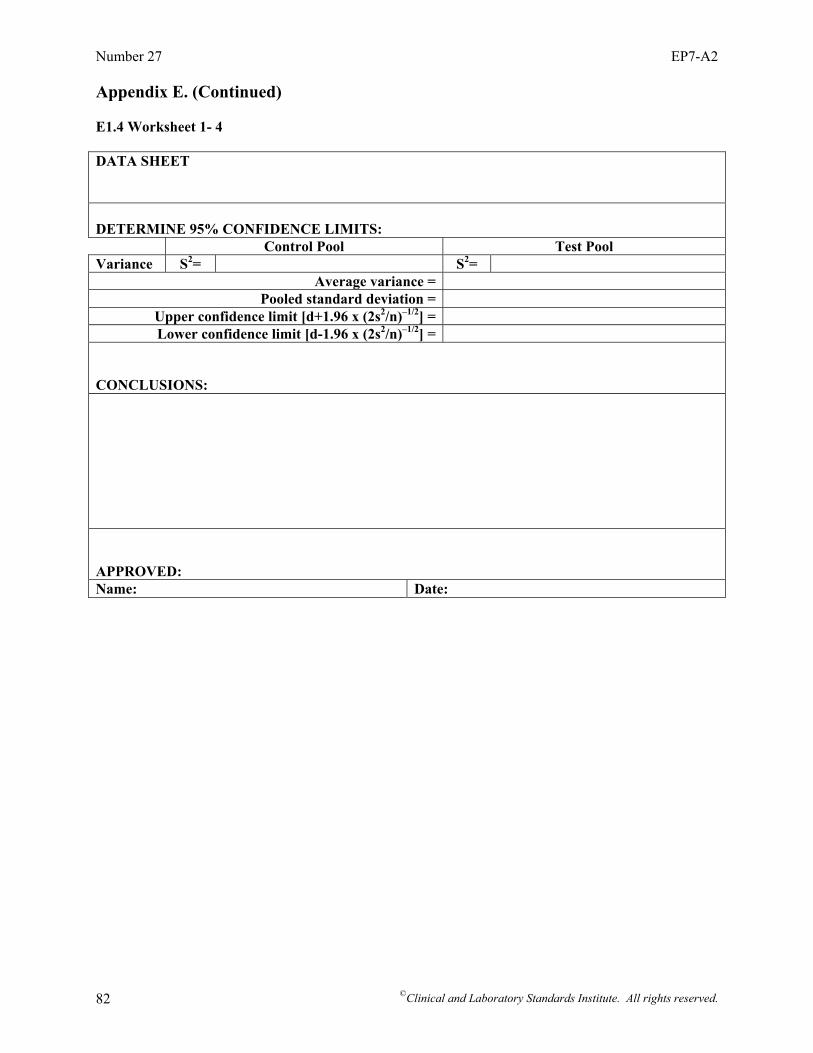
Number 27 EP7-A2
©Clinical and Laboratory Standards Institute. All rights reserved. 82
Appendix E. (Continued) E1.4 Worksheet 1- 4 DATA SHEET DETERMINE 95% CONFIDENCE LIMITS: Control Pool Test Pool Variance S2= S2=
Average variance = Pooled standard deviation =
Upper confidence limit [d+1.96 x (2s2/n)–1/2] = Lower confidence limit [d-1.96 x (2s2/n)–1/2] =
CONCLUSIONS: APPROVED: Name: Date:
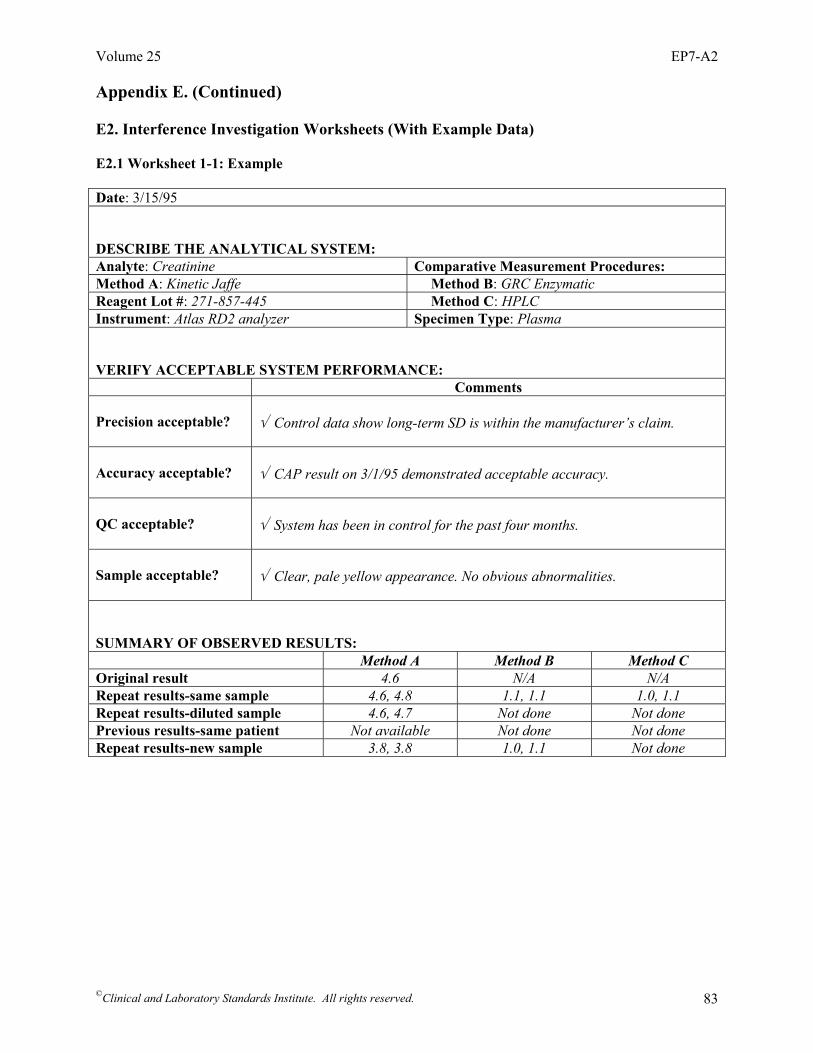
Volume 25 EP7-A2
©Clinical and Laboratory Standards Institute. All rights reserved. 83
Appendix E. (Continued) E2. Interference Investigation Worksheets (With Example Data) E2.1 Worksheet 1-1: Example Date: 3/15/95 DESCRIBE THE ANALYTICAL SYSTEM: Analyte: Creatinine Comparative Measurement Procedures: Method A: Kinetic Jaffe Method B: GRC Enzymatic Reagent Lot #: 271-857-445 Method C: HPLC Instrument: Atlas RD2 analyzer Specimen Type: Plasma VERIFY ACCEPTABLE SYSTEM PERFORMANCE: Comments Precision acceptable?
√ Control data show long-term SD is within the manufacturer’s claim.
Accuracy acceptable?
√ CAP result on 3/1/95 demonstrated acceptable accuracy.
QC acceptable?
√ System has been in control for the past four months.
Sample acceptable?
√ Clear, pale yellow appearance. No obvious abnormalities.
SUMMARY OF OBSERVED RESULTS: Method A Method B Method C Original result 4.6 N/A N/A Repeat results-same sample 4.6, 4.8 1.1, 1.1 1.0, 1.1 Repeat results-diluted sample 4.6, 4.7 Not done Not done Previous results-same patient Not available Not done Not done Repeat results-new sample 3.8, 3.8 1.0, 1.1 Not done

Number 27 EP7-A2
©Clinical and Laboratory Standards Institute. All rights reserved. 84
Appendix E. (Continued) E2.2 Worksheet 1-2: Example LIST POTENTIAL INTERFERENTS:
Source Relevant Information Product labeling
Cephalosporin antibiotics, keto-acids, bilirubin, hemoglobin.
Other literature
Same as above.
Manufacturer’s customer service center
Called Customer Service hotline; they are unaware of any other interferents.
Patient diagnosis/condition
Admitted for abdominal surgery. Patient has a history of diabetes.
Recent procedures/treatments
None
Recent medications
Seldane, Nasalide, Ketoconizole, Acetaminophen
Laboratory contaminants
None apparent
Patient diet
Nothing unusual
CONCLUSIONS: Sample tested positive for keto-acids. Suspect beta-hydroxybutyrate interference. REPORTED to manufacturer Name: Robert H. Fleming Date: 3/3/95

Volume 25 EP7-A2
©Clinical and Laboratory Standards Institute. All rights reserved. 85
Appendix E. (Continued) E2.3 Worksheet 1-3: Example DATA SHEET RECORD TEST DETAILS: Date: 3/2/95 Technologist: R. Doyle Analyte: Creatinine Test Substance: Cephaloxin Concentration: 1.5 mg/dL Concentration: 10 mg/dL Precision (%): 0.8% Acceptable Limit: 0.15 mg/dL or 3% Method: Jaffe Instrument: Autochem 101 Reagent Lot #: B2106-44 Calibrators: Set # C1812 RECORD RESULTS:
Control Pool Test Pool C1 1.49 mg/dL T1 5.25 mg/dL C2 1.42 mg/dL T2 5.41 mg/dL C3 1.55 mg/dL T3 5.34 mg/dL C4 1.55 mg/dL T4 5.34 mg/dL C5 1.55 mg/dL T5 5.34 mg/dL
CALCULATE STATISTICS: Control Pool Test Pool Mean X= 1.49 mg/dL X= 5.33 mg/dL Std. Dev. SD= 0.065 mg/dL SD= 0.080 mg/dL C.V. CV= 4.38% CV= 1.50% CALCULATE DIFFERENCE: Test pool mean – Control pool mean = 3.85 mg/dL
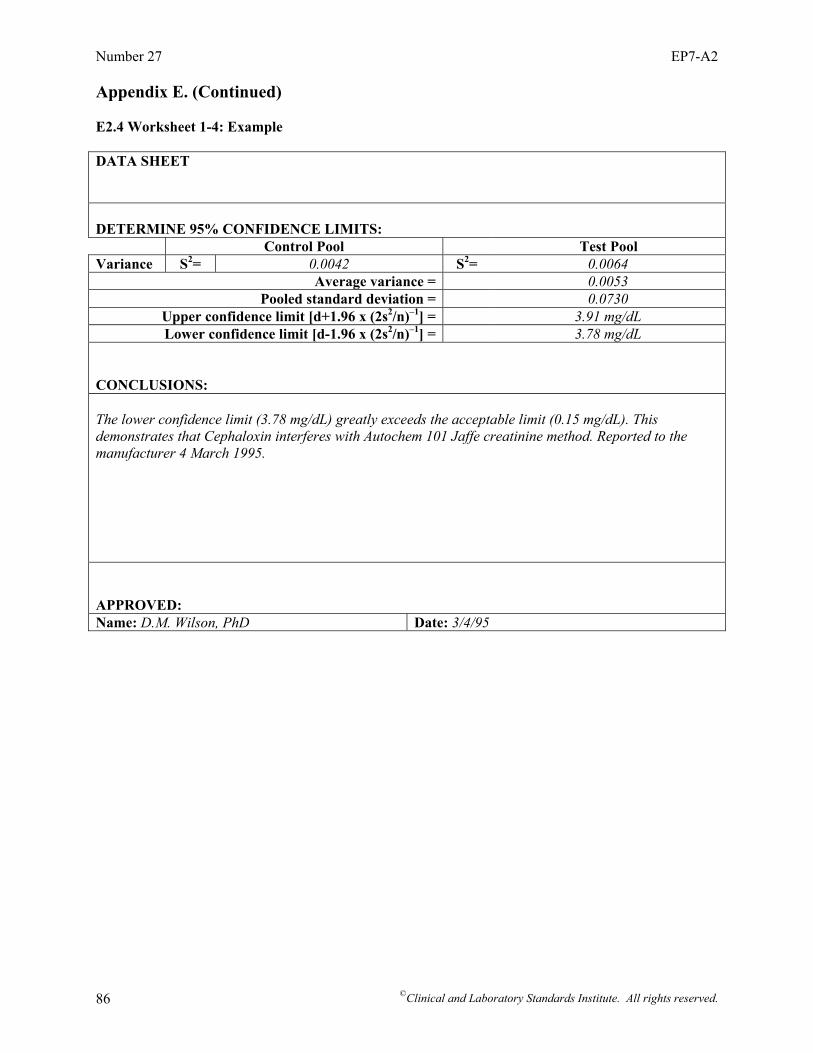
Number 27 EP7-A2
©Clinical and Laboratory Standards Institute. All rights reserved. 86
Appendix E. (Continued) E2.4 Worksheet 1-4: Example DATA SHEET DETERMINE 95% CONFIDENCE LIMITS: Control Pool Test Pool Variance S2= 0.0042 S2= 0.0064
Average variance = 0.0053 Pooled standard deviation = 0.0730
Upper confidence limit [d+1.96 x (2s2/n)–1] = 3.91 mg/dL Lower confidence limit [d-1.96 x (2s2/n)–1] = 3.78 mg/dL
CONCLUSIONS: The lower confidence limit (3.78 mg/dL) greatly exceeds the acceptable limit (0.15 mg/dL). This demonstrates that Cephaloxin interferes with Autochem 101 Jaffe creatinine method. Reported to the manufacturer 4 March 1995. APPROVED: Name: D.M. Wilson, PhD Date: 3/4/95
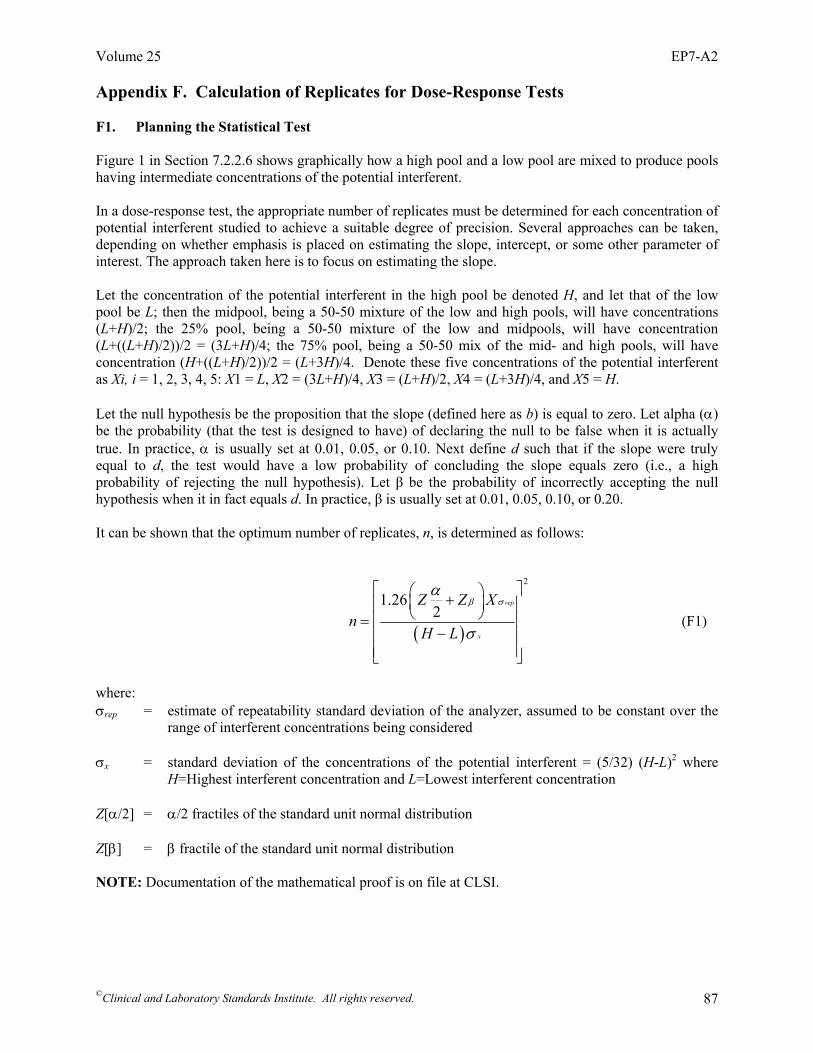
Volume 25 EP7-A2
©Clinical and Laboratory Standards Institute. All rights reserved. 87
Appendix F. Calculation of Replicates for Dose-Response Tests F1. Planning the Statistical Test
Figure 1 in Section 7.2.2.6 shows graphically how a high pool and a low pool are mixed to produce pools having intermediate concentrations of the potential interferent. In a dose-response test, the appropriate number of replicates must be determined for each concentration of potential interferent studied to achieve a suitable degree of precision. Several approaches can be taken, depending on whether emphasis is placed on estimating the slope, intercept, or some other parameter of interest. The approach taken here is to focus on estimating the slope.
Let the concentration of the potential interferent in the high pool be denoted H, and let that of the low pool be L; then the midpool, being a 50-50 mixture of the low and high pools, will have concentrations (L+H)/2; the 25% pool, being a 50-50 mixture of the low and midpools, will have concentration (L+((L+H)/2))/2 = (3L+H)/4; the 75% pool, being a 50-50 mix of the mid- and high pools, will have concentration (H+((L+H)/2))/2 = (L+3H)/4. Denote these five concentrations of the potential interferent as Xi, i = 1, 2, 3, 4, 5: X1 = L, X2 = (3L+H)/4, X3 = (L+H)/2, X4 = (L+3H)/4, and X5 = H. Let the null hypothesis be the proposition that the slope (defined here as b) is equal to zero. Let alpha (α) be the probability (that the test is designed to have) of declaring the null to be false when it is actually true. In practice, α is usually set at 0.01, 0.05, or 0.10. Next define d such that if the slope were truly equal to d, the test would have a low probability of concluding the slope equals zero (i.e., a high probability of rejecting the null hypothesis). Let β be the probability of incorrectly accepting the null hypothesis when it in fact equals d. In practice, β is usually set at 0.01, 0.05, 0.10, or 0.20. It can be shown that the optimum number of replicates, n, is determined as follows:
( )
2
1.262
rep
x
Z Z Xn
H L
β σα
σ
⎡ ⎤⎛ ⎞+⎜ ⎟⎢ ⎥⎝ ⎠⎢ ⎥=−⎢ ⎥
⎢ ⎥⎣ ⎦
(F1)
where: σrep = estimate of repeatability standard deviation of the analyzer, assumed to be constant over the
range of interferent concentrations being considered σx = standard deviation of the concentrations of the potential interferent = (5/32) (H-L)2 where
H=Highest interferent concentration and L=Lowest interferent concentration Z[α/2] = α/2 fractiles of the standard unit normal distribution Z[β] = β fractile of the standard unit normal distribution NOTE: Documentation of the mathematical proof is on file at CLSI.
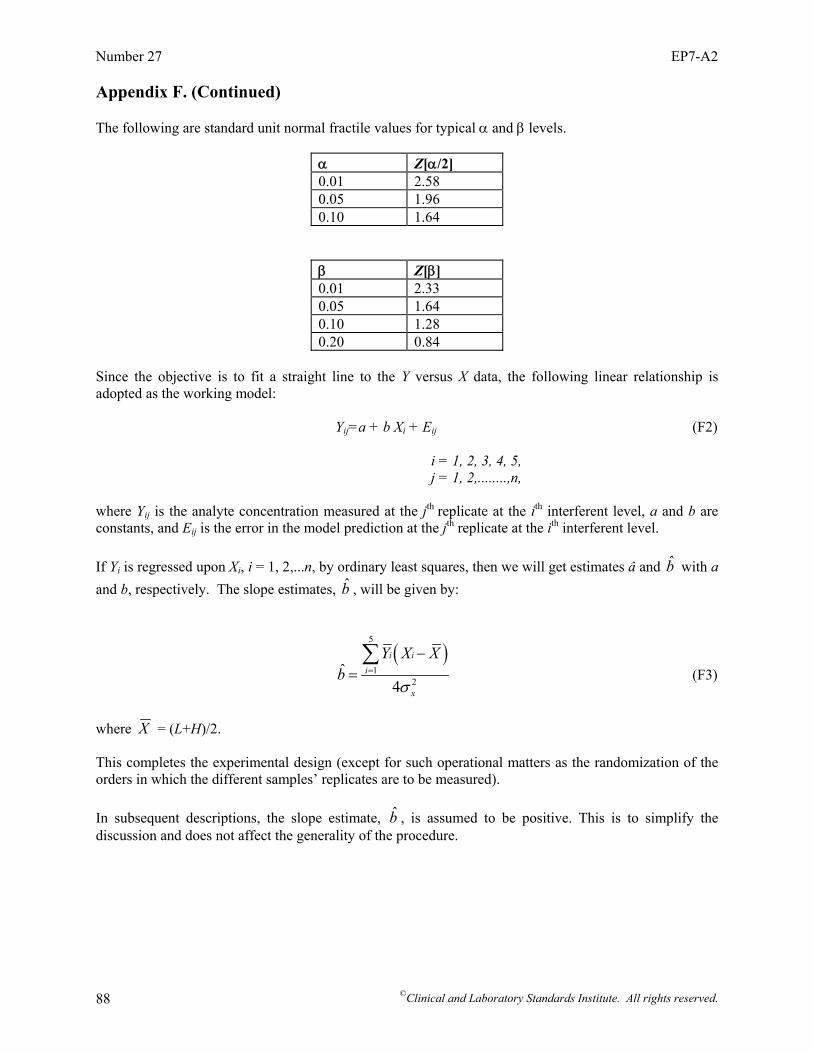
Number 27 EP7-A2
©Clinical and Laboratory Standards Institute. All rights reserved. 88
Appendix F. (Continued) The following are standard unit normal fractile values for typical α and β levels.
α Z[α/2] 0.01 2.58 0.05 1.96 0.10 1.64
β Z[β] 0.01 2.33 0.05 1.64 0.10 1.28 0.20 0.84
Since the objective is to fit a straight line to the Y versus X data, the following linear relationship is adopted as the working model: Yij=a + b Xi + Eij (F2) i = 1, 2, 3, 4, 5, j = 1, 2,........,n, where Yij is the analyte concentration measured at the jth replicate at the ith interferent level, a and b are constants, and Eij is the error in the model prediction at the jth replicate at the ith interferent level. If Yi is regressed upon Xi, i = 1, 2,...n, by ordinary least squares, then we will get estimates â and b with a and b, respectively. The slope estimates, b , will be given by:
( )
5
12
ˆ4
i ii
x
Y X Xb
σ=
−=
∑ (F3)
where X = (L+H)/2.
This completes the experimental design (except for such operational matters as the randomization of the orders in which the different samples’ replicates are to be measured).
In subsequent descriptions, the slope estimate, b , is assumed to be positive. This is to simplify the
discussion and does not affect the generality of the procedure.

Volume 25 EP7-A2
©Clinical and Laboratory Standards Institute. All rights reserved. 89
Appendix F. (Continued) F2. Doing the Statistical Test When we have selected a value of n that is consistent with (E1) and with the specified values for α, β, and ∗, then b* (the cutoff on b , for the test), can be computed as follows:
)(
2x
rep
2nσ
σ|2α/z|=*b (F4)
Using b* as the cutoff value for b , it is concluded, on the basis of this test, that the null hypothesis (which asserts that b = 0) is true if b , i, the magnitude of the regression-estimated slope, is less than or equal to b*, and we will declare that the null is false if b is greater than b*. If the null is not rejected, then, in reporting the results, it should be pointed out that the test was capable of detecting, with the probability of 1-β, a slope of magnitude ∗. If the null is rejected, then it should be pointed out that the probability that the null would have been erroneously declared to be false, when it is in fact true, is α. But this can be done only if the actual number of replicates for each of the test samples is equal to the planned value of n. In practice, some replicates may be omitted, lost, or eliminated as outlier observations. When this occurs, in principle, ordinary least squares should not be used to run the regression of iY on Xi. Instead, a weighted least squares analysis is more appropriate. (For details of weighted least squares, see Box, Hunter, and Hunter, Statistics for Experimenters: An Introduction to Design, Data Analysis, and Model Building. 2nd ed. London: Longman Group, Ltd; 1956:505-508). In practice, however, the nI’s will not usually differ by very much, from each other or from n, so the results of weighted regression will be very nearly the same as the results of ordinary, unweighted regression; to do weighted least squares would usually not be worth the trouble. Therefore, the slope estimate, b given by (E3) can still be used. It may be necessary to insert an approximately reasonable n (i.e., an n approximately equal to the average number of replicates actually taken in the experiment) into the expression (E4).

Number 27 EP7-A2
©Clinical and Laboratory Standards Institute. All rights reserved. 90
Appendix G. Preparation of Test Solutions for Interference Testing G1. Hemolysis: Osmotic Shock Procedure High Test Level: 500 mg/dL Hemoglobin Caution: Paired-difference testing cannot differentiate between interference effects of
hemoglobin and other constituents of red blood cells, such as K+, NH4+, LDH, AST, etc.
Stock Solution*: (1) Collect 5 mL heparinized blood. (2) Centrifuge ten minutes to pack cells. (3) Discard plasma and replace with 10 mL isotonic saline. (4) Invert tube slowly ten times. Centrifuge ten minutes and discard saline wash. Repeat wash with saline
twice again. (5) Dilute the cells with an equal volume of distilled water. Invert tube and mix well ten times. Freeze
overnight. (6) Thaw cells and bring to room temperature. (7) Centrifuge 30 minutes to remove the stroma. Save supernatant (hemolysate). Discard red cell debris
in pellet. (8) Analyze hemolysate to determine the hemoglobin concentration. Test Pool: Add measured volume of hemolysate to 10 mL serum to make 500 mg/dL hemoglobin. Control Pool: Add equivalent volume of saline to 10 mL of same serum pool. Determine actual
hemoglobin levels in the pools by analysis. Stability: Keep no more than one week at 4 °C. Longer storage may result in conversion to
methemoglobin, which may not have the same interference characteristics as hemoglobin. Reference: Meites S. Reproducibly simulating hemolysis for evaluating its interference with
chemical methods. Clin Chem. 1973;19:1319. G2. L-Ascorbic Acid High Test Level: 3 mg/dL Stock Solution: Prepare 300 mg/dL in cold (0 to 5 °C) water, deoxygenated previously by
nitrogen bubbling. Keep stock and serum solutions on ice before testing. Determine actual concentration spectrophotometrically (aM 15 000 1/mol-cm at 265 nm).
Test Sample: Add 0.1 mL to 10 mL serum. Minimize exposure to air.

Volume 25 EP7-A2
©Clinical and Laboratory Standards Institute. All rights reserved. 91
Appendix G. (Continued) Control Sample: Add 0.1 mL water to 10 mL serum. Stability: Stock and test solutions are unstable. Test all solutions within two hours after
preparation of original stock solution. Reference: Nealon D, PhD, Ortho-Clinical Diagnostics, Personal communication, 1995. G3. Free Fatty Acids High Test Level: 3 mmol/L total Test Materials: Palmitic acid, stearic acid, oleic acid Test Pool: Procedure involves transfer of free fatty acids (FFA) from particulate absorbent
(Celite) to serum. (1) Spread dried Celite evenly in beaker to thickness of 5 mm. (2) Add 1 mmol FFA dissolved in hexane per 10 g Celite. Particles should be completely immersed in
hexane. (3) Evaporate with gentle warming under N2 stream. (4) Transfer 200 mg/dL dried particles to screw-cap vial, mix thoroughly, and add 4 mL fresh human
plasma (EDTA anticoagulant). (5) Gently stir for 30 minutes (under N2 for unsaturated FFA). (6) Remove particles by decantation and centrifugation. (7) Adjust pH to match control pool with NaOH. (8) Determine exact amount by analysis. Expect 3 to 4 mmol/L. Control Pool: Repeat the above procedure with a portion of the same fresh human plasma but omitting
FFA from the hexane. Expect 0.5 to 0.8 mmol/L endogenous FFA. Determine exact amount by analysis.
Stability: Use fresh. Reference: Spector AA, Hoak JC. An improved method for the addition of long-chain fatty acid to
protein solutions. Anal Biochem. 1969;32:297-302. G4. Lipemia: Ultracentrifugation Procedure High Test Level: 3000 mg/dL triglycerides Test Material: Lipemic serum pool with triglyceride level 3000 mg/dL. Test Pool: Lipemic serum pool (untreated).
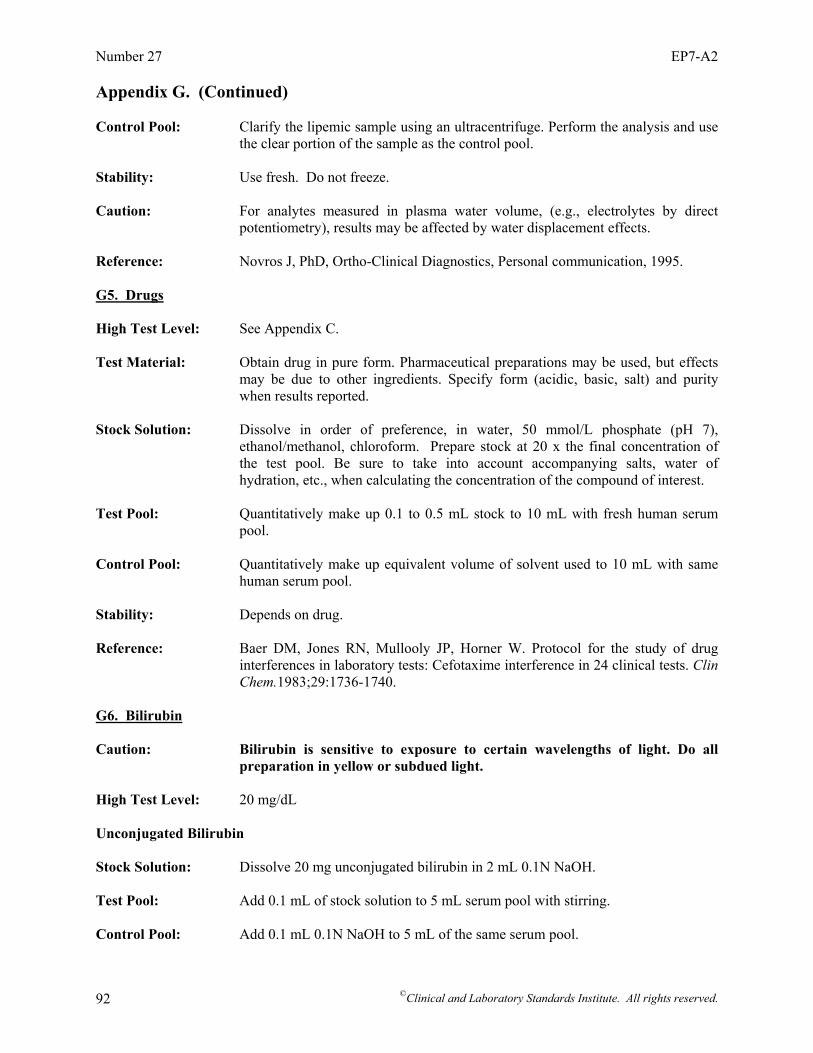
Number 27 EP7-A2
©Clinical and Laboratory Standards Institute. All rights reserved. 92
Appendix G. (Continued) Control Pool: Clarify the lipemic sample using an ultracentrifuge. Perform the analysis and use
the clear portion of the sample as the control pool. Stability: Use fresh. Do not freeze. Caution: For analytes measured in plasma water volume, (e.g., electrolytes by direct
potentiometry), results may be affected by water displacement effects. Reference: Novros J, PhD, Ortho-Clinical Diagnostics, Personal communication, 1995. G5. Drugs High Test Level: See Appendix C. Test Material: Obtain drug in pure form. Pharmaceutical preparations may be used, but effects
may be due to other ingredients. Specify form (acidic, basic, salt) and purity when results reported.
Stock Solution: Dissolve in order of preference, in water, 50 mmol/L phosphate (pH 7),
ethanol/methanol, chloroform. Prepare stock at 20 x the final concentration of the test pool. Be sure to take into account accompanying salts, water of hydration, etc., when calculating the concentration of the compound of interest.
Test Pool: Quantitatively make up 0.1 to 0.5 mL stock to 10 mL with fresh human serum
pool. Control Pool: Quantitatively make up equivalent volume of solvent used to 10 mL with same
human serum pool. Stability: Depends on drug. Reference: Baer DM, Jones RN, Mullooly JP, Horner W. Protocol for the study of drug
interferences in laboratory tests: Cefotaxime interference in 24 clinical tests. Clin Chem.1983;29:1736-1740.
G6. Bilirubin Caution: Bilirubin is sensitive to exposure to certain wavelengths of light. Do all
preparation in yellow or subdued light. High Test Level: 20 mg/dL Unconjugated Bilirubin Stock Solution: Dissolve 20 mg unconjugated bilirubin in 2 mL 0.1N NaOH. Test Pool: Add 0.1 mL of stock solution to 5 mL serum pool with stirring. Control Pool: Add 0.1 mL 0.1N NaOH to 5 mL of the same serum pool.
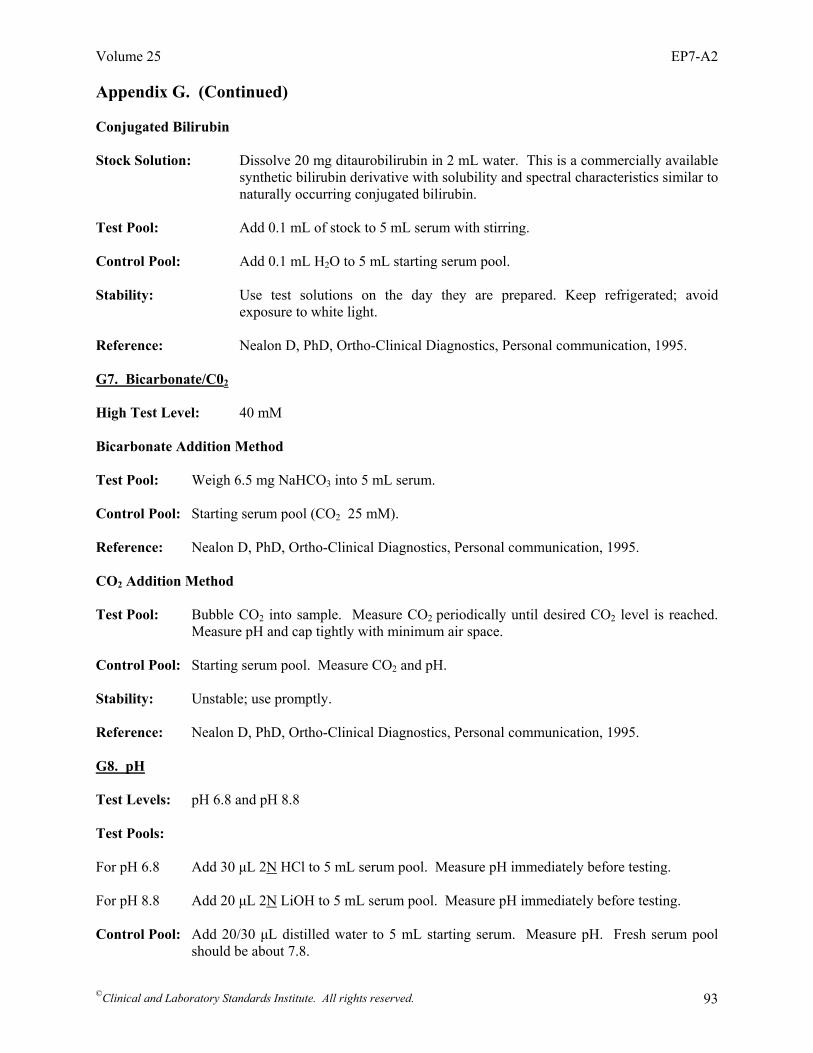
Volume 25 EP7-A2
©Clinical and Laboratory Standards Institute. All rights reserved. 93
Appendix G. (Continued) Conjugated Bilirubin Stock Solution: Dissolve 20 mg ditaurobilirubin in 2 mL water. This is a commercially available
synthetic bilirubin derivative with solubility and spectral characteristics similar to naturally occurring conjugated bilirubin.
Test Pool: Add 0.1 mL of stock to 5 mL serum with stirring. Control Pool: Add 0.1 mL H2O to 5 mL starting serum pool. Stability: Use test solutions on the day they are prepared. Keep refrigerated; avoid
exposure to white light. Reference: Nealon D, PhD, Ortho-Clinical Diagnostics, Personal communication, 1995. G7. Bicarbonate/C02 High Test Level: 40 mM Bicarbonate Addition Method Test Pool: Weigh 6.5 mg NaHCO3 into 5 mL serum. Control Pool: Starting serum pool (CO2 25 mM). Reference: Nealon D, PhD, Ortho-Clinical Diagnostics, Personal communication, 1995. CO2 Addition Method Test Pool: Bubble CO2 into sample. Measure CO2 periodically until desired CO2 level is reached.
Measure pH and cap tightly with minimum air space. Control Pool: Starting serum pool. Measure CO2 and pH. Stability: Unstable; use promptly. Reference: Nealon D, PhD, Ortho-Clinical Diagnostics, Personal communication, 1995. G8. pH Test Levels: pH 6.8 and pH 8.8 Test Pools: For pH 6.8 Add 30 µL 2N HCl to 5 mL serum pool. Measure pH immediately before testing. For pH 8.8 Add 20 µL 2N LiOH to 5 mL serum pool. Measure pH immediately before testing. Control Pool: Add 20/30 µL distilled water to 5 mL starting serum. Measure pH. Fresh serum pool
should be about 7.8.
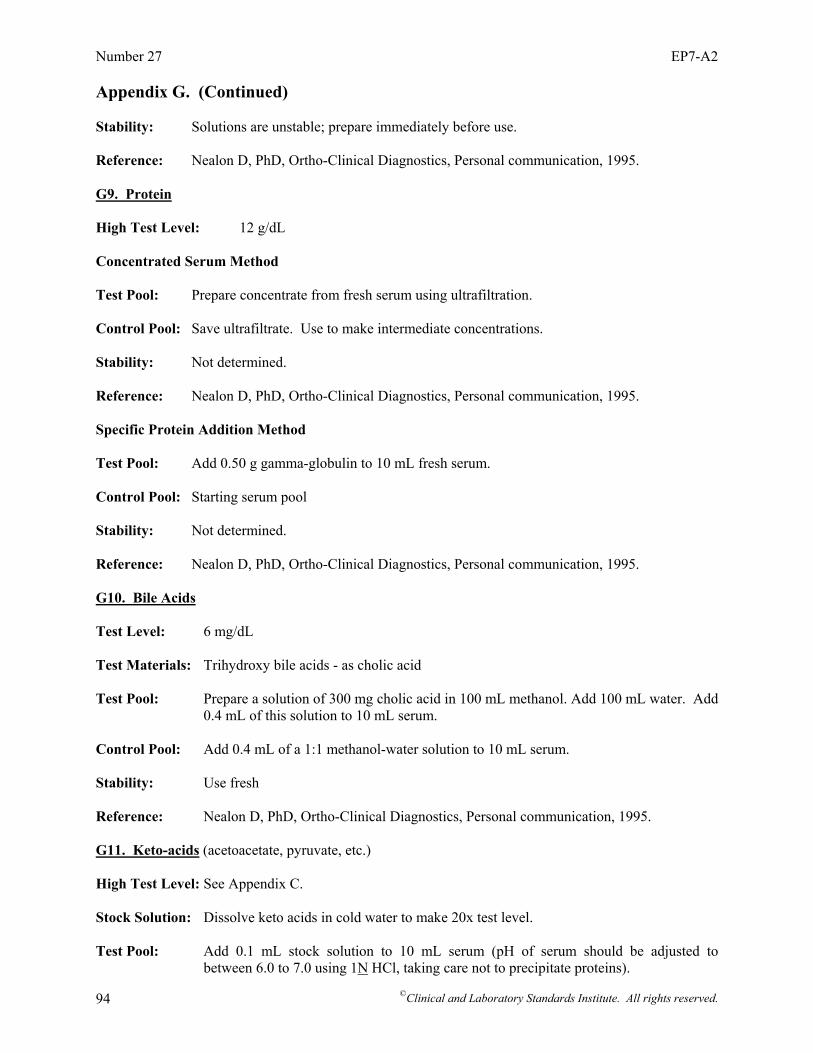
Number 27 EP7-A2
©Clinical and Laboratory Standards Institute. All rights reserved. 94
Appendix G. (Continued) Stability: Solutions are unstable; prepare immediately before use. Reference: Nealon D, PhD, Ortho-Clinical Diagnostics, Personal communication, 1995. G9. Protein High Test Level: 12 g/dL Concentrated Serum Method Test Pool: Prepare concentrate from fresh serum using ultrafiltration. Control Pool: Save ultrafiltrate. Use to make intermediate concentrations. Stability: Not determined. Reference: Nealon D, PhD, Ortho-Clinical Diagnostics, Personal communication, 1995. Specific Protein Addition Method Test Pool: Add 0.50 g gamma-globulin to 10 mL fresh serum. Control Pool: Starting serum pool Stability: Not determined. Reference: Nealon D, PhD, Ortho-Clinical Diagnostics, Personal communication, 1995. G10. Bile Acids Test Level: 6 mg/dL Test Materials: Trihydroxy bile acids - as cholic acid Test Pool: Prepare a solution of 300 mg cholic acid in 100 mL methanol. Add 100 mL water. Add
0.4 mL of this solution to 10 mL serum. Control Pool: Add 0.4 mL of a 1:1 methanol-water solution to 10 mL serum. Stability: Use fresh Reference: Nealon D, PhD, Ortho-Clinical Diagnostics, Personal communication, 1995. G11. Keto-acids (acetoacetate, pyruvate, etc.) High Test Level: See Appendix C. Stock Solution: Dissolve keto acids in cold water to make 20x test level. Test Pool: Add 0.1 mL stock solution to 10 mL serum (pH of serum should be adjusted to
between 6.0 to 7.0 using 1N HCl, taking care not to precipitate proteins).

Volume 25 EP7-A2
©Clinical and Laboratory Standards Institute. All rights reserved. 95
Appendix G. (Continued) Control Pool: Add 0.1 mL water to 10 mL starting serum. Stability: Unstable; prepare immediately before use. Reference: Nealon D, PhD, Ortho-Clinical Diagnostics, Personal communication, 1995.
Number 27 EP7-A2
©Clinical and Laboratory Standards Institute. All rights reserved. 96
Summary of Consensus Comments and Committee Responses EP7-A: Interference Testing in Clinical Chemistry; Approved Guideline Section 9.1.2, Specificity Claim (Formerly Section 8.1.2) 1. The form of the specificity claim for a manufacturer allows one to state “no interference,” provided that the
conditions of Section 8.1.1 are met. The information that the user gets is the concentration(s) at which the assay was tested; the concentration at which the interference was tested; and the point at which interference is considered significant. In the example, 10% is used as a level above which interference is considered significant. This is not enough information for the user, because:
(1) If several substances were tested in this way and reported not to interfere, they could nevertheless each
have interferences less than 10% so that their combined effect is greater than 10%. (2) A user might desire a different level at what is considered a significant problem (e.g., less than 5%). With
the way the results are presented, the user cannot determine if the 5% criteria were met. (3) In some countries, uncertainty intervals must be calculated. This requires knowing the effects of all biases.
The interference results are not reported in a way that allows the uncertainty intervals to be calculated.
• A recommendation has been added to Section 9.1.2 (formerly Section 8.1.2) stating: “The manufacturer should report, upon request, the observed bias found, the bias corresponding to the upper 95% confidence limit, the SD of the experiment, and the sample size.” The distribution of most interferents in the patient population is generally unknown, and assumptions would have to be made with inadequate information. For ubiquitous metabolites and very common drugs, it might be possible to estimate standard deviations of the net biases due to sample-specific factors, but interference from drugs that are only present in occasional patients has to be treated as a special cause of error.
Appendix C, Interferent Test Concentrations 2. EP7-P contains a listing for recommended serum/plasma test levels for endogenous substances (Appendix A on
pages 326-327). There is a more updated list for exogenous substances in EP7-A (Appendix C). Endogenous substances previously on the list in EP7-P do not appear in EP7-A. Are the levels for endogenous substances previously listed in EP7-P still relevant and can it be assumed that these levels remain unchanged?
• Parts II and III of Appendix A in EP7-P were inadvertently omitted in EP7-A. These tables are included
in Appendix C of EP7-A2. Appendix A, Guidelines for Specific Measurement Procedures (Formerly Guidelines for Specific Methodologies) 3. I have a question about the cross-reactivity calculation on page 43 in EP7-A. The calculation of cross-reactivity
is written as % Cross-reactivity = 100 (measured value – true value/concentration of interferent). However, I think, the (measured value – true value) should be divided by true value. This way, you are calculating the extent of cross-reactance of the substance in the assay at the tested concentration.
• The cross-reactivity is calculated by: % Cross-reactivity = 100 (measured value – true
value/concentration of interferent). The % interference is calculated by: % Interference = 100 (measured value – true value/true value). Calculations for both “cross-reactivity” and “% interference” are included in EP7-A2 as shown below:
measured value - true value% Cross-reactivity = 100* Concentration of interferent
⎛ ⎞⎜ ⎟⎝ ⎠
CLSI consensus procedures include an appeals process that is described in detail in Section 8 of the Administrative Procedures. For further information, contact CLSI or visit our website at www.clsi.org.
Volume 25 EP7-A2
©Clinical and Laboratory Standards Institute. All rights reserved. 97
measured value - true value% Interference = 100* true value
⎛ ⎞⎜ ⎟⎝ ⎠
Appendix B, Analyte Test Concentrations 4. We have a question regarding the hemoglobin level for interference testing for our glucose testing systems. The
low and high recommended hemoglobin serum/plasma test levels listed in Appendix B on page 45 of EP7-A are 10 and 20 g/dL. These levels would be consistent with levels found in whole blood samples. In Appendix A on page 326 of EP7-P, since a normal plasma level is around 2.5 mg/L (note unit differences), the recommended test level was 500 mg/dL. It is a huge jump from 500 mg/dL (reported in EP7-P) to 20 g/dL (reported in EP7-A). Was this change intentional?
• Hemoglobin test levels were reduced to 100 and 200 mg/dL to simulate hemolysis in EP7-A, and the
correct table entries in Appendix D should have been 1 and 2 g/L. The correct values (i.e., 1 g/L [10 g/dL] and 2 g/L [20 g/dL]) have been included in EP7-A2.
5. I am currently revising SOPs for interference testing and have a question. In EP7-A, it is recommended on page
47, that enzymes be tested at 2x and 10x the upper limit of the population reference ranges. So, we take the top of our reference interval for our enzyme methods and test vs. interferents at 2x and 10x that concentration. Why are enzymes tested above the reference interval as indicated?
• The committee recommended testing each analyte at two different concentrations (activities) because of
the possibility that positive and negative effects due to different causes could cancel each other. Since some enzymes are present in very low levels, the low test levels were set at 2x the upper limit of the population reference to allow inhibition effects to be observed. The high test level was set at 10x the upper limit of the population reference range to represent a high activity.
6. We are formulating our new procedures based on the new EP7-A and would like some clarifications. For
bilirubin interference—for conjugated bilirubin (ditaurobilirubin)—why are we using the same MW as the unconjugated bilirubin (584.67) as shown in Appendix B? The MW of ditaurate is 842.9.
• The following corrections have been made for conjugated bilirubin (ditaurobilirubin) in Appendix B: MW = 842.9; Low test concentration = 2.4 µmol/L; and High test concentration = 86 µmol/L.
7. Sometimes weighing 20 mg of ditaurobilirubin does not necessarily yield 20 mg of conjugated bilirubin
measured as “direct bilirubin.” • Direct bilirubin methods vary in their recovery of conjugated bilirubin. The concentration of the
ditaurobilirubin solution should be verified with an accurate total bilirubin method. Appendix B, Analyte Test Concentrations, and Appendix C, Interferent Test Concentrations 8. In examining the analyte and interferent test concentrations in Appendixes B and C, respectively, we noted a
discrepancy in the units reported for acetaminophen in Appendix C, and were wondering if you could clarify this for us. In Appendix B, the acetaminophen test concentrations (low and high) are reported as 33 to 199 µmol, whereas in Appendix C, they are reported as 0.03 to 0.20 µmol. It appears that the Appendix C entry is lower by a factor of 1000, and it appears that the units reported in the Appendix C entry should be millimolar rather than micromolar.
• The appropriate units are µmol/L. Values are corrected in Appendixes B and C. Appendix C, Interferent Test Concentrations 9. Please explain the differences in therapeutic and testing concentrations between CLSI/NCCLS guidelines EP7-P
and EP7-A. I am currently reviewing my company’s interferent testing list and am using EP7-A as a reference point. The testing concentrations for most drugs listed in EP7-A are significantly lower than those listed in EP7-
Number 27 EP7-A2
©Clinical and Laboratory Standards Institute. All rights reserved. 98
P. I have been told that quoting the new figures from EP7-A is not enough and I would have to provide a reason for the change.
• The recommended test concentrations in EP7-P set at 10x the highest expected concentration were based
on an earlier IFCC guideline. Experience showed that preparing concentrated solutions of many analytes was difficult if not impossible, and introduced unnecessary risk of artifacts. Based on comments received on EP7-P, the subcommittee decided that a 3x upper therapeutic range margin was sufficient to simulate worst case scenario for interference testing purposes.
10. I need clarification for the differences in therapeutic concentrations of drugs in Appendix C of the new
guidelines (EP7-A) and the old guidelines (EP7-P). In the previous documents, they are referenced as ‘mg/dL’ and the most recent documents reference these as mmol/L. When we convert these values to mg/dL and compare, they differ significantly; e.g., acetaminophen: EP7-P states the therapeutic concentration is 1 to 2 mg/dL and test concentration is 20 mg/dL. However in EP7-A, the therapeutic concentration for acetaminophen is 0.03 to 0.2 µmol/L and test concentration is 1.66 µmol/L. When these figures are converted to mg/dL, these differ to those in EP7-P, i.e., the test concentration of 1.66 µmol/L = 0.025 mg/dL which is significantly lower than the previous figure. There are also numerous other drugs which when comparing, there is a significant difference. It would be very helpful to us if the reasoning behind this difference could be clarified.
• Most of the inconsistencies were due to the use of different molecular weights for the drug substances,
which affected the conventional to SI conversions (e.g., EP7-P listed free base, USP listed HCl). All of the drug molecular weights in the current table have been verified against the USP or other sources.
11. I was reviewing the recommended test and therapeutic concentrations for common drugs in the table in
Appendix C. Interferent Test Concentrations on page 48 of EP7-A (2002, vol. 22 no. 27) document, I noticed that the Unit for Acetaminophen is listed as µmol/L, but the values for the test, therapeutic, and toxic concentrations appear to be in mmol/L. I consulted Tietz Textbook of Clinical Chemistry (1999) to confirm the correct concentrations. Tietz lists the therapeutic concentration in SI units as 66 to 199 µmol/L, and the toxic concentration is listed as greater than 1324 µmol/L. The correct reporting unit in SI for acetaminophen is µmol/L (as confirmed with our local hospital here in Ottawa, Ontario, Canada), and therefore the table in Appendix C on page 48 of the CLSI document should be revised as follows: For acetaminophen in units = µmol//L: test concentration = 1667; therapeutic concentrations = 33- 200; and toxic concentrations = 330-1667.
• The appropriate units are µmol/L. The values for acetaminophen in Appendix C: test concentration
(1324 µmol/L), therapeutic concentrations (66 to 200 µmol/L), and toxic concentration (>1324) are from the Tietz Textbook of Clinical Chemistry (1999).
12. What is the source of the information regarding the therapeutic and test concentrations of N-Acetylcysteine
(NAC) in Appendix C on page 48 of EP7-A? The test level of 16.6 mmol/L and therapeutic level of 5.52 mmol/L seem quite high compared to the values in the literature, which are in the µmol/L range for patients receiving NAC as a mucolytic agent. I would expect that levels of NAC are higher in patients receiving bolus and maintenance doses of NAC for an acetaminophen overdose, but I have a difficult time believing that the levels would be in the mmol/L range.
• Patients treated with N-acetylcysteine for acetaminophen poisoning have been shown to reach plasma
concentrations in the millimolar range. Randall Baselt (Disposition of Toxic Drugs and Chemicals in Man, 6th Edition. Foster City, CA: Biomedical Publications, 2002. ISBN 0-9626523-5-0) reported an average peak plasma value of 3.4 mmol/L immediately after the loading dose in a study of 17 patients. Since this is the “worst case” situation for emergency patients, the recommended test concentration has been set at 10.2 mmol/L. NOTE: Donald Young reports values up to 200 µmol/L (Values in healthy persons in SI Units. SI Units for Clinical Measurement. 1998:191).
13. Since N-acetylcysteine is quickly metabolized to cysteine, shouldn’t cysteine also be tested as an interferent? • N-acetylcysteine is metabolized to a number of compounds, including cysteine. The selection of
compounds to test as potential interferents is the responsibility of the evaluator (see Section 9 for guidelines).

Volume 25 EP7-A2
©Clinical and Laboratory Standards Institute. All rights reserved. 99
14. We are trying to use Appendix C concentrations listed in EP7-A to update our package inserts for cross-reactants and interferents. When we calculate the test concentration based on maximum dosage, why are we getting concentrations significantly higher than those listed in Appendix C? One example: Amitriptyline is dosed maximally at 300 mg/day which is 60 mg/L; times 3 would then give CLSI calculated test concentration of 180 000 ng/mL, but the Appendix lists 1000 ng/mL. Why is there a significant difference?
• It is not appropriate to use dosage to determine the levels to test for drug interference. Dosage may not
translate into serum/blood levels due to drug uptake kinetics, volume of distribution of the drug, half life, etc. It is recommended that the therapeutic range be the starting point to determine interference testing.
15. Is there a more recent appendix that is further updated with more recent tricyclic antidepressants or co-
administered compounds, as we have a number of other compounds that are not listed? • Specific recommendations will be considered at the next revision. 16. Where do you find your serum levels or toxic concentrations, as we are trying to find information on drugs of
abuse? • The information was taken from various sources, including textbooks, published reviews, scientific
literature, the manufacturer’s labeling, and recommendations of committee members, advisors, and consultants. It is intended only as a guide in selecting concentrations for interference testing and should not be used for any other purpose.
Appendix D, Interference Test Concentrations for Endogenous Analytes (Formerly Appendix C), and Appendix G, Preparation of Test Solutions for Interference Testing (Formerly Appendix F) 17. I have a question as to the recommended testing levels for bilirubin interference (both conjugated and
unconjugated). Bilirubin does not appear in Appendix C, as stated in the response to comment 71 in EP7-A. In Appendix F on page 78, directions are given for the preparation of interference testing solutions for bilirubin and the high-test level is indicated to be 20 mg/dL for both unconjugated and conjugated bilirubin. Should we make the assumption that 20 mg/dL is the recommended test level for both unconjugated and conjugated bilirubin?
• The recommended test level for both conjugated and unconjugated bilirubin is 342 µmol/L (20 mg/dL),
as shown in Appendix D. Appendix D, Interference Test Concentrations for Endogenous Analytes, and Appendix E, Worksheets (Formerly Appendix D) 18. Although Appendixes D and E are a great help, I would like to see more “worked out” examples. • Specific recommendations will be considered at the next revision. Appendix G, Preparation of Test Solutions for Interference Testing (Formerly Appendix F) 19. It is important that the actual interferent present in the “spiked” samples be quantitated to ensure that accurate
amounts of the “claimed” interferents are indeed present in the samples. • It is up to the manufacturer to justify that the test solutions are sufficiently accurate for interference
testing. Gravimetric preparation of most solutions should be sufficient when compounds are of known purity.
20. In Appendix F, Section F1, Hemolysis: if one is examining the effects of hemoglobin (hemolysate) on assays
such as Na+, K+, and Cl-, is there a way to correct for the concentration of these during the testing, or do you just accept those concentrations as part of the interference?
• Paired difference testing assumes the analyte concentration is not changed by the “spiked” sample. If the
analyte is added along with the test solution, paired difference testing is not appropriate. In such cases,

Number 27 EP7-A2
©Clinical and Laboratory Standards Institute. All rights reserved. 100
the amounts of analyte in the “spiked” sample and the control must be determined by a measurement procedure known not to be affected, such as a reference measurement procedure.
21. If one adds deionized water as part of the osmotic shock treatment of red cells, shouldn’t deionized water be
added to the control pool—not saline? This is especially in reference to assays for Na+ and Cl-. • The last step involves a 50:50 suspension of the red cells, so the final sodium and chloride concentrations
will be somewhere in between water and saline. However, saline will not compensate for the additional potassium or other red cell constituents. For analytes that are major constituents of red cells, lack of interference should be demonstrated by parallel analysis of naturally hemolyzed patient specimens by the measurement procedure being evaluated and a procedure known not to be affected, such as a reference procedure.
22. We’ve been using a MOPS/TRIS buffer (isotonic) to wash the cells instead of saline. Do you see any issues
with that? • The evaluator is responsible for providing scientific justification or validating any changes to the
procedure. 23. What is the typical concentration of hemoglobin following the protocol after centrifugation? • The hemoglobin concentration after centrifugation should be 90 to 110 g/L, according to Meites S.
(Reproducibly simulating hemolysis for evaluating its interference with chemical methods. Clin Chem. 1973;19:1319).
24. In EP7-P, it was indicated to be OK to freeze. • In Appendix G, Section G1, Hemolysis (formerly Appendix F1), freezing is an option, according to Meites
S. (Reproducibly simulating hemolysis for evaluating its interference with chemical methods. Clin Chem. 1973;19:1319).
25. In Appendix F4, Lipemia, what speed (rpm) is required for the ultracentrifugation method described? • Lipids can be cleared from serum by ultracentrifugation at ~200 000 to 600 000 g. The time needed to
centrifuge the lipids will depend on the centrifuge. Check with the manufacturer of the centrifuge for exact details.
26. In Appendix F6, Bilirubin (now Appendix G6), it indicates that the high test level is 20 mg/dL. However, it
indicates preparation of 20 mg/dL of unconjugated bilirubin and 20 mg/dL of conjugated bilirubin. Should testing be done with the unconjugated and conjugated species mixed (1:1 to provide 10 mg/dL of each species = 20 mg/dL t-Bili) or are these two separate test series each at 20 mg/dL?
• Testing should be done with separate solutions of conjugated and unconjugated bilirubin, both at
concentrations of 20 mg/dL. 27. Our system is very sensitive to pH. In the case of the unconjugated bilirubin, the final concentration of 2 mM
NaOH could pose a problem and cause variations. Any options? • Unconjugated bilirubin is soluble in chloroform (10 mg/mL), yielding a hazy solution. It is also soluble in
benzene, chlorobenzene, carbon disulfides, acids, and alkalies; slightly soluble in alcohol and ether; and practically insoluble in water. An appropriate control sample must be run to show that any effect is due to bilirubin and not to the solvent.
Volume 25 EP7-A2
©Clinical and Laboratory Standards Institute. All rights reserved. 101
Summary of Consensus/Delegate Comments and Committee Responses EP7-A2: Interference Testing in Clinical Chemistry; Approved Guideline—Second Edition General 1. EP7-A2 appears to be inconsistent with its use of terms. On page viii, it states “The terms specimen and sample
are both used in this document, with specimen reserved for actual patient materials, and sample reserved for processed materials (e.g., PT samples, reference materials).” Yet on many pages (e.g., page 37), “sample” is used in referring to both patient material and control material. Also, the use of the term “assay” instead of “analysis” or “test” throughout the document (e.g., pages 1, 3, and 14) does not appear appropriate in contrast to the great attention made to differentiate the terms method and measurement procedure.
• Text in the Foreword was revised to clarify the differences in meaning between the terms “specimen” and
“sample” and the terms were reviewed throughout the document to ensure accepted usage. The term assay has been replaced by method, measurement procedure, measurement, analyze, and analysis as appropriate. At this time, due to user unfamiliarity, the term examination is not used in this edition of EP7.
Foreword 2. What is IVD? • The last sentence of the first paragraph has been revised to include “in vitro diagnostic” before the
abbreviation (IVD). Section 4, Definitions 3. Add “Type I” as a synonym for “alpha error.” • As suggested, “Type I error” has been added as a synonym for “alpha (α) error” as noted: alpha (α)
error//Type I error. 4. Add “Type II” as a synonym for “beta error.” • As suggested, “Type II error” has been added as a synonym for “beta (β) error” as noted: beta (β)
error//Type II error. Section 5.1, Clinical Acceptability Criteria 5. Under “Clinical Acceptability Criteria,” one additional criterion used to evaluate the degree of allowable error
due to interference is that due to both analytical and physiological variability. Thus, I think that there should be another subsection titled “Criteria Based on Analytical and Physiological Variability.”
• This recommended revision will be considered during the next revision of this document. Section 5.5, Interferent Test Concentrations 6. Use of the phrase ‘worst case’: can a less colloquial phrase be located? • The phrase “worst case” is commonly used and understood by professionals in laboratories and
manufacturers, and the committee believes that this is the appropriate terminology as used in the document.

Number 27 EP7-A2
©Clinical and Laboratory Standards Institute. All rights reserved. 102
7. Define “short draw.” • For clarification, the sentence has been revised to read: “For serum, plasma, and whole blood, test at five
times the recommended additive concentration to simulate a “short draw” (i.e., partially filled blood collection tube).”
Appendix A, Guidelines for Specific Measurement Procedures 8. Equations (A1) and (A2): I think the original equation may be right for the basic concept of % cross-reactivity,
which measures the binding of the substance to the antibody. However, when we test interference in the clinical assay system, we are measuring not only binding of substances to the antibody, but also suppression of an indicator reaction, inhibit of the analyte, or any other cause of specimen-dependent bias as is written in the definition of “interference” in Section 4, Definitions. Therefore, I think the second equation may be more appropriate in the interference testing in the clinical assay.
• For clarity, Equation A2 has been changed to % interference. Appendix B, Analyte Test Concentrations 9. For blood lead, low level is too high. Should be 0.5 µmol/L if not lower (see CDC permitted exposure limits
for children). • The committee has reviewed the CDC recommendations and has revised the low test concentration values
for lead to 0.48 µmol/L (10 µg/dL) in Appendix B.

Volume 25 EP7-A2
©Clinical and Laboratory Standards Institute. All rights reserved. 103
NOTES
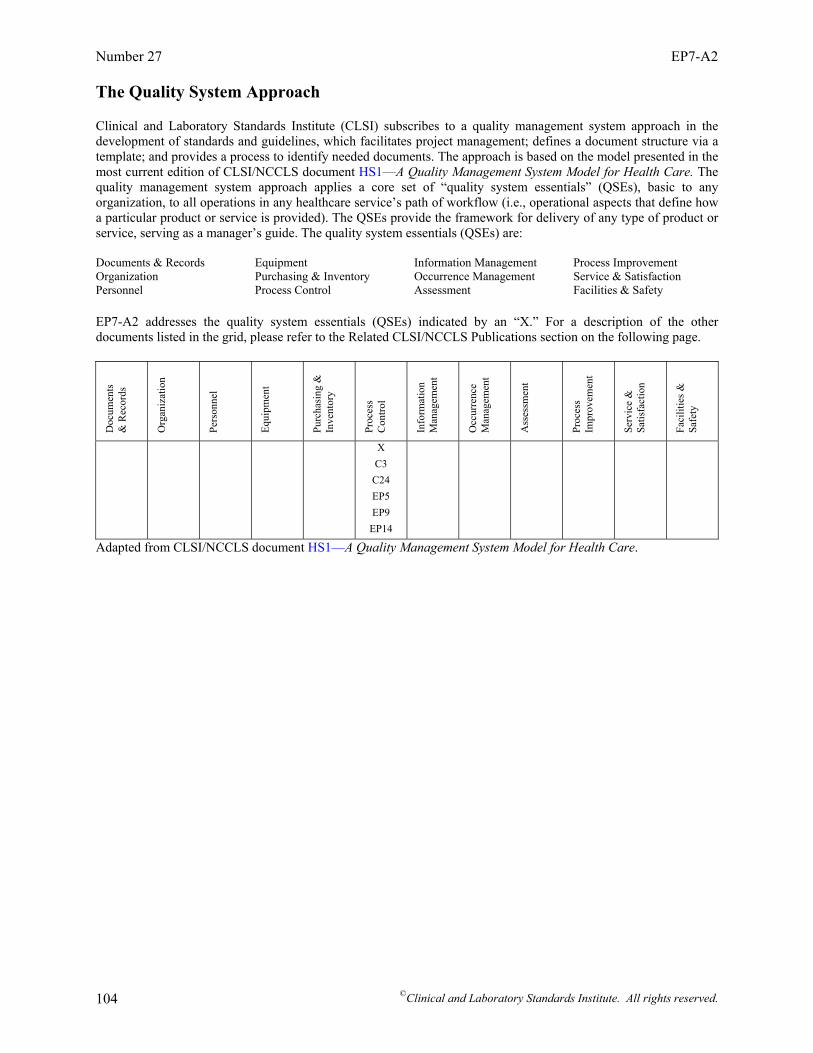
Number 27 EP7-A2
©Clinical and Laboratory Standards Institute. All rights reserved. 104
The Quality System Approach Clinical and Laboratory Standards Institute (CLSI) subscribes to a quality management system approach in the development of standards and guidelines, which facilitates project management; defines a document structure via a template; and provides a process to identify needed documents. The approach is based on the model presented in the most current edition of CLSI/NCCLS document HS1—A Quality Management System Model for Health Care. The quality management system approach applies a core set of “quality system essentials” (QSEs), basic to any organization, to all operations in any healthcare service’s path of workflow (i.e., operational aspects that define how a particular product or service is provided). The QSEs provide the framework for delivery of any type of product or service, serving as a manager’s guide. The quality system essentials (QSEs) are: Documents & Records Equipment Information Management Process Improvement Organization Purchasing & Inventory Occurrence Management Service & Satisfaction Personnel Process Control Assessment Facilities & Safety EP7-A2 addresses the quality system essentials (QSEs) indicated by an “X.” For a description of the other documents listed in the grid, please refer to the Related CLSI/NCCLS Publications section on the following page.
Doc
umen
ts
& R
ecor
ds
Org
aniz
atio
n
Pers
onne
l
Equi
pmen
t
Purc
hasi
ng &
In
vent
ory
Proc
ess
Con
trol
Info
rmat
ion
Man
agem
ent
Occ
urre
nce
Man
agem
ent
Ass
essm
ent
Proc
ess
Impr
ovem
ent
Serv
ice
&
Satis
fact
ion
Faci
litie
s &
Safe
ty
X C3
C24 EP5 EP9
EP14
Adapted from CLSI/NCCLS document HS1—A Quality Management System Model for Health Care.
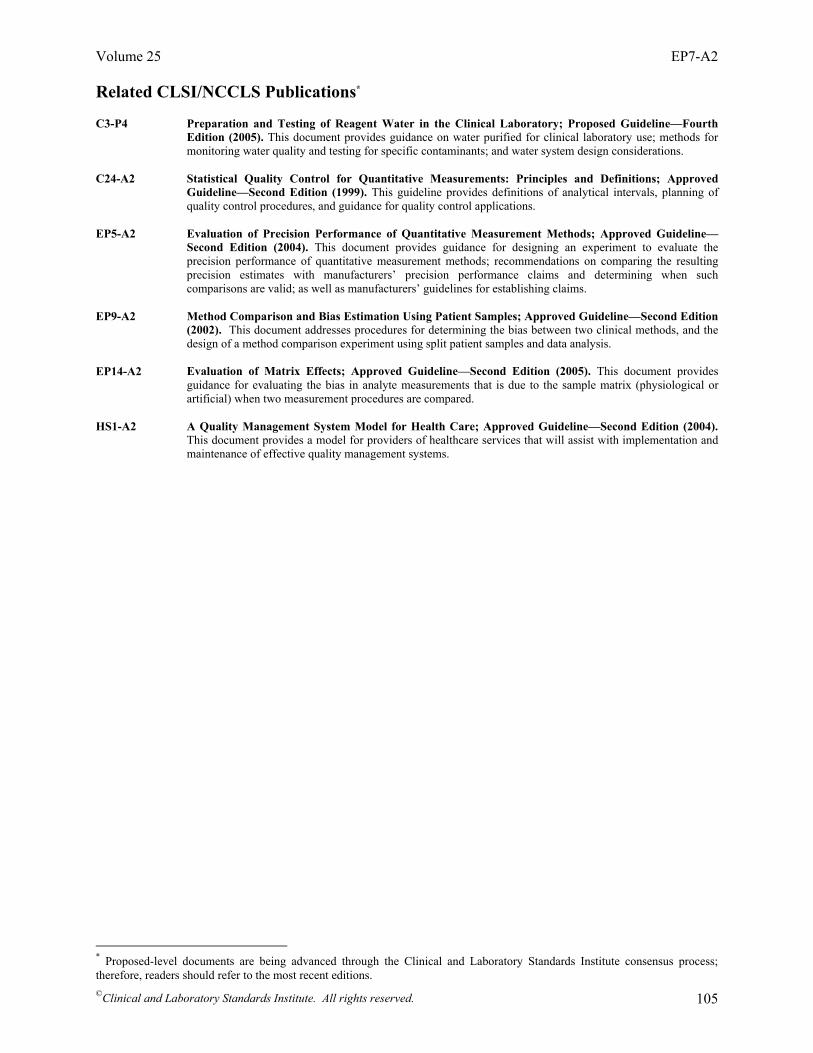
Volume 25 EP7-A2
©Clinical and Laboratory Standards Institute. All rights reserved. 105
Related CLSI/NCCLS Publications* C3-P4 Preparation and Testing of Reagent Water in the Clinical Laboratory; Proposed Guideline—Fourth
Edition (2005). This document provides guidance on water purified for clinical laboratory use; methods for monitoring water quality and testing for specific contaminants; and water system design considerations.
C24-A2 Statistical Quality Control for Quantitative Measurements: Principles and Definitions; Approved Guideline—Second Edition (1999). This guideline provides definitions of analytical intervals, planning of quality control procedures, and guidance for quality control applications.
EP5-A2 Evaluation of Precision Performance of Quantitative Measurement Methods; Approved Guideline—Second Edition (2004). This document provides guidance for designing an experiment to evaluate the precision performance of quantitative measurement methods; recommendations on comparing the resulting precision estimates with manufacturers’ precision performance claims and determining when such comparisons are valid; as well as manufacturers’ guidelines for establishing claims.
EP9-A2 Method Comparison and Bias Estimation Using Patient Samples; Approved Guideline—Second Edition
(2002). This document addresses procedures for determining the bias between two clinical methods, and the design of a method comparison experiment using split patient samples and data analysis.
EP14-A2 Evaluation of Matrix Effects; Approved Guideline—Second Edition (2005). This document provides
guidance for evaluating the bias in analyte measurements that is due to the sample matrix (physiological or artificial) when two measurement procedures are compared.
HS1-A2 A Quality Management System Model for Health Care; Approved Guideline—Second Edition (2004).
This document provides a model for providers of healthcare services that will assist with implementation and maintenance of effective quality management systems.
* Proposed-level documents are being advanced through the Clinical and Laboratory Standards Institute consensus process; therefore, readers should refer to the most recent editions.

Number 27 EP7-A2
©Clinical and Laboratory Standards Institute. All rights reserved. 106
NOTES

Volume 25 EP7-A2
©Clinical and Laboratory Standards Institute. All rights reserved. 107
NOTES
Active Membership (as of 1 October 2005)
Sustaining Members Abbott Laboratories American Association for Clinical Chemistry Bayer Corporation BD Beckman Coulter, Inc. bioMérieux, Inc. CLMA College of American Pathologists GlaxoSmithKline Ortho-Clinical Diagnostics, Inc. Pfizer Inc Roche Diagnostics, Inc. Professional Members American Academy of Family Physicians American Association for Clinical Chemistry American Association for Laboratory Accreditation American Association for Respiratory Care American Chemical Society American Medical Technologists American Society for Clinical Laboratory Science American Society for Microbiology American Society of Hematology American Type Culture Collection, Inc. Assn. of Public Health Laboratories Assoc. Micro. Clinici Italiani- A.M.C.L.I. British Society for Antimicrobial Chemotherapy Canadian Society for Medical Laboratory Science - Société Canadienne de Science de Laboratoire Médical Canadian Standards Association Clinical Laboratory Management Association COLA College of American Pathologists College of Medical Laboratory Technologists of Ontario College of Physicians and Surgeons of Saskatchewan ESCMID International Council for Standardization in Haematology International Federation of Biomedical Laboratory Science International Federation of Clinical Chemistry Italian Society of Clinical Biochemistry and Clinical Molecular Biology Japanese Committee for Clinical Laboratory Standards Joint Commission on Accreditation of Healthcare Organizations National Academy of Clinical Biochemistry National Association of Testing Authorities - Australia National Society for Histotechnology, Inc. Ontario Medical Association Quality Management Program-Laboratory Service RCPA Quality Assurance Programs PTY Limited Sociedad Espanola de Bioquimica Clinica y Patologia Molecular Sociedade Brasileira de Analises Clinicas Taiwanese Committee for Clinical Laboratory Standards (TCCLS) Turkish Society of Microbiology Government Members Armed Forces Institute of Pathology Association of Public Health Laboratories BC Centre for Disease Control Caribbean Epidemiology Centre Centers for Disease Control and Prevention Centers for Medicare & Medicaid Services Centers for Medicare & Medicaid Services/CLIA Program Chinese Committee for Clinical Laboratory Standards Commonwealth of Pennsylvania Bureau of Laboratories Department of Veterans Affairs
Deutsches Institut für Normung (DIN) FDA Center for Biologics Evaluation and Research FDA Center for Devices and Radiological Health FDA Center for Veterinary Medicine FDA Division of Anti-Infective Drug Products Iowa State Hygienic Laboratory Maryland Dept. of Health & Mental Hygiene Massachusetts Department of Public Health Laboratories National Center of Infectious and Parasitic Diseases (Bulgaria) National Health Laboratory Service (South Africa) National Institute of Standards and Technology National Pathology Accreditation Advisory Council (Australia) New York State Department of Health Ontario Ministry of Health Pennsylvania Dept. of Health Saskatchewan Health-Provincial Laboratory Scientific Institute of Public Health; Belgium Ministry of Social Affairs, Public Health and the Environment Industry Members AB Biodisk Abbott Diabetes Care Abbott Laboratories Acrometrix Corporation Advancis Pharmaceutical Corporation Affymetrix, Inc. Agilent Technologies, Inc. Ammirati Regulatory Consulting Anna Longwell, PC A/S ROSCO AstraZeneca Pharmaceuticals Axis-Shield POC AS Bayer Corporation - Elkhart, IN Bayer Corporation - Tarrytown, NY Bayer Corporation - West Haven, CT BD BD Diabetes Care BD Diagnostic Systems BD VACUTAINER Systems Beckman Coulter, Inc. Beckman Coulter K.K. (Japan) Bio-Development S.r.l. Bio-Inova Life Sciences International Biomedia Laboratories SDN BHD bioMérieux, Inc. (MO) Biometrology Consultants Bio-Rad Laboratories, Inc. Bio-Rad Laboratories, Inc. – France Bio-Rad Laboratories, Inc. – Plano, TX Black Coast Corporation – Health Care Systems Consulting Blaine Healthcare Associates, Inc. Bristol-Myers Squibb Company Cepheid Chen & Chen, LLC Chiron Corporation The Clinical Microbiology Institute Comprehensive Cytometric Consulting Copan Diagnostics Inc. Cosmetic Ingredient Review Cubist Pharmaceuticals Cumbre Inc. Dade Behring Inc. - Cupertino, CA Dade Behring Inc. - Deerfield, IL Dade Behring Inc. - Glasgow, DE Dade Behring Inc. - Marburg, Germany Dade Behring Inc. - Sacramento, CA David G. Rhoads Associates, Inc. Diagnostic Products Corporation Digene Corporation Eiken Chemical Company, Ltd. Elanco Animal Health Electa Lab s.r.l. Enterprise Analysis Corporation F. Hoffman-La Roche AG Gavron Group, Inc. Gen-Probe Genzyme Diagnostics GlaxoSmithKline Greiner Bio-One Inc. Immunicon Corporation Instrumentation Laboratory
International Technidyne Corporation I-STAT Corporation Johnson and Johnson Pharmaceutical Research and Development, L.L.C. K.C.J. Enterprises LabNow, Inc. LifeScan, Inc. (a Johnson & Johnson Company) Medical Device Consultants, Inc. Merck & Company, Inc. Micromyx, LLC National Pathology Accreditation Advisory Council (Australia) Nippon Becton Dickinson Co., Ltd. Nissui Pharmaceutical Co., Ltd. Novartis Institutes for Biomedical Research Olympus America, Inc. Optimer Pharmaceuticals, Inc. Ortho-Clinical Diagnostics, Inc. (Rochester, NY) Ortho-McNeil Pharmaceutical (Raritan, NJ) Oxoid Inc. Paratek Pharmaceuticals Pfizer Animal Health Pfizer Inc Powers Consulting Services Predicant Biosciences Procter & Gamble Pharmaceuticals, Inc. QSE Consulting Radiometer America, Inc. Radiometer Medical A/S Reliance Life Sciences Replidyne Roche Diagnostics GmbH Roche Diagnostics, Inc. Roche Diagnostics Shanghai Ltd. Roche Laboratories (Div. Hoffmann- La Roche Inc.) Roche Molecular Systems Sanofi Pasteur Sarstedt, Inc. Schering Corporation Schleicher & Schuell, Inc. SFBC Anapharm Sphere Medical Holding Streck Laboratories, Inc. SYN X Pharma Inc. Sysmex Corporation (Japan) Sysmex Corporation (Long Grove, IL) TheraDoc Theravance Inc. Thrombodyne, Inc. THYMED GmbH Transasia Engineers Trek Diagnostic Systems, Inc. Vicuron Pharmaceuticals Inc. Wyeth Research XDX, Inc. YD Consultant YD Diagnostics (Seoul, Korea) Trade Associations AdvaMed Japan Association of Clinical Reagents Industries (Tokyo, Japan) Associate Active Members 82 MDG/SGSCL (Sheppard AFB,TX) Academisch Ziekenhuis -VUB (Belgium) ACL Laboratories (WI) All Children’s Hospital (FL) Allegheny General Hospital (PA) Allina Health System (MN) American University of Beirut Medical Center (NY) Anne Arundel Medical Center (MD) Antwerp University Hospital (Belgium) Arkansas Department of Health Associated Regional & University Pathologists (UT) Atlantic Health System (NJ) AZ Sint-Jan (Belgium) Azienda Ospedale Di Lecco (Italy) Barnes-Jewish Hospital (MO) Baxter Regional Medical Center (AR) BayCare Health System (FL) Baystate Medical Center (MA) Bbaguas Duzen Laboratories (Turkey) BC Biomedical Laboratories (Surrey, BC, Canada) Bo Ali Hospital (Iran)
Bon Secours Hospital (Ireland) Brazosport Memorial Hospital (TX) Broward General Medical Center (FL) Cadham Provincial Laboratory (Winnipeg, MB, Canada) Calgary Laboratory Services (Calgary, AB, Canada) California Pacific Medical Center Cambridge Memorial Hospital (Cambridge, ON, Canada) Canterbury Health Laboratories (New Zealand) Cape Breton Healthcare Complex (Nova Scotia, Canada) Capital Health System Fuld Campus (NJ) Carilion Consolidated Laboratory (VA) Carolinas Medical Center (NC) Cathay General Hospital (Taiwan) Central Laboratory for Veterinarians (BC, Canada) Central Ohio Primary Care Physicians Central Texas Veterans Health Care System Centro Diagnostico Italiano (Milano, Italy) Chang Gung Memorial Hospital (Taiwan) Children’s Healthcare of Atlanta (GA) Children’s Hospital (NE) Children’s Hospital Central California Children’s Hospital & Clinics (MN) Childrens Hospital of Wisconsin Children’s Hospital Medical Center (Akron, OH) Chinese Association of Advanced Blood Bankers (Beijing) Christus St. John Hospital (TX) City of Hope National Medical Center (CA) Clarian Health - Methodist Hospital (IN) CLSI Laboratories (PA) Community College of Rhode Island Community Hospital of Lancaster (PA) Community Hospital of the Monterey Peninsula (CA) CompuNet Clinical Laboratories (OH) Covance Central Laboratory Services (IN) Creighton University Medical Center (NE) Detroit Health Department (MI) DFS/CLIA Certification (NC) Diagnostic Accreditation Program (Vancouver, BC, Canada) Diagnósticos da América S/A (Brazil) Dianon Systems (OK) Dr. Everett Chalmers Hospital (New Brunswick, Canada) Duke University Medical Center (NC) Dwight David Eisenhower Army Medical Center (GA) Emory University Hospital (GA) Enzo Clinical Labs (NY) Evangelical Community Hospital (PA) Faith Regional Health Services (NE) Florida Hospital East Orlando Focus Technologies (CA) Focus Technologies (VA) Foothills Hospital (Calgary, AB, Canada) Franciscan Shared Laboratory (WI) Fresno Community Hospital and Medical Center Gamma Dynacare Medical Laboratories (Ontario, Canada) Geisinger Medical Center (PA) General Health System (LA) Hagerstown Medical Laboratory (MD) Hamad Medical Corporation (Qatar) Harris Methodist Fort Worth (TX) Hartford Hospital (CT) Headwaters Health Authority (Alberta, Canada) Health Network Lab (PA) Health Partners Laboratories (VA) High Desert Health System (CA) Highlands Regional Medical Center (FL) Hoag Memorial Hospital Presbyterian (CA)
Holy Cross Hospital (MD) Hôpital Maisonneuve - Rosemont (Montreal, Canada) Hôpital Saint-Luc (Montreal, Quebec, Canada) Hospital Consolidated Laboratories (MI) Hospital de Sousa Martins (Portugal) Hospital for Sick Children (Toronto, ON, Canada) Hotel Dieu Grace Hospital (Windsor, ON, Canada) Humility of Mary Health Partners (OH) Hunter Area Health Service (Australia) Hunterdon Medical Center (NJ) Indiana University Innova Fairfax Hospital (VA) Institute of Medical and Veterinary Science (Australia) International Health Management Associates, Inc. (IL) Island Hospital (WA) Jackson Health System (FL) Jacobi Medical Center (NY) John H. Stroger, Jr. Hospital of Cook County (IL) Johns Hopkins Medical Institutions (MD) Kaiser Permanente (MD) Kantonsspital (Switzerland) Karolinska University Hospital King Abdulaziz Medical City � Jeddah (Saudi Arabia) King Faisal Specialist Hospital (Saudi Arabia) LabCorp (NC) Laboratoire de SantØ Publique du Quebec (Canada) Laboratorio Dr. Echevarne (Spain) Laboratório Fleury S/C Ltda. (Brazil) Laboratorio Manlab (Argentina) Laboratory Alliance of Central New York Laboratory Corporation of America (NJ) Lakeland Regional Medical Center (FL)Lawrence General Hospital (MA)Lewis-Gale Medical Center (VA) L’Hotel-Dieu de Quebec (Canada) Libero Instituto Univ. Campus BioMedico (Italy) Lindy Boggs Medical Center (LA) Loma Linda Mercantile (CA) Long Beach Memorial Medical Center (CA) Long Island Jewish Medical Center (NY) Los Angeles County Public Health Lab (CA) Maimonides Medical Center (NY)Martin Luther King/Drew Medical Center (CA)Massachusetts General Hospital (Microbiology Laboratory)MDS Metro Laboratory Services (Burnaby, BC, Canada)
Medical Centre Ljubljana (Slovinia)Medical College of Virginia Hospital Medical Research Laboratories International (KY) Medical University of South Carolina Memorial Medical Center (Napoleon Avenue, New Orleans, LA) Memorial Regional Hospital (FL) Methodist Hospital (Houston, TX) Methodist Hospital (San Antonio, TX) Mid America Clinical Laboratories (IN)Montreal Children�s Hospital (Canada) Montreal General Hospital (Canada) Mount Sinai Hospital (NY) National Healthcare Group (Singapore) National Serology Reference Laboratory (Australia) NB Department of Health & Wellness (New Brunswick, Canada) The Nebraska Medical Center Nevada Cancer Institute New Britain General Hospital (CT) New England Fertility Institute (CT) New York City Department of Health & Mental Hygiene New York University Medical Center NorDx (ME) North Carolina State Laboratory of Public Health North Central Medical Center (TX) North Coast Clinical Laboratory (OH) North Shore Hospital Laboratory (Auckland, New Zealand) North Shore - Long Island Jewish Health System Laboratories (NY) North Shore University Hospital (NY) Northern Plains Laboratory (ND) Northwestern Memorial Hospital (IL) Ochsner Clinic Foundation (LA) Onze Lieve Vrouw Ziekenhuis (Belgium) Orlando Regional Healthcare System (FL) Ospedali Riuniti (Italy) The Ottawa Hospital (Ottawa, ON, Canada) Our Lady of the Resurrection Medical Center (IL) Pathology and Cytology Laboratories, Inc. (KY) Pathology Associates Medical Laboratories (WA) Pathology Associates of Boone (NC) Penn State Hershey Medical Center (PA) Phoenix College (AZ) Piedmont Hospital (GA) Pitt County Memorial Hospital (NC)
Presbyterian Hospital of Dallas (TX) Providence Health Care (Vancouver, BC, Canada) Provincial Laboratory for Public Health (Edmonton, AB, Canada) Quest Diagnostics Incorporated (CA) Quintiles Laboratories, Ltd. (GA) Regional Health Authority Four (NB, Canada) Regions Hospital Rex Healthcare (NC) Rhode Island Department of Health Laboratories Robert Wood Johnson University Hospital (NJ) SAE � Laboratorio Medico (Brazil) Sahlgrenska Universitetssjukhuset (Sweden) St. Agnes Healthcare (MD) St. Anthony Hospital (CO) St. Anthony�s Hospital (FL) St. Barnabas Medical Center (NJ) St. Christopher�s Hospital for Children (PA) St-Eustache Hospital (Quebec, Canada) St. John Hospital and Medical Center (MI) St. John Regional Hospital (St. John, NB, Canada) St. John�s Hospital & Health Center (CA) St. Joseph�s Hospital � Marshfield Clinic (WI) St. Jude Children�s Research Hospital (TN) St. Mary Medical Center (CA) St. Mary of the Plains Hospital (TX) St. Michael�s Hospital (Toronto, ON, Canada) St. Vincent�s University Hospital (Ireland) Ste. Justine Hospital (Montreal, PQ, Canada) San Francisco General Hospital (CA) Santa Clara Valley Medical Center (CA) Shands at the University of Florida South Bend Medical Foundation (IN) South Western Area Pathology Service (Australia) Southern Maine Medical Center Specialty Laboratories, Inc. (CA) State of Connecticut Dept. of Public Health State of Washington Department of Health Stony Brook University Hospital (NY) Stormont-Vail Regional Medical Center (KS) Sun Health-Boswell Hospital (AZ) Sunnybrook Health Science Center (ON, Canada) Sunrise Hospital and Medical Center (NV)
Swedish Medical Center - Providence Campus (WA) Taiwan Society of Laboratory Medicine Tenet Odessa Regional Hospital (TX) The Children�s University Hospital (Ireland) The Permanente Medical Group (CA) Touro Infirmary (LA) Tri-Cities Laboratory (WA) Tripler Army Medical Center (HI) Truman Medical Center (MO) Tuen Mun Hospital (Hong Kong) UCLA Medical Center (CA) UCSF Medical Center (CA) UNC Hospitals (NC) Unidad de Patologia Clinica (Mexico) Union Clinical Laboratory (Taiwan) United Laboratories Company (Kuwait) Universita Campus Bio-Medico (Italy) University of Chicago Hospitals (IL) University of Colorado Hospital University of Debrecen Medical Health and Science Center (Hungary) University of Maryland Medical System University of Medicine & Dentistry, NJ University Hospital University of MN Medical Center - Fairview University of the Ryukyus (Japan) The University of the West Indies University of Virginia Medical Center University of Washington US LABS, Inc. (CA) USA MEDDAC-AK UZ-KUL Medical Center (Belgium) VA (Tuskegee) Medical Center (AL) Virginia Beach General Hospital (VA) Virginia Department of Health Washington Adventist Hospital (MD) Washington State Public Health Laboratory Washoe Medical Center Laboratory (NV) Wellstar Health Systems (GA) West China Second University Hospital, Sichuan University (P.R. China) West Jefferson Medical Center (LA) Wilford Hall Medical Center (TX) William Beaumont Army Medical Center (TX) William Beaumont Hospital (MI) Winn Army Community Hospital (GA) Winnipeg Regional Health Authority (Winnipeg, Canada) York Hospital (PA)
OFFICERS BOARD OF DIRECTORS
Thomas L. Hearn, PhD, President Centers for Disease Control and Prevention
Robert L. Habig, PhD, President Elect Abbott Laboratories
Wayne Brinster, Secretary BD
Gerald A. Hoeltge, MD, Treasurer The Cleveland Clinic Foundation
Donna M. Meyer, PhD, Immediate Past President CHRISTUS Health
Glen Fine, MS, MBA, Executive Vice President
Susan Blonshine, RRT, RPFT, FAARC TechEd
Maria Carballo Health Canada
Kurt H. Davis, FCSMLS, CAE Canadian Society for Medical Laboratory Science
Russel K. Enns, PhD Cepheid
Mary Lou Gantzer, PhD Dade Behring Inc.
Lillian J. Gill, DPA FDA Center for Devices and Radiological Health
J. Stephen Kroger, MD, MACP COLA
Jeannie Miller, RN, MPH Centers for Medicare & Medicaid Services
Gary L. Myers, PhD Centers for Disease Control and Prevention
Klaus E. Stinshoff, Dr.rer.nat. Digene (Switzerland) Sàrl
James A. Thomas ASTM International
Kiyoaki Watanabe, MD Keio University School of Medicine

™
(Formerly NCCLS) Providing NCCLS standards and guidelines,ISO/TC 212 standards, and ISO/TC 76 standards