J Clin Invest 2002 Mauvais-Jarvis
9
Introduction Insulin resistance is a major pathophysiologic feature of type 2 diabetes, obesity, polycystic ovarian disease, and the metabolic syndrome (1, 2). Unraveling the molecular determinants of insulin resistance is there- fore essential to understanding of the pathogenesis of these diseases and development of therapies for them. Over the past decade, evidence has accumulated indi- cating that class I A phosphoinositide (PI) 3-kinase plays a central role in the metabolic actions of insulin (3). Class I A PI 3-kinase is a heterodimer composed of cat- alytic and regulatory subunits. Most tissues express two forms of regulatory subunit, p85α and p85β, and two forms of catalytic subunit, p110α and p110β (3). p85α and p85β share the highest degree of homology in the C-terminal half of the molecules, which contains two SH2 domains that bind to tyrosine-phosphorylat- ed proteins and an inter-SH2 domain that interacts with the catalytic subunit. The N-terminal halves of p85α and p85β contain an SH3 domain, a BCR homol- ogy region, and two proline-rich domains, but these domains are less well conserved between the two mole- cules. Two isoforms of p85α truncated in the N-termi- nal region, identified as AS53 (or p55α) (4, 5) and p50α (6, 7), as well as p85α itself, are derived from a single gene (Pik3r1). p85β and another short isoform with limited tissue distribution termed p55γ/p55 PIK are encoded by separate genes (8). Insulin stimulation of PI 3-kinase activity involves docking of tyrosine-phosphorylated insulin receptor substrate (IRS) proteins to SH2 domains of the regula- tory subunit via pYXXM motifs. This increases the intracellular levels of PI(3,4)P 2 and PI(3,4,5)P 3 , which are presumed to act as second messengers of insulin actions (9). A large body of evidence in cultured cells indicates that PI 3-kinase is central to the metabolic effects of insulin on glucose transport (10–12), glycogen synthe- sis (13), hepatic glucose production (14, 15), and regu- lation of β cell function (16). Although it is known that changes in the regulatory subunits of PI 3-kinase are observed in animals with insulin resistance and diabetes (17, 18), suggesting that expression levels of the regula- tory subunits might modulate insulin sensitivity in vivo, the precise role of PI 3-kinase in glucose homeostasis in vivo is still poorly understood. To directly clarify the role of PI 3-kinase in vivo, knockout mice with several types of disruption of PI 3-kinase have been engineered. Of these, disruption of The Journal of Clinical Investigation | January 2002 | Volume 109 | Number 1 141 Reduced expression of the murine p85α subunit of phosphoinositide 3-kinase improves insulin signaling and ameliorates diabetes Franck Mauvais-Jarvis, 1 Kohjiro Ueki, 1 David A. Fruman, 2 Michael F. Hirshman, 1 Kei Sakamoto, 1 Laurie J. Goodyear, 1 Matteo Iannacone, 1 Domenico Accili, 3 Lewis C. Cantley, 2 and C. Ronald Kahn 1 1 Research Division, Joslin Diabetes Center and Department of Medicine, Harvard Medical School, Boston, Massachusetts, USA 2 Division of Signal Transduction, Beth Israel Deaconess Medical Center, Department of Cell Biology, Harvard Medical School, Boston, Massachusetts, USA 3 Diabetes Research Unit, Columbia University, New York, New York, USA Address correspondence to: C. Ronald Kahn, Research Division, Joslin Diabetes Center, One Joslin Place, Boston, Massachusetts 02215, USA. Phone: (617) 732-2635; Fax: (617) 732-2487; E-mail: [email protected]. Franck Mauvais-Jarvis and Kohjiro Ueki contributed equally to this work. Received for publication May 18, 2001, and accepted in revised form October 29, 2001. A critical component of insulin action is the enzyme phosphoinositide (PI) 3-kinase. The major reg- ulatory subunits of PI 3-kinase, p85α and its splice variants, are encoded by the Pik3r1 gene. Het- erozygous disruption of Pik3r1 improves insulin signaling and glucose homeostasis in normal mice and mice made insulin-resistant by heterozygous deletion of the Insulin receptor and/or insulin recep- tor substrate-1 (IRS1) genes. Reduced expression of p85 modulates the molecular balance between this protein, the p110 catalytic subunit of PI 3-kinase, and the IRS proteins. Thus, despite the decrease in p85α, PI 3-kinase activation is normal, insulin-stimulated Akt activity is increased, and glucose tolerance and insulin sensitivity are improved. Furthermore, Pik3r1 heterozygosity protects mice with genetic insulin resistance from developing diabetes. These data suggest that regulation of p85α lev- els may provide a novel therapeutic target for the treatment of type 2 diabetes. J. Clin. Invest. 109:141–149 (2002). DOI:10.1172/JCI200213305.
-
Upload
independent -
Category
Documents
-
view
1 -
download
0
Transcript of J Clin Invest 2002 Mauvais-Jarvis

IntroductionInsulin resistance is a major pathophysiologic featureof type 2 diabetes, obesity, polycystic ovarian disease,and the metabolic syndrome (1, 2). Unraveling themolecular determinants of insulin resistance is there-fore essential to understanding of the pathogenesis ofthese diseases and development of therapies for them.Over the past decade, evidence has accumulated indi-cating that class IA phosphoinositide (PI) 3-kinase playsa central role in the metabolic actions of insulin (3).Class IA PI 3-kinase is a heterodimer composed of cat-alytic and regulatory subunits. Most tissues expresstwo forms of regulatory subunit, p85α and p85β, andtwo forms of catalytic subunit, p110α and p110β (3).p85α and p85β share the highest degree of homologyin the C-terminal half of the molecules, which containstwo SH2 domains that bind to tyrosine-phosphorylat-ed proteins and an inter-SH2 domain that interactswith the catalytic subunit. The N-terminal halves ofp85α and p85β contain an SH3 domain, a BCR homol-ogy region, and two proline-rich domains, but thesedomains are less well conserved between the two mole-cules. Two isoforms of p85α truncated in the N-termi-nal region, identified as AS53 (or p55α) (4, 5) and p50α
(6, 7), as well as p85α itself, are derived from a singlegene (Pik3r1). p85β and another short isoform withlimited tissue distribution termed p55γ/p55PIK areencoded by separate genes (8).
Insulin stimulation of PI 3-kinase activity involvesdocking of tyrosine-phosphorylated insulin receptorsubstrate (IRS) proteins to SH2 domains of the regula-tory subunit via pYXXM motifs. This increases theintracellular levels of PI(3,4)P2 and PI(3,4,5)P3, which arepresumed to act as second messengers of insulin actions(9). A large body of evidence in cultured cells indicatesthat PI 3-kinase is central to the metabolic effects ofinsulin on glucose transport (10–12), glycogen synthe-sis (13), hepatic glucose production (14, 15), and regu-lation of β cell function (16). Although it is known thatchanges in the regulatory subunits of PI 3-kinase areobserved in animals with insulin resistance and diabetes(17, 18), suggesting that expression levels of the regula-tory subunits might modulate insulin sensitivity in vivo,the precise role of PI 3-kinase in glucose homeostasis invivo is still poorly understood.
To directly clarify the role of PI 3-kinase in vivo,knockout mice with several types of disruption of PI 3-kinase have been engineered. Of these, disruption of
The Journal of Clinical Investigation | January 2002 | Volume 109 | Number 1 141
Reduced expression of the murine p85α subunit of phosphoinositide 3-kinase improves insulin signaling and ameliorates diabetes
Franck Mauvais-Jarvis,1 Kohjiro Ueki,1 David A. Fruman,2 Michael F. Hirshman,1
Kei Sakamoto,1 Laurie J. Goodyear,1 Matteo Iannacone,1 Domenico Accili,3
Lewis C. Cantley,2 and C. Ronald Kahn1
1Research Division, Joslin Diabetes Center and Department of Medicine, Harvard Medical School, Boston, Massachusetts, USA
2Division of Signal Transduction, Beth Israel Deaconess Medical Center, Department of Cell Biology, Harvard Medical School, Boston, Massachusetts, USA
3Diabetes Research Unit, Columbia University, New York, New York, USA
Address correspondence to: C. Ronald Kahn, Research Division, Joslin Diabetes Center, One Joslin Place, Boston, Massachusetts 02215, USA. Phone: (617) 732-2635; Fax: (617) 732-2487; E-mail: [email protected].
Franck Mauvais-Jarvis and Kohjiro Ueki contributed equally to this work.
Received for publication May 18, 2001, and accepted in revised form October 29, 2001.
A critical component of insulin action is the enzyme phosphoinositide (PI) 3-kinase. The major reg-ulatory subunits of PI 3-kinase, p85α and its splice variants, are encoded by the Pik3r1 gene. Het-erozygous disruption of Pik3r1 improves insulin signaling and glucose homeostasis in normal miceand mice made insulin-resistant by heterozygous deletion of the Insulin receptor and/or insulin recep-tor substrate-1 (IRS1) genes. Reduced expression of p85 modulates the molecular balance betweenthis protein, the p110 catalytic subunit of PI 3-kinase, and the IRS proteins. Thus, despite the decreasein p85α, PI 3-kinase activation is normal, insulin-stimulated Akt activity is increased, and glucosetolerance and insulin sensitivity are improved. Furthermore, Pik3r1 heterozygosity protects mice withgenetic insulin resistance from developing diabetes. These data suggest that regulation of p85α lev-els may provide a novel therapeutic target for the treatment of type 2 diabetes.
J. Clin. Invest. 109:141–149 (2002). DOI:10.1172/JCI200213305.

p110α results in embryonic lethality, presumablythrough deficiency of PI 3-kinase signaling for normalgrowth, such that it is impossible to address the role ofPI 3-kinase in glucose homeostasis (19). Disrupting theregulatory subunits was also expected to result in animpaired PI 3-kinase signaling in insulin actions, sincethese subunits function as a bridge between the p110subunit and IRS proteins. Surprisingly, however, micecarrying a disruption of only the long form of p85α butstill expressing the alternatively spliced forms of thisgene, p55α and p50α, exhibit increased insulin sensi-tivity (20). This led to the suggestion that the improve-ment of insulin sensitivity was due to an increase in thep50α isoform, which seems to be a more potent medi-ator of PI 3-kinase–dependent signaling (20). On theother hand, homozygous disruption of all products ofthe Pik3r1 gene results in perinatal lethality, presum-ably via a marked reduction in PI 3-kinase signaling (21,22). Indeed, in the knockout mice, there is a significantdecrease in the p85-p110 dimer (21, 22) by the primaryreduction in the regulatory subunits and the secondaryreduction in the p110 catalytic subunits. The second-ary reduction is caused by a deficiency of the regulato-ry subunits to stabilize p110 (23). Although this indi-cates the indispensable role of the regulatory subunitsin normal development, with regard to glucose home-ostasis the homozygous knockout mice show hypo-
glycemia with decreased plasma insulin concentrations(22), suggesting that insulin signaling is preserved, atleast in part, despite the marked reduction of the p85-p110 dimer. Recent studies suggest that the regulatorysubunit plays a dual role in regulation of the p110 cat-alytic subunit of PI 3-kinase. Binding of p85 to p110stabilizes p110 but also maintains p110 in a low activi-ty state by an allosteric mechanism (23, 24). Associationof the SH2 domains of p85 with tyrosine-phosphory-lated IRS proteins recruits PI 3-kinase to the membraneand reduces the negative effect on the catalytic activity.Moreover, overexpression or pharmacological induc-tion of the p85α subunit inhibits insulin or IGF-1 sig-naling (24, 25), by both this allosteric effect and byincreasing the monomeric form of the regulatory sub-unit that can interfere with the p85-p110 heterodimerfor binding phosphorylated IRS proteins. These find-ings raise a possibility that a reduction in the regulato-ry subunits may reduce these inhibitory effects andenhance insulin signaling by affecting the balancebetween the regulatory subunits, catalytic subunits,and phosphorylated IRS proteins. This would be mostlikely if the regulatory subunits are more abundantthan the p110 subunits and IRS proteins.
To assess this possibility and better define the physio-logical role of the regulatory subunit, we have investi-gated the effects of heterozygous deletion of the Pik3r1gene on glucose homeostasis in normal mice as well asmice with insulin resistance by heterozygous deletion ofthe insulin receptor (IR) and/or IRS-1 (26). In this study,we demonstrate that reduction in all isoforms derivedfrom the Pik3r1 gene results in improved insulin signal-ing and glucose homeostasis and can prevent develop-ment of diabetes in mice with genetic insulin resistance.
MethodsCreation of mutant mice and PCR genotyping. Mice het-erozygous for the IR allele (IR+/–), double heterozygousfor the IR- and IRS-1–null alleles (IR/IRS-1+/–), and het-erozygous for the Pik3r1-null allele (p85+/–) wereobtained as previously described (21, 26). Double het-erozygous IR/p85+/– and triple heterozygous IR/IRS-1/p85+/– mice were generated by breeding the IR/IRS-1+/–
with the p85+/– mice. This yielded eight different geno-types with the expected mendelian frequency of 12.5%per genotype: wild-type, p85+/–, IR+/–, IR/p85+/–, IRS-1+/–,IRS-1/p85+/–, IR/IRS-1+/–, and IR/IRS-1/p85+/–. All micehad a mixed genetic background consisting of 129Svand C57BL/6. For all studies, we used the 6-month-oldmale mice of the same generation and mixed back-ground. Genotyping was performed by PCR usingDNA from tail biopsies of 3- to 4-week-old mice, as pre-viously described (21, 26). All animals were housed ona 12-hour light/dark cycle and were fed a standardrodent chow (Purina Mills Inc., St. Louis, Missouri,USA). All protocols for animal use and euthanasia wereapproved by the Animal Care Use Committee of theJoslin Diabetes Center and Harvard Medical School inaccordance with NIH guidelines.
142 The Journal of Clinical Investigation | January 2002 | Volume 109 | Number 1
Figure 1Creation of mutant mice. (a) Mice were bred and genotyped usingPCR. The presence of the IR mutant allele results in a 240-bp prod-uct, while there is no product in the wild-type (WT) allele. The pres-ence of the wild-type allele for the IRS-1 gene results in a 440-bpproduct; insertion of the neomycin cassette in the targeted alleleresults in a band of 1.25 kb. In the case of the Pik3r1 gene, themutant allele results in a band at 600 bp, whereas the wild-type alleleyields a 750-bp product. (b) Body weight of the various subgroupsof mice was determined at the indicated ages. Results are expressedas mean ± SEM (n = 12–30 mice per genotype).

Metabolic studies. For glucose tolerance testing (GTT),blood samples were obtained at 0, 15, 30, 60, and 120minutes after intraperitoneal injection of 2 g/kg dex-trose. For stimulated insulin secretion, blood wasobtained at 0, 2, 5, 15, and 30 minutes after intraperi-toneal injection of 3 g/kg of dextrose. For insulin andIGF-1 tolerance tests, blood samples were obtained at 0,30, 60, and 120 minutes after intraperitoneal injectionof 1 U/kg insulin (Lilly Research Laboratories, Indi-anapolis, Indiana, USA) or 1 mg/kg IGF-1 (PeprotechInc., Rocky Hill, New Jersey, USA). Whole blood glucosevalues were determined using an automatic glucosemonitor (One Touch II; Lifescan Inc., Milipitas, Cali-fornia, USA). Plasma insulin levels were measured byELISA using mouse insulin as a standard (Crystal ChemInc., Chicago, Illinois, USA). Triglyceride levels in serumfrom fasted animals were measured by a colorimetricenzyme assay using the GPO-Trinder Assay (SigmaDiagnostics Inc., St. Louis, Missouri, USA). FFA levelswere analyzed in serum from fasted animals using theNESCAUTO NEFA-Kit-U (Azwell Inc., Osaka, Japan).Plasma leptin levels were measured by ELISA usingmouse leptin as a standard (Crystal Chem).
In vivo insulin stimulation and analysis of insulin signaling.Six-month-old male mice were starved overnight, anes-
thetized with pentobarbital, and injected with 5 U ofregular human insulin (Lilly Research Laboratories)into the inferior vena cava. Liver and muscle wereremoved 5 minutes after injection and frozen in liquidnitrogen. Immunoprecipitation and Western blot analy-sis of insulin signaling molecules were performed on tis-sue homogenates as previously described (26).
Glucose transport in isolated muscles. Mice were food-restricted overnight before they were sacrificed, and thesoleus and extensor digitorum longus (EDL) muscleswere removed. Uptake of 2-deoxy-D-[1,2-3H]-glucosewas measured in the presence or absence of 2.2 nMinsulin, as previously described (27).
Antibodies and enzyme assays. Anti-p85α antibodies(αp85pan), which recognize all variants of p85α and(to a lesser extent) p85β, p85α-specific antibodies(αp85α), and anti-phosphotyrosine antibodies (4G10)were purchased from Upstate Biotechnology Inc. (LakePlacid, New York, USA). p85β-specific antibodies(αp85β) were generated as described (21). Anti-p55PIK
antibodies (αp55PIK) were kindly provided by MorrisWhite (Joslin Diabetes Center) (8). Anti–IRS-1 anti-bodies (αIRS-1) were generated against a glutathione-Stransferase–fusion (GST-fusion) protein correspondingto amino acids 859–1233 of mouse IRS-1. Anti–IRS-2
The Journal of Clinical Investigation | January 2002 | Volume 109 | Number 1 143
Figure 2Signaling molecules involved in activation of PI 3-kinase by insulin. (a) Expression levels of Pik3r1 gene products were determined in lysatesfrom liver (left) and skeletal muscle (right) by Western blotting with an anti-p85pan antibody (αp85pan). (b) Tyrosine phosphorylationof IRS proteins and association with p85 were determined using lysates from liver of the indicated animals. Proteins were immunoprecip-itated with anti–IRS-1 antibody (αIRS-1) (top two panels) or anti–IRS-2 antibody (αIRS-2) (bottom two panels), and blotted with anti-phosphotyrosine antibody (αPY) or αp85pan. (c) To determine the molecular balance between p85 and p110, the liver lysates were sub-jected to three sequential rounds of immunodepletion using αp110, followed by Western blotting with αp110 (left top panel) or αp85pan(left bottom panel). The amount of the p85-p110 dimer and the p85 monomer was expressed as the ratio to the value of the amount ofthe p85 monomer in the wild-type cells. In the graph, each bar represents the ratio to the total p85 in wild-type cells (open bar, p85-p110dimer; dotted bar, p85 monomer).

antibodies (αIRS-2) were generated against a GST-fusion protein corresponding to a plekstrin homologydomain of mouse IRS-2. Anti-p110α antibodies(αp110α) and anti-Akt antibodies (αAkt), which rec-ognize both Akt1 and Akt2, were purchased from SantaCruz Biotechnology Inc. (Santa Cruz, California, USA).Phosphospecific Akt (Ser473) antibodies (αp-Akt) werepurchased from New England Biolabs Inc. (Beverly,Massachusetts, USA).
PI 3-kinase activities in liver and muscle were deter-mined using immunoprecipitates in vitro as previous-ly described (28). Akt kinase activities were determinedin the basal state and after insulin stimulation inimmunoprecipitates with αAkt antibody usingCrosstide, a synthetic peptide (Gly-Arg-Pro-Arg-Thr-Ser-Ser-Phe-Ala-Glu-Gly), corresponding to the regionsurrounding in vivo phosphorylation site of glycogensynthase kinase 3 by Akt(29).
144 The Journal of Clinical Investigation | January 2002 | Volume 109 | Number 1
Figure 3PI 3-kinase activation in liver and muscle ofPik3r1 mutant mice. Lysates from the liverof animals were immunoprecipitated withthe indicated antibodies and subjected to aPI 3-kinase assay as described in Methods.PI 3-kinase activities associated with totalregulatory subunit (αp85pan) (a), associ-ated with p85α regulatory subunit (αp85α)(b), associated with the p110 catalytic sub-unit (αp110) (c), associated with tyrosine-phosphorylated proteins (αPY) (d), andassociated with p85β regulatory subunit(αp85β) (e) were assessed. The upper pan-els shows representative PI 3-kinase assays,while each bar in the lower panels repre-sents the mean ± SEM of the relative PI 3-kinase activity (% of unstimulated wild-type) calculated from at least three inde-pendent experiments. *P < 0.05, wild-typevs. p85+/–. (f) Activation of PI 3-kinase inmuscle. Lysates were immunoprecipitatedwith the p85pan antibody (αp85pan, toppanel), tyrosine-phosphorylated proteins(αPY, middle panel), or the p85β regulato-ry subunit (αp85β, bottom panel), andsubjected to PI 3-kinase assay as above.

ResultsGeneration and characterization of mutant mice. Mutantmice were generated as described in Methods and geno-typed as outlined in Figure 1a. The p85+/–, IR/p85+/–, andIR/IRS-1/p85+/– mice were born alive and were indistin-guishable from their controls. IR/IRS-1+/– and IR/IRS-1/p85+/– mice showed a stable 20% decrease in bodyweight compared with the other groups (Figure 1b),consistent with the mild growth retardation previouslyobserved after heterozygous disruption of the IRS-1gene (26). Immunoblotting revealed an approximately40% decrease in total p85 protein in both liver and mus-cle of p85+/– mice compared with their control group(39.3% ± 1.4% and 42.0% ± 3.6% in p85+/–, 35.4% ± 5.4%and 43.7% ± 13.1% in IR/p85+/–, and 40.9% ± 8.2% and40.2% ± 4.7% in IR/IRS-1/p85+/–; n = 3) (Figure 2a). Inaddition, there was an approximately 60% reduction inexpression of p50α in liver and AS53/p55α in musclefrom the three genotypes of mice carrying the heterozy-gous Pik3r1 allele (Figure 2a). The levels of p50α were41.1% ± 6.1% in p85+/–, 37.3% ± 1.8% in IR/p85+/–, and35.5% ± 5.6% in IR/IRS-1/p85+/– compared with theircontrols, and the levels of AS53 were 44.7% ± 4.8% inp85+/–, 39.1% ± 4.2% in IR/p85+/–, and 46.5% ± 4.1% inIR/IRS-1/p85+/– compared with their controls (n = 3). Asexpected, heterozygous deletion of IR or IRS-1 resultedin about 50% reduction of each of these proteins (data not shown).
Study of early insulin signaling. As previously reported(26), IRS-1 phosphorylation and IRS-1 binding to p85were reduced by about 50% in IR heterozygous miceand by 75–80% in the IR/IRS-1 double heterozygotes(Figure 2b). The levels of IRS-2 phosphorylation andbinding to p85 were also reduced by about 40% in IR+/–
mice, but were unchanged in IR/IRS-1+/– mice, proba-bly due to a compensatory increase in IRS-2 phospho-rylation (26). Heterozygosity for the Pik3r1 gene didnot appreciably affect the level of IR, IRS-1, or IRS-2phosphorylation (Figure 2b). Interestingly, despite thedecrease in p85α expression in mice heterozygous forthe Pik3r1 gene, the amount of p85 associated withphosphorylated IRS-1 and IRS-2 in livers of p85+/–,IR/p85+/–, and IR/IRS-1/p85+/– mice was unchangedcompared with controls (Figure 2b). This appears tobe due to the fact that in normal cells the p85 regula-tory subunits are more abundant than the phospho-rylated IRS proteins (24).
In normal cells in culture, the p85 regulatory sub-units are also more abundant than the p110 catalyticsubunits (24). To assess the balance between p85monomer and p85-p110 dimer in the tissues of themouse, we performed immunodepletion studies usinganti-p110 antibody and liver lysates (Figure 2c, left,top). Under these conditions, p85 protein remaining inthe lysates after immunodepletion represents the p85monomer, whereas the amount of p85 depleted corre-
The Journal of Clinical Investigation | January 2002 | Volume 109 | Number 1 145
Figure 4Insulin-stimulated Akt activity in Pik3r1 mutant mice. Lysates from liver and muscle were subjected to Western blotting with αp-Akt (toppanels). Akt activity was assessed following immunoprecipitation with an anti-Akt antibody in an immune complex kinase assay (bottompanels). The results are expressed as percent of unstimulated wild-type. Each bar represents the mean ± SEM of at least four independentexperiments. *P < 0.05, wild-type vs. p85+/– and IR/IRS-1+/– vs. IR/IRS-1/p85+/–.
sponds to the p85-p110 dimer. Using this approach,the ratio of p85-p110 dimer to p85 monomer in liver ofwild-type mice was about 2:1 (Figure 2c, left, bottom).By comparison, in the p85+/– mice, this ratio wasincreased to 4:1, due to a preferential reduction in p85monomer as compared with p85-p110 dimer. Similarresults were obtained in muscle, where the ratio of p85-p110 dimer to p85 monomer was 3:1 in wild-typemice and 5:1 in p85+/– mice (data not shown).
Insulin-dependent activation of PI 3-kinase and Akt in liverand muscle. The 50% reduction in products of Pik3r1 didnot result in a decrease in p85-associated PI 3-kinaseactivity. Thus, PI 3-kinase activity in liver detected byan anti-p85pan antibody, which recognizes p85α,p55α, p50α, and, to a lesser extent, p85β, or by an anti-p85α specific antibody, was comparable in mice of all
genotypes (Figure 3, a and b). Likewise, heterozygosityfor Pik3r1 had no effect on PI 3-kinase activity associ-ated with p110α, consistent with the findings that het-erozygosity for Pik3r1 does not reduce the amount ofp85-p110 dimer (Figure 3c). PI 3-kinase activity associ-ated with tyrosine-phosphorylated IRS proteins wasdecreased by 40% in IR+/– and by 50% in IR/IRS-1+/– micecompared with wild-type, but it was actually increasedto some extent by heterozygosity for Pik3r1 (Figure 3d).This is most likely due to the increased ratio of p85-p110 dimer to p85 monomer produced by heterozy-gous disruption of Pik3r1, since p85 monomer cancompete with p85-p110 dimer in binding to IRS pro-teins and inhibit PI 3-kinase–dependent signaling (24).In muscle, PI 3-kinase activity associated with anti-p85α and anti-phosphotyrosine (anti-PY) immuno-precipitates was not affected by the heterozygosity forPik3r1 (Figure 3f). By contrast, PI 3-kinase activity asso-ciated with p85β in liver was increased in the basal andinsulin-stimulated states by 15–100% in p85+/–,IR/p85+/–, and IR/IRS-1/p85+/– mice as compared withtheir controls (Figure 3e), while PI 3-kinase activityassociated with p85β in muscle showed no significantdifference between the different groups of animals(Figure 3f). PI 3-kinase activity associated with p55PIK
was very low and not stimulated by insulin in all groupsof animals in both liver and muscle.
Akt is a Ser/Thr kinase that is phosphorylated andactivated by PI 3-kinase upon insulin stimulation andis believed to mediate certain metabolic actions ofinsulin (30). In livers of wild-type mice, insulin induceda threefold increase in Akt phosphorylation and activi-ty. This was unchanged in IR+/– and reduced by about50% in IR/IRS-1+/– mice (Figure 4). Surprisingly, decreas-ing the expression of p85α and its splice variants led toan increase in Akt phosphorylation and activity in liversof p85+/– mice and IR/IRS-1/p85+/– mice (P < 0.05) ascompared with their controls (Figure 4). In muscle, theeffect of insulin on Akt was small, and no modificationof Akt activity or phosphorylation was detected by theheterozygous knockouts (Figure 4).
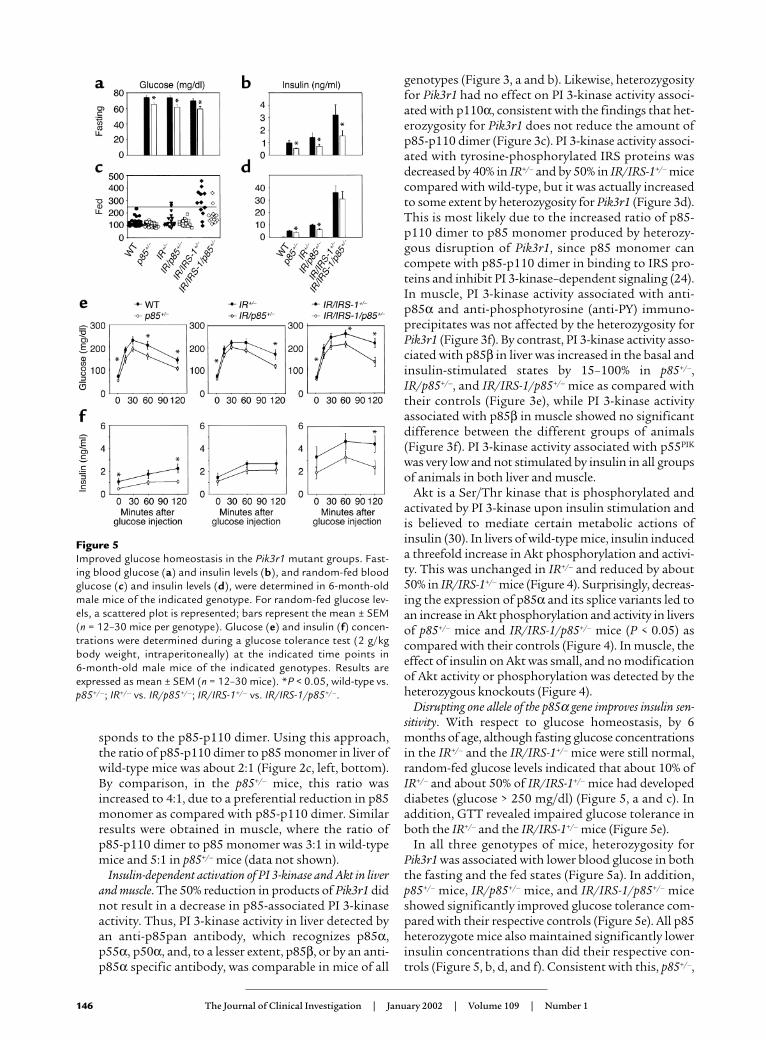
Disrupting one allele of the p85α gene improves insulin sen-sitivity. With respect to glucose homeostasis, by 6months of age, although fasting glucose concentrationsin the IR+/– and the IR/IRS-1+/– mice were still normal,random-fed glucose levels indicated that about 10% ofIR+/– and about 50% of IR/IRS-1+/– mice had developeddiabetes (glucose > 250 mg/dl) (Figure 5, a and c). Inaddition, GTT revealed impaired glucose tolerance inboth the IR+/– and the IR/IRS-1+/– mice (Figure 5e).
In all three genotypes of mice, heterozygosity forPik3r1 was associated with lower blood glucose in boththe fasting and the fed states (Figure 5a). In addition,p85+/– mice, IR/p85+/– mice, and IR/IRS-1/p85+/– miceshowed significantly improved glucose tolerance com-pared with their respective controls (Figure 5e). All p85heterozygote mice also maintained significantly lowerinsulin concentrations than did their respective con-trols (Figure 5, b, d, and f). Consistent with this, p85+/–,
146 The Journal of Clinical Investigation | January 2002 | Volume 109 | Number 1
Figure 5Improved glucose homeostasis in the Pik3r1 mutant groups. Fast-ing blood glucose (a) and insulin levels (b), and random-fed bloodglucose (c) and insulin levels (d), were determined in 6-month-oldmale mice of the indicated genotype. For random-fed glucose lev-els, a scattered plot is represented; bars represent the mean ± SEM(n = 12–30 mice per genotype). Glucose (e) and insulin (f) concen-trations were determined during a glucose tolerance test (2 g/kgbody weight, intraperitoneally) at the indicated time points in 6-month-old male mice of the indicated genotypes. Results areexpressed as mean ± SEM (n = 12–30 mice). *P < 0.05, wild-type vs.p85+/–; IR+/– vs. IR/p85+/–; IR/IRS-1+/– vs. IR/IRS-1/p85+/–.

IR/p85+/–, and IR/IRS-1/p85+/– mice showed improvedsensitivity to insulin injection as compared with theirrespective controls (Figure 6, a and b). Most impor-tantly, the incidence of diabetes in the IR/IRS-1/p85+/–
subgroup was reduced by half (Figure 5c). Althoughthe improved insulin sensitivity is present in severaltissues, the most important effect is probably at theliver. Glucose uptake in isolated soleus and EDL mus-cles was increased in the basal state, but not afterinsulin stimulation (Figure 6c). Likewise, heterozy-gosity of p85α did not affect either insulin secretionor islet size (data not shown).
In addition to the direct effects of the heterozygousdeletion of the Pik3r1 gene on insulin signaling, it ispossible that a reduction in the regulatory subunits mayaffect glucose metabolism in an indirect fashion, suchas alteration of lipid metabolism. However, as shown inTable 1, heterozygous disruption of the Pik3r1 gene did
not change either body weight or fat pad mass andresulted in a modest but significant increase in FFA,which is usually associated with increased rather thandecreased insulin resistance (31). Thus, it is unlikelythat these changes in lipid metabolism contribute toincreased insulin sensitivity in p85+/– mice.
Recently, a number of factors secreted fromadipocytes have been shown to affect insulin sensitivi-ty (32). Of these factors, leptin is best characterized,and its deficiency is known to lead to insulin resistancein some types of obese mice (33) and lipoatrophic mice(34). Again, there was no change in plasma leptin levelsby heterozygous deletion of the Pik3r1 gene that mightcontribute to increased insulin sensitivity (Table 1).
DiscussionPI 3-kinase activation is central to most of the meta-bolic actions of insulin (3). The major regulatory sub-units of PI 3-kinase in most cells are p85α and its alter-natively spliced isoforms AS53/p55α and p50αencoded by the Pik3r1 gene. In the present study, wehave shown that reducing the level of p85α, AS53, andp50α by heterozygous disruption of the Pik3r1 generesults in increased insulin sensitivity, lower fasting andpostprandial glucose levels, and a significant decreasein the incidence of diabetes related to geneticallyinduced insulin resistance in mice.
Recently, Terauchi et al. reported that selectivehomozygous disruption of the p85α full-length formof regulatory subunit results in hypoglycemia andincreased sensitivity to insulin (20). The authors suggested that this was a result of an isoform switchfrom p85α to p50α or AS53 in insulin-sensitive tissues and that p50α is more potent in activation of PI 3-kinase–dependent insulin signaling than is p85α.Since the expression levels of p85α, p50α, and AS53 areall reduced in the Pik3r1 knockout mouse, this mecha-nism cannot be responsible for the increased insulinsensitivity observed in the present study. Rather,changes in the molecular balance between p85 andp110 by heterozygous knockout of Pik3r1 appear toplay a key role in this phenomenon. Indeed, immun-odepletion studies reveal that in liver of wild-typemouse, 30% of p85 exits as a monomer that may com-pete with p85-p110 dimer in binding to phosphorylat-ed IRS proteins, thereby inhibiting PI 3-kinase–depend-ent signaling. Heterozygous disruption of Pik3r1
The Journal of Clinical Investigation | January 2002 | Volume 109 | Number 1 147
Figure 6Increased insulin sensitivity in the Pik3r1 mutant groups. (a) Insulintolerance tests (1 U/kg, intraperitoneally) and (b) IGF-1 tolerancetests (1 mg/kg, intraperitoneally) were performed on 6-month-oldmale mice of the indicated genotypes. Results represent the bloodglucose concentration as a percentage of the starting glucose valueand are expressed as mean ± SEM (n = 12–30 mice per genotype).*P < 0.05, wild-type vs. p85+/–; IR+/– vs. IR/p85+/–; IR/IRS-1+/– vs.IR/IRS-1/p85+/–. (c) Glucose transport activity in isolated skeletalmuscle of the Pik3r1 mutant mice was estimated using 2-deoxyglu-cose uptake in isolated EDL and soleus muscles as described inMethods. Results are expressed as mean ± SEM (n = 4). *P < 0.05,wild-type vs. p85+/–.
Table 1Characteristics of lipid metabolism in the Pik3r1+/– mice
Wild-type p85+/–
(n = 7–11) (n = 11–18)
Body weight (g) 37.7 ± 2.2 38.5 ± 1.1 NSPerigonadal fat (g) 1.59 ± 0.24 1.79 ± 0.18 NSTriglyceride (mg/dl) 141 ± 15 164 ± 11 NSFFA (meq/l) 1665 ± 189 2135 ± 111 P < 0.05Leptin (ng/ml) 9.4 ± 1.0 7.2 ± 1.5 NS
NS, not significant.

decreases p85 monomer with only slight reduction ofthe amount of p85-p110 dimer. As a consequence,p85+/– mice group exhibits PI 3-kinase activities almostequal to those of mice with normal levels of p85α.Thus, heterozygous disruption of Pik3r1 increases theratio of p85-p110 dimer to p85 monomer. This couldimprove insulin-induced PI 3-kinase signaling, depend-ing on the balance between p85 and phosphorylatedIRS proteins. For instance, if phosphorylated IRS pro-teins are less abundant than total p85 monomer andp85-p110 dimer in a p85+/– tissue, the increase in theratio of p85-p110 dimer to p85 monomer by heterozy-gous disruption of Pik3r1 could improve PI 3-kinasesignaling by increasing the amount of p85/p110/IRScomplexes. However, if phosphorylated IRS proteinsare more abundant than total p85 in wild-type, theincrease of the ratio by heterozygous disruption ofPik3r1 might not affect PI 3-kinase–dependent signal-ing, because all of the p85-p110 dimers can bind IRSproteins even in the wild-type.
Following insulin injection, the improvement of PI 3-kinase–dependent signaling in mice with a hetero-zygous disruption of Pik3r1 was confirmed by in-creased Akt activity, at least in wild-type and IR/IRS-1+/–
mice. Since under normal feeding conditions, phos-phorylation levels of IRS proteins should be muchlower than those caused by pharmacological insulininjection, the improvement of PI 3-kinase–dependentsignaling leading to improved insulin sensitivity wouldbe even more pronounced.
Heterozygous disruption of Pik3r1 also results in anincrease in the PI 3-kinase activity associated withp85β, at least in liver of the mouse, and this may alsocontribute to the increased insulin sensitivity. We (24)and others (23, 35) have shown that p85α inhibits thelipid kinase activity of the p110 catalytic subunit invitro. p85β appears to be less potent in this negativeregulation, as evidenced by the finding that in Pik3r1-null mice PI 3-kinase activity associated with p85βmaintains Akt activation, even though p85α is com-pletely absent and p110 is markedly decreased (22).
In addition, p85α may modulate PI 3-kinase–dependent signaling by effects that are independent ofits regulation of p110. For example, we find that incultured cells derived from p85+/– mice, PI(3,4,5)P3
production is increased and the levels more sustainedas compared with those in the wild-type cells, eventhough PI 3-kinase activity associated with phospho-tyrosine complexes is equal in these two cell types (36).This suggests that p85α protein may have some effectto modulate PI(3,4,5)P3 clearance independent of itseffect on PI 3-kinase activity (36). This could accountfor the 30% increase in Akt activity in livers of p85+/–
and IR/IRS-1/p85+/– mice, since Akt activity depends onPI(3,4,5)P3 levels. Similarly, Terauchi et al. demon-strated that disrupting the full-length p85α alone,results in an increased and sustained PI(3,4,5)P3 pro-duction, although PI 3-kinase activity associated withphosphotyrosine complex is markedly decreased (20).
While the effect of reducing p85α levels on insulinsensitivity is clear, it remains to be determined whichtissue is most important in this physiological response.In both isolated skeletal muscle (this study) and cul-tured brown adipocyte cell lines (K. Ueki et al., unpub-lished data), basal glucose uptake is increased in thep85+/– tissues as compared with controls, although nosignificant difference is observed in insulin-stimulatedglucose uptake. This could contribute to lower fastingglucose levels. Lower fasting glucose levels may alsoreflect increased sensitivity to insulin-induced sup-pression of hepatic glucose output, since the enzymephosphoenolpyruvate carboxykinase (PEPCK) is nega-tively regulated by insulin via a PI 3-kinase/Akt–medi-ated pathway (14, 15, 37), and increasing Akt activity inliver has been shown to lower glucose levels in insulin-resistant mice (28). Thus, insulin-induced inhibition ofhepatic glucose production seems to be important forwhole-body insulin sensitivity observed in p85+/– mice.However, in preliminary studies, we found no changein mRNA levels of PEPCK in the p85α heterozygousmice (data not shown). It is possible that any differ-ences in PEPCK are too small to be detected or that theincreased Akt activity in liver modifies other enzymesinvolved in hepatic glucose production, such as 6-phospho-fructose 2-kinase (38) and glycogen syn-thase kinase 3 (39). Further studies using cultured cellsheterozygous for the Pik3r1-null allele would help char-acterize these issues.
In summary, reducing the expression level of p85α by50% significantly improves insulin sensitivity and resultsin a decrease in the incidence of diabetes in mouse mod-els of insulin resistance. This appears to be due to animproved stoichiometry of the p85/p110/IRS complexand enhanced PI 3-kinase–dependent signaling. Thusp85α can play a dual role in insulin action mediating PI3-kinase activation by bridging IRS proteins and the cat-alytic p110 subunit, but it can also act as a competitiveinhibitor in PI 3-kinase signaling in its monomeric state.Pharmacological modulation of p85α expression ininsulin-sensitive tissues appears to be a novel strategy toimprove insulin sensitivity and may serve as a new ther-apeutic target in the treatment of type 2 diabetes.
AcknowledgmentsWe are grateful to Karrie E. Miller for excellent techni-cal assistance and Sandra Paquette for assistance inpreparing this manuscript. This work was supportedby NIH grants DK-33201 and DK-55545 to C.R. Kahnand GM-41890 to L.C. Cantley. D.A. Fruman was sup-ported by fellowships from Damon Runyon-WalterWinchell Cancer Research Fund and the LeukemiaSociety of America.
1. Kahn, C.R. 1994. Banting Lecture. Insulin action, diabetogenes, and thecause of type II diabetes. Diabetes. 43:1066–1084.
2. Dunaif, A. 1999. Insulin action in the polycystic ovary syndrome.Endocrinol. Metab. Clin. North Am. 28:341–359.
3. Shepherd, P.R., Withers, D.J., and Siddle, K. 1998. Phosphoinositide 3-kinase: the key switch mechanism in insulin signaling. Biochem. J.333:471–490.
148 The Journal of Clinical Investigation | January 2002 | Volume 109 | Number 1

4. Inukai, K., et al. 1996. A novel 55-kDa regulatory subunit for phos-phatidylinositol 3-kinase structurally similar to p55PIK is generated byalternative splicing of the p85a gene. J. Biol. Chem. 271:5317–5320.
5. Antonetti, D.A., Algenstaedt, P., and Kahn, C.R. 1996. Insulin receptorsubstrate 1 binds two novel splice variants of the regulatory subunit ofphosphatidylinositol 3-kinase in muscle and brain. Mol. Cell. Biol.16:2195–2203.
6. Fruman, D.A., Cantley, L.C., and Carpenter, C.L. 1996. Structural organ-ization and alternative splicing of the murine phosphoinositide 3-kinase p85a gene. Genomics. 37:113–121.
7. Inukai, K., et al. 1997. p85a gene generates three isoforms of regulato-ry subunit for phosphatidylinositol 3-kinase (PI 3-kinase), p50a, p55a,and p85a, with different PI 3-kinase activity elevating responses toinsulin. J. Biol. Chem. 272:7873–7882.
8. Pons, S., et al. 1995. The structure and function of p55PIK reveal a newregulatory subunit for phosphatidylinositol 3-kinase. Mol. Cell. Biol.15:4453–4465.
9. Rameh, L.E., and Cantley, L.C. 1999. The role of phosphoinositide 3-kinase lipid products in cell function. J. Biol. Chem. 274:8347–8350.
10. Hara, K., et al. 1994. 1-Phosphatidylinositol 3-kinase activity is requiredfor insulin-stimulated glucose transport but not for RAS activation inCHO cells. Proc. Natl. Acad. Sci. USA. 91:7415–7419.
11. Cheatham, B., et al. 1994. Phosphatidylinositol 3-kinase activation isrequired for insulin stimulation of pp70 S6 kinase, DNA synthesis, andglucose transporter translocation. Mol. Cell. Biol. 14:4902–4911.
12. Okada, T., Kawano, Y., Sakakibara, T., Hazeki, O., and Ui, M. 1994.Essential role of phosphatidylinositol 3-kinase in insulin-induced glu-cose transport and antilipolysis in rat adipocytes. Studies with a selec-tive inhibitor wortmannin. J. Biol. Chem. 269:3568–3573.
13. Cross, D.A., Alessi, D.R., Cohen, P., Andjelkovich, M., and Hemmings,B.A. 1995. Inhibition of glycogen synthase kinase-3 by insulin mediat-ed by protein kinase B. Nature. 378:785–789.
14. Gabbay, R.A., et al. 1996. Insulin regulation of phosphoenolpyruvatecarboxykinase gene expression does not require activation of theRas/mitogen-activated protein kinase signaling pathway. J. Biol. Chem.271:1890–1897.
15. Agati, J.M., Yeagley, D., and Quinn, P.G. 1998. Assessment of the rolesof mitogen-activated protein kinase, phosphatidylinositol 3-kinase,protein kinase B, and protein kinase C in insulin inhibition of cAMP-induced phosphoenolpyruvate carboxykinase gene transcription. J. Biol.Chem. 273:18751–18759.
16. Leibiger, I.B., Leibiger, B., Moede, T., and Berggren, P.O. 1998. Exocyto-sis of insulin promotes insulin gene transcription via the insulin recep-tor/PI-3 kinase/p70 s6 kinase and CaM kinase pathways. Mol. Cell.1:933–938.
17. Anai, M., et al. 1998. Altered expression levels and impaired steps in thepathway to phosphatidylinositol 3-kinase activation via insulin recep-tor substrates 1 and 2 in Zucker fatty rats. Diabetes. 47:13–23.
18. Kerouz, N.J., Horsch, D., Pons, S., and Kahn, C.R. 1997. Differential reg-ulation of insulin receptor substrates-1 and -2 (IRS-1 and IRS-2) andphosphatidylinositol 3-kinase isoforms in liver and muscle of the obesediabetic (ob/ob) mouse. J. Clin. Invest. 100:3164–3172.
19. Bi, L., Okabe, I., Bernard, D.J., Wynshaw-Boris, A., and Nussbaum, R.L.1999. Proliferative defect and embryonic lethality in mice homozygousfor a deletion in the p110alpha subunit of phosphoinositide 3-kinase.J. Biol. Chem. 274:10963–10968.
20. Terauchi, Y., et al. 1999. Increased insulin sensitivity and hypoglycaemiain mice lacking the p85a subunit of phosphoinositide 3-kinase.
Nat. Genet. 21:230–235.21. Fruman, D.A., et al. 1999. Impaired B cell development and prolifera-
tion in absence of phosphoinositide 3-kinase p85a. Science.283:393–397.
22. Fruman, D.A., et al. 2000. Hypoglycaemia, liver necrosis and perinataldeath in mice lacking all isoforms of phosphoinositide 3-kinase p85a.Nat. Genet. 26:379–382.
23. Yu, J., et al. 1998. Regulation of the p85/p110 phosphatidylinositol 3’-kinase: stabilization and inhibition of the p110alpha catalytic subunitby the p85 regulatory subunit. Mol. Cell. Biol. 18:1379–1387.
24. Ueki, K., Algenstaedt, P., Mauvais-Jarvis, F., and Kahn, C.R. 2000. Posi-tive and negative regulation of phosphoinositide 3-kinase-dependentsignaling pathways by three different gene products of the p85a regu-latory subunit. Mol. Cell. Biol. 20:8035–8046.
25. Giorgino, F., Pedrini, M.T., Matera, L., and Smith, R.J. 1997. Specificincrease in p85alpha expression in response to dexamethasone is asso-ciated with inhibition of insulin-like growth factor-I stimulated phos-phatidylinositol 3-kinase activity in cultured muscle cells. J. Biol. Chem.272:7455–7463.
26. Bruning, J.C., et al. 1997. Development of a novel polygenic model ofNIDDM in mice heterozygous for IR and IRS-1 null alleles. Cell.88:561–572.
27. Bruning, J.C., et al. 1998. A muscle-specific insulin receptor knockoutexhibits features of the metabolic syndrome of NIDDM without alter-ing glucose tolerance. Mol. Cell. 2:559–569.
28. Ueki, K., et al. 2000. Restored insulin-sensitivity in IRS-1-deficient micetreated by adenovirus-mediated gene therapy. J. Clin. Invest.105:1437–1445.
29. Ueki, K., et al. 1998. Potential role of protein kinase B in insulin-induced glucose transport, glycogen synthesis, and protein synthesis. J.Biol. Chem. 273:5315–5322.
30. Coffer, P.J., Jin, J., and Woodgett, J.R. 1998. Protein kinase B (c-Akt): amultifunctional mediator of phosphatidylinositol 3-kinase activation.Biochem. J. 335:1–13.
31. Boden, G. 1997. Role of fatty acids in the pathogenesis of insulin resist-ance and NIDDM. Diabetes. 46:3–10.
32. Flier, J.S. 2001. Diabetes. The missing link with obesity? Nature.409:292–293.
33. Zhang, Y., et al. 1994. Positional cloning of the mouse obese gene andits human homologue. Nature. 372:425–432.
34. Shimomura, I., Hammer, R.E., Ikemoto, S., Brown, M.S., and Goldstein,J.L. 1999. Leptin reverses insulin resistance and diabetes mellitus inmice with congenital lipodystrophy. Nature. 401:73–76.
35. Yu, J., Wjasow, C., and Backer, J.M. 1998. Regulation of thep85/p110alpha phosphatidylinositol 3’-kinase. Distinct roles for the n-terminal and c-terminal SH2 domains. J. Biol. Chem. 273:30199–30203.
36. Ueki, K., et al. 2001. Molecular balance between the regulatory and cat-alytic subunits of phosphoinositide 3-kinase regulates cell signalingand survival. Mol. Cell. Biol. In press.
37. Michael, M.D., et al. 2000. Loss of insulin signaling in hepatocytes leadsto severe insulin resistance and progressive hepatic dysfunction. Mol.Cell. 6:87–97.
38. Lefebvre, V., Mechin, M.C., Louckx, M.P., Rider, M.H., and Hue, L. 1996.Signaling pathway involved in the activation of heart 6-phosphofruc-to-2-kinase by insulin. J. Biol. Chem. 271:22289–22292.
39. Peak, M., Rochford, J.J., Borthwick, A.C., Yeaman, S.J., and Agius, L.1998. Signaling pathways involved in the stimulation of glycogen syn-thesis by insulin in rat hepatocytes. Diabetologia. 41:16–25.
The Journal of Clinical Investigation | January 2002 | Volume 109 | Number 1 149