RELATÓRIO ANUAL - IDB Invest
165
RELATÓRIO ANUAL
-
Upload
khangminh22 -
Category
Documents
-
view
0 -
download
0
Transcript of RELATÓRIO ANUAL - IDB Invest

RELATÓRIO ANUAL

GLOSSÁRIO
O Relatório Anual de 2020 da Corporação Interamericana de Investimentos, doravante denominada “BID Invest”, apresenta os resultados institucionais e operacionais do ano.
O BID Invest é um banco multilateral de desenvolvimento empenhado em promover o desenvolvimento econômico de seus países-membros da América Latina e do Caribe por meio do setor privado. Administramos uma carteira de US$ 16,1 bilhões em ativos relacionados ao desenvolvimento, abrangendo mais de 400 clientes. Trabalhamos em parceria com empresas de todos os setores estratégicos na América Latina e no Caribe (ALC), oferecendo-lhes acesso a recursos financeiros, bem como o nosso conhecimento técnico e a nossa experiência setorial. Trabalhamos em favor de empresas e de projetos sustentáveis para obter resultados financeiros melhores e maximizar o desenvolvimento econômico, social e ambiental na ALC.
Os dados operacionais apresentados neste documento baseiam-se na carteira combinada sem garantia soberana do Banco Interamericano de Desenvolvimento (BID) e do BID Invest, referidos em conjunto como Grupo do BID para os fins deste relatório anual. Os destaques, os resultados e as demonstrações financeiras no apêndice 1 referem-se apenas ao BID Invest.
Países pequenos e insulares
Bahamas, Barbados, Belize, República Dominicana, Guiana, Haiti, Jamaica, Suriname, e Trinidad e Tobago.
Programa de Facilitação do Financiamento do Comércio (PFFC) Lançado em 2015, o PFFC é uma solução eficaz, criada para apoiar o acesso de bancos da região aos mercados internacionais de financiamento do comércio, por meio de cooperação técnica, geração de conhecimento e produtos financeiros. Nos termos do PFFC, BID e BID Invest oferecem empréstimos de curto prazo a bancos locais, para financiamento de carteiras com títulos negociados aprovados, e garantias de crédito a bancos mundiais, para mitigar eventuais riscos associados a instrumentos de negociação emitidos por bancos na América Latina e no Caribe.
Proteção a crédito sem custeio
Nos termos desse programa (UCP na sigla em inglês), o BID Invest celebra acordos com seguradoras internacionais com rating A e superior, para cobertura do risco de não pagamento do principal nos termos do contrato de empréstimo.

Carta do PresidenteCarta do Gerente-GeralResposta do BID Invest à COVID-19 Nossa abordagem O Painel do Coronavírus Projetos de destaque na nossa resposta à COVID-19Setores estratégicos Infraestrutura Instituições financeiras EmpresasMedição e gestão de impactoSoluções financeiras Aumento da mobilização de recursos Financiamento combinado Financiamento institucional Soluções não financeiras Serviços de assessoria Parcerias público-privadasPaíses pequenos e insularesPromoção da diversidadeEstratégia para os clientesConhecimento e comunicaçãoGestão dos riscos não financeirosOperações em 2020Conquistas e prêmiosDestaques operacionaisSubstituição da LIBORGovernança institucional Mauricio J. Claver-Carone eleito Presidente do Banco Interamericano de Desenvolvimento Nossa missão Nossos países-membros Nosso mandato Assembleia de Governadores Diretoria Executiva Administração PessoalInformações de contato por paísApêndice Apêndice 1: Resultados e demonstrações financeiras Apêndice 2: Força-tarefa sobre Divulgações Financeiras Relacionadas ao Clima Apêndice 3: Implementação da Política de Acesso à Informação
123
4
56
7
89
1011121314151617
1819
579111319
21222832363940
44464748525358596061637175777980
8080818181
848485
87
89
95
abc
abc
a
bc
ab
a
bcdefgh
a
b
c
SUMÁRIO


RELATÓRIO ANUAL 2020
5
CARTA DO PRESIDENTE
MAURICIO CLAVER-CARONE
Presidente da Diretoria ExecutivaCorporação Interamericana de Investimentos (BID Invest)
Em conformidade com o disposto no Convênio Constitutivo da Corporação Interamericana de Investimentos, cuja marca é BID Invest, tenho o prazer de apresentar o Relatório Anual correspondente ao ano de 2020 e as demonstrações financeiras referentes aos exercícios encerrados em 31 de dezembro de 2020 e 2019.
Este relatório apresenta os resultados institucionais e operacionais de 2020, contendo um resumo das principais realizações do BID Invest e dos marcos importantes alcançados em 2020, um ano marcado pela devastação provocada pela pandemia da COVID-19.
A América Latina e o Caribe foram assolados desproporcionalmente pela COVID-19. Os especialistas preveem que a pandemia possa fazer a região retroceder 10 anos em termos econômicos e sociais. Uma recuperação forte, rápida e mais inclusiva exigirá um setor privado revitalizado, com empresas capazes de retomar a produção, gerar empregos e criar novas oportunidades por meio da inovação e de uma visão voltada para reconstruir melhor. Nos termos dos poderes ampliados de que está investido, o BID Invest está dotado de capacidade especial para ajudar as empresas da América Latina e Caribe a enfrentarem esse desafio crucial.
Logo após os primeiros casos do novo coronavírus na região, o BID Invest agiu rapidamente na preparação para a crise iminente. Com o apoio da Diretoria Executiva, o BID ampliou consideravelmente sua capacidade de financiamento e definiu metas ambiciosas a fim de mobilizar mais recursos de terceiros. Além disso, definiu
PARA: PRESIDENTE DA ASSEMBLEIA DE GOVERNADORES, CORPORAÇÃO INTERAMERICANA DE INVESTIMENTOS (BID INVEST), WASHINGTON, D.C.
Senhor Presidente,
um conjunto de critérios que cada nova operação teria que cumprir: aliviar os impactos da pandemia, proteger empresas essenciais e reanimar a atividade econômica. E, mesmo ao atuar de forma anticíclica, sem perder de vista sua sustentabilidade financeira de longo prazo.
Os resultados no fim do exercício mostram que o BID Invest superou suas metas, tendo vencido desafios sem precedentes. Os compromissos totalizaram US$ 6,2 bilhões, enquanto a mobilização básica atingiu US$ 2,3 bilhões. A instituição fechou 2020 com uma carteira combinada de US$ 16,1 bilhões em ativos de desenvolvimento sob gestão. Mais uma vez, o BID Invest tornou a provar por que é o parceiro multilateral preferencial do setor privado da ALC.
Como novo presidente do BID e presidente da Diretoria Executiva do BID Invest e da Comissão de Contribuintes do BID Lab, estou empenhado em fortalecer a capacidade do Grupo do BID para promover o desenvolvimento por meio do setor privado, prestes a tornar-se o motor da recuperação na América Latina e no Caribe. Trabalhando em conjunto com nossos clientes e parceiros, ajudaremos a região a emergir mais forte e realizar seu potencial de prosperidade, cumprindo nossa missão fundamental de melhorar a vida das pessoas.
Atenciosamente,


RELATÓRIO ANUAL 2020
7
Durante 2020, a América Latina e o Caribe estiveram no epicentro da crise mundial provocada pela pandemia da COVID-19. Além da devastação em termos do número de óbitos e de meios de subsistência perdidos, nenhuma outra região do mundo sofreu uma queda tão acentuada do PIB, um retrocesso que ameaça eliminar os ganhos sociais e econômicos que a América Latina e o Caribe haviam obtido ao longo dos 10 anos anteriores.
Como instituição de desenvolvimento, o Grupo do BID precisa ajudar seus países-membros mutuários a evitar mais uma década perdida. Em um momento em que os governos lutam contra a pandemia e operam com restrições fiscais, o setor privado terá que cumprir um papel de liderança na condução da retomada. O desafio à frente é enorme, mas o BID Invest está pronto a fazer sua parte no trabalho com as empresas da América Latina e do Caribe, visando a uma reconstrução melhor e obtenção de resultados econômicos, sociais e ambientais excepcionais.Este relatório apresenta como o BID Invest respondeu a essa emergência sem precedentes e como planeja trabalhar visando o futuro. Os resultados do ano passado devem proporcionar aos países membros a plena confiança de que a instituição que eles renovaram e fortaleceram há cinco anos para impulsionar o desenvolvimento por meio do setor privado está cumprindo as expectativas.
S u p e ra m o s to d a s a s n o s s a s m e t a s . Quadruplicamos o financiamento de longo prazo, de US$ 834 milhões em 2016 para US$ 3,5 bilhões em 2020. Mais do que dobramos nosso financiamento de curto prazo e atingimos uma carteira de US$ 16,1 bilhões em ativos relacionados ao desenvolvimento. Além disso, conseguimos triplicar nossos esforços de mobilização direta, passando de US$ 861 milhões em 2016 para US$ 2,3 bilhões em 2020. Para consolidarmos a característica contínua de valor agregado, acima do financiamento puro, mantivemos nosso compromisso de apoio a projetos com alto nível de impacto sobre o desenvolvimento e forte teor de intervenção positiva adicional. À medida que a vacinação avança pelo mundo, um novo cenário está surgindo. A perspectiva de recuperação nos permitirá concentrar-nos em acelerar o desenvolvimento por meio do setor privado.
CARTA DO GERENTE-GERAL
Sob a liderança do novo presidente do Banco Interamericano de Desenvolvimento e presidente ex officio de nossa Diretoria Executiva, ajustamos nosso programa operacional para refletir as prioridades da nova administração, em total alinhamento com a estratégia institucional do Grupo do BID. Continuamos empenhados em ser o parceiro preferencial do setor privado da ALC.
Com o desenrolar da pandemia, o BID Invest contou com o apoio de sua Diretoria Executiva, em abril passado, para lançar uma resposta à crise causada pela COVID-19, pautada em dois critérios amplos: proteger e aliviar, e ainda ajudar a iniciar a recuperação.
Entre as medidas, destaca-se o aumento da capacidade de financiamento do BID Invest, de US$ 4,5 bilhões para até US$ 7 bilhões, a fim de apoiar clientes novos e já existentes, com ênfase em aliviar as restrições de saúde, manter empregos, restabelecer as cadeias que alimentam o comércio e sustentar fontes de renda, sobretudo para as micro, pequenas e médias empresas. Além disso, foi criada uma Linha de Crédito para Mitigação da Crise (CMF, na sigla em inglês) de US$ 500 milhões, para apoio simplificado aos clientes já existentes.
Tenho a satisfação de informar que o BID Invest atingiu todas as metas operacionais definidas em sua resposta estratégica à crise, com aprovações que totalizaram US$ 9,1 bilhões, incluídos os esforços de mobilização. Os compromissos do BID Invest somaram US$ 6,2 bilhões, e a mobilização básica atingiu US$ 2,3 bilhões, apesar da mudança no apetite de risco nos mercados regionais e mundiais.
Cumprimento das prioridades
Embora tenhamos concentrado muitos de nossos esforços na resposta emergencial à pandemia, o BID Invest também cumpriu suas principais metas operacionais e prioridades institucionais.O financiamento para as microempresas e para as empresas de pequeno e médio porte superou a meta de 30% em 2020, atingindo 37,4% do
Resposta à crise causada pela COVID-19

8
BID INVEST
JAMES P. SCRIVENGerente-Geral e CEO, BID Invest
total de compromissos, com um total de US$ 2 bilhões. A meta para o financiamento de projetos envolvendo questões de gênero e diversidade (25% dos projetos de longo prazo) foi superada, pois alcançamos 29,9% das operações aprovadas em 2020.
Pela primeira vez desde sua criação, o BID Invest incorporou critérios relativos à inclusão de afrodescendentes e de povos indígenas para identificar projetos sustentáveis na região.
Nada menos do que 37% de nosso financiamento de longo prazo foi destinado a projetos de mitigação ou adaptação às mudanças climáticas.Ampliamos nosso apoio aos países pequenos e insulares. Em 2020, esses países foram responsáveis por 8,5% do total dos compromissos do BID Invest, com um aumento do volume de operações de 71% em relação a 2019.
Outros marcos institucionais
Para financiar seu programa de empréstimos, o BID Invest fortaleceu a presença nos mercados de capitais internacionais e locais. Emitimos títulos no montante de US$ 2,3 bilhões em 2020, com um aumento de 230% em relação a 2019. Além disso, a Fitch Ratings confirmou as notas de crédito do BID Invest como “AAA”, uma prova da robustez do desempenho dos nossos ativos e da nossa gestão financeira.
Em fevereiro de 2021, a Fitch Ratings declarou a classificação AAA do BID Invest no Rating de Inadimplência de Emissor de Longo Prazo, com menção à sua “excelente capitalização e perfil de baixo risco”, e revisou a previsão de rating de estável para negativo, como reflexo do cenário macroeconômico desafiador na ALC e do aumento em alavancagem do BID Invest, decorrente do aumento da carteira após a resposta do BID Invest à pandemia.
Também estamos muito orgulhosos porque nossa nova política de sustentabilidade ambiental e social entrou em vigor em dezembro passado, substituindo a de 2013. As novas diretrizes, enriquecidas por um processo de consulta pública inclusivo e transparente, aumentam o foco nos direitos humanos, no envolvimento das partes interessadas e nas questões de gênero. Além disso, refletem uma proteção maior dos povos indígenas, sobretudo dos que vivem em isolamento voluntário, e incluem uma nova seção sobre a gestão dos riscos de desastre.
Por último, não poderíamos ter alcançado esses resultados sem o comprometimento de nosso pessoal, que continuou a desempenhar suas tarefas mesmo após trabalhar em casa ter se tornado a regra tanto em Washington, D.C., como no restante da região.
De olho no futuro
A pandemia agravou os múltiplos desafios para o desenvolvimento da América Latina e do Caribe. Além de superar a crise atual, a região também precisa enfrentar fatores estruturais de longa data que geram baixa produtividade e elevada desigualdade, e a deixam mais vulnerável a catástrofes.
O BID Invest está preparado para ajudar a ALC a seguir a trajetória rumo à recuperação e enfrentar muitos dos problemas ainda pendentes. Ao longo dos últimos cinco anos, construímos uma organização hoje reconhecida como o principal agente financeiro de desenvolvimento do setor privado na região.
O BID Invest está empenhado em liderar uma recuperação impulsionada pelo setor privado, concentrando-se em prior idades como promover a geração de empregos, estimular a inovação, reduzir o déficit de crédito para as pequenas empresas, enfrentar as exigências de infraestrutura, ampliar o financiamento climático, incluir questões de gênero e de diversidade, incentivar a digitalização, atuar como catálise de negócios em cadeias de valor regionais, e fortalecer a segurança alimentar e o desenvolvimento rural.
Nesses tempos sem precedentes, o BID Invest tem-se mostrado à altura do desafio e continua a apoiar o setor privado na região, ciente de que em economia não existem “milagres”, mas apenas investimentos inteligentes que produzem resultados de fato.

3.RESPOSTA DO BID INVEST À COVID-19

10
BID INVEST
Além de causar a perda de quase meio milhão de vidas, a crise da COVID-19 teve um impacto econômico devastador na América Latina e no Caribe em 2020, com o PIB da região sofrendo a maior contração em mais de um século.Lockdowns, proibições de viagens e outras medidas para conter a pandemia paralisaram setores inteiros, ocasionando a perda de milhões de empregos e empurrando milhões de pessoas para a pobreza. A ALC corre o risco de perder muitos dos ganhos sociais e econômicos que havia conquistado durante as duas décadas anteriores.
A extraordinária amplitude da crise exigiu respostas extraordinárias. Com o respaldo da Diretoria Executiva, à medida que os primeiros casos de coronavírus na região começaram a ser informados, o BID Invest elaborou um plano de resposta à crise causada pela COVID-19. Como o Grupo do BID está encarregado de promover o desenvolvimento por meio do setor privado, ele teve um papel anticíclico a desempenhar, oferecendo financiamento extremamente necessário enquanto outros financiadores reduziam sua atuação.
Se 2020 tivesse sido um ano normal, a meta do BID Invest em termos de mobilização teria sido de aproximadamente US$ 4,5 bilhões, somando financiamento próprio e recursos de terceiros. O plano de resposta permitiu uma expansão recorde da capacidade de financiamento para US$ 7 bilhões.
Ao fim do ano, o BID Invest tinha atingido todas as metas operacionais definidas em sua resposta estratégica à COVID-19. O total de aprovações somou US$ 9,1 bilhões, incluídos os esforços de mobilização. Os compromissos atingiram US$ 6,2 bilhões, e a mobilização básica atingiu US$ 2,3 bilhões, um marco recorde em circunstâncias tão difíceis.

RELATÓRIO ANUAL 2020
11
NOSSA ABORDAGEMO plano de resposta do BID Invest baseou-se em seis elementos centrais:
1. Enfocar os efeitos da crise.
2. Agir mais rapidamente para enfrentar as consequências mais urgentes da crise.
3. Fazer mais do que o planejado originalmente.
4. Encontrar os parceiros certos e ampliar as intervenções
5. Assegurar uma resposta financeiramente sustentável.
6. Adaptar-se às implicações operacionais da oferta de uma resposta oportuna à crise.
Figura 1. Resposta operacional integrada e coerente à crise provocada pela COVID-19

12
BID INVEST

RELATÓRIO ANUAL 2020
13
Integramos uma ótica de referência para a COVID-19 ao Quadro de Gestão de Impacto, de modo a avaliar todos os projetos após a aprovação da Resposta à COVID-19 pela Diretoria Executiva. Essa ótica classifica as transações em potencial em duas categorias: as que protegem e aliviam, visando os efeitos imediatos da crise, e as que irão reacender as economias visando os efeitos de médio e longo prazo da crise.
Dada a velocidade com que a crise se desenrolou, e em vista dos danos possivelmente duradouros do choque econômico, foi de importância crucial prestar apoio rapidamente. Para acelerar a distribuição de recursos, mesmo ao nos adaptarmos ao trabalho a distância, adotamos uma série de medidas flexíveis e temporárias para agilizar os processos de aprovação.
Uma delas foi a criação de uma Linha de Crédito para Mitigação da Crise (CMF, na sigla em inglês) de US$ 500 milhões, para auxiliar nas necessidades urgentes de liquidez dos clientes já existentes. Outra medida foi ampliar o limite de exposição do Programa de Facilitação do Financiamento do Comércio (PFFC), de US$ 1,5 bilhão para US$ 3 bilhões.

14
BID INVEST
SAÚDEMais vale prevenir
Mesmo antes dos primeiros casos de COVID-19 serem identificados no Brasil, a direção e o pessoal do Hospital Israelita Albert Einstein (HIAE) em São Paulo já sabiam que precisavam preparar-se para tempos difíceis.
Fundada em 1955 por membros da comunidade judaica da cidade, essa instituição sem fins lucrativos administra um sistema integrado de assistência médica, educação e capacitação que abrange sua própria rede privada de hospitais e centros médicos — reconhecidos por muitos como os melhores da América Latina — além de dois hospitais públicos altamente conceituados e uma rede de unidades de atenção primária e secundária sob a administração do HIAE por meio de convênios com a Prefeitura de São Paulo. Em tempos normais, esse sistema atende cerca de 8 milhões de pacientes por ano.
O comando do HIAE executou rapidamente um plano de emergência para ampliar a capacidade e fazer face à pandemia iminente, providenciando a compra rápida de equipamentos e suprimentos médicos, como ventiladores mecânicos, camas hospitalares, unidades de terapia intensiva e equipamentos de proteção individual, e com a contratação de mais pessoal médico. Praticamente triplicaram a capacidade de leitos nos hospitais públicos, de 423 para 1.146, ao construir dois hospitais de campanha e aumentar os postos de triagem.
Todos os gastos adicionais saíram do próprio bolso do HIAE — recursos que, em um ano normal, teriam sido destinados a investimentos de capital e gastos recorrentes. Contudo, alguns meses depois, os hospitais brasileiros não estavam apenas enfrentando uma das piores explosões de coronavírus do mundo, mas também, como outros sistemas de saúde de todo o mundo, experimentavam uma queda na demanda de consultas, testes
e operações relacionadas a outras doenças e enfermidades. Em consequência, as receitas caíram, mesmo com os custos operacionais continuando a subir.
Conservador na maneira de administrar, o HIAE precisou encontrar uma forma de suprir a insuficiência de recursos num momento em que os bancos locais enfrentavam seus próprios problemas com a deterioração das carteiras de crédito. Além disso, a instituição também precisava diluir pelo maior prazo possível o custo das dívidas em que incorreria, a fim de suavizar o impacto e garantir a continuidade de suas operações no médio e longo prazo, tanto nas atividades privadas quanto nas públicas.
Mais ou menos na mesma época, o BID Invest buscava oportunidades para apoiar organizações de saúde do setor privado na região. “Sabíamos que seria um dos melhores usos para nossos recursos, mas não tínhamos um histórico longo no setor de saúde, em comparação com nosso trabalho em setores como finanças ou energia”, apontou Cristina Simón, Especialista Setorial em Infraestrutura Social .
Um de seus colegas, Juan Parodi, já havia trabalhado com administradores do HIAE no passado. “A direção do HIAE acreditou que a crise seria uma oportunidade muito boa para juntar forças com uma instituição internacional de f inanciamento do desenvolvimento como o BID Invest, o que assentou as bases para um relacionamento de longo prazo entre as duas instituições”, afirmou.
Um empréstimo no montante de R$ 200 milhões (cerca de US$ 38 milhões à época do desembolso, em outubro passado) foi montado em tempo recorde para um novo cliente, em setor não muito familiar, e enquanto muitas das pessoas envolvidas trabalhavam a distância. Contribuíram


16
BID INVEST
“A transação de longo prazo com o BID
Invest nos permitiu dar uma resposta mais eficiente à COVID-19
e foi significativa para manter a
capacidade financeira e operacional da instituição,
permitindo-nos aumentar nossa
cobertura da população durante a
pandemia”
Guilherme Diegues Gerente de Tesouraria
do HIAE.
especialistas em operações do setor público do BID das áreas de infraestrutura social e de saúde, bem como o representante do Grupo do BID no Brasil, Morgan Doyle.
“Essa transação foi um exemplo de cooperação, ao alavancar as habilidades de uma equipe multidisciplinar que contou com especialistas dos setores público e privado do Grupo do BID. Trabalhamos como uma equipe unificada para fornecer a nossos clientes uma solução rápida, bem estruturada e adaptada às necessidades à época”, concluiu Morgan Doyle.
As medidas preventivas do HIAE renderam frutos, pois suas unidades alcançaram índices elevados de ocupação durante os picos da pandemia. Eles planejam doar os equipamentos adquiridos a mais durante a pandemia para aumentar a capacidade permanente dos hospitais públicos de sua rede. O desafio ainda não acabou.
“A transação de longo prazo com o BID Invest nos permitiu dar uma resposta mais eficiente à COVID-19 e foi significativa para manter a capacidade financeira e operacional da instituição, permitindo-nos aumentar nossa cobertura da população durante a pandemia”, afirmou o Gerente de Tesouraria do HIAE, Guilherme Diegues.


18
BID INVEST
O PAINEL DO CORONAVÍRUS
No início da pandemia, os governos da ALC começaram a tomar diversas medidas para reduzir a propagação do vírus, tais como lockdowns, toques de recolher, fechamento de escolas e empresas, proibição de viagens ou, pura e simplesmente, o pedido insistente para que as pessoas ficassem em casa e observassem o distanciamento social. A princípio, era difícil avaliar o impacto dessas medidas. Para ajudar a orientar respostas mais eficazes à crise, era crucial que os países obtivessem informações oportunas e precisas sobre os efeitos da pandemia na região.
Em março, no espaço de 10 dias, em um esforço colaborativo, o Grupo do BID lançou o Painel do Impacto do Coronavírus, um instrumento projetado para medir em tempo real os efeitos das restrições relacionadas ao vírus como um indicador substituto da atividade econômica. Graças à nossa atual parceria com o Waze, o aplicativo de trânsito e GPS, criamos rapidamente um índice que mostra, em tempo real, quando e onde os padrões de tráfego estão mudando. A ampla cobertura dos dados permitiu-nos informar as mudanças diárias e semanais no tráfego, em 23 países e em 67 regiões metropolitanas. Começamos examinando os dados do aplicativo Waze antes mesmo da declaração da pandemia pela Organização Mundial da Saúde, em 11 de março. Percebemos mudanças significativas em termos de congestionamento que poderiam muito bem ser levadas em conta pelas autoridades de toda a região.
Além disso, o Painel informa diariamente os casos de COVID-19 e os óbitos, mostra a evolução da qualidade do ar em 11 cidades e acompanha padrões de mobilidade humana baseados em telefones celulares e no uso de transporte público, com dados do Moovit. Até hoje, o Painel já recebeu mais de 60 mil visitas de todo o mundo. Ao longo do ano passado Colômbia, Estados Unidos, Brasil, Peru, México, Argentina e Costa Rica foram os principais países que usaram esses dados. Além disso, o Painel vem aparecendo na imprensa regional e internacional.

RELATÓRIO ANUAL 2020
19
PROJETOS DE DESTAQUE NA NOSSA RESPOSTA À COVID-19
1.
2.
3. Instituições financeiras – Caja Los Héroes (Chile): Um empréstimo de US$ 50 milhões para ajudar esse fundo de gestão de benefícios sociais a aprofundar e expandir seu programa de inclusão financeira e transformação digital, concentrado na terceira idade, um dos grupos mais afetados pela COVID-19. O programa também visa a população não bancarizada, como as pessoas de baixa renda e os imigrantes. Como parte do projeto, a plataforma oferecerá acesso a cartões de débito e contas virtuais, bem como a recursos para educação financeira. O BID Invest também oferecerá incentivos às empresas filiadas à Caja Los Héroes para que se juntem à Iniciativa de Paridade de Gênero.
Empresas – Phoenix Tower International (Equador): Um empréstimo de US$ 80 milhões e um empréstimo B de US$ 12 milhões para ajudar na consolidação de um modelo de negócios baseado no uso compartilhado de torres de telecomunicações no mercado equatoriano. O projeto também ajudará a ampliar a cobertura da banda larga móvel por diversas operadoras de redes móveis. Esse resultado é de importância especial no contexto da crise provocada pela COVID-19, pois as redes estão com um aumento significativo do consumo de dados digitais, e os usuários exigem sistemas confiáveis em razão das medidas de distanciamento social (teletrabalho, telemedicina, aulas on-line, etc.).
Infraestrutura – AES (El Salvador): Uma linha de crédito para contas a receber no montante de US$ 60 milhões, para financiar os pagamentos adiados das contas de luz dos usuários em El Salvador. As empresas de serviços públicos foram afetadas pela suspensão e pelo adiamento por três meses do pagamento das contas pelos consumidores afetados pela pandemia. A eletricidade consumida durante esses meses deverá ser paga em parcelas mensais ao longo de dois anos. A linha de crédito estruturada pelo BID Invest atenderá às necessidades de financiamento do setor elétrico decorrentes das medidas emergenciais, atenuando gradativamente o impacto econômico.

20
BID INVEST
Quando a pandemia de COVID-19 atingiu a América Central, no início de 2020, muitas empresas viram os negócios serem paralisados. O principal fabricante têxtil hondurenho, a Elcatex, foi uma exceção.Rapidamente, a empresa se adaptou ao novo cenário mundial. Em apenas 13 dias, estava pronta para iniciar a confecção de máscaras com modelo aprovado pela FDA (Food and Drug Administration, a agência reguladora de remédios e alimentos nos EUA), e 45 dias depois estava produzindo aventais hospitalares descartáveis.
“Acabaram produzindo 45 milhões de máscaras e 7,2 milhões de aventais hospitalares em um período de cinco meses para exportar para os Estados Unidos”, apontou Mariana Coello, líder da equipe do BID Invest, de Tegucigalpa. “A Elcatex colocou Honduras no mapa ao mostrar o que eles conseguiriam fazer em uma emergência — em um ano em que fomos atingidos não apenas pelo coronavírus, mas também por duas grandes tempestades tropicais.”
O governo hondurenho isentou a indústria têxtil, um dos principais empregadores do país, da obrigação de suspender as atividades. Contudo, as empresas tiveram que reorganizar a forma como operavam. A fim de atender às exigências de distanciamento social e outras medidas preventivas, a Elcatex reorganizou tudo, dos espaços de trabalho no chão de fábrica até os assentos nos ônibus usados para transportar os trabalhadores entre a casa e o trabalho.
Ao contrário de tantas empresas que cortaram incontáveis empregos durante a crise, a Elcatex acabou contratando mais trabalhadores — e está disposta a contratar muitos mais, após concluir seu projeto de expansão. Um empréstimo de US$ 64 milhões do BID Invest, complementado por US$ 32 milhões do Fundo Chinês de Cofinanciamento para a América Latina e o Caribe, ajudará a financiar o plano.
INDÚSTRIAUm ponto no tempo

RELATÓRIO ANUAL 2020
21

22
BID INVEST
A Elcatex opera em Choloma, a terceira maior cidade de Honduras. Como muitas outras empresas nessa parte do país, especializa-se na confecção de camisetas e moletons para o mercado americano. Todavia, ao contrário da maioria de seus concorrentes, está integrada verticalmente, usando fios importados para fazer tecidos e depois cortar e costurar roupas. A proximidade com os Estados Unidos é outra vantagem estratégica na era da moda rápida, quando novos produtos têm que ir da fábrica até a loja em questão de dias.
Ao ver uma oportunidade na crescente demanda de moda activewear — roupas projetadas para a prática de esportes, mas normalmente usadas por pessoas que trabalham em casa — a Elcatex quis aumentar sua produção de algodão e de tecidos e roupas sintéticas, como as calças de yoga, encontradas atualmente por toda parte. Como as instalações atuais estavam produzindo à plena capacidade, precisaram construir uma nova fábrica, a San Juan Textiles, para a qual pretendem contratar cerca de 3.200 pessoas, a serem acrescidas a sua força de trabalho de cerca de 7.300 funcionários.
Além de ampliar a produção, o projeto tem metas sociais específicas. Usando recursos da Iniciativa de Financiamento para Mulheres Empreendedoras (We-Fi, do inglês Women Entrepreneurs Finance Initiative), a Elcatex tem um programa para aumentar o número de pequenas empresas de propriedade de mulheres ou lideradas por mulheres em sua cadeia de produção. Se tudo correr conforme o planejado, até 2027 isso poderá abrir oportunidades para até 137 empresárias.
“Fechar o financiamento com o BID Invest foi uma de nossas principais realizações em 2020, sobretudo em virtude da pandemia”, afirmou Jesús Canahuati, Gerente-Geral da Elcatex. “Essa transação nos permitirá fazer investimentos para dobrar a capacidade da área têxtil e satisfazer uma demanda crescente de nossos clientes, com um grande foco em nossa estratégia de sustentabilidade.”
“Fechar o financiamento com
o BID Invest foi uma de nossas principais
realizações em 2020, sobretudo em virtude
da pandemia”
Jesús CanahuatiGerente-Geral da
Elcatex

4. SETORES ESTRATÉGICOS

24
BID INVEST
A pandemia obrigou os governos de toda a ALC a priorizar atenção e recursos para lidar com as consequências sociais e econômicas mais urgentes da crise, limitando a capacidade de investimento em infraestrutura, um setor em que a região ainda enfrenta grandes desafios.O BID Invest tem como mandato de seus países-membros apoiar a participação do setor privado da ALC no desenvolvimento de uma infraestrutura mais eficiente e resiliente, com ênfase em expandir e modernizar as redes de transportes e
Infraestruturalogística da região, acelerar a transição para matrizes energéticas mais limpas e atualizar a infraestrutura social, como instalações nos setores de saúde, educação e água e saneamento.
Apesar da desaceleração econômica, no ano passado o BID colheu frutos do investimento de US$ 952 milhões em negócios para financiar projetos de infraestrutura e energia. Entre as operações mais significativas de 2020, destacam-se:

RELATÓRIO ANUAL 2020
25
Novo Complexo Solar Juazeiro. Um pacote de US$ 67,2 milhões que combina empréstimos do BID Invest e de bancos comerciais, somado a recursos concessionais do Fundo de Tecnologia Limpa e de um fundo climático canadense, para apoiar a construção de quatro usinas fotovoltaicas com uma capacidade combinada de 187 MW no estado da Bahia, Brasil. O financiamento combinado permitirá ao cliente, a Atlas Renewable Energy, adotar painéis solares bifaciais mais eficientes e executar um plano de ação de diversidade para empregar mais mulheres e afrodescendentes no projeto.
PPP para Infraestrutura Educacional. Um empréstimo de US$ 25 milhões ajudará a financiar a construção de escolas, parques tecnológicos e centros esportivos em 16 dos 19 departamentos do Uruguai, no âmbito de uma parceria público-privada entre a Administração Nacional do Ensino Público e um consórcio de empresas locais de construção e engenharia. O projeto ampliará o acesso à educação e à formação exigidas pelo mercado de trabalho fora das grandes áreas urbanas.
Tratamento de águas residuais. Um pacote de financiamento em reais, em montante equivalente a US$ 179 milhões, ajudará a SABESP, a maior empresa de água e saneamento da América Latina, a ampliar o tratamento de águas residuais poluindo um rio que cruza parte da cidade de São Paulo. A concessionária acrescentará sua própria capacidade de geração de energia solar para alimentar estações de tratamento de água e reduzir sua pegada de carbono.
•
•
•

26
BID INVEST

RELATÓRIO ANUAL 2020
27
Embora a pandemia de COVID-19 concentre a atenção do mundo, outros problemas globais continuam a ameaçar nosso planeta. É o caso das mudanças climáticas, que exigem ação coletiva e esforços inovadores para que possamos nos adaptar a seus efeitos ou combatê-los.
Durante 2020, o BID Invest defendeu o princípio de investir em reverter, procurando incentivar seus parceiros a buscar um programa mais ambicioso para alterar ou desfazer políticas e ações que agravem o impacto das mudanças climáticas na América Latina e no Caribe.
Uma forma de atingir esse objetivo é substituir a eletricidade gerada por usinas elétricas movidas a combustíveis fósseis por fontes de energia renováveis. Nos termos do Acordo de Paris, países de todo o mundo se comprometeram a descarbonizar suas economias, mas, conforme os cronogramas atuais, a desativação de usinas poluentes levará várias décadas.
O Chile, por exemplo, comprometeu-se a desativar até 2040 suas 28 usinas termelétricas, que atualmente respondem por cerca de 35% da capacidade de geração nacional. Mas um mecanismo pioneiro para monetizar o custo da descarbonização (ou seja, compensar os geradores por evitarem a emissão de gases do efeito estufa) poderia ajudar o traçado de um caminho mais rápido para um futuro mais limpo.
A linha de crédito é a principal característica de um pacote de financiamento de US$ 125 milhões para a concessionária ENGIE Energía Chile construir um parque eólico de 151 megawatts no deserto, no norte do país. O financiamento consiste em um empréstimo sênior de US$ 74 milhões do BID Invest, US$ 36 milhões do Fundo Chinês para Cofinanciamento na América Latina e no Caribe, e US$ 15 milhões do Fundo de Tecnologia Limpa.
A nova linha de crédito — montada pelo BID Invest com base em um estudo financiado por doações do Nordic Development Fund e dos governos da Áustria, dos Países Baixos e da Suécia — oferecerá à ENGIE um incentivo financeiro para antecipar em vários anos o fechamento de duas usinas movidas a carvão, evitando mais de 4.880 toneladas em emissões de gases do efeito estufa no período de 2022 a 2041.
Mudanças climáticasInvestir em reverter

28
BID INVEST
“Isso poderia se tornar um modelo para o resto do setor de geração de eletricidade, não apenas no Chile, mas no
resto da América Latina e Caribe”
Hilen MeirovichLíder da equipe climática
no BID Invest
Se um mercado de carbono já funcionasse no Chile, essas compensações antecipadas poderiam ser certificadas, precificadas e negociadas. Em vez disso, o mecanismo do acordo estabelece um preço mínimo para as emissões evitadas pela ENGIE ao não usar essas usinas térmicas, bem como ao gerar eletricidade com turbinas eólicas. Essas compensações são então convertidas em uma redução no pagamento de juros sobre o empréstimo concedido pelo Fundo de Tecnologia Limpa.
“Nosso compromisso com a descarbonização antecede nosso acordo com o BID Invest”, diz o Diretor Executivo da ENGIE Energía Chile, Axel Levêque. “Mas essa linha de crédito atua como um acelerador desse tipo de transformação.”Essa concessionária, especializada no fornecimento de eletricidade a grandes clientes industriais, como empresas de mineração que operam no norte do Chile, planeja desenvolver parques solares e eólicos com uma capacidade de geração total de cerca de 1.000 megawatts nos próximos anos.
Para Hilen Meirovich, líder da equipe encarregada das mudanças climáticas no BID Invest, o significado do mecanismo de monetização da descarbonização vai muito além desse acordo. Por exemplo, o Chile está empenhado em desativar usinas movidas a carvão e derivados de petróleo com uma capacidade de mais de 8.000 megawatts.
“Isso poderia se tornar um modelo para o resto do setor de geração de eletricidade, não apenas no Chile, mas no resto da América Latina e Caribe”, previu Hilen Meirovich. “Pode-se até imaginar um impulso à descarbonização do transporte público, um incentivo às cidades de toda a região para substituirem os ônibus a diesel por veículos elétricos.”


30
BID INVEST
Instituições financeirasA crise econômica ocasionada pela pandemia da COVID-19 teve um forte impacto sobre as empresas de todos os tamanhos na América Latina e no Caribe, mas foi devastadora, sobretudo, para as de menor porte. A emergência imprimiu um senso de urgência ainda maior ao trabalho do BID Invest com instituições financeiras, que busca reduzir o déficit de financiamento enfrentado pela região, mais especificamente em quatro áreas
prioritárias: primeira, o fortalecimento dos mercados de capitais e a liderança da classe de ativos de títulos temáticos; segunda, o estabelecimento de parcerias com instituições financeiras especializadas para promover a inclusão financeira; terceira, o apoio ao acesso das PMEs a financiamento; por último, o financiamento de fluxos do comércio internacional por meio do Programa de Facilitação do Financiamento do Comércio (PFFC).

RELATÓRIO ANUAL 2020
31
Expansão do apoio ao financiamento do comércio. O BID Invest intensificou o Programa de Facilitação do Financiamento do Comércio (PFFC) ao estabelecer 27 linhas de crédito novas ou renovadas, perfazendo um total de mais de US$ 1 bilhão, e reforçando as 30 linhas existentes em mais de US$ 500 milhões. Em consequência, as operações do PFFC cresceram 57% em relação a 2019.
•
Apoio ao desenvolvimento de fornecedores locais. Um empréstimo de até US$ 16 milhões para Demerara Distillers — um dos principais grupos econômicos na Guiana — para financiamento de novas instalações de processamento e embalagem.
•
Lançamento do primeiro fundo de venture debt na região, em associação com Silicon Valley Bank e Partners for Growth. Essa operação notável em termos de impacto e de sinergias com o Grupo BID consiste em um fundo de US$ 30 milhões com um período de investimento de quatro anos e duração de oito anos, para apoiar empresas jovens e de grande crescimento na ALC, em setores como tecnologia e software.
•
Alívio na forma de liquidez para as microfinanceiras afetadas pela pandemia. Um empréstimo de um ano, no montante de US$ 60 milhões, ajudará o Bancoldex, o banco nacional de desenvolvimento da Colômbia, a aumentar as linhas de crédito de emergência para entidades de microfinanças que operam em áreas rurais, onde os clientes de baixa renda dispõem de pouco ou nenhum acesso aos bancos comerciais.
•
Apesar da desaceleração, o BID Invest conseguiu reservar US$ 1,4 bilhão em compromissos para projetos envolvendo instituições f inanceiras e fundos de investimento especializados. Alguns dos destaques de 2020 foram:

32
BID INVEST
32
Pouco tempo depois que a pandemia chegou à Colômbia, em março passado, o Banco W entrou em contato com o BID Invest para finalizar um acordo que vinha sendo discutido havia vários meses. Assim como outras instituições microfinanceiras experientes, ele sabia que a crise iminente limitaria gravemente a capacidade de seus clientes de reembolsar seus pequenos empréstimos. Sabia também que uma recuperação exigiria ainda mais crédito.
O BID Invest agarrou a oportunidade de ajudar uma das maiores e mais antigas microf inanceiras da Colômbia, uma instituição que atende a centenas de milhares de empreendedores informais que, sem ela, teriam pouco ou nenhum acesso a serviços financeiros formais.
O Banco W foi criado em 2011, após a Fundación WWB (Women's World Banking, uma rede global de microf inanças) ter decidido tornar-se uma instituição financeira regulamentada com o intuito de oferecer a seus clientes produtos de poupança e seguros, além de pequenos empréstimos.
As microempresas constituem mais de 80% da clientela do Banco W, e mais da metade dos clientes são mulheres. Opera em 30 dos 32 departamentos da Colômbia, com uma rede de 142 agências e 150 agentes não bancários, além de 16.500 pontos de coleta eletrônica.
Além de atender a empreendedores e famílias de baixa renda em áreas e atividades pouco atendidas pelos bancos tradicionais, o Banco W oferece várias vantagens aos mutuários. Por exemplo, para empréstimos de até 3 milhões de pesos colombianos (aproximadamente US$ 850), não exige fiador, e o dinheiro normalmente é desembolsado em até 24 horas.
Apesar de o Banco W ser uma instituição bem capitalizada e solvente há muito tempo, a desaceleração econômica
MicrofinançasChegar até a base da pirâmide
testaria duramente sua sustentabilidade. O PIB da Colômbia contraiu-se cerca de 8% em 2020, atingindo mais duramente os menos afortunados. De acordo com uma avaliação, 45% das micro, pequenas e médias empresas colombianas viram suas receitas caírem até 75% no ano passado.
Em uma tentativa de proporcionar algum alívio aos mutuários, o governo colombiano decretou que as instituições financeiras teriam que adiar temporariamente os reembolsos dos empréstimos e prorrogar os prazos por até um ano. Isso impôs um ônus adicional às financeiras de todos os tamanhos, que também foram solicitadas a fazer provisões para perdas maiores.

RELATÓRIO ANUAL 2020
3333
O BID Invest veio em auxílio do Banco W com uma nova proposta: ajudaria o banco a emitir um título de impacto relacionado a questões de gênero, uma novidade para uma instituição de microfinanças na América Latina e no Caribe.
Nos meses seguintes , t rabalhamos juntos para estruturar um título de 150 bilhões de pesos colombianos (cerca de US$ 40 milhões) com um prazo de quatro anos, que ajudará o Banco W a conceder microempréstimos a cerca de 25 mil mulheres, as quais tradicionalmente têm tido menos acesso a crédito do que os homens.
“Para nós, é de importância crucial ajudarmos os que assumiram a missão de bancar os não bancarizados. O Banco W faz exatamente isso, em um país onde a informalidade do trabalho gira em torno de 50% e chega a 70% em algumas regiões”, apontou a líder da equipe do BID Invest, Sandra Angarita. “Esperamos que esse acordo sirva de modelo para outras instituições financeiras da região, interessadas em atender às mulheres microempresárias.”

34
BID INVEST
34
Empresas
O BID Invest trabalha com uma ampla gama de clientes empresariais, investindo em setores-chave para o desenvolvimento econômico e social na América Latina e no Caribe, como agronegócio, indústria, telecomunicações, mídia e tecnologia, e turismo.
Em 2020, esse segmento totalizou US$ 1,13 bilhão em fechamentos financeiros, seguindo um plano de operações destinado a fortalecer
a segurança alimentar, ampliar o acesso à banda larga móvel, desenvolver opções de financiamento para pequenas empresas e promover a adoção de modelos de negócios digitais. Além dessas metas, o BID Invest apoiou, no ano passado, medidas de diversas empresas para enfrentar a pandemia de COVID-19, com destaque para as seguintes transações:

RELATÓRIO ANUAL 2020
35
A maior fábrica de celulose solúvel do mundo. Um pacote de financiamento de US$ 1,1 bilhão liderado pelo BID Invest e pela IFC (Banco Mundial) apoiará um projeto de construção de uma fábrica de última geração no estado de Minas Gerais, Brasil, para produzir celulose solúvel, usada na fabricação de fibras têxteis biodegradáveis. A fábrica terá sua própria usina de geração de bioeletricidade, que também alimentará a rede pública.
Desenvolvimento urbano para habitação social. Um empréstimo em moeda local, em montante equivalente a US$ 40 milhões, ajudará a incorporadora peruana Los Portales a executar até 19 projetos em oito cidades, com o objetivo de oferecer a cerca de 12 mil compradores de baixa renda a possibilidade de realizar o sonho da casa própria.
Financiamento mezanino para apoiar o turismo sustentável. Sel ina, uma cadeia de hotéis lifestyle que administra propriedades em 12 países na ALC, utilizará um financiamento mezanino no montante de US$ 50 milhões para aumentar sua liquidez durante a pandemia e ampliar suas operações na região à medida que o setor de viagens e lazer se recupere. A operação abrange a mobilização de US$ 15 milhões da Blue Like an Orange Sustainable Capital, um parceiro financeiro do BID Invest.
Factoring reverso para a cadeia produtiva. Em uma aliança com o Conselho Mexicano de Negócios, uma importante associação empresarial, o BID Invest está concedendo empréstimos a grandes corporações mexicanas para estabelecer programas de factoring reverso que ofereçam liquidez às PMEs em suas cadeias produtivas atingidas pela pandemia. Com essa iniciativa, o BID Invest prevê financiar entre 15 mil e 20 mil MPMEs. Entre os participantes, figuram a fabricante de autopeças Rassini Automotriz, o conglom erado industrial Grupo Kuo, a processadora de alimentos Sigma Alimentos e a construtora Elementia.
•
•
•
•

36
BID INVEST
Cadeias produtivasO parceiro certo
Se houvesse dúvidas sobre por que a cadeia de supermercados Tiendas TIA seria o parceiro certo para o BID Invest em 2020, basta ver como esse varejista respondeu à pandemia de COVID-19, que assolou alguns de seus maiores mercados no Equador.
Fundada por comerciantes da Europa Oriental que fugiram de sua terra natal durante a Segunda Guerra Mundial, a Tiendas TIA liderou uma campanha que reuniu os esforços de centenas de empresas e inúmeros doadores individuais para coletar alimentos para as vítimas da crise causada pelo novo coronavírus.
“No auge da crise estávamos beneficiando 250 mil pessoas por dia e mantivemos esse ritmo até que a emergência sanitária mostrou sinais de que diminuiria e os trabalhadores informais poderiam uma vez mais sair para ganhar a vida”, disse o Gerente-Geral da TIA, Luis Reyes, em dezembro. “Até hoje, continuamos a apoiar pessoas vulneráveis em comunidades em todo o Equador.”
Em uma etapa posterior da campanha, a empresa projetou uma plataforma virtual que permitiu aos beneficiários selecionar os produtos de que precisavam, usando mensagens de texto e vales eletrônicos,

RELATÓRIO ANUAL 2020
37
acrescentando a escolha de frutas e hortaliças frescas e envolvendo as lojas de bairro na iniciativa de distribuição.
A campanha rendeu à Tiendas TIA o prêmio Super-Heróis do Desenvolvimento, que reconhece contribuições e inovações excepcionais feitas pelos parceiros do BID e do BID Invest.
“Para nós, fazia todo o sentido nos unirmos à Tiendas TIA”, afirmou o diretor de investimentos em manufatura, Gabriel Jiménez Grandes. “Além de um compromisso admirável com a responsabilidade social
corporat iva, e les têm uma enorme repercussão e foco nos consumidores de baixa e média renda. Além disso, envolvem milhares de pequenas empresas em sua cadeia produtiva. As oportunidades para obter um maior impacto no desenvolvimento são ilimitadas.”
A Tiendas TIA buscou o apoio do BID Invest para financiar uma expansão de sua rede de vendas e logística, bem como obter liquidez para pagamentos antecipados a fornecedores atingidos pela pandemia. Seus planos preveem a abertura de até 100 novas lojas (atualmente são 229) nos próximos quatro anos, avançando rapidamente para os subúrbios mais afastados e para cidades de rápido crescimento onde nenhum outro supermercado opera atualmente.
O projeto também envolve um programa de valor compartilhado no qual a cadeia de supermercados se esforçará para vincular um número maior de pequenas empresas de propriedade de mulheres, indígenas ou afro-equatorianas, com o fornecimento de frutas e vegetais cultivados localmente, com o projeto e a produção de embalagens sustentáveis, e com a gestão de resíduos pós-consumo.
Dependendo do resultado de estudos em andamento, a Tiendas TIA também poderá usar recursos do empréstimo do BID Invest para equipar algumas de suas lojas e armazéns com painéis solares no telhado, reduzindo sua pegada de carbono.

38
BID INVEST
MEDIÇÃO E GESTÃO DE IMPACTONosso Quadro de Gestão de Impacto permite ao BID Invest monitorar, medir e avaliar, do começo ao fim, os resultados do impacto de desenvolvimento dos nossos projetos. Além de ajudar a orientar os esforços de originação, priorização do inventário de projetos, e estruturação das operações, esse conjunto de ferramentas de importância crucial mostrou-se um recurso importante durante a crise causada pela COVID-19.
Uma de suas ferramentas, a Ficha de Pontuação da Seletividade Estratégica, foi aperfeiçoada neste ano para melhorar a seleção de projetos e a alocação de recursos para prioridades como países pequenos e insulares, pequenas empresas, mudanças climáticas, questões de gênero, diversidade e inclusão.
A forma como medimos e gerenciamos o impacto de desenvolvimento das nossas operações é um elemento-chave, conforme nos concentramos em reconstruir de forma melhor e em atrair cada vez mais investidores em busca de impacto para a região.
Em 2020, continuou a crescer o interesse dos investidores em melhores práticas para a medição e gestão de impactos e em sua integração ao processo decisório sobre investimentos.
Em consonância com as exigências do mercado, publicamos o documento Managing a Portfolio for Impact, um relatório que esboça o funcionamento interno do Quadro de Gestão de Impacto do BID Invest, desde os estágios iniciais de definição de metas em oportunidades setoriais de alto impacto, com avaliação sistemática do impacto previsto de cada investimento, até a forma como rastreamos, apuramos seu valor e divulgamos o impacto obtido.

RELATÓRIO ANUAL 2020
39

40
BID INVEST
Ao longo do ano, mantivemos nossas contribuições com divulgação de conhecimentos baseados em experiência e técnicos especializados, no espaço de gestão de impacto, através de uma série de blogs, artigos, op-eds, vídeos e webinars, com diferentes parceiros, inclusive Financial Times e Devex.
Também participamos ativamente de debates contínuos sobre o estabelecimento de métricas comuns para medição do impacto socioambiental em áreas como clima, questões de gênero e empregos diretos. Temos atuado com outras instituições financeiras de desenvolvimento para alinhar os Indicadores Harmonizados para Operações do Setor Privado, ou HIPSO, com as métricas IRIS+ -- o sistema com aceitação mais ampla para medição e gestão de impacto -- e com os Objetivos de Desenvolvimento Sustentável. Da mesma forma, como membro do Conselho Consultor para os Princípios Operacionais para Gestão de Impactos, também estamos ajudando a trazer mais investidores para o campo da gestão de impacto.
A pedra angular do quadro é a ferramenta de Eficácia em Desenvolvimento, Aprendizagem, Monitoramento e Avaliação (DELTA, na sigla em inglês), um sistema de pontuação baseado em fatos que estima o impacto de cada investimento no desenvolvimento, complementado por análises das partes interessadas, avaliações da sustentabilidade e avaliações da adicionalidade.
Em 2020, a mediana da pontuação calculada pela DELTA para os novos compromissos de longo prazo atingiu 8,7 (em uma escala máxima de 10), superando a mediana de 8,3 alcançada entre 2016 e 2019.
Ademais, o BID Invest monitora regularmente a carteira dos pontos de vista do risco e do desenvolvimento. No ano passado, executou um teste de estresse para avaliar os possíveis efeitos da crise causada pela COVID-19 sobre os resultados previstos dos projetos.
Da mesma forma, porém olhando para o longo prazo, o BID Invest acompanha as contribuições previstas de cada um dos projetos para a consecução dos Objetivos de Desenvolvimento Sustentável da ONU.
Além de visar o duplo objetivo da transparência e da prestação de contas, essas atividades produzem lições úteis que podem ser aplicadas na melhoria dos níveis de desempenho dos projetos e da carteira. Os produtos de conhecimento gerados com essas atividades são coletados na plataforma de Análise da Eficácia no Desenvolvimento e compartilhados amplamente dentro do Grupo do BID, bem como com parceiros e clientes.
Leia mais sobre o trabalho de monitoramento, medição e gestão, e avaliação do BID Invest no relatório de 2020 intitulado Managing a Portfolio for Impact.

6. SOLUÇÕES FINANCEIRAS

42
BID INVEST
Apesar das complexas cond ições financeiras criadas pela pandemia em 2020, a mobilização básica atingiu US$ 2,3 bilhões em 48 transações executadas, o maior volume na história do Grupo do BID, mesmo com muitos agentes dos mercados de capitais tendo demonstrado maior aversão ao risco em relação aos mercados emergentes. Para compensar esses fatores, o BID Invest desenvolveu novos produtos, como a Proteção de Crédito sem Financiamento (UCP, do inglês Unfunded Credit Protection), que ajudou a ampliar a base de investidores institucionais de modo a abranger seguradoras internacionais.
Entre os negócios de destaque fechados em 2020, destaca-se a LD Celulose, no Brasil, para a qual o BID Invest mobilizou um empréstimo B de US$ 250 milhões de bancos comerciais e um empréstimo paralelo de US$ 50 milhões do Fundo Chinês de Cofinanciamento para a América Latina e o Caribe. Posteriormente, essa transação recebeu da revista LatinFinance os prêmios de Empréstimo do Ano e de Operação de Infraestrutura do Ano.
Outra transação digna de nota é a Dívida Subordinada da Ferrocarril, no Uruguai. Essa foi a primeira vez em que o BID Invest uniu forças com o fundo Global Infrastructure Partners, que subscreveu um empréstimo B subordinado de US$ 67,5 milhões.
Além disso, mantivemos os esforços para ampliar nossa base de investidores, que compreende mais de 400 parceiros em todo o mundo, com um histórico de fechamento de pelo menos uma transação com mais da metade desses investidores. Com vistas ao futuro, o BID Invest continuará a desenvolver instrumentos inovadores para atrair mais investidores institucionais e fundos de pensão para a região.
Aumento da mobilização de recursos

RELATÓRIO ANUAL 2020
43

44
BID INVEST
Poucos setores destacaram-se em 2020. Um dos poucos segmentos que realmente prosperou durante a pandemia foi um negócio relativamente novo e ainda de nicho: as farmácias digitais.
Os varejistas on-line de medicamentos, como as farmácias digitais, estavam bem posicionados para tirar partido do novo normal de lockdowns e distanciamento social. As pessoas que, no passado, iam a pé ou de carro até a farmácia do bairro agora não se importam nem um pouco de usar o telefone para pedir a entrega de remédios e recebê-los na porta de casa.Além da vantagem de não ter de pagar aluguel nem manter lojas físicas, as farmácias digitais podem ser acessadas 24 horas por dia, e seus serviços podem ser mais bem adaptados às necessidades ou preferências de seus clientes — que já não precisam ficar na fila para aviar uma receita ou receber um remédio.
Nos últimos anos, as farmácias digitais testemunharam um aumento tão expressivo em vendas que um estudo da Fortune Business Insights previu que o mercado mundial para esses varejistas on-line poderia triplicar e ultrapassar o patamar de US$ 150 bilhões até 2026.
Embora o comércio eletrônico já venha crescendo há muito tempo na América Latina e no Caribe, as farmácias digitais são uma tendência mais recente. Em muitos de seus países, trata-se de uma atividade altamente regulamentada e pulverizada, mas alguns empresários já estão abrindo caminho na região.
Um deles é José Joaquín Mora, fundador da Farmalisto, uma farmácia digital com sede no Panamá que atualmente opera na Colômbia, no México e, mais recentemente, no Peru. Em dezembro de 2020, a Farmalisto recebeu um investimento de capital no montante de US$ 8 milhões do BID Invest, ao qual se uniu o fundo especializado em
InovaçãoA farmácia pelo telefone
saúde HBM Healthcare Investments e a Morgan Rio Capital Management, numa rodada de captação de US$ 18 milhões para essa start-up com sete anos de existência.A Farmalisto planeja usar esse novo capital para ampliar seus mercados atuais e expandir para outros países da América Latina. Além disso, fortalecerá seus próprios processos de inovação e desenvolverá novas linhas de negócio baseadas na prestação de serviços de saúde em casa.Cristina Simon, Especialista Setorial em Infraestrutura Social do BID Invest, disse que esse foi um dos fatores que atraiu a atenção para a Farmalisto. A empresa busca agora oferecer serviços como radiologia e quimioterapia a pessoas com dificuldades para sair de casa.
O desenvolvimento de disposit ivos “portáteis” para acompanhar os sinais vitais dos pacientes com doenças crônicas, bem como oferecer-lhes conselhos médicos e lembretes sobre o horário de tomar

RELATÓRIO ANUAL 2020
454545
“O BID Invest nos dá um selo de garantia
que nos permite abrir e liderar novas linhas de negócio lucrativas,
estruturadas corretamente,
tendo em mente o componente
socioambiental nos diversos países onde
operamos.”
José Joaquín MoraFundador y CEO
Farmalisto
a medicação, é outra área com enorme potencial. A Farmalisto já lançou um serviço desse tipo com a marca Care24.
“Graças à digitalização, essa empresa pode, por exemplo, monitorar os pacientes com doenças crônicas, o que, na minha opinião, não só vai melhorar a qualidade de vida dos pacientes, mas também tornar os serviços de saúde mais eficientes. A Farmalisto é um grande exemplo do que pode ser feito no setor de saúde, e espero que esse investimento de capital seja o primeiro de muitos desse tipo”, diz Cristina Simon.
Por sua vez, José Mora, da Farmalisto, diz que trabalhar com o BID Invest oferece `à sua empresa mais do que apenas recursos financeiros. “O BID Invest nos dá um selo de garantia que nos permite abrir e liderar novas linhas de negócio lucrativas, estruturadas corretamente, tendo em mente o componente socioambiental nos diversos países onde operamos.”

46
BID INVEST
Com mais de US$ 800 milhões em recursos de doadores sob gestão para financiamento combinado, o BID Invest oferece aos clientes incentivos para ter em mira objetivos econômicos, sociais ou ambientais mais ambiciosos no âmbito dos projetos. Em 2020, comprometemo-nos a investir um montante recorde de US$ 97 milhões em recursos concessionais em 16 investimentos. Esses fundos a judaram a cata l isar US$ 1,6 bilhão em capital empresarial para projetos de baixo carbono, de resiliência climática, envolvendo questões de gênero e diversidade.
Na Guatemala, por exemplo, o BID Invest estruturou seu primeiro investimento de capital com financiamento combinado, fornecendo US$ 5 milhões em capital à Kingo, uma empresa descentralizada de energia solar, especializada no atendimento de comunidades rurais fora da rede. A maioria dos recursos concessionais veio do Fundo de Tecnologia Limpa, que participou do negócio exigindo que a Kingo alcançasse resultados específicos na área de questões de gênero.
Financiamento combinado

RELATÓRIO ANUAL 2020
47

48
BID INVEST
Apesar das incertezas do mercado, durante 2020, o BID Invest continuou a expandir sua presença nos mercados de capitais locais e internacionais para financiar seu programa de empréstimos, emitindo títulos em um montante recorde de US$ 2,3 bilhões. Nosso compromisso de oferecer respostas adequadas aos clientes nos impulsiona a soluções financeiras e produtos inovadores. Com base em nossa experiência e em nosso modelo de negócios sustentáveis, conseguimos abrir novos mercados na região, expandir os mercados existentes e produzir produtos inovadores de apoio ao crescimento de nossos clientes. Como consequência, o mercado reconhece o impacto que trazemos, e alguns de nossos projetos receberam prêmios internacionais (ver na pág. 72) que ressaltam sua natureza transformadora e pioneira. Entre os marcos do programa de financiamento, destacam-se os seguintes:
Em abril, emitimos nosso primeiro título de referência, com montante nominal de US$ 1 bilhão e prazo de dois anos, seguido por outro, em julho, de US$ 1 bilhão e prazo de três anos. Ambos foram destinados ao nosso plano de resposta à COVID-19. Os títulos de referência tiveram forte demanda de investidores da Europa, do Oriente Médio, da Ásia e das Américas.
Em outubro, emitimos nosso primeiro título denominado em dólares australianos, outro título de resposta à COVID-19, com um montante nominal de 140 milhões de dólares australianos (o equivalente a US$ 99 milhões) e um prazo de 15 anos. Esse foi o título com prazo de vencimento mais longo já emitido pelo BID Invest.
Fortalecemos nossa presença nos mercados de capitais latino-americanos com as emissões de títulos internos: emitimos nosso sexto e maior bônus no México com um valor nominal de 2 bilhões de pesos mexicanos (equivalente a US$ 96 milhões) e prazo de 3 anos.
No Paraguai, emitimos dois títulos no montante total de 125 bilhões de guaranis (equivalente a US$ 18 milhões). Esses títulos contribuem para o desenvolvimento dos mercados de capitais locais, proporcionando aos investidores nos países os instrumentos para aumentar a diversificação e a qualidade de crédito de suas carteiras de investimento.
Aumentamos nossa captação em reais e em pesos colombianos e, pela primeira vez na história do BID Invest, executamos uma operação de captação em dólares de Trinidad e Tobago.
Financiamento institucional
•
•
•
•
•

7. SOLUÇÕES NÃO FINANCEIRAS

50
BID INVEST
O BID Invest apoia os clientes com serviços de assessoria durante todo o ciclo de vida dos projetos, desde a preparação até o financiamento e a operação. Esses serviços, projetados para aumentar o impacto, enfocam as mudanças climáticas, a igualdade de gênero, a diversidade e a inclusão, a sustentabilidade, as MPMEs e as parcerias público-privadas.
Durante 2020, 85 serviços de assessoria foram lançados e 51 foram concluídos, o que representa um aumento de 21% em relação a 2019. No fim do ano, havia 126 serviços de assessoria ativos.
Serviços de assessoria
dos recursos de longo prazo contribuem para a mitigação ou adaptação aos efeitos das mudanças climáticas
das transações apoiaram MPMEs e 30% ajudaram a promover a igualdade, a diversidade e a inclusão de gênero.

RELATÓRIO ANUAL 2020
51

52
BID INVEST
À luz da pandemia, o BID Invest adaptou seus serviços de assessoria ao novo contexto, passando de um modelo tradicional baseado na capacitação presencial para um novo modelo que incorpora diagnósticos automáticos, formação on-line, comunidades de prática e comunicações digitais.
Entre os serviços de assessoria iniciados durante o ano de 2020, destacam-se:
Adaptação às mudanças climáticas. Duas grandes tempestades tropicais atingiram a América Central, ressaltando a importância da ajuda às empresas da região, na adaptação a condições mais extremas. A Mercon, uma distribuidora mundial de café verde, procurou o apoio do BID Invest para um programa de promoção de práticas climáticas mais inteligentes entre seus pequenos fornecedores na Nicarágua. É também importante assinalar que o Grupo BID atuou com o Banco Mundial e o Banco Centro-Americano de Integração Econômica (CABEI) para efetivação de um plano conjunto de ações de financiamento para obras de assistência humanitária e de reconstrução nos países afetados.
Apoio a empresas de médio porte e ao setor de saúde. O BID Invest estruturou e adquiriu o primeiro título social no Brasil, emitido pelo Banco ABC, uma instituição financeira brasileira. O aporte do BID Invest apoiará a carteira do Banco ABC para empresas de médio porte e o setor de saúde, para que consigam fazer face às suas necessidades de financiamento e responder à crise. O BID Invest ajudou o Banco ABC a confirmar a classificação temática como título social.
Consultoria para a adoção de soluções circulares. O BID Invest trabalhará com o Grupo KUO no México, prestando assessoria para a adoção de soluções circulares em plásticos, por meio da inclusão de recicladores na logística reversa.
•
•
•

RELATÓRIO ANUAL 2020
53

54
BID INVEST
Durante 2020, o BID Invest reforçou sua capacidade de apoio a governos, órgãos públicos e empresas privadas com interesse em organizar e participar de projetos bem-sucedidos de parcerias público privadas para grandes investimentos em infraestrutura. Entre os destaques do ano, figuram:
Na Colômbia, em colaboração com o BID, ajudamos a Agência Nacional de Infraestrutura a montar um dos projetos de transporte mais estratégicos do país: a navegabilidade do Rio Magdalena.
No Bras i l , a judamos a Agência Nacional de Telecomunicações (ANATEL) a definir uma estrutura ideal para garantir a viabilidade financeira de um projeto de expansão da conectividade de banda larga na região amazônica.
No México, atuamos na primeira iniciativa privada de um projeto rodoviário, objeto de uma proposta não solicitada, um modelo que pode ser replicado em outros países com quadros regulatórios e institucionais adequados.
Na Jamaica, fornecemos consultoria ao Development Bank of Jamaica sobre a possibilidade de estruturar os projetos da Zona Econômica Especial das Ilhas Cayman nos termos de parceria público-privada.
•
•
•
•
PARCERIASPÚBLICO-PRIVADAS

8. PAÍSES PEQUENOS E INSULARES

56
BID INVEST
No âmbito de um mandato expresso de sua Assembleia de Governadores, o BID Invest trabalha para estender seu financiamento a países que historicamente foram menos beneficiados por operações sem garantia soberana do Grupo do BID, ou seja, as economias latino-americanas menores e as nações caribenhas.
Os compromissos para os países pequenos e insulares vêm crescendo a cada ano desde 2016, tendo chegado a US$ 522 milhões, o que representa 8,5% do total de compromissos em 2020. Essa mudança não foi apenas no volume, mas também no tipo de transações, que passaram a ser maiores e mais significativas economicamente em diversos setores.
O BID Invest continua empenhado em aumentar suas operações em países pequenos e insulares, visando a dedicar pelo menos 10% de seus compromissos a projetos nessas nações e envidar todos os esforços para fechar pelo menos uma operação por ano em Barbados, Belize, Guiana e Haiti.

RELATÓRIO ANUAL 2020
57
O Suriname pode ser a menor república, com a menor população e uma das menores economias da América do Sul. Contudo, a última parte dessa descrição pode mudar drasticamente em breve.
Graças à recente descoberta de grandes reservas de petróleo e gás ao longo de sua costa atlântica, essa nação de idioma neerlandês pode estar à beira de um surto de crescimento. A expectativa é que ele beneficie muitos — ou até mesmo a todos —, sobretudo após a contração causada pela pandemia de COVID-19 em 2020.
Um boom econômico impulsionaria as perspectivas do setor privado surinamês, no qual 98% das empresas são de pequeno ou médio porte. As empresas precisarão ter acesso a empréstimos e a outros serviços financeiros, mas atualmente metade delas tem dificuldade em conseguir qualquer tipo de financiamento.
O Finabank quer mudar esse quadro. Embora essa instituição financeira privada de 30 anos seja a menor dos quatro bancos que dominam o pequeno setor financeiro do Suriname, ela tem grandes planos.
Nos últimos anos, o Finabank modernizou agressivamente sua plataforma digital para melhorar os serviços bancários oferecidos on-line e agora aposta no crescimento com a inclusão de clientes PMEs negligenciados por concorrentes maiores.
Mas uma das barreiras enfrentadas para expandir as operações de empréstimo é ter acesso a financiamento em dólares. A pandemia é parcialmente responsável pela depressão da atividade econômica, mas o Finabank, assim como outros bancos surinameses, tem um problema comum em todo o Caribe: o chamado de-risking.
Um banco de pequeno porte aposta no crescimento

58
BID INVEST
De-r i sk ing é o te rmo usado para referir-se à prática dos bancos globais de cortar re lações comercia is com instituições financeiras menores, empresas de transferência de dinheiro e até mesmo organizações humanitárias em regiões em desenvolvimento, em virtude da preocupação com a lavagem de dinheiro e outros possíveis crimes financeiros.
Essa eliminação de riscos provoca uma pequena redução nos resultados dos bancos internacionais, mas pode dificultar seriamente as operações das instituições financeiras locais que, de repente, podem ser excluídas de negócios geradores de divisas, como o financiamento do comércio ou a distribuição de remessas.
Uma possível maneira de superar esse problema é reforçar as regras dos bancos locais contra a lavagem de dinheiro, elevando-as aos padrões internacionais. É exatamente isso que o Finabank pretende fazer, no âmbito de um acordo celebrado com o BID Invest em 2020. O banco surinamês também vai elaborar e adotar um sistema de gestão socioambiental mais sofisticado.
Esses serviços de assessoria de importância crucial complementarão um empréstimo de US$ 3 milhões que o Finabank usará para financiar o crédito a PMEs. Além disso, o BID Invest aumentou a linha de financiamento do comércio concedida ao banco surinamês de US$ 2 milhões para US$ 5 milhões.
“A parceria com o Finabank foi acertada. Precisávamos reconhecer as medidas que eles estão tomando em um ambiente muito desafiador, como preparação para um futuro melhor”, disse Michael Apel, líder da equipe do BID Invest.
Por sua vez, o CEO do Finabank, Eblein Frangie, disse: “Estamos honrados em assumir esse compromisso novo, e ainda mais sólido, com o BID Invest. Esse acordo nos permitirá fortalecer ainda mais a governança do Finabank de acordo com os padrões internacionais, a fim de cumprir nossos objetivos estratégicos.”


60
BID INVEST
9. PROMOÇÃO DA DIVERSIDADEDurante nossos cinco primeiros anos de operação, concentramo-nos em construir uma espinha dorsal forte como alicerce para apoiar a originação e a gestão de uma carteira cada vez maior e, assim, assegurar um impacto sustentável e permit i r velocidade, seletividade e gestão proativa nos riscos financeiros e não financeiros. Essa visão abrangia a priorização do crescimento em nossa capacidade de originação de projetos, bem como nas áreas de middle office e back office, ao mesmo tempo que também investíamos ativamente na melhoria de processos e sistemas.
Em 2020, continuamos a fortalecer essa espinha dorsal em três elementos definidos de forma bem clara: pessoas, processo e sistemas. O resultado previsto é aumentar a eficiência e apoiar nossa capacidade para originar, registrar e executar uma gama cada vez mais ampla de transações e cumprir as ambiciosas metas de crescimento visando a um impacto sustentável. Além disso, aprofundamos nossa capacidade e nossas qualificações em termos de conhecimento setorial e de produtos, perícia, melhoria em automação e novas funcionalidades, para continuar a otimizar o atendimento aos clientes internos e externos.
A força de trabalho do BID Invest continua a ser equilibrada em termos de gênero (51% mulheres e 49% homens), uma tendência refletida cada vez mais nos escalões superiores da organização, em que as mulheres ocupam 37,8% dos cargos de liderança. Ademais, aumentamos nossa diversidade com respeito às nacionalidades representadas em nossa força de trabalho. Em 1º de novembro de 2020, contávamos com cidadãos de todos os países pequenos e insulares da ALC, além de cidadãos de países que não estavam representados em 2016, como Bolívia, Guatemala, Guiana, Honduras, Panamá e República Dominicana.

RELATÓRIO ANUAL 2020
61
10. ESTRATÉGIA PARA OS CLIENTESNo BID Invest, nosso trabalho é oferecer aos clientes as ferramentas necessárias para o crescimento sustentável. Assim, o fortalecimento de nossa estratégia para os clientes está no cerne de nosso mandato.
A primeira versão do Portal do Cliente e outras melhorias, como a unificação dos identificadores dos clientes em todos os sistemas de TI, devem ser implementadas em 2021. Além disso, em termos de gestão do relacionamento, identificamos clientes estratégicos e designamos gerentes de relacionamento exclusivos para continuar a desenvolver e promover oportunidades de negócios e colaboração com um horizonte de médio e longo prazo. Por último, implementamos uma pesquisa de satisfação para entender melhor a experiência dos clientes após o fechamento financeiro e durante a supervisão.
O BID Invest está empenhado em contar com uma força de trabalho que reflita a diversidade da região e de seus clientes e em criar uma cultura inclusiva que celebre as diferenças. Nesse sentido, em 2021, o Grupo do BID atualizará seu quadro de diversidade e inclusão.

62
BID INVEST
11. CONHECIMENTO E COMUNICAÇÃODurante 2020, o BID Invest aumentou continuamente o volume de produtos de conhecimento destinados a reforçar o impacto para todos os investidores, compartilhando as lições extraídas em suas operações, disseminando as melhores práticas em toda a região e destacando projetos de natureza inédita que ajudam o setor privado a investir com impacto.
Os esforços de comunicação externa também renderam frutos, ao contribuir
para a marca e a imagem do BID Invest como um parceiro preferencial na ALC. Aumentaram as menções nos meios de comunicação, nos principais veículos regionais e internacionais. Além disso, promovemos o valioso trabalho dos clientes e parceiros por meio de mais de 30 campanhas de marketing digital em nossos canais de comunicação, ampliando o alcance dos nossos e-mails e atingindo mais de 9 milhões de pessoas.

12. GESTÃO DOS RISCOS NÃO FINANCEIROS

64
BID INVEST
1 Mais informações sobre a implementação da Política de Acesso à Informação do BID Invest durante 2020 podem ser consultadas no Anexo 3.
O BID Invest trabalha com seus clientes para implementar as melhores práticas de gestão de riscos ambientais, sociais e de governança corporativa, de forma que o desempenho reforçado do setor privado contribua para a consecução dos Objetivos de Desenvolvimento Sustentável.
Durante 2020, continuamos a implementar medidas de fortalecimento da nossa gestão dos riscos não financeiros como um valor agregado para nossos clientes. Continuamos empenhados em promover uma visão integrada dos riscos, enfatizando a correlação entre os riscos de crédito e os riscos não financeiros em todas as suas dimensões, como os riscos ligados a reputação, integridade, meio ambiente, aspectos sociais, governança corporativa, clima, questões de gênero e contexto, bem como os riscos operacionais atuais e emergentes.
A versão atual izada da Pol ít ica de Sustentabilidade Ambiental e Social, em vigor desde 15 de dezembro de 2020, posiciona o BID Invest na vanguarda das melhores práticas do desenvolvimento sustentável em todo o mundo. Essa política e o respectivo manual de implementação foram enriquecidos por consultas ativas à sociedade civil e a partes interessadas regionais. Foram adotadas melhorias
significativas nas áreas de direitos humanos, envolvimento das partes interessadas, grupos vulneráveis , mecanismos de queixas, prevenção de represálias, questões de gênero, povos indígenas e pessoas com deficiência.
Além disso, elaboramos novas metodologias e ferramentas que estão sendo aplicadas a investimentos diretos como parte do processo de devida diligência ambiental e social para avaliar e gerenciar riscos específicos.
A nova Política de Acesso à Informação, em vigor desde 2020, reflete o compromisso do BID Invest com a transparência no exercício de suas atividades.1
Em 2020, o BID Invest continuou a valorizar iniciativas destinadas a fortalecer a capacidade institucional de nossos clientes, além da conformidade.
Essas iniciativas abrangeram a coleta e a disseminação de lições extraídas e de melhores práticas. Nesse contexto, organizamos nove workshops externos com clientes e lançamos nove publicações e notas setoriais, das quais quatro estavam relacionadas à COVID-19. Essas notas podem ser acessadas em nosso website:
Guia para Projetos de Infraestrutura sobre a COVID-19: Quadro Rápido para a Identificação de Riscos e Tomada de Decisões
Governança Corporativa: COVID-19 e o Conselho de Administração
Guia para o setor agrícola sobre a COVID-19: Riscos e quadro de resposta
Gestão de Riscos em Saúde e Resiliência em Projetos do Setor Privado: Resposta dos clientes do BID Invest à Pandemia da COVID-19, Lições Iniciais e um Roteiro para a Ação
•
•
•
•

13. OPERAÇÕES EM 2020

66
BID INVEST
Setor Privado - Grupo BIDDESTAQUES OPERACIONAIS
2019
120
$4.597
43%
28731225
$3.382 $501
$8.470 44%
$1.441 $4.188
0,34
$645 $3.398
$161 $80 $313
289914100
$4.840 $715
$10.242 40%
$2.304 $6.157
0,37
$1.128 $5.339
$211 $104
$-
2020
151
$6.782
37%
(US$ milhões)
Aprovações
Desembolsos e garantias
Carteira de ativos de desenvolvimento
Mobilização básica
Número de projetos
Montante
Países C&D (com base no montante)
Múltiplos tipos de produtosEmpréstimosGarantiasInvestimentos de capitalTítulos de dívida
DesembolsosGarantias
Carteira ativaCarteira ativa C&D (com base no montante)
Mobilização básicaMontante ajustadoCoeficiente de mobilização básica
Múltiplos tipos de produtosEmpréstimosGarantiasInvestimentos de capitalTítulos de dívida

RELATÓRIO ANUAL 2020
67
EMPRÉSTIMOS
(US$ milhares)
País Nome Setor Montante Nº do projeto
Setor privado - Grupo BIDAPROVAÇÕES - 2020
Bahamas
Brasil
Chile
Colômbia
Equador
El Salvador
Guatemala
Jamaica
Guiana
Honduras
Belize
Barbados
ALIV
LD Celulose SA
B2F Infrastructure Debt FundCasablanca PV Bifacial Solar Power ProjectNew Juazeiro Bifacial Solar Power ProjectBanco ABC - Social BondBDMG – Sustainable BondCreditasHospital Albert EinsteinSabesp Green Capex Facility
Electricity Tariff Stabilization Liquidity Financing IElectricity Tariff Stabilization Liquidity Financing IIEngie Decarbonization InstrumentHuemul PortfolioCaja Los Heroes Financial Inclusion PartnershipTanner factoring SMEs II
Banco W - Bonos de GéneroBancoldex -Emergency line MSMEs supportDavivienda Bono GéneroDavivienda SubordinadoProcaps ColombiaAlpha Capital S.A.S (Alphacredit)TMAS-2
Pronaca II
Banco Guayaquil Social BondVicunha EC 3rd operationCorporación FavoritaPTI Ecuador
Floating Storage Regasification Unit for Acajutla LNG to Power ProjectBAC El Salvador - Support to “Mujer Acelera” ProgramDavivienda - Green Lending Partnership
BAC Guatemala - SME Partnership and Digitalization PromotionPromerica Guatemala SME Financing Partnership
JMMB Bank Partnership
Demerara Distillers Limited
Jilamito Hydroelectric ProjectGrupo Elcatex/San Juan Textiles
National Gas Company - LPG TerminalAtlantic Bank Tourism Financing Partnership
Barbados Port Inc.
Indústria 16.000 12509-01
12683-01
Agricultura e desenvolvimento ruralEnergiaEnergiaEnergiaMercados financeirosMercados financeirosCiência e tecnologiaInvestimento socialÁgua e saneamento
200.000
150.000 142.830 53.933
100.000 50.000 30.000
37.517 169.582
12710-01
12640-0112092-0312092-0212979-0112976-0113113-0113135-01
13069-01
Energia
Energia
Energia
EnergiaMercados financeirosMercados financeiros
Mercados financeirosMercados financeirosMercados financeirosMercados financeirosSaúdeCiência e tecnologiaTransportes
Agricultura e desenvolvimento ruralMercados financeirosIndústriaOutroCiência e tecnologia
Energia
Mercados financeiros
Mercados financeiros
Mercados financeiros
Mercados financeiros
Mercados financeiros
Agricultura e desenvolvimento rural
EnergiaIndústria
50.000
175.000
74.000 200.000
50.000
36.000
38.748 100.000 100.000 100.000 20.000 40.000 26.593
50.000
20.000 10.000
230.000 80.000
88.000
60.000
50.000
100.000
25.000
35.000
10.000
20.250 64.000
13330-01
13330-02
12995-0112380-0212610-01
11363-06
13166-0113100-0112114-0212114-0312431-0213150-01
13044-01
11598-04
11749-0713127-0112511-01
13023-01
12520-02
12824-02
11860-02
12853-02
11866-02
12793-03
12754-01
11784-0812375-01
EnergiaMercados financeiros
6.000 20.000
12486-0111834-02
Transportes 30.000

68
BID INVEST
GARANTIAS
INVESTIMENTOS DE CAPITAL*
País
País
País
Nome
Nome
Nome
Setor
Setor
Setor
Montante
Montante
Montante
Nº do projeto
Nº do projeto
Nº do projeto
México
Regional
Suriname
Uruguai
Costa Rica
Brasil
México
México
Regional
Trinidad e Tobago
Paraguai
Peru
Green Power Assets (Amistad IV)Green Power Assets (Dolores)Green Power Assets (Magdalena)La Pimienta Solar ProjectPuebla Solar PVKonfio Warehousing LineMercader Financial - SME Financing PartnershipCADU 2020VARMOXZ
CMI Alimentos II
Fernandes Guyana
LAAD II
Selina
Finabank SME Line
Natelu & Yarnel - B BondTacuarembó-Salto Green Transmission LineYarnel B BondBBVA UR - Subordinated Sustainable BondFerrocarril Central Subordinated Loan
Promerica CR - Linha de crédito de garantias para Programa de emissões temáticas
Valor Capital - Opportunity FundVinci Impact FundCargoX - Digital trucking platform
Mercados financeirosMercados financeirosCiência e tecnologia
10.000 10.000 10.850
12851-0113030-0113095-01
Kingo EnergyHMC Capital - Deuda Privada AndinaLAC Venture Debt Growth FundSEAF Caribbean SME Growth FundFarmalisto
EnergiaMercados financeirosMercados financeirosMercados financeirosSaúde
GAIAAlta Growth Capital Fund III
CADU PCG Program
Home Mortgage Bank Loan
Sudameris MSME Financing Partnership
Cálidda Corporate LoanCaja Arequipa Bono Mujer
EnergiaEnergiaEnergiaEnergiaEnergiaMercados financeirosMercados financeiros
IndústriaIndústria
Agricultura e desenvolvimento ruralAgriculltura e desenvolvimento ruralAgricultura e desenvolvimento ruralTurismo sustentável
Mercados financeiros
EnergiaEnergiaEnergiaMercados financeirosTransportes
Mercados financeiros
Indústria
Mercados financeiros
Mercados financeiros
EnergiaMercados financeiros
26.670 46.660 26.670
100.000 45.000 56.065 19.063
14.501 46.500
50.000
4.000
30.000
35.000
3.000
1.500 114.069
1.500 15.000 7.500
15.000
23.245
3.699.120
38.245
104.490
36.816
45.153
100.000 16.000
13291-0113290-0113289-0112893-0112541-0113057-0113001-01
13033-0112822-01
12167-03
13042-01
12098-02
12825-01
12132-03
11466-0312220-0111467-0312665-0112278-02
11866-03
13033-02
13065-01
12933-01
13146-0113019-01
IndústriaDesenvolvimento de empresas privadas e PMEs
15.000 10.300
12885-0112614-01
1.000 20.000
7.740 10.000 9.600
12332-0112162-01
12494-0113079-0113020-01

RELATÓRIO ANUAL 2020
69
PFFC - Programa de Facilitação do Financiamento do Comércio - EMPRÉSTIMOS
País Nome Setor Montante Nº do projeto
Belize
Brasil
República Dominicana
Equador
El Salvador
Guatemala
Honduras
Jamaica
Panamá
Paraguai
Peru
Chile
Costa Rica
Bolívia
Atlantic Bank - TFFP (BL-L1012)
Banco ABC Brasil S.A. - TFFP Line (BR-X1032)Banco Industrial do Brasil TFFP (BR-L1066)Banco Santander Brasil S.A. - TFFP (BR-X1034)Daycoval - TFFP (BR-L1286)TFFP-Banco Sofisa (BR-L1283)
Banco de Reservas - TFFP (DR-L1027)Banco Múltiple Santa Cruz S.A. - TFFP (DR-X1008)
Banco de Guayaquil TFFP (EC-L1028)Banco de la Producción, S.A. (PRODUBANCO) (EC-L1024)Banco Internacional S.A. - TFFP (EC-L1042)TFFP Banco Pacífico (EC-X1013)
BAC ES TFFPBanco Agrícola S.A. - TFFP (ES-L1031)Banco Cuscatlán TFFPBanco G&T El Salvador - TFFP Line (ES-X1009)Banco Promerica El Salvador -TFFP (ES-L1060)
Banco Agromercantil de Guatemala - TFFP (GU-L1011)Banco FICOHSA (Guatemala) - TFFP LineBanco Industrial - TFFP (GU-L1041)Banco Internacional, S.A. - TFFP (GU-L1061)Banco Promerica Guatemala -TFFP (GU-L1066)
Banco Del Pais S.A. (Banpais) - TFFP (HO-L1074)Banco Ficensa Honduras TFFP (HO-X1023)
National Commercial Bank Jamaica Ltd TFFP (JA-X1009)
Banco Aliado S.A. - TFFP (PN-L1030)Tower Bank - TFFP (PN-L1065)
Banco Continental S.A.E.C.A. - TFFP (PR-L1053)Banco Familiar - TFFP (PR-X1004)Banco para la Comercialización y la Producción (Bancop) - TFFPBanco Regional S.A. - TFFP (PR-L1038)
Banco Interamericano de Finanzas - TFFP (PE-L1029)Santander Perú TFFP
Banco Internacional - TFFP (CH-X1010)
BAC SAN JOSE -TFFP (CR-X1011)Banco Promerica - TFFP (CR-L1041)
Banco Económico - TFFP (BO-X1009)
Mercados financeiros
Mercados financeiros
Mercados financeirosMercados financeiros
Mercados financeirosMercados financeiros
Mercados financeirosMercados financeiros
Mercados financeirosMercados financeiros
Mercados financeirosMercados financeirosMercados financeirosMercados financeiros
Mercados financeiros
Mercados financeiros
Mercados financeirosMercados financeirosMercados financeiros
Mercados financeiros
Mercados financeiros
Mercados financeiros
Mercados financeiros
Mercados financeirosMercados financeiros
Mercados financeiros
Mercados financeirosMercados financeiros
Mercados financeiros
Mercados financeiros
Mercados financeiros
12.000 42.500
28.000 20.000
10.000 40.000
4.973 2.000
6.212
20.000
3.325 135.000
5.000
1.000
22.885
25.230
65.096
30.170 17.216
27.065
10.000 3.000
18.900
90.000
60.000
EC-L1028EC-L1024
EC-L1042EC-X1013
12824-01ES-L103112057-01
ES-X1009
ES-L1060
GU-L1011
12773-01GU-L1041GU-L1061
GU-L1066
HO-L1074
HO-X1023
JA-X1009
PN-L1030PN-L1065
PR-L1053
PR-X100412032-01
PR-L1038
PE-L1029
12026-02
Mercados financeirosMercados financeiros
Mercados financeiros
Mercados financeirosMercados financeiros
Mercados financeiros
10.310
200.000
35.467 203.695
77.616 10.847
10.000 5.000
27.000
20.000 8.028
10.000
BL-L1012
BR-X1032
BR-L1066BR-X1034
BR-L1286BR-L1283
DR-L1027DR-X1008
CH-X1010
CR-X1011CR-L1041
BO-X1009
1.317.536
* Esse montante inclui US$61,99 milhões de produtos de crédito e participação no capital, US$27,5 milhões de investimentos de capital em fundos cujos ativos-objeto são investimentos em títulos de dívida, e US$15 milhões de produtos de financiamento mezanino.

70
BID INVEST
637.046
PROGRAMA PFFC - GARANTIAS
País Nome Setor Montante Nº do projeto
Argentina
Brasil
Costa Rica
República Dominicana
Equador
El Salvador
Guatemala
Honduras
Nicarágua
Panamá
Suriname
Bolívia
Belize
Banco Rio de la Plata S/A - TFFP (AR-L1028)Banco Credicoop TFFP Line
Banco Industrial do Brasil TFFP (BR-L1066)Banco Santander Brasil S.A. - TFFP (BR-X1034)Daycoval - TFFP (BR-L1286)
Banco Lafise Costa Rica - TFFP (CR-L1027)BCT - TFFP LineDavivienda CR - TFFP Line
Banco de Reservas - TFFP (DR-L1027)
Banco Bolivariano - TFFP (EC-L1034)Banco de Guayaquil TFFP (EC-L1028)Banco Internacional S.A. - TFFP (EC-L1042)
BAC ES TFFPBanco Cuscatlán TFFPBanco Davivienda Salvadoreño, S.A. - TFFP (ES-L1042)Banco Promerica El Salvador -TFFP (ES-L1060)
Banco FICOHSA (Guatemala) - TFFP LineBanco G&T Continental - TFFP (GU-L1036)Banco Internacional, S.A. - TFFP (GU-L1061)Banco Promerica Guatemala -TFFP (GU-L1066)
Banco FICOHSA TFFP (HO-L1012)Banco Lafise Honduras S.A.- TFFP LineBanhcafe Honduras TFFP (HO-X1022)
Banco de la Producción S.A. - TFFP (NI-L1028)
Banco Internacional de Costa Rica S.A. (BICSA) TFFP (PN-X1009)Unibank TFFP Line
Finabank Trade Finance Line
Banco Nacional de Bolivia S.A. - TFFP (BO-L1049)
Atlantic Bank - TFFP (BL-L1012)
Mercados financeiros
Comércio
Mercados financeirosMercados financeiros
Mercados financeiros
Mercados financeiros Mercados financeiros Mercados financeiros
Mercados financeiros
Mercados financeiros Mercados financeiros Mercados financeiros
Mercados financeiros Mercados financeiros Mercados financeiros
Mercados financeiros
Mercados financeiros Mercados financeiros Mercados financeiros
Mercados financeiros
Mercados financeiros Mercados financeiros Mercados financeiros
Mercados financeiros
Mercados financeiros
Mercados financeiros
Mercados financeiros
Mercados financeiros
Mercados financeiros
1.772 99
4.267 77.121
21.450
1.009 5.503
54.785
290.000
15.512 5.598 1.212
10.047 10.000 19.979
3.787
2.909 7.476
5.000
1.630
53.500 2.000
513
5.473
15.000
17.809
500
2.651
445
AR-L102812281-01
BR-L1066BR-X1034
BR-L1286
CR-L102712498-0111512-05
DR-L1027
EC-L1034EC-L1028EC-L1042
12824-0112057-01
ES-L1042
ES-L1060
12773-01GU-L1036GU-L1061
GU-L1066
HO-L1012HO-L1041HO-X1022
NI-L1028
PN-X1009
12572-01
12132-01
BO-L1049
BL-L1012

RELATÓRIO ANUAL 2020
71
Financiamento de Comércio e Cadeias Produtivas - FCCP - EMPRÉSTIMOS
País
Brasil
Colômbia
Chile
Delta Sucroenergia - USD 40MM LT Senior Secured A/B Loan
Celsia Colombia Receivables FacilityMovistar Colombia Handset Financing
Electricity Tariff Stabilization Liquidity Facility I (CEC XII)Electricity Tariff Stabilization Liquidity Facility I (CGE I)Electricity Tariff Stabilization Liquidity Facility I (Chilquinta VI)Electricity Tariff Stabilization Liquidity Facility I (Codiner XV)Electricity Tariff Stabilization Liquidity Facility I (Coelcha XVI)Electricity Tariff Stabilization Liquidity Facility I (Coopelan XIV)Electricity Tariff Stabilization Liquidity Facility I (Cooprel XVII)Electricity Tariff Stabilization Liquidity Facility I (Crell XIII)Electricity Tariff Stabilization Liquidity Facility I (EDECSA X)Electricity Tariff Stabilization Liquidity Facility I (EEPA XIX)Electricity Tariff Stabilization Liquidity Facility I (EMELCA XX)Electricity Tariff Stabilization Liquidity Facility I (Enel Distribucion V)Electricity Tariff Stabilization Liquidity Facility I (Frontel III)Electricity Tariff Stabilization Liquidity Facility I (Litoral VII)Electricity Tariff Stabilization Liquidity Facility I (Luz Linares VIII)Electricity Tariff Stabilization Liquidity Facility I (Luz Osorno IV)Electricity Tariff Stabilization Liquidity Facility I (Luz Parral IX)Electricity Tariff Stabilization Liquidity Facility I (Saesa II)Electricity Tariff Stabilization Liquidity Facility I (Socoepa XVIII)Electricity Tariff Stabilization Liquidity Facility I (XI COPELEC)Enel Chile Liquidity FacilityMovistar Chile Handset Financing
Agricultura e desenvolvimento rural
EnergiaCiência e tecnologia
Ciência e tecnologia
Energia
Energia
Energia
Energia
Energia
Energia
Energia
Energia
Energia
Energia
Energia
Energia
Energia
Energia
Energia
Energia
Energia
Energia
Energia
Energia
Energia
EnergiaCiência e tecnologia
20.000
80.000 31.570
3.607
5.716
27.469
7.769
1.700 91.765 55.935 101.767 20.351 5.288
82.956
9.731 45.831
447
22.014
1.279
299
252
341
158
396
31
77
6
9.655
4.114
55
110
557
65
8.616
128
797
62.577 156.970
12434-02
13342-0112618-01
12261-01
13110-01
13209-01
13117-01
12593-0112120-0112121-0112119-0112135-0112522-01
ME4104A-01
12124-0212134-01
13361-01
12111-02
13357-01
13369-01
13367-01
13366-01
13362-01
13365-01
13363-01
13370-01
13371-01
13356-01
13353-01
13358-01
13359-01
13354-01
13360-01
13355-01
13368-01
13364-01
12718-0412491-01
Equador
El Salvador
México
Movistar Ecuador Handset Financing
AES El Salvador Deferred Electricity Receivables Purchase Facility
Grupo Kuo - Financiamiento Cadena de ValorNaturasol Capital de Trabajo
eFactor: Supply Chain FinancingCEMEXGenomma LabMabe ProlecRassiniSupply Chain Finance – E Factor Diez / NemakXignuxEFactor/Axtel Approved Payables Financing
Agricultura e desenvolvimento ruralAgricultura e desenvolvimento ruralMercados financeirosIndústriaIndústriaIndústriaIndústriaIndústriaIndústriaIndústria
Ciência e tecnologia
Nome Setor Montante Nº do projeto

72
BID INVEST
914.494
71.169
Paraguai Agrofertil
Tecnomyl - línea revolvente
Agricultura e desenvolvimento ruralAgricultura e desenvolvimento rural
30.000
11.968
12297-01
12756-01
2.713
29
12886-01
13191-01
9.385
9
7
305
42
46
179
70.580
13022-02
13193-01
13199-01
13200-01
13201-01
13198-01
12053-02
11895-03
Ciência e tecnologia
Energia
Energia
Energia
Energia
Energia
Mercados financeiros
Transportes
Agricultura e desenvolvimento ruralIndústria
Movistar Perú Handset Financing
Bancoldex/EMEVASI Guarantee - Complementary Mechanism to Tender CLPE No. 02-2019Bancoldex/Emserpucar Guarantee - Complementary MechanismBancoldex/Enerca Guarantee - Complementary MechanismBancoldex/Energuaviare Guarantee - Complementary MechanismBancoldex/Putumayo Guarantee - Complementary MechanismEnertotal S.A. E.S.P.
Rutas 2/7
SIGMA Alimentos
Elementia
Peru
Colômbia
Paraguai
Regional
PROGRAMA FCCP - GARANTIAS
País Nome Setor Montante Nº do projeto

14. CONQUISTAS E PRÊMIOS

74
BID INVEST
Títulos
Usina termelétrica
Agronegócio
Projeto
Projeto
Projeto
Projeto
ClientePaísInstituiçãoCategoria
ClientePaísInstituiçãoCategoria
ClientePaísInstituiçãoCategoria
ClientePaísInstituiçãoCategoria
Prêmio
Prêmio
Prêmio
Prêmio
Bancolombia
Banco Pichincha
Energía del Pacífico
LD Celulose
BancolombiaColômbiaEnvironmental FinanceTítulo de sustentabilidade do ano – Banco
Banco PichinchaEquadorClimate Bonds InitiativePioneiro verde de novos mercados
Energía del PacíficoEl SalvadorLatinFinanceFinanciamento de infraestrutura do ano – América Central
LD CeluloseBrasilLatinFinanceEmpréstimo do ano, América Latina
Environmental Finance – Premiação de Títulos 2020
Pioneiro verde de novos mercados 2020
Financiamento de infraestrutura do ano – América Central
Empréstimo do ano, América Latina

RELATÓRIO ANUAL 2020
75
Projeto
Projeto
Projeto
ClientePaísInstituiçãoCategoria
ClientePaísInstituiçãoCategoria
PaísInstituiçãoCategoria
Prêmio
Prêmio
Prêmio
total
LD Celulose
PFI Awards
Rutas 2 & 7
LD CeluloseBrasilLatinFinanceFinanciamento de infraestrutura do ano
LD CeluloseBrasilLatinFinanceAmérica Latina, operação industrial do ano
ParaguaiLatinFinanceFinanciamento de infraestrutura do ano – Cone Sul
Financiamento de infraestrutura do ano
América Latina, operação industrial do ano
Financiamento de infraestrutura do ano – Cone Sul
7
Estradas


15. DESTAQUES OPERACIONAIS

78
BID INVEST
Compromissos de longo prazo USD (milhões)
Compromissos por conta própria, por segmento
Instituições financeirasEmpresasInfraestrutura e energiaPor conta própria, subtotalCompromissos de mobilização1Compromissos de longo prazo, total
Instituições financeirasEmpresas Infraestrutura e energiaAprovações de longo prazo
Curto prazo pendente, médiaCompromissos de curto prazo
Compromissos de mobilização de longo prazoCompromissos de mobilização de curto prazoMobilização ex post4Mobilização básica
Número de atividades com novos clientes para serviços de assessoriaCaptação de recursos de doadores para financiamento combinado e serviços de assessoria
Mediana da pontuação DELTAFinanciamento climático (% US$)5MPMEs (% US$)Países pequenos e insulares (% US$)Gênero ou diversidade (% número)
Incluída a mobilização ex post.Abrange apenas BID Invest + BID SGS.Exposição total a ARD sob administração = Exposição a ARD do BID Invest SGS + Exposição a ARD do BID SGS + Empréstimos B pendentes em ARD + Recursos de terceiros pendentes em ARD. Não abrange ativos líquidos do BID Invest nem o Fundo para PMEs do Haiti (ARD = ativos relacionados ao desenvolvimento).A mobilização ex post refere-se à mobilização que não gera um compromisso adicional com um cliente do BID Invest. De modo geral, abrange vendas secundárias, vendas de empréstimos A, ou compartilhamento de risco por meio de transferências de risco sem financiamento.Calculado apenas com base em compromissos de longo prazo. Quando a porcentagem é calculada com base em compromissos de curto e longo prazo, a porcentagem do financiamento climático é igual a 22,5%.
[1][2][3]
[4]
[5]
NOTA: Montantes indicados em milhões de dólares.
Aprovações de longo prazo
Financiamento de curto prazo
Mobilização
Serviços de assessoria
Principais parâmetros do impacto
$ $ $ $ $ $
$ $$ $
$ $
$ $$$
# $
# % % % %
1.373 1.136 952
3.461 2.304 5.621
1.353 1.0451.689
4.087
1.492 2.695
1.544 145 615
2.304
85 38
8,7 37,0 37,4 8,5
29,9

16.SUBSTITUIÇÃO DA LIBOR

80
BID INVEST
Em julho de 2017, a Autoridade de Conduta Financeira, o regulador da LIBOR, anunciou que não mais obrigaria os bancos do painel a apresentar as taxas necessárias para calcular a LIBOR após 31 de dezembro de 2021. Assim, os participantes do mercado, incluídos o BID Invest e seus mutuários, precisariam adotar taxas de referência alternativas porque a disponibilidade da LIBOR após essa data passou a ser incerta. Em 4 de dezembro de 2020, a Intercontinental Exchange Benchmark Administration Limited publicou uma consulta sobre sua intenção de adiar a data de descontinuação da maioria dos prazos mais líquidos da LIBOR americana, de 31 de dezembro de 2021 para 30 de junho de 2023. Embora a transição da LIBOR esteja sujeita a incontáveis incertezas e desafios, a decisão quanto à transição visa a aumentar a transparência nos mercados financeiros, ao alinhar melhor as taxas de referência alternativas com as transações efetivas nos mercados.
O BID Invest concluiu uma avaliação inicial do impacto de sua exposição à LIBOR e elaborou um roteiro de implementação para a transição dessa taxa. O BID Invest está trabalhando ativamente nessa transição e analisando o impacto sob múltiplos pontos de vista: financiamento, captação, contabilidade, operações, tecnologia da informação, investimentos de liquidez, riscos e aspectos jurídicos, considerando a carteira de empréstimos existentes e outros instrumentos que usam a LIBOR como referência.

17. GOVERNANÇA INSTITUCIONAL

82
BID INVEST
Mauricio J. Claver-Carone eleito Presidente do Banco Interamericano de Desenvolvimento
NOSSA MISSÃO
NOSSOS PAÍSES-MEMBROS
Em 12 de setembro de 2020, a Assembleia de Governadores do Banco Interamericano de Desenvolvimento elegeu Mauricio J. Claver-Carone como novo Presidente do BID. A Assembleia de Governadores, o principal órgão encarregado da formulação de políticas do BID, é composta por autoridades governamentais dos 48 países-membros do Banco. O Presidente do BID, eleito para um mandato de cinco anos, também preside a Diretoria Executiva do BID Invest e a Comissão de Contribuintes do BID Lab. O Presidente Claver-Carone tomou posse em 1º de outubro de 2020. Antes de ser eleito, atuou como Assistente Adjunto do Presidente dos Estados Unidos e Diretor Sênior para Assuntos do Hemisfério Ocidental no Conselho de Segurança Nacional dos Estados Unidos. Anteriormente, foi Diretor Executivo dos Estados Unidos no Fundo Monetário Internacional e Conselheiro Sênior para Assuntos Internacionais no Departamento do Tesouro dos Estados Unidos.
Mauricio J. Claver-Carone é o quinto Presidente do BID. Ele sucede Luis Alberto Moreno (2005-2020), Enrique V. Iglesias (1988-2005), Antonio Ortiz Mena (1971-1988) e Felipe Herrera (1960-1971).
O BID Invest promove o desenvolvimento econômico de seus países-membros em desenvolvimento na região ao estimular a criação, a ampliação e a modernização de empresas no setor privado, de maneira a complementar as atividades do BID. Nosso objetivo é ser a principal instituição financeira com conhecimento e experiência para investir com impacto na América Latina e Caribe e conectar os países e os investimentos do setor privado com os Objetivos de Desenvolvimento Sustentável.
Alemanha, Argentina, Áustria, Bahamas, Barbados, Bélgica, Belize, Bolívia, Brasil, Canadá, Chile, China, Colômbia, Coreia, Costa Rica, Croácia, Dinamarca, El Salvador, Equador, Eslovênia, Espanha, Estados Unidos da América, Finlândia, França, Guatemala, Guiana, Haiti, Honduras, Israel, Itália, Jamaica, Japão, México, Nicarágua, Noruega, Países Baixos, Panamá, Paraguai, Peru, Portugal, República Dominicana, Suécia, Suíça, Suriname, Trinidad e Tobago, Uruguai e Venezuela.

RELATÓRIO ANUAL 2020
83
A Diretoria Executiva é responsável pela condução das operações do BID Invest e exerce todos os poderes a ela conferidos pelo Convênio Constitutivo da Corporação Interamericana de Investimentos ou delegados pela Assembleia de Governadores. A Diretoria Executiva determina a estrutura organizacional básica do BID Invest e aprova o orçamento da instituição.
Os 13 membros efetivos e 13 suplentes da Diretoria Executiva têm mandatos de três anos e representam um ou mais países-membros da instituição. O Comitê Executivo da Diretoria Executiva é composto por quatro membros: o diretor ou suplente nomeado pelo país-membro com a maior quantidade de ações do BID Invest, dois diretores representando países-membros em desenvolvimento e um diretor representando os demais países-membros. Todos os empréstimos e investimentos do BID Invest são analisados por esse comitê.
O Presidente do BID é o presidente ex officio da Diretoria Executiva do BID Invest e preside suas reuniões, mas só tem direito a voto em caso de empate. O presidente pode participar das reuniões da Assembleia de Governadores, mas sem direito a voto.
Orientado pelos princípios do fortalecimento da eficácia no desenvolvimento, o BID Invest contribui para o desenvolvimento e para a maximização do uso eficiente dos recursos e das sinergias entre as atividades com os setores público e privado do Grupo do BID. O BID Invest é responsável por todas as operações sem garantia soberana do Grupo (incluídas as operações com empresas estatais sem garantia soberana).
Todos os poderes do BID Invest estão investidos em sua Assembleia de Governadores, composta por governadores e governadores suplentes, com respectiva indicação de cada país-membro. Entre os poderes investidos na Assembleia de Governadores sem possibilidade de delegação à Diretoria Executiva estão a admissão de novos países-membros, a contratação de auditores externos, a aprovação das demonstrações financeiras do BID Invest e a alteração do Convênio Constitutivo da Corporação Interamericana de Investimentos.
NOSSO MANDATO
ASSEMBLEIA DE GOVERNADORES
DIRETORIA EXECUTIVA

ARGENTINA AND HAITIARGENTINA AND HAITI
Alt. Exec Dir. Jorge Eduardo Srur
Exec Dir. Guillermo Alberto Francos
BRAZIL AND SURINAMEBRAZIL AND SURINAME
Exec Dir. Jose GuilhermeAlmeida dos Reis
Alt. Exec Dir. Sergio Savino Portugal
CANADA, DENMARK, FINLAND, FRANCE, NORWAY, SWEDEN, ANDSWITZERLAND
Exec Dir. Mattia Celio
CANADA, DENMARK, FINLAND, FRANCE, NORWAY, SWEDEN, ANDSWITZERLAND
Alt. Exec Dir. Harald Tollan
CHILE AND COLOMBIA CHILE AND COLOMBIA
Exec Dir. Alex Foxley Exec Dir. Sergio Díaz Granados
BELIZE, COSTA RICA, EL SALVADOR, GUATEMALA, HONDURAS, ANDNICARAGUA
BELIZE, COSTA RICA, EL SALVADOR, GUATEMALA, HONDURAS, ANDNICARAGUA
Alt. Exec Dir. Edna Gabriela Camacho
Exec Dir. Francisco Jose Mayorga Balladares
BAHAMAS, BARBADOS, GUYANA, JAMAICA, AND TRINIDAD AND TOBAGO
BAHAMAS, BARBADOS, GUYANA, JAMAICA, AND TRINIDAD AND TOBAGO
Exec Dir. Dr. Brian Langrin Alt. Exec Dir. Terry Ann Atkins-Huggins
Exec Dir. Adolfo Di Carluccio
AUSTRIA, BELGIUM, CHINA, GERMANY, ITALY, AND THE NETHERLANDS
AUSTRIA, BELGIUM, CHINA, GERMANY, ITALY, AND THE NETHERLANDS
Alt. Exec Dir. Jing Chen
BOLIVIA, PARAGUAY AND URUGUAY BOLIVIA, PARAGUAY AND URUGUAY
VACANT Alt. Exec Dir. Santiago Cat Ruprecht
AlemANhA, áusTriA, bélgicA, chiNA, iTáliA e pAíses bAixOs
bOlíviA, pArAguAi e uruguAi bOlíviA, pArAguAi e uruguAi brAsil e suriNAme brAsil e suriNAme
bAhAmAs, bArbAdOs, guiANA, jAmAicA, TriNidAd e TObAgO
belize, cOsTA ricA, el sAlvAdOr, guATemAlA, hONdurAs, NicAráguA
cANAdá, diNAmArcA, FiNlÂNdiA, FrANÇA, NOruegA, suéciA, suíÇA
cANAdá, diNAmArcA, FiNlÂNdiA, FrANÇA, NOruegA, suéciA, suíÇA
chile e cOlÔmbiA chile e cOlÔmbiA
belize, cOsTA ricA, el sAlvAdOr, guATemAlA, hONdurAs, NicAráguA
ArgeNTiNA e hAiTíAlemANhA, áusTriA, bélgicA, chiNA, iTáliA e pAíses bAixOs
ArgeNTiNA e hAiTí
Diretor ExecutivoAdolfo Di Carluccio
Diretor Executivo Dr. Brian Langrin
Cargo Vago Diretor executivo SuplenteSantiago Cat Ruprecht
Diretor Executivo José Guilherme Reis
Diretor Executivo SuplenteSergio Savino Portugal
Diretora Executiva Suplente Terry Ann Atkins-Huggins
Diretor ExecutivoFrancisco José Mayorga Balladares
Diretor ExecutivoMattla Cello
Diretor Executivo SuplenteHarald Tollan
Diretor ExecutivoAlex Foxley
Diretor Executivo SuplenteSergio Díaz Granados
Diretora Executiva SuplenteEdna Gabriela Camacho
Diretor Executivo Guillermo Alberto FrancosDiretor Executivo Suplente
Jing Chen
Diretor Executivo SuplenteJorge Eduardo Srur
bAhAmAs, bArbAdOs, guiANA, jAmAicA, TriNidAd e TObAgO

Exec Dir. Eliot Pedrosa VACANT
CROATIA, ISRAEL, JAPAN, KOREA, PORTUGAL, SLOVENIA AND SPAIN
CROATIA, ISRAEL, JAPAN, KOREA, PORTUGAL, SLOVENIA AND SPAIN
DOMINICAN REPUBLIC AND MEXICO
DOMINICAN REPUBLIC AND MEXICO
Exec. Dir. Hyungon Kim
Exec Dir. Mario Alejandro Gaytán Gonzalez
ECUADOR AND PERUECUADOR AND PERU
Alt. Exec Dir. Bernardo Acosta
Exec Dir. Gerardo M. CorrochanoAlt. Exec Dir. Alberto
Nadal
Alt. Exec Dir. Carlos Pared
PANAMA AND VENEZUELA
Exec Dir. Gina Montiel Alt. Exec Dir. Carlos Alberto Vallarino Rangel
PANAMA AND VENEZUELAUNITED STATES OF AMERICA UNITED STATES OF AMERICA
Members of the Board of Executive Directors as of Nov. 30, 2020
crOáciA, eslOvÊNiA, espANhA,isrAel, jApÃO, cOreiA, pOrTugAl
crOáciA, eslOvÊNiA, espANhA,isrAel, jApÃO, cOreiA, pOrTugAl
repúblicA dOmiNicANA e méxicO repúblicA dOmiNicANA e méxicO
eQuAdOr e peru eQuAdOr e peru
esTAdOs uNidOs dA AméricA esTAdOs uNidOs dA AméricA pANAmá e veNezuelApANAmá e veNezuelA
Diretor ExecutivoHyungon Kim
Diretor Executivo Mario Alejandro Gaytán
Diretor Executivo SuplenteCarlos Pared
Miembros del Directorio Ejecutivo al 30 de Noviembre de 2020.
Diretor Executivo Suplente Alberto Nadal
Diretor Executivo Gerardo M. Corrochano
Diretor Executivo Eliot Pe-drosa
Cargo Vago Diretora Executiva Gina Montiel
Diretor Executivo SuplenteCarlos Alberto Vallarino
Diretor Executivo SuplenteBernardo Acosta

86
BID INVEST
Mediante recomendação de seu presidente, a Diretoria Executiva nomeia o Gerente-Geral e CEO do BID Invest por maioria de quatro quintos dos votos. Sob a direção da Diretoria Executiva e a supervisão geral do Presidente da Diretoria Executiva, o Gerente-Geral conduz os negócios correntes do BID Invest. Em consulta com a Diretoria Executiva e seu Presidente, responde pela organização, nomeação e demissão de executivos e funcionários. O Gerente-Geral, que pode participar das reuniões da Diretoria Executiva, determina a estrutura operacional do BID Invest e pode modificá-la para acompanhar a evolução das necessidades da organização.
Para cumprir sua missão de desenvolvimento, o BID Invest conta com 478 funcionários distribuídos em cinco departamentos. Do total, 30% estão em 24 dos 26 escritórios na ALC: Argentina, Bahamas, Barbados, Belize, Brasil, Bolívia, Chile, Colômbia, Costa Rica, El Salvador, Equador, Guatemala, Guiana, Haiti, Honduras, Jamaica, México, Panamá, Paraguai, Peru, República Dominicana, Suriname, Trinidad e Tobago e Uruguai. O restante do pessoal está lotado na sede do BID Invest em Washington, D.C.
ADMINISTRAÇÃO
PESSOAL

18. INFORMAÇÕES DE CONTATO POR PAÍS

88
BID INVEST
SEDE: 1350 New York Avenue, NW, Washington, DC 20577 Estados Unidos da América Tel.: +1 (202) 623-3900Fax: +1 (202) 623-3815
NA REGIÃO
1. ARGENTINA Esmeralda 130 Piso 17 C1035ABD, Buenos Aires Tel.: + (54 11) 4320-1800 Fax: + (54 11) 4320-1831/7
2. BARBADOS “Hythe” Welches Maxwell Main Road BB17068, Christ Church Tel.: + (1-246) 627- 8500 Fax: + (1-246) 429-8869
3. BELIZE1024 Newtown Barracks 101 1st Floor Marina Towers Building, Belize City Tel.: + (501) 221-5300 Fax: + (501) 221-5312
4. BOLÍVIAAv. 6 de Agosto # 2818, Zona de San Jorge La Paz Tel.: + (591) -2217-7739
5. BRASIL Alameda Santos, 2300 Ed. Haddock Santos, 2º andar, 01418-200 São Paulo, SPTel.: + (55 11) 3317-4200 Fax: + (55-1 1) 3321-3112
6. COSTA RICA Centro Corporativo El Cedral Edificio A. Piso 4300 mts Este del Peaje Autopista Próspero Fernández Trejos Montealegre, Escazú Apartado postal 1343-1250 San José Tel:+ (506) 2588-8748
7. CHILEAvda. Pedro de Valdivia 0193 Pisos 10 y 11, Providencia, Santiago Tel.: + (562) 2431- 3707/3719 Fax: + (562) 2374-2436
8. COLÔMBIACarrera 7 No. 71-21, Torre B, Piso 19 Edificio Davivienda Bogotá Tel.: + (571) 325-7000 Fax: + (571) 325-7057
9. REPÚBLICA DOMINICANA Calle Luis F. Thomen Esquina Winston Churchill Torre BHD, piso 10, Santo Domingo Tel.: + (1-809) 784-6400 Fax: + (1-809) 562-2607
10. EQUADORAvda. 12 de Octubre N24-528 y Cordero Edificio World Trade Center - Torre II, Piso 9, Quito Tel.: + (5932) 299-6900 Fax: + (5932) 299-6969
11. EL SALVADOR Edificio World Trade Center Torre 1, 4º Nivel Calle El Mirador y 89 Avenida Norte San Salvador Tel.: + (503) 2233-8900 ext. 2201 Fax: + (503) 2233-8921
12. GUATEMALA 3era Avenida 13 -78, Zona 10 Torre Citigroup - 10º Nivel, Ciudad de Guatemala Tel.: + (502) 2327-4300 Fax: + (502) 2379-9301
13. GUIANA47-High Street, Kingston, GeorgetownTel.: + (592) 225-7951 Fax: + (592) 225-7138
14. HAITI Bourdon 389 Boite Postale 1321 Port- au-Prince Tel.: + (509) 2812-5000/5048
15. HONDURASColonia Lomas del Guijarro Sur Primera Calle, Tegucigalpa Tel.: + (504) 2290-3500 Fax: + (504) 239-5752
16. JAMAICA 40-46 Knutsford Boulevard 6th Floor, KingstonTel.: + (876) 764-0815/0852
17. MÉXICOAvenida Paseo de la Reforma Nº 222 Piso 11 Colonia Juárez, Delegación Cuauhtémoc México, D.F. 06600 Tel.: + (52-55) 5141-2492
18. NICARÁGUABoulevard Jean Paul Genie, de la Rotonda Jean Paul Genie 970 mts al oeste (M/D) Managua Tel.: + (505) 2264-9140Fax: + (505) 2264-9153
19/ PANAMÁTower Financial Center, Piso 23 Calle 50 y Elvira Méndez Panamá Tel.: + (507) 0927 Fax: + (507) 206-2060999
20. PARAGUAI Quesada 4616 esq. Legión Civil Extranjera – Piso 1 Asunción Tel.: + (595 21) 616-2320 Fax: + (595 21) 616-2261
21. PERUCalle Dean Valdivia No. 148 piso 10 Lima 27 Tel.: + (511) 215-7800 Fax: + (511) 442-3466
22. SURINAMEPeter Bruneslaan 2-4, Paramaribo Tel.: + (597) 52-1201 Fax: + (597) 52-1229
23. TRINIDAD E TOBAGO17 Alexandra Street, St. Clair, Port of Spain Tel.: + (1-868) 822- 6400 Fax: + (868) 622-6047
24. URUGUAI Rincón 640 11.000 Montevideo Tel.: + (598) 2915-3696Fax: + (598) 2916-2607

APÊNDICE 1: RESULTADOS E DEMONSTRAÇÕES FINANCEIRAS

US$ in thousands Year ended December 31Financial Highlights 2020 2019 2018 2017 2016Statement of IncomeTotal income (1) 192,668 223,063 170,168 134,229 111,575 Total income, net of borrowings expense (1) 144,711 178,493 143,556 117,189 99,020 Total other expenses (1) 153,175 130,265 119,500 99,635 81,249 Net income 6,888 43,871 24,056 17,554 17,771 Balance SheetTotal development related investments, net 4,176,889 2,445,809 1,690,355 963,938 851,569 Total assets 6,424,312 3,899,824 3,209,253 2,185,395 2,146,724 Borrowings 3,908,457 1,648,146 1,286,372 646,741 1,062,383 Equity 2,108,214 2,033,062 1,819,250 1,444,580 1,021,982 RatiosReturn on average assets 0.1 % 1.2 % 0.9 % 0.8 % 1.0 %Return on average equity 0.3 % 2.3 % 1.5 % 1.4 % 1.9 %Debt to equity 186 % 81 % 71 % 45 % 104 %Equity to assets 33 % 52 % 57 % 66 % 48 %Liquidity to total assets 33 % 35 % 46 % 55 % 59 %Allowance for credit losses to development related investments 4.8 % 4.7 % 4.3 % 5.2 % 4.1 %Non-performing loans 0.5 % 0.7 % 0.8 % 0.9 % 1.0 %
(1) IDB Invest refined its income statement presentation related to valuation adjustments on loans and debt securities in the development related investmentportfolio during 2020, impacting the 2020 and 2019 presentation only.
Definitions
Return on average assets: Net income divided by the average of current and previous year’s Total assets.Return on average equity: Net income divided by the average of current and previous year’s Equity. Debt to equity: Borrowings plus Interest and commitment fees payable divided by Equity.Equity to assets: Equity divided by Total assets.Liquidity to total assets: Cash and cash equivalents plus Investment securities divided by Total assets.Allowance for credit losses to development related investments: Allowance for credit losses divided by development related loans and debt securities at amortized cost. On January 1, 2020, IDB Invest adopted the current expected credit loss (CECL) model. This ratio is related to development related assets only, and does not consider the liability for undisbursed commitments and financial guarantees. Prior to 2020, this ratio was defined as Allowance for loan losses as a percentage of Loan portfolio.Non-performing loans: Nonaccrual loans over 90 days past due divided by total Loan portfolio.
Unaudited supplemental information - see accompanying accountants’ report
APPENDIX 1: FINANCIAL RESULTS AND STATEMENTS
90

Financial Results
IDB Invest marked its fifth year of operations of its expanded mandate after the private sector reform in 2016,
pursuing smart growth and a prudential approach in its COVID-19 response. With a clear focus to protect,
alleviate and reignite the private sector within its Regional Developing Member Countries (the LAC Region)
through a time of crisis, IDB Invest delivered a record program of operations financed with a record-setting
funding program in 2020. At the same time, IDB Invest made progress towards key initiatives to fortify the
long-term stability and financial sustainability of the institution.
In 2020, IDB Invest also marked its fifth year of consecutive profits with net income of $6.9 million in 2020
(compared to $43.9 million for 2019). The reduction in net income compared to the prior year was mainly
driven by significant continued portfolio growth along with the recent global crisis triggered by COVID-19
resulting in a higher provision for credit losses of $75.1 million that was significantly impacted by the adoption
of CECL.
Total income, net of borrowings expense, amounted to $144.7 million in 2020. On a positive note, income
from gross development related investments on a larger outstanding portfolio grew by $51.8 million higher
despite a lower global interest rate environment. However, this was offset by an increase of $75.1 million in
provisions for credit losses as detailed above, and $15.6 million lower gains from the liquid assets portfolio.
These factors explain the decrease of $33.8 million in total income as compared to the prior year. An
additional contributor was $3.4 million higher borrowings expense on a $2.3 billion larger outstanding
borrowings portfolio at the end of 2020 compared to the end of 2019 driven by IDB Invest's benchmark bond
issuances under the Euro Medium Term Note Program to support its COVID-19 response.
Administrative expenses increased from $130.0 million in 2019 to $147.2 million in 2020 (or 13%). The main
driver for this increase was higher workforce expenses related to pension costs driven by historically low
discount rates detailed further below. Compared to gross development related investments growth of 71%,
the limited increase in workforce costs is a signal of IDB Invest's operational efficiencies and strategy towards
a results-oriented budget in its first five years of operations. IDB Invest also delivered on strengthening the
backbone with the creation of the Operations Division and investments in processes and systems
improvements.
Pension Plans and Post Retirement Benefit Plan
The volatility in the equity and credit markets affects the funded status of the Pension Plans and
Postretirement Benefits Plan. IDB Invest’s Pension Plans are 68% funded ($123.1 million underfunded) and
the Post Retirement Benefit Plan (PRBP) is 84% funded ($34.7 million underfunded) as of December 31,
2020. The funded status of the Pension Plans decreased by $45.2 million and the PRBP decreased by $16.9
million from 2019. The changes to the funded status of the Pension Plans and PRBP were driven by a
decrease in the discount rates of 73 bps and 71 bps, respectively, maintaining the trend of historically low
discount rates despite a recovery in asset values from the economic impacts of COVID-19 on financial
Unaudited supplemental information - see accompanying accountants’ report
91

markets. IDB Invest, in coordination with the IDB, actively monitors management strategies to address the
short-term and long-term performance of the Pension Plans and PRBP.
Development Related Investments
The COVID-19 pandemic spurred the adoption of alleviation measures at IDB Invest including an expansion
of new financial instruments and mobilization products, substantial increase in short-term financing, more
long-term commitments, and a continued expansion of local currency financing including in Trinidad and
Tobago dollars. IDB Invest entered into its first interest rate and cross currency swaps during 2020. These
swaps are used as risk management tools to hedge the interest and currency risks inherent in development
related assets and borrowings.
Assets Liabilities and capital(in US$million)
49.5 93.6 126.8(65.8) (97.6) (181.1)
1,590.62,175.9
3,782.799.0
270.8
443.9
66.6
96.6
131.4
1,469.4
1,360.5
2,120.6
$3,209.3
$3,899.8
$6,424.3
Dec-18 Dec-19 Dec-20
1,819.3 2,033.1 2,108.2
1,286.41,648.1
3,908.5
103.6
218.6
407.6
$3,209.3
$3,899.8
$6,424.3
Dec-18 Dec-19 Dec-20
Liquid assets Loans and debt securities at amortized cost
Other liabilities Borrowings CapitalEquity investmentsLoans and debt securities at fair value
Allowance for credit lossesOther assets
Unaudited supplemental information - see accompanying accountants’ report
92

IDB Invest’s gross development related investments, comprised of loans, debt securities and equity
investments, increased approximately 71% in 2020, from $2.5 billion in 2019 to $4.4 billion in 2020. In
addition, undisbursed commitments related to development related investments were 72% higher as
compared to the prior year, providing evidence of continued growth in IDB Invest’s portfolio.
Development related investments portfolio(in US$ million)
$1,756.2$1,756.2
$2,543.3$2,543.3
$4,358.0$4,358.0
1,590.6
2,175.9
3,782.7
99.0
270.8
443.9
66.6
96.6
131.4
Dec-18 Dec-19 Dec-20
Development related debt investments at amortized cost
Development related debt investments at fair value
Equity investments
Allowance for credit losses$(65.8) $(97.6) $(181.1)
Asset Quality
IDB Invest’s gross development related investments portfolio continued to grow from prior year end while
maintaining a consistent level of portfolio credit quality over the period of growth. The allowance for credit
losses as a percentage of development related investments outstanding remained constant compared to the
end of 2019 (4.8% at the end of 2020 vs. 4.7% at the end of 2019). Also, the ratio of impaired loans to loan
portfolio outstanding improved from 1.5% in 2019 to 0.8% in 2020. Further, despite the LAC Region facing the
challenges of the COVID-19 pandemic, the ratio of development related debt investments portfolio past due
90 days compared to the total portfolio decreased slightly from 0.7% at the end of 2019 to 0.5% at the end of
Unaudited supplemental information - see accompanying accountants’ report
93

2020, demonstrating the limited impact to date of the pandemic on the portfolio and continued health of the
portfolio.
Capital, Leverage and Liquidity Adequacy
During 2020, IDB Invest’s total capital increased by 4%, from $2.0 billion in 2019 to $2.1 billion in 2020. This
increase in IDB Invest’s capital base resulted from $184.7 million in capital contributions during 2020
contributing to $1.3 billion in total capital contributions received under the Second General Capital Increase
demonstrating continued shareholder support. Positive net income further improved IDB Invest's capital base
that was partially offset by accumulated other comprehensive losses of $70.2 million, primarily comprised of
unrealized valuation adjustment losses on pension obligations and losses in the fair value of borrowings
resulting from changes in IDB Invest's own credit risk spread.
Capital ContributionsAs of December 31, 2020 (in US$ million)
Total GCI-II capital contributions: $1,311.1
1st, 2nd, 3rd, 4th and 5th installments received under GCI-II6th installment received under GCI-IIIncome distributions (transfers) from IDB on behalf of its shareholdersAdvance payments
IDB Invest has a solid financial risk management framework. In 2020, IDB Invest’s capital adequacy ratio,
liquidity coverage ratio and debt to equity ratio remained in full compliance with financial risk management
policies and targets.
IDB Invest’s solvency and liquidity ratios remained within established thresholds in 2020 despite the events
caused by the COVID-19 crisis. IDB Invest’s capital-to-total-assets ratio shifted to 33% at the end of 2020 as
compared to 52% at the end of 2019 as a result of the aforementioned portfolio growth. The leverage ratio
Unaudited supplemental information - see accompanying accountants’ report
94

maintained below the maximum of 3.0x established by the Agreement Establishing the Inter-American
Investment Corporation, with a debt-to-equity ratio of 186% in 2020 compared to 81% in 2019. IDB Invest’s
liquidity-to-total-assets ratio was 33% in 2020 (35% in 2019) and the liquidity-to-debt ratio was 54% in 2020
(82% in 2019).
The soundness of IDB Invest's business and financial profiles was reflected in its external ratings. As of
December 31, 2020, IDB Invest was rated AAA, Aa1, and AA by Fitch1, Moody’s and S&P, respectively.
Unaudited supplemental information - see accompanying accountants’ report
1On February 2, 2021, Fitch Ratings revised its outlook from stable to negative.
95

APÊNDICE 2:FORÇA-TAREFA SOBRE DIVULGAÇÕES FINANCEIRAS RELACIONADAS AO CLIMA
96

KPMG LLPSuite 120001801 K Street, NWWashington, DC 20006
KPMG LLP, a Delaware limited liability partnership and a member firm of the KPMG global organization of independent member firms affiliated with KPMG International Limited, a private English company limited by guarantee.
Independent Auditors’ Report
The Board of Governors Inter-American Investment Corporation:
We have audited the accompanying financial statements of Inter-American Investment Corporation (the Corporation), which comprise the balance sheets as of December 31, 2020 and 2019, the related income statements and the statements of comprehensive income/(loss), changes in capital and cash flows for the years then ended, and the related notes to the financial statements.
Management’s Responsibility for the Financial Statements
Management is responsible for the preparation and fair presentation of these financial statements in accordance with U.S. generally accepted accounting principles; this includes the design, implementation, and maintenance of internal control relevant to the preparation and fair presentation of financial statements that are free from material misstatement, whether due to fraud or error.
Auditors’ Responsibility
Our responsibility is to express an opinion on these financial statements based on our audits. We conducted our audits in accordance with auditing standards generally accepted in the United States of America. Those standards require that we plan and perform the audit to obtain reasonable assurance about whether the financial statements are free from material misstatement.
An audit involves performing procedures to obtain audit evidence about the amounts and disclosures in the financial statements. The procedures selected depend on the auditors’ judgment, including the assessment of the risks of material misstatement of the financial statements, whether due to fraud or error. In making those risk assessments, the auditor considers internal control relevant to the entity’s preparation and fair presentation of the financial statements in order to design audit procedures that are appropriate in the circumstances, but not for the purpose of expressing an opinion on the effectiveness of the entity’s internal control. Accordingly, we express no such opinion. An audit also includes evaluating the appropriateness of accounting policies used and the reasonableness of significant accounting estimates made by management, as well as evaluating the overall presentation of the financial statements.
We believe that the audit evidence we have obtained is sufficient and appropriate to provide a basis for our audit opinion.
Opinion
In our opinion, the financial statements referred to above present fairly, in all material respects, the financial position of Inter-American Investment Corporation as of December 31, 2020 and 2019, and the results of its operations and its cash flows for the years then ended in accordance with U.S. generally accepted accounting principles.
97
Emphasis of Matter
As discussed in Note 2 to the financial statements, in 2020, the Corporation adopted new accounting guidance related to the recognition and measurement of credit losses under Accounting Standards Update (ASU) 2016-13, Financial Instruments – Credit Losses (Topic 326): Measurement of Credit Losses on Financial Instruments and other related ASUs. Our opinion is not modified with respect to this matter.
Washington, District of Columbia March 3, 2021
98

INTER-AMERICAN INVESTMENT CORPORATIONFinancial Statements December 31, 2020 and 2019
99

Expressed in thousands of United States dollars Notes December 31, 2020 December 31, 2019Assets
Cash and cash equivalents 3 $ 41,592 $ 22,749
Investment securities 3 & 10 2,079,036 1,337,664
Development related investments
Loans and debt securities
At amortized cost 3,782,696 2,175,921
Allowance for credit losses (181,098) (97,614)
3,601,598 2,078,307
At fair value 443,883 270,827
4,045,481 2,349,134
Equity investments
At cost-based measurement alternative 4,695 4,695
At fair value 126,713 91,980
131,408 96,675
Total development related investments, net 4 & 10 4,176,889 2,445,809
Derivative assets 8 5,461 —
Receivables and other assets 5 121,334 93,602
Total assets 6,424,312 3,899,824
LiabilitiesBorrowings 7
At amortized cost 1,792,818 1,648,146
At fair value 2,115,639 —
3,908,457 1,648,146
Derivative liabilities 8 1,834 —
Payables and other liabilities 6 405,807 218,616
Total liabilities 4,316,098 1,866,762 Capital
Capital, par value 1,640,850 1,573,500
Additional paid-in-capital 593,835 546,751
Receivable from members (217,596) (287,840)
Total paid-in-capital 9 2,017,089 1,832,411
Retained earnings 239,882 279,227
Accumulated other comprehensive income/(loss) (148,757) (78,576)
Total capital 2,108,214 2,033,062
Total liabilities and capital $ 6,424,312 $ 3,899,824
Inter-American Investment Corporation
Balance Sheets
The accompanying notes are an integral part of these financial statements
100

Year ended December 31Expressed in thousands of United States dollars Notes 2020 2019Income from development related investments
Development related investmentsLoans and debt securities
Interest and other income $ 185,900 $ 134,067 (Provision)/release of provision for credit losses (111,756) (36,697)
74,144 97,370 Equity investments
Realized gain/(loss) from sales, dividends and other income, net 1,185 2,835 Unrealized gain/(loss) from changes in fair value and measurement adjustments, net 100 229
1,285 3,064 Income from development related investments, net 4 75,429 100,434
Gain/(loss) from liquid assets, net 3 22,310 37,920
Borrowings expense 7 (47,957) (44,570)
Other incomeService fees from related parties 13 85,876 77,420 Mobilization fees and other income 9,053 7,289
Total other income 94,929 84,709
Income/(expense) from development related investments, liquid assets and other income, net of borrowings expense 144,711 178,493
Other expensesAdministrative expenses 147,160 130,031 Other components of pension benefit costs, net 14 2,032 (4,119) Other expenses 3,983 4,353
Total other expenses 153,175 130,265
Gain/(loss) from changes in fair value on non-trading portfolios and foreign exchange transactions, net 15,352 (4,357) Net income/(loss) $ 6,888 $ 43,871
Inter-American Investment Corporation
Income Statements
The accompanying notes are an integral part of these financial statements
101

Statements of Comprehensive Income/(Loss)
Year ended December 31
Expressed in thousands of United States dollars Notes 2020 2019
Net income/(loss) $ 6,888 $ 43,871
Other comprehensive income/(loss)Recognition of net actuarial losses and prior service credit on Pension Plans and Postretirement Benefit Plan 14 (46,178) (50,064) Recognition of unrealized gain/(loss) related to available-for-sale securities, net 3 (3,172) 9,800 Net fair value adjustments on borrowings attributable to changes in instrument-specific credit risk 7 (20,831) —
Total other comprehensive income/(loss) (70,181) (40,264)
Comprehensive income/(loss) $ (63,293) $ 3,607
Statements of Changes in Capital
Expressed in thousands of United States dollars, except for share information Notes Shares
Total paid-in capital
Retained earnings
Accumulated other
comprehensive income/(loss)
Total capital
As of December 31, 2018 154,286 $ 1,622,206 $ 235,356 $ (38,312) $ 1,819,250 Year ended December 31, 2019
Net income/(loss) — 43,871 — 43,871
Other comprehensive income/(loss) — — (40,264) (40,264)
Change in shares 9 3,064
Payments received for capital 210,205 — — 210,205
As of December 31, 2019 157,350 1,832,411 279,227 (78,576) 2,033,062 Year ended December 31, 2020
Cumulative effect of adoption of ASU 2016-13 2 — (46,233) — (46,233)
Net income/(loss) — 6,888 — 6,888
Other comprehensive income/(loss) — — (70,181) (70,181)
Change in shares 9 6,735
Payments received for capital 184,678 — — 184,678
As of December 31, 2020 164,085 $ 2,017,089 $ 239,882 $ (148,757) $ 2,108,214
Inter-American Investment CorporationStatements of Comprehensive Income/(Loss)
Statements of Changes in Capital
The accompanying notes are an integral part of these financial statements
102

Year ended December 31Expressed in thousands of United States dollars 2020 2019Cash flows from investing activities
Loan disbursements $ (2,972,509) $ (1,320,894) Loan proceeds 1,241,298 772,450 Equity investment disbursements (50,798) (37,624) Equity investment proceeds 16,323 9,993 Development related debt securities purchases (97,401) (205,813) Development related debt securities proceeds 38,519 413 Available-for-sale security purchases — (187,271) Available-for-sale security proceeds — 732,777 Capital asset expenditures (4,697) (3,835)
Net cash provided by/(used in) investing activities $ (1,829,265) $ (239,804) Cash flows from financing activities
Proceeds from issuance of borrowings 2,302,519 980,416 Borrowings repayments (35,187) (620,000) Payments received for capital 184,678 210,205
Net cash provided by/(used in) financing activities $ 2,452,010 $ 570,621 Cash flows from operating activities
Net income/(loss) 6,888 43,871 Adjustments to reconcile net income/(loss) to net cash provided by/(used in) operating activities:
Change in fair value of equity investments and measurement adjustments (100) (229)Provision/(release) of provision for credit losses 111,756 36,697(Gain)/loss from investment securities, net (6,846) (10,828)Depreciation and amortization (2,934) (2,818) (Gain)/loss from changes in fair value on non-trading portfolios and foreign exchange transactions, net (15,352) 4,357 Realized (gain)/loss on sales of equity investments, net (922) (2,541)
Change in receivables and other assets (28,060) (59,701)Change in payables and other liabilities 50,674 74,234Change in Pension Plans and Postretirement Benefit Plan, net 15,903 1,618 Change in investment securities (737,698) (403,822) Other, net 3,331 1,425
Net cash provided by/(used in) operating activities $ (603,360) $ (317,737) Change in cash and cash equivalents 19,385 13,080 Effect of exchange rate changes on cash and cash equivalents, net (542) 22Net increase/(decrease) in cash and cash equivalents $ 18,843 $ 13,102 Cash and cash equivalents as of January 1 22,749 9,647 Cash and cash equivalents as of December 31 $ 41,592 $ 22,749 Supplemental disclosure:
Change in ending balances resulting from currency exchange rate fluctuations:Investment securities (6,687) 3,689 Loans (1,065) 2,072 Debt securities (18,486) (4,780) Borrowings 26,176 (910)
Gain/(loss) on foreign exchange transactions, net (62) 71Interest paid during the period 40,621 44,569
Inter-American Investment Corporation
Statements of Cash Flows
The accompanying notes are an integral part of these financial statements
103

1. Purpose
The Inter-American Investment Corporation (the IIC or IDB Invest), an international organization, was established in 1986 and began operations in 1989, and is owned by its member countries. These members include 26 regional developing member countries, all of which are located in Latin America and the Caribbean (the Regional Developing Member Countries), and 21 members from non-regional countries. The purpose of IDB Invest is to promote the economic development of its Regional Developing Member Countries by encouraging the establishment, expansion, and modernization of private enterprises in such a way as to supplement the activities of the Inter-American Development Bank (IDB). IDB Invest provides financing through its development related investments that include loans, investments in debt securities, guarantees and equity investments where sufficient capital is not otherwise available on adequate terms in the market. IDB Invest also arranges additional project funding from other investors and lenders, either through joint financing or through loan syndications, loan participations and guarantees. In addition, IDB Invest provides financial and technical advisory services to clients. IDB Invest is an autonomous international organization and a member of the Inter-American Development Bank Group (the IDB Group), which also includes the IDB and the Multilateral Investment Fund (commercially known as IDB Lab).
2. Summary of Significant Accounting Policies
Basis of presentation – These financial statements are prepared in accordance with generally accepted accounting principles in the United States of America (US GAAP). References to US GAAP issued by the Financial Accounting Standards Board (FASB) in these notes are to the FASB Accounting Standards Codification (ASC) or Accounting Standards Update (ASU).
All amounts presented in the accompanying financial statements and notes are expressed in United States dollars (USD, US$ or $), which is IDB Invest’s functional and reporting currency.
Use of estimates – The preparation of the financial statements requires management to make estimates and assumptions that affect the reported amounts of assets and liabilities, the disclosure of contingent assets and liabilities at the date of the financial statements and the reported amounts of revenues and expenses during the reporting period. Actual results could differ from those estimates. A significant degree of judgment has been used in the determination of: the adequacy of the allowance for credit losses; the evaluation for other-than-temporary impairment on available-for-sale and held-to-maturity debt securities and equity investments; the fair value of investment securities, loan and equity investments, debt securities, derivative instruments and borrowings; the determination of the projected benefit obligations of the pension and postretirement benefit plans; the fair value of plan assets, and the funded status and net periodic benefit cost associated with these plans. There are inherent risks and uncertainties related to IDB Invest’s operations including the potential impacts of changing economic conditions on IDB Invest’s clients and the global investment markets that could have an adverse effect on the financial position of IDB Invest.
Cash and cash equivalents – Highly liquid investments purchased with original maturities of three months or less are considered cash equivalents. IDB Invest may hold cash deposits in excess of Federal Deposit Insurance Corporation (FDIC) insured limits. In addition, cash and cash equivalents include restricted cash for project related activities.
Liquid asset portfolio – IDB Invest's liquid asset portfolio consists of Cash and cash equivalents1 and Investment securities. IDB Invest's overall portfolio management strategy is to provide liquidity and resources to finance development related investments and to invest in money market funds and debt securities issued by
Inter-American Investment Corporation
Notes to Financial Statements
1 References to captions in the financial statements are identified by the name of the caption beginning with a capital letter every time theyappear in the notes to the financial statements.
104

corporations, governments, supranationals and agencies (Investment securities). These investments may include fixed and floating rate bonds, notes, bills, certificates of deposit, commercial paper and mutual funds.
Securities are classified based on management’s intention on the date of purchase. Purchases and sales of securities are recorded on a trade date basis. The first-in, first-out method is used to determine the cost basis of securities sold. Within the liquid asset portfolio, Investment securities are classified as trading and are recorded at fair value with unrealized gains and losses reported in income from Gain/(loss) from liquid assets, net. For the year ended December 31, 2019, Investment securities classified as available-for-sale are carried at fair value with net unrealized gains or losses reported in Other comprehensive income/(loss). Available-for-sale debt securities are evaluated for other-than-temporary impairment. For impairments that are deemed to be other-than-temporary, the credit portion of the loss is recognized in income and the non-credit portion is recognized in Other comprehensive income/(loss). Interest and dividends on securities, amortization of premiums, accretion of discounts, and realized gains and losses from both trading and available-for-sale debt securities are reported in income from Gain/(loss) from liquid assets, net.
As a result of management's conclusion that IDB Invest's business model requires greater available liquidity to meet strategic business needs, IDB Invest did a one-time reclassification of its remaining available-for-sale debt securities into the trading portfolio on January 1, 2020. Unrealized gains of $3.2 million previously recorded to Accumulated other comprehensive income were recognized in income on the date of transfer.
Loans and development related debt securities (Development related debt investments) – Loans and debt securities in the development related investments portfolio are recorded when disbursed. As described in Note 4, these development related debt investments are carried at amortized cost or fair value through income, depending on the nature of the instrument. Debt securities designated as held-to-maturity (HTM) and carried at amortized cost and loans carried at amortized cost are adjusted for an allowance for expected credit losses. IDB Invest utilizes the net asset value (NAV) as a practical expedient for the fair value measurement for certain development related debt securities.
For credit monitoring and portfolio management purposes, the development related debt investments portfolio includes loans and debt securities. Loans are classified into three portfolio segments: corporates, financial institutions and project finance. Debt securities are classified as corporate securities.
IDB Invest’s loans may be secured or unsecured. Secured loans may be guaranteed by mortgages and other forms of collateral security, as well as third-party guarantees. IDB Invest also enters into standalone insurance contracts as a form of credit enhancements that are generally not transferable. IDB Invest estimates its recovery assets under these contracts and records them as Receivables and other assets in the balance sheets and as Interest and other income in the income statements.
Guarantees – IDB Invest offers credit guarantees covering, on a risk-sharing basis, third party obligations on loans undertaken for or securities issued in support of projects located within Regional Developing Member Countries to enhance their credit standing and enable them to complete a wide variety of business transactions. These financial guarantees are commitments issued by IDB Invest to guarantee payment performance by a borrower to a third party. IDB Invest’s policy for requiring collateral security with respect to these instruments and the types of collateral security held is generally the same as for loans. Guarantees are regarded as issued when IDB Invest executes the guarantee agreement, outstanding when the underlying financial obligation of the third party is incurred and called when IDB Invest’s obligation under the guarantee has been invoked. There are two obligations associated with the guarantees: (1) the stand-ready obligation to perform; and (2) the contingent obligation to make future payments. The stand-ready obligation to perform is recognized at the issuance date at fair value. The contingent liability associated with the financial guarantee is recognized following the current expected credit losses (CECL) methodology. Any stand-ready and contingent liabilities associated with the guarantees are included in Payables and other liabilities in the balance sheets. The expense related to the contingent liability is recorded in (Provision)/release of provision for credit losses on development related investments in the income statements. Guarantee fee income is recognized as IDB Invest is released from risk and its stand-ready obligation to perform and recorded in Interest and other income in the income statements. In the event the guarantees are called, the amount disbursed is recorded as a loan and reserves are established based on the expected credit loss.
Inter-American Investment Corporation
Notes to Financial Statements
105

Undisbursed commitments – Under CECL, IDB Invest estimates expected credit losses over the contractual period in which it is exposed to credit risk through a contractual obligation to extend credit unless management has the discretion to cancel the commitment at any time (unconditionally cancellable). The estimate considers the likelihood that funding will occur and the expected credit losses on estimated funded commitments over its estimated life. Liability for off-balance sheet credit losses is recorded as a contingent liability and included in Payables and other liabilities in the balance sheets. The expense related to the contingent liability is recorded in (Provision)/release of provision for credit losses on development related investments in the income statements.
Allowance for credit losses – The allowance for expected credit losses considers historical credit loss information that is adjusted for current conditions and reasonable and supportable (R&S) forecasts of future economic conditions in the related portfolio as of the balance sheet date and is recorded as a reduction of the respective development related debt investments carried at amortized cost (loans and HTM debt securities) and as a contingent liability for undisbursed commitments and guarantees (related off-balance sheet credit exposures). Changes in the allowance for credit losses are recorded through the (Provision)/release of provision for credit losses in the income statements.
Expected credit losses are estimated over the contractual term of the development related debt investment in accordance with its current estimate of the collectability risk over the contractual life of such asset and for related off-balance sheet exposures over the contractual period in which IDB Invest is exposed to credit risk via a present contractual obligation to extend credit. The contractual term excludes expected extensions, renewals, and modifications unless either of the following applies: (i) management has a reasonable expectation at the reporting date that a troubled debt restructuring (TDR) will be executed with an individual borrower or (ii) the extension or renewal options are included in the original or modified contract at the reporting date and are not controlled by IDB Invest (not unconditionally cancellable by IDB Invest). Expected credit losses are estimated over the contractual term adjusted for expected prepayments. Prepayment assumptions are based on historical data from IDB's private sector portfolio given the common portfolio characteristics that include borrower's country, risk rating and industry sector.
IDB Invest assesses credit risk for development related debt investments using a series of sector specific scorecards to determine borrower risk ratings. IDB Invest's portfolio segments — corporates, financial institutions and project finance — are aligned to the scorecards.
The major credit risk factors considered for a project finance development related debt investment may be grouped into the following categories: political risk, commercial or project risk, technical and construction risk, and financial risk. Political risks can be defined as the risks to a project’s financing emanating from governmental sources, either from a legal or regulatory perspective. Commercial or project risks are related to the construction or completion risks, economic or financial viability of a project and operational risks. Financial risks consider the project’s exposures to cash flow generation, interest rate and foreign currency volatility, inflation risk, liquidity risk, and funding risk.
The major credit risk factors considered for a development related debt investment to financial institutions considers country-related risk including regulatory, competition, government support and macro-economic risks, which acts as an anchor for the risk assessment as a whole. Additionally, the rating scorecard assesses the following institution-specific factors: capital adequacy, asset quality, operating policies & procedures and risk management framework; quality of management and decision making; earnings and market position, liquidity and sensitivity to market risk; quality of regulations and regulatory agencies; and potential government or shareholder support.
The major credit risk factors considered for corporate development related debt investments are country and industry risks, business and market risks, an assessment of the borrower’s management, and financial risks, including a qualitative assessment of financial risks and a quantitative assessment of financial ratios. After consideration of these borrower specific characteristics, extraordinary support from shareholders or from the government may be considered if applicable.
The CECL methodology incorporates Point in Time (PIT) term structures for probability of default (PD), loss given default (LGD) term structures and exposure at default (EAD). In addition, the methodology incorporates forward looking conditioning, which takes into consideration current market conditions, macroeconomic
Inter-American Investment Corporation
Notes to Financial Statements
106

forecasts and their corresponding impact to the PIT PDs and LGDs. The macroeconomic forecasts in the CECL model include various scenarios, where each scenario represents a different state of the economy in the R&S period. For each scenario, a lifetime loss rate for each instrument is calculated using the appropriate PD and LGD for every quarter for the remaining life of the instrument. The results are then multiplied by the instrument’s amortized cost. If multiple scenarios are considered, then results are weighted.
Management currently considers the R&S period to be three years, after which the model reverts to historical averages for long-term values over a two year period. IDB Invest uses PDs published by international rating agencies for similarly rated credits to determine PDs.
To augment the quantitative process described above, qualitative adjustments arising from information lags implicit in the quantitative loss estimation models, known model or data limitations, significant changes in portfolio composition or lending operations and uncertainty associated with economic and business conditions are applied as necessary based on management judgment.
The recent global crisis triggered by the COVID-19 pandemic has had a direct effect on economies within IDB Invest's Regional Developing Member Countries. The crisis affected risk parameters of the portfolio, such as internal ratings in specific industries and countries. These parameters are considered in the CECL methodology, as well as the deterioration in the macroeconomic forecasts during the R&S period and mean reverting period to historical losses.
For individually assessed development related debt investments, the determination of the allowance for identified probable losses reflects management’s best judgment of the creditworthiness of the borrower and is established based upon the periodic review of individual development related debt investments. This estimate considers all available evidence including, as appropriate, the present value of the expected future cash flows discounted at the development related debt investment’s contractual effective rate, the fair value of collateral less disposal costs, and other market data. Due to the nature of the development related debt investments, secondary market values are usually not available.
IDB Invest considers a development related debt investment impaired when, based on current information and events, it is probable that IDB Invest will be unable to collect all amounts due according to the investment’s contractual terms. Information and events considered in determining that an investment is impaired include the borrower’s financial difficulties, the borrower’s competitive position in the marketplace, the risk associated with the underlying collateral, the willingness and capacity of the sponsor who organized the project to support the investment, the borrower’s management team, as well as geopolitical conflict and macroeconomic crises.
A modification is considered a TDR when the borrower is experiencing financial difficulty and IDB Invest has granted a concession to the borrower that it otherwise would not grant in order to maximize recoveries on the existing development related debt investment. A development related debt investment restructured under a TDR is considered impaired, until its extinguishment, but it does not need to be disclosed as such after the year it was restructured, if the restructuring agreement specifies an interest rate equal to or greater than the rate that IDB Invest was willing to accept at the time of the restructuring for a new investment with comparable risk, and the investment is not impaired based on the terms specified in the restructuring agreement. In light of the COVID-19 pandemic, IDB Invest implemented COVID-19 loan modification measures in response to requests received from borrowers for short-term modifications such as payment deferrals under existing loans that meets the Interagency Statement2. Additional information is included in Note 4.
Development related debt investments are partially or fully written off when IDB Invest has exhausted all possible means of recovery through a legal agreement, final bankruptcy settlement or when IDB Invest has determined with a reasonable degree of certainty that the relevant amount will not be collected. IDB Invest reduces the investment and related allowance for credit losses. Such reductions in the allowance are partially offset by recoveries, if any, associated with previously written off development related debt investments.
Inter-American Investment Corporation
Notes to Financial Statements
2 The Interagency Statement on Loan Modifications and Reporting for Financial Institutions Working with Customers Affected by theCoronavirus was issued jointly by the Board of Governors of the Federal Reserve System, the Federal Deposit Insurance Corporation, the National Credit Union Administration, the Office of the Comptroller of the Currency, and the Consumer Financial Protection Bureau.
107

Revenue recognition on development related debt investments – Interest on development related debt investments is included in Interest and other income from development related investments, net in the income statements. Accrued interest income receivable is presented separately from development related debt investments and is included in the balance sheets in Receivables and other assets. IDB Invest has elected the practical expedient permissible under CECL to not record an allowance for credit losses on accrued interest receivable as it has a substantive nonaccrual policy.
Development related debt investments are generally placed in nonaccrual status when collectability is in doubt or payments of interest or principal are past due more than 90 days. IDB Invest does not accrue income and ceases amortization of any premiums or discounts on development related debt investments in nonaccrual status. Any uncollected interest accrued on a development related debt investment placed in nonaccrual status is reversed out of income and is thereafter recognized as income in Interest and other income in the income statements when the payment is received. A development related debt investment is returned to accrual status once management has concluded that the borrower has demonstrated its ability to make periodic interest and principal payments.
Development related debt investment fees and costs, net, are deferred and amortized over the life of the asset on a straight-line basis. Amortization of the net deferred fees and costs is included in Interest and other income in the income statements thereby approximating how fees and costs would be reflected under the effective interest method. The net deferred amounts are included in Payables and other liabilities in the balance sheets.
Equity investments – Equity investments include certain ownership interests in limited partnerships and similar fund structures (LPs) and direct equity investments primarily in small and medium-sized enterprises and financial institutions.
Equity investments under ASC 321, Investments–Equity Securities, are accounted for at fair value through the income statements except for those investments without a readily determinable fair value that are accounted for under the cost-based measurement alternative.
IDB Invest utilizes the net asset value (NAV) reported by the fund managers as a practical expedient for the fair value measurement of interests in LPs. The NAVs that have been reported by the fund manager are derived from the fair values of the underlying investments.
Equity investments accounted for under the cost-based measurement alternative are recorded at cost less impairment plus or minus adjustments resulting from observable price changes in orderly transactions for the identical investment or a similar investment of the same issuer. Adjustments related to impairment and observable price changes, if any, are recorded in Unrealized gain/(loss) from changes in fair value and measurement adjustments, net in the income statements. IDB Invest reassesses periodically whether these equity investments continue to qualify for this cost-based measurement alternative. IDB Invest may subsequently elect to measure an equity investment at fair value; such election is irrevocable, and any resulting gains or losses would be recorded through income at the time of election and thereafter.
Equity investments accounted for under the cost-based measurement alternative are assessed for impairment periodically based on the latest financial information, operating performance and other relevant information including macroeconomic conditions, specific industry trends, the historical performance of the company, and IDB Invest’s intent to hold the investment for an extended period. When impairment is identified, the investment is written down to its estimated fair value, which becomes the new carrying value for the investment.
Revenue recognition on equity investments – Dividends and profit participations received from equity investments are recorded as income and reported as Realized gain/(loss) from sales, dividends and other income, net in the income statements on a cash basis when the distributions are received. Gains or losses on the sale or redemption of equity investments accounted for under the cost-based measurement alternative are recorded, at disposition, as income/(loss) and reported in Realized gain/(loss) from sales, dividends, and other income, net in the income statements.
Inter-American Investment Corporation
Notes to Financial Statements
108

For equity investments accounted for at fair value, unrealized gains and losses are recorded as Unrealized gain/(loss) from changes in fair value and measurement adjustments, net in the income statements. Disbursements and distributions are recorded as changes to the outstanding balance of these equity investments and reflected as such in Equity investments in the balance sheets.
Variable interest entities – ASC 810, Consolidation, provide for consolidation when a reporting entity is the primary beneficiary of a variable interest entity (VIE), or if an entity does not meet the definitional elements of a VIE, consolidation is required if a reporting entity has a controlling financial interest or holds a majority voting interest in an entity. Additional information about VIEs is included in Note 4.
Revenue recognition for service fees – IDB Invest recognizes income for services provided to related parties. A series of service level agreements (SLAs) define the nature of the services and corresponding fees for services provided to the IDB. The most significant of these services relates to loan origination and servicing performed on the IDB’s behalf. Revenue is recognized as IDB Invest fulfills its performance obligation over the annual service period. Similarly, IDB Invest receives project administration and general administrative fees for services provided to several special purpose trust funds affiliated with IDB Invest or the IDB. Additional information about related party transactions is included in Note 13.
Risk management and use of derivative instruments – IDB Invest uses derivative instruments primarily for market risk management purposes in connection with its principal business activities. IDB Invest enters into cross currency and interest rate swaps to manage foreign exchange and interest rate risks arising from mismatches between its development related debt investments and its borrowing liabilities. None are designated as hedging instruments as meant by ASC 815, Derivatives.
Derivatives are recognized in the balance sheet at their fair value and are classified as either Derivative assets or Derivative liabilities, depending on their net fair value amount. Changes in fair value of derivatives are recorded in Gain/(loss) from changes in fair value on non-trading portfolios and foreign exchange transactions, net in the income statements. Additional information about derivatives is included in Note 8.
Fixed and intangible assets – Fixed and intangible assets (software costs) are presented at cost less accumulated depreciation and amortization and are included in Receivables and other assets in the balance sheets. Depreciation and amortization are recognized using the straight-line method over the estimated useful lives of the assets that range from three to seven years.
Leases – In accordance with ASC 842, Leases, IDB Invest recognizes lease assets and lease liabilities in the balance sheets. IDB Invest follows lessee accounting related to its operating leases for office space with the IDB at headquarters and in its Regional Developing Member Countries.
IDB Invest recognizes a right-of-use asset and lease liability for its operating leases. The right-of-use assets are nonmonetary assets included in Receivable and other assets in the balance sheets and are amortized based on each period’s discounted cash flows, and the lease liabilities are monetary liabilities included in Payables and other liabilities in the balance sheets and are reduced based on each period’s discounted cash flows. IDB Invest remeasures its lease liabilities originating in currencies other than US$ at the current market exchange rate in effect at each reporting date. Operating lease expense is recorded on a straight-line basis and included in Administrative expenses in the income statements. Additional information related to IDB Invest’s leases is included in Notes 5, 6 and 12.
Borrowings – To ensure funds are available for its operational liquidity needs, IDB Invest accesses the international capital markets, offering its debt securities to investors. IDB Invest’s borrowings are carried at amortized cost or fair value in the balance sheets.
For those borrowings carried at amortized cost, the amortization of premiums and accretion of discounts is calculated following a methodology that approximates the effective interest method and is included in Borrowings expense in the income statements. The unamortized balance of the borrowing issuance costs
Inter-American Investment Corporation
Notes to Financial Statements
109

related to a recognized debt liability is included as a direct deduction from the carrying amount of the Borrowings in the balance sheets. Interest expense on all borrowings is recognized on an accrual basis and is included in Borrowings expense in the income statements.
For those borrowings carried at fair value, fair value changes are reported in accordance with ASU 2016-01, Financial Instruments. Accordingly, the change in fair value resulting from changes in instrument-specific credit risk is reported in Net fair value adjustments on borrowings attributable to changes in instrument-specific credit risk in the statements of other comprehensive income, while the remaining change in fair value is reported in Gain/(loss) from changes in fair value on non-trading portfolios and foreign exchange transactions, net and Borrowings expense in the income statements. Additional information about borrowings is included in Note 7.
Non-trading portfolio – IDB Invest's non-trading portfolio includes development related debt investments composed of loans and debt securities, derivatives, and borrowings accounted for at fair value. The reported income volatility resulting from these non-trading financial instruments is not fully representative of the underlying economics of the transactions as IDB Invest does not intend to actively trade such instruments. Therefore, Gain/(loss) from changes in fair value on non-trading portfolios and foreign currency transactions, net, are reported separately from Income/(expense) from development related investments, liquid assets and other income, net of borrowing expenses in the income statements.
Remeasurements of foreign currency transactions – Monetary assets and liabilities denominated in currencies other than the US$ are translated into US$ at market exchange rates prevailing at the balance sheet dates. Income and expenses are translated at the market exchange rate in effect at the transaction date or at monthly average rates. Resulting gains and losses from remeasurements are generally included in Gain/(loss) from changes in fair value on non-trading portfolios and foreign exchange transactions, net in the income statements.
Fair value measurements – The Codification requires entities to disclose information about recurring and non-recurring fair value measurements, as well as the fair value of financial instruments.
Fair value is defined as the price that would be received to sell an asset or paid to transfer a liability in an orderly transfer between market participants at the measurement date under current market conditions. Fair value measurement further assumes that a transaction to sell the asset or assume a liability takes place either in the principal market or, in the absence of a principal market, in the most advantageous market for the asset or liability.
In determining fair value, IDB Invest uses various valuation approaches, including market, income or cost approaches. The Codification establishes a hierarchy for inputs used in measuring fair value that maximizes the use of observable inputs and minimizes the use of unobservable inputs by requiring that the observable inputs be used when available. Observable inputs are inputs that market participants would use in pricing the asset or liability developed based on market data obtained from sources independent of IDB Invest. Unobservable inputs are inputs that reflect the best information available about the assumptions market participants would use in pricing the asset or liability developed based on the best information available in the circumstances. The hierarchy is broken down into three levels based on the reliability of inputs as follows:
• Level 1—Unadjusted quoted prices for identical assets or liabilities in active markets.
Assets and liabilities utilizing Level 1 inputs include debt securities and equity investments that are actively traded and primarily include debt securities of the United States government and agencies.
• Level 2—Valuations based on quoted prices for similar assets or liabilities in active markets; quotedprices for identical or similar assets or liabilities that are not actively traded; or pricing models for which allsignificant inputs are observable, directly or indirectly, for substantially the full term of the asset or liability.
Inter-American Investment Corporation
Notes to Financial Statements
110

Assets and liabilities utilizing Level 2 inputs include money market funds, investment securities that are not actively traded, and investments in obligations of banks, governments and agencies or instrumentalities other than the United States, sovereigns, local and regional governments, corporate bonds, and structured borrowings.
• Level 3—Valuations based on inputs that are unobservable and significant to the overall fair valuemeasurement.
Assets utilizing Level 3 inputs include loans, equity investments and development related debt securities and borrowings that are measured for impairment or disclosed at fair value.
The availability of observable inputs is affected by a wide variety of factors, including, for example, the type of product, and other characteristics particular to the transaction. To the extent fair value is based on models or inputs that are less observable or unobservable in the market, the determination of fair value requires more judgment. Accordingly, the degree of judgment exercised in determining fair value is greatest for instruments categorized in Level 3.
Fair value for the majority of IDB Invest’s financial instruments is derived using pricing models. Pricing models take into account the contract terms (including maturity) as well as multiple inputs, including, where applicable, interest rate yield curves, credit spreads, creditworthiness of the counterparty, option volatility, and currency rates. In accordance with ASC 820, Fair Value Measurements (ASC 820), the impact of IDB Invest’s own credit spreads would also be considered when measuring the fair value of liabilities. Where appropriate, valuation adjustments are made to account for various factors, including bid-ask spreads, credit quality, and market liquidity. These adjustments are applied on a consistent basis and are based upon observable inputs, where available.
Fair value option – The Fair Value Option (FVO) under ASC 825 permits the measurement of eligible financial assets, financial liabilities and firm commitments at fair value on an instrument-by-instrument basis, that are not otherwise permitted or required to be accounted for at fair value under other accounting standards. IDB Invest has elected the FVO for the following classes of financial assets and liabilities: i) certain development related investments in debt securities that IDB Invest does not have the ability and intent to hold until maturity, ii) certain development related investments with special features, iii) investments that would otherwise be accounted for under the equity method, iv) certain development related investments in equity securities that do not have quoted market prices, v) certain hybrid instruments that would otherwise require bifurcation of the host and embedded derivative, and vi) borrowings that are economically hedged with derivative financial instruments.
Financial assets and borrowings elected under the FVO are measured at fair value on a recurring basis and changes in fair value of these financial instruments are included in Gain/(loss) from changes in fair value on non-trading portfolios and foreign exchange transactions, net in the income statements. Interest income on these financial instruments is recognized on an accrual basis, where applicable.
Loan participations and co-financing arrangements – IDB Invest mobilizes funds from commercial banks and other financial institutions (Participants) by facilitating loan participations, without recourse. These loan participations are administered and serviced by IDB Invest on behalf of the Participants in exchange for a fee. Such fees are recognized upon receipt and are reported as Mobilization fees and other income in the income statements. IDB Invest also services co-financing arrangements with IDB Group related parties in exchange for a fee recognized upon receipt and are reported as Services fees from related parties in the income statements. The disbursed and outstanding balances of loan participations and co-financing arrangements that meet the applicable accounting criteria for sales are not included in IDB Invest’s balance sheets.
Pension and postretirement benefits – The IDB Group has three defined benefit pension plans: The Staff Retirement Plan (SRP), the Complementary Staff Retirement Plan (CSRP), and the Local Retirement Plan (LRP) (the Pension Plans and LRP), covering staff of the IDB Group entities. Under the Pension Plans and LRP, benefits are based on years of service and level of compensation, and are funded by contributions from
Inter-American Investment Corporation
Notes to Financial Statements
111

employees, IDB Invest and the IDB, in accordance with the provisions of the Pension Plans and LRP. Any and all contributions to the Pension Plans and LRP are irrevocable and are held separately in retirement funds solely for the payment of benefits under the Pension Plans and LRP.
The IDB Group also provides certain health care, tax reimbursement and other benefits to retirees. Staff who retire, receive a monthly pension from the IDB or IDB Invest, and meet certain requirements, are eligible for postretirement benefits under the Postretirement Benefits Plan (PRBP). Retirees contribute toward the PRBP based on an established premium schedule. IDB Invest and the IDB contribute the remainder of the actuarially determined cost of future health care and other benefits. While all contributions and all other assets and income of the PRBP remain the property of IDB Invest and the IDB, they are held and administered separately and apart from the other property and assets of each employer solely for the purpose of payment of benefits under the PRBP.
Since both the IDB and IDB Invest are sponsors of the Pension Plans and the PRBP, each employer presents its respective share of these plans. The amounts presented reflect IDB Invest’s proportionate share of costs, assets, and obligations of these Pension Plans and PRBP in accordance with ASC 715, Compensation – Retirement Benefits.
The service cost component of net periodic benefit costs allocated to IDB Invest is included in Administrative expenses and the other components are included in Other components of pension benefit costs, net in the income statements. The funded status of the Pension Plans and the PRBP is included in Receivables and other assets when the respective plan is in a funded status, and included in Payables and other liabilities when the respective plan is in an unfunded status in the balance sheets. Additional information about the Pension Plans and PRBP is included in Note 14.
Taxes – IDB Invest, its property, other assets, income, and the operations and transactions it carries out pursuant to the Agreement Establishing the Inter-American Investment Corporation are immune from all taxation and from all custom duties in its member countries. IDB Invest is also immune from any obligation relating to the payment, withholding or collection of any tax or duty in its member countries.
Accounting and financial reporting developments – On January 1, 2020, IDB Invest early adopted ASU 2016-13, Financial Instruments – Credit Losses (Topic 326): Measurement of Credit Losses on Financial Instruments and other related ASUs, which replaces the incurred loss methodology with an expected loss methodology that is referred to as the current expected credit loss (CECL) methodology. The measurement of expected credit losses under the CECL methodology is applicable to financial assets measured at amortized cost, including loans and held-to-maturity debt securities, as well as off-balance sheet undisbursed loan commitments and financial guarantees. IDB Invest adopted ASC 326 using the modified retrospective method and recorded a net decrease to retained earnings of $46.2 million as of January 1, 2020 for the cumulative effect of adopting CECL.
In August 2018, the FASB issued ASU 2018-13, Fair Value Measurement – Changes to the disclosure requirements for fair value measurement. The amendments in this Update impact disclosure requirements for all entities that are required, under existing US GAAP, to make disclosures about recurring or nonrecurring fair value measurements. This Update eliminates, modifies, and adds to the existing disclosures. For IDB Invest, this Update is effective on January 1, 2020. This Update did not have a material impact on IDB Invest's financial statements.
In August 2018, the FASB issued ASU 2018-14, Compensation – Retirement Benefits - Defined Benefit Plans – Changes to the disclosure requirements for defined benefit plans. The amendments in this Update impact disclosure requirements for all employers that sponsor defined benefit pension or other postretirement plans by eliminating existing disclosures that are no longer deemed to be relevant while at the same time adding new disclosures deemed to improve disclosures and clarifying existing disclosures. Among the new disclosures, the explanation of the reasons for significant gains and losses related to changes in the benefit obligation for the
Inter-American Investment Corporation
Notes to Financial Statements
112

period will be required. For IDB Invest, this Update is effective on January 1, 2020. This Update did not have a material impact on IDB Invest's financial statements.
In August 2018, the FASB issued ASU 2018-15, Intangibles – Goodwill and other – Internal-use software – Customer’s accounting for implementation costs incurred in a cloud computing arrangement that is a service contract. The amendments in this Update result in consistent capitalization of implementation costs of a hosting arrangement that is a service contract and implementation costs incurred to develop or obtain internal-use software and hosting arrangements that include an internal-use software license. For IDB Invest, this Update is effective on January 1, 2020. This Update did not have a material impact on IDB Invest's financial statements.
In January 2020, the FASB issued ASU 2020-01, Investments—Equity Securities (Topic 321), Investments—Equity Method and Joint Ventures (Topic 323), and Derivatives and Hedging (Topic 815) Investments. The amendments in this Update clarify the interaction of the accounting for equity securities under Topic 321 and investments accounted for under the equity method of accounting in Topic 323 and the accounting for certain forward contracts and purchased options accounted for under Topic 815. For IDB Invest, this Update is effective on January 1, 2021 and is not expected to have a material impact on IDB Invest's financial statements.
In March 2020, the FASB issued ASU 2020-04, Reference Rate Reform (Topic 848). This Update provides temporary optional expedients and exceptions to the US GAAP guidance on contract modifications and hedge accounting to ease the financial reporting burden of the expected marked transition from LIBOR and other interbank offered rates. To be eligible for the optional expedients, modifications of contractual terms that change (or have the potential to change) the amount or timing of contractual cash flows must be related to replacement of a reference rate. IDB Invest is exposed to LIBOR through its LIBOR-based development related debt investments, investment securities, borrowings and swaps. The amendments in this Update may be implemented any time before December 31, 2022. IDB Invest has elected to apply the optional expedients related to contract modifications effective December 31, 2020.
In April 2020, US federal banking regulators in consultation with the FASB issued the Interagency Statement
that allows lenders to conclude that loan modifications related to COVID-19 meeting certain conditions are not TDRs. The guidance clarifies that it is not necessary to consider the impact of the COVID-19 pandemic on the financial condition of a borrower in connection with a short-term COVID-19 related modification, provided the borrower is current at the date the modification measures are implemented. COVID-19 related modifications that do not meet the provisions of the Interagency Statement will be assessed for TDR classification. IDB Invest elected to apply the guidance. The adoption of the guidance did not have a material impact on IDB Invest's financial statements.
In October 2020, the FASB issued ASU 2020-08, Codification Improvements to Subtopic 310-20, Receivables - Nonrefundable Fees and Other Costs. The amendments in this Update state that for callable bonds purchased at a premium, an entity must reevaluate to ensure that the premium is not amortized to the earliest call date. For IDB Invest, this Update is effective is on January 1, 2021 and is not expected to have a material impact on IDB Invest’s financial statements.
Inter-American Investment Corporation
Notes to Financial Statements
113

3. Liquid Assets
Liquid assets consists of the following (US$ thousands):
December 31, 2020 December 31, 2019Cash and cash equivalents (1) $ 41,592 $ 22,749
Money market funds 617,053 372,822
Debt securities
Corporate securities 967,805 677,372 Agency securities 309,103 136,336 Government securities 114,850 127,911 Supranational securities 70,225 23,223
Total debt securities 1,461,983 964,842 Total $ 2,120,628 $ 1,360,413
(1) Includes restricted cash of $22.6 million as of December 31, 2020 ($523 thousand as of December 31, 2019).
The total income from Liquid assets is summarized below (US$ thousands):
Year ended December 312020 2019
Interests and dividends, net $ 15,928 $ 27,092 Gain/(loss) from changes in fair value and gain/(loss) from foreign exchange transactions, net 6,382 10,828
Total $ 22,310 $ 37,920
Net unrealized gains recognized in income for the year ended December 31, 2020 relating to trading securities still held as of December 31, 2020 were $7.6 million ($193 thousand net unrealized gains for the year ended December 31, 2019).
The maturity structure of debt securities included in Liquid assets is as follows (US$ thousands):
December 31, 2020 December 31, 2019Less than one year $ 608,857 $ 412,570
Between one and five years 853,126 552,272
Total $ 1,461,983 $ 964,842
As of December 31, 2020, all investment securities are classified as trading due to the one-time reclassification explained in Note 2. The fair value of available-for-sale debt securities as of December 31, 2019 was as follows (US$ thousands):
December 31, 2019
Amortizedcost
Gross unrealizedFair valuegains losses
Corporate securities $ 410,019 $ 3,014 $ (328) $ 412,705
Government securities 80,046 184 (6) 80,224
Agency securities 70,139 115 (11) 70,243
Supranational securities 23,042 183 (2) 23,223
Total $ 583,246 $ 3,496 $ (347) $ 586,395
Inter-American Investment Corporation
Notes to Financial Statements
114

The length of time that individual available-for-sale debt securities were in a continuous unrealized loss position as of December 31, 2019 was as follows (US$ thousands):
December 31, 2019Less than 12 months 12 months or more Total
Fair valueUnrealized
loss Fair valueUnrealized
loss Fair valueUnrealized
lossCorporate securities $ 34,975 $ (51) $ 74,611 $ (277) $ 109,586 $ (328)
Government securities 6,981 (6) — — 6,981 (6)
Agency securities — — 52,416 (11) 52,416 (11)
Supranational securities — — 7,997 (2) 7,997 (2)
Total $ 41,956 $ (57) $ 135,024 $ (290) $ 176,980 $ (347)
Changes in available-for-sale debt securities recognized in Other comprehensive income/(loss) are as follows (US$ thousands):
Year ended December 312020 2019
Unrealized gain/(loss) during the period $ — $ 10,759 Reclassification of (gain)/loss to net income/(loss) (3,172) (959) Total recognized in other comprehensive income/(loss) related to available-for-sale investment securities $ (3,172) $ 9,800
Sales of available-for-sale debt securities amounted to $293.2 million during the year ended December 31, 2019. Gross realized gains were $884 thousand and there were $4 thousand gross realized losses from the sale of available-for-sale debt securities during the year ended December 31, 2019.
During the year ended December 31, 2019, there were no other-than-temporary impairment losses on debt securities that IDB Invest would be more likely than not required to sell before recovery of the amortized cost.
4. Development Related Investments
IDB Invest has specific metrics for concentrations and it monitors the development related investments for credit performance, market risk and any potential related effects of geographic or sectorial concentrations. IDB Invest’s development related investments are the result of lending and investing activities that include loans, debt securities, equity investments, and guarantees that promote the economic development of IDB Invest’s Regional Developing Member Countries through the establishment, expansion and modernization of private enterprises. All development related investments are individually evaluated for purposes of monitoring and evaluating credit performance and market risk.
Inter-American Investment Corporation
Notes to Financial Statements
115

The cost and carrying amount of development related investments are as follows (US$ thousands):
December 31, 2020 December 31, 2019
CostCarrying amount Cost
Carrying amount
Loans
At amortized cost $ 3,654,492 3,654,492 $ 2,042,297 $ 2,042,297
At fair value 156,554 155,647 28,432 27,527
Total loans 3,811,046 3,810,139 2,070,729 2,069,824
Debt securities
At amortized cost 128,204 128,204 133,624 133,624
At fair value 289,022 288,236 243,205 243,300
Total debt securities 417,226 416,440 376,829 376,924
Total development related debt investments 4,228,272 4,226,579 2,447,558 2,446,748
Equity investments
At cost-based measurement alternative 4,695 4,695 4,695 4,695
At fair value 125,373 126,713 90,534 $ 91,980
Total equity investments 130,068 131,408 95,229 96,675 Allowance for credit losses (181,098) (97,614)
Total development related investments, net $ 4,358,340 $ 4,176,889 $ 2,542,787 $ 2,445,809
Inter-American Investment Corporation
Notes to Financial Statements
116

The distribution of the portfolio by country, and a reconciliation of total cost to carrying amount, is as follows (US$ thousands):
December 31, 2020 December 31, 2019
LoansDebt
securitiesEquity
investments Total LoansDebt
securitiesEquity
investments TotalBrazil $ 680,459 $ 62,595 $ 35,676 $ 778,730 $ 273,290 $ 45,715 $ 19,217 $ 338,222 Colombia 336,778 153,514 32,099 522,391 150,536 144,129 6,993 301,658 Mexico 471,292 4,427 39,080 514,799 187,960 3,233 13,404 204,597 Ecuador 393,402 35,000 — 428,402 241,783 20,000 — 261,783 Chile 389,782 — — 389,782 282,164 — — 282,164 Guatemala 266,870 40,000 1,000 307,870 59,890 40,000 — 99,890 Peru 212,951 28,932 15,500 257,383 77,878 13,000 — 90,878 Argentina 168,352 9,000 — 177,352 196,864 12,000 — 208,864 Panama 100,115 50,000 — 150,115 66,929 50,000 — 116,929 El Salvador 123,550 14,286 — 137,836 27,982 15,000 — 42,982 Uruguay 116,076 19,472 — 135,548 79,648 17,752 — 97,400 Paraguay 134,355 — — 134,355 96,663 — — 96,663 Honduras 107,542 — — 107,542 24,273 — — 24,273 Nicaragua 70,286 — 4,695 74,981 65,717 — — 65,717 Trinidad and Tobago 74,490 — — 74,490 37,500 — — 37,500 Costa Rica 69,601 — — 69,601 78,690 — — 78,690 Bolivia 43,897 — 2,018 45,915 38,566 — 18,500 57,066 Dominican Republic 12,436 — — 12,436 13,265 — — 13,265 Belize 12,428 — — 12,428 7,500 — — 7,500 Spain 10,944 — — 10,944 — — — — Haiti 8,874 — — 8,874 7,032 — — 7,032 Suriname 5,136 — — 5,136 6,515 — — 6,515 Bahamas 1,430 — — 1,430 1,891 — — 1,891 Regional(1) — — — — 48,193 16,000 37,115 101,308 Total cost 3,811,046 417,226 130,068 4,358,340 2,070,729 376,829 95,229 2,542,787 Fair value adjustments (907) (786) 1,340 (353) (905) 95 1,446 636 Total carrying value 3,810,139 416,440 131,408 4,357,987 2,069,824 376,924 96,675 2,543,423 Allowance for credit losses (173,247) (7,851) — (181,098) (97,614) — — (97,614) Total development related investments, net $ 3,636,892 $ 408,589 $ 131,408 $ 4,176,889 $ 1,972,210 $ 376,924 $ 96,675 $ 2,445,809
(1) On January 1, 2020, IDB Invest adopted CECL and refined the exposure tracking methodology for investments in multiple countries to bebased on a single country representing the activities or location of the borrower or ultimate guarantor (country of risk).
Inter-American Investment Corporation
Notes to Financial Statements
117

Income from development related investments is summarized below (US$ thousands):
Year ended December 31
2020 2019
Loans, debt securities and guarantees
Interest income $ 149,194 $ 125,847
Fees and other income 36,706 8,220
(Provision)/release of provision for credit losses (111,756) (36,697)
Income/(expense) from loans, debt securities and guarantees 74,144 97,370
Equity investments
Realized gain/(loss) from sales, net 922 2,541
Realized dividends and other income 263 294 Unrealized gain/(loss) from changes in fair value and measurement adjustments, net (1) 100 229
Income/(expense) from equity investments 1,285 3,064 Income from development related investments, net $ 75,429 $ 100,434
(1) Includes net gains/(losses) for equity investments carried at fair value or observable price change/impairment adjustments for equityinvestments recorded using the cost-based measurement alternative.
Development related investments committed but not disbursed (net of cancellations) are summarized below (US$ thousands):
December 31, 2020Loans $ 1,090,707
Equity investments 153,952
Debt securities 59,478
Total $ 1,304,137
Inter-American Investment Corporation
Notes to Financial Statements
118

The maturity structure of development related debt investments is as follows (US$ thousands):
December 31, 2020 December 31, 2019Loans
Due in one year or less $ 1,343,945 $ 622,921
Due after one year through five years 1,452,793 878,165
Due after five years through ten years 830,520 406,723
Due after ten years and thereafter 191,797 167,651
Total loans 3,819,055 2,075,460 Debt securities
Due in one year or less 12,969 24,132
Due after one year through five years 301,963 247,258
Due after five years through ten years 92,736 90,952
Due after ten years and thereafter 9,558 14,487
Total debt securities 417,226 376,829 Total development related debt investments, gross 4,236,281 2,452,289
Unamortized discounts for loans (8,009) (4,731)
Total development related debt investments at cost, net 4,228,272 2,447,558 Fair value adjustments for loans and debt securities (1,693) (810)
Total development related debt investments at carrying amount, net $ 4,226,579 $ 2,446,748
Inter-American Investment Corporation
Notes to Financial Statements
119

Development related debt investments by currency and range of contractual interest rates, and a reconciliation of total cost to carrying amount are summarized below (US$ thousands):
December 31, 2020 December 31, 2019Amount Range Amount Range
Brazilian real (BRL)Loans $ 26,282 3.9% - 6.7% $ — —%Debt securities 12,595 3.9% 45,715 7.7%
38,877 45,715 Colombian peso (COP)
Loans 58,903 7.6% - 9.2% 41,177 10.9% - 11.8%Debt securities 137,513 3.3% - 9.5% 144,129 5.7% - 9.5%
196,416 185,306 Dominican Republic peso (DOP)
Loans 8,590 10.5% 9,418 10.5%8,590 9,418
Mexican peso (MXN)Loans 58,036 5.9% - 8.7% 34,555 8.7% - 12.0%Debt securities 4,427 5.5% 3,232 7.7%
62,463 37,787 Paraguayan guarani (PYG)
Loans 21,388 7.5% - 9.0% 4,650 9.0%21,388 4,650
Peruvian sol (PEN)Loans 15,793 10.5% — —%Debt securities 15,931 8.0% — —%
31,724 — Trinidad and Tobago dollar (TTD)
Loans 36,990 3.8% — —%36,990 —
United States dollar (USD)Loans 3,155,537 1.1% - 12.0% 1,735,934 1.5% - 16.0%Debt securities 246,758 2.2% - 8.0% 183,753 3.5% - 7.9%
3,402,295 1,919,687 Total development related debt investments, before discounted loans 3,798,743 2,202,563
Discounted loans with no stated rate (USD) 363,443 222,695 Discounted loans with no stated rate (MXN) 66,086 22,300
Total development related debt investments at cost, net 4,228,272 2,447,558
Fair value adjustments for loans and debt securities (1,693) (810)
Total development related debt investments at carrying amount, net $ 4,226,579 $ 2,446,748
Inter-American Investment Corporation
Notes to Financial Statements
120

Variable rate loans generally reprice within one year. Base rates of variable rate loans reset at each repayment date at least annually or more frequently, but loan margins generally remain constant over the life of the variable rate loan.
Development related debt investments
An aging analysis, based on contractual terms, for development related debt investment at cost as of December 31, 2020 and December 31, 2019 is as follows (US$ thousands):
December 31, 20201-90 days past
due>90 days past
due Total past due Total current Total portfolioLoans $ 8,049 $ 17,774 $ 25,823 $ 3,785,223 $ 3,811,046
Debt securities — — — 417,226 417,226
Total $ 8,049 $ 17,774 $ 25,823 $ 4,202,449 $ 4,228,272
December 31, 20191-90 days past
due>90 days past
due Total past due Total current Total portfolioLoans $ 6,530 $ 14,516 $ 21,046 $ 2,049,683 $ 2,070,729
Debt securities — — — 376,829 376,829
Total $ 6,530 $ 14,516 $ 21,046 $ 2,426,512 $ 2,447,558
The recorded investment in nonaccrual loans at amortized cost is summarized as of December 31, 2020 and December 31, 2019 as follows (US$ thousands):
December 31, 2020 Year ended December 31, 2020
Nonaccrual > 90 dayspast due and
accruing
Interest income recognized on
nonaccrual status
Accrued interest income written
offPast due Current TotalLoans $ 21,185 $ 11,192 $ 32,377 $ — $ 720 $ 206
Total $ 21,185 $ 11,192 $ 32,377 $ — $ 720 $ 206
December 31, 2019 Year ended December 31, 2019Nonaccrual > 90 days
past due and accruing
Interest income recognized on nonaccrual statusPast due Current Total
Loans $ 19,415 $ 11,851 $ 31,266 $ 1,501 $ 857
Total $ 19,415 $ 11,851 $ 31,266 $ 1,501 $ 857
There were no debt securities in nonaccrual status as of December 31, 2020 nor December 31, 2019.
A current nonaccrual development related debt investment is a financial instrument that was placed in nonaccrual status, where the borrower is now current on payments, but for which ongoing monitoring is necessary to determine whether the borrower has sufficiently demonstrated performance before returning the development related debt investment to accrual status. There were no development related debt investments at amortized cost classified as nonaccrual without a related allowance for credit losses as of December 31, 2020 (none as of December 31, 2019).
Inter-American Investment Corporation
Notes to Financial Statements
121

The investment in impaired loans was $32.4 million as of December 31, 2020 ($31.3 million as of December 31, 2019). The average investment in impaired loans was $30.4 million for the year ended December 31, 2020 ($30.3 million for the year ended December 31, 2019). The total allowance related to impaired loans was $15.0 million as of December 31, 2020 ($12.8 million as of December 31, 2019). As of the years ended December 31, 2020 and 2019, all loans classified as impaired were in nonaccrual status.
As of December 31, 2020, there was one operation in the portfolio considered a TDR with an outstanding balance of $6.4 million and individually assessed allowance for credit losses of $1.9 million (none as of December 31, 2019). IDB Invest does not have commitments to extend additional funds to borrowers whose terms have been modified in a TDR.
During 2020, IDB Invest implemented loan modification measures in response to requests received from borrowers for short-term modifications as a result of the COVID-19 pandemic. As of December 31, 2020, IDB Invest evaluated loans with a total outstanding balance of $66 million under the Interagency Statement and determined that the modifications are not considered TDRs. These loans were fully performing at the time the measures were implemented. The reliefs provided are short-term arrangements of principal deferrals amounting to $5 million. The loans continue to accrue interest during the deferral period and are not reported as past due nor in nonaccrual status. IDB Invest continues to estimate the allowance for expected credit losses for these loans under the CECL provision.
The allowance for credit losses considers credit risk assessments as of December 31, 2020. In light of the COVID-19 pandemic, several of the credit risk ratings of individual development related debt investments have deteriorated as of December 31, 2020 when compared to December 31, 2019, reflecting both general credit and specific COVID-19 related aspects. In evaluating the appropriateness of the allowance for credit losses on development related debt investments as of December 31, 2020, IDB Invest has considered this impact when assessing the credit worthiness and risk rating of its development related debt investments and increased its provisions for credit losses in the year ended December 31, 2020.
Inter-American Investment Corporation
Notes to Financial Statements
122

Changes in the allowance for expected credit losses are summarized below (US$ thousands):
Year ended December 31, 2020
Financial institutions Corporates
Project finance (1) Total
LoansBeginning balance $ (32,926) $ (64,688) $ — $ (97,614)
Cumulative effect of adoption of ASU 2016-13 5,490 26,988 (30,082) 2,396 Loans written off, net — — — —
Recoveries (40) — — (40)
(Provision)/release of provision for credit losses (32,386) (34,364) (11,239) (77,989)
Loans ending balance (59,862) (72,064) (41,321) (173,247)
Debt securitiesBeginning balance (2) — — — —
Cumulative effect of adoption of ASU 2016-13 (3,755) (3,021) (732) (7,508)
Debt securities written off, net — — — —
Recoveries — — — —
(Provision)/release of provision for credit losses (875) 463 69 (343)
Debt securities ending balance (4,630) (2,558) (663) (7,851)
Allowance for credit losses (64,492) (74,622) (41,984) (181,098)
Undisbursed commitmentsBeginning balance (2) — — — —
Cumulative effect of adoption of ASU 2016-13 (3,356) (10,134) (18,431) (31,921)
(Provision)/release of provision for credit losses (14,716) (4,237) (9,456) (28,409)
Undisbursed commitments ending balance (18,072) (14,371) (27,887) (60,330)
GuaranteesBeginning balance (187) (314) (2,747) (3,248)
Cumulative effect of adoption of ASU 2016-13 110 (542) (8,768) (9,200)
(Provision)/release of provision for credit losses (205) (286) (4,524) (5,015)
Guarantees ending balance (282) (1,142) (16,039) (17,463)
Liability for off-balance sheet credit losses (18,354) (15,513) (43,926) (77,793)
(Provision)/release of provision for credit losses $ (48,182) $ (38,424) $ (25,150) $ (111,756) (1) Project finance was not presented as a separate segment prior to the adoption of ASU 2016-13.(2) Debt securities and undisbursed commitments were not subject to provisioning prior to the adoption of ASU 2016-13.
Inter-American Investment Corporation
Notes to Financial Statements
123

Year ended December 31, 2019
LoansFinancial
institutions Corporates TotalBeginning balance $ (24,602) $ (41,174) $ (65,776)
Write-offs — 2,352 2,352
Recoveries (133) (44) (177)
(Provision)/release of provision for loan losses (1) (8,191) (25,822) (34,013)
Ending balance $ (32,926) $ (64,688) $ (97,614) (1) Does not include changes in (Provision)/release of provision for credit losses related to guarantees of $(2.7) million that are recorded inthe same line item in the income statements.
A description of credit quality indicators is presented in the table below:
Rating categories
Credit quality
indicator
Internal credit risk
classification range Description
aa- and better
Very strong aa- or higher An obligor in these categories has a very strong capacity to meet its financial
commitment.
a+ to a– Strong a+, a, a- An obligor in these categories has a strong capacity to meet its financial commitment.
bbb+ to bbb- Adequate bbb+, bbb,
bbb-An obligor in these categories exhibits an adequate financial profile. However, adverse economic conditions or changing circumstances are more likely to lead to a weakening of the obligor’s capacity to meet its financial obligations.
bb+ to bb- Moderate bb+, bb, bb-An obligor in these categories can face major uncertainties or exposures to adverse business, financial, or economic conditions that could lead to its inadequate capacity to meet its financial obligations.
b+ to b- Weak b+, b, b-An obligor in these categories is more vulnerable to nonpayment than obligations rated bb-, but the obligor currently has the capacity to meet its financial obligations. Adverse business, financial, or economic conditions will likely impair the obligor's capacity or willingness to meet its financial obligations.
ccc+ and lower Very weak ccc+ or lower
An obligor in these categories faces significant challenges, and default may also already be a virtual certainty. The obligor is currently vulnerable to nonpayment, and is dependent upon favorable business, financial, and economic conditions for the obligor to meet its financial obligations. In the event of adverse business, financial, or economic conditions, the obligor is not likely to have the capacity to meet its financial obligations.
Inter-American Investment Corporation
Notes to Financial Statements
124

A summary of development related debt investments carried at amortized cost by credit quality indicator, class of financing receivable and major security type, and vintage as of December 31, 2020 are as follows (US$ thousands):
December 31, 2020
Amortized cost basis by origination year (2) Revolving loans
amortized cost basis (1)2020 2019 2018 Prior Total
LoansAdequate $ 270,000 $ 60,750 $ — $ 29,404 $ 331,111 $ 691,265
Moderate 755,716 287,107 323,748 115,225 232,869 1,714,665
Weak 461,220 240,847 190,829 158,377 16,477 1,067,750
Very weak 6,000 37,811 51,015 85,986 — 180,812
Total loans 1,492,936 626,515 565,592 388,992 580,457 3,654,492 Debt securities
Adequate — — — — — —
Moderate — 50,000 50,085 6,119 — 106,204
Weak — — 13,000 — — 13,000
Very weak — — 9,000 — — 9,000
Total debt securities — 50,000 72,085 6,119 — 128,204 Total amortized cost loans and debt securities $ 1,492,936 $ 676,515 $ 637,677 $ 395,111 $ 580,457 $ 3,782,696
(1) Includes line-of-credit arrangements that may be converted to term loans in a separate column. As of December 31, 2020, line of creditarrangements converted to term loans amounted to $1.2 million.(2) Includes short-term loans with maturities of less than one year.
A summary of loans carried at amortized cost by credit quality indicator and by investment type as of December 31, 2019 are as follows (US$ thousands):
December 31, 2019
Internal credit quality indicatorFinancial
institutions Corporates TotalAdequate $ 132,500 $ 141,348 $ 273,848
Moderate 402,726 484,971 887,697
Weak 246,458 537,470 783,928
Very weak 1,000 95,824 96,824
Total loans at amortized cost $ 782,684 $ 1,259,613 $ 2,042,297
Inter-American Investment Corporation
Notes to Financial Statements
125
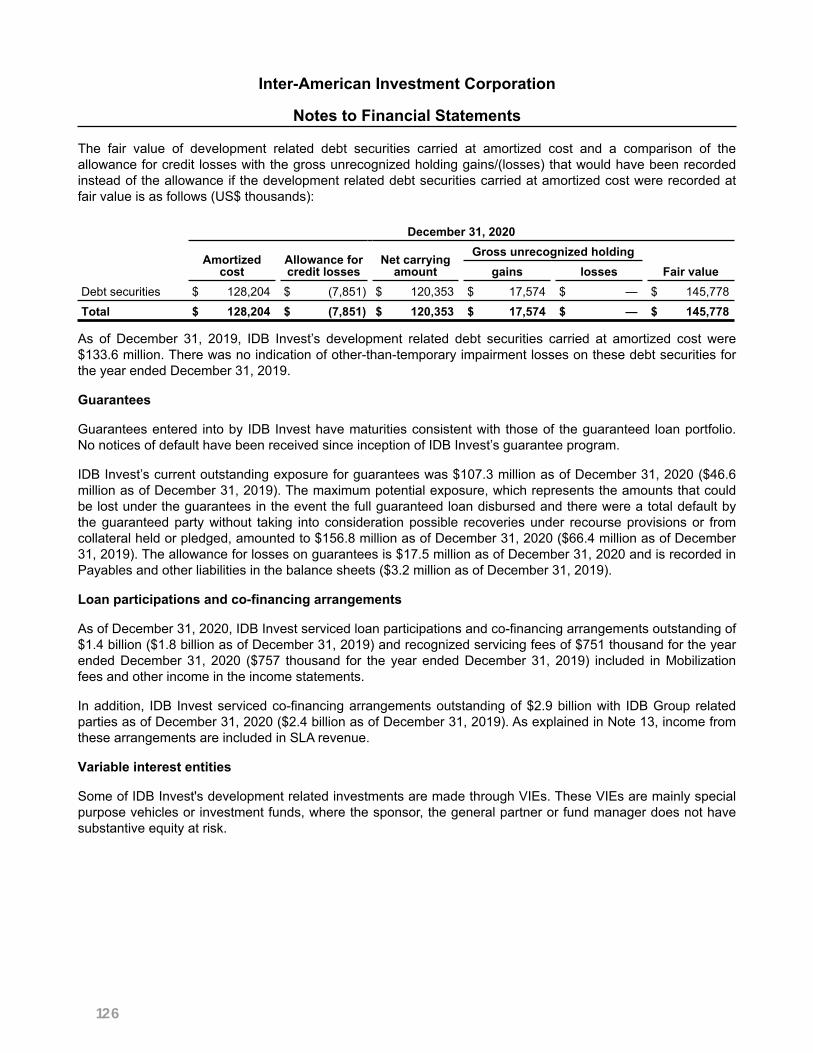
The fair value of development related debt securities carried at amortized cost and a comparison of the allowance for credit losses with the gross unrecognized holding gains/(losses) that would have been recorded instead of the allowance if the development related debt securities carried at amortized cost were recorded at fair value is as follows (US$ thousands):
December 31, 2020
Amortizedcost
Allowance for credit losses
Net carrying amount
Gross unrecognized holdingFair valuegains losses
Debt securities $ 128,204 $ (7,851) $ 120,353 $ 17,574 $ — $ 145,778
Total $ 128,204 $ (7,851) $ 120,353 $ 17,574 $ — $ 145,778
As of December 31, 2019, IDB Invest’s development related debt securities carried at amortized cost were $133.6 million. There was no indication of other-than-temporary impairment losses on these debt securities for the year ended December 31, 2019.
Guarantees
Guarantees entered into by IDB Invest have maturities consistent with those of the guaranteed loan portfolio. No notices of default have been received since inception of IDB Invest’s guarantee program.
IDB Invest’s current outstanding exposure for guarantees was $107.3 million as of December 31, 2020 ($46.6 million as of December 31, 2019). The maximum potential exposure, which represents the amounts that could be lost under the guarantees in the event the full guaranteed loan disbursed and there were a total default by the guaranteed party without taking into consideration possible recoveries under recourse provisions or from collateral held or pledged, amounted to $156.8 million as of December 31, 2020 ($66.4 million as of December 31, 2019). The allowance for losses on guarantees is $17.5 million as of December 31, 2020 and is recorded in Payables and other liabilities in the balance sheets ($3.2 million as of December 31, 2019).
Loan participations and co-financing arrangements
As of December 31, 2020, IDB Invest serviced loan participations and co-financing arrangements outstanding of $1.4 billion ($1.8 billion as of December 31, 2019) and recognized servicing fees of $751 thousand for the year ended December 31, 2020 ($757 thousand for the year ended December 31, 2019) included in Mobilization fees and other income in the income statements.
In addition, IDB Invest serviced co-financing arrangements outstanding of $2.9 billion with IDB Group related parties as of December 31, 2020 ($2.4 billion as of December 31, 2019). As explained in Note 13, income from these arrangements are included in SLA revenue.
Variable interest entities
Some of IDB Invest's development related investments are made through VIEs. These VIEs are mainly special purpose vehicles or investment funds, where the sponsor, the general partner or fund manager does not have substantive equity at risk.
Inter-American Investment Corporation
Notes to Financial Statements
126

IDB Invest has made development related investments amounting to approximately $6.4 million in loans for one VIE for which it is deemed to be the primary beneficiary as of December 31, 2020 ($26.1 million in loans and $3.0 million in debt securities as of December 31, 2019). IDB Invest’s involvement with one VIE is limited to development related investments, which are reflected as such in IDB Invest’s financial statements as of December 31, 2020 (three as of December 31, 2019). Based on the most recent available data, the size of these VIEs measured by total assets with a notional value of approximately $6.5 million as of December 31, 2020 is considered immaterial compared to the carrying value of $6.4 million, and thus not consolidated in IDB Invest’s financial statements ($31.5 million notional value and $29.1 million carrying value at December 31, 2019).
IDB Invest does not have a significant variable interest in any other VIE, which would require disclosure. Similarly, IDB Invest does not hold a controlling financial interest or majority voting interest in any other entity, and it does not have significant influence over any entities.
5. Receivables and Other Assets
Receivables and other assets are summarized below (US$ thousands):
December 31, 2020 December 31, 2019Operating lease right-of-use asset $ 48,400 $ 52,536
Interest receivable on development related debt investments 24,377 22,538
Recovery assets 23,660 737
Fixed and intangible assets 12,650 11,033
Other assets 6,736 3,169
Interest receivable on investment securities 5,511 3,589
Total receivables and other assets $ 121,334 $ 93,602
Inter-American Investment Corporation
Notes to Financial Statements
127

6. Payables and Other Liabilities
Payables and other liabilities are summarized below (US$ thousands):
Notes December 31, 2020 December 31, 2019Pension and Postretirement Benefit Plans 14
Pension Plans, net liability $ 123,105 $ 77,920
Postretirement Benefit Plan, net liability 34,694 17,798
Leases 12
Operating lease liability 49,939 53,388
Current Expected Credit Losses (CECL) 4
Liability for off-balance sheet credit losses 77,793 3,248
Development related investments
Loan origination fees and costs, net 29,634 17,769
Interest and commitment fees payable 11,866 7,332
Deferred revenue 15,373 12,884
Employment benefits payable 14,600 12,288
Due to IDB, net 13 14,825 8,426
Other liabilities 33,978 7,563
Total payables and other liabilities $ 405,807 $ 218,616
Deferred revenue includes service fees collected from related parties. Additional information about IDB Invest’s related party transactions is included in Note 13.
Inter-American Investment Corporation
Notes to Financial Statements
128

7. BorrowingsBorrowings outstanding by currency are as follows (US$ thousands):
Final Maturity
Interest payment
terms
December 31, 2020 December 31, 2019Amount
outstandingF/V
rate(1)Interest
rateAmount
outstandingF/V
rate(1)Interest
rateAustralian dollar (AUD):2020 AUD 140.0 million 2035 Semi-annual $ 107,925 F 1.5 % $ —
107,925 — Brazilian real (BRL):
2020 BRL 4.2 million 2027 Quarterly 802 V 3.2 % — 2020 BRL 25.5 million 2028 Quarterly 4,905 V 2.7 % — 2020 BRL 23.4 million 2028 Quarterly 4,495 V 2.8 % — 2020 BRL 12.4 million 2028 Quarterly 2,393 V 2.8 % — 2020 BRL 67.3 million 2029 Quarterly 12,944 V 2.8 % — 2020 BRL 37.7 million 2039 Quarterly 7,264 V 4.0 % — 2020 BRL 4.7 million 2039 Quarterly 909 V 4.3 % — 2018 BRL 90.0 million 2021 Quarterly — V 0.0 % 29,776 V 4.1 %2019 BRL 15.0 million 2021 Quarterly — V 0.0 % 4,963 V 3.9 %2019 BRL 11.3 million 2021 Quarterly — V 0.0 % 3,722 V 3.8 %2019 BRL 11.3 million 2021 Quarterly — V 0.0 % 3,722 V 3.5 %2019 BRL 11.3 million 2021 Quarterly — V 0.0 % 3,722 V 3.7 %
33,712 45,905 Colombian peso (COP):
2019 COP 328.5 billion 2024 Monthly 95,593 V 2.2 % 100,192 V 4.6 %2018 COP 144.1 billion 2025 Semi-annual 41,920 F 6.6 % 43,937 F 6.6 %2018 COP 35.3 billion 2030 Quarterly 10,286 V 6.3 % 10,782 V 8.3 %2020 COP 30.3 billion 2030 Quarterly 8,830 V 6.3 % — 2019 COP 27.1 billion 2030 Quarterly 7,883 V 6.3 % 8,262 V 8.3 %2020 COP 16.1 billion 2030 Quarterly 4,676 V 6.0 % — 2019 COP 47.0 billion 2035 Semi-annual 13,677 V 6.4 % 14,335 V 7.9 %2020 COP 9.0 billion 2035 Semi-annual 2,619 V 6.4 % — 2020 COP 7.0 billion 2035 Semi-annual 2,037 V 6.4 % — 2019 COP 6.0 billion 2035 Semi-annual 1,746 V 6.4 % 1,830 V 8.4 %2019 COP 5.0 billion 2035 Semi-annual 1,455 V 6.4 % 1,525 V 8.4 %2020 COP 5.0 billion 2035 Semi-annual 1,455 V 6.4 % —
192,177 180,863 Dominican peso (DOP):
2019 DOP 500.0 million 2022 Semi-annual 8,589 F 8.8 % 9,418 F 8.8 %8,589 9,418
Mexican peso (MXN):2018 MXN 1.5 billion 2021 Monthly 75,372 V 4.6 % 79,515 V 7.8 %2019 MXN 1.5 billion 2022 Monthly 75,372 V 4.5 % 79,515 V 7.7 %2020 MXN 2.0 billion 2023 Monthly 100,496 V 4.5 % —
251,240 159,030 Paraguayan guarani (PYG):
2018 PYG 22.5 billion 2023 Semi-annual 3,263 F 6.1 % 4,650 F 6.1 %2020 PYG 100.0 billion 2025 Semi-annual 14,500 F 6.1 % — 2020 PYG 25.0 billion 2025 Semi-annual 3,625 F 5.4 % —
21,388 4,650 Trinidad and Tobago dollar (TTD):
2020 TTD 250.0 million 2025 Semi-annual 36,990 V 2.1 % — 36,990 —
Inter-American Investment Corporation
Notes to Financial Statements
129

Final Maturity
Interest payment
terms
December 31, 2020 December 31, 2019Amount
outstandingF/V
rate(1)Interest
rateAmount
outstandingF/V
rate(1)Interest
rateUnited States dollar (USD):
2018 $500.0 million 2021 Quarterly 500,000 V 0.3 % 500,000 V 2.1 %2019 $250.0 million 2021 Quarterly 250,000 V 0.3 % 250,000 V 2.1 %2020 $1.0 billion 2022 Annual 1,000,000 F 0.8 % — 2020 $1.0 billion 2023 Annual 1,000,000 F 0.5 % — 2019 $500.0 million 2024 Annual 500,000 F 1.8 % 500,000 F 1.8 %
3,250,000 1,250,000
Total borrowings, gross $ 3,902,021 $ 1,649,866 Fair value (gain)/loss adjustments, net 8,084 — Unamortized premiums/ discounts and issuance costs, net (1,648) (1,720)
Total borrowings, net $ 3,908,457 $ 1,648,146 (1) F: fixed; V: variable
Availability under existing credit facilities by currency are as follows (US$ thousands):
December 31, 2020
Available until
Contractual amount
Availableamount
Drawdown amount
Colombian peso (COP)2018 COP 370 billion 2021 $ 107,670 $ 53,006 $ 54,664
Multi-currency1997 $300 million 2022 $ 300,000 $ 114,915 $ 185,085
The Borrowings expense, net is as follows (US$ thousands):
Year ended December 312020 2019
Interest expense $ 45,099 $ 43,433 Fees expense 534 693 Amortization of premiums/discounts and issuance costs, net 2,324 444 Total borrowings expense, net $ 47,957 $ 44,570
Changes in fair value of borrowings attributable to changes in instrument-specific credit risk recognized in Other comprehensive income/(loss) are as follows (US$ thousands):
Year ended December 312020 2019
Unrealized gain/(loss) during the period $ (20,831) $ —
Total recognized in other comprehensive income/(loss) $ (20,831) $ —
Inter-American Investment Corporation
Notes to Financial Statements
130

8. Derivative instruments
IDB Invest enters into transactions in certain derivative instruments primarily for market risk management purposes in connection with its principal business activities. None of these derivative instruments are designated as hedging instruments under ASC 815.
The location in the balance sheets and the fair value of derivative instruments by type and purpose are summarized below (US$ thousands):
December 31, 2020 December 31, 2019
Derivative purpose Derivative typeDerivative
assetsDerivative liabilities
Derivative assets
Derivative liabilities
Development related debt investments Cross currency swaps $ 266 $ (444) $ — $ —
Interest rate swaps 164 (90) — —
Borrowings Cross currency swaps 3,848 — — —
Interest rate swaps 1,183 (1,300) — —
Total $ 5,461 $ (1,834) $ — $ —
The effect of derivative instruments in the income statements are summarized below (US$ thousands):
Year ended December 31Derivative type and purpose Income statement location 2020 2019Development related debt investments
Cross currency swapsGain/(loss) from changes in fair value on non-trading portfolios and foreign exchange transactions, net $ (178) $ —
Interest rate swapsGain/(loss) from changes in fair value on non-trading portfolios and foreign exchange transactions, net 62 —
Borrowings
Cross currency swapsGain/(loss) from changes in fair value on non-trading portfolios and foreign exchange transactions, net 3,848 —
Interest rate swapsGain/(loss) from changes in fair value on non-trading portfolios and foreign exchange transactions, net 2,073 —
Total $ 5,805 $ —
The income related to each derivative type includes realized and unrealized gains and losses.
As of December 31, 2020, the outstanding volume, measured by notional amount, of swap contracts was $2.4 billion (none as of December 31, 2019).
Inter-American Investment Corporation
Notes to Financial Statements
131

IDB Invest does not present derivative assets and liabilities related to contracts entered into with the same counterparty under a legally enforceable netting agreement on a net basis in the balance sheets. The following tables provide the gross and net positions of IDB Invest’s derivative contracts considering amounts and collateral held or pledged in accordance with enforceable counterparty credit support and netting agreements described below (US$ thousands):
December 31, 2020Gross amount of assets presented
in the balance sheets
Gross amounts not offset in the balance sheetsFinancial instruments Collateral received (1) Net amount
Derivative assets $ 5,461 $ (1,834) $ (2,205) $ 1,422
December 31, 2020Gross amount of
liabilities presented in the balance sheets
Gross amounts not offset in the balance sheetsFinancial instruments Collateral pledged Net amount
Derivative liabilities $ (1,834) $ 1,834 $ — $ — (1) Total cash collateral received was $2.6 million as of December 31, 2020 (none as of December 31, 2019).
IDB Invest’s derivative contracts with market counterparties are entered into under standardized master agreements published by the International Swaps and Derivatives Association (“ISDA” Agreements). ISDA Agreements provide for a single lump sum settlement amount upon the early termination of transactions following a default or termination event whereby amounts payable by the non-defaulting party to the other party may be applied to reduce any amounts that the other party owes the non-defaulting party. This setoff effectively reduces any amount payable by the non-defaulting party to the defaulting party.
IDB Invest’s ISDA Agreements are appended by a Credit Support Annex (“CSA”) that provides for the receipt and posting of collateral in the form of cash in US$ or U.S. Treasury securities to reduce mark-to-market exposure among derivative market counterparties. IDB Invest recognizes cash collateral received and a corresponding liability in its balance sheets for the obligation to return it. As of December 31, 2020, IDB Invest had $2.6 million of outstanding obligations to return cash collateral under CSAs (none as of December 31, 2019). IDB Invest recognizes a receivable in its balance sheets for its rights to cash collateral posted. As of December 31, 2020, no cash collateral was posted under CSAs (none as of December 31, 2019).
Securities received as collateral are not recognized in the balance sheets. In accordance with the CSAs, IDB Invest may rehypothecate securities received as collateral, subject to the obligation to return such collateral and any related distributions received. In the event of a counterparty default, IDB Invest may exercise certain rights and remedies, including the right to setoff any amounts payable by the counterparty against any collateral held by IDB Invest and the right to liquidate any collateral held.
Inter-American Investment Corporation
Notes to Financial Statements
132

9. Capital
IDB Invest’s original authorized share capital was increased to $705.9 million, equivalent to 70,590 shares, through a $500.0 million general capital increase approved in 1999 (GCI-I), and several special increases. These increases allocated a total of $505.9 million for subscriptions by new and existing member countries, with a par value and issuance price of $10,000 per share.
On March 30, 2015, IDB Invest’s Board of Governors authorized the Second General Capital Increase (GCI-II) for $2.03 billion. The capital increase is comprised of: (i) $1.305 billion in capital to be paid by IDB Invest shareholders during the 2016-2022 period; and (ii) annual transfers from the IDB, on behalf of its shareholders, to be paid to IDB Invest during the period 2018-2025, totaling $725.0 million for the entire period, and conditional upon annual approval by the IDB Board of Governors. The GCI–II increases the authorized capital stock by 125,474 shares – 80,662 shares corresponding to capital contributions payable by the countries (Annex A Shares) and 44,812 shares corresponding to transfers from the IDB on behalf of its member countries (Annex B Shares) – with a share issuance price of $16,178.60 per share. With this capital increase, total authorized shares amount to 196,064.
All Annex A Shares have been subscribed and are expected to be paid in over time. In the balance sheets, subscribed shares are recorded as Capital, par value, Additional paid-in capital and Receivable from members on the date of the subscription instrument at the share issuance price. Payments are due on October 31 of each year from 2016 to 2022, per a payment plan determined and communicated by management to each subscribing country. The Board of Executive Directors is authorized to extend payment deadlines. The price for Annex A Shares not paid within their corresponding annual installment is adjusted to reflect a 5.0% increase for each year of arrears; except that, shares corresponding to the first installment which were fully paid in by the end of the second installment were not subject to a price adjustment. The price adjustment for shares in arrears is recorded to Additional paid-in capital and to Receivable from members in the balance sheets.
Capital contributions of $75.7 million were received during the year ended December 31, 2020 for a total of $1.1 billion in contributions corresponding to Annex A Shares under GCI-II. In March 2020, the Board of Governors approved income distributions corresponding to Annex B Shares transfers from the IDB on behalf of its shareholders that are also member countries of IDB Invest. Following this approval, IDB Invest received $109 million in income distributions (transfers) for a total of $207.9 million contributions corresponding to Annex B Shares under GCI-II, which are included as part of Total paid-in capital in the balance sheets. Total capital contributions of $1.3 billion have been received under GCI-II through December 31, 2020.
Under the Agreement Establishing the Inter-American Investment Corporation, any member may withdraw from IDB Invest, which shall become effective on the date specified in the notice but in no event prior to six months from the delivery date of such notice. Even after withdrawing, a member shall remain liable for all obligations to IDB Invest to which it was subject on the date of delivery of the withdrawal notice. In the event a member withdraws, IDB Invest and the member may agree to the repurchase of the shares of said member on terms appropriate under the circumstances. If such agreement is not reached within three months of the withdrawal notice, or within a term agreed upon between both parties, the repurchase price of the member’s shares shall be equal to the book value on the date when the member ceases to belong to IDB Invest, such book value to be determined by the audited financial statements. Payment for shares shall be made in such installments, times, and currencies as IDB Invest shall determine, taking into account its financial position.
Inter-American Investment Corporation
Notes to Financial Statements
133

The following table lists the capital and receivable from members (US$ thousands, except for share and voting power information):
December 31
Capital Voting power
Shares(1)Capital, par
value
Additional paid-in
capital(2)
Receivable from
members(3)Total paid in
capital
Percent of total paid in
capital (4)Number of
votesPercent of
total votes(4)
Argentina 18,850 $ 188,500 $ 66,726 $ 234 $ 254,992 12.64 18,170 12.18 Austria 907 9,070 3,484 680 11,874 0.59 865 0.58 Bahamas 335 3,350 1,186 519 4,017 0.20 303 0.20 Barbados 237 2,370 903 189 3,084 0.15 225 0.15 Belgium 211 2,110 270 — 2,380 0.12 211 0.14 Belize 116 1,160 95 — 1,255 0.06 116 0.08 Bolivia 1,516 15,160 5,358 922 19,596 0.97 1,374 0.92 Brazil 18,850 188,500 69,586 44,246 213,840 10.60 16,178 10.84 Canada 4,607 46,070 27,556 4,659 68,967 3.42 4,319 2.90 Chile 4,860 48,600 17,704 7,496 58,808 2.92 4,399 2.95 China 9,330 93,300 56,689 10,888 139,101 6.90 8,657 5.80 Colombia 4,860 48,600 17,154 — 65,754 3.26 4,684 3.14 Costa Rica 730 7,300 2,578 453 9,425 0.47 702 0.47 Croatia(5) 6 60 42 — 102 0.01 6 0.00 Denmark 1,093 10,930 137 — 11,067 0.55 1,093 0.73 Dominican Republic 1,012 10,120 3,559 615 13,064 0.65 974 0.65 Ecuador 1,020 10,200 3,616 324 13,492 0.67 981 0.66 El Salvador 730 7,300 2,692 1,122 8,870 0.44 661 0.44 Finland 1,041 10,410 4,016 — 14,426 0.72 993 0.67 France 3,114 31,140 5,885 891 36,134 1.79 3,059 2.05 Germany 1,580 15,800 1,522 — 17,322 0.86 1,580 1.06 Guatemala 971 9,710 3,418 631 12,497 0.62 932 0.62 Guyana 276 2,760 978 178 3,560 0.18 265 0.18 Haiti 730 7,300 3,120 5,272 5,148 0.26 431 0.29 Honduras 730 7,300 2,650 529 9,421 0.47 697 0.47 Israel 411 4,110 1,483 357 5,236 0.26 389 0.26 Italy 4,874 48,740 16,758 2,961 62,537 3.10 4,691 3.14 Jamaica 494 4,940 471 — 5,411 0.27 494 0.33 Japan 5,599 55,990 19,202 2,976 72,216 3.58 5,415 3.63 Korea 8,293 82,930 50,281 9,658 123,553 6.13 7,696 5.16 Mexico 12,071 120,710 42,422 — 163,132 8.09 11,637 7.80 Netherlands 1,096 10,960 168 — 11,128 0.55 1,096 0.73 Nicaragua 730 7,300 2,574 453 9,421 0.47 702 0.47 Norway 1,038 10,380 3,986 777 13,589 0.67 990 0.66 Panama 1,031 10,310 4,361 2,000 12,671 0.63 908 0.61 Paraguay 764 7,640 2,701 501 9,840 0.49 733 0.49 Peru 5,369 53,690 20,290 — 73,980 3.67 5,141 3.45 Portugal 396 3,960 1,332 666 4,626 0.23 355 0.24 Slovenia(6) 3 30 32 — 62 0.00 3 0.00 Spain 7,217 72,170 29,195 — 101,365 5.03 6,890 4.62 Suriname 112 1,120 76 — 1,196 0.06 112 0.08 Sweden 988 9,880 3,686 716 12,850 0.64 881 0.59 Switzerland 2,349 23,490 7,898 1,488 29,900 1.48 2,118 1.42 Trinidad and Tobago 727 7,270 3,129 4,852 5,547 0.28 450 0.30 United States 19,915 199,150 24,079 — 223,229 11.07 19,915 13.35 Uruguay 2,007 20,070 7,077 — 27,147 1.35 1,933 1.30 Venezuela 10,889 108,890 51,710 110,343 50,257 2.49 4,752 3.19 Total as ofDecember 31, 2020 164,085 $ 1,640,850 $ 593,835 $ 217,596 $ 2,017,089 100 149,176 100 Total as ofDecember 31, 2019 157,350 $ 1,573,500 $ 546,751 $ 287,840 $ 1,832,411 134,785
(1) Includes Annex B shares for which income distributions (transfers) were made by IDB on behalf of its shareholders.(2) Includes the amount in addition to par value for shares under GCI-II, partial payments in excess of full shares.(3) Represents receivable from members under GCI-II.(4) Data are rounded; detail may not add to total because of rounding.(5) Croatia's voting power is 0.0040.(6) Slovenia's voting power is 0.0020.
Inter-American Investment Corporation
Notes to Financial Statements
134

10. Fair Value Measurements
Certain of IDB Invest’s financial instruments are not actively traded in any market. Determining future cash flows for fair value estimation is subjective, and minor changes in assumptions or methodologies may affect the estimated values. Also, there is a heightened degree of uncertainty and judgment in incorporating the impact of COVID-19. Therefore, while disclosure of estimated fair values of certain financial instruments is required, readers are cautioned about using these data for purposes of evaluating the financial condition of IDB Invest as of December 31, 2020.
The methodologies and key assumptions used to estimate the fair values of IDB Invest’s financial instruments are summarized below:
Cash and cash equivalents – The carrying amount reported in the balance sheets approximates fair value.
Liquid assets – Fair values for money market funds and debt securities are based on either unadjusted quoted prices for identical assets or liabilities in active markets or quoted prices in active markets for identical assets or liabilities or prices derived from alternative pricing models when these prices are not available from pricing vendors. These methodologies apply to certain investments in non-U.S. government obligations, agencies, supranationals and corporate bonds. Also included are commercial paper (CP) and certificates of deposit (CD) issued under large U.S. based CP or CD programs. For investments for which prices and other relevant information, generated by market transactions involving identical or comparable assets, are not available, the income approach valuation has been employed, using yield curves, bond or credit default swap spreads, and recovery rates based on collateral values as key inputs.
Development related debt investments – For disclosure purposes, IDB Invest estimates the fair value of its development related debt investments. Loans and development related investments in debt securities for which a combination of observable and unobservable inputs is generally available, require the use of estimates and present value calculations of future cash flows. The fair values are estimated using recently executed transactions, market price quotations (where observable), and market observable credit default swap levels along with proprietary valuation models where such transactions and quotations are unobservable. The lack of objective pricing standards adds a greater degree of subjectivity and volatility to these derived or estimated fair values.
Any excess or deficit resulting from the difference between the carrying amounts of the development related debt investments carried at amortized cost and the fair value disclosed does not necessarily reflect the realizable values since IDB Invest generally holds investments to maturity with the aim of realizing their contractual cash flows.
Equity investments – Equity investments includes direct equity investments and LPs primarily in small and medium-sized enterprises and financial instruments. In most cases, market prices are not available, and alternate valuation techniques require a significant degree of judgment. IDB Invest intends to hold investments in LPs until the final liquidation of the underlying assets of the LPs in order to participate fully in the performance of the LP. IDB Invest does not have redemption rights in any of these investments. IDB Invest estimates that the underlying assets of the LPs generally may be liquidated over a period of 10 years.
Equity investments at fair value – Equity investments are recorded at fair value if publicly traded in certain markets, or IDB Invest elects the FVO. For investments in LPs, IDB Invest utilizes the NAVs reported by the fund managers as the basis of the fair value measurement. These NAVs are derived from the fair values of the underlying investments and adjusted further by IDB Invest, as needed.
Equity investments at cost-based measurement alternative – IDB Invest’s methodology to measure equity investments using the cost-based measurement alternative requires the use of estimates and present value calculations of future cash flows for impairments or observable price change adjustments. IDB Invest relies on third-party valuation specialists when available, internal estimates, or a combination of both.
Inter-American Investment Corporation
Notes to Financial Statements
135

Derivative instruments – These include cross currency and interest rate swap contracts. Fair values are determined by obtaining the present value of estimated future cash flows using appropriate discount rates.
Borrowings – IDB Invest’s borrowings are recorded at amortized cost or fair value. The fair value of IDB Invest’s borrowings is estimated using traded prices, quoted market prices or discounted cash flow analyses based on IDB Invest’s current borrowing rates for similar types of borrowing arrangements.
Other assets and liabilities – The carrying value of financial instruments included in Receivables and other assets, and Payables and other liabilities approximates fair value due to their liquid or short-term nature.
Inter-American Investment Corporation
Notes to Financial Statements
136

Fair value of financial instruments
IDB Invest’s financial instruments recorded or disclosed at fair value have been categorized based on a fair value hierarchy in accordance with ASC 820 and are as follows (US$ thousands):
December 31, 2020
Carrying amount Level 1 Level 2 Level 3 Fair value
Investment securitiesCorporate securities $ 967,805 $ — $ 967,805 $ — $ 967,805
Money market funds 617,053 — 617,053 — 617,053
Agency securities 309,103 — 309,103 — 309,103
Government securities 114,850 — 114,850 — 114,850
Supranational securities 70,225 — 70,225 — 70,225
2,079,036 — 2,079,036 — 2,079,036
LoansAmortized cost 3,654,492 — — 3,739,510 3,739,510
Fair value 155,647 — — 155,647 155,647
3,810,139 — — 3,895,157 3,895,157
Equity investmentsCost-based measurement alternative 4,695 — — 4,695 4,695
Fair value 43,441 1,119 — 42,322 43,441
NAV(1) 83,272 83,272
131,408 1,119 — 47,017 131,408
Debt securitiesAmortized cost 128,204 — — 145,777 145,777
Fair value 275,593 — — 275,593 275,593
NAV(1) 12,643 12,643
416,440 — — 421,370 434,013
Derivative assets Cross currency swaps 4,114 — 4,114 — 4,114
Interest rate swaps 1,347 — 1,347 — 1,347
5,461 — 5,461 — 5,461
BorrowingsAmortized cost 1,792,818 — 1,572,243 258,166 1,830,409
Fair value 2,115,639 — 2,115,639 — 2,115,639
3,908,457 — 3,687,882 258,166 3,946,048
Derivative liabilitiesCross currency swaps 444 — 444 — 444
Interest rate swaps 1,390 — 1,390 — 1,390
1,834 — 1,834 — 1,834 (1)In accordance with ASC 820, investments that are recorded using net asset value per share as a practical expedient to fair value have notbeen classified in the fair value hierarchy. The fair value amounts presented in this table are intended to permit reconciliation of the fair valuehierarchy to the amounts presented in the balance sheets.
Inter-American Investment Corporation
Notes to Financial Statements
137

December 31, 2019
Carrying amount Level 1 Level 2 Level 3 Fair value
Investment securitiesCorporate securities $ 677,372 $ — $ 677,372 $ — $ 677,372
Money market funds 372,822 — 372,822 — 372,822
Agency securities 136,336 — 136,336 — 136,336
Government securities 127,911 2,995 124,916 — 127,911
Supranational securities 23,223 — 23,223 — 23,223
1,337,664 2,995 1,334,669 — 1,337,664
LoansAmortized cost 2,042,297 — — 2,099,284 2,099,284
Fair value 27,527 — — 27,527 27,527
2,069,824 — — 2,126,811 2,126,811
Equity investmentsCost-based measurement alternative 4,695 — — 4,695 4,695
Fair value 27,239 1,298 — 25,941 27,239
NAV(1) 64,741 64,741
96,675 1,298 — 30,636 96,675
Debt securitiesAmortized cost 133,624 — — 144,720 144,720
Fair value 197,406 — — 197,406 197,406
NAV(1) 45,894 45,894
376,924 — — 342,126 388,020
BorrowingsAmortized cost 1,648,146 — 1,655,632 — 1,655,632
(1)In accordance with ASC 820, investments that are recorded using net asset value per share as a practical expedient to fair value have notbeen classified in the fair value hierarchy. The fair value amounts presented in this table are intended to permit reconciliation of the fair valuehierarchy to the amounts presented in the balance sheets.
Inter-American Investment Corporation
Notes to Financial Statements
138

The following tables present changes in carrying value of IDB Invest’s Level 3 financial instruments that are carried at fair value as follows (US$ thousands):
Year ended December 31, 2020
Balance as of January 1, 2020
Net gains and losses included in
income
Disbursements, purchases,
sales, settlements and other
Balance as of December 31, 2020
Net unrealized gains/ (losses) included in earnings related to
assets/liabilities held at December 31, 2020
Loans $ 27,527 $ (189) $ 128,309 $ 155,647 $ (189)
Equity investments 25,941 1,754 14,627 42,322 1,506
Debt securities 197,406 (5,485) 83,672 275,593 (5,485) Total assets at fair value 250,874 (3,920) 226,608 473,562 (4,168)
Year ended December 31, 2019
Balance as of January 1, 2019
Net gains and losses included in
income
Disbursements, purchases,
sales, settlements and other
Balance as of December 31, 2019
Net unrealized gains/(losses) included in earnings related to
assets/liabilities held at December 31, 2019
Loans $ 7,714 $ (905) $ 20,718 $ 27,527 $ (905) Equity investments — 1,141 24,800 25,941 1,141 Debt securities 60,333 (84) 137,157 197,406 (84) Total assets at fair value $ 68,047 $ 152 $ 182,675 $ 250,874 $ 152
Inter-American Investment Corporation
Notes to Financial Statements
139

The following tables present gross purchases, sales, issuances and settlements related to the changes in the carrying value of IDB Invest’s Level 3 financial instruments that are carried at fair value (US$ thousands):
Year ended December 31, 2020Disbursements/
PurchasesRepayments/
Sales IssuancesSettlements and
others NetLoans $ 131,130 $ (2,821) $ — $ — $ 128,309
Equity investments 15,857 (1,230) — — 14,627
Debt securities 84,838 (1,166) — — 83,672 Total assets at fair value $ 231,825 $ (5,217) $ — $ — $ 226,608
Year ended December 31, 2019Disbursements/
PurchasesRepayments/
Sales IssuancesSettlements and
others NetLoans $ 20,718 $ — $ — $ — $ 20,718
Equity investments 15,500 — — 9,300 24,800
Debt securities 137,157 — — — 137,157 Total assets at fair value $ 173,375 $ — $ — $ 9,300 $ 182,675
The following tables present the valuation techniques and significant unobservable inputs for development related investments classified as Level 3 as of December 31, 2020 and December 31, 2019 (US$ thousands):
December 31, 2020
Fair value Valuation technique Significant inputs RangeWeighted average
Loans $ 128,247 Discounted cash flows Discount rate 2.5%-15.0% 4.1%
27,400 Recent transaction
155,647 Equity investments 16,889 Discounted cash flows Discount rate 18.4% 18.4%
15,857 Recent transaction
9,576 Various techniques (1)
42,322 Debt securities 194,661 Discounted cash flows Discount rate 2.3%-6.0% 3.5%
80,932 Recent transaction
275,593 Total $ 473,562
(1) Includes a combination of valuation techniques utilizing discounted cash flows, recent transactions and valuation multiples.
Inter-American Investment Corporation
Notes to Financial Statements
140

December 31, 2019
Fair value Valuation technique Significant inputs RangeWeighted average
Loans $ 26,096 Discounted cash flows Discount rate 6.5%-15.0% 10.1%
1,431 Recent transaction
27,527 Equity investments 15,500 Recent transaction
10,441 Various techniques(1)
25,941 Debt securities 177,524 Discounted cash flows Discount rate 3.9%-9.3% 5.6%
19,882 Listed price
197,406 Total $ 250,874
(1) Includes a combination of valuation techniques utilizing discounted cash flows, recent transactions and valuation multiples.
There were no transfers between levels during the year ended December 31, 2020 nor December 31, 2019.
Inter-American Investment Corporation
Notes to Financial Statements
141

11. Gain/(loss) from changes in fair value on non-trading portfolios and foreign exchange transactions, net
Net gains and losses on non-trading portfolios are as follows (US$ thousands):
Year ended December 312020 2019
Gain/(loss) from changes in fair value, netDevelopment related debt investments $ (937) $ (798) Borrowings 3,997 — Derivatives
Realized gain/(loss) on swaps 2,178 — Unrealized gain/(loss) on swaps 3,627 —
8,865 (798)
Gain/(loss) from foreign exchange transactions, net 6,487 (3,559) Gain/(loss) from changes in fair value and foreign exchange transactions, net $ 15,352 $ (4,357)
IDB Invest's non-trading portfolio includes development related debt investments and borrowings accounted for at fair value under the Fair Value Option as well as derivative instruments at fair value. Changes in the fair value of borrowings resulting from changes in IDB Invest's own credit risk spread are recorded through Other comprehensive income whereas changes in fair value due to market risk, and all fair value changes on derivatives, are accounted for in the income statements.
Inter-American Investment Corporation
Notes to Financial Statements
142

12. Contingencies and Leases
In the ordinary course of business, IDB Invest is from time to time named as a defendant, co defendant or party in litigation matters inherent to and typical of the operations in which it is engaged. In the opinion of IDB Invest’s management, the ultimate resolution of these legal proceedings would not have a material adverse effect on the financial position, results of operations, or cash flows.
The recent global outbreak of the COVID-19 pandemic has disrupted economic markets and created significant volatility. The operational and financial performance of the companies IDB Invest finances depends on future developments, including the duration and spread of the outbreak. Such uncertainty may impact the fair value of IDB Invest’s development related investments and the credit worthiness of IDB Invest’s borrowers. IDB Invest has capital buffers in place to absorb additional stress and credit rating downgrades.
Office Space Leases
IDB Invest has entered into office space leases with the IDB at headquarters and in its Regional Developing Member Countries that are accounted for as either short-term leases or operating leases. The current lease agreement with the IDB at headquarters expired in 2020 and was renewed for an additional ten year term that will expire in 2030. The remaining current lease agreements with the IDB in the Regional Developing Member Countries are renewed annually with the exception of the Argentina, Brazil and Colombia offices which extend between 2021 and 2023. The lease agreements in Argentina and Colombia include renewal options to extend the lease term, all of which IDB Invest is reasonably certain to exercise for the duration established in the contract.
Refer to Notes 5 and 6 for additional information related to IDB Invest’s operating lease right-of-use assets and operating lease liabilities outstanding as of December 31, 2020.
The following table details the lease expenses and quantitative disclosure requirements (US$ thousands): Year ended December 31
2020 2019Operating leases
Operating lease expense $ 6,110 $ 6,109
Total lease expense $ 6,110 $ 6,109 Supplemental disclosure:
Weighted average of lease terms (years) 9.92 10.90
Weighted average discount rate 3.11 % 3.11 %
Discount rate is determined as IDB Invest's incremental borrowing rate under the IDB multi-currency facility.
Maturity analysis of operating lease liabilities with the IDB are as follows (US$ thousands):December 31, 2020
Undiscounted cash flows in 2021 $ 5,351
Undiscounted cash flows in 2022 5,315
Undiscounted cash flows in 2023 5,436
Undiscounted cash flows in 2024 5,503
Undiscounted cash flows in 2025 and thereafter 36,664
Total operating leases $ 58,269 Discount (8,330)
Operating lease liability $ 49,939
Inter-American Investment Corporation
Notes to Financial Statements
143

13. Related Party Transactions
IDB Invest and the IDB entered into SLAs whereby IDB Invest provides certain services to the IDB and the IDB provides certain services to IDB Invest. These services are further described below. IDB Invest has also entered into office space leases with the IDB discussed in Note 12.
Service Level Agreements
The SLAs with the IDB outline the duration, scope of work, roles and responsibilities, remuneration, and performance metrics of each institution.
Co-financing Arrangements and SLA Revenue
Following the IDB Group private sector and non-sovereign guaranteed (NSG) reorganization, all new NSG activities are originated by IDB Invest and largely co-financed by IDB Invest and the IDB. IDB Invest and the IDB maintain separate legal and economic interests in their respective share of the loan principal balance for a co-financed loan. IDB Invest’s portion is defined as a percentage of the overall transaction subject to certain minimum amounts as agreed between IDB Invest and the IDB.
IDB Invest earns revenue from an annual renewable SLA under which IDB Invest provides loan origination, credit risk evaluation and monitoring, and certain loan administration services for the IDB related to its private sector operations including operations that are co-financed by IDB Invest and IDB. IDB Invest also provides certain advisory services to the IDB Group. These amounts are included in Service fees from related parties in the income statements.
Management of External Funds
IDB Invest administers on behalf of other related party entities, which include donors and member countries, funds restricted for specific uses that include the co-financing of certain projects, technical studies for borrowers, project-related studies, and research and training programs. These funds are held in trust by IDB Invest and are not commingled with IDB Invest’s funds, nor are they included in the assets of IDB Invest. IDB Invest receives a management fee that is generally a percentage of the funds received. These fees are included in Service fees from related parties in the income statements.
Access to IDB Administered Funds
In addition to the aforementioned funds, IDB Invest provides certain services for trust funds administered by the IDB on behalf of the trust fund donors (the Trust Funds). IDB Invest receives an allocation of the IDB’s related Trust Fund fees. Such fees are intended to cover internal and external costs associated with administering the NSG activities for the Trust Funds and related operations over the expected lives of the Trust Funds and the underlying operations. Costs expected to be incurred approximate the allocable fee. The Trust Fund organizational documents provide for either the payment of a lump sum or scheduled payments. The timing of the payments may not correspond to the incurrence of the related costs. IDB Invest also provides certain technical assistance activities for private sector operations on behalf of donor trust funds that are directly funded by IDB Trust Funds. These arrangements are recognized on a cost reimbursement basis and presented gross in Service fees from related parties and Administrative expenses in the income statements.
For the year ended December 31, 2020, IDB Invest received $4.3 million for these services ($1.2 million for the year ended December 31, 2019). As of December 31, 2020, IDB Invest has recorded deferred revenue of $15.0 million related to these services ($12.5 million as of December 31, 2019), which will be recognized as revenue as services are provided. Deferred revenue is presented as a component of Payables and other liabilities in the balance sheets.
Inter-American Investment Corporation
Notes to Financial Statements
144

Revenue from related party transactions are as follows (US$ thousands):
Year ended December 312020 2019
SLA revenue $ 76,688 $ 73,652
Management of external funds revenue 2,109 2,202
IDB administered funds revenue 7,079 1,566
Total $ 85,876 $ 77,420
SLA Expenses
IDB Invest purchases various general and administrative services from the IDB under a series of annual renewable SLAs. IDB Invest incurred expenses of $16.7 million for receiving these SLA services from the IDB for the year ended December 31, 2020 ($14.6 million for the year ended December 31, 2019) that are included in Administrative expenses in the income statements. Payables related to these SLA expenses are included in the total Due to IDB, net of $14.8 million as of December 31, 2020 ($8.4 million as of December 31, 2019). Refer to Note 6 for additional details.
Other Transactions with Related Parties
IDB Invest has a renewable credit facility with the IDB amounting to $300.0 million. On September 21, 2018, this renewable credit facility was modified from a United States dollar facility to a multicurrency facility and the original expiration date of November 2020 was modified and extended to December 2022. As of December 31, 2020, IDB Invest’s total drawdowns from the IDB multi-currency credit facility were $185.1 million and $114.9 million remain available ($150.8 million total drawdowns and $149.2 million available as of December 31, 2019). Refer to Note 7 for additional details.
14. Pension and Postretirement Benefit Plans
Both the IDB and IDB Invest are sponsors of the Pension Plans and PRBP and each employer presents its respective share of these plans using a December 31 measurement date.
Inter-American Investment Corporation
Notes to Financial Statements
145

Obligations and funded status
IDB Invest uses a December 31 measurement date for the Pension Plans and the PRBP. The following table summarizes the change in benefit obligation, change in plan assets, funded status of the Pension Plans and the PRBP, and the amounts recognized in the balance sheets (US$ thousands):
Pension Plans PRBP2020 2019 2020 2019
Reconciliation of benefit obligationObligation as of January 1 $ (306,498) $ (224,152) $ (180,482) $ (136,934)
Service cost (18,717) (12,303) (7,671) (5,228)
Interest cost (9,635) (9,317) (5,600) (5,525)
Participants' contributions (3,659) (3,458) — —
Plan amendments — — — —
Net transfers between IDB and IIC 1,856 1,590 723 1,516
Actuarial gains/(losses) (49,420) (62,204) (25,608) (35,997)
Benefits paid 3,590 3,346 1,173 1,695
Retiree Part D subsidy — — (20) (9)
Obligation as of December 31 $ (382,483) $ (306,498) $ (217,485) $ (180,482)
Reconciliation of fair value of plan assetsFair value of plan assets as of January 1 228,578 184,260 162,684 132,799
Net transfers between IDB and IIC (1,856) (1,590) (723) (1,516)
Actual return on plan assets 25,086 38,699 16,967 28,399
Benefits paid (3,590) (3,346) (1,173) (1,695)
Participants' contributions 3,659 3,458 — —
Employer contributions 7,501 7,097 5,036 4,697
Fair value of plan assets as of December 31 $ 259,378 $ 228,578 $ 182,791 $ 162,684
Funded statusFunded/(Underfunded) status as of December 31 (123,105) (77,920) (34,694) (17,798)
Funded status as of December 31 $ (123,105) $ (77,920) $ (34,694) $ (17,798)
Amounts recognized in Accumulated other comprehensive income/(loss) consist of:Net actuarial (gain)/loss 83,744 52,011 45,582 31,574
Prior service (credit)/cost — — (1,399) (1,836)
Transition obligation/(asset) — — Net amount recognized as of December 31 $ 83,744 $ 52,011 $ 44,183 $ 29,738
As of December 31, 2020 and 2019, the Pension Plans and PRBP were all underfunded. In 2020 and 2019, the aggregate fair value of the Pension Plans and PRBP's assets were $442.2 million and $391.3 million, respectively, and aggregate benefit obligations were $600.0 million and $487.0 million, respectively, contributing to the total Pension Plans and PRBP liability of $157.8 million and $95.7 million, respectively, as of December 31, 2020 and 2019.
Inter-American Investment Corporation
Notes to Financial Statements
146

The accumulated benefit obligation, in excess of the fair value of the Pension Plans' assets is as follows (US$ thousands):
Pension Plans2020 2019
Accumulated benefit obligation $ (312,419) (248,390)
Fair value of plan assets $ 259,378 $ 228,578
Funded status $ (53,041) $ (19,812)
The accumulated benefit obligation attributable to IDB Invest for the Pension Plans, which excludes the effect of future salary increases was $312.4 million and $248.4 million as of December 31, 2020 and 2019, respectively.
Components of net periodic benefit cost
Pension Plans and PRBP net periodic benefit costs recognized in the income statements consists of the following components (US$ thousands):
Year ended December 31Pension Plans PRBP
2020 2019 2020 2019Service cost (1) $ 18,717 $ 12,303 $ 7,671 $ 5,228
Interest cost (3) 9,635 9,317 5,600 5,525
Expected return on plan assets (2)(3) (11,590) (10,946) (7,781) (7,815)
Amortization of: (3)
Net actuarial (gain)/loss 4,191 107 2,414 130
Prior service (credit)/cost — — (437) (437)
Net periodic benefit cost $ 20,953 $ 10,781 $ 7,467 $ 2,631 (1) Included in Administrative expenses.(2) The expected long-term rate of return on plan assets is 5.75% in 2020 and 6.00% in 2019.(3) Included in Other components of pension benefit costs, net.
Other changes in plan assets and benefit obligations recognized in Other comprehensive income/(loss) (US$ thousands):
Year ended December 31Pension Plans PRBP
2020 2019 2020 2019Current actuarial (gain)/loss, net $ 35,924 $ 34,451 $ 16,422 $ 15,413
Amortization of:Net actuarial (gain)/loss (4,191) (107) (2,414) (130)
Prior service (credit)/cost — — 437 437
Total recognized in other comprehensive (income)/loss $ 31,733 $ 34,344 $ 14,445 $ 15,720
Total recognized in Net periodic benefit cost and Other comprehensive (income)/loss $ 52,686 $ 45,125 $ 21,912 $ 18,351
Inter-American Investment Corporation
Notes to Financial Statements
147

Actuarial assumptions
The actuarial assumptions used in the Pension Plans and PRBP valuations are based on financial market interest rates, past experience, and management's best estimate of future benefit changes and economic conditions. Changes in these assumptions will impact future benefit costs and obligations. Actuarial gains and losses occur when actual results are different from expected results. Actuarial gains and losses recognized in Accumulated other comprehensive income, which exceed 10% of the greater of the benefit obligation or market-related value of the plan assets at the beginning of the period, are amortized to income over the average remaining service period of active participants expected to receive benefits under the Pension Plans and PRBP, which is approximately 10.5 and 12.6 years, respectively.
Unrecognized prior service credit is amortized over a range of 2.4 years to 5.0 years for the PRBP.
The weighted-average assumptions used to determine the benefit obligation and the net periodic benefit cost were as follows:
Pension Plans PRBP2020 2019 2020 2019
Weighted average assumptions used to determine benefit obligation as of December 31
Discount rate 2.44 % 3.17 % 2.52 % 3.23 %
Inflation rate 2.12 % 2.20 % 2.12 % 2.20 %
Rate of compensation increase 4.26 % 4.34 % n/a n/a
Pension Plans PRBP2020 2019 2020 2019
Weighted average assumptions used to determine net periodic benefit cost for years ended December 31
Discount rate 3.17 % 4.17 % 3.23 % 4.22 %Expected long-term rate of return on plan assets 5.75 % 6.00 % 5.50 % 6.00 %Rate of compensation increase 4.34 % 4.27 % n/a n/aInflation rate 2.20 % 2.21 % n/a n/a
The expected long-term rate of return on the Pension Plans and PRBP's assets represents management's best estimate, after surveying external investment specialists, of the expected long-term (10 years or more) forward-looking rates of return of the asset categories employed by the Pension Plans and PRBP, weighted by the Pension Plans and PRBP's investment policy asset allocations. Accumulated and projected benefit obligations are measured as the present value of expected payments. The discount rate used is selected in reference to the year-end yield of AA corporate bonds within the approved Financial Times Stock Exchange Pension Liability Index, with maturities that correspond to the payment of benefits. For the assumed rate of inflation, the IDB has established a process by which a range of inputs is reviewed, including 10-year forward looking expert opinion forecasts, the average of the 10 year and 30 year U.S. Treasury Inflation Protected Securities (U.S. TIPS) breakeven inflation rate, and historical averages.
The decreases in the weighted-average discount rates for the Pension Plans and PRBP in 2020 and 2019 were the primary driver for the increases in the benefit obligations of approximately $45.2 million and $16.9 million, respectively, as of December 31, 2020 with respect to the precedent year ($38.0 million and $13.7 million, respectively, as of December 31, 2019).
Significant actuarial gains and losses related to changes in the Plans' benefit obligations for 2020 and 2019 primarily resulted from changes in the discount rate.
Inter-American Investment Corporation
Notes to Financial Statements
148

For participants assumed to retire in the United States, the accumulated postretirement benefit obligation was determined using the following health care cost trend rates at December 31:
PRBP2020 2019
Health care cost trend rates assumed for next yearMedical, Non-Medicare 4.50 % 4.75 %
Medical, Medicare 2.50 % 2.75 %
Prescription drugs 6.00 % 6.50 %
Dental 4.50 % 4.50 %
Rate to which the cost trend rate is assumed to decline (the ultimate trend rate)Medical, Non-Medicare 4.50 % 4.50 %
Medical, Medicare 2.50 % 2.50 %
Prescription drugs 6.00 % 6.00 %
Dental 4.50 % 4.50 %
Year that the rate reaches the ultimate trend rate 2021 2021
For those participants assumed to retire outside of the United States, a 5.00% and 5.50% health care cost trend rate was used for 2020 and 2019, respectively with an ultimate trend rate of 4.50% in 2023.
Pension Plans and PRBP Assets
The assets of the Pension Plans and the PRBP are managed primarily by investment managers engaged by the IDB who are provided with investment guidelines that take into account the Pension Plans and PRBP investment policies. Investment policies with long-term strategic asset allocations have been developed so that there is an expectation of sufficient returns to meet long-term funding needs. The policies allocate 65% of the Pension Plans portfolio to growth-oriented assets (the Return Strategies), and 35% of assets to nominal and inflation-indexed U.S. fixed income (the Liabilities Hedging Strategies), to partially hedge the interest rate and inflation exposure in the Pension Plans and PRBP’s liabilities, and to protect against disinflation.
The Pension and Managing Committees of the Pension Plans and PRBP approve Investment Policy Statements (IPS) and Strategic Asset Allocations (SAA), which comply with the IDB’s Risk Appetite (RA) and Long-term Funding (LTF) policies.
Inter-American Investment Corporation
Notes to Financial Statements
149
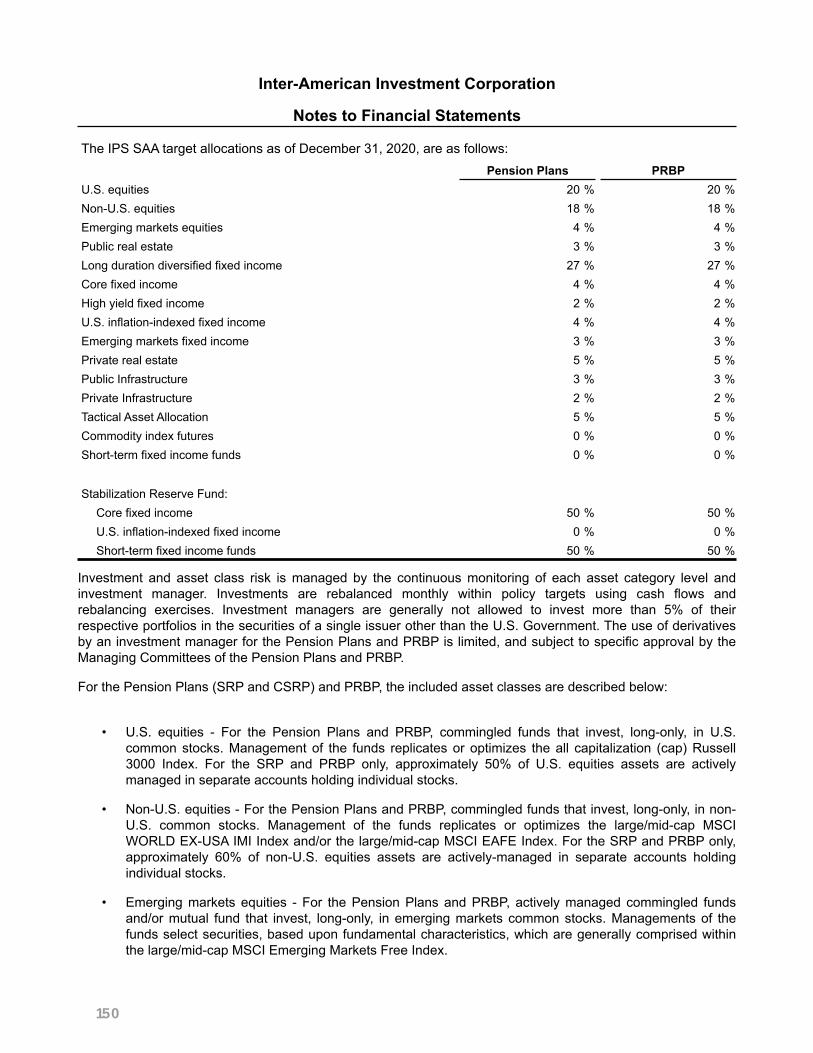
The IPS SAA target allocations as of December 31, 2020, are as follows:Pension Plans PRBP
U.S. equities 20 % 20 %Non-U.S. equities 18 % 18 %Emerging markets equities 4 % 4 %Public real estate 3 % 3 %Long duration diversified fixed income 27 % 27 %Core fixed income 4 % 4 %High yield fixed income 2 % 2 %U.S. inflation-indexed fixed income 4 % 4 %Emerging markets fixed income 3 % 3 %Private real estate 5 % 5 %Public Infrastructure 3 % 3 %Private Infrastructure 2 % 2 %Tactical Asset Allocation 5 % 5 %Commodity index futures 0 % 0 %Short-term fixed income funds 0 % 0 %
Stabilization Reserve Fund:Core fixed income 50 % 50 %U.S. inflation-indexed fixed income 0 % 0 %Short-term fixed income funds 50 % 50 %
Investment and asset class risk is managed by the continuous monitoring of each asset category level and investment manager. Investments are rebalanced monthly within policy targets using cash flows and rebalancing exercises. Investment managers are generally not allowed to invest more than 5% of their respective portfolios in the securities of a single issuer other than the U.S. Government. The use of derivatives by an investment manager for the Pension Plans and PRBP is limited, and subject to specific approval by the Managing Committees of the Pension Plans and PRBP.
For the Pension Plans (SRP and CSRP) and PRBP, the included asset classes are described below:
• U.S. equities - For the Pension Plans and PRBP, commingled funds that invest, long-only, in U.S.common stocks. Management of the funds replicates or optimizes the all capitalization (cap) Russell3000 Index. For the SRP and PRBP only, approximately 50% of U.S. equities assets are activelymanaged in separate accounts holding individual stocks.
• Non-U.S. equities - For the Pension Plans and PRBP, commingled funds that invest, long-only, in non-U.S. common stocks. Management of the funds replicates or optimizes the large/mid-cap MSCIWORLD EX-USA IMI Index and/or the large/mid-cap MSCI EAFE Index. For the SRP and PRBP only,approximately 60% of non-U.S. equities assets are actively-managed in separate accounts holdingindividual stocks.
• Emerging markets equities - For the Pension Plans and PRBP, actively managed commingled fundsand/or mutual fund that invest, long-only, in emerging markets common stocks. Managements of thefunds select securities, based upon fundamental characteristics, which are generally comprised withinthe large/mid-cap MSCI Emerging Markets Free Index.
Inter-American Investment Corporation
Notes to Financial Statements
150

• Public real estate equities - For the SRP and PRBP only, individual (separate) account which holds,long-only, real estate securities. The account is actively-managed based upon fundamentalcharacteristics, investing in securities generally comprised within the MSCI U.S. REIT Index.
• Long duration diversified fixed income - For the SRP and PRBP only, long duration fixed income assetsare actively managed in separate accounts holding individual bonds generally comprised within theBloomberg Barclays U.S. Long Government/Credit Bond Index. For the CSRP, actively managedcommingled fund and/or mutual fund that invest, long-only, in long duration government and creditsecurities. Managements of the funds select securities, based upon fundamental characteristics, whichare generally comprised within the Bloomberg Barclays U.S. Long Government/Credit Bond Index, aswell as opportunistic investments in non-index securities.
• Core fixed income - For the Pension Plans and PRBP, actively managed commingled funds that invest,long-only, in intermediate duration government and credit securities. Managements of the funds selectsecurities, based upon fundamental characteristics, which are generally comprised within theBloomberg Barclays U.S. Aggregate Bond Index, as well as opportunistic investments in non-indexsecurities.
• High yield fixed income - For the SRP only, assets are actively managed in a separate account holdingindividual securities, and for the PRBP only, in an actively managed commingled fund. For both theSRP and PRBP, the investible universe is generally comprised of the securities within the BloombergBarclays High Yield 2% Constrained Index, as well as opportunistic investments in non-index securities.High yield securities are financial obligations of U.S. companies, rated below investment-grade by atleast one of the nationally recognized statistical rating organizations.
• U.S. inflation-indexed fixed income - For the Pension Plans and PRBP, investment in individual U.S.Treasury Inflation Protected Securities in accounts managed internally. For the SRP and PRBP,replicate or optimize the Bloomberg Barclays U.S. Treasury Inflation Notes 10+ Years Index. For theSRP and PRBP Stabilization Reserve Funds, replicate or optimize the Bloomberg Barclays U.S.Treasury Inflation TIPS 0-5 Years Index. For the CSRP, replicates or optimizes the Bloomberg BarclaysU.S. Treasury Inflation Notes 10+ Years Index.
• Emerging markets fixed income - For the Pension Plans and PRBP, actively managed commingledfunds that invest, long-only, in emerging markets fixed income. The funds invest in sovereign and sub-sovereign United States dollar- and local-denominated debt. Managements of the funds invest insecurities generally comprised within the J.P. Morgan EMBI Global Diversified Index, as well asopportunistic investments in non-index securities.
• Private real estate - For the Pension Plans and PRBP, an open-end commingled funds which invest,long-only, in U.S. real estate properties. The funds are actively-managed based upon fundamentalcharacteristics of the properties.
• Public infrastructure - For the CSRP, an enhanced index exchange-traded fund that invests, long-only,in U.S. and developed markets common stocks within the infrastructure industries. Management of thefund selects securities, based upon fundamental characteristics, which are generally comprised withinthe MSCI World Infrastructure Index. For the SRP and PRBP only, assets are actively managed in aseparate account holding individual stocks.
• Private infrastructure - For the SRP and PRBP only, an actively managed , open-end commingled fundwhich invests, long-only, in U.S. and developed markets private equity within the infrastructure sector.This new asset class is not implemented yet.
Inter-American Investment Corporation
Notes to Financial Statements
151

• Tactical asset allocation - For the SRP and PRBP only, actively managed commingled funds and mutualfund that invest in U.S. and developed markets equities, fixed income, commodities and currencies,investments could shift due to opportunistic behavior within these markets.
• Commodity index futures - For the CSRP, investment in a commingled fund that invests, long-only incommodity index futures. Management of the fund replicates or optimizes the Bloomberg CommodityIndex.
• Short-term fixed income funds - Commingled funds that invest, long-only, in U.S. Government securitieswith maturities of less than 18 months. Managements of the funds invest in short-term governmentsecurities only, which are benchmarked against the Merrill Lynch 3-month Treasury Bill Index.
Effective December 2015, the IDB Board of Executive Directors (Board) approved the Long-Term Funding Policy (LTF) for the Pension Plans (SRP and CSRP) and the PRBP that established stable contribution rates of 20% (SRP), 0.71% (CSRP) and 12% (PRBP) of applicable salaries and established the Stabilization Reserve Funds (SRFs) for the SRP and PRBP for the IDB Invest and IDB. The LTF Policy had a five-year initial term. In July 2019, following a review of the LTF Policy components, the Board adopted and enhanced version of the LTF policy as part of the ongoing financial policies of the IDB. The enhanced version of the LTF policy removes its sunset period, continues to keep the IDB Invest and IDB contribution rates at a stable level, and establishes a rules based mechanism to guide management decision making to allocate IDB Invest and IDB contributions when the SRFs reaches its limits, as well as when the Pension Plans and PRBP reach their fully funded status. IDB Invest contributions made in excess (deficit) of the actuary’s determined contribution rate are allocated (withdrawn) to (from) the SRFs. The approved Investment Policy Strategic Asset Allocation for the Stabilization Reserve Funds is 50% Short-term fixed income funds cash and 50% Core fixed income.
The following tables set forth the investments of the Pension Plans and PRBP as of December 31, 2020 and 2019, which are measured at fair value and presented together with their weighted average allocation, by level within the fair value hierarchy. As required by the fair value measurements accounting framework, these investments are classified in their entirety based on the lowest level of input that is significant to the fair value measurement. Investments in funds that do not have a readily determinable fair value are measured at NAV as a practical expedient and are not classified within the fair value hierarchy (US$ thousands).
Inter-American Investment Corporation
Notes to Financial Statements
152

Pension Plans
December 31, 2020
Level 1 Level 2Fair value
measurements
Weightedaverage
allocationsEquity securities
U.S. equities $ 23,460 $ 25,345 $ 48,805 19 %
Non-U.S. equities 27,708 15,829 43,537 17 %
Emerging markets equities 5,269 5,356 10,625 4 %
Public real estate equities 8,840 — 8,840 3 %Public infrastructure 7,421 — 7,421 3 %
Government and diversified fixed income and fixed income funds
Long duration U.S. Government and Agencies fixed income 21,486 1,464 22,950 9 %
Long duration diversified fixed income 447 40,426 40,873 16 %
Core fixed income — 17,994 17,994 7 %
Emerging markets fixed income — 7,172 7,172 3 %
High yield fixed income — 3,890 3,890 1 %
U.S. inflation-indexed fixed income 9,507 — 9,507 3 %
Tactical asset allocation 6,044 6,818 12,862 5 %
Short-term fixed income funds 1,327 11,469 12,796 5 %
$ 111,509 $ 135,763 $ 247,272 Investments measured at NAV
Private real estate fund 13,861 5 %
Total investments $ 261,133 100 %Other liabilities, net (1) (1,755)
Total $ 259,378 (1) Includes receivables and payables carried at amounts that approximate fair value. Mainly payables for investments purchased.
Inter-American Investment Corporation
Notes to Financial Statements
153

Pension PlansDecember 31, 2019
Level 1 Level 2Fair value
measurements
Weightedaverage
allocationsEquity securities
U.S. equities $ 16,489 $ 28,172 $ 44,661 20 %
Non-U.S. equities 25,756 14,101 39,857 17 %
Emerging markets equities 5,144 4,385 9,529 4 %
Public real estate equities 348 6,342 6,690 3 %
Public infrastructure 11,087 — 11,087 5 %
Government and diversified fixed income and fixed income funds
Long duration U.S. Government and Agencies fixed income 21,501 1,334 22,835 10 %
Long duration diversified fixed income 386 35,312 35,698 15 %
Core fixed income — 13,731 13,731 6 %
Emerging markets fixed income — 6,567 6,567 3 %
High yield fixed income 125 4,137 4,262 2 %
U.S. inflation-indexed fixed income 9,126 — 9,126 4 %
Tactical asset allocation 5,211 4,851 10,062 4 %
Short-term fixed income funds 1,359 6,168 7,527 3 %
$ 96,532 $ 125,100 $ 221,632 Investments measured at NAV
Private real estate fund 9,101 4 %
Total investments $ 230,733 100 %Other liabilities, net (1) (2,155)
Total $ 228,578 (1) Includes receivables and payables carried at amounts that approximate fair value. Mainly payables for investments purchased.
Inter-American Investment Corporation
Notes to Financial Statements
154

PRBPDecember 31, 2020
Level 1 Level 2Fair value
measurements
Weightedaverage
allocationsEquity and equity funds
U.S. equities $ 16,776 $ 17,118 $ 33,894 19 %
Non-U.S. equities 18,960 11,178 30,138 16 %
Emerging markets equities 3,458 4,180 7,638 4 %
Public real estate equities 6,145 — 6,145 3 %Public Infrastructure 5,086 — 5,086 3 %
Government and diversified fixed income and fixed income funds
Long duration U.S. Government and Agencies fixed income 15,698 869 16,567 9 %
Long duration diversified fixed income — 28,285 28,285 15 %
Core fixed income — 14,678 14,678 8 %
Emerging markets fixed income — 4,877 4,877 3 %
High yield fixed income — 2,669 2,669 1 %
U.S. inflation-indexed fixed income 6,566 — 6,566 4 %
Tactical asset allocation 4,390 5,273 9,663 5 %
Short-term fixed income funds 10,720 10 10,730 6 %
$ 87,799 $ 89,137 $ 176,936 Investments measured at NAV
Private real estate fund 7,606 4 %
Total investments 184,542 100 %Other liabilities, net (1) (1,751)
Total $ 182,791 (1) Includes receivables and payables carried at amounts that approximate fair value. Mainly payables for investments purchased.
Inter-American Investment Corporation
Notes to Financial Statements
155

PRBPDecember 31, 2019
Level 1 Level 2Fair value
measurements
Weightedaverage
allocationsEquity and equity funds
U.S. equities $ 11,891 $ 21,555 $ 33,446 20 %
Non-U.S. equities 17,056 13,949 31,005 19 %
Emerging markets equities 3,217 3,243 6,460 4 %
Public real estate equities 245 4,487 4,732 3 %
Public infrastructure 7,796 — 7,796 5 %
Government and diversified fixed income and fixed income funds
Long duration U.S. Government and Agencies fixed income 15,354 888 16,242 10 %
Long duration diversified fixed income — 24,713 24,713 15 %
Core fixed income — 11,289 11,289 7 %
Emerging markets fixed income — 4,534 4,534 3 %
High yield fixed income — 3,051 3,051 2 %
U.S. inflation-indexed fixed income 6,493 — 6,493 4 %
Tactical asset allocation 3,833 3,800 7,633 4 %
Short-term fixed income funds 7,027 31 7,058 4 %
Total investments $ 72,912 $ 91,540 $ 164,452 100 %Other liabilities, net (1) (1,768)
Total $ 162,684 (1) Includes receivables and payables carried at amounts that approximate fair value. Mainly payables for investments purchased.
Investment securities that are measured at fair value based on quoted market prices in active markets, a valuation technique consistent with the market approach, include U.S., non-U.S. infrastructure individual equity holdings, public infrastructure exchange trade funds, fixed income mutual funds, U.S. treasury and U.S. inflation-indexed fixed income. Such securities are classified within Level 1 of the fair value hierarchy.
Investment securities that are measured at fair value based on quoted market prices for similar assets in active markets, or quoted prices for identical or similar assets in markets that are not active, a valuation technique consistent with the market approach, include corporate, non-U.S. government, high yield and municipal fixed income, and commercial mortgage backed securities. Also included are proprietary investment managers’ commingled funds investing in U.S. and global equities, emerging markets fixed income, fixed income funds, and/or short-term fixed income investments. These commingled funds are not publicly traded and are measured at fair value based on the net asset per share, which are determined and published and are the basis for current transactions. Such securities are classified within Level 2 of the fair value hierarchy.
Proprietary investment managers’ funds investing in private real estate and tactical asset allocation do not have readily determinable fair values and are measured at the NAV as a practical expedient. Such investments are not classified within the fair value hierarchy.
Contributions
Contributions from IDB Invest to the Pension Plans and the PRBP during 2021 are expected to be approximately $8.4 million and $5.6 million, respectively. All contributions are made in cash.
Inter-American Investment Corporation
Notes to Financial Statements
156

Estimated future benefit payments
The following table summarizes the benefit payments, which reflect expected future service, as appropriate, expected to be paid in each of the next five years and in the aggregate for the subsequent five years. These amounts are based on the same assumptions used to measure the benefit obligation as of December 31, 2020 (US$ thousands).
Pension Plans PRBPEstimated future benefit payments
2021 $ 4,788 $ 1,567
2022 5,180 1,715
2023 5,649 1,874
2024 6,177 2,049
2025 6,761 2,288
2026 and thereafter 46,447 16,728
15. Subsequent Events
Management has evaluated subsequent events through March 3, 2021, which is the date the financial statements were issued. Management determined that there were no subsequent events that require disclosure under ASC Topic 855, Subsequent Events.
Inter-American Investment Corporation
Notes to Financial Statements
157

92
BID INVEST
O BID Invest anunciou seu apoio à Força-Tarefa sobre Divulgações Financeiras Relacionadas ao Clima (TCFD) em novembro de 2019 e fez sua primeira divulgação de informações no Relatório Anual referente ao exercício de 2019. Desde então, as recomendações da TCFD têm constituído um quadro para orientar o avanço do BID Invest como uma instituição de financiamento do desenvolvimento climaticamente inteligente.
O BID Invest avançou rumo ao alinhamento com as recomendações da TCFD durante o exercício de 20202. Criamos um grupo de trabalho interdepartamental da TCFD que permitiu a difusão e a operacionalização das ações climáticas em toda a instituição. Além disso, o BID Invest usou sua experiência para acelerar o alinhamento com as recomendações na ALC, envolvendo clientes e oferecendo serviços de assessoria.
A Diretoria Executiva do BID Invest é composta por 13 representantes dos 47 países-membros. Esses membros abrangem os 26 países-membros regionais em desenvolvimento, todos localizados na América Latina e no Caribe, e 21 não regionais. A Diretoria Executiva exerce a supervisão das mudanças climáticas por meio dos seguintes canais, documentos e procedimentos:
A Diretoria recebe atualizações trimestrais sobre o clima, a estratégia, a gestão de riscos e os parâmetros, entre outras informações.
A Diretoria monitora o Quadro de Resultados Institucionais, que abrange riscos climáticos e metas para o financiamento climático, entre outros fatores.
O plano operacional 2020-2022 do BID Invest e suas atualizações anuais são aprovados pela Diretoria e contém compromissos e atualizações sobre o clima.
A Diretoria aprova propostas de investimento e, conforme o caso, consulta sobre o risco climático e as oportunidades associadas à transação proposta.
A nova Política de Sustentabilidade do BID Invest entrou em vigor em 15 de dezembro de 2020. Esse documento fortalece a gestão dos riscos relacionados ao clima, tanto os físicos como os associados à transição para a baixa emissão de carbono.
A Diretoria monitora as metas de financiamento climático, como o piso de 30% para o financiamento climático e o mínimo de 40% das transações com um componente de financiamento climático.
DIVULGAÇÃO DE INFORMAÇÕES DE 2020 EM CONFORMIDADE COM AS RECOMENDAÇÕES DA FORÇA-TAREFA SOBRE DIVULGAÇÕES FINANCEIRAS RELACIONADAS AO CLIMA (TCFD)
GOVERNANÇA
•
•
•
•
•
•
As informações divulgadas abrangem principalmente os ativos relacionados ao desenvolvimento que constam do balanço do BID Invest. O BID Invest continuará a trabalhar para alinhar com as recomendações da TCFD os investimentos não relacionados ao desenvolvimento.
[1]
158

RELATÓRIO ANUAL 2020
93
A administração é responsável por monitorar os riscos climáticos e também os resultados do financiamento climático do BID Invest:
Junto com outros Bancos Multilaterais de Desenvolvimento, o BID Invest está definindo uma metodologia para alinhar os fluxos financeiros dos bancos com os objetivos do Acordo de Paris. O BID Invest definiu sua estratégia institucional de curto prazo no Plano Operacional 2020-2022. O plano de ação do Grupo do BID para as mudanças climáticas referente ao período 2016-2020 apresenta um pilar estratégico adicional com respeito aos riscos e às oportunidades referentes ao clima para a instituição e seus clientes. No médio prazo, a versão de 2021-2025 desse plano, aprovada em dezembro de 2020, orientará a estratégia climática do BID Invest. Entre as medidas de alinhamento, destacam-se:
A líder da equipe encarregada das mudanças climáticas informa anualmente a alta administração sobre a estratégia e os resultados nessa área.
Um grupo de trabalho interdepartamental, composto por pessoas de nível diretivo, reúne-se mensalmente para orientar a integração do clima em toda a organização, gerindo e coordenando o processo de alinhamento do BID Invest com a TCFD3.
O Comitê de Supervisão da Carteira, presidido pelo Diretor de Risco, reúne-se trimestralmente para avaliar e discutir a carteira do BID Invest. Desde o quarto trimestre de 2020, essa reunião usa um mapa de calor que ilustra a exposição da carteira a riscos físicos e de transição, por montante em dólares e número de projetos.
O manual de implementação da Política de Sustentabilidade incorpora uma lista de exclusão que impede o BID Invest de participar de investimentos em mineração de carvão para geração de energia ou geração de energia a carvão, bem como projetos de exploração e desenvolvimento de petróleo ou gás a montante.4
O BID Invest estabeleceu definições institucionais de horizontes temporais, que formarão a base para fazer análises de cenários. Curto prazo: < 1 ano; médio prazo: 1 a 5 anos e longo prazo > 5 anos, com uma visão tendente a zero líquido até 2050.
A Divisão de Riscos ESG faz avaliações do risco climático sobre novos investimentos diretos para identificar, analisar e gerenciar possíveis impactos materiais.
O BID Invest tem oferecido serviços de consultoria e/ou incentivos na forma de financiamento combinado a três clientes para apoiar e alinhar-se com a TCFD, ajudando a formar capacidades e criar pioneiros em termos da TCFD na América Latina e Caribe.
•
•
•
•
•
•
•
ESTRATÉGIA
O grupo de trabalho da TCFD é formado por representantes das seguintes áreas: Excelência Operacional, Gestão do Risco de Crédito, Eficácia no Desenvolvimento, Meio Ambiente, Área Social e Governança Corporativa (ESG), Estratégia Institucional, Jurídica, Tesouraria, Assessoria sobre o Clima e a divisão de Infraestrutura e Energia.Em circunstâncias excepcionais e caso a caso, será analisado o financiamento de gás a montante nos países mais pobres onde exista um claro benefício em termos de acesso a energia para os pobres e quando o projeto visar à redução das emissões de gases do efeito estufa (GEE).
[3]
[4]
159

94
BID INVEST
160

RELATÓRIO ANUAL 2020
95
O BID Invest aplica uma metodologia de avaliação do risco climático a investimentos diretos durante a fase de devida diligência. A metodologia consiste em três níveis e examina a exposição a riscos físicos e de transição. Quando são identificados riscos significativos, o BID Invest trabalha com o cliente para aumentar a resiliência das operações.
O BID Invest estabelece metas e mede seu progresso e desempenho com base em uma variedade de parâmetros relacionados ao clima.
O BID Invest mede tanto a proporção de dólares comprometidos com o financiamento climático, como sua redução líquida de gases do efeito estufa (GEE) (emissões evitadas por meio de investimentos para a mitigação das mudanças climáticas).
Como parte da Política de Sustentabilidade e de acordo com os Padrões de Desempenho da IFC, o BID Invest exige que projetos com emissões brutas superiores a 25 mil tCO2e meçam e informem as emissões anualmente e proponham um plano de redução dos GEE. O BID Invest atua com clientes e presta serviços de consultoria para que aprimorem as práticas de gestão de GEE. Os números agregados das emissões de Escopo 1 e 2 dos projetos acima mencionados na carteira são divulgados abaixo.
Para avaliar a exposição a riscos físicos, o BID Invest usa um sistema de informação geográfica (SIG) com projeções de dados de modelos climáticos em escala reduzida sobre os riscos climáticos em vários caminhos de concentração representativos (RCPs, do inglês representative concentration pathways).
Para compreender a exposição aos riscos de transição, o BID Invest considera o contexto do país da transação, incluída a Contribuição Nacionalmente Determinada (NDC), bem como as informações e caminhos relativos ao setor e à vida útil dos ativos.
Ao fazer avaliações do risco climático o BID Invest consegue, por um lado, gerenciar riscos no nível da transação e, por outro lado, obter uma visão holística da exposição da carteira global a diferentes riscos e ameaças relacionados ao clima.
Do lado institucional, o Grupo do BID, do qual o BID Invest faz parte, vem informando indicadores chave, como as emissões de GEE de acordo com a Iniciativa de Relatório Global (GRI). Além disso, o Grupo tem um compromisso com a neutralidade de carbono em suas operações institucionais, promovendo a energia renovável nas representações nos países e compensando as emissões residuais com projetos na região.
O BID Invest adota um piso de 30% para o financiamento climático.5
•
•
•
•
•
GESTÃO DE RISCOS
PARÂMETROS E METAS
O BID Invest divulga o financiamento climático de médio e longo prazo de acordo com a metodologia conjunta dos BMDs. Além disso, acompanha os parâmetros internos de financiamento climático, como o financiamento de curto prazo.
[5]
161

96
BID INVEST
Empresas Instituições financeiras Infraestrutura e energia Mitigação Adaptação AmbosPFFC
Escopo das emissões institucionais de GEE1
Emissões de GEE financiadas na carteira ativa no ano do relatório (tCO2e)4
Reduções das emissões de GEE financiadas na carteira ativa no ano do relatório (tCO2e)5
Reduções das emissões de GEE financiadas em novos projetos fechados no ano do relatório (tCO2e)6
Porcentagem do financiamento climático (%)
Financiamento climático (US$, milhões)
Parâmetros relacionados ao clima
MONTANTE DE FC POR SEGMENTO MONTANTE DE FC POR ADAPTAÇÃO/MITIGAÇÃO/AMBOS
3.1702
3.848.869
1.860.189
364.059,95
43%
$1.151
2019
1.2803
4.155.487
118.000
2.029.322,05
38%
$1.441
2020
•
•
Corresponde ao valor combinado do Escopo 1, Escopo 2 (baseado na localização) e Escopo 3 do Grupo do BID, proporcional aos funcionários que trabalham para o BID Invest (12,8% em 2019, 13,8% em 2020). Mais informações sobre a metodologia, metas de redução e neutralidade de carbono estão disponíveis no Relatório de Sustentabilidade do BID e no anexo da Iniciativa de Relatório Global.Escopo 1: 146 tCO2e; Escopo 2 (baseado na localização): 1.233 tCO2e; Escopo 2 (baseado no mercado): 236 tCO2e; Escopo 3: 1791 tCO2e.Dados provisórios. Os dados finais estarão disponíveis no Relatório de Sustentabilidade 2020 do BID.Este número refere-se à estimativa das emissões brutas combinadas do Escopo 1 e Escopo 2 de GEE dos projetos que emitem mais de 25 mil tCO2e por ano e estavam na carteira ativa do BID Invest no ano do respectivo relatório. Exclui as emissões biogênicas de CO2e de fontes estacionárias.Este número refere-se às emissões brutas estimadas das transações de financiamento de projetos que emitem mais de 25 mil tCO2e por ano e foram fechados no ano do relatório, calculadas como as emissões anuais previstas a serem produzidas durante um ano representativo. Exclui as emissões biogênicas de CO2e de fontes estacionárias.Este número refere-se à estimativa das emissões de CO2 reduzidas por ano pelos novos projetos fechados no ano de referência. As reduções de investimentos em instituições financeiras não estão incluídas.
[1]
[2]
[3][4]
[5]
[6]
O BID Invest também exige que um mínimo de 40% das transações tenham um componente de financiamento climático, dos quais 10% devem apoiar a agricultura, a silvicultura, o uso da terra e a gestão da zona costeira como parte do Quadro de Resultados Institucionais.
O BID Invest está empenhado em financiar uma economia resiliente e de baixo carbono.
162

APÊNDICE 3: IMPLEMENTAÇÃO DA POLÍTICA DE ACESSOÀ INFORMAÇÃO
163

98
BID INVEST
Em janeiro de 2020, a Administração adotou as Diretrizes para Implementação da Política de Acesso à Informação, a fim de definir os principais processos e tornar a aplicação mais previsível.
Após um processo de concorrência, o BID Invest nomeou três especialistas independentes para o Painel Externo sobre a Política de Acesso à Informação.
Regulação e governança
Divulgação proativa
Hub de Transparência
Tecnologia e capacitação
A.
B.
C.
D. O BID Invest vem adaptando seus sistemas tecnológicos para facilitar o processamento de pedidos de informação e está capacitando seus funcionários.
O BID Invest identificou as informações detalhadas necessárias para a divulgação proativa nos termos da política. Essa divulgação é feita no site www.idbinvest.org.
O BID Invest criou o Hub de Transparência para receber, processar e responder às solicitações de acesso à informação.
Em 2020, foram recebidas 363 solicitações de informação externas, das quais 109 exigiram ações internas de busca, divulgação ou indeferimento. Foram emitidos 22 indeferimentos e foi solicitada uma revisão em primeira instância pelo Comitê Administrativo.
O prazo médio para a resposta aos pedidos de informação foi de 12 dias. O tema mais solicitado foi informações sobre projetos (74,1%), seguido por informações institucionais (11,57%) e investigação e dados (6,61%). A maioria das solicitações veio do setor privado (47,9%), meio acadêmico (19,8%) e pessoas físicas (12,4%). O maior número de solicitações veio do México (14,4%), da Colômbia (11,7%), do Equador (8,5%) e do Peru (8,3%).
164

165