Retail Guiden Sweden 2019_2020 - Malmö.pdf - Invest in Skåne
Upload
khangminh22Category
view
2download
0
JUNE 2013 INVEST IN RUSSIASPECIAL ISSUE
Russia offers high investment opportunities, thanks to its good internal market, which will ensure higher demands for any kind of projects
High return investments


EX
PE
RT
.
SP
EC
IAL
IS
SU
E
VECTOR — 70 BILLION IN FOREIGN INVESTMENTS 4This year, Russia hopes to attract foreign invest-ments amounting to 55 billion dollars. In the near future, the Russian government plans to raise the annual volume of attracted foreign capital to 70 billion dollars or more. Sergei Belyakov, Deputy Minister of Economic Development of the Russian Federation talks about this in an interview with the magazine Invest in Russia
STANDARDIZING OUR COUNTRY 8The Investment Standard will be introduced in all the regions of Russia as of this year. It is aimed at significantly improving the business environment in our country and bringing the positions of authori-ties and entrepreneurs closer on a large number of issues related to the development of regional economies
A BIG COUNTRY FOR PROFITABLE INVESTMENTS 12Against the background of ongoing difficulties in the global economy and an investor confidence crisis, Russia, with its growing economy, is looking more and more attractive, a fact that is reflected in the steadily increasing volume of foreign investments
IMPROVING WHAT’S GOOD 16In the past few years, the Khanty-Mansiysk Autono-mous District — Ugra has been actively improving its investment climate. Today, the modernization of investment conditions is required in order to imple-ment new socio-economic goals, outlined in Ugra’s Development Strategy up to 2030
USING YOUR HEAD TO BREAK THROUGH THE WALL! 20Against the background of a stagnating Europe, the growing Russian market and unsatisfied demands for housing are increasingly attracting foreign players despite the complexity of agreements and corrup-tion in this sector
A REGION WORTH 500 BILLION ROUBLES! 24This is the amount of investments that the Kam-chatka Territory aims to attract in the coming years in order to implement projects that should create a new economy in the region
INTERNET FOR ACCELERATED DEVELOPMENT 26Eastern Siberia and the Far East will be one of the most powerful drivers of economic development in
Russia. Reliable communication channels, which are currently being developed in the region, constitute the most important element of success in the state programme for the economic recovery of the east-ern regions of our country
FINDING THE MISSING PIECE 30Our agency announced that 59 private investment projects amounting to $15.6 billion were launched in Russia from August to October, 2012. It seems that this rapid growth in investments has very much to do with the end of a turbulent election period. Foreign capital investments intensified significantly, which seems that, in the long run, it will form the basis for medium-sized industrial business companies
NEW INDUSTRIAL PARKS 36Today, industrial parks in Russia are developing thanks to local initiatives. Private business compa-nies have realized that parks can offer a large scope for investments, whereas regional authorities see them as a means to attract foreign investments
OUR SOURCE OF PRIDE:A NEW ECONOMY 44More than USD 2.5 trillion has been invested in the Russian economy during the post-Soviet pe-riod. One can dispute the efficiency ratio of these investments, but it is definitely not equal to zero. Without getting into discussions about moderniza-tion, several sectors have already been updated and new sectors have been formed.
WHAT WE ARE PROUD OF:OUR LEADERS 50
WHAT WE WILL BE PROUD OF: BREAKTHROUGH AREAS 51Growth potential has been built up in several sec-tors. However, the most serious challenges, prima-rily domestic ones, have yet to be met in order to achieve these targets
STRATEGIES OF STATE-OWNED COMPANIES:NO PARTICULAR AMBITIONS 56The planning horizon at large state-owned com-panies has been extended to 10-20 years. No particular achievements have been planned over this period
IMPORTANT BUSINESS TRENDS: CUSTOMER AND INVESTOR UNIONS 57A new wave of consumer demands and active mod-ernization of fixed assets propelled the manufac-
turing industry to the top of the leadership list in developing dynamics
RATING OF RUSSIA’S LARGEST COMPANIES IN TERMS OF VOLUME OF PRODUCT SALES 62
THE APPROACHING THIRD WAVE 78Attention to the social sphere and fiscal discipline, as well as good communication with federal bod-ies — that is the recipe for minimizing investment risks in the post-crisis period. The new wave of investment attractiveness growth will be gener-ated by former peripheral regions with moderate levels of wages
Content

EX
PE
RT
.
SP
EC
IAL
IS
SU
EGeneral Director: Alexandr PrivalovFinance Director: Andrei BoldinInvestment Director: Viktor SuvorovCommercial Director: Tatiana KopitsaDeputy General Director for Sales and Distribution: Yuri MukhtarovSubscription Director: Olga KuleshovaDirector of Retail Distribution: Alexandr TsyganovRegional Development Director: Pavel MarkarianProduction Director: Boris KaganIT Director: Evgeniy Maltsev
Commercial Department:Director for Customer Relations: Irina VaravinaDirector for Advertising Agencies: Tatiana DunyushkinaConsolidated Sales Service:Tel.: (495) 510 56 45, [email protected]: Evgenia Chernysheva, Elena Samokhina,Alexandra Voloshina, Violetta Kreshchuk, Anna Astafurova, Oksana Khromova,Victoria Panik, Olga Kiseleva, Anna Timoshenkova, Irina Sapozhnikova, AnnaRyzhovaHead of Creative Department: Oleg GolovnevHead of Design Team: Elena Drugush
Coordinator of Regional Advertising Group: Anastasia Kosareva
Regional and International Applications:Chief Editor: Alexandr Sychev
Regional, Industrial, and International Project Group:Tel.: (495) 637 94 72, [email protected]: Sergei MaslovSenior Manager: Antonina KorushenkovaSenior Manager: Yulia GnezdilovaManager: Marina Kiryukha
Chief Editor: Valery Fadeev
First Deputy Editor: Tatiana Gurova
Deputy Editors: Pavel Bykov, Alexandr Ivanter, Dan Medovnikov
Scientific Editors: Dmitry Grishankov, Alexandr Privalov
Copy Editor: Helena Saet
Art Director: Sergey Zheglo
Executive Secretary: Asya Arakelian
Creative Director: Kirill Rubtsov /
Designer: Alexandr Kozlov / Infographics:
Liudmila Kadilova /
Artists: Konstantin Batynkov, Sergei Kalinin / Photo Department Director:
Alexandr Sidorov /
Photo Editor: Nika Ziangirova / Photoreporter: Oleg Serdechnikov /
Production and Publishing Department: Vladimir Kotov (Head), Andrei Korobko;
Larisa Son, Mikhail Streltsov /
Scanning: Sergei Biryukov, Konstantin Kudryavtsev /
Layout: Natalia Starodubova, Piotr Kuzmin (designer) /
Literary Editing: Inna Sretenskaya, Anna Shafran /
Proofreading: Olga Ventskovskaya, Miroslava Kurenkova, Liubov Fedetskaya /
Assistant Executive Secretary: Elena Platonova /
Material from following agencies was used to publish blocks of news: AK&M, Interfax, MFD-InfoCenter, Prime-TASS, RosBusinessConsulting, Finmarket, Associated Press. Circulation certified by the
National Circulation Service /
Telephone of Advertising Department of Expert Journal: (495) 510 5645 / Advertising in regional editions of Expert: (495) 789 4465 / Advertising on website: (495) 755 8396 / Group for Work with
Industrial Companies: (495) 637 9472, Fax: (495) 637 9473 / Editorial address: 24 Pravdy St., 6th floor (NGK), 125866, Moscow / Mailing address: POB 33, 127137 Moscow. E-mail: ask@expert.
ru / Website: www.expert.ru / Editorial Board Secretariat – (495) 789 4465, Fax (495) 228 0078; Editor-in-chief, General Manager, Art Director, Deputy Editors, Scientific Editor.
Editorial Departments: Economics, Politics, International, Companies and Management,
Economic Activities, Innovation, Culture and Society, Information Service, Industry, Editorial Office of Regional Operations, Layout, Rewriting, Typing Pool, Photo Archives, Artists, Printing – (495) 789
4465. Administrative Departments: Marketing, Human Resources, Legal – (495) 789 4465. Information Technology – (495) 228 0080, Accounting - (495) 609 6625 / Subscriptions – 8800200 80 10
(toll free for residents of the Russian Federation) or (495) 789 4465, ext. 1393. E-mail: [email protected]; Please call toll-free number at 8800200 8010 in case your subscription is not accepted,
Expert Journal is not available for sales, terms of delivery are not respected, and any other shortcomings in our work.
We take no responsibility for the accuracy of the information published in advertisements and news reports from information agencies. The Editorial Office does not provide reference information. Reprints
from the Expert Journal are allowed only upon agreement with the publisher. Subscription index in the catalogue of the Rospechat Agency 72550. Founder – MediaHolding Expert CJSC. Registered by
Federal Service for Supervision in the Sphere of Telecom, Information Technologies and Mass Communications (ROSKOMNADZOR) under PI No. ФС77-53054 from March 4, 2013.
Published by Expert Group CJSC. ISSN: 1812-1896.
Printed by OJSC «Pushkinskaya ploshchad» (Pushkin Square) Publishing House, 4D Shosseynaya Str., 105948, Moscow. Circulation: 3 000 copies.
Open price. © Expert Group CJSC, 2013.

V IEWPOINT4E
XP
ER
T.
S
PE
CIA
L
ISS
UE
ergei Yurevich, what is your overall assessment of the Russian economy? Which economic indicators are important for foreign investors?
— The Russian economy is developing rapidly. In general, we can make a positive evaluation for GDP growth, the unemployment rate, the government debt
level, and the amount of gold reserves. Let me remind you that our economy grew by 3.4% in 2012. This is lower than in 2011, when growth stood at 4.3%, but higher than the growth rate of world economy, which, I remind you, increased by 2.5%. We can say that unemployment is at the lowest and quite favourable level — 5.5%. Inflation has dropped by almost half since 2008 — from 13% to 6.6%. It was 6.1% in 2011 — a record low. As of January 1, 2013, the volume of gold reserves amounted to over 530 billion dollars. This is 77% more than in 2007. I can say with certainty that all these posi-tive indicators are the result of the government’s economic policy. Even though, in many ways, the Russian economy isn’t growing as fast as we would like.
— Let’s talk about foreign investments: What factors consti-tute the appeal and, inversely, risks of the Russian economy for foreign capital?
— It’s common knowledge that investments in Russia mean a high rate of return. High investment opportunities in Russia are dependent on a good domestic market, which is capable of provid-ing demands for any kind of project. Our domestic market has a population of 140 million, and if you include the Customs Union with Kazakhstan and Belarus, that makes 169 million people. In such a case, the purchasing power of people in Russia is growing, and that’s very important because household incomes haven’t de-clined as in some countries, but on the contrary, average incomes have increased. Don’t forget about the geopolitical position of Rus-sia, which is located at the junction of Europe and Asia, and our country’s highly educated population. On the other hand, these attractive points can be equated with risks that are traditionally associated with Russia.
— What are these risks?— The main risks are connected to our economy’s dependence
on the price of traditional Russian exports — oil and gas. Another risk, which is very real, is corruption. Unfortunately, there is a dis-crepancy between the law on paper and how it is applied in practice. However, it should be noted that this negative image, which doesn’t always correspond to reality, doesn’t play in favour Russia. We can’t say that everything’s rosy in the garden. But, our image is worse than what is really true. And, do you know who’s saying that? The companies that already have experience implementing projects in Russia. If you look at foreign companies that already have projects in Russia, more than 70% say that they’re satisfied with their decision to invest, and believe that their investments are successful. Well, those companies that don’t have experience working in Russia focus on external sources, which often distort reality. We’re not trying to make it look better than it really is, but we want the information about our country to be objective. We understand that it’s necessary to fill that information gap, which leads to distorted information. So, we’re now actively working in this direction.
— What should the state do in order to improve the investment climate in our country?
— The government has focused on eliminating obstacles, which foreign companies in Russia are talking about. By the way, these are very specific targets. They include procedures that an investor must go through before launching his business in Russia, and especially the time and costs involved. In addition to putting a company into operation, we’re talking about the cost of doing business and the degree of state control. The experience of different regions suggests that under current federal legislation and with no drastic changes, it’s quite possible to create favourable conditions for investors. The main lesson that we’ve learnt is that what matters is the motivation of regional and local authorities. If they want to attract investments, and this, by the way, refers not only to foreign investments, if they want to develop the business industry, then all the tools they need are already there… they just have to want to use them.
— In your opinion, what areas of investment into the Russian economy are particularly attractive to foreign companies?
— I think that we can’t single out any particular areas. It’s where the investor sees himself, where he wants to go, and that’s where we can help. I happened to mention the word “help”. As long as institutions supporting investments haven’t been formed, such manual support is sometimes essential. Especially in cases when the investor, before launching his project, is informed about spe-cific conditions, then it turns out that this information doesn’t correspond to reality. In such cases, “manual” support is actually required. Therefore, all investments are important to us, but of course, “long-term” projects are more appreciated. We’re ready to support any kind of production or service that companies may want to locate in Russia. At the same time, if you remember, five so-called presidential priorities were designated in 2008. These were power engineering and energy efficiency, telecommunica-tions and aerospace technology, nuclear technology, medicine and pharmaceuticals, and computer technology and software. Having announcing these priority sectors, we proceeded from where we actually needed new technologies and new competency. Therefore, the development potential of these industries is reasonably high. We have human resources capable of absorbing these investments and implementing projects in these areas.
— What might be some ways to encourage federal and local authorities to attract foreign investment?
— We have to admit that profile ministries sometimes behave irresponsibly towards investors. If you feel that a foreign company is intruding into a territory with too much attention from the gov-ernment, then you should say at once that you don’t welcome that company’s investments. That will be fair, and such an answer is sometimes possible. However, the most irresponsible and harmful policy possible, which we have unfortunately witnessed, is when interest in foreign investments is shown at the very beginning. And then, when company arrives, it runs into various bureaucratic dif-ficulties, when authorities are too embarrassed to say directly that they’re just not interested in these investments, and start setting up the nine circles of hell. That’s totally unacceptable. If the federal and regional ministries think that they’ll always have a long queue
Alexei Grammatchikov
Vector — 70 billion in foreign investmentsThis year, Russia hopes to attract foreign investments amounting to 55 billion dollars. In the near future, the Russian government plans to raise the annual volume of attracted foreign capital to 70 billion dollars or more. Sergei Belyakov, Deputy Minister of Economic Development of the Russian Federation talks about this in an interview with the magazine Invest in Russia
–S

5
of investors at their door, then they’re sadly mistaken. In order to break this cycle, we’ve developed a system of key performance indicators for heads of federal ministries and heads of constituent subjects of the Russia Federation, where the important indicator will be the volume of attracted investments. Because there’s noth-ing that destroys Russia’s image more than examples of unsuc-cessful investments. The worst scenario for investors is when real actions don’t correspond to earlier statements. This undermines their confidence.
— How does the state of the global economy influence the process of attracting investment into Russia?
— Unfortunately, the growth rate of global economy has slowed down. The volume of investment resources that exists in world mar-kets isn’t growing either. According to various estimates, it’s now about one and a half trillion dollars. Private funds and investors are now quite careful in choosing investment options; they prefer to save rather than invest. These conditions impose even greater
V IEWPOINT
EX
PE
RT
.
SP
EC
IAL
IS
SU
E
Sergei Belyakov, Deputy Minister of Economic Development of the Russian Federation
OLE
G S
ERD
ECH
NIK
OV

V IEWPOINTE
XP
ER
T.
S
PE
CIA
L
ISS
UE
6
demands on our country. Creating comfortable conditions for doing business, we must do something to prevent investments from fleeing to other countries, and encourage them to come here. I repeat, we have tremendous opportunities for investments, but we don’t use these opportunities to the full extent.
— Can Russia become a “safe haven” for global investment funds?
— We’re still a very long way from becoming a “safe haven”. Of course, we’d love to be just that, but you need to be very effective in questions related to business reforms. So far, we’ve announced our priority, but when this priority is expressed not only in words but also in daily work operations performed by specific officials, then Russia can, and will, at last, become a “safe haven” for invest-ments. Foreign investors find it impossible to even get through to some of our colleagues. After several months, they can’t even reach and just talk to administration officials of any ministry. Moreover, representatives of some ministries don’t even bother to meet and establish some sort of dialogue.
— What examples of successful foreign investments could you name?
— We have examples in various fields. For example, in the high-tech field, when foreign companies created R & D centres here. We can recall investment projects in the automobile industry, wood processing, pharmaceuticals, and many other areas. Unfortunately, there aren’t as many projects as there could be; once again, this is partly due to the unfavourable environment, in part because of the cautious attitude towards investments prevailing throughout the whole world. Incidentally, even in China, the growth rate of foreign investment has slowed down.
— What are some examples of unsuccessful foreign investments?
— These are infrastructure projects with enormously inflated budgets. Moreover, they concern government, and not foreign investments. And that’s depressing. It means that we could use our investment resources more prudently. As to purely foreign projects, well, there aren’t any clearly unsuccessful examples because for-eign companies take them very seriously at the early decision-making stage. However, as failures, I could mention the projects that could have been initiated, but failed to take off because of red tape and the demotivating behaviour of regional and federal officials; after meeting and talking with these officials, investors decided not to invest. There are examples when it was difficult to defend completed investments, bearing in mind the position of
regional authorities and heads of municipalities. This is typical, for example, in regions such as the Krasnodar Territory, where investors are informed first about some investment conditions, and then there’s a completely different approach in practice. Generally speaking, this generates a strong distrust of the government, and it contributes to the unfavourable image of Russia that we have to fight against. To call a spade a spade — in such cases, officials often act in their own selfish interests. That explains why they lobby in favour of companies connected to themselves in some way or another and allocate contracts with inflated costs. We need to get rid of these practices.
— In your opinion, how will the global economy develop in the near future, and how will that affect investments in Russia?
— I’d really like to be optimistic and say that we’re on the thresh-old of economic growth. Unfortunately, I can’t say this for the time being. The examples of the European Union show us that when economically wealthy countries have to support economically weak countries, they’re forced to spend their own resources on them. On the other hand, we’re also seeing the crisis of the so-called welfare state. When the state, which provides quite a high quality standard of living, has to rethink its policy in this time of economic crisis, that is, how and what to spend its money on. The question arises — is the pace of economic growth compatible to the obligations which the state itself is responsible for? What is the source of these com-mitments? It’s still possible to maintain this balance in Russia.
We can definitely say that Russia isn’t interested in seeing the global economic crisis get worse. Today, the world’s economy has become so globalized that it’s better for Russia if the global economy grows and not drops. But, Russia’s economy has reserves of stability thanks to the fact that today, Russian economy is largely depend-ent on government actions. Although we’re open to the outside world, although we’ve joined the WTO, we’re still more focused on ourselves. 2008 showed us that we can readjust quickly enough. By the way, the actions of the Russian government were greatly appreciated by the international community at that time.
— And how do you feel about the problem related to the out-flow of capital from Russia?
— This is definitely a problem. If we talk about it, we must un-derstand that it’s not all about capital flight. These figures show transactions made by foreign companies abroad and the acquisition of foreign assets. That’s what it really is — normal economic activ-ity, which is linked to moving and shifting capital assets abroad. Of course, we’d rather see investors buying something here, and not abroad. The outflow, which we register, often turns around and comes back as influx through offshore companies. This means that offshore companies are used as a kind of insurance against legislative risks that exist in our country. Nevertheless, this money comes back because investment yield is high in Russia. This year, we’re planning to attract foreign investments amounting to 55 bil-lion dollars. That’s roughly the same as in 2012. In general, we’re seeking to attract 70 billion dollars per year.
— What are the special features of today’s Saint Petersburg Forum?
— This year’s forum is being held under the slogan — “Global Economic Prospects: Time for Decisive Actions”. In the first place, forum participants will be invited to discuss economic and social impacts of the global crisis, the unstable nature of global economic recovery, changes in the balance of powers existent in the world, and new technological opportunities. In addition, this year is the year of bilateral cooperation between Russia and Germany, and Russia and the Netherlands. In this regard, Angela Merkel, Chan-cellor of Germany will attend the Forum, and the visit of the prime minister of the Netherlands has also been planned. We hope that many interesting discussions will be held and solutions to today’s complex economic problems will be found at the Saint Petersburg Forum. ■
High investment opportu-n i t i es i n Russ i a a re dependent on a good domestic market, which is capable of providing demands for any kind of project


he Agency for Strategic Initiatives (ASI), created on the initiative of Vladimir Putin, President of Russia, in the spring of 2011, has now become an important institution to accelerate social and economic devel-opment in the country. The Agency facilitates the implementation of the most promising projects in
different social and economic sectors. In addition, it formulates strategic goals in order to improve the investment climate in our country, simplify administrative procedures, eliminate bureaucratic barriers for business and promote appropriate programmes worked out with its participation. Andrei Nikitin, the General Director of the Agency talked about its work and operations.
— Last May, in fact, your agency celebrated its second birth-
day. What have you managed to achieve in this period of time?— The Agency was created to promote the most promising
projects initiated by private business. We should select promising proposals, promote them, and help them obtain financing and overcome administrative barriers. These projects must be socially relevant, innovative, supply imported products to our country, or be competitive in foreign markets. To date, entrepreneurs have submitted nearly 4,000 projects to the Agency — 205 are being as-sessed and 59 have been approved by the Supervisory Board, which is headed by Vladimir Putin, the President of Russia.
But, our tasks are not limited to this work. We must work towards radically improving our country’s investment climate. After all, the motive to establish ASI stemmed from unsatisfactory evalua-tions related to investments and doing business in Russia, which were outlined by the business community. At the time the Agency was launched, Russia was at the bottom of almost all the rating scales, which are regularly compiled by international research organizations.
— These rating scales are often very biased…— That’s right. Moreover, some are even very biased, and it’s
certain that all of them get something wrong. Even the World Bank’s rating scale — Doing Business — in which Russia took 124th place at the time that ASI was launched and which we’ve decided to focus on in order to understand in which direction the country is developing, isn’t quite accurate, although this organization’s assessment method is the most transparent and clear. In particular, the World Bank bases its rankings on surveys of business companies. Business owners fill out questionnaires based on some of their own ideas about what it once was like, and their poor awareness of the current situation. Our entrepreneurs are often not very well informed about the positive activities of our government in one direction or another, and so, they unwittingly tend to distort the observations made by the World Bank.
However, it’s not the fault of business, but rather a mistake made by the authorities themselves, which aren’t active enough in communicating the essence of their actions to the general public. In general, information awareness in all segments of society and coordination among different government agencies have become extremely acute problems in Russia. We don’t know how to communicate our achievements to a broad audience; we don’t know
how to conduct a dialogue with the business sector; we aren’t able to show what’s being done and what’s being planned. Among other things, all this generates just another confidence issue.
— Does the Agency help to solve this problem? Is it an active member of this much talked-about dialogue between business and the government or is it just a formal observer?
— It’s important to get live feedback from the business community in order to efficiently and objectively assess the efforts of the authorities to engage business companies in the management process for improving the business climate. A positive experience of dialogue between business and government can be seen in the project — The National Business Initiative to improve the investment climate in the Russian Federation (NBI). The project includes action plans proposed by entrepreneurs to simplify, accelerate and reduce the cost of procedures associated with running a business, and currently functioning in territories of the Russian Federation. This initiative is being implemented by the Agency pursuant to instructions issued by V.V. Putin, President of the Government of the Russian Federation on December 21, 2011.
V IEWPOINT8E
XP
ER
T.
S
PE
CIA
L
ISS
UE
Alexander Sychev
Standardizing our countryThe Investment Standard will be introduced in all the regions of Russia as of this year. It is aimed at significantly improving the business environment in our country and bringing the positions of authorities and entrepreneurs closer on a large number of issues related to the development of regional economies
T
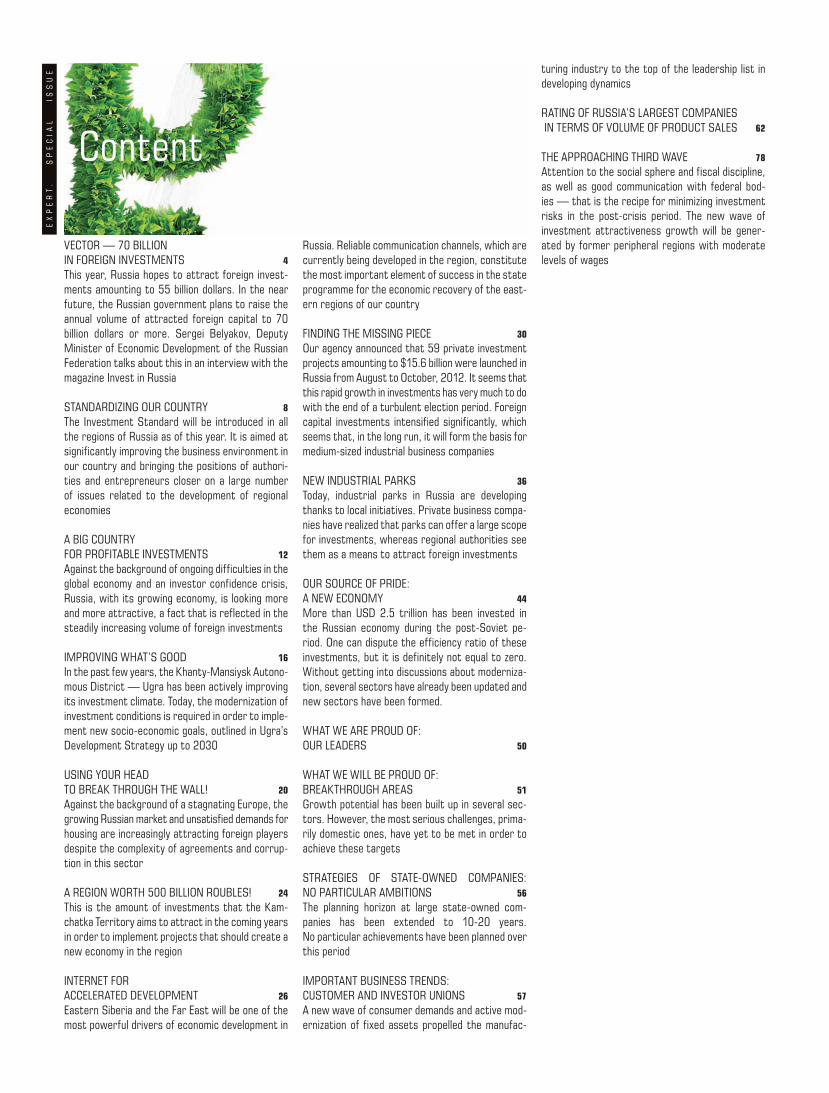
The work format is very important. Work areas were proposed by the business community itself. We’ve established cooperation with professional and entrepreneurial business associations. First of all, these include associations such as Klub Liderov (Leaders Club), the CCI, Opora Rossiyi (Support of Russia), Delovaya Rossiya (Russian Business), and the RUIE. Together with other business organizations specializing in different fields, the Agency forms working groups that include entrepreneurs, experts and officials. Together, they develop a “roadmap” that includes specific actions, timeframes for their realization, and agencies responsible for implementing them. In fact, these maps are a compromise between the entrepreneur and authorities.
After the “roadmaps” of the NBI have been worked out and approved (first, by the Supervisory Board of the ASI, then by a Government order), the Agency monitors their implementation. An important feature of monitoring the implementation of these “roadmaps”, which is conducted by the ASI, is that it’s carried out by the entrepreneurs themselves.
Eight “roadmaps” have already been approved and implemented; they deal with problems related to exports, obtaining building
permits, power supply connections, customs clearance, registration of property and companies, promoting competition and improving antimonopoly legislation, and procurement of state monopolies.
Work on a number of maps, in particular, the simplification of tax administration and appraisal activities, has almost been completed. These documents may be submitted at the next meeting of the Supervisory Board of the ASI.
— Are you certain that these roadmaps will be implemented in practice?
— We believe that publicity, both during the development of roadmaps and the monitoring phase, will be the most important guarantee of quality implementation in practice.
This is why in May we launched a public discussion portal — “Investment Climate RF” — concerning the implementation of roadmaps. This portal will allow entrepreneurs from any region of the Russian Federation to take part in projects to improve the investment climate, and assess changes in the country. It’s important to get feedback from entrepreneurs in order to understand how the implementation of certain points can simplify, accelerate and reduce
9V IEWPOINT
EX
PE
RT
.
SP
EC
IAL
IS
SU
E
Andrei Nikitin, the General Director of the Agency for Strategic Initiatives

10
costs of procedures for doing business in the country, which is very important for further decisions.
— Attracting investments isn’t just a question of activities provided by experts and business, but also a question of effective information. According to Ernst & Young, 85% of foreign entrepreneurs have a very distorted view of Russia; some of them go so far as to believe that bears can be seen wandering around the Red Square; some are afraid of the incredible crime rate, others believe that we have a terrible investment climate and therefore don’t plan to do business in Russia...
— ...At the same time, 64% of foreign companies, already operating in Russia, plan to expand their work operations in our
country! They believe that we do have some problems, but they aren’t catastrophic, that it’s quite possible to work here and make a very decent profit.
Where do such split opinions come from? The problem is in the correct positioning of our country’s investment potential in global markets. The fact that we haven’t created an information space that would allow foreign investors to obtain comprehensive information about our country, regions, projects and opportunities so that they may compare and immediately see and assess possible risks. In general, the availability of advanced information space isn’t so important to investors who are interested in our large consumer market. They’ll come here in any case, if only there is a financially sound demand. However, for investors bringing in new technologies, it’s extremely important to see the complete picture.
Even we, at the Agency, didn’t have the complete picture when we started working. It was obvious that some regions were more successful than others, but it wasn’t clear what they had done in order to become successful. So, we tried to collect data and analyze the reasons for the achievements of the regions, whose economic growth rate was higher than the national average. However, these regions are very different from each other with regard to resources, geographical location, and workforce potential.
It turned out that rapidly growing regions had a well-established system for attracting investments and working with the business community. For example, last year, direct foreign investments in Tatarstan increased six-fold — from 99 million dollars to 577 million dollars. Thanks to what? The Republic founded its own agency to attract foreign investments, improved its legal frame-
work, developed a system for benefits and preferences, and is trying to establish a dialogue between business and the authorities. The same scenario can be observed in the Kaluga, Ulyanovsk, Sverdlovsk and Lipetsk Regions.
At the same time, we saw that some regions are, at times, actu-ally trying to reinvent the wheel or striving to copy someone else’s experience, although not always so skillfully. So, a strategic objec-tive arose — to instill a common denominator in existent regional management practices.
— Do you mean the Standard for executive authorities, which was introduced in our country last year?
— Last year, it was introduced in eleven pilot regions; two more
regions began to carry out the project independently. At the end of last year, at a meeting of the State Council, the implementation of this Standard was considered successful; it was decided to extend it to all the regions.
So, we tried to identify the best practices and formulate a certain standard that would be available to everyone. However, I want to emphasize that the 15 points laid out in the Standard do not at all impose limits on other possibilities or wishes. This is only a man-datory minimum, creating a single temporary base; the regions should be guided by it, but they should continue moving forwards. It’s like the services of a large bank or, for example, the Russian Post — they can be used anywhere, they have specific standard everywhere. Investors should receive a simple set of services, which are laid out in the Standard, in all the regions. Each region should provide a clearly defined and accessible investment strategy, a plan for infrastructure construction, the Investor Protection Act, the Council for improving investment climate, a specialized organiza-tion to attract investments, and a unified regulation for investment support according to the “single window” principle. I think that it’s not necessary to enumerate all the points. They’re just as specific as those that I’ve mentioned. Beyond that, each region should set its priorities and start working as hard as possible on their own competitive advantages.
— You once said that the secret to the success of leading regions fundamentally lies in three factors that differentiate them from all the other constituent subjects of the Federation — the determination and will of regional heads, an effective and coordinated management team, and a truly equal dialogue with the business community…
V IEWPOINTE
XP
ER
T.
S
PE
CIA
L
ISS
UE
Rapidly growing regions had a well-
established system for attracting
investments and working with the business
community
11
— These are extremely important components for success, but, of course, the list is far from exhaustive. Determination alone isn’t enough. For example, in business, executives are retrained at least every two years. Representatives from the authorities should also be retrained. They should have the opportunity to learn about best practices completely and methodically, and not accidentally stumble upon them in the course of their work. Let me give you an example. Maintaining and developing a complex diversified economy requires coordinating strategies to attract investments with strategies for developing higher and secondary vocational education. Such coordination has been established in Tatarstan. There, university and college administrations know where their graduates will go, and what competence they will need. Investors have remarked this factor as one of the major advantages of the republic. I think it should be so in every region if it doesn’t want to be the private domain of a single plant or a single industry.
— Is it possible to involve entrepreneurs in creating a more favourable investment climate and a general business environment in the regions? As far as can be judged, business distrust of official authorities is strong, and moreover, so is the reluctance of authorities to burden themselves with the different views of entrepreneurs.
— That’s why the mechanism for implementing the Standard, developed by the Agency, is based on enforcing dialogue. Distrust can be overcome only through communication and collaboration. Moreover, the results of implementing the Standard in administrative work practice are submitted to entrepreneurs selected in the expert group by the Agency. It’s a pool of experts, which, in addition to regional entrepreneurs, also includes professional consultants, representatives of the academic community, and federal business communities.
The control system is very effective. There was one case that involved one of the requirements of the Standard, namely, that a plan for developing infrastructure sites in the region should be worked out for investors. In addition to such a plan being available, it should also be comprehensible. Anyway, in Kaluga, employees of the Ministry of Economy submitted for approval a business plan for infrastructure development to the expert group, but the members of the group refused to approve it; the proposed plan was very difficult to put into operation. The office had to do some more work on it, and three months later, they introduced an interactive map, whereby any untrained person could choose the type of infrastructure and see when and where these sites of interest would be built. This means that any investor can now quickly and easily identify possible sites for locating his business.
Such a control system isn’t limited to the implementation process. Even now, expert groups in pilot regions, where the Standard was introduced in 2012, have started the monitoring process. The institutions that were created or reformed within the framework of the Standard should act, and not just exist. Their functionality will also be evaluated by the business community in the future.
Once again, dialogue between the parties is crucial. It was during the discussion on “roadmaps” according to the National System of competences and qualifications that I was able to overcome my own doubts about the need to improve the investment climate in our country. It turned out to be extremely interesting for business. The plan should create conditions for re-training specialists and supplying the economy with highly qualified personnel.
At the May conference — “National system of competence and qualifications: from personnel disasters to a long-term policy” — Andrei Belousov, the Minister of Economic Development cited the following data — in real economy, Russia employs 67 million people, of whom 31 million work in large and medium-sized businesses, 15 million are employed in small business companies and individual enterprises, and 4 million are temporarily unemployed. What do
the other 17 million Russians do, and what qualifications do they have? The new ASI programme should create a national system for competence and qualifications. Currently, the share of highly skilled workers employed in the economic field reaches 16%. It should be at least 33% by 2020.
Now, we should clearly indicate questions related to motivating people to improve their skills, better assess necessary investments in vocational education, and carefully think out a system for validating qualifications. This “roadmap” was prepared by academic scholars, experts, and business representatives — a total of 3,200 people from more than 100 organizations. As a result of this programme, the economic sector should welcome 4.5 million graduates from a modern system of vocational education, whose knowledge level will almost equate a bachelor’s degree, and about 20 million people will be retrained.
— The experience in implementing the Standard for executive authorities in pilot regions was considered successful. In your opinion, when can statistically set changes be expected?
— The first results will hopefully be marked in statistics by the end of 2013. The implementation of the Standard is already noticeable; the situation has changed in pilot regions; systemic shifts in the relationship between business and government have become apparent. The Standard can make a serious contribution to the rising popularity of Russia and its regions as an investment platform. Moreover, constituent subjects of the Russian Federation will cease to be “blank spots” on the world map for foreign investors. Having seen that the basic rules of the game are the same everywhere, even regional entrepreneurs, who are used to operating within their own administrations, will become bolder and enter the federal level or move towards neighbouring regions.
We hope that statistical data will confirm our speculations and allow us to evaluate business efficiency, understand how clear rules for attracting investments affect GDP growth rate, and improve the economic structure of the regions and the country as a whole. On this basis, it’ll be possible to determine the next steps in the formation of a coherent system for attracting investments into our economy.
By the way, last year, Russia rose to the 112th place in the Doing Business rating scale. Of course, this isn’t because of the Standard, but the result of steps taken at the federal level within the framework of implementing “roadmaps” of the National Business Initiative. However, I’m sure that standardized regional efforts to attract investments and create a favourable business climate will firmly propel Russia closer to global leaders.
For reference:The first roadmaps, approved by the Supervisory Board of the Agency: “Supporting access to foreign markets and export promotion”, “Improving Customs administration”, “Improving access to energy infrastructure”, and “Improving the business climate in the construction sector” were ratified by the Government of the Russian Federation on June 29, 2012, June 30, 2012, and August 16, 2012.
In addition, in December 2012, the following roadmaps were approved: “Improving the quality of public services in cadastral registration of immovable property and state registration of rights to and transactions in immovable property”, and “Developing com-petition and improving antimonopoly policies” under orders of the Government of the Russian Federation dated December 1, 2012 and December 28, 2012.
Under the order of the Government of the Russian Federation dated March 7, 2013, the roadmap — “Optimizing procedures for the registration of legal entities and individual entrepreneurs” was approved in March, 2013.
The deadline for implementing 126 points as part of seven road-maps was set for the period from July 2012 to April 2013. ■
V IEWPOINT
EX
PE
RT
.
SP
EC
IAL
IS
SU
E
V IEWPOINT12E
XP
ER
T.
S
PE
CIA
L
ISS
UE
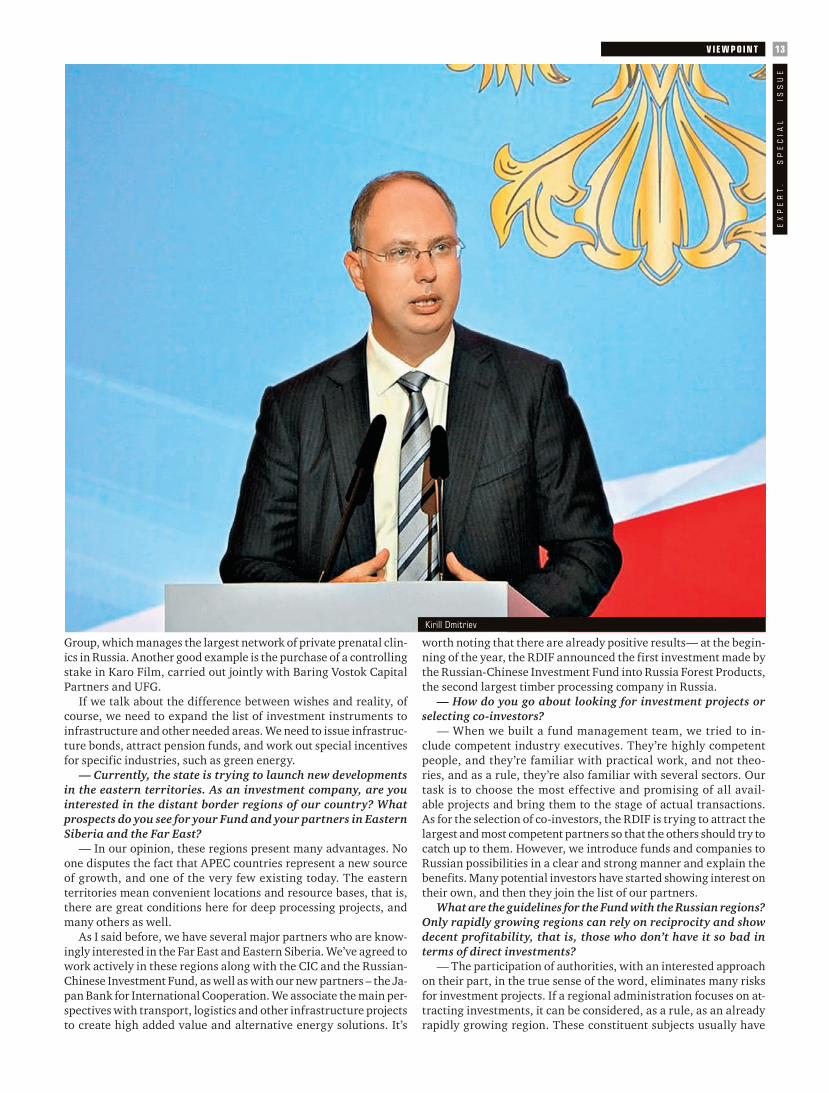
he Russian Direct Investment Fund, the capitalization of which is estimated at $10 billion US, was created for investments in the most promising and rapidly growing sectors of the economy. Kirill Dmitriev, Gen-eral Director, talked about the fund’s activities and operations.
— This year, the Russian Direct Investment Fund (RDIF) will be two years old. What has it achieved? How many projects have been implemented with the participation of the RDIF, and in which sectors?
— We’re already seeing good payoffs – both for specific projects and for general trends. During the first year of the fund’s existence, the number of long-term investors, who are will-ing to step up their investments in Russia, has doubled— from 25% to 48%. This isn’t just an inner feeling, but objective data.In the first quarter of 2013, Russia received $60.4 billion US in foreign investments. This is 65.4% more than in the first three months of 2012. Direct foreign investments in the Russian economy amounted to $6.3 billion US in January— March, 63.2% more than in the same period last year.
Our fund has attracted dozens of major partners over two years. I’m talking about leading companies. Their investments into our country were a signal for other investors to start working with Russia. Since it was launched, the RDIF has attracted a total of $2.3 billion US, $500 million US of which are the fund’s own assets. The RDIF has also attracted $3.2 billion US of foreign capital into the Russian economy, building a number of long-term strategic partner-ships. We continue to work actively with strategic investors, the re-sults of which will be announced at the Saint Petersburg Forum.
In the very near future, we’ll also tell you about new investments in such sectors as IT, agricultural equipment, manufacturing, and oth-ers. We try to cover the most popular and most promising industries.An example of such significant transactions would be investments in the Moscow Stock Exchange, and then, our programme to support pre-IPO. We have attracted an entire consortium with the partici-pation of the BlackRock and Templeton Funds, and, according to co-investment procedures, we also support Russian companies that are prepared to invest on the Moscow Stock Exchange.
We’d like to draw your attention to the geography of our partners. In a literal sense, they are all major regions, from where we might expect major investments. We launched an automatic co-investment mechanism with the Kuwait Investment Fund. Along with AGC Equity Partners, we attracted the largest investment in history from the Middle East into OJSC Enel OGK-5— $175 million US for a total of $600 million US in transactions. In Europe, we’re working closely with the Caisse des Dépôts and the Eastern Committee of German Economy. By the way, today Germany is one of the largest and most successful investors in the Russian economy.
Another priority region— APEC countries. An investment con-sortium was created together with the State Bank of India— up to a billion dollars in bilateral projects. The Russian-Chinese Invest-ment Fund was founded on an equal footing with the CIC – we’re planning to invest up to two billion dollars in projects, and attract
the same amount from outside sources. Our countries have com-mon needs and rapidly growing markets. So, we’re talking about both good investment revenues and the development of our mutual economies. A similar scheme was launched in Japan: within the framework of the Investment Platform, we plan to invest in priority regions, above all in the Far East.
— The fund was established as a classic capitalist enterprise; its main purpose is to make a profit. However, when the fund was established, the initiators still referred to the “five indus-tries for modernization and five sectors for innovation”, that is, they were worried about priority areas in our country. Was this all just wishful thinking or have you taken them into account somehow? What are the Fund’s investment priorities? How are work operations in these areas coming along?
— I’ll remind you that the capital of the fund is very substantial— up to $10 billion US, while, in fact, we’re not limited to making a special selection of industries. But, our priorities remain the same as at the beginning: these are areas that should make our economy more efficient and more competitive. On the one hand, the state is interested in their development; on the other hand, they are in great demand, they are needed by both the population and the business community. By selecting these projects, we’re giving investors an opportunity to make large profits, especially by today’s standards, and modernizing the economy at the same time.
Take transportation and logistics – these are basic sectors for mod-ernization among other priorities of the RDIF. Shortcomings in infra-structure and technology are very significant in these fields. If enough tools are provided, investments in these areas will be very extensive and profitable. Vnesheconombank has considerable experience in in-frastructure projects, and we’re actively working with the Chairman of Vnesheconombank, Vladimir Dmitriev, on different joint projects.We’re talking about long-term investments, that is, a market where funds and companies tend to act quite carefully. I’m sure that as soon as global investors see a payoff, we can attract them into more complex industries. For example, into the aerospace industry, which, again, is listed as a priority.
— How far do investment realities differ from the original wishes of the initiators of the Fund?
— Most of the industries designated when the fund was launched proved to be truly interesting for investors. In fact, we even had to think more broadly. During the selection process, we saw that many other spheres corresponded to our interests, had a high profitability rate and promoted modernization. So, we invested in a network of high-tech medical centres in the Russian regions, and we attracted the world’s largest investment fund – BlackRock – as a partner.
Investors have great expectations with regard to the consumer sector and infrastructure. We have repeatedly pointed out that the Russian middle class has grown three times over the past five years, and this is a guarantee for product and service demands, which can be provided by respective companies. Therefore, the fund has focused on healthcare, an efficient urban environment and other consumer segments.
During the IPO, the RDIF, together with BlackRock, Russia Part-ners and other qualified investors bought shares in the MD Medical
Alexander Sychev
A big country for profitable investmentsAgainst the background of ongoing difficulties in the global economy and an investor confidence crisis, Russia, with its growing economy, is looking more and more attractive, a fact that is reflected in the steadily increasing volume of foreign investments
T
13
Group, which manages the largest network of private prenatal clin-ics in Russia. Another good example is the purchase of a controlling stake in Karo Film, carried out jointly with Baring Vostok Capital Partners and UFG.
If we talk about the difference between wishes and reality, of course, we need to expand the list of investment instruments to infrastructure and other needed areas. We need to issue infrastruc-ture bonds, attract pension funds, and work out special incentives for specific industries, such as green energy.
— Currently, the state is trying to launch new developments in the eastern territories. As an investment company, are you interested in the distant border regions of our country? What prospects do you see for your Fund and your partners in Eastern Siberia and the Far East?
— In our opinion, these regions present many advantages. No one disputes the fact that APEC countries represent a new source of growth, and one of the very few existing today. The eastern territories mean convenient locations and resource bases, that is, there are great conditions here for deep processing projects, and many others as well.
As I said before, we have several major partners who are know-ingly interested in the Far East and Eastern Siberia. We’ve agreed to work actively in these regions along with the CIC and the Russian-Chinese Investment Fund, as well as with our new partners – the Ja-pan Bank for International Cooperation. We associate the main per-spectives with transport, logistics and other infrastructure projects to create high added value and alternative energy solutions. It’s
worth noting that there are already positive results— at the begin-ning of the year, the RDIF announced the first investment made by the Russian-Chinese Investment Fund into Russia Forest Products, the second largest timber processing company in Russia.
— How do you go about looking for investment projects or selecting co-investors?
— When we built a fund management team, we tried to in-clude competent industry executives. They’re highly competent people, and they’re familiar with practical work, and not theo-ries, and as a rule, they’re also familiar with several sectors. Our task is to choose the most effective and promising of all avail-able projects and bring them to the stage of actual transactions.As for the selection of co-investors, the RDIF is trying to attract the largest and most competent partners so that the others should try to catch up to them. However, we introduce funds and companies to Russian possibilities in a clear and strong manner and explain the benefits. Many potential investors have started showing interest on their own, and then they join the list of our partners.
What are the guidelines for the Fund with the Russian regions? Only rapidly growing regions can rely on reciprocity and show decent profitability, that is, those who don’t have it so bad in terms of direct investments?
— The participation of authorities, with an interested approach on their part, in the true sense of the word, eliminates many risks for investment projects. If a regional administration focuses on at-tracting investments, it can be considered, as a rule, as an already rapidly growing region. These constituent subjects usually have
V IEWPOINT
EX
PE
RT
.
SP
EC
IAL
IS
SU
E
Kirill Dmitriev

V IEWPOINT14E
XP
ER
T.
S
PE
CIA
L
ISS
UE
good experience in raising private funds by the time the RDIF arrives.
Investment projects are successful, especially where invest-ments are welcome. We don’t have strict restrictions with regard to economic indicators of the regions, with which we should work. It’s clear that if you rely on large investments, you need to take a proactive stance. The main thing for us is good potential and a high interest in investments, and in principle, that can be said of most Russian regions. We have a few RDIF agreements with constituent subjects of the Russian Federation, in particular, with the Krasnoyarsk Territory, Saratov and Leningrad Regions, the Republic of Bashkortostan and Tatarstan. Our documents contain secured agreements on the establishment of a favourable invest-ment climate and the development of future projects. Governments, which sign such memorandums, inform the fund of potentially attractive projects. Moreover, such transactions always mean new technologies and industries, and new jobs for the constituent sub-jects themselves.
— Direct Investment Fund acts not only as co-investor with other companies, but it also creates joint investment funds with similar organizations, and even other countries. What form is preferable? How do they differ from each other, and what ad-vantages do they present?
— Our fund functions in various formats; first and foremost, they differ in their objectives. We do have a few, I would say, strategic partners with whom we expect to work long and effectively. Bilat-eral joint funds have been established with China; we’ve launched the total investment platform with Japan, and a cooperation agree-ment with India. The largest state-owned financial institutions of partner countries are involved in such transactions. In this format, we have the opportunity to invest in an entire package of industries and projects that lie in the field of economic interests of our respec-tive states. If we’re talking about an individual perspective project, then we’ll use a standard mechanism of co-investments and attract profile companies and funds.
— How does the ongoing global economic crisis influence the Fund’s work operations? There are fewer investments and profits are declining…?
— In a sense, the global crisis has played into the hands of invest-ments into Russia. We’re seeing a growing deficit and an investor confidence crisis in the financial world. Against this background, Russia is starting to look much more attractive than many other countries. According to IMF forecasts, Russian economy will grow from two to three trillion dollars in the next five years. In addition, investors tend to trust countries with low levels of external debt, which is true of the Russian Federation.
— It’s estimated that today some 30 trillion dollars can be called free assets that are ready to be invested through-
out the world. There are very many contenders for this money. What advantages does Russia have so that we can hope to acquire a significant portion of these funds?— Returning to the subject of growth, I’d say that it’s namely growth and development that constitute the main advantage for Russia and the main prerequisite for investment interest. Many developed econo-mies are close to stagnation, while the relatively slow rate of GDP, even low by our own standards, makes our country appealing to investors.Russian GDP has also increased and even when calculated per capita. Therefore, spheres focusing on the end user of-fer very promising opportunities to multiply investments.In Davos, the RDIF launched a new initiative called “Russia means growth!” Within the framework of this programme, we tell interna-tional investment communities about real economic performance indicators of the Russian Federation, whose dynamics are actually much greater than those mentioned by western statistics.
— By the way, in April, the U.S. representative trade office in Moscow (incidentally, America isn’t our biggest investor) sud-denly publicly declared that the investment climate in Russia was unfavourable. What is your partners’ opinion?
— Our partners continue to invest in Russia, in-creasing their f inancial placements. I think that suf-f ic ient ly character izes their posit ion on this issue.Of course, the economic community has much to complain about in relation to Russian realities. The Russian Federation has yet to eliminate many administrative barriers for investors and what is also very important, dispel many stereotypes.
T he economic situation is not always represented as it real-ly is in Russia. With the participation of Ernst & Young and the Moscow State University Centre of National Intellectual Re-serve, we recently conducted a study on the outflow of capital. It turned out that the indicators announced for 2011 were in-flated by at least two times. In fact, given the nature of trans-actions, the situation with capital outflow from Russia is com-parable to such economies as Kuwait, Norway and Japan.In this case, judging by new research studies – “The confidence barometer for direct investment funds”— such structures have maintained their interest in the Russian market. Early last year, only 11% of the foreign investors believed Russia to be one of the most attractive places for investment. This figure rose to 19% in nine months. Potential and existing partners primarily focus on the large volume of the Russian domestic market, a cost-balanced and high-quality labour force, potential growth of productivity and advanced telecommunications.
— The idea of establishing the Fund was f irst an-nounced at the Saint Petersburg Investment Forum. You have, so to speak, “a family bond” with it. What importance does the forum represent for the f und?— For the RDIF, the Saint Petersburg Forum is, above all, a platform where we can work with the international investment community. Wherever major funds and companies gather, we can see the op-portunity to attract new and effective partners to our projects. This year, the Petersburg Forum will have a special meaning for us.As you know, Russia is chairing the “Group of Twenty”, and in our opinion, as many benefits as possible must be gained from this situation. In this regard, our fund has been an active participant in the working group – “Investments and Infrastructure”, within the framework of “Business Twenty”. Several meetings have al-ready been held, at which business representatives developed preliminary recommendations on restoring economic growth, primarily by improving the investment climate and expanding joint infrastructure investments. Officially, we’ll present these recommendations at the Saint Petersburg Forum, during which the B20 summit will take place. Then our proposal and those of other working groups will be discussed by the leaders at the “Group of Twenty” in September. ■
Our fund has attracted dozens of major
partners over two years. I’m talking about
leading companies. Their investments
into our country were a signal for other
investors to start working with Russia


IN FOCUS16E
XP
ER
T.
S
PE
CIA
L
ISS
UE
o prepare the operational Development Strategy of the Khanty-Mansiysk Autonomous District — Ugra up to 2030, a Territorial Information System (TIS) was created, various data on all industrial sectors was collected, and public hearings were held, dur-ing which the inhabitants of the region could talk
about their vision for Ugra’s future and put forth suggestions for regional development. TIS will keep track of real changes in regional development parameters: it will collect, store, process information and make it available to the general public through official government portals of the autonomous district on the basis of information exchange agreements.
In addition, a Community Council was formed to implement the Strategy — 2030 — a permanent body, the composition of which will be updated annually. Members of the Council will provide public and expert support for the execution of the Strategy. “The Strategy is aimed at ensuring sustainable development, enhancing Ugra’s current and future potential, improving living standards, and guaranteeing long-term regional development.” stated Na-talia Komarova, Governor of the Khanty-Mansiysk Autonomous District — Ugra. “However, the Strategy is not just a picture of the future, but a roadmap which will help us to move forward from the very first day of adoption of the document. The Strategy update system will incite action — we are introducing a new approach to Russian strategic planning, involving periodic updating of the base document along with complex scientific and expert support of such work on an ongoing basis.”
A Solid Base as Before, but not Only OneThe Khanty-Mansiysk Autonomous District — Ugra is a very spe-cial region of Russia. In 2012, Ugra took first place in oil extrac-tion, including gas condensate (50.3%) and power electricity production (8%), and second place in gas production (4.9%), industrial production (7.6%) and amount of tax revenues paid into the budget of the Russian Federation, and third place in terms of investments in fixed assets.
Oil is still the main asset of the region, ensuring our country’s energy security. More than half of Russia’s global share of oil production is extracted here. For more than half a century, Ugra oil has been a major source of revenue for the federal budget and the cornerstone of Ugra’s economic power, contributing more than 63% GRP of the district.
However, regional oil production has recently gone through hard times; the region entered a period of natural decline in oil production. The record 360 million tons produced in 1985 has become a page in history. This record volume will not be repeated. 278.4 million tons of oil were extracted in 2007; production volume dropped to 259.9 million tons in 2012. There are several reasons for this slide: the instability of global prices for hydrocarbons may threaten the price of Russian oil, making it drop to a $40 US per barrel and forcing mining companies to save on investments, the after-effects of perestroika, reduced exploitation drilling, insuffi-cient geological exploration of new deposits and slow development of surveyed fields. Finally, the old deposit fields have been depleted
Alexander Sychev
Improving What’s GoodIn the past few years, the Khanty-Mansiysk Autonomous District — Ugra has been actively improving its investment climate. Today, the modernization of investment conditions is required in order to implement new socio-economic goals, outlined in Ugra’s Development Strategy up to 2030
T
Natalia Komarova, Governor of the Khanty-Mansiysk Autonomous District — Ugra

17
— a total of more than 10 billion tons of oil has been produced in Ugra. The Governor of the district cites these reasons amongst many others: “In the last decade, most of the oil companies operat-ing in the district have not implemented their projects in terms of drilling new wells or improving the effectiveness of existing ones. Geological surveys were made in 2002, but they ensured only half of the standard growth of hydrocarbon reserves. The state is no longer able to take care of preparations for new reserves.”
The current period of turmoil in the world economy has clearly demonstrated the vulnerability of a resource-based economy. Al-though oil still represents a fairly long-term base for the regional economy, it has become quite obvious that it would be unreason-able to continue building society around this unique resource only. Therefore, two fundamental goals are defined in the new Strategy. First of all, as oil will remain the foundation of Ugra’s economy in the foreseeable future, oil companies should be encouraged to extend and recover the mineral and resource base: exploration of new deposit fields, introduction of advanced technology to enhance the output in old beds, and development of geologically complex deposit fields. According to experts and oil companies, at least another 20 billion tons of oil can be recovered from Ugra’s deep reserves, that is, twice as much as was produced in previous years. “All participants should have a clear understanding of their responsibilities for the recovery of the mineral and resource base.” said the Governor. However, this sense of responsibility cannot arise in a complete vacuum. Therefore, in order to stimulate in-vestments in fixed assets, and increase the volume of geological surveys, two laws were adopted in Ugra. Companies engaged in investment activities in the fuel and energy sector and in geo-logical prospecting will be exempt from profits tax and corporate property taxes. This will come to a total of roughly 19.7 billion rubles. “These measures will help stabilize oil production and increase the volume of geological exploration carried out in Ugra by different companies.” said Natalia Komarova confidently.
In fact, Gazprom Neft’s implementation of shale oil extraction technology is in line with the region’s strategy on innovative de-velopment of the oil-producing industry. Projects to develop and introduce new technologies in extracting reserves in the Bazhenov Suite and other hard-to-recover reserves will be implemented as innovative projects. Ugra’s hydrocarbon deposits are mostly found in multi-layer beds, requiring new production techniques.
In addition, the value and economic importance of small- and medium-sized oil-producing companies and service companies using innovative methods to enhance oil recovery will increase substantially in Ugra in the coming years. This will be facilitated by a set of support measures drawn up by Ugra authorities.
Current efforts are already yielding positive results — almost 260 million tons of oil were produced in 2012; the production decline rate decreased from 2.5% in 2009 to 1.2% in the past year. Eight new fields were put into operation, 3,888 new exploitation wells were drilled, while the volume of exploitation drilling ex-ceeded 13.6 million meters.
In the period from 2013 to 2020, it is expected that the fol-lowing fields will be put into operation: Priobskiy, Prirazlomny, Malobalykskiy (OJSC Rosneft NK), the southern sections of the Priobskiy deposit (OJSC Gazprom Neft), as well as the Samot-lorskiy (OJSC TNK-BP Holding) and Fedorovskiy sections (OJSC Surgutneftegaz). In total, it is planned to invest more than 15 trillion rubles in the oil-producing industry up to 2030. Neverthe-less, by the end of the current Development Strategy, the share of mining operations, including oil drilling, will drop to 40% in Gross Regional Product. Based on unique regional advantages, the Strategy will kick off a new phase of economic diversification, development of culture, education and healthcare, and create a more comfortable lifestyle. That constitutes the second important objective of the Strategy.
Diversification through ClustersThe current protracted global economic crisis has enabled experts to identify a number of Ugra’s economic sectors that have resisted external negative influences. In the medium term, the electric power sector is projected to have the highest growth rate. Today, Ugra’s electric power engineering is redundant. Regional power plants produce more than 75 billion kilowatt/hour of electricity per year, whereas just over 60 billion kW are consumed. Taking into account the implementation of all the investment projects and the prospects for exploiting resources in the Polar Ural Region, electricity consumption will very quickly exceed available surplus and inevitably, there will be a very serious obstacle to the develop-ment of Ugra’s economy, which many regions of our country must face today — lack of energy. Therefore, the number of investment projects related to electric power engineering is second to Ugra’s petrochemical cluster (see Table). Currently, Surgut State District Power Stations 1 and 2 and the Nizhnevartovsk State Power Sta-tion are being rehabilitated, while the Nyagan State District Power Station is being built.
In addition, new low capacity power plants are under construc-tion. Oil-producing companies are mainly engaged in this field. The fact is that in the early 2000s the federal government decided to stop ineffective flaring of valuable hydrocarbons — associated petroleum gas (APG) — and imposed a penalty factor.
Since January of this year, the ratio in the formula for calculat-ing payments for inappropriate use of APG (in fact — penalties) in-creased from 4.5 to 12, and will reach 25 as of next year. “In 2011, fines exceeded 350 million rubles, and the amount has increased significantly in the past year. These fines are distributed between three levels of the budget: 20% go to the federal budget, 40% — to the regional and local budgets respectively. Seeing that the decree of the Government of the Russian Federation, increasing penalties for non-normative amounts of gas flaring, has come into force, our fines will be very high this year.” confirmed the Governor.
Thanks to the motivating effect of this decree, the Ministry of Natural Resources and Environment of Russia believes that roughly 44.4 billion rubles will be invested in APG utilization projects, and that the gas utilization indicator will reach 95% by 2014. In the Khanty-Mansiysk Autonomous District — Ugra, the level of 89% was attained last year against 85.3% in 2011.
Utilization of APG for the production of heat and electricity is the simplest way to avoid a penalty, but gas processing projects for a broad fraction of light hydrocarbons (NGLs) used for the produc-tion of polymers are still a priority for the autonomous district. Next year, two processing plants will be launched in Ugra. One will be built by RN-Yuganskneftegaz. Projected power capacity of this plant will reach 1.2 billion cubic meters per year. The other plant, with similar power capacity, will be constructed by RussNeft.
Forestry has also recently become a highly efficient industry in Ugra. The region is rich for all kinds of forestry industries: wood-cutting areas total up to 24.7 million cubic meters. Only 7.5% of this wood is currently used. A target programme was approved to develop the forest industry. Nine projects have been planned for timber processing and production of particle boards, plank timber, fuel pellets, and other products. Companies are investing their own and borrowed funds — roughly 10 billion rubles. The district budget will contribute about 307 million rubles. Ugra will use these funds mainly as subsidies allocated to investors to offset part of the cost of interest payments on loans. In addition, forest management work has been financed by funds from the district treasury. Budget funds were not assigned to directly finance cer-tain projects, but to encourage private investments in the timber industry. As a result, the volume of processed wood will increase by 17% in the district.
In general, all the industries that form the new “skeletal struc-ture” of Ugra’s economy can be grouped into four geographically-
IN FOCUS
EX
PE
RT
.
SP
EC
IAL
IS
SU
E

18
industrial clusters. In addition to the petrochemical and forestry sectors, mining and innovation and technology clusters should also be mentioned. Each of them shows enormous potential.
Huge reserves of various minerals, especially numerous in the Polar Urals, will form the base for the mining cluster. Today, deposits of coal and silica, peat and building materials have been well explored. There is also a rock crystal sub-province in Ugra, where several deposits and occurrences of raw quartz have been discovered. Here, the Polar Quartz Company is building a mod-ern complex for the production of high-purity quartz concentrate and powder for nano-electronic, optical, lighting technology and chemical industries. The project will be completed in 2015.
The High-tech Technopark has become the base for the innova-tion and technology cluster. Since it was launched in 2009, the Technopark has registered 74 innovative companies, whose pro-duction output totaled more than 600 million rubles in 2012.
The Technopark was designed with constantly improving tech-nological infrastructures to encourage successful innovative ac-tivities. In particular, it is home to the Certification and Analysis Centre and the Network Centre for collective use of unique scien-tific equipment. A Prototyping Centre was launched here in 2011; its equipment produces 3D-model products ordered by innovative enterprises. The Technopark will open branches in major cities of the region. Such a Technopark network and government support will provide an effective innovation environment in the region. Ugra’s innovative companies receive subsidies and grants from the Department of Economic Development of the autonomous district, and grants from the Entrepreneurship Support Fund. In total, more than 55 million rubles and counting private investments — about 400 million rubles — have been invested in scientific and technical spheres from different sources.
The next challenge is to promote and develop Ugra’s infra-structure. It is planned to create a Ugra Technopolis and build industrial parks and technology platforms in the large cities of the autonomous district. In this way, an important number of re-search and science and innovation potentials will be concentrated in one large area in view of generating new ideas, creating new products, technologies, and promoting fundamental and applied research.
In addition, an educational system has been included in the district’s innovation process. Coherent programmes for gen-eral, vocational and further education have been implemented in Ugra; they take into account specific features of regional economy and the socio-cultural development of concrete ter-ritories. “We will improve the effectiveness and targeting of investments in human capital, relying on the development of modern education and science, high-tech healthcare, improving the quality of social services, and facilitating access to culture and sport. The purpose of such investments is to create the best conditions allowing for the comprehensive development and maximum self-fulfillment of Ugra’s inhabitants. Ugra is rich in talent and we should create a fertile environment that will en-able them to materialize, create innovative ideas in the region, and work towards maintaining our competitiveness and the district’s sustainable development.” announced the Governor of Ugra, Natalia Komarova.
It is impressive to note the targets that the region is hoping to achieve by putting the Strategy into action in real life. By 2030, Ugra’s Gross Regional Product may reach roughly 5 trillion rubles (it was 2.5 trillion rubles last year).
Investment EldoradoThe scope of investments required for the implementation of 69 planned projects (36 under implementation at present) match the prospects. This year, it is expected that investments in Ugra’s fixed capital will exceed 766 billion rubles. According to preliminary estimates, 669.9 billion rubles were invested in the autonomous district last year. The increase in constant prices to the 2011 level reached 5.2%.
For many years, investment volume in the fixed capital of the Khanty-Mansiysk Autonomous District — Ugra has taken third place in Russia. Per capita investments total about 426 thousand rubles (Russian average — 87.8 thousand rubles). The share of investments in Ugra’s Gross Regional Product reaches 27.2%, which today corresponds to the order issued by the President of Russia to regions to achieve 25% by 2015.
This can be explained by natural and target-oriented advan-tages created by the district, whose investment appeal has brought
IN FOCUSE
XP
ER
T.
S
PE
CIA
L
ISS
UE Investment projects in the Khanty-Mansiysk Autonomous District —
Ugra
Industrial sector No. of projects
Investment volume, billion rubles
Oil and gas cluster 26 97.5
Electric power engineering 13 357
Timber processing cluster 9 10.2
Construction of residential and commercial real estate
11 24
Mining cluster 1 5.3
Education 1 27.8
MSW treatment and processing 1 0.5
Agriculture 3 2.1
Food industry 1 0.05
Transport infrastructure 3 55.5
Communication 1 6.45
Huge reserves of various minerals is the base for the prosperous regional mining cluster
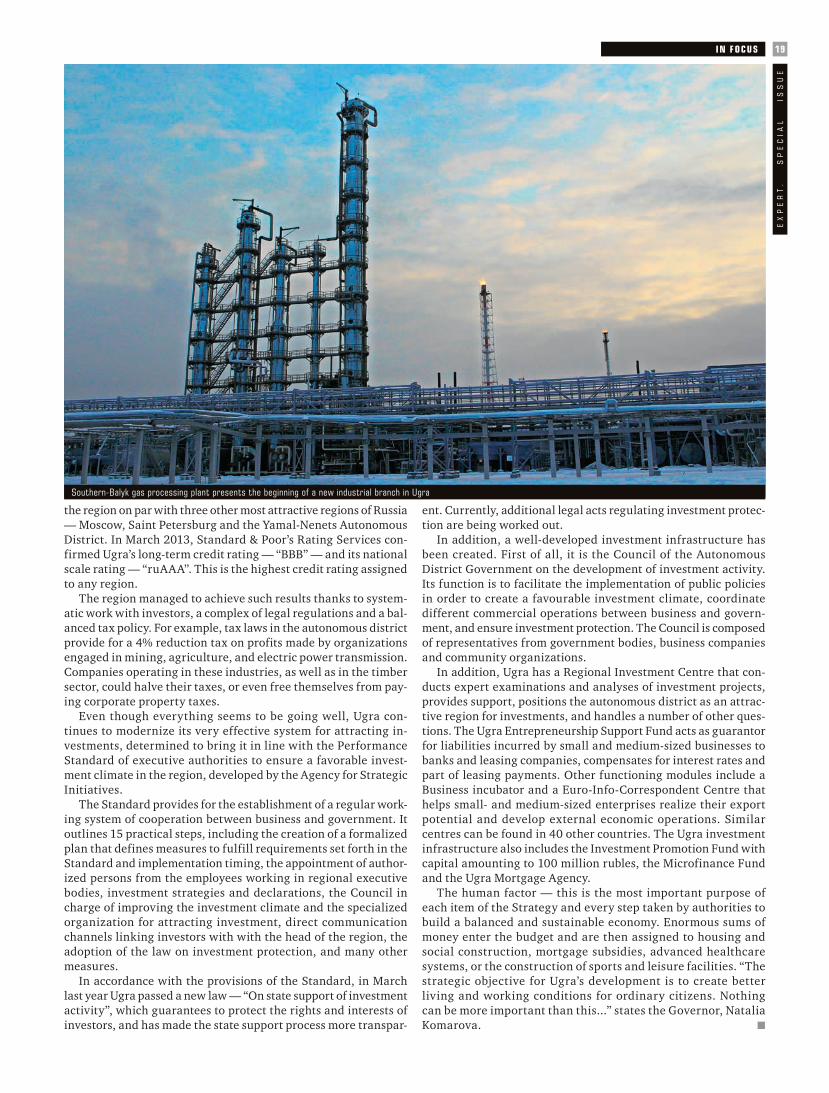
19
the region on par with three other most attractive regions of Russia — Moscow, Saint Petersburg and the Yamal-Nenets Autonomous District. In March 2013, Standard & Poor’s Rating Services con-firmed Ugra’s long-term credit rating — “BBB” — and its national scale rating — “ruAAA”. This is the highest credit rating assigned to any region.
The region managed to achieve such results thanks to system-atic work with investors, a complex of legal regulations and a bal-anced tax policy. For example, tax laws in the autonomous district provide for a 4% reduction tax on profits made by organizations engaged in mining, agriculture, and electric power transmission. Companies operating in these industries, as well as in the timber sector, could halve their taxes, or even free themselves from pay-ing corporate property taxes.
Even though everything seems to be going well, Ugra con-tinues to modernize its very effective system for attracting in-vestments, determined to bring it in line with the Performance Standard of executive authorities to ensure a favorable invest-ment climate in the region, developed by the Agency for Strategic Initiatives.
The Standard provides for the establishment of a regular work-ing system of cooperation between business and government. It outlines 15 practical steps, including the creation of a formalized plan that defines measures to fulfill requirements set forth in the Standard and implementation timing, the appointment of author-ized persons from the employees working in regional executive bodies, investment strategies and declarations, the Council in charge of improving the investment climate and the specialized organization for attracting investment, direct communication channels linking investors with with the head of the region, the adoption of the law on investment protection, and many other measures.
In accordance with the provisions of the Standard, in March last year Ugra passed a new law — “On state support of investment activity”, which guarantees to protect the rights and interests of investors, and has made the state support process more transpar-
ent. Currently, additional legal acts regulating investment protec-tion are being worked out.
In addition, a well-developed investment infrastructure has been created. First of all, it is the Council of the Autonomous District Government on the development of investment activity. Its function is to facilitate the implementation of public policies in order to create a favourable investment climate, coordinate different commercial operations between business and govern-ment, and ensure investment protection. The Council is composed of representatives from government bodies, business companies and community organizations.
In addition, Ugra has a Regional Investment Centre that con-ducts expert examinations and analyses of investment projects, provides support, positions the autonomous district as an attrac-tive region for investments, and handles a number of other ques-tions. The Ugra Entrepreneurship Support Fund acts as guarantor for liabilities incurred by small and medium-sized businesses to banks and leasing companies, compensates for interest rates and part of leasing payments. Other functioning modules include a Business incubator and a Euro-Info-Correspondent Centre that helps small- and medium-sized enterprises realize their export potential and develop external economic operations. Similar centres can be found in 40 other countries. The Ugra investment infrastructure also includes the Investment Promotion Fund with capital amounting to 100 million rubles, the Microfinance Fund and the Ugra Mortgage Agency.
The human factor — this is the most important purpose of each item of the Strategy and every step taken by authorities to build a balanced and sustainable economy. Enormous sums of money enter the budget and are then assigned to housing and social construction, mortgage subsidies, advanced healthcare systems, or the construction of sports and leisure facilities. “The strategic objective for Ugra’s development is to create better living and working conditions for ordinary citizens. Nothing can be more important than this...” states the Governor, Natalia Komarova. ■
IN FOCUS
EX
PE
RT
.
SP
EC
IAL
IS
SU
E
Southern-Balyk gas processing plant presents the beginning of a new industrial branch in Ugra
V IEWPOINT20E
XP
ER
T.
S
PE
CIA
L
ISS
UE
he Finnish construction group Lemminkäinen has been working in Russia for 40 years of its more than a century of history. During this time, the Finns have implemented some 400 projects, including such fac-tories as Nokian Tyres and Elcoteq, a new museum depository at the Hermitage, and an industrial park
in Kaluga. Activities beyond Suomi borders bring Lemminkäinen roughly 40% of its revenue. Russia provides 6% of the Group’s revenue, 11% of its orders and 16% of its revenue outside Finland. Lemminkäinen is a traditional construction company, covering all areas of the construction business: housing, infrastructure facili-ties, roads, bridges, special structures, tunnels, mines, and engi-neering systems. They are all represented in Russia. Housing con-struction is concentrated in Saint Petersburg, but in other areas Lemminkäinen operates in the regions, including Kazan, Khanty-Mansi, Kaluga, and Tver. The company’s share is now less than one percent in the construction and housing market in Saint Petersburg.In line with its current strategy, the Finnish construction group Lem-minkäinen in Saint Petersburg is striving to reach figures comparable to its operations in all of Finland — 1,000 apartments per year. Juha Vättö, Vice President of construction of buildings and structures talked about certain features of national house building.
— How does the Russian market look in comparison with other countries where Lemminkäinen works?
— Any market is complex in its own way; there are problems everywhere. The Russian market is largely dependent on the situation in the world market as a whole, especially in the contract construction sector. What happens in the world also happens in Russia. Most of our customers are western companies. The economic crisis in Europe has not yet been resolved, so investors are still very cautious about spending money and investing funds. As for predictions, with respect to the economic situation in Russia, they are still positive. Russian GDP shows a growth rate of about 4% per year; it’s barely one percent in Finland and other western countries. That means that Russia is an interesting place for investments; nowadays, Europe is far from showing such dynamic development. Therefore, if the authorities want to help investors, the volume of investments in the Russian economy can be significantly improved. This is how it will probably turn out in the end, but difficulties are inevitable.
— In your opinion, what are the main competitive advantages of Lemminkäinen?
— We Finns are very reliable; we can be trusted. We keep our word and carry out our promises — that’s our strong point. We comply with the construction schedule, we don’t change rates or conditions as we continue to do our work. We do have competitors who fail to fulfill part of the contract price, and indeed, treat contractual provisions in a very “flexible” manner, but we believe in other principles. We demand high-quality construction work and installation of equipment. We are reliable partners.
— Who are your main competitors?— In the construction industry — large local Russian
companies. Turkish players often operate in large-scale projects; they are also quite serious competitors. In the housing
sector, we compete with all the major players in this market — LenSpetsSMU, LSR, YIT — they all need to be taken seriously.Given the current demand for housing on the Russian market, there is a niche for all the companies; market needs will find room to fit in all the players; there are opportunities for everyone. We still occupy only a small niche in the Russian housing market. A key success factor for any construction project is choosing the right location for the building site. Companies that manage to get land plots in good areas have a decisive advantage.
— How can the Russian division of Lemminkäinen continue to grow?
— Our growth is not due to a decrease in other players’ share of the market. Today, the availability of housing in Saint Petersburg is about 23-24 square meters per person. If we are to follow the objectives set forth by the Russian government, this figure should be raised to at least 30 square meters per person. To fulfill such a task, 5-6 million square meters of housing should be put into operation in Saint Petersburg every year. This is twice as much as the present capacity. In general, 60-70 million square meters are built in Russia annually, but needs and demands reach at least 140 million per year. Today, the Russian government is quite actively trying to support financially solvent demands for housing by extending mortgage loans to young families, for example. Nevertheless, there’s enough work for all the players involved in the housing market. We position ourselves as a player in the “comfort” and “comfort-plus” sectors. Along with other Finnish companies, we’re bringing new modern materials and technology to the Russian market, and we pay much more attention to the quality of our construction work. In many ways, we are pioneers and role models.
— How do you go about building a relationship with your main Finnish competitor — YIT?
— I came to Lemminkäinen from YIT. Times have changed; we act differently in the market. They have a good strong brand. We are building up our own brand, and so far, both Lemminkäinen, and YIT can operate calmly on the local market. In February 2013, the Presi-dent of Finland, Sauli Väinämö Niinistö, visited Moscow and met with the Russian President, Vladimir Putin. In particular, both presidents agreed to create a working group to develop standards for housing construction in Russia and bring them closer to European standards.
At present, Russian and EU normative regulations differ quite sub-stantially, although Russia is developing its own standards in the Eu-ropean direction. In this matter, we are in the same boat as YIT, SRV, and NCC. Harmonizing standards requires us to work together and co-operate with local and foreign players. So, even as competitors, we must work together because our interests coincide on this question.Frankly speaking, our common goal is to make sure that people respect construction workers, and that construction quality is at a high level. The construction sector is not an attractive place to work in Russia or in Europe. Russians believe that too large numbers of construction workers have “invaded” their areas from the southern regions. The population’s prosperity is growing, the demand for quality construc-tion is also growing, but there aren’t enough skilled workers to do the job — that’s sure to disturb and worry local people.
— Does Lemminkäinen employ “large numbers of migrant workers”?
Nadezhda Linnas
Using Your Head to Break Through the Wall! Against the background of a stagnating Europe, the growing Russian market and unsatisfied demands for housing are increasingly attracting foreign players despite the complexity of agreements and corruption in this sector
T

21V IEWPOINT
EX
PE
RT
.
SP
EC
IAL
IS
SU
E
Juha Vättö

22
— Our subcontractors are more than likely to use these people. But, we’re fairly strict in our Russian division; we employ about 750 people, but only a few foreigners, and they’re all Finns. The others are all Russian citizens. In any case, we firmly demand that all workers, whose labour force is used by our sub-contractors, have all the required permits and licenses. There are no “grey-zone” workers on our construction sites. After all, we have a responsibility to the community, so we comply with the law and adhere to ethical principles, including showing respect for our personnel.
— Lemminkäinen has positioned itself as a company with European construction standards. How do you compete with Russian players, which often have considerably less expenditure?
— Indeed, our manufacturing costs are probably higher than those of our Russian competitors. We concentrate on optimizing administrative and management processes, as well as creating effective design projects. We prepare carefully for any new project; we think it all over, make plans and calculations. We monitor quality very strictly and strive to avoid waste. If you do this once, but correctly, it won’t be so expensive.
Furthermore, we aim to ensure that at least half of our apartments have been completed with all the finishing touches. We use technical solutions in designing our projects, thus avoiding unnecessary systems that increase the cost of building a technical floor; it turns out that our performance factor is often higher than that of our competitors, and in the end, parity through more efficient management and good planning. Thanks to more “advanced” technological solutions, we punctually adhere to our construction schedule and deliver our building sites faster than our competitors. There is a Finnish proverb that says — a good plan is already half the battle. We follow this maxim rigorously.
Russian games— You’ve been working in Russia for almost 40 years. Have you noticed any progress at all in reducing red-tape in the construction business?
— Back in the early 2000s, all the mechanisms were relatively simple and straightforward. Work became much more complicated in 2007, when an amendment to the Building Law came into effect in Saint Petersburg. Alexei Belousov, Vice-President of SRO NPO Association of Builders of Saint Petersburg, noted recently — and I can attest to it myself — that in order to start construction work in Saint Petersburg, you need three times more different kinds of approvals and conclu-sions from supervising bodies than the average in Russia. According to Belousov, 130 — 150 approvals are required in Saint Petersburg but about fifty on average in Russia. In this sense, Saint Petersburg is a very difficult region for the construction business. It’s clear that simplifica-tion is needed for all participants of the construction industry. I hope that the best solution will be found in the end.
— What are your impressions of the other regions?— Kaluga made a very good impression on me. The local governor
declared that the region needed new high-quality accommodation — come and work here, he said! We get the same sort of offers from many other regions: we’re offered land plots all across Russia, including in Kazan, Omsk, Ufa, the Moscow region and southern regions. Strategically, in the future, Lemminkäinen would like to build not only in Saint Petersburg, but also in other regions. In addition, there’s another factor: if there’s a lot of active industrial construction in a city, it will be followed by housing construction. For example, many foreign investors are arriving in Kaluga. As a result, people who moved from Kaluga to work in Moscow are now returning to work in local companies. Naturally, they need homes.
— How long does it take to coordinate a construction site in a Finnish city?
— Building permits in Russia and Finland are very different. If construction is planned in accordance with a general plan or with an overall plan for the development of a specific area, the procedures are very simple. In order to get permission in Suomi, we must make a drawing of the facades of the future building, draw up a general architectural
plan and a sectional plan, write a brief description of what kind of house will be built, and develop a master plan — how the new building will be positioned on the site. In general, no more than just a couple of sheets of A4 paper are required. In smaller municipalities, you can even obtain preliminary authorization for construction at an hour-long meeting with local authorities. It’ll take about a month in larger cities, but hardly more. Our anti-record in Saint Petersburg was two years.
A pig (and a cat) in a poke— What are the most pressing problems facing foreign developers working in the Russian market?— In Finland, the design phase begins after the construction permit has been received — no detailed projects are prepared in advance. Here, beating down office doors of various committees and hundreds of approvals and assessments are already needed at the preliminary approval stage. Another important point: builders and designers are responsible for construction documents in Finland, and not officials who refuse to issue a permit here for weeks or months because their own responsibility is involved. They need to check that everything has been done in accordance with regulations. I believe that Finnish practice in this regard is more favourable for investors and builders, as well as for customers.
Here’s another Russian game — getting technical specifications, connections to utilities. In Finland, this question is decided very simply. Let’s say I have a construction site and I need a certain amount of electric power… I just call the institution responsible for this question, I ask them how much the connection and one kilowatt will cost; I then fill out an application and everything is ready and done in accordance with the schedule. Foreign investors who come to Russia often find it hard to imagine how this could be managed otherwise. But, it’s the opposite here: to request technical specifications and get some information, you must arrange to lease the land or buy the property without having a normal opportunity to assess the costs for infrastructure or understand whether the land is really suitable for you or not.Having made a decision concerning their investments, western companies allocate a certain budget for the project and plan their expenditures. But everything works the other way in Russia: an investor cannot calculate how much electricity will cost, or whether there is any power available at all. What he gets is not a land plot, but a cat in a bag (the Finnish version refers to a pig in a poke). This option does not suit him, and he decides to completely abandon construction work.
I’ve been working in Russia for almost 40 years and have seen many cases where an investment project just got stuck in the mire at this stage. This problem considerably disturbs foreign investors coming to work in Russia. Access to information on technical specifications should be as simple as possible. Not everyone is willing to take the risk: buy land, and then decide what to do with such a surprise. Finnish municipalities are willing to do anything to lure investors to their regions. In this respect, it seems that everything works the opposite way in Russia.
— The construction industry has a reputation as being one of the most prone to bribery. How do you get along with corruption?
— That’s a complicated question. Given the fact that hundreds of approvals are needed for each construction site, many small companies try to make life easier for themselves by handing out bribes. They don’t have any money to spend on consultants and lawyers, so they are forced to do so. Russia takes 170th place in the ranking of Transparency International — that’s not just by accident. But, we keep banging our heads against the wall. If we’re told that a comma is missing in the project plan, we go and do everything over again. It’s clear that at some point they get annoyed and give us the approval. We try to do everything according to the law. If necessary, we will defend our position in court. It’s hard, but in this respect, our situation is better than that of many small Russian companies. I think that Lemminkäinen also has a fitting reputation — a company that follows the letter of the law and ethical principles. So, no one even tries to extort bribes from us. ■ Saint Petersburg
V IEWPOINTE
XP
ER
T.
S
PE
CIA
L
ISS
UE
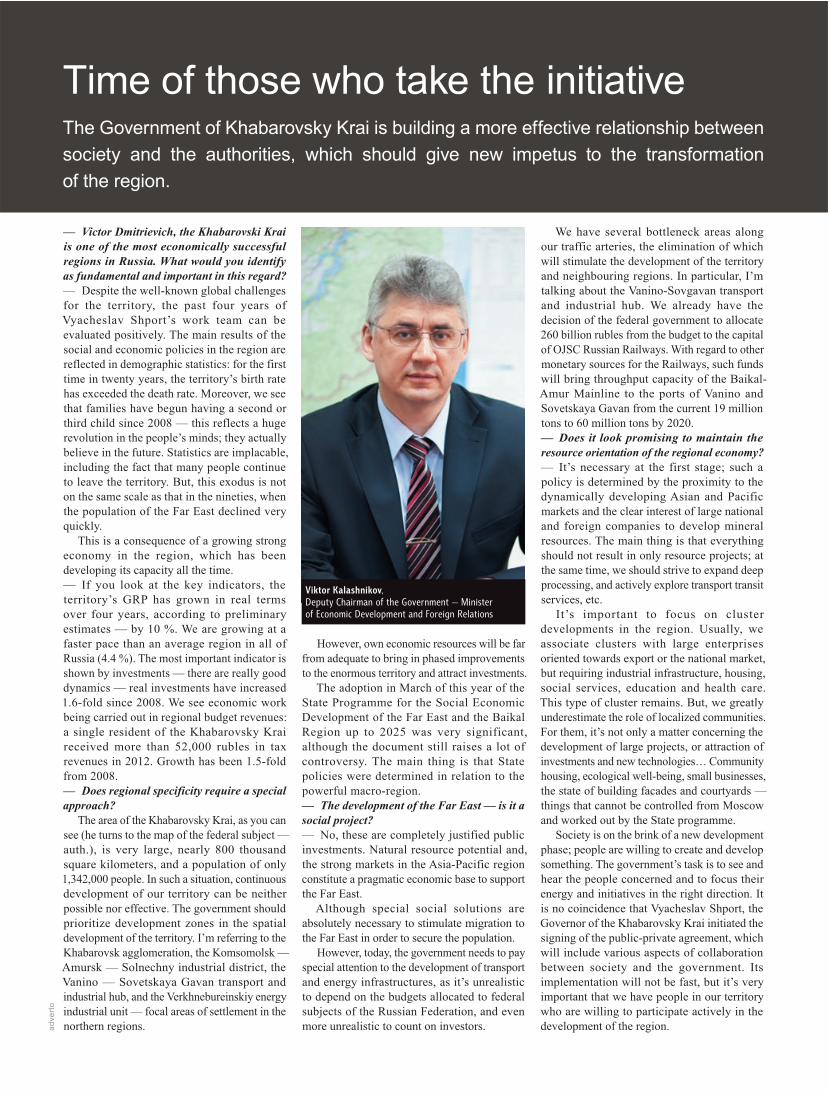

RUSSIAN REGIONS — KAMCHATKA24E
XP
ER
T.
S
PE
CIA
L
ISS
UE
ikolai Pegin, General Director of the company, talked about the tasks, powers and functions of the newly created OJSC Corporation for the Development of the Kamchatka Territory, which has been charged with attracting investments as a routine procedure.
— What is the purpose of the Corporation for the Development
of the Kamchatka Territory? Wouldn’t it have been enough to ap-point a deputy chairman of the regional government, who would work on questions related to different investments?
— Until recently, I held the position of deputy chairman of invest-ments, and as we continued our work, it became apparent that it was very difficult to deal with specific issues of investment policy within a government structure — procedures are extremely long, and it’s impossible to achieve important dynamics. But, we must react almost instantly if we wish to attract investments. Moreo-ver, the government of the Kamchatka Territory cannot always be directly involved in financing different projects. The corporation has become a government agent that triggers the mechanisms for public-private partnerships.
As a rule, we will not use our own funds, but our authority, and opportunities to find financing from foreign investment companies, Russian financial institutions and companies that may be interested in the implementation of different projects in the Kamchatka Ter-ritory. We’ll represent Kamchatka’s interests, coordinating them with the interests of potential investors. We want to work in order to make money flow into the economy of the peninsula, and invest it where it would be interesting for us, the residents of this region.
Therefore, on February 18 of this year, we founded the Corpora-tion for the Development of the Kamchatka Territory, which I was appointed to head on the instructions of the Governor of the Kam-chatka Territory. We haven’t even finished up our organizational period — not all the employees have been hired and offices require additional equipment, but work is already in full swing — we’ve started negotiations. In particular, we’ve already talked to a Japa-nese investment company, we’re signing memorandums, and we’re working on specific projects.
Of course, it’s difficult for the Kamchatka Territory to compete with such regions as Belgorod, Ulyanovsk and Kaluga, and Tatar-stan. They are leaders in attracting investors, and the roots for their success are not hard to understand. Proximity to transporta-tion logistics routes, a vast consumer market in the European part of Russia, and developed manufacturing capacity. Therefore, the challenge facing them was much easier.
Everything is more complicated in Kamchatka — large Russian consumer markets are far away and the infrastructure is less devel-oped. Moreover, there are certain natural hazards — earthquakes and tsunamis, for example. Therefore, we understand that today the circle of consumers for Kamchatka products is much narrower. But, our prospects are enormous. We have the huge Asia-Pacific region nearby. Entering that market won’t be just a new opportunity for the Kamchatka Territory. It will mean new opportunities for the whole country.
— What is the goal of the Corporation for the Development of the Kamchatka Territory?
— Our goal is to create good conditions so that investors will come here, so that they’ll feel comfortable here. The corporation must be a kind of factory that takes up ideas and turns them into needs and demands. The times when investors just grabbed at ideas are long gone. Today, one factor has become very important — how long will it take the idea to develop into a real business prospect? Sometimes, it can take up to two years. It often happens that during that time people lose interest in the project, or the investor becomes insolvent, or puts his money into other projects. That’s the crucial moment, when it’s necessary to invest, go ahead. As they say: strike while the iron is still hot!
Therefore, one of the goals of the Corporation for the De-velopment of the Kamchatka Territory is to reduce this time period, having done all the preparatory work for the inves-tor. In some cases, such preparatory work may include ques-tions and infrastructural support for investment sites.We’ll take care of all the “packaging” of the initial idea: establish the economic efficiency of the investments, evaluate the quality of different projects and their relevance, and then begin to prepare the “final package”.
— What do you mean by “packaging”?— Let’s say there’s an investment idea. The initiator of the project
tries to describe it… I mean, as well as he can. We’ll be able to es-timate very accurately how much money should be invested, what financial result will be achieved, how much time will be needed,
Alexander Sychev
A Region Worth 500 Billion Roubles!This is the amount of investments that the Kamchatka Territory aims to attract in the coming years in order to implement projects that should create a new economy in the region
N
Nikolai Pegin
VICT
OR
ZAZ
HIG
IN

25
will there be consumers ready to buy this service or product, how long will the payback period last, what risks are involved ... In ad-dition, land allocation will be included in this “packaging” deal.In other words, we’ll try to give investors specific answers to any questions that may arise during the implementation of projects and provide all the required services. Our task will be to find and offer all the ingredients to realize the initial idea and solve all pos-sible problems. The investor will receive everything on a platter; everything will already have been worked out by all authorities and legally cleared.
However, the corporation is not only the mechanism to complete an investment project, but also a coordinator that will be capable of gathering together the interests and possibilities of the federal centre, the regional government, the initiator of the idea and the investor. For example, there’s a programme to support small— and medium-sized businesses, according to which the Ministry of Economic Development of Russia provides federal co-financing to build the infrastructure of industrial parks and provide subsidies to cover partial costs of the residents, if the region allocates the needed territory, develops investment documentation and recruits a certain number of residents. Who can fulfill all the requirements of such a programme? An authorized company, and in particular, the Corpo-ration for the Development of the Kamchatka Territory. We find the land and residents, develop a concept and project documents, then, with the help of federal co-financing, we supply roads, electricity, municipal networks, and in the future, we exercise the functions of the management company for the established industrial park (but not its residents!). Besides, there’s even a more difficult task — not all potential residents will have the money to organize production or construct industrial facilities. We also search for required funds. This is all part of “packaging” the initial idea.
— What are the investment advantages of the Kamchatka Territory?
— We have a lot of great competitive offers. The region is well situated along the most important Pacific sea lanes. By the way, one of the most important projects should be the project to create a large port hub in Petropavlovsk-Kamchatskiy. It could become the eastern gate for entering and leaving the Northern Sea Route, which, by the way, has real economic advantages over the route via the Suez Canal. The non-freezing Petropavlovsk-Kamchatskiy Bay is so big that the entire naval fleet of the world could be stationed there. It’s also important that this area already has ship-repairing companies that only need to be reconstructed.Kamchatka is extremely rich in mineral resources. The agro-indus-trial sector is also attractive. Incidentally, during the Soviet period, Chukotka, Yakutia, and Magadan received their potatoes, cabbages, beets, and carrots from Kamchatka. Today, we could produce food for military units stationed in these regions.
We have fantastic natural and climatic conditions. Kamchatka’s natural environment is amazing. We have all the conditions for de-veloping the tourist sector. And what about fishing and hunting in Kamchatka! The Fund for the Development of the Far East supports our evaluations for developing tourism in Kamchatka. Today, we’re working on an integrated project of tourist infrastructure, which includes building resorts and hotels, reconstructing the maritime terminal and the airport, providing water utilities, and much more.Finally, the Kamchatka Territory has been included in the list of areas, where a system of preferential taxation will be created.
— At present, on recommendations of the Association of Stra-tegic Initiatives, regions are involved in standardizing invest-ment attractiveness ...
— A very useful thing. Such a designed standard will allow us to see our own shortcomings and not just to reinvent the wheel, but to really move on. Many points of this standard have long been established in our area and some of them are being worked out right now. I’m talking about a regional investment fund, the Fund
for Small— and Medium-sized Enterprises, “a single window”, eliminating the need to run around different official offices, etc.In addition, we plan to create a high-quality geographic informa-tion system — a database needed to assess investors’ opportunities to implement projects in the Kamchatka Territory. Today, some investment ideas and projects are available on the information portal of the government of our territory, but it has only limited information. The Corporation will provide the investor with com-prehensive information.
— Does the corporation have priorities in industries or projects or, perhaps, in the actual amount of investments?
— Of course, we have priorities that have been specified by the Governor of the Kamchatka Territory, Vladimir Ilyukhin, and record-ed in the investment strategy of our region. This means mining and fishing industries, transportation, housing and utilities, marine and agricultural industries, and tourist development. So, we’ll continue moving forward within the framework of perspective objectives set by the Government of the Kamchatka Territory, albeit with a certain degree of autonomy. We are to attract investments amounting to roughly 500 billion roubles to our regional economy. It’s essential that this money should not be thrown out the window, but should benefit the Kamchatka Territory and, above all, the people of our region.It’s important to note that the Corporation aims not only to at-tract foreign investors, but also to support projects designed by Kamchatka entrepreneurs. We’ll be able to assist some companies in attracting additional funding; others will get help in resolving infrastructure problems, and still others in promoting their brand name. The main thing is that these projects should have a quality foundation, and their initiators should have serious intentions with regard to developing their respective businesses.
— The state is trying to find the right algorithm for the devel-opment of the Far East, and plans to carry out an unprecedented number of investments. What kind of help is Kamchatka count-ing on?
— By and large, the state owes a lot to the region and the people living here. Since the collapse of the Soviet Union right up to the early 2000s, the Far East actually had to survive by focusing almost exclu-sively on its own possibilities. During this time, of course, we accu-mulated many serious problems that cannot be resolved straighta-way. It will be difficult for the state to find the necessary resources in the short term. In general, even the announced amount of an an-nual allocation of 100 billion roubles does not seem to be sufficient.Kamchatka will need to be actively involved in all possible federal programmes, such as the State Programme — “Social and Economic Development of the Far East and the Baikal Region” — a major but not the only source of federal funds for investment purposes. There are other sectoral programmes for tourism, transport, fish-eries, etc. In addition to these means, we need the largest possible public-private partnership, based on clear and stable rules. For the time being, not all of these sources are being exploited fully in our region, so we have definitely allowed for a certain reserve.
Not only is the Far East an important region in itself, but it’s also a basis for a new sense of unity of Russia, its new (Eurasian) role in the world. It must go beyond simple “investments in the territory”, but should represent a new national idea of our country. Today, Russia is not just “a part of the Asia-Pacific region”, but has become a representative of the West in the East and of the East in the West. It’s namely Russia that can establish relations between the world’s largest manufacturing centre — the Asia-Pacific region — and the world’s consumer centre — Europe. From an exporter of raw materials — this is the very position that Europe has been trying to secure for Russia — we can become a centre for global trade, production and transportation flows. This represents a new source of power for us. The Far East and the Kamchatka Territory, as its most important region, may become the testing ground for a new geopolitical situation in the world. ■
RUSSIAN REGIONS — KAMCHATKA
EX
PE
RT
.
SP
EC
IAL
IS
SU
E

COMMUNIC AT ION NE T WORK26E
XP
ER
T.
S
PE
CIA
L
ISS
UE
he Russian government’s plans to turn the Far East into a growth engine of the country’s economy are taking on much clearer outlines. Basically, they were pinpointed in the regional
development programme, approved at the meeting of the State Commission for the De-velopment of the Far East and Trans-Baikal held in Yakutsk on April 2, 2013, under the chairmanship of Dmitry Medvedev, Head of the Cabinet of Ministers. The Prime Minister described the development of the Far East as a priority for the Russian Federation, a fact that has been manifested in several decisions pertaining to the social and economic sphere, aimed at the development of the region. In particular, participants of the Yakutsk meet-
ing seriously discussed 23 complex invest-ment projects aimed at creating competitive jobs, and ensuring infrastructure, urban development and social welfare. Among the most ambitious projects – the development of the Chayandinskoye oil and gas depos-its, construction of the pipeline – Sila Sibiri (Power of Siberia), a road-rail bridge across the Lena River and the railway network in Yakutia, the development of the Elginskiy coal deposit, etc.
Investment capacity in Far East infrastruc-ture projects has been evaluated at hundreds of billions of rubles. Most of them are high-tech projects that require reliable communi-cation channels, data transmission, and infor-mation support. The volume of the broadband sector for Internet access in the Far Eastern
Federal District alone is estimated at 220-250 million dollars. It is not surprising that the growing telecommunications market of the Far East is becoming more and more attrac-tive to different market players.
Today, one of the contenders for an ap-preciable portion of the service and data transmission market in the Far East is Tr-ansTeleCom CJSC (TTK), which is actively developing its operations in this direction. As a subsidiary of Russian Railways OJSC, TTK operates fiber-optic communication lines (FOCL) along all the main Russian railway routes. In recent years, as one of the lead-ing participants in the wholesale market, the company has also developed Internet access services in the retail sector, using the special features of its own business. The presence
Andrew Kudisov
Internet for accelerated developmentEastern Siberia and the Far East will be one of the most powerful drivers of economic development in Russia. Reliable communication channels, which are currently being developed in the region, constitute the most important element of success in the state programme for the economic recovery of the eastern regions of our country
TFiber-optic communication lines have connected both banks of the Lena river in Yakutia

27
of a backbone network along railway routes enables the company to quickly enter the market in remote regions. Therefore, the Far East represents one of the main development areas for TTK.
Telecommunication networks have usu-ally developed on the basis of other, more capital-intensive infrastructures: cables laid along roads, gas pipelines, or power trans-mission lines. In the case of TransTeleCom, it is railroads. In practice, the spread of the Internet through the railway infrastructure has been an effective business model in our country.
Today, TTK is in charge of over 76 thou-sand kilometers of fiber-optic communication lines with bandwidth capacity of more than 1.5 Tbit/sec and its own access infrastructure for 4.7 million Russian households. In two years, the operator’s subscription base in Rus-sian regions has reached 1.2 million private users, and the company became the fifth larg-est Russian broadband operator last year.
“The Far East has always been a prior-ity region for our company,” says Svetlana Shamzon, Vice-President of TTK, Head of the Broadband Unit, “Today, TTK is one of the largest providers in Khabarovsk and Ir-kutsk. In 2007, we were the first to install fiber-optic cables to Sakhalin, connecting the island with the mainland, and offer-ing Sakhalin residents high-speed Internet access. Today, we also provide television services to Sakhalin Island. Last year, we completed our network constructions and started providing services in Birobidzhan and Komsomolsk-on-Amur. We’ve been working in Yakutia since the beginning of 2013. Thanks to a modern network built by TTK, residents of Yakutsk and a number of
other cities can now enjoy high-speed Inter-net. Before, the radio relay line in Yakutia had completely exhausted its own resources and wasn’t able to ensure other possibili-ties. In the future, we’re considering the possibility of building modern fiber-optic telecommunication infrastructure in such cities as Salekhard, Magadan, Petropavlov-sk-Kamchatskiy, and Norilsk – quite large industrial centers where there are still no “optics.” remarks Svetlana Shamzon.
According to Tatiana Zemtsova, analyst at Finam Investment Company, the com-pany’s competitive advantage is its abil-ity to achieve an important synergy impact through the simultaneous development of its wholesale business and satisfying consumer needs. With its own backbone network, TTK can offer its retail customers high quality and reasonable prices, while maintaining
the necessary level of profitability of differ-ent projects.
“We’re a commercial organization, and we can’t afford to operate below a certain level of profitability. However, we’re aware of the social significance of telecommunication ser-vices in remote areas, and we’re doing our best to make our tariffs as affordable as possible.” says Svetlana Shamzon, Vice-President of TTK. “For example, after entering the market in Yakutsk, together with the Government of the Republic of Sakha (Yakutia), we developed a programme, whereby we lowered tariffs for both individuals and corporate clients accord-ing to plan, and within reasonable economic indicators.” Since May 2013, Internet access provided by TTK has become cheaper by 30% for legal entities in Yakutsk. The prices for home users have also dropped. The regional enterprise, TTK-Baikal has started providing broadband services in Nerungri, the second most populous and important city in Yakutia. Here, home Internet from TTK is available to residents of more than 21 million households. The company plans to enter the broadband market in Aldan and Tommot, and continue developing the main line.
Today, large and, in particular, small- and medium-sized businesses are largely based on modern communication technologies, and each year this relationship becomes stron-ger and clearer. Therefore, the availability of high-quality telecommunication services naturally promotes economic and social de-velopment of the regions. According to vari-ous expert estimates, the cost for broadband Internet access in the Far East has dropped by three to five times in the last three years, ever since TTK entered the retail market, and this trend may continue in the coming years. ■
COMMUNIC AT ION NE T WORK
EX
PE
RT
.
SP
EC
IAL
IS
SU
E
Investment capacity in
Far East infrastructure
projects has been evaluated
at hundreds of billions of
rubles
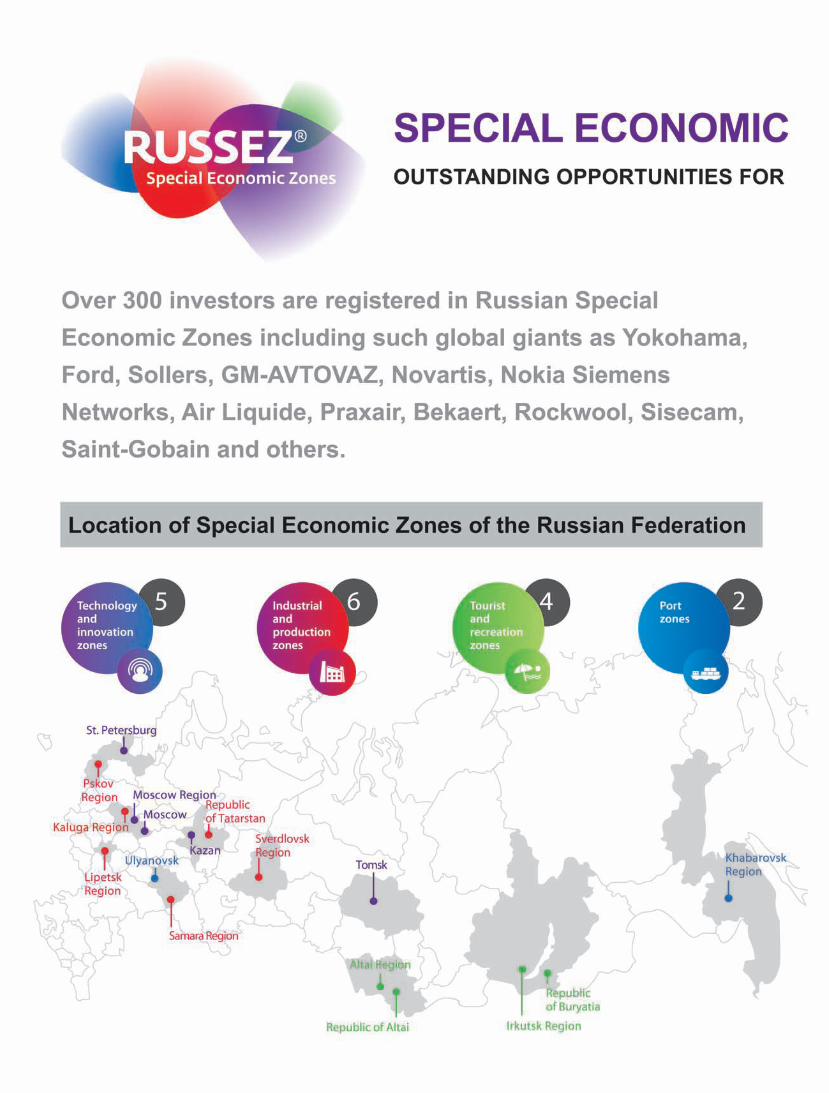


IN V E S T MEN T S REP OR T30E
XP
ER
T.
S
PE
CIA
L
ISS
UE
ust over a year ago, we started noticing that investment activities of private business companies were gradually declining in our country (see article “Hitting the Brakes” in
No.37, Expert, 2011). Subsequently, we linked this drop to the fact that the country was entering a turbulent election period, during which businessmen, fearing radical political upheaval, were not willing to invest in new plants and factories. However, investment operations of private business companies did not occur immediately after the election. The best time for capital investments, i.e. spring and summer, was marked by a continuing recession (in the spring investment survey, we recorded a total of 35 private projects worth $7.15 billion, and even less in the summer — 31 projects totaling $5.8 billion), whereas there had always been some growth during the warm season. At this point, our belief in private capital was shaken; for a short moment, it seemed to us that, figuratively speaking, state-owned companies had trampled all over private investments like elephants, without even noticing them. However, we can now assert that private business still exists in Russia; it has not gone anywhere; it is still building new plants, factories, shopping centers, pig complexes, and greenhouses (see Chart 1).
Only the structure of its activities has changed.The intensification of foreign capital has been particularly noticeable, although it has seemingly been dormant during the past year (see Chart 2).
Of the 59 investment projects of private business companies, taking part in this sur-vey, twenty-eight, or almost half, were initi-ated by foreign companies. According to the amount of investments announced, these twenty-eight projects total $4.7 billion out of $15.3 billion (30%). It is evident that they are less capital-intensive than other projects, which have mostly been initiated by large federal business companies. The reason is clear: foreigners invest in high-tech industries – mechanical engineering, pharmaceuticals, etc. In their countries, added value is created by developing products for the market and organizing their sales, human resources, and technology transfers from their other enterprises. The Russian national market at-tracts foreigners like a magnet! It is huge; for example, its size is comparable to the Ger-man market (see Chart 3). Nevertheless, we produce very few goods and services for final consumption; as a matter of fact, we produce almost nothing (see article “We do not Pro-duce a Thing”, in No.47, Expert, 2012). At the same time, exports of raw materials allow our country to live quite comfortably, while we
continue to consume large quantities of im-ported goods. Some foreigners tell us directly that the volume of their exports to Russia has grown so much that they had no choice but to organize production here in order to simplify logistics and eliminate at least part of the ex-tra costs, namely for transporting goods.
Whatever one may say, Russia is a breath of fresh air for foreign companies, especially European and American businesses. We have already mentioned the huge market — this is a basic prerequisite for their successful growth and development in our country. Ongoing low costs of production constitute the second key prerequisite. Although our gas and electric-ity prices have moved significantly closer to those in foreign countries (see Chart 4), the labour costs in the industrial sector still lag far behind (see Chart 5). This means that we will soon be running out of resources in competitive industries, where the impact of gas, electricity and transport prices remains high: metallurgy, fertilizers, heavy chemicals, etc. This fact, in theory, should encourage business, particu-larly private companies, to invest first in the modernization of industrial assets, which are heavily dependent on gas, electricity and trans-port prices, and then to invest in the creation of manufacturing companies with higher added value, situated far away from source locations — raw materials.
Vasiliy Lebedev
Finding the Missing Piece Our agency announced that 59 private investment projects amounting to $15.6 billion were launched in Russia from August to October, 2012. It seems that this rapid growth in investments has very much to do with the end of a turbulent election period. Foreign capital investments intensified significantly, which seems that, in the long run, it will form the basis for medium-sized industrial business companies
J
PRO
VID
ED B
Y TH
E M
ECH
EL C
OM
PAN
Y
The Elginskiy coal deposits are one of the largest in the world

31
In order to organize production with high added value, it is necessary to develop products, technologies, and professional qualifications. In our country, we have never had a wide range of consumer goods, especially complex ones. Neither did the Soviet Union nor does the new Russia. In this case, we really need the help of foreign companies with their experience and technologies.
They will thus become the missing link, which will close the production circuit. Their place lies in industries, segments, and niches targeting consumer demands. Electronics, household appliances, automobiles, cosmet-ics, pharmaceuticals, and new building materi-als — these are all fields of activity where we cannot do without foreign capital. Of course, we also cannot do without our national “home-grown” capital; however, it will probably not dominate the field, but will develop a niche largely thanks to enthusiastic people.
ElectronicsTraditionally, we start our survey of differ-ent projects with the industries that have at-tracted the maximum number of investments. We have now decided to change this rule. An extremely interesting and somewhat amaz-ing investment project – a genuine diamond -was discovered in the most high-tech sec-tor — electronics. In this case, it is not even a question of the volume of investments — about 25 billion rubles, as projects of this size, for example, in the power engineering field might be viewed as fairly common — but in their very essence. We are talking about sev-eral related plants, which were built or are still under construction in the town of Gusev, Kaliningrad Region. These plants form an integral complex, at the top of which we find high-tech production (by Russian standards) of digital receivers. These TV devices receive television signals, decode them, convert them to standard analogue signals (through a common TV tuner), and display them on the screen as a film or TV programme.
The production of these receivers is ensured by a Russian corporation called General Satel-lite. In particular, General Satellite receivers are used to receive signals from Russian tel-evision satellite operators, such as Tricolour TV and NTV+. General Satellite receivers are also sold on foreign markets. The planned volume of revenues of the General Satellite Corporation in 2012 will total about 20 billion rubles. This means that next year, it may well make the Expert-400 list of the largest Russian companies.
The factory manufacturing these receivers is located in the similarly-named technopo-lis of Gusev; it was constructed first, and now manufactures the final product. Subsequently, another plant was built to produce antennas and towers for these receivers, then a center for research and the production of microelectronic devices. Additional production facilities were then built — a small house-building plant and a cardboard factory. Total investments in this production complex amounted to about $500 million, of which two-thirds have already been invested. According to the investor’s plan, the structure of this technopolis includes not only the manufacturing area, but also accommoda-tion; a private house-building plant was needed in order to ensure that the employees and en-gineers have their own housing in the form of cottages. Taking into account housing facili-ties, the business incubator building, and the scientific and research center, investments in this project should amount to 25 billion rubles within a few years. We have always been scepti-cal of the word “innovation”, when it is applied to major Russian industrial projects, but in this case it seems to be the right word to use.
So far, all the investments have been en-tirely private. The main beneficiary of the corporation is the Saint Petersburg business-man, Andrei Tkachenko, who has had a keen interest in radio physics since the 1980s, and eventually turned his hobby into a real busi-ness. However, people in the General Satellite Company maintain that the company could not
have done without government funds. They were needed to build the next plant — for the production of printed circuit boards.
Power EngineeringThis industrial sector represents the leader of our study, accounting for five projects and $11.88 billion. This means 40% of total investments in projects, which were reviewed in our investment survey. Large sums mainly appeared thanks to the State Corporation Rosatom, which builds very capital-intensive plants.
Thus, the new Novovoronezh NPP-2 with power capacity of 2.4 GW, worth $7 billion has been under construction since 2008. Such a huge volume of capital investments is compa-rable only to that of pipeline projects carried out by Gazprom and Transneft. The commissioning of two power units is scheduled for 2014 and 2015; they will gradually replace the retiring neighbouring Novovoronezh NPP, commis-sioned nearly half a century ago.
While the power units of the new nuclear power plant in the Voronezh Region are still under construction, the last uncompleted So-viet construction project – power unit No.4 with power capacity of 1 GW – has finally been launched at the Kalinin NPP in the Tver Region. Construction began a quarter century ago, in 1986. It is true that Rosenergoatom (the operator of Russian nuclear power plants, the “granddaughter” of the State Corporation Rosatom) claims that, when construction was resumed in the mid-2000s, the plant had been completed by only 5%. In other words, most of the investments have been expended in recent years, and not at the end of the Soviet period, as it may seem to be at first glance.
Among other non-nuclear projects, we should note the construction of a major new state district power plant (GRES) in the Khanty-Mansi Autonomous District – Nyagan with de-sign power capacity of 1.25 GW. The project has been implemented by a Finnish company, For-tum, which will invest $2.14 billion. The Finns
IN V E S T MEN T S REP OR T
EX
PE
RT
.
SP
EC
IAL
IS
SU
E

32
began building the Nyagan GRES in 2008. The first of three units was first planned to be opera-tional in January 2012, and then in December 2012. The new plan projects the launch for the first quarter of 2013. This GRES is being built within the framework of so-called power sup-ply contracts, when the investor agrees before market representatives and regulators to mar-ket a certain amount of power at a defined time. If there is a delay, the investor not only loses his profits, but also has to pay an important penalty for failure to deliver on time. Fortum found itself in this situation. During his visit to the construction site this autumn, the Minister of Energy, Alexandr Novak, demanded that the first unit with power capacity of 418 MW be put into operation by the end of 2012. This did not happen, and now Fortum faces a fine totaling up to five billion rubles for failing to deliver on time, which amounts to about 25% of the unit cost. The construction of the Nya-gan GRES was planned way back in the Soviet period, but in fact, it was only started in 2008, virtually “in an open field”. Building the plant from scratch may explain the delay in construc-tion and assembly operations. However, major new thermal power plants have not been built in Russia for twenty years, and it seems that people have forgotten how to do it. Despite miti-gating circumstances, a large fine will be issued to the Finnish company. It will, so to speak, be a lesson to others.
Chemical Industry and OilProcessingIn this field, we recorded twelve projects totaling $7.4 billion (25% of total investments). Two of them are very large.The first, which is still being implemented, is the complete modernization of the Komsomolsk oil refinery plant in the Khabarovsk Krai worth $3.6 billion; it was completely neglected during the Second World War. Rosneft is in charge of the work. Modernization includes the construction of new buildings for hydrocracking, reforming, and coking, as
well as many general management facilities. As a result, petroleum processing depth will increase, whereas the quality of motor fuels will reach the “Euro-5” class level by 2016.
Another big project is being implemented by TAIF; the company is building an ethylene complex and processing industries worth $3 billion on the site of Nizhnekamskneftekhim (according to company calculations). Apparent-ly, the project will soon be in the active phase of implementation (see article “We Ourselves do not Mind”, in No.45, this year’s Expert).
Major projects naturally attract attention given their enormous scale and their impact on the course of industrial development in our country. However, smaller projects are also very interesting.
For example, the Gazprom Khimvolokno Company has built a production line for poly-ester cord fibers for $133 million at its plant in Volzhskiy, Volgograd Region. Gazprom Khim-volokno got its current name a year ago, when one of the subsidiaries of Gazprom became the controlling shareholder; before that, it was called Sibur Volga and was part of the Sibur Holding Company, and even before that period, the company used to be called the Volzhskiy Chemical Fiber Plant. Today, the plant is one of the largest in the country for the production of cord fibers used in manufacturing automo-bile tyres. This new production line will help the company to consolidate its position as a supplier to foreign tyre companies. The latter are actively building new plants in Russia: the Finnish Nokian Tyres is erecting a new plant in the Leningrad Region, the German Continental — near Kaluga, while the Japanese Yokohama — in the Lipetsk Region. Almost 100% of all polyester fibers cords had been imported into Russia before.
Two plants for paint production are being built in Saint Petersburg and the surrounding area at the same time. Both projects are being carried out by Scandinavian investors, who are, so to say, just a stone’s throw away. These projects concern the Norwegian Jotun Group
($57 million project) and the Finnish Teknos Group ($27 million). Both companies have long been active in Russia; as a matter of fact, the Finns already have a small manufacturing company here. Both companies anticipate growth in demand for their products and have therefore decided to expand. Claes Jansson Hakon, General Director of Jotun Paints (subsidiary of the Jotun Group), told Expert why the company had decided to build its own plant, “In Russia, we have already reached such a large number of sales that it is necessary to build a plant in order to meet demands (Jotun Paints earned 1.13 billion rubles in 2011 — Expert). We import most of the products from England, and that, of course, increases financial and time costs. By building a plant in Russia, we can greatly reduce the costs for transporting and storing goods, and ensure more timely deliveries. With the plant running at full capacity in 2014, we plan to take about ten percent of the Russian industrial paint market.” Generally speaking, this is quite a logical statement: transporting water-based paint from England to Russia is like making the company do the donkey work – it becomes especially extravagant when transporting large volumes of products.
Mining IndustryMining is represented by only two projects, totaling nearly $3.5 billion. Both projects concern coal mining, and have been implemented by Mechel and Stroiservis.
A special case is the project run by the Mechel Company, which is developing the huge Elginskiy coal deposit in the south-eastern part of Yakutia. Coal mining started there a year ago, but only in August this year were coal preparation plants launched, which can be considered the intermediate phase of the project. Now extracted in quarries, the coal will be enriched further and exported as a concentrate. The Elginskiy deposit fields were supposed to be developed during the Soviet period, but the authorities could not manage it in time. The deposit field is huge; until recently, it was considered one of the largest, delineated, recorded, but undevel-oped coal deposits in the world; according to JORC standards, reserves total 2.2 billion tons, of which the main part is composed of scarce coking coal. The key problem posed by the Elga deposit is its distance from any living areas and its remote location in the poorly populated Far East. The deposit is located 415 km east of Neryungri; there are no other reasonably important settlements in terms of population around Elgi. Moreover, the de-velopment of the deposit was impossible until Mechel built a railway line connecting the field to the railway station on the Ulak Baikal-Amur main line. The 320km railway line and the nearby highway cost the company about $1.25 billion. In addition, it was necessary to spend even more on a shift camp for construc-
IN V E S T MEN T S REP OR TE
XP
ER
T.
S
PE
CIA
L
ISS
UE
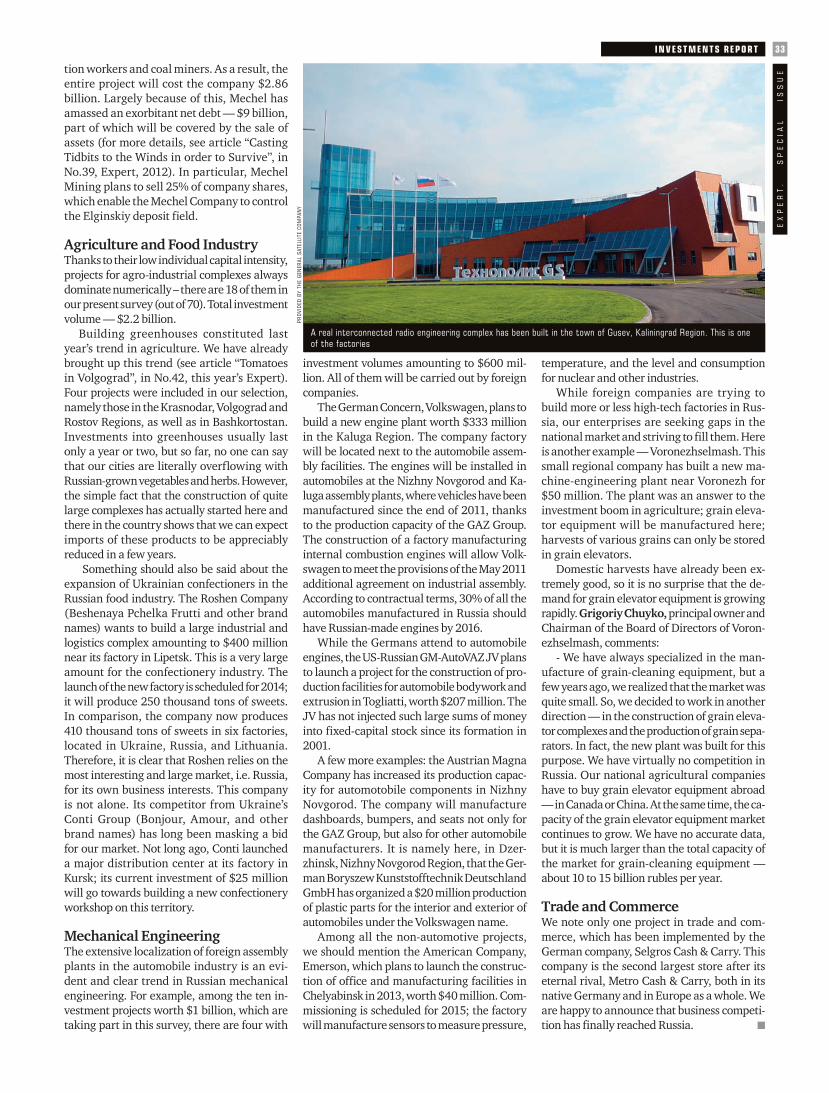
33
tion workers and coal miners. As a result, the entire project will cost the company $2.86 billion. Largely because of this, Mechel has amassed an exorbitant net debt — $9 billion, part of which will be covered by the sale of assets (for more details, see article “Casting Tidbits to the Winds in order to Survive”, in No.39, Expert, 2012). In particular, Mechel Mining plans to sell 25% of company shares, which enable the Mechel Company to control the Elginskiy deposit field.
Agriculture and Food IndustryThanks to their low individual capital intensity, projects for agro-industrial complexes always dominate numerically – there are 18 of them in our present survey (out of 70). Total investment volume — $2.2 billion.
Building greenhouses constituted last year’s trend in agriculture. We have already brought up this trend (see article “Tomatoes in Volgograd”, in No.42, this year’s Expert). Four projects were included in our selection, namely those in the Krasnodar, Volgograd and Rostov Regions, as well as in Bashkortostan. Investments into greenhouses usually last only a year or two, but so far, no one can say that our cities are literally overflowing with Russian-grown vegetables and herbs. However, the simple fact that the construction of quite large complexes has actually started here and there in the country shows that we can expect imports of these products to be appreciably reduced in a few years.
Something should also be said about the expansion of Ukrainian confectioners in the Russian food industry. The Roshen Company (Beshenaya Pchelka Frutti and other brand names) wants to build a large industrial and logistics complex amounting to $400 million near its factory in Lipetsk. This is a very large amount for the confectionery industry. The launch of the new factory is scheduled for 2014; it will produce 250 thousand tons of sweets. In comparison, the company now produces 410 thousand tons of sweets in six factories, located in Ukraine, Russia, and Lithuania. Therefore, it is clear that Roshen relies on the most interesting and large market, i.e. Russia, for its own business interests. This company is not alone. Its competitor from Ukraine’s Conti Group (Bonjour, Amour, and other brand names) has long been masking a bid for our market. Not long ago, Conti launched a major distribution center at its factory in Kursk; its current investment of $25 million will go towards building a new confectionery workshop on this territory.
Mechanical EngineeringThe extensive localization of foreign assembly plants in the automobile industry is an evi-dent and clear trend in Russian mechanical engineering. For example, among the ten in-vestment projects worth $1 billion, which are taking part in this survey, there are four with
investment volumes amounting to $600 mil-lion. All of them will be carried out by foreign companies.
The German Concern, Volkswagen, plans to build a new engine plant worth $333 million in the Kaluga Region. The company factory will be located next to the automobile assem-bly facilities. The engines will be installed in automobiles at the Nizhny Novgorod and Ka-luga assembly plants, where vehicles have been manufactured since the end of 2011, thanks to the production capacity of the GAZ Group. The construction of a factory manufacturing internal combustion engines will allow Volk-swagen to meet the provisions of the May 2011 additional agreement on industrial assembly. According to contractual terms, 30% of all the automobiles manufactured in Russia should have Russian-made engines by 2016.
While the Germans attend to automobile engines, the US-Russian GM-AutoVAZ JV plans to launch a project for the construction of pro-duction facilities for automobile bodywork and extrusion in Togliatti, worth $207 million. The JV has not injected such large sums of money into fixed-capital stock since its formation in 2001.
A few more examples: the Austrian Magna Company has increased its production capac-ity for automotobile components in Nizhny Novgorod. The company will manufacture dashboards, bumpers, and seats not only for the GAZ Group, but also for other automobile manufacturers. It is namely here, in Dzer-zhinsk, Nizhny Novgorod Region, that the Ger-man Boryszew Kunststofftechnik Deutschland GmbH has organized a $20 million production of plastic parts for the interior and exterior of automobiles under the Volkswagen name.
Among all the non-automotive projects, we should mention the American Company, Emerson, which plans to launch the construc-tion of office and manufacturing facilities in Chelyabinsk in 2013, worth $40 million. Com-missioning is scheduled for 2015; the factory will manufacture sensors to measure pressure,
temperature, and the level and consumption for nuclear and other industries.
While foreign companies are trying to build more or less high-tech factories in Rus-sia, our enterprises are seeking gaps in the national market and striving to fill them. Here is another example — Voronezhselmash. This small regional company has built a new ma-chine-engineering plant near Voronezh for $50 million. The plant was an answer to the investment boom in agriculture; grain eleva-tor equipment will be manufactured here; harvests of various grains can only be stored in grain elevators.
Domestic harvests have already been ex-tremely good, so it is no surprise that the de-mand for grain elevator equipment is growing rapidly. Grigoriy Chuyko, principal owner and Chairman of the Board of Directors of Voron-ezhselmash, comments:
- We have always specialized in the man-ufacture of grain-cleaning equipment, but a few years ago, we realized that the market was quite small. So, we decided to work in another direction — in the construction of grain eleva-tor complexes and the production of grain sepa-rators. In fact, the new plant was built for this purpose. We have virtually no competition in Russia. Our national agricultural companies have to buy grain elevator equipment abroad — in Canada or China. At the same time, the ca-pacity of the grain elevator equipment market continues to grow. We have no accurate data, but it is much larger than the total capacity of the market for grain-cleaning equipment — about 10 to 15 billion rubles per year.
Trade and CommerceWe note only one project in trade and com-merce, which has been implemented by the German company, Selgros Cash & Carry. This company is the second largest store after its eternal rival, Metro Cash & Carry, both in its native Germany and in Europe as a whole. We are happy to announce that business competi-tion has finally reached Russia. ■
IN V E S T MEN T S REP OR T
EX
PE
RT
.
SP
EC
IAL
IS
SU
E
A real interconnected radio engineering complex has been built in the town of Gusev, Kaliningrad Region. This is one of the factories
PRO
VID
ED B
Y TH
E G
ENER
AL S
ATEL
LITE
CO
MPA
NY

34 IN V E S T MEN T S REP OR TE
XP
ER
T.
S
PE
CIA
L
ISS
UE All investment projects in Russian territories (from August 1 to October 31, 2012)
No. Investment project Volume of invest-ments
(million dollars)
Type of plat-form
Region Implemen-tation
stage *
Owner Type of invest-ment
Power
1 Ethylene complex 3,000 brownfield Tatarstan 0 TAIF federal 1 million tons of ethylene2 Coal Complex 2,860 greenfield Yakutia 2 Mechel federal 27 million tons of raw
coal3 Power plant 2,139 greenfield Khanty-Mansiysk
Autonomous District1.5 Fortum with foreign
capital1,254 MW
4 Workshop for the production of HBI (hot briquetted iron)
850 brownfield Belgorod Region 0 Metalloinvest federal 1.8 million tons of HBI
5 Coal preparationcomplex
610 greenfield Kemerovo Region 2 Stroiservis regional 3.5 million tons of coal concentrate
6 Complex of radio electronics factories
500 greenfield Kaliningrad Region 1.5 General Satellite federal n/a
7 Confectionery factory and warehouse
400 greenfield Lipetsk Region 0 Roshen with foreign capital
253 thousand tons of confectionery products
8 Power block 367 brownfield Samara Region 3 KES Holding federal 235 MW
9 Sugar plant 338 greenfield Rostov Region 0 Sucden with foreign capital
1.2 million tons of sugar beet (processing)
10 Automobile engine production plant
333 greenfield Kaluga Region 0 Volkswagen with foreign capital
150 thousand engines
11 Greenhouse 333 greenfield Krasnodar Region 0 Tander federal 200 ha
12 Cement factory 333 greenfield Ryazan Region 2 Basel Cement federal 1.7 million tons of cement
13 Greenhouse 267 greenfield Volgograd Region 1 Volzhkiy Agrocomplex
regional 52 ha
14 Carbamide installation, power plant
253 brownfield Vologda Region 3 Fosagro federal 500 thousand tons of carbamide, 32 MW
15 Airport terminals 238 brownfield Krasnodar Krai 1 Basel federal 2.4 thousand passengers per hour
16 Shopping and entertainment center
233 greenfield Khanty-Mansiysk Autonomous District
3 Surgutgasstroy Construction and Finance Company
regional 154 thousand sq. m. (total surface area)
17 Workshop for automobile bodywork and extrusion
207 brownfield Samara Region 0 GM-AutoVAZ with foreign capital
n/a
18 Plant for the production of refined sugar
163 greenfield Kaliningrad Region 0 ARVI&CO with foreign capital
180 thousand tons of sugar
19 Shopping and entertainment center
133 greenfield Bryansk Region 1 Grinn Corporation federal 170 thousand sq. m. (total surface area)
20 Plant for the production of medium-density fiberboard (MDF)
133 brownfield Tomsk Region 0 Tomlesdrev regional 300 thousand sq. m. of MDF
21 Accumulator factory 107 brownfield Kaluga Region 0 Farmakom MB with foreign capital
5 million accumulators
22 Pharmaceutical plant 100 greenfield Yaroslavl Region 3 Takeda Pharmaceuticals
with foreign capital
2 million ampoules and vials, 2 billion tablets
23 Pig complex (second phase) 100 brownfield Kaliningrad Region 3 Russia Baltic Pork Invest ASA
with foreign capital
n/a
24 Pig complex 93 greenfield Kursk Region 3 Agrokomplek-tatsiya
federal 10 thousand tons of pork
25 Dairy farm 80 greenfield Penza Region 1 Russkaya Molochnaya Kompaniya (Russian Dairy Company)
federal 46 thousand tons of milk
26 Shopping and entertainment center
80 greenfield Orel Region 3 Tashir federal 40 thousand sq. m. (total surface area)
27 Two air-separation facilities 80 brownfield Nizhny Novgorod Region
0 Linde Gas with foreign capital
400 thousand tons of oxygen, nitrogen, and argon
28 Greenhouse 70 greenfield Rostov Region 1.5 Fabrika Ovoshchey Management Company (Vegetable Factory)
federal 16 ha
29 Mini TPP (thermal power plant)
70 brownfield Kurgan Region 0 Intertekhelektor GC
federal 25 MW, 40 Gcal /hr
30 Production lines for dairy products
70 brownfield Krasnodar Krai 3 Danone with foreign capital
120 thousand tons of dairy products
31 Greenhouse 67 greenfield Bashkortostan 1.5 Tiulpan KFK regional 3 ha32 Chemical plant 63 greenfield Tatarstan 0 3М with foreign
capital 6 million liters of liquid corrosion protective coating, 180 million sq. m. of adhesive tape
33 Plant for the production of industrial gases
60 greenfield Nizhny Novgorod Region
1.5 Air Liquide with foreign capital
120 thousand tons of oxygen
34 Shop for the production of automobile components
57 brownfield Nizhny Novgorod Region
1 Magna International
with foreign capital
n/a
35 Plant for the production of paints and varnishes
57 greenfield Leningrad Region 1 Jotun Group with foreign capital
12 million liters of paints, 3.6 thousandtons of powdercoating
36 Autoclaved aerated concrete plant
53 greenfield Krasnodar Krai 2 Basel federal 420 thousand cu. m. ofAAC
37 Plant for the production of grain elevator equipment
50 greenfield Voronezh Region 3 Voronezhselmash regional equipment for 500 thousandtons of total storage capacity

IN V E S T MEN T S REP OR T 35
EX
PE
RT
.
SP
EC
IAL
IS
SU
EAll investment projects in Russian territories (from August 1 to October 31, 2012)No. Investment project Volume of
invest-ments
(million dol-lars)
Type of plat-form
Region Implemen-tation
stage *
Owner Type of investment Power
38 Workshop for the production of soft roofing tiles
50 brownfield Ryazan Region 0 Tekhno Nikol JV and ChovA
with foreign capital 30 million sq. m. of roofing tiles
39 Shoe factory 47 greenfield Karachay-Cherkessia
0 Obuv Rossiyi federal 1 million pairs of shoes
40 Complex for the production and processing of turkey meat
43 greenfield Stavropol Krai 1 Agro-Plus regional 10 thousand tons of turkey meat
41 Shopping center 43 greenfield Rostov Region 1.5 Selgros Cash & Carry
with foreign capital 12 thousand sq. m. (total surface area)
42 Facilities for processing coal tar
40 brownfield Vologda Region 1.5 Rutgers and Severstal JV
with foreign capital n/a
43 Assembly line for railway bearings
40 brownfield Saratov Region 3 JV YePK and Brenko
with foreign capital 300 thousand bearings
44 Production line for hard cheese with rennet
40 brownfield Bashkortostan 3 Neral GC regional 200 thousand tons of milk (processing)
45 Plant for the production of sensors
40 greenfield Chelyabinsk Region 0 Emerson with foreign capital n/a
46 Production line for chairs 40 brownfield Kirov Region 0 IKEA with foreign capital 2.5 million chairs 47 Pig complex 36 greenfield Krasnoyarsk Krai 1.5 Sangilen+ regional 1.5 thousand tons of
pork48 Production line for small
and medium car castings34 brownfield Altai Krai 1.5 Sibirskiy Delovoy
Soyuz Holding Company (Siberia Business Union)
federal n/a
49 Pharmaceutical plant 33 brownfield Irkutsk Region 1.5 Pharmasintez with foreign capital n/a
50 Factory for the production of power line towers
31 brownfield Novosibirsk Region 0 Transkomplek-tenergo and Domodedovo Metal Construction and Design Factory JV
regional 26 thousand polyhedral power line towers
51 Confectionery workshop 29 brownfield Kursk Region 1.5 Conti Group with foreign capital n/a 52 Pig breeding center 27 greenfield Ulyanovsk Region 0 Agro-Invest regional n/a
53 Shopping center 27 greenfield Irkutsk Region 2 Metro Cash & Carry
with foreign capital 12 thousand sq. m. (total surface area)
54 Plant for the production of paints and varnishes
27 greenfield Saint Petersburg 0 Teknos Group OY with foreign capital 15 thousand tons of liquid paint and powder coating
55 Plant for the production of packaging film
27 greenfield Kaluga Region 3 AB Rani Plast OY with foreign capital 8 thousand tons of film
56 Plant for the production of salad products
26 greenfield Tatarstan 3 Belaya Dacha GC federal 12 thousand tons of salads
57 Dairy farm 23 greenfield Sverdlovsk Region 1.5 Sinara Group federal 1.2 thousand dairy cows
58 Automobile component plant 20 greenfield Nizhny Novgorod Region
1 Boryszew Kunststofftechnik Deutschland GmbH
with foreign capital n/a
59 Plant for the production of melamine films
17 brownfield Tyumen Region 1.5 Schattdecor with foreign capital 40 million sq. m. of film
Infrastructure and/or Government Investment Projects1 Nuclear power plant 7,000 greenfield Voronezh Region 1.5 Rosatom federal 2,400 MW2 Complete modernization of
oil refineries3,600 brownfield Khabarovsk Krai 1.5 Rosneft federal 6.3 million tons of light
petroleum products3 NPP power unit 2,300 brownfield Tver Region 3 Rosatom federal 1,000 MW4 Railway line to the airport 367 brownfield Tatarstan 1.5 Russian Railways federal n/a 5 Workshop for the
production of medium-diameter pipes for the oil and gas industry
333 brownfield Kostroma Region 1 Gaspromtrub-invest
federal 350 thousand tons of pipes
6 Locomotive depot 212 brownfield Novosibirsk Region 1.5 Russian Railways federal n/a
7 Production line for polyester cord fibers
133 brownfield Volgograd Region 3 Gaspromkhim-volokno
federal 30 million linear and cord fibers
8 Airport fueling facilities 117 brownfield Primorskiy Krai 3 Rosneft federal 130 thousand tons of aviation kerosene
9 Production site for rolled rings
83 brownfield Sverdlovsk Region 1 VSMPO-Avisma federal n/a
10 Airport terminal 67 brownfield Tatarstan 3 Tatarstan Government and Bulgarian Aviation Group JV
with foreign capital 1.2 million passengers
11 Workshop for the thermal processing of small parts
27 brownfield Udmurtia 3 Moscow Institute of Thermal Technology
federal n/a
* 0 - invoice statement of intent, 1 - construction actually launched, 1.5 - ongoing investment construction, 2 - completed construction, 3 – Production start-up.Source: Expert, on the basis of the Interfax Agency and Prime-TASS

ussian regions are focusing more and more on the creation of industrial parks. There are now 55 of them at the design and construction stage. Ninety more sites have been targeted by
regional authorities and private developers.Industrial parks appeared in Russia eight years ago, and today they number close to two hundred. However, according to information provided by the Association of Industrial Parks in Russia, only 41 of them are actually in operation, and not even one of these is totally consistent with the standards of an industrial park in the western sense.In North America and Western Europe, a dozen or even more industrial parks of different sizes and specializations are located close to larger or smaller cities. Russia has no other alternative - we will certainly follow the same path because it is the only way you can effectively organize the production of “a large quantity of useful things” as expressed by Ilya Shpurov, President and co-owner of the Inpark Group of companies, which is
in charge of developing industrial parks in the Yaroslavl Region and in Krasnoyarka. “Industrial parks play an important role all over the world today, especially in economies that are similar to Russia’s. Their effectiveness will depend only on the extent of their popularity in Russia, and whether they will be supported by the federal and regional authorities.” said Shpurov. “But, you can also do many useful things even without having any support.”
State Assistance:Two Points of ViewIlya Shpurov has every right to say that one can do without support. During the eight years that have passed since the first industrial park was created in Pereslavl-Zalessky, the Inpark Company managed to do a great job: they studied the development experience of such parks in dozens of countries around the world, made presentations on each company’s possibilities to provide required facilities for potential residents, participated in
conferences and meetings with investors, and created a call center in India, which was responsible for calling up potential investors. Moreover, Inpark explored the market of imported goods, made a list of manufacturing companies, which might be interested in locating their production sites in Russia, and then proceeded to contact them.The result of this hard work is impressive. Now, Inpark industrial parks cover about two thousand square kilometers, and platforms measuring more than 500 thousand square meters are ready to be used. They have been leased or bought by more than one hundred and fifty residents. The company is a leader regarding the number of attracted residents. Five to six companies are added to the list of residents every year, except during the economic crisis of the past years. The value of Inpark’s assets exceeds $200 million US, while revenues earned by the management company reached $40.5 million US last year.For the last two years, Inpark has been exploring another field, and has created three venture capital firms. At the moment,
INDUS T RI A L PA RKS36
Alexander Sychev
New Industrial ParksToday, industrial parks in Russia are developing thanks to local initiatives. Private business companies have realized that parks can offer a large scope for investments, whereas regional authorities see them as a means to attract foreign investments
ЭКСП
ЕРТ
№ 3
7 28
СЕН
ТЯБР
Я –
4 ОК
ТЯБР
Я 20
09ЭК
СПЕР
Т №
37
28 С
ЕНТЯ
БРЯ
– 4
ОКТЯ
БРЯ
2009
ЭКСП
ЕРТ
№ 3
7 28
СЕН
ТЯБР
Я –
4 ОК
ТЯБР
Я 20
09ЭК
СПЕР
Т №
37
28 С
ЕНТЯ
БРЯ
– 4
ОКТЯ
БРЯ
2009
EX
PE
RT
.
SP
EC
IAL
IS
SU
E
R
Russian regions are focusing more and more on the creation of industrial parks. There are now 55 of them at the design and construction stage. Ninety more sites have been targeted by regional authorities and private developers
TREN
D/P
HO
TOXP
RES
S.R
U

their revenues are not overwhelming, ranging from $500 thousand to $1 million US per year, which is much lower than the income of other industrial park residents. However, no one intends to give up these new business ventures in Inpark, as everyone believes that one day they will “skyrocket”.When Ilya Shpurov began developing the industrial park in Pereslavl-Zalessky, he admitted that “no one bothered him.” “In general, it was an inter-company transaction; everything belonged to us. We just put all the superfluous non-industrial assets out of business, and bought up all the surrounding land plots.” explains Shpurov. “It was necessary to create a large pool of land that could be developed over several decades. In those days, the municipal authorities
were puzzled by only one thing: “Why are you doing this?” they asked. Apart from that, the former municipal administration was completely indifferent to our project.”But, although Shpurov generally believes that if a person starts moving along on his own, and things will eventually work out, he himself does not shy away from outside help. “We and our customers turned to the regional administration for assistance, which was stipulated by law, and we got it.” he says. “But, of course, it’s most important for the government to take an overall interest in the partnership, and promote the companies that are being localized in their industrial parks.”Adept followers of the philosophy that the state should be the main organizer of a person’s living space believe that this view
should be consistently applied to industrial parks. “Support should be provided by the government at all levels.” states Alfred Stohler with conviction, Chairman of the Swiss company Dega AG. “But, the other fundamental question is how this support should be expressed…”
The project to create the industrial park — Dega Cluster Noginsk, which is con-sidered the closest park meeting western standards, was launched in 2006. From the very beginning, it was conceived as a platform for placing industrial branches of western companies in Russia. However, the difficulty in obtaining suitable indus-trial land plots, and contending with hun-dreds of administrative bodies, where each step must be justified, forced many west-
INDUS T RI A L PA RKS 37
EX
PE
RT
.
SP
EC
IAL
IS
SU
E

38E
XP
ER
T.
S
PE
CIA
L
ISS
UE
INDUS T RI A L PA RKS
List of Industrial Parks in the Russian Federation as of November, 2012No. item/
itemConstituent subject of the
Russian FederationName of industrial park Status of industrial park Type of industrial park Type of ownership
1 Altay Kray Novoaltaysk Projected Brownfield State owned 2 Astrakhan Region Zaboldinskiy Projected Greenfield Privately owned3 Republic of Bashkortostan Stroitelnye Materialy
BashkortostanaOperational Brownfield Privately owned
Salavat Projected Brownfield Privately ownedSigma Operational Greenfield Privately owned
4 Belgorod Region Severny Operational Greenfield PPP 5 Vladimir Region Strunino Operational Greendield Privately owned
V-Park Projected Greenfield Privately ownedVyazniki Projected Greenfield Privately owned
6 Volgograd Region Volgograd Operational Brownfield Privately ownedNikokhim Projected Brownfield Privately owned
7 Vologda Region Sheksna Operational Greenfield State owned Sokol Projected Greenfield State owned
8 Voronezh Region Maslovskiy Operational Greenfield State owned Perspective Operational Greenfield Privately owned
9 Trans-Baikal Kray Industrial Park Mogoytuy Projected Greenfield PPP 10 Ivanovo Region Rodinki Operational Brownfield PPP 11 Irkutsk Region Angarskiy Operational Brownfield Privately owned12 Kaliningrad Region Neuhausen Projected Greenfield PPP
Baltic Industrial Park Operational Greenfield Privately owned13 Kaluga Region Vorsino Operational Greenfield State owned
Grabtsevo Operational Greenfield State owned Kaluga-Yug Operational Greenfield State owned I-Park Lemminkyaynen Operational Greenfield Privately ownedRosva Operational Greenfield Privately ownedKaluga-Detchino Operational Greenfield Privately owned
14 Republic of Karachay-Cherkessia
Agro-Industrial Park Projected Greenfield State owned
15 Kirov Region Vyatskie Polyany Projected Greenfield State owned Slobodino Projected Greenfield State owned
16 Krasnodar Kray Krasnodar Industrial Zone Projected Greenfield State owned 17 Leningrad Region Greenstate Gorelovo Operational Greenfield Privately owned
Marienburg Operational Greenfield Privately ownedMaryino Operational Greenfield Privately ownedPrinevskiy Projected Greenfield Privately ownedDoni-Verevo Projected Greenfield Privately ownedKirovskiy Projected Greenfield State owned Ust-Luga Projected Greenfield PPP Utkina Zavod-2 Projected Greenfield Privately ownedFedorovskoe Projected Greenfield Privately owned
18 Lipetsk Region Gryazinskiy Operational Brownfield Privately ownedKuznetskaya Sloboda Operational Brownfield Privately ownedLipetsk SEZ (Special Economic Zone)
Operational Greenfield State owned
19 Moscow Region Ozery Operational Brownfield Privately ownedShchelkovskiy Operational Brownfield Privately ownedProminvest Operational Brownfield Privately ownedElectrostal Operational Brownfield Privately ownedDega Cluster Noginsk Operational Greenfield Privately ownedStupino (Komstrin) Operational Greenfield Privately ownedМ4 (Zagpro) Operational Greenfield Privately ownedYuzhnye Vrata Operational Greenfield Privately ownedIndigo Projected Greenfield Privately ownedKotovo Projected Greenfield Privately ownedPapivino Projected Greenfield Privately ownedStupino-2 Projected Greenfield Privately ownedKoledino Projected Greenfield Privately ownedDomodedovo, Vidnoe
Projected Greenfield Privately owned
Kuzhminskoe, Velyaminovo Projected Greenfield Privately ownedBLMZ (Balashikha Casting-Mechanical Plant)
Projected Brownfield Privately owned
20 Nizhny Novgorod Region Oka-Polymer Projected Brownfield Privately ownedNizhny Novgorod Region Volzhskiy Operational Greenfield Privately owned
21 Novosibirsk Region Industrial and Logistics Park Tolmachevo
Operational Greenfield State owned
22 Orlov Region Orel Operational Brownfield Privately ownedZelenaya Roshcha Projected Greenfield State owned
23 Perm Kray Morion Projected Brownfield Privately ownedOsentsy Projected Brownfield Privately ownedKrasny (RED) Projected Greenfield Privately owned
24 Pskov Region Pskov SEZ (Special Economic Zone)
Projected Greenfield State owned
Stupnikovo Projected Greenfield State owned 25 Republic of Tatarstan Kama Industrial Park Master Operational Brownfield Privately owned
Technopolis Khimgrad Operational Brownfield PPP

INDUS T RI A L PA RKS 39
EX
PE
RT
.
SP
EC
IAL
IS
SU
E
ern companies to try to find another way to speed up the process and reduce risks.The industrial park and the management company of Park Noginsk LLC became a means to the end. It offers a package of services that includes assistance in ac-quiring land plots, ensuring connections to network communications, provid-ing maintenance and repairs of common infrastructure, water supply, sewage systems, security, cleaning, outsourc-ing technical staff, transfers, etc. A retail area has also been established in the park.Since the Noginsk Industrial Park was created in the greenfield format, that is, “in an open field”, the land is sold with installed communications, and the utilities are included in the services pro-vided by the management company.Mr. Stohler believes that the park will have a competitive advantage thanks to its own largely autonomous infrastructure, which will be required to operate industrial facili-ties, and primarily it will have its own TPP, operating on gas turbine equipment made in Switzerland. The current capacity of the TPP station is 30 MW, but it can easily be doubled. In particular, the actual presence of this TPP became a key factor for the Meg-afon Company when it decided to establish its data center in the industrial park.
Today, there are twenty-two, mostly west-ern companies, operating in the Noginsk Park (Ilya Shpurov has only 10% foreigners working in his area), including Bayer AG,
the Metro Group, Meffert AG, Peri GmbH, Hübner GmbH, Roto Frank AG, and TTS Tooltechnic Systems. Total investments are estimated at 1 billion EUR, and the largest facilities, worth up to 175 million euros, are owned by the Swedish company - Oriflame.“Today, our problems are very different from those that we had to face in the be-ginning. Over recent years, the attitude of the authorities has changed significantly. It is obvious that in Russia more attention is being paid to developing industrial parks and attracting investors. The authorities are now more open to dialogue. So, at the fore-front today, we are faced with the problem of financing different projects. Many finan-cial instruments, which are used extensively in the West, have yet to be implemented in Russia. In particular, for quite some time now, we’ve been searching unsuccessfully for an investor, who would be willing to implement projects under the built-to-suit-to-lease scheme — i.e., the construction of facilities that can be leased by a specific cli-ent.” says Alfred Stohler.
Capital and Regulatory FrameworkThanks to systemic targeted policies, it should be easier to stimulate the growth and development of industrial parks in Russia. In China, where not only incentives for stimulating industrial policy have been implemented, but also a powerful State Development Corporation called Fakel
has been functioning with great success (something akin to our Special Economic Zone OJSC, which has enabled about 400 industrial parks to be created in 40-50 years). In the course of eight years and without any support, only about four dozen of such parks are currently operating in our country. This pace might not be too bad when considering such unequal starting conditions. However, the smallest park in China is equal to the biggest one in our country. Ilya Shpurov is absolutely right when he argues that entrepreneurial spirit and energy are the main drivers of development.And yet, how do private developers of industrial parks in Russia see the possible involvement of the State? Alfred Stohler believes that the government should work out mutually beneficial forms of cooperation with real business companies and professional developers, assist in matters related to land planning, and collaborate in the development of transport and social infrastructures. But, the realization of actual projects should be in the hands of business companies, which understand the scope of investments and cost recovery, and will be able to make the project really viable.
Denis Zhuravskiy, Executive Director of the Association of Industrial Parks of Russia, believes that the lack of uniform federal legis-lation has led to chaos in developing local reg-ulations and policies, and that systemic sup-port for the industry sector is badly needed.“I don’t think that we need to bring out
List of Industrial Parks in the Russian Federation as of November, 2012No. item/
itemConstituent subject of the
Russian FederationName of industrial park Status of industrial park Type of industrial park Type of ownership
Alabuga SEZ (Special Economic Zone)
Operational Greenfield State owned
Agro-Industrial Park Projected Greenfield State owned Kanskie Polyany Projected Greenfield Privately ownedChistopol Projected Greenfield State owned
26 Rostov Region Azovskiy Industrial Park Projected Greenfield State owned Krasnosulinskiy Industrial Park
Projected Greenfield State owned
Novoalexandrovskiy Industrial Park
Projected Greenfield State owned
Oktyabrskiy Industrial Park Projected Greenfield State owned 27 Ryazan Region Dega Ryazan Projected Greenfield Privately owned28 Samara Region Togliatti SEZ (Special
Economic Zone) Projected Brownfield State owned
29 Saratov Region Spetsauto Projected Brownfield Privately ownedAnisovskiy Projected Greenfield Privately owned
30 Sverdlovsk Region Khimicheskiy Park Tagil Operational Brownfield Privately ownedTitanovaya Dolina SEZ (Special Economic Zone)
Projected Greenfield State owned
31 Stavropol Kray Nevinnomyssk Operational Greenfield State owned RIP Pharmaceuticals Projected Greenfield State owned Budennovskiy Industrial Park Projected Greenfield State owned
32 Tver Region Udomlya Projected Greenfield Privately ownedBorovlevo Projected Greenfield State owned Dve Bashni Projected Greenfield State owned Raslovo Projected Greenfield State owned
33 Ulyanovsk Region DAAZ (Dimitrovgrad Automobile Unit Plant)
Projected Brownfield State owned
Zavolzhye Operational Greenfield State owned Novoulyanovsk Projected Greenfield State owned
34 Yaroslavl Region Tutaev Projected Brownfield State owned Novoselki
Operational Greenfield State owned

40E
XP
ER
T.
S
PE
CIA
L
ISS
UE
INDUS T RI A L PA RKS
never-ending or additional laws.” maintains Ilya Shpurov. “We have so many laws, but they offer very few benefits.” However, he also agrees that we do not devote enough attention to industrial parks. “Our reality cannot be compared with any other in any other country!” says Shpurov. “The prob-lem is that our regions and the govern-ment should systematically address the issue of growth and development. They should take real actions to stimulate pro-duction, as well as qualitative and scien-tific growth. Capital will provide the real means to stimulate business in all cases.”Indeed, targeted assistance from the fed-eral budget has only just begun, but actual volumes are still rather small. Moreover, the sluggishness of the federal authorities with respect to industrial parks can prob-ably be explained by the fact that the As-sociation of Industrial Parks has only re-cently developed specific standards and certified all the sites. The government now has an idea of the subject matter, so it is high time to define specific rules.So far, indifference at the federal level has been compensated by regional authorities, who are literally competing with each other
in rule-making, developing a system of ben-efits, subsidies, and preferences. Of course, they are engaged in these matters in keep-ing with their own notions of attractiveness and ideas on how to run industrial parks and which residents should be given pref-erence. It is clear that preference was given to such companies as Volkswagen, Volvo, and Samsung Electronics, whose arrival in the Kaluga Region five years ago brought in more than $5 billion US of foreign invest-ments and just as many Russian ones, too. In a short period of time, a poor and little-known subsidized region of Russia man-aged to reach a level of self-sufficiency. More than twenty companies supplying spare parts for assembly lines localized their pro-duction around automobile corporations.Kaluga is envied by everyone; all the gover-nors dream of recreating the experience of this particular region. This is understand-able. Governors are required to provide performance indicators, and the arrival of a large investor in a region may mean large and rapid growth of many social and eco-nomic markers, which will enable the local authorities to produce outstanding reports. Therefore, many regions even provide spe-
cial incentives for investors whose projects exceed several million dollars.
Expectations of catching the “big fish” naturally contributed to creating a market for industrial parks (this applies to those that are created through regional budg-ets), many of which focus on one solid and reputed investor. And, some experts even say that there is some overproduction in the segment reserved for giant players. However, we continue to search for the optimal approach to creating industrial parks. It is difficult, but progress is unde-niable. In the beginning, regional authori-ties often proposed agricultural fields, overgrown with weeds, to investors, and thought that this would satisfy everyone. But, today, they provide services for legal land registration, conduct engineering preparations on the sites, and even build manufacturing plants on demand. In the Trans-Baikal Industrial Park Mogoytuy, for example, two industrial manufactur-ing facilities, measuring one thousand and three thousand square meters respectively, a roadside warehouse complex, a Customs post, and quite large energy management utilities are ready to be put into operation.There have also been many changes in ideas regarding the responsibil-ity of developers, forms of collabora-tion between government and business, and the meaning of “attractiveness”.But, it is still too early to believe that some kind of standard for attracting investments has been actually drawn up for the regions - the differences are significant and it is the duty of the federal government to provide a common denominator for everyone. In some regions, authorities have introduced reduced rates for leasing land for invest-ment projects. At the beginning of the year, the government of the Yaroslavl Region an-nounced that they were ready to grant free land plots for the construction of industrial plants. In some regions, authorities have introduced tax holidays of up to ten years from the start of each project; in others, they have only lowered rates, sometimes linking them to the volume of total investments. The Ivanovo Region has introduced a law on property taxes, thus providing significant benefits.
The most powerful move was made by the Stavropol Region in 2009. Regional authorities adopted a special law No. 98 “On regional, industrial, tourism and recreation, and technological parks.” It spelled out the basic objectives, prin-ciples, and conditions for the creation of parks, the mechanisms for manag-ing and controlling their activities, and the legal basis for government support.Then, Maxim Kletin, First Deputy Mayor of the Stavropol Administration, who partici-pated actively in drafting the law, and is
The first industrial park, the Trafford Park in Manchester (Great Britain), was founded by Ernest Hooley in 1896,. He purchased ten hectares of land along the Manchester sea channel, established engineering and transport infrastructures, and began to lease operational land plots to industrial companies, and started selling them later. Henry Ford built his first European automobile plant in Trafford Park in 1910. In just ten years, more than 300 American companies were operating on the grounds. At present, the park is still operational. Industrial parks have been spreading all across the U.S. and Europe since the beginning of the 20th century, gravitating towards major cities, transportation hubs and port areas. ■
The Trafford Park in Manchester — the oldest industrial park in the world
LEG
ION
-MED
IA

INDUS T RI A L PA RKS 41
EX
PE
RT
.
SP
EC
IAL
IS
SU
Enow the Minister of Economy and Foreign Economic Relations of the Volgograd Re-gion, commented: “We had to understand and identify the term - resident of an in-dustrial park — so that this status auto-matically entailed the application of tax benefits. It turns out that the mechanisms for support were not blurred as they were not spread over numerous regulations. The model became clear thanks to the law. It was consolidated by legislation, which is very important in Russia. Moreover, this law is binding in the territory — in order to obtain resident status, the company must be registered in the industrial park or the municipality so that the taxes should be de-posited in the local and regional budgets.”In the neighboring Rostov Region, inves-tors still have to deal with several different laws at once — “On investments in the Ros-tov Region”, “On economic development zones in the Rostov Region”, and “On the framework of public-private partnerships”. These regulations do not specify which investor is considered a resident of the park and what territory can be used as an indus-trial park. The resident of the industrial park is viewed as one of the many other investors.
Thus, by promulgating one law, the Stav-ropol Krai repeatedly reduced bureaucratic paperwork and increased the attractiveness of the territory. “It took only a month be-tween the introduction and the conclusion of agreements to settle the issue related to granting the status of a resident of the in-dustrial park,” said Alexey Somov, General Director of Lissant-Yug CJSC. (Lissant is a Saint Petersburg company, which manu-factures ventilation systems and is also en-gaged in construction work - Expert). “Our project was examined in one week and didn’t cost us anything. We were going to implement another project in the Nevin-nomysskiy Industrial Park — the produc-tion of sandwich panels for construction, with a volume of investments amounting to 500 million rubles — located in the Kras-nodar Krai. We bought a ventilation plant in Armavir; I also conducted negotiations there on the allocation of sandwich panel production. But, the bureaucratic obstacles were enormous. Everyone wanted money, but at the same time, they refused to do anything. I had to pay for all the permits, and when I finally refused to implement the project, no one even bothered to ask me why... In Armavir, they told me to pay three million rubles a year for the land. In Nevinnomyssk, I’ll be paying 26 thousand rubles every year for five years; so, I save 15 million over five years only on leases. I estimate that the overall savings on my project will come to about a million dollars.”In addition, last year the Stavropol Krai managed to obtain grants from the feder-
al budget as support funds for small and medium-sized businesses. One grant was allocated to Lissant-Yug, and the second went to the Stavstal Company, which is building a metallurgical mini-plant worth 4.7 billion rubles in the Nevinnomysskiy In-dustrial Park. The enterprise will produce building bars. “We have already received 25 hectares; the land has been leased for five years — this corresponds to the con-struction period - with a guarantee that in the future, the agreement will be extended for twenty years,” said Hasan Hasanov, the main shareholder of the company. “A re-duced leasing rate was set; we’ll be paying only 80 thousand rubles for one year. We are exempt from property taxes, and part of the income tax. We calculated how much the company will save on benefits. Running at full capacity, we’ll save about 100 million a year. That doesn’t include free connections to power supplies.
Low Level of Culture and High CostsRegional policies in the field of industrial parks have recently been moving more and more from reliance on large investors as authorities have come to realize that there are not so many of them in this world and they are not easy to obtain, but the demand for space in industrial parks on the part of local business communities, especial ly smal l- and middle-sized companies, have not been satisf ied. Today, only 29% of ready production facilities are being exploited in existing industrial parks. The real reasons - the initial huge and expensive entrance fee for small companies. According to Andrey Nazarov, General Director of the Start Development Management Company, the cost for developing a site in the park varies from $35 to 60 US per square meter of land, whereas a fully prepared section in a growing park would cost about $230 US. And this does not include other expenses. In the Tolmachevo Industrial and Logistics Park, a unified cost for land acquisition has been established for all investors — five million rubles per hectare; the lease amounts to 500 thousand rubles a year.
This includes the cost for connecting the plant to different infrastructures.“According to our foreign partners,” says Viktor Zaglumin, Head of the Department of Professional Services at Bright Rich. “The final budget for project localization of our production in Russia will be roughly 30-40 percent more expensive than in other BRICS states.” “As our prepared sites are usually very expensive compared to those in other countries, the option, when foreign companies prepare their own site on their own within two to four years, will often cost them less, although it is fraught with legal and timing risks!” adds Natalia Wilke, Director of the Beiten Burkhard representative office in Saint Petersburg.
It is possible that when the parks are put into operation (they are now at the stage of design and construction, and there are more than 100 of them), the rental and buy-out prices will decline. Industrial parks are un-deniable channels to stimulate the develop-ment of industry and attract investments, and consequently, they will be created and built, with state support or without it. Throughout the world, such parks are be-ing used to stimulate the economy. China is not even able to digest all the capital raised in these parks; the country’s econo-my is overheated and needs to slow down.“We need real investment resources,” says Ilya Shpurov. “Our ruling elite, whose opinions were publicly expressed by Alexey Kudrin, has become stubbornly prejudiced against invest-ing in the economy. They are easy to under-stand: the country has sought to stimulate the economy through massive investments in the industrial sector, and each time it has ended in failure. However, there are ways and means to avoid such unfortunate consequences due to investments. We need to finance leasing companies; they have the means to control the property and exploit it rationally. This will re-duce leasing costs and bring in more offers for equipment to the industries. And of course, they will be completely responsible as ben-eficiaries for the money and equipment that they received. One can think of many other different ways to expand offers of investment resources to the real sector. We just need the will to get it done!” ■
The average size of a typical Russian industrial park is about 255 hectares, but about a dozen of them have an area of more than 1,000 hectares. Regional authorities are mainly engaged in creating industrial parks from scratch — the so-called greenfield projects. Twelve of the 27 existing greenfield parks were built by government authorities, and the remaining by private developers. Among parks, organized on sites with existing facilities (brownfield parks), there are two state parks, and twelve parks are private. In relation to projected parks, the ratio is the following: 25:19 and 4:7, respectively. Industrial parks can be universal, i.e., companies are not tied to one technological chain, but they can also be specialized. The latter are formed mainly around anchor tenants engaged in the production of complex end products. Thirty thousand small enterprises operate in the Toyota Industrial Park in Japan. The park around our KamAZ Company has about 150. Many ecological industrial parks have sprung up in the West in the last twenty years. They differ in that they tend to involve companies linked both by technology and resources, which allows them to achieve excellent economic results while reducing environmental impacts. ■


we nt y ye a r s a f te r t he collapse of the Soviet Union represents quite a long period, but changes, which appeared during this time, do not always catch the eye.
However, multi-volume reports issued by Rosstat (Federal State Statistics Service) do not have to be studied in depth in order to evaluate the scale of work that has been accomplished; giving a number of examples will be suffi cient for this purpose.
Farewell to MartinThe Russian iron & steel industry is one of the leading sectors in terms of modernization and technical re-equip-ment. More than RUB 1.2 trillion (over USD 695 billion during the three post-
E XPERT–400E
XP
ER
T.
S
PE
CIA
L
ISS
UE
44
Dmitry Mindich
Our Source of Pride: a New EconomyMore than USD 2.5 trillion has been invested in the Russian economy during the post-Soviet period. One can dispute
the efficiency ratio of these investments, but it is definitely not equal to zero. Without getting into discussions about
modernization, several sectors have already been updated and new sectors have been formed
T
Investments in modernizing iron & steel industries resulted in the implementation of megaprojects, such as the construction of rolling mills-5000, which enabled our country to set up factories and plants producing large diameter pipes that had been imported in the past.
RIA
NO
VOST
I
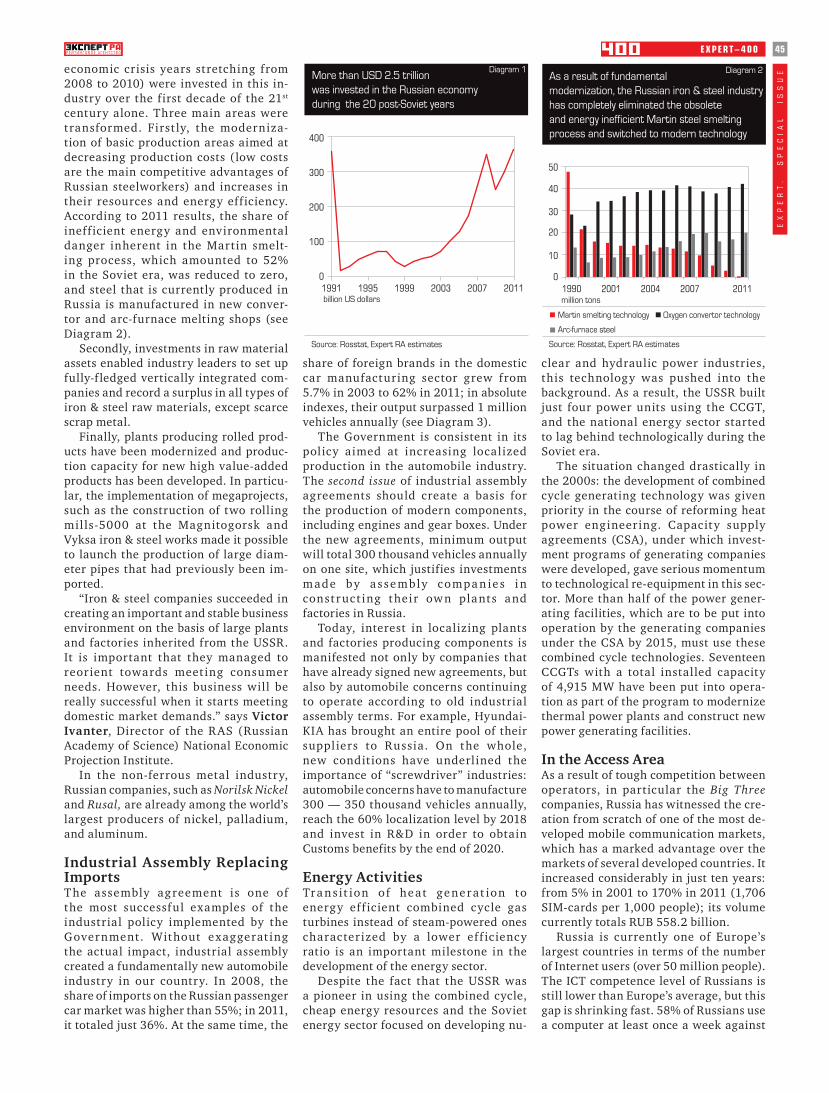
E XPERT–400
EX
PE
RT
.
SP
EC
IA
L
IS
SU
Eeconomic crisis years stretching from 2008 to 2010) were invested in this in-dustry over the first decade of the 21st century alone. Three main areas were transformed. Firstly, the moderniza-tion of basic production areas aimed at decreasing production costs (low costs are the main competitive advantages of Russian steelworkers) and increases in their resources and energy efficiency. According to 2011 results, the share of inefficient energy and environmental danger inherent in the Martin smelt-ing process, which amounted to 52% in the Soviet era, was reduced to zero, and steel that is currently produced in Russia is manufactured in new conver-tor and arc-furnace melting shops (see Diagram 2).
Secondly, investments in raw material assets enabled industry leaders to set up fully-f ledged vertically integrated com-panies and record a surplus in all types of iron & steel raw materials, except scarce scrap metal.
Finally, plants producing rolled prod-ucts have been modernized and produc-tion capacity for new high value-added products has been developed. In particu-lar, the implementation of megaprojects, such as the construction of two rolling mills-5000 at the Magnitogorsk and Vyksa iron & steel works made it possible to launch the production of large diam-eter pipes that had previously been im-ported.
“Iron & steel companies succeeded in creating an important and stable business environment on the basis of large plants and factories inherited from the USSR. It is important that they managed to reorient towards meeting consumer needs. However, this business will be really successful when it starts meeting domestic market demands.” says Victor Ivanter, Director of the RAS (Russian Academy of Science) National Economic Projection Institute.
In the non-ferrous metal industry, Russian companies, such as Norilsk Nickel and Rusal, are already among the world’s largest producers of nickel, palladium, and aluminum.
Industrial Assembly Replacing ImportsT he assembly agreement is one of the most successful examples of the industrial policy implemented by the Government. Without exaggerat ing the actual impact, industrial assembly created a fundamentally new automobile industry in our country. In 2008, the share of imports on the Russian passenger car market was higher than 55%; in 2011, it totaled just 36%. At the same time, the
share of foreign brands in the domestic car manufacturing sector grew from 5.7% in 2003 to 62% in 2011; in absolute indexes, their output surpassed 1 million vehicles annually (see Diagram 3).
The Government is consistent in its policy aimed at increasing localized production in the automobile industry. The second issue of industrial assembly agreements should create a basis for the production of modern components, including engines and gear boxes. Under the new agreements, minimum output will total 300 thousand vehicles annually on one site, which justifies investments m ade b y a s s e mbly c ompa n ie s i n constr uct ing their ow n plants and factories in Russia.
Today, interest in localizing plants and factories producing components is manifested not only by companies that have already signed new agreements, but also by automobile concerns continuing to operate according to old industrial assembly terms. For example, Hyundai-KIA has brought an entire pool of their suppliers to Russia. On the whole, new conditions have underlined the importance of “screwdriver” industries: automobile concerns have to manufacture 300 — 350 thousand vehicles annually, reach the 60% localization level by 2018 and invest in R&D in order to obtain Customs benefits by the end of 2020.
Energy ActivitiesTr a n s it ion of he at ge ne r at ion to energy eff icient combined cycle gas turbines instead of steam-powered ones characterized by a lower ef f iciency ratio is an important milestone in the development of the energy sector.
Despite the fact that the USSR was a pioneer in using the combined cycle, cheap energy resources and the Soviet energy sector focused on developing nu-
clear and hydraulic power industries, this technology was pushed into the background. As a result, the USSR built just four power units using the CCGT, and the national energy sector started to lag behind technologically during the Soviet era.
The situation changed drastically in the 2000s: the development of combined cycle generating technology was given priority in the course of reforming heat power engineering. Capacity supply agreements (CSA), under which invest-ment programs of generating companies were developed, gave serious momentum to technological re-equipment in this sec-tor. More than half of the power gener-ating facilities, which are to be put into operation by the generating companies under the CSA by 2015, must use these combined cycle technologies. Seventeen CCGTs with a total installed capacity of 4,915 MW have been put into opera-tion as part of the program to modernize thermal power plants and construct new power generating facilities.
In the Access AreaAs a result of tough competition between operators, in particular the Big Three companies, Russia has witnessed the cre-ation from scratch of one of the most de-veloped mobile communication markets, which has a marked advantage over the markets of several developed countries. It increased considerably in just ten years: from 5% in 2001 to 170% in 2011 (1,706 SIM-cards per 1,000 people); its volume currently totals RUB 558.2 billion.
Russia is currently one of Europe’s largest countries in terms of the number of Internet users (over 50 million people). The ICT competence level of Russians is still lower than Europe’s average, but this gap is shrinking fast. 58% of Russians use a computer at least once a week against
45EXPERT–400
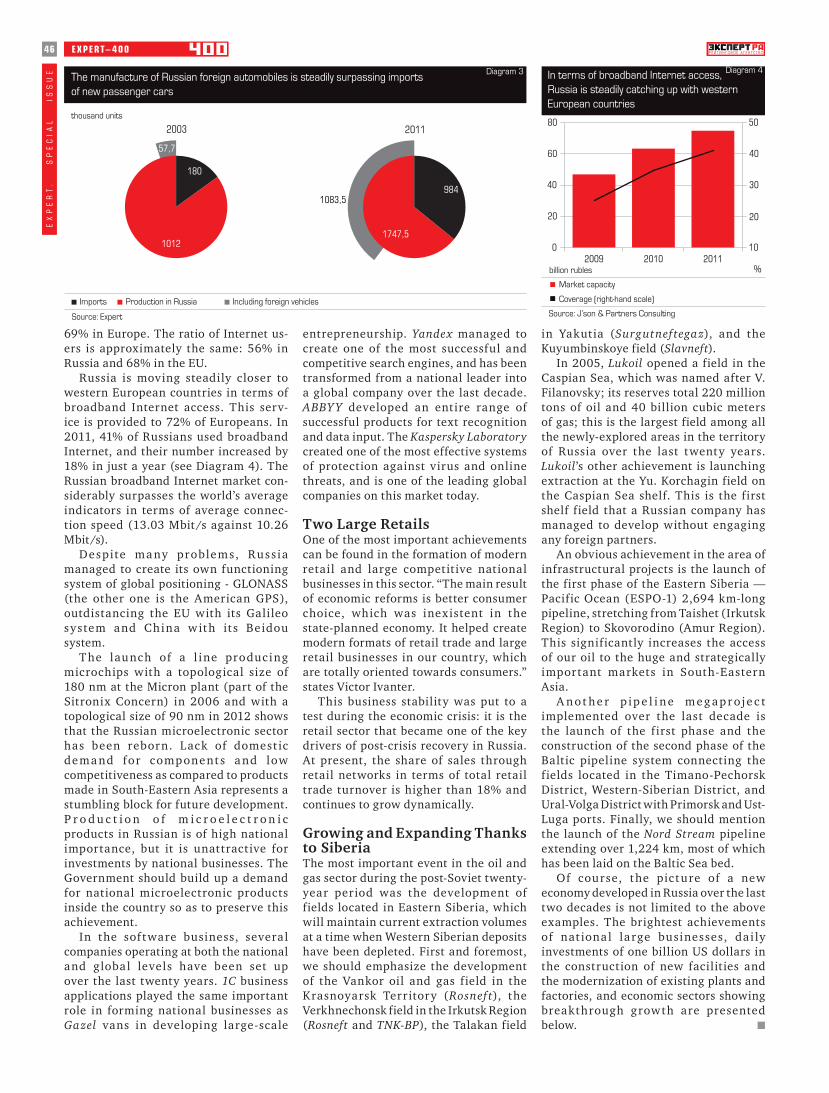
69% in Europe. The ratio of Internet us-ers is approximately the same: 56% in Russia and 68% in the EU.
Russia is moving steadily closer to western European countries in terms of broadband Internet access. This serv-ice is provided to 72% of Europeans. In 2011, 41% of Russians used broadband Internet, and their number increased by 18% in just a year (see Diagram 4). The Russian broadband Internet market con-siderably surpasses the world’s average indicators in terms of average connec-tion speed (13.03 Mbit/s against 10.26 Mbit/s).
Despite ma ny problem s, Russia managed to create its own functioning system of global positioning - GLONASS (the other one is the American GPS), outdistancing the EU with its Galileo system and China w it h it s Beidou system.
T he launc h of a l ine producing microchips with a topological size of 180 nm at the Micron plant (part of the Sitronix Concern) in 2006 and with a topological size of 90 nm in 2012 shows that the Russian microelectronic sector has been reborn. Lack of domest ic de m a nd for comp one nt s a nd low competitiveness as compared to products made in South-Eastern Asia represents a stumbling block for future development. P r o d u c t i o n o f m i c r o e l e c t r o n i c products in Russian is of high national importance, but it is unattractive for investments by national businesses. The Government should build up a demand for national microelectronic products inside the country so as to preserve this achievement.
In the sof tware business, several companies operating at both the national and global levels have been set up over the last twenty years. 1C business applications played the same important role in forming national businesses as Gazel vans in developing large-scale
entrepreneurship. Yandex managed to create one of the most successful and competitive search engines, and has been transformed from a national leader into a global company over the last decade. ABBY Y developed an entire range of successful products for text recognition and data input. The Kaspersky Laboratory created one of the most effective systems of protection against virus and online threats, and is one of the leading global companies on this market today.
Two Large Retails One of the most important achievements can be found in the formation of modern retail and large competitive national businesses in this sector. “The main result of economic reforms is better consumer choice, which was inexistent in the state-planned economy. It helped create modern formats of retail trade and large retail businesses in our country, which are totally oriented towards consumers.” states Victor Ivanter.
This business stability was put to a test during the economic crisis: it is the retail sector that became one of the key drivers of post-crisis recovery in Russia. At present, the share of sales through retail networks in terms of total retail trade turnover is higher than 18% and continues to grow dynamically.
Growing and Expanding Thanks to SiberiaThe most important event in the oil and gas sector during the post-Soviet twenty-year period was the development of fields located in Eastern Siberia, which will maintain current extraction volumes at a time when Western Siberian deposits have been depleted. First and foremost, we should emphasize the development of the Vankor oil and gas field in the Krasnoyarsk Territory (Rosnef t), the Verkhnechonsk field in the Irkutsk Region (Rosneft and TNK-BP), the Talakan field
in Yakutia (Surgutneftegaz), and the Kuyumbinskoye field (Slavneft).
In 2005, Lukoil opened a field in the Caspian Sea, which was named after V. Filanovsky; its reserves total 220 million tons of oil and 40 billion cubic meters of gas; this is the largest field among all the newly-explored areas in the territory of Russia over the last twenty years. Lukoil’s other achievement is launching extraction at the Yu. Korchagin field on the Caspian Sea shelf. This is the first shelf field that a Russian company has managed to develop without engaging any foreign partners.
An obvious achievement in the area of infrastructural projects is the launch of the first phase of the Eastern Siberia — Pacific Ocean (ESPO-1) 2,694 km-long pipeline, stretching from Taishet (Irkutsk Region) to Skovorodino (Amur Region). This significantly increases the access of our oil to the huge and strategically important markets in South-Eastern Asia.
A n o t h e r p i p e l i n e m e g a p r o j e c t implemented over the last decade is the launch of the first phase and the construction of the second phase of the Baltic pipeline system connecting the fields located in the Timano-Pechorsk District, Western-Siberian District, and Ural-Volga District with Primorsk and Ust-Luga ports. Finally, we should mention the launch of the Nord Stream pipeline extending over 1,224 km, most of which has been laid on the Baltic Sea bed.
Of course, the picture of a new economy developed in Russia over the last two decades is not limited to the above examples. The brightest achievements of nat ional large businesses, dai ly investments of one billion US dollars in the construction of new facilities and the modernization of existing plants and factories, and economic sectors showing breakthrough growth are presented below. ■
«ЭКСПЕР Т–400»Э
КС
ПЕ
РТ
№ 3
8 5
–1
1 О
КТ
ЯБ
РЯ
20
09
4646 EXPERT–400E
XP
ER
T.
S
PE
CIA
L
ISS
UE
Imports Production in Russia Including foreign vehicles
Diagram 3The manufacture of Russian foreign automobiles is steadily surpassing imports of new passenger cars
thousand units
Source: Expert


E XPERT–400E
XP
ER
T.
S
PE
CI
AL
I
SS
UE
48 «ЭКСПЕР Т–400»E
XP
ER
T.
S
PE
CIA
L
ISS
UE
ore than one billion US dollars is invested in creating new facilities and modernizing existing plants and factories in Russia every day. This seems to be just a lot of propaganda! But, this figure is not real, because it is actually much higher.
If total investments in equity presented by Rosstat for 2011 (10 trillion and 776 billion rubles) is converted into US dollars according to the average exchange rate (367.4 billion) and divided into the number of days in a year, then the result will seem improbable. Where are those new or reconstructed plants, factories, farms, and power plants worth a billion US dollars a day? There have been no reports on their start-ups or openings on TV or in the main media. This information gap is partially filled by quarterly investment overviews published in our magazine; however, due to a high level of selection (investment projects worth less than 15 million US dollars are not included in our overviews), a complete picture cannot be presented.
In order to fill this gap and understand where these daily US dollar-worth investments come from, we should look at what is built or reconstructed in our country in just one week, an average week in terms of the results: without considering any export oil and gas pipelines via railways (investments
in transport, including pipelines, are ranked first among other investments — see Diagram 1) or any major automobile assembly plants; it is a summer week (while most investments are closed by the end of the year), i.e. a week of ordinary, and not extraordinary, achievements.
These materials include no news about housing developments, investments in rolling stock acquisitions, information about budget investments at all levels or state-owned corporations (although they account for almost one quarter of all the investments in fixed assets - see Diagram 2). Even if we take into account the above-mentioned facts and much other information that has not been included, the list is impressive.
Finally, here is an explanation why the amount of one billion US dollars in daily investments is an understated figure. Since 2007 (see Expert No. 36, 2007), the Expert RA rating agency has been studying investment activities of Russia’s largest companies. Studies show that Rosstat figures are lower by 15% - 20% than the investment figures of companies audited according to the IFRS. Rosstat acknowledges this discrepancy, specifying that, in particular, investments by small businesses are disregarded. Therefore, larger amounts are actually invested in construction, equipment purchase, and modernization in Russia on a daily basis. ■
Russia’s Construction Boom
M

E XPERT–400
EX
PE
RT
.
SP
EC
IA
L
IS
SU
E
49«ЭКСПЕР Т–400»
EX
PE
RT
.
SP
EC
IAL
IS
SU
E

t is much more dif f icult t o d e s c r i b e s p e c i f i c achievements than to evaluate success from the statistics perspective, because such specifi cs unavoidably require
more or less formulated criteria. We were faced with this problem as well when selecting projects for the Wall of Fame of Russia’s large businesses. It took us several months to formulate the subject-matter in the process of continuous discussions with leading experts in the industry. Everyone is proud of Gagarin’s fl ight into space. One might arrive at a trivial conclusion against this grand background: we have nothing to be proud of now, nothing at all.
However, we can formulate it in a more gentle way: if we look for achievements that changed the economic landscape of the world or at least the country or a sector, something concrete will become more apparent. At least, in our discussions with experts we managed to make a list of about three dozen examples.
They are very diverse and fit into different categories. However, they have one thing in common: success factors.
Implementation of megaprojects is the first of those factors. They include, for example, the construction of a network of new pipelines for exporting oil and gas to markets, which were cut off from Russia geographically after the collapse of the USSR. During the Soviet era, pipes for such branches were primarily purchased abroad. Due to massive and government-guaranteed demands in the 2000s, businesses were able to build rolling mills-5000, enabling the manufacture of rolled product blanks for large diameter pipes.
A reasonable industrial policy is the second factor contributing to our Wall of Fame expansion. It is namely thanks to this policy that our agricultural sector was transformed from a “black hole” into an attractive investment sector, chicken legs were no longer imported; several plants for assembling foreign cars were created with growing localization of automotive component producing plants.
Cooperation with technological leaders is the third success factor of our large businesses. After the collapse of the
USSR and the CMEA (Council for Mutual Economic Aid), the national market became too restricted for several sectors of our economy; integration in global labor distribution became a new basis for their development. Cooperation with the world’s leading players helped implement advanced projects such as the Sukhoi Superjet, and opened new doors to foreign markets for our companies, such as VSMPO-Avisma or Aerofl ot.
Business globalization is the fourth factor closely related to the previous one. No expansion into the global market is possible without leading global companies. Today, Russia has such leaders, and not only in raw material sectors. Apart from Gazprom and LUKoil, they include Rosatom, Rusal, and Volga-Dnepr Airlines.
Finally, the fifth factor contributing to the success of Russian companies over the last decades is the implementation of the most advanced business technologies. The food sector and retail trade, cellular com mu n ic at ion s a nd i n for m at ion technologies, the finance and crediting sectors are all economic fields that have been developed from scratch or have been fundamentally modernized during the post-Soviet period, having successfully employed the latest business technologies in the national environment.
The potential of these success factors has not been fully exploited by our business community. They can and must serve as a basis for a Russian breakthrough in the economic sector.
As regards the fi nal list of achievements of large business companies presented on these pages, it is far from being exhaustive and quite subjective in many ways. We may have missed many others for sure. But, we believe that we can be forgiven as we will be able to tell the story of our country’s success some other time in the future.
What We are Proud of: our Leaders
50
I
E XPERT–400E
XP
ER
T.
S
PE
CIA
L
ISS
UE

ussian business companies will have to demonstrate new achievements in the near future: this is a result of the scale of problems facing the Russian economy. Let us
try to analyze projects that have already been announced by different national companies, the implementation of which will be a milestone event for the whole country in the foreseeable future.
Engineering: Cooperating with Technological LeadersThe most anticipated achievements in civil aircraft and engine engineering are related to projects of the MC-21 long-haul aircraft (main fi rm – Irkut Corporation) and a range of PD-14 new generation aircraft engines. After mastering production of liner SSJ-100 and creating the SaM-146 engine jointly with Snecma, success in these projects is highly plausible.
Problems arising in the process of im-plementing the SSJ-100 project are no reason to doubt the development of the aviation industry in general and the MC-21 project in particular. Firstly, the SSJ-100 is the first aircraft created by a large international corporation in our coun-try after the collapse of the USSR. The project required the company to basically rebuild the entire management model of the industry in the process of its im-plementation. We can now say that this model has been created and developed. In particular, an important step consist-ed in forming independent competence centers within the Unified Aircraft Build-ing Corporation for all the aviation com-panies to develop key units and compo-nents for potential models. Two centers have already been set up: Aerokompozit (development and production of compos-ite materials and units), and the BREO Complexation Center (development and production of avionics).
Secondly, the history of the global avia-tion industry has no examples of the fi rst project of a resource aircraft created by a defense company being implemented with-out any technical or marketing problems. All in all, if the SSJ project had failed, there would be no sense at all in discussing any
development outlooks for the Russian avia-tion industry.
The MC-21 is a much more ambitious project. The aircraft will compete in the tight niche of the world market for short-haul and mid-haul passenger aircraft, which is currently dominated by two be-stseller aircraft: the A320 and the Boeing 737. By 2016, when serial production of the new liner is launched, the modernized versions of the A320 Neo and Boeing 737 MAX, as well as the new generation of the Chinese Comac C919, equipped with Pratt & Whitney engines, will have appeared or will be about to appear on the market.
In the engine engineering sector, our main hopes are centered on the PD-14 en-gine, on which an entire family of units with traction of 8 to 18 tons will be based. Its main quality consists in using a new universal gas generator that could be uti-lized in a wide range of engines. The PD-14 will not compete with Russian engines of the previous generations, but with the lat-est models of global technological leaders, such as PW1400G (Pratt & Whitney) and CFM International LEAP-X (GE-Snecma) engines. In case of such project implemen-tation, the Russian engine engineering sec-tor can overcome in one leap ten to fi fteen years of the technological gap separating it from the other global leaders.
In the automotive industry, the second edition of agreements for industrial assem-bly will result in the development of a mod-ern automotive component sector in Russia. According to Alexey Rakhmanov, Deputy Minister of Industry and Commerce, in-vestments in the production and output of automotive components on the Russian market are estimated to reach 5 billion US dollars by 2020. The Ministry of Industry and Commerce expects that investments will be directed towards the construction of engine plants, plants producing gear boxes and performing mechanical process-ing, interior components, and stamping. Agreements on industrial assembly will lead to an increase in the output of Russian automobile manufacturing plants to three million vehicles by 2020 against 1.7 mil-lion last year.
Gestamp and Toyota Tsusho, incorpo-rated in the Toyota Group, have already
announced that they will build component production plants; Volkswagen intends to build a petrol engine plant in the Kaluga Region. Ford ( jointly with Sollers), Re-nault-Nissan, and Avto-VAZ have similar plans, i.e. creating or modernizing engine building plants.
Good conditions for a serious break-through have been created in the transport engineering sector. Yuri Saakian, General Director of the Natural Monopoly Institute, estimates that, if one looks at the Trans-port Engineering Development Strategy approved fi ve years ago, the sector is cur-rently slightly behind the target indicators stipulated in an optimistic scenario. This concerns both the range of products and equipment production. In addition, serious changes were recorded in the technical re-equipment of the sector, including the ar-rival of global technological leaders such as Siemens (JV with Sinara Group) and Alstom (which acquired a share in the capital of Transmashholding) in Russia. Today, Rus-sian transport engineering companies can produce practically all types of equipment demanded by main customers: RZD, except modern mainline locomotives, continuous current locomotives, two-system electrical locomotives and locomotives with an asyn-chronous drive required, in particular, for high-speed service.
However, these gaps in the range of products of Russian manufacturers will be filled in the foreseeable future. Test-ing programs for the two-system passen-ger electrical locomotive with the EP-20 asynchronous drive are coming to an end (Transmashholding in cooperation with Alstom); the joint venture of Siemens and Sinara is being completed in order to mas-ter the manufacturing process of the ES2G continuous current electrical locomotive. But, these machines are not serially pro-duced yet, and they will still have to go through the “childhood period” and deal with “certain diseases” - a normal process for complicated machines.
In the power plant engineering indus-try, great hopes are placed on the high capacity gas turbine project of the Silovye Mashiny and Siemens JV. It is in this sec-tor of gas turbines that the national pow-er plant engineering industry is lagging
51EXPERT–400
EX
PE
RT
.
SP
EC
IAL
IS
SU
E
What We will be Proud of: Breakthrough Areas Growth potential has been built up in several sectors. However, the most serious challenges, primarily domestic
ones, have yet to be met in order to achieve these targets
Dmitry Mindich
R

behind its competitors, and the Russian power sector is highly dependent on sup-plies from abroad (the share of imports surpasses 50%). Turbines with a capacity of 168 MW and 292 MW will be manu-factured by a JV under a Siemens license. Vasiliy Timatkov, head of the expert an-alytical department for new energy tech-nologies at the Energy Strategy Institute, emphasizes that no full production cycle is to be developed and some components will be supplied by Siemens; however, as a result of this project, the Russian manufacturer will be able to learn how to organize the maintenance of this equip-ment as the maintenance costs will total about 70% of the equipment cost in the next thirty years.
Several other turbine production JV projects with western companies are at dif-ferent phases of development. A joint ven-ture between Alstom and Atomenergomash, uniting the machine engineering assets of SC Rosatom, has implemented a project for high-capacity slow-speed turbines de-signed for power plants. A JV between Gen-eral Electric, Inter RAO, and UK ODK (part of Rostekhnologii) is localizing a plant for the production of medium capacity gas tur-bines (77 MW) in the Yaroslavl Region.
Defense: Focusing onBreakthrough ProjectsThe main problem that the Russian military and industrial sectors will be faced with in the foreseeable future is the potential exhaustion of Soviet equipment and the need to create and master the production of new generation equipment and military arms. Even a partial solution will be one of the most important achievements of
the Russian economy in the foreseeable future.
The military and industrial sectors have been successful export-oriented sectors of Russian economy over the last twenty years. Today, our country is ranked second in the world in terms of arms exports: in 2011, sales of military products totaled 13.2 billion US dollars and surpassed 6.5 billion US dollars in the first half of this year. The importance of this achievement emphasizes the fact that the most profi table markets of the NATO countries, countries that are traditionally under the infl uence of the USA (Japan, South Korea, Australia), and countries of the Middle East oil monar-chies are actually closed off for the Russian arms industry.
The sector’s export success was not ac-companied by any important technological achievements. The Russian military and industrial sector turned out to be competi-tive only in niches where the Soviet de-fense sector had historically held a leading position. The MIS has used both the poten-tial of human resources and technologies inherited from the USSR, as well as mate-rial stock preserved from the Soviet times, in particular stocks of components. They include heavy jet fi ghters (apart from the USA, Russia covers over 50% of the glo-bal production of this category of jets), air defense systems, heavy armored vehicles, and helicopters. Our country is also one of the largest exporters of surface war craft; however, supplies of obsolete destroyers, delivered to China, which could not choose other suppliers due to sanctions imposed by the NATO countries in the 1990s, ac-count for the lion’s share of exports of this type of equipment.
The sector needs new growth driv-ers, because exports that have helped the strongest segments of the military and in-dustrial sectors survive over the last twen-ty years cannot contribute to further de-velopment. The State Armament Program (SAP), which is unprecedented in terms of scale and should be implemented through 2020, will be such a locomotive during the next decade; under this program, over 19 trillion rubles are to be allocated for rear-mament purposes of the Russian army.
More than 1.3 thousand units of equip-ment and arms will be procured under this program; by 2020, the share of new equip-ment and weapons is expected to reach 70%. However, even the “golden raindrops” falling on the defense sector does not guar-antee that this sector will be able to create the technological and production reserves required for long-term development.
Firstly, according to Strategy and Technology Analysis Center Director, Rusla n P uk hov, t he Russian MIS f undamental problem l ies in poor efficiency of the sector’s management: “In the 1990s, individuals managing the R&D in the defense sector used to perform according to the following principle: the government pretends to pay and we pretend to develop. Many of those people still manage the sector and do not plan to leave. R&D costs are financed according to actual expenses; firms and institutes involved in development are not exposed to any financial risks and are practically not responsible for complying with deadlines and results. It is not easy to get rid of this system as real networks, based on mutual cover-up, have been established in the military and industrial sectors. Some
52 EXPERT–400E
XP
ER
T.
S
PE
CIA
L
ISS
UE
The national aviation industry was fundamentally rebuilt in the course of engineering the SSJ-100. In particular, centers for the development and production of composite materials and avionics were set up at the Unified Aircraft Building Corporation, meeting the highest requirements required in this sector.
RIA
NO
VOST
I

institutions have been transformed into conveyors of reports. They issue positive conclusions about R&D, but, speaking conventionally, the “planned rockets” will not take off. However, the developer is covered as he has presented a definite conclusion.
Secondly, the adopted SA P-2020 is or iented pr imar i ly towards t he procurement of equipment and arms, which have already been manufactured and mastered by the Russian MIS. In particular, the program stipulates procurement of outdated equipment, for example, diesel electrical submarines, developed under the Varshavianka project or frigates of the 11356 project, which were developed in the mid-1990s and ordered by India. The R&D costs included in the program are extremely low and amount to just about 10% of its total scope, while both national and foreign experience shows that the normal indicator should be 20% — 25%. If the SAP-2020 is successfully implemented, the army will be rearmed with new, but not necessarily the most advanced weapons. However, by 2020 we may become aware that procrastinating is not the answer, and we will have to start massively importing weapons and equipment.
At the same time, the Russian MIS has the opportunity to remain competitive and sometimes even retain its leading position in several areas. In the aviation industry, the fifth generation jet fighter (the promising aviation complex of front-line aviation, PAC FA) represents a major breakthrough point. The PAC FA project has an excellent future for export, because the USA is not currently planning to supply the F-22 to foreign markets, while the light jet fi ghter F-35 will be sold to a restricted number of countries. Therefore, for several major markets there are no other alternatives to the Russian jet fi ghter. The fi fth generation C-400 air defense systems and the development of C-500 systems are other projects that may become export bestsellers as well.
Although the Russian tank building sector has been heavily criticized on many occasions by the Ministry of Defense (the promising T-95 and BMD-4 tank-building project was closed down), the Russian MIS managed to create a successful project of new generation tanks. The helicopter building sector will remain competitive for many years by selling Mi-8/Mi-17 helicopters, provided that they continue to be modernized. However, sooner or later, it will be necessary to design a new generation transportation helicopter; it is now estimated that focus will be placed on engineering high-speed helicopters, and the Russian helicopter building sector should not pass by this technological revolution.
Despite the failure of the project of the Lada diesel electrical submarines (project 677), it still has a good chance to break through the market. The Russian MIS has managed to preserve a strong engineering school and production competence in this area.
Final ly, projects with no export potential will be highly important for creating the MIS technological reserve and improving the defense capacity of the country. They include nuclear-powered submarines related to the Borey project, further development of IsKander tactical ballistic guided missile systems, and intercontinental ballistic missiles. Those projects have a good chance of becoming a symbol of Russia’s military and technical dominance.
Metallurgy: Domestic Development OutlookPromising projects announced by the metallurgical companies are primarily aimed at completing the modernization of production facilities, in which Russia’s major metallurgical corporations have made important advances, and at developing mineral assets as well. Moreover, several projects are focused on meeting current demands of major Russian customers, for example, rail and beam production at NKMK (Evraz) to meet the RZD demands for one hundred meter rails required to organize high-speed services.
“The announced projects do not change the quality situation in the Russian metallurgy sector, the business model of which consists in having access to its own raw materials and low manufacturing costs for low-added value products. The Russian iron & steel industry produces more steel than can be consumed by the domestic market: about 50% of the products are exported, which is an abnormally high indicator for most steel-manufacturing countries.” says Vadim Grinberg, Chief Editor of National Metallurgy magazine.
At present, the Russian iron & steel industry has a stable niche on the global
market and is one of the most prospering sectors of the national economy. However, the existing business model of stability in the Russian metallurgy industry will be put to the test in the foreseeable future. As usual, the main threat comes from China whose industrial and infrastructural growth over the last few decades has driven global and national metallurgy growth fast forward. Steel production in this country has grown more than fi vefold in just twenty years, and now surpasses 684 million tons annually. This is ten times higher than volumes produced in Russia, and the national output of rolled products is slightly higher than one tenth of China’s output. China has consumed the lion’s share of this colossal output to date: the country has built a lot of residential buildings, roads, and industrial plants. However, this explosive growth cannot continue forever: industrialization and modern infrastructure in China will be saturated in the foreseeable future, domestic market capacity will decline, and China will be faced with a steel overproduction problem. Expanding exports will be the most obvious solution to this problem.
For this reason, the real development outlook for the Russian iron & steel industry is associated with development on the domestic market. Major metallurgical companies have already contributed greatly to modernizing production and diversifying the range of products, and are now ready to meet practically any Russian consumer demands. Everything now depends on the development of metal-intensive sectors of the Russian economy, primarily housing and infrastructural developments, extraction industries, and the machine-engineering sector. Metallurgical companies will not take long to meet their needs as soon as they appear.
ICT: Changes in LeadershipThe specifi c feature of the information and communication technology markets is that their forthcoming achievements are quite obvious, but it is absolutely unclear who
53EXPERT–400
EX
PE
RT
.
SP
EC
IAL
IS
SU
E
At the same time, the Russian MIS has the opportunity
to remain competitive and sometimes even retain its
leading position in several areas. In the aviation industry,
the fifth generation jet fighter (the promising aviation
complex of front-line aviation, PAC FA) represents a major
breakthrough point

will attain them and profi t from them to the greatest extent.
The next ten to fifteen years will be diffi cult for today’s leaders of the Russian ICT segment, i.e. mobile operators. They have already obtained all they could from the voice communication market, in terms of user base growth and income growth. The future of the sector is associated with the development of another basic service: batch data communication.
“The most important problem for mobile operators is that any business not pertaining to data communication is a non-core one for them. Operators cannot conceptually produce services and, more importantly, sell them. The entire sales structure by operators is built in such a way that they are unable to promote something through the system, which requires an individual description of the product and marketing depending on the type of customers.” states Mikhail Minkovsky, Vice-President for new technologies at Sitronix OJSC.
Operators r isk becoming str ict ly infrastructural companies, pipelines for data communication. This is the worst
development scenario for mobile operators. “Mobile operators are unlikely to become a sector that the Russian business community will be proud of in ten years. They will probably be unknown, just as no one knows the name of suppliers delivering heat or water to our homes today. Communication has been a public utility for a long time.” says IBS President, Anatoly Karachinsky.
The market for ICT-services anticipates a revolution in the next fi fteen to twenty years, which is related to the penetration of information and communication technologies into various economic areas. Mikhail Minkovsky believes that the most promising areas are as follows: services associated with M2M system utilization (unmanned information interaction of machines and devices), and services based on cloud technologies. These areas will be closely interrelated as communities of machines can communicate with users via cloud services.
In the area of M2M, the major markets in terms of capacity may emerge as a result of the development of intelligent power supply networks. First and foremost, this
concerns the terminal sections of networks, where public utility management systems may be widely used within the framework of one fl at or a private house. For example, intelligent meters can make it possible to choose electricity supply tariff plans, manage power consumption in a f lat through interaction systems linked directly to household appliances, and also pay electricity bills.
The development and penetration of biometry and identifi cation technologies, which, in particular, will make it possible to create a payment system without using any external devices, is another important fi eld for communication operators.
It is quite difficult to predict the emergence of new major Russian companies on the software and Internet markets, where Russian high-tech businesses have recorded the most important achievements recognized around the world in the last twenty years. On the one hand, these markets are characterized by the lowest entry barriers. On the other hand, according to Mikhail Minkovsky, the number of qualifi ed and talented specialists, as well as good ideas in this area, has become limited in our country. Moreover, if the government does not care to create better conditions for such companies, including fi scal terms, chances that Russia will come up with new stories of success, such as Kaspersky Laboratory, ABBYY, IBS, and Yandex, will decline to a considerable extent.
Railway Infrastructure: Speed and ExpansionRailway infrastructure conditions will become one of the main obstacles for national economic development in the foreseeable future to a greater extent than poor development of highway networks, or port and airport infrastructures. Therefore, at least a partial solution to the problems of Russian railways will be an achievement, the importance of which will be hard to overestimate.
The following figures point out the scale of those problems: at present narrow track places are 6.2 thousand kilometers long or 8% of the total length of the railway network. They are situated on the most cargo-intensive lines, carrying approximately 80% of total railway freight traffic. The Economy and Transport Development Institute (ETDI) estimates that if Russian economic growth rates and investments in railway infrastructure remain at the same level, the length of narrow track places will amount to 14 thousand kilometers by 2015 and will surpass 19 thousand kilometers by 2020. That will represent the worst scenario for the economy: in 2015, the RZD will not be able to carry 200 million tons of additional
54 EXPERT–400E
XP
ER
T.
S
PE
CIA
L
ISS
UE
By 2030, our railways will have grown by 16-20 thousand kilometers, including tracks for high-speed trains. Such a large number of steel tracks has not been laid since the Tsarist times
RIA
NO
VOSR
I

freight, the value of which will total 0.5% of the GDP. According to the ETDI, about 3.5 trillion rubles will have to be invested in the development of railway infrastructures by 2020 in order to maintain the situation at today’s level, which is obviously far from being the best example.
The railway transport development strategy includes the construction of 2 756 km of second, third, and fourth tracks to increase network capacity; 1 767 km will have to be built over a period stretching from 2016 to 2030; and 16 (minimum variant) to 20 (maximum variant) thousand kilometers of new lines must be built by 2030. The question is who will fi nance these construction works. “Investments in those projects are knowingly non-recoverable for the RZD as a joint-stock company. But, they are recoverable for the government as there will be an increase in the tax base, Customs duties, and new jobs. However, such investments have been projected in two to three years and, unfortunately, no one wants to look so far ahead in our country.” says Yuri Saakian.
The development of the high-speed ser v ice net work (Moscow – Saint Petersburg, Moscow – Nizhny Novgorod – Kazan – Yekaterinburg, Omsk – Novosibirsk, and Novosibirsk – Krasnoyarsk) could be an important achievement of the railway company. “Apart from ensuring the country ’s transport connectivity, high-speed trunk projects will have an important impact on the development of machine engineering transportation. If Russian manufacturers are engaged in manufacturing rolling stocks for such trunks as JV participants or suppliers of components, this will give momentum to the technological development of this sector. And these technologies can be applied beyond the railway transport sector in the future.” says Yuri Saakian.
The problem consists in the high costs related to such projects; for example, investments in the construction of the high-speed service section - Nizhny Novgorod – Kazan – Yekaterinburg - are estimated to
reach approximately 1.4 trillion rubles. It is quite obvious that they will have to be fi nanced by the public budget as the RZD is unable to cope with such expenditures.
Agricultural Sector: OutwardExpansion The agricultural sector, which had become a “black hole” with no clear outlook for growth and development ten to fi fteen years ago, is now one of the most promising economic sectors. “Agriculture is a fundamental natural resource of the Russian economy. However, it has realized no more than one tenth of its potential to date.” says Russian Grain Union President, Arkadiy Zlochevsky. The highly anticipated and the most probable achievements in the agricultural sector during the next ten to fi fteen years will consist in strengthening its positions on the global grain market and expanding domestic consumption by 10 to 15 million tons, creating an industry of high-level grain processing, and transforming Russia into a large exporter of poultry and pork meat.
Modern agrarian technologies are the main resources behind the growth of grain production. If we compare the average yield of the main crops in Russia and in developed countries, our agricultural sector still has room to grow and can increase grain output by 3 – 3.5 times without using more land surfaces. The fi rst small step toward this goal was made in 2008, when in the thick of global inflation, including ultra-high grain prices, many farmers decided to buy modern machines and equipment required to provide subsurface tillage technologies to homesteads and enterprises, besides zero tillage.
An unstable grain market is an obstacle to modernization: for any producer there is a price threshold, whereby income increases not as a result of investments, but due to cost reduction and transition to more archaic farming forms. The present mechanisms of grain interventions fail to cope with this problem and have to be improved.
The domestic grain market will develop along with growing exports: these two areas do not contradict each other. According to the most optimistic forecast, the domestic consumption of grain will grow by 10 to 15 million tons in a decade. In particular, rapid growth in pig and poultry breeding has had a minor effect on domestic grain consumption over the last couple of years as new stock-raising enterprises use modern production technologies, which ensure both an increase in feed conversion and a decrease in grain contained in the diet. The feed conversion rate (the amount of feed to obtain 1 kg of the animal’s weight gain) at poultry breeding complexes built in the 2000s is twice as high as the average indicators in the sector during the Soviet period, and 2 to 2.5 times higher at pig breeding complexes. If the poultry breeding sector has already achieved its optimal indicators in terms of consumption and feed composition and the fact that growth in subsequent production will energize domestic demand for grain, the demand for developing pig breeding will probably undergo a decline in the years to come. The problem is that about 40% of pork meat in Russia is currently produced by poorly effi cient individual farm households. The inevitable concentration of pork production by large plants will at fi rst lead to a decline in grain consumption. The same can be said about other stock breeding sectors, such as beef and milk production. As a result, poultry and pig breeding enterprises have a good chance of expanding and entering export markets in the next ten years.
The development of high-level grain processing and the gradual transition from raw material exports to exports of products with a higher added value present a clearer prospect for an increase in domestic market capacity. This is the strategy that was chosen, in particular, by Kazakhstan, which is now the world’s largest fl our exporter. And, our country is fully dependent on imports for many groups of products. In particular, Russia does not produce modifi ed starch (the oil and gas industry is its major consumer), amino acids for stock breeding, vitamins, and fl akes made from cereals. The fi rst steps taken in this area can already be seen: in the Belgorod Region, the Prioskolie Group started to build a plant that will produce lysine sulfate (one of the amino acids used in stock breeding and poultry breeding) with a capacity of 57 thousand tons annually. However, a major breakthrough in this area can be achieved only if the government creates additional stimuli and reduces risks that investors might encounter as such projects are capital-intensive with a payback period of ten to fi fteen years. ■
55EXPERT–400
EX
PE
RT
.
SP
EC
IAL
IS
SU
E
Our agricultural sector still has to grow and it can increase
grain output by 3–3.5 times without using more land
surfaces. Poultry and pig breeding enterprises have a
good chance of expanding to export markets in the next
ten years

he top ten state - ow ned companies currently account for 30% of the total revenue g a i ne d b y t he e nt i t ie s included in the Expert-400 list. Given the state-owned
companies, consolidated data of which have not as yet been presented in the rating scale, the real impact made by the state-owned companies on the country’s economy is considerably higher. In many ways, the future of entire sectors depends on the implementation of their development strategies. Are there such strategies? What are their priorities?
In order to answer this question, the Expert R A rating agency examined t he s t rateg ic doc u ment s of s tate -owned companies. Despite the fact that, according to Federal Law No. 437 adopted towards the end of 2010, state-owned corporations had to prepare their own development strategies and make them public, we managed to find different strategic documents of only a dozen or so firms out of 50 state-owned companies. (It is true that many of them stated that their documents were simply not ready). We will attempt to evaluate at least the approximate quality of the identif ied strategies based on the following simple criteria: adequate goal-setting, corresponding tools used to set goals, implementation control, and, finally, ambitions expressed in company plans. We will present short preliminary results of this mini-study.
Firstly, the planning horizon at state-owned companies has been extended to 10 – 20 years. This is a ser ious breakthrough. Not so long ago, even the most sagacious managers were reluctant to predict the future beyond two to three years. At present, the strategies of RZD and Gazprom have been drawn up through 2030; MRSK-Holding and Transneft have worked out plans for their activities until 2020.
Secondly, if the goals are adequate, the mechanisms of their achievements are often behind the scenes in many companies. For example, Gazprom makes a reasonable statement when it asserts that geographic diversification of exports
is one of its objectives. However, it is reluctant to provide more detail as to the tools permitting to reduce gas extraction and transportation costs in Russia, at least publicly. The Unified Shipbuilding Company announces that its goal is to increase labor productivity by 3 to 3.5 times (which is quite important for the Russian machine engineering sector indeed), but it discloses no ways of resolving this problem. On the contrary, the Post of Russia provides quite a detailed and segmented action plan aimed at achieving one of its main goals:
more than a twofold growth in revenues by 2020. However, strategy planners point out that, even with such dynamics, revenues generated by the Post of Russia will be 6 – 7 times lower than those of major western postal operators.
All in all, ambitions expressed by global leaders are not as yet typical of most of our state-owned companies. For example, KamAZ plans to increase its sales to 100 thousand trucks by 2020 (38.3 thousand trucks in 2010), while its immediate competitor; Volvo Trucks, sold over 105 thousand trucks in 2006. Only a few Russian state-owned companies are planning to achieve real breakthroughs. R ZD i s planning to f undamental ly increase the length of railway tracks for express and high-speed passenger traffic (almost eightfold by 2030). Rosatom, the leader among the top ten companies in terms of strategic planning quality, is not only intending to increase its revenue f ivefold against 2011, and raise the capacity of its PP by 2.5 times, but it is also supporting these plans by large-scale R&D investment programs (4.5% of revenue; this figure is impressive even against the background of the indicators show n by t he cor porat ion’s global competitors). ■
56 EXPERT–400E
XP
ER
T.
S
PE
CIA
L
ISS
UE
Strategies of State-owned Companies:no Particular Ambitions The planning horizon at large state-owned companies has been extended to 10-20 years.
No particular achievements have been planned over this period
Andrey Gradetsky, Fedor Zherdev
The planning horizon at state-owned companies has been
extended to 10–20 years. This is a serious breakthrough.
Not so long ago, even the most sagacious managers
were reluctant to predict the future beyond two or three
years
T

he results of another Expert-400 rating study turned out to be even better than we anticipated. In 2011, the to-tal revenue of Russia’s 400 leading companies grew by
23.4%, setting a new record: 1.407 tril-lion US dollars (see Diagram 1). This can-not be explained by the market situation factor alone (even though, despite the sta-bility of oil prices in the second semester of the year, their level rose to a consider-able extent). A more important role was played by brand strengthening that we noticed last year: growing investment de-mands and a new wave of consumer ac-tivities.
However, when we explained the post-crisis economic recovery of consum-er and investment oriented sectors last year, today the scale of business related to machine building and engineering sec-tor companies surpasses the peak figures
of 2007 – 2008 by at least 20%. Further-more, these developing dynamics speak for themselves. In 2011, revenue growth recorded by major machine engineering companies reached the highest level for the previous decade, totaling 36.2% (see Table 2). In terms of this indicator, the sector is inferior to the industrial infra-structure construction sector (46.8%) only, and leaves the oil sector (29.1%) and the iron & steel industries (22.4%) far behind.
Motor GroupThe engineering industry is represent-ed by 46 companies in this rating. This is the most impressive group in the list. The pace here is set by 13 automobile plants and 9 automotive assembly factories of which are owned by foreign companies. Revenues generated by automobile man-ufacturers included in our 2011 rating grew by 57.2%. It is worth noting that the
Soviet vehicle giant - AvtoVAZ (39th posi-tion in the rating, 27.2% revenue growth in a year) ceded its leadership position in terms of revenue to the Volkswagen Group Rus (35th position, 71.9%). In 2011, the German company sold 229 thousand vehicles on the Russian market, over 135 thousand of which (almost 60%) were made in Russia. The growth reserves will not be exhausted in the sector in the near future. This is because at least five automobile concerns are now develop-ing their plants in Russia. Three of them have already been included in the list of the top twenty most dynamic companies of our rating scale (see Table 3): Nissan Manufacturing Rus (growth by 4.6 times, first position in the top ten accelera-tors), GM Auto (+126.1%), and PSMA Rus (+87.3%).
Agricultural machinery and tractor producers have been developing just as dynamically; the total amount of their
57EXPERT–400
EX
PE
RT
.
SP
EC
IAL
IS
SU
E
Important Business Trends: Customer and Investor Unions A new wave of consumer demands and active modernization of fixed assets propelled the manufacturing industry to the top of the leadership list in developing dynamics
Dmitry Kabalinsky
T
Twenty largest companies in terms of volume of sales Table 1
2012 2011 Company Volume of sales in 2011 (RUB, million) Volume of sales in 2010 (RUB, million)
1 1 Gazprom 4 637 090.0 3 597 054.0
2 2 LUKoil Oil Company 3 275 015.9 2 615 049.6
3 3 Rosneft Oil Company 1 858 035.8 1 373 145.6
4 4 RZD 1 480 879.0 1 355 854.0
5 6 NTK-BP 1 223 064.9 953 871.2
6 – Savings Bank of Russia 1 002 500.0 926 595.0
7 7 AFK Sistema 969 318.9 814 527.9
8 8 Surgutneftegaz 787 854.0 615 714.0
9 11 Transneft 670 270.0 447 532.0
10 9 MRSK Holding 634 608.0 559 496.0
11 10 Tatneft 615 867.0 468 032.0
12 – Inter RAO YeES 536 244.0 464 386.0
13 14 Evraz Group 481 996.0 406 909.7
14 13 Severstal 464 726.4 389 444.8
15 – VTB Group 464 100.0 359 300.0
16 17 X5 Retail Group 454 225.0 342 701.3
17 15 Norilsky Nikel MMC 415 045.6 388 104.5
18 19 Mechel 368 735.3 296 084.6
19 12 Rushydro 362 599.0 526 581.0
20 18 United Company Rusal 361 232.5 333 542.0
* Volume of sales refers to revenues (gross income) from sales of products, works, and services derived from the relevant lines of profit and loss accounts, or an indicator recognized to be its equivalent according to the rating preparation methods (l. 134).

58 EXPERT–400E
XP
ER
T.
S
PE
CIA
L
ISS
UE Industry-specific structure of the Expert-400 rating scale (by volume of sales) Table 2
Sector
Num
ber
of
com
pani
es in
the
Ex
pert
-400
rat
ing
Volu
me
of s
ales
in
2011
(RU
B, m
illion
)
Volu
me
of s
ales
on
aver
age
per
com
pany
(RU
B,
milli
on)
Shar
e in
the
tot
al vo
lum
e of
sal
es in
th
e Ex
pert
-400
ra
ting
(%)
Grow
th r
ate*
(%
)
Volu
me
of s
ales
in
2011
(US
D, m
illion
)
Prof
it be
fore
tax
es
in 2
011
(RUB
, m
illion
)
Net
prof
it in
201
1 (R
UB, m
illion
)
Industrial sector, total: 176 26 071 364.1 148 132.8 63.06 24 887 083.3 4 938 007.1 3 762 928.1
Oil, oil and gas industry 16 13 295 836.7 830 989.8 32.16 29.1 452 393.2 3 460 692.6 2 694 706.4
Electric power industry 23 2 814 585.1 122 373.3 6.81 3.4 95 766.7 229 832.1 149 931.5
Iron & steel industry 15 2 811 748.2 187 449.9 6.80 22.4 95 670.2 272 411.0 199 398.7
Machine engineering 46 2 664 475.2 57 923.4 6.44 36.2 90 659.7 190 315.3 143 922.3
Food processing industry 25 972 659.1 38 906.4 2.35 13 33 095.1 43 529.6 36 117.3
Chemical, oil and chemical industry 17 1 114 667.4 65 568.7 2.70 32 37 926.6 290 391.6 231 013.7
Non-ferrous metal industry 9 1 150 566.4 127 840.7 2.78 12 39 148.3 230 744.7 147 638.1
Coal industry 4 250 385.8 62 596.5 0.61 23.6 8 519.4 52 080.2 40 889.0
Tobacco industry 4 297 749.9 74 437.5 0.72 18 10 131.1 19 183.9 14 802.9
Precious metal and diamond industry 6 330 492 55 082 0.80 30.8 11 245.1 94 305.7 62 467.6
Forest, wood processing, and pulp & paper industry
5 140 528.9 28 105.8 0.34 12.9 4 781.4 18 921.1 14 857.3
Building material industry 3 127 956.8 42 652.3 0.31 20.5 4 353.7 17 709.7 13 306.6
Printing and publishing industry 1 41 983 41 983 0.10 33.3 1 428.5 5 014.2 3 807.1
Consumer goods industry 1 15 075.7 15 075.7 0.04 70.2 513 1 637.8 1 289.1
Pharmaceutical industry 1 42 653.9 42 653.9 0.10 43.7 1 451.3 11 237.6 8 780.5
Banks 26 2 523 075.1 97 041.4 6.10 17.5 85 848.1 706 603.2 556 153.0
Transport 26 3 268 682 125 718.5 7.91 18.4 111 217.6 634 947.2 471 531.0
Retail trade 38 2 612 280.1 68 744.2 6.32 30.1 88 883.5 100 709.5 73 811.4
Wholesale trade 40 1 475 738.7 36 893.5 3.57 22.7 50 212.4 51 760.4 38 468.0
Telecommunications & communication 6 1 042 661.2 173 776.9 2.52 10.2 35 476.8 171 342.0 131 582.7
Engineering, industrial infrastructure construction
30 1 583 790.9 52 793 3.83 46.8 53 888.7 65 161.0 48 883.9
Multi-sector holding 1 969 318.9 969 318.9 2.34 19 32 981.2 60 151.7 6 407.1
Construction 9 321 210.2 35 690 0.78 18.3 10 929.4 21 409.3 16 813.0
Insurance 10 387 453.4 38 745.3 0.94 14.4 13 183.1 14 317.8 8 265.6
Housing & utilities sector 8 255 381.6 31 922.7 0.62 0.5 9 386.1 21 330.6 11 631.9
Agriculture 8 246 060.4 30 757.6 0.60 22.6 8 372.3 10 680.2 10 191.1
Information technologies 11 265 525.4 24 138.7 0.64 33.3 9 034.5 3 014.3 2 338.7
Service companies 3 98 211.9 32 737.3 0.24 29.6 3 341.7 5 151.5 5 594.9
Media 6 162 848.7 27 141.5 0.39 24.5 5 541 35 550.9 27 569.1
Packaging 1 24 854.2 24 854.2 0.06 -1.3 845.7 120.4 132.4
Public catering 1 34 145 34 145 0.08 30.3 1 161.8 4 889.1 3 679.9

product sales rose by 56.9% on average. The government programs aimed at sup-porting the agrarian sector accelerated the process of technical re-equipment in agriculture. The sector ’s leaders, the Rostselmash and Traktornye Zavody Concerns, have increased their sales by 60.7% and 55.7%, respectively, in this rating scale. However, once Russia joins the WTO, competition with foreign man-ufacturers will get much tougher in this segment. For this reason, companies are unlikely to maintain the same impressive growth rates of their businesses.
2011 witnessed peak demands for freight wagons. Needs of railway opera-tors, which had been postponed during the economic crisis, were exacerbated in 2011 by the necessity of replacing writ-ten-off rolling stock. In addition, buyers mostly represented by leasing companies sometimes preferred to acquire wagons for future use, hoping that demands would grow. Against this background, wagon producers managed to increase their turnover by 33.4% on average. The revenues of the sector’s largest company, i.e. Transmashholding, rose at a greater pace: its growth amounted to 37.2%, and the company was upgraded from the 74th position to the 66th position in the rat-ing scale. As regards railway companies, their growth was much more appropri-ate. RZD revenues went up by 9.2%. The First Cargo Company, which separated from the railway, built up its turnover slightly faster (13.4% growth). In late 2011, 75% of its shares were acquired by the Independent Transport Company (this transaction was not recorded in its statements for 2011); the company went on to become a leader in terms of devel-opment dynamics among railway opera-tors (41.4%). On the whole, the revenues of transport companies included in our list rose by 18.4%.
The MIS companies failed to achieve a considerable breakthrough despite the record fi gures of arms exports (in 2011, its volume reached 13.2 billion US dol-lars). In 2011, the growth rate in this sec-tor was 17.1% on average. However, there are some exceptions. Income generated by Sukhoi AHC rose by 83.4%. Apart from export supplies of fi ghter jets to Vietnam, Angola, and Uganda, an order placed by the government defense sector made a considerable contribution to its income growth: in addition to supplying com-bat aircraft to the army, the company is developing a project for the fi fth genera-tion fighter jet PAC FA, 86.9% of which was fi nanced by the state budget in 2011. In a couple of years, the Sukhoi Superjet project will start generating dividends for the company. Another fast-growing com-
pany in the MIS is the Moscow Thermal Engineering Institute, which is working on the development project of the Bulava intercontinental missile. In 2011, its rev-enues grew by 77.4%.
Industrial infrastructure construc-tion. The financing of major government projects associated with the construction of the Olympic facilities or gas pipelines continued even in economically rough times. The economic recovery was a cata-lyzer of a new wave of economic growth. Despite an exceptionally high average industry-specific indicator of dynam-ics (we should be reminded that com-panies’ income grew by almost one and a half times), several economic players managed to grow at a much faster pace. Velesstroi (163rd position in the rating scale) increased its income by 2.8 times,
which allowed it to rank third among the fastest growing companies of Expert-400. This is not surprising because it is the general contractor for several major pipeline construction projects: Eastern Siberia – Pacific, Baltic Pipeline System – 2, Purpe – Samotlor, Skovorodino – China. Transuzhstroi is another record breaker from the growth perspective (growth by 2.5 times); it built highways and railways in preparation for the Sochi Winter Olympic Games. Stroigazconsult-ing, a major company in this sector, can-not boast of such dynamics: its revenues grew by just 90% to reach 11.3 billion US dollars. These funds were earned, in par-ticular, as a result of participation in the Nord Stream gas pipeline construction project, the development of the Trans-polar Oil and Gas Condensate Field, and
59EXPERT–400
EX
PE
RT
.
SP
EC
IAL
IS
SU
E
Twenty most dynamic companies Table 3
No. Position in the Expert-400 rating scale
Company Growth rate (%)
1 76 Nissan Manufacturing Rus 363.8
2 254 Scania-Rus 192.0
3 163 Velesstroi 182.2
4 346 PA Vozrozhdenie 152.7
5 221 Transuzhstroi 151.8
6 216 GM Auto 126.1
7 387 Russian Power Machine Engineering Holding (REP-Holding)
123.5
8 274 Atomenergoproekt Research, Design and Engineering Institute
121.1
9 352 TGK-16 109.7
10 185 Volvo Vostok 102.1
11 231 International Grain Company 100.0
12 182 Petropavlovsk Group 99.6
13 23 Stroigasconsulting 92.3
14 110 Nomos-Bank 89.8
15 243 PSMA Rus (Peugeot Citroen and Mitsubishi Motors)
87.3
16 89 Sukhoi ACC 83.4
17 158 Stroiservice 82.1
18 386 Zeppelin Rusland 82.1
19 302 Stroinovatsia 81.2
20 126 Novoshakhtinsk Petroleum Factory 80.2

the construction of the Kolyma federal highway.
“Ghost” DynamicsIt should be recognized that a break-through in the manufacturing industry has made practically no impact on the to-tal structure of the rating scale or the list of its leaders. No progress was recorded among the top five largest companies of the rating scale (see Table 1). The share of the extraction sector, along with the iron & steel industries and the non-fer-rous metal industry, has not changed for a year in total revenues according to Ex-pert-400, remaining at the level of 42%. Furthermore, the specific weight of com-panies in the oil and gas sector even rose to 32.2% in the industry-specific struc-ture of the rating scale thanks to oil com-panies (their revenues grew by 29.1%). In addition, they made practically no efforts to achieve such dynamics.
In 2011, oil and gas extraction in Russia stagnated (the oil sector recorded a mere 0.7% growth and the gas sector a – 1.8% growth). Oil exports shrank from 233 to 219 million tons. Gas exports grew by 5.8%. Oil and gas companies profited from the situation on the global market for hydrocarbons. The average export prices of Russian oil rose by 42% and the gas price went up by 27% in a year. As a result, revenue growth of an overwhelm-ing majority of companies in the sector ranged from 25% to 35%. NovaTEK was
profitably distinguished against this background: its turnover increased by 1.5 times as a result of activated gas sales. A 42% gas extraction growth as a result of development in the Yurkharovskoe and Eastern Tarko-Sale fields contributed to such success.
The metallurgy sector was not as lucky with regard to the market situation. Metal prices plunged and led to almost a twofold slowdown in sales growth in the iron & steel industries (from 40.2% in the previ-ous rating scale to 22.4%). Among the key players, only the Novolipetsk Steel Mill, Metalloivest, and the Chelyabinsk Tube Rolling Plant were able to demonstrate more than a 30 percent growth rate. The collapse in the non-ferrous metal industry was even more conclusive: according to 2011 results, the growth rate of compa-nies in the sector dropped from 35% to 12%. Neither aluminum nor nickel drove the income growth of their manufacturers above 6% to 8%. The situation is quite dif-ferent when it comes to copper. The Ural Mining and Metallurgical Company turno-ver grew by 18.9%, whereas the Russian Copper Company saw its turnover go up by 23.6%. In the future, the metallurgical companies will have to rely on the domes-tic market to a greater extent. Once the main buyer of Russian steel, China is now becoming a powerful exporter; the situa-tion on the Middle East markets, in par-ticular in Iran, is not stable; in addition, sanctions have been imposed on Iran;
metal consumption in Europe is growing quite slowly. Only the implementation of major investment projects related to the construction of metal-consuming plants and factories will bring hope for stability in the long run.
Consumers in the Provinces Retail trade was one of the first sectors to suffer from the 2008 – 2009 economic crisis. However, difficulties have been successfully overcome. In 2011, incomes of the biggest retailers from the Expert-400 rating totaled almost 89 billion US dollars, which represents the highest achievement of the sector in the his-tory of our rating. Of course, pre-crisis growth dynamics (in 2007, retailers in-creased their revenues by nearly 50%) have remained a thing of the past; nev-ertheless, retail development indicators are now quite good. Turnovers of the 38 leading retail companies in this rating rose by 30.1% (see Diagram 2). Given the fact that major cities have practically no free niches left, business development opportunities are associated either with expansion to the regions or acquisitions of other economic players. For example, Magnit – the leading regional chain - in-creased its sales by 42%, which is higher by 10 percentage points than X5 Group, the sector’s leader (32.5%). Dixie Group has recorded an even higher growth rate (59.3%); in 2011, its regional business was strengthened by the acquisition of
60 EXPERT–400E
XP
ER
T.
S
PE
CIA
L
ISS
UE Twenty most profitable companies Table 4
No. No. in last year’s rating scale
Position in the Expert-400 rating scale
Company Profit before taxes in 2011 (RUB, million)
Net profit in 2011 (RUB, million)
1 1 1 Gazprom 1 679 936.0 1 307 018.0
2 2 3 Rosneft oil company 461 599.3 365 964.3
3 6 6 Savings Bank of Russia 395 681.0 316 195.0
4 3 2 LUKoil oil company 385 567.4 304 392.2
5 5 5 TNK-BP 364 524.2 263 951.6
6 8 8 Surgutneftegas 297 272.0 237 768.0
7 4 4 RZD 268 402.0 184 565.0
8 9 9 Transneft 235 529.0 188 105.0
9 7 17 Norilsky Nikel MMC 165 935.9 105 921.6
10 18 38 NovaTEK 135 025.0 119 655.0
11 12 15 VTB Group 115 500.0 89 400.0
12 14 11 Tatneft 85 909.0 61 428.0
13 – 29 Sibur 77 120.0 62 829.0
14 16 14 Severstal 71 387.5 59 803.7
15 – 46 FSK YeES 62 863.0 49 139.0
16 11 7 AFK Sistema 60 151.7 6 407.1
17 19 27 Metalloinvest 59 485.6 41 788.0
18 – 26 Rostelecom 57 025.0 46 240.0
19 15 31 Megafon Group 55 905.0 43 579.0
20 20 45 Gazprombank 53 902.0 42 207.0

the Victoria chain. Atac, a smaller super-market chain opened stores in areas near Moscow, and achieved a 52.2% growth rate. Car dealers have also recorded high growth rates. The Avtomir Company, a leader in this segment, increased its rev-enues by 42.2%; the Nezavisimost Group recorded a 44.8% revenue growth; and the volumes of sales of Genser rose by 50.5%.
Banks are catalyzers of the popula-tion’s consumer activities. The develop-ment of highly profitable retail crediting became the main factor of their income growth, which is 17.5% in this rating scale (see Diagram 3). In 2011, the retail portfolio of banks became one of most significant income growth locomotives in the sector. Assets in the banking system rose by 23% in a year; the retail portfolio grew by 36%; and the corporate portfo-lio went up by 26%. According to 2011 results, the retail segment share in assets reached 13.3%, while the corporate seg-ment share amounted to 42.6%. In 2011, the growth rate of banks’ interest income from the retail segment amounted to 27%, but only 1.7% from the corporate one. Rosbank and Trust represent two bright examples of active development in the retail segment. In 2011, Rosbank consolidated banks such as Rusfinance (retail segment), Deltacredit (mortgage), and Societe Generale East. As a result, in 2011 the assets of Rosbank grew by 64% and the retail portfolio rose by 131%. Retail segment volume amounted to 359 billion rubles, while the corporate seg-ment size totaled 243 billion rubles. In 2011, Trust recorded a 66% growth rate of individual portfolios, reaching 83 bil-lion rubles as part of its strategy of reo-rienting towards the retail segment. The corporate portfolio declined by 20%, down to 45 billion rubles.
The leading state-owned banks are unparalleled in the financial sector in terms of profit level. Having recorded a profit before taxes amounting to 395.7 billion rubles in 2011, Sberbank was up-graded to the third line in the list of the top twenty most profitable companies in the rating scale. The 11th and 20th posi-tions in this rating are held by the VTB Group and Gazprombank, respectively (see Table 4).
Telecom mu n ic at ion compa n ie s seem to have exhausted their opportu-nities for active development. The mar-ket for mobile communications and on-line services has become saturated and we can only hope for a slow evolution in growth. In 2011, the leading companies of this sector included in the Expert-400 rating scale earned 35.5 billion US dol-lars, representing just a 10.2% growth
year on year. The dynamics indicators shown by the sector’s leaders are even lower. Vimpelcom’s income grew by 7.8% and that of Rostelecom rose by 7.4%. Only Megaphone, ranking third in terms of business volume among telecommunica-tion companies (the 31st position in the
rating scale), outperformed the average level in this sector (the growth rate to-taled 12.6%). Tele-2, providing cellular communication services as a discounter and operating primarily in the regions, was the most dynamic company, showing income that grew by more than 20%. ■
61EXPERT–400
EX
PE
RT
.
SP
EC
IAL
IS
SU
ERegional structure of the Expert-400 rating scale Table 5
Region Number of companies
Share in the total volume of sales in the Expert-400
rating scale (%)
Volume of sales in 2011 (RUB, million)
Interregional companies 267 89.45 36 979 140.1
Moscow 32 2.46 1 016 751.1
Saint Petersburg 19 1.38 571 429.7
Chelyabinsk Region 5 1.10 456 219.0
Republic of Tatarstan 7 0.88 365 216.6
Samara Region 5 0.69 283 592.5
Moscow Region 10 0.62 254 464.4
Kemerovo Region 4 0.31 126 541.9
Sverdlovsk Region 4 0.24 98 318.8
Leningrad Region 3 0.29 121 252.8
Kaluga Region 3 0.25 103 531.9
Rostov Region 4 0.25 102 809.5
Republic of Bashkortostan 3 0.23 93 548.0
Tyumen Region 2 0.22 92 552.7
Krasnodar Territory 3 0.20 81 897.4
Belgorod Region 2 0.13 54 309.7
Altay Territory 2 0.09 37 511.1
Lipetsk Region 2 0.08 34 078.9
Krasnoyarsk Territory 2 0.08 33 867.4
Omsk Region 1 0.08 33 502.3
Khabarovsk Territory 2 0.08 32 293.0
Republic of Komi 1 0.07 29 458.8
Chukotka Autonomous District 1 0.07 29 323.9
Kursk Region 1 0.07 28 750.0
Voronezh Region 1 0.06 24 999.1
Perm Territory 1 0.06 24 083.7
Nizhny Novgorod Region 1 0.05 20 872.0
Novosibirsk Region 1 0.05 19 982.0
Republic of Sakha (Yakutia) 1 0.05 19 757.0
Kaliningrad Region 1 0.05 19 371.9
Amur Region 1 0.05 18 978.7
Arkhangelsk Region 1 0.05 18 778.6
Republic of Mari El 1 0.04 18 053.8
Udmurt Republic 1 0.04 17 612.1
Primorski Territory 1 0.04 17 432.1
Tula Region 1 0.04 16 927.2
Smolensk Region 1 0.04 16 732.1
Irkutsk Region 1 0.03 14 341.4
Republic of Karelia 1 0.03 14 318.6

Expe
rt-4
00 d
atab
ase
for
18 y
ears
— h
ttp:
//ww
w.ra
expe
rt.r
u/ra
tings
/exp
ert4
001–
5062 EXPERT–400
EX
PE
RT
.
SP
EC
IAL
IS
SU
E Rating of Russia’s largest companies in terms of volume of product sales 2012 2011 Company Region Sector Volume of sales in
2011 (RUB, million)1
1 1 Gazprom oil, oil and gas industry 4 637 090.02 2 LUKoil oil company oil, oil and gas industry 3 275 015.93 3 Rosneft oil company oil, oil and gas industry 1 858 035.84 4 RZD transport 1 480 879.05 6 TNK-BP oil, oil and gas industry 1 223 064.96 -4 Savings Bank of Russia banks 1 002 500.07 7 AFK Sistema multi-sector holdings 969 318.98 8 Surgutneftegaz oil, oil and gas industry 787 854.09 11 Transneft JSC transport 670 270.0
10 9 MRSK Holding electric power industry 634 608.011 10 Tatneft oil, oil and gas industry 615 867.012 - Inter RAO YeES electric power industry 536 244.013 14 Evraz Group iron & steel industry 481 996.014 13 Severstal iron & steel industry 464 726.415 - VTB Group banks 464 100.016 17 X5 Retail Group retail trade 454 225.017 15 Norilsky Nikel MMC non-ferrous metal industry 415 045.618 19 Mechel iron & steel industry 368 735.319 12 Rushydro electric power industry 362 599.020 18 United company Rusal non-ferrous metal industry 361 232.521 23 Novolipetsk Iron & Steel Works iron & steel industry 344 702.322 25 Magnit retail trade 335 729.623 - Stroigazconsulting engineering, industrial
infrastructure construction333 050.5
24 20 Vimpelcom telecommunications & communication
313 536.4
25 22 KES-holding electric power industry 302 952.0
26 - Rostelecom telecommunications & communication
296 015.0
27 27 Metalloinvest iron & steel industry 291 507.328 26 Magnitogorsk Iron & Steel Works Chelyabinsk
Regioniron & steel industry 273 503.3
29 - Sibur chemical, oil and chemical industry
248 660.0
30 36 Stroigazmontazh engineering, industrial infrastructure construction
244 839.7
31 28 Megaphone Group telecommunications & communication
242 608.0
32 30 OPK Oboronprom machine engineering 226 445.1
33 31 Auchan retail trade 205 147.034 29 Rosenergoatom Concern electric power industry 201 382.935 - Volkswagen Group Rus machine engineering 200 015.3
36 32 Pipe metallurgical company iron & steel industry 198 485.937 35 UMMC non-ferrous metal industry 185 391.0
38 46 NovaTEK oil, oil and gas industry 176 064.039 38 AvtoVAZ Group Samara
Regionmachine engineering 175 073.0
40 34 SIBENCO coal industry 167 013.041 37 Rusneft Oil Company oil, oil and gas industry 160 603.042 - PepsiCo food processing industry 159 914.1
43 42 Slavneft Oil Company oil, oil and gas industry 159 499.444 41 Aeroflot transport 158 056.545 - Gazprombank banks 157 151.046 49 FSK YeES electric power industry 139 571.047 48 Alrosa JSC precious metal and diamond
industry137 732.0
48 50 J.T.I. po Marketingu I Prodazham tobacco industry 137 100.149 55 GAZ Group machine engineering 132 444.850 54 Evrokhim Group chemical, oil and chemical
industry131 298.1
51 - TVEL machine engineering 128 037.1

63EXPERT–400
EX
PE
RT
.
SP
EC
IAL
IS
SU
E
Volume of sales in 2010 (RUB, million)
Growth rate (%)
Volume of sales in 2011 (USD, million)
Profit before taxes in 2011 (RUB, million)
Net profit in 2011 (RUB, million)
Reporting
3 597 054.0 28.9 157 777.8 1 679 936.0 1 307 018.0 IFRS2 615 049.6 25.2 111 433.0 385 567.4 304 392.2 US GAAP1 373 145.6 35.3 63 220.0 461 599.3 365 964.3 US GAAP1 355 854.0 9.2 50 387.2 268 402.0 184 565.0 IFRS953 871.2 28.2 41 615.0 364 524.2 263 951.6 US GAAP926 595.0 8.2 34 110.2 395 681.0 316 195.0 IFRS814 527.9 19.0 32 981.2 60 151.7 6 407.1 US GAAP615 714.0 28.0 26 806.9 297 272.0 237 768.0 RAS, consolidated447 532.0 49.8 22 806.1 235 529.0 188 105.0 IFRS559 496.0 13.4 21 592.7 53 655.0 23 438.0 IFRS468 032.0 31.6 20 955.0 85 909.0 61 428.0 US GAAP464 386.0 15.5 18 245.8 51 824.0 36 144.0 IFRS406 909.7 18.5 16 400.0 25 657.5 13 548.8 IFRS389 444.8 19.3 15 812.4 71 387.5 59 803.7 IFRS359 300.0 29.2 15 791.1 115 500.0 89 400.0 IFRS342 701.3 32.5 15 455.1 11 906.0 8 859.0 IFRS388 104.5 6.9 14 122.0 165 935.9 105 921.6 IFRS296 084.6 24.5 12 546.3 34 190.2 21 392.5 US GAAP526 581.0 -31.1 12 337.5 43 712.0 31 411.0 IFRS333 542.0 8.3 12 291.0 17 927.9 6 965.4 IFRS253 695.7 35.9 11 728.6 49 438.8 39 899.7 US GAAP236 277.5 42.1 11 423.3 16 491.7 12 304.9 IFRS173 188.7 92.3 11 332.1 n/a n/a management
accounting290 749.0 7.8 10 668.1 41 426.0 31 183.6 US GAAP
275 412.0 10.0 10 308.0 n/a n/a management accounting
275 731.0 7.4 10 072.0 57 025.0 46 240.0 IFRS
217 314.0 34.1 9 918.6 59 485.6 41 788.0 IFRS234 503.2 16.6 9 306.0 -4 144.0 -3 526.8 IFRS
188 563.0 31.9 8 460.7 77 120.0 62 829.0 IFRS
154 412.5 58.6 8 330.7 17 221.8 12 627.4 management accounting
215 515.0 12.6 8 254.8 55 905.0 43 579.0 US GAAP
181 584.0 24.7 7 704.8 41 319.7 36 499.3 management accounting
178 142.6 15.2 6 980.2 10 985.2 8 607.1 RAS210 222.7 -4.2 6 852.1 1 544.6 -2 913.4 RAS116 342.6 71.9 6 805.6 n/a n/a management
accounting according to the IFRS
169 477.8 17.1 6 753.5 15 992.2 11 172.0 IFRS155 940.5 18.9 6 308.0 27 241.0 21 471.0 management
accounting according to the IFRS
117 024.0 50.5 5 990.6 135 025.0 119 655.0 IFRS137 630.0 27.2 5 956.9 8 463.0 6 793.0 IFRS
131 200.0 27.3 5 682.6 31 290.0 23 703.0 IFRS139 077.3 15.5 5 464.5 -3 433.5 -3 822.8 RAS145 135.3 10.2 5 441.1 n/a n/a management
accounting130 958.9 21.8 5 427.0 1 769.2 -2 450.7 US GAAP131 220.3 20.5 5 377.9 17 202.0 15 418.0 IFRS111 070.0 41.5 5 347.1 53 902.0 42 207.0 IFRS113 330.0 23.2 4 748.9 62 863.0 49 139.0 IFRS113 394.0 21.5 4 686.4 38 313.0 26 480.0 IFRS
112 536.0 21.8 4 664.9 16 074.2 12 584.6 RAS96 720.8 36.9 4 506.5 9 457.4 8 208.6 IFRS97 787.5 34.3 4 467.4 40 100.2 32 028.3 IFRS
98 779.7 29.6 4 356.5 25 690.0 19 546.6 IFRS

64Ex
pert
-400
dat
abas
e fo
r 18
yea
rs—
htt
p://w
ww.
raex
pert
.ru/
ratin
gs/e
xper
t400
51–1
01E XPERT–400
EX
PE
RT
.
SP
EC
IAL
IS
SU
E Rating of Russia’s largest companies in terms of volume of product sales 2012 2011 Company Region Sector Volume of sales in
2011 (RUB, million)1
52 39 Concern PVO Almaz-Antei machine engineering 127 431.4
53 70 Avtotor Group machine engineering 127 097.2
54 - Spetsstroi Rossii engineering, industrial infrastructure construction
126 022.5
55 56 Nizhnekamskneftekhim Republic of Tatarstan
chemical, oil and chemical industry
126 021.0
56 57 TAIF-NK Republic of Tatarstan
oil, oil and gas industry 124 269.0
57 52 Post of Russia telecommunications & communication
120 707.1
58 78 Rolf Group retail trade 119 734.159 45 United Metallurgical Company iron & steel industry 118 978.0
60 - Rosselkhozbank banks 118 148.061 - First Cargo Company transport 117 373.462 65 ChTPZ Chelyabinsk
Regioniron & steel industry 113 970.9
63 63 M. Video retail trade 111 937.064 53 Protek Group wholesale trade 107 052.765 79 KamAZ Group machine engineering 106 830.066 74 Transmashholding machine engineering 106 200.0
67 58 Philip Morris Sales and Marketing tobacco industry 104 333.968 - Uralkaliy Group chemical, oil and chemical
industry102 744.2
69 84 Dixie Group retail trade 102 317.370 62 SIA International Ltd Moscow wholesale trade 101 785.971 76 Fosagro Group chemical, oil and chemical
industry100 518.0
72 95 Gazprom Avtomatizatsia engineering, industrial infrastructure construction
99 458.6
73 61 Evrosibenergo electric power industry 99 248.0
74 89 Mostotrest engineering, industrial infrastructure construction
98 996.0
75 77 Lenta St. Petersburg
retail trade 98 379.4
76 264 Nissan Manufacturing Rus St. Petersburg
machine engineering 97 821.3
77 - Alfa-Bank Group banks 95 282.478 69 O’kei Group retail trade 93 134.479 75 Katren wholesale trade 92 268.780 - Uralvagonzavod RPC machine engineering 91 381.4
81 64 MOEK Moscow housing and utilities sector 90 698.082 82 Alliance Oil Company oil, oil and gas industry 90 599.483 73 Baltika Brewery food processing industry 89 795.284 83 Merlion Company wholesale trade 88 883.2
85 72 Rossgosstrakh Group insurance 88 628.386 80 National Computer Corporation wholesale trade 87 999.6
87 - Glavstroi Corporation construction 87 225.2
88 88 Transaero Airline transport 86 494.489 - Sukhoi AHC machine engineering 84 431.0
90 66 Eldorado retail trade 83 630.191 - Rosbank Group banks 80 975.092 97 Ford Motor Company Leningrad
Regionmachine engineering 74 779.0
93 105 Polyus Zoloto precious metal and diamond industry
70 615.6
94 67 Tekhsnabexport wholesale trade 70 513.895 93 Svyaznoi Group retail trade 70 116.0
96 104 SU-155 Group construction 70 100.0
97 114 Avtomir Group retail trade 69 867.2
98 99 Sollers Group machine engineering 69 531.099 - Evroset retail trade 69 371.0
100 91 N-Trans Group transport 68 611.5
101 90 Nestle Russia food processing industry 66 829.0

65EXPERT–400
EX
PE
RT
.
SP
EC
IA
L
IS
SU
E
Volume of sales in 2010 (RUB, million)
Growth rate (%)
Volume of sales in 2011 (USD, million)
Profit before taxes in 2011 (RUB, million)
Net profit in 2011 (RUB, million)
Reporting
134 699.0 -5.4 4 335.9 2 237.0 940.4 management accounting
82 018.9 55.0 4 324.5 10 459.2 n/a management accounting according to the IFRS
105 896.0 19.0 4 287.9 1 850.9 1 156.4 management accounting
96 516.0 30.6 4 287.9 21 178.0 16 691.0 IFRS
93 532.2 32.9 4 228.3 19 991.0 15 889.3 RAS
105 445.6 14.5 4 107.1 -57.6 797.7 RAS
74 650.1 60.4 4 074.0 5 845.1 2 926.1 IFRS118 441.0 0.5 4 048.2 20 227.0 16 138.0 management
accounting108 418.0 9.0 4 020.0 350.0 367.0 IFRS103 493.0 13.4 3 993.7 32 815.8 26 050.5 IFRS85 400.7 33.5 3 877.9 1 088.1 496.4 IFRS
86 565.0 29.3 3 808.7 4 638.0 3 374.0 IFRS99 840.8 7.2 3 642.5 2 375.9 1 846.7 IFRS73 773.0 44.8 3 634.9 2 615.0 1 778.0 IFRS77 400.0 37.2 3 613.5 10 900.0 7 400.0 management
accounting according to the IFRS
91 139.9 14.5 3 550.0 1 646.6 1 216.4 RASn/a - 3 495.9 39 304.6 34 798.7 IFRS
64 236.2 59.3 3 481.4 2 147.5 1 101.8 IFRS87 050.6 16.9 3 463.3 384.8 219.3 RAS76 951.0 30.6 3 420.1 28 296.0 19 935.0 IFRS
56 284.1 76.7 3 384.1 1 897.8 1 366.9 management accounting
87 145.0 13.9 3 376.9 -4 742.0 -6 360.0 management accounting according to the IFRS
74 879.0 32.2 3 368.4 5 081.0 3 714.0 IFRS
76 232.4 29.1 3 347.4 4 944.0 3 818.8 RAS
21 091.9 363.8 3 328.4 2 857.2 2 346.0 RAS
83 727.3 13.8 3 242.0 22 395.2 18 839.0 IFRS82 666.6 12.7 3 168.9 4 369.7 3 239.9 IFRS77 068.8 19.7 3 139.5 1 071.4 656.8 IFRS69 306.8 31.9 3 109.3 11 613.9 9 816.4 management
accounting85 840.0 5.7 3 086.0 1 475.0 -3 180.0 IFRS66 707.1 35.8 3 082.7 12 718.8 9 371.7 IFRS79 307.0 13.2 3 055.3 22 201.1 17 713.2 IFRS66 519.8 33.6 3 024.3 n/a n/a management
accounting according to the US GAAP
79 791.2 11.1 3 015.6 2 446.4 1 615.7 RAS69 355.7 26.9 2 994.2 n/a n/a management
accounting79 100.1 10.3 2 967.9 n/a n/a management
accounting60 865.5 42.1 2 943.0 2 014.6 1 831.9 RAS46 026.0 83.4 2 872.8 3 507.0 3 620.0 management
accounting according to the IFRS
83 453.5 0.2 2 845.5 10 806.4 10 189.6 RAS53 498.0 51.4 2 755.2 10 939.0 8 426.0 IFRS55 487.0 34.8 2 544.4 3 213.0 2 602.0 RAS
53 128.7 32.9 2 402.7 22 485.3 13 783.9 IFRS
83 261.2 -15.3 2 399.2 17 139.2 13 318.8 RAS56 384.9 24.4 2 385.7 n/a n/a management
accounting according to the IFRS
53 400.0 31.3 2 385.2 n/a n/a management accounting
49 127.3 42.2 2 377.2 n/a n/a management accounting
55 266.0 25.8 2 365.8 6 275.0 4 594.0 IFRS59 274.6 17.0 2 360.4 2 762.2 1 554.4 RAS57 043.5 20.3 2 334.5 22 012.7 12 887.1 management
accounting according to the IFRS
59 319.1 12.7 2 273.9 752.0 1 019.0 RAS

66Ex
pert
-400
dat
abas
e fo
r 18
yea
rs—
htt
p://w
ww.
raex
pert
.ru/
ratin
gs/e
xper
t400
102–
150
E XPERT–400E
XP
ER
T.
S
PE
CIA
L
ISS
UE Rating of Russia’s largest companies in terms of volume of product sales
2012 2011 Company Region Sector Volume of sales in 2011 (RUB, million)1
102 96 LG Electronics Rus wholesale trade 66 762.7103 111 E.ON Russia electric power industry 66 089.3104 122 Acron Group chemical, oil and chemical
industry65 431.0
105 94 Moscow Metropolitan Moscow transport 64 605.0106 116 Itera Oil & Gas Company oil, oil and gas industry 63 798.1107 158 Avtoframos Moscow machine engineering 62 862.3108 160 Mezhregiontruboprovodstroi engineering, industrial
infrastructure construction62 092.5
109 139 OKhC Uralkhim chemical, oil and chemical industry
61 140.5
110 - Nomos-Bank banks 60 418.3111 124 Eurasia Drilling Company service companies 60 405.6112 106 Enel OGK-5 electric power industry 60 102.5113 81 Transoil transport 59 893.9
114 103 Ilim Group forest, wood processing, and pulp & paper industry
59 238.4
115 128 Samsung Electronics Rus Kaluga Kaluga Region
machine engineering 57 250.9
116 115 Mars Moscow Region
food processing industry 56 996.4
117 85 Bashkirenergo Republic of Bashkor-tostan
electric power industry 56 261.0
118 125 Yug Rusi Group2 agricultural sector 56 059.7
119 146 Evrotsement Group building materials 55 741.0
120 132 Koks Group iron & steel industry 55 589.0121 149 Leroy Merlin Vostok retail trade 55 527.8122 129 Utair Airline Tyumen
Regiontransport 55 337.7
123 130 Russkaya Mednaya Compania Group non-ferrous metal industry 54 844.6
124 - Promsvyazbank banks 54 646.6125 - Sedmoi Continent Rostov
Regionretail trade 54 229.1
126 194 Novoshakhtinsky Petroleum Factory oil, oil and gas industry 53 952.0127 119 SOGAZ Group insurance 53 610.5128 108 Rosta Moscow
Regionwholesale trade 53 312.4
129 143 Ikea Dom retail trade 53 142.7130 117 AEON Corporation transport 52 236.5
131 120 Stroi-Trust engineering, industrial infrastructure construction
52 143.1
132 137 RESO-Garantia insurance 52 105.6133 112 LSR Group building materials 51 909.7134 138 Tele2 Russia telecommunications &
communication51 857.7
135 - Far-Eastern Generating Company electric power industry 51 716.1136 136 Ingosstrakh Group insurance 51 419.0137 134 Coca-Cola HBC Eurasia food processing industry 51 311.7138 - Atomenergomash machine engineering 50 939.8139 165 LANIT Group informational technologies 50 254.9
140 109 Silovye Mashiny Concern machine engineering 50 046.9141 118 Volga-Dnepr Group transport 49 528.1142 182 Traktornye Zavody Concern machine engineering 49 134.0
143 110 Irkut Corporation machine engineering 47 789.0144 - Raiffeisenbank banks 47 702.4145 - Hands Motor Manufacturing Rus St.
Petersburgmachine engineering 47 698.0
146 180 Avilon AG retail trade 47 689.2
147 147 Gazprom-Media Holding media 46 876.0148 152 PIK Group construction 45 991.0149 - UniCredit Bank banks 45 395.8150 145 S7 Airlines (Sibir Airline) transport 45 264.1

67EXPERT–400
EX
PE
RT
.
SP
EC
IA
L
IS
SU
E
Volume of sales in 2010 (RUB, million)
Growth rate (%)
Volume of sales in 2011 (USD, million)
Profit before taxes in 2011 (RUB, million)
Net profit in 2011 (RUB, million)
Reporting
55 757.9 19.7 2 271.6 2 609.7 1 812.7 RAS50 321.9 31.3 2 248.7 18 177.2 14 606.7 IFRS46 738.0 40.0 2 226.3 25 524.0 18 329.0 IFRS
56 331.4 14.7 2 198.2 8 328.1 5 962.5 RAS48 662.8 31.1 2 170.7 7 345.2 5 660.2 IFRS36 216.4 73.6 2 138.9 4 500.8 3 748.8 RAS36 172.0 71.7 2 112.7 12 852.3 10 168.5 RAS
42 201.4 44.9 2 080.3 16 396.9 12 931.5 IFRS
31 835.0 89.8 2 055.7 15 532.9 10 003.6 IFRS45 222.9 33.6 2 055.3 5 473.2 4 252.4 RAS52 560.6 14.3 2 045.0 6 271.7 4 975.0 IFRS67 823.0 -11.7 2 037.9 9 480.6 7 570.2 Management
accounting according to the IFRS
53 507.6 10.7 2 015.6 10 767.3 8 589.6 RAS
44 519.6 28.6 1 948.0 8 474.0 7 497.2 RAS
48 680.3 17.1 1 939.3 11 162.8 8 849.8 RAS
62 852.0 -10.5 1 914.3 4 447.0 7 949.0 IFRS
45 210.5 24.0 1 907.4 n/a n/a Management accounting according to the IFRS
39 780.0 40.1 1 896.6 13 206.0 10 238.0 Management accounting according to the IFRS
44 259.0 25.6 1 891.4 1 728.0 1 274.0 IFRS38 551.3 44.0 1 889.3 3 870.9 2 772.5 RAS44 398.5 24.6 1 882.9 450.0 114.0 IFRS
44 381.6 23.6 1 866.1 6 246.8 4 692.3 Management accounting according to the IFRS
53 881.2 1.4 1 859.4 7 063.6 5 259.2 IFRS40 668.1 33.3 1 845.2 1 235.7 761.7 RAS
29 939.1 80.2 1 835.7 2 668.2 2 307.1 RAS47 819.6 12.1 1 824.1 9 019.7 6 882.9 IFRS50 986.6 4.6 1 814.0 495.2 322.1 RAS
39 922.0 33.1 1 808.2 3 657.4 2 798.7 RAS48 609.0 7.5 1 777.4 5 889.4 4 664.7 Management
accounting47 149.6 10.6 1 774.2 443.9 332.4 RAS
43 525.8 19.7 1 772.9 4 459.2 3 592.9 IFRS49 949.5 3.9 1 766.2 3 734.0 2 473.0 IFRS42 746.3 21.3 1 764.5 16 136.7 9 053.5 Management
accounting according to the IFRS
45 228.0 14.3 1 759.6 -14 992.6 -12 185.6 IFRS43 872.0 17.2 1 749.5 3 775.0 2 681.0 IFRS44 199.4 16.1 1 745.9 -2 392.0 -2 323.2 RAS
n/a - 1 733.2 2 674.9 1 706.7 RAS consolidated 35 012.7 43.5 1 709.9 n/a n/a Management
accounting50 875.0 -1.6 1 702.9 11 464.6 9 312.0 IFRS48 224.8 2.7 1 685.2 2 717.5 1 965.8 IFRS31 553.0 55.7 1 671.8 -3 814.0 -3 579.0 Management
accounting50 815.1 -6.0 1 626.0 4 829.0 3 610.9 IFRS41 209.2 15.8 1 623.1 18 286.1 13 855.4 IFRS
- 1 622.9 1 915.4 1 495.7 RAS
31 805.7 49.9 1 622.6 n/a n/a Management accounting according to the IFRS
39 219.0 19.5 1 595.0 8 191.0 5 719.0 IFRS38 090.0 20.7 1 564.9 6 412.0 4 645.0 IFRS41 016.2 10.7 1 544.6 19 866.3 15 787.8 IFRS39 822.4 13.7 1 540.1 733.5 733.5 RAS

68Ex
pert
-400
dat
abas
e fo
r 18
yea
rs—
htt
p://w
ww.
raex
pert
.ru/
ratin
gs/e
xper
t400
151–
200
E XPERT–400E
XP
ER
T.
S
PE
CIA
L
ISS
UE Rating of Russia’s largest companies in terms of volume of product sales
2012 2011 Company Region Sector Volume of sales in 2011 (RUB, million)1
151 175 Kraft Foods Rus food processing industry 44 730.7152 176 Sportmaster Chain retail trade 44 658.3153 188 Nezavisimost Group retail trade 44 548.2
154 190 ARMZ Uranium Holding non-ferrous metal industry 44 495.0155 150 ATO State-Owned Corporation transport 44 094.4156 142 Mosvodokanal Moscow housing and utilities sector 43 443.4157 163 Cherkizovo Group food processing industry 43 288.3158 241 Stroiservice Kemerovo
Regionwholesale trade 43 169.1
159 161 M. V. Khrunichev GKNPTs Moscow machine engineering 43 150.0
160 155 Obiedinionnye Konditery Holding food processing industry 42 824.6161 196 Farmstandart pharmaceutical industry 42 653.9162 144 Sovkomflot Group transport 42 290.0163 - Velesstroi engineering, industrial
infrastructure construction42 108.6
164 183 Goznak printing industry 41 983.0165 198 Atlant-M Holding retail trade 41 621.0
166 177 Stroitransgaz engineering, industrial infrastructure construction
41 369.4
167 - Efko Group food processing industry 40 743.0
168 164 Quadra Generating Company electric power industry 40 227.0169 154 SAN InBev food processing industry 40 081.0170 187 Rusagro Group agricultural sector 39 715.1171 - Home Credit Bank banks 39 666.0172 184 R-Farm wholesale trade 39 566.0173 - Uralsib Bank banks 39 162.0174 237 Metallservice wholesale trade 39 084.5175 207 Polimetall precious metal and diamond
industry38 983.8
176 204 Crocus International Moscow retail trade 38 868.8177 186 Sibuglemet Holding Kemerovo
Regioncoal industry 38 858.1
178 167 Miratorg Agricultural Holding agricultural sector 38 495.0179 171 Takticheskoe Raketnoe Vooruzhenie
Corporationmachine engineering 38 028.6
180 - Henkel Russia Group chemical, oil and chemical industry
37 501.0
181 - Antipinski OR Tyumen Region
oil, oil and gas industry 37 215.0
182 295 Petropavlovsk Group precious metal and diamond industry
37 104.6
183 179 Group E4 engineering, industrial infrastructure construction
37 051.8
184 173 Kazanorgsintez Republic of Tatarstan
chemical, oil and chemical industry
36 714.0
185 306 Volvo Vostok wholesale trade 36 437.7186 - Russki Standart Bank banks 35 864.0187 245 Steel Industrial Company Sverdlovsk
Regionwholesale trade 35 834.1
188 168 Mosgortrans Moscow transport 35 827.7189 209 Media-Saturn Russia retail trade 35 705.7
190 195 Chelyabinsk Electrical Iron and Steel Works
Chelyabinsk Region
iron & steel industry 35 595.1
191 140 Atomenergoproekt Nizhny Novgorod Engineering Company
engineering, industrial infrastructure construction
35 307.8
192 203 Tekhnoserv informational technologies 34 886.4
193 206 Adidas Moscow wholesale trade 34 857.9194 189 Philips wholesale trade 34 778.0195 200 Rossiyskie Komunalnyie Sistemy housing and utilities sector 34 490.0
196 222 MacDonald’s public catering 34 145.0197 - Unimilk food processing industry 34 008.4198 252 Titan Group Omsk Region chemical, oil and chemical
industry33 502.3
199 217 Real-Hypermarket retail trade 33 349.5200 191 British American Tobacco Russia tobacco industry 33 131.3

69EXPERT–400
EX
PE
RT
.
SP
EC
IA
L
IS
SU
E
Volume of sales in 2010 (RUB, million)
Growth rate (%)
Volume of sales in 2011 (USD, million)
Profit before taxes in 2011 (RUB, million)
Net profit in 2011 (RUB, million)
Reporting
33 140.5 35.0 1 522.0 4 457.8 3 492.8 RAS32 980.1 35.4 1 519.5 5 133.5 3 934.5 RAS30 762.4 44.8 1 515.8 n/a n/a management
accounting according to the IFRS
30 222.0 47.2 1 514.0 5 730.0 2 638.0 IFRS38 435.3 14.7 1 500.3 6 386.8 4 748.6 RAS40 353.7 7.7 1 478.2 5 207.5 3 277.9 RAS36 097.9 19.9 1 472.9 4 572.1 4 344.6 US GAAP23 709.9 82.1 1 468.8 2 475.8 2 016.9 RAS
36 170.9 19.3 1 468.2 819.1 611.2 management accounting
36 556.7 17.1 1 457.1 3 105.3 938.6 IFRS29 686.6 43.7 1 451.3 11 237.6 8 780.5 IFRS39 886.8 6.0 1 438.9 2 092.6 1 535.8 IFRS14 924.1 182.2 1 432.8 1 980.9 1 495.1 RAS
31 486.9 33.3 1 428.5 5 014.2 3 807.1 RAS29 440.9 41.4 1 416.2 n/a n/a management
accounting32 480.9 27.4 1 407.6 1 748.4 851.4 RAS
32 704.0 24.6 1 386.3 971.0 745.0 management accounting
35 542.5 13.2 1 368.7 1 187.1 879.0 IFRS37 478.0 6.9 1 363.8 -4 059.4 -3 310.7 RAS30 955.5 28.3 1 351.3 2 627.4 2 364.7 IFRS33 033.0 20.1 1 349.6 13 632.0 10 754.0 IFRS31 289.1 26.5 1 346.2 4 024.2 3 119.1 RAS42 537.0 -7.9 1 332.5 -5 100.0 -3 940.0 IFRS24 259.2 61.1 1 329.9 926.6 712.5 RAS28 112.9 38.7 1 326.4 12 016.0 8 503.2 IFRS
28 351.6 37.1 1 322.5 207.4 104.0 RAS31 188.6 24.6 1 322.2 10 380.4 8 300.6 RAS
34 367.0 12.0 1 309.8 6 253.0 5 964.0 IFRS34 017.2 11.8 1 293.9 5 032.4 4 070.6 management
accounting42 213.0 -11.2 1 276.0 5 328.0 4 228.0 management
accounting according to the IFRS
21 172.0 75.8 1 266.2 1 925.0 1 398.0 management accounting according to the IFRS
18 593.0 99.6 1 262.5 10 619.3 6 785.7 IFRS
32 393.9 14.4 1 260.7 1 510.9 1 076.4 management accounting
33 567.0 9.4 1 249.2 585.0 388.0 IFRS
18 031.1 102.1 1 239.8 2 977.3 2 335.1 RAS29 752.0 20.0 1 220.3 6 602.0 5 011.0 IFRS23 077.8 55.3 1 219.3 327.8 270.9 RAS
34 417.4 4.1 1 219.0 359.5 172.1 RAS27 952.9 27.7 1 214.9 n/a n/a management
accounting according to the IFRS
29 849.0 19.3 1 211.1 556.3 303.0 RAS
41 081.5 -14.1 1 201.4 828.2 707.8 RAS
28 404.7 22.8 1 187.0 n/a n/a management accounting
28 157.1 23.8 1 186.0 6 695.6 5 313.9 RAS30 669.0 13.4 1 183.3 803.5 414.0 RAS29 155.3 18.3 1 173.5 1 708.0 1 414.4 management
accounting 26 207.2 30.3 1 161.8 4 889.1 3 679.9 RAS35 326.9 -3.7 1 157.1 564.0 470.7 RAS22 307.9 50.2 1 139.9 1 657.4 1 240.6 management
accounting27 538.6 21.1 1 134.7 -118.4 -342.2 RAS30 340.3 9.2 1 127.3 n/a n/a management
accounting
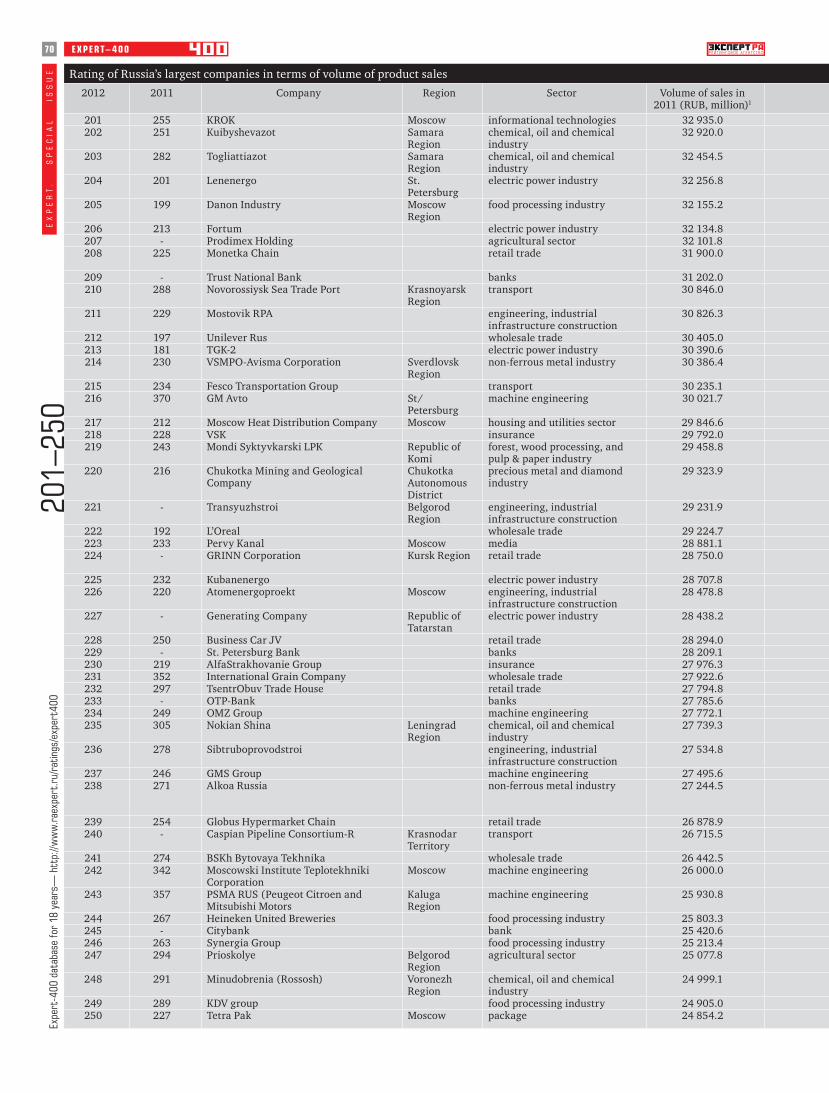
70Ex
pert
-400
dat
abas
e fo
r 18
yea
rs—
htt
p://w
ww.
raex
pert
.ru/
ratin
gs/e
xper
t400
201–
250
E XPERT–400E
XP
ER
T.
S
PE
CIA
L
ISS
UE Rating of Russia’s largest companies in terms of volume of product sales
2012 2011 Company Region Sector Volume of sales in 2011 (RUB, million)1
201 255 KROK Moscow informational technologies 32 935.0202 251 Kuibyshevazot Samara
Regionchemical, oil and chemical industry
32 920.0
203 282 Togliattiazot Samara Region
chemical, oil and chemical industry
32 454.5
204 201 Lenenergo St. Petersburg
electric power industry 32 256.8
205 199 Danon Industry Moscow Region
food processing industry 32 155.2
206 213 Fortum electric power industry 32 134.8207 - Prodimex Holding agricultural sector 32 101.8208 225 Monetka Chain retail trade 31 900.0
209 - Trust National Bank banks 31 202.0210 288 Novorossiysk Sea Trade Port Krasnoyarsk
Regiontransport 30 846.0
211 229 Mostovik RPA engineering, industrial infrastructure construction
30 826.3
212 197 Unilever Rus wholesale trade 30 405.0213 181 TGK-2 electric power industry 30 390.6214 230 VSMPO-Avisma Corporation Sverdlovsk
Regionnon-ferrous metal industry 30 386.4
215 234 Fesco Transportation Group transport 30 235.1216 370 GM Avto St/
Petersburgmachine engineering 30 021.7
217 212 Moscow Heat Distribution Company Moscow housing and utilities sector 29 846.6218 228 VSK insurance 29 792.0219 243 Mondi Syktyvkarski LPK Republic of
Komiforest, wood processing, and pulp & paper industry
29 458.8
220 216 Chukotka Mining and Geological Company
Chukotka Autonomous District
precious metal and diamond industry
29 323.9
221 - Transyuzhstroi Belgorod Region
engineering, industrial infrastructure construction
29 231.9
222 192 L’Oreal wholesale trade 29 224.7223 233 Pervy Kanal Moscow media 28 881.1224 - GRINN Corporation Kursk Region retail trade 28 750.0
225 232 Kubanenergo electric power industry 28 707.8226 220 Atomenergoproekt Moscow engineering, industrial
infrastructure construction28 478.8
227 - Generating Company Republic of Tatarstan
electric power industry 28 438.2
228 250 Business Car JV retail trade 28 294.0229 - St. Petersburg Bank banks 28 209.1230 219 AlfaStrakhovanie Group insurance 27 976.3231 352 International Grain Company wholesale trade 27 922.6232 297 TsentrObuv Trade House retail trade 27 794.8233 - OTP-Bank banks 27 785.6234 249 OMZ Group machine engineering 27 772.1235 305 Nokian Shina Leningrad
Regionchemical, oil and chemical industry
27 739.3
236 278 Sibtruboprovodstroi engineering, industrial infrastructure construction
27 534.8
237 246 GMS Group machine engineering 27 495.6238 271 Alkoa Russia non-ferrous metal industry 27 244.5
239 254 Globus Hypermarket Chain retail trade 26 878.9240 - Caspian Pipeline Consortium-R Krasnodar
Territorytransport 26 715.5
241 274 BSKh Bytovaya Tekhnika wholesale trade 26 442.5242 342 Moscowski Institute Teplotekhniki
CorporationMoscow machine engineering 26 000.0
243 357 PSMA RUS (Peugeot Citroen and Mitsubishi Motors
Kaluga Region
machine engineering 25 930.8
244 267 Heineken United Breweries food processing industry 25 803.3245 - Citybank bank 25 420.6246 263 Synergia Group food processing industry 25 213.4247 294 Prioskolye Belgorod
Regionagricultural sector 25 077.8
248 291 Minudobrenia (Rossosh) Voronezh Region
chemical, oil and chemical industry
24 999.1
249 289 KDV group food processing industry 24 905.0250 227 Tetra Pak Moscow package 24 854.2

71EXPERT–400
EX
PE
RT
.
SP
EC
IA
L
IS
SU
E
Volume of sales in 2010 (RUB, million)
Growth rate (%)
Volume of sales in 2011 (USD, million)
Profit before taxes in 2011 (RUB, million)
Net profit in 2011 (RUB, million)
Reporting
22 207.3 48.3 1 120.6 n/a n/a RAS22 454.0 46.6 1 120.1 6 005.0 4 730.0 IFRS
19 735.7 64.4 1 104.3 9 355.5 7 273.2 RAS
28 573.6 12.9 1 097.5 -844.7 -950.5 IFRS
29 331.7 9.6 1 094.1 1 926.8 1 305.3 RAS
27 715.9 15.9 1 093.4 3 821.1 2 924.3 RAS29 062.5 10.5 1 092.3 103.4 75.3 RAS25 800.0 23.6 1 085.4 n/a n/a management
accounting19 440.0 60.5 1 061.17 550.0 262.0 IFRS19 300.9 59.8 1 049.5 4 835.2 3 735.5 IFRS
24 904.8 23.8 1 048.9 811.8 607.7 RAS
29 667.1 2.5 1 034.5 -1 270.6 -1 087.2 RAS31 609.1 -3.9 1 034.0 -3 738.0 -3 551.1 IFRS24 748.2 22.8 1 033.9 3 892.8 3 058.2 RAS
24 322.0 24.3 1 028.8 1 735.2 565.8 IFRS13 277.6 126.1 1 021.5 -2 471.2 -2 180.9 RAS
27 820.6 7.3 1 015.5 2 279.3 1 537.0 RAS25 148.6 18.5 1 013.7 579.0 423.7 RAS23 630.0 24.7 1 002.3 4 070.5 3 171.0 RAS
27 369.6 7.1 997.8 10 498.9 6 626.8 RAS
11 611.1 151.8 994.6 2 005.8 1 579.7 RAS
30 268.9 -3.4 994.4 2 905.9 1 866.7 RAS24 482.2 18.0 982.7 3 582.6 2 785.4 RAS27 795.0 3.4 978.2 2 197.5 1 916.5 management
accounting24 535.5 17.0 976.8 -2 221.0 -1 861.8 RAS27 039.1 5.3 969.0 1 390.2 906.1 RAS
33 183.8 -14.3 967.6 272.6 75.4 IFRS
22 585.3 25.3 962.7 1 624.4 1 290.4 RAS26 267.0 7.4 959.8 7 287.1 5 885.5 IFRS27 166.9 3.0 951.9 792.9 569.4 RAS13 957.9 100.0 950.1 -125.4 -113.8 RAS18 376.3 51.3 945.7 567.0 315.2 RAS21 942.6 26.6 945.4 7 667.3 6 003.7 IFRS22 663.6 22.5 945.0 -1 981.9 -1 392.1 IFRS18 085.9 53.4 943.8 9 128.3 7 573.7 RAS
20 020.0 37.5 936.9 36.5 9.1 RAS
23 070.0 19.2 935.5 4 267.0 3 224.7 IFRS20 319.5 34.1 927.0 n/a n/a management
accounting according to the IFRS
22 269.9 20.7 914.6 600.1 316.3 RAS28 557.2 -6.4 909.0 6 495.2 5 290.2 IFRS
20 152.2 31.2 899.7 114.1 70.2 RAS14 652.2 77.4 884.7 63.7 36.2 RAS
13 843.0 87.3 882.3 -1 597.2 -1 561.2 RAS
20 770.9 24.2 878.0 -1 695.5 -1 410.1 RAS21 851.2 16.3 864.9 10 238.3 8 567.4 IFRS21 127.9 19.3 857.9 2 177.5 1 589.3 IFRS18 701.5 34.1 853.3 1 217.1 1 216.5 RAS
18 994.3 31.6 850.6 6 808.0 5 517.5 RAS
19 146.2 30.1 847.4 37.8 14.5 RAS25 182.5 -1.3 845.7 120.4 132.4 RAS

72Ex
pert
-400
dat
abas
e fo
r 18
yea
rs—
htt
p://w
ww.
raex
pert
.ru/
ratin
gs/e
xper
t400
251–
300
E XPERT–400E
XP
ER
T.
S
PE
CIA
L
ISS
UE Rating of Russia’s largest companies in terms of volume of product sales
2012 2011 Company Region Sector Volume of sales in 2011 (RUB, million)1
251 260 Oriola wholesale trade 24 560.1252 244 MSK Insurance Group insurance 24 497.4253 273 VGTRK Moscow media 24 401.7254 - Scania-Rus Moscow
Regionwholesale trade 24 339.5
255 238 South Multi-Sectoral Corporation Krasnodar Territory
wholesale trade 24 335.9
256 280 IBS Group informational technologies 24 226.1257 284 Orimi Trade St.
Petersburg food processing industry 24 185.0
258 328 Kamski Kabel Perm Territory
machine engineering 24 083.7
259 - Life Financial Group banks 23 855.9260 293 Tekhnopromexport engineering, industrial
infrastructure construction23 815.1
261 221 Mosstroimekhanizatsia Moscow construction 23 772.5262 211 PRODO Kommerz wholesale trade 23 738.4263 - Central Suburban Passenger Company Moscow transport 23 670.5264 301 R-Style Group Moscow informational technologies 23 458.2
265 224 Metrostroi St. Petersburg
engineering, industrial infrastructure construction
23 251.5
266 215 Moskva-Efes Brewery food processing industry 23 196.9267 300 Imperial Tobacco Prodazha i
Marketingtobacco industry 23 184.6
268 - SDS-Ugol Holding Kemerovo Region
coal industry 23 174.6
269 359 Soglasie Insurance Company insurance 23 119.9270 231 Globalstroi-Engineering engineering, industrial
infrastructure construction23 066.3
271 236 Avon Beauty Products Company retail trade 23 035.1272 318 Poliplastic Group chemical, oil and chemical
industry23 019.5
273 259 GNPRKTs TsSKB-Progress machine engineering 22 851.3274 - Atomenergoproekt Research and
Engineering Institute St. Petersburg
engineering, industrial infrastructure construction
22 822.7
275 277 Vodokanal Sankt Peterburga St. Petersburg
housing and utilities sector 22 797.4
276 - Etalon Group St. Petersburg
construction 22 741.0
277 358 Komatsu SNG wholesale trade 22 667.2278 265 Avtoban DSK engineering, industrial
infrastructure construction22 567.6
279 287 Tadem Group machine engineering 22 555.9
280 - Sovfrakht-Sovmortrans Group transport 22 549.0
281 302 STS Media media 22 523.3282 292 Ostankino Meat Processing Factory Moscow food processing industry 22 276.6283 364 Koksokhimmontazh Trust engineering, industrial
infrastructure construction22 170.0
284 - Zenit Banking Group banks 22 139.5285 - Otkrytie Financial Corporation banks 22 104.8286 - Ak Bars Bank banks 22 098.0287 283 Panasonic Rus wholesale trade 22 012.9288 261 Aventis Pharma Moscow wholesale trade 21 908.5289 - Atac Supermarket Chain retail trade 21 662.5290 325 Elektroshchit – TM Samara Group Samara
Regionmachine engineering 21 634.2
291 379 Bunge SNG wholesale trade 21 627.6292 270 Drugstore Chain 36,6 retail trade 21 594.0293 368 GM AvtoVAZ Samara
Regionmachine engineering 21 510.8
294 258 Raspadskaya Kemerovo Region
coal industry 21 340.1
295 327 Siemens wholesale trade 21 288.3
296 298 Alcor and Co (L’Etoile Chain) wholesale trade 21 264.6297 324 SO UPS electric power industry 21 190.0298 275 Alliance Group (ROSNO) insurance 21 062.2299 - Envision Group3 informational technologies 21 025.7300 266 Nizhny Novgorod Oil and Fat Factory
(TD NMZhK)Nizhny Novgorod Region
food processing industry 20 872.0

73EXPERT–400
EX
PE
RT
.
SP
EC
IA
L
IS
SU
E
Volume of sales in 2010 (RUB, million)
Growth rate (%)
Volume of sales in 2011 (USD, million)
Profit before taxes in 2011 (RUB, million)
Net profit in 2011 (RUB, million)
Reporting
21 275.8 15.4 835.7 -852.5 -754.5 RAS24 586.5 -0.4 833.5 -6 812.1 -7 426.6 RAS20 174.1 21.0 830.3 11 037.0 10 604.8 RAS8 336.1 192.0 828.2 985.4 759.6 RAS
24 257.3 0.3 828.0 1 186.9 970.4 RAS
19 819.2 22.2 824.3 n/a n/a US GAAP19 517.0 23.9 822.9 n/a 2 430.0 management
accounting15 910.8 51.4 819.5 2 069.3 1 625.5 RAS
18 966.5 25.8 811.7 2 537.2 1 945.8 IFRS18 828.5 26.5 810.3 361.5 185.6 RAS
26 601.5 -10.6 808.9 890.7 641.7 RAS27 878.1 -14.8 807.7 -69.5 -86.1 RAS15 036.5 57.4 805.4 5 909.0 4 701.6 RAS18 274.8 28.4 798.2 n/a n/a management
accounting25 840.4 -10.0 791.1 915.5 753.4 RAS
27 417.1 -15.4 789.3 -2 707.7 -2 189.4 RAS18 197.2 26.7 788.9 1 463.1 1 001.9 RAS
n/a - 788.5 5 199.3 4 904.8 RAS
13 802.0 67.5 786.7 97.0 52.3 RAS24 648.4 -6.4 784.8 3 346.5 2 926.9 RAS
24 296.8 -5.2 783.8 2 115.0 1 566.1 RAS16 880.7 36.4 783.2 2 742.5 1 910.3 IFRS
21 398.9 6.8 777.5 175.6 108.4 RAS10 321.3 121.1 776.5 1 856.2 1 472.4 RAS
20 059.6 13.6 775.7 1 181.2 403.8 RAS
20 316.0 11.9 773.8 9 025.0 7 332.0 IFRS
13 818.2 64.0 771.3 2 310.4 1 802.7 RAS21 027.9 7.3 767.9 2 060.0 1 701.7 management
accounting19 311.8 16.8 767.5 n/a n/a management
accounting15 700.0 43.6 767.2 532.0 449.0 management
accounting according to the IFRS
18 267.0 23.3 766.4 4 024.0 1 561.1 US GAAP18 851.8 18.2 758.0 848.3 681.5 RAS13 579.1 63.3 754.3 1 228.9 961.9 RAS
21 435.7 3.3 753.3 3 546.3 2 506.9 IFRS12 396.3 78.3 752.1 -85.3 -823.1 IFRS22 211.3 -0.5 751.9 -4 173.2 -3 452.3 IFRS19 642.9 12.1 749.0 -124.5 -249.1 RAS21 224.2 3.2 745.4 -726.5 -775.4 RAS14 204.6 52.5 737.1 519.8 265.4 RAS16 101.7 34.4 736.1 1 768.0 1 393.0 RAS
13 026.1 66.0 735.9 -732.7 -545.0 RAS20 381.0 6.0 734.7 -23.0 -1 034.0 IFRS13 306.5 61.7 731.9 3 253.7 2 598.2 RAS
21 436.3 -0.4 726.1 5 210.5 3 980.6 IFRS
15 944.8 33.5 724.3 2 246.6 1 760.2 management accounting according to the IFRS
18 362.4 15.8 723.5 -371.5 -318.3 RAS16 283.0 30.1 721.0 4 611.0 3 516.0 IFRS20 085.5 4.9 716.6 -254.6 -429.4 IFRS17 888.3 17.5 715.4 1 839.8 1 482.9 IFRS20 903.4 -0.2 710.2 -326.2 -283.6 RAS

74Ex
pert
-400
dat
abas
e fo
r 18
yea
rs—
htt
p://w
ww.
raex
pert
.ru/
ratin
gs/e
xper
t400
301–
350
E XPERT–400E
XP
ER
T.
S
PE
CIA
L
ISS
UE Rating of Russia’s largest companies in terms of volume of product sales
2012 2011 Company Region Sector Volume of sales in 2011 (RUB, million)1
301 345 PKF DiPOS wholesale trade 20 754.4302 - Stroinovatsia engineering, industrial
infrastructure construction20 738.7
303 - Welding and Installation Trust Moscow engineering, industrial infrastructure construction
20 702.9
304 248 S. P. Korolev Energia RKK Moscow Region
machine engineering 20 538.5
305 - AromaLux (Rive Gauche Chain) wholesale trade 20 521.9306 317 Saint Petersburg Fuel Company wholesale trade 20 512.3307 307 Mosoblgaz Moscow
Regionhousing and utilities sector 20 475.1
308 - Ground Space Infrastructure Operation Centre (GSIOC)
Moscow machine engineering 20 453.4
309 290 SABMiller Rus Kaluga Region
food processing industry 20 350.2
310 322 Tarkett Rus building materials 20 306.1311 - National Media Group Moscow media 20 133.6312 - Yandex media 20 033.0313 - Siberia Energy Company (Sibeco) Novosibirsk
Regionelectric power industry 19 982.0
314 - Ufaoil Republic of Bashkor-tostan
wholesale trade 19 977.8
315 281 Saint Petersburg Fuel and Energy Sector
St. Petersburg
housing and utilities sector 19 843.2
316 285 Yakutskenergo JSC Republic of Saha (Yakutia)
electric power industry 19 757.0
317 374 Aerofuels Group service companies 19 708.7
318 336 Roznitsa-1 (Maria Ra chain) Altay Territory
retail trade 19 605.2
319 - Holiday retail trade 19 503.8320 309 Sodruzhestvo-Soya Kaliningrad
Regionagricultural sector 19 371.9
321 392 Liebherr Russland wholesale trade 19 240.8322 - Vozrozhdenie Bank banks 19 191.0323 279 Oriflame Cosmetics retail trade 19 114.8324 - Far Eastern Distribution Network
Company (FEDNC)Amur Region electric power industry 18 978.7
325 315 Arkhangelsk TsBK Arkhangelsk Region
pulp and paper industry 18 778.6
326 320 M. F. Reshetnev Informatsionnyie Sputnikovyie Sistemy
Krasnoyarsk Territory
machine engineering 18 735.7
327 308 International Paper Leningrad Region
forest, wood processing, and pulp & paper industry
18 734.5
328 - Azbuka Vkusa Supermarket Chain retail trade 18 700.0
329 - Independent Transport Company transport 18 632.2330 397 Specialized Office No. 2 Moscow
Regionconstruction 18 583.5
331 333 Mospromstroi5 Group Moscow construction 18 557.6
332 - Russkoe More5 Group wholesale trade 18 557.6333 - VAD St.
Petersburgengineering, industrial infrastructure construction
18 472.7
334 373 Evrotrans transport 18 178.9335 - Slavyanski DSK St.
Petersburgconstruction 18 144.8
336 239 Integra Group service companies 18 097.6337 341 Mariysky Oil Refinery Republic of
Mari-Eloil, oil and gas industry 18 053.8
338 321 Ferrero Russia wholesale trade 17 976.9339 326 Russian Television and Radio
Broadcasting network telecommunications & communication
17 937.0
340 338 Altaivagon Altay Territory
machine engineering 17 905.9
341 268 Russki Alkhogol Group food processing industry 17 867.4342 314 Mostransavto Moscow
Regiontransport 17 857.5
343 369 Khabarovsk Fuel Company Khabarovsk Territory
wholesale trade 17 747.7
344 - Aston AC Rostov Region
agricultural sector 17 627.0
345 355 Comos Group Udmurt Republic
agricultural sector 17 612.1
346 - Vozrozhdenie PA St. Petersburg
engineering, industrial infrastructure construction
17 601.0
347 381 Ruselprom Concern machine engineering 17 494.8
348 323 Indesit International Lipetsk Region
machine engineering 17 487.4
349 - Uralskie Avialinii Airline Sverdlovsk Region
transport 17 480.7
350 365 Compulink Group Moscow informational technologies 17 463.7

75EXPERT–400
EX
PE
RT
.
SP
EC
IA
L
IS
SU
E
Volume of sales in 2010 (RUB, million)
Growth rate (%)
Volume of sales in 2011 (USD, million)
Profit before taxes in 2011 (RUB, million)
Net profit in 2011 (RUB, million)
Reporting
14 454.7 43.6 706.2 252.3 205.0 RAS11 446.1 81.2 705.6 307.3 293.2 RAS
n/a - 704.4 604.3 476.2 RAS
22 816.9 -10.0 698.8 1 669.4 1 245.8 RAS
n/a - 698.3 247.4 168.3 RAS16 920.7 21.2 697.9 6.8 5.4 RAS18 025.2 13.6 696.7 2 356.6 1 906.9 RAS
16 146.5 26.7 695.9 1 505.9 1 096.3 RAS
19 014.3 7.0 692.4 1 760.2 2 025.9 RAS
16 442.1 23.5 690.9 769.7 595.6 RASn/a - 685.0 1 398.3 1 125.8 RAS
12 500.0 60.3 681.6 7 318.0 5 773.0 US GAAPn/a - 679.9 -826.0 -531.0 IFRS
17 079.8 17.0 679.7 189.7 141.6 RAS
19 791.7 0.3 675.2 6 330.0 6 362.9 RAS
19 414.0 1.8 672.2 1 850.0 1 345.0 IFRS
13 195.8 49.4 670.6 n/a 96.7 management accounting
14 892.4 31.6 667.1 1 116.5 890.0 RAS
15 182.9 28.5 663.6 212.4 157.5 RAS17 759.9 9.1 659.1 -466.9 -261.7 RAS
12 496.3 54.0 654.7 52.2 16.5 RAS17 895.0 7.2 653.0 2 016.0 1 594.0 IFRS19 996.5 -4.4 650.4 -47.5 -71.6 RAS18 337.8 3.5 645.8 -719.9 -697.2 IFRS
17 010.7 10.4 638.9 3 171.0 2 404.0 IFRS
16 717.7 12.1 637.5 849.7 635.0 RAS
17 956.6 4.3 637.4 1 801.1 1 475.5 RAS
14 760.0 26.7 636.3 n/a n/a management accounting according to the IFRS
13 172.3 41.4 634.0 1 593.4 1 255.6 RAS12 225.3 52.0 632.3 374.4 260.4 RAS
15 090.4 23.0 631.4 3 679.7 3 076.4 management accounting
n/a 631.4 -453.1 -486.6 IFRS15 930.2 16.0 628.5 166.7 139.0 RAS
13 213.9 37.6 618.5 910.8 671.2 RASn/a - 617.4 885.5 727.4 RAS
17 337.6 4.4 615.8 -321.7 1 245.8 IRFS14 656.2 23.2 614.3 553.4 429.2 RAS
16 712.3 7.6 611.7 630.7 467.9 RAS15 958.4 12.4 610.3 906.9 728.9 RAS
14 801.2 21.0 609.3 2 482.1 1 995.5 RAS
20 740.1 -13.9 607.9 -491.8 -444.0 RAS17 361.6 2.9 607.6 -2 224.1 -1 923.7 RAS
13 292.5 33.5 603.9 801.2 638.3 RAS
10 766.2 63.7 599.8 52.9 67.9 RAS
13 927.9 26.5 599.3 893.3 764.4 IFRS
6 966.5 152.7 598.9 344.3 246.2 RAS
13 013.3 34.4 595.3 596.7 477.4 management accounting according to the IFRS
16 413.0 6.5 595.0 765.2 490.5 RAS
13 181.1 32.6 594.8 163.5 148.1 RAS, consolidated
13 480.4 29.5 594.2 n/a n/a management accounting

76Ex
pert
-400
dat
abas
e fo
r 18
yea
rs—
htt
p://w
ww.
raex
pert
.ru/
ratin
gs/e
xper
t400
351–
400
E XPERT–400E
XP
ER
T.
S
PE
CIA
L
ISS
UE Rating of Russia’s largest companies in terms of volume of product sales
2012 2011 Company Region Sector Volume of sales in 2011 (RUB, million)1
351 - Pacific Bridge Building Company Primorsk Territory
engineering, industrial infrastructure construction
17 432.1
352 - TGK-16 Republic of Tatarstan
electric power industry 17 407.0
353 - Uchalinsky OMDP Republic of Bashkor-tostan
non-ferrous metal industry 17 309.2
354 361 Ashinsky Iron and Steel Works Chelyabinsk Region
iron & steel industry 17 292.5
355 344 Borets Production Company Moscow machine engineering 17 136.0356 362 Kargill (Efremovsky GPK) Tula Region food processing industry 16 927.2357 391 Ai-Teko informational technologies 16 900.0
358 400 Crystal PA Smolensk Region
precious metal and diamond industry
16 732.1
359 343 Roshen Lipetsk Region
food processing industry 16 591.5
360 - Severnaya Verf St. Petersburg
machine engineering 16 507.7
361 335 ABB wholesale trade 16 475.7362 346 VAMIN Tatarstan Republic of
Tatarstanfood processing industry 16 272.8
363 330 Magnezit Group iron & steel industry 16 263.7364 - Rostselmash Combine Plant Rostov
Regionmachine engineering 16 154.8
365 - Petrokommerz Bank banks 16 136366 311 Elektrotsentromontazh engineering, industrial
infrastructure construction16 115.8
367 - Kazan Production and Building Company
Republic of Tatarstan
construction 16 094.6
368 360 Do it Yourself (OBI chain) retail trade 16 078.2369 - Michelin Moscow
Regionchemical, oil and chemical industry
15 994.4
370 - Genser Moscow retail trade 15 976.3371 350 Petersburg Metropolitan St.
Petersburgtransport 15 954.4
372 - Mosinzhproekt Moscow engineering, industrial infrastructure construction
15 893.2
373 - Zlatoustovsky Iron and Steel Works Chelyabinsk Region
iron & steel industry 15 857.2
374 382 Evrosib Group transport 15 800.0
375 331 Amway retail trade 15 763.3
376 - EFESk Group engineering, industrial infrastructure construction
15 611.1
377 367 Solnechnye Produkty TH food processing industry 15 520.2378 - Softline informational technologies 15 396.6
379 383 Renaissance Strakhovanie Group insurance 15 242.2380 Svyaz-Bank banks 15 132.0381 - Krasnoyarsknefteproduct Krasnoyarsk
Territorywholesale trade 15 131.7
382 - Gloria Jeans Corporation Rostov Region
light industry 15 075.7
383 - Most USK engineering, industrial infrastructure construction
15 017.9
384 351 NPO Mashynostroyenia MIS Moscow Region
machine engineering 14 856.7
385 - RusVietPetro Joint Company oil, oil and gas industry 14 855.4386 - Zeppelin Russland Moscow wholesale trade 14 797.8387 - Russian Power Engineering Holding
(REP Holding)St. Petersburg
machine engineering 14 781.1
388 - Major Avto Centre Moscow retail trade 14 700.8389 - Globexbank banks 14 658.4390 - Asteros Group informational technologies 14 625.7
391 388 Kamensk-Uralsky Iron and Steel Works Sverdlovsk Region
non-ferrous metal industry 14 617.6
392 398 Amurmetall Khabarovsk Territory
iron & steel industry 14 545.3
393 - SAP CIS Moscow informational technologies 14 353.0394 394 Irkutks Power Network Company
(IESK)Irkutsk Region
electric power industry 14 341.4
395 395 Kondopoga Republic of Karelia
forest, wood processing, and pulp & paper industry
14 318.6
396 380 Rosvodokanal Group housing and utilities sector 14 263.0397 385 Rubin TsKB MT St.
Petersburgmachine engineering 14 138.1
398 - Moscow Industrial Bank banks 14 130.7399 - Kirovsky Zavod Group St.
Petersburgmachine engineering 14 011.2
400 366 NIKOS Group chemical, oil and chemical industry
14 010.5
Total 41 342 601.81 Volume of sales refers to revenues (gross income) from sales of products, works, and services derived from the relevant lines of profit 2 The Company provided data of its management statements for the fiscal year ending on June 30, 2012. 3 The Company provided data for methods. 5 The company’s position in 2011 corresponds to the amount of revenues from sales expressed in RUB’000. 6 Average figure

77EXPERT–400
EX
PE
RT
.
SP
EC
IA
L
IS
SU
E
Volume of sales in 2010 (RUB, million)
Growth rate (%)
Volume of sales in 2011 (USD, million)
Profit before taxes in 2011 (RUB, million)
Net profit in 2011 (RUB, million)
Reporting
9 782.8 78.2 593.1 841.7 578 RAS
8 301.0 109.7 592.3 1 969.2 1 568.7 RAS
17 429.2 -0.7 588.9 2 833.3 2 159.7 RAS
13 783.1 25.5 588.4 1.6 113.5 RAS
14 572.1 17.6 583.1 719.0 607.0 RAS13 757.6 23.0 576.0 266.5 177.8 RAS12 510.0 35.1 575.0 n/a n/a management
accounting12 102.9 38.2 569.3 373.2 288.0 RAS
14 587.4 13.7 564.5 595.9 473.9 RAS
10 387.8 58.9 561.7 -1 239.2 -1 093.6 RAS
14 968.1 10.1 560.6 1 366.5 973.9 RAS14 408.0 12.9 553.7 -200.9 -193.7 RAS
15 448.3 5.3 553.4 1 276.3 898.7 RAS10 054.1 60.7 549.7 271.9 105.7 RAS
16 188.7 -0.3 549.0 626.7 428.8 IFRS17 696.6 -8.9 548.3 447.5 335.5 RAS
11 400.1 41.2 547.6 142.0 130.1 RAS
13 788.6 16.6 547.1 2 426.3 1 811.4 RAS10 388.0 54.0 544.2 862.2 609.9 RAS
10 616.2 50.5 543.6 494.1 364.0 RAS14 103.7 13.1 542.9 78.9 2.0 RAS
n/a - 540.8 2 160.6 1 674.4 RAS
9 923.5 59.8 539.5 11.1 26.8 RAS
13 287.0 18.9 537.6 504.0 311.0 management accounting
14 715.0 7.1 536.3 n/a n/a management accounting
9 144.6 70.7 531.2 331.2 233.2 RAS, consolidated
13 343.1 16.3 528.1 4.0 0.1 RAS10 873.4 41.6 523.9 n/a n/a management
accounting12 930.8 17.9 518.6 215.3 303.7 RAS12 048.0 25.6 514.9 641.0 401.0 IFRS10 083.3 50.1 514.9 166.9 114.5 RAS
8 859.2 70.2 513.0 1 637.8 1 289.1 RAS
16 178.2 -7.2 511.0 528.0 306.7 RAS
14 024.9 5.9 505.5 1 684.0 1 293.7 RAS
n/a - 505.5 7 295.4 5 747.3 RAS8 127.3 82.1 503.5 716.7 564.0 RAS6 612.4 123.5 503.0 312.3 72.3 RAS
10 149.5 44.8 500.2 24.6 19.4 RAS8 274.6 77.1 498.8 481.0 310.9 IFRS9 474.4 54.4 497.6 n/a n/a management
accounting12 680.8 15.3 497.4 937.0 731.9 RAS
12 197.0 19.3 494.9 -4 485.2 -3 929.6 RAS
11 197.2 28.2 488.4 1 174.5 855.8 RAS12 414.4 15.5 488.0 1 710.8 1 011.0 RAS
12 394.6 15.5 487.2 -888.8 -782.8 RAS
13 018.2 9.6 485.3 793.0 -91.0 IFRS12 850.2 10.0 481.1 624.9 427.5 RAS
12 215.4 15.7 480.8 620.7 357.4 IFRS11 320.9 23.8 476.7 22.8 99.0 RAS, consolidated
13 406.1 4.5 476.7 n/a n/a management accounting
33 204 769.1 23.46 1 407 387.2 6 845 146.2 5 175 981.8 and loss accounts, or an indicator recognized to be its equivalent according to the rating preparation methods (p. 134) the fiscal year ending on March 31, 2012. 4 The position of banks in the 2010 rating study is not indicated due to changes in revenue estimation

ix years ago, when calculating the investment attractiveness rating of regions, we began to take risk management into ac-count. We did it because we believe that regional manage-
ment quality is a key factor to improve the investment climate. Since that time, work performance of regional administrations has become a kind of mainstream. Line min-istries continue to improve the KPI system for regional governors. An agency special-izing in strategic initiatives has developed and implemented a special standard of ac-tions for regional authorities. However, we have not been able to progress very far in developing performance evaluations of spe-cifi c regions.
Of course, there are regions that have become generally accepted models of ef-fective investment policy: the Kaluga and Leningrad Regions, Tatarstan, etc. However, success in these cases is the result of at least a decade of work accomplished by regional administrations. We still do not have a well-defi ned answer to the question — which governor has performed most effectively in the shortest time interval… let’s say in the last two or three years. We decided to cor-rect this omission by looking at the problem through the prism of our rating scale.
The Top SixIn the current ranking, we tried to evaluate the fi rst results of the work program carried out by governors, who came to power in times of crisis or in the early post-crisis re-covery period. Given the inertia of regional economies and the administrative systems, we evaluated only the heads of regions who had been appointed from late 2008 to mid 2010 (these included sixteen, except reap-pointed persons). Assessment criteria in the current rating survey lay in analyzing the dynamics of each region in terms of risk, as compared with the rating study through 2010.
Out of sixteen candidates, six contenders made the list of the most effective managers: the heads of Khabarovsk Krai, and the Orel, Voronezh, Chelyabinsk, Rostov and Kirov Regions (see Table 2).
With an overall risk reduction in these regions, each of the newly appointed ex-
ecutives managed to make improvements in at least one of three areas, which, from our point of view, are the most closely de-pendent on administrative activities: social climate, fi scal discipline, and relations with the federal government.
In the social sphere of most of these re-gions, namely unemployment and the pro-portion of persons with incomes below the poverty level were reduced by much more than the Russian average within two years (2010-2011). The Chelyabinsk and Rostov Regions constitute exceptions, as they found themselves in somewhat more diffi cult con-ditions. The former was not able to rapidly reduce unemployment due to extremely negative economic conditions on the metal markets (metallurgy plays a key role in the region’s economy); the latter encountered the traditional problems facing “coal” mu-nicipalities. However, we should acknowl-edge the work carried out by the team of the Chelyabinsk Governor, Mikhail Yurevich: in two years, arrears in wages were reduced to one of the lowest levels in the country. Further merit can be attributed to the new Khabarovsk Governor, Vyacheslav Shport – the reduction of criminality; this territory currently shows minimal criminal risks on our rating scale.
The Governors of Orel (Alexander Ko-zlov), Chelyabinsk (Mikhail Yurevich) and Rostov (Vasiliy Golubev) improved the quality of fi scal discipline in their re-spective regions. In 2009, during the peak years of the economic crisis, the head of the Kirov Region, Nikita Belykh, distinguished himself by reducing public administration costs by as much as 14% (compared to the national average of 4%).
The Governors of the Orel, Chelyabinsk, Khabarovsk and Kirov Regions displayed the greatest ability to build relations with Moscow: transfers from the federal budget to these regions signifi cantly exceeded the growth of their own income during the post-crisis period. For example, in the Orel Region, federal transfers increased by more than 70% in 2011, as compared to 2008, whereas regional income grew by only 20%. We should also note the effective work with the central government carried out by the Governor of the Voronezh Region, Alexei Gordeev (former Minister of Agriculture):
in 2011, this area became one of the main recipients of investments from the federal budget. Important funding was also allo-cated to the Kremlin’s priority areas, namely Krasnodar Krai and Primorsky Krai (respec-tively, venues for the Olympic Games and the APEC summit), the Republic of Tatarstan (Universiade venue), Dagestan and Moscow, which began to receive federal investments for the development of transportation in-frastructure.
The Third WaveOur rating survey showed that, against the background of an ongoing post-crisis eco-nomic recovery in the European part of Rus-sia, investment risks decreased in a large number of regions, in terms of the following three features: proximity to economic cent-ers, relatively cheap labour and no signifi cant investment projects in previous years.
We take the liberty to suggest that the above-mentioned players have the potential to become new points of investment growth (the so-called “third wave” regions — see chart). Naturally, the implementation of this scenario will only be possible if there are no adverse external factors, such as a new wave of economic crisis.
In the late 1990s, the fi rst wave of invest-ment growth spread over Moscow and Saint Petersburg, as well as throughout regions, which became pioneers for investment poli-cies: the Belgorod Region and Tatarstan. In the 2000s, a second wave spread to the surroundings of capital megalopolises and millionaire cities: the Leningrad and Kaluga Regions, the Samara, Sverdlovsk, and Nizh-ny Novgorod Regions, and several other re-gions. Investment logic here is simple and clear: a huge market next door, relatively low labour costs in comparison with those in the actual capitals, and well-developed infrastructure.
However, an important tendency ap-peared during these years of economic growth and post-crisis recovery: the labour force in Russian regions is no longer cheap by international standards. Compared to 2008, real per capita income rose, largely thanks to the paternalistic policies of the Russian government.
Today, investors will have to move to peripheral areas in order to reduce costs.
IN V E S T MEN T AT T R AC T IV ENE SS R AT ING OF RUSSI A N REGIONSE
XP
ER
T.
S
PE
CIA
L
ISS
UE
78
S
Vladimir Gorchakov
The Approaching Third WaveAttention to the social sphere and fiscal discipline, as well as good communication with federal bodies — that is
the recipe for minimizing investment risks in the post-crisis period. The new wave of investment attractiveness
growth will be generated by former peripheral regions with moderate levels of wages

IN V E S T MEN T AT T R AC T IV ENE SS R AT ING OF RUSSI A N REGIONS
EX
PE
RT
.
SP
EC
IAL
IS
SU
E
79
Number on Chart 1 Region
Maximum potential — minimum risk (1A)
10 Moscow Region
18 Moscow
29 Saint Petersburg
32 Krasnodar Krai
46 Republic of Tatarstan
Moderate potential — minimum risk (2A)
1 Belgorod Region
Reduced potential — minimum risk (3A1)
4 Voronezh Region
9 Lipetsk Region
14 Tambov Region
25 Leningrad Region
Low potential — minimum risk (3A2)
— —
High potential — moderate risk (1B)
58 Sverdlovsk Region
Moderate potential — moderate risk (2B)
35 Rostov Region
43 Republic of Bashkortostan
49 Perm Krai
51 Nizhny Novgorod Region
54 Samara Region
60 Khanty-Mansiysk Autonomous District — Ugra
62 Chelyabinsk Region
69 Krasnoyarsk Krai
70 Irkutsk Region
71 Kemerovo Region
72 Novosibirsk Region
Reduced potential — moderate risk (3B1)
2 Bryansk Region
3 Vladimir Region
6 Kaluga Region
8 Kursk Region
Regions with “new” governors, where investment risks have been substantially reduced Table 2
Position of the region in the rating scale in terms of investment risk Region Governor Date of appointment
Position in the rating scale 2010
Position in the rating scale 2012
Dynamics (number of places)
68 35 +33 Khabarovsk Krai Vyacheslav Shport 30.04.2009
60 49 +11 Orel Region Alexander Kozlov 16.02.2009
19 9 +10 Voronezh Region Alexei Gordeev 16.02.2009
35 28 +7 Chelyabinsk Region Mikhail Yurevich 15.03.2010
18 12 +6 Rostov Region Vasiliy Golubev 15.05.2010
62 58 +4 Kirov Region Nikita Belykh 08.12.2008
Source: Expert RA, open data
Number on Chart 1 Region
12 Ryazan Region
13 Smolensk Region
15 Tver Region
16 Tula Region
17 Yaroslavl Region
19 Republic of Karelia
20 Komi Republic
21 Arkhangelsk Region
23 Vologda Region
24 Kaliningrad Region
33 Astrakhan Region
34 Volgograd Region
42 Stavropol Krai
47 Udmurt Republic
48 Chuvash Republic
50 Kirov Region
52 Orenburg Region
53 Penza Region
55 Saratov Region
56 Ulyanovsk Region
59 Tyumen Region
61 Yamal-Nenets Autonomous District
67 Altai Krai
73 Omsk Region
74 Tomsk Region
75 Republic of Sakha (Yakutia)
77 Primorskiy Krai
78 Khabarovsk Krai
81 Sakhalin Region
Low potential — moderate risk (3B2)
5 Ivanovo Region
7 Kostroma Region
11 Orel Region
22 Nenets Autonomous District
Number on Chart 1 Region
27 Novgorod Region
28 Pskov Region
30 Republic of Adygea
38 Kabardino-Balkar Republic
44 Mari El Republic
45 Republic of Mordovia
66 Republic of Khakassia
79 Amur Region
Maximum potential — high risk (1C)
— —
Moderate potential — high risk (2C)
— —
Reduced potential — high risk (3C1)
26 Murmansk Region
36 Republic of Dagestan
64 Republic of Buryatia
68 Trans-Baikal Krai
Low potential — high risk (3C2)
31 Republic of Kalmykia
39 Karachay-Cherkess Republic
40 Republic of North Ossetia — Alania
57 Kurgan Region
63 Altai Republic
76 Kamchatka Krai
80 Magadan Region
82 Jewish Autonomous Region
83 Chukotka Autonomous District
Low potential — extreme risk (3D)
37 Republic of Ingushetia
41 Chechen Republic
65 Tyva Republic
Classification of Russian regions according to the investment climate rating in 2012 Table 1
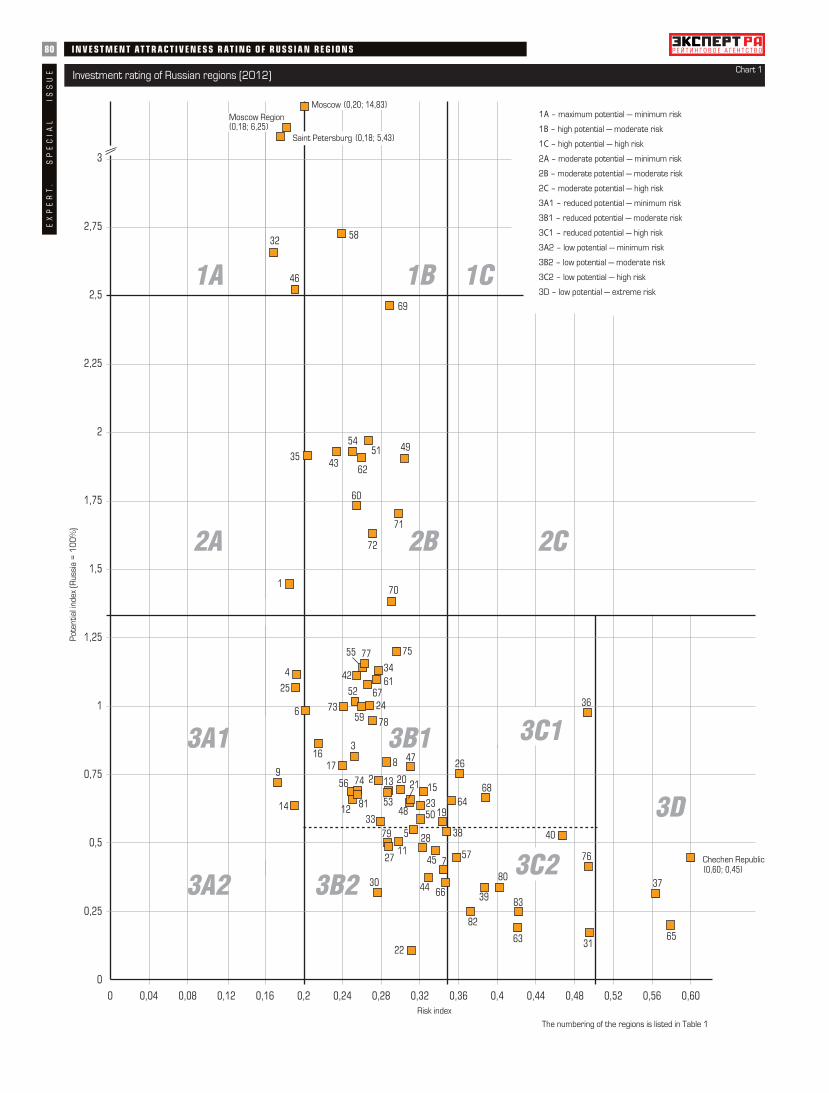
80 IN V E S T MEN T AT T R AC T IV ENE SS R AT ING OF RUSSI A N REGIONSE
XP
ER
T.
S
PE
CIA
L
ISS
UE

For example, companies, targeting capital markets, may be attracted to such areas as the Orel, Bryansk, Smolensk, Ivanovo and Kostroma Regions, or partly to the Tambov and Voronezh Regions. In the North-West territories, low risk potential may be found in the Republic of Karelia; in the Volga ter-ritories — in Chuvashia, Udmurtia, Mari El and the Penza Region. It is namely these areas that might become the “third wave” regions of investment growth.
There are more opportunities for those, which have already done a lot to improve their own investment climate. For example, in previous years, the Tambov and Voron-ezh Regions were classifi ed in our rating scale as constituent subjects of the Russian Federation with minimal investment risks. Run by a new Governor, the Ulyanovsk Re-gion, which was also included in the list of potential points of growth, has been con-ducting an active PR-campaign to promote its investment brand for several years now. The arrival of major investors in the region shows that budget money has not been spent in vain.
In general, the quality of governance is growing in all the “third wave” regions: ad-ministrative risks have declined almost eve-rywhere in the last year. Moreover, the cur-rent level of these risks is favourable: more than 60% of these constituent subjects are positioned at the top of the general list of re-gions (see Chart 2). However, the economic risk and, to a lesser degree, fi nancial risk in these areas remain somewhat high. Almost 40% of the regions are listed below the 60th place (out of 83 possibilities) in terms of eco-nomic risks; about 20% are classifi ed within the top sixty. The situation is a bit better in terms of financial risk: about 40% of the regions are listed below the 50th place. True, the situation has improved somewhat: more than 60% of the above-mentioned federal subjects were able to reduce economic risks, and more than 70% decreased their fi nancial risks (see Chart 3).
The explanation for this poor fi nancial and economic situation in the “third wave” regions is fairly obvious: most of them use a high proportion of outdated Soviet me-chanical engineering in their economic and employment structures. Therefore, it is vitally important that the heads of these territories should stimulate re-in-dustrialization through effective economic policies. By replacing or renovating their fi xed assets, the “third wave” regions can count on the federal government, prima-rily by attracting and carrying out large-scale Defense Procurement and Acquisi-tion (by 2020, three trillion rubles will be allocated to industrial enterprises through the current Federal Target Program for the modernization of the military-industrial complex).
The Far East is Drawing NearLike last year, there is a tendency to re-duce investment risks in the Far East (see chart). Even though the APEC summit in Vladivostok, which contributed to this phe-nomenon, is over, it is obvious that the preparations for this event were benefi cial to the fi nancial and economic indicators of the macro-region (despite revealed embez-zlement). As a result, Primorskiy Krai has reduced integral and almost all private investment risks for a second year in a row, and now stands at a record 30th position in the integral ranking scale. Primorye’s share in total Russian investments from 2008 to 2011 increased almost threefold, and its share of investments allocated from the federal budget reached 8.5% for 2011 (a higher amount of funds was assigned to Krasnodar Krai for pre-Olympic work and for the expansion of Moscow). People’s incomes grew thanks to these investments (even though the rate was not so impres-sive); compared with 2008, they rose by more than 10% in real terms in the Primor-skiy Region (that is, two times more than the Russian average).
Russian (and sometimes foreign) mining projects (especially for non-ferrous metals), designed by large business companies, con-tinue to be implemented in Yakutia and the Amur Region, both of which also showed a decrease in investment risks. Ambitious investments have been made in Chukotka’s gold business. The Irkutsk, Magadan Re-gions and Khabarovsk Krai have also re-duced their risks.
After all the important investments had poured into the territory thanks to the APEC summit, the dynamics of investments in the Far East will now depend on the implemen-tation of President Vladimir Putin’s post-election decrees, according to which a state program is to be worked out for the socio-economic development of the macro-region, a special ministry having been created for this purpose. This structure and other fed-eral departments have already prepared a number of proposals for the implementation of the President’s plans. Among the meas-ures aimed at raising funds for the develop-ment of Eastern Siberia and the Far East, the Ministry of Energy has proposed to annul “gas” severance taxes for 25 years, while the line Ministry for the Development of the Russian Far East has presented 92 projects totaling five trillion rubles (see Charts 4 and 5).
The development of energy and transport infrastructures is at the top of the project list, and represents key problems for the growth and development of the Far East. Lack of transport and energy infrastruc-tures constitute a major issue for important investment companies, especially those in-volved in the fi eld of mining.
Almost half of the projects (43) are lo-cated in two Far Eastern regions — Yakutia and Khabarovsk Krai. The explanation is simple: in past years, these territories were already leaders in drawing up grandiose plans for their respective development (in particular, the project for the complex development of South Yakutia). It is very likely that some of these past projects were integrated in the current project list. We should also remember that the present Minister of the Far East is the former Gov-ernor of Khabarovsk Krai.
As planned by the Ministry, it will be possible to fi nance these projects through a subsidiary of the Bank for Development and Foreign Economic Affairs – the Foun-dation for the Development of the Far East and the Baikal Region OJSC. The project list did not stir up much enthusiasm with the Foundation and President Putin him-self, who expressed some critical remarks during the meeting of the State Council at the end of November. And, for good reasons: only a third of the announced projects are technical and economic fea-sibility studies or business plans. Seeing that the budget for preparations for the APEC summit grew by 4.5 times, compared to the original estimate, the Ministry for the Development of the Russian Far East should hardly display such a fl ippant at-titude towards the prospects of territories lying within its jurisdiction.
Falling into the Oil WellThis year, a paradoxical situation has de-veloped in the regions, which produce and export oil and gas resources. Despite a fa-vourable economic situation on the world hydrocarbon market, investment risks in-creased in these areas; one exception was the Khanty-Mansi Autonomous District, which retained its 24th place in the ranking scale. The Komi Republic fell three posi-tions, the Orenburg Region — fi ve positions, the Astrakhan and Tomsk Regions — six, the Yamal-Nenets Autonomous District — seven, the Sakhalin Region — nine, and the Tyumen Region and the Nenets Autonomous District – eleven and sixteen places respec-tively. The growth of integral risks in these constituent subjects was due to an increase in the economic and social components. As certain companies, engaged in the explora-tion and production of oil and gas resources, dominate this sphere, the dynamics of eco-nomic development become highly depend-ent on the exhaustion or, conversely, on the development of different groups of deposits. Something similar happened in the Nenets and Yamal-Nenets Autonomous Districts, and the Tyumen and Sakhalin Regions, which dropped more than ten positions in terms of economic risks. A key reason — in 2011, there was a rather sharp increase in
81IN V E S T MEN T AT T R AC T IV ENE SS R AT ING OF RUSSI A N REGIONS
EX
PE
RT
.
SP
EC
IAL
IS
SU
E

82 IN V E S T MEN T AT T R AC T IV ENE SS R AT ING OF RUSSI A N REGIONSE
XP
ER
T.
S
PE
CIA
L
ISS
UE Investment risks of Russian regions in 2012
Risk ranking Potential ranking, 2012 Region (federal subject) Risk weighted aver-age index, 2012
2012 20121 2 17 Belgorod Region 0.1642 1 5 Krasnodar Krai 0.1693 3 42 Lipetsk Region 0.1734 5 3 Saint Petersburg 0.1785 4 2 Moscow Region 0.1816 10 56 Tambov Region 0.1907 9 6 Republic of Tatarstan 0.1918 7 27 Leningrad Region 0.1929 23 23 Voronezh Region 0.193
10 11 1 Moscow 0.19911 8 32 Kaluga Region 0.20212 6 11 Rostov Region 0.20413 22 35 Tula Region 0.21514 12 10 Republic of Bashkortostan 0.23415 27 4 Sverdlovsk Region 0.23916 29 38 Yaroslavl Region 0.24017 21 30 Omsk Region 0.24118 15 36 Vladimir Region 0.24319 25 48 Ulyanovsk Region 0.24920 38 53 Ryazan Region 0.25021 17 9 Samara Region 0.25022 13 51 Sakhalin Region 0.25223 18 28 Orenburg Region 0.25324 24 14 Khanty-Mansiysk Autonomous District — Ugra 0.25525 14 24 Stavropol Krai 0.25526 20 45 Tomsk Region 0.25627 16 31 Tyumen Region 0.26028 31 12 Chelyabinsk Region 0.26029 19 21 Saratov Region 0.26130 50 20 Primorskiy Krai 0.26331 28 26 Altai Krai 0.26632 59 8 Nizhny Novgorod Region 0.26733 42 29 Kaliningrad Region 0.26834 47 41 Bryansk Region 0.26935 44 34 Khabarovsk Krai 0.27136 40 16 Novosibirsk Region 0.27137 30 25 Yamal-Nenets Autonomous District 0.27538 33 76 Republic of Adygea 0.27639 43 22 Volgograd Region 0.27740 34 58 Astrakhan Region 0.27941 26 37 Kursk Region 0.28642 46 49 Penza Region 0.28743 32 64 Novgorod Region 0.28744 53 65 Amur Region 0.28845 52 46 Smolensk Region 0.28846 36 7 Krasnoyarsk Krai 0.28947 58 18 Irkutsk Region 0.29148 54 19 Republic of Sakha (Yakutia) 0.29649 62 63 Orel Region 0.29850 37 15 Kemerovo Region 0.29851 48 44 Komi Republic 0.30052 49 13 Perm Krai 0.30453 64 39 Udmurt Republic 0.31054 65 54 Chuvash Republic 0.31055 39 83 Nenets Autonomous District 0.31156 61 47 Arkhangelsk Region 0.31257 63 60 Ivanovo Region 0.31358 55 57 Kirov Region 0.32159 41 55 Vologda Region 0.32160 45 66 Pskov Region 0.32361 35 43 Tver Region 0.32662 69 72 Mari El Republic 0.32963 60 67 Republic of Mordovia 0.33664 51 75 Republic of Khakassia 0.33765 72 59 Republic of Karelia 0.34366 71 71 Kostroma Region 0.34467 66 61 Kabardino-Balkar Republic 0.34868 57 52 Republic of Buryatia 0.35569 56 79 Jewish Autonomous Region 0.35770 68 68 Kurgan Region 0.35871 67 40 Murmansk Region 0.36172 74 74 Karachay-Cherkess Republic 0.38773 73 50 Trans-Baikal Krai 0.38874 77 73 Magadan Region 0.40275 70 81 Altai Republic 0.42176 78 78 Chukotka Autonomous District 0.42277 75 62 Republic of North Ossetia — Alania 0.46778 79 33 Republic of Dagestan 0.49379 76 70 Kamchatka Krai 0.49480 80 82 Republic of Kalmykia 0.49581 81 77 Republic of Ingushetia 0.56482 82 80 Tyva Republic 0.57983 83 69 Chechen Republic 0.600

83IN V E S T MEN T AT T R AC T IV ENE SS R AT ING OF RUSSI A N REGIONS
EX
PE
RT
.
SP
EC
IAL
IS
SU
E Table 3Changes in risk index, 2012 to 2011, increase
(+), decrease (-)
Ranking of components of investment risks in 2012 Changes in risk index,
2012 to 2011Social Economic Financial Criminal Ecological Administrative
–0.004 4 7 15 11 5 28 10.014 14 3 19 16 10 7 –1
–0.010 3 12 14 12 30 16 0–0.009 2 15 2 41 45 29 1–0.002 5 5 12 59 24 27 –1–0.028 6 23 38 38 6 3 4–0.025 19 2 39 15 34 12 2–0.011 8 13 4 51 46 19 –1–0.068 24 26 17 13 12 8 14–0.023 1 25 6 4 32 68 1–0.013 20 16 20 62 25 1 –30.014 26 4 49 3 18 22 –6
–0.043 7 41 9 32 28 51 90.009 67 1 8 53 39 42 –2
–0.027 12 39 10 45 58 45 12–0.027 17 58 27 5 49 23 13–0.016 31 9 24 61 54 34 40.001 35 30 48 60 7 14 –3
–0.013 57 51 29 18 17 13 6–0.033 32 46 50 6 21 32 180.005 23 22 16 48 41 61 –40.018 30 42 46 43 68 2 –90.007 44 37 13 9 59 56 –5
–0.006 40 24 1 64 73 43 00.020 51 11 23 46 51 46 –110.000 63 27 11 29 57 41 –60.017 21 21 31 79 37 31 –11
–0.012 15 44 18 73 64 25 30.011 38 36 42 27 35 52 –10
–0.044 46 20 51 17 61 36 200.000 61 14 32 28 40 54 –3
–0.056 25 57 25 75 8 37 27–0.022 72 40 59 19 1 5 9–0.035 11 45 60 40 29 38 13–0.023 39 29 43 1 67 58 9–0.015 50 10 7 74 44 67 40.006 10 68 3 56 83 9 –7
–0.004 52 31 73 8 3 10 –5–0.014 27 54 26 52 36 63 4–0.003 59 33 37 72 53 15 –60.021 49 34 68 23 2 48 –15
–0.014 45 63 41 2 11 72 40.009 36 48 58 78 16 18 –11
–0.025 29 43 67 24 66 17 9–0.023 53 49 47 77 15 20 70.006 48 17 22 30 77 64 –10
–0.030 64 18 5 31 71 71 11–0.022 70 35 35 44 79 4 6–0.038 9 53 57 69 13 62 130.015 13 47 61 34 72 44 –13
–0.004 66 65 28 25 76 6 –3–0.003 54 64 33 26 62 53 –3–0.031 69 66 40 47 27 33 11–0.032 81 56 36 57 26 11 110.027 37 52 21 33 80 65 –16
–0.020 16 67 62 21 75 24 5–0.026 33 70 56 49 33 55 60.001 77 59 54 10 55 21 –30.034 34 55 44 36 63 76 –180.027 62 61 63 14 22 57 –150.044 18 72 45 71 14 75 –26
–0.029 79 62 52 20 42 26 70.008 58 32 74 55 4 50 –30.027 56 28 69 7 52 77 –13
–0.035 60 81 34 68 69 40 7–0.034 22 77 55 70 50 69 5–0.004 68 50 72 66 23 39 –10.035 80 6 71 35 65 59 –110.038 41 80 66 58 48 60 –130.003 55 76 70 63 43 49 –20.007 65 71 30 39 78 70 –4
–0.003 73 19 75 42 9 79 20.006 75 69 64 65 74 35 0
–0.061 43 82 65 76 81 47 30.056 78 73 77 37 56 30 –5
–0.049 28 83 53 22 82 83 20.054 42 74 80 67 38 80 –20.014 71 8 79 83 20 73 10.063 47 75 78 81 70 74 –30.013 82 60 76 54 47 78 00.026 76 79 82 80 31 82 00.007 83 38 81 50 60 81 0
–0.016 74 78 83 82 19 66 0

84 IN V E S T MEN T AT T R AC T IV ENE SS R AT ING OF RUSSI A N REGIONSE
XP
ER
T.
S
PE
CIA
L
ISS
UE Investment potential of Russian regions in 2012
Potential ranking Risk rank-ing, 2012
Region (federal subject) Share of total Russian potential,
2012 (%)
Changes in share of potential, 2012 to
2011 (pp.)
Labour Consumer2012 2011
1 1 10 Moscow 14.832 0.120 1 12 2 5 Moscow Region 6.249 0.061 2 23 3 4 Saint Petersburg 5.434 0.202 3 34 5 15 Sverdlovsk Region 2.723 0.099 8 45 4 2 Krasnodar Krai 2.654 –0.106 4 56 7 7 Republic of Tatarstan 2.521 0.133 5 77 6 46 Krasnoyarsk Krai 2.462 –0.062 14 148 13 32 Nizhny Novgorod Region 1.969 0.056 10 119 8 21 Samara Region 1.930 –0.075 7 910 9 14 Republic of Bashkortostan 1.929 –0.048 11 611 10 12 Rostov Region 1.914 –0.029 6 812 12 28 Chelyabinsk Region 1.907 –0.012 9 1013 11 52 Perm Krai 1.904 –0.023 19 1314 14 24 Khanty-Mansiysk Autonomous
District — Ugra 1.730 0.015 24 20
15 15 50 Kemerovo Region 1.701 0.030 18 1616 16 36 Novosibirsk Region 1.628 0.143 12 1517 17 1 Belgorod Region 1.417 –0.007 29 2918 18 47 Irkutsk Region 1.382 –0.012 20 2119 20 48 Republic of Sakha (Yakutia) 1.200 0.017 52 4520 22 30 Primorskiy Krai 1.154 0.003 21 2721 21 29 Saratov Region 1.139 –0.026 15 2322 19 39 Volgograd Region 1.128 –0.063 17 1823 28 9 Voronezh Region 1.116 0.066 22 1924 23 25 Stavropol Krai 1.112 –0.026 13 1725 27 37 Yamal-Nenets Autonomous District 1.095 0.022 61 5926 24 31 Altai Krai 1.079 –0.041 23 2427 26 8 Leningrad Region 1.068 –0.031 28 2828 29 23 Orenburg Region 1.017 –0.033 26 2529 31 33 Kaliningrad Region 1.000 0.000 37 5630 30 17 Omsk Region 0.997 –0.020 25 2231 25 27 Tyumen Region 0.996 –0.105 38 2632 34 11 Kaluga Region 0.983 0.082 50 4233 33 78 Republic of Dagestan 0.975 0.011 16 1234 32 35 Khabarovsk Krai 0.945 –0.023 27 3135 35 13 Tula Region 0.864 –0.028 30 3036 36 18 Vladimir Region 0.827 –0.032 33 3937 38 41 Kursk Region 0.795 –0.016 41 4338 37 16 Yaroslavl Region 0.782 –0.048 35 3839 40 53 Udmurt Republic 0.777 0.011 31 3240 39 71 Murmansk Region 0.752 –0.034 53 5041 45 34 Bryansk Region 0.721 0.018 40 3542 43 3 Lipetsk Region 0.719 –0.020 49 3443 42 61 Tver Region 0.701 –0.039 43 3644 46 51 Komi Republic 0.695 –0.005 55 4445 41 26 Tomsk Region 0.691 –0.059 39 5546 55 45 Smolensk Region 0.690 0.056 45 5147 50 56 Arkhangelsk Region 0.688 0.004 42 3348 51 19 Ulyanovsk Region 0.687 0.011 36 4149 52 42 Penza Region 0.684 0.010 32 3750 47 73 Trans-Baikal Krai 0.666 –0.029 63 4751 56 22 Sakhalin Region 0.663 0.035 73 6252 48 68 Republic of Buryatia 0.659 –0.028 62 5753 49 20 Ryazan Region 0.659 –0.027 48 4954 44 54 Chuvash Republic 0.658 –0.072 34 5355 53 59 Vologda Region 0.637 –0.021 51 5256 54 6 Tambov Region 0.636 –0.015 56 4857 58 58 Kirov Region 0.587 –0.011 46 4058 57 40 Astrakhan Region 0.578 –0.022 47 4659 59 65 Republic of Karelia 0.577 –0.002 69 6760 61 57 Ivanovo Region 0.547 0.014 44 5861 60 67 Kabardino-Balkar Republic 0.541 0.002 59 6462 63 77 Republic of North Ossetia — Alania 0.526 –0.006 60 6563 62 49 Orel Region 0.504 –0.028 58 6364 65 43 Novgorod Region 0.501 –0.004 68 6665 67 44 Amur Region 0.487 0.011 57 6166 64 60 Pskov Region 0.483 –0.040 70 6867 66 63 Republic of Mordovia 0.471 –0.026 54 7068 68 70 Kurgan Region 0.448 –0.025 65 6069 72 83 Chechen Republic 0.445 0.080 64 5470 69 79 Kamchatka Krai 0.415 –0.015 71 7471 70 66 Kostroma Region 0.401 –0.006 67 6972 71 62 Mari El Republic 0.373 –0.009 66 7173 74 74 Magadan Region 0.341 0.002 79 7774 75 72 Karachay-Cherkessia Republic 0.338 0.001 72 7575 73 64 Republic of Khakassia 0.332 –0.020 75 7276 76 38 Republic of Adygea 0.318 –0.012 74 7377 78 81 Republic of Ingushetia 0.314 0.065 76 7678 77 76 Chukotka Autonomous District 0.248 –0.011 82 8379 81 69 Jewish Autonomous Region 0.202 –0.002 81 8080 79 82 Tyva Republic 0.200 –0.022 78 7881 80 75 Altai Republic 0.190 –0.022 80 7982 82 80 Republic of Kalmykia 0.171 –0.016 77 8183 83 55 Nenets Autonomous District 0.108 –0.046 83 82
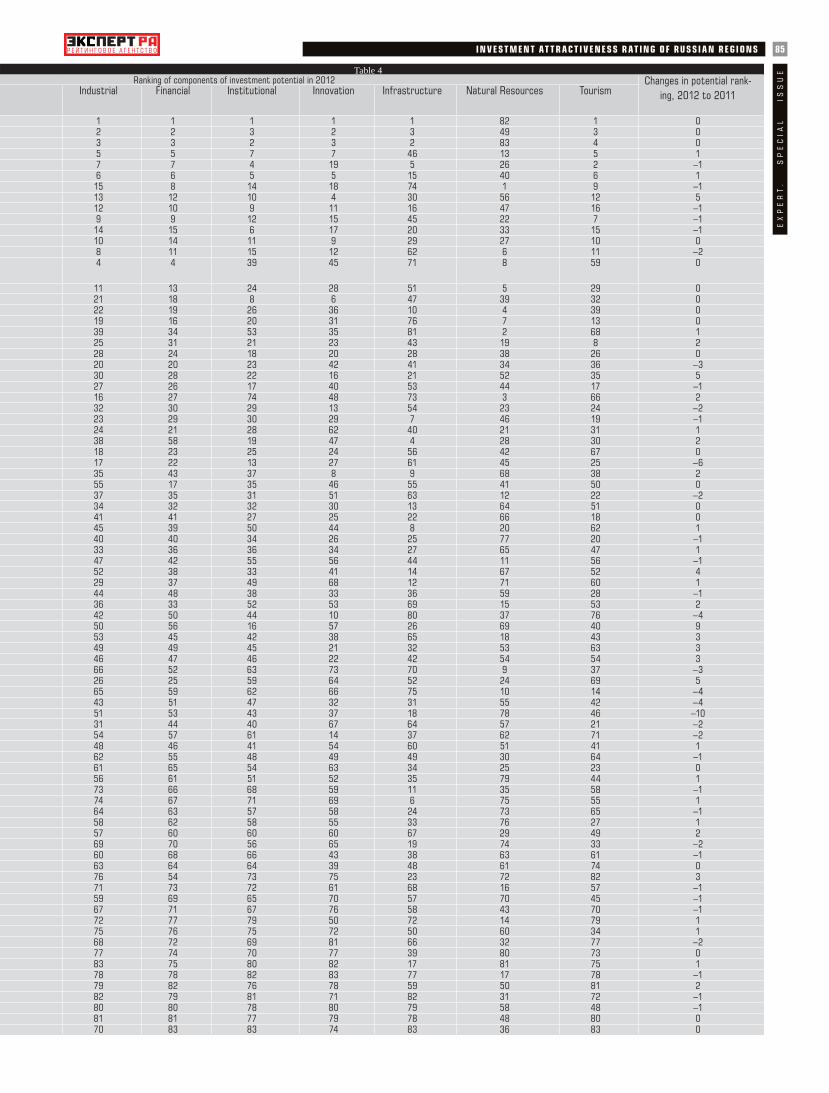
85IN V E S T MEN T AT T R AC T IV ENE SS R AT ING OF RUSSI A N REGIONS
EX
PE
RT
.
SP
EC
IAL
IS
SU
E Table 4Ranking of components of investment potential in 2012 Changes in potential rank-
ing, 2012 to 2011Industrial Financial Institutional Innovation Infrastructure Natural Resources Tourism
1 1 1 1 1 82 1 02 2 3 2 3 49 3 03 3 2 3 2 83 4 05 5 7 7 46 13 5 17 7 4 19 5 26 2 –16 6 5 5 15 40 6 115 8 14 18 74 1 9 –113 12 10 4 30 56 12 512 10 9 11 16 47 16 –19 9 12 15 45 22 7 –114 15 6 17 20 33 15 –110 14 11 9 29 27 10 08 11 15 12 62 6 11 –24 4 39 45 71 8 59 0
11 13 24 28 51 5 29 021 18 8 6 47 39 32 022 19 26 36 10 4 39 019 16 20 31 76 7 13 039 34 53 35 81 2 68 125 31 21 23 43 19 8 228 24 18 20 28 38 26 020 20 23 42 41 34 36 –330 28 22 16 21 52 35 527 26 17 40 53 44 17 –116 27 74 48 73 3 66 232 30 29 13 54 23 24 –223 29 30 29 7 46 19 –124 21 28 62 40 21 31 138 58 19 47 4 28 30 218 23 25 24 56 42 67 017 22 13 27 61 45 25 –635 43 37 8 9 68 38 255 17 35 46 55 41 50 037 35 31 51 63 12 22 –234 32 32 30 13 64 51 041 41 27 25 22 66 18 045 39 50 44 8 20 62 140 40 34 26 25 77 20 –133 36 36 34 27 65 47 147 42 55 56 44 11 56 –152 38 33 41 14 67 52 429 37 49 68 12 71 60 144 48 38 33 36 59 28 –136 33 52 53 69 15 53 242 50 44 10 80 37 76 –450 56 16 57 26 69 40 953 45 42 38 65 18 43 349 49 45 21 32 53 63 346 47 46 22 42 54 54 366 52 63 73 70 9 37 –326 25 59 64 52 24 69 565 59 62 66 75 10 14 –443 51 47 32 31 55 42 –451 53 43 37 18 78 46 –1031 44 40 67 64 57 21 –254 57 61 14 37 62 71 –248 46 41 54 60 51 41 162 55 48 49 49 30 64 –161 65 54 63 34 25 23 056 61 51 52 35 79 44 173 66 68 59 11 35 58 –174 67 71 69 6 75 55 164 63 57 58 24 73 65 –158 62 58 55 33 76 27 157 60 60 60 67 29 49 269 70 56 65 19 74 33 –260 68 66 43 38 63 61 –163 64 64 39 48 61 74 076 54 73 75 23 72 82 371 73 72 61 68 16 57 –159 69 65 70 57 70 45 –167 71 67 76 58 43 70 –172 77 79 50 72 14 79 175 76 75 72 50 60 34 168 72 69 81 66 32 77 –277 74 70 77 39 80 73 083 75 80 82 17 81 75 178 78 82 83 77 17 78 –179 82 76 78 59 50 81 282 79 81 71 82 31 72 –180 80 78 80 79 58 48 –181 81 77 79 78 48 80 070 83 83 74 83 36 83 0

86
the proportion of unprofi table enterprises, and the Nenets Autonomous District also reg-istered a twenty-percent drop in industrial production.
From our point of view, the increase in so-cial risks in the oil and gas regions is most interesting. Unemployment increased despite favourable conditions in the Tomsk and As-trakhan Regions, and in the Nenets Autono-mous District. In addition, the real income of the population has not reached the 2008 level in any of the oil and gas regions over the post-crisis period (with the exception of the Orenburg and Astrakhan Regions, where the economy is more diversifi ed).
However, given that revenues in the oil regions sometimes surpassed the average Russian income, this trend can be considered somewhat of an improvement in the overall situation.
Financial Goldmine Emerging from the economic crisis, most regions have managed to reduce their fi nan-cial risks for the second year in a row (see Chart 6). The ratio between expenditures and revenues of federal subjects continues to
improve. It is true that the pace of develop-ment has slowed down dramatically. On the whole, the debt situation has become a little better: the volume of debt liabilities in the regions grew by only 6.9% in 2011 (i.e. close to the infl ation rate), while 2010 saw an in-crease of over 20%. While most regions are still increasing their debt liabilities (some of them more than several times), the overall ratio of debt and own budget incomes has decreased.
However, we predict a negative forecast for fi nancial risks in the Russian regions. This is linked to the following reason: in the past few years, the trend has been clearly shifting to allocating more funds to education and healthcare (and partially, to the social sphere) from the federal to regional levels, although revenues in the regions have not increased very much. President Putin’s post-election de-crees stated that doctors’ and teachers’ salaries should not be lower than the average in each region, and regional budgets should bear the most responsibility for implementing these measures.
Last year, the regions experienced the fi rst investigation carried out by the federal gov-
ernment for the reallocation of expenditures. With an average growth of total expenditure amounting to 15.7%, funding for education increased by 19%, and for health care — by 72%, as compared to 2010!
In this sense, the predictions expressed by Andrey Klepach, Deputy Minister of Econom-ic Development, are quite signifi cant — from 2013 to 2015, budget defi cits in the regions will increase by more than six times, and over the following three years — as much as by six times.
Regional budgets cannot indefinitely increase borrowing to finance current expenditures: there are strict limits on debts and payments in relation to own revenues, which are incorporated in the Budget Code. The only way out of this difficult situation is to further increase federal transfers, and when this resource is depleted, regional expenditures will have to be sequestered.
Taking into account the practical experi-ence that we gained during the economic crisis of 2008-2009, we believe that public sector wages and costs for social programs will be cut last. Economic expenditures
he investment attractiveness rating of Russian regions is traditionally based on official information issued by Rosstat (Federal Service of State Statistics) and statistics issued by other federal agencies: the Ministry of Communications, Ministry of Finance, Ministry of Environment, the
FFMS (Federal Financial Market Service), and the Central Bank.Investment attractiveness ranking is evaluated by using two parameters:
investment potential and investment risk. Potential indicates the share that each region occupies on the national market; risk shows the scope of different problems that investors may encounter in each region. Total potential consists of nine categories: labour, financial, industrial, consumer, institutional, infrastructure, natural resources, tourism and innovation. Integrated risk includes six categories: financial, social, administrative, economic, ecological and criminal. The contribution of each particular risk or potential in the final indicator is assessed on the basis of a survey of representatives of the expert, investment, and banking communities.
We would like to express our gratitude to the representatives of companies and organizations that participated in this year’s survey: Vnesheconombank, the
Eurasian Development Bank, the Trust Bank, the SME Bank (Russian Bank for Small and Medium Enterprises), the Association of Regional Banks, the Chamber of Commerce and Industry of the Russian Federation, and the Higher School of Economics. Our experts determined the importance of each component in the integral indicator for risk and potential.
We used statistical data as of January 1, 2012.In the 2012 rating report, instead of using indicators such as “Number
of organizations involved in innovative activities” in the innovative potential category, we added the indicator – “Number of advanced production technologies”, and updated the list of science cities and special economic zones implementing innovation. In the infrastructure potential, instead of applying the indicator – “Share of organizations using the Internet, out of the total number of organizations”, we added the indicator – “Number of subscribers using broadband Internet per 100 people”. We consulted the list of SEZ (Special Economic Zones) implementing tourism and recreation in order to determine tourist potential. ■
Working out the Investment Attractiveness Rating of Russian Regions
T
IN V E S T MEN T AT T R AC T IV ENE SS R AT ING OF RUSSI A N REGIONSE
XP
ER
T.
S
PE
CIA
L
ISS
UE


(which also include support for investments) may be fi rst to go under the knife. This will not hurt developed areas too much – busi-ness companies will continue investing in the same way as before. However, for the vast majority of average regions, including the potential “third” wave regions, which need to invest in infrastructure in order to attract investors, the sequestration of invest-ment expenditures amid general economic growth will result in an investment coma.
Even many good initiatives implemented by the federal government face the risk of having to deal with the inefficiency of the government’s own fi scal policy. For example, it is possible that many of the projects drawn up by the Strategic Initiative Agency in the regions, particularly investment strategies, will simply remain without any funding from regional budgets.
Searching for a footholdFor the second year in a row, we have deter-mined risks throughout the whole country in our rating report.
In 2011, Russia was still experiencing eco-nomic growth, albeit weak. Consequently, moderate risks in the country have been re-duced for the second year in a row, except for ecological risks, which have risen slightly due to higher production levels of industrial enterprises and a larger number of car owners (see Chart 6). The main risk for investors was
reduced, namely poor quality management: it is quite possible that the federal government’s directives to improve the investment climate in the regions had an impact on the activities of regional administrations.
It can be assumed that, unless there is a catastrophic development in foreign trade, we again predict a reduction in moderate risks in the country for the 2013 rating sur-vey. However, the pace will obviously slow down. The current assessment of the Min-istry of Economic Development of the Rus-sian Federation concerning the dynamics of Russia’s GDP during 2012 amounts to 3.5%. It was 4.3% last year. It is evident that the
growth rate of regional economies will also slow down. Each constituent subject of the Russian Federation will have to fi nd its own sources for further development. For some regions, these are likely to be new projects applied on a nationwide scale (similar to those in the Far East), for others, it will mean exploiting their own natural resources (our rating report shows that this way is very dan-gerous). Particular hopes have been pinned on the “third wave” regions — it is here that the process of reindustrialization will clearly bear fruit, the need for which is becoming more and more evident for our country as a whole. ■
IN V E S T MEN T AT T R AC T IV ENE SS R AT ING OF RUSSI A N REGIONSE
XP
ER
T.
S
PE
CIA
L
ISS
UE
88

Copyright © 2022 FDOKUMEN