WO 2009/054996 A2
185
(12) INTERNATIONAL APPLICATION PUBLISHED UNDER THE PATENT COOPERATION TREATY (PCT) (19) World Intellectual Property Organization International Bureau (43) International Publication Date (10) International Publication Number 30 April 2009 (30.04.2009) PCT WO 2009/054996 A2 (51) International Patent Classification: (US). FRENTZEN, Alexa [DE/US]; 1219 Hornblend St., GOlN 33/50 (2006.01) C12N 7/00 (2006.01) Unit C, San Diego, CA 92109 (US). A61K 48/00 (2006.01) C12Q 1/70 (2006.01) (74) Agents: SEIDMAN, Stephanie L. et al; Bell Boyd & (21) International Application Number: Lloyd LIp, 3580 Carmel Mountain Road, Suite 200, San PCT/US2008/0 12061 Diego, CA 92130 (US). (22) International Filing Date: 24 October 2008 (24.10.2008) (81) Designated States (unless otherwise indicated, for every kind of national protection available): AE, AG, AL, AM, (25) Filing Language: English AO, AT, AU, AZ, BA, BB, BG, BH, BR, BW, BY, BZ, CA, CH, CN, CO, CR, CU, CZ, DE, DK, DM, DO, DZ, EC, EE, (26) Publication Language: English EG, ES, FI, GB, GD, GE, GH, GM, GT, HN, HR, HU, ID, IL, IN, IS, JP, KE, KG, KM, KN, KP, KR, KZ, LA, LC, LK, (30) Priority Data: LR, LS, LT, LU, LY, MA, MD, ME, MG, MK, MN, MW, 61/000,602 25 October 2007 (25 .10.2007) US MX, MY, MZ, NA, NG, NI, NO, NZ, OM, PG, PH, PL, PT, 61/003,275 14 November 2007 (14.1 1.2007) US RO, RS, RU, SC, SD, SE, SG, SK, SL, SM, ST, SV, SY, TJ, 61/057,191 29 May 2008 (29.05.2008) US TM, TN, TR, TT, TZ, UA, UG, US, UZ, VC, VN, ZA, ZM, ZW (71) Applicant (for all designated States except US): GENELUX CORPORATION [US/US]; 3030 Bunker (84) Designated States (unless otherwise indicated, for every Hill Street, Suite 310, San Diego, CA 92109 (US). kind of regionalprotection available): ARIPO (BW, GH, GM, KE, LS, MW, MZ, NA, SD, SL, SZ, TZ, UG, ZM, (71) Applicant (for US only): SZALAY,Aladar, A. [US/US]; ZW), Eurasian (AM, AZ, BY, KG, KZ, MD, RU, TJ, TM), 7740 North Folk Rd., Highland, CA 92346 (US). European (AT, BE, BG, CH, CY, CZ, DE, DK, EE, ES, FI, FR, GB, GR, HR, HU, IE, IS, IT, LT, LU, LV,MC, MT, NL, (72) Inventors; and NO, PL, PT, RO, SE, SI, SK, TR), OAPI (BF, BJ, CF, CG, (75) Inventors/Applicants (for US only): YU, Yong, A. CI, CM, GA, GN, GQ, GW, ML, MR, NE, SN, TD, TG). [CN/US]; 3830 Elijah Ct., Unit 422, San Diego, CA 92130 (US). CHEN, Nanhai [CN/US]; 9167 Buckwheat Street, Published: San Diego, CA 92129 (US). ZHANG, Qian [CN/US]; — without international search report and to be republished 12601 El Camino Real, Unit B, San Diego, CA 92130 upon receipt of that report (54) Title: SYSTEMS AND METHODS FOR VIRAL THERAPY (57) Abstract: Diagnostic methods and compositions associated with viral therapy are provided. In particular, methods, composi tions, and kits to measure markers and therapeutic indicator predictive of viral efficacy in antitumor therapy are provided. Therapeutic viruses and combinations and kits for use in the practicing the methods also are provided.
-
Upload
khangminh22 -
Category
Documents
-
view
0 -
download
0
Transcript of WO 2009/054996 A2

(12) INTERNATIONAL APPLICATION PUBLISHED UNDER THE PATENT COOPERATION TREATY (PCT)
(19) World Intellectual Property OrganizationInternational Bureau
(43) International Publication Date (10) International Publication Number30 April 2009 (30.04.2009) PCT WO 2009/054996 A2
(51) International Patent Classification: (US). FRENTZEN, Alexa [DE/US]; 1219 Hornblend St.,GOlN 33/50 (2006.01) C12N 7/00 (2006.01) Unit C, San Diego, CA 92109 (US).A61K 48/00 (2006.01) C12Q 1/70 (2006.01)
(74) Agents: SEIDMAN, Stephanie L. et al; Bell Boyd &(21) International Application Number: Lloyd LIp, 3580 Carmel Mountain Road, Suite 200, San
PCT/US2008/0 12061 Diego, CA 92130 (US).
(22) International Filing Date: 24 October 2008 (24.10.2008) (81) Designated States (unless otherwise indicated, for everykind of national protection available): AE, AG, AL, AM,
(25) Filing Language: English AO, AT,AU, AZ, BA, BB, BG, BH, BR, BW, BY, BZ, CA,CH, CN, CO, CR, CU, CZ, DE, DK, DM, DO, DZ, EC, EE,
(26) Publication Language: English EG, ES, FI, GB, GD, GE, GH, GM, GT, HN, HR, HU, ID,IL, IN, IS, JP, KE, KG, KM, KN, KP, KR, KZ, LA, LC, LK,
(30) Priority Data: LR, LS, LT, LU, LY, MA, MD, ME, MG, MK, MN, MW,61/000,602 25 October 2007 (25 .10.2007) US MX, MY, MZ, NA, NG, NI, NO, NZ, OM, PG, PH, PL, PT,61/003,275 14 November 2007 (14.1 1.2007) US RO, RS, RU, SC, SD, SE, SG, SK, SL, SM, ST, SV, SY,TJ,61/057,191 29 May 2008 (29.05.2008) US TM, TN, TR, TT, TZ, UA, UG, US, UZ, VC, VN, ZA, ZM,
ZW(71) Applicant (for all designated States except US):
GENELUX CORPORATION [US/US]; 3030 Bunker (84) Designated States (unless otherwise indicated, for everyHill Street, Suite 310, San Diego, CA 92109 (US). kind of regional protection available): ARIPO (BW, GH,
GM, KE, LS, MW, MZ, NA, SD, SL, SZ, TZ, UG, ZM,(71) Applicant (for US only): SZALAY,Aladar, A. [US/US]; ZW), Eurasian (AM, AZ, BY, KG, KZ, MD, RU, TJ, TM),
7740 North Folk Rd., Highland, CA 92346 (US). European (AT,BE, BG, CH, CY, CZ, DE, DK, EE, ES, FI,FR, GB, GR, HR, HU, IE, IS, IT, LT,LU, LV,MC, MT, NL,
(72) Inventors; and NO, PL, PT, RO, SE, SI, SK, TR), OAPI (BF, BJ, CF, CG,(75) Inventors/Applicants (for US only): YU, Yong, A. CI, CM, GA, GN, GQ, GW, ML, MR, NE, SN, TD, TG).
[CN/US]; 3830 Elijah Ct., Unit 422, San Diego, CA 92130(US). CHEN, Nanhai [CN/US]; 9167 Buckwheat Street, Published:San Diego, CA 92129 (US). ZHANG, Qian [CN/US]; — without international search report and to be republished12601 El Camino Real, Unit B, San Diego, CA 92130 upon receipt of that report
(54) Title: SYSTEMS AND METHODS FOR VIRAL THERAPY
(57) Abstract: Diagnostic methods and compositions associated with viral therapy are provided. In particular, methods, compositions, and kits to measure markers and therapeutic indicator predictive of viral efficacy in antitumor therapy are provided. Therapeuticviruses and combinations and kits for use in the practicing the methods also are provided.

SYSTEMS AND METHODS FOR VIRAL THERAPY
RELATED APPLICATIONS
Benefit of priority is claimed to U.S. Provisional Application Serial No.
61/000,602, to Nanhai Chen, Yong A. Yu and Aladar A. Szalay, filed on October 25,
2007, entitled "SYSTEMS AND METHODS FOR VIRAL THERAPY," to U.S.
Provisional Application Serial No. 61/003,275, to Nanhai Chen, Yong A. Yu and
Aladar A. Szalay, filed on November 14, 2007, entitled "SYSTEMS AND
METHODS FOR VIRAL THERAPY," and to U.S. Provisional Application Serial
No. 61/057,191, to Yong A. Yu Nanhai Chen, Alexa Frentzen and Aladar A. Szalay,
filed on May 29, 2008, entitled "SYSTEMS AND METHODS FOR VIRAL
THERAPY." Where permitted, the subject matter of each of these applications is
incorporated by reference in its entirety.
This application is related to U.S. application Serial No. (Attorney Dkt. No.
0 119356-144/1 17) to Aladar A. Szalay, Yong A. Yu, Nanhai Chen and Alexa
Frentzen, filed on October 25, 2008, entitled "SYSTEMS AND METHODS FOR
VIRAL THERAPY," which also claims priority to U.S. Provisional Application
Serial No. 61/000,602, U.S. Provisional Application Serial No. 61/003,275, and to
U.S. Provisional Application Serial No. 61/057,191.
This application is related to U.S. Application Serial No. 11/975,088, filed on
October 16, 2007, entitled "METHODS FOR ATTENUATING VIRUS STRAINS
FOR DIAGNOSTIC AND THERAPEUTIC USES," to U.S. Application Serial No.
11/975,090, filed on October 16, 2007, entitled "MODIFIED VACCINIA VIRUS
STRAINS FOR USE IN DIAGNOSTIC AND THERAPEUTIC METHODS," to U.S.
Application Serial No. 12/080,766, filed on April 4, 2008, entitled "METHODS FOR
ATTENUATING VIRUS STRAINS FOR DIAGNOSTIC AND THERAPEUTIC
USES," and to International Application No. PCT/US2007/022172, filed on October
16, 2007, entitled "MODIFIED VACCINIA VIRUS STRAINS FOR USE IN
DIAGNOSTIC AND THERAPEUTIC METHODS."
This application also is related to U.S. Application Serial No. 12/157,960 to Nanhai
Chen, Yuman Fong, Aladar A . Szalay, Yong A. Yu and Qian Zhang, filed on June 13,
2008, entitled "MICROORGANISMS FOR IMAGING AND/OR TREATMENT OF

TUMORS" and to International Application No. PCT/US2008/007377 to Nanhai
Chen, Yuman Fong, Aladar A. Szalay, Yong A. Yu and Qian Zhang, filed on June 13,
2008, entitled "MICROORGANISMS FOR IMAGING AND/OR TREATMENT OF
TUMORS."
This application is related to U.S. Application Serial No. 10/872,156, to
Aladar A. Szalay, Tatyana Timiryasova, Yong A. Yu and Qian Zhang, filed on June
18, 2004, entitled "MICROORGANISMS FOR THERAPY," which claims the
benefit of priority under 35 U.S.C. § 119(a) to each of EP Application No. 03 013
826.7, filed 18 June 2003, entitled "Recombinant vaccinia viruses useful as tumor-
specific delivery vehicle for cancer gene therapy and vaccination," EP Application
No. 03 018 478.2, filed 14 August 2003, entitled "Method for the production of a
polypeptide, RNA or other compound in tumor tissue," and EP Application No. 03
024 283.8, filed 22 October 2003, entitled "Use of a Microorganism or Cell to Induce
Autoimmunization of an Organism Against a Tumor." This application also is related
to International Application No. PCT/US04/1 9866, filed on June 18, 2004, entitled
"MICROORGANISMS FOR THERAPY."
This application also is related to U.S. Application Serial No. 10/866,606,
filed June 10, 2004, entitled "Light emitting microorganisms and cells for diagnosis
and therapy of tumors," which is a continuation of U.S. Application Serial No.
10/189,918, filed July 3, 2002, entitled "Light emitting microorganisms and cells for
diagnosis and therapy of tumors." This application also is related to International
PCT Application PCT/IB02/04767, filed July 31, 2002, entitled "Microorganisms and
Cells for Diagnosis and Therapy of Tumors," EP Application No. 0 1 118 417.3, filed
July 31, 2001, entitled "Light-emitting microorganisms and cells for tumor
diagnosis/therapy," EP Application No. 0 1 125 9 11.6, filed October 30, 2001 , entitled
"Light emitting microorganisms and cells for diagnosis and therapy of tumors" and
EP Application No. 02 0794 632.6, filed January 28, 2004, entitled "Microorganisms
and Cells for Diagnosis and Therapy of Tumors."
Where permitted, the subject matter of each of the above-referenced
applications is incorporated by reference in its entirety.

Incorporation by reference of Sequence Listing provided on compact discs
An electronic version on compact disc (CD-R) of the Sequence Listing is filed
herewith in four copies (labeled COPY 1, COPY 2, COPY 3, and CRF), the contents
of which are incorporated by reference in their entirety. The computer-readable file
on each of the aforementioned compact discs, created on October 24, 2008 i s
identical, 1588 kilobytes in size, and titled 117seq.pcl.txt.
FIELD OF INVENTION
Diagnostic methods for assaying the efficacy of therapeutic viruses in vitro for
the treatment of cancer and methods for identifying therapeutic viruses are provided.
Combinations and kits for use in the practicing the methods are provided.
BACKGROUND
Current standard cancer therapies include surgery, chemotherapy, radiation,
and autologous cell transplantation. Surgery is generally effective in the early
treatment of cancer; however, metastatic growth of tumors can prevent any complete
cure. Chemotherapy, which involves administration of compounds having antitumor
activity, while effective in the treatment of some cancers, is often accompanied by
severe side effects, including nausea and vomiting, bone marrow depression, renal
damage, and central nervous system depression. Radiation therapy has also been used
to target cancer cells, as cancer cells are less able to repair themselves after treatment
with radiation. However, radiation cannot be used to treat many cancers because of
the sensitivity of normal cells which surround cancerous tissue.
Viral therapy provides an additional tool to treat cancer. Approaches to viral
therapy are at least twofold. A first approach includes the use of non-destructive
viruses to introduce genes into cells. In this approach, genes can express an enzyme
such as thymidine kinase that the cells do not otherwise express. The rationale of this
type of therapy is to selectively provide tumor cells with an enzymatic activity that is
lacking or is much lower in the normal cells and which renders the tumor cells
sensitive to certain drugs. Another approach to viral therapy to treat cancerous cells
involves direct inoculation of tumor with attenuated viruses. Attenuated viruses can
exhibit a reduced virulence yet are able to actively multiply and may ultimately cause
the destruction of infected cells.

-A-
There remains a need to assess whether viral therapy will be successful in
treating a given subject and to develop additional effective vectors for use in viral
therapy.
SUMMARY
Provided are methods for predicting the efficacy of a particular therapeutic
virus for treatment of a particular tumor. As described herein, therapeutic viruses,
such as oncolytic viruses, often are effective against one type of tumor (a responder),
but not against another (a non-responder). A responder is a tumor cell that is
susceptible to treatment with the virus and a non-responder is a tumor cell the is
resistant to treatment with the virus.
Methods are provided herein for predicting for which viruses a tumor will be
a responder. This permits, for example, selection of an appropriate viral therapy. As
shown herein, while many viruses replicate in the tumor, those that will be not be
effective for a particular tumor type, exhibit a delay in replication. Hence, the level
of replication early after introduction or administration of a virus to a tumor, is an
indicator of the viruses efficacy for a particular tumor. Also provided herein, are
tumor cell markers, such as housekeeping genes, whose expression decreases upon
viral infection and are indicative of non-delayed replication. In addition, as shown
herein, the presence or absence of certain host cell makers also can indicate efficacy
of therapeutic virus for a particular tumor. To assess such markers or measure viral
replication, levels can be compared to suitable to controls or to standards or to pre¬
determined values.
In particular, provided are methods for predicting efficacy of viral therapy for
a tumor. Such methods include the steps of:
determining a replication indicator indicative of the level or amount of
viral replication within a predetermined period of time or as a function of time after
introduction of the a therapeutic virus into tumor cells; and
determining if replication is delayed, wherein if replication is not
delayed, selecting the virus as a candidate therapeutic virus for treatment of the tumor
in a subject.
For example, delayed replication can be assessed by:

infecting a cell culture with a therapeutic virus, wherein the cell
culture contains cells from a tumor;
after a predetermined time, determining a replication indicator of
replication of the virus in the culture; and
based on the value of the replication indicator, predicting a therapeutic
efficacy of the virus against the tumor.
Viral replication can be assessed in appropriate tumor cells, including, but not
limited to, tissue cultured tumor cells or cells from a tumor biopsy or body fluid
containing tumor cells.
Therapeutic viruses include any therapeutic viruses known to those of skill in
the art, including viruses, such as adenoviruses, herpesviruses and pox viruses, such
as vaccinia viruses. Often the virus is an oncolytic virus, which optionally expresses
a therapeutic product and/or detectable markers or other appropriate product.
Exemplified herein are vaccinia viruses of the strain LIVP, such as the virus that
contains inactivated, such as by insertion of heterologous nucleic acid, in the HA, F3
and F14.5 genes/loci. Exemplary of such viruses is the strain designated GLV-lh68,
which optionally can be modified to express additional heterologous nucleic acid
molecules (in place of or in addition to the inserted heterologous nucleic acid in
GLV-lh68.
The replication indicator that is measured is any parameter from which the
level or amount or relative amount of viral replication, typically within a day of
administration to the tumor cells, can be assessed or inferred. For example,
replication can be determined by infecting or introducing the test virus into a tumor
cell and assessing viral titer at a particular time or as a function of time. This can be
compared to a predetermined standard or compared to other test candidates. Those the
replicate relatively early, typically within about or zero to 10 days, about or zero to 5
days, about or zero to 3 days about or zero to 2 days, about or zero to 1 day, such as
within two days or one day or 10 to 24 hours or 5 to 10 or 20 hours, are candidate
therapeutic viruses. The particular time value to select can be empirically determined
if necessary. Thus, the replication indicator can be determined and, for example, can
be compared to a standard indicative of delayed replication or non-delayed

replication. The standard can be pre-determined, such as a database of values of the
indicator that represent non-delayed replication. Thus, for example, the replication
indicator can be compared to a database of predetermined values for tumor cell types
to determine whether the replication indicator has a value indicative of non-delayed
replication.
In another embodiment, a tumor cell is identified as responsive to virus
therapy by: obtaining a first set of values, each of the first set of values
corresponding to a first parameter indicative of in vivo therapeutic effect of a virus on
a cancerous cell line;
obtaining a second set of values, each of the second set of values
corresponding to a second parameter indicative of a replication property of the virus
in the cell line; and
categorizing the cancerous cell lines into two or more groups based at
least in part on the first and second sets of values, the two or more groups
representative of likely responses of respective cell lines to the virus.
Replication indicators, include but are not limited to one or more of:
(i) an increasein expression of a viral gene or a heterologous gene
encoded by the virus, wherein an increase in expression is indicative that the tumor
cells are responsive to virus therapy;
(ii) a decrease in expression of a housekeeping gene expressed in the
tumor upon viral expression, wherein a decrease in expression is indicative that the
tumor cells are responsive to virus therapy; or
(iii) a change in expression of a gene expressed by the tumor cells,
wherein a change in expression is indicative that the tumor cells are responsive to
virus therapy
Typically, when gene expression in the tumor cells is assessed, expression of a
plurality of such genes, such as housekeeping genes whose expression decreases in
tumor cells that are responders, are assessed. Hence panels of genes can be assessed,
such as by reacting a nucleic acid sample, with an array (or high density microarray)
containing nucleic acid encoding sufficient portions of a plurality of genes to detect
expression, hi some embodiments, patterns of expression can be detected and

correlated with a responder/non-responder phenotype. Genes that can be assed
include expression of one or more genes encoding a protein selected from among IL-
18 (Interleukin-18), MCP-5 (Monocyte Chemoattractant Protein-5; CCL12), IL-I l
(Interleukin-1 1), MCP-I (Monocyte Chemoattractant Protein- 1), MPO
(Myeloperoxidase), Apo Al (Apolipoprotein Al), TIMP-I (Tissue Inhibitor of
Metalloproteinase Type-1), CRP (C Reactive Protein), Fibrinogen, MMP-9 (Matrix
Metalloproteinase-9), Eotaxin (CCLl 1), GCP-2 (Granulocyte Chemotactic Protein-2;
CXCL6), IL-6 (Interleukin-6), Tissue Factor (TF), SAP (Serum Amyloid P), FGF-
basic (Fibroblast Growth Factor-basic), MCP-3 (Monocyte Chemoattractant Protein-
3; CCL7), IP-10 (CXCL 10), MIP-2, Thrombopoetin, Cancer antigen 125, CD40,
CD40 ligand, ENA-78, Ferritin, IL-12p40, IL-12p70, IL- 16, MMP-2, PAI-I, TNF
RII, TNF-beta and VCAM-I indicates that the tumor cells are responsive to virus
therapy.
Increases in expression of housekeeping genes or panels, such as arrays of
probes, for detecting expression of housekeeping genes in a tumor cell following
introduction of a virus can be assess, such as as a function of time, indicate that a
tumor is a non-responder. Housekeeping genes, include genes encoding proteins, such
as actin, various ribosomal proteins are well known (see, e.g., the article "Human
Housekeeping genes are compact" (2003) Trends in Genetics 19:362-365). For
example, increases in gene expression of one or more genes encoding a protein
selected from among MIP-lbeta (Macrophage Inflammatory Protein- 1beta), MDC
(Macrophage-Derived Chemokine; CCL22), MIP-I alpha (Macrophage Inflammatory
Protein- 1alpha; CCL3), KC/GROalpha (Melanoma Growth Stimulatory Activity
Protein), VEGF (Vascular Endothelial Cell Growth Factor), Endothelin-1, MIP-3 beta
(Macrophage Inflammatory Protein-3 beta; Exodus-3 or ELC), Beta-2 microglobulin,
IL-5 (Interleukin-5), IL-I alpha (Interleukin-1 alpha), EGF (Epidermal Growth
Factor), Lymphotactin (XCLl), GM-CSF (Granulocyte Macrophage-Colony
Stimulating Factor), MIP-I gamma (Macrophage Inflammatory Protein- 1gamma;
CCL4), IL-I beta (Interleukin-1 beta), Brain-derived neutrophic factor, Cancer antigen
19-9, Carcinoembryonic antigen, C reactive protein, EGF, Fatty acid binding protein,
Factor VII, Growth hormone, IL-I alpha, IL-I beta, IL-I ra, IL-7, IL-8, MDC,

Prostatic acid phosphatase, Prostate specific antigen, free, Stem cell factor, Tissue
factor, TNF-alpha, VEGF and Von Willebrand factor, indicates that the tumor cells
are not responsive to virus therapy.
In all of the methods, the virus can be modified to include a gene that encodes
a protein whose expression is increased in responders compared to non-responders or
encodes a gene product that reduces expression of a protein whose level of expression
is increased in non-responders compared to responders. Those genes whose
expression improves response to the virus can be included in the therapeutic virus to
improve therapeutic efficacy.
As noted, a responder is a tumor cell that is susceptible to treatment with the
virus and a non-responder is a tumor cell the is resistant to treatment with the virus.
Also provided are methods for improving or increasing the therapeutic
efficacy of a therapeutic virus for a particular tumor or tumor type. This can be
achieved by including in the virus nucleic acid that encodes a protein whose
expression is increased in responders compared to non-responders or encodes a gene
product that reduces expression of a protein whose level of expression is increased in
non-responders compared to responders, wherein a responder is a tumor that is
susceptible to treatment with the virus and a non-responder is a tumor the is resistant
to treatment with the virus.
Also provided are methods of viral therapy and/or uses of the viruses for
treatment or formulation of a medicament, where the therapeutic virus encodes a
protein whose expression is increased in responders compared to non-responders or
encodes a gene product that reduces expression of a protein whose level of expression
is increased in non-responders compared to responders, wherein a responder is a
tumor that is susceptible to treatment with the virus and a non-responder is a tumor
the is resistant to treatment with the virus. Such viruses and methods and uses can be
employed for treatment of subjects with non-responder tumor. The gene product
encoded by the virus can be RNA, such as siRNA, or antisense nucleic acid or a
ribozyme. Other products that can be expressed by the virus include therapeutic
proteins, including, for example, one or more of TIMP-I, TIMP-2, TIMP-3, MCP-I,
and IP-10. The therapeutic viruses include any such virus, including vaccinia virus,

such as an LIVP virus, such as a GLV- Ih68 modified to express a therapeutic
product. Exemplary of such viruses are any selected from among GLV-lhl03, GLV-
IhI 19, GLV-lhl20 or GLV-1M21. For all methods described herein, the therapeutic
viruses include any suitable therapeutic virus, including oncolytic viruses and any
discussed herein or known to those of skill in the art.
The therapeutic viruses can be provided as pharmaceutical compositions.
Such compositions can additionally contain another therapeutic agent or can be
administered in conjunction with a another agent. In particular, the therapeutic
viruses can be used a part of a combination anti-cancer protocol. Combination
therapies include co-administration or sequential or intermittent administration of
viral therapy and chemotherapeutic compounds or other anti-cancer therapies, such as
radiation and surgery. Examplar chemotherapeutic compounds include, but are not
limited to, platinum; platinum analogs anthracenediones; vinblastine; alkylating
agents; alkyl sulfonates; aziridines; ethylenimines and methylamelamines;
nitrosureas; antibiotics; anti-metabolites; folic acid analogues; androgens; anti-
adrenals; folic acid replenisher; aminolevulinic acid; amsacrine; bestrabucil;
bisantrene; edatraxate; defofamine; demecolcine; diaziquone; elfornithine; elliptinium
acetate; etoglucid; gallium nitrate; substituted ureas; hydroxyurea; lentinan;
lonidamine; mitoguazone; mitoxantrone; mopidamol; nitracrine; pentostatin;
phenamet; pirarubicin; podophyllinic acid; 2-ethylhydrazide; procarbazine; anti¬
cancer polysaccharides; polysaccharide-K; razoxane; sizof ϊ ran; spirogermanium;
tenuazonic acid; triaziquone; 2, 2',2"-trichlorotriethylamine; urethan; vindesine;
dacarbazine; mannomustine; mitobronitol; mitolactol; pipobroman; gacytosine;
cytosine arabinoside; cyclophosphamide; thiotepa; taxoids, such as paclitaxel and
doxetaxel; chlorambucil; gemcitabine; 6-thioguanine; mercaptopurine; methotrexate;
etoposide (VP-1 6); ifosfamide; mitomycin C; vincristine; vinorelbine; navelbine;
novantrone; teniposide; daunomycin; aminopterin; xeloda; ibandronate; CPTl 1;
topoisomerase inhibitor RFS 2000; difiuoromethylornithine (DMFO); retinoic acid;
esperamicins; capecitabine; methylhydrazine derivatives; and pharmaceutically
acceptable salts, acids or derivatives of any of the above. Chemotherapeutic
compounds also include, but are not limited to, adriamycin, non-sugar containing

chloroethylnitrosoureas, 5-fluorouracil, bleomycin, doxorubicin, taxol, fragyline,
Meglamine GLA, valrubicin, carmustaine and poliferposan, MMl 270, BAY 12-9566,
RAS famesyl transferase inhibitor, famesyl transferase inhibitor, MMP,
MTA/LY231514, LY264618/Lometexol, Glamolec, CI-994, TNP-470,
Hycamtin/Topotecan, PKC412, Valspodar/PSC833, Novantrone/Mitroxantrone,
Metaret/Suramin, Batimastat, E7070, BCH-4556, CS-682, 9-AC, AG3340, AG3433,
Incel/VX-710, VX-853, ZDOlOl, IS1641, ODN 698, TA 2516/Marmistat,
BB2516/Marmistat, CDP 845, D2163, PD183805, DX8951f, Lemonal DP 2202, FK
317, Picibanil/OK-432, AD 32/Valrubicin, Metastron/strontium derivative,
Temodal/Temozolomide, Evacet/liposomal doxorubicin, Yewtaxan/Placlitaxel,
TaxolO/Paclitaxel, Xeload/Capecitabine, Furtulon/Doxifluridine, Cyclopax/oral
paclitaxel, Oral Taxoid, SPU-077/Cisplatin, HMR 1275/Flavopiridol, CP-358
(774)/EGFR, CP-609 (754)/RAS oncogene inhibitor, BMS-1 82751 /oral platinum,
UFT(TegafurAJracil), Ergamisol/Levamisole, Eniluracil/776C85/5FU enhancer,
Campto/Levamisole, Camptosar/Irinotecan, Tumodex/Ralitrexed,
Leustatin/Cladribine, Paxex/Paclitaxel, Doxil/liposomal doxorubicin,
Caelyx/liposomal doxorubicin, Fludara/Fludarabine, Pharmarubicin/Epirubicin,
DepoCyt, ZDl 839, LU 79553/Bis-Naphtalimide, LU 103793/Dolastain,
Caetyx/liposomal doxorubicin, Gemzar/Gemcitabine, ZD 0473/Anormed, YM 116,
Iodine seeds, CDK4 and CDK2 inhibitors, PARP inhibitors, D4809/Dexifosamide,
Ifes/Mesnex/Ifosamide, Vumon®/Teniposide, Paraplatin/Carboplatin,
Plantinol/cisplatin, Vepeside/Etoposide, ZD 9331, Taxotere/Docetaxel, prodrug of
guanine arabinoside, Taxane Analog, nitrosoureas, alkylating agents such as
melphelan and cyclophosphamide, Aminoglutethimide, Anastrozole, Asparaginase,
Busulfan, Carboplatin, Chlorambucil, Cladribine, Cytarabine HCl, Dactinomycin,
Daunorubicin HCl, Denileukin diftitox, Estramustine phosphate sodium, Etoposide
(VP 16-2 13), Exemestane, Floxuridine, Fluorouracil (5-FU®), Flutamide,
Hydroxyurea (hydroxycarbamide), Ifosfamide, Interferon Alfa-2a, Interferon Alfa-2b,
Interferon Gamma- Ib, Letrozole, Leuprolide acetate (LHRH -releasing factor
analogue), Lomustine (CCNU), Mechlorethamine HCl (nitrogen mustard), Megestrol,
Mercaptopurine, Mesna, Mitotane (o.p'-DDD), Mitoxantrone HCl, Octreotide,

Pegaspargase, Plicamycin, Procarbazine HCl, Streptozocin, Tamoxifen citrate,
Thioguanine, Thiotepa, Tretinoin, Vinblastine sulfate, Amsacrine (m-AMSA),
Azacitidine, Erythropoietin, Hexamethylmelamine (HMM), Interleukin 2,
Mitoguazone (methyl-GAG; methyl glyoxal bis-guanylhydrazone; MGBG),
Pentostatin (2'deoxycoformycin), Semustine (methyl-CCNU), Teniposide (VM-26®),
Vindesine sulfate, Altretamine, Carmustine, Estramustine, Gemtuzumab ozogamicin,
Idarubicin, Ifosphamide, Isotretinoin, Leuprolide, Melphalan, Testolactone, Uracil
mustard, and the like. Also included in this definition are anti-hormonal agents that
act to regulate or inhibit hormone action on tumors such as anti-estrogens,
adrenocortical suppressants, antiandrogens and pharmaceutically acceptable salts,
acids or derivatives of any of the above. Such chemotherapeutic compounds that can
be used herein include compounds whose toxicities preclude use of the compound in
general systemic chemotherapeutic methods.
In another embodiment, methods for assessing or predicting efficacy of
particular virus for therapy of a particular tumor are provided. These methods
include: determining the level of expression of at least one marker that is increased or
decreased in a responder compared a non-responder in the absence of virus treatment;
and based on the level of expression of the marker, predicting a therapeutic effect
of the virus against the tumor. In other embodiments a plurality of such markers can
be assessed. Such markers include, one or more or combinations of , but are not
limited to, Beta-2 Microglobulin, Brain-Derived Neurotrophic Factor, Cancer Antigen
19-9, Carcinoembryonic Antigen, C Reactive Protein, EGF, Fatty Acid Binding
Protein, Factor VII, Growth Hormone, GM-CSF, IL-I alpha, IL-Ibeta, IL- Ira, IL-7,
IL-8, Prostatic Acid Phosphatase, Prostate Specific Antigen, Stem Cell Factor, TNF-
alpha and VEGF.
In other embodiments, markers that are increased in non-responders compared
to responders, include, but are not limited to, for example, Beta-2 Microglobulin,
Brain-Derived Neurotrophic Factor, Cancer Antigen 19-9, Carcinoembryonic
Antigen, C Reactive Protein, EGF, Fatty Acid Binding Protein, Factor VII, Growth
Hormone, GM-CSF, IL-I alpha, IL-I beta, IL-I ra, IL-7, IL-8, Prostatic Acid
Phosphatase, Prostate Specific Antigen, Stem Cell Factor, TNF-alpha, and VEGF.
Methods for assessing whether a particular subject likely will respond
favorably or poorly to a particular viral therapy are provided. These methods include:
contacting a sample, particularly a sample, such as a biopsy or body fluid or
tissue that contains tumor cells, from the subject with a therapeutic virus;
determining whether the level of expression of at least one marker is altered in
response to the virus, wherein the marker is a marker that is altered in a responder
compared to a non-responder; and
based on whether the level of expression of the marker is altered, predicting
whether a subject is likely to respond favorably or poorly to viral therapy.
Determining can be effected by any suitable method, such as for example,
comparing the level of expression of the marker in the sample which has been
contacted with the virus to the level of expression of the marker in a sample which has
not been contacted with the virus. The sample can be contacted with the virus and
cultured in vitro.
As with the methods discussed above, a levels of expression of a marker or
plurality of markers can be assessed and/or a patter of expression of markers can be
assessed. The markers are products whose level of expression is indicative of a
favorable or a poor response to viral therapy. For some markers, an increased level
in the presence of the virus is indicative of a favorable response; for others, a
decreased level is indicative of a favorable response. As with the methods above,
markers and combinations thereof can be determined empirically, such as by the
methods exemplified in the Examples.
Markers include, but are not limited to, IL- 18, MCP-5, IL-1 1, MCP-I, MPO,
Apo Al, TIMP-I (Tissue Inhibitor of Metalloproteinase Type-1), CRP (C Reactive
Protein), Fibrinogen, MMP-9 (Matrix Metalloproteinase-9), Eotaxin (CCLl 1), GCP-2
(Granulocyte Chemotactic Protein-2; CXCL6), IL-6 (Interleukin-6), Tissue Factor
(TF), SAP (Serum Amyloid P), FGF-basic (Fibroblast Growth Factor-basic), MCP-3
(Monocyte Chemoattractant Protein-3; CCL7), IP-IO (CXCL 10), MIP-2,
Thrombopoetin, Cancer antigen 125, CD40, CD40 ligand, ENA-78, Ferritin, IL-
12p40, IL-12p70, IL-16, MMP-2, PAI-I, TNF RII, TNF-beta and VCAM-I, MIP-
lbeta (Macrophage Inflammatory Protein- 1beta), MDC (Macrophage-Derived

Chemokine; CCL22), MIP-I alpha (Macrophage Inflammatory Protein- 1alpha;
CCL3), KC/GROalpha (Melanoma Growth Stimulatory Activity Protein), VEGF
(Vascular Endothelial Cell Growth Factor), Endothelin-1, MIP-3 beta (Macrophage
Inflammatory Protein-3 beta; Exodus-3 or ELC), Beta-2 microglobulin, IL-5
(Interleukin-5), IL-I alpha (Interleukin-1 alpha), EGF (Epidermal Growth Factor),
Lymphotactin (XCLl), GM-CSF (Granulocyte Macrophage-Colony Stimulating
Factor), MIP-I gamma (Macrophage Inflammatory Protein- 1gamma; CCL4), IL-lbeta
(Interleukin-1 beta), Brain-derived neutrophic factor, Cancer antigen 19-9,
Carcinoembryonic antigen, C reactive protein, EGF, Fatty acid binding protein, Factor
VII, Growth hormone, IL-I alpha, IL-I beta, IL-I ra, IL-7, IL-8, MDC, Prostatic acid
phosphatase, Prostate specific antigen, Stem cell factor, Tissue factor, TNF-alpha,
VEGF, Von Willebrand factor, IgA (Immunoglobulin A), Haptoglobin, MIP-2
(Macrophage Inflammatory Protein-2), IL- 17 (Interleukin-1 7), SGOT (Serum
Glutamic-Oxaloacetic Transaminase), IP-IO (Inducible Protein-10), IL-IO, FGF-9
(Fibroblast Growth Factor-9), M-CSF (Macrophage-Colony Stimulating Factor), IL-4
(Interleukin-4), IL-3 (Interleukin-3), TPO (Thrombopoietin), SCF (Stem Cell Factor),
LIF (Leukemia Inhibitory Factor), IL-2 (Interleukin-2), VCAM-I (Vascular Cell
Adhesion Molecule- 1; CD106) and TNF alpha and OSM (Oncostatin M).
As noted, one or a plurality of markers can be assessed. The markers can be
determined by contacting with a suitable array or microarray of probes for such
markers. In these methods as in the others described above, a plurality of markers can
be assessed, such as at least 5, 10, 15, 20, 25, 30, 35, 50, 75, 100, 150, 200, 250, 300,
330, 350. Such markers included, but are not limited to: IL-1 8 (Interleukin-1 8),
MCP-5 (Monocyte Chemoattractant Protein-5; CCL 12), IL-1 1 (Interleukin-1 1), MCP-
1 (Monocyte Chemoattractant Protein-1), MPO (Myeloperoxidase), Apo Al
(Apolipoprotein Al), TIMP-I (Tissue Inhibitor of Metalloproteinase Type-1), CRP (C
Reactive Protein), Fibrinogen, MMP-9 (Matrix Metalloproteinase-9), Eotaxin
(CCLI l), GCP-2 (Granulocyte Chemotactic Protein-2; CXCL6), IL-6 (Interleukin-6),
Tissue Factor (TF), SAP (Serum Amyloid P), FGF-basic (Fibroblast Growth Factor-
basic), MCP-3 (Monocyte Chemoattractant Protein-3; CCL7), IP-10 (CXCL 10),
MIP-2, Thrombopoetin, Cancer antigen 125, CD40, CD40 ligand, ENA-78, Ferritin,

IL-12p40, IL-1 2p70, IL-16, MMP-2, PAI-I, TNF RII, TNF-beta and VCAM-I,
MIP-I beta (Macrophage Inflammatory Protein- 1beta), MDC (Macrophage-Derived
Chemokine; CCL22), MIP-I alpha (Macrophage Inflammatory Protein- 1alpha;
CCL3), KC/GROalpha (Melanoma Growth Stimulatory Activity Protein), VEGF
(Vascular Endothelial Cell Growth Factor), Endothelin-1, MIP-3 beta (Macrophage
Inflammatory Protein-3 beta; Exodus-3 or ELC), Beta-2 microglobulin, IL-5
(Interleukin-5), IL-I alpha (Interleukin-1 alpha), EGF (Epidermal Growth Factor),
Lymphotactin (XCLl), GM-CSF (Granulocyte Macrophage-Colony Stimulating
Factor), MIP-I gamma (Macrophage Inflammatory Protein- 1gamma; CCL4), IL-I beta
(Interleukin-1 beta), Brain-derived neutrophic factor, Cancer antigen 19-9,
Carcinoembryonic antigen, C reactive protein, EGF, Fatty acid binding protein, Factor
VII, Growth hormone, IL-I alpha, IL-I beta, IL-I ra, IL-7, IL-8, MDC, Prostatic acid
phosphatase, Prostate specific antigen, Stem cell factor, Tissue factor, TNF-alpha,
VEGF, Von Willebrand factor, IgA (Immunoglobulin A), Haptoglobin, MIP-2
(Macrophage Inflammatory Protein-2), IL- 17 (Interleukin- 17), SGOT (Serum
Glutamic-Oxaloacetic Transaminase), IP-IO (Inducible Protein- 10), IL-IO, FGF-9
(Fibroblast Growth Factor-9), M-CSF (Macrophage-Colony Stimulating Factor), IL-4
(Interleukin-4), IL-3 (Interleukin-3), TPO (Thrombopoietin), SCF (Stem Cell Factor),
LIF (Leukemia Inhibitory Factor), IL-2 (Interleukin-2), VCAM-I (Vascular Cell
Adhesion Molecule- 1; CD106) and TNF alpha and OSM (Oncostatin M).
For example, the level of expression of one or more markers selected from
among IL- 18 (Interleukin-1 8), MCP-5 (Monocyte Chemoattractant Protein-5;
CCLl 2), IL-1 1 (Interleukin-1 1), MCP-I (Monocyte Chemoattractant Protein- 1), MPO
(Myeloperoxidase), Apo Al (Apolipoprotein Al), TIMP-I (Tissue Inhibitor of
Metalloproteinase Type-1), CRP (C Reactive Protein), Fibrinogen, MMP-9 (Matrix
Metalloproteinase-9), Eotaxin (CCLl 1), GCP-2 (Granulocyte Chemotactic Protein-2;
CXCL6), IL-6 (Interleukin-6), Tissue Factor (TF), SAP (Serum Amyloid P), FGF-
basic (Fibroblast Growth Factor-basic), MCP-3 (Monocyte Chemoattractant Protein-
3; CCL7), IP-IO (CXCL 10), MIP-2, Thrombopoetin, Cancer antigen 125, CD40,
CD40 ligand, ENA-78, Ferritin, IL-12p40, IL-12p70, IL-16, MMP-2, PAI-I, TNF
RII, TNF-beta and VCAM-I is assessed. One or all or plurality or a majority should

be increased. Other markers in which expression of one or more or a majority or
plurality in response to the virus decreased in response to the virus include, but are not
limited to, MIP-I beta (Macrophage Inflammatory Protein- 1beta), MDC
(Macrophage-Derived Chemokine; CCL22), MIP-I alpha (Macrophage Inflammatory
Protein- 1alpha; CCL3), KC/GROalpha (Melanoma Growth Stimulatory Activity
Protein), VEGF (Vascular Endothelial Cell Growth Factor), Endothelin-1, MIP-3 beta
(Macrophage Inflammatory Protein-3 beta; Exodus-3 or ELC), Beta-2 microglobulin,
IL-5 (Interleukin-5), IL-I alpha (Interleukin-1 alpha), EGF (Epidermal Growth
Factor), Lymphotactin (XCLl), GM-CSF (Granulocyte Macrophage-Colony
Stimulating Factor), MIP-1gamma (Macrophage Inflammatory Protein- 1gamma;
CCL4), IL-I beta (Interleukin-1 beta), Brain-derived neutrophic factor, Cancer antigen
19-9, Carcinoembryonic antigen, C reactive protein, EGF, Fatty acid binding protein,
Factor VII, Growth hormone, IL-I alpha, IL-I beta, IL-I ra, IL-7, IL-8, MDC,
Prostatic acid phosphatase, Prostate specific antigen, free, Stem cell factor, Tissue
factor, TNF-alpha, VEGF and Von Willebrand factor.
Also provided are methods for assessing whether a candidate virus will be
effective in viral therapy by determining whether the candidate virus alters the level
of expression of at least one marker in a cell contacted with the candidate virus,
wherein the cell is known to be responsive to viral therapy vectors; and based on
whether the level of expression of the marker is altered, predicting whether candidate
virus will be effective for viral therapy.
Determining can be effected by comparing the level of expression of the
marker in the cell contacted with the candidate virus to the level of expression of the
marker in a cell not contacted with the candidate virus. The cell can be contacted
with the virus and cultured in vitro. Contacting can be effected v Contacting can be
effected in vivo.
As with the above, the markers or combinations can be selected. Markers
include, but are not limited to IL- 18 (Interleukin-1 8), MCP-5 (Monocyte
Chemoattractant Protein-5; CCL12), IL-I l (Interleukin-1 1), MCP-I (Monocyte
Chemoattractant Protein-1), MPO (Myeloperoxidase), Apo Al (Apolipoprotein Al),
TIMP-I (Tissue Inhibitor of Metalloproteinase Type-1), CRP (C Reactive Protein),

Fibrinogen, MMP-9 (Matrix Metalloproteinase-9), Eotaxin (CCLI l), GCP-2
(Granulocyte Chemotactic Protein-2; CXCL6), IL-6 (Interleukin-6), Tissue Factor
(TF), SAP (Serum Amyloid P), FGF-basic (Fibroblast Growth Factor-basic), MCP-3
(Monocyte Chemoattractant Protein-3; CCL7), IP-IO (CXCL 10), MIP-2,
Thrombopoetin, Cancer antigen 125, CD40, CD40 ligand, ENA-78, Ferritin, IL-
12p40, IL-12p70, IL-16, MMP-2, PAI-I, TNF RII, TNF-beta and VCAM-I, MIP-
lbeta (Macrophage Inflammatory Protein- 1beta), MDC (Macrophage-Derived
Chemokine; CCL22), MIP-I alpha (Macrophage Inflammatory Protein- 1alpha;
CCL3), KC/GROalpha (Melanoma Growth Stimulatory Activity Protein), VEGF
(Vascular Endothelial Cell Growth Factor), Endothelin-1 , MIP-3 beta (Macrophage
Inflammatory Protein-3 beta; Exodus-3 or ELC), Beta-2 microglobulin, IL-5
(Interleukin-5), IL-I alpha (Interleukin-1 alpha), EGF (Epidermal Growth Factor),
Lymphotactin (XCLl), GM-CSF (Granulocyte Macrophage-Colony Stimulating
Factor), MIP-I gamma (Macrophage Inflammatory Protein- 1gamma; CCL4), IL-I beta
(Interleukin-1 beta), Brain-derived neutrophic factor, Cancer antigen 19-9,
Carcinoembryonic antigen, C reactive protein, EGF, Fatty acid binding protein, Factor
VII, Growth hormone, IL-I alpha, IL-I beta, IL-I ra, IL-7, IL-8, MDC, Prostatic acid
phosphatase, Prostate specific antigen, Stem cell factor, Tissue factor, TNF-alpha,
VEGF, Von Willebrand factor, IgA (Immunoglobulin A), Haptoglobin, MIP-2
(Macrophage Inflammatory Protein-2), IL- 17 (Interleukin- 17), SGOT (Serum
Glutamic-Oxaloacetic Transaminase), IP-IO (Inducible Protein- 10), IL-10, FGF-9
(Fibroblast Growth Factor-9), M-CSF (Macrophage-Colony Stimulating Factor), IL-4
(Interleukin-4), IL-3 (Interleukin-3), TPO (Thrombopoietin), SCF (Stem Cell Factor),
LIF (Leukemia Inhibitory Factor), IL-2 (Interleukin-2), VCAM-I (Vascular Cell
Adhesion Molecule- 1; CD106) and TNF alpha and OSM (Oncostatin M).
As with the methods discussed above, a plurality or combinations of markers
(5, 10, 15, 20, 25, 30, 35, 50, 100, 150, 200, 250, 300, 330, 350 or more) can be
assessed. They can be assessed one-by-one or using a gene chip, or array or
microarray.
As with the methods above, the markers include those that are increases in
responders, such as, but are not limited to IL- 18 (Interleukin- 18), MCP-5 (Monocyte

Chemoattractant Protein-5; CCLl 2), IL-1 1 (Interleukin-1 1), MCP-I (Monocyte
Chemoattractant Protein- 1), MPO (Myeloperoxidase), Apo A l (Apolipoprotein Al),
TIMP-I (Tissue Inhibitor of Metalloproteinase Type-1), CRP (C Reactive Protein),
Fibrinogen, MMP-9 (Matrix Metalloproteinase-9), Eotaxin (CCLI l), GCP-2
(Granulocyte Chemotactic Protein-2; CXCL6), IL-6 (Interleukin-6), Tissue Factor
(TF), SAP (Serum Amyloid P), FGF-basic (Fibroblast Growth Factor-basic), MCP-3
(Monocyte Chemoattractant Protein-3; CCL7), IP-IO (CXCL 10), MIP-2,
Thrombopoetin, Cancer antigen 125, CD40, CD40 ligand, ENA-78, Ferritin, IL-
12p40, IL-12p70, IL- 16, MMP-2, PAI-I, TNF RII, TNF-beta and VCAM-I, and/or
markers whose expression is decreased in response to the virus, such as, but are not
limited to, MIP-lbeta (Macrophage Inflammatory Protein- 1beta), MDC
(Macrophage-Derived Chemokine; CCL22), MIP-I alpha (Macrophage Inflammatory
Protein- 1alpha; CCL3), KC/GROalpha (Melanoma Growth Stimulatory Activity
Protein), VEGF (Vascular Endothelial Cell Growth Factor), Endothelin-1, MIP-3 beta
(Macrophage Inflammatory Protein-3 beta; Exodus-3 or ELC), Beta-2 microglobulin,
IL-5 (Interleukin-5), IL-I alpha (Interleukin-1 alpha), EGF (Epidermal Growth
Factor), Lymphotactin (XCLl), GM-CSF (Granulocyte Macrophage-Colony
Stimulating Factor), MIP-I gamma (Macrophage Inflammatory Protein- 1gamma;
CCL4), IL-I beta (Interleukin-1 beta), Brain-derived neutrophic factor, Cancer antigen
19-9, Carcinoembryonic antigen, C reactive protein, EGF, Fatty acid binding protein,
Factor VII, Growth hormone, IL-I alpha, IL-I beta, IL-I ra, IL-7, IL-8, MDC,
Prostatic acid phosphatase, Prostate specific antigen, free, Stem cell factor, Tissue
factor, TNF-alpha, VEGF and Von Willebrand factor.
Also provided are methods for monitoring the progress of viral therapy in a
subject by determining whether the level of expression of at least one marker is
altered in the subject at a plurality of time points; and based on whether the level of
expression of the marker is altered, making an assessment of whether the viral therapy
is effective.
Determining can be effected by comparing the level of expression of the
marker in a first sample to the level of expression of the marker in at least a second
sample obtained from the subject subsequent to the time at which the first sample was

obtained. Data can be taken at any suitable time points, including for example
starting prior to or at about the same time as beginning the viral therapy, and can
include time point(s) during the viral therapy. As above, one or a plurality or
combinations of markers can be monitored, and typically include at least one marker
known to be altered in response to effective viral therapy in a host. Markers include,
for example, but are not limited to IL- 18 (Interleukin-18), MCP-5 (Monocyte
Chemoattractant Protein-5; CCLl 2), IL-I l (Interleukin-1 1), MCP-I (Monocyte
Chemoattractant Protein- 1), MPO (Myeloperoxidase), Apo Al (Apolipoprotein Al),
TIMP-I (Tissue Inhibitor of Metalloproteinase Type-1), CRP (C Reactive Protein),
Fibrinogen, MMP-9 (Matrix Metalloproteinase-9), Eotaxin (CCLl 1), GCP-2
(Granulocyte Chemotactic Protein-2; CXCL6), IL-6 (Interleukin-6), Tissue Factor
(TF), SAP (Serum Amyloid P), FGF-basic (Fibroblast Growth Factor-basic), MCP-3
(Monocyte Chemoattractant Protein-3; CCL7), IP-IO (CXCL 10), MIP-2,
Thrombopoetin, Cancer antigen 125, CD40, CD40 ligand, ENA-78, Ferritin, IL-
12p40, IL-12p70, IL-16, MMP-2, PAI-I, TNF RII, TNF-beta and VCAM-I, MIP-
lbeta (Macrophage Inflammatory Protein- lbeta), MDC (Macrophage-Derived
Chemokine; CCL22), MIP-I alpha (Macrophage Inflammatory Protein- 1alpha;
CCL3), KC/GROalpha (Melanoma Growth Stimulatory Activity Protein), VEGF
(Vascular Endothelial Cell Growth Factor), Endothelin-1, MIP-3 beta (Macrophage
Inflammatory Protein-3 beta; Exodus-3 or ELC), Beta-2 microglobulin, IL-5
(Interleukin-5), IL-I alpha (Interleukin-1 alpha), EGF (Epidermal Growth Factor),
Lymphotactin (XCLl), GM-CSF (Granulocyte Macrophage-Colony Stimulating
Factor), MIP-I gamma (Macrophage Inflammatory Protein- 1gamma; CCL4), IL- lbeta
(Interleukin-1 beta), Brain-derived neutrophic factor, Cancer antigen 19-9,
Carcinoembryonic antigen, C reactive protein, EGF, Fatty acid binding protein, Factor
VII, Growth hormone, IL-I alpha, IL-I beta, IL-I ra, IL-7, IL-8, MDC, Prostatic acid
phosphatase, Prostate specific antigen, Stem cell factor, Tissue factor, TNF-alpha,
VEGF, Von Willebrand factor, IgA (Immunoglobulin A), Haptoglobin, MIP-2
(Macrophage Inflammatory Protein-2), IL- 17 (Interleukin-1 7), SGOT (Serum
Glutamic-Oxaloacetic Transaminase), IP-10 (Inducible Protein- 10), IL- 10, FGF-9
(Fibroblast Growth Factor-9), M-CSF (Macrophage-Colony Stimulating Factor), IL-4

(Interleukin-4), IL-3 (Interleukin-3), TPO (Thrombopoietin), SCF (Stem Cell
Factor), LIF (Leukemia Inhibitory Factor), IL-2 (Interleukin-2), VCAM-I (Vascular
Cell Adhesion Molecule- 1; CD106) and TNF alpha and OSM (Oncostatin M).
For example, at least expression of at least 5 or more, at least 10 or more, or at
least 15 or more markers is monitored. Such markers, include, but are not limited to,
IL-1 8 (Interleukin-18), MCP-5 (Monocyte Chemoattractant Protein-5; CCL12), IL-I l
(Interleukin-1 1), MCP-I (Monocyte Chemoattractant Protein- 1), MPO
(Myeloperoxidase), Apo A l (Apolipoprotein Al), TIMP-I (Tissue Inhibitor of
Metalloproteinase Type-1), CRP (C Reactive Protein), Fibrinogen, MMP-9 (Matrix
Metalloproteinase-9), Eotaxin (CCLl 1), GCP-2 (Granulocyte Chemotactic Protein-2;
CXCL6), IL-6 (Interleukin-6), Tissue Factor (TF), SAP (Serum Amyloid P), FGF-
basic (Fibroblast Growth Factor-basic), MCP-3 (Monocyte Chemoattractant Protein-
3; CCL7), IP-IO (CXCL 10), MIP-2, Thrombopoetin, Cancer antigen 125, CD40,
CD40 ligand, ENA-78, Ferritin, IL-12p40, IL-12p70, IL- 16, MMP-2, PAI-I, TNF
RII, TNF-beta and VCAM-I , MIP-I beta (Macrophage Inflammatory Protein- 1beta),
MDC (Macrophage-Derived Chemokine; CCL22), MIP-I alpha (Macrophage
Inflammatory Protein- 1alpha; CCL3), KC/GROalpha (Melanoma Growth Stimulatory
Activity Protein), VEGF (Vascular Endothelial Cell Growth Factor), Endothelin-1,
MIP-3 beta (Macrophage Inflammatory Protein-3 beta; Exodus-3 or ELC), Beta-2
microglobulin, IL-5 (Interleukin-5), IL-I alpha (Interleukin-1 alpha), EGF (Epidermal
Growth Factor), Lymphotactin (XCLl), GM-CSF (Granulocyte Macrophage-Colony
Stimulating Factor), MIP-I gamma (Macrophage Inflammatory Protein- 1gamma;
CCL4), IL-I beta (Interleukin-1 beta), Brain-derived neutrophic factor, Cancer antigen
19-9, Carcinoembryonic antigen, C reactive protein, EGF, Fatty acid binding protein,
Factor VII, Growth hormone, IL-I alpha, IL-I beta, IL-I ra, IL-7, IL-8, MDC,
Prostatic acid phosphatase, Prostate specific antigen, Stem cell factor, Tissue factor,
TNF-alpha, VEGF, Von Willebrand factor, IgA (Immunoglobulin A), Haptoglobin,
MIP-2 (Macrophage Inflammatory Protein-2), IL- 17 (Interleukin-1 7), SGOT (Serum
Glutamic-Oxaloacetic Transaminase), IP-IO (Inducible Protein- 10), IL-IO, FGF-9
(Fibroblast Growth Factor-9), M-CSF (Macrophage-Colony Stimulating Factor), IL-4
(Interleukin-4), IL-3 (Interleukin-3), TPO (Thrombopoietin), SCF (Stem Cell Factor),

LIF (Leukemia Inhibitory Factor), IL-2 (Interleukin-2), VCAM-I (Vascular Cell
Adhesion Molecule- 1; CD 106) and TNF alpha and OSM (Oncostatin M).
Markers whose expression is increased include, for example, one or more of
IL-1 8 (Interleukin-18), MCP-5 (Monocyte Chemoattractant Protein-5; CCL12), IL-I l
(Interleukin- 11), MCP- 1 (Monocyte Chemoattractant Protein- 1), MPO
(Myeloperoxidase), Apo A l (Apolipoprotein Al), TIMP-I (Tissue Inhibitor of
Metalloproteinase Type-1), CRP (C Reactive Protein), Fibrinogen, MMP-9 (Matrix
Metalloproteinase-9), Eotaxin (CCLl 1), GCP-2 (Granulocyte Chemotactic Protein-2;
CXCL6), IL-6 (Interleukin-6), Tissue Factor (TF), SAP (Serum Amyloid P), FGF-
basic (Fibroblast Growth Factor-basic), MCP-3 (Monocyte Chemoattractant Protein-
3; CCL7), IP-IO (CXCL 10), MIP-2, Thrombopoetin, Cancer antigen 125, CD40,
CD40 ligand, ENA-78, Ferritin, IL-12p40, IL-12p70, IL-16, MMP-2, PAM, TNF
RII, TNF-beta and VCAM-I ; and markers whose expression is decreased, include, for
example, one or more of MIP-I beta (Macrophage Inflammatory Protein- 1beta), MDC
(Macrophage-Derived Chemokine; CCL22), MIP-I alpha (Macrophage Inflammatory
Protein- 1alpha; CCL3), KC/GROalpha (Melanoma Growth Stimulatory Activity
Protein), VEGF (Vascular Endothelial Cell Growth Factor), Endothelin-1, MIP-3 beta
(Macrophage Inflammatory Protein-3 beta; Exodus-3 or ELC), Beta-2 microglobulin,
IL-5 (Interleukin-5), IL-I alpha (Interleukin- 1 alpha), EGF (Epidermal Growth
Factor), Lymphotactin (XCLl), GM-CSF (Granulocyte Macrophage-Colony
Stimulating Factor), MIP-I gamma (Macrophage Inflammatory Protein- 1gamma;
CCL4), IL-I beta (Interleukin- 1 beta), Brain-derived neutrophic factor, Cancer antigen
19-9, Carcinoembryonic antigen, C reactive protein, EGF, Fatty acid binding protein,
Factor VII, Growth hormone, IL-I alpha, IL-I beta, IL-I ra, IL-7, IL-8, MDC,
Prostatic acid phosphatase, Prostate specific antigen, free, Stem cell factor, Tissue
factor, TNF-alpha, VEGF and Von Willebrand factor.
Also provided are combinations of a therapeutic virus, including those provided
herein; and a reagent(s) to assess expression of at least one marker, such as, but are
not limited to, IL- 18 (Interleukin-18), MCP-5 (Monocyte Chemoattractant Protein-5;
CCL 12), IL-1 1 (Interleukin- 11), MCP-I (Monocyte Chemoattractant Protein- 1), MPO
(Myeloperoxidase), Apo A l (Apolipoprotein Al), TIMP-I (Tissue Inhibitor of

Metalloproteinase Type-1), CRP (C Reactive Protein), Fibrinogen, MMP-9 (Matrix
Metalloproteinase-9), Eotaxin (CCLl 1), GCP-2 (Granulocyte Chemotactic Protein-2;
CXCL6), IL-6 (Interleukin-6), Tissue Factor (TF), SAP (Serum Amyloid P), FGF-
basic (Fibroblast Growth Factor-basic), MCP-3 (Monocyte Chemoattractant Protein-
3; CCL7), IP-IO (CXCL 10), MIP-2, Thrombopoetin, Cancer antigen 125, CD40,
CD40 ligand, ENA-78, Ferritin, IL-12p40, IL-12p70, IL- 16, MMP-2, PAI-I, TNF
RII, TNF-beta and VCAM-I, MIP-lbeta (Macrophage Inflammatory Protein- 1beta),
MDC (Macrophage-Derived Chemokine; CCL22), MIP-I alpha (Macrophage
Inflammatory Protein- 1alpha; CCL3), KC/GROalpha (Melanoma Growth Stimulatory
Activity Protein), VEGF (Vascular Endothelial Cell Growth Factor), Endothelin-1 ,
MIP-3 beta (Macrophage Inflammatory Protein-3 beta; Exodus-3 or ELC), Beta-2
microglobulin, IL-5 (Interleukin-5), IL-I alpha (Interleukin-1 alpha), EGF (Epidermal
Growth Factor), Lymphotactin (XCLl), GM-CSF (Granulocyte Macrophage-Colony
Stimulating Factor), MIP-I gamma (Macrophage Inflammatory Protein- 1gamma;
CCL4), IL-I beta (Interleukin-1 beta), Brain-derived neutrophic factor, Cancer antigen
19-9, Carcinoembryonic antigen, C reactive protein, EGF, Fatty acid binding protein,
Factor VII, Growth hormone, IL-I alpha, IL-I beta, IL-I ra, IL-7, IL-8, MDC,
Prostatic acid phosphatase, Prostate specific antigen, Stem cell factor, Tissue factor,
TNF-alpha, VEGF, Von Willebrand factor, IgA (Immunoglobulin A), Haptoglobin,
MIP-2 (Macrophage Inflammatory Protein-2), IL- 17 (Interleukin- 17), SGOT (Serum
Glutamic-Oxaloacetic Transaminase), IP-10 (Inducible Protein- 10), IL-10, FGF-9
(Fibroblast Growth Factor-9), M-CSF (Macrophage-Colony Stimulating Factor), IL-4
(Interleukin-4), IL-3 (Interleukin-3), TPO (Thrombopoietin), SCF (Stem Cell Factor),
LIF (Leukemia Inhibitory Factor), IL-2 (Interleukin-2), VCAM-I (Vascular Cell
Adhesion Molecule- 1; CD 106) and TNF alpha and OSM (Oncostatin M). Reagents
include any suitable reagent, such as a nucleic acid probe, that is hybridized under
suitable conditions, typically medium or high stringency to nucleic acid from a
sample. The combinations are associations of the elements, such as use together or in
a box or in proximity and/or packaged, such as a kit. The combinations can be
packaged as kits, optionally including additional reagents and materials and/or
instructions for practicing a method.

DETAILED DESCRIPTION
A. DefinitionsB. Methods for Assessing Viral Therapy
1. Methods of Assessing Whether a Subject is Likely to RespondFavorably or Poorly to Viral Therapy by Assessing aReplication Indicatora. Virus titerb. Expression of virus genesc. Decreased expression of housekeeping genesd. Expression of tumor proteins
C. Therapeutic Viruses1. Modifications of Therapeutic Viruses2. Viruses Encoding a Marker Protein that is Increased in Cellsthat Respond Favorable to Tumor Therapy
a. IP-IO encoding virusesb. MCP-I encoding virusesc. TIMP-I, 2, 3 encoding viruses
3. Viruses an Agent which Reduces the Level of Expression of aMarker Protein
D. Host Cells1. Harvesting tumor cells from patient
E. Pharmaceutical CompositionsF. Methods of administering viral therapy
1. Monitoring the progress of viral therapyG. Identifying markers associated with a response to viral therapyH. Identifying a virus for viral therapyI. Articles of Manufacture and KitsJ . Examples
A. DEFINITIONS
Unless defined otherwise, all technical and scientific terms used herein have
the same meaning as is commonly understood by one of skill in the art to which the
invention(s) belong. All patents, patent applications, published applications and
publications, GENBANK sequences, websites and other published materials referred
to throughout the entire disclosure herein, unless noted otherwise, are incorporated by
reference in their entirety. In the event that there is a plurality of definitions for terms
herein, those in this section prevail. Where reference is made to a URL or other such
identifier or address, it is understood that such identifiers can change and particular
information on the internet can come and go, but equivalent information is known and
can be readily accessed, such as by searching the internet and/or appropriate
databases. Reference thereto evidences the availability and public dissemination of

such information. To the extent, if any, that publications and patents or patent
applications incorporated by reference contradict the disclosure contained in the
specification, the specification is intended to supersede and/or take precedence over
any such contradictory material.
As used herein, "virus" refers to any of a large group of entities referred to as
viruses. Viruses typically contain a protein coat surrounding an RNA or DNA core of
genetic material, and are capable of growth and multiplication only in living cells.
Viruses for use in the methods provided herein include, but are not limited, to a
poxvirus, including a vaccinia virus. Other exemplary viruses include, but are not
limited to, adenovirus, adeno-associated virus, herpes simplex virus, Newcastle
disease virus, vesicular stomatitis virus, mumps virus, influenza virus, measles virus,
reovirus, human immunodeficiency virus (HIV), hanta virus, myxoma virus,
cytomegalovirus (CMV), lentivirus, Sindbis virus, and any plant or insect virus.
As used herein, the term "viral vector" is used according to its art-recognized
meaning. It refers to a nucleic acid vector construct that includes at least one element
of viral origin and can be packaged into a viral vector particle. The viral vector
particles can be used for the purpose of transferring DNA, RNA or other nucleic acids
into cells either in vitro or in vivo. Viral vectors include, but are not limited to,
retroviral vectors, vaccinia vectors, lentiviral vectors, herpes virus vectors (e.g.,
HSV), baculoviral vectors, cytomegalovirus (CMV) vectors, papillomavirus vectors,
simian virus (SV40) vectors, semliki forest virus vectors, phage vectors, adenoviral
vectors, and adeno-associated viral (AAV) vectors.
As used herein, the term "modified" with reference to a gene refers to a
deleted gene, a gene encoding a gene product having one or more truncations,
mutations, insertions or deletions, or a gene that is inserted (into the chromosome or
on a plasmid, phagemid, cosmid, and phage) encoding a gene product, typically
accompanied by at least a change in function of the modified gene product or virus.
As used herein, the term "modified virus" refers to a virus that is altered with
respect to a parental strain of the virus. Typically modified viruses have one or more
truncations, mutations, insertions or deletions in the genome of virus. A modified
virus can have one or more endogenous viral genes modified and/or one or more

intergenic regions modified. Exemplary modified viruses can have one or more
heterologous nucleic acid sequences inserted into the genome of the virus. Modified
viruses can contain one more heterologous nucleic acid sequences in the form of a
gene expression cassette for the expression of a heterologous gene. As used herein,
modification of a heterologous nucleic acid molecule with respect to a virus
containing a heterologous nucleic acid molecule refers to any alteration of the
heterologous nucleic acid molecule including truncations, mutations, insertions, or
deletions of the nucleic acid molecule. Modification of a heterologous nucleic acid
molecule can also include alteration of the viral genome, which can be, for example, a
deletion of all or a potion heterologous nucleic from the viral genome or insertion of
an additional heterologous nucleic acid molecule into the viral genome.
As used herein, the term "therapeutic virus" refers to a virus that is
administered for the treatment of a disease or disorder. A therapeutic virus is
typically a modified virus. Such modifications include one or more insertions,
deletions, or mutations in the genome of the virus. Therapeutic viruses typically
possess modifications in one or more endogenous viral genes or one or more
intergenic regions, which attenuate the toxicity of the virus, and can optionally
express a heterologous therapeutic gene product and/or detectable protein.
Therapeutic viruses can contain heterologous nucleic acid molecules, including one or
more gene expression cassettes for the expression of the therapeutic gene product
and/or detectable protein. Therapeutic viruses can be replication competent viruses
(e.g., oncolytic viruses) including conditional replicating viruses, or replication-
defective viruses. As used herein, the term, "therapeutic gene product" refers to any
heterologous protein expressed by the therapeutic virus that ameliorates the symptoms
of a disease or disorder or ameliorates the disease or disorder.
As used herein, a responder is a tumor cell for which a therapeutic virus is
effective against in vivo. The methods provided herein provide in vitro assays for
predicted whether a particular tumor is a responder or a non-responder. If a tumor is a
predicted responder for a therapeutic virus, the tumor is likely to respond favorably to
tumor treatment. As used herein, a tumor that respond favorably to a treatment with a

therapeutic virus means that treatment of a tumor with the virus will cause the tumor
to slow or stop tumor growth, or cause the tumor to shrink or regress.
As used herein, a nonresponder is a tumor for which a therapeutic virus is not
effective against in vivo.
As used herein, a marker is any gene product for which level of gene
expression is assayed. A marker can be a gene product that is increased, decreased, or
unchanged in a tumor or that is increased, decreased, or unchanged in a tumor that is
treated with a virus. A marker can also be a gene product that is increased, decreased
or unchanged in a subject that bears a tumor or that is increased, decreased, or
unchanged in a subject that bears a tumor and that is treated with a virus. The
characteristic levels of expression of one or more marker proteins in a tumor or in a
host that bears a tumor can be used to generate a marker profile, or expression profile
for the particular tumor. Marker profiles can be generated for untreated tumors and
tumors that have been treated with a virus.
As use herein, delayed replication refers to the inability of a therapeutic virus
to efficiently replicate in a tumor in the in vitro replication assay methods provided
herein. Viruses that exhibit delayed replication in a tumor following infection of the
tumor are predicted to not be effective for therapy of
As used herein, a replication indicator is any parameter indicative of viral
replication. For example, such indicators include, but are not limited to, virus titer,
expression of viral proteins, expression of reporter proteins, expression of host
housekeeping genes or other host proteins.
As used herein, a housekeeping gene is a gene involved in basic functions
needed for the sustenance of the cell. Housekeeping genes are constitutively
expressed. Exemplary housekeeping genes can be found in the Examples and
elsewhere herein.
As used herein, attenuation of a virus means to a reduction or elimination of
deleterious or toxic effects to a host upon administration of the virus compared to an
un-attenuated virus. As used herein, a virus with low toxicity means that upon
administration a virus does not accumulate in organs and tissues in the host to an
extent that results in damage or harm to organs, or that impacts survival of the host to

a greater extent than the disease being treated does. For the purposes herein,
attenuation of toxicity is used interchangeably with attenuation of virulence and
attenuation of pathogenicity.
As used herein, the term "viral load" is the amount of virus present in the
blood of a patient. Viral load also is referred to as viral titer or viremia. Viral load can
be measured in variety of standard ways, including immunochemistry methods or by
plaque assay.
As used herein, the term "toxicity" with reference to a virus refers to the
ability of the virus to cause harm to the subject to which the virus has been
administered.
As used herein virulence and pathogenicity with reference to a virus refers to
the ability of the virus to cause disease or harm in the subject to which the virus has
been administered. Hence, for the purposes herein the terms toxicity, virulence, and
pathogenicity with reference to a virus are used interchangeably.
As used herein, a delivery vehicle for administration refers to a lipid-based or
other polymer-based composition, such as liposome, micelle, or reverse micelle,
which associates with an agent, such as a virus provided herein, for delivery into a
host animal.
As used herein, a disease or disorder refers to a pathological condition in an
organism resulting from, for example, infection or genetic defect, and characterized
by identifiable symptoms.
As used herein, treatment means any manner in which the symptoms of a
condition, disorder or disease are ameliorated or otherwise beneficially altered.
Treatment also encompasses any pharmaceutical use of the viruses described and
provided herein.
As used herein, amelioration or alleviation of symptoms associated with a
disease refers to any lessening, whether permanent or temporary, lasting or transient
of symptoms that can be attributed to or associated with a disease. Similarly,
amelioration or alleviation of symptoms associated with administration of a virus
refers to any lessening, whether permanent or temporary, lasting or transient of

symptoms that can be attributed to or associated with an administration of the virus
for treatment of a disease.
As used herein, an effective amount of a virus or compound for treating a
particular disease is an amount that is sufficient to ameliorate, or in some manner
reduce the symptoms associated with the disease. Such an amount can be
administered as a single dosage or can be administered according to a regimen,
whereby it is effective. The amount can cure the disease but, typically, is
administered in order to ameliorate the symptoms of the disease. Repeated
administration can be required to achieve the desired amelioration of symptoms.
As used herein, an effective amount of a therapeutic agent for control of viral
unit numbers or viral titer in a patient is an amount that is sufficient to prevent a virus
introduced to a patient for treatment of a disease from overwhelming the patient's
immune system such that the patient suffers adverse side effects due to virus toxicity
or pathogenicity. Such side effects can include, but are not limited to fever,
abdominal pain, aches or pains in muscles, cough, diarrhea, or general feeling of
discomfort or illness that are associated with virus toxicity and are related to the
subject's immune and inflammatory responses to the virus. Side effects or symptoms
can also include escalation of symptoms due to a systemic inflammatory response to
the virus, such as, but not limited to, jaundice, blood-clotting disorders and multiple-
organ system failure. Such an amount can be administered as a single dosage or can
be administered according to a regimen, whereby it is effective. The amount can
prevent the appearance of side effects but, typically, is administered in order to
ameliorate the symptoms of the side effects associated with the virus and virus
toxicity. Repeated administration can be required to achieve the desired amelioration
of symptoms.
As used herein, an in vivo method refers to a method performed within the
living body of a subject.
As used herein, a subject includes any animal for whom diagnosis, screening,
monitoring or treatment is contemplated. Animals include mammals such as primates
and domesticated animals. An exemplary primate is human. A patient refers to a
subject such as a mammal, primate, human, or livestock subject afflicted with a

disease condition or for which a disease condition is to be determined or risk of a
disease condition is to be determined.
As used herein, the term "neoplasm" or "neoplasia" refers to abnormal new
cell growth, and thus means the same as tumor, which can be benign or malignant.
Unlike hyperplasia, neoplastic proliferation persists even in the absence of the original
stimulus.
As used herein, neoplastic disease refers to any disorder involving cancer,
including tumor development, growth, metastasis and progression.
As used herein, cancer is a term for diseases caused by or characterized by any
type of malignant tumor, including metastatic cancers, lymphatic tumors, and blood
cancers. Exemplary cancers include, but are not limited to: leukemia, lymphoma,
pancreatic cancer, lung cancer, ovarian cancer, breast cancer, cervical cancer, bladder
cancer, prostate cancer, glioma tumors, adenocarcinomas, liver cancer and skin
cancer. Exemplary cancers in humans include a bladder tumor, breast tumor, prostate
tumor, basal cell carcinoma, biliary tract cancer, bladder cancer, bone cancer, brain
and CNS cancer (e.g., glioma tumor), cervical cancer, choriocarcinoma, colon and
rectum cancer, connective tissue cancer, cancer of the digestive system; endometrial
cancer, esophageal cancer; eye cancer; cancer of the head and neck; gastric cancer;
intra-epithelial neoplasm; kidney cancer; larynx cancer; leukemia; liver cancer; lung
cancer (e.g. small cell and non-small cell); lymphoma including Hodgkin's and Non-
Hodgkin's lymphoma; melanoma; myeloma, neuroblastoma, oral cavity cancer (e.g.,
lip, tongue, mouth, and pharynx); ovarian cancer; pancreatic cancer, retinoblastoma;
rhabdomyosarcoma; rectal cancer, renal cancer, cancer of the respiratory system;
sarcoma, skin cancer; stomach cancer, testicular cancer, thyroid cancer; uterine
cancer, cancer of the urinary system, as well as other carcinomas and sarcomas.
Malignant disorders commonly diagnosed in dogs, cats, and other pets include, but
are not limited to, lymphosarcoma, osteosarcoma, mammary tumors, mastocytoma,
brain tumor, melanoma, adenosquamous carcinoma, carcinoid lung tumor, bronchial
gland tumor, bronchiolar adenocarcinoma, fibroma, myxochondroma, pulmonary
sarcoma, neurosarcoma, osteoma, papilloma, retinoblastoma, Ewing's sarcoma,
Wilm's tumor, Burkitt's lymphoma, microglioma, neuroblastoma, osteoclastoma, oral

neoplasia, fibrosarcoma, osteosarcoma and rhabdomyosarcoma, genital squamous
cell carcinoma, transmissible venereal tumor, testicular tumor, seminoma, Sertoli cell
tumor, hemangiopericytoma, histiocytoma, chloroma (e.g., granulocytic sarcoma),
corneal papilloma, corneal squamous cell carcinoma, hemangiosarcoma, pleural
mesothelioma, basal cell tumor, thymoma, stomach tumor, adrenal gland carcinoma,
oral papillomatosis, hemangioendothelioma and cystadenoma, follicular lymphoma,
intestinal lymphosarcoma, fibrosarcoma and pulmonary squamous cell carcinoma, hi
rodents, such as a ferret, exemplary cancers include insulinoma, lymphoma, sarcoma,
neuroma, pancreatic islet cell tumor, gastric MALT lymphoma and gastric
adenocarcinoma. Neoplasias affecting agricultural livestock include leukemia,
hemangiopericytoma and bovine ocular neoplasia (in cattle); preputial fibrosarcoma,
ulcerative squamous cell carcinoma, preputial carcinoma, connective tissue neoplasia
and mastocytoma (in horses); hepatocellular carcinoma (in swine); lymphoma and
pulmonary adenomatosis (in sheep); pulmonary sarcoma, lymphoma, Rous sarcoma,
reticulo-endotheliosis, fibrosarcoma, nephroblastoma, B-cell lymphoma and lymphoid
leukosis (in avian species); retinoblastoma, hepatic neoplasia, lymphosarcoma
(lymphoblastic lymphoma), plasmacytoid leukemia and swimbladder sarcoma (in
fish), caseous lumphadenitis (CLA): chronic, infectious, contagious disease of sheep
and goats caused by the bacterium Corynebacterium pseudotuberculosis, and
contagious lung tumor of sheep caused by jaagsiekte.
As used herein, the term "malignant," as it applies to tumors, refers to primary
tumors that have the capacity of metastasis with loss of growth control and positional
control.
As used herein, metastasis refers to a growth of abnormal or neoplastic cells
distant from the site primarily involved by the morbid process.
As used herein, proliferative disorders include any disorders involving
abnormal proliferation of cells, such as, but not limited to, neoplastic diseases.
As used herein, a method for treating or preventing neoplastic disease means
that any of the symptoms, such as the tumor, metastasis thereof, the vascularization of
the tumors or other parameters by which the disease is characterized are reduced,
ameliorated, prevented, placed in a state of remission, or maintained in a state of

remission. It also means that the indications of neoplastic disease and metastasis can
be eliminated, reduced or prevented by the treatment. Non-limiting examples of the
indications include uncontrolled degradation of the basement membrane and proximal
extracellular matrix, migration, division, and organization of the endothelial cells into
new functioning capillaries, and the persistence of such functioning capillaries.
As used herein, an anti-cancer agent or compound (used interchangeably with
"anti-tumor or anti-neoplastic agent") refers to any agents, or compounds, used in
anti-cancer treatment. These include any agents, when used alone or in combination
with other compounds, that can alleviate, reduce, ameliorate, prevent, or place or
maintain in a state of remission of clinical symptoms or diagnostic markers associated
with neoplastic disease, tumors and cancer, and can be used in methods, combinations
and compositions provided herein. Exemplary anti-cancer agent agents include, but
are not limited to, the viruses provided herein used singly or in combination and/or in
combination with other anti-cancer agents, such as cytokines, growth factors,
hormones, photosensitizing agents, radionuclides, toxins, prodrug converting
enzymes, anti-metabolites, signaling modulators, anti-cancer antibiotics, anti-cancer
antibodies, anti-cancer oligopeptides, angiogenesis inhibitors, radiation therapy,
hypothermia therapy, hyperthermia therapy, laser therapy, chemotherapeutic
compounds, or a combination thereof.
As used herein, a prodrug is a compound that, upon in vivo administration, is
metabolized or otherwise converted to the biologically, pharmaceutically or
therapeutically active form of the compound. To produce a prodrug, the
pharmaceutically active compound is modified such that the active compound is
regenerated by metabolic processes. The prodrug can be designed to alter the
metabolic stability or the transport characteristics of a drug, to mask side effects or
toxicity, to improve the flavor of a drug or to alter other characteristics or properties
of a drug. By virtue of knowledge of pharmacodynamic processes and drug
metabolism in vivo, those of skill in this art, once a pharmaceutically active
compound is known, can design prodrugs of the compound (see, e.g., Nogrady (1985)
Medicinal Chemistry A Biochemical Approach, Oxford University Press, New York,
pages 388-392).

As used herein the term assessing or determining is intended to include
quantitative and qualitative determination in the sense of obtaining an absolute value
for the activity of a product, and also of obtaining an index, ratio, percentage, visual
or other value indicative of the level of the activity. Assessment can be direct or
indirect.
An oncolytic virus is a virus that preferentially replicates in, and kills,
neoplastic or cancer cells. The virus can be a naturally-occurring virus or an
engineered virus. Preferably, the virus is a modified vaccinia virus.
As used herein, the phrase "immunoprivileged cells and tissues" refers to cells
and tissues, such as solid tumors and wounded tissues, which are sequestered from the
immune system.
As used herein, an array refers to a collection of elements, such as proteins,
nucleic acids, cells or viruses, containing three or more members. An addressable
array is one in which the members of the array are identifiable, typically by position
on a solid phase support or by virtue of an identifiable or detectable label, such as by
color, fluorescence, electronic signal (i.e. RF, microwave or other frequency that does
not substantially alter the interaction of the molecules of interest), bar code or other
symbology, chemical or other such label. Hence, in general the members of the array
are immobilized to discrete identifiable loci on the surface of a solid phase or directly
or indirectly linked to or otherwise associated with the identifiable label, such as
affixed to a microsphere or other particulate support (herein referred to as beads) and
suspended in solution or spread out on a surface.
The term "array" is to be construed broadly, and includes any arrangement
wherein a plurality of different polypeptides are held, presented, positioned, situated,
or supported. Arrays can include microtiter plates, such as 48-well, 96-well, 144-well,
192-well, 240-well, 288-well, 336-well, 384-well, 432-well, 480-well, 576-well, 672-
well, 768-well, 864-well, 960-well, 1056-well, 1152-well, 1248-well, 1344-well,
1440-well, or 1536-well plates, tubes, slides, chips, flasks, or any other suitable
laboratory apparatus. Furthermore, arrays can also include a plurality of sub-arrays. A
plurality of sub-arrays encompasses an array where more than one arrangement is

used to position the polypeptides. For example, multiple 96-well plates could
constitute a plurality of sub-arrays and a single array.
As used herein, an address refers to a unique identifier whereby an addressed
entity can be identified. An addressed moiety is one that can be identified by virtue
of its address. Addressing can be effected by position on a surface or by other
identifiers, such as a tag encoded with a bar code or other symbology, a chemical tag,
an electronic, such RF tag, a color-coded tag or other such identifier.
As used herein, "a combination" refers to any association between two or
among more items. Such combinations can be packaged as kits.
As used herein, a composition refers to any mixture. It can be a solution, a
suspension, an emulsion, liquid, powder, a paste, aqueous, non-aqueous or any
combination of such ingredients.
As used herein, fluid refers to any composition that can flow. Fluids thus
encompass compositions that are in the form of semi-solids, pastes, solutions, aqueous
mixtures, gels, lotions, creams and other such compositions.
As used herein, a kit is a packaged combination, optionally, including
instructions for use of the combination and/or other reactions and components for
such use.
The section headings used herein are for organizational purposes only and are
not to be construed as limiting the described subject matter in any way. All literature
and similar materials cited in this application, including but not limited to, patents,
patent applications, articles, and books are expressly incorporated by reference in
their entirety for any purpose where permitted. It is to be understood that the
foregoing general description and the following detailed description are exemplary
and explanatory only and are not restrictive. The articles "a" and "an" are used herein
to refer to one or to more than one (i.e., to at least one) of the grammatical object of
the article. By way of example, "an element" means one element or more than one
element. Further, unless otherwise required by context, singular terms shall include
pluralities and plural terms shall include the singular.

As used herein, "comprising" as used herein is synonymous with "including,"
"containing," or "characterized by," and is inclusive or open-ended and does not
exclude additional, unrecited elements or method steps.
All numbers expressing quantities are to be understood as being modified in
all instances by the term "about." The word "about" carries the understanding that the
number referred to can vary by up to ±10%, unless indicated otherwise in the text or
as understood in the art, and still remain within the meaning of the disclosure. At the
very least, and not as an attempt to limit the application of the doctrine of equivalents
to the scope of the claims, each numerical parameter should be construed in light of
the number of significant digits and ordinary rounding approaches.
Generally, nomenclature used in connection with, and techniques of, cell and
tissue culture, molecular biology, and protein and oligo- or polynucleotide chemistry
and hybridization described herein are those well known and commonly used in the
art. The techniques and procedures described herein are generally performed
according to conventional methods well known in the art and as described in various
general and more specific references that are cited and discussed throughout the
instant specification, for example, Sambrook et al., Molecular Cloning: A Laboratory
Manual (Third ed., Cold Spring Harbor Laboratory Press, Cold Spring Harbor, N.Y.
2000). The nomenclatures utilized in connection with, and the laboratory procedures
and techniques described herein are those well known and commonly used in the art.
B. METHODS FOR ASSESSING VIRAL THERAPY
Provided herein are methods and compositions for viral therapy. Methods to
predict or assess or determine a subject's, such as a subject with a tumor or cancer,
response to viral therapy are provided. The methods include assessing whether a
subject bearing a tumor is likely to respond to treatment of the tumor with a
therapeutic virus. In some examples, the methods include measuring a replication
indicator that is predictive for tumor response to viral therapy. In some examples,
markers for use in assessing responses to viral therapy are provided. . Therapeutic
viruses designed for viral therapy also are provided elsewhere herein.
Also provided herein are methods to identify markers associated with a
subject's response to viral therapy. In some examples, methods to assess a candidate

therapeutic virus are provided. Methods for administering viral therapy to a subject
also are provided. In further examples, methods to monitor the progress of viral
therapy in a subject are provided. Also provided are pharmaceutical compositions
containing a therapeutic virus. In some examples, kits to measure markers are
provided.
1. Methods of Assessing Whether a Subject is Likely to RespondFavorably or Poorly to Viral Therapy by Assessing a ReplicationIndicator
Provided herein are methods of assessing the likely response of a tumor to
treatment with a therapeutic virus by assessing a replication indicator. As described
herein, virus replication patterns in tissue cultures can be used to predict in vivo viral
therapeutic effects. For example, a tissue or cell sample can be obtained (e.g., biopsy)
from a subject (e.g., human or non-human animal subject), and the sample can be
infected with one or more types of viruses. Based on the replication patterns of the
one or more viruses, therapeutic effects of those viruses on the tissue or cells (from
which the sample was obtained) can be predicted, hi some examples, such prediction
can be a binary prediction, indicating whether the tissue or cells of interest will be a
responder type or a non-responder type.
As described herein by examples, known tumor cell lines can be characterized,
for examples, as responders or non-responders for various types of viruses. Such
information can be stored in a database in known manners. During a viral therapy
planning phase, such database can be utilized to customize a treatment if information
about the to-be-treated tumor cell line is available. In some example the database can
be used as a standard by to compare a replication indicator determined from a tumor
sample obtained from a subject.
If information about the particular tumor type is uncertain or not known,
prediction of therapeutic effects can be made by obtaining replication patterns of one
or more viruses in a culture of a sample obtained from the subject (e.g., tumor
biopsy). For example, a sample can be obtained from a patient, and be infected by
one or more viral candidates. After a certain period, replication indicator, such as
changes in viral titer or relative gene expression, can be obtained; and based on such

indicator values, prediction as to therapeutic effect of each of the viral candidates can
be made.
In some examples, determination of the replication indicator in the tissue or
cell sample can be achieved via an array having different types of viruses, or an array
capable of receiving such viruses for infection. In some examples, a panel of one or
more candidate viruses in an array is assayed. In some examples, one or more cell
types or tumor samples are assayed. The tumor samples can include known
responders, known non-responders or unknown responders or non-responders, or a
combination thereof. In some examples, such an array can be a microarray. In some
example, replication indicators from the array can be at least partially automated or
controlled by a computing device.
In some embodiments, such period for determining viral replication patterns
can be in a range of approximately zero to 10 days, zero to 5 days, zero to 2 days, zero
to 1 day, zero to 2 days or more. Other ranges of such period also are possible. Viral
titers can also be assayed at any time point during the experiment. In some examples,
a replication indicator such as viral titer can be obtained at approximately 24 hours
after infection. In other examples the virus titer is assayed before 24 hours, such as
for example 6 hours or more or 12 hours of more.
In some viruses, period associated with lagging of viral replication in non-
responders may vary. Accordingly, such variations can be accounted for in forming
predictions of therapeutic effects.
In some applications, replication indicators can include assaying viral titer
performed using a standard method, such as by plaque assy. In some examples,
viruses can encode other gene products whose expression can be used as an indicator
of viral replication, such as, for example, but not limited to, proteins that emit light.
In some examples, the virus can encode a protein such as a fluorescent protein or a
luciferase or a combination thereof. In one example, the virus is vaccinia virus, such
as GLV-lh68. Other replication indictors include but are not limited to detection of
changes in viral gene expression or host gene expression.
As described herein, obtaining the viral replication patterns relatively early
after infection (around 24 hours post infection) can provide a replication index

indicative of therapeutic effect of the virus against a particular tumor of tumor type.
Such indices can be assigned for a given combination of virus and cell line. In some
examples, such a therapeutic index can be within a finite range of values.
The therapeutic index can be formed, for example, by plotting a curve of the
relative change in tumor volume against time after virus injection and a curve of the
change in tumor volume during the same time period in the absence of virus. The
untreated control curve represents the relative change in tumor volume without virus
treatment; and the virus treatment curve represents the relative change in tumor
volume with virus treatment. Such studies can be performed in well-recognized
tumor xenograft models as described herein.
One example way of forming a therapeutic index is to determine or estimate a
quantity given by
therapeutic index = (A-B)ZA (Eq. 1)
where A is the area under the untreated control curve, and B is the area under the
virus treatment curve, with both as from time T O to T. The time T Ocan be the time
when virus is introduced to the tumor-bearing subject, and can be measured in
appropriate time scale such as days.
The exemplary therapeutic index ((A-B)/A) can generally provide a range of
values between approximately zero and one. For example, if the value of B is
relatively low (where tumor volume increase is relatively low followed by a decrease
in volume), the therapeutic index is closer to one. On the other hand, if the value of B
is relatively high (where tumor volume increase is relatively high), the therapeutic
index is closer to zero. In some examples, the use of integrated values (e.g., areas
under curves) associated with curves can average out fluctuations that may be present
in the curves, which thereby yields a more accurate representation of the therapeutic
index. Also, in some examples, normalizing the therapeutic index, such as in the
examples provided herein, can facilitate a more meaningful comparison of various
combinations of viruses and cell lines.
In some embodiments, various concepts of the present disclosure can be
utilized for applications such as cancer treatment planning and/or patient screening.
For example, a biopsy can be performed on a patient, and the sample tissue can be

prepared for infection. A biopsy sample may contain cancerous and healthy cells.
Thus, such preparation can include a step where, for example, healthy cells are
allowed to die off in a known manner {e.g., over a period such as one week). Various
known techniques can be utilized to increase the relative number of cancerous cells in
the biopsy sample prior to viral infection.
A replication indicator can be any parameter that correlates with the ability of
a therapeutic virus to replicate efficiently in a tumor. As described herein and in the
Examples, delayed replication of a virus in vitro in a tumor cell is indicative of the
inability of the virus to cause tumor regression in vivo. Likewise, efficient and early
replication of the virus following infection of a tumor cell in vitro is indicative of a
favorable response to tumor therapy by the virus in vivo.
a. Virus titer
Determination of virus titer can be used a replication indicator. In some
examples, cells obtained from a biopsy can be infected (e.g., 0.01 MOI) with a
therapeutic virus (e.g., GLV-Ih68). Such infected cells can be assayed for viral titer
after a selected time (e.g., 24 hours), and such viral titer can be used to predict the
therapeutic index of the therapeutic virus on the tumor or cancerous cells associated
with the biopsied cells.
In some examples, a threshold value can be assigned to allow prediction of
responsiveness or non-responsiveness of a particular tumor. A threshold value can be
assigned at, for example, a viral titer value between 4.00 and 4.50 log pfu/106 above
which a particular tumor is classified a responder.
As shown in the examples provided, where the therapeutic index values are
constrained in a finite range, the slopes of lines increase as the viral titer time (post
infection) increases. It is therefore advantageous to have as large a range of viral titer
values as possible so as to allow better separation of such values. In the examples
provided, the 24 time point following infection of the tumor cells provided the largest
range of viral titer values among the three example times assayed (24, 48, and 72
hours), thereby allowing more effective separation and classifying of cell lines.
In the example data described herein, the 24-hour viral titer provides a
relatively convenient and fast method for obtaining sufficient replication statistics for

the purpose of classifying tumor cells as better responders or poorer responders to
the candidate virus (e.g. GLV- Ih68). It will be understood, however, that other viral
titer times can be selected for other viruses and/or cell lines. For example, earlier or
later time points such as for example around 12 hour to around 36 hours can be
assayed in order to classify the candidate viruses as responder or non responders.
In the examples provide herein, the multiplicity of infection employed MOI
was 0.01 . It is understood, however, that other MOI can be selected to allow better
separation of viral titer values, such as for example in the range of around 0.001 MOI
- 1 MOI.
In some examples, the viral titer of the biopsy sample can be accompanied by
one or more controls. In some examples, one or more known cell lines can be
infected and assayed along with the cells from the biopsy. For example, known cell
lines that are responders such as, for example, PANC-I and GI-IOlA, and/or non
responders, such as for example, PC-3 and MB-231 can be used as control(s). Viral
titer from the biopsied cells, normalized in an appropriate manner, can be compared
with titers from the known cell line(s). If the biopsied cells' viral titer is less than or
equal to that of PC-3, for example, such cells can be considered to be potential poorer
responders; and if the biopsied cells' viral titer is greater than or equal to that of
PANC-I, for example, such cells can be considered to be potential better responders.
If the biopsied cells' viral titer is between the values of PC-3 and PANC-I, a
classification can be made which may include consideration of other factors.
b. Expression of virus genes
Another exemplary replication indicator can be a change in the expression of
overall expression of vaccinia viral genes. As described in the examples provided
herein, the overall expression of vaccinia viral genes was upregulated in the responder
tumor cells compared to the non-responder cells at 24 hours post viral infection.
Thus, an assay for one or more viral genes or a panel of viral genes can be performed
in order to determine whether the virus efficiently replicates in the tumor cell type. If
the infected tumor cell exhibits an increase in viral gene expression, the tumor cell
can be classified as a predicted responder to viral therapy. In the methods provided
herein, one or more viral genes can be assessed to determine the level of viral gene

expression in the infected tumor cells. For example, 1, 2, 3, 4, 5 or more, 10 or
more, 50 or more 100 or more housekeeping genes can be assessed. Exemplary viral
genes that can be assayed for oncolytic viruses, such as vaccinia viruses, are provided
elsewhere herein. Such viral genes can be arrayed on microarrays and micro array
analysis can be performed to determine the level of viral gene expression using
standard techniques well known in the art and described elsewhere herein.
c. Decreased expression of housekeeping genes
An additional exemplary replication indicator provided herein is the
downregulation housekeeping genes in the tumor cell. Previous studies have shown
that housekeeping genes are dysregulated in tumors infected with viruses indicative
of the infected host shutdown of cellular functions due to the increased energy
demands of the infecting virus (Guerra, S (2007) J Virol. 8 1:8707-8721). As
described herein, the nearly all of the housekeeping genes in a responder tumor tested
had decreased expression within 24 hours of viral infection. Housekeeping gene
expression was not altered in the non-responder tumor during the same period (see
Examples).
In the methods provided herein, one or more housekeeping genes can be
assessed to determine whether the level of expression decreases in the presence of the
virus. For example, 1, 2, 3, 4, 5 or more, 10 or more, 50 or more 100 or more
housekeeping genes can be assessed. Exemplary housekeeping genes include, but are
not limited to ACTB, ALDOA, GAPD, PGKl, LDHA, RPS27A, RPLl 9, RPLl 1,
NONO, GDI, ARHGDIA, RPL32, RPS18, HSPCB, ILF2, USPI l , ATP6V1G1,
A1S9T, UBEl, CSNK2B, CPNEl, TNFRSF5, CTNNBl, EIF3S7, NDUFAl,
ARAFl, SAFB, ATP6IP1, H2BFL, COX7A2L, ENSA, BTF3, ETR, ATP5J2,
SFRS9, GlO, CSTB, SLC9A3R2, TETRAN, VEGFB, STK24, RAD9, EFNA3,
ARHGAPl, TAPBP, BATl, TKT, HLA-C, RABlA, UBE2D2, UBE2M, GNAS,
PTBPl, RPL36AL, C21orf33, GPI, COX7C, EIF4A2, COX6B, FBR-MuSV, FAU,
GRIK5, COX5B, COX5A, CDClO, VAMP3, GPAAl, PABPNl, HSBPl, YARS,
UBE2I, PABPCl, GCN5L1, COX4I1, SPAG7, PSMD8, ZFP36L1, ODCl, RPLl 8,
RPL13, RPSI l , CCND3, RPL14, PSMDI l , TPMT, RPL8, MTAl, COL6A1,
AP2M1, ATP5D, STKl 9, RPS25, RPS 19, MAPKAPK2, AIFl, C14orf2, MAP4,

RPS9, B4GALT3, CCBP2, RPS5, TPR-containingSGT, H6PD, MMPLl, E2F4,
ADAMl 5, ADDl, ADAR, PAX8, ANXA6, CHITl, TAGLN, FOLRl, ACTN4,
RINGl, ACVRLl, CDA, PTTGlIP, BCRPl, JAGl, ID3, ARHA, SULT1A3, CANX,
ARF5, ARF4, ARFl, TSTA3, GDI2, SSR2, ADRBKl, ELAVL3, CAPZB, SNRPA,
SDHA, PPP2CB, PITPNM, ILK, HDGF, GGTLAl , NEDD5, DAP, CSK, COX8,
ANXA2, SSTR5, CTBPl, CHD4, ZNF91, ZNF91, TTCl, TEGT, SRM, SGSH,
PSME2, PRKAGl, PGD, PRDXl, NM23B, MTXl, MSN, MC2R, LTBP4, LMOl,
IMPDH2, IFITMl, GRM4, GNAI2, GDIl, GASl, FTHl, EIF4G2, DAXX, CNTNl,
BSG, ARL2, ARF3, DNCLl, HLA-G, HGS, Cl lorfl3, ATP5A1, CSNKlE, SNX3,
CTSD, PSMA7, PSMB7, LDHB, SREBFl, PSMB4, PSMB2, PSMBl, MYH9,
CENPB, PFDN5, SYNGR2, APlBl, H3F3A, ARHGEF7, YWHAZ, MAP3K1 1,
AES, VIL2, PHFl, PFDNl, CKB, YWHAH, RNH, SLC25A1 1, CYCl, PTMA,
SNRPG, TUFM, YWHAB, RPA2, CD81, CALM2, ATP6V1F, H2AFY, NDUFB7,
HMGBl, CD23A, FCER2, GUKl, G22P1, BECNl, MCM3AP, CSFl, HPCALl,
ATP6V0C, ATP6V0B, ATP6V1E1, COX7A2, COX6A1, FKBPlA, RPL29, RPL27,
RPLP2, RPLPl, GM2A, RPL3, ENOl, RPL38, RPL37, RPL34, RPLl 5, RPS2,
RPS24, RPS16, RPS15, RPS13, RPL5, RPL17, POLR2A, RPS12, HNRPK, HNRPD,
HNRPAB, RPSlO, MAZ, MYC, FBL, AP2S1, ACTGl, M6PR, SNRPD2, LGALS9,
DIAl, COMT, MGATl, EIF3S8, DDT, FUS, ALTE, RRBPl, NDUFS5, ERH, B2M,
LYZ, NM23A, MVK, ENTPD6, UQCRCl, TXN, TUBB, TCOFl, SRP14, SRF,
SODl, SNRPB, SNRP70, SFRS2, RPS6KB2, RPNl, PRKCSH, PNMT, PKM2,
PIMl, SLC25A3, NDUFCl, NDUFA2, MPG, MIF, JAKl, HRMT1L2, GPX4, GP2,
GOT2, EXTL3, EIF3S5, EIF3S4, EIF3S2, DHCR7, DADl, CYB5, CLTB, CLTA,
CKAPl, CAPNSl, ATP5O, ATP5G3, ATF4, APLP2, ZNF, DNAJB6, HSPA8,
PHGDH, RAPlB, SKIP, MBC2, SAP18, C0PS6, ARPC4, ARPC3, NSAPl, BMIl,
TERF2IP, ARPC2, STARD7, FEZl, FBXO7, PLSCR3, PDAPl, DXSE, ST5, PRPH,
ZNF, RAGA, ClD, GABARAPL2, TADA3L, SEC61G, HAXl, DNPEP, CGI-57,
DKFZPK, MGC, M9, AF69, PRO, FLJ3, TRAPl, KIAA, COPE, CGlI, UQCRH,
NOT56L, H2AV, PLXNB2, DJ-I, REA, UBC, MACMARCKS, COBRAl,
RAD23A, UQCR, GPR56, RERE, KIFC3, MCLl, PPPlRl 1, QP-C, HBOA, TUBB4,
KIAA, MGC, HLA-DRB4, RFP, DNAJBl, RNPSl, CGB7, TIMM44, SIAHBPl,

BARTl, AFG3L2, MFN2, RUVBL2, DIAPHl, MLC-B, MGC, FLJ2, TMSBlO,
HCDI, PTOVl, KIAA, KIAA, RE2, NEDD8, CCT7, SARS, PFNl, SDC3, RPL35,
K-ALPHA-I, NXFl, SLC6A7, AGPATl, MRPL23, POLR2F, SEC61B, RPS 14,
HNRPHl, TALDOl, ARMET, DXYSE, PTDSSl, FOXMl, RACl, VAMPl, KIAA,
ABLl, RAN, A2LP, RTN4, ZFPLl, JTB, NUDT3, CPNE6, PGPL, TIP-I, FCGR2A,
JUND, NFKBIA, LAMPl, KIAA, MEA, BC-2, CIZl, ASE-I, CALMl, RBPMS,
RBM3, CRF, VARS2, TACCl, PINl, LASPl, MT3, UQCRFSl, CCT3, TCFLl,
SLC6A8, KARS, ISLR, CFLl, NCL, MLF2, PRPF8, TOM7, MRC2, AKRlAl,
LQFBS-I, GNB2L1, MLN51, HSGP25L2G, BRMSl, APOBEC3C, UBB, CREB3,
RANBP16, MRPL9, PDCD6, MDHl, JAM3, MAP2K2, REQ, YWHAQ, MGC3,
FLJ4, SLC25A1, FLJ2, SARl, G2AN, PPP2R1A, SMT3H2, TSFM, HSPA5,
TMEM4, RNP24, MAPK8IP1, GNB2, LYPLA2, NDUFVl, BTBD2, ANAPC5,
SUIl, DDOST, PKD2, DRAPl, MYL6, WDRl, MEL, TLNl, SCAMP3, CDC2L2,
RBM8A, RPLlO, SDCCAG33, RPLlOA, TRIM28, AATF, P-RHO-GEF, RPLl 3A,
POLR2L, NIFIE14, XBPl, HYOUl, C9orfl6, C12orf8, FLJ7, GSK3A, MRPS12,
NDUFV2, CLSTNl, DAZAP2, HSA16, DKK4, PAK4, PRKCABP, ZNF, TCEB2,
GABARAP, ATP5I, SMT3H1, IDH3B, KDELRl, KIFlC, TUBGCP2, API5,
ANP32B, RABACl, HISl, ATP5H, ACAT2, SRRMl, NACA, HINTl, ATP5G1,
ALDOC and NDUFA (Eisenberg and Levanon (2003) Trends in Genetics 19, 362-
365). Such housekeeping genes can be arrayed on microarrays and microarray
analysis to measure gene expression can be performed using standard techniques well
known in the art and described elsewhere herein.
Any method known in the art can be used for assessing the expression of
housekeeping genes in a tumor. For example, methods for measuring protein
expression levels which can be used include, but are not limited to, microarray
analysis, ELISA assays, Western blotting, or any other technique for the quantitation
of specific proteins. For RNA levels, examples of techniques which can be used
include microarray analysis, quantitative PCR, Northern hybridization, or any other
technique for the quantitation of specific nucleic acids.
In an exemplary method provided herein includes contacting a tumor sample
with the virus for a period of time in vitro and measuring the level of expression of

one or more housekeeping genes compared to level of the one ore more
housekeeping genes in a second tumor sample. Decreased expression of the one or
more housekeeping genes is indicative of a favorable response to tumor therapy.
d. Expression of tumor proteins
As described herein, the level of one or more tumor proteins can be
upregulated or down regulated in response to viral infection. Thus, measuring the
level of expression of such protein can be a indicator of efficient viral replication in
the tumor cell. Examples of such proteins are provided elsewhere herein and in the
examples hi an exemplary method, a tumor cell is infected with a virus and the level
of gene expression in the tumor is measured compared to the level of gene expression
in the tumor in the absence of the virus. An increase or decrease in the level of gene
expression in a tumor can be compared to the pattern of gene expression obtained
when a responder is infected with a therapeutic virus versus the pattern of gene
expression obtained when a non- responder is infected with a virus. Comparison of
the patterns of gene expression will allow one classify the tumor as one likely to
respond favorably to tumor therapy.
Any method known in the art can be used for assessing the level of gene
expression in a tumor. For example, methods for measuring protein expression levels
which can be used include, but are not limited to, microarray analysis, ELISA assays,
Western blotting, or any other technique for the quantitation of specific proteins. For
RNA levels, examples of techniques which can be used include microarray analysis,
quantitative PCR, Northern hybridization, or any other technique for the quantitation
of specific nucleic acids.
2. Methods of Assessing Whether a Subject is Likely to RespondFavorably or Poorly to Viral Therapy by Marker Expression Profiling
Methods of assessing whether a subject is likely to respond favorably or
poorly to viral therapy are provided. Such methods can be used to determine whether
to administer viral therapy to a subject or whether to utilize a therapeutic approach
other than viral therapy. In some examples, such methods can be used to determine
the type of therapeutic virus to administer to a subject.
In some examples, a marker profile of a cell contacted with a therapeutic virus
can be used to assess whether a subject is likely to respond favorably or poorly to

viral therapy. In some examples, a marker profile of a cell not contacted with a
therapeutic virus can be used to assess whether a subject is likely to respond favorably
or poorly to viral therapy. A marker profile can be obtained by determining whether
the level of expression of a plurality of markers indicative of a favorable or poor
response to viral therapy is altered when a biological sample, such as a tumor sample,
from the subject is contacted with a therapeutic virus. Markers can include markers
whose expression is altered in cells that are known to respond favorably to viral
therapy; markers whose expression is altered in cells that are known to respond poorly
to viral therapy; and markers whose expression is known to remain substantially the
same in cells which respond favorably or poorly to viral therapy. In some examples,
the cells which respond favorably to viral therapy are cells which permit replication of
the therapeutic virus following infection. In some examples, the cells which respond
poorly to viral therapy are cells in which the therapeutic virus replicates poorly. In
some examples, markers can include markers for which an increased level of
expression is indicative of a favorable or poor response to viral therapy, markers for
which a decreased level of expression is indicative of a favorable or poor response to
viral therapy or markers for which a substantially unchanged level of expression is
indicative of a favorable or poor response to viral therapy. For example, some of the
markers can be one or more of those listed in Table 1, Table 2, and Table 3.
Table 1Markers For Which an Increased Expression Level is Indicative of a Favorable
Response to Viral Therapy

Table 2Cell Markers For Which an Decreased Expression Level is Indicative of a
Favorable Res onse to Viral Thera

Table 3Tumor Cell Markers For Which the Expression Level is Substantially
Unchanged in Cells Which Respond Favorably to Viral Therap y

In some examples, the expression profile for a tumor that is responsive to
tumor therapy can be compared to the expression profile for a tumor that is non-
responsive to viral therapy in the absence of any viral treatment. As described herein
and in the examples, tumors that are non-responsive to tumor therapy have increased
expression of markers that are predictive of whether the tumor will respond to viral
therapy. Such markers can be employed to assess whether a particular tumor will be
responsive to tumor therapy. Listed in Table 4 are marker where increased expression
is indicative of a poor response to therapy. Such markers include but are not limited
to Beta-2 Microglobulin, Brain-Derived Neurotrophic Factor, Cancer Antigen 19-9,
Carcinoembryonic Antigen, C Reactive Protein, EGF, Fatty Acid Binding Protein,
Factor VII, Growth Hormone, GM-CSF, IL-I alpha, IL-I beta, IL-I ra, IL-7, IL-8,
Prostatic Acid Phosphatase, Prostate Specific Antigen, Stem Cell Factor, TNF-alpha,
and VEGF.
Table 4Tumor Markers For Which an Increased Expression Level is Indicative
of a Poor Res onse to Viral Thera

Methods to determine whether a subject is likely to have a favorable or a poor
response to viral therapy can include one or more steps. In some examples, a
biological sample, such as a tumor sample, from the subject is contacted with a
therapeutic virus. In such examples, the level of expression of at least one marker in
the biological sample, such as a tumor sample, contacted with the virus is assessed to
determine whether the level of expression is altered in response to the therapeutic
virus. If the expression level of the at least one marker is indicative of a favorable
response to viral therapy, viral therapy with the therapeutic virus can be performed on
the subject. If the expression level of the at least one marker is indicative of a poor
response to viral therapy, a therapeutic approach other than viral therapy can be
employed for the subject. In some examples, such methods can include obtaining a
biological sample from the subject, for example, a biopsy of a tumor; measuring the
level of expression of at least one marker in a first biological sample; measuring the
level of expression of the same at least one marker in a second biological sample
contacted with a therapeutic virus; and determining whether the level of expression of
the at least one marker has increased, decreased or remained substantially the same in
response to contacting the biological sample with the therapeutic virus. Alternatively,
for this method and any of the methods described herein, rather than comparing the
level of expression in contacted or non-contacted samples, the level of expression in
the contacted biological sample or cells can be compared to a previously determined
expression level which has been shown to be an accurate baseline expression level for
uncontacted biological samples or cells.
In some examples, the at least one marker can be selected from the markers
listed in Table 1, Table 2 and Table 3. In some examples, the at least one marker
encompasses a plurality of markers selected from the markers listed in Table 1, Table
2, or Table 3. In some examples the expression level of at least 1, at least 5, at least
10, at least 15, at least 20 markers, or more than 20 markers selected from the markers
listed in Table 1, Table 2 and Table 3 can be determined. In some examples, the

expression levels of all the markers of Table 1, Table 2, and Table 3 can be
determined.
The at least one marker can be a marker identified by methods described
herein. In some examples, the marker can be a marker for which the level of
expression is indicative of a favorable or poor response to viral therapy. In some
examples, the marker can be a marker for which the level of expression is associated
with good or poor replication of the virus in a biological sample.
In some examples, a single biological sample, such as a tumor sample, is
obtained and divided into two test samples. One test sample is not contacted with the
virus, while the other test sample is contacted with the virus. The level of expression
of the marker in the two portions is compared. In other examples, the second
biological sample, such as a second tumor sample, can be a portion of the first
biological sample or from the same source as the first biological sample.
Methods to determine whether a subject is likely to have a favorable or a poor
response to viral therapy can include culturing a biological sample, such as a tumor
sample, contacted with a therapeutic virus, prior to measuring the level of expression
of at least one marker. In some examples, the biological sample, such as a tumor
sample, can be cultured in vitro according to methods known in the art. Alternatively,
the biological sample, such as a tumor sample, can be cultured in vivo. In such
methods, the biological sample, such as a tumor sample, can be implanted
subcutaneously into an organism, such as a nude mouse. Where the biological sample
is cultured in vivo, the level of expression can be measured for markers of the host
organism, and for markers of the biological sample.
The biological sample, such as a tumor sample, contacted with the therapeutic
virus can be cultured for a period of time sufficient to detect a response to the virus.
In some examples, the period of time can be determined by the sensitivity of the
method used to measure the level of expression of at least one marker. For example,
the biological sample, such as a tumor sample, contacted with the therapeutic virus
can be cultured for about 30 minutes, about 1 hour, about 6 hours, about 12 hours,
about 1 day, about 2 days, about 3 days, about 4 days, about 5 days, about 6 days,
about 7 days, about 8 days, about 9 days, about 10 days, about 11 days, about 12 days,

about 13 days, about 14 days, about 2 weeks, about 3 weeks, about 4 weeks, or about
1 month.
The measurement of the level of expression of at least one marker can be
carried out using methods well known in the art. Examples of methods for measuring
protein expression levels which can be used include, but are not limited to, microarray
analysis, ELISA assays, Western blotting, or any other technique for the quantitation
of specific proteins. For RNA levels, examples of techniques which can be used
include microarray analysis, quantitative PCR, Northern hybridization, or any other
technique for the quantitation of specific nucleic acids.
In some examples of the methods for assessing whether a subject is likely to
respond favorably or poorly to viral therapy described herein, the step of determining
whether the level expression of the at least one marker in a biological sample, such as
a tumor sample, contacted with a therapeutic virus has decreased, increased, or
remained substantially the same, as compared to the expression of the same at least
one marker in a non-contacted biological sample can be performed by comparing
quantitative or semi-quantitative results obtained from the determining step. In some
examples, a difference in expression of the same marker between the contacted and
non-contacted biological samples of about less than 2-fold, about 2-fold, about 3-fold,
about 4-fold, about 5-fold, about 6-fold, about 7-fold, about 8-fold, about 9-fold,
about 10-fold, about 20-fold, about 30-fold, about 40-fold, about 50-fold, about 60-
fold, about 70-fold, about 80-fold, about 90-fold, about 100-fold or greater than about
100-fold is indicative of a favorable or poor response to viral therapy. For markers
for which a substantially unchanged level of expression is indicative of a favorable or
poor response to viral therapy, the difference in expression of the same marker
between the contacted and non-contacted samples can be less than about 2-fold, less
than about 1.5 fold, or less than about 1.
In examples where the at least one marker is selected from Table 1, an
increase in expression of the selected marker in a contacted biological sample, such as
a tumor sample, as compared to expression of the same marker in a non-contacted
biological sample can indicate that the subject is likely to respond favorably to viral
therapy. Conversely, no increase can indicate that the subject is likely to have a poor

response to viral therapy. In examples where the at least one marker is selected from
Table 2, a decrease in expression of the selected marker in a contacted biological
sample as compared to expression of the same marker in a non-contacted biological
sample can indicate that the subject is likely to respond favorably to viral therapy.
Conversely, no decrease can indicate that the subject is likely to have a poor response
to viral therapy. In examples where the at least one marker is selected from Table 3,
no substantial change in the level of expression of the selected marker in a contacted
biological sample as compared to expression of the same marker in a non-contacted
biological sample can indicate that the subject is likely to respond favorably to viral
therapy. In some examples where the at least one marker is selected from Table 3,
evidence of a subject's likely favorable or poor response to viral therapy can be
corroborated by measuring the level of expression of markers from Table 1 and Table
2.
Any therapeutic virus described herein can be used to assess whether a subject
is likely to respond favorably or poorly to viral therapy. In some examples, .a subject
can be screened with a plurality of viruses designed for viral therapy to determine
which virus can be used in viral therapy. For example, where a subject responds
poorly to a first therapeutic virus, at least a second virus can be used to determine
whether a subject is likely to respond favorably or poorly to viral therapy containing
the at least a second virus. In such examples, a biological sample, such as a tumor
sample, from the subject is contacted with the at least a second virus and the level of
expression of at least one marker is determined. If the level of expression of the at
least one marker is indicative of a favorable response, viral therapy can be performed
using the at least a second virus.
In some examples, methods to determine whether a subject is likely to respond
to favorably or poorly to viral can include determining the level of expression of at
least one marker in a biological sample, such as a tumor sample, not contacted with a
therapeutic virus. In such examples, a biological sample, for example, a biopsy (the
following is not limited to a biopsy samples only), can be obtained from a subject and
the level of expression of at least one marker is determined. In some examples, the at
least one marker can be selected from among markers listed in Table 1, Table 2 and

Table 3. In some examples, the at least one marker encompasses a plurality of
markers selected from among the markers listed in Table 1, Table 2, and Table 3. In
some examples, the expression of at least 1, at least 5, at least 10, at least 15, at least
20, or more than 20 markers selected from among the markers listed in Table 1,
Table 2 and Table 3 can be determined. In some examples, the expression level of all
the markers in Table 1, Table 2, and Table 3 can be determined. In other examples,
the at least one marker can be a marker identified by methods described herein.
In some examples, the amount or pattern of expression of the at least one
marker or a plurality of markers in a biological sample, such as a tumor sample,
which has not been contacted with a therapeutic virus is assessed to determine
whether the amount or pattern resembles the amount or pattern characteristic of
biological samples which respond favorably to viral therapy or biological samples
which respond poorly to viral therapy. For example, if the amount or pattern
resembles the amount or pattern characteristic of biological samples which respond
favorably to viral therapy then the subject from which the biological sample was
obtained is likely to respond favorably to viral therapy and therapy with the
therapeutic virus can be initiated. In another example, if the amount or pattern
resembles the amount or pattern characteristic of biological samples which respond
poorly to viral therapy then the subject from which the biological sample was
obtained is likely to respond poorly to viral therapy and a therapeutic approach other
than therapy with the therapeutic virus can be employed.
In some examples, the amount or pattern of expression of the at least one
marker or plurality of markers in the biological sample, such as a tumor sample, can
be compared to the amount or pattern of expression which has been previously
determined to be characteristic of biological samples which respond favorably or
poorly to viral therapy. For example, in some examples, the amount of expression of
the at least one marker or plurality of markers can be determined relative to a standard
such as the size of the tumor or other biological tissue in the biological sample, the
volume of the biological sample, the weight of the biological sample, the amount of
total protein in the biological sample, the total amount of nucleic acid in the biological
sample, the amount of DNA in the biological sample, the amount of RNA in the

biological sample or any other appropriate standard. For example, if a concentration
of 50 ng/ml or more of a particular marker per 150 mg of tumor has been shown to be
characteristic of tumors which respond favorably to viral therapy and the tumor
biopsy obtained from the subject has an expression level of 75 ng/ml per 150 mg of
tumor, it is likely that the subject will respond favorably to viral therapy and viral
therapy can be initiated. The same type of analysis can be performed using the
concentrations of a plurality of markers or by measuring the concentrations of the
markers relative to any of the standards described above.
The pattern of expression of one or more markers in the biological sample,
such as a tumor sample, also can be compared to the pattern of expression of one or
more markers which has been previously determined to be characteristic of biological
samples which respond favorably or poorly to viral therapy. For example, if it has
been determined that biological samples which respond favorably to viral therapy
exhibit a high level of expression of a first marker, a low level of expression of a
second marker, and an intermediate level of expression of a third marker and this
same pattern of expression is observed in a biological sample obtained from the
subject, the subject is likely to respond favorably to viral therapy and therapy with the
therapeutic virus can be initiated. In another example, if it has been determined that
biological samples which respond poorly to viral therapy exhibit a low level of
expression of a first marker, a low level of expression of a second marker, and a high
level of expression of a third marker and this same pattern of expression is observed
in a biological sample obtained from the subject, the subject is likely to respond
poorly to viral therapy and a therapeutic approach other than therapy with the
therapeutic virus can be initiated.
C. THERAPEUTIC VIRUSES
Provided herein are viruses designed for viral therapy (i.e. therapeutic
viruses). Viruses described in U.S. Patent Publication Nos. 2005/0031643,
2004/0234455 and 2004/0213741, can be used in conjunction with examples. In
particular, U.S. Patent Publication Nos. 2005/0031643, 2004/0234455 and
2004/0213741 describe desirable characteristics of viruses designed for viral therapy,
such as, attenuated pathogenicity, reduced toxicity, preferential accumulation in

certain cells and tissues, such as a tumor, ability to activate an immune response
against tumor cells, immunogenicity, replication competence, expression of
exogenous proteins, and any combination of the foregoing characteristics.
In some examples, viruses designed for viral therapy can include recombinant
vaccinia viruses. A variety of vaccinia virus strains are available, including Western
Reserve (WR), Copenhagen, Tashkent, Tian Tan, Lister, Wyeth, IHD-J, and IHD-W,
Brighton, Ankara, MVA, Dairen I, L-IPV, LC16M8, LC16MO, LIVP, WR 65-16,
Connaught, New York City Board of Health. In further examples, a vaccinia virus
can be a member of the Lister strain. In even further examples, the Lister virus can be
an attenuated Lister strain, such as the LIVP (Lister virus from the Institute for
Research on Virus Preparations, Moscow, Russia) strain.
In particular examples, a therapeutic virus can include the GLV-Ih68 virus
(Zhang et al. (2007) Cancer Research 67:10038-10046). The GLV-lh68 virus is a
replication-competent recombinant vaccinia virus that was constructed by inserting
three expression cassettes (encoding Renilla luciferase- Aequorea green fluorescent
protein fusion, β-galactosidase, and β-glucuronidase) into the F14.5L, J2R (encoding
thymidine kinase) and A56R (encoding hemagglutinin) loci of the viral genome,
respectively. GLV-Ih68 has an enhanced tumor targeting specificity and much
reduced toxicity compared with its parental LIVP strains.
In some examples, a therapeutic virus can be immunogenic where the virus
can induce a host immune response against the virus. The immune response can be
activated in response to viral antigens or can be activated as a result of viral-infection
induced cytokine or chemokine production. In some examples, an immune response
against a therapeutic virus can result in killing of a target tissue or target cell. In some
examples, the immune response can result in the production of antibodies against
tumor antigens. In some examples, an immune response can result in cell killing
through a bystander effect, for example, where uninfected cells in close proximity to
cells infected by the virus are killed as infected cells are killed.
In some examples, a therapeutic virus can be an attenuated virus which is
replication competent. Such viruses can have a decreased capacity to cause disease in
a host and accumulate in targeted tissues or cells. Methods to attenuate a virus can

include reducing the replication competence of the virus. For example, in the
vaccinia virus one or more genes selected from among the thymidine kinase gene, the
hemaglutinin gene and the F14.5L gene can be modified so as to attenuate the virus.
In some examples, the modification reduces the ability of the virus to replicate. In
some examples, the modification inactivates the protein encoded by the gene or
results in a lack of expression of the protein encoded by the gene.
In some examples, a therapeutic virus can accumulate in any of a variety of
organs, tissues or cells of the host. Accumulation can be evenly distributed over the
entire host organism, or can be concentrated in one or a few organs or tissues. In
certain examples, viruses can accumulate in targeted tissues, such as tumors,
metastases, or cancer cells. In exemplary examples, viruses designed for viral therapy
can accumulate in a targeted organ, tissue or cell at least about 2-fold greater, at least
about 5-fold greater, at least about 10-fold greater, at least about 100-fold greater, at
least about 1,000-fold greater, at least about 10,000-fold greater, at least about
100,000-fold greater, or at least about 1,000,000-fold greater, than the accumulation
in a non-targeted organ, tissue or cell.
Methods for the generation of recombinant viruses using recombinant DNA
techniques are well known in the art {e.g., see U.S. Pat. No. 4,769,330, 4,603,1 12,
4,722,848, 4,215,051, 5,1 10,587, 5,174,993, 5,922,576, 6,319,703, 5,719,054,
6,429,001, 6,589,531, 6,573,090, 6,800,288, 7,045,313, He et al. (1998) PNAS 95(5):
2509-2514, Racaniello et al, (1981) Science 214: 916-919, Hruby et al, (1990) Clin
Micro Rev. 3:153-170).
Non-limiting examples of attenuated Lister strain LIVP viruses that can be
used in any of the method provided herein or that can be modified to encode proteins
provided herein include, LIVP viruses described in U.S. Patent Publication Nos.
2005/0031643, 2004/0234455 and 2004/0213741 and U.S. Patent Application Serial
No. 11/975,088. Exemplary viruses contained therein that can be modified as
described here include viruses which have one or more expression cassettes removed
from GLV-Ih68 and replaced with a heterologous non-coding DNA molecule (e.g.,
GLV-lh70, GLV-lh71, GLV-lh72, GLV-lh73, GLV-lh74, GLV-lh85, and GLV-
Ih86). GLV-lh70 contains inserted into the F14.5L gene locus,

(PsEL)r7>/7? and (P7.5k)LαcZ inserted into the TK gene locus, and a non-coding DNA
molecule inserted into the HA gene locus in place of (? u ,)gusA. GLV-lh71 contains
a non-coding DNA molecule inserted into the F14.5L gene locus in place of
(? SEL)RUC-GFP, (PsEUrTrfll and (P75k )L cZ inserted into the TXgene locus, and
(Pi udgusA inserted into the HA gene locus. GLV-lh72 contains (? SEL)RUC-GFP
inserted into the F14. 5L gene locus, a non-coding DNA molecule inserted into the TK
gene locus in place of (PsE / inserted into the HA
gene locus. GLV- Ih73 contains a non-coding DNA molecule inserted into the
F14.5L gene locus in place of ( SEL)RUC-GFP, (P SEL>7>/R and (P75k ) cZ inserted
into the TK gene locus, and a non-coding DNA molecule inserted into the HA gene
locus in place of ( \\k )gusA. GLV- Ih74 contains a non-coding DNA molecule
inserted into the F14.5L gene locus in place of (PSEL)RUC-GFP, a non-coding DNA
molecule inserted into the TK gene locus in place of (PsELfTr β i and and a
non-coding DNA molecule inserted into the HA gene locus in place of (P \ i )gusA.
GLV- Ih85 contains a non-coding DNA molecule inserted into the F14.5L gene locus
in place of ( T SEI )RUC-GFP, a non-coding DNA molecule inserted into the TK gene
locus in place of ( SEL)fTr/R and (?η. \)LacZ, and (Pi \ )gusA inserted into the HA
gene locus. GLV- Ih86 contains ( SEL)RUC-GFP inserted into the F14.5L gene locus,
a non-coding DNA molecule inserted into the TK gene locus in place of (P SEL V/
and (?η.s )LacZ, and a non-coding DNA molecule inserted into the HA gene locus in
place of ? \\\ )gusA. Other exemplary viruses include, but are not limited to, LIVP
viruses that express one or more therapeutic gene products, such as angiogenesis
inhibitors (e.g., GLV- Ih81, which contains DNA encoding the plasminogen K5
domain under the control of the vaccinia synthetic early-late promoter in place of the
gusA expression cassette in GLV-lh68; GLV-1M04, GLV-1M05 and GLV-lhlO6,
which contain DNA encoding a truncated human tissue factor fused to the Cv -
integrin RGD binding motif (tTF-RGD) under the control of a vaccinia synthetic early
promoter, vaccinia synthetic early/late promoter or vaccinia synthetic late promoter,
respectively, in place of the LacZ/rTFr expression cassette at the TK locus of GLV-
Ih68; GLV-1M07, GLV-1M08 and GLV-lhlO9, which contains DNA encoding an
anti-VEGF single chain antibody G6 under the control of a vaccinia synthetic early
promoter, vaccinia synthetic early/late promoter or vaccinia synthetic late promoter,
respectively, in place of the LacZ/rTFr expression cassette at the TK locus of GLV-
Ih68) and proteins for tumor growth suppression {e.g., GLV-lh90, GLV-lh91 and
GLV-lh92, which express a fusion protein containing an IL-6 fused to an IL-6
receptor (sIL-6R/IL-6) under the control of a vaccinia synthetic early promoter,
vaccinia synthetic early/late promoter or vaccinia synthetic late promoter,
respectively, in place of tho gusA expression cassette in GLV-lh68; and GLV-lh96,
GLV-lh97 and GLV-lh98, which express IL-24 (melanoma differentiation gene,
mda-7) under the control of a vaccinia synthetic early promoter, vaccinia synthetic
early/late promoter or vaccinia synthetic late promoter, respectively, in place of the
Ruc-GFP fusion gene expression cassette at the F14.5L locus of GLV-I h68).
Additional therapeutic gene products that can be engineered in the viruses provided
herein also are described elsewhere herein.
1. Modifications of Therapeutic Viruses
In some examples, therapeutic viruses can contain a genetic modification.
Such modifications can include truncations, insertions, deletions and mutations to the
viral genome. In some examples, modifications can result in a change of viral
characteristics, for example, immunogenicity, pathogenicity, toxicity, ability to lyse
cells or cause cell death, and ability to preferentially accumulate in particular cells.
In some examples, a virus can be modified to produce a genetic variant using
techniques well known in the art. Such techniques for modifying vaccinia strains by
genetic engineering are well established (Moss (1993) Curr. Opin. Genet. Dev. 3:86-
90; Broder and Earl (1999) MoI. Biotechnol. 13, 223-245; Timiryasova et al. (2001)
Biotechniques 31: 534-540), and described in U.S. Patent Application No.
11/238,025. In some examples, genetic variants can be obtained by general methods
such as mutagenesis and passage in cell or tissue culture and selection of desired
properties, as exemplified for respiratory syncytial virus in Murphy et al. (1994) Virus
Res. 32:13-26. In some examples, genetic variants can be obtained by methods in
which nucleic acid residues of the virus are added, removed or modified relative to
the wild type. Any of a variety of known mutagenic methods can be used, including
recombination-based methods, restriction endonuclease-based methods, and PCR-
based methods. Mutagenic methods can be directed against particular nucleotide
sequences such as genes, or can be random, where selection methods based on desired
characteristics can be used to select mutated viruses. Any of a variety of viral
modifications can be made, according to the selected virus and the particular known
modifications of the selected virus.
In certain examples, any of a variety of insertions, mutations or deletions of
the vaccinia viral genome can be used herein. Such modifications can include
insertions, mutations or deletions of: the thymidine kinase (TK) gene, the
hemagglutinin (HA) gene, the VGF gene (U.S. Patent Publication No. 20030031681);
a hemorrhagic region or an A type inclusion body region (U.S. Patent No. 6,596,279);
Hind III F, Fl 3L, or Hind III M (as taught in U.S. Patent No. 6,548,068); A33R,
A34R, A36R or B5R genes (Katz et al., J . Virology 77:12266-12275 (2003); SalF7L
(Moore et al., EMBO J. 1992 11:1973-1980); NIL (Kotwal et al, Virology 1989
171:579-587); Ml lambda (Child et al., Virology. 1990 174:625-629); HR, Hindlll-
MK, HindIII-MKF, HindIII-CNM, RR, or BaniF (Lee et al., J. Virol. 1992 66:2617-
2630); C21L (Isaacs et al., Proc Natl Acad Sci USA. 1992 89:628-632); or F3
(F14.5L) (U.S. Patent Application No. 11/238,025).
2. Viruses Encoding a Marker Protein that is Increased in Cells thatRespond Favorable to Tumor Therapy
Some examples relate to viruses designed for gene therapy which encode a
marker protein whose level of expression is increased in cells which respond
favorably to viral therapy. Other examples relate to viruses designed for gene therapy
which encode an agent which reduces the level of expression of a marker protein
whose level of expression is decreased in cells which respond favorably to viral
therapy. Each of the foregoing viruses can, in some examples, be a modified virus
such as those described above.
In some examples, a therapeutic virus can contain a heterologous nucleic acid
encoding a protein whose levels are increased in cells that respond favorably to viral
therapy. In certain examples, the heterologous nucleic acid is operatively linked to
regulatory elements. Such regulatory elements can include promoters, enhancers, or
terminator sequences. Promoter sequences can be constitutive or inducible. Methods

to increase the level of expression of a particular protein can include providing a
therapeutic virus expressing the particular protein to a cell.
The methods can include providing a therapeutic virus expressing a
transactivator to a cell, where the transactivator can increase the level of expression of
a particular endogenous protein in the cell. In such examples, the endogenous protein
can be a protein whose level of expression is increased in cells that respond favorably
to viral therapy.
In some examples, the increase in the level of expression of a particular
protein in a cell contacted with a therapeutic virus containing a therapeutic agent
compared with a cell not contacted with the virus can be about less than 2-fold, about
2-fold, about 3-fold, about 4-fold, about 5-fold, about 6-fold, about 7-fold, about 8-
fold, about 9-fold, about 10-fold, about 20-fold, about 30-fold, about 40-fold, about
50-fold, about 60-fold, about 70-fold, about 80-fold, about 90-fold, about 100-fold or
greater than about 100-fold.
In some examples, the virus can encode one or more proteins whose level of
expression is increased in cells that respond favorably to viral therapy. Such proteins
can include, but are not limited to, the proteins listed in Table 1. In some examples,
the virus can encode one or more proteins selected from among IL-1 8 (Interleukin-
18), MCP-5 (Monocyte Chemoattractant Protein-5; CCL12), IL-I l (Interleukin-1 1),
MCP-I (Monocyte Chemoattractant Protein- 1), MPO (Myeloperoxidase), Apo A l
(Apolipoprotein Al), TIMP-I (Tissue Inhibitor of Metalloproteinase Type-1), CRP (C
Reactive Protein), Fibrinogen, MMP-9 (Matrix Metalloproteinase-9), Eotaxin
(CCLl 1), GCP-2 (Granulocyte Chemotactic Protein-2, CXCL6) IL-6 (Interleukin-6),
Tissue Factor (TF), SAP (Serum Amyloid P), FGF-basic (Fibroblast Growth Factor-
basic), MCP-3 (Monocyte Chemoattractant Protein-3, CCL7), IP-10 (CXCL), MIP-2,
and Thrombopoetin.
Among the viruses provided herein are viruses encoding cytokines, such as
chemokines, including members of the C-X-C and C-C chemokine families. The
chemokine-encoding viruses include, but are not limited to, viruses encoding IP-10
(e.g. mouse IP-10 having the sequence of amino acids set forth in SEQ ID NO: 24,
and human IP-10 having the sequence of amino acids set forth in SEQ ID NO: 485),

MCP-I (e.g. mouse MCP-I having the sequence of amino acids set forth in SEQ ID
NO: 50, and human MCP-I, having the sequence of amino acids set forth in SEQ ED
NO: 135); RANTES (see SEQ ID NO: 142 (human); SEQ ID NO: 57 (mouse); MIPl-
alpha (see SEQ ID NO: 130 (human); SEQ ID NO: 44 (mouse)); eotaxin (see SEQ ID
NO: 88 (human); SEQ ID NO: 10 (mouse)); and MlPl-beta (see SEQ ID NO: 131
(human); SEQ ID NO: 45 (mouse)). These viruses can be used in treatment of
subjects, such as human patients. For example, the viruses can be formulated and
administered to a subject for treating tumors, e.g. by promoting anti-tumor immunity,
preventing angiogenesis, preventing tumor growth, and other anti-tumor activities. A
plurality of immunostimulatory cytokines promote anti-cancer immune responses
and/or inhibit growth of tumors, for example, by preventing angiogenesis (reviewed
in Oppenhiem et al., Clin. Cancer Res. 3, 2682-2686 (1997)).
a. IP-10 encoding viruses
Among the provided viruses are viruses encoding interferon-gamma-induced
protein (IP-1 0; also known as Chemokine (C-X-C motif) ligand 10 (CXCLl 0), 10
kDa interferon-gamma-induced protein, C7, crg-2, Gamma- IP 10 (γ -IPIO), gIP-10,
IFIlO, INPlO, mob-1, SCYBlO, and Small inducible cytokine BlO precursor),
including viruses encoding mouse IP-10 (mIP-10, such as mIP-10 having the
sequence of amino acids set forth in SEQ ID NO: 24 and mIP-10 encoded by the
sequence of nucleic acids set forth in SEQ ID NO: 397) and viruses encoding human
IP-10 (such as IP-10 having the sequence of amino acids set forth in SEQ ID NO:
485, and IP-10 encoded by the sequence of nucleic acids set forth in SEQ ID NO:
484). Exemplary IP-10 encoding viruses are described in Example 21, below. IP-10,
a member of the C-X-C chemokine family, is a small cytokine (10 kDa) secreted by
monocytes, endothelial cells, fibroblasts and other cells in response to IFN-γ
production. IP-10 binds to chemokine receptor CXCR3, acting as chemoattractant for
a plurality of immune cells, including macrophages, monocytes, T cells, NK cells, and
dendritic cells, and promoting cell adhesion (Luster et al., Nature 315: 672-676
(1985); Dufour et al., J . Immunol. 168: 3195-3204 (2002).
The IP-10 encoding viruses can be used in treatment of subjects, such as
human patients. For example, the viruses can be administered to a subject for treating

tumors, e.g. , by promoting anti-tumor immunity, and/or blocking tumor cell
proliferation, tumor growth and angiogenesis. C-X-C chemokines, including IP-IO,
have been shown to have anti-tumor activities, including suppression of tumor growth
and angiogenesis and promotion of anti-tumor immunity (Angiolillo et al., J. Exp.
Med. 182 155-162 (1995); Oppenhiem et al., Clin. Cancer Res. 3, 2682-2686 (1997)).
For example, IP-10 reportedly inhibited bone marrow colony formation and
angiogenesis; transfection of IP-10 into murine tumor cells promoted anti-tumor
immunity (Luster et al., J . Exp. Med. 178, 1057-1065 (2003)).
b. MCP-I encoding viruses
Also among the viruses provided herein are viruses encoding monocyte
chemoattractant protein- 1 (MCP-I, also known as chemokine (C-C motif) ligand 2
(CCL2)), including mouse MCP-I (such as MCP-I having the amino acid sequence
set forth in SEQ ID NO: 50) and human MCP-I (hMCP-1, such as hMCP-1 having
the sequence of amino acids set forth in SEQ ID NO: 135 and hMCP-1 encoded by
the sequence of nucleic acids set forth in SEQ ID NO: 483). Exemplary MCP-I
encoding viruses are described in Example 21, below. MCP-I is generated in vivo
from a protein precursor by cleavage of a 23 amino acid signal peptide, to yield the
mature MCP-I protein, which is 76 amino acids in length, and approximately 13
kilodaltons (kDa). MCP-I is a C-C family chemokine that recruits monocytes,
memory T cells and dendritic cells and binds to receptors including CCL2, CCR2 and
CCR4 (Gu et al., J . Leuk. Biol. 62: 577-580 (1997); Carr et al., Proc. Natl. Acad. Sci.
USA 91: 3652-3656 (1994).
The MCP-I -encoding viruses can be used in treatment of subjects, such as
human patients. For example, the viruses can be administered to a subject for treating
tumors, e.g. by promoting anti-tumor immunity, and/or blocking tumor cell
proliferation and tumor growth. Anti-tumor effects of MCP-I have been observed in
a plurality of cancers, including colon carcinoma and renal adenocarcinoma; MCP-I
expression positively correlated with patient survival rate and immune cell infiltration
and inversely correlated with tumor proliferation in pancreatic cancer (reviewed in
Craig et al., Cancer Metastasis Rev 25:61 1-619 (2006)). MCP-I can promote
migration of monocytes/macrophages to tumors and was observed to promote
monocyte-mediated inhibition of tumor growth in vitro (Matushima et al., J. Exp.
Med. 169: 1485-1490 (1987). MCP-I expression in tumor cells blocked in vivo tumor
formation in nude mice (Rollins and Sunday, MoI. Cell. Biol. 11(6), 3125-3131
(1991). Other reports indicate that MCP-I can attract tumor cells and promote tumor
metastasis, e.g. bone metastasis, in some cancers (Oppenhiem et al., Clin. Cancer Res.
3, 2682-2686 (1997); see also Pellegrino et al., Recenti Prog. Med. 93(1 1): 642-654
(2002); Craig et al., Cancer Metastasis Rev 25:61 1-619 (2006).
c. TIMP-I, 2, 3 encoding viruses
In some examples, the virus can encode TIMP-I. TIMP-I has been identified
herein as having an increased expression level in cells which permit a good level of
replication of a therapeutic virus or which respond favorably to viral therapy. TIMP-I
is a multifunctional protein that plays contrasting roles during angiogenesis and
metastasis hi some studies TIMP-I has been reported to regulate matrix
metalloproteinase activity, act as a growth stimulator and inhibit apoptosis. For
example, Yamazaki et al. have shown that transgenic mice carrying a transgene of
TIMP-I linked to the albumin promoter (Alb) have a greatly decreased tumor
incidence (Yamazaki M et al. (2004) 25(9):1735-46). In particular, in an initial
mammary carcinogenesis study, heterozygous AIb-TIMP- 1 mice had a 25% tumor
incidence compared to wild-type littermates with a 83.3% tumor incidence. Further
analysis of the tumors in the AIb-TIMP- 1mice showed evidence of decreased
proliferative activity and inhibition of apoptosis. In another study, C57BL/6J-CBA
mice overexpressing human TIMP-I in the liver under the control of the mouse
albumin promoter/enhancer were shown to have an increased tumor angiogenic
response (de Lorenzo MS et al. (2003) 17(l):45-50). In addition to the increased
tumor angiogenic response, transgenic animals also showed an early subcutaneous
growth advantage compared to wild-type hybrid mice de Lorenzo et al. postulated
that TIMP-I displays paradoxical effects on tumor progression and that circulating
TIMP-I can be efficient in suppressing lung colonization of melanoma cells.
In some examples, the virus can encode TIMP-2. TIMP-2 can inhibit the
invasive activities of matrix metalloproteinases in malignant tumors, such as
malignant gliomas. In one study, a gene encoding TIMP-2 was transferred in vitro to

malignant glioma cells using a defective herpes simplex virus (HSV) (Hoshi M, et
al., Antitumoral effects of defective herpes simplex virus-mediated transfer of tissue
inhibitor of metalloproteinases-2 gene in malignant glioma U87 in vitro:
consequences for anti-cancer gene therapy. Cancer Gene Ther. 2000 7(5):799-805).
The defective HSV vector, dvSRaTIMP2, was engineered to express human TIMP-2
using a replication-competent temperature-sensitive HSV-tsK mutant. U87 human
glioblastoma cells infected with the vector in vitro showed an inhibition of invasive
activity.
In some examples, the virus can encode TIMP-3. In experiments where
neuroblastoma and malignant peripheral nerve sheath (MPNS) tumor xenografts were
infected with an oncolytic virus expressing human TIMP-3, an enhancement of
antitumor efficacy has been observed (Mahller YY, et al (2008) Cancer Res.
68(4): 1170-9). The antitumor efficacy of oncolytic herpes simplex viruses (oHSV)
expressing either human TIMP-3, or luciferase was evaluated in infected
neuroblastoma and malignant peripheral nerve sheath tumor (MPNST) xenografts.
Cells infected with the virus expressing TIMP-3 showed increased cytotoxicity and
reduced metalloproteinase activity. Tumors treated with the virus expressing TIMP-3
showed delayed tumor growth, increased peak levels of infectious virus, immature
collagen extracellular matrix, and reduced tumor vascular density. In addition,
treatment with the virus expressing TIMP-3 reduced circulating endothelial
progenitors.
3. Viruses an Agent which Reduces the Level of Expression of a MarkerProtein
In other examples, a therapeutic virus can contain a heterologous nucleic acid
encoding an agent which reduces the level of expression of a marker whose level of
expression is decreased in cells which respond favorably to viral therapy or in cells
which permit a good level of replication of a therapeutic virus. Methods to decrease
the level of expression of a protein can include providing a therapeutic virus to a cell,
where the virus can express a protein that inhibits the expression of the marker.
In some examples, the level of expression of a marker protein in a cell can be
decreased by providing a therapeutic virus encoding a nucleic acid that reduces the
level of expression of a marker whose level of expression is decreased in cells that

respond favorably to viral therapy. In such methods the therapeutic agent can
include an antisense nucleic acid targeted against a nucleic acid encoding the marker,
small inhibitory RNA (siRNA) targeted against a nucleic acid encoding the marker, or
a ribozyme targeted against a nucleic acid encoding the marker.
Methods to decrease the level of expression of a marker protein using
antisense nucleic acids are well known in the art. Antisense sequences can be
designed to bind to the promoter and other control regions, exons, introns or even
exon-intron boundaries of a gene. Antisense RNA constructs, or DNA encoding such
antisense RNAs, can be employed to inhibit gene transcription or translation or both
within a host cell, either in vitro or in vivo, such as within a host animal, including a
human subject. While all or part of the gene sequence can be employed in the context
of antisense construction, statistically, any sequence 17 bases long should occur only
once in the human genome and, therefore, suffice to specify a unique target sequence.
Methods to decrease the level of expression of a marker protein using siRNA
are well known in the art. For example, the design of a siRNA can be readily
determined according to the mRNA sequence encoding of a particular protein. Some
methods of siRNA design and downregulation are further detailed in U.S. Patent
Application Publication No. 20030198627.
Methods to decrease the level of expression of a particular protein using a
ribozyme are well known in the art. Several forms of naturally-occurring and
synthetic ribozymes are known, including Group I and Group II introns, RNaseP,
hairpin ribozymes and hammerhead ribozymes (Lewin A S and Hauswirth W W,
Trends in Molecular Medicine 7 : 221-228, 2001). hi some examples, ribozymes can
be designed as described in int. PCT Patent Application Publication No. WO
93/23569 and PCT Patent Application Publication No. WO 94/02595. US 7,342,1 11
describes general methods for constructing vectors encoding ribozymes.
In some examples, the decrease in the level of expression of a marker protein
in a cell contacted with a therapeutic virus encoding an agent which decreases the
level of expression of the marker compared with a cell not contacted with the virus
can be about less than 2-fold, about 2-fold, about 3-fold, about 4-fold, about 5-fold,
about 6-fold, about 7-fold, about 8-fold, about 9-fold, about 10-fold, about 20-fold,

about 30-fold, about 40-fold, about 50-fold, about 60-fold, about 70-fold, about 80-
fold, about 90-fold, about 100-fold or greater than about 100-fold. In some examples,
the level of expression of a marker protein in a cell contacted with a therapeutic virus
containing a nucleic acid encoding an agent which decreases the level of expression
of the marker protein can be zero.
In some examples, the agent can decrease the level of expression of one or
more proteins whose level of expression is known to be decreased in cells that
respond favorably to viral therapy. In some examples, the agent can be directed to
one or more of the proteins listed in Table 2. hi other examples, the virus can encode
an agent which decreases the level of expression of one or more proteins selected
from among MIP-I beta (Macrophage Inflammatory Protein- 1beta), MDC
(Macrophage-Derived Chemokine, CCL22), MIP-I alpha (Macrophage Inflammatory
Protein- 1alpha, CCL3), KC/GROalpha (Melanoma Growth Stimulatory Activity
Protein), VEGF (Vascular Endothelial Cell Growth Factor), Endothelin-1, MIP-3beta
(Macrophage Inflammatory Protein-3beta, also know as Exodus-3 or ELC), RANTES
(Regulation Upon Activation, Normal T-CeIl Expressed and Secreted, CCL5), IL-5
(Interleukin-5), IL-I alpha (Interleukin-1 alpha), EGF (Epidermal Growth Factor),
Lymphotactin (XCLl), GM-CSF (Granulocyte Macrophage-Colony Stimulating
Factor), MIP-I gamma (Macrophage Inflammatory Protein-1gamma, CCL4) and IL-
lbeta (Interleukin-1beta).
In some examples, the virus can encode an agent which alters the expression
of a protein whose expression is altered in cells that respond poorly to viral therapy.
For example, in some examples the virus can encode an agent which increases the
level of expression of a marker for which the level of expression is decreased in cells
which respond poorly to viral therapy. Alternatively, the virus can encode a marker
protein whose expression is decreased in cells that respond poorly to viral therapy,
thereby increasing the level of expression of the marker protein. In other examples,
the virus can encode an agent which decreases the level of expression of a marker
whose level of expression is increased in cells which respond poorly to viral therapy.
In some examples, the virus contain a regulatory sequence operatively linked
to a nucleic acid sequence encoding a marker whose level of expression is increased

in cells which respond favorably to viral therapy or cells which permit good viral
replication. In other examples, the virus contains a regulatory sequence operatively
linked to a nucleic acid encoding an agent which reduces the level of expression of a
marker whose level of expression is decreased in cells which respond favorably to
viral therapy or cells which permit good viral replication. In still further examples, the
virus contains a regulatory sequence operably linked to a nucleic acid encoding a
protein whose level of expression is decreased in cells which respond poorly to viral
therapy or cells which permit poor viral replication hi other examples, the virus
contains a regulatory sequence operatively linked to a nucleic acid encoding an agent
which decreases the level of expression of a marker whose level of expression is
increased in cells which respond poorly to viral therapy or cells which permit poor
viral replication. Regulatory sequences can include a constitutive promoter, an
inducible promoter, or an enhancer. In such examples, a regulatory sequence can
include a natural or synthetic vaccinia virus promoter. In another embodiment, the
regulatory sequence can contain a poxvirus promoter. In some examples, strong late
promoters can be used to achieve high levels of expression of the foreign genes.
Early and intermediate-stage promoters, however, can also be used. In one
embodiment, the promoters contain early and late promoter elements, for example, the
vaccinia virus early/late promoter p7.5, vaccinia late promoter p i 1, a synthetic
early/late vaccinia pE/L promoter (Patel et al. (1988) Proc. Natl. Acad. Sci. USA 85,
9431-9435); Davison and Moss (1989) J MoI Biol 210, 749-769; Davison et al.,
(1990), Nucleic Acids Res. 18, 4285-4286; Chakrabarti et al. (1997) BioTechniques
23, 1094-1097. In exemplary examples, an inducible promoter system can include a
chimeric transcription factor containing a progesterone receptor fused to the yeast
GAL4 DNA-binding domain and to the activation domain of the herpes simplex virus
protein VP 16, and a synthetic promoter containing a series of GAL4 recognition
sequences upstream of the adenovirus major late ElB TATA box, linked to one or
more exogenous genes. In such a system, administration of RU486 to a subject can
result in induction of the therapeutic agent.

D. HOST CELLS
Provided herein are host cells that contain a therapeutic virus. Such host cells
can include any of a variety of mammalian, avian and insect cells and tissues that are
susceptible to viruses. Examples of cells can include, for example, but not limited to,
PANC-I (pancreatic carcinoma), MIA PaCa-2 (pancreatic carcinoma), GI-IOlA
(breast cancer), SiHa (cervical cancer), NCI-H 1299 (lung carcinoma), HT-29 (colon
adenocarcinoma), HeLa (cervical cancer), CCRF-CEM (leukemia), HL-60
(leukemia), P388 (leukemia), P388/ADR (leukemia), KGIa (leukemia), THP-I
(leukemia), K-562 (leukemia), MOLT-4 (leukemia), RPMI-8226 (leukemia), SR
(leukemia), A549 (ATCC) (non-small cell lung cancer), EKVX (non-small cell lung
cancer), HOP-62 (non-small cell lung cancer), HOP-92 (non-small cell lung cancer),
NCI-H226 (non-small cell lung cancer), NCI-H23 (non-small cell lung cancer), NCI-
H322M (non-small cell lung cancer), NCI-H460 (non-small cell lung cancer), NCI-
H522 (non-small cell lung cancer), LXFL 529 (non-small cell lung cancer), DMS 114
(small cell lung cancer), SHP-77 (small cell lung cancer), COLO 205 (colon cancer),
HCC-2998 (colon cancer), HCT-1 16 (colon cancer), HCT- 15 (colon cancer), KM 12
(colon cancer), SW-620 (colon cancer), DLD-I (colon cancer), KM20L2 (colon
cancer), SF-268 (central nervous system), SNB-78 (central nervous system), XF 498
(central nervous system), SF-295 (central nervous system), SF-539 (central nervous
system), SNB- 19 (central nervous system), SNB-75 (central nervous system), U251
(central nervous system), LOX IMVI (melanoma), RPMI-7951 (melanoma), M19-
MEL (melanoma), MALME-3M (melanoma), M l 4 (melanoma), SK-MEL-2
(melanoma), SK-MEL-28 (melanoma), SK-MEL-5 (melanoma), UACC-257
(melanoma), UACC-62 (melanoma), IGR-OVl (ovarian cancer), OVCAR-3 (ovarian
cancer), OVCAR-4 (ovarian cancer), OVCAR-5 (ovarian cancer), OVCAR-8 (ovarian
cancer), SK-OV-3 (ovarian cancer), 786-0 (renal cancer), A498 (renal cancer), RXF-
631 (renal cancer), SN12K1 (renal cancer), ACHN (renal cancer), CAKI-I (renal
cancer), RXF 393 (renal cancer), SNl 2C (renal cancer), TK-IO (renal cancer), UO-31
(renal cancer), PC-3 (prostate cancer), DU-1 45 (prostate cancer), MCF7 (breast
cancer), MDA-MB-468 (breast cancer), NCI/ADR-RES (breast cancer), MDA-MB-
231 (ATCC) (breast cancer), MDA-N (breast cancer), BT-549 (breast cancer), T-47D

(breast cancer), HS 578T (breast cancer), and MDA-MB-435 (breast cancer).
Additional examples of tumor cells can be found in the art and are publicly available,
such as for example the National Cancer Insitute Respository of Cancer cell lines.
Methods of transforming these host cells and selecting for transformants are well
known in the art.
The tumor cells can be from solid tumors or hematopoietic neoplasms, and
from any cell lineage. For example, the tumor cells can be of epithelial origin
(carcinomas), arise in the connective tissue (sarcomas), or arise from specialized cells
such as melanocytes (melanomas), lymphoid cells (lymphomas), myeloid cells
(myelomas), brain cells (gliomas), mesothelial cells (mesotheliomas) or any other cell
type. Furthermore, the neoplastic cells can be derived from primary tumors or
metastatic tumors.
1. Harvesting tumor cells from patient
In some examples, where primary tumor cells are assayed in the methods
provided herein, the initial step in the assay involves isolation of tumor cells from a
subject, such as a patient that has cancer. This can be performed before, during, or
after the patient has undergone one or more rounds of radiation and/or chemotherapy
treatment. When the tumor is a solid tumor, isolation of tumor cells is typically
achieved by surgical biopsy. When the cancer is a hematopoietic neoplasm, tumor
cells can be harvested by methods including, but not limited to, bone marrow biopsy,
needle biopsy, such as of the spleen or lymph nodes, and blood sampling. Biopsy
techniques that can be used to harvest tumor cells from a patient include, but are not
limited to, needle biopsy, aspiration biopsy, endoscopic biopsy, incisional biopsy,
excisional biopsy, punch biopsy, shave biopsy, skin biopsy, bone marrow biopsy, and
the Loop Electrosurgical Excision Procedure (LEEP). Typically, a non-necrotic,
sterile biopsy or specimen is obtained that is greater than 100 mg, but which can be
smaller, such as less than 100 mg, 50 mg or less, 10 mg or less or 5 mg or less; or
larger, such as more than 100 mg, 200 mg or more, or 500 mg or more, 1 gm or more,
2 gm or more, 3 gm or more, 4 gm or more or 5 gm or more. The sample size to be
extracted for the assay can depend on a number of factors including, but not limited
to, the number of assays to be performed, the health of the tissue sample, the type of

cancer, and the condition of the patient. The tumor tissue is placed in a sterile
vessel, such as a sterile tube or culture plate, and can be optionally immersed in an
appropriate media. Typically, the tumor cells are dissociated into cell suspensions by
mechanical means and/or enzymatic treatment as is well known in the art. In some
examples, the cells from a tumor tissue sample can be subjected to a method to enrich
for the tumor cells, such as by cell sorting (e.g. fluorescence activated cell sorting
(FACS)).
Once harvested, the tumor cells can be used immediately, or can be stored
under appropriate conditions, such as in a cryoprotectant at -1960C. In some
examples, the cells are maintained or grown in appropriate media under the
appropriate conditions (e.g., 370C in 5% CO2) to facilitate attachment of the cells to
the surface of the culture plate and, in some instances, formation of a monolayer. Any
media useful in culturing cells can be used, and media and growth conditions are well
known in the art (see e.g., U.S. Pat. Nos. 4,423,145, 5,605,822, and 6,261,795, and
Culture of Human Tumor Cells (2004) Eds. Pfragner and Freshney). In some
examples, the culture methods used are designed to inhibit the growth of non-tumor
cells, such as fibroblasts. For example, the tumor cells can be maintained in culture as
multicellular particulates until a monolayer is established (U.S. Pat. No. 7,1 12,415),
or the cells can be cultured in plates containing two layers of different percentage agar
(U.S. Pat. No. 6,261,705). The tumor cells can be grown to the desired level, such as
for example, a confluent monolayer, or a monolayer displaying a certain percentage
confluency, such as 30% or more, 40% or more, 50% or more, 60% or more, 70% or
more, 80% ore more, or 90% or more. In some examples, the cells are incubated for a
short period of time, long enough to facilitate attachment to the culture plate, dish or
flask. In still further examples, the cells are added to the culture dish in appropriate
media and, optionally, either allowed to settle to the bottom of the culture dish by
gravity, or forced to the bottom by, for example, centrifugation, and the assay is then
continued without any substantial incubation or growth. Other examples can use cells
in suspension.
E. PHARMACEUTICAL COMPOSITIONS
Provided herein are pharmaceutical compositions that contain a therapeutic
virus and a suitable pharmaceutical carrier. The virus can be any of the viruses
described herein. The pharmaceutical compositions can contain an additional
therapeutic agent, such as an anticancer agent. Exemplary anticancer agents are
provided elsewhere herein.
Examples of suitable pharmaceutical carriers are known in the art and include
phosphate buffered saline solutions, water, emulsions, such as oil/water emulsions,
various types of wetting agents, sterile solutions. Such carriers can be formulated by
conventional methods and can be administered to the subject at a suitable dose.
Colloidal dispersion systems that can be used for delivery of viruses include
macromolecule complexes, nanocapsules, microspheres, beads and lipid-based
systems including oil-in-water emulsions (mixed), micelles, liposomes and lipoplexes.
An exemplary colloidal system is a liposome. Organ-specific or cell-specific
liposomes can be used in order to achieve delivery only to the desired tissue. The
targeting of liposomes can be carried out by the person skilled in the art by applying
commonly known methods. This targeting includes passive targeting (utilizing the
natural tendency of the liposomes to distribute to cells of the RES in organs which
contain sinusoidal capillaries) or active targeting (for example by coupling the
liposome to a specific ligand, for example, an antibody, a receptor, sugar, glycolipid,
protein etc., by well known methods). In the present methods, monoclonal antibodies
can be used to target liposomes to specific tissues, for example, tumor tissue, via
specific cell-surface ligands.
In some examples, the pharmaceutical composition can contain a therapeutic
agent that increases the level of expression of a protein whose level of expression is
increased in cells that respond favorably to viral therapy. In other examples, the
pharmaceutical compound can contain a therapeutic agent that decreases the level of
expression of a protein whose level of expression is decreased in cells that respond
favorably to viral therapy. Such therapeutic agents can include proteins and/or
nucleic acids. In certain examples, the therapeutic agent can include a chemical
compound, a protein, a nucleic acid encoding a protein, a nucleic acid encoding an

antisense nucleic acid, a nucleic acid encoding a siRNA, or a nucleic acid encoding a
ribozyme.
In some examples, antisense nucleic acids described herein can be synthesized
so as to increase their stability under in vivo conditions. Such antisense nucleic acids
typically include one or more chemical modifications to the nucleic acid backbone,
bases and/or sugar moieties. For example, such nucleic acids are those in having
internucleotide phosphate residues with methylphosphonates, phosphorothioates,
phosphoramidates, and phosphate esters. Nonphosphate internucleotide analogs such
as siloxane bridges, carbonate brides, thioester bridges, as well as many others known
in the art can also be used in modified nucleic acids.
Modified nucleic acids also can contain α-anomeric nucleotide units and
modified nucleotides such as 1,2-dideoxy-d-ribofuranose, 1,2-dideoxy-l-
phenylribofuranose, and N4, N4-ethano-5-methyl-cytosine are contemplated for use in
the methods and compositions herein. Modified nucleic acids can also be peptide
nucleic acids in which the entire deoxyribose-phosphate backbone has been exchanged
with a chemically completely different, but structurally homologous, polyamide
(peptide) backbone containing 2-aminoethyl glycine units.
In certain examples, one can employ antisense constructs which include other
elements, for example, those which include C-5 propyne pyrimidines.
Oligonucleotides which contain C-5 propyne analogues of uridine and cytidine have
been shown to bind RNA with high affinity and to be potent antisense inhibitors of
gene expression.
In other examples, siRNA and ribozymes can be used and applied in much the
same way as described for antisense nucleic acids.
F . METHODS OF ADMINISTERING VIRAL THERAPY
Also provided herein are methods and compositions that relate to
administering viral therapy to a subject. Such therapeutic methods can include one or
more steps.
In some examples, administering viral therapy can include administering a
pharmaceutical composition containing a therapeutic virus to a subject. The virus can
be any of the viruses described herein. Pharmaceutical compositions include those
described herein. Routes of administering viral therapy can include parenteral, e.g.,
intravenous, intradermal, subcutaneous, oral {e.g., inhalation), transdermal (topical),
transmucosal, and rectal administration.
In some examples, administering viral therapy can include administering more
than one therapeutic virus to a subject. In such examples, each virus can have
synergistic features for viral therapy. For example, a first therapeutic virus can be co¬
administered with a second virus encoding a therapeutic agent.
In some examples, administering viral therapy can include co-administering a
therapeutic virus with a therapeutic agent to the subject. Therapeutic agents can
include chemical compounds, proteins and/or nucleic acids. In certain examples, the
therapeutic agent can include a protein, a nucleic acid encoding a protein, a nucleic
acid encoding an antisense nucleic acid, a nucleic acid encoding a siRNA, or a nucleic
acid encoding a ribozyme. Therapeutic agents can be co-administered to a subject at
the same time as a therapeutic virus, or at a different time. Therapeutic agents can be
administered as pharmaceutical compositions according to the methods provided
herein. Exemplary therapeutic agents are provided elsewhere herein.
1. Monitoring the progress of viral therapy
Provided herein are methods of monitoring the progress of viral therapy in a
subject. Such methods of monitoring can include determining whether the expression
of at least one marker is altered in a biological sample, such as a tumor sample, from
the subject obtained at a plurality of time points.
In some examples, methods to monitor the progress of viral therapy can
include one or more steps. For example, the method can include obtaining a
biological sample, such as a biopsy of a tumor, from a subject; measuring the level of
expression of at least one marker in a first biological sample at a first time point;
obtaining a second biological sample from a subject; measuring the level of
expression in the same at least one marker in the second biological sample at a second
time point; and determining whether the level of expression of the at least one marker
has increased, decreased or remained substantially the same during the interval
between the first and second time points.

In some examples, the level of expression of at least one marker can be
measured in a first biological sample, such as a tumor sample, at a first time point.
The first time point can be before viral therapy is administered, at the time viral
therapy is administered, or during viral therapy. In further examples, the level of
expression of at least one marker can be measured in the second biological sample,
such as a second tumor sample, at least a second time point. The time between the
first time point and the at least second time point can be about 30 minutes, about 1
hour, about 6 hours about 12 hours, about 1 day, about 2 days, about 3 days, about 4
days, about 5 days, about 6 days, about 7 days, about 8 days, about 9 days, about 10
days, about 11 days, about 12 days, about 13 days, about 14 days, about 2 weeks,
about 3 weeks, about 4 weeks, and about 1 month.
In certain examples, the first biological sample can be obtained from the same
anatomical site as the second biological sample.
In some examples, the marker can be a protein whose level of expression is
increased in cells that respond favorably to viral therapy, a protein whose level of
expression is decreased in cells that respond favorably to viral therapy, or a protein
whose level of expression is substantially the same in cells that respond favorably to
viral therapy.
In some examples, the at least one marker can be selected from among the
markers listed in Table 1, Table 2 and Table 3. In some examples, the at least one
marker encompasses a plurality of markers selected from among the markers listed in
Table 1, Table 2, and Table 3. In some examples, the expression of at least 1, at least
5, at least 10, at least 15, or at least 20 markers can be selected from among the
markers listed in Table 1, Table 2 and Table 3 can be determined. In some examples,
the expression level of all the markers in Table 1, Table 2, and Table 3 can be
determined. In other examples, the at least one marker can be a marker identified by
methods described herein.
In some examples, the marker can be a host protein whose level of expression
is increased a tumor that is responding favorably to viral therapy, a host protein whose
level of expression is decreased in cells that respond favorably to viral therapy, or a
host protein whose level of expression is substantially the same in cells that respond

favorably to viral therapy. Such proteins are produced by the host (not the tumor
cells themselves), but are found within a tumor tissue sample.
In some examples, measuring the level of expression of at least one marker
can be carried out using methods well known in the art. For protein levels, examples
of methods can include, but are not limited to microarray analysis, ELISA assays,
Western blotting, or any other technique for the quantitation of specific proteins. For
RNA levels, examples of techniques include microarray analysis, quantative PCR,
Northern hybridization, or any other technique for the quantitation of specific nucleic
acids.
In some examples, the step of determining whether the level expression of the
at least one selected marker in a first biological sample, such as a tumor sample,
contacted with a therapeutic virus has decreased, increased, or remained substantially
the same, as compared to the expression of the same at least one selected marker in a
second biological sample, such as a second tumor sample, can be performed by
comparing quantitative or semi-quantitative results obtained from the measuring step.
In some examples, the difference in expression of the same selected marker between
the first biological sample and the second biological sample can be about less than 2-
fold, about 2-fold, about 3-fold, about 4-fold, about 5-fold, about 6-fold, about 7-fold,
about 8-fold, about 9-fold, about 10-fold, about 20-fold, about 30-fold, about 40-fold,
about 50-fold, about 60-fold, about 70-fold, about 80-fold, about 90-fold, about 100-
fold or greater than about 100-fold.
In those examples where the at least one marker is selected from Table 1, an
increase in expression of the selected marker in second biological sample as compared
to expression of the same marker in a first biological sample can indicate that the
subject is responding favorably to viral therapy. Conversely, no increase can indicate
that the subject is responding poorly to viral therapy. In those examples where the at
least one marker is selected from Table 2, a decrease in expression of the selected
marker in a second biological sample as compared to expression of the same marker
in a first biological sample can indicate that the subject is responding favorably to
viral therapy. Conversely, no decrease in expression of the selected marker can
indicate that the subject is responding poorly to viral therapy. In those examples

where the at least one marker is selected from Table 3, no substantial change in the
level of expression of the selected marker in a second biological sample as compared
to expression of the same marker in a first biological sample can indicate that the
subject is responding favorably to viral therapy. In such examples, evidence of a
subject's favorable or poor response to viral therapy can be corroborated by
measuring the level of expression of markers from Table 1 and Table 2, respectively.
In some examples, a subject's response to viral therapy can be used to
determine whether viral therapy is effective and as a basis for further therapeutic
decisions, for example, whether to modify viral therapy, to continue viral therapy, or
to administer alternative therapy.
In examples where the subject responds poorly to viral therapy containing a
first therapeutic virus, the subject can be re-assessed to determine whether it is likely
to respond favorable or poorly to a second therapeutic virus using the methods
described herein.
G. IDENTIFYING MARKERS ASSOCIATEDWITH A RESPONSE TO VIRAL THERAPY
Provided herein are methods of identifying markers associated with a
favorable or poor response to viral therapy. Such methods can include determining
whether the level of expression of a candidate marker is altered by contact with a
therapeutic virus in a cell in which a therapeutic virus replicates well or poorly.
In some examples, methods to identify a marker associated with a subject's
response to viral therapy can include one or more steps. Such steps can include
comparing the level of expression of a candidate marker in a cell contacted with the
virus to the level of expression of the candidate marker in a cell which has not been
contacted with the virus.
In some examples, a single biological sample is obtained and divided into two
test samples. One test sample is not contacted with the virus, while the other test
sample is contacted with the virus. The level of expression of the candidate marker in
the two test samples is compared.
In some examples, the cell can contain a cell known to respond favorably to
viral therapy vectors or a cell which permits good viral replication. In some
examples, the cell can be from a cell-line. Cell-lines that respond favorably or poorly

to viral therapy vectors are described herein. The virus can be any virus described
herein. Examples of cell-lines known to respond favorably viral therapy vectors can
include, but are not limited to PANC-I, MIA PaCa-2, A549, OVCAR-3 and GI-101A,
A549, DU145, MEL-888 and MEL-1 858.
In other examples, the cell can be a cell known to respond poorly to viral
therapy or to permit a poor level of viral replication. Examples of cell-lines known to
respond poorly to viral therapy vectors can include, but are not limited to, PC-3, SiHa,
NCI-H1299, MDA-MB-23, MEL-1936 and HT-29.
Any therapeutic virus described herein can be used in conjunction with the
methods to identify markers associated with a biological sample's response to viral
therapy, such an anti tumor response. In some examples, the virus can be a virus
which is known to be effective in viral therapy. For example, in some examples the
virus contains the GLV-lh68 virus. The GLV-lh68 virus is described in U.S. Patent
Application No. 10/872,156.
In some examples, methods of identifying a candidate marker include
culturing the cells before measuring the level of expression of the candidate marker.
The cells can be cultured in vitro according to methods known in the art.
Alternatively, the cells can be cultured in vivo. In such methods, the cells can be
implanted subcutaneously into an organism, such as a nude mouse. Where the cells
are cultured in vivo, the expression levels of markers in the implanted cells or in the
tissues of the host organism can be measured.
The cells contacted with the therapeutic virus can be cultured for a period of
time sufficient to detect a response to the virus. In some examples, the period of time
can be determined by the sensitivity of the method used to measure the level of
expression of at least one marker. For example, the cells contacted with the
therapeutic virus can be cultured for about 30 minutes, about 1 hour, about 6 hours
about 12 hours, about 1 day, about 2 days, about 3 days, about 4 days, about 5 days,
about 6 days, about 7 days, about 8 days, about 9 days, about 10 days, about 11 days,
about 12 days, about 13 days, about 14 days, about 2 weeks, about 3 weeks, about 4
weeks, and about 1 month.

The level of expression of the candidate marker can be measured using
methods well known in the art. For example, for RNA, techniques such as microarray
analysis, Quantative PCR, Northern hybridization, or any other technique for the
quantitation of specific nucleic acids can be used. For a protein marker, methods such
as microarray analysis, ELISA assays, Western blotting, or any other technique for
the quantitation of specific proteins can be used to measure the expression of a
candidate protein marker can be used.
In some examples of the methods for identifying a marker associated with a
favorable or poor response to viral therapy described herein, the step of determining
whether the level expression of the candidate marker in cells contacted with a
therapeutic virus has decreased, increased, or remained substantially the same, as
compared to the expression of the candidate marker in non-contacted cells can be
performed by comparing quantitative or semi-quantitative results. In some examples,
the difference in expression of the candidate marker between the contacted and non-
contacted cells can be about less than 2-fold, about 2-fold, about 3-fold, about 4-fold,
about 5-fold, about 6-fold, about 7-fold, about 8-fold, about 9-fold, about 10-fold,
about 20-fold, about 30-fold, about 40-fold, about 50-fold, about 60-fold, about 70-
fold, about 80-fold, about 90-fold, about 100-fold or greater than about 100-fold.
H. IDENTIFYING A VIRUS FOR VIRAL THERAPY
Also provided herein are methods of identifying a candidate virus for viral
therapy. Such methods can include assessing whether a candidate virus is likely to be
effective in viral therapy, and in particular, whether the candidate virus alters the level
of expression of at least one marker in a cell contacted with the candidate virus. In
some examples, the cell can be a cell which is known to be responsive to viral therapy
vectors. If the expression of the at least one marker is altered by the candidate virus
in a manner associated with a favorable response to viral therapy vectors, the
candidate virus is likely to be successful as a viral therapy vector.
In certain examples, methods to identify a candidate virus for viral therapy can
include one or more steps. Such steps can include measuring the level of expression
of at least one marker in a first cell; measuring the level of expression in the same at
least one marker in a second cell contacted with the candidate virus; and determining

whether the level of expression of the at least one marker has increased, decreased or
remained substantially the same in response to contacting the biological sample, such
as a tumor sample, with the candidate virus.
In some examples, at least one marker can be selected from among the
proteins listed in Table 1, Table 2 and Table 3. In some examples, at least one marker
encompasses a plurality of markers selected from among the proteins listed in Table
1, Table 2, and Table 3. In some examples, at least 1, at least 5, at least 10, at least
15, at least 20 markers can be selected from among the proteins listed in Table 1,
Table 2 and Table 3. In some examples, at least one marker selected for the
determining step includes all the proteins listed in Table 1, Table 2, and Table 3. In
other examples, at least one marker can be a protein identified by methods described
herein.
In some examples, the cell can be a cell known to respond favorably to viral
therapy vectors. Cell-lines that respond favorably or poorly to viral therapy vectors
also are described in U.S. Provisional Patent Application Attorney Docket No. 117
"Systems and Methods for Viral Therapy" filed on October 25, 2007 and November
14, 2007. Examples of cell-lines known to respond favorably to the viral therapy
vectors can include, but are not limited to, PANC-I, MIA PaCa-2, A549, OVCAR-3
and GI-101A, A549, DU145, MEL-888 and MEL-1 858.
Any therapeutic virus described herein can be used in conjunction with the
methods to identify a virus for use in viral therapy.
In some examples, the cells can be cultured in vitro according to methods
known in the art. Alternatively, the cells can be cultured in vivo. In such methods,
the cells can be implanted subcutaneously into an organism, such as a nude mouse.
Where the cells are cultured in vivo, the level of expression of host markers in
response to the candidate virus can be determined.
The cells contacted with the candidate virus can be cultured for a period of
time sufficient to detect a response to the virus. In some examples, the period of time
can be determined by the sensitivity of the method used to measure the level of
expression of at least one marker. For example, the cells contacted with the
therapeutic virus can be cultured f for about 30 minutes, about 1 hour, about 6 hours

about 12 hours, about 1 day, about 2 days, about 3 days, about 4 days, about 5 days,
about 6 days, about 7 days, about 8 days, about 9 days, about 10 days, about 11 days,
about 12 days, about 13 days, about 14 days, about 2 weeks, about 3 weeks, about 4
weeks, and about 1 month.
The level of expression of the candidate marker can be measured using
methods well known in the art. For example, for RNA, techniques such as microarray
analysis, Quantative PCR, Northern hybridization, or any other technique for the
quantitation of specific nucleic acids can be used. For a protein marker, methods
include microarray analysis, ELISA assays, Western blotting, or any other technique
for the quantitation of specific proteins can be used to measure the expression of a
candidate protein marker.
In some examples of the methods for assessing whether a candidate virus is
likely to be effective in viral therapy described herein, the step of determining
whether the level expression of the at least one selected marker in a cell contacted
with the candidate virus has decreased, increased, or remained substantially the same,
as compared to the expression of the same at least one selected marker in a non-
contacted cell can be performed by comparing quantitative or semi-quantitative
measurements of the expression levels on the at least one marker. In some examples,
the difference in expression of the same selected marker between the contacted and
non-contacted cells can be about less than 2-fold, about 2-fold, about 3-fold, about 4-
fold, about 5-fold, about 6-fold, about 7-fold, about 8-fold, about 9-fold, about 10-
fold, about 20-fold, about 30-fold, about 40-fold, about 50-fold, about 60-fold, about
70-fold, about 80-fold, about 90-fold, about 100-fold or greater than about 100-fold.
In those examples where the at least one marker is selected from the markers
listed in Table 1, an increase in expression of the selected marker in contacted cells as
compared to expression of the same marker in a non-contacted cells can indicate that
the candidate virus is likely to be effective for viral therapy. Conversely, no increase
can indicate that the candidate virus is likely to be less effective for viral therapy. In
those examples where the at least one marker is selected from the markers listed in
Table 2, a decrease in expression of the selected marker in contacted cells as
compared to expression of the same marker in non-contacted cells can indicate that

candidate virus is likely to be effective for viral therapy. Conversely, no decrease
can indicate that the candidate virus is likely to be less effective for viral therapy. In
those examples where the at least one marker is selected from the markers listed in
Table 3, no substantial change in the level of expression of the selected marker in a
contacted cell as compared to expression of the same marker in non-contacted cells
can indicate that the candidate virus is likely to be effective for viral therapy. In such
examples where the at least one marker is selected from among the markers listed in
Table 3, if desired, evidence of whether a candidate virus is likely to be effective for
viral therapy can be corroborated by measuring the level of expression of markers one
or more markers from Table 1 and Table 2.
I. ARTICLES OF MANUFACTURE AND KITS
Also provided herein are kits. Kits can contain reagents, devices or
instructions for use thereof. A kit can contain a variety of components. Components
can include reagents to measure the expression level of at least one marker associated
with a favorable or a poor response to viral therapy; at least one therapeutic virus; a
therapeutic agent; a pharmaceutical composition; a reagent or device to administer
viral therapy; a host cell containing a therapeutic virus; a reagent or device to obtain a
biological sample; or reagents to measure the presence of a therapeutic virus in a
subject.
In some examples, a kit can contain reagents to measure the expression level
of one or more markers associated with a favorable and/or poor response to viral
therapy. Such kits can contain means for, or components for measuring particular
protein levels in a biological sample, such as, monoclonal antibodies specific to a
particular protein; or a means or component for measuring particular mRNA levels in
a biological sample, such as, nucleic acid probes specific for RNA encoding the
marker.
In some examples, a kit can contain at least one therapeutic virus. In some
kits, a plurality of viruses designed for viral therapy can be supplied. Such kits can be
provided to determine whether a subject responds favorably to any virus of the kit.
In one example, a kit can contain instructions. Instructions typically include a
tangible expression describing the virus and, optionally, other components included in

the kit, and methods for administration, including methods for determining the health
status of the subject, the proper dosage amount, and the proper administration method,
for administering the virus. Instructions can also include guidance for monitoring the
progress of the subject over the duration of the treatment time.
In some examples, a kit can include a device for administering a virus to a
subject. Any of a variety of devices known in the art for administering medications or
vaccines can be included in the kits provided herein. Exemplary devices include a
hypodermic needle, an intravenous needle, a catheter, a needle-less injection device,
an inhaler, and a liquid dispenser such as an eyedropper. Typically, the device for
administering a virus of the kit will be compatible with the virus of the kit; for
example, a needle-less injection device such as a high pressure injection device can be
included in kits with viruses not damaged by high pressure injection, but is typically
not included in kits with viruses damaged by high pressure injection.
In some examples, a kit can include a device for administering a therapeutic
agent to a subject. Any of a variety of devices known in the art for administering
medications to a subject can be included in the kits provided herein. Exemplary
devices include a hypodermic needle, an intravenous needle, a catheter, a needle-less
injection device, an inhaler, and a liquid dispenser. Typically the device for
administering the therapeutic agent will be compatible with the desired method of
administration of the therapeutic agent. For example, a therapeutic agent to be
delivered subcutaneously can be included in a kit with a hypodermic needle and
syringe.
J . EXAMPLES
The following examples are included for illustrative purposes only and are not
intended to limit the scope of the invention.
Example 1
Construction of Viruses for use in Anti-cancer Efficacy Assays
Viruses for use in exemplary assays to assess the efficacy of viruses for anti¬
cancer treatment were generated by modification of the vaccinia virus strain
designated LIVP (a vaccinia virus strain, originally derived by adapting the Lister
strain (ATCC Catalog No. VR-1 549) to calf skin (Institute for Research on Virus

Preparations, Moscow, Russia, Al'tshtein et al. (1983) Dokl. Akad. Nauk USSR
285:696-699). The LIVP strain (whose genome sequence is set forth in SEQ ID NO:
1) from which the viral strains were generated contains a mutation in the coding
sequence of the thymidine kinase (TK) gene in which a substitution of a guanine
nucleotide with a thymidine nucleotide (nucleotide position 80207 of SEQ ID NO: 1)
introduces a premature STOP codon within the coding sequence. The LIVP strain
was further modified to generate the GLV-lh68 virus (SEQ ID NO: 2; U.S. Patent
Publication No. 2005-0031643 and Japanese Patent No. 3,934,673).
As described in U.S. Patent Publication No. 2005/0031643 and Japanese
Patent No. 3,934,673 (see particularly Example 1 in each application), GLV-lh68 was
generated by inserting expression cassettes encoding detectable marker proteins into
the F14.5L (also designated in LIVP as F3) gene, thymidine kinase (TK) gene, and
hemagglutinin (HA) gene loci of the vaccinia virus LIVP strain. All cloning steps
were performed using vaccinia DNA homology-based shuttle plasmids generated for
homologous recombination of foreign genes into target loci in the vaccinia virus
genome through double reciprocal crossover (see Timiryasova et al. (2001)
BioTechniques 31(3) 534-540). As described in U.S. Patent Publication -
2005/0031643 and Japanese Patent No. 3,934,673, the GLV-lh68 virus was
constructed using plasmids pSC65 (Chakrabarti et al. (1997) Biotechniques 23:1094-
1097) and pVY6 (Flexner et al. (1988) Virology 166:339-349) to direct insertions into
the TK and HA loci of LIVP genome, respectively. Recombinant viruses were
generated by transformation of shuttle plasmid vectors using the FuGENE 6
transfection reagent (Roche Applied Science, Indianapolis, IN) into CV-I cells
(ATCC Cat No. CRl-1469), which were pre-infected with the LIVP parental virus, or
one of its recombinant derivatives.
The expression cassettes were inserted in the LIVP genome in three separate
rounds of recombinant virus production. In the first round, an expression cassette
containing a Ruc-GFP cDNA (a fusion of DNA encoding Renilla luciferase and DNA
encoding GFP) under the control of a vaccinia synthetic early/late promoter PSEL was
inserted into the Not I site of the F14.5L gene locus. In the second round, the
resulting recombinant virus from the first round was further modified by insertion of

an expression cassette containing DNA encoding beta-galactosidase (LacZ) under
the control of the vaccinia early/late promoter P7 5k (denoted (P7.5k)/ cZ) and DNA
encoding a rat transferrin receptor positioned in the reverse orientation for
transcription relative to the vaccinia synthetic early/late promoter PSEL (denoted
(PsEt yTrfR) was inserted into the TK gene (the resulting virus does not express
transferrin receptor protein since the DNA encoding the protein is positioned in the
reverse orientation for transcription relative to the promoter in the cassette). In the
third round, the resulting recombinant virus from the second round was then further
modified by insertion of an expression cassette containing DNA encoding β-
glucuronidase under the control of the vaccinia late promoter P ]ik (denoted
( ιik)gusA) was inserted into the HA gene. The resulting virus containing all three
insertions is designated GLV-lh68. The complete sequence of GLV-lh68 is shown
in SEQ ID NO:2.
The expression of the Ruc-GFP fusion protein by the recombinant virus was
confirmed by luminescence assay and fluorescence microscopy. Expression of β-
galactosidase and /^-glucuronidase were confirmed by blue plaque formation upon
addition of 5-bromo-4-chloro-3-indolyl-j3-D-galactopyranoside (X-gal, Stratagene, La
Jolla, CA) and 5-bromo-4-chloro-3-indolyl-/3-D-glucuronic acid (X-GIcA, Research
Product International Corporation, Mt. Prospect, IL), respectively. Positive plaques
formed by recombinant virus were isolated and purified. The presence of expression
cassettes in the F14.5L, TK and HA loci were also confirmed by PCR and DNA
sequencing.
High titer viral preparations were obtained by centrifugation of viral
precipitates in sucrose gradients (Joklik WK (1962) Virol. 18:9-18). For testing
infection, CV-I ( 1 x 10⁵) and GI-101A (4 x 10⁵) cells (Dr. A. Aller, Rumbaugh-
Goodwin Institute for Cancer Research, Inc., Plantation, Florida) were seeded onto
24-well plates. After 24 hours in culture, the cells were infected with individual
viruses at a multiplicity of infection (MOI) of 0.001 . The cells were incubated at
37°C for 1 hour with brief agitation every 10 minutes to allow infection to occur. The
infection medium was removed, and cells were incubated in fresh growth medium
until cell harvest at 24, 48, 72, or 96 hours after infection. Viral particles from the

infected cells were released by a quick freeze-thaw cycle, and the titers determined
as pfu/ml of medium in duplicate by plaque assay in CV-I cell monolayers. The same
procedure was followed using a resting CV-I cell culture, which was obtained by
culturing a confluent monolayer of CV-I cells for 6 days in DMEM supplemented
with 5% FBS, before viral infection.
Example 2
Replication of GLV-lh68 vaccinia virus in different tumor cell types
Materials and Methods
Cell Lines Employed
A panel of well-characterized human cancer cell lines of different histological
derivation was employed in the studies described herein. All cell lines except noted
were purchased from American Type Culture Collection (Manassas).
MDA MB-231 (ATCC Cat No. HTB-26), PANC-I (ATCC Cat No. CRL-
1469), CV-I (ATCC Cat No. CRL-1469) and PC-3 (ATCC Cat No. CRL-1435) cells
were cultured in Dulbecco's modified Eagle's medium (DMEM) supplemented with
10% fetal bovine serum (FBS) and 1% antibiotic-antimycotic solution (AA) (100
U/ml penicillin G, 250 ng/ml amphotericin B, 100). MIA PaCa-2 (ATCC Cat No.
CRL- 1420) cells were cultured under similar conditions in DMEM media
supplemented with 12.5% FBS and 2 mM L-glutamine. SiHa (ATCC Cat No. HTB-
35) cells were cultured in Eagle's minimal essential medium (EMEM) supplemented
with 10% FBS, 1% non-essential amino acids (NEAA), 1 mM sodium pyruvate and
1% AA.
All other cells were cultured in Roswell Park Memorial Institute medium
(RPMI) supplemented with the following compounds: A549 (ATCC Cat No. CCL-
185) and HT-29 (ATCC Cat No. HTB-38) cells (10% FBS and 1% AA); GI-101A
cells (Dr. A. Aller, Rumbaugh-Goodwin Institute for Cancer Research, Inc.,
Plantation, Florida; 20% FBS, 4.5 g/L glucose, 10 mM HEPES, ImM sodium
pyruvate, 1% AA and 4 ng/ml /3-estradiol, 5 ng/ml progesterone); NCI-H 1299 (ATCC
Cat No. CRL-580) cells (10% FBS, 4.5 g/L glucose, 10 mM HEPES, 1 mM sodium
pyrucate, 1% AA); and OVCAR-3 (ATCC Cat No. HTB-161) cells (20% FBS, 2.3
g/L glucose, 10 mM HEPES, ImM sodium pyruvate, 1% AA and 4 ng/ml /3-estradiol,
5 ng/ml progesterone and human Insulin). Three additional cell lines from distinct
cutaneous melanoma metastases obtained from patient 888 (Dr. Francesco Marincola,
National Institutes of Health; Wang / . (2006) J Invest Dermatol. 126(6): 1372-7;
Sabatino, M., et al. (2008) Cancer Res 68:222-231) were included in the tests. 888-
MEL, 1858-MEL and 1936-MEL cells were cultured in RPMI supplemented with
10% FBS, 1 mM HEPES, 1 mM Ciprofloxacin and L-
glutamine/penicillin/streptomycin. All cell cultures were carried out at 37°C under 5%
CO2.
In vitro viral replication assay
The cells, described above, were seeded in 24-well plates at a density of 2-4 x
105 cells per well and were infected with GLV-lh68 at a MOI of 0.01 after 24 hours
of culture (Zhang, Q. et al. (2007) Cancer Res 67:10038-10046). The cells were
incubated at 37°C for 1 h with brief agitation every 10 min to allow infection to occur.
The infection medium was removed, and cells were incubated in fresh growth
medium until cell harvest at 24, 48 or 72 h after infection. Viral particles from the
infected cells were released by a quick freeze-thaw cycle, and the titers determined in
duplicate as pfu/ml of medium by standard plaque assay in CV-I cell monolayers.
The same procedure was followed using a resting CV-I cell culture, which was
obtained by culturing a confluent monolayer of CV-I cells for 6 days in DMEM
supplemented with 5% FBS before viral infection. Data for the average viral titers at
0, 24, 48 and 72 hours post infection is shown in Tables 5A-5L.
Table 5AViral titer values for PANC-I

Table 5BViral titer values for MIA PaCa-2
Table 5CViral titer values for A549
Table 5DViral titer values for OVCAR-3
Hours Post Average Viral Titer Standard DeviationInfection (Log pfu/106 cells) (Log pfu/106 cells)
0 4.00 0.0024 4.59 0.0648 6.12 0.3472 6.20 0.03
Table 5EViral titer values for GI-101A
Table 5FViral titer values for PC-3

Table 5GViral titer values for SiHa
Table 5HViral titer values for NCI-H1299
Table 51Viral titer values for MDA-MB-231
Table 5JViral titer values for 888-MEL
Table 5KViral titer values for 1858-MEL

Table 5LViral titer values for 1936-MEL
The cell lines were divided into groups of predicted responders and non-
responders based on the ability of the virus to exhibit significant replication within the
cells within 24 hours post infection. Cell types that exhibited an approximate 4-fold
or greater increase in viral titer over input titer were designated as in vitro responders.
Table 6 displays the fold increase in viral titer between consecutive time points.
Table 6Predicted Responders and Non-responders based on in vitro replication assays
h.p.i. = hours post viral infection
Example 3In vivo tumor regression following GLV- Ih68 vaccinia virus treatment of
different xenograft tumorsIn order to determine whether the in vitro replication profile correlated with
efficacy in vivo, each cell line was tested for sensitivity to the oncolytic activity of
systemically administered GLV-Ih68 using tumor xenograft mouse models (Sabatino,
M. et al. (2008) Cancer Res 68:222-231; Jones, CB. et al. (1997) Cancer Chemother.
Pharmacol. 40:475-483; Schultz, R.M. et al. (1993) Oncol. Res. 5:223-228; Roschke,

A.V. et al. (2003) Cancer Res. 63:8634-8647; Ahn, W.S. et al. (2005) Gene
Ontology. Int. J Gynecol. Cancer 15:94-106).
6-8 week old nude mice (NCI:Hsd:Athymic Nude-Foxni"", Harlan) were
inoculated with 5 x 10⁶ cells per mouse to obtain subcutaneous xenografts as
previously described (Zhang, Q. et al. (2007) Cancer Res 67:10038-10046). Thirty
days after tumor cell implantation, a single intravenous inoculation of 1 x 10⁶ pfu of
GLV-Ih68 virus in a final volume of 100 µl PBS or PBS only as a control was
delivered to the mice by femoral vein injection. Tumor growth was measured once a
week before and after viral infection and tumor mass was reported in mm3. After
inoculation with GLV-Ih68, the expression of green fluorescent protein (due to the
Ruc-GFP fusion protein encoded by the GLV-lh68 virus) within the tumors was also
monitored under UV-light.
Two characteristic patterns of tumor growth were identified: some tumors
progressively continued their growth independent of therapy {i.e. PC-3, HT-29; see
Tables 7A and 7B), while some exhibited three phases of growth (Zhang, Q. et al.
(2007) Cancer Res 67:10038-10046). The first phase during the first few weeks is
characterized by a slightly faster expansion in the mass of tumors receiving treatment
compared to control tumors. This initial rapid expansion may be related to an
ongoing inflammatory process. The expansion phase was followed by a plateau phase
and then by shrinkage of the tumor masses {i.e. GI-101A; see Table 7C). These
patterns were cell line-specific and highly reproducible independent of GLV-I h68
plaque forming units (PFUs) injected or cancer cells inoculated. While the kinetics of
growth and disappearance varied according to the various experimental conditions
applied (PFUs of virus administered and number of cancer cells administered), the
final outcome (tumor growth versus tumor regression) was highly reproducible for
each tumor type tested.
During the initial growth phase, fluorescent light emission from tumors non-
responding to therapy (i.e. HT-29) displayed a patchy pattern that did not significantly
differ from that of tumors eventually responding to treatment {i.e. GI-IOlA), though
the GI-101 tumor had a higher expression of the Ruc-GFP fusion protein.
Table 7AMedian tumor volumes at different time points after i.v. injection of

GLV-lh68 into nude mice bearing PC-3 tumors
Table 7BMedian tumor volumes at different time points after i.v. injection of
GLV-Ih68 into nude mice bearin HT-29 tumors
Table 7CMedian tumor volumes at different time points after i.v. injection of
GLV-lh68 into nude mice bearin GI-101A tumors

To provide a single parameter descriptive of individual cell line
responsiveness to virus therapy, a therapeutic index (T.I.) was calculated for each
tumor by integrating the areas between the median growth of control and treated
xenografts (eight animals per group) during the first 45 days of treatment. The
therapeutic index was calculated as:
therapeutic index = (A-B)/A
where A is the area under the untreated control curve, and B is the area under the
virus treatment curve, with both areas being from time of virus infection to 45 days
post virus treatment. Table 8 lists the therapeutic indices calculated for the various
xenograft tumors tested.
Table 8
Tl = Therapeutic Index
Comparison of in vitro and in vivo test results
In the in vitro replication assay, four of four cell lines that resisted virus
replication during the first 24 hours following infection (MDA MB-231, PC-3, SiHa

and NCI-H 1299) uniformly produced xenografts non-responding to vaccinia virus
(VACV) therapy in vivo. Eight out often cell lines that allowed viral replication in
the first 24 hours yielded xenografts responsive to vaccinia virus treatment in vivo,
while two cell lines (HT-29 and 1936-MEL) yielded xenografts that did not respond
to virus treatment. Notwithstanding the two outliers, the relationship between the
permissivity of a given cell line to in vitro replication rate of GLV-I h68 and the in
vivo responsiveness of the corresponding xenograft was statistically significant
(Fisher exact test p2-value = 0.005).
The difference in responder versus non-responder cell lines was not limited to
particular cell lines of diverse ontogeny. 888-MEL and 1936-MEL, two autologous
melanoma cell lines, exhibited differences in in vivo responsiveness to vims
treatment, though they displayed the same degree of permissivity in vitro to GLV-
Ih68 replication. 888-MEL and 1936-MEL are derived from the same ancestral
progenitor though established from two distinct melanoma metastases (Sabatino, M.
et al. (2008) Cancer Res 68:222-23 1; Wang, E. et al. (2006) J Invest Dermatol
126:1372-1377). The first cell line (888-MEL) was removed in 1989 during earlier
stages of disease at a time when the patient underwent a complete remission of all
metastatic disease following adoptive transfer of tumor infiltrating lymphocytes; the
second (1936-MEL), was expanded 12 years later from a metastasis excised at a time
when the patient had rapidly progressing disease and did not respond to further
therapy. The early cell line was highly sensitive to treatment (T.I. = 88.0) and was
completely eradicated by the oncolytic virus administration while the later cell line
1936-MEL was completely resistant (T.I. = 13.7), continuing its growth with identical
kinetics between treated and untreated animals. These data suggest that
responsiveness is related to biological characteristics of the tumors independent of
their ontogeny and is more likely related to evolving phenotypic alterations occurring
during the natural history of the disease.
Example 4
In vivo viral replication in Responder versus Poor/Non-responder tumor types
To further investigate the reasons for the lack of in vivo responsiveness of
xenografts derived by distinct cell lines, the in vivo behavior of three cell lines (GI-

101 A, HT-29 and PC-3), which demonstrated different and representative patterns of
in vitro permissivity to GLV-Ih68 replication and in vivo outcomes, was examined.
Although viral replication in vivo was similar in the growth phase of GI-101A and
HT-29 xenografts and comparable light emitting properties were observed, viral titer
studies showed that viral replication was delayed in vivo in HT-29 xenografts as they
continued their growth while it remained elevated in the regressing GI-101A
xenografts.
Table 9 shows the in vivo viral titers (PFU/gram of xenograft) as an average of
eight individual experiments for each treatment group comparing the permissivity of
three xenografts derived from GI-101A colorectal cancer, HT-29 breast cancer and
PC-3 prostate adenocarcinoma tumors. A dichotomy was observed between
responding and non-responding xenografts equally permissive to GLV-Ih68 in vitro
but not in vivo. Moreover, PC-3 xenografts, in spite of delaying in vitro replication of
vaccinia virus, allowed replication in vivo of GLV-I h68 at a rate similar to HT-29 at
day 2 1 and intermediate between HT-29 and GI-101A at day 42. In view of the
replication and tumor regression data described above, delayed replication in vivo or
in vitro appeared to decrease the likelihood of tumor regression while tumor
regression was associated with effective viral replication in vitro and in vivo.
Table 9Virus re lication in vivo
Example 5
Viral infectivity of various tumor cell lines
To determine whether the results obtained in the in vitro viral replication assay
and/or in vivo tumor regression study were affected by the ability of vaccinia virus to
infect the tumor cells, a test for viral infectivity of three vaccinia viruses (GLV-lh68,
LIVP and Western Reserve Strain WR) was performed. Cells were plated in 24 well
plates at a density of 2 x 10⁵ cells/well (A549, HT-29, MIA PaCa-2, GI-101A, PANC-

1, OVCAR-3, SiHa, NCI-H 1299 and MDA MB-231) or 3 x 10⁵ cells/well (PC-3 and
DU-145, ATCC Catalog No. HTB-81). Cells were infected in duplicate or triplicate
with 1 x 10⁵, 1 x 10⁶, 1 x 10⁷, 5 x 10⁷ dilutions of each virus (GLV- Ih68, LIVP or
WR) for Ih and then overlayed with 1 ml of corresponding cell medium. Viral titer
was then determined by crystal violet staining (plaque assay). The infectivity of the
various tumor cell lines tested is shown in Table 10. The results show that the degree
of viral infectivity does not correlate with the efficacy of the virus to cause tumor
regression or replicate within the tumor cell.
Table 10Viral infectivit of various tumor cell lines
Example 6
Microarray Analysis of in vivo and in vitro gene expression in Responder versus
Poor/Non-responder tumor types
The comparison between in vitro and/or in vivo virus replication patterns and
in vivo regression of different cell lines exposed to GLV-lh68 suggested a complex
relationship between vaccinia virus, cancer cells and the host. To further examine
these relationships, the gene expression patterns of vaccinia virus, human cancer cells
and mouse host cells in responding and non-responding xenografts excised at times
relevant to the kinetics of their response were examined. Transcriptional profiling
was achieved though the use of organism-specific microarray platforms.
Preparation of test samples
In vivo tumor samples from virus treated and untreated tumors were prepared
for microarray analysis. Tumor xenograft models for GI-IOlA breast carcinoma, HT-
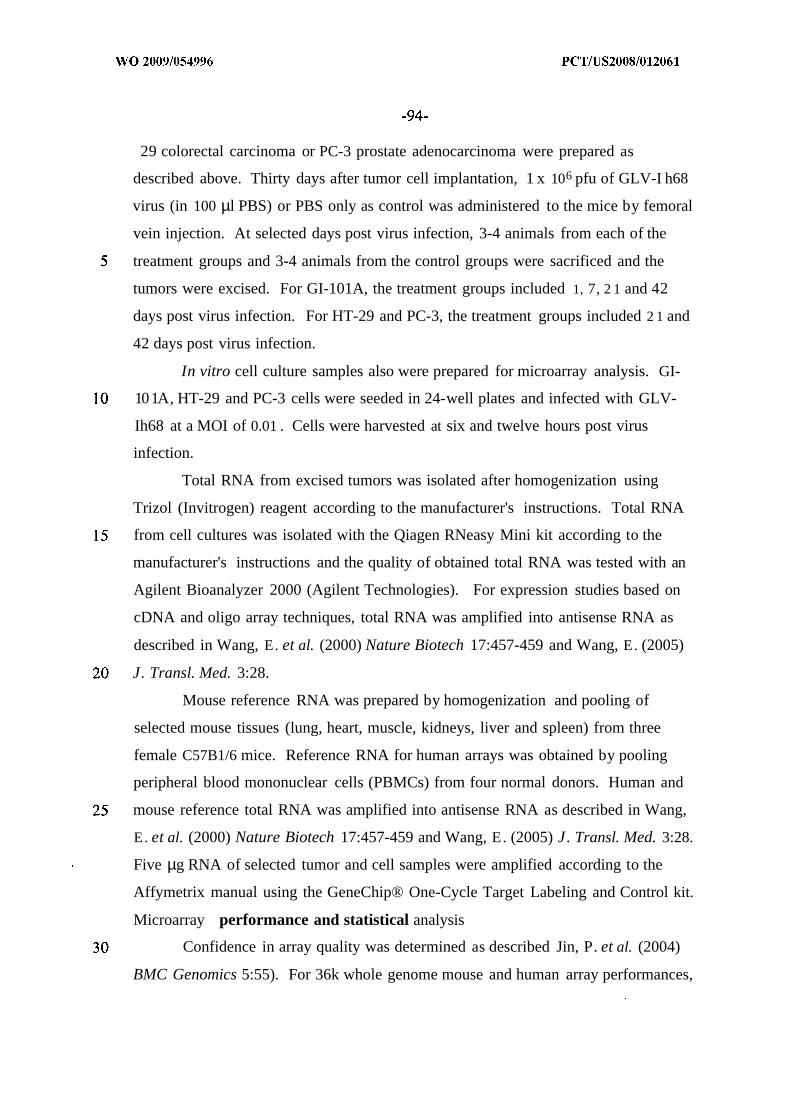
29 colorectal carcinoma or PC-3 prostate adenocarcinoma were prepared as
described above. Thirty days after tumor cell implantation, 1 x 10⁶ pfu of GLV-I h68
virus (in 100 µl PBS) or PBS only as control was administered to the mice by femoral
vein injection. At selected days post virus infection, 3-4 animals from each of the
treatment groups and 3-4 animals from the control groups were sacrificed and the
tumors were excised. For GI-101A, the treatment groups included 1, 7, 2 1 and 42
days post virus infection. For HT-29 and PC-3, the treatment groups included 2 1 and
42 days post virus infection.
In vitro cell culture samples also were prepared for microarray analysis. GI-
101A, HT-29 and PC-3 cells were seeded in 24-well plates and infected with GLV-
Ih68 at a MOI of 0.01 . Cells were harvested at six and twelve hours post virus
infection.
Total RNA from excised tumors was isolated after homogenization using
Trizol (Invitrogen) reagent according to the manufacturer's instructions. Total RNA
from cell cultures was isolated with the Qiagen RNeasy Mini kit according to the
manufacturer's instructions and the quality of obtained total RNA was tested with an
Agilent Bioanalyzer 2000 (Agilent Technologies). For expression studies based on
cDNA and oligo array techniques, total RNA was amplified into antisense RNA as
described in Wang, E. et al. (2000) Nature Biotech 17:457-459 and Wang, E. (2005)
J. Transl. Med. 3:28.
Mouse reference RNA was prepared by homogenization and pooling of
selected mouse tissues (lung, heart, muscle, kidneys, liver and spleen) from three
female C57B1/6 mice. Reference RNA for human arrays was obtained by pooling
peripheral blood mononuclear cells (PBMCs) from four normal donors. Human and
mouse reference total RNA was amplified into antisense RNA as described in Wang,
E. et al. (2000) Nature Biotech 17:457-459 and Wang, E. (2005) J. Transl. Med. 3:28.
Five µg RNA of selected tumor and cell samples were amplified according to the
Affymetrix manual using the GeneChip® One-Cycle Target Labeling and Control kit.
Microarray performance and statistical analysis
Confidence in array quality was determined as described Jin, P. et al. (2004)
BMC Genomics 5:55). For 36k whole genome mouse and human array performances,

reference and amplified test RNA were directly labeled using a ULS™ aRNA
Fluorescent Labeling kit (Kreatech Biotechnology) with Cy3 for reference and Cy5
for test samples and were co-hybridized to the slides (Worschech, A. et al. (2008)
Cancer Res. 68:2436-2446). 17k human cDNA arrays were carried out as described
according to standard methods for labeling and array hybridization (Basil, CF. et al.
(2006) Cancer Res 66:2953-2961). A customized Vaccinia Virus-GLV-lh68
Affymetrix expression array was specifically prepared for this study. Amplified
RNA from tumor or cell samples was handled according to the manufacturer's
instructions for eukaryotic sample processing and hybridized to the arrays. After 16h
incubation in the hybridization oven at 45°C, the arrays were washed and stained in
the Fluidics station using the GeneChip® Hybridization, Wash, and Stain Kit
(Affymetrix).
Resulting data files from both array types, Affymetrix and in house spotted
arrays, were uploaded to the mAdb databank (nciarray.nci.nih.gov) and further
analyzed using BRBArrayTools developed by the Biometric Research Branch,
National Cancer Institute (linus.nci.nih.gov/BRB-ArrayTools.html) (Simon, R. et al.
(2007) Cancer Informatics 2:1 1-17) and Cluster and TreeView software (Eisen, M.B.
et al. (1998) Proc Natl. Acad. Sci. USA 95:14863-14868). Multiple dimensional
scaling was performed using the BRB-array tool.
Retrieved data from the Affymetrix platform were normalized using median
over entire array as reference because of single color labeling technology. For all
array types, unsupervised analysis was used for class confirmation using the Stanford
Cluster program (80% gene presence across all experiments and at least 3-fold ratio
change) and Treeview program for visualization. Gene ratios were average corrected
across experimental samples and displayed according to an uncentered correlation
algorithm. Class comparison was performed using parametric unpaired Student's t
test or three-way ANOVA to identify differentially expressed genes among GLV-
Ih68 infected and uninfected tumors or cells at various time points using different
significance cutoff levels as demanded by the statistical power of each test.
Subsequent filtering (80% gene presence across all experiments and at least 3-fold

ratio change) narrowed down the number of genes that were expressed differentially
between experimental groups.
Statistical significance and adjustments for multiple test comparisons were
based on univariate and multivariate permutation test as previously described.
Previous studies have shown that the present method for RNA amplification is robust
yielding results comparable to those obtained by quantitative PCR (qPCR) (Jin, P. et
al. (2004) BMC Genomics 5:55; Feldman, A.L. et al. (2002) Biotechniques 33:906-
914; Nagorsen, D. et al. (2005) Genome Biol 6:R15). Additional quantitative PCR
can be performed to confirm changes in expression of individual genes.
Microarray Results
1. Transcriptional differences between responding xenografts versus non-responding xenografts to systemic GLV- Ih68 administration: vaccinia virus(VACV) signatures
Vaccinia virus (VACV) gene expression was assessed by a custom-made
VACV array platform (VACGLa520445F, Affymetrix, CA). The array platform (See
Table 11) included 308 probes representing 219 genes that covered the combined
genome of several vaccinia virus strains; exogenous constructs specific to GLV-Ih68
virus, such as the Renilla hxdfeτase-Aequorea green fluorescent fusion protein; and
393 probes representing 337 human or mouse "house keeping" genes.
Table 11VACV Array Platform Genes


With this array, it was possible to compare the expression of VACV
transcripts in vivo in the responding xenograft tumor, GI-101A, and the two non-
responding xenografts tumors, HT-29 (characterized by normal in vitro but delayed in

vivo replication) and PC-3 (characterized by delayed in vitro but intermediate in vivo
replication). In all cases, there was a correlation between Ruc-GFP transcript
expression and the overall expression of VACV genes independent of cell line
analyzed, suggesting that the exogenous construct accurately represented GLV-Ih68
replication. Furthermore, although some variation in VACV gene expression was
observed among cell lines or among individual experiments using the same cell line, a
clear dichotomy was observed between replicating and non-replicating cases. The
overall VACV transcriptional pattern correlated to viral titers observed in vivo (Table
9). For example, most GI-IOlA xenografts demonstrated replication with three out of
four samples expressing VACV genes at day 7, and four out of four samples at days
2 1 and 42. In contrast, HT-29 and PC-3 displayed delayed replication in vivo with
only a small proportion of xenografts displaying full VACV gene expression at day
2 1 (two out of four in either case). After 42 days the expression of VACV genes was
turned on in all four PC-3 xenografts and in only one of four HT-29 xenografts,
consistent with direct viral load analysis. These data suggest that delayed in vivo, but
not complete lack of, replication is a predictor of in vivo outcome.
For the array analysis on the in vitro infected tumor cell samples, VACV gene
expression analysis confirmed a lack of differences in the transcriptional pattern of in
vitro replication between HT-29 and GI-101A with two out of three cell cultures
demonstrating active viral replication in either case in the first 24 hours after
infection. The transcriptional pattern associated with PC-3 replication in vitro at 24
hours was not tested by the array platform since it was clearly absent according to
viral load and Ruc-GFP analysis.
The kinetics of VACV gene expression in xenografts were measured by a
time-course analysis performed on BRB-Array tool based on a time threshold p-value
< 0.001 and a false discovery rate of 0.1. Differences in VACV gene expression
between non-responding (HT-29 and PC-3) and responding xenografts (GI-IOlA)
were observed 2 1 days after intravenous injection of GLV-I h68. At that time point,
only three out of eight non responding xenografts (one HT-29 and two PC-3)
demonstrated active replication compared with four out of four xenografts derived
from GI-101A (Fisher test p-value = 0.03). Consistent with these results, a Student's t

test comparing the number of VACV genes differentially expressed between
xenografts at day 2 1 or 42 with baseline conditions (uninfected xenografts or
xenografts excised from mice infected only 24 hours prior) identified significant
differences (multivariate permutation p-value < 0.001) only in GI-101A xenografts at
day 21, while significant differences were observed in PC-3 xenografts at day 42
only. Table 12 shows the number of VACV-genes differentially expressed between
baseline and 2 1 or 42 days in the three exemplary xenografts (Student's t test cutoff
<0.001, multivariate permutation test p-value is shown).
Table 12
n.s.= not significant
The number of genes differentially expressed in replicating tumors reflected
almost completely the number of probes and annotations present in the array platform
(JJgHand 308) respectively, demonstrating that GLV- Ih68 replication is either absent
or complete in xenografts. A near complete overlap of VACV probes or genes
expressed at day 2 1 and 42 was observed in the GI-101A xenografts. A reverse
behavior was observed in the pattern of expression of human house keeping genes
represented in the VACV array platform; these genes were significantly down-
regulated in permissive cell lines, suggesting a shut off of cellular metabolism in
virally infected cells that correlated inversely with viral transcription as previously
described (Guerra, S. et al. (2007) J Virol. 8 1:8707-8721).
2. Transcriptional differences between responding xenografts versus non-responding xenografts to systemic GLV- Ih68 administration: human cancersignatures
A time course analysis evaluating the in vivo effects of viral replication on
the permissive GI-IOlA human xenografts was performed using a previously
described custom-made 17.5k human cDNA array platform (Panelli, M.C. et al.
(2006) Genome Biol 8:R8. Four experimental groups were tested that included
animals receiving systemic GLV-Ih68 administration 1, 7, 2 1 and 42 days before
xenograft excision; 4 animals were tested for each experimental group. As expected
based on the analysis of viral replication in vivo, significant changes in the
transcriptional profile of infected tumors occurred only 2 1 days after GLV-lh68
administration and increased at 42 days. Since the time course demonstrated that in
permissive xenografts the most significant changes occurred only after 2 1 days, the
analysis of xenografts representative of non-responding tumors was limited to days 2 1
and 42. It was previously observed that the use of species-specific cDNA arrays as
well as oligo probes can distinguish the expression patterns in mixed cell populations
in which human tissues (cancer cells) are infiltrated with host normal cells (Zhang, Q.
et al. (2007) Cancer Res. 67:10038-10046). This is due to a lack or reduced cross-
hybridization between non-related species was comparable to closely related ones,
such as primate to primate comparisons. Although partial cross-hybridization may
occur, this can be flagged and eliminated by applying an appropriate intensity signal
cutoff. Since cDNA arrays contain probes of relatively large size (600 to 2,000
bases), to increase the specificity of the hybridization, the same material was tested on
custom-made 36 kb oligo array platforms, constituting 70-base-length oligo-probes
(Operon) as well as cDNA probes using identical statistical parameters. The results
were concordant between platforms.
To test whether delayed replication affected the transcriptional program of
cancer cell lines, the transcriptional profile of responding (GI-IOlA) and non-
responding (HT-29) xenografts was compared. Comparisons were made between the
transcriptional profiles of infected and non-infected GI-101A and HT-29 xenografts at
days 2 1 and 42. HT-29 was selected among the non-responding tumor cell lines
because of the different behavior observed in in vivo experiments compared to the
responding GI-101A. An overview of the global differences among experimental
conditions was provided by multiple dimensional scaling based on the complete data

set of 36K oligo probes. This analysis demonstrated that infected GI-101A
xenografts completely segregated in Euclidian space from non infected xenografts,
while HT-29 xenografts clustered together whether or not they received GLV-Ih68
treatment. Similar results were observed based on the cDNA-based array platform.
To test overall differences between xenografts from infected and non-infected
animals, a Student's test (cutoff p2-value O.001) comparing GI-101A infected
xenografts to non-infected xenografts and HT-29 101 A infected xenografts to non-
infected xenografts was applied. Comparison of GI-101A xenografts identified 1,073
genes differentially expressed between infected and non-infected xenografts at the
level of significance (permutation test p value = 0). By contrast, only 9 genes were
found to be differentially expressed by HT-29 xenografts excised from infected
compared to non-infected animals at the same statistical stringency (permutation test
non significant). Among the genes differentially expressed in the GI-101A xenografts
excised from GLV-lh68 infected animals, the large majority were down-regulated,
particularly, in xenografts excised at day 42 suggesting that, as observed in vitro, viral
replication induces depression of cellular function. A smaller cluster of genes was
specifically over-expressed by GI-101A xenografts from infected animals. Among
these genes, allograft inflammatory factor-1 (AIF-I), tissue inhibitor of
metalloproteinase 2 (TIMP-2) and the IL-2 receptor common γ chain were found to be
strongly up regulated.
A multivariate analysis (F test, p-value cutoff < 0.001) comparing the four
groups at days 2 1 and 42 (HT-29 and GI-101A in infected and non-infected mice)
identified 2,241 and 1,984 clones, respectively, that were differentially expressed
among the four groups based on the oligo arrays. Comparison of the 17k cDNA
arrays similarly identified 1,467 cDNA clones representative of the four groups at day
42. In either platform, most of the differences in expression pattern were tumor cell
specific and segregated the HT-29 xenografts from GI-101A xenografts independent
of GLV-lh68 administration. However, a subgroup of genes was observed to be
specific for GI-101A infected xenografts (exemplified using the cDNA array platform
displaying 149 clones. The GLV-lh68 infection-specific signatures were enriched of
genes associated with immune function (35 genes) with a significantly higher than

expected frequency (1.88) according to Genontology assignment of biological
processes. Among the genes up-regulated in the in GI-IOlA xenografts excised from
GLV-Ih68 infected mice, several were strongly associated with activation of innate
immune mechanisms including the Toll-like receptor (TLR)-2, the interferon
regulatory factor (IRF)-7, signal transducer and activator of T cell (STAT)-3 and
tumor necrosis factor (TNF)-α This enrichment was not as clearly observed in the
oligo array based arrays, suggesting that these signatures could be potentially
attributed to host infiltrating immune cells whose genes could cross-hybridize to the
less stringent cDNA array probes.
3. Transcriptional differences between responding xenografts versus non-responding xenografts to systemic GLV- Ih68 administration: mouse hostsignatures
To further define the host involvement in the oncolytic process, HT-29 and
GI-101A xenografts were analyzed using a custom-made, whole genome mouse array
platform. All four GI-101A xenografts excised at day 42 from infected mice were
utilized, while only three of four xenograft were utilized for the human arrays
described above due to degradation of human mRNA in one of the regressing
xenografts. Gene expression was only significantly affected in GI-101A xenografts
excised from GLV-Ih68 infected mice (see Table 13). This modulation was
particularly evident at day 42 when 768 genes were altered in expression in GI-101A
xenografts excised from GLV-Ih68 infected animals.
Table 13
Genes differentially expressed between xenografts excised from GLV-1h68-infected vs non-infected animals(Cut off p2-value < 0.001 (unpaired Student t test)
36k whole genome mouse array platform
Day Experimental Group # genes Permutation test
2 1 HT-29 0 N.S.42 HT-29 6 N.S.21 GI-101A 88 <0.0142 GI-101A 768 <0.001
A statistical overview of gene expression modulation of GI-101A xenografts
from GLV-lh68 infected grafts gave an opposite picture compared with that obtained
with the human arrays. Most mouse genes where up regulated in xenografts excised
from infected animals suggesting that, while the metabolism of cancer cell was

declining, the activation of host cells was actively enhanced. An F test was
performed to compare xenografts at days 2 1 and 42. At day 21, 1,066 genes
demarcated the differences among the four experimental groups. This number
increased to 1,471 by day 42 (permutation test p-value = 0 in either case).
Genes up-regulated in GI-101A xenografts excised from infected animals
included several genes with immune effector function including several lymphokines,
chemokines and interferon-stimulated genes (ISGs) (see Table 14, Il18bp (SEQ ID
NO:406), 1118 (SEQ ID NO:407), 1115 (SEQ ID NO: 124), IllOra (SEQ ID NO:408),
Cxcll 1 (SEQ ID NO:409), Cxcl9 (SEQ ID NO:410), Cxcll2 (SEQ ID NO:41 1), Ccl5
(SEQ ID NO: 142), Ccl9 (SEQ ID NO:46), Ccl7 (SEQ ID NO:412), Ccl27 (SEQ ID
NO:413), Igtp (SEQ ID NO:474), Ifi27 (SEQ ID NO:414), Ifi47 (SEQ ID NO:475),
Iigp2 (SEQ ID NO:476), MxI (SEQ ID NO:415), 16204 (SEQ ID NO:477), Irfl
(SEQ ID NO:416), Statl (SEQ ID NO:417), Ifitl (SEQ ID NO:418), Iigpl (SEQ ID
NO:478), Ifhar2 (SEQ ID: NO 419), Irf5 (SEQ ID NO:420), Stat3 (SEQ ID NO:421),
Ly6f (SEQ ID NO:479), Aifl (SEQ ID NO:422), Ly6c (SEQ ID NO:480), Ripkl
(SEQ ID NO:423), Sell (SEQ ID NO:424), Taxlbp (SEQ ID NO:425), Ikbkap (SEQ
ID NO:426), Ly6a (SEQ ID NO:481), Ctla2b (SEQ ID NO:482), Artsl (SEQ ID
NO:427), Nkiras2 (SEQ ID NO:428), Ly96 (SEQ ID NO:429), Ly6e (SEQ ID
NO:430), and Tlr2 (SEQ ID NO:431)).
Among the cytokines, IL-1 8 and the IL-1 8 binding protein appeared to play a
prominent role, while IL- 15 was also strongly up regulated. Several CXCR-3,
CXCR4 and CCR5 ligands were up regulated among chemokines, suggesting a strong
pro-inflammatory switch capable of recruiting activated natural killer cells. Among
them, the expression of CXC-1 2/SDF-l was previously reported to be associated with
the rejection of metastatic melanoma during IL-2 therapy (Wang, E. et al. (2002)
Cancer Res. 62:3581-3586). A large number of ISGs predominantly associated with
interferon-alpha (IFN- ) function were also up regulated including IRF-I, also
previously described in association with rejection of melanoma metastases during IL-
2 based immunotherapy. ISGs were among the most up-regulated genes including
interferon- γ -induced GTPase, whose expression was increased 48-fold in GI-101A
rumors excised from GLV-lh68-infected animals compared with control xenografts.

TLR-2, AIF-I and STAT-3 were also found to be up-regulated according to the
mouse array platform similarly to the findings in the human platform suggesting a
cross hybridization of these genes likely expressed by host immune cells.
Table 14Immune genes up-regulated in regressing GI-IOlA tumors
Gene(F test p2-value <0.001)
HT-29 HT-29 GI-101A GI-101AID # Symbol Name Control GLV-1h68 Control GLV-1H68
lnterieukins and Receptors16068 M18bp interleukin 18 binding protein 1 3 1 2 18 1 00 13.2816173 1118 interleukin 18 1 12 1 40 1 00 10.8916168 1115 interleukin 15 1 02 1 5 1 1 00 5.2016154 IHOra interleukin 10 receptor alpha 0 74 0 90 1 00 3.51
Chemokines
Cxcl11 Cxcl11/I-TAC 0 92 1 75 1 00 13.5717329 Cxcl9 Cxcl9/M ιg 1 0 1 1 07 00 11.7420315 CXCI12 Cxcl12/SDF-1/PBSF 0 4 1 0 58 00 5.2320304 Ccl5 CCI5/RANTES 1 00 2 69 00 13.3320308 Ccl9 Ccl9/MRP-2/CCF18/MIP-1 γ 1 56 3 14 00 12.0320304 Ccl5 CCI5/RANTES 1 11 2 57 00 9.8120306 Ccl7 CCI7/MARC 0 84 1 18 00 5.8620301 Ccl27 Ccl27/ALP/CTACK/ILC/Esk ιne 1 86 1 9 1 1 00 5.1720308 Ccl9 Ccl9/MRP-2/CCF18/MIP-1 γ 1 26 1 42 1 00 4.04
ISGs16145 lgtp interferon gamma induced GTPase 1 15 3 3 1 1 00 48.2176933 Ifi27 interferon, alpha-inducible protein 27 0 76 0 9 1 1 00 12.84
Ifi47 interferon gamma inducible protein 47 0 66 0 94 1 00 11.09Iιgp2 interferon inducible GTPase 2 0 64 1 4 1 1 00 10.05
16145 lgtp interferon gamma induced GTPase 0 70 1 28 1 00 9.7017857 Mx1 myxovirus (influenza virus) resistance 1 0 62 1 46 1 00 9.46
lfi204 interferon activated gene 204 0 86 1 77 1 00 8.9416362 Irf1 interferon regulatory factor 1 0 59 0 98 1 00 7.2820846 Stati signal transducer and activator of transcription 1 0 57 0 8 1 1 00 6.8420846 Stati signal transducer and activator of transcription 1 0 66 0 97 1 00 6.1715957 IfiH interferon-induced protein with tetratricopeptide repeats 1 0 79 1 03 1 00 5.7760440 ligpi interferon inducible GTPase 1 0 77 1 00 1 00 4.1915976 Ifnar2 Interferon (alpha and beta) receptor 2 1 10 1 60 1 00 3.73
Irf5 interferon regulatory factor 5 0 53 0 70 1 00 3.4720848 Stat3 signal transducer and activator of transcription 3 1 16 1 17 1 00 2.55
Other17071 Ly6f Lymphocyte antigen 6 complex, locus F 0 56 0 73 1 00 8.5611629 Aif 1 allograft inflammatory factor 1 0 90 1 33 1 00 8.4617067 Ly6c Lymphocyte antigen 6 complex, locus C 1 24 1 22 1 00 7.35
Rιpk1 receptor (TNFRSF)- ιnteract ιng seπne-threonine kinase 1 0 82 1 42 1 00 6.9717067 Lyδc lymphocyte antigen 6 complex, locus C 0 99 1 12 1 00 6.0317071 Ly6f lymphocyte antigen 6 complex, locus F 0 80 0 89 1 00 5.6620343 Sell selectin, lymphocyte 0 6 1 0 79 1 00 5.0376281 Tax1bp1 Taxi (human T-cell leukemia virus type I) binding protein 1 1 0 1 1 5 1 1 00 5.02
230233 lkbkap Inhibitor of kappa light polypeptide enhancer in B-cells 0 8 1 0 93 1 00 4.55110454 Ly6a lymphocyte antigen 6 complex, locus A 0 96 0 98 1 00 4.13
13025 Ctla2b Cytotoxic T lymphocyte-associated protein 2 beta 0 68 1 20 1 00 4.12Arts1 type 1 tumor necrosis factor receptor shedding aminopeptidase regulator 0 73 1 3 1 1 00 3.87
71966 Nk ιras2 NFKB inhibitor interacting Ras-like protein 2 1 07 1 27 1 00 3.8017087 Ly96 lymphocyte antigen 96 1 13 1 43 1 00 3.7717069 Ly6e Lymphocyte antigen 6 complex, locus E 0 77 1 15 1 00 3.2824088 Tlr2 toll-like receptor 2 0 25 0 36 1 00 1.60
4. Delayed in vitro replication of GLV-lh68 can be predicted by specifictranscriptional signatures suggestive of intrinsic activation of anti-viralmechanisms in the non-permissive cancer cell lines

From the in vivo studies, it could be concluded that GLV- Ih68 administration
to human cancer xenograft-bearing mice resulted in a dichotomy of expression of
viral genes that in turn resulted in differences in the expression patterns within the
cancer cell lines with a strong reduction of cellular metabolism in presence of viral
replication. These changes were also responsible for the activation of powerful innate
immune mechanisms, suggesting that tumor eradication is at least in part due to the
activation of immune effector mechanism. As described above, in vitro behavior of
non-permissive cell lines was a strong predictor of in vivo behavior, where delayed
replication of GLV-I h68 in vitro was consistently associated with lack of in vivo
responsiveness of the corresponding xenografts. This in turn could decrease the in
vivo ability of GLV-I h68 to control tumor growth either through oncolytic or
immunological mechanisms. The expression profile of the different cancer cell lines
in vitro in base line conditions (in the absence of GLV-I h68) and during the active
phases of GLV-I h68 replication were examined. The following time points were
compared for each cell line in the presence or absence of virus: 0, 3 and 12 hours.
GLV- Ih6 8 infection induced several changes in gene expression that were
time dependent and tightly correlated with the expression of VACV-genes. In
particular, a shut off of several host cell genes was observed with time in accordance
with previous studies (Guerra, S. et al. (2007) J Virol. 8 1:8707-8721). The most
significant differences between the cell lines that allowed or inhibited early
replication were noted in non-infected controls. Non-infected controls behaved
similarly at the three in vitro culture time points (0, 3 and 12 hours) and no
statistically significant differences could be identified among the three time points.
Therefore, their transcriptional profile was analyzed together when comparing
different cell lines. A class comparison was performed based on an unpaired
Student's t test between non-permissive (MDA-231, NCI-H1229, SiHa, PC-3) and
permissive (888-MEL, 1858-MEL, 1936-MEL, GI-101A, MIA PaCa-2, HT-29 and
A549) cell lines; OVCAR-3 and PANC-I were not included in the Student's t test
analysis because of their intermediate behavior in allowing GLV- Ih68 replication in
culture. This analysis identified 1,736 genes that were differentially expressed
between permissive and non-permissive cell lines at a p-value cut off of 0.01

(permutation test p-value = 0). The most specific signatures were obtained for the
constitutive expression of genes that characterized the non-permissive cell lines. It
was observed that non-permissive cell lines expressed a significant number of
interferon-stimulated genes (ISGs) and other immune regulatory genes based on Gene
Ontology classification, while such genes were completely absent in the permissive
cell lines (Table 15, IL6 (SEQ ID NO:1 17), ILl 3RAl (SEQ ID NO:432), IL8 (SEQ
ID NO:1 19), IL7R (SEQ ID NO:433), CCRL2 (SEQ ID NO:434), CCL5 (SEQ ID
NO: 142), IFITl (SEQ ID NO:418), EBI3 (SEQ ID NO:435), interferon-induced
transmembrane protein 3(SEQ ID NO:436), IFITl (SEQ ID NO:418), IFNGR2 (SEQ
ID NO:437), IFITM2 (SEQ ID NO:438), MXl (SEQ ID NO:41 5), STATl (SEQ ID
NO:417), IFITMl (SEQ ID NO:439), OASL (SEQ ID NO:440), IRF7 (SEQ ID
NO:441), IRFl (SEQ ID NO:442), NGFRAPl (SEQ ID NO:443), TGFBlIl (SEQ ID
NO:444), TAX1BP3 (SEQ ID NO:445), BAX (SEQ ID NO:446), PTX3 (SEQ ID
NO:447), BAG5 (SEQ ID NO:448), TIMPl (SEQ ID NO:449), IER3 (SEQ ID
NO:450), NFAT5 (SEQ ID NO:451), BAT5 (SEQ ID NO:452), TNFRSF9 (SEQ ID
NO:453), LY6G6E (SEQ ID NO:454), CSF2 (SEQ ID NO:455), TNFSFlO (SEQ ID
NO:456), CRLF2 (SEQ ID NO:457), LTB4R (SEQ ID NO:458), B2M (SEQ ID
NO:459), GBP2 (SEQ ID NO:460), PBX4 (SEQ ID NO:461), NFKBIA (SEQ ID
NO:462), HLA-C (SEQ ID NO:463), HLA-H (SEQ ID NO:464), HLA-G (SEQ ID
NO:465), BCL6 (SEQ ID NO:466), HLA-F (SEQ ID NO:467), HLA-B (SEQ ID
NO:468), HLA CLASS 1 HISTOCOMPATIBILITY ANTIGEN, ALPHA CHAIN F
(SEQ ID NO:469), BAG3 (SEQ ID NO:470), HLA-DMA (SEQ ID NO:471), TRBCl
(SEQ ID NO:472), HLA-DRB4 (SEQ ID NO:473)).
Thus, it was concluded that non-permissive cell lines delay viral replication
during the initial 24 hours through a constitutive activation of innate immune
responses. In particular, genes associated with the initiation of anti-viral immune
responses were observed to be constitutively expressed, including MXl, NFKBIA,
STAT-I, IL-6, CXCL-8 (IL-8), CCL5 (RANTES), and several interferon regulatory
factors (IRFs) including IRF-I and IRF-7 while IRF-4, a classic inhibitor of TLR
signaling and pro-inflammatory cytokine production downstream of MyD88 was the
only ISG relatively under-expressed by non-permissive cells compared to permissive

cells. Since GLV-lh68 replication in vitro is only dependent upon the interaction
between the virus and the host cell without the participation of any immune
mechanisms, the intracellular immune mechanism or paracrine cross talk among
cancer cells may be sufficient to limit the ability of GLV-I h68 to replicate during the
first 24 hours.

Table 15Immune genes up-regulated in non-permissive tumors
(F test p2-value <0.001)Gene Non-permissive cells Permissive cells
Symbol Name Control Control
lnterieukins and Receptors3569 IL6 intβrieukin 6 (interferon, beta 2) 2 23 0 643597 IL13RA1 lnterleukin 13 receptor, alpha 1 2 02 0 993576 IL8 lnterleukin 8 0 27 0 063575 ILTR PREDICTED interieukiπ 7 receptor 0 09 0 04
Chemokines9034 CCRL2 chemokine (C-C motif) receptor-like 2 1 15 0 686352 CCL5 chemokine (C-C motif) ligand 5 0 10 0 06
ISGs3434 IFIT1 interferon-induced protein with tetratπcopeptide repeats 1 4 76 0 69
10148 EBI3 Epstem-Barr virus induced gene 3 1 93 1 20LOC144383-PREDICTED similar to Interferon-induced transmembrane protein 3 1 74 0 39
3460 IFNGR2 interferon gamma receptor 2 (interferon gamma transducer 1) 1 35 0 8610581 IFITM2 interferon induced transmembrane protein 2 1 26 0 4710581 IFITM2 interferon induced transmembrane protein 2 1 18 0 254599 MX1 myxovirus (influenza virus) resistance 1, interferon-inducible protein p78 0 76 0 246772 STAT1 signal transducer and activator of transc πption 1 0 65 0 22
IFITM1 interferon induced transmembrane protein 1 0 62 0 048638 OASL 2'-5'-ol ιgoadenylate synthetase-l ιke 0 50 0 233665 IRF7 interferon regulatory factor 7 0 35 0 143659 IRF1 interferon regulatory factor 1 0 3 1 0 19
Other
27018 NGFRAP1 nerve growth factor receptor (TNFRSF1 6) associated protein 1 6 74 2 227041 TGFB1I1 transforming growth factor beta 1 induced transcπpt 1 3 46 1 39
30851 TAX1BP3 Taxi (human T-cell leukemia virus type I) binding protein 3 3 16 1 23581 BAX BCL2-assoc ιated X protein 3 14 1 75
5806 PTX3 pentraxin-related gene, rapidly induced by IL-I beta 3 10 0 989529 BAG5 BCL2-assoc ιated athanogene 5 2 67 1 3 1
7076 TIMP1 TIMP metallopeptidase inhibitor 1 2 02 0 438870 IER3 immediate early response 3 2 00 0 84
10725 NFAT5 nuclear factor of activated T-cells 5, tonicrty-responsive 1 92 1 087920 BAT5 HLA-B associated transcπpt 5 1 75 1 033604 TNFRSF9 tumor necrosis factor receptor superfamily, member 9 1 65 0 80
LY6G6E lymphocyte antigen 6 complex, locus G6E 1 56 0 601437 CSF2 colony stimulating factor 2 (granulocyte-macrophage) 1 49 0 778743 TNFSF10 tumor necrosis factor (ligand) superfamily, member 10 1 24 0 42
64109 CRLF2 cytokine receptor-like factor 2 0 97 0 701241 LTB4R leukotriene B4 receptor 0 87 0 25
B2M beta-2-m ιcroglobul ιn 0 84 0 502634 GBP2 guanylate binding protein 2, interferon-inducible 0 80 0 46
80714 PBX4 pre-B-cell leukemia homeobox 4 0 79 0 374792 NFKBIA nuclear factor of kappa light polypeptide gene enhancer in B-cells inhibitor, alpha 0 75 0 144792 NFKBIA nuclear factor of kappa light polypeptide gene enhancer in B-cells inhibitor, alpha 0 74 0 15
B2M beta-2-m ιcroglobul ιn 0 70 0 083107 HLA-C major histocompatibility complex, class I, C 0 63 0 19
B2M beta-2-m ιcroglobul ιn 0 6 1 0 093136 HLA-H Major histocompatibility complex, class I, H 0 57 0 263135 HLA-G HLA-G histocompatibility antigen, class I, G 0 52 0 35
BCL6 B-cell CLUIymphoma 6 (zinc finger protein 5 1) 0 48 0 173135 HLA-G HLA-G histocompatibility antigen, class I, G 0 36 0 093134 HLA-F Major histocompatibility complex, class I, F 0 35 0 163106 HLA-B major histocompatibility complex, class I, B 0 28 0 14
HLA CLASS I HISTOCOMPATIBILITY ANTIGEN, ALPHA CHAIN F PRECURSOR (HL 0 28 0 11
BAG3 BCL2-assoc ιated athanogene 3 0 23 0 153108 HLA-DMA major histocompatibility complex, class II, DM alpha 0 12 0 04
28639 TRBC1 T cell receptor beta constant 1 0 08 0 033126 HLA-DRB4 major histocompatibility complex, class II, DR beta 4 0 08 0 04

Example 7
Identification of differentially expressed host proteins in hosts bearing PANC-I
xenograft tumors, which respond favorably to viral therapy
To identify host proteins which are differentially expressed in hosts that
respond favorably to viral therapy, PANC-I tumor cells (human pancreatic ductal
carcinoma cells) were implanted subcutaneously into nude mice (male or female).
Once the tumors reached a desired size (approximately 200-400 mm3), the mice were
injected intravenously with 5xlO6 pfu/100 µl PBS/mouse of vaccinia virus GLV-lh68.
Mice were sacrificed at 2 1 days and 42 days post-injection. Tumors were excised and
prepared in Tris buffer. Protein expression profiles were determined by Rules-Based
Medicine, Inc. using the RodentMAP™ multi-analyte profile immunoassay. The
assay measure mouse protein levels in the extracted tumor samples. Table 16 shows
the fold change in the host protein expression levels for tumors injected with GLV-
Ih68 (treated) and non-injected control tumors (untreated) at 2 1 days and 42 days
post-injection (n=2). The data in Table 16 is expressed as Treated/Untreated and
Untreated/Treated.
Table 16Fold Change in Host Protein Expression Levels Between GLV-lh68 treated and
untreated PANC-I human ancreatic xeno raft tumors

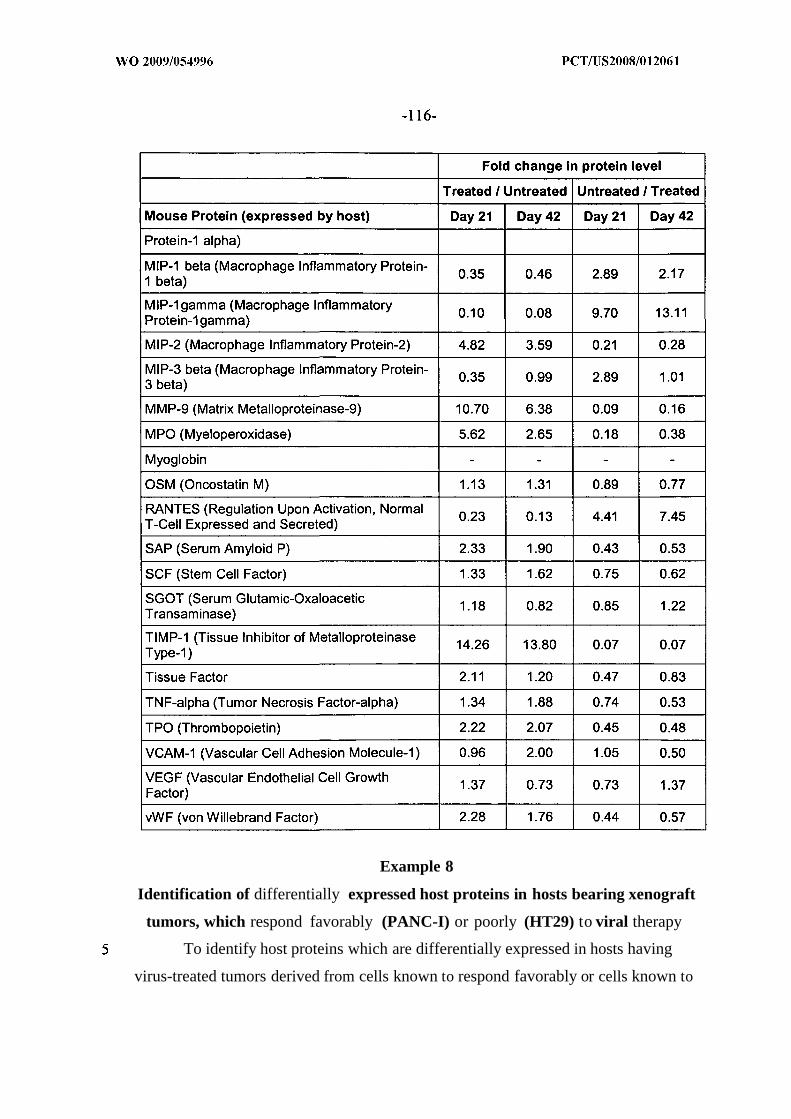
Example 8
Identification of differentially expressed host proteins in hosts bearing xenograft
tumors, which respond favorably (PANC-I) or poorly (HT29) to viral therapy
To identify host proteins which are differentially expressed in hosts having
virus-treated tumors derived from cells known to respond favorably or cells known to

respond poorly to viral therapy, PANC-I tumor cells or HT29 tumor cells were
implanted subcutaneously into nude mice (male or female). PANC-I is a human
pancreatic ductal carcinoma which responds favorably to viral therapy; HT29 is a
human colorectal adenocarcinoma which responds poorly to viral therapy. Once the
tumors reached a desired size (approximately 200-400 mm3), the mice were injected
intravenously with 5xlO6 pfu/100 µl PBS/mouse of vaccinia virus GLV-lh68. Mice
were sacrificed and the tumors were excised and prepared in Tris buffer. Host protein
profiles were determined by Rules-Based Medicine, Inc. using the RodentMAP™
multi-analyte profile immunoassay for tumors injected with GLV- Ih68 (treated), and
non-injected control tumors (untreated). The assay measures mouse protein levels in
the extracted tumor samples. Table 17 shows the fold change in the host protein
expression levels between GLV-Ih68 treated and untreated tumor samples for tumors
derived from either PANC-I cells or HT29 cells. The data in Table 17 is expressed as
either Untreated/Treated or Treated/Untreated for each tumor type. Table 18 shows
the fold difference in protein expression levels between tumors derived from PANC-I
cells versus HT29 cells in GLV-Ih68 (treated), or non-injected (untreated) tumors.
The data in Table 18 is expressed as either PANC-1/HT29 or HT29/PANC-I for
either the treated or untreated tumor samples.
Table 17Fold Change in Host Protein Expression Levels Between GLV-lh68 treated
and untreated PANC-I human pancreatic and HT29 human colorectalcarcinoma xeno raft tumors


Table 18Fold Difference in Host Protein Expression Levels Between GLV-lh68 treated
and untreated PANC-1 human pancreatic and HT29 human colorectalcarcinoma xeno raft tumors


Example 9
Identification of proteins which are differentially expressed in tumors which
respond favorably (DU145) or poorly (PC-3) to viral therapy
To identify human tumor proteins which are differentially expressed in tumors
which respond favorably or unfavorably to viral therapy, DU145 or PC-3 cells were
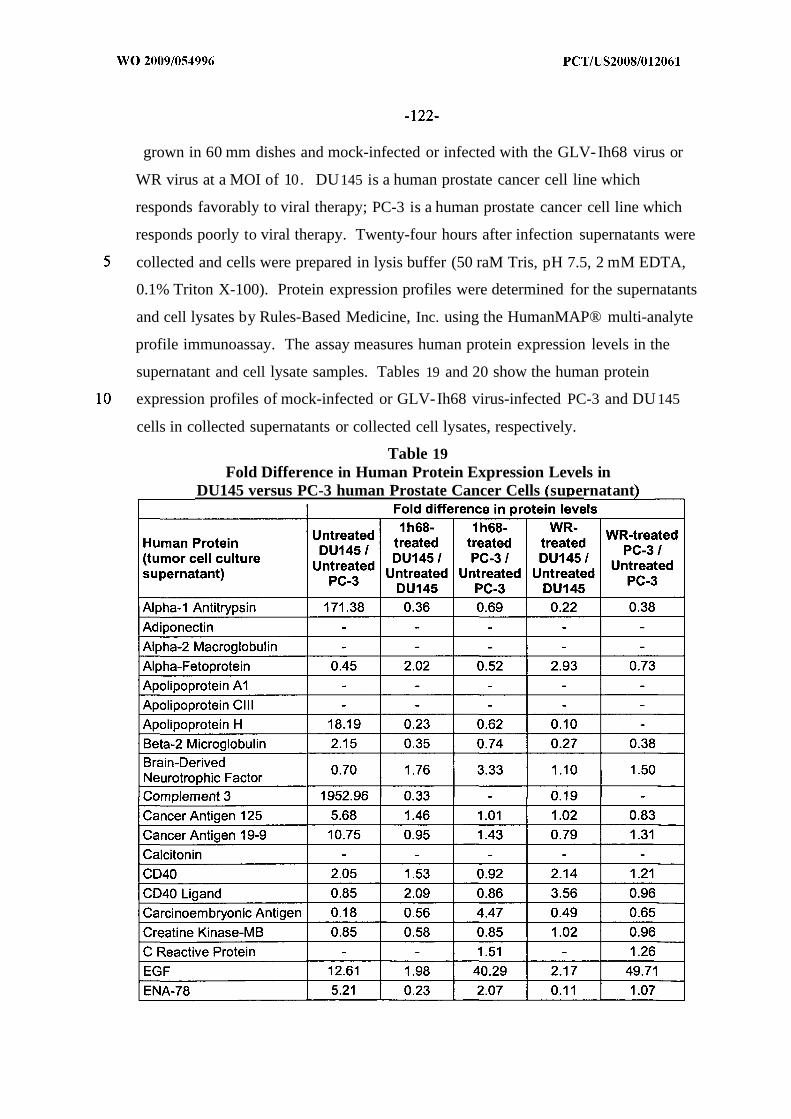
grown in 60 mm dishes and mock-infected or infected with the GLV-Ih68 virus or
WR virus at a MOI of 10. DU145 is a human prostate cancer cell line which
responds favorably to viral therapy; PC-3 is a human prostate cancer cell line which
responds poorly to viral therapy. Twenty-four hours after infection supernatants were
collected and cells were prepared in lysis buffer (50 raM Tris, pH 7.5, 2 mM EDTA,
0.1% Triton X-100). Protein expression profiles were determined for the supernatants
and cell lysates by Rules-Based Medicine, Inc. using the HumanMAP® multi-analyte
profile immunoassay. The assay measures human protein expression levels in the
supernatant and cell lysate samples. Tables 19 and 20 show the human protein
expression profiles of mock-infected or GLV-Ih68 virus-infected PC-3 and DU145
cells in collected supernatants or collected cell lysates, respectively.
Table 19Fold Difference in Human Protein Expression Levels in
DU145 versus PC-3 human Prostate Cancer Cells su ernatant


Table 20Fold Difference in Human Protein Expression Levels in
DU145 versus PC-3 human Prostate Cancer Cells (cell lysate)Fold change in protein levels


Example 10
Identification of proteins which are differentially expressed in xenograft tumors
which respond favorably (PANC-I) or poorly (HT-29) to viral therapy
To identify differentially expressed proteins in virus-infected tumors derived
from cancer cells known to respond favorably to viral therapy versus cancer cells
known to respond poorly to viral therapy, PANC-I human tumor cells or HT-29
human tumor cells were implanted subcutaneously into nude mice (male or female).
Once the tumors reached a desired size, (approximately 200-400 mm3), the mice
were injected intravenously with 5xlO6 pfu/100 µl PBS/mouse of vaccinia virus GLV-
Ih68. Mice were sacrificed at 42 days after injection. Tumors were excised and
prepared in Tris buffer. Human protein profiles were determined by Rules-Based
Medicine, Inc. using the HumanMAP® multi-analyte profile immunoassay for tumors
injected with GLV-lh68 (treated) and non-injected control tumors (untreated). The
assay measures the level of expression of human proteins in the tumor sample. Table
2 1 shows fold change in protein expression levels of human proteins between treated
and untreated xenograft tumors derived from PANC-I cells or HT29 cells.
Table 21

Fold Change in Human Protein Expression Levels in GLV-lh68 treatedand untreated PANC-I human pancreatic and HT29 human colorectal
carcinoma xeno raft tumors


Example 11
Specificity of Rodent Multi-Analyte Profiles (MAPs)
To demonstrate the specificity of rodent multi-analyte profile assays employed
in examples above, human breast carcinoma GI-101A cells were seeded in a 60 mm
dish at 5 x 10⁶ cells/dish. The following day, the medium was exchanged for fresh
medium, and 24 hours later the supernatant was collected to determine antibody
specificity using HumanMAP® and RodentMAP™ multi-analyte profile
immunoassays carried out by Rules-Based Medicine, Inc. Table 22 shows the level of
expression detected using RodentMAP™ or HumanMAP® multi-analyte profile
assays.
Table 22Cross-reactivity of Expressed Human Tumor Proteins in
Human and Rodent Multi-anal te Profile Assa s


* Cross reactivity = RodentMAP/HumanMAP* 100
Example 12
Reproducibility of Human Multi-Analyte Profile (MAP) assay
To demonstrate the reproducibility of the multi-analyte profile assays, protein
expression profiles cells were assayed on multiple days. Supernatant was taken from
cultured human breast carcinoma GI-101A cells on Day 0 (Test 1) and Day 13 (Test
2). Protein profiles of supernatants were determined using the HumanMAP® multi-
analyte profile immunoassay carried out by Rules-Based Medicine, Inc. Table 23
shows the human protein concentration of proteins for Test 1 and Test 2 supernatants.
Some antigens may have had a lower score due to the stability of the proteins during
storage.


Example 13
Identification of differentially expressed host proteins in a host bearing xenograft
tumors which respond favorably to viral therapy using A549 cells
To identify host proteins which are differentially expressed in hosts that
respond favorably to viral therapy, A549 tumor cells (human lung carcinoma cells
which are responsive to viral therapy) were implanted subcutaneously into nude mice
(male or female). Once the tumors reached a desired size, the mice were injected
intravenously with 5x1 06 pfu/100 µl PBS/mouse of vaccinia virus GLV-Ih68 or
GLV-lhlO9. (GLV-lhlO9 is an LIVP vaccinia virus derived from GLV-lh68. The
virus contains DNA encoding an anti-VEGF single chain antibody under the control
of a vaccinia synthetic late promoter in place of the LacZ/rTFr expression cassette at
the TK locus of GLV-lh68; U.S. Patent Application Serial No. 11/975,088). Mice
were sacrificed at 2 1 days post-injection. Tumors were excised and prepared in Tris
buffer. A blood sample was taken from the same mice, and serum was prepared.
Protein expression profiles were determined by Rules-Based Medicine, Inc. using the
RodentMAP™ multi-analyte profile immunoassay. Table 24 shows host protein
profiles for tumors injected with GLV-Ih68 or GLV-IhI 09 (treated), and non-
injected control tumors (untreated), with the fold change in mouse protein levels
between tumors injected with virus, and tumors non-injected with virus at 2 1 days
post-injection (n=2). Table 25 shows host protein profiles for serum proteins from
mice with tumors injected with GLV-lh68 or GLV-1M09 (treated), and non-injected
control serum (untreated), with the fold change in mouse protein levels between

serum from mice injected with virus, and serum from non-injected mice with virus at
1 days post-injection.
Table 24Fold Change in Host Protein Expression Levels in GLV-I h68-treated, GLV-
lhlO9-treated or Untreated A549 Human Lung Carcinoma Xenograft Tumorstumor extract


Table 25Fold Change in Host Protein Expression Levels in Serum from Mice Bearing
GLV-lh68-treated, GLV-lhlO9-treated or Untreated A549 Human LungCarcinoma Xeno raft Tumors


Example 14
Identification of tumor proteins which are differentially expressed in xenograft
tumors which respond favorably to viral therapy using A549 cells.
To identify differentially expressed proteins in virus-infected tumors derived
from cells known to respond favorably to viral therapy, A549 human tumor cells were
implanted subcutaneously into nude mice (male or female). Once the tumors reached
a desired size,(approximately 200-400 mm3), the mice were injected intravenously
with 5xlO6 pfu/100 µl PBS/mouse of vaccinia virus GLV-lh68 or GLV-lhlO9. Mice
were sacrificed at 2 1 days after injection. Tumors were excised and prepared in Tris
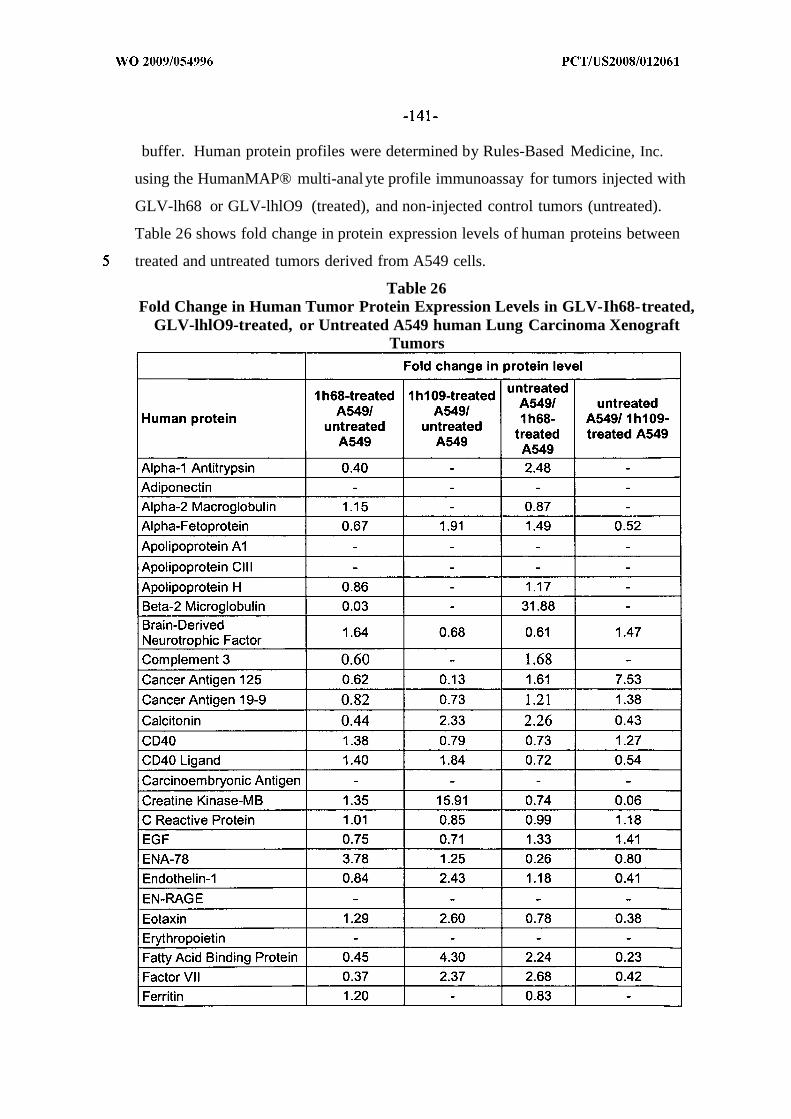
buffer. Human protein profiles were determined by Rules-Based Medicine, Inc.
using the HumanMAP® multi-analyte profile immunoassay for tumors injected with
GLV-lh68 or GLV-lhlO9 (treated), and non-injected control tumors (untreated).
Table 26 shows fold change in protein expression levels of human proteins between
treated and untreated tumors derived from A549 cells.
Table 26Fold Change in Human Tumor Protein Expression Levels in GLV-Ih68-treated,
GLV-lhlO9-treated, or Untreated A549 human Lung Carcinoma XenograftTumors
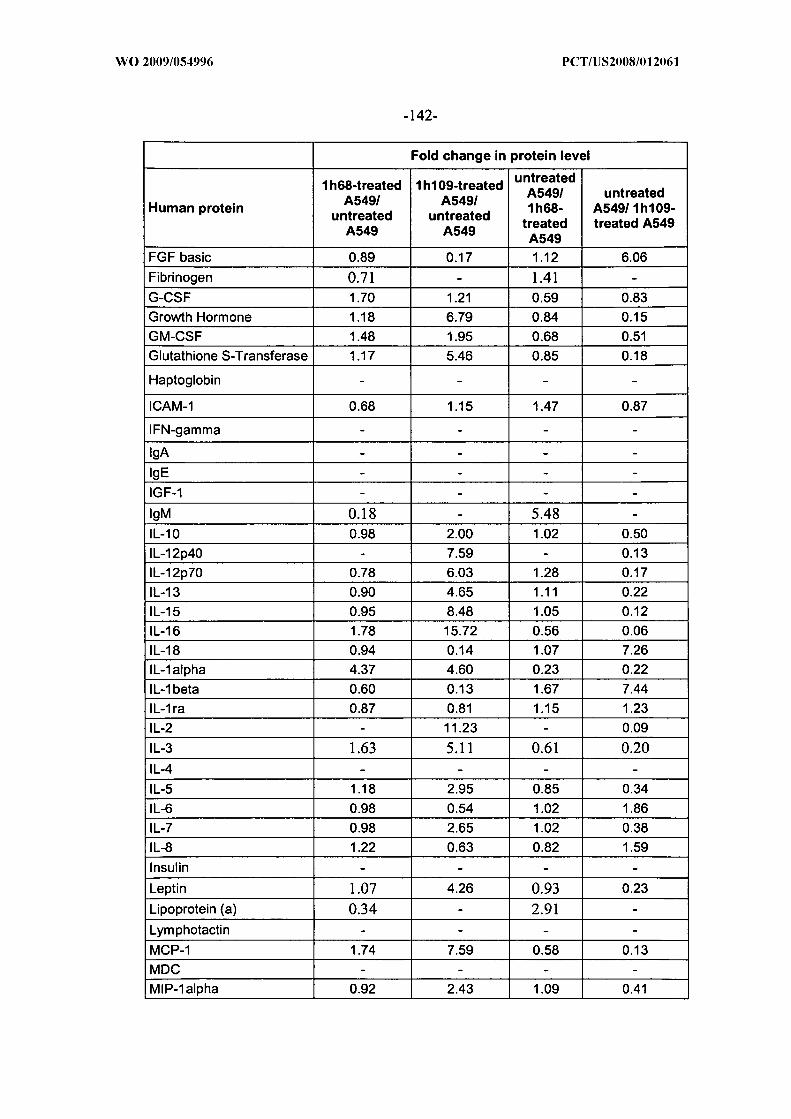

Example 15
Specificity of HumanMAP multi-analyte profile immunoassay
To demonstrate the specificity of the human multi-analyte profile
immunoassay, mouse mammary gland tumor 4Tl (ATCC Catalog No. CRL-2935)
cells were seeded in a 60 mm dish at 5 x 10⁶ cells/dish. The following day, the
medium was changed, and 24 hours later the supernatant was collected to determine

antibody specificity using HumanMAP® and RodentMAP™ multi-analyte profile
immunoassays carried out by Rules-Based Medicine, Inc. Table 27 shows the level of
expression detected using RodentMAP™ or HumanMAP® multi-analyte profile
immunoassays.
Table 27Cross-reactivity of Expressed Mouse Tumor Proteins in
Rodent and Human Multi-anal te Profile Assa s

* Cross reactivity = HumanMAP/RodentMAP* 100
Example 16
Identification of differentially expressed tumor proteins in xenograft tumor cells
which respond poorly to viral therapy using HT29 cells.
To identify tumor proteins which are differentially expressed in tumor cells
that respond poorly to viral therapy, HT29 human colorectal adenocarcinoma cells
were implanted subcutaneously into nude mice (male or female). Once the tumors
reached a desired size, (approximately 200-400 mm3), the mice were injected
intravenously with 5x1 06 pfu/100 µl PBS/mouse of vaccinia virus GLV-lh68. Mice
were sacrificed at 2 1 days and 42 days post-injection. Tumors were excised and
prepared in Tris buffer. Protein expression profiles were determined by Rules-Based
Medicine, Inc. using the HumanMAP® multi-analyte profile immunoassay. Table 28
shows human tumor cell protein profiles for mice injected with GLV- Ih68 (treated),
and non-injected control tumors (untreated) at either 2 1 days and 42 days post¬
infection (n=2). The data is expressed as either Untreated/GLV-lh68-Treated or
GLV-lh68-Treated/Untreated for Day 2 1 or Day 42 post-infection.
Table 28Fold Change in Human Tumor Protein Expression Levels in GLV-lh68-treated
or Untreated HT29 Human Colorectal Adenocarcinoma Xeno raft Tumors


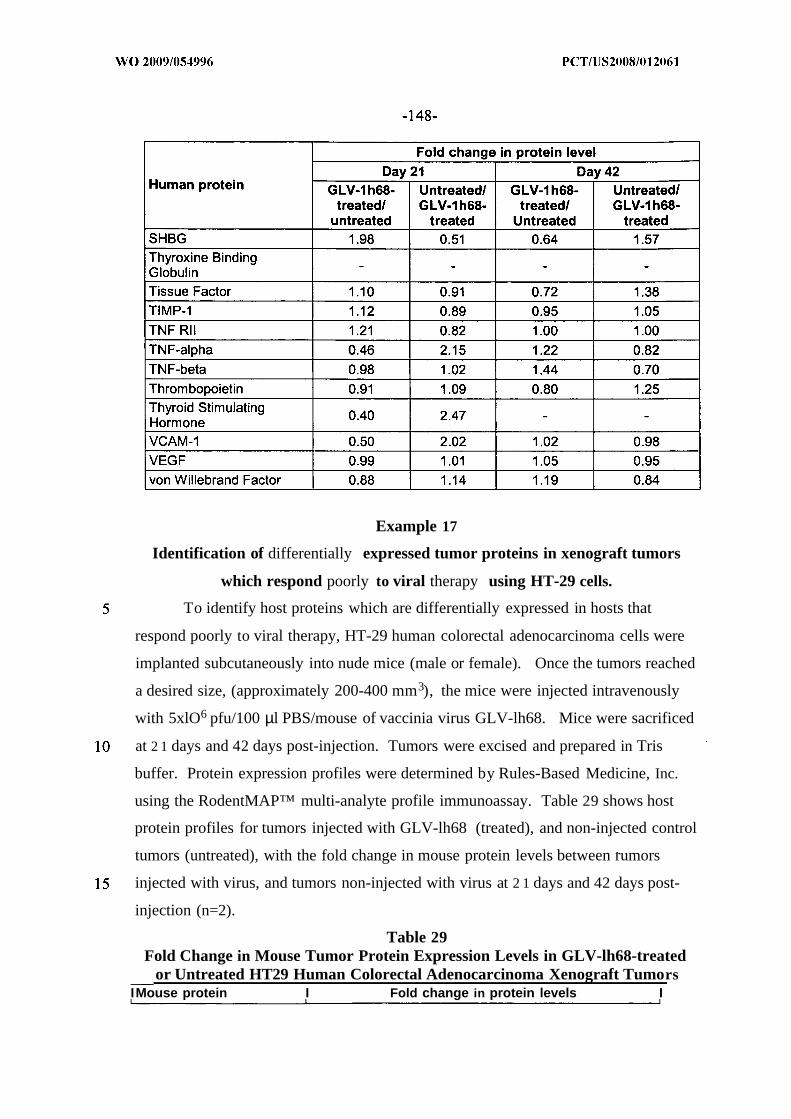
Example 17
Identification of differentially expressed tumor proteins in xenograft tumors
which respond poorly to viral therapy using HT-29 cells.
To identify host proteins which are differentially expressed in hosts that
respond poorly to viral therapy, HT-29 human colorectal adenocarcinoma cells were
implanted subcutaneously into nude mice (male or female). Once the tumors reached
a desired size, (approximately 200-400 mm3), the mice were injected intravenously
with 5xlO6 pfu/100 µl PBS/mouse of vaccinia virus GLV-lh68. Mice were sacrificed
at 2 1 days and 42 days post-injection. Tumors were excised and prepared in Tris
buffer. Protein expression profiles were determined by Rules-Based Medicine, Inc.
using the RodentMAP™ multi-analyte profile immunoassay. Table 29 shows host
protein profiles for tumors injected with GLV-lh68 (treated), and non-injected control
tumors (untreated), with the fold change in mouse protein levels between rumors
injected with virus, and tumors non-injected with virus at 2 1 days and 42 days post-
injection (n=2).
Table 29Fold Change in Mouse Tumor Protein Expression Levels in GLV-lh68-treated
or Untreated HT29 Human Colorectal Adenocarcinoma Xenograft TumorsIMouse protein I Fold change in protein levels I


Example 18
Comparison of Expression Levels in Different Tumors
The level of expression of one or more markers in a biological sample may be
compared to the level of expression in biological samples known to respond favorably
or poorly to viral therapy. For example, the level of expression of one or more
markers in a tumor obtained from a subject can be compared to the level of expression
in tumors known to respond favorably or poorly to viral therapy. An example of one
method for comparing expression levels is described below.
Weight of exemplary tumor sample A : 500 mg
Weight of exemplary tumor sample B: 600 mg
Weight of exemplary tumor sample C: 550 mg
All tumors are ground in a volume of Tris buffer (e.g., 1000 ul Tris buffer, pH
7.4, with protease inhibitors added).
Assuming 1 mg = 1 ul, the tumor sample concentration for sample A is
therefore = (500 mg) / (500 ul + 1000 ul) = 0.333 mg/ul
Similarly, for tumor sample B, the tumor sample concentration is (600 mg) /
(600 ul + 1000 ul) = 0.375 mg/ul
Similarly, for tumor sample C, the tumor sample concentration is (550 mg) /
(550 ul + 1000 ul) = 0.355 mg/ul
When the raw data of protein antigens (in concentration) is obtained, it may be
adjusted to the tumor sample concentration. For example, if the raw data for protein
K is, for example, 0.34 ng/ml, 0.55 ng/ml, and 0.39 ng/ml, for tumor samples A, B,
and C, respectively, the relative concentration of protein K can be adjusted according
the tumor sample concentration. Since tumor sample B is 0.375/0.333=1.072 fold
higher than sample A, the concentration of antigen K for sample A is adjusted by
calculating: 0.34 ng/ml x 1.072 = 0.36 ng/ml. The concentration of antigen K for
sample C may be adjusted by calculating: 0.39 ng/ml x (0.375/0.355) = 0.41 ng/ml.
The adjusted data for the concentration of protein antigen K is 0.36 ng/ml,
0.55 ng/ml, 0.41 ng/ml for tumor sample A, B, C, respectively. After this
concentration adjustment, the samples can be directly compared to identify those
markers that are elevated and those markers that are decreased and the fold
differences among them.
Example 19
Efficacy of GLV-Ih68 Replication in Additional tumor cell lines
A panel of well-characterized human cancer cell lines of different histological
derivation was employed in the studies described herein. All cell lines except noted
were purchased from American Type Culture Collection (Manassas).
NCI-H460 lung large cell carcinoma (ATCC Cat No. HTB-1 77), MALME-
3M malignant melanoma lung metastasis (ATCC Cat No. HTB-64), RXF-393 renal
hypernephroma (National Cancer Institute Repository), NCI-H522 lung
adenocarcinoma (ATCC Cat No. CRL-58 10), NCI-H322M lung bronchi alveolar
carcinoma (National Cancer Institute Repository), NCI-H226 lung squamous cell
carcinoma (ATCC Cat No. CRL-5826), NCI-H23 lung adenocarcinoma (ATCC Cat
No. CRL-5800), HOP-92 lung carcinoma (National Cancer Institute Repository), and
EKVX lung adenocarcinoma (National Cancer Institute Repository) cells were
cultured in Roswell Park Memorial Institute medium (RPMI) supplemented with 10%
FBS. A-673 rhabdomyosarcoma (ATCC Cat No. CRL-1 598) and D283/MED
medulloblastoma (ATCC Cat No. HTB-1 85) cells were cultured in Eagle's minimal
essential medium (EMEM) media supplemented with 10% FBS. MNNG/HOS
osteosarcoma (ATCC Cat No. CRL- 1547) cells were cultured in EMEM
supplemented with 10% FBS, non-essential amino acids (NEAA) and sodium
pyruvate. All cell cultures were carried out at 37°C under 5% CO2.
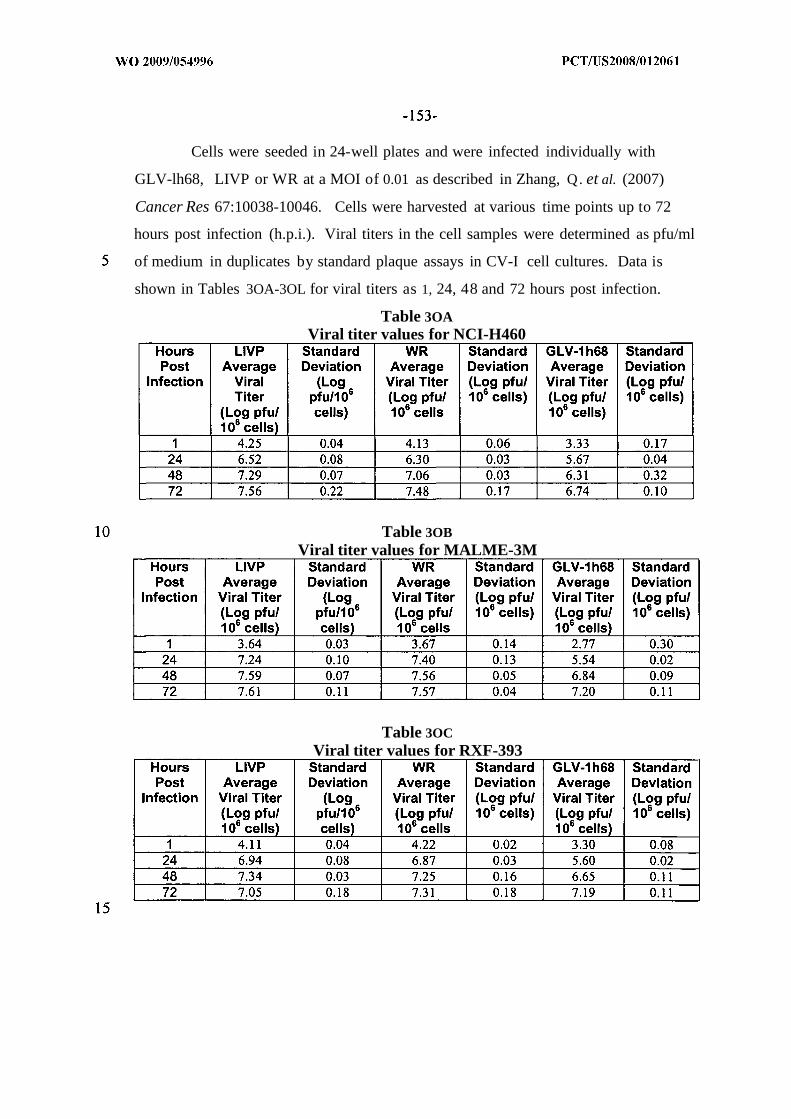
Cells were seeded in 24-well plates and were infected individually with
GLV-lh68, LIVP or WR at a MOI of 0.01 as described in Zhang, Q. et al. (2007)
Cancer Res 67:10038-10046. Cells were harvested at various time points up to 72
hours post infection (h.p.i.). Viral titers in the cell samples were determined as pfu/ml
of medium in duplicates by standard plaque assays in CV-I cell cultures. Data is
shown in Tables 3OA-3OL for viral titers as 1, 24, 48 and 72 hours post infection.
Table 3OAViral titer values for NCI-H460
Table 3OBViral titer values for MALME-3M
Table 3OCViral titer values for RXF-393

Table 3ODViral titer values for NCI-H522
Table 3OEViral titer values for NCI-H322M
Table 3OFViral titer values for NCI-H226
Table 3OGViral titer values for NCI-H23

Table 3OHViral titer values for HOP-92
Table 301Viral titer values for EKVX
Table 3OJViral titer values for A-673
Table 3OKViral titer values for D283/MED

Table 3OLViral titer values for MNNG/HOS
The cell lines were divided into groups of predicted responders and non-
responders based on the ability of the virus to exhibit significant replication within the
cells within 24 hours post infection. Cell types that exhibited an approximate 3-fold
or greater increase in viral titer over input titer were designated as in vitro responders.
Table 31 displays the fold increase in viral titer between consecutive time points.
Table 31Predicted Res onders and Non-responders based on in vitro re lication assa s
h.p.i. = hours post viral infection
Example 20
Comparison of Expression Levels in Between Untreated Tumors
In order to determine whether there were similarities in basal gene expression
levels among tumors that respond favorably to viral therapy versus tumors that
respond poorly to viral therapy, the expression profiles in untreated tumors were
compared. The data from the experiments described in Examples 9 and 10 were used
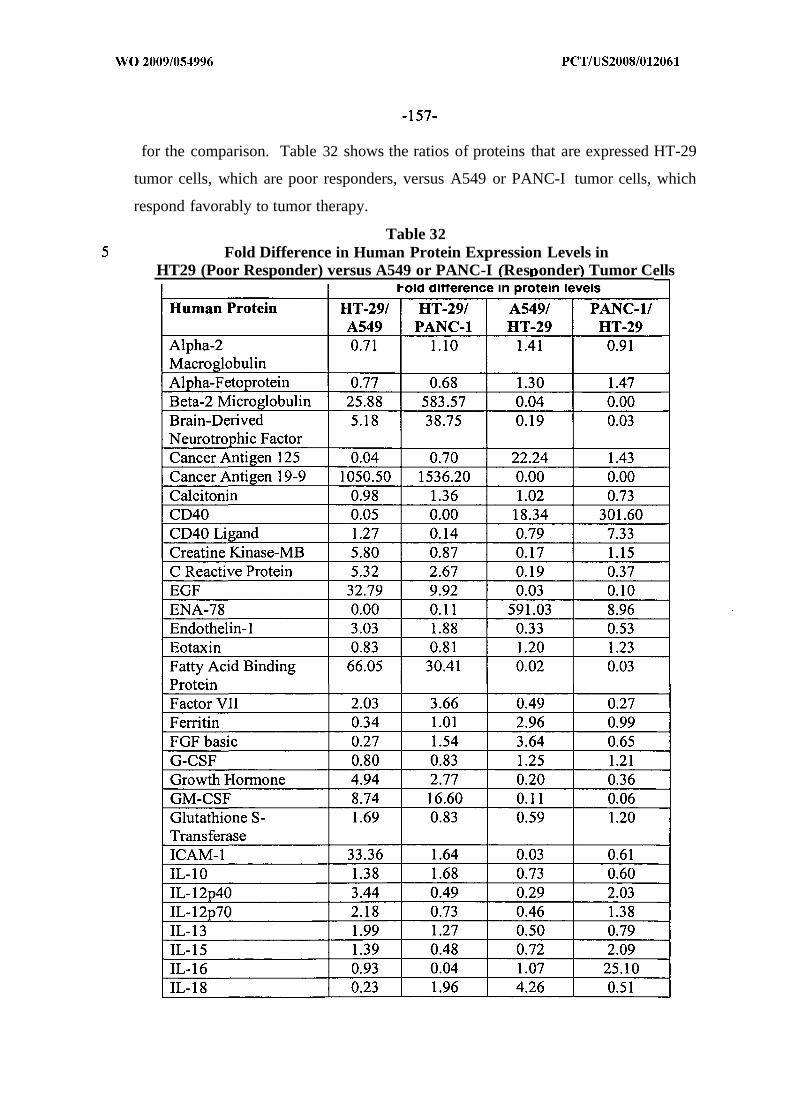
for the comparison. Table 32 shows the ratios of proteins that are expressed HT-29
tumor cells, which are poor responders, versus A549 or PANC-I tumor cells, which
respond favorably to tumor therapy.
Table 32Fold Difference in Human Protein Expression Levels in
HT29 (Poor Responder) versus A549 or PANC-I Res onder Tumor Cells
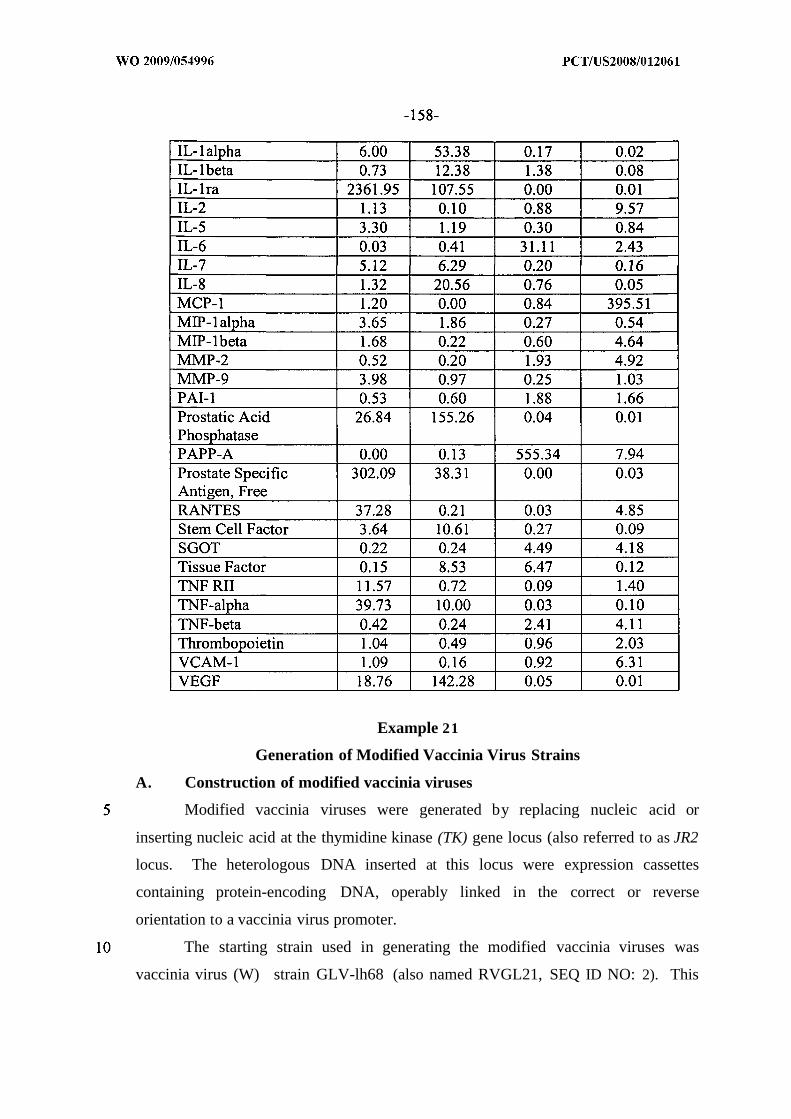
Example 21
Generation of Modified Vaccinia Virus Strains
A. Construction of modified vaccinia viruses
Modified vaccinia viruses were generated by replacing nucleic acid or
inserting nucleic acid at the thymidine kinase (TK) gene locus (also referred to as JR2
locus. The heterologous DNA inserted at this locus were expression cassettes
containing protein-encoding DNA, operably linked in the correct or reverse
orientation to a vaccinia virus promoter.
The starting strain used in generating the modified vaccinia viruses was
vaccinia virus (W) strain GLV-lh68 (also named RVGL21, SEQ ID NO: 2). This

genetically engineered strain, which is described in U.S. Patent Publication No.
2005/0031643, contains DNA insertions in the F14. 5L (also referred to as F3; see
U.S. Patent Publication No. 2005/0031643), thymidine kinase (TK) and
hemagglutinin (HA) genes. GLV-lh68 was prepared from the vaccinia virus strain
designated LIVP (a vaccinia virus strain, originally derived by adapting the Lister
strain (ATCC Catalog No. VR- 1549) to calf skin (Research Institute of Viral
Preparations, Moscow, Russia, Al'tshtein et al. (1983) Dokl. Akad. Nauk USSR
285:696-699). The LIVP strain (genome sequence set forth in SEQ ID NO: 1), from
which GLV- Ih68 was generated, contains a mutation in the coding sequence of the
TK gene (see SEQ ID NO: 1 for the sequence of the LIVP strain) in which a
substitution of a guanine nucleotide with a thymidine nucleotide (nucleotide position
80207 of SEQ ID NO: 1) introduces a premature STOP codon within the coding
sequence.
As described in U.S. Patent Publication No. 2005/0031643 (see particularly
Example 1, therein), GLV-lh68 was generated by inserting expression cassettes
encoding detectable marker proteins into the F14.5L (also designated in LIVP as F3)
gene, thymidine kinase (TK) gene, and hemagglutinin (HA) gene loci of the vaccinia
virus LIVP strain. Specifically, an expression cassette containing a Ruc-GFP cDNA
(a fusion of DNA encoding Renilla luciferase and DNA encoding GFP) under the
control of a vaccinia synthetic early/late promoter P SEL was inserted into the F14.5L
gene; an expression cassette containing DNA encoding beta-galactosidase under the
control of the vaccinia early/late promoter P7.5k (denoted (P7.5k)Z, cZ) and DNA
encoding a rat transferrin receptor positioned in the reverse orientation for
transcription relative to the vaccinia synthetic early/late promoter P SEL (denoted
(P sEL.) ) was inserted into the TK gene (the resulting virus does not express
transferrin receptor protein since the DNA encoding the protein is positioned in the
reverse orientation for transcription relative to the promoter in the cassette); and an
expression cassette containing DNA encoding ^-glucuronidase under the control of
the vaccinia late promoter P 1 (denoted ( gusA) was inserted into the HA gene.
Insertion of the expression cassettes into the LIVP genome in the generation of
GLV- Ih68 resulted in disruption of the coding sequences for each of the F14.5L, TK

and HA genes; accordingly, all three genes in the GLV- Ih68 strain are nonfunctional
in that they do not encode the corresponding full-length proteins. As described in
U.S. Patent Publication No. 2005/0031643, disruption of these genes not only
attenuates the virus but also enhances its tumor-specific accumulation. Previous data
have shown that systemic delivery of the GLV- Ih68 virus in a mouse model of breast
cancer resulted in the complete eradication of large subcutaneous GI-101A human
breast carcinoma xenograft tumors in nude mice (see U.S. Patent Publication No.
2005/0031643).
1. Modified Viral strains
Modified recombinant vaccinia viruses containing heterologous DNA inserted
into the TK locus of the vaccinia virus genome were generated via homologous
recombination between DNA sequences in the genome and a transfer vector using
methods described herein and known to those of skill in the art (see, e.g., Falkner and
Moss (199O) J . Virol. 54:3108-21 11; Chakrabarti et al (1985) MoI. Cell Biol. 5:3403-
3409; and U.S. Patent No. 4,722,848). With these methods, the existing target gene in
the starting vaccinia virus (GLV- Ih68) genome was replaced by an interrupted copy
of the gene contained in each transfer vector through two crossover events: a first
crossover event of homologous recombination between the vaccinia virus genome and
the transfer vector and a second crossover event of homologous recombination
between direct repeats within the target locus. The interrupted version of the target
gene that was in the transfer vector contained the insertion DNA flanked on each side
by DNA corresponding to the left portion of the target gene and right portion of the
target gene, respectively. Each of the transfer vectors also contained a dominant
selection marker, the E .coli guanine phosphoribosyltransferase (gpt) gene, under the
control of a vaccinia virus early promoter (P 7.51CE) Including such a marker in the
vector enabled a transient dominant selection process to identify recombinant virus
grown under selective pressure that has incorporated the transfer vector within its
genome. Because the marker gene was not stably integrated into the genome, it wa
deleted from the genome in a second crossover event that occured when selection was
removed. Thus, the final recombinant virus contained the interrupted version of the

target gene as a disruption of the target loci, but did not retain the selectable marker
from the transfer vector.
Homologous recombination between a transfer vector and the starting vaccinia
virus genome (GLV-Ih68) occurred upon introduction of the transfer vector into cells
that had been infected with the starting vaccinia virus. A series of transfer vectors
was constructed as described below and used in construction of the following
modified vaccinia strains: GLV-lhlO3, GLV-lhl l9, GLV-lhl20 and GLV-lhl21.
The construction of these strains is summarized in the following Table, which lists the
modified vaccinia virus strains, including the previously described GLV-Ih68 (see
section A, above), their respective genotypes, and the transfer vectors used to
engineer the viruses:
Table 33: Generation of engineered vaccinia viruses
Briefly, these strains were generated as follows (further details are provided below):
GLV-lhlO3 was generated by insertion of an expression cassette containing
DNA encoding human monocyte chemoattractant protein-1 (hMCPl; a
chemoattractant that specifically attracts monocytes and memory T cells), under the
control of the vaccinia synthetic late promoter (PSL) , into the TK locus of strain GLV-
Ih68 (parental virus), thereby deleting the LacZ/rTFr expression cassette at the TK
locus of GLV-lh68. Strain GLV-1M03 retains the Ruc-GFP expression cassette at
the F14. 5L locus and the gusA expression cassette at the HA locus.

GLV-IhI 19 was generated by insertion of an expression cassette containing
DNA encoding mouse interferon- γ inducible protein 10 (mIP-10; a potent
chemoattractant for activated T cells and NK cells), under the control of the vaccinia
synthetic early promoter (P SE), into the TK locus of strain GLV- Ih68 (parental virus),
thereby deleting the LacZ/rTFr expression cassette at the TK locus of GLV- Ih68.
Strain GLV-lhl l 9 retains the Ruc-GFP expression cassette at the F14.5L locus and
the gusA expression cassette at the HA locus.
GLV-lhl20 was generated by insertion of an expression cassette containing
DNA encoding mouse interferon- γ inducible protein 10 (mIP-10; a potent
chemoattractant for activated T cells and NK cells), under the control of the vaccinia
synthetic early/late promoter (P SEL) into the TK locus of strain GLV- Ih68 (parental
virus), thereby deleting the LacZ/rTFr expression cassette at the TK locus of GLV-
Ih68. Strain GLV-lhl20 retains the Ruc-GFP expression cassette at the F14.5L locus
and the gusA expression cassette at the HA locus.
GLV-lhl21 was generated by insertion of an expression cassette containing
DNA encoding mouse interferon- γ inducible protein 10 (mIP-10; a potent
chemoattractant for activated T cells and NK cells), under the control of the vaccinia
synthetic late promoter (P SL), into the TK locus of strain GLV- Ih68 (parental virus),
thereby deleting the LacZ/rTFr expression cassette at the TK locus of GLV- Ih68.
Strain GLV-lhl21 retains the Ruc-GFP expression cassette at the F14.5L locus and
the gusA expression cassette at the HA locus.
2. W transfer vectors employed for the production of the modifiedvaccinia viruses
The following vectors were constructed and employed as described below to
generate the recombinant vaccinia viral strains listed in Table 33, above.
a. Construction of the TK-SL-hMCPl transfer vector forinsertion of human MPC-I encoding DNA into the vacciniavirus TK locus
The TK-SL-hMCPl transfer vector (SEQ ID NO: 395) was used to produce
the modified vaccinia virus strain GLV-1M03 (see Table 33, above), which had the
genotype F14.5L: (PSEL)/?wc-GFP; TK: (PSL)A/wcp-i; HA: (Pn k) w . Strain GLV-
lhl03 was generated by inserting DNA (SEQ ID NO: 396) encoding a human
monocyte chemoattractant protein- 1 (hMCP-1) protein (SEQ ID NO: 135) into the TK

locus of strain GLV-Ih68, thereby deleting the rTrfR-LacZ expression cassette at the
TK locus of strain GLV-Ih68. The transfer vector TK-SL-hMCPl , which was used in
this process, contained a DNA fragment encoding the hMCP-1 protein operably
linked to the vaccinia synthetic late promoter (PSL) , sequences of the TK gene flanking
the (PSL) / protein-encoding DNA fragment. The vector was generated as follows:
hMCP-1 cDNA was amplified by PCR (Accu Prime Pfx Supermix) from a
cDNA template (clone encoding Homo sapiens chemokine (C-C motif) ligand 2
(cDNA clone TCl 18317; Origene; SEQ ID NO: 391), using the following primers:
hMCPl-5 (Sal I)
5'-GTCGACGCCACCATGAAAGTCTCTGCCGCCCT-S' (SEQ ID NO:
392); and
hMCPl-3 (Pac I)
5'-TTAATTAATCAAGTCTTCGGAGTTTGGGTTTGC-S' (SEQ ID NO:
393).
These primers contained recognition sites for Sal I and Pac I restriction
enzymes, respectively. The product from this PCR amplification was run on an
agarose gel and purified and cloned into the pCR®- Blunt II-TOPO® vector (SEQ ID
NO: 394) using a Zero Blunt® TOPO® PCR Cloning Kit (Invitrogen™, Carlsbad,
CA). The nucleic acid sequence of the resulting construct, pCRII-hMCPl-2 was
confirmed by sequencing. This pCRII-hMCPl-2 construct was digested with Sal I
and Pac I to release the hMCP-1 cDNA, which then was subcloned into a TK-SL-
CSF4 vector (which contains the cDNA for GM-CSF under the control of the vaccinia
synthetic late promoter flanked by the TK gene regions) that also had been digested
with Sal I and Pac I . Subcloning replaced the GM-CSF cDNA in the TK-SL-CSF4
vector with hMCP-1, thereby placing hMCP-1 under the control of vaccinia synthetic
late promoter (PSL) - The nucleotide sequence of the resulting construct, TK-SL-
hMCPl (SEQ ID NO: 395), was confirmed by sequencing.
b. Construction of the TK-SE-mIPlO-1, TK-SL-mIPlO-1 andTK-SEL-mIPlO-1 transfer vectors for insertion of mouseIP-IO encoding DNA into the vaccinia virus TK locus
The TK-SE-mIPlO-1 (SEQ ID NO: 399), TK-SL-mIPlO-1 (SEQ ID NO: 400)
and TK-SEL-mIPlO-1 (SEQ ID NO: 401) transfer vectors were used to produce the

modified vaccinia virus strains GLV-lhlO3GLV-lhl l9, GLV-lhl21 and GLV-
lhl20, respectively (See Table 33, above). As listed in Table 33, these visurses had
the following genotypes: F14.5L: (? SEL)RUC-GFP, TK: (?SE)mIP-]0 , HA: (Pm)gusA
(GLV-lhl l9); F14.5L: ? SEL)RUC-GFP, TK: (PsOmIP-IO HA: ? )gusA (GLV-
Ihl21); and F14.5L: ( SEL)RUC-GFP, TK: ?SEL)mIP-10, HA: (? Uk)gusA (GLV-
lhl20). Each of the virus strains was generated by inserting DNA (SEQ ID NO: 398)
encoding a mouse interferon-γ inducible protein 10 (mIP-10) (SEQ ID NO: 24) into
the TK locus of strain GLV-Ih68, thereby deleting the rTrfR-LacZ expression cassette
at the TK locus of strain GLV-Ih68.
The three transfer vectors used in this process, TK-SE-mIPlO-1, TK-SL-
mIPlO-1 and TK-SEL-mIPlO-1, contained DNA fragments encoding the mIP-10
protein, operably linked to the vaccinia synthetic early promoter (PSE) synthetic late
promoter (P SL) and synthetic early/late promoter (P SEL) respectively. These transfer
vectors further contained sequences of the TK gene flanking the promoter / protein-
encoding DNA fragment. These transfer vectors were generated as follows:
Mouse IP-10 cDNA was amplified by PCR using a cDNA template (mouse
GenePools cDNA from Biomedomics, Inc. (Research Triangle Park, NC; Catalog
number BM2080-1)), and the following primers:
mIP10-5 (Sal I)
5'-GTCGACGCCACCATGAACCCAAGTGCTGCCGT-S' (SEQ ID NO: 402)
mIP10-3 (Pac I)
5'-TTAATTAATTAAGGAGCCCTTTTAGACCTTTTTTGG-S '(SEQ ID NO: 403).
As indicated, these primers contained the Sal I and Pac I restriction enzyme
recognition sites, respectively. The product from this PCR amplification was run on
an agarose gel, purified and cloned into the pCR®- Blunt II-TOPO® vector (SEQ ID
NO: 394) using a Zero Blunt® TOPO® PCR Cloning Kit (Invitrogen™, Carlsbad,
CA). The nucleotide sequence of the resulting construct, pCRII-mIPlO, was
confirmed by sequencing.
This pCRII-mIPlO construct was digested with Sal I and Pac I to release the
mIP-10 cDNA, which then was subcloned into the TK-SE-CSF-2 (which contains the
cDNA for GM-CSF under the control of the vaccinia synthetic early promoter flanked

by the TK gene regions. SEQ ID NO: 404), TK-SL-CSF4 (which contains the cDNA
for GM-CSF under the control of the vaccinia synthetic late promoter flanked by the
TK gene regions) and TK-SEL-CSF-2 (which contains the cDNA for GM-CSF under
the control of the vaccinia synthetic early/late promoter flanked by the TK gene
regions; SEQ ID NO: 405) vectors (which had been digested with Sal I and Pac I), to
generate the TK-SE-mIPlO-1, TK-SL-mIPlO-1, and TK-SEL-mIPlO-1 transfer
vectors, respectively. Subcloning into TK-SE-CSF-2, TK-SL-CSF4 and TK-SEL-
CSF-2 replaced GM-CSF-encoding cDNA in these vectors with cDNA encoding mlP-
10, thereby placing placing mIP-10 expression under the control of vaccinia synthetic
early SE, late SL, and early/late promoter SEL, respectively. The nucleotide
sequences of the resulting transfer vectors, TK-SE-mIPlO-1, TK-SL-mIPlO-1, and
TK-SEL-mIPlO-1, were confirmed by sequencing.
3. Preparation of recombinant vaccinia viruses
For preparation of the GVL-lhl03, GVL-lhl 19, GVL-lhl20 and GVL-lhl21
modified viruses, CV-I cells, grown in DMEM (Mediatech, Inc., Herndon, VA) with
10% FBS, were infected with the indicated parental viruses (Table 33) at an m.o.i. of
0.1 for 1 hr, then transfected using Lipofectamine 2000 or Fugene (Roche,
Indianapolis, IN) with 2 µg of the corresponding transfer vector (Table 33).
Infected/transfected cells were harvested and the recombinant viruses were selected
using a transient dominant selection system and plaque purified using methods known
in the art (see, e.g., Falkner and Moss, J. Virol, 64, 3108-31 11 (1990)). Isolates were
plaque purified five times with the first two rounds of plaque isolation conducted in
the presence of mycophenolic acid, xanthine and hypoxanthine which permits growth
only of recombinant virus that expressing the selectable marker protein, i.e., E. coli
guanine phosphoribosyltransferase (gpt), under the control of the vaccinia P7.5kE
promoter. Each of the transfer vectors used in the generation of the GVL-lhl03,
GVL-lhl 19, GVL-1M20 and GVL-1M21 recombinant vaccinia viruses contained a
(¥i.5KE)gpt expression cassette. Thus, growth of the virus in the presence of the
selection agents enabled identification of virus in which the first crossover event of
homologous recombination between the transfer vector and the parental strain genome
had occurred. Subsequent growth of the isolates in the absence of selection agents

and further plaque purification yielded isolates that had undergone a second
crossover event resulting in deletion of the DNA encoding guanine
phosphoribosyltransferase from the genome. This was confirmed by the inability of
these isolates to grow in the presence of selection agents.
4. Verification of vaccinia virus strain genotypes
The genotypes of the GVL-lhl03, GVL-1M 19, GVL-1M20 and GVL-lhl21
modified vaccinia virus strains were verified by PCR and restriction enzyme digestion
and lack of expression of 0-galactosidase in these viruses was confirmed by X-gal (5-
bromo-4-chloro-3-indolyl-/3-D-galactopyranoside) staining of the infected cells to
confirm lack of ability to convert the X-gal substrate, as indicated by lack of
development of blue color in the assays compared to a control strain (e.g. GLV-lh68).
Viruses lacking lacZ expression are unable to convert the X-gal substrate. Standard
techniques for X-GIcA and X-gal viral staining and fluorescence microscopy were
employed and are well-known in the art.
B. Vaccinia virus purification
Ten T225 flasks of confluent CV-I cells (seeded at 2 x 10⁷ cells per flask the
day before infection) were infected with each virus at m.o.i. of 0.1. The infected cells
were harvested two days post infection and lysed using a glass Dounce homogenizer.
The cell lysate was clarified by centrifugation at 1,800g for 5 min, and then layered
on a cushion of 36% sucrose, and centrifuged at 13,000 rpm in a HB-6 rotor, Sorvall
RC-5B Refrigerated Superspeed Centrifuge for 2 hours. The virus pellet was
resuspended in 1 ml of 1 mM Tris, pH 9.0, loaded on a sterile 24% to 40% continuous
sucrose gradient, and centrifuged at 26,00Og for 50 min. The virus band was
collected and diluted using 2 volumes of 1 mM Tris, pH 9.0, and then centrifuged at
13,000 rpm in a HB-6 rotor for 60 min. The final virus pellet was resuspended in 1
ml of 1 mM Tris, pH 9.0 and the titer was determined in CV-I cells (ATCC No.
CCL-70).
Since modifications will be apparent to those of skill in this art, it is intended
that this invention be limited only by the scope of the appended claims.

CLAIMS:
1. A method for predicting efficacy of viral therapy for a tumor,
comprising:
determining a replication indicator indicative of the level or amount of
viral replication within a predetermined period of time or as a function of time after
introduction of the a therapeutic virus into tumor cells; and
determining if replication is delayed, wherein if replication is not
delayed, selecting the virus as a candidate therapeutic virus for treatment of the tumor
in a subject.
2. The method of claim 1, wherein delayed replication is assessed by:
infecting a cell culture with a therapeutic virus, wherein the cell culture
comprises cells from a tumor;
after a predetermined time, determining a replication indicator of
replication of the virus in the culture; and
based on the value of the replication indicator, predicting a therapeutic
efficacy of the virus against the tumor.
3. The method of claim 1 or claim 2, wherein the cells are tissue culture
cells or cells from a tumor biopsy or body fluid containing tumor cells.
4. The method of any of claims 1-3 , wherein the virus is an oncolytic
virus.
5. The method of any of claims 1-4, wherein the virus is a vaccinia virus.
6. The method of any of claims 1-5, wherein the virus is LIVP.
7. The methods of any of claims 1-6, wherein the virus is GLV-Ih68.
8. The method of any of claims 2-8, wherein the replication indicator is
compared to a standard indicative of delayed replication or non-delayed.
9. The method of claim 8, wherein the standard is pre-determined.
10. The method of claim 9, wherein the replication indicator is compared
to a database of predetermined values for cell types to determine whether the
replication indicator has a value indicative of non-delayed replication.
11. The method of any of claims 1-10, wherein the tumor cell is selected as
responsive to virus therapy by:

obtaining a first set of values, each of the first set of values
corresponding to a first parameter indicative of in vivo therapeutic effect of a virus on
a cancerous cell line;
obtaining a second set of values, each of the second set of values
corresponding to a second parameter indicative of a replication property of the virus
in the cell line; and
categorizing the cancerous cell lines into two or more groups based at
least in part on the first and second sets of values, the two or more groups
representative of likely responses of respective cell lines to the virus.
12. The method of any of claims 1-1 1, wherein the period comprises a
range of about or zero to 10 days, about or zero to 5 days, about or zero to 2 days,
about or zero to 1 day.
13. The method of claim 12, wherein the period comprises about or less
than 24 hours or 24 hours.
14. The method of any of claims 1-13, wherein the replication indicator is
from among one or more of:
(i) an increasein expression of a viral gene or a heterologous gene
encoded by the virus, wherein an increase in expression is indicative that the tumor
cells are responsive to virus therapy;
(ii) a decrease in expression of a housekeeping gene expressed in the
tumor upon viral expression, wherein a decrease in expression is indicative that the
tumor cells are responsive to virus therapy; or
(iii) a change in expression of a gene expressed by the tumor cells,
wherein a change in expression is indicative that the tumor cells are responsive to
virus therapy
15. The method of claim 14, wherein an increase in gene expression of one
or more genes encoding a protein selected from among IL- 18 (Interleukin-18), MCP-5
(Monocyte Chemoattractant Protein-5; CCL12), IL-1 1 (Interleukin-1 1), MCP-I
(Monocyte Chemoattractant Protein- 1), MPO (Myeloperoxidase), Apo Al
(Apolipoprotein Al), TIMP-I (Tissue Inhibitor of Metalloproteinase Type-1), CRP (C
Reactive Protein), Fibrinogen, MMP-9 (Matrix Metalloproteinase-9), Eotaxin

(CCLI l), GCP-2 (Granulocyte Chemotactic Protein-2; CXCL6), IL-6 (Interleukin-
6), Tissue Factor (TF), SAP (Serum Amyloid P), FGF-basic (Fibroblast Growth
Factor-basic), MCP-3 (Monocyte Chemoattractant Protein-3; CCL7), IP-IO (CXCL
10), MIP-2, Thrombopoetin, Cancer antigen 125, CD40, CD40 ligand, ENA-78,
Ferritin, IL- 12p40, IL-12p70, IL- 16, MMP-2, PAI- 1, TNF RII, TNF-beta and VCAM-
1 indicates that the tumor cells are responsive to virus therapy.
16. The method of claim 15, wherein an increase in gene expression of one
or more genes encoding a protein selected from among MIP-I beta (Macrophage
Inflammatory Protein- 1beta), MDC (Macrophage-Derived Chemokine; CCL22),
MIP- 1alpha (Macrophage Inflammatory Protein- 1alpha; CCL3), KC/GROalpha
(Melanoma Growth Stimulatory Activity Protein), VEGF (Vascular Endothelial Cell
Growth Factor), Endothelin-1, MIP-3 beta (Macrophage Inflammatory Protein-3 beta;
Exodus-3 or ELC), Beta-2 microglobulin, IL-5 (Interleukin-5), IL-I alpha
(Interleukin-1 alpha), EGF (Epidermal Growth Factor), Lymphotactin (XCLl), GM-
CSF (Granulocyte Macrophage-Colony Stimulating Factor), MIP-I gamma
(Macrophage Inflammatory Protein-1gamma; CCL4), IL-I beta (Interleukin-1 beta),
Brain-derived neutrophic factor, Cancer antigen 19-9, Carcinoembryonic antigen, C
reactive protein, EGF, Fatty acid binding protein, Factor VII, Growth hormone, IL-I
alpha, IL-I beta, IL-I ra, IL-7, IL-8, MDC, Prostatic acid phosphatase, Prostate
specific antigen, free, Stem cell factor, Tissue factor, TNF-alpha, VEGF and Von
Willebrand factor, indicates that the tumor cells are not responsive to virus therapy.
17. The method of any of claims 14-16, wherein the expression of two or
more genes is assessed.
18. The method of any of claims 14-17, wherein gene expression is
assessed on an array.
19. The method of any of claims 1-18, further comprising adjusting the
multiplicity of infection to obtain an improved replication indicator from infected
tumor cells.
20. The method of any of claims 1-19, further comprising,
modifying the virus to include a gene that encodes a protein whose
expression is increased in responders compared to non-responders or encodes a gene

product that reduces expression of a protein whose level of expression is increased in
non-responders compared to responders, wherein a responder is a tumor that is
susceptible to treatment with the virus and a non-responder is a tumor the is resistant
to treatment with the virus.
21. A method for increasing the therapeutic efficacy of a therapeutic virus,
comprising:
including in the virus nucleic acid that encodes a protein whose expression is
increased in responders compared to non-responders or encodes a gene product that
reduces expression of a protein whose level of expression is increased in non-
responders compared to responders, wherein a responder is a tumor that is susceptible
to treatment with the virus and a non-responder is a tumor the is resistant to treatment
with the virus.
22. A method of viral therapy, comprising:
administering a therapeutic virus to a subject, wherein the virus encodes a
protein whose expression is increased in responders compared to non-responders or
encodes a gene product that reduces expression of a protein whose level of expression
is increased in non-responders compared to responders, wherein a responder is a
tumor that is susceptible to treatment with the virus and a non-responder is a tumor
the is resistant to treatment with the virus.
23. A method of treating a subject with a non-responder tumor with a
therapeutic virus, comprising:
modifying the virus to encode a protein whose expression is increased in
responders compared to non-responders or encodes a gene product that reduces
expression of a protein whose level of expression is increased in non-responders
compared to responders, wherein a responder is a tumor that is susceptible to
treatment with the virus and a non-responder is a tumor the is resistant to treatment
with the virus; and
administering the modified virus.
24. The method of any of claims 21-23, wherein the gene product
comprises an antisense nucleic acid or ribozyme.

25. A therapeutic virus for use for anti-tumor therapy, wherein the virus
encodes a protein whose expression is increased in responders compared to non-
responders or encodes a gene product that reduces expression of a protein whose level
of expression is increased in non-responders compared to responders, wherein a
responder is a tumor that is susceptible to treatment with the virus and a non-
responder is a tumor the is resistant to treatment with the virus.
26. The virus of claim 25, wherein the gene product comprises an
antisense nucleic acid or ribozyme.
27. The virus of claim 25, wherein the protein is selected from among
TIMP-I, TIMP-2, TIMP-3, MCP-I, and IP-10.
28. The virus of any of claims 25-27, wherein the virus is a vaccinia virus.
29. The virus of claim 28, wherein the virus is an LIVP virus.
30. The virus of claim 29, wherein the virus is GLV-lhl03, GLV-lhl 19,
GLV-lhl20 or GLV-lhl21.
31. A combination, comprising
an array of cell cultures, wherein the cell cultures comprise tumor
cells;
and an oncolytic virus.
32. A pharmaceutical composition comprising any of the viruses of claims
25-30 in a pharmaceutically acceptable carrier.
33. The pharmaceutical composition of claim 32, further comprising a
therapeutic agent.
34. The pharmaceutical composition of claim 33, wherein the therapeutic
agent is an anti-cancer agent.
35. Use of a therapeutic virus of any of claims 25-30 for the formulation of
a medicament for anti-tumor therapy.
36. A method for predicting efficacy of viral therapy for a tumor,
comprising:
determining the level of expression of at least one marker that is increased or
decreased in a responder compared a non-responder in the absence of virus treatment,

wherein a responder is a tumor that is susceptible to treatment with the virus and a
non-responder is a tumor that is not susceptible to treatment with the virus; and
based on the level of expression of the marker, predicting a therapeutic effect
of the virus against the tumor.
37. The method of claim 36, wherein the marker is selected from among
Beta-2 Microglobulin, Brain-Derived Neurotrophic Factor, Cancer Antigen 19-9,
Carcinoembryonic Antigen, C Reactive Protein, EGF, Fatty Acid Binding Protein,
Factor VII, Growth Hormone, GM-CSF, IL-lalpha, IL-lbeta, IL-lra, IL-7, IL-8,
Prostatic Acid Phosphatase, Prostate Specific Antigen, Stem Cell Factor, TNF-alpha
and VEGF.
38. The method of any of claims 1-24, wherein the marker that is increased
in non-responders compared to responders is selected from among Beta-2
Microglobulin, Brain-Derived Neurotrophic Factor, Cancer Antigen 19-9,
Carcinoembryonic Antigen, C Reactive Protein, EGF, Fatty Acid Binding Protein,
Factor VII, Growth Hormone, GM-CSF, IL-I alpha, IL-I beta, IL-I ra, IL-7, IL-8,
Prostatic Acid Phosphatase, Prostate Specific Antigen, Stem Cell Factor, TNF-alpha,
and VEGF.
39. A method of assessing whether a subject will respond favorably or
poorly to a particular viral therapy comprising:
contacting a sample from the subject with a therapeutic virus;
determining whether the level of expression of at least one marker is altered in
response to the virus, wherein the marker is a marker that is altered in a responder
compared to a non-responder; and
based on whether the level of expression of the marker is altered, predicting
whether a subject is likely to respond favorably or poorly to viral therapy.
40. The method of claim 39, wherein the determining step comprises
comparing the level of expression of the marker in the sample which has been
contacted with the virus to the level of expression of the marker in a sample which has
not been contacted with the virus.
4 1. The method of claim 39 or claim 40, wherein the determining step
comprises culturing the sample contacted with the virus in vitro.

42. The method of any of claims 39-41 , wherein the sample comprises
tumor cells.
43. The method of any of claims 39-42, wherein the level of expression of
the at least one marker is indicative of a favorable or a poor response to viral therapy.
44. The method of any of claims 39-43, wherein the at least one marker is
selected from among IL- 18, MCP-5, IL-Il, MCP-I, MPO, Apo Al, TIMP-I (Tissue
Inhibitor of Metalloproteinase Type-1), CRP (C Reactive Protein), Fibrinogen, MMP-
9 (Matrix Metalloproteinase-9), Eotaxin (CCLl 1), GCP-2 (Granulocyte Chemotactic
Protein-2; CXCL6), IL-6 (Interleukin-6), Tissue Factor (TF), SAP (Serum Amyloid
P), FGF-basic (Fibroblast Growth Factor-basic), MCP-3 (Monocyte Chemoattractant
Protein-3; CCL7), IP-IO (CXCL 10), MIP-2, Thrombopoetin, Cancer antigen 125,
CD40, CD40 ligand, ENA-78, Ferritin, IL-12p40, IL-12p70, IL-16, MMP-2, PAI-I,
TNF RII, TNF-beta and VCAM-I, MIP-lbeta (Macrophage Inflammatory Protein-
lbeta), MDC (Macrophage-Derived Chemokine; CCL22), MIP-I alpha (Macrophage
Inflammatory Protein- 1alpha; CCL3), KC/GROalpha (Melanoma Growth Stimulatory
Activity Protein), VEGF (Vascular Endothelial Cell Growth Factor), Endothelin-1,
MIP-3 beta (Macrophage Inflammatory Protein-3 beta; Exodus-3 or ELC), Beta-2
microglobulin, IL-5 (Interleukin-5), IL-I alpha (Interleukin-1 alpha), EGF (Epidermal
Growth Factor), Lymphotactin (XCLl), GM-CSF (Granulocyte Macrophage-Colony
Stimulating Factor), MIP-I gamma (Macrophage Inflammatory Protein- 1gamma;
CCL4), IL-I beta (Interleukin-1 beta), Brain-derived neutrophic factor, Cancer antigen
19-9, Carcinoembryonic antigen, C reactive protein, EGF, Fatty acid binding protein,
Factor VII, Growth hormone, IL-I alpha, IL-I beta, IL-I ra, IL-7, IL-8, MDC,
Prostatic acid phosphatase, Prostate specific antigen, Stem cell factor, Tissue factor,
TNF-alpha, VEGF, Von Willebrand factor, IgA (Immunoglobulin A), Haptoglobin,
MIP-2 (Macrophage Inflammatory Protein-2), IL- 17 (Interleukin-1 7), SGOT (Serum
Glutamic-Oxaloacetic Transaminase), IP-IO (Inducible Protein- 10), IL-10, FGF-9
(Fibroblast Growth Factor-9), M-CSF (Macrophage-Colony Stimulating Factor), IL-4
(Interleukin-4), IL-3 (Interleukin-3), TPO (Thrombopoietin), SCF (Stem Cell Factor),
LIF (Leukemia Inhibitory Factor), IL-2 (Interleukin-2), VCAM-I (Vascular Cell
Adhesion Molecule- 1; CD106) and TNF alpha and OSM (Oncostatin M).
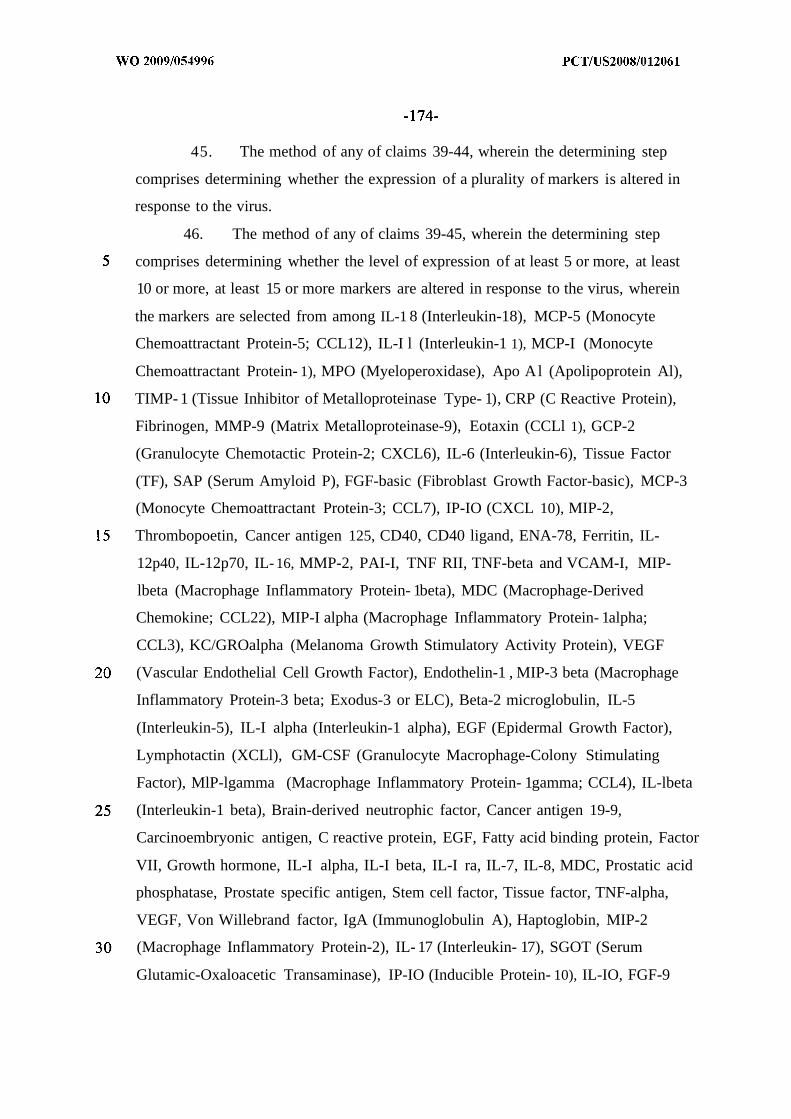
45. The method of any of claims 39-44, wherein the determining step
comprises determining whether the expression of a plurality of markers is altered in
response to the virus.
46. The method of any of claims 39-45, wherein the determining step
comprises determining whether the level of expression of at least 5 or more, at least
10 or more, at least 15 or more markers are altered in response to the virus, wherein
the markers are selected from among IL-1 8 (Interleukin-18), MCP-5 (Monocyte
Chemoattractant Protein-5; CCL12), IL-I l (Interleukin-1 1), MCP-I (Monocyte
Chemoattractant Protein- 1), MPO (Myeloperoxidase), Apo Al (Apolipoprotein Al),
TIMP- 1 (Tissue Inhibitor of Metalloproteinase Type- 1), CRP (C Reactive Protein),
Fibrinogen, MMP-9 (Matrix Metalloproteinase-9), Eotaxin (CCLl 1), GCP-2
(Granulocyte Chemotactic Protein-2; CXCL6), IL-6 (Interleukin-6), Tissue Factor
(TF), SAP (Serum Amyloid P), FGF-basic (Fibroblast Growth Factor-basic), MCP-3
(Monocyte Chemoattractant Protein-3; CCL7), IP-IO (CXCL 10), MIP-2,
Thrombopoetin, Cancer antigen 125, CD40, CD40 ligand, ENA-78, Ferritin, IL-
12p40, IL-12p70, IL- 16, MMP-2, PAI-I, TNF RII, TNF-beta and VCAM-I, MIP-
lbeta (Macrophage Inflammatory Protein- 1beta), MDC (Macrophage-Derived
Chemokine; CCL22), MIP-I alpha (Macrophage Inflammatory Protein- 1alpha;
CCL3), KC/GROalpha (Melanoma Growth Stimulatory Activity Protein), VEGF
(Vascular Endothelial Cell Growth Factor), Endothelin-1 , MIP-3 beta (Macrophage
Inflammatory Protein-3 beta; Exodus-3 or ELC), Beta-2 microglobulin, IL-5
(Interleukin-5), IL-I alpha (Interleukin-1 alpha), EGF (Epidermal Growth Factor),
Lymphotactin (XCLl), GM-CSF (Granulocyte Macrophage-Colony Stimulating
Factor), MlP-lgamma (Macrophage Inflammatory Protein- 1gamma; CCL4), IL-lbeta
(Interleukin-1 beta), Brain-derived neutrophic factor, Cancer antigen 19-9,
Carcinoembryonic antigen, C reactive protein, EGF, Fatty acid binding protein, Factor
VII, Growth hormone, IL-I alpha, IL-I beta, IL-I ra, IL-7, IL-8, MDC, Prostatic acid
phosphatase, Prostate specific antigen, Stem cell factor, Tissue factor, TNF-alpha,
VEGF, Von Willebrand factor, IgA (Immunoglobulin A), Haptoglobin, MIP-2
(Macrophage Inflammatory Protein-2), IL- 17 (Interleukin- 17), SGOT (Serum
Glutamic-Oxaloacetic Transaminase), IP-IO (Inducible Protein- 10), IL-IO, FGF-9

(Fibroblast Growth Factor-9), M-CSF (Macrophage-Colony Stimulating Factor), IL-
4 (Interleukin-4), IL-3 (Interleukin-3), TPO (Thrombopoietin), SCF (Stem Cell
Factor), LIF (Leukemia Inhibitory Factor), IL-2 (Interleukin-2), VCAM-I (Vascular
Cell Adhesion Molecule- 1; CD 106) and TNF alpha and OSM (Oncostatin M).
47. The method of any of claims 39-46, wherein the determining step
comprises determining whether the level of expression of at least one marker is
increased in response to the virus, wherein the at least one marker is selected from
among IL- 18 (Interleukin-18), MCP-5 (Monocyte Chemoattractant Protein-5;
CCL12), IL-1 1 (Interleukin-1 1), MCP-I (Monocyte Chemoattractant Protein-1), MPO
(Myeloperoxidase), Apo A l (Apolipoprotein Al), TIMP-I (Tissue Inhibitor of
Metalloproteinase Type-1), CRP (C Reactive Protein), Fibrinogen, MMP-9 (Matrix
Metalloproteinase-9), Eotaxin (CCLl 1), GCP-2 (Granulocyte Chemotactic Protein-2;
CXCL6), IL-6 (Interleukin-6), Tissue Factor (TF), SAP (Serum Amyloid P), FGF-
basic (Fibroblast Growth Factor-basic), MCP-3 (Monocyte Chemoattractant Protein-
3; CCL7), IP-IO (CXCL 10), MIP-2, Thrombopoetin, Cancer antigen 125, CD40,
CD40 ligand, ENA-78, Ferritin, IL-12p40, IL-12p70, IL- 16, MMP-2, PAI-I, TNF
RII, TNF-beta and VCAM-I.
48. The method of any of claims 39-46, wherein the determining step
comprises determining whether the level of expression of at least one marker is
decreased in response to the virus, wherein the at least one marker is selected from
among MIP-I beta (Macrophage Inflammatory Protein-1 beta), MDC (Macrophage-
Derived Chemokine; CCL22), MIP-I alpha (Macrophage Inflammatory Protein-
1alpha; CCL3), KC/GROalpha (Melanoma Growth Stimulatory Activity Protein),
VEGF (Vascular Endothelial Cell Growth Factor), Endothelin-1, MIP-3 beta
(Macrophage Inflammatory Protein-3 beta; Exodus-3 or ELC), Beta-2 microglobulin,
IL-5 (Interleukin-5), IL-I alpha (Interleukin-1 alpha), EGF (Epidermal Growth
Factor), Lymphotactin (XCLl), GM-CSF (Granulocyte Macrophage-Colony
Stimulating Factor), MIP-I gamma (Macrophage Inflammatory Protein-1 gamma;
CCL4), IL-I beta (Interleukin-1 beta), Brain-derived neutrophic factor, Cancer antigen
19-9, Carcinoembryonic antigen, C reactive protein, EGF, Fatty acid binding protein,
Factor VII, Growth hormone, IL-I alpha, IL-I beta, IL-I ra, IL-7, IL-8, MDC,

Prostatic acid phosphatase, Prostate specific antigen, free, Stem cell factor, Tissue
factor, TNF-alpha, VEGF and Von Willebrand factor.
49. The method of claim 39, wherein the therapeutic virus is GLV- Ih68 or
comprises a virus of any one of claims 25-30.
50. A method of assessing whether a candidate virus will be effective in
viral therapy comprising determining whether the candidate virus alters the level of
expression of at least one marker in a cell contacted with the candidate virus, wherein
the cell is known to be responsive to viral therapy vectors; and
based on whether the level of expression of the marker is altered, predicting
whether candidate virus will be effective for viral therapy.
51. The method of claim 50, wherein the determining step comprises
comparing the level of expression of the marker in the cell contacted with the
candidate virus to the level of expression of the marker in a cell not contacted with the
candidate virus.
52. The method of claim 50 or claim 51, wherein the determining step
comprises culturing the cell contacted with the virus in vitro.
53. The method of any of claims 50-52, wherein the determining step
comprises culturing the cell contacted with the virus in vivo.
54. The method of any of claims 50-53, wherein the marker is selected
from among IL- 18 (Interleukin-18), MCP-5 (Monocyte Chemoattractant Protein-5;
CCLl 2), IL-1 1 (Interleukin-1 1), MCP-I (Monocyte Chemoattractant Protein- 1), MPO
(Myeloperoxidase), Apo A l (Apolipoprotein Al), TIMP-I (Tissue Inhibitor of
Metalloproteinase Type-1), CRP (C Reactive Protein), Fibrinogen, MMP-9 (Matrix
Metalloproteinase-9), Eotaxin (CCLl 1), GCP-2 (Granulocyte Chemotactic Protein-2;
CXCL6), IL-6 (Interleukin-6), Tissue Factor (TF), SAP (Serum Amyloid P), FGF-
basic (Fibroblast Growth Factor-basic), MCP-3 (Monocyte Chemoattractant Protein-
3; CCL7), IP-10 (CXCL 10), MIP-2, Thrombopoetin, Cancer antigen 125, CD40,
CD40 ligand, ENA-78, Ferritin, IL-12p40, IL-12p70, IL-16, MMP-2, PAI-I, TNF
RII, TNF-beta and VCAM-I, MIP-lbeta (Macrophage Inflammatory Protein- 1beta),
MDC (Macrophage-Derived Chemokine; CCL22), MIP-I alpha (Macrophage
Inflammatory Protein- 1alpha; CCL3), KC/GROalpha (Melanoma Growth Stimulatory

Activity Protein), VEGF (Vascular Endothelial Cell Growth Factor), Endothelin-1,
MIP-3 beta (Macrophage Inflammatory Protein-3 beta; Exodus-3 or ELC), Beta-2
microglobulin, IL-5 (Interleukin-5), IL-I alpha (Interleukin-1 alpha), EGF (Epidermal
Growth Factor), Lymphotactin (XCLl), GM-CSF (Granulocyte Macrophage-Colony
Stimulating Factor), MIP- 1gamma (Macrophage Inflammatory Protein- 1gamma;
CCL4), IL-I beta (Interleukin-1 beta), Brain-derived neutrophic factor, Cancer antigen
19-9, Carcinoembryonic antigen, C reactive protein, EGF, Fatty acid binding protein,
Factor VII, Growth hormone, IL-I alpha, IL-I beta, IL-I ra, IL-7, IL-8, MDC,
Prostatic acid phosphatase, Prostate specific antigen, Stem cell factor, Tissue factor,
TNF-alpha, VEGF, Von Willebrand factor, IgA (Immunoglobulin A), Haptoglobin,
MIP-2 (Macrophage Inflammatory Protein-2), IL- 17 (Interleukin-1 7), SGOT (Serum
Glutamic-Oxaloacetic Transaminase), IP-IO (Inducible Protein- 10), IL-IO, FGF-9
(Fibroblast Growth Factor-9), M-CSF (Macrophage-Colony Stimulating Factor), IL-4
(Interleukin-4), IL-3 (Interleukin-3), TPO (Thrombopoietin), SCF (Stem Cell Factor),
LIF (Leukemia Inhibitory Factor), IL-2 (Interleukin-2), VCAM-I (Vascular Cell
Adhesion Molecule- 1; CD 106) and TNF alpha and OSM (Oncostatin M).
55. The method of any of claims 50-54, wherein the determining step
comprises determining whether the level of expression of a plurality of markers is
altered in response to the virus.
56. The method of any of claims 50-55, wherein the determining step
comprises determining whether the level of expression of at least 5 or more, at least
10 or more, or at least 15 or more markers is altered in response to the virus, wherein
the markers are selected from among IL- 18 (Interleukin-1 8), MCP-5 (Monocyte
Chemoattractant Protein-5; CCL12), IL-I l (Interleukin-1 1), MCP-I (Monocyte
Chemoattractant Protein-1), MPO (Myeloperoxidase), Apo A l (Apolipoprotein Al),
TIMP-I (Tissue Inhibitor of Metalloproteinase Type-1), CRP (C Reactive Protein),
Fibrinogen, MMP-9 (Matrix Metalloproteinase-9), Eotaxin (CCLl 1), GCP-2
(Granulocyte Chemotactic Protein-2; CXCL6), IL-6 (Interleukin-6), Tissue Factor
(TF), SAP (Serum Amyloid P), FGF-basic (Fibroblast Growth Factor-basic), MCP-3
(Monocyte Chemoattractant Protein-3 ; CCL7), IP- 10 (CXCL 10), MIP-2,
Thrombopoetin, Cancer antigen 125, CD40, CD40 ligand, ENA-78, Ferritin, IL-

12p40, IL-12p70, IL- 16, MMP-2, PAI-I, TNF RII, TNF-beta and VCAM-I, MIP-
lbeta (Macrophage Inflammatory Protein- 1beta), MDC (Macrophage-Derived
Chemokine; CCL22), MIP-lalpha (Macrophage Inflammatory Protein- 1alpha;
CCL3), KC/GROalpha (Melanoma Growth Stimulatory Activity Protein), VEGF
(Vascular Endothelial Cell Growth Factor), Endothelin-1 , MIP-3 beta (Macrophage
Inflammatory Protein-3 beta; Exodus-3 or ELC), Beta-2 microglobulin, IL-5
(Interleukin-5), IL-I alpha (Interleukin-1 alpha), EGF (Epidermal Growth Factor),
Lymphotactin (XCLl), GM-CSF (Granulocyte Macrophage-Colony Stimulating
Factor), MIP-I gamma (Macrophage Inflammatory Protein- 1gamma; CCL4), IL-lbeta
(Interleukin-1 beta), Brain-derived neutrophic factor, Cancer antigen 19-9,
Carcinoembryonic antigen, C reactive protein, EGF, Fatty acid binding protein, Factor
VII, Growth hormone, IL-I alpha, IL-I beta, IL-I ra, IL-7, IL-8, MDC, Prostatic acid
phosphatase, Prostate specific antigen, Stem cell factor, Tissue factor, TNF-alpha,
VEGF, Von Willebrand factor, IgA (Immunoglobulin A), Haptoglobin, MIP-2
(Macrophage Inflammatory Protein-2), IL-17 (Interleukin- 17), SGOT (Serum
Glutamic-Oxaloacetic Transaminase), IP-IO (Inducible Protein- 10), IL-IO, FGF-9
(Fibroblast Growth Factor-9), M-CSF (Macrophage-Colony Stimulating Factor), IL-4
(Interleukin-4), IL-3 (Interleukin-3), TPO (Thrombopoietin), SCF (Stem Cell Factor),
LIF (Leukemia Inhibitory Factor), IL-2 (Interleukin-2), VCAM-I (Vascular Cell
Adhesion Molecule- 1; CD106) and TNF alpha and OSM (Oncostatin M).
57. The method of any of claims 50-56, wherein the determining step
comprises determining whether the level of expression of at least one marker is
increased in response to the virus, wherein the at least one marker is selected from
among IL- 18 (Interleukin- 18), MCP-5 (Monocyte Chemoattractant Protein-5;
CCL12), IL-1 1 (Interleukin-1 1), MCP-I (Monocyte Chemoattractant Protein-1), MPO
(Myeloperoxidase), Apo Al (Apolipoprotein Al), TIMP-I (Tissue Inhibitor of
Metalloproteinase Type-1), CRP (C Reactive Protein), Fibrinogen, MMP-9 (Matrix
Metalloproteinase-9), Eotaxin (CCLl 1), GCP-2 (Granulocyte Chemotactic Protein-2;
CXCL6), IL-6 (Interleukin-6), Tissue Factor (TF), SAP (Serum Amyloid P), FGF-
basic (Fibroblast Growth Factor-basic), MCP-3 (Monocyte Chemoattractant Protein-
3; CCL7), IP-IO (CXCL 10), MIP-2, Thrombopoetin, Cancer antigen 125, CD40,

CD40 ligand, ENA-78, Ferritin, IL-12p40, IL-12p70, IL- 16, MMP-2, PAI-I, TNF
RII, TNF-beta and VCAM-I.
58. The method of any of claims 50-56, wherein the determining step
comprises determining whether the level of expression of at least one marker is
decreased in response to the virus, wherein the at least one marker is selected from
among MIP-I beta (Macrophage Inflammatory Protein- 1beta), MDC (Macrophage-
Derived Chemokine; CCL22), MIP-I alpha (Macrophage Inflammatory Protein-
1alpha; CCL3), KC/GROalpha (Melanoma Growth Stimulatory Activity Protein),
VEGF (Vascular Endothelial Cell Growth Factor), Endothelin-1, MIP-3 beta
(Macrophage Inflammatory Protein-3 beta; Exodus-3 or ELC), Beta-2 microglobulin,
IL-5 (Interleukin-5), IL-I alpha (Interleukin-1 alpha), EGF (Epidermal Growth
Factor), Lymphotactin (XCLl), GM-CSF (Granulocyte Macrophage-Colony
Stimulating Factor), MIP-I gamma (Macrophage Inflammatory Protein- 1gamma;
CCL4), IL-I beta (Interleukin-1 beta), Brain-derived neutrophic factor, Cancer antigen
19-9, Carcinoembryonic antigen, C reactive protein, EGF, Fatty acid binding protein,
Factor VII, Growth hormone, IL-I alpha, IL-I beta, IL-I ra, IL-7, IL-8, MDC,
Prostatic acid phosphatase, Prostate specific antigen, free, Stem cell factor, Tissue
factor, TNF-alpha, VEGF and Von Willebrand factor..
59. The method of claim 50, wherein the therapeutic virus is GLV-lh68 or
comprises a virus of any one of claims 25-30.
60. A method of monitoring the progress of viral therapy in a subject
comprising determining whether the level of expression of at least one marker is
altered in the subject at a plurality of time points; and
based on whether the level of expression of the marker is altered, making an
assessment of whether the viral therapy is effective.
61. The method of claim 60, wherein the determining step comprises
comparing the level of expression of the marker in a first sample to the level of
expression of the marker in at least a second sample obtained from the subject
subsequent to the time at which the first sample was obtained.
62. The method of claim 60 or claim 61, wherein one of the time points is
prior to or at about the same time as beginning the viral therapy.

63. The method of any of claims 60-62, wherein at least one of the time
points is during the viral therapy.
64. The method of any of claims 60-63, wherein the at least one marker is
known to be altered in response to viral therapy in the host.
65. The method of claim 64, wherein the at least one marker is selected
from among IL-1 8 (Interleukin-18), MCP-5 (Monocyte Chemoattractant Protein-5;
CCL12), IL-Il (Interleukin-1 1), MCP-I (Monocyte Chemoattractant Protein-1), MPO
(Myeloperoxidase), Apo A l (Apolipoprotein Al), TIMP-I (Tissue Inhibitor of
Metalloproteinase Type-1), CRP (C Reactive Protein), Fibrinogen, MMP-9 (Matrix
Metalloproteinase-9), Eotaxin (CCL 11), GCP-2 (Granulocyte Chemotactic Protein-2 ;
CXCL6), IL-6 (Interleukin-6), Tissue Factor (TF), SAP (Serum Amyloid P), FGF-
basic (Fibroblast Growth Factor-basic), MCP-3 (Monocyte Chemoattractant Protein-
3; CCL7), IP-IO (CXCL 10), MIP-2, Thrombopoetin, Cancer antigen 125, CD40,
CD40 ligand, ENA-78, Ferritin, IL-12p40, IL-12p70, IL- 16, MMP-2, PAI-I, TNF
RII, TNF-beta and VCAM- 1, MIP- 1beta (Macrophage Inflammatory Protein- 1beta),
MDC (Macrophage-Derived Chemokine; CCL22), MIP-I alpha (Macrophage
Inflammatory Protein-1 alpha; CCL3), KC/GROalpha (Melanoma Growth Stimulatory
Activity Protein), VEGF (Vascular Endothelial Cell Growth Factor), Endothelin-1,
MIP-3 beta (Macrophage Inflammatory Protein-3 beta; Exodus-3 or ELC), Beta-2
microglobulin, IL-5 (Interleukin-5), IL-I alpha (Interleukin-1 alpha), EGF (Epidermal
Growth Factor), Lymphotactin (XCLl), GM-CSF (Granulocyte Macrophage-Colony
Stimulating Factor), MIP-I gamma (Macrophage Inflammatory Protein-1 gamma;
CCL4), IL-I beta (Interleukin-1 beta), Brain-derived neutrophic factor, Cancer antigen
19-9, Carcinoembryonic antigen, C reactive protein, EGF, Fatty acid binding protein,
Factor VII, Growth hormone, IL-I alpha, IL-I beta, IL-I ra, IL-7, IL-8, MDC,
Prostatic acid phosphatase, Prostate specific antigen, Stem cell factor, Tissue factor,
TNF-alpha, VEGF, Von Willebrand factor, IgA (Immunoglobulin A), Haptoglobin,
MIP-2 (Macrophage Inflammatory Protein-2), IL- 17 (Interleukin-1 7), SGOT (Serum
Glutamic-Oxaloacetic Transaminase), IP-IO (Inducible Protein- 10), IL-10, FGF-9
(Fibroblast Growth Factor-9), M-CSF (Macrophage-Colony Stimulating Factor), IL-4
(Interleukin-4), IL-3 (Interleukin-3), TPO (Thrombopoietin), SCF (Stem Cell Factor),

LIF (Leukemia Inhibitory Factor), IL-2 (Interleukin-2), VCAM-I (Vascular Cell
Adhesion Molecule-1; CD106) and TNF alpha and OSM (Oncostatin M).
66. The method of any of claims 60-63, wherein the determining step
comprises determining whether the level of expression of a plurality of markers is
altered in response to the virus.
67. The method of any of claims 60-66, wherein the determining step
comprises determining whether the level of expression of at least 5 or more, at least
10 or more, or at least 15 or more markers is altered in response to the virus, wherein
the markers are selected from among IL- 18 (Interleukin-18), MCP-5 (Monocyte
Chemoattractant Protein-5 ; CCLl 2), IL-11 (Interleukin- 11), MCP- 1 (Monocyte
Chemoattractant Protein-1), MPO (Myeloperoxidase), Apo Al (Apolipoprotein Al),
TIMP-I (Tissue Inhibitor of Metalloproteinase Type-1), CRP (C Reactive Protein),
Fibrinogen, MMP-9 (Matrix Metalloproteinase-9), Eotaxin (CCLI l), GCP-2
(Granulocyte Chemotactic Protein-2; CXCL6), IL-6 (Interleukin-6), Tissue Factor
(TF), SAP (Serum Amyloid P), FGF-basic (Fibroblast Growth Factor-basic), MCP-3
(Monocyte Chemoattractant Protein-3; CCL7), IP-IO (CXCL 10), MIP-2,
Thrombopoetin, Cancer antigen 125, CD40, CD40 ligand, ENA-78, Ferritin, IL-
12p40, IL-12p70, IL- 16, MMP-2, PAI-I, TNF RII, TNF-beta and VCAM-I, MIP-
lbeta (Macrophage Inflammatory Protein-1beta), MDC (Macrophage-Derived
Chemokine; CCL22), MIP- 1alpha (Macrophage Inflammatory Protein- 1alpha;
CCL3), KC/GROalpha (Melanoma Growth Stimulatory Activity Protein), VEGF
(Vascular Endothelial Cell Growth Factor), Endothelin-1, MIP-3 beta (Macrophage
Inflammatory Protein-3 beta; Exodus-3 or ELC), Beta-2 microglobulin, IL-5
(Interleukin-5), IL-I alpha (Interleukin- 1 alpha), EGF (Epidermal Growth Factor),
Lymphotactin (XCLl), GM-CSF (Granulocyte Macrophage-Colony Stimulating
Factor), MIP-I gamma (Macrophage Inflammatory Protein-1 gamma; CCL4), IL-I beta
(Interleukin- 1 beta), Brain-derived neutrophic factor, Cancer antigen 19-9,
Carcinoembryonic antigen, C reactive protein, EGF, Fatty acid binding protein, Factor
VII, Growth hormone, IL-I alpha, IL-I beta, IL-I ra, IL-7, IL-8, MDC, Prostatic acid
phosphatase, Prostate specific antigen, Stem cell factor, Tissue factor, TNF-alpha,
VEGF, Von Willebrand factor, IgA (Immunoglobulin A), Haptoglobin, MIP-2

(Macrophage Inflammatory Protein-2), IL- 17 (Interleukin-17), SGOT (Serum
Glutamic-Oxaloacetic Transaminase), IP-IO (Inducible Protein-10), IL-IO, FGF-9
(Fibroblast Growth Factor-9), M-CSF (Macrophage-Colony Stimulating Factor), IL-4
(Interleukin-4), IL-3 (Interleukin-3), TPO (Thrombopoietin), SCF (Stem Cell Factor),
LIF (Leukemia Inhibitory Factor), IL-2 (Interleukin-2), VCAM-I (Vascular Cell
Adhesion Molecule- 1; CD106) and TNF alpha and OSM (Oncostatin M).
68. The method of any of claims 60-67, wherein the determining step
comprises determining whether the level expression of at least one marker is
increased in response to the virus, wherein the at least one marker is selected from
among IL- 18 (Interleukin- 18), MCP-5 (Monocyte Chemoattractant Protein-5;
CCL12), IL-1 1 (Interleukin- 11), MCP-I (Monocyte Chemoattractant Protein-1), MPO
(Myeloperoxidase), Apo A l (Apolipoprotein Al), TIMP-I (Tissue Inhibitor of
Metalloproteinase Type-1), CRP (C Reactive Protein), Fibrinogen, MMP-9 (Matrix
Metalloproteinase-9), Eotaxin (CCLl 1), GCP-2 (Granulocyte Chemotactic Protein-2;
CXCL6), IL-6 (Interleukin-6), Tissue Factor (TF), SAP (Serum Amyloid P), FGF-
basic (Fibroblast Growth Factor-basic), MCP-3 (Monocyte Chemoattractant Protein-
3; CCL7), IP-IO (CXCL 10), MIP-2, Thrombopoetin, Cancer antigen 125, CD40,
CD40 ligand, ENA-78, Ferritin, IL-12p40, IL-12p70, IL- 16, MMP-2, PAI-I, TNF
RII, TNF-beta and VCAM-I.
69. The method of any of claims 60-67, wherein the determining step
comprises determining whether the level expression of at least one marker is
decreased in response to the virus, wherein the at least one marker is selected from
among MIP-lbeta (Macrophage Inflammatory Protein-1beta), MDC (Macrophage-
Derived Chemokine; CCL22), MIP-I alpha (Macrophage Inflammatory Protein-
1alpha; CCL3), KC/GROalpha (Melanoma Growth Stimulatory Activity Protein),
VEGF (Vascular Endothelial Cell Growth Factor), Endothelin-1, MIP-3 beta
(Macrophage Inflammatory Protein-3 beta; Exodus-3 or ELC), Beta-2 microglobulin,
IL-5 (Interleukin-5), IL-I alpha (Interleukin- 1 alpha), EGF (Epidermal Growth
Factor), Lymphotactin (XCLl), GM-CSF (Granulocyte Macrophage-Colony
Stimulating Factor), MIP-I gamma (Macrophage Inflammatory Protein-1 gamma;
CCL4), IL-I beta (Interleukin- 1 beta), Brain-derived neutrophic factor, Cancer antigen

19-9, Carcinoembryonic antigen, C reactive protein, EGF, Fatty acid binding protein,
Factor VII, Growth hormone, IL-I alpha, IL-I beta, IL-I ra, IL-7, IL-8, MDC,
Prostatic acid phosphatase, Prostate specific antigen, free, Stem cell factor, Tissue
factor, TNF-alpha, VEGF and Von Willebrand factor.
70. A combination, comprising:
a therapeutic virus of any one of claims 25-30; and
a reagent to assess expression of at least one marker selected from
among IL- 18 (Interleukin-18), MCP-5 (Monocyte Chemoattractant Protein-5;
CCL12), IL-1 1 (Interleukin-1 1), MCP-I (Monocyte Chemoattractant Protein-1), MPO
(Myeloperoxidase), Apo A l (Apolipoprotein Al), TIMP-I (Tissue Inhibitor of
Metalloproteinase Type-1), CRP (C Reactive Protein), Fibrinogen, MMP-9 (Matrix
Metalloproteinase-9), Eotaxin (CCLI l), GCP-2 (Granulocyte Chemotactic Protein-2;
CXCL6), IL-6 (Interleukin-6), Tissue Factor (TF), SAP (Serum Amyloid P), FGF-
basic (Fibroblast Growth Factor-basic), MCP-3 (Monocyte Chemoattractant Protein-
3; CCL7), IP-10 (CXCL 10), MIP-2, Thrombopoetin, Cancer antigen 125, CD40,
CD40 ligand, ENA-78, Ferritin, IL-12p40, IL-12p70, IL- 16, MMP-2, PAI-I, TNF
RII, TNF-beta and VCAM-I, MIP-lbeta (Macrophage Inflammatory Protein- lbeta),
MDC (Macrophage-Derived Chemokine; CCL22), MIP-I alpha (Macrophage
Inflammatory Protein-1 alpha; CCL3), KC/GROalpha (Melanoma Growth Stimulatory
Activity Protein), VEGF (Vascular Endothelial Cell Growth Factor), Endothelin-1 ,
MIP-3 beta (Macrophage Inflammatory Protein-3 beta; Exodus-3 or ELC), Beta-2
microglobulin, IL-5 (Interleukin-5), IL-I alpha (Interleukin-1 alpha), EGF (Epidermal
Growth Factor), Lymphotactin (XCLl), GM-CSF (Granulocyte Macrophage-Colony
Stimulating Factor), MIP-I gamma (Macrophage Inflammatory Protein-1 gamma;
CCL4), IL-lbeta (Interleukin-1 beta), Brain-derived neutrophic factor, Cancer antigen
19-9, Carcinoembryonic antigen, C reactive protein, EGF, Fatty acid binding protein,
Factor VII, Growth hormone, IL-I alpha, IL-I beta, IL-I ra, IL-7, IL-8, MDC,
Prostatic acid phosphatase, Prostate specific antigen, Stem cell factor, Tissue factor,
TNF-alpha, VEGF, Von Willebrand factor, IgA (Immunoglobulin A), Haptoglobin,
MIP-2 (Macrophage Inflammatory Protein-2), IL-17 (Interleukin-1 7), SGOT (Serum
Glutamic-Oxaloacetic Transaminase), IP-IO (Inducible Protein- 10), IL-10, FGF-9

(Fibroblast Growth Factor-9), M-CSF (Macrophage-Colony Stimulating Factor), IL-
4 (Interleukin-4), IL-3 (Interleukin-3), TPO (Thrombopoietin), SCF (Stem Cell
Factor), LIF (Leukemia Inhibitory Factor), IL-2 (Interleukin-2), VCAM-I (Vascular
Cell Adhesion Molecule- 1; CD106) and TNF alpha and OSM (Oncostatin M).
> 71. The combination of claim 70, wherein the reagent is a nucleic acid
probe that hybridizes to nucleic acid encoding a marker under sufficiency strigency to
determine expression of the marker.
72. The combination of claim 70 or 7 1 that is packaged as a kit.