Environmental Regulation of Seed Performance - WUR eDepot
186
Environmental Regulation of Seed Performance Hanzi He
-
Upload
khangminh22 -
Category
Documents
-
view
4 -
download
0
Transcript of Environmental Regulation of Seed Performance - WUR eDepot

Environmental Regulation of Seed Performance
Hanzi He
Thesis committee
Promotors Prof. Dr H.J. Bouwmeester Professor of Plant Physiology Wageningen University
Prof. Dr J.C.M. SmeekensProfessor of Molecular Plant PhysiologyUtrecht University
Co-promotors Dr H.W.M. Hilhorst Associate professor, Laboratory of Plant Physiology Wageningen University
Dr L. Bentsink Associate professor, Laboratory of Plant Physiology Wageningen University
Other members Prof. Dr M.E. Schranz, Wageningen University Dr S.D. Penfield, University of Exeter, United KingdomDr Th. Matakiadis, Monsanto Vegetable Seeds Division, Seminis/De Ruiter Seeds, BergschenhoekDr W. Soppe, Max Planck Institute for Plant Breeding Research, Cologne, Germany
This research was conducted under the auspices of the Graduate School of Experimental Plant Sciences (EPS)

Hanzi He
Thesissubmitted in fulfillment of the requirements for the degree of doctor
at Wageningen Universityby the authority of the Rector Magnificus
Prof. Dr M.J. Kropff,in the presence of the
Thesis Committee appointed by the Academic Boardto be defended in public
on Tuesday 26 August 2014at 1.30 p.m. in the Aula.
Environmental Regulation of
Seed Performance

Hanzi HeEnvironmental regulation of seed performance186 pages.
PhD thesis, Wageningen University, Wageningen, NL (2014)With references, with summaries in English, Dutch and Chinese
ISBN 978-94-6257-033-7

Chapter 1General introduction
Chapter 2Genome-wide analysis of a locally adapted trait in Arabidopsis thaliana: Seed dormancy
Chapter 3Interaction between parental environment and genotype affects plant and seed performance in Arabidopsis
Chapter 4Parental temperature and nitrate effects on seed performance are reflected by partly overlapping genetic and metabolic pathways
Chapter 5A role for DELAY OF GERMINATION 1 in Arabidopsis seed maturation
Chapter 6General discussion
ReferencesSummarySamenvatting中文摘要AcknowledgementsCurriculum vitaeEducation certificate
7
21
49
75
105
129
139165169173177181184
TABLE OF CONTENTS


General Introduction
Chapter 1

8
Chapter 1
Seeds are importantWhy would we be interested in seeds? First of all, seeds provide food, feed, fiber
and fuel. Seeds provide >70% of the world’s caloric intake (Nambara and Nonogaki, 2012). Their value lies in the storage reserves, especially protein, starch and oil that are synthesized during development and maturation (Bewley et al., 2013). Secondly, seeds are an essential part of the life cycle of higher plants and store the genetic information necessary for the regeneration and maintenance of the species. Seeds are survival packages that are well equipped to withstand extended periods of unfavorable conditions, until after germination the seedling becomes autotrophic. The capacity of seeds to germinate under various environmental conditions we refer to as seed performance. Traits that are important in this respect are seed dormancy, seed longevity and several germination characteristics. The dormant state is used to optimize germination in time and space, which is an essential step for plant fitness. Seed dormancy has been defined as the inability of a viable seed to germinate under favorable conditions (Bewley, 1997). A certain degree of seed dormancy can prevent pre-harvest sprouting, a phenomenon that causes substantial losses for the agricultural industry. However, in crops, seed dormancy is generally an undesirable trait, because rapid and uniform germination and growth are preferred. Finally, in order to meet the requirements of an increasing human population, more efficient seed production for food, feed and other uses is required. Therefore, understanding the genetic and molecular control of seed performance, including the regulation by environmental factors, are of fundamental interest to seed biologists, and has considerable agronomic impact.
Genetic analysis of seed performance
Natural genetic variation of seed dormancy
Divergent responses to climatic conditions and geographical structures have resulted in adaptations. Seed dormancy is an important adaptive trait that, together with flowering time, is an essential factor of the different life history strategies of plants (Donohue, 2009). Considerable genetic variation in seed dormancy is present among natural accessions (ecotypes). Arabidopsis thaliana is a convenient species to study natural variation because it has a worldwide distribution, encountering diverse ecological conditions, leading to adaptive variation for many traits related to morphology, life history and other aspects of fitness (Bergelson and Roux, 2010). Arabidopsis usually reproduces through self-pollination but the low level of outcrossing that occurs suffices to generate heterozygosity for adaptation.
During the past two decades, natural variation studies by mapping quantitative

9
General introduction
trait loci (QTLs) in bi-parental populations have been performed. QTL mapping for dormancy in several Recombinant Inbred Line (RIL) populations of Landsberg erecta (Ler) crossed with other accessions and Bayreuth (Bay-0) crossed with Shahdara (Sha) have led to the identification of 22 DELAY OF GERMINATION (DOG) QTLs (Alonso-Blanco et al., 2003; Clerkx et al., 2004; Laserna et al., 2008; Bentsink et al., 2010). The effect of these QTLs on seed dormancy can be confirmed in so-called near-isogenic lines (NILs) that have introgressed fragments of other accessions at the QTL position (Keurentjes et al., 2007). In Arabidopsis, NILs have been developed in various studies to confirm and fine map QTLs that were identified in RILs (Alonso-Blanco et al., 1998; Swarup et al., 1999; Alonso-Blanco et al., 2003; Bentsink et al., 2003; Edwards et al., 2005; Teng et al., 2005; Nguyen et al., 2012). Among the 22 DOG loci, DOG1 was the first seed dormancy QTL that was cloned (Bentsink et al., 2006). Its expression peaks during late seed development, which coincides with the period during which seed dormancy is highly induced.
Natural variation can be explored by traditional QTL analysis with two or more accessions (MAGIC (Gan et al., 2011) and AMPRIL (Huang et al., 2011)) or by studying accessions world-wide collected. Genome-wide association mapping (GWA mapping) has emerged as a powerful alternative approach to examine the intraspecific genetic variation that underlies phenotypic variation in large populations of plants (Bergelson and Roux, 2010). The extensive collections of individuals (accessions) that are often used possess higher allelic diversity when compared to only two mapping parents, due to a higher rate of recombination during adaptation to local environments. Furthermore, the resolution of fine mapping can be greatly enhanced relative to RIL populations (Bergelson and Roux, 2010; Korte and Farlow, 2013). The power of GWA mapping to study natural variation was demonstrated in many studies in Arabidopsis (e.g. (Atwell et al., 2010; Meijón et al., 2013)) and in other species (e.g. poplar (Porth et al., 2013)). GWA mapping can generate lists of significantly associated genes enriched in a priori candidate genes (Filiault and Maloof, 2012; Yano et al., 2013) suggesting that GWAS is capable of generating meaningful results. Recently, combinations of GWA mapping and gene expression analysis increased the power to identify novel genes controlling phenotypes such as, for instance, glucosinolates content (Chan et al., 2011), root development (Meijón et al., 2013) and seed dormancy (Yano et al., 2013).
Seed trait correlation and co-location
Traits that determine seed performance are often highly correlated. Examples of genes that regulate both seed dormancy and seed longevity are ABSCISIC ACID INSENSITIVE 3 (ABI3) and DOG1. The abi3-5 mutant is completely non-dormant because of defective seed maturation, which also results in defective storability (Giraudat

10
Chapter 1
et al., 1992). DOG1 also has an effect on seed longevity in addition to its dormancy phenotype. A loss-of-function-mutant in NIL DOG1-Cvi (a NIL with the Ler genetic background containing an introgression fragment of the accession of the Cape Verde Islands (Cvi) at the position of the DOG1 QTL) background is completely non-dormant and significantly less storable than the NIL DOG1-Cvi itself (Bentsink et al., 2006).
In addition to the correlation between dormancy and longevity in well-studied mutants, e.g. abi3 (Ooms et al., 1993), QTLs that control both traits have also been identified. Nguyen et al. (2012) showed negative correlations of dormancy QTLs and natural aging QTLs. Moreover, some QTLs also co-locate with a number of other important seed performance traits (Clerkx et al., 2004; Joosen et al., 2011; Kazmi et al., 2012). For example, co-locations between germination after artificial aging, germination after heat treatment and germination in NaCl have been identified (Clerkx et al., 2004). In crops such as tomato (Foolad et al., 2003) and Brassica (Bettey et al., 2000) comparable QTL co-locations have been reported. In tomato it was shown that only a few QTLs accounted for a large part of the trait variation in salt-, cold- and drought tolerance (Foolad et al., 2003).The co-locations demonstrate that the genetic control of germination in general and germination under a range of stress conditions may overlap, at least partially.
In addition, seed performance loci might be controlled by genes regulating other developmental processes. Chiang et al. (2009) reported that the FLOWERING LOCUS C (FLC) gene, which previously was shown to be associated primarily with flowering time, also strongly associates with temperature-dependent germination.
Molecular mechanisms of seed performanceSeed performance is largely dependent on endogenous factors which comprise
genetic and hormonal regulation, as well as environmental factors during seed development. In this section, I will focus on endogenous factors while the next section will summarize the environmental regulation of seed performance.
Seed development comprises two major phases: embryogenesis and seed maturation (Meinke, 1994). Several processes occur during the seed maturation stage, including accumulation of storage compounds, degradation of chlorophyll, induction of dormancy and acquisition of desiccation tolerance (Goldberg et al., 1994).
Regulators of seed maturation
In Arabidopsis, there are four key regulators of seed maturation, namely LEAFY COTYLEDON (LEC) 1, LEC2, FUSCA (FUS) 3 and ABI3 (Raz et al., 2001). LEC1 is a HAP3 family CCAAT-box binding factor whereas LEC2, FUS3 and ABI3 are B3 domain

11
General introduction
containing transcription factors (Giraudat et al., 1992; Lotan et al., 1998; Luerssen et al., 1998; Stone et al., 2001). ABI3 and LEC genes (LEC1, LEC2, FUS3) operate through different pathways to ensure that developing seeds prepare for dormancy and desiccation (Meinke et al., 1994).
Several studies have unraveled the complex and intricate regulatory network of how seed maturation processes are regulated. LEC1 and LEC2 can activate ABI3 and FUS3 expression (Kroj et al., 2003; Kagaya et al., 2005; To et al., 2006; Stone et al., 2008), whereas LEC1 and LEC2 also regulate each other (Kagaya et al., 2005; Stone et al., 2008). FUS3 and LEC2 act in a partially redundant manner to locally control FUS3 expression (Kroj et al., 2003). ABI3 and FUS3 exhibit auto-regulation and interact through mutual activation (To et al., 2006). These four genes, together with LEC1-like (L1L) (Kwong et al., 2003), are referred to as the LAFL transcriptional network. The complex interactions of LAFL members govern various seed maturation processes, such as seed storage protein (SSP) accumulation, lipid biosynthesis, late embryogenesis abundant (LEA) protein synthesis, suppression of precocious germination, suppression of leafy traits in cotyledons, and hormone perception and balance (Jia et al., 2013).
Hormonal regulation
ABSCISIC ACID (ABA) acts as an important stress signal and is also involved in regulating numerous developmental and growth processes under non-stressful conditions. ABA is a crucial positive regulator of both dormancy induction during seed maturation and maintenance of the dormant state after imbibition. During seed development, ABA levels peak around mid-maturation and this corresponds with the induction of dormancy (Kermode, 2005). ABA-regulated seed dormancy is embryo-controlled as ABA produced by maternal tissues or supplied exogenously is not sufficient to induce dormancy (Karssen et al., 1983). Studies of two key genes of ABA biosynthesis during seed development, namely members of the 9-cis-epoxycarotenoid dioxygenase family, NCED6 and NCED9, have demonstrated that both embryo and endosperm contribute to dormancy (Lefebvre et al., 2006). During seed germination, ABA levels decrease due to increased catabolism regulated by specific ABA 8’-hydroxylases encoded by the cytochrome P450 CYP707A family (Okamoto et al., 2006). The breakthrough identification of the ABA receptors PYR/PYL/RCAR accelerated our understanding of the ABA signaling network (Ma et al., 2009; Park et al., 2009).
Gibberellins (GAs) are a group of hormones with essential roles in germination and are antagonistic to ABA function. The genes GIBBERELLIN 20 OXIDASES (GA20oxs) and GIBBERELLIN 3 OXIDASES (GA3oxs) encode enzymes that synthesize bioactive GA, whereas GIBBERELLIN 2 OXIDASES (GA2oxs) encode GA inactivating enzymes (Ueguchi-Tanaka et al., 2005). Finch-Savage et al. (2007) showed that the

12
Chapter 1
GA3ox2 transcript increased up to 40 fold in after-ripened seeds while GA2ox1 was highly expressed in the dormant Arabidopsis accession Cvi. Moreover, the balance between GA and ABA is more important than the absolute levels of each hormone and this balance is regulated by environmental cues that affect their biosynthesis and catabolism (Finkelstein et al., 2008). The GA signal is perceived by the GA receptor GA INSENSITIVE DWARF1 (GID1) (Ueguchi-Tanaka et al., 2005). DELLA proteins are transcription factors that negatively regulate GA signaling (Davière et al., 2008). Binding of GA to GID1 enhances the interaction between GID1 and DELLA, resulting in rapid degradation of DELLAs via the ubiquitin-proteasome pathway (Sun, 2010). Meanwhile, GA can also positively regulate ABA levels (Zentella et al., 2007).
Besides ABA and GA, ethylene (Matilla and Matilla-Vázquez, 2008), jasmonate (Linkies and Leubner-Metzger, 2012) and auxin (Liu et al., 2007; Holdsworth et al., 2008) are involved in the regulation of seed germination. In addition, recent reports have demonstrated the roles of strigolactones and karrikins in dormancy and germination. Strigolactones stimulate the germination of parasitic plant seeds (reviewed by Ruyter-Spira et al., 2013), whereas karrikins discovered in smoke stimulate Arabidopsis seed germination (Nelson et al., 2009). Strigolactone mutants displaying reduced germination can be rescued by the application of the synthetic strigolactone GR24 in a process that requires the F-box protein MORE AXILLARY BRANCHES 2 (MAX2) as downstream signaling factor (Ruyter-Spira et al., 2013). F-box protein KARRIKIN INSENSITIVE 1 (KAI1) is allelic to MAX2 and the kai1/max2 mutant shows increased seed dormancy (Nelson et al., 2011). In addition, karrikin induced seed germination requires GA and light (Nelson et al., 2009). These observations reinforce the complex regulation of seed performance, and the importance of coordinated interactions of various hormones in the plants.
The regulation of seed performance by the parental environmentSeeds act as environmental sensors that integrate environmental signals to adjust
seed performance (Finch-Savage and Leubner-Metzger, 2006; Penfield, 2008; Footitt et al., 2011; Kendall et al., 2011). Key environmental factors, such as temperature, nitrate, light, water and oxygen particularly exert influence on dormancy levels during seed development on the mother plant.
Temperature
Temperature is one of the most important determinants of many seed characteristics. Several studies have shown that the temperature during seed maturation determines the depth of primary dormancy. Low temperatures during seed maturation

13
General introduction
lead to deep primary dormancy, whereas warm temperatures lead to shallow dormancy in Arabidopsis (Schmuths et al., 2006; Chiang et al., 2009; Donohue, 2009; Kendall et al., 2011).
Temperature modulates seed dormancy during plant development through GA and ABA levels, as well as DOG1 gene expression (Chiang et al., 2011; Footitt et al., 2011; Kendall et al., 2011; Nakabayashi et al., 2012). It has been shown that C-REPEAT BINDING FACTOR (CBF) transcription factors are necessary for the regulation of dormancy by low seed-maturation temperatures. As ABA catabolic gene CYP707A2 was also down regulated in low temperature, CBF, DOG1 and ABA/GA metabolism have been proposed as central components of a pathway mediating the effect of seed maturation temperature on dormancy (Kendall et al., 2011). In addition, high FLC expression during seed maturation is associated with altered expression of hormonal genes (namely CYP707A2 and GA20ox1) in germinating seeds (Chiang et al., 2009) and phytochromes seem to play important roles in the varied seed maturation temperature (Donohue et al., 2007). Another gene involved in the low temperature response during seed maturation is MOTHER OF FT AND TFL1 (MFT). Footitt et al. (2011) have demonstrated that MFT peaks with the same kinetics as DOG1 during annual dormancy cycling.
Penfield et al. (2005) have shown that SPATULA (SPT) is important for germination by mediating cold and light signaling. SPT is a bHLH transcription factor, which was originally identified due to ‘spatula’ shaped siliques because it controls development of carpel margin tissues (Heisler et al., 2001). SPT also plays a role integrating temperature and day time signaling to repress growth of vegetative tissue, such as hypocotyls, cotyledons, and leaves (Sidaway-Lee et al., 2010). A recent report (Vaistij et al., 2013) demonstrates the function of SPT during seed development and reveals that SPT regulates expression of five transcription factor encoding genes: ABI4, ABI5, REPRESSOR-OF-GA (RGA), RGA-LIKE3 and MFT. Moreover, these authors showed MFT promotes primary dormancy in Arabidopsis.
Light
Light is a pervasive environmental factor that affects development throughout the whole life cycle of the plant. Light signals received by phytochromes are converted to internal cues, which in turn regulate physiological processes in seeds and are decisive for germination in many light-requiring species (Seo et al., 2009).
The effect of photoperiod during seed maturation is species dependent. In Arabidopsis, Munir et al. (2001) have shown that short days induced high dormancy levels, whereas long days induced low dormancy levels. Furthermore, a varying

14
Chapter 1
photoperiod altered the sensitivity to cold stratification. However, in some cases, such as Portulaca oleracea (Gutterman, 1974) and Amaranthus retroflexus (Kigel et al., 1979) germinability is promoted by short days and dormancy increased with day length. It has been shown that coat thickness is the crucial characteristic affected by day length: long days promote thicker, harder coats, thereby reducing germinability. The effect of photoperiod during maturation on seed performance has been extensively reviewed by Fenner (1991) and Gutterman (2000). Despite the phenotypes observed, the molecular mechanisms of how light conditions during maturation regulate seed dormancy and germination are not well understood. In Arabidopsis, five phytochromes have been identified (PHYA-E). Phytochromes are synthesized in an inactive red-light absorbing form and then undergo photon conversion to a biologically active far-red light absorbing form. Using single and multiple phytochrome mutants, Donohue et al. (2008) identified phytochromes that contributed differently to germinability, depending on seed maturation conditions. PHYB contributed to germination more strongly in seeds that had matured under short days, whereas PHYD contributed more to seeds matured under long days. Moreover, PHYB and PHYD were necessary to break cold-induced dormancy acquired during seed maturation.
Light intensity is another influential factor of light signaling. However, the genetic basis of light intensity effects on dormancy is virtually unknown. Changes in light intensity reveal a major role for carbon balance in Arabidopsis responses to high temperature (Vasseur et al., 2011). Evidently, light energy that is employed by the photosynthetic apparatus will influence source-sink relationships of the growing plant
and, hence, performance properties of the developing seed.
Nitrate
Nitrate is an important nitrogen source for plants, but also a signal molecule that controls seed dormancy (Alboresi et al., 2005). Mutants, such as cyp707a1, cyp707a2 (Matakiadis et al., 2009) and cho1 (Yamagishi et al., 2009) have contributed to the identification of nitrate signaling pathways. Nitrate reduced ABA levels in dry seeds when provided to the mother plant during seed development (Matakiadis et al., 2009). Nitrate is assimilated through its reduction by nitrate reductase (NR) and other enzymes leading to the production of amino acids and nitrogen compounds. Gene expression analysis has shown that endogenous nitrate content affected many genes involved in carbon and nutrient metabolism in both root and shoot (Wang et al., 2003).
Based on genetic analysis of mutants performed by many research groups, we propose a regulating network of central regulatory genes, hormones and environmental factors that controls seed dormancy (Fig. 1).

15
General introduction
Figure 1. Network summarizing the environmental regulation of seed dormancy through genetic factors and hormones during Arabidopsis seed development based on previous genetic studies discussed above. Plant hormones are indicated in circles and environmental conditions are shown in red.
The regulation of seed performance by germination stimulantsAs described above, low temperature during seed maturation increases seed
dormancy. However, low temperature has a dual role in affecting seed dormancy levels. Low temperature during seed imbibition relieves dormancy, which is a process known as “cold stratification”. In many summer annuals, seeds are set before winter and overwinter in the soil seed bank. During the winter dormancy is lost by cold stratification resulting in germination in spring when temperatures become favourable for germination. Conversely, winter annuals are less dormant compared to summer annuals; winter annuals may germinate in autumn and overwinter as rosette (Bewley et al., 2013). However, seeds that do not germinate before the onset of winter and therefore experience low temperatures during winter, may induce secondary dormancy that delays germination until the spring (Footitt et al., 2011).
Light is another very important germination stimulant as seeds of most annuals are light-requiring. Germination of these species can be stimulated by exposure to light

16
Chapter 1
for a few minutes or seconds or even milliseconds. However, some species have lost their light dependency during domestication, for example tomato, which can germinate under dark conditions (Bewley et al., 2013). Light controls seed germination mostly through phytochromes. PHYA mediates the very low fluence response (VLFR), while PHYB is involved in the low fluence response (LFR) (Casal et al., 1998). PHYE is required for germination of Arabidopsis seeds in continuous far-red light (Hennig et al., 2002). In addition, different phytochromes are required for germination at different temperatures (Heschel et al., 2007).
Furthermore, as mentioned earlier, SPT mediates cold and light signals to regulate seed germination by regulating GA3ox expression together with PHYTOCHROME INTERACTING FACTOR 3-LIKE 5 (PIL5) (Penfield et al., 2005).
Nitrate has long been known to stimulate germination in a large number of plant species e.g. Amaranthus albus and Lactuca sativa (Hendricks and Taylorson, 1974). Hilhorst and Karssen (1988) have shown that in Sisymbrium officinale nitrate promotes germination, possibly by enhancing GA synthesis. Exogenous nitrate was shown to promote germination in Arabidopsis Ler and Cvi ecotypes, by reducing the light requirement of seeds (Batak et al., 2002) and by affecting ABA levels in imbibed seeds (Ali-Rachedi et al., 2004), respectively. Yamagishi et al. (2009) suggested that CHOTTO1 regulates nitrate responses downstream of ABI4 during germination and seedling growth. Gene expression profiles indicated that higher transcript abundance of genes linked to nitrate reduction and accumulation was associated with dormancy relief (Finch-Savage et al., 2007).
“Omics” analyses related to seed performanceNew platforms and technologies for sequencing genomes, as well as post-
genomic techniques have the potential to dissect the complex interactions of genetic and environmental factors involved in the control of seed performance. Understanding the nature of these complex traits requires in-depth and integrated knowledge of the molecular, biochemical, and physiological aspects of biological processes. Correspondingly, a ‘systems approach’ brings together all these data and uses mathematical and computational models towards uncovering these networks on a global scale (Bassel et al., 2012).
Transcriptomics
Several recent studies have generated extensive gene expression data sets on a genome-wide scale. Dormancy cycling was studied in the Arabidopsis accession Cvi in a range of dormant and after-ripening states. The data supports an ABA-GA hormone balance mechanism controlling cycling through dormant states that depends

17
General introduction
on biosynthetic and catabolic pathways of both hormones (Cadman et al., 2006). Later, Carrera et al. (2008) performed a study using a transcriptome profiling approach on mutant Arabidopsis seeds and showed that after-ripening is a specific developmental pathway that acts independently from the germination potential. Recent transcriptomic studies have uncovered that different seed compartments (testa, endosperm, and embryo) control different cellular processes, enabling predictions of gene regulatory networks (Belmonte et al., 2013). Furthermore, Dekkers et al. (2013) studied spatial and temporal transcriptomic changes during seed germination and concluded that two transcriptional phases during germination are separated by testa rupture.
Given the abundance of existing gene expression data, the generation of co-expression networks is a feasible top-down approach to generate coordinated functional network models (Bassel et al., 2012). Functional modules consisting of subsets of highly inter-connected nodes can be identified within networks. The biological meaning of these modules can be derived from overrepresented Gene Ontology categories (Ashburner et al., 2000). Co-expression networks have led to the identification of previously uncharacterized genes in Arabidopsis seed germination (Bassel et al., 2011), as well as flower development (Usadel et al., 2009) and other traits (Mutwil et al., 2010).
Proteomics
Several proteome analyses have been performed using two-dimensional gel electrophoresis to study protein composition in Arabidopsis seeds in relation to dormancy and germination. Gallardo et al. (2001) described protein abundance related to germination and seed priming and the patterns of protein oxidation in Arabidopsis seeds during germination have been revealed by Job et al. (2005). The initiation of translation and the role of stored messenger RNAs was depicted (Rajjou et al., 2012). The 2D protein profiles of de novo synthesized proteins during germination and seedling establishment showed that translational activity is low during the first 8 h of imbibition, reflecting the use of stored proteins in this early phase of germination. Arc et al. (2011) also illustrated the control of seed germination via posttranslational modifications (PTMs), which may affect protein functions including localization, complex formation, stability, and activity.
A genome-scale proteomics analysis for different plant organs using mass spectrometry was described by Baerenfaller et al. (2008). Although this paper only describes a protein survey in after-ripened seeds, the seed-specific peptide map of Arabidopsis demonstrated the potential of proteomics to be used as a routine scoring method, comparing different dormancy and germination states.

18
Chapter 1
Metabolomics
Metabolic analysis (primary metabolites) has been applied to study seed development (Fait et al., 2006), as well as the transition from seed desiccation to germination (Angelovici et al., 2010). Metabolomics of plant responses to abiotic stress was extensively reviewed by Guy et al. (2008) and Obata and Fernie (2012). Nowadays, applications of network analysis to study plant metabolism and the integration of metabolic and gene regulatory networks allow more accurate identification of key network components and obtain an overall map of changes in metabolites. Toubiana et al. (2012) compared metabolic data of tomato seeds and fruits, using correlation-based metabolic network analysis. They showed that the seed network displayed tighter interdependence of metabolic processes than the fruit network. The benefit of combining metabolite and transcript profiling data to characterize gene-to-metabolite associations has been demonstrated in Arabidopsis for stress responses (Urano et al., 2009; Hannah et al., 2010) as well as for tomato fruit development (Osorio et al., 2011).
The potential of metabolomics as a functional genomics tool in addition to transcriptomics and proteomics is well recognized (Bino et al., 2004). The integration of various levels of omics data will help in a more comprehensive understanding of how plants cope with the environment. This information can help us to further understand plant adaptation (Schwarz et al., 2011).
Scope of the thesisPlants are sessile and must modulate their development according to the continuous
perturbations of their surrounding environment, an ability referred to as ‘plasticity’. This ability relies on the interactions between signaling pathways triggered by endogenous and environmental cues. How changes in environmental factors are interpreted by the plant and reflected in seed performance and further contribute to plant plasticity is largely unknown. Therefore, the objective of this study is to gain advanced knowledge about the environmental regulation of seed performance, using genetic and molecular tools as well as state of the art “omics” techniques and analyses.
In Chapter 2, we analyse seed dormancy in a world-wide collection of accessions of Arabidopsis thaliana. First, the correlation between seed dormancy and a set of 36 climatic parameters, as well as geographical parameters is presented. Then GWA mapping of seed dormancy (DSDS50) is performed to identify causal single nucleotide polymorphisms (SNPs) that affect natural variation of seed dormancy.
In Chapter 3, we study the influence of light intensity, photoperiod, temperature, and nitrate and phosphate nutrition during seed development on five plant and thirteen

19
General introduction
seed performance traits. We perform an extensive screen for which we used twelve Arabidopsis genotypes, including near isogenic lines and loss-of-function mutants. The interaction between the environment and genotype on seed dormancy and longevity is schematically summarized.
In Chapter 4 we further investigate the transcriptomic and metabolic changes affected by the most influential maturation environments (identified in Chapter 3) in Arabidopsis seeds. The aim of this study is to reveal different genetic and metabolic pathways affected by various maturation environments.
The aim of Chapter 5 is to identify the role of DOG1 during seed maturation by a combination of “omics” (transcriptome, proteome and metabolome) approaches. Furthermore, the genetic interaction between DOG1 and ABI3, which is an important seed maturation regulator, is studied.
In Chapter 6 the results of this thesis are integrated and discussed. Attention is paid to the ecological aspects and implications of practical usage for the seed industry.

Genome-wide analysis of a locally adapted trait in Arabidopsis thaliana: Seed dormancy
Hanzi He1, Sabine Schnabel2,3, Henk Hilhorst1, Leónie Bentsink1,4
1 Wageningen Seed Lab, Laboratory of Plant Physiology, Wageningen University, Droevendaalsesteeg 1, NL-6708 PB Wageningen, The Netherlands
2 Biometris-Applied Statistics, Wageningen University and Research Centre, Droevendaalsesteeg 1, NL-6708 PB Wageningen, The Netherlands
3 Centre for BioSystems Genomics, Droevendaalsesteeg 1, NL-6708 PB Wageningen, The Netherlands
4 Department of Molecular Plant Physiology, Utrecht University, NL-3584 CH Utrecht, The Netherlands
Chapter 2
22
Chapter 2
AbstractSeed dormancy is an important life history trait. A world-wide collection of
Arabidopsis accessions was used to explore the genetic variation for this trait. A large variation for seed dormancy, expressed as days of seed dry storage required to reach 50% of germination, was revealed which was correlated with 36 climatic parameters, as well as geographical parameters. The significant correlation of seed dormancy with longitude, latitude and eight temperature-related climatic parameters of local environments confirmed that dormancy is an adaptive trait. Genome-wide association mapping of seed dormancy was performed to identify causal SNPs that affect primary seed dormancy. The relatively large number of accessions and the accurate measurement of dormancy levels allowed robust Genome-wide association mapping. Interestingly, two major peaks were detected and overlapped at genome positions where previously the seed dormancy QTL DELAY OF GERMINATION 5 and 6 were located. A likely candidate gene for each peak were identified.
23
Genome-wide analysis of seed dormancy
IntroductionGeographical structure and climate conditions lead to phenotypic variation
and altered allele frequencies (Hancock et al., 2011). Accordingly, from ecological and evolutionary perspectives, analysis of natural variation and climatic adaptation draws increasing attention and has become a hot spot of research (Mitchell-Olds, 2001; Mitchell-Olds and Schmitt, 2006; Bergelson and Roux, 2010; Fournier-Level et al., 2011; Hancock et al., 2011). Patterns of phenotypic and molecular variation are analysed to explore the mechanisms that are generating, accumulating and maintaining this variation, and furthermore, allelic polymorphisms that are adaptive under specific environmental conditions are identified (Koornneef et al., 2004).
Nowadays, new technologies, methods and vast amounts of resources are available to study natural variation in more detail (Korte and Farlow, 2013). In addition, there is a tremendous interest in using genome-wide association mapping (GWA mapping) to identify genes responsible for natural variation. GWA mapping has now emerged as a powerful approach compared with traditional Quantitative Trait Locus (QTL) mapping. The large collection of individuals (accessions) that are often used possesses higher allelic diversity as compared with only two mapping parents, because of a higher rate of recombination events during adaptation to local environments. The resolution of mapping is therefore greatly enhanced relative to recombinant inbred line (RIL) populations (Bergelson and Roux, 2010; Korte and Farlow, 2013). In Arabidopsis, GWA mapping has already been used to study many phenotypes. Besides 107 phenotypes studied by Atwell et al. (2010), many other traits have been investigated by GWA mapping, for instance, pathogen resistance (Aranzana et al., 2005), flowering time (Atwell et al., 2010; Brachi et al., 2010), sodium accumulation (Baxter et al., 2010), fitness (Fournier-Level et al., 2011), glucosinolates (Chan et al., 2011), shade avoidance (Filiault and Maloof, 2012) and root development (Meijón et al., 2013) and seed dormancy (Yano et al., 2013).
Seed dormancy is defined as the failure of an intact viable seed to complete germination under favourable conditions (Bewley, 1997). It is an adaptive trait that optimizes the distribution of germination over time (Bewley, 1997) and displays strong adaptive plasticity to geographic location and seasonal conditions (Donohue et al., 2005). GWA mapping for seed dormancy has revealed some known loci, including DELAY OF GERMINATION (DOG) 1 and 6 that earlier had been identified by QTL analysis (Alonso-Blanco et al., 2003; Laserna et al., 2008; Bentsink et al., 2010; Huang et al., 2010). In addition, HD2 histone deacetylase (HD2B) was identified as a novel gene associated with seed dormancy (Yano et al., 2013). These results demonstrate that GWA mapping can be a powerful tool to study natural variation for seed dormancy, provide further genetic evidence for adaptive plasticity and identify the genes that are responsible

24
Chapter 2
for the adaptation. However, we expect more loci to be involved in the control of germination in nature. The reason that Yano et al. (2013) only identified a few loci might be because they used germination percentage at a certain time point during after-ripening as a measure for seed dormancy. This implies that the dormancy status was mapped at a certain time point only, thereby masking possible differences in innate dormancy which may not be apparent at one single time point. However, the seed dormancy level is much more accurately reflected by the days of seed dry storage (after-ripening) until 50% germination is reached (DSDS50). Atwell et al. (2010) did not identify any clear associations for dormancy related traits probably because the geographical origin of the accessions used caused a certain level of polymorphism and population structure, as well as different linkage disequilibrium, in which dormancy is not strongly associated with a set of SNPs. To further explore the presence of natural variation for this important trait, we performed GWA analysis with a different natural population and a more accurate measurement of seed dormancy.
In this chapter we analysed primary seed dormancy in a world-wide collection of Arabidopsis thaliana ecotypes. This population consisted of 360 accessions, which were selected from 5,707 accessions based on the genotypes at 149 single nucleotide polymorphisms (SNPs), to minimize redundancy and close family relatedness (Weigel and Mott, 2009; Platt et al., 2010). The 360 accessions were further genotyped by Baxter et al. (2010) with a high density tiling array (250k SNPtile). We have analysed the correlation between seed dormancy and a set of 36 climate parameters, as well as geographical parameters, which gives insight in the factors that shaped the selective pressure during evolution. The GWA mapping identified a number of causal SNPs for seed dormancy, resulting in the identification of two major peaks for which the most likely candidate genes were identified using haplotype analysis and in silico expression analysis.
Results
Seed dormancy distribution in a natural population
Arabidopsis accessions were grown under standard greenhouse conditions, with two biological replicates each containing two plants. After seed harvest, after-ripening was monitored for 723 days by performing germination assays at nine intervals. Seed dormancy was gradually released during dry storage (Fig. 1), which is reflecting the after-ripening process. The number of days of seed dry storage required to reach 50% germination (DSDS50) could not be calculated for two accessions since these were highly dormant (<50% germination after two years of after-ripening). DSDS50 values for five accessions, which only had data for one biological replicate, as well as 20 accessions that

25
Genome-wide analysis of seed dormancy
had a high standard deviation (>100 days), were removed. This resulted in a total of 322 accessions for further analysis.
Figure 1. Germination percentage of 349 accessions at 11 DAH, 40 DAH, 102 DAH and 723 DAH (days after harvest). Error bars indicate the standard deviation of two biological replicates.
Figure 2. Frequency distribution of seed dormancy level (DSDS50) of 322 accessions. A) Frequency distribution of DSDS50, B) Frequency distribution of 10log normalized DSDS50 values.
The DSDS50 distribution is highly skewed (Fig. 2A), 125 accessions had DSDS50 values between 67 and 100 days but there were a few highly dormant lines with Alc-0, originating from Spain, being the most dormant one (DSDS50: 661 days). After 10log transformation, the data approached a normal distribution (Fig. 2B).
Seed dormancy has been studied in several natural populations (Atwell et al., 2010; Joosen, 2013; Yano et al., 2013), thus it is interesting to analyse how our data relates to these earlier studies. Of our 322 accessions, 81 accessions overlapped with the data published by Atwell et al. (2010), and 77 accessions overlapped with the data published by Yano et al. (2013). Due to the small number of overlapping accessions and different ways of dormancy measurement, we did not perform a correlation analysis with Yano et al. (2013). Correlation analysis for DSDS50 values between the Atwell et al. (2010) data set and ours showed a highly significant correlation (r= 0.72; Table S1). 320 of our accessions overlapped with data presented by Joosen (2013). However, instead of calculating DSDS50 values, this author determined dormancy by assessing

26
Chapter 2
total germination after 7 months (202 days) of after-ripening. After this period of after-ripening still 29 lines germinated lower than 10%. To be able to compare both data sets at a relatively similar after-ripening stage, we compared the author’s 202 days after harvest (DAH) germination percentage with our 102 DAH germination percentage. The correlation coefficient was 0.57 with high significance (Table S1). Seed dormancy is strongly affected by environmental conditions during seed maturation (Chapter 3), but the high correlation of our dormancy levels with those of the earlier studies suggests there is considerable heritable variation among Arabidopsis accessions.
Correlation between seed dormancy and geographical/climatic conditions
Seed dormancy is thought to be adaptive to local geographic/climatic conditions. Spearman correlations were determined between the dormancy levels (DSDS50 values) and the geographic/climatic parameters of the locations from which the accessions originate. This analysis revealed highly significant correlations (P<0.001) (Table 1). Seed dormancy correlated negatively with longitude and latitude. Of all the 36 climate parameters, 13 displayed a highly significant correlation with dormancy levels. Of these 13, eight are temperature-related parameters (Table 1). The other five are average, minimum and maximum vapor pressure, ground-frost and minimum irradiation. By definition, vapor pressure (hPA) increases non-linearly with temperature and, therefore, there is, in general, a high correlation between vapor pressure and temperature and, as a result, with dormancy as well (Table S2; Table 1). Average number of days with ground-frost correlated negatively with dormancy, which indicates that accessions that originate from regions with more days of ground-frost per month are less dormant than the others. Minimum irradiation (μmol m-2 s-1) correlated positively with seed dormancy but the correlation coefficients were not as high as those for temperature. The correlations of all 36 climate parameters with seed dormancy are shown in Table S3.

27
Genome-wide analysis of seed dormancy
Table 1. Spearman correlations (P<0.001) between DSDS50 and geographical/climate parameters collected from the origin of the accessions. Climate data is collected between 1961 and 1990.
DSDS50
r P NLongitude -0.395 2.22-13 320Latitude -0.254 4.02-06 320
Tmax_MN 0.413 1.83-14 316
Tmean_MN 0.404 7.72-14 316
Tmean_AV (2.0) 0.387 6.76-13 320
Tmin_MN 0.386 1.18-12 316
Vapp_AV 0.384 1.57-12 316
Vapp_MN 0.381 2.35-12 316
Tmean_AV (1.0) 0.362 3.11-11 316
Tmax_AV 0.349 1.85-10 316
Frs (2.0) -0.348 1.47-10 320
Tmin_AV 0.348 1.94-10 316
Vapp_MX 0.256 3.96-06 316
diurn_MN 0.211 1.62-04 316
Irr_MN 0.193 6.60-04 308
Tmax_MN: minimum temperature of the maximum temperature of 12 months; Tmean_MN: minimum temperature of the mean temperature of 12 months; Tmean_AV (2.0), Tmean_AV (1.0): average annual temperature from CRU CL 2.0 and CRU 1.0, respectively; Tmin_MN: minimum temperature of the minimum temperature of 12 months; Vapp_AV: average annual vapour pressure; Vapp_MN: minimum vapour pressure of the mean value of 12 months; Tmax_AV: average temperature of the maximum temperature of 12 months; Frs (2.0): average annual days with ground-frost (from CRU CL 2.0); Tmin_AV: average temperature of the minimum temperature of 12 months. Vapp_MX: maximum vapour pressure of the mean value of 12 months; diurn_MN: minimum diurnal temperature range of the mean value of 12 months. Irr_MN: minimum irradiation (μmol m-2 s-1) of the mean value 12 months. All the data come from CRU 1.0 unless indicated. Spearman correlations (r), P-values (P) and number of accessions included in the correlation analysis (N) are presented.
Genome-wide association mappingHeritability is a measure for the fraction of phenotypic variation that can be
attributed to genetic variation. High heritability is necessary for genetic studies and provides confidence for trustable association mapping. In our study, the heritability of seed dormancy was very high (broad-sense heritability H2=0.89).
To investigate the genetic architecture underlying this population for seed dormancy, genome-wide association (GWA) mapping was performed by analysing associations between DSDS50 and 214,051 SNP markers (Atwell et al., 2010), with ≥ 0.05

28
Chapter 2
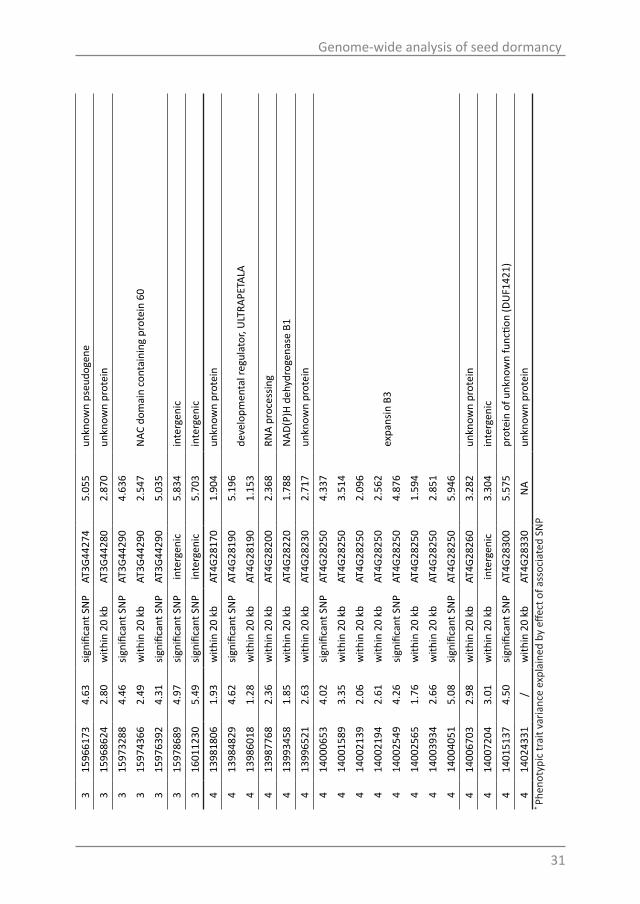
minor allele frequency (MAF). Association mapping was performed on 10log normalized data (Fig. 2B) of 311 accessions for which genotype information was available. GWA mapping was performed by Efficient Mixed Model Association eXpedited (EMMAX) (Kang et al., 2008) to correct for population structure. We identified one single peak of five significant SNPs associated with DSDS50 using the Bonferroni multiple testing correction, which is a stringent threshold of 6.63 (-10log (0.05/number of SNPs)) (Fig. 3). The P value threshold was lowered (P<10-4) to detect more potential candidate SNPs, thus SNPs with P-value below 10-4 and within +/-20 kb genomic region of significant SNPs were examined. Of these +/-20 kb region SNPs, only the ones that had over 0.5 linkage disequilibrium (LD) with the significant SNP (r2>0.5) were selected since these are closely linked to the significant SNPs. Only the peaks with more than two significant SNPs were further investigated. We have identified two peaks located at chromosomes 3 and 4, which meet this requirement (Fig. 3). Since these peaks co-located with the previously reported DOG6 and DOG5 QTL regions (Bentsink et al., 2010), we have named these peaks DOG6 and DOG5, respectively. Overall we have identified 27 significant SNPs and 20 SNPs within +/-20 kb genomic region with higher than 0.5 LD (Table 2).
Figure 3. Manhattan plots of GWA mapping for seed dormancy (10Log(DSDS50)) in 311 accessions. -10log(P)=4 is indicated by a black dashed line. The red dots above the line are regarded as significant SNPs. The Bonferroni corrected P-value (-10log(P/number of SNPs)=6.63) threshold is indicated by the red dashed line. The SNPs that marked are important ones that were discussed. The two major peaks are indicated as DOG6 peak and DOG5 peak.

29
Genome-wide analysis of seed dormancy
Next to GWAS on 10log transformed DSDS50 values (Fig. 3) we have also used some other methods to perform GWA analysis for seed dormancy to check the robustness of the analysis. We have clustered the DSDS50 data into seven categories (Fig. S1) which, again, lead to the identification of the DOG6 peak as a major peak, and some minor peaks, including a singleton in the +/- 40kb region of DOG1 (Fig. S2). Additionally, by only using the 283 European accessions, no additional significant peaks were identified (Fig. S3), which means that the population structure and linkage disequilibrium do not change dramatically by removing the 28 non-European accessions. In addition to using DSDS50 values, we have also used the germination percentage at four time points during after-ripening for GWA analysis (Fig. 4), and the time-points correspond to those in Fig. 1. Obviously, each time point has distinct peaks, however the DOG6 peak is the highest one for the first two time points. This result emphasizes the importance of DOG6 in the control of dormancy and germination.
Figure 4. Manhattan plots of GWA mapping for seed germination percentage (10log(germination percentage)) at four time points during after-ripening in 311 accessions. The four time points, 11, 40, 102 and 723DAH, are corresponding to Fig. 1. -10log(P)=4 is indicated by a black dashed line. The red dots above the line are regarded as significant SNPs.

30
Chapter 2
Tabl
e 2.
List
of s
igni
fican
t SN
Ps w
ith P
val
ues
high
er th
an 1
0-4 (-
10lo
g(P)
=4))
and
SNPs
with
in 2
0 kb
in li
nkag
e di
sequ
ilibr
ium
(r2 >0
.5) w
ith s
igni
fican
t SN
Ps.
Both
SN
P po
sition
and
des
crip
tion
are
base
d on
TAI
R v.1
0 (w
ww
.ara
bido
psis.
org)
. Ch
rom
osom
e nu
mbe
r (C
hr.),
SN
P po
sition
, -1
0log
(P-v
alue
), SN
P st
a-tu
s (s
igni
fican
t SN
P or
with
in 2
0kb
geno
mic
reg
ion)
, gen
e AG
I cod
e, p
heno
typi
c va
rianc
e (%
) an
d a
shor
t de
scrip
tion
of g
ene
func
tion
are
liste
d be
low
.
Chr.
Posi
tion
-10l
og(P
)SN
P st
atus
AGI c
ode
Phen
otyp
ic
varia
nce
(%)*
Desc
riptio
n
315
9091
995.
27sig
nific
ant S
NP
AT3G
4420
05.
926
NIM
A (n
ever
in m
itosis
, gen
e A)
-rel
ated
6
315
9121
933.
43w
ithin
20
kbin
terg
enic
3.52
4in
terg
enic
315
9179
484.
05sig
nific
ant S
NP
AT3G
4421
24.
432
pseu
doge
ne
315
9222
224.
35sig
nific
ant S
NP
AT3G
4421
54.
778
tran
spos
able
ele
men
t gen
e3
1592
3805
5.02
signi
fican
t SN
PAT
3G44
215
5.46
3
315
9242
655.
91sig
nific
ant S
NP
AT3G
4421
56.
738
315
9250
193.
54w
ithin
20
kbAT
3G44
215
3.71
3
315
9274
555.
74sig
nific
ant S
NP
AT3G
4422
06.
685
late
em
bryo
gene
sis a
bund
ant (
LEA)
hyd
roxy
prol
ine-
rich
glyc
opro
tein
fam
ily3
1592
9639
6.49
signi
fican
t SN
PAT
3G44
220
7.52
6
315
9328
507.
46sig
nific
ant S
NP
AT3G
4423
58.
904
unkn
own
prot
ein
315
9340
437.
59sig
nific
ant S
NP
inte
rgen
ic8.
837
inte
rgen
ic
315
9345
164.
10sig
nific
ant S
NP
inte
rgen
ic4.
054
inte
rgen
ic
315
9396
585.
39sig
nific
ant S
NP
AT3G
4424
05.
613
poly
nucl
eotid
yl tr
ansf
eras
e, ri
bonu
clea
se H
-like
supe
rfam
ily p
rote
in3
1594
0322
2.68
with
in 2
0 kb
AT3G
4424
02.
676
315
9444
586.
93sig
nific
ant S
NP
AT3G
4424
58.
086
pseu
doge
ne
315
9502
914.
49sig
nific
ant S
NP
AT3G
4425
04.
939
cyto
chro
me
P450
, fam
ily 7
1, su
bfam
ily B
, pol
ypep
tide
38
315
9547
643.
69w
ithin
20
kbAT
3G44
261
3.74
9un
know
n pr
otei
n
315
9576
362.
90w
ithin
20
kbAT
3G44
262
2.86
0ps
eudo
gene
315
9597
096.
63sig
nific
ant S
NP
AT3G
4426
47.
531
tran
spos
able
ele
men
t gen
e
315
9607
685.
47sig
nific
ant S
NP
AT3G
4426
76.
118
tran
spos
able
ele
men
t gen
e
315
9627
127.
53sig
nific
ant S
NP
AT3G
4427
08.
757
tran
spos
able
ele
men
t gen
e
315
9638
335.
61sig
nific
ant S
NP
inte
rgen
ic6.
360
inte
rgen
ic
31
Genome-wide analysis of seed dormancy
315
9661
734.
63sig
nific
ant S
NP
AT3G
4427
45.
055
unkn
own
pseu
doge
ne
315
9686
242.
80w
ithin
20
kbAT
3G44
280
2.87
0un
know
n pr
otei
n
315
9732
884.
46sig
nific
ant S
NP
AT3G
4429
04.
636
NAC
dom
ain
cont
aini
ng p
rote
in 6
03
1597
4366
2.49
with
in 2
0 kb
AT3G
4429
02.
547
315
9763
924.
31sig
nific
ant S
NP
AT3G
4429
05.
035
315
9786
894.
97sig
nific
ant S
NP
inte
rgen
ic5.
834
inte
rgen
ic
316
0112
305.
49sig
nific
ant S
NP
inte
rgen
ic5.
703
inte
rgen
ic
413
9818
061.
93w
ithin
20
kbAT
4G28
170
1.90
4un
know
n pr
otei
n
413
9848
294.
62sig
nific
ant S
NP
AT4G
2819
05.
196
deve
lopm
enta
l reg
ulat
or, U
LTRA
PETA
LA4
1398
6018
1.28
with
in 2
0 kb
AT4G
2819
01.
153
413
9877
682.
36w
ithin
20
kbAT
4G28
200
2.36
8RN
A pr
oces
sing
413
9934
581.
85w
ithin
20
kbAT
4G28
220
1.78
8N
AD(P
)H d
ehyd
roge
nase
B1
413
9965
212.
63w
ithin
20
kbAT
4G28
230
2.71
7un
know
n pr
otei
n
414
0006
534.
02sig
nific
ant S
NP
AT4G
2825
04.
337
expa
nsin
B3
414
0015
893.
35w
ithin
20
kbAT
4G28
250
3.51
4
414
0021
392.
06w
ithin
20
kbAT
4G28
250
2.09
6
414
0021
942.
61w
ithin
20
kbAT
4G28
250
2.56
2
414
0025
494.
26sig
nific
ant S
NP
AT4G
2825
04.
876
414
0025
651.
76w
ithin
20
kbAT
4G28
250
1.59
4
414
0039
342.
66w
ithin
20
kbAT
4G28
250
2.85
1
414
0040
515.
08sig
nific
ant S
NP
AT4G
2825
05.
946
414
0067
032.
98w
ithin
20
kbAT
4G28
260
3.28
2un
know
n pr
otei
n
414
0072
043.
01w
ithin
20
kbin
terg
enic
3.30
4in
terg
enic
414
0151
374.
50sig
nific
ant S
NP
AT4G
2830
05.
575
prot
ein
of u
nkno
wn
func
tion
(DU
F142
1)
414
0243
31/
with
in 2
0 kb
AT4G
2833
0N
Aun
know
n pr
otei
n* Ph
enot
ypic
trai
t var
ianc
e ex
plai
ned
by e
ffect
of a
ssoc
iate
d SN
P

32
Chapter 2
Candidate genes for the DOG6 peakThe DOG6 peak region contained 22 significant SNPs and 7 SNPs within +/-20
kb of the significant SNPs. This peak covers the genomic region from gene AT3G44200 to AT3G44290, 7 SNPs are located in transposable element (TE) genes, 6 SNPs are in intergenic regions, 4 SNPs in pseudo genes, 3 SNPs in genes encoding unknown proteins, which left 9 SNPs located in genes with known functions. In order to identify the causal SNP, seed dormancy levels of the haplotypes of these 29 SNPs were categorized. There are 18 haplotypes that contain at least 3 accessions and the dormancy levels of these were investigated (Fig. 5A). All the haplotype information is shown in Table S4. Fig. 5A indicates that there is variation for seed dormancy over the haplotypes; however this becomes clearer when we separate the 9 accessions that have the Col haplotype (10log(DSDS50) of Col is 1.35) from the non-Col haplotypes. The Col haplotypes have significantly lower dormancy levels than the non-Col haplotypes (P=0.008; Fig. 5B).
Figure 5. Effects of polymorphic alleles on seed dormancy for the DOG6 peak. A) Boxplots of the 18 haplotypes of 29 identified SNPs at the DOG6 peak. Only haplotypes which contained more than 3 accessions are shown. B) Boxplot diagrams of Col (n=9) and non-Col haplotypes (n=302). The Col haplotypes have significantly lower dormancy levels than the non-Col haplotypes (P =0.008).
For 157 of our accessions genome sequence data are available from the Arabidopsis genome browser http://signal.salk.edu/atg1001/3.0/gebrowser.php (Weigel and Mott, 2009). This sequence information was used to design an LD tool (http://biotools.wurnet.nl/biotools/index.php?p=14) that can be used to help identifying causal SNPs.
We focused on the SNPs in the genes of the sequenced accessions and intergenic SNPs were not taken into account. 51 SNPs, including 17 SNPs identified before, were detected at the DOG6 peak region, which adds four additional genes to the candidate gene list (Table 3). Nearly half of the SNPs (24 out of 51 SNPs) cause amino acids changes and two SNPs modify the stop codon, resulting in longer proteins. Gene AT3G44215 contains the highest number of SNPs in this region, namely 14 non-synonymous coding SNPs
33
Genome-wide analysis of seed dormancy
out of 21 SNPs and two loss-of-stop-codon SNPs. However, this gene is a transposable element (TE) gene that, due to the large amount of repetitive DNA, was difficult to sequence, which resulted in (partly) missing sequences for 26 accessions. In addition to this TE there are four more TE genes in this peak region. Although the function of TEs remain enigmatic (Tenaillon et al., 2010), recent studies have revealed that methylated TE insertions are often associated with reduced expression of nearby genes (Hollister et al., 2011). The genes with known functions are AT3G44220 (late embryogenesis abundant (LEA) hydroxyproline-rich glycoprotein), AT3G44240 (polynucleotidyl transferase, which is a gene involved in RNA modification), AT3G44250 (cytochrome P450, CYP71B38) and AT3G44290 (transcription factor ANAC060).
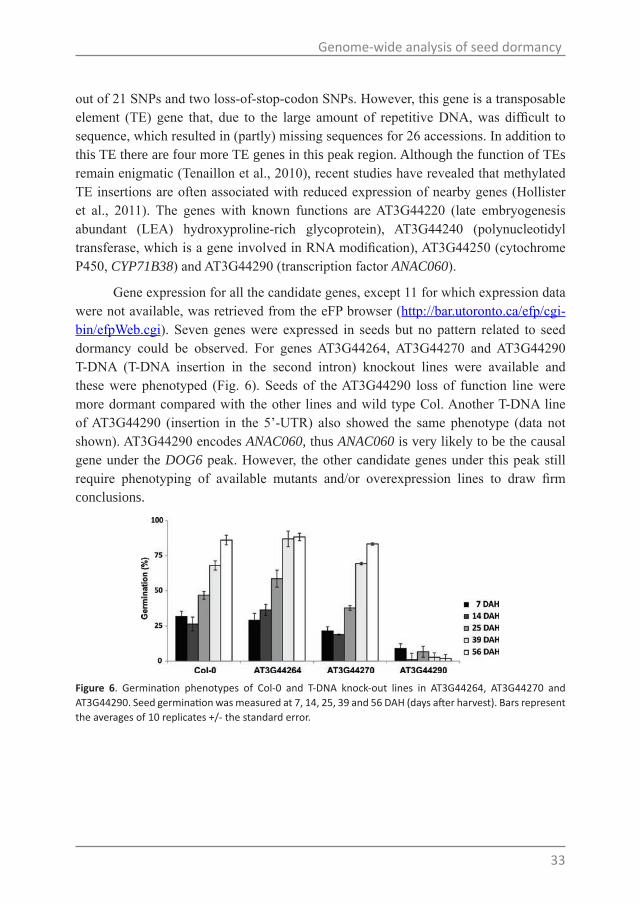
Gene expression for all the candidate genes, except 11 for which expression data were not available, was retrieved from the eFP browser (http://bar.utoronto.ca/efp/cgi-bin/efpWeb.cgi). Seven genes were expressed in seeds but no pattern related to seed dormancy could be observed. For genes AT3G44264, AT3G44270 and AT3G44290 T-DNA (T-DNA insertion in the second intron) knockout lines were available and these were phenotyped (Fig. 6). Seeds of the AT3G44290 loss of function line were more dormant compared with the other lines and wild type Col. Another T-DNA line of AT3G44290 (insertion in the 5’-UTR) also showed the same phenotype (data not shown). AT3G44290 encodes ANAC060, thus ANAC060 is very likely to be the causal gene under the DOG6 peak. However, the other candidate genes under this peak still require phenotyping of available mutants and/or overexpression lines to draw firm conclusions.
Figure 6. Germination phenotypes of Col-0 and T-DNA knock-out lines in AT3G44264, AT3G44270 and AT3G44290. Seed germination was measured at 7, 14, 25, 39 and 56 DAH (days after harvest). Bars represent the averages of 10 replicates +/- the standard error.

34
Chapter 2
Tabl
e 3.
SN
Ps o
f the
DO
G6 p
eak
iden
tified
by
usin
g re
-seq
uenc
ed d
ata
http:
//sig
nal.s
alk.
edu/
atg1
001/
3.0/
gebr
owse
r.php
(Wei
gel a
nd M
ott, 2
009)
and
an
LD to
ol w
hich
is
desig
ned
base
d on
that
info
rmati
on (h
ttp:
//bi
otoo
ls.w
urne
t.nl/b
ioto
ols/
inde
x.ph
p?p=
14).
Gene
AGI
cod
e, S
NP
positi
on, T
AIR
alle
le, n
on T
AIR
maj
or a
llele
, non
TAI
R al
lele
freq
uenc
y %
, am
ino
acid
mut
ation
type
and
the
desc
riptio
n of
mut
ation
are
list
ed b
elow
.
AGI c
ode
Posi
tion
TAIR
Non
TAI
R m
ajor
al
lele
Non
TAI
R al
lele
fr
eque
ncy
%AA
-mut
ation
-c
odea
Desc
riptio
n of
mut
ation
AT3G
4417
0*1
5894
889
AC
88N
34H
Non
-syn
onym
ous c
odin
g Aa
c/Ca
c*1
5895
155
TC
90P1
22Sy
nony
mou
s cod
ing
AT3G
4420
015
9091
99C
T90
L262
Syno
nym
ous c
odin
gAT
3G44
205
*159
1366
4C
G90
C553
SN
on-s
ynon
ymou
s cod
ing
AT3G
4421
0*1
5916
425
TG
83In
tron
AT3G
4421
215
9179
48C
T88
Pseu
doge
ne
AT3G
4421
5
*159
1957
3C
G69
G137
3AN
on-s
ynon
ymou
s cod
ing
gGt/
gCt
*159
1961
8T
C71
•135
8W13
58W
stop
lost
*159
1970
7G
A73
V132
8Sy
nony
mou
s cod
ing
*159
1972
4G
C73
Q13
23E
Non
-syn
onym
ous c
odin
g Ca
a/Ga
a*1
5920
032
TC
69Q
1220
RN
on-s
ynon
ymou
s cod
ing
cAg/
cGg
*159
2013
9T
C73
L118
4Sy
nony
mou
s cod
ing
*159
2046
3T
C73
Q10
76Sy
nony
mou
s cod
ing
*159
2047
7T
A74
I107
2FN
on-s
ynon
ymou
s cod
ing
Att/T
tt
*159
2095
7T
C72
K912
EN
on-s
ynon
ymou
s cod
ing
Aaa/
Gaa
*159
2106
8A
G66
S875
PN
on-s
ynon
ymou
s cod
ing
Tct/
Cct
*159
2136
8A
G70
S775
PN
on-s
ynon
ymou
s cod
ing
Tcg/
Ccg
*159
2147
1T
C69
Q74
0Sy
nony
mou
s cod
ing
*159
2154
3A
G73
S716
Syno
nym
ous c
odin
g*1
5921
727
CT
71C6
55Y
Non
-syn
onym
ous c
odin
g tG
t/tA
t*1
5921
882
AC
73N
603K
Non
-syn
onym
ous c
odin
g aa
T/aa
G15
9222
22A
C68
V490
GN
on-s
ynon
ymou
s cod
ing
gTt/
gGt
*159
2227
1C
G72
A474
PN
on-s
ynon
ymou
s cod
ing
Gct/
Cct
*159
2234
9A
C62
•448
G44
8G st
op lo
st*1
5922
499
TC
73M
398V
Non
-syn
onym
ous c
odin
g At
g/Gt
g*1
5922
575
AC
65H3
72Q
Non
-syn
onym
ous c
odin
g ca
T/ca
G*1
5922
807
AG
69I2
95T
Non
-syn
onym
ous c
odin
g aT
t/aC
t

35
Genome-wide analysis of seed dormancy
AT3G
4422
015
9296
39T
C88
D205
Syno
nym
ous c
odin
gAT
3G44
235
*159
3384
3A
G79
T160
Syno
nym
ous c
odin
gAT
3G44
240
1594
0322
GA
74A4
7TN
on-s
ynon
ymou
s cod
ing
Gca/
Aca
AT3G
4424
515
9430
49C
T61
Pseu
doge
ne15
9436
18G
A50
Pseu
doge
ne15
9444
58A
C53
Pseu
doge
ne
AT3G
4425
0*1
5948
524
TG
72Q
494P
Non
-syn
onym
ous c
odin
g cA
a/cC
a*1
5949
409
TC
71T2
44A
Non
-syn
onym
ous c
odin
g Ac
c/Gc
cAT
3G44
260
*159
5240
5T
C86
E217
Syno
nym
ous c
odin
g
AT3G
4426
4*1
5959
418
TG
86R1
35Sy
nony
mou
s cod
ing
1595
9709
TG
86S3
8RN
on-s
ynon
ymou
s cod
ing
Agt/
Cgt
AT3G
4426
7*1
5960
820
CA
82H1
66Q
Non
-syn
onym
ous c
odin
g ca
C/ca
A15
9607
68A
G81
Q14
9RN
on-s
ynon
ymou
s cod
ing
cAa/
cGa
*159
6176
3T
A80
Y481
NN
on-s
ynon
ymou
s cod
ing
Tac/
Aac
AT3G
4427
015
9627
12A
G82
D7G
Non
-syn
onym
ous c
odin
g gA
t/gG
t
AT3G
4427
415
9660
41T
C86
Pseu
doge
ne15
9661
39T
G78
Pseu
doge
ne15
9661
73G
C73
Pseu
doge
neAT
3G44
280
1596
8624
GA
793’
-UTR
AT3G
4429
0
*159
7326
8C
A76
Intr
on, A
ltere
d m
RNA
splic
ing,
ext
ra e
xon
1597
3288
TC
49In
tron
*159
7355
0T
C85
P168
Syno
nym
ous c
odin
g15
9743
66T
A85
Intr
on*1
5974
422
CT
84In
tron
* in
dica
te e
xtra
SN
Ps fo
und
in re
-seq
uenc
ed d
ata.
a AA-
mut
ation
-cod
e: fo
r exa
mpl
e: N
34H
mea
ns th
e SN
P ca
uses
the
34th
am
ino
acid
cha
nges
from
N to
H, P
122
indi
cate
s th
at th
e SN
P is
syno
nym
ous
SNP
in th
e 12
2th
amin
o ac
id
•135
8W m
eans
the
SNP
at 1
358th
am
ino
acid
cha
nges
stop
cod
on to
W.

36
Chapter 2
Candidate genes for the DOG5 peakThe DOG5 peak has 5 significant SNPs and 13 SNPs within +/-20 kb of the
significant SNPs and covers the genomic region from gene AT4G28170 to AT4G28330. As was done for the DOG6 peak, seed dormancy levels of the haplotypes of these 18 SNPs were categorized. There are 19 haplotypes that contain at least 3 accessions and the dormancy levels of these were plotted in Fig. 7. Detailed haplotype information is shown in Table S5. Fig. 7 indicates that there is variation for seed dormancy over the haplotypes.
Figure 7. Effects of polymorphic alleles on seed dormancy for the DOG5 peak. Boxplots of the 19 haplotypes of 18 identified SNPs at the DOG5 peak. Only haplotypes which contained more than 3 accessions are shown.
The genome re-sequencing data revealed 45 extra SNPs (Table 4). Only six of these SNPs cause amino acids changes while 21 SNPs are in introns. There are also four 5’-UTR SNPs and seven 3’-UTR SNPs which may cause variations in mRNA translation (Kuersten and Goodwin, 2003; Wilkie et al., 2003). Based on the gene annotation, AT4G28250 (EXPANSIN B3) is involved in cell wall loosening and since cell wall loosening is known to be important for seed germination it is a likely candidate gene (Lee et al., 2012). However, the T-DNA insertion mutant of this gene did not reveal a seed dormancy phenotype (data not shown), and the haplotypes of this gene did not display a clear phenotype (Fig. 8).

37
Genome-wide analysis of seed dormancy
Tabl
e 4.
SN
Ps o
f the
DO
G5 p
eak
iden
tified
usin
g th
e re
-seq
uenc
ed d
ata
http:
//sig
nal.s
alk.
edu/
atg1
001/
3.0/
gebr
owse
r.php
(Wei
gel a
nd M
ott, 2
009)
and
an
LD to
ol w
hich
is d
esig
ned
base
d on
that
info
rmati
on (h
ttp:
//bi
otoo
ls.w
urne
t.nl/b
ioto
ols/
inde
x.ph
p?p=
14).
Gene
AGI
cod
e, S
NP
positi
on, T
AIR
alle
le, n
on TA
IR
maj
or a
llele
, non
TAI
R al
lele
freq
uenc
y %
, am
ino
acid
mut
ation
type
and
the
desc
riptio
n of
mut
ation
are
list
ed b
elow
.
AGI c
ode
Posi
tion
TAIR
al
lele
Non
TAI
R m
ajor
al
lele
non
TAIR
alle
le
freq
uenc
y %
AA-m
utati
on-
code
aDe
scrip
tion
of m
utati
on
AT4G
2816
0*1
3980
897
TC
233’
-UTR
AT4G
2817
013
9818
06G
C27
E58Q
Non
-syn
onym
ous c
odin
g Ga
g/Ca
g
AT4G
2819
0
*139
8527
2A
C51
5’-U
TR
*139
8600
2T
A31
Intr
on
1398
6018
TC
30In
tron
*139
8629
4A
T45
Intr
on
*139
8640
7T
A30
Intr
on
AT4G
2820
0
*139
8767
2T
C45
3’-U
TR
1398
7768
TC
283’
-UTR
*139
8796
2A
T28
Intr
on
*139
8802
8G
A29
Y606
Syno
nym
ous c
odin
g ta
C/ta
T
AT4G
2822
0
*139
9329
7T
C45
Intr
on
*139
9329
8A
T45
Intr
on
*139
9334
1G
T42
Intr
on
1399
3458
AC
45E3
9AN
on-s
ynon
ymou
s cod
ing
gAa/
gCa
*139
9350
4G
T44
V54
Syno
nym
ous c
odin
g gt
G/gt
T
*139
9351
6T
A44
G58
Syno
nym
ous c
odin
g gg
T/gg
A
*139
9358
2C
A44
P80
Syno
nym
ous c
odin
g cc
C/cc
A
*139
9360
3G
A44
T87
Syno
nym
ous c
odin
g ac
G/ac
A
*139
9383
5G
A44
K134
Syno
nym
ous c
odin
g aa
G/aa
A

38
Chapter 2
AGI c
ode
Posi
tion
TAIR
Al
lele
Non
TAI
R m
ajor
al
lele
non
TAIR
alle
le
freq
uenc
y %
AA-m
utati
on-
code
aDe
scrip
tion
of m
utati
on
AT4G
2822
0
*139
9388
3A
G42
E150
Syno
nym
ous c
odin
g ga
A/ga
G
*139
9388
9C
G42
S152
Syno
nym
ous c
odin
g tc
C/tc
G
*139
9391
0C
T43
I159
Syno
nym
ous c
odin
g at
C/at
T
*139
9391
3A
T43
V160
Syno
nym
ous c
odin
g gt
A/gt
T
*139
9395
6C
A43
L175
IN
on-s
ynon
ymou
s cod
ing
Ctt/A
tt
*139
9404
8T
C35
Intr
on
*139
9478
2A
G44
Intr
on
*139
9485
0C
T45
A386
VN
on-s
ynon
ymou
s cod
ing
gCg/
gTg
*139
9498
3T
C44
S430
Syno
nym
ous c
odin
g tc
T/tc
C
*139
9509
5A
T44
Intr
on
*139
9510
2C
T44
Intr
on
*139
9535
7C
T43
Intr
on
*139
9549
7C
T43
Intr
on
*139
9550
9T
A43
Intr
on
AT4G
2823
0
*139
9587
0A
G7
3’-U
TR
1399
6521
GA
26R2
26Sy
nony
mou
s cod
ing
cgC/
cgT
*139
9719
9A
C24
5’-U
TR
AT4G
2824
0*1
3997
493
CA
673’
-UTR
*139
9814
4A
G65
S32
Syno
nym
ous c
odin
g tc
T/tc
C

39
Genome-wide analysis of seed dormancy
AT4G
2825
0
*140
0011
5C
T46
3’-U
TR
1400
0653
CA
31In
tron
*140
0105
6C
T39
K156
Syno
nym
ous c
odin
g aa
G/aa
A
1400
1589
TA
33G8
7Sy
nony
mou
s cod
ing
ggA/
ggT
*140
0173
6T
C8
Intr
on
*140
0176
9T
C46
Intr
on
AT4G
2826
014
0067
03A
G47
Intr
on
*140
0695
1A
T8
3’-U
TR
AT4G
2827
0*1
4008
832
TG
215’
-UTR
AT4G
2830
014
0151
37G
T6
Intr
on
AT4G
2835
0
*140
2690
0T
C5
L108
Syno
nym
ous c
odin
g ct
T/ct
C
*140
2703
7A
G5
N15
4SN
on-s
ynon
ymou
s cod
ing
aAc/
aGc
*140
2706
0G
A5
V162
IN
on-s
ynon
ymou
s cod
ing
Gtc/
Atc
AT4G
2837
0*1
4034
717
TC
65’
-UTR
*140
3597
9A
G8
Intr
on*
indi
cate
s ext
ra S
NP
foun
d in
re-s
eque
nced
dat
a.
a AA-
mut
ation
-cod
e: fo
r exa
mpl
e: N
34H
mea
ns th
e SN
P ca
uses
the
34th
am
ino
acid
chan
ges f
rom
N to
H, P
122
mea
ns th
e SN
P is
syno
nym
ous S
NP
in th
e 12
2th
amin
o ac
id
•135
8W m
eans
the
SNP
at 1
358th
am
ino
acid
cha
nges
stop
cod
on to
W.
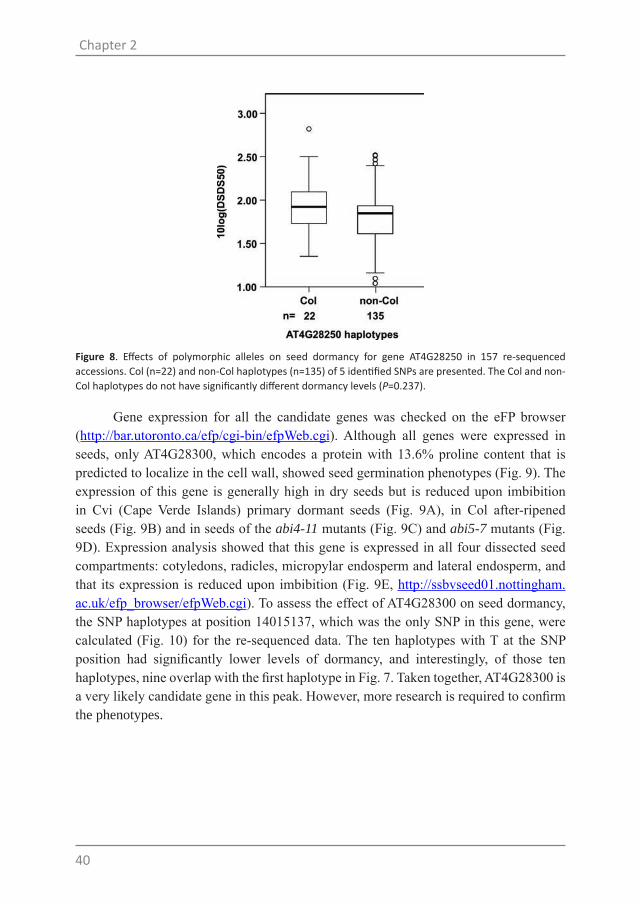
40
Chapter 2
Figure 8. Effects of polymorphic alleles on seed dormancy for gene AT4G28250 in 157 re-sequenced accessions. Col (n=22) and non-Col haplotypes (n=135) of 5 identified SNPs are presented. The Col and non-Col haplotypes do not have significantly different dormancy levels (P=0.237).
Gene expression for all the candidate genes was checked on the eFP browser (http://bar.utoronto.ca/efp/cgi-bin/efpWeb.cgi). Although all genes were expressed in seeds, only AT4G28300, which encodes a protein with 13.6% proline content that is predicted to localize in the cell wall, showed seed germination phenotypes (Fig. 9). The expression of this gene is generally high in dry seeds but is reduced upon imbibition in Cvi (Cape Verde Islands) primary dormant seeds (Fig. 9A), in Col after-ripened seeds (Fig. 9B) and in seeds of the abi4-11 mutants (Fig. 9C) and abi5-7 mutants (Fig. 9D). Expression analysis showed that this gene is expressed in all four dissected seed compartments: cotyledons, radicles, micropylar endosperm and lateral endosperm, and that its expression is reduced upon imbibition (Fig. 9E, http://ssbvseed01.nottingham.ac.uk/efp_browser/efpWeb.cgi). To assess the effect of AT4G28300 on seed dormancy, the SNP haplotypes at position 14015137, which was the only SNP in this gene, were calculated (Fig. 10) for the re-sequenced data. The ten haplotypes with T at the SNP position had significantly lower levels of dormancy, and interestingly, of those ten haplotypes, nine overlap with the first haplotype in Fig. 7. Taken together, AT4G28300 is a very likely candidate gene in this peak. However, more research is required to confirm the phenotypes.

41
Genome-wide analysis of seed dormancy
Figure 9. Seed gene expression levels of AT4G28300. Data was retrieved from the eFP browser (A-D: http://bar.utoronto.ca/efp/cgi-bin/efpWeb.cgi E: http://ssbvseed01.nottingham.ac.uk/efp_browser/efpWeb.cgi). A) Primary dormant dry, 24 hours and 48 hours imbibed Cvi seeds, B) 2-4 months after-ripened Col-0 seeds. Gene expression values of dry seeds, imbibed for 1, 2, 6, 12, and 24 hours seeds. C) abi4-11 dry and 24 h imbibed seeds. D) abi5-7 dry and 24 h imbibed seeds. E) Col-0 dry seed and 1 to 38 hours imbibed seed tissue specific expression values.
Figure 10. Effects of polymorphic alleles on seed dormancy for gene AT4G28300 at SNP position 14015137 in chromosome 4 in 157 re-sequenced accessions. Col (n=147) and non-Col haplotypes (n=10) are presented. The non-Col alleles have significantly lower dormancy levels than the Col alleles (P=0.023).

42
Chapter 2
Discussion
Association mapping for seed dormancy in natural populationsSeed dormancy is a complex adaptive trait of higher plants that is determined by
genetic factors and influenced by a large number of environmental factors (Koornneef et al., 2002; Donohue, 2009). Seed dormancy of Arabidopsis thaliana has been analysed in multiple natural populations by QTL studies (Loudet et al., 2002; Alonso-Blanco et al., 2003; Bentsink et al., 2010), as well as genome-wide association mapping (Atwell et al., 2010; Yano et al., 2013).
Atwell et al. (2010) used 191 accessions for association mapping, which were derived from hierarchical population samples and represent a worldwide collection of accessions (Nordborg et al., 2005; Shindo et al., 2005). Yano et al. (2013) also used a set of worldwide accessions to perform association mapping, but this set contained accessions that were different from the Atwell et al. (2010) dataset as well as our dataset. Therefore, these populations contain diverse polymorphism patterns, different population structures, as well as diverse linkage disequilibria.
We used DSDS50 to quantify seed dormancy levels. DSDS50 values represent the time of after-ripening that is required to reach 50% of germination and therefore provide a rather precise value for the level of dormancy that an accession contains. This in contrast to germination percentages at different time-points which might identify peaks that are more related to germination than to dormancy. Using individual time points during after-ripening resulted in different mapping outcomes (Fig. 4). This might be due to the low variation since there is always a large group of accessions that are still dormant (0% of germination) or germinate already for 100% (Fig. 1) as well as the large differences between each time point. In agreement with this result, Atwell et al. (2010) showed that germination at 7, 28, and 56 DAH gave divergent results and had no overlapping peaks. Therefore, it is not surprising that the peak identified by Yano et al. (2013) using germination percentages of two-month after ripened seeds was neither identified by Atwell et al. (2010) nor by us. However, in spite of these different ways of dormancy assessment, the DOG6 peak was also identified by Yano et al. (2013), indicating that the candidate gene under the DOG6 peak is very important for the control of seed dormancy.
DOG1, which is the major dormancy QTL identified among seven natural accessions (Bentsink et al., 2010), was not identified in our data by 10log transformation (Fig. 3). However the dormancy cluster mapping resulted in a significant SNP in this region (Fig. S2), despite the fact that it is a singleton rather than a string of significant SNPs in this region. Yano et al. (2013) detected a peak around DOG1 by both arcsine and logit transformation, but it was not the highest peak. It is unclear why the most
43
Genome-wide analysis of seed dormancy
significant peak in QTL mapping is generally not identified in GWA mapping. One possible explanation might be that in the QTL studies (Bentsink et al., 2010), only seven accessions have served as source of variation. The over-representation of strong DOG1 alleles in the Cvi and Kas (Kashmir) accessions compared to the rather weak Ler allele resulted in the identification of this locus whereas in the world wide set strong DOG1 alleles might be relatively rare. Moreover, Huang et al. (2010), using the Cal x Tac RIL population (Calver (Cal) from England and Tacoma (Tac) from Washington) identified DOG1, however, DOG6 was the strongest QTL under both lab and field conditions. This indicates that in different natural accessions, dormancy is genetically associated with different genes and gives an indication of natural selection and adaptation.
Moreover, analysis of a set of 163 Swedish accessions also revealed an association of dormancy with DOG1. At least 17 haplotypes showed a strong correlation with seed dormancy levels (Envel Kerdaffrec, personal communication), which again indicates adaptation. This hypothesis is supported by the finding that DOG1 contributes to local adaptation (Kronholm et al., 2012). Moreover, both Hancock et al. (2011) and Fournier-Level et al. (2011) showed strong correlations between fitness and a number of climate variables and clearly demonstrated that the molecular basis of climate adaptations and the genetic basis for fitness differ across locations.
Seed dormancy and geographic/climate parametersIt is well-known that one of the most important factors determining climate is
latitude, because of the solar radiation, day length and, as a result of that, temperature variations. Moisture differences due to the continental – oceanic distribution of land and sea contrast, resulting in dry to humid climate gradients, are associated with longitude (longitude zone) (http://www.fao.org/docrep/006/ad652e/ad652e00.htm, Global ecological zoning for the global forest resources assessment, 2000 final report). Therefore, the correlation of seed dormancy with latitude and longitude is the result of climatic variation. Our analysis revealed that seed dormancy correlated negatively with longitude and latitude (Table 1). This is in agreement with Debieu et al. (2013) who demonstrated that latitude caused co-variation between seed dormancy, growth rate and flowering in Arabidopsis and the patterns of trait co-variation changed, presumably because major environmental gradients shift with latitude.
Moreover, in our analysis it is worth noting that longitude had a stronger correlation with dormancy than latitude, which has not been described before. As most of the accessions in our population originate from Europe (294 out of 322), it is worthwhile to study the climate of Europe in detail to understand local adaptation and the reason for a high correlation between dormancy and longitude. Western Europe has an oceanic climate, whereas Eastern Europe has a drier, continental climate. Parts of the

44
Chapter 2
Central European plains have a hybrid oceanic/continental climate. Four seasons occur in Eastern Europe, whereas southern Europe experiences distinct wet and dry seasons, with prevailing hot and dry conditions during the summer months. Seed germination requires water and, therefore, it is possible that dormancy and germination have adapted to the dry-humid climate. Our correlation analysis with climatic parameters showed that precipitation had relatively high significant correlation with DSDS50 (P=0.00123, Table S3) and this is supported by Barazani et al. (2012) who showed that populations of Eruca sativa from arid sites possess deeper primary dormancy than those from mesic Mediterranean sites in Israel. So as the climate conditions along longitude are gradually changed, from hot-dry in Western Europe (especially Spain) to cold-humid in Eastern Europe and together with other complex climatic conditions along longitude, this resulted in relatively high correlation between dormancy and longitude.
Candidate genesOur genome-wide association mapping of seed dormancy by 10log transformation
has identified two main peaks located at chromosomes 3 and 4 (Fig. 3), for which one likely candidate gene of each peak was identified. However, we cannot rule out other candidate genes under the peak as not for all genes T-DNA knock-out lines were investigated for their dormancy behavior.
The most likely candidate gene of the DOG6 peak is ANAC060, which encodes a NAC transcription factor with a transmembrane domain (TMD) at the C-terminal (Kim et al., 2007). NAC transcription factors regulate various growth and developmental processes, including floral development (Zhong et al., 2007), apical meristem formation (Gordon et al., 2007) and cell division (Kim et al., 2006). The expression of several NAC transcription factors is influenced by abiotic stresses (Tran et al., 2004; Kim et al., 2007; Li et al., 2011), suggesting that they may be involved in plant stress responses and signaling. Controlled proteolytic activation of membrane-bound transcription factors (MTFs) can be an adaptive strategy to perturbations of the environment (Seo et al., 2008). Interestingly, Kim et al. (2008) have shown that a membrane-bound NAC transcription factor NTL8 (NTM1-Like 8; ANAC040) mediates the effect of salt on seed germination via the GA pathway. The T-DNA knock-out line of ANAC060 showed a clear seed dormancy phenotype. Complementation cloning and protein localization analysis are being performed in order to further characterize the molecular function of ANAC060. A recent publication has demonstrated that ANAC060 is responsible for altering sugar sensitivity in seedlings through the ABA signaling pathway. It showed that the membrane domain of ANAC060 anchors the protein to membranes, and the negative feedback on ABA signaling of nuclear located ANAC060 likely contributes to glucose insensitivity (Li et al., 2014). If indeed ANAC060 reveals to be the gene underlying the

45
Genome-wide analysis of seed dormancy
DOG6 peak this would be the second example of a relationship between sugar sensitivity and seed dormancy. Previously Teng et al. (2008) showed that the GLUCOSE SENSING QTL 5 (GSQ5) locus is allelic to DOG1.
The candidate gene of the DOG5 peak is AT4G28300, which encodes a protein that is predicted to be localized in the cell wall. Cell walls not only provide shape to the many different cell types, but are also multifunctional structures that protect cells from biotic and abiotic stresses, and regulate growth, development and intercellular communication (Albersheim et al., 2010; Keegstra, 2010). Seed dormancy release and germination are mediated by hormones, e.g. ABA and GA, and germination starts with cell wall loosening and radicle extension (Bewley, 1997). Cell wall loosening involves expansins (Cosgrove, 2000), which disrupt hydrogen bonding. However, the T-DNA knock out germination phenotype of EXPANSIN B3 (AT4G28250) did not have a seed dormancy phenotype. Of the candidate gene (At4G28300) only its cell wall localization is known and that it is highly expressed in dry seeds but down-regulated upon imbibition, suggesting that it is important in dormancy release or the germination process. The next step will be the phenotypic analysis of the T-DNA knock-out lines of this gene.
ConclusionsIn this chapter we have analysed primary seed dormancy in a world-wide collection
of accessions. We have analysed the correlation between seed dormancy and a set of 36 climatic parameters, as well as geographical parameters, in order to determine the factors that shaped the selective pressure during evolution. The high correlations of seed dormancy with geographical and climatic parameters confirmed that dormancy is an adaptive trait. Furthermore, GWA mapping of seed dormancy (DSDS50) was performed to identify causal SNPs that affect primary seed dormancy. The relatively large number of accessions and the accurate measurement of dormancy levels allowed robust GWA mapping. Two major peaks were detected and one most likely candidate gene for each peak was identified.
Materials and Methods
Plant materials and growth conditionsThe Arabidopsis population used in this study was composed of a set of 349
accessions (Li et al., 2010), which were obtained from the Arabidopsis Biological Resource Centre (ABRC). To synchronize the flowering time of this widely diverse population, all plants were vernalized (4°C, 16h day length) for eight weeks before transferring them to the greenhouse. All the accessions were grown in duplicate in two

46
Chapter 2
Rockwool blocks watered with a standard nutrient solution Table S6.
Salk T-DNA insertion mutants in gene AT3G44264 (SALK_132921), AT3G44270 (SAIL_517_G01), AT3G44290 (SALK_012554C) as well as wild type Col-0 (N60000) were obtained from the Nottingham Arabidopsis Stock Centre (NASC). Ten individual plants of each genotype were grown and watered with a standard nutrient solution, as described above.
Seed germination and dormancy determinationsGermination experiments were performed as described previously (Joosen et
al., 2010). In brief, two layers of blue germination paper were equilibrated with 48ml demineralized water in plastic trays (15 x 21 cm). Six samples of approximately 50 to 150 seeds were spread on wetted papers using a mask to ensure accurate spacing. Piled up trays were wrapped in a closed transparent plastic bag. The experiment was carried out in a 22°C incubator under continuous light (143 μmol m-2 s-1). Pictures were taken twice a day for a period of 6 days using the same camera and software as described for number of seeds.
Germination was scored using the Germinator package (Joosen et al., 2010). To measure seed dormancy level (DSDS50: days of seed dry storage required to reach 50% germination), germination tests were performed weekly until all seed batches germinated for more than 90%. A generalized linear model with a logit link as described by Hurtado et al. (2012) was adapted to calculate DSDS50. Germination data were adjusted by choosing n=100 and fitted as one smooth curve per line. The observed germination proportion was re-interpreted as having observed y “successes” in n binomial trials (e.g. 75% germinated means y=75 out of 100 possible “trials”). DSDS50 was the closest time point where a horizontal line with y=50 crosses the fitted curve.
Maximum germination (Gmax) values were extracted from the germination assay using the Germinator package (Joosen et al., 2010). Gmax is the final germination percentage at the end of the germination assay.
Climate dataThe climate data were obtained from the Climate Research Unit (CRU, Norwich,
UK). The 1.0 climate data set that we used consists of a construction of 0.5° latitude X 0.5° longitude surface climatology of global land areas, excluding Antarctica, between 1961 and 1990 (New et al., 1999), while the CRU 2.0 is a higher resolution data set of 10’ x 10’ grid (New et al., 2002).
Tools for extracting data from CRU climate datasets are

47
Genome-wide analysis of seed dormancy
available from http://prometheuswiki.publish.csiro.au/tiki-index.php?page=CRU+climate+data+extraction+tool.
CRU CL 1.0 (New et al., 1999) contains climate parameters of average value of each month, namely irradiation (Irr, μmol m-2 s-1), cloud cover (Cld, %), diurnal temperature range (diurnT, °C), precipitation (Prec, mm day-1), vapor pressure (Vapp, hPa), wet-day (Wetd, d), as well as maximum temperature (Tmax, °C) of each month, minimum temperature (Tmin, °C) of each month, mean temperature (Tmean) of each month. For all these variables, a maximum, minimum and mean annual value was calculated, so in total 27 variables were used for correlation analysis.
CRU CL 2.0 (New et al 2002) contains nine climate averages of precipitation (pre, mm month-1), wet-days (rd0, no days with >0.1 mm rain per month), temperature (tmp, °C), diurnal temp range (dtr, °C), relative humidity (reh), sunshine hours (sunp, percentage of daylength), frost days (frs, number of days with ground-frost per month), wind speed (wnd, m/s), elevation (elv, km).
In total, 36 climate variables were included in the correlation analysis.
Genome-wide association analysisGenome wide association mapping was performed using a custom R-script (R
version: R 2.13.1) and C+ program (ScanGLS) (in which EMMAX is imbedded) as described by (Kruijer et al., Submitted). Statistical significance was analysed using a non-parametric test (SPSS statistics 20).
Supplemental MaterialsSupplemental files can be downloaded from http://www.wageningenseedlab.nl/
thesis/hhe/SI/chapter2/
Table S1. Spearman correlation of DSDS50 between Atwell et al. (2010) data and the present study.
Table S2. Correlation between vapor pressure and temperature.
Table S3. Correlation between seed dormancy (DSDS50) and 36 climate parameters.
Table S4. DOG6 peak haplotypes
Table S5. DOG5 peak haplotypes
Table S6. Element concentrations in the standard nutrient solution

48
Chapter 2
Figure S1. Frequency distribution of the seven DSDS50 clusters
Figure S2. Manhattan plot of GWA mapping for seed dormancy in 311 accessions.
Figure S3. Manhattan plot of GWA mapping for seed dormancy (10Log(DSDS50)) in 283 EU accessions.
AcknowledgementWe thank Prof. Dr. Ing. Joost Keurentjes and Ing. Frank Becker providing in the
Arabidopsis population used in this study, and Willem Kruijer for providing R-script for GWA mapping.

Interaction between parental environment and genotype affects plant and seed performance in
Arabidopsis
Hanzi He1*, Deborah de Souza Vidigal1*, L. Basten Snoek2, Harm Nijveen3, Henk Hilhorst1, Leónie Bentsink1,4
1 Wageningen Seed Lab, Laboratory of Plant Physiology, Wageningen University, Droevendaalsesteeg 1, NL-6708 PB Wageningen, The Netherlands
2 Laboratory of Nematology, Wageningen University, Droevendaalsesteeg 1, NL-6708 PB Wageningen, The Netherlands
3 Laboratory of Bioinformatics, Wageningen University, Droevendaalsesteeg 1, NL-6708 PB Wageningen, The Netherlands
4 Department of Molecular Plant Physiology, Utrecht University, NL-3584 CH Utrecht, The Netherlands
*These authors contributed equally to this work.
Accepted by Journal of Experimental Botany
Chapter 3

50
Chapter 3
AbstractSeed performance after dispersal is highly dependent on parental environmental
cues, especially during seed formation and maturation. It is not clear what environmental factors are the most dominant in this respect. We have studied the influence of light intensity, photoperiod, temperature, nitrate and phosphate during seed development on five plant- and thirteen seed attributes. Twelve Arabidopsis genotypes were used, including near isogenic lines and loss-of-function mutants that have been reported to affect seed traits. Comparative analysis clearly indicated that the various environments during seed development resulted in changed plant and/or seed performances. Overall, temperature appears to play a dominant role in both plant and seed performance, whereas light has more impact on plant traits. Nitrate mildly affected some of the plant and seed traits while phosphate had even less influence on those traits. We report that low light and low temperature conditions increased seed dormancy and decreased longevity. We show that individual genotypes responded differentially to the environmental conditions, which indicates that different genetic and molecular pathways are involved in the plant and seed responses.
51
Parental effects on plants and seeds
IntroductionSeed performance refers to the capacity of seeds to germinate under various
environmental conditions and represents a critical component of the plant life cycle that is of eminent ecological and agronomic importance. It has been observed that a change of temperature, photoperiod, nutrient or drought stress, during seed development, maturation and after dispersal, may strongly affect seed performance (reviewed by Donohue (2009)). The principles of plasticity or adaptation of species with respect to seed performance in response to environmental changes is still largely unclear (Donohue et al., 2005; Donohue, 2009; Walck et al., 2011). However, it is imperative to increase our knowledge as climate changes are expected to play a powerful and diverse role in ecosystems all over the world.
One of the characteristics that determines seed performance is seed dormancy. In natural environments dormancy of dry seeds can be released by storage of the seeds for several months at mild temperatures (after-ripening; AR) or by cold stratification, which is a low-temperature treatment of imbibed seeds (Bewley et al., 2013). The roles of temperature, light quality, photoperiod, water and nutrients in determining the degree of seed dormancy have been investigated in a wide range of species (Fenner, 1991; Hilhorst, 1995; Holdsworth et al., 2008; Bewley et al., 2013) . Seeds that develop at warmer temperatures are generally less dormant at maturity than those that develop at cooler temperatures, as described for Beta vulgaris, Lactuca sativa, Amaranthus retroflexus, wild oat Avena fatua (Fenner, 1991), wheat (Biddulph et al., 2007), lettuce (Contreras et al., 2009), weedy rice (Gu et al., 2006) and Arabidopsis (Donohue et al., 2008; Kendall et al., 2011; Kendall and Penfield, 2012). Low temperature increases abscisic acid (ABA) content during seed development in Arabidopsis; plants grown at 15°C had 2-fold higher ABA content compared to those grown at 22°C, whereas gibberellic acid (GA) -levels were reduced around 3-fold (Kendall et al., 2011). Also, nutrition can affect seed dormancy; Alboresi et al. (2005) showed that the depth of seed dormancy of Arabidopsis is inversely correlated with seed nitrate content. Higher nitrate concentrations (50 mM) administered to the mother plant led to less dormant seeds than seeds produced under standard nitrate conditions (10 mM). Nitrate likely affects seed dormancy by its effect on ABA synthesis and degradation, since Matakiadis et al. (2009) showed that increased endogenous nitrate led to lower ABA levels in Arabidopsis seeds.
In addition to an effect on seed dormancy, environmental cues during seed development can also affect other traits that contribute to seed performance, such as seed weight, seed yield, ability to germinate and longevity (or ‘storability’). A recent study has shown that some of these traits are directly linked. Prevailing stress conditions, such as high salt, osmotic stress, high and low temperature, ABA treatment and artificial aging
52
Chapter 3
have a negative effect on germination, whereas seed size has a negative correlation with germination in the presence of ABA but a positive correlation with the rate of germination (Joosen et al., 2012). Nguyen et al. (2012) demonstrated a negative correlation between seed dormancy and seed longevity (deeper seed dormancy correlated with shorter longevity and better longevity correlated with lower seed dormancy) for natural alleles of several DELAY OF GERMINATION (DOG) loci.
ABA is a major player in plant responses to various environmental stresses and this plant hormone is also thought to play a role in seed performance after environmental stress. ABA levels increase during seed maturation and in response to different abiotic stresses (Xiong and Zhu, 2003), including drought, high salinity or low temperature (Iuchi et al., 2001; Kendall et al., 2011). The family of the 9-cis-epoxycarotenoid dioxygenases (NCEDs) catalyze the first committed step in ABA biosynthesis and NCED genes may be key elements in the control of ABA levels in seeds (Tan et al., 2003; Lefebvre et al., 2006). The NCED genes are involved in regulating key physiological processes in seeds, such as development, maturation, desiccation and germination, by affecting the ABA concentration (Iuchi et al., 2001; Tan et al., 2003; Lefebvre et al., 2006). In Arabidopsis, NCED3 expression is induced by drought stress and the endogenous ABA content under drought stress is increased, thereby increasing seed dormancy (Iuchi et al., 2001; Frey et al., 2012). NCED6 and NCED9 were shown to be essential for ABA production in the embryo and endosperm that imposes dormancy, whereas NCED5 fine-tunes ABA accumulation and affects seed dormancy and drought tolerance together with other NCED family members (Frey et al., 2012). Members of the CYP707A (Cytochrome P450, Family 707, Subfamily A) gene family, which catalyze steps of the ABA catabolic pathway, also play a prominent role in regulating endogenous ABA levels during seed development and germination (Okamoto et al., 2006). CYP707A transcript levels increased in response to abiotic stress, dehydration and exogenous ABA treatment (Saito et al., 2004). CYP707A1 is expressed predominantly during mid-maturation and is down-regulated during late-maturation, whereas CYP707A2 transcript levels increase from late-maturation to mature dry seed, indicating that CYP707A2 plays a major role in reducing the ABA content in after-ripening Arabidopsis seeds or during early seed imbibition (Kushiro et al., 2004; Okamoto et al., 2006; Matakiadis et al., 2009). Seeds of T-DNA insertion mutants of CYP707A2 have higher ABA content and exhibit increased dormancy, as compared to wild type plants (Kushiro et al., 2004).
Here, we investigated the effect of the parental environment on seed and plant performance. We used different genotypes: a set of DOG near isogenic lines (DOG-NILs; Bentsink et al. (2010)) that are known to be affected in their dormancy and seed longevity (Nguyen et al., 2012) levels by different genetic and molecular pathways, and several mutants that are defective in DOG1 gene expression (Bentsink et al., 2006)
53
Parental effects on plants and seeds
or in ABA biosynthesis (NCED6 and NCED9; (Lefebvre et al., 2006)) and catabolism genes (CYP707A1 and CYP707A2; (Kushiro et al., 2004; Saito et al., 2004)). These different genotypes might give a first indication of the genetic and molecular pathways that are involved in the response to the parental environment. A noticeable difference between mutants and NILs is that the genetic variation present in the NILs is the result of adaptations to local environmental variables. Seeds of all genotypes were harvested from plants grown under various light intensities, photoperiod, temperatures, nitrate and phosphate concentrations and seed performance was analysed by after-ripening requirement to release seed dormancy, seed longevity and germination under several stress conditions. In this paper we show that interaction between parental environment and genotype interaction clearly affects plant and seed performances in Arabidopsis.
ResultsTo investigate the effect of the parental environment on seed performance the
different genotypes from flowering onwards were grown in the environments listed in Table 1. Twelve genotypes were used, including two wild type accessions Landsberg erecta (Ler), Columbia (Col-0), five near isogenic lines (NILDOG1, NILDOG2, NILDOG3, NILDOG6, NILDOG22) that are known to affect seed dormancy (Bentsink et al., 2010), as well as two mutants that are affected in the DOG1 gene (dog1-1 and dog1-3) and three mutants of ABA biosynthesis and catabolism genes (cyp707a1-1, cyp707a2-1 and nced6 nced9). Here, seed performance refers to the capacity of seeds to germinate under varying environmental conditions. Several seed germination traits were determined, including seed dormancy (DSDS50), seed longevity, and germination under stress conditions (i.e. high and low temperatures, osmotic stress, salt stress and ABA stress conditions). Since the environment has both direct and indirect effects on seed performance we have also monitored several plant phenotypes, such as the time that is required for seed maturation, plant height, number of siliques per plant, number of seeds per silique, seed size and seed weight.

54
Chapter 3
Table 1. Environmental conditions before and after the start of flowering. After the start of flowering the plants were transferred to different parental conditions. For each condition the abbreviation that is used in Figure 1-5 has been indicated within brackets. Standard light intensity (SL), Long day (LD), 20°C, 5 mM nitrate (N5), 0.5 mM phosphate (P0.5) was regarded as control condition.
Environmental factors Before flowering After flowering
Light Intensity Standard (SL)
Low (75 μmol m-2 s-1) (LL)
Standard (150 μmol m-2 s-1), (SL)
High (300 μmol m-2 s-1), (HL)
Photoperiod Long Day (LD)
Short Day (8h daylength) (SD)
Long Day (16h daylength), (LD)
Continuous Light (CL)
Temperature 20°C
15°C
20°C
25°C
Nitrate 5 mM (N5)
0 mM (N0)
5 mM (N5)
20 mM (N20)
Phosphate
0.5 mM, 20°C (P0.5_20°C)
0.01 mM, 20°C (P0.01_20°C)
0.5 mM, 20°C (P0.5_20°C)
3 mM, 20°C (P3_20°C)
0.5 mM, 25°C (P0.5_25°C)
0.01 mM, 25°C (P0.01_25°C)
0.5 mM, 25°C (P0.5_25°C)
3 mM, 25°C (P3 _25°C)
The effect of the parental environment on the seed reproductive periodLow light intensity (LL) and short day (SD) extended the seed reproductive period
with approximately 10 days (Fig.1). In contrast, increased light intensity and extended photoperiod had no influence on the length of the seed reproductive period.
Low temperature (15°C) retards plant growth and, as a result, extends the reproductive period (Fig. 1). At 15°C, all genotypes required almost one month extra to complete their life cycle, as compared to 20°C, whereas at higher temperature (25°C) the reproductive period was shortened by 12 days.
Different nitrate and phosphate concentrations have no effect on the reproductive
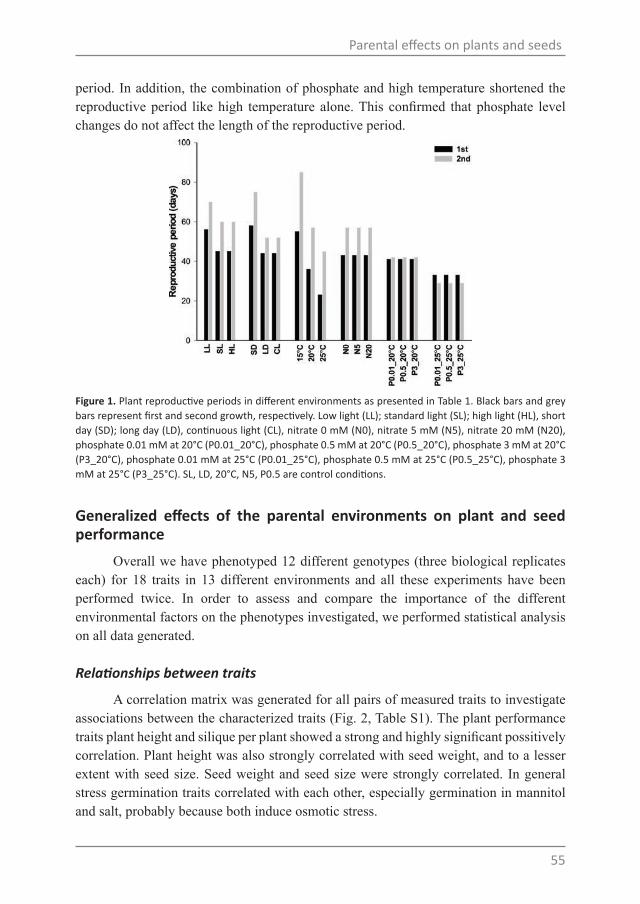
55
Parental effects on plants and seeds
period. In addition, the combination of phosphate and high temperature shortened the reproductive period like high temperature alone. This confirmed that phosphate level changes do not affect the length of the reproductive period.
Figure 1. Plant reproductive periods in different environments as presented in Table 1. Black bars and grey bars represent first and second growth, respectively. Low light (LL); standard light (SL); high light (HL), short day (SD); long day (LD), continuous light (CL), nitrate 0 mM (N0), nitrate 5 mM (N5), nitrate 20 mM (N20), phosphate 0.01 mM at 20°C (P0.01_20°C), phosphate 0.5 mM at 20°C (P0.5_20°C), phosphate 3 mM at 20°C (P3_20°C), phosphate 0.01 mM at 25°C (P0.01_25°C), phosphate 0.5 mM at 25°C (P0.5_25°C), phosphate 3 mM at 25°C (P3_25°C). SL, LD, 20°C, N5, P0.5 are control conditions.
Generalized effects of the parental environments on plant and seed performance
Overall we have phenotyped 12 different genotypes (three biological replicates each) for 18 traits in 13 different environments and all these experiments have been performed twice. In order to assess and compare the importance of the different environmental factors on the phenotypes investigated, we performed statistical analysis on all data generated.
Relationships between traits
A correlation matrix was generated for all pairs of measured traits to investigate associations between the characterized traits (Fig. 2, Table S1). The plant performance traits plant height and silique per plant showed a strong and highly significant possitively correlation. Plant height was also strongly correlated with seed weight, and to a lesser extent with seed size. Seed weight and seed size were strongly correlated. In general stress germination traits correlated with each other, especially germination in mannitol and salt, probably because both induce osmotic stress.

56
Chapter 3
Figure 2. Trait by trait correlation/significance of plant and seed performance. The linear model was used to calculate all pairwise correlations between plant and seed performance traits. In the red/blue colored area, rectangles represent Pearson correlation coefficient r values (see correlation color key). In the yellow/grey colored area, rectangles represent –log (P-values) of the Pearson correlation coefficients (see Significance color key) and empty rectangles represent not significant (P-values greater than 0.01). DSDS50 (days of seed dry storage until 50% of germination) represents dormancy levels. Longevity is measured by artificial aging (40°C, 85% relative humidity). Gmax is the final germination percentage at the end of the germination assay. t50 is the rate of germination. NA: not available.
The effect of the parental environmental factors
We used linear models/ANOVA (analysis of variance) to investigate the overall variance caused by the different parental environments. This analysis reveals that in general the effect of the genotype is the most pronounced (P<1x10-200) (Table 2), with a very prominent contribution of the genetic background (Ler or Col) of the

57
Parental effects on plants and seeds
genotypes (P<1x10-113). Also the effect of the parental environment was very significant (P<1x10-157). Of the environmental factors, temperature had the most significant effect on the traits measured (P<1x10-60; Table 2). A linear model was used to determine the significance of the different environments on each plant as well as on the seed traits (Table 3). Temperature played a dominant role in both plant and seed traits (as was also shown in Table 2), whereas light signals (light intensity and photoperiod) had more impact on plant traits. Nitrate mildly affected some of the plant and seed traits while phosphate had even less influence on those traits. To illustrate the direction of the effect of the parental environment, we have presented plant and seed performances in Fig. 3 and Fig. 4, respectively. Only the data for Ler and Col are presented since most of the effects were similar in all genotypes and the largest differences were caused by the genetic background. Data for all the genotypes on two growths is available in Fig. S1. The significance of all the genotypes for both growths is shown in Table 3. The effects that are different from the control treatment in both independent growths (T-test, P < 0.05) are presented in Fig. 3 and Fig. 4.
Table 2. Integrated analysis of all factors contributing to plant and seed performance.
Factors P
Genotype <1x10-200
Environmental summary* <1x10-157
Background <1x10-113
Temperature <1x10-60
Light intensity <1x10-49
Photoperiod <1x10-27
Phosphate <1x10-25
Nitrate <1x10⁻⁴
*Environmental summary is the combination of the five environmental factors. For every factor the P-value is reported to indicate significance.
The effect of light intensity on plant and seed performance
Light intensity affected all the plant phenotypes significantly (Table 3). In high light intensity (HL) plants grew taller (Fig. 3A) and produced more siliques per plant (Fig. 3B). Low light intensity (LL) significantly decreased the number of seeds per silique (Fig. 3C). High light intensity (HL) resulted in heavier (Fig. 3D) and larger seeds (Fig. 3E). High light intensity also had a positive effect on germination percentage in ABA (Fig. 4A), germination rate in 10°C (Fig. 4B) and seed longevity (Fig. 4C), as measured by artificial aging.
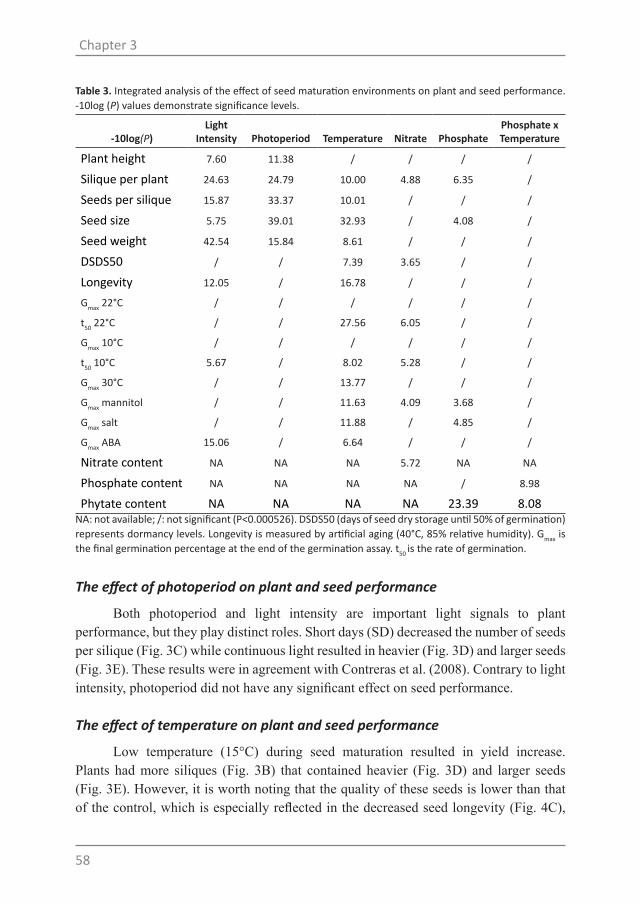
58
Chapter 3
Table 3. Integrated analysis of the effect of seed maturation environments on plant and seed performance. -10log (P) values demonstrate significance levels.
-10log(P)Light
Intensity Photoperiod Temperature Nitrate PhosphatePhosphate x Temperature
Plant height 7.60 11.38 / / / /
Silique per plant 24.63 24.79 10.00 4.88 6.35 /
Seeds per silique 15.87 33.37 10.01 / / /
Seed size 5.75 39.01 32.93 / 4.08 /
Seed weight 42.54 15.84 8.61 / / /
DSDS50 / / 7.39 3.65 / /
Longevity 12.05 / 16.78 / / /
Gmax 22°C / / / / / /
t50 22°C / / 27.56 6.05 / /
Gmax 10°C / / / / / /
t50 10°C 5.67 / 8.02 5.28 / /
Gmax 30°C / / 13.77 / / /
Gmax mannitol / / 11.63 4.09 3.68 /
Gmax salt / / 11.88 / 4.85 /
Gmax ABA 15.06 / 6.64 / / /
Nitrate content NA NA NA 5.72 NA NA
Phosphate content NA NA NA NA / 8.98
Phytate content NA NA NA NA 23.39 8.08NA: not available; /: not significant (P<0.000526). DSDS50 (days of seed dry storage until 50% of germination) represents dormancy levels. Longevity is measured by artificial aging (40°C, 85% relative humidity). Gmax is the final germination percentage at the end of the germination assay. t50 is the rate of germination.
The effect of photoperiod on plant and seed performance
Both photoperiod and light intensity are important light signals to plant performance, but they play distinct roles. Short days (SD) decreased the number of seeds per silique (Fig. 3C) while continuous light resulted in heavier (Fig. 3D) and larger seeds (Fig. 3E). These results were in agreement with Contreras et al. (2008). Contrary to light intensity, photoperiod did not have any significant effect on seed performance.
The effect of temperature on plant and seed performance
Low temperature (15°C) during seed maturation resulted in yield increase. Plants had more siliques (Fig. 3B) that contained heavier (Fig. 3D) and larger seeds (Fig. 3E). However, it is worth noting that the quality of these seeds is lower than that of the control, which is especially reflected in the decreased seed longevity (Fig. 4C),
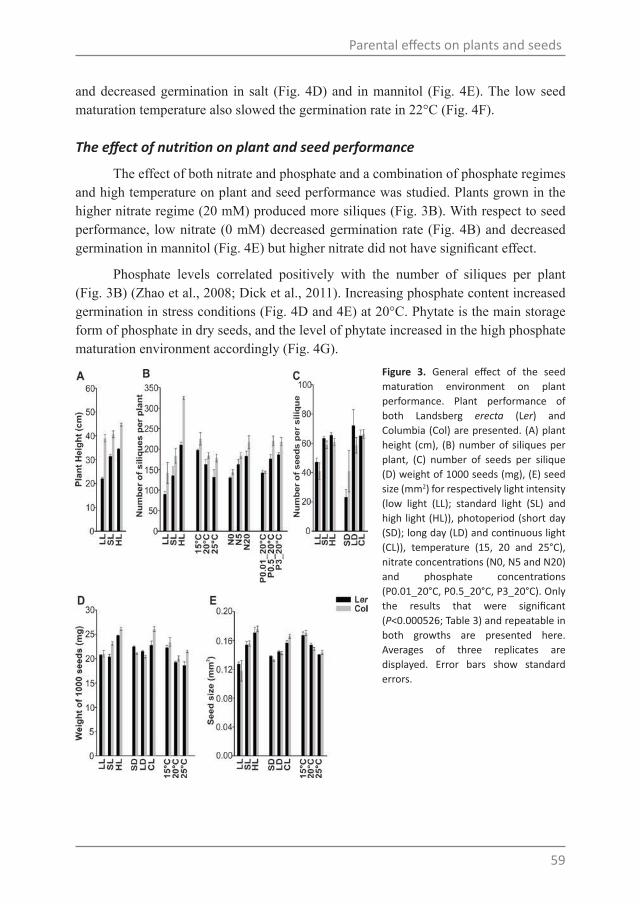
59
Parental effects on plants and seeds
and decreased germination in salt (Fig. 4D) and in mannitol (Fig. 4E). The low seed maturation temperature also slowed the germination rate in 22°C (Fig. 4F).
The effect of nutrition on plant and seed performance
The effect of both nitrate and phosphate and a combination of phosphate regimes and high temperature on plant and seed performance was studied. Plants grown in the higher nitrate regime (20 mM) produced more siliques (Fig. 3B). With respect to seed performance, low nitrate (0 mM) decreased germination rate (Fig. 4B) and decreased germination in mannitol (Fig. 4E) but higher nitrate did not have significant effect.
Phosphate levels correlated positively with the number of siliques per plant (Fig. 3B) (Zhao et al., 2008; Dick et al., 2011). Increasing phosphate content increased germination in stress conditions (Fig. 4D and 4E) at 20°C. Phytate is the main storage form of phosphate in dry seeds, and the level of phytate increased in the high phosphate maturation environment accordingly (Fig. 4G).
Figure 3. General effect of the seed maturation environment on plant performance. Plant performance of both Landsberg erecta (Ler) and Columbia (Col) are presented. (A) plant height (cm), (B) number of siliques per plant, (C) number of seeds per silique (D) weight of 1000 seeds (mg), (E) seed size (mm2) for respectively light intensity (low light (LL); standard light (SL) and high light (HL)), photoperiod (short day (SD); long day (LD) and continuous light (CL)), temperature (15, 20 and 25°C), nitrate concentrations (N0, N5 and N20) and phosphate concentrations (P0.01_20°C, P0.5_20°C, P3_20°C). Only the results that were significant (P<0.000526; Table 3) and repeatable in both growths are presented here. Averages of three replicates are displayed. Error bars show standard errors.

60
Chapter 3
Figure 4. General effect of the seed maturation environment on seed performance. Seed performance of both Landsberg erecta (Ler) and Columbia (Col) is presented. (A) germination in ABA (0.2 µM), (B) t50 (time (hours) required to reach 50% germination of the total number of germinated seeds)) of germination at low temperature (10°C), (C) germination after artificial aging (40°C, 85% relative humidity), (D) germination in salt (125 mM NaCl), (E) germination in mannitol (-0.8 MPa), (F) t50 (time (hours) required to reach 50% germination of the total number of germinated seeds) of germination at 22°C). (G) phytate content in seeds (mg/g seeds) for respectively light intensity (low light (LL); standard light (SL) and high light (HL)), photoperiod (short day (SD); long day (LD) and continuous light (CL)), temperature (15, 20 and 25°C), nitrate concentrations (N0, N5 and N20) and phosphate concentrations x temperature (P0.01_20°C, P0.5_20°C, P3_20°C, P0.01_25°C, P0.5_25°C, P3_25°C). Only the results that were significant (P<0.000526; Table 3) and repeatable in both growths are presented here. Averages of three replicates are displayed. Error bars show standard errors.
Genotype specific effects of the parental environment on seed performance
Genotype by environment interactions
Maturation environments have a noteworthy influence on seed dormancy levels,

61
Parental effects on plants and seeds
as well as on other plant and seed performance traits. However, several highly significant genotype by environment (GxE) interactions suggest that the phenotypic plasticity varied among the twelve genotypes tested. All the significant (P<0.001) GxE interactions for the parental maturation environments are listed in Table 4. To visualize this GxE effect we have shown the dormancy levels (DSDS50) for the nitrate environment (Fig. 5). Genotypes with higher primary dormancy levels display higher plasticity in the different nitrate environments. Thus, likely specific genetic regions (NILs) or genes (mutants) are the causal factors of higher plasticity. Furthermore, we see mainly an effect of reduced nitrate (0 mM) and not that of increased nitrate. Likely, the nitrate response is saturated between N20 and N5. All of the significant GxE interactions affecting plant and seed performances in the different environments are shown in Figure S1. To explore this in more detail, we will focus on genotype specific effects in the following section.Table 4. Significant genotype by environment interactions affecting plant and seed performance in all five environments.
Environment Plant/Seed performance GxE P-value
Light Intensity
DSDS50 2.5-10
Gmax 10°C 3.3-23
Gmax 22°C 4.7-15
Gmax mannitol 2.2-08
Gmax salt 4.0-09
Seed weight 3.8-07
PhotoperiodDSDS50 2.3-09
Seed weight 2.2-07
Temperature
DSDS50 7.1-09
Gmax 22°C 3.1-09
Gmax 30°C 2.7-04
Gmax mannitol 7.6-04
Gmax salt 2.7-05
Longevity 1.1-13
Nitrate
DSDS50 4.0-18
Gmax 10°C 8.7-04
Gmax 22°C 5.6-13
Gmax ABA 5.6-04
Gmax mannitol 2.2-06
PhosphateGmax 30°C 1.4-04
Gmax salt 6.0-04
DSDS50 (days of seed dry storage until 50% of germination) represents dormancy levels. Longevity is measured by artificial aging (40°C, 85% relative humidity). Gmax is the final germination percentage at the end of the germination assay.

62
Chapter 3
Figure 5. Genotype by environment interactions for seed dormancy behavior after seed maturation in different nitrate regimes. The Boxplot presents dormancy levels (DSDS50) of 12 genotypes in three nitrate environmental conditions (N0, N5 and N20). The genotype by environment interaction is significant (P=4.03−18).
Effect of the parental environment on seed dormancy and longevity
Low light intensity (LL) increased seed dormancy of NILDOG3 and NILDOG6 (Fig. 6A). Germination behaviour after artificial aging increased in low light intensity, indicating a negative correlation with seed dormancy for NILDOG3 and NILDOG6 (Fig. 6). However, the response of seed longevity to light was much more pronounced than that of dormancy. Light intensity significantly affected seed longevity for all genotypes tested (Fig. 6B and Fig. S1).
Our results show that the low maturation temperature increased dormancy in NILDOG1 significantly (Fig. 6C), but also in the other genotypes (Fig. S1). This can be explained by the functional DOG1 Ler and Col alleles that are present in these lines, which is supported by the lack of response in the dog1 mutants (Fig. S1). Also for temperature we have identified a negative correlation between seed dormancy and seed longevity (Fig. 6C and 6D).
Nitrate dosage, particularly low nitrate (0 mM) during silique formation increased the dormancy levels of NILDOG1 and cyp707a1-1 (Fig. 6E), but not of cyp707a2-1 (Fig. S1). Thus, the loss of function mutation in CYP707A2 leads to a defective response to nitrate and therefore no increase in dormancy.

63
Parental effects on plants and seeds
Figure 6. Dormancy (DSDS50) and longevity levels (germination after artificial aging) of seeds matured in different light intensity (A, B), temperature (C, D) and nitrate concentrations (E, F). Averages of three replicates are presented. Error bars show standard errors. Asterisks indicate significant differences between treatment and control of each genotype (P<0.05).
The effect of the parental environment on germination in stress conditions
In general, high light intensity, continuous light, high temperature (25°C), high nitrate and high phosphate resulted in higher germination percentage under stress (Fig. S1). Germination behaviour in mannitol and salt were positively correlated as described above (Fig. 2; Table S1; P=4.05-96). The nced6 nced9 double mutant that produces less

64
Chapter 3
ABA in its seeds (Lefebvre et al., 2006) showed the most distinguishable germination phenotype, germinating to approximately 100% in both salt and mannitol, irrespective of the maturation environment (Fig. 7). Meanwhile, cyp707a2-1 was always sensitive to stress conditions, and to a higher extent than cyp707a1-1 (Fig. 7).
Figure 7. Mannitol (A) and salt (B) stress germination of ABA biosynthesis double mutant (nced6 nced9) and catabolic mutants (cyp707a1-1 and cyp707a2-1) grown under different environments. Light intensity (low light (LL); standard light (SL) and high light (HL)), photoperiod (short day (SD); long day (LD) and continuous light (CL), temperature (15, 20 and 25°C)), nitrate concentrations (N0, N5 and N20) and phosphate concentrations x temperature (P0.01_20°C, P0.5_20°C, P3_20°C, P0.01_25°C, P0.5_25°C, P3_25°C). Averages of three replicates are presented. Error bars show standard errors. Asterisks indicate significant differences between treatment and control of each genotype (P<0.05).

65
Parental effects on plants and seeds
Experimental variation
Our experimental set-up allowed us to have a more detailed view of the variation between experiments. Since plants were growing in the different maturation environments, which were performed independently, and because each experiment contained the standard control condition (SL, LD, 20°C, N0 and P0.5; see materials and methods) we had nine control condition data sets. Even though the settings of these control conditions were the same, the results were quite variable (Table 5). This variation is both caused by variation during plant growth as well as during the germination experiments. Seed size displayed the largest experimental variation, which was 25.95%. Germination in ABA and 30°C also showed considerable experimental variation (17.95% and 18.35%, respectively), which largely can be explained by the timing of the experiment. We know that freshly harvested seeds are very sensitive to ABA, which can be overcome by a longer after-ripening period that widens the germination window. Germination data of just after-ripened seeds and two months after-ripened seeds are shown in Fig. S2 from which it is clear that two-month after-ripened seeds had much higher germination percentage compared with just after-ripened seeds. The experimental variation for the other stress germination traits (Gmax at 30°C, in mannitol or salt and t50 at 22°C) and seed longevity are most likely also caused by the timing of after-ripening. The number of siliques per plant might be affected by the time at which the plants are moved to the changed environment, as we explained in material and methods all siliques developed before the transfer have been removed at the moment of transfer (See Supplemental Material for concerns on experimental variation).Table 5. Experimental variation for all the plant and seed performance traits among the controls (n=9) (SL, LD, 20°C, N5, P0.5) grown in the different environments.
Trait P Variance explained
Seed size 5.43-25 25.95
Gmax ABA 4.75-15 17.95
Gmax 30°C 2.01-15 18.35
Gmax mannitol 5.29-12 14.56
Seeds per silique 5.02-10 12.14
Longevity 4.94-08 9.7
Silique per plant 5.43-07 9.14
Gmax salt 9.59-07 8.07
t50 22°C 2.89-04 4.79
Seed weight 6.27-04 3.93
Plant height 4.55-02 1.77
Gmax is the final germination percentage at the end of the germination assay. Longevity is measured by artificial aging (40°C, 85% relative humidity). t50 is the rate of germination
66
Chapter 3
DiscussionKnowledge about the effect of the parental environment on seed performance
provides more insight in fundamental principles of how the environment may influence the fitness of a species, as measured by fruit and seed yield, and seed performance. Such knowledge will not only help to predict seed performance but also assist in the improvement of breeding programs and seed production by choosing the best location, season, and soil type to increase yield and seed quality. Our study using twelve genotypes and thirteen different seed maturation environments provides a very detailed insight in the effect of both the environment and genotype on plant and seed performance.
Genotype by environment interactionsThe usefulness of studying different genotypes became apparent from the fact
that clear genotype specific effects were observed. Most obvious is the effect of the genetic background (Table 2, P<1x10-113). Ler and Col genotypes responded with a similar trend to the changes in the environment but Col plants are taller, produce more siliques per plant and are in general more stress tolerant (higher germination in ABA and higher germination after artificial aging) (Fig. 3 and Fig. 4). Furthermore, strong GxE interactions were observed (Table 4, Fig. 8). Photoperiod, phosphate and phosphate x temperature combination do not have significant effects on seed dormancy and longevity while light intensity, temperature and nitrate show clear genotype specific responses (Fig. 8). Low light conditions increased dormancy in NILDOG3 and NILDOG6, whereas temperature mainly affected NILDOG1 and cyp707a1-1 (Fig. 6 and Fig. 8). It remains unclear how light intensities can affect NILDOG3 and NILDOG6 since the underlying genes have not been cloned yet. For DOG1 it is known that low temperature during seed maturation increases expression and thereby seed dormancy (Chiang et al., 2011; Kendall et al., 2011). Low nitrate conditions also specifically increased seed dormancy in NILDOG1 and cyp707a1-1, as well as in the background accessions Ler and Col (Fig. 8). The precise effect of the environment on DOG1 and CYP707A1 remains to be investigated. However, both DOG1 expression and ABA levels in buried seeds increase in winter (Footitt et al., 2011) and likely CYP707A1 is required for the ABA breakdown. This agrees with the observed higher ABA levels in NILDOG1 and cyp707a1-1 in low nitrate and low temperature conditions (Fig. S3, see Supplemental Material for ABA extraction and detection method).

67
Parental effects on plants and seeds
Figure 8. Summarizing model of parental environmental effects on seed dormancy and longevity. Red and blue lines represent the environmental conditions which increase or decrease the trait level, respectively. Bold lines show the negative correlation between dormancy and longevity.
ABA metabolism and signaling are responsive to many important developmental processes and environmental cues, which make it a key regulator of growth in changing environments (Nambara and Kuchitsu, 2011). These physiological processes are primarily regulated by ABA maintenance, through fine-tuning of the rates of de novo biosynthesis and catabolism (Saito et al., 2004). The ABA biosynthesis defective nced6 nced9 double mutant was far less sensitive to changing environments, suggesting a role for de novo ABA synthesis during imbibition in these conditions. The expression of the ABA catabolic gene CYP707A2 was induced dramatically after 6 hours of imbibition whereas CYP707A1 did not peak at the early stages of germination. Therefore, CYP707A2 is likely more effective in the up regulation of ABA degradation during germination (Liu et al., 2009). This hypothesis is supported by the observation that cyp707a2-1 was always more sensitive to germination under stress (mannitol and salt) than cyp707a1-1 (Fig. 7 and Fig. S1).
The responses discussed above are direct effects of the environment on seed development and maturation; however, there might also be indirect responses. The increased length of the reproductive period at low temperature (Fig. 1) can be the cause of the heavier (Fig. 3D) and larger (Fig. 3E) seeds. Seeds are on the plant longer allowing

68
Chapter 3
increased nutrient translocation and reserve accumulation. Effects on seed performance in LL, SD and 15°C seem to be direct since the reproductive period was extended by 10-15 days for all three treatments but seed performance responses were different between the three environments (Fig. 4).
Negative correlation between seed dormancy and longevity Interestingly, we could manipulate the correlation between seed dormancy and
longevity by changing the seed maturation environment. Increasing light intensity, temperature and nitrate concentrations all decreased primary dormancy and increased seed longevity, as measured by artificial aging (Fig. 6 and Fig. 8). Only recently a similar negative correlation has been reported by Nguyen et al. (2012). These authors reported co-location of seed dormancy and seed longevity quantitative trait loci (QTL) that was confirmed in NILs. We show here that next to this genetic effect also seed maturation environments can affect the relation between dormancy and longevity. To our knowledge, this is the first report that shows that seeds matured in various environments display negative correlation between dormancy and longevity (Fig. 2, Fig. 6, Fig. 8 and Table S1). Contreras et al. (2008; 2009) took a similar experimental setup to investigate seed performance in lettuce. However, lettuce possesses almost no primary dormancy, which is most likely the reason that these authors did not find this negative correlation between dormancy and longevity. A negative correlation between seed dormancy and seed longevity, and a role for environmental adaptation has been described for Eruca sativa (Barazani et al., 2012; Hanin et al., 2013). These authors studied Eruca sativa plants that are distributed in Israel in a narrow geographic area, along different habitats ranging from arid- dry environments to more mesic habitats and found that dormancy increased with increasing aridity and that the seed longevity decreased along this gradient.
The combination of low seed dormancy and high longevity is a desired trait for crop species but also for seed conservation. A certain degree of dormancy is required to distribute the germination in time in the soil seed bank and prevent pre-harvest sprouting on the plant. Good seed longevity allows seeds to be stored until the next growth. Our study reveals that we can manipulate the growth conditions in order to culture seeds with the required seed performance.
Transfer of knowledge to cropsIn the present study we have investigated the effect of single environments and
only in one case the effect of a combined environment (phosphate and high temperature) which did not have any significant effect on either plant or seed performance (Table 3), whereas the single environments phosphate and temperature did have significant effects. In the field, environmental conditions are more complex. Plants often have to deal with

69
Parental effects on plants and seeds
combinatorial changes. For example, high light intensity is most likely companied by high temperature, whereas winter combines cold, short photoperiod and low radiation. Moreover, our analysis revealed that light intensity may significantly affect plant performance. Doubling the light intensity increased plant height, number of siliques per plant, number of seeds per silique, seed weight and seed size. Standard laboratory light intensities used in this and other studies (150 μmol m-2 s-1) are still rather low compared to that of sunlight (in open field, 1500 - 2000 μmol m-2 s-1 on sunny days and 200 - 450 μmol m-2 s-1 on cloudy days at noon in summer in the Netherlands (Global radiation data in 2012 from De Kring – Bleiswijk, the Netherlands) (Mishra et al., 2012). Our study indicates that Arabidopsis benefits substantially from growth at high light intensities. Whether crop plants respond in a similar way remains to be investigated, as well as whether striving for higher sunlight levels has the same advantages. Furthermore, we see that increased photoperiod, especially continuous light enhances plant performance, which might be detrimental to some crops, for example, tomato (Velez-Ramirez et al., 2011). The research performed here in the model plant Arabidopsis provides directions for further investigations in crop species.
ConclusionThe comparative analyses clearly indicated that environmental conditions during
seed development result in different plant and seed performances. Of all five parental environments analysed, temperature changes during seed maturation played a dominant role in both plant and seed performance, whereas light signals (light intensity and photoperiod) had more impact on plant traits. Nitrate and phosphate displayed relatively mild effects on plant and seed performance. The observation that the different genotypes responded differentially to the environmental conditions indicates that different genetic and molecular pathways are involved in these responses. We demonstrated the capacity of using GxE interactions to investigate these genotypic effects and indicated the potential of manipulating growth conditions to produce seeds with the desired seed performance.
Materials and Methods
Plant materialsThe Arabidopsis thaliana accessions Landsberg erecta (Ler-0), Columbia (Col-0)
and other genotypes with the Ler and Col genetic backgrounds were used in this study. NILDOG1-Cvi (Cape Verde Islands), NILDOG2-Cvi, NILDOG3-Cvi, NILDOG6-Kas-2 (Kashmir), NILDOG22-An-1 (Antwerpen) (Alonso-Blanco et al., 2003; Bentsink et al., 2010), and the dog1-1 mutant (Bentsink et al., 2006) are lines with a Ler genetic background, whereas dog1-3 (SALK 000867, T-DNA insertion in the promoter region

70
Chapter 3
of DOG1) (Bentsink et al., 2006), cyp707a1-1, cyp07a2-1 (Kushiro et al., 2004) and the Atnced6-Atnced9 double mutant (Lefebvre et al., 2006) are lines with a Col genetic background.
Growth conditionsSeeds were sown in petri dishes on water soaked filter paper followed by a 4-day
cold treatment at 4°C, and transferred to a climate room at 22°C with continuous light for 3 days before planting. Germinated seedlings were grown on 4 x 4 cm Rockwool blocks in a growth chamber at 20°C/18°C (day/night) under a 16-h photoperiod of artificial light (150 μmol m-2 s-1) and 70% relative humidity. Plants were grown in a standard nutrient solution (Chapter 2, Table S1) and watered three times per week. Upon the start of flowering, plants were transferred to the various environmental conditions (Table 1), for each condition three biological replicates containing five plants per replicate. Plants that were known to flower earlier (NILDOG2 and NILDOG22) were planted later (5 days) in order to synchronize the flowering. In case individual plants had already started flowering, those flowers and siliques were removed to make sure all the seeds developed under the specific environmental conditions. Due to space limitation in the growth compartments each environment was performed as an independent experiment containing the control condition, except for the second nitrate and temperature experiment these were performed at the same time and share therefore the control. All experiments at each growth condition were executed twice, for a robust confirmation of the phenotypes.
Plant phenotypingPlant height, number of siliques per plant and number of seeds per silique were
scored for all three replicates (one plant per replicate). To investigate the number of seeds per silique and seed size, flowers that had opened at day 10 after the start of flowering were tagged and harvested at seed maturity. The number of seeds was determined by taking photographs of the seeds on white filter paper (20.2 x 14.3 cm white filter paper, Allpaper BV, Zevenaar, The Netherlands, http://www.allpaper.nl) using a Nikon D80 camera fixed to a repro stand with a 60mm macro objective. The camera was connected to a computer with Nikon Camera Control Pro software version 2.0. Clustering of seeds was prevented as much as possible. The photographs were analyzed using ImageJ (http://rsbweb.nih.gov/ij/) by combining color thresholds (Y100-255U0-85V0-255) with particle
analysis.
Seed phenotypingSeeds were harvested as a bulk from five plants. Seeds were weighed with an

71
Parental effects on plants and seeds
AD-4 autobalance (PerkinElmer, Inc.). In order to determine the 1000-seed weight, single seed weight was measured by weighing around 5 mg of seeds, divided by the number of the weighed seeds.
Germination experiments and dormancy measurement were performed as described in Chapter 2. Germination under stress conditions was performed on fully after-ripened seeds. Stress conditions were: temperature stress (10°C, 30°C); osmotic stress (-0.8 MPa mannitol; Sigma-Aldrich), salt stress (125mM NaCl; Sigma-Aldrich), ABA stress (0.2 µM ABA; Duchefa Biochemie). ABA was dissolved in 10 mM MES buffer (Sigma-Aldrich) and the pH adjusted to 5.8. To measure seed longevity, an artificial aging test was performed by incubating seeds above a saturated ZnSO4 solution (40°C, 85% relative humidity) in a closed tank with circulation for 5 days (ISTA., 2012). In the accelerated aging method (ISTA., 2012) and in our artificial aging method the seeds are constantly incubated in the same relative humidity combined with a warm temperature. The accelerated aging method of ISTA uses near 100% relative humidity, whereas we used 85% relative humidity. Then the seeds were taken out and germinated on demineralized water as described before.
Germination parametersMaximum germination (Gmax) values were extracted from the germination
assay using the Germinator package (Joosen et al., 2010). Gmax is the final germination percentage at the end of the germination assay. For germination in demineralized water (control), and germination at 10°C, the Gmax of most genotypes reached 100%, therefore, to better distinguish the small differences between genotypes, the rate of germination (t50: the time required to reach 50% germination of the total number of germinated seeds) was also used in data analysis.
Nitrate, phosphate and phytate measurementsTo measure nitrate, phosphate and phytate content, 5mg of seeds were boiled
at 100°C for 15 minutes in 0.5 ml 0.5 M HCl and 50 mg l-1 trans-aconitate (internal standard). After centrifuging for 2 minutes at 13000 rpm, 200 µl of the supernatant was transferred to an HPLC-vial.
HPLC-analysis was performed on a Dionex ICS2500 system with an AS11-HC column and an AG11-HC guard column and eluted with NaOH. The elution procedure was: 0-15 min linear gradient of 25-100 mM NaOH, then 15-20 min 500 mM NaOH followed by 20-35 min 5 mM NaOH. Flow rates were 1 ml min-1 throughout the run. Contaminating anions in the eluents were removed using an ion trap column (ATC), installed between the pump and the sample injection valve. Anions were determined

72
Chapter 3
by conductivity detection. Background conductivity was decreased using an ASRS suppressor, with water as a counterflow. Peaks were identified and quantified using known external standards. External standards of nitrate, phosphate and phytate were: NaNO3 (Merck), Na2HPO4.2H2O (Merck) and Na(12)-IP6 IP6 (Sigma-Aldrich), respectively.
Data analysisAll data analysis was done in the statistical programming environment R 3.0.0.
Integrated analysis of all factors contributing to plant and seed performance.
All data was analysed together. For comparison between traits each trait dataset was normalized to a scale of 0 to 100. Analysis of variance (ANOVA) using linear models was used to determine significance of the different environmental variables one-by-one.
Integrated analysis of the effect of seed maturation environments on each plant and seed performance
The dataset was split up by environmental factors as show in Table 1. For data generated in each environment a linear model was fitted to determine the significance of the variable within the set. This was done over all genotypes. The significance threshold was adjusted for multiple testing by using significance 0.05 dividing the number of test (95) (P=0.000526).
Experimental variation for all the plant and seed performance traits among the controls
For five environments described in Table 1 the control environment was compared to investigate if they differed between environments and for which traits. We had nine control conditions as described above in growth conditions. For this ANOVA using a linear model was used to test each trait one by one. The explained variance was directly taken from the linear model whereas the P-value comes from the subsequent ANOVA.
Trait by trait correlation/significance of plant and seed performance
All data was used for this investigation. Pearson correlation was calculated for all trait pairs and significance was determined by linear regression.
Genotype by environment interactions
Data was split by environmental factors as described in Table 1. Genotype by environment interaction was determined by ANOVA using a linear model

73
Parental effects on plants and seeds
(trait~environment*genotype). Boxplots were generated by the standard R boxplot function, using the same linear model and data as use in the ANOVA as input.
Supplemental MaterialsSupplemental files can be downloaded from http://www.wageningenseedlab.nl/
thesis/hhe/SI/chapter3/
Table S1. Trait by trait correlation/significance of plant and seed performance.
Figure S1. Plant and seed performances of each genotype in five environments (light intensity, photoperiod, temperature, nitrate and phosphate).
Figure S2. Germination in ABA of 12 genotypes matured in three phosphate environments (0.01 mM, 0.5 mM and 3 mM).
Figure S3. ABA levels in freshly harvested seeds of Ler, NILDOG1, Col and cyp707a1-1 matured in low temperature (15°C) and low nitrate (N0) compared with the control condition (20°C/N5).
ABA extraction and detection method
Concerns on experimental variation
AcknowledgementWe thank Dr. Eiji Nambara (University of Toronto) for providing cyp707a1-1,
cyp707a2-1 seeds, Dr. Annie Marion-Poll (INRA) for providing the Atnced6 Atnced9 double mutant, Dr. Wilco Ligterink (Wageningen Seed Lab) for valuable discussions, Kerstin Gühl for ABA measurements, Diaan Jamar for nitrate, phosphate and phytate measurements and Dr. Jan E. Kammenga (Wageningen University) for his support.

Parental temperature and nitrate effects on seed performance are reflected by partly overlapping
genetic and metabolic pathways
Hanzi He1, Leo Willems1, Albert Batushansky2, Aaron Fait2, Johannes Hanson3,4, Harm Nijveen5, Henk Hilhorst1, Leónie Bentsink1,3
1 Wageningen Seed Lab, Laboratory of Plant Physiology, Wageningen University, Droevendaalsesteeg 1, NL-6708 PB Wageningen, The Netherlands
2 The Jacob Blaustein Institutes for Desert Research, Ben-Gurion University of the Negev, 84990, Sede Boqer Campus, Israel
3 Department of Molecular Plant Physiology, Utrecht University, NL-3584 CH Utrecht, The Netherlands
4 Umeå Plant Science Centre, Department of Plant Physiology, Umeå University, SE-90187 Umeå, Sweden
5 Laboratory of Bioinformatics, Wageningen University, Droevendaalsesteeg 1, NL-6708 PB Wageningen, The Netherlands
Chapter 4

76
Chapter 4
AbstractSeed performance is affected by the seed maturation environment and
previously, we have shown that temperature, nitrate and light intensity were the most influential parental factors affecting seed performance. Therefore, seeds grown in these environments were selected to assess the underlying metabolic pathways, using a combination of transcriptomics and metabolomics. These analyses revealed that the effects of temperature and nitrate parental environments were reflected by partly overlapping genetic and metabolic pathways, as based on similar metabolite and transcripts changes. Nitrogen-metabolism related metabolites (asparagine, GABA and allantoin) were significantly decreased in both low temperature (15°C) and low nitrate (N0) maturation environments. Correspondingly, nitrogen-metabolism genes (ALLANTOINASE, NITRATE REDUCTASE 1, NITRITE REDUCTASE 1 and NITRILASE 4) were significantly differentially regulated in the low temperature and nitrate maturation environments compared with control conditions. High light intensity during seed maturation increased the galactinol level, and displayed a high correlation with seed longevity. Low light had a genotype specific effect on cell surface encoding genes in the DELAY OF GERMINATION 6-Near Isogenic Line (NILDOG6). Overall, the integration of phenotypes, metabolites and transcripts leads to new insights in the regulation of seed performance.
77
Parental effects on seed transcriptome and metabolome
IntroductionSeed maturation is an important phase of seed development during which
embryo growth ceases, storage products accumulate and desiccation tolerance and seed dormancy are induced. Seed maturation is regulated by four master regulators, and the interactions among them have been extensively studied (Bewley et al., 2013). Plant hormones, especially abscisic acid (ABA) and gibberellins (GAs) and their balance are taken the leading role in the regulation of dormancy induction during seed maturation (Holdsworth et al., 2008).
Information from genetic and transcriptome studies has increased our understanding of the maturation process and its cross talk with environments. In transcriptome analysis experiments, the ABA catabolic gene CYP707A2 was identified to be responsive to exogenous nitrate levels and it was shown to play a central role in nitrate-mediated control of ABA levels during seed development and germination (Matakiadis et al., 2009). Kendall et al. (2011) identified genes associated with both dormancy (DOG1) and the hormone balance (GA2ox6, NCED4, and CYP707A2) that may underlie the dormancy changes caused by low seed maturation temperatures. Global transcript analysis of Arabidopsis thaliana (accession Cvi) seeds in a range of dormant and dry after-ripened states during dormancy cycling revealed that ABA signaling genes and ABA synthesis/catabolism key genes (NCEDs, CYP707A2, GA2ox2, GA3ox1) were particularly differentially expressed in various dormancy states (Cadman et al., 2006). These data support an ABA–GA balance mechanism controlling dormancy cycling.
Metabolic analysis has revealed that seed maturation is associated with significant decrease of sugar, organic acid, and amino acid levels, suggesting their efficient incorporation into storage reserves such as oil, seed storage protein and starch (Fait et al., 2006). Seed desiccation bridges maturation and germination, and is associated with distinct transcript and metabolite patterns, to acquire desiccation tolerance and prepare for germination (Angelovici et al., 2010). One metabolite that occupies a central position in amino acid metabolism in plants is glutamate (Forde and Lea, 2007). Glutamate is the precursor of many amino acids, such as arginine, proline and γ-aminobutyrate (GABA). In addition, glutamine synthesized from glutamate, catalyzed by GLUTAMINE SYNTHASE (GS), is vital for nitrogen fixation. In stressful environments, particularly carbon shortage, there is probably a strong demand to obtain carbon from amino acids to feed into the tricarboxylic acid (TCA) cycle. The regulation of the C/N balance can also be achieved by regulating the concentration of compounds with a low C/N ratio such as allantoin (C/N ratio of 1) (Miflin and Habash, 2002). Fait et al. (2011) demonstrated that glutamate-to-GABA conversion during seed development has a profound effect on the C/N balance and storage reserve accumulation in the seed. A metabolomic study of cold acclimation showed that metabolites such as proline, inositol, galactinol, raffinose

78
Chapter 4
and sucrose are important, as well as expression of C-REPEATDEHYDRATION RESPONSIVE ELEMENT BINDING FACTOR (CBF) genes (Cook et al., 2004).
In recent years, a number of studies on higher plants have begun to combine extensive transcript and metabolite data sets to understand the underlying regulatory processes. For example, by correlating a subset of transcripts with all measured metabolites Carrari et al. (2006) revealed that certain compound classes correlated with a large number of transcripts during tomato fruit ripening. Some unknown genes clustered with categorized genes and this could potentially aid in assigning putative functions for the many non-annotated genes. Similar methodology was employed for pepper ripening processes, and showed the coordinated regulation of transcripts and the accumulation of key organic acids, including malate, citrate, dehydroascorbate and threonate (Osorio et al., 2011). In Arabidopsis seeds, Angelovici et al. (2009) revealed the response of seed metabolism and transcription to developmentally inducible lysine metabolism. A large set of protein synthesis genes including ribosomal related genes, translation initiation and elongation factors and genes belonging to networks of amino acids and sugar metabolism were significantly regulated. These authors discussed the context of network interactions both between and within metabolic and transcriptional control systems and concluded that the inducible lysine metabolism was primarily associated with altered expression of genes belonging to networks of amino acids and sugar metabolism. This demonstrates that combining transcriptome and metabolite analysis can be helpful in identifying relevant metabolic pathways.
In chapter 3 it was shown that seeds matured in different environmental conditions had variable seed performance. We showed that temperature, nitrate and light intensity were the most discriminative parental environments. In addition to that, individual genotypes responded differentially to the environmental conditions, which triggered us to investigate the underlying genetic and molecular pathways. Here, we describe the metabolic profiling of the seeds matured in low temperature, low nitrate, low and high light intensities. A subset of these materials was also used for transcriptome analysis. Comparative analyses between both approaches showed that the effects of temperature and nitrate on seed performance are reflected by partly overlapping genetic and metabolic pathways while light intensity had more specific effects on transcripts and metabolites.
ResultsPlant and seed performance of 12 Arabidopsis genotypes that had been grown in
13 different environments from flowering onwards, were investigated in Chapter 3. The twelve genotypes included two wild type accessions: Ler, Col, five near isogenic lines: NILDOG1, NILDOG2, NILDOG3, NILDOG6, NILDOG22, two DOG1 mutants: dog1-

79
Parental effects on seed transcriptome and metabolome
1, dog1-3, and three mutants of ABA biosynthesis and catabolism genes: cyp707a1-1, cyp707a2-1, nced6 nced9. Seed performance of twelve genotypes that had matured under various temperature-, nitrate- and light intensity regimes, were affected by the different parental environments (Chapter 3, Table 3). In addition, significant genotype by environment interactions were found for a number of seed characteristics. Low temperature (15°C), low nitrate (N0) and low (LL) and high light (HL) were the most influential seed maturation environments. Therefore, seeds grown in these environments were selected to study the underlying metabolic pathways, using a metabolomics approach.
Genetic effects on metabolite profilesPrimary metabolites of dry dormant seeds were analysed using untargeted gas
chromatography-time of flight-mass spectrometry (GC-TOF-MS). This resulted in 24010 significant mass signals, after processing the raw data we obtained 124 representative masses each consisting out of reconstituted mass spectra. These 124 predominantly primary metabolites were identified by matching mass spectra and retention times to an in-house constructed library and the NIST05 (National Institute of Standards and Technology, Gaithersburg, MD, USA; http://www.nist.gov/srd/mslist.htm) libraries. This led to the identification of 41 metabolites, which included amino acids, sugars, organic acids and some precursors and derivatives of central metabolism compounds. (Table S1). β-D-Methylfructofuranoside (4TMS), glucopyranose (5TMS), hydroxyethyl-methanamine (2TMS), pentitol (5TMS), pentonic acid (5TMS) and unknown metabolites were matching with the NIST05 library but not confirmed using standards. In addition to primary metabolites profile, ABA contents were measured for the same samples.
Principle component analysis for primary metabolite profiles showed a clear separation of the two genetic backgrounds (Ler and Col), indicating that the variation caused by genetic background was larger than the variation caused by the altered maturation environments. Within each background group the maturation environmental effects were larger than the genotypic effects (Fig. 1). This was in contrast to the phenotypic variation where the variation introduced by genotype was the most prominent factor followed by the genetic background effect (Chapter 3, Table 2). The strong genotypic effect on seed performance is biased since the genotypes have been selected for these differences. However, the fact that different factors explain the phenotypic and metabolic variance indicates that seed performance cannot only be explained by the metabolic profile. A possible reason is the large plasticity of cellular metabolism that buffers the effect of the environment (Almaas et al., 2005; Fu et al., 2009). To exclude the background effect in the further analyses we have only used the Ler background genotypes in the following sections.
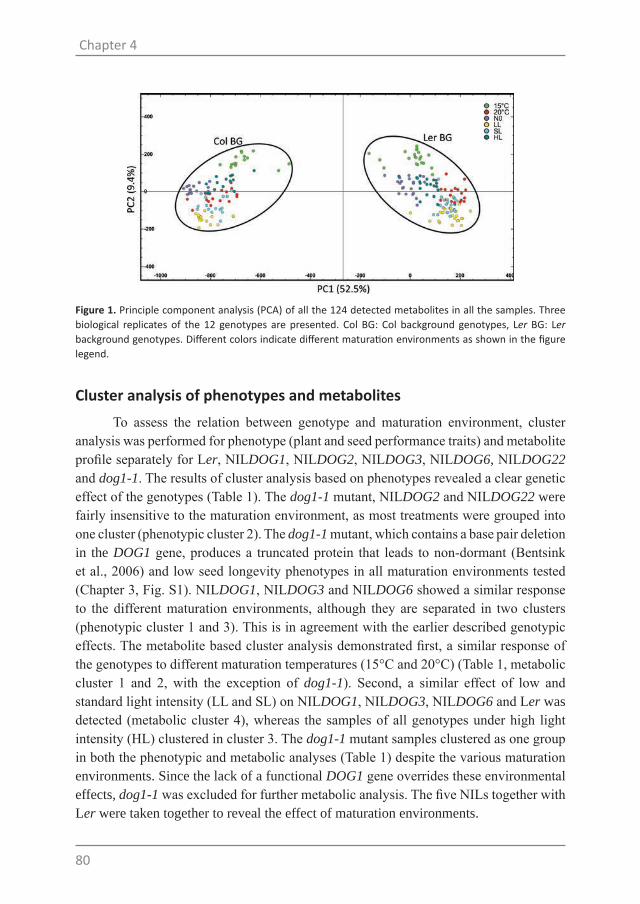
80
Chapter 4
Figure 1. Principle component analysis (PCA) of all the 124 detected metabolites in all the samples. Three biological replicates of the 12 genotypes are presented. Col BG: Col background genotypes, Ler BG: Ler background genotypes. Different colors indicate different maturation environments as shown in the figure legend.
Cluster analysis of phenotypes and metabolitesTo assess the relation between genotype and maturation environment, cluster
analysis was performed for phenotype (plant and seed performance traits) and metabolite profile separately for Ler, NILDOG1, NILDOG2, NILDOG3, NILDOG6, NILDOG22 and dog1-1. The results of cluster analysis based on phenotypes revealed a clear genetic effect of the genotypes (Table 1). The dog1-1 mutant, NILDOG2 and NILDOG22 were fairly insensitive to the maturation environment, as most treatments were grouped into one cluster (phenotypic cluster 2). The dog1-1 mutant, which contains a base pair deletion in the DOG1 gene, produces a truncated protein that leads to non-dormant (Bentsink et al., 2006) and low seed longevity phenotypes in all maturation environments tested (Chapter 3, Fig. S1). NILDOG1, NILDOG3 and NILDOG6 showed a similar response to the different maturation environments, although they are separated in two clusters (phenotypic cluster 1 and 3). This is in agreement with the earlier described genotypic effects. The metabolite based cluster analysis demonstrated first, a similar response of the genotypes to different maturation temperatures (15°C and 20°C) (Table 1, metabolic cluster 1 and 2, with the exception of dog1-1). Second, a similar effect of low and standard light intensity (LL and SL) on NILDOG1, NILDOG3, NILDOG6 and Ler was detected (metabolic cluster 4), whereas the samples of all genotypes under high light intensity (HL) clustered in cluster 3. The dog1-1 mutant samples clustered as one group in both the phenotypic and metabolic analyses (Table 1) despite the various maturation environments. Since the lack of a functional DOG1 gene overrides these environmental effects, dog1-1 was excluded for further metabolic analysis. The five NILs together with Ler were taken together to reveal the effect of maturation environments.

81
Parental effects on seed transcriptome and metabolome
Table 1. Cluster analysis of phenotypes and metabolites for seeds of Ler background genotypes matured in low temperature (15°C), standard temperature (20°C), low nitrate (N0), low light intensity (LL), standard light intensity (SL) and high light intensity (HL). NILDOG genotypes are simplified as ‘DOGs’.
Phenotypes Metabolites
Cluster 1 Cluster 2 Cluster 3 Cluster 4 Cluster 1 Cluster 2 Cluster 3 Cluster 4
DOG1_15°C dog1-1_15°C DOG1_20°C DOG2_N0 dog1-1_15°C DOG1_20°C dog1-1_HL dog1-1_SL
DOG1_LL dog1-1_20°C DOG1_HL DOG22_20°C DOG1_15°C DOG2_20°C dog1-1_LL DOG1_LL
DOG3_15°C dog1-1_HL DOG1_N0 DOG22_N0 DOG2_15°C DOG22_20°C dog1-1_N0 DOG1_SL
DOG3_N0 dog1-1_LL DOG1_SL Ler_20°C DOG22_15°C DOG3_20°C dog1-1_20°C DOG22_LL
DOG6_LL dog1-1_N0 DOG3_HL Ler_N0 DOG3_15°C DOG6_20°C DOG1_HL DOG3_LL
DOG6_N0 dog1-1_SL DOG3_LL DOG6_15°C Ler_20°C DOG1_N0 DOG3_SL
Ler_15°C DOG2_15°C DOG3_SL Ler_15°C DOG2_HL DOG6_LL
Ler_LL DOG2_20°C DOG6_15°C DOG2_LL DOG6_SL
DOG2_HL DOG6_SL DOG2_N0 Ler_LL
DOG2_LL DOG2_SL Ler_SL
DOG2_SL DOG22_HL
DOG22_15°C DOG22_N0
DOG22_HL DOG22_SL
DOG22_LL DOG3_HL
DOG22_SL DOG3_N0
DOG3_20°C DOG6_HL
DOG6_20°C DOG6_N0
DOG6_HL Ler_HL
Ler_HL Ler_N0
Ler_SL
Correlations between seed performance traits and metabolitesWith the intention of investigating the metabolic changes in relation to their altered
seed performance, correlation plots were made between primary metabolites, ABA contents and seed performance traits using Ler and the five NILs for each maturation environment, each with its own control.
Overall the four correlation plots were quite different (Fig. 2), indicating that the different maturation environments affecting seed performance are reflected by different metabolic pathways. However, there were also some common effects. ABA levels correlated positively with dormancy levels (DSDS50: days of seed dry storage required to reach 50% germination) in all four environments, with correlation coefficients (r) of 0.67, 0.67, 0.45 and 0.34 in, respectively, 15°C, N0, HL and LL (Table S2). These results confirm the importance of ABA during seed dormancy induction (Bewley et al., 2013).

82
Chapter 4
Figure 2. Correlation analysis of metabolites and seed performance traits of Ler and five NILs in four maturation environments. (A) low temperature (15°C) and standard temperature (20°C, control), (B) low nitrate (N0) and standard nitrate (N5, control, N5 and 20°C are the same control), (C) low light intensity (LL) and standard light intensity (SL, control) and (D) high light intensity (HL) and standard light intensity (SL, control). The black rectangles indicate the correlations discussed in the text.
The correlation patterns in 15°C and N0 have some similarities (Fig. 2A and 2B). DSDS50 showed similar correlations with all the metabolites in both environments (Fig. 2A and 2B). ABA levels correlated negatively with almost all the phenotypes except DSDS50. Galactinol and myo-inositol both had negative correlations with almost all phenotypes except DSDS50, yet in N0 the negative correlations were higher than in 15°C. In LL and HL (Fig. 2C and 2D), similar correlations for DSDS50 with all metabolites were observed. Four TCA cycle intermediates and 2-hydroxyglutarate, which is derived

83
Parental effects on seed transcriptome and metabolome
from the TCA cycle intermediate 2-oxoglutarate, all had negative correlations with almost all measured seed performance traits in both environments.
Allantoin and urea are two nitrogen rich compounds. In low temperature (15°C) and low nitrate (N0) conditions, allantoin correlated negatively with DSDS50 (r= -0.55 and -0.34). However, in LL, allantoin and urea correlated positively with DSDS50 (r= 0.60 and 0.49) (Fig. 2C).
The correlation plots also showed that each environment had its unique effects (Fig. 2). In 15°C, there were contrasting correlations between metabolites and seed performance traits (Fig. 2A). In 15°C seed performance traits correlated positively with each other except for DSDS50, which correlated negatively with all the other seed performance traits (Fig. S1A).
Nitrate content correlated positively with most of the amino acids and nitrogen rich compounds in N0 (Fig. 2B). Only NAcGlu, the intermediate between glutamate and the urea cycle, showed a negative correlation with nitrate content. Longevity showed a strong negative correlation with galactarate (r= -0.71) and gluconate (r= -0.72).
Galactinol in altered light intensity, especially in high light intensity (HL) was highly positively correlated with seed longevity (r= 0.93, Table S2) (Fig. 2D).
Overview of metabolites abundance change in metabolic pathwaysThirty-seven out of the 41 identified primary metabolites were mapped on
metabolic pathways to view the metabolic changes in a more dynamic manner (Fig. 3). Low temperature significantly altered TCA cycle activity: all four TCA intermediates were decreased in 15°C, the level of fumarate and succinate was halved.
Low nitrate and low temperature both decreased nitrogen rich amino acids, such as asparagine and nitrogen-related compounds, like GABA. Also pyroglutamate and allantoin were decreased under both conditions and glutamate, aspartate and urea only decreased in low nitrate. In both conditions glucuronate levels were significantly increased (over two-fold). Together with the correlation analyses (Fig 2A and 2B) these results indicate that 15°C and N0 affect seed performance apparently are mediated by similar metabolic pathways.
Light intensities affected the above mentioned metabolites in an opposite way when compared to the effect on seed performance. Nitrogen rich compounds, which were decreased in low nitrate and low temperature (Fig. 3), correlate with increased seed dormancy, i.e. a negative correlation of nitrogen rich compounds with DSDS50 (Fig. 2A and 2B). However in low light intensity (LL), allantoin and urea increased (Fig. 3) with increased seed dormancy, i.e. positive correlation of allantoin and urea with DSDS50 (Fig. 2C). A possible explanation for this is that under the low light intensity

84
Chapter 4
plants produce fewer siliques and less seeds per silique (Chapter 3, Fig. 3). However, the amount of nutrients supplied to the plant was the same as the control condition. Consequently, the amount of assimilated nutrients per seed may be higher than under the control condition. Thus the low light intensity condition could resemble the high nitrate condition to some extent, whereas the high light intensity condition, apparently, is similar to the low nitrate condition. This is supported by cluster analysis that in metabolites cluster 3 N0 is clustered with HL (Table 1).
Figure 3. Changes of metabolite levels in the framework of metabolic biosynthetic pathways. The values below each metabolite box indicate the fold change of Ler and five NILs. Asterisks indicate a more than two-fold (P<0.05) significant increase/decrease between changed environment and control. Environments are low temperature (15°C), low nitrate (N0), low light intensity (LL) and high light intensity (HL).

85
Parental effects on seed transcriptome and metabolome
Metabolite networks show decreased correlations of metabolites in low temperature and high light intensity
The correlation-based network shows that under standard conditions the relationship between metabolites was strong and intertwined (Fig. 4A). Especially amino acids and nitrogen rich compounds were highly interconnected (Fig. 4A). The low maturation temperature led to a strong decrease in number of nodes and edges (Fig. 4B, Table 2). Moreover, correlations involving succinate, fumarate, citrate and malate did not pass the threshold set for the network, suggesting a significant change in TCA cycle activity that shifted from normal to stress metabolism (Fig. 4B). This confirms the observation in Fig. 3 that all four TCA intermediates were decreased in 15°C. Taken together, energy metabolism seems to be restricted in 15°C. Moreover, the appearance of the unique triad raffinose - myo-inositol - galactinol in Fig. 4B suggests the involvement of these three metabolites in the response to low temperature stress. The correlations of these three metabolites in both 20°C and 15°C conditions are shown in Table 3. Although the absolute fold changes were not significant (Fig. 3), they became highly correlated in low temperature (r>0.8). The temperature-induced changes also affected metabolism of N compounds, though to a weaker extent. Thus aspartate, one of the main players of the network under normal temperature, lost part of its links, while glutamate kept most of it edges under both regimes (Fig. 4A and 4B). This reinforces the central role of glutamate in relation with other amino acids (see Forde and Lea (2007 for extensive review)).
The effect of light intensity was also investigated using the network approach. The metabolic cluster analysis (Table 1, metabolic cluster 4) indicated that the standard (SL) and low light intensity (LL) maturation environmental effects are rather similar (Table 1). Thus to improve the interpretation of the analysis, the network was constructed by combining the SL and LL data in comparison to the high light intensity (HL) network. The close relationship between amino acids under HL was absent from the SL/LL network (Fig. S2). The links between sugars and TCA cycle intermediates (succinate - fumarate - malate) was also dropped under HL.
Due to the limited number of significant correlations it was not possible to generate the low nitrate network, suggesting that metabolic correlations are significantly disrupted because of the low nitrate maturation environment.
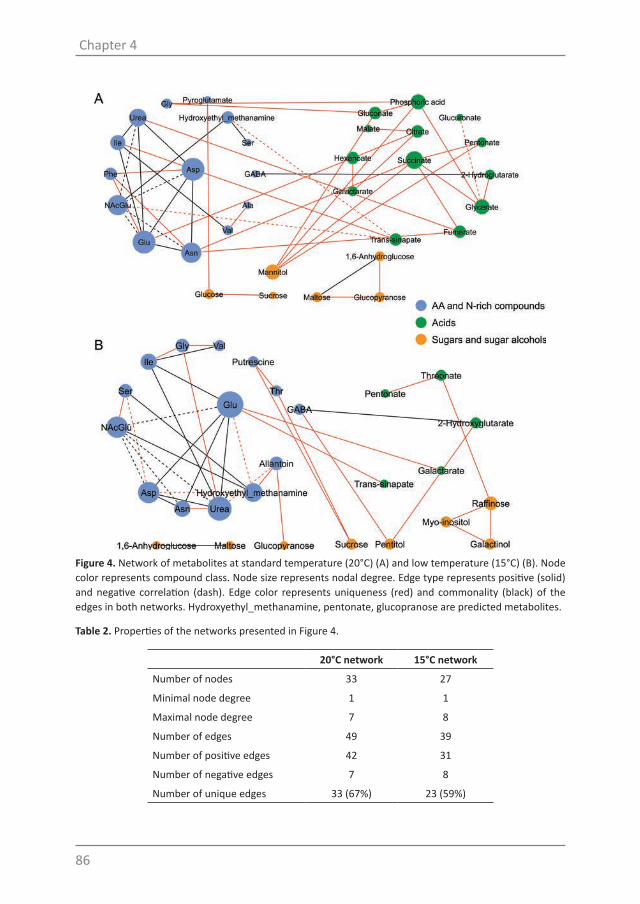
86
Chapter 4
Figure 4. Network of metabolites at standard temperature (20°C) (A) and low temperature (15°C) (B). Node color represents compound class. Node size represents nodal degree. Edge type represents positive (solid) and negative correlation (dash). Edge color represents uniqueness (red) and commonality (black) of the edges in both networks. Hydroxyethyl_methanamine, pentonate, glucopranose are predicted metabolites.
Table 2. Properties of the networks presented in Figure 4.
20°C network 15°C network
Number of nodes 33 27
Minimal node degree 1 1
Maximal node degree 7 8
Number of edges 49 39
Number of positive edges 42 31
Number of negative edges 7 8
Number of unique edges 33 (67%) 23 (59%)

87
Parental effects on seed transcriptome and metabolome
Table 3. Spearman correlation of raffinose family metabolites in standard (20°C) and low temperature (15°C). Correlations are calculated using the Ler background genotypes.
Correlation 20°C 15°C
Raffinose - Galactinol 0.18 0.82**
Galactinol - Myo-inositol 0.48* 0.82**
Raffinose - Myo-inositol 0.54* 0.81***significant at P < 0.05 **significant at P < 0.01
The effect of the parental environment on the dry seed transcriptomeWe also analysed genome-wide gene expression in freshly harvested dry seed of
NILDOG1, NILDOG3 and NILDOG6 grown in low temperature (15°C), low nitrate (N0) and low light intensity (LL) to investigate the effect of the environment on seed stored mRNAs. All three genotypes responded in a similar way to the environmental factors and all three environments affected seed dormancy in the same direction (increased DSDS50) (Fig. 5A, 5B, 5C). The number of genes differentially expressed in 15°C was the highest compared with N0 and LL, especially for the up-regulated genes (Table 4). In 15°C and N0 conditions, the three genotypes respond in a similar way, with a significant number of genes that were commonly up/down regulated (Fig. 5) so in this case the genotype specific response to a certain environment is relatively small.Table 4. Numbers of genes up/down regulated in low temperature (15°C), low nitrate (N0) and low light intensity (LL) for NILDOG1, NILDOG3 and NILDOG6. The threshold is set at a fold change of two and P<0.05.
NILDOG1 NILDOG3 NILDOG6
up down up down up down
15°C 216 82 187 105 196 106
N0 50 64 36 108 38 109
LL 16 11 0 3 58 75

88
Chapter 4
Figure 5. Dormancy levels and transcriptome changes of NILDOG1, NILDOG3 and NILDOG6 seeds grown in different seed maturation environments. Dormancy levels of seeds grown in low temperature (15°C) (A), low nitrate (N0) (B) and low light intensity (LL) (C) environments. Averages of three replicates are presented. Error bars show standard errors. Asterisks indicate significant differences between treatment and control of each genotype (P<0.05). (D, E, F) Venn diagrams comparing up-regulated genes in freshly harvested dry seeds of NILDOG1, NILDOG3 and NILDOG6 grown in 15°C, N0 and LL, respectively. (G, H, I) Venn diagrams comparing down-regulated genes in freshly harvested dry seeds of NILDOG1, NILDOG3 and NILDOG6 grown in 15°C, N0 and LL, respectively.
Over-representation analysis was performed on significantly changed genes (>2 fold, Adjusted P value<0.05) using Pageman analysis (Fig. 6). Several functional categories, among which N-metabolism, RNA related and cell related categories, were commonly down regulated in 15°C and N0. Besides that, down regulated genes of NILDOG1 and NILDOG6 in 15°C are enriched in (general) stress, abiotic stress and heat stress classes.
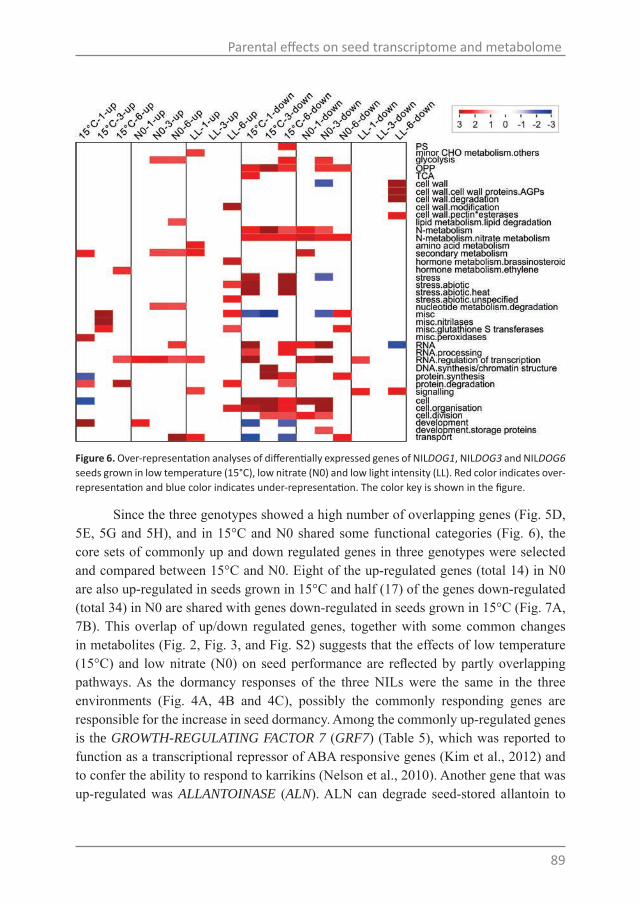
89
Parental effects on seed transcriptome and metabolome
Figure 6. Over-representation analyses of differentially expressed genes of NILDOG1, NILDOG3 and NILDOG6 seeds grown in low temperature (15°C), low nitrate (N0) and low light intensity (LL). Red color indicates over-representation and blue color indicates under-representation. The color key is shown in the figure.
Since the three genotypes showed a high number of overlapping genes (Fig. 5D, 5E, 5G and 5H), and in 15°C and N0 shared some functional categories (Fig. 6), the core sets of commonly up and down regulated genes in three genotypes were selected and compared between 15°C and N0. Eight of the up-regulated genes (total 14) in N0 are also up-regulated in seeds grown in 15°C and half (17) of the genes down-regulated (total 34) in N0 are shared with genes down-regulated in seeds grown in 15°C (Fig. 7A, 7B). This overlap of up/down regulated genes, together with some common changes in metabolites (Fig. 2, Fig. 3, and Fig. S2) suggests that the effects of low temperature (15°C) and low nitrate (N0) on seed performance are reflected by partly overlapping pathways. As the dormancy responses of the three NILs were the same in the three environments (Fig. 4A, 4B and 4C), possibly the commonly responding genes are responsible for the increase in seed dormancy. Among the commonly up-regulated genes is the GROWTH-REGULATING FACTOR 7 (GRF7) (Table 5), which was reported to function as a transcriptional repressor of ABA responsive genes (Kim et al., 2012) and to confer the ability to respond to karrikins (Nelson et al., 2010). Another gene that was up-regulated was ALLANTOINASE (ALN). ALN can degrade seed-stored allantoin to

90
Chapter 4
produce NH3, which can explain the decrease in allantoin in both 15°C and N0 (Fig. 3). Likely, allantoin is degraded to compensate for N-deficient environments.
NITRATE REDUCTASE 1 (NR1) and NITRITE REDUCTASE 1 (NIR1) are commonly down-regulated genes in 15°C and N0. The NITRATE TRANSPORTER 1.1 (NRT1.1), was up-regulated in 15°C (1.78, 1.96, 1.56 fold up-regulated compared with control for NILDOG1, NILDOG3 and NILDOG6, respectively (Adjusted P value <0.05)) and N0 (>2-fold, Adjusted P value <0.05). Expression of CYP707A2 in both 15°C and N0 of the three genotypes was down-regulated significantly (Adjusted P value <0.05) by approximately 1.5 fold (1.44 to 1.68 fold).
Figure 7. Venn diagrams of all up-regulated genes (A) and all down-regulated genes (B) in freshly harvested dry seeds of NILDOG1, NILDOG3 and NILDOG6 matured in 15°C and N0.
Furthermore, genes encoding a number of (other) enzymes were commonly up/down regulated in 15°C and N0 (Table 5). Three of these enzymes are involved in carbohydrate metabolism were BETA GLUCOSIDASE 28 (up-regulated), UDP-GLUCOSYL TRANSFERASE 71B1 (down-regulated) and AT5G41670 which is a 6-phosphogluconate dehydrogenase family protein (down regulated). The lactate/malate dehydrogenase family protein (AT1G04410) was down-regulated, as well.
DOG1, GA2ox6 and two NAC transcription factors (ANAC3 and ANAC019) which are involved in ABA-mediated signaling pathways, were specifically up-regulated at 15°C. This suggests that the functions of these genes are specific in response to low temperature, which has been shown previously for DOG1 and GA2ox6 (Kendall et al., 2011). The uniquely down-regulated genes in N0 contain a MYB-like transcription factor (AT1G68670) and a PP2C family protein (AT5G26010).

91
Parental effects on seed transcriptome and metabolome
Table 5. Commonly up- and down-regulated genes in seeds of NILDOG1, NILDOG3 and NILDOG6 grown in 15°C and N0 environments. A short description of the TAIR annotation and AGI codes are presented.
TAIR annotation AGI
Up-regulated
Allantoinase AT4G04955
Beta glucosidase 28 AT2G44460
Growth-regulating factor 7 AT5G53660
Integrase-type DNA-binding superfamily protein AT1G72570
Nitrilase 4 AT5G22300
Pyruvate kinase family protein AT3G49160
Response to low sulfur 1 AT3G49580
Unknown protein AT3G15250
Down-regulated
6-phosphogluconate dehydrogenase family protein AT5G41670
Ankyrin repeat family protein / BTB/POZ domain-containing protein AT2G41370
CONSTANS-like 5 AT5G57660
HXXXD-type acyl-transferase family protein AT5G42830
Integral membrane HPP family protein AT5G62720
Lactate/malate dehydrogenase family protein AT1G04410
Mannose-binding lectin superfamily protein AT2G25980
Nitrate reductase 1 (NR1) AT1G77760
Nitrite reductase 1 (NIR1) AT2G15620
P-loop containing nucleoside triphosphate hydrolases superfamily protein AT2G36200
Strictosidine synthase-like 4 AT3G51420
UDP-glucosyl transferase 71B1 AT3G21750
Unknown protein AT1G78170
Unknown protein AT4G34419
Unknown protein AT5G05965
Urophorphyrin methylase 1 AT5G40850
WUSCHEL related homeobox 2 AT5G59340
There were very few genes differentially expressed for NILDOG1 and NILDOG3 in low light intensity (LL) (Fig. 5F and 5I), while in NILDOG6 many genes were differentially regulated by light intensity. Over-representation analysis showed that especially down regulated genes of DOG6 are cell wall related genes (Fig. 6). Among these eleven encode cell wall proteins and eight encode membrane anchored proteins (Table 6). These eight membrane anchored proteins were either predicted or confirmed to be glycosylphosphatidylinositol (GPI)-anchored proteins (GAPs, (Borner et al., 2003)), except for AT1G28290.

92
Chapter 4
Table 6. Genes encoding cell wall proteins and membrane anchored proteins up/down regulated in NILDOG6 grown in low light intensity (LL). A short description of the TAIR annotation and AGI codes are presented.
TAIR annotation AGI
Cell wall encoding proteins
Up-regulated
Expansin A AT1G26770 AT2G03090
Plant invertase/pectin methylesterase inhibitor superfamily protein AT5G62350
Down-regulated
Pectin lyase-like superfamily protein
AT3G07820 AT3G57510 AT5G07410 AT5G07430
Pectate lyase family protein AT3G01270
Plant invertase/pectin methylesterase inhibitor superfamily protein
AT1G10770 AT4G24640
Cell wall invertase AT3G52600
Membrane anchored proteins
Up-regulated
Arabinogalactan protein AT1G28290
Protein of unknown function (DUF 3339) AT5G63500
Glycosyl hydrolase superfamily protein AT1G32860
Down-regulated
Arabinogalactan protein
AT3G57690AT5G40730AT3G20865AT5G14380
COBRA-like protein 10 precursor AT3G20580
Integrated analysis of phenotype, metabolites and transcriptsWith the aim of discovering genes and metabolites that are possibly associated
with seed performance traits, correlation analysis was performed with the gene expression levels (average normalized expression level>32), all detected metabolite contents, and seed performance traits in all environments (15°C, 20°C, N0, LL and SL) for NILDOG1, NILDOG3 and NILDOG6 together. DSDS50, longevity, t50 10°C, Gmax mannitol and Gmax salt were highly correlated with expression profiles of a number of genes and/or metabolites (r>0.75, Adjusted P value<0.05) (Fig. 8, Table S2).

93
Parental effects on seed transcriptome and metabolome
Figure 8. Correlations among seed performance traits, all the expressed transcripts (log2>5) and all detected metabolites for five environments (15°C, 20°C, N0, LL and SL) using NILDOG1, NILDOG3 and NILDOG6. Correlation coefficients were calculated using Spearman’s rank correlation (r>0.75). P value was adjusted by Benjamini-Hochberg correction (Adjusted P value<0.05). The seed performance traits that have correlated transcripts/metabolites/seed performance traits were shown. Red lines indicate the z-score transformed seed performance trait value. Gray lines indicate values of correlated transcripts/metabolites/seed performance traits. List of these traits are presented in Table 7 and Table S2.
DSDS50 correlated (r>0.75, P.adjust<0.05) with 13 genes but no significant correlation with metabolites was identified (Fig. 8, Table 7). Among the genes was MOTHER OF FT AND TFL1 (MFT), which was shown to induce seed dormancy in both Arabidopsis thaliana (Vaistij et al., 2013) and wheat (Nakamura et al., 2011) and could negatively regulate ABA signaling to promote germination in Arabidopsis (Xi et al., 2010). Another gene involved in ABA-mediated responses is ABA INSENSITIVE RING PROTEIN 2 (AIRP2) (Cho et al., 2011) (Table 7). DOG1 correlated with DSDS50 (r= 0.73, Adjusted P value= 0.076).
Gmax mannitol correlated strongly with 63 genes, 8 metabolites (pyroglutamate, nicotinate, maltose and five unknowns) and two other seed performance traits (t50 10°C and Gmax salt) (Table S2). CYP707A2 and two genes encoding seed storage albumin proteins significantly correlated with Gmax mannitol, indicating that the potential of germination in mannitol is possibly related with seed storage albumins and ABA catabolism. The highly correlated genes and metabolites have the potential to be involved in the regulation of seed performance and are therefore worthy of further investigation.
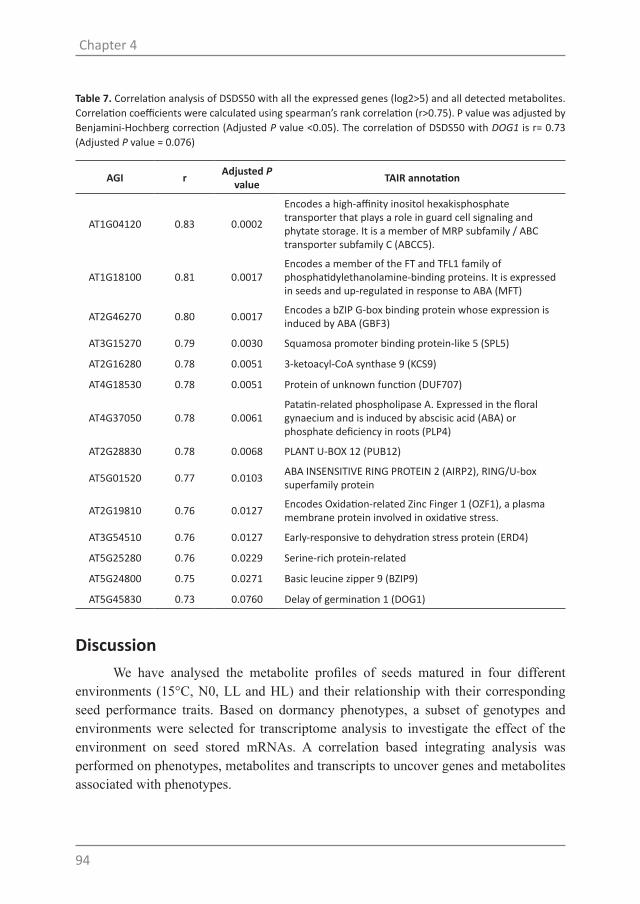
94
Chapter 4
Table 7. Correlation analysis of DSDS50 with all the expressed genes (log2>5) and all detected metabolites. Correlation coefficients were calculated using spearman’s rank correlation (r>0.75). P value was adjusted by Benjamini-Hochberg correction (Adjusted P value <0.05). The correlation of DSDS50 with DOG1 is r= 0.73 (Adjusted P value = 0.076)
AGI r Adjusted P value TAIR annotation
AT1G04120 0.83 0.0002
Encodes a high-affinity inositol hexakisphosphate transporter that plays a role in guard cell signaling and phytate storage. It is a member of MRP subfamily / ABC transporter subfamily C (ABCC5).
AT1G18100 0.81 0.0017Encodes a member of the FT and TFL1 family of phosphatidylethanolamine-binding proteins. It is expressed in seeds and up-regulated in response to ABA (MFT)
AT2G46270 0.80 0.0017 Encodes a bZIP G-box binding protein whose expression is induced by ABA (GBF3)
AT3G15270 0.79 0.0030 Squamosa promoter binding protein-like 5 (SPL5)
AT2G16280 0.78 0.0051 3-ketoacyl-CoA synthase 9 (KCS9)
AT4G18530 0.78 0.0051 Protein of unknown function (DUF707)
AT4G37050 0.78 0.0061Patatin-related phospholipase A. Expressed in the floral gynaecium and is induced by abscisic acid (ABA) or phosphate deficiency in roots (PLP4)
AT2G28830 0.78 0.0068 PLANT U-BOX 12 (PUB12)
AT5G01520 0.77 0.0103 ABA INSENSITIVE RING PROTEIN 2 (AIRP2), RING/U-box superfamily protein
AT2G19810 0.76 0.0127 Encodes Oxidation-related Zinc Finger 1 (OZF1), a plasma membrane protein involved in oxidative stress.
AT3G54510 0.76 0.0127 Early-responsive to dehydration stress protein (ERD4)
AT5G25280 0.76 0.0229 Serine-rich protein-related
AT5G24800 0.75 0.0271 Basic leucine zipper 9 (BZIP9)
AT5G45830 0.73 0.0760 Delay of germination 1 (DOG1)
DiscussionWe have analysed the metabolite profiles of seeds matured in four different
environments (15°C, N0, LL and HL) and their relationship with their corresponding seed performance traits. Based on dormancy phenotypes, a subset of genotypes and environments were selected for transcriptome analysis to investigate the effect of the environment on seed stored mRNAs. A correlation based integrating analysis was performed on phenotypes, metabolites and transcripts to uncover genes and metabolites associated with phenotypes.

95
Parental effects on seed transcriptome and metabolome
The effect of parental temperature and nitrate on seed performance are reflected by partly overlapping genetic and metabolic pathways
We have identified a strong overlapping effect of 15°C and N0 based on correlation of metabolites with phenotypes (Fig. 2A and 2B), fold change of metabolites (Fig. 3), over-representation analysis of the transcriptome (Fig 6) and overlapping of up/down regulated genes (Fig. 7). This could either be a direct effect of the treatments, or an indirect effect of low temperature on plant development and maturation (delayed and prolonged maturation period; Chapter 3 Fig. 1). It is possible that the uptake, mobilization and re-location of nutrients in the plants were changed, or that the C/N balance was modified. This indirect response could cause changes that partially resemble nitrate-deficient environments. For example, some amino acids and N related metabolites were decreased in both 15°C and N0 (Fig 3). The functional category ‘N metabolism’ was over-represented in both environments (Fig. 6). In addition, three genes that are involved in nitrogen metabolism, NITRILASE 4, NIR1 and NR1 were all affected. NITRILASE 4 was up-regulated in 15°C and N0, while NIR1 and NR1 both were down-regulated in 15°C and N0. This is in agreement with Kendall et al. (2011), that they also showed nitrate metabolism gene NITRATE REDUCTASE 2 (NR2) down-regulated when seeds matured in 10°C. Furthermore, NITRATE TRANSPORTER 1.1 (NRT1.1) was also up regulated in 15°C and N0, although to a lesser extent in 15°C. This indicated that low temperature also affected nitrate transport, assimilation and therefore influenced amino acids and N-rich compound accumulation in dry seeds.
NRT1.1 displays an unusual dual-affinity transport activity (Wang et al., 1998; Liu et al., 1999) depending on phosphorylation of the Thr101 residue catalyzed by the CIPK23 kinase (Gojon et al., 2011). It was shown that in addition to NO3
- transport activity, NRT1.1 contributed to other important physiological functions, including auxin transport (Krouk et al., 2010), carbohydrate accumulation (Schulze et al., 1994), cytosol acidification (Meraviglia et al., 1996) and modified root or shoot development (Guo et al., 2002). Besides acting as signaling sensor to release seed dormancy (Alboresi et al., 2005), NRT1.1 has also been suggested to control several other responses by its signaling effect such as increased stomatal opening (Guo et al., 2003). Thus it was hypothesized by Gojon et al. (2011) that NRT1.1 could mediate several different signalling pathways, through different sensing mechanisms. Possibly NRT1.1 senses temperature changes in the environment and thus may cause similar effects as nitrate-deficient environments. Moreover, NRT1.1 is regulated by auxin in both shoots and roots (Guo et al., 2002). Another nitrate transporter NRT1.2 is able to transport ABA, in addition to NO3
- (Kanno et al., 2012). Since we showed that ABA contents increased with seed dormancy (Fig. 2), NRT1.1 could also be regulated by ABA levels in seeds. Clearly, the molecular mechanisms involved require further investigations.

96
Chapter 4
Specific effect of low light intensity on NILDOG6We have shown that low light intensity had a specific effect on the NILDOG6
transcriptome (Table 4, Fig. 5), and that especially the expression of genes encoding cell wall and membrane proteins was affected (Table 6). Glycosylphosphatidylinositol (GPI)-anchored proteins (GAPs), were the main category of membrane anchored proteins. A number of studies have highlighted the importance of GAPs at the plant cell surface. Smyth (2004) has reviewed the biological role of arabinogalactan proteins and concluded that their amphiphilic molecular nature makes them prime candidates for linking the cell wall, the cell membrane and the cytoplasm. Likely, DOG6 controls dormancy and germination by a currently unknown effect on the cell surface, and this molecular pathway is regulated by light intensity.
Importance of galactinol, myo-inositol and raffinose in changing environments
It was observed that the raffinose pathway metabolites raffinose, galactinol and myo-inositol were more strongly correlated in low temperature (Fig. 4, Table 3), and that galactinol and myo-inositol correlated negatively with a number of seed performance traits in low temperature (15°C) and low nitrate (N0) (Fig. 2A and 2B). The significance of raffinose pathway metabolites in cold acclimation was demonstrated by (Cook et al., 2004). Our results suggest a coordinated function of these metabolites in low temperature conditions (Fig 4, Table 3).
In addition, galactinol showed a very high correlation (0.93) with seed longevity in high light intensity (HL) (Fig. 2D). These observations strongly point at the importance of these metabolites in changing environments. Raffinose family oligosaccharides (RFOs) were discovered several decades ago to accumulate in the late stages of soybean (Glycine max) seed maturation and desiccation, indicating that they play a role as protectants (Saravitz et al., 1987; Castillo et al., 1990). The mechanisms of protection remains to be elucidated, though a few were suggested: (1) raffinose can contribute with sucrose and stachyose to the increase of viscosity of the inner parts of the seed thus maintaining a low but safe hydrated environment (glassy matrix) (Bernal-Lugo and Leopold, 1995; Hoekstra et al., 2001), (2) RFOs can form a protecting layer around membranes. More recently, raffinose was suggested as a storage metabolite in Arabidopsis seeds, accumulating during desiccation and readily consumed upon imbibition (Baud et al., 2002; Fait et al., 2006).
RFOs are important in various stress tolerance defense mechanisms (reviewed by ElSayed et al., 2014). These authors showed that RFOs can act as antioxidants to counteract the accumulation of reactive oxygen species (ROS) under stress conditions

97
Parental effects on seed transcriptome and metabolome
(Nishizawa et al., 2008; Van den Ende and Valluru, 2009; Bolouri-Moghaddam et al., 2010). The seed aging process is accompanied by an increase in oxidative stress, such as DNA damage accumulation (Waterworth et al., 2010). Therefore it can be hypothesized that galactinol plays a role in oxidative stress protection during seed aging in high light intensity. This is supported by the finding that seeds of the non-storable dog1 mutants (dog1-1, dog1-3) had a lower galactinol level than wild type seeds (Table S1).
Carbon-nitrogen balance in low temperature and low nitrate environments
Glucuronate accumulated to very high levels in 15°C and N0 environments. Possibly, the oxidation of myo-inositol results in the formation of glucuronate present in cell wall polysaccharides and this pathway is important in controlling the carbohydrate flux (Valluru and Van den Ende, 2011). This indicates that the carbon-nitrogen balance is dramatically changed in both 15°C and N0. Further evidence of a changed carbon-nitrogen balance is the significant decrease of GABA in both environments. It was shown by Fait et al. (2011) that conversion of glutamate to GABA during seed development plays an important role in balancing carbon - nitrogen metabolism and in storage reserve accumulation, i.e. glutamate-to-GABA conversion represents one of the major routes for glutamate incorporation into the TCA cycle.
Background effect of Ler and ColWe identified a strong effect of the genetic background (Ler, Col) at the phenotypic
(Chapter 3 Table 2) and metabolic levels (Fig. 1). Compared with Col background genotypes, Ler plants are in general shorter and produce less siliques (Chapter 3 Fig. 3) and their seeds are less stress tolerant (lower germination percentage in ABA and lower longevity) (Chapter 3 Fig. 4). Metabolite profiles showed a 30 times decrease of maltose in Ler compared with Col in control conditions (Table S1). Galactinol also decreased around 5 times. The difference between Ler and Col may be caused by the ERECTA gene, since it is known that several growth-related phenotypes including plant height and the expression of many genes are controlled or modulated by ERECTA (van Zanten et al., 2009; Terpstra et al., 2010). Snoek et al. (2012) also showed that ERECTA regulates many gene functions under low-light conditions. However, more evidence is required to show that metabolic changes are caused by ERECTA gene.
Integration of phenotypes, metabolites and transcriptsAs the “omics” technologies develop, an integrated view spanning the multiple
levels of the cellular control hierarchy will be most informative and can help in proposing

98
Chapter 4
novel hypothesis and directions for future research.
We showed that the level of N-metabolism related compounds (asparagine, GABA and allantoin) was significantly decreased in both 15°C and N0 maturation environments (Fig. 3). Interestingly, also N-metabolism genes were significantly differentially regulated in these two environments (ALLANTOINASE and NITRILASE 4 were up-regulated, NR1 and NIR1 were down-regulated compared with control condition) (Table 5, Fig. 6). The evidences at metabolite and transcript levels showed that nitrate metabolism was changed in 15°C and N0 maturation environments and the similarities of correlation between metabolites and seed performance traits (Fig. 2) suggest that the effect of temperature and nitrate maturation environments on seed performance is reflected by partly overlapping pathways.
Correlation based integration analysis was utilized to uncover possible genes and/or metabolites associated with seed performance traits. Interestingly, MFT is highly correlated with DSDS50. MFT is a homolog of FLOWERING LOCUS T (FT) and TERMINAL FLOWER 1 (TFL1) (Kobayashi et al., 1999), and belongs to the phosphatidylethanolamine-binding protein (PEBP) family. This protein family is a highly conserved group of proteins that have been identified in numerous tissues in a wide variety of organisms, including bacteria, yeast, nematodes, mammals and plants (Schoentgen and Jolles, 1995). The various functions described for members of this family, include lipid binding, acceleration of flowering (Yoo et al., 2004), the control of the morphological switch between shoot growth and flower structures (Che et al., 2006) and the regulation of several signaling pathways such as the MAP kinase pathway (Banfield and Brady, 2000). Vaistij et al. (2013) concluded that MFT promoted dormancy during seed development by acting downstream with or parallel to the ABA and GA response pathways, as in mft-2 the elevated ABA coincided with an increase in the expression of REPRESSOR-OF-GA (RGA). A wheat homolog of MFT was shown to be up-regulated in dormant seeds grown at low temperature (13°C) (Nakamura et al., 2011). This matches with our results that, in Arabidopsis thaliana, MFT expression was significantly (approximately 1.5 fold, data not shown) up-regulated when seeds had matured at a low temperature (15°C), and its expression is highly correlated with DSDS50 levels (Table 7). This suggests a role of MFT in low temperature signaling. Further characterisation of the underlying molecular mechanism will be of great interest. Many seed performance traits that correlated with genes/metabolites were not previously described, for example pyroglutamate correlated with Gmax mannitol, two seed storage albumin protein and CYP707A2 highly correlated with Gmax mannitol. This information can be used to formulate new hypothesis that possibly lead to new findings.
Networks are largely analyzed on the basis of co-response of different transcripts, metabolites and proteins. By using the “guilt by association” principle, genes in a

99
Parental effects on seed transcriptome and metabolome
metabolic pathway that are coordinately regulated can be investigated, and therefore novel gene annotations can be achieved (Usadel et al., 2005; Bassel et al., 2011). This may also be applied for metabolites: Toubiana et al. (2012) used network analysis and identified six exceptionally highly co-regulated amino acids. By correlating metabolites and the most differentially changed transcripts, Osorio et al. (2012) found correlations of functional gene categories with metabolite compound classes and suggested the importance of some organic acids in pepper fruit development. Random forest regression can be used to select subsets of metabolites and transcripts that show association with trait such as potato tuber flesh color (Acharjee et al., 2011). Network reconstruction on pre-selected metabolites and transcripts resulted in the integration of known and unknown metabolites with carotenoid biosynthesis pathway associated genes. Acharjee et al. (2011) showed that this approach enabled the construction of meaningful networks with regard to known and unknown components and metabolite pathways.
However, correlation based analysis faces some limitations. First, regulations of seed performance at the transcript, metabolite and protein levels show temporal and spatial dependence. Second, our data was collected at a steady state while metabolic pathway flux can change substantially without perturbation of the final concentration at steady state. Last, since correlation alone provides no proof of causality, the putative causal genes need further validations such as demonstrated in Hannah et al. (2010). For those reasons, the correlation based analysis may be combined with metabolic flux measurement so as to overcome this drawback, since the rate and the pattern of changes can be monitored.
ConclusionSeed performance is affected by parental environments. The effect of temperature
and nitrate maturation environments on seed performance were reflected by partly overlapping genetic and metabolic pathways, as based on changes in nitrogen related metabolites (asparagine, GABA and allantoin) and genes (ALLANTOINASE, NITRATE REDUCTASE 1, NITRITE REDUCTASE 1 and NITRILASE 4). In high light intensity seed longevity correlated with galactinol levels. It would be interesting to investigate if high galactinol levels would result in a better seed longevity. In low light intensity, cell surface related genes were specifically differentially regulated in NILDOG6, which indicated a role for light in the control of DOG6 and an indication that DOG6 may function through the regulation of cell surface properties. This may help in finding the function of DOG6. The integration of phenotypes, metabolites and transcripts indicated that the maturation environmental effect on seed performance could be reflected by transcript and metabolic profiles, however in detail molecular analyses should be performed to confirm these hypotheses.

100
Chapter 4
Materials and Methods
Plant materialsThe twelve Arabidopsis thaliana genotypes used in this study consist of the Ler
and Col wild types and ten other genotypes with their respective genetic backgrounds. Ler background genotypes are NILDOG1-Cvi, NILDOG2-Cvi, NILDOG3-Cvi, NILDOG6-Kas-2, NILDOG22-An-1 and the dog1-1 mutant whereas Col background genotypes are dog1-3, cyp707a1-1, cyp07a2-1 and the Atnced6-Atnced9 double mutant. Detailed information about the genotypes can be found in Chapter 3 (Materials and Methods, Plant materials).
Growth conditionsPlant growth conditions before flowering are described in Chapter 3 (Materials
and Methods, Growth conditions). Upon the start of flowering, half of the plants were transferred to 15°C or nitrate 0 mM (N0) or low light intensity (LL) or high light intensity (HL), while all the other conditions stayed the same, and the other half were maintained at 20°C, nitrate 5mM and standard light intensity (control condition). Plants of each condition were grown in three blocks, with five plants per block.
Seed phenotypingGermination was scored using the Germinator package (Joosen et al., 2010). To
measure seed dormancy level (DSDS50: days of seed dry storage required to reach 50% germination), germination tests were performed weekly until all seed batches germinated for more than 90%. Germination under stress conditions was performed on fully after-ripened seeds. An accelerated aging test was carried out to measure seed longevity. The detailed methods of measuring DSDS50 and longevity are illustrated in Chapter 2 and Chapter 3, respectively. The germination stress conditions were 10°C; 30°C; -0.8 MPa mannitol (Sigma-Aldrich); 125 mM NaCl (Sigma-Aldrich) and 0.2 µM ABA (Duchefa Biochemie).
Maximum germination percentage (Gmax) at the end of the germination assay and the rate of germination (t50) values were extracted from the germination assay using the Germinator package (Joosen et al., 2010). For the germination at 30°C, in mannitol, NaCl and ABA, Gmax was used as there were enough variations. For germination at 10°C and 22°C (as control), Gmax of most genotypes reached 100%, therefore, to better distinguish the small differences between genotypes, t50 was used for those two conditions.

101
Parental effects on seed transcriptome and metabolome
Metabolite extraction and derivatization methodsThe metabolite extraction was performed on dry mature seeds of Ler, NILDOG1
and dog1-1 based on a previously described method (Roessner et al., 2000) with some modifications. For each genotype metabolite extractions were performed on three biological replicates. For each sample five mg of seeds pre-cooled in liquid nitrogen, was homogenized in 2 ml tubes with 2 iron balls (2.5 mm) using a micro dismembrator (Mo Bio Laboratory). 233 μl methanol/chloroform (4:3) was added, together with 50 μl standard (0.13 mg ml-1 ribitol) and mixed thoroughly. After 10 minutes of sonication 66 μl MQ water was added to the mixture followed by vortexing and centrifugation (5 min., 15000 rpm). The methanol phase was collected in a glass vial. 166 μl methanol/chloroform (1:1) was added to the remaining organic phase and kept on ice for 10 min. 66 μl MQ water was added followed by vortexing and centrifugation (5 min., 15000 rpm). Again the methanol phase was collected and mixed with previously collected phase. 60 μl was dried overnight using a speedvac (room temperature, Savant SPD121). Dried samples were derivatized online as described by Lisec et al. (2006) using a Combi PAL autosampler (CTC Analytics). The derivatized samples were analysed by a GC-TOF-MS system consisting of an Optic 3 high-performance injector (ATAS) and and Agilent 6890 gas chromatograph (Agilent Technologies) coupled to a Pegasus III time-of-flight mass spectrometer (Leco Instruments). 2 μl of each sample was introduced to the injector. The details of the GC-TOF-MS method as described by (Carreno-Quintero et al., 2012) with some minor modifications. Detector voltage was set at 1650V.
GC-MS data processing methodsRaw data was processed using the chromaTOF software 2.0 (Leco instruments)
and further processed using the Metalign software (Lommen, 2009), to extract and align the mass signals. A signal to noise ratio of 2 was used. The output was further processed by the Metalign Output Transformer (METOT; Plant Research International, Wageningen) and mass signals that where present in less than 3 samples where discarded. Centrotypes were created using the MSclust program (Tikunov et al., 2012) to reduce signal redundancy. The mass spectra of these centrotypes were used for the identification by matching to an in-house constructed library and the NIST05 (National Institute of Standards and Technology, Gaithersburg, MD, USA; http://www.nist.gov/srd/mslist.htm) libraries. This identification is based on spectra similarity and comparison of retention indices calculated by using a 3th order polynomial function (Strehmel et al., 2008). Forty one metabolites were identified by matching to the in-house constructed library and the NIST05 library. β-D-Methylfructofuranoside (4TMS), glucopyranose (5TMS), hydroxyethyl-methanamine (2TMS), pentitol (5TMS), pentonic acid (5TMS) and unknown metabolites matched with the NIST05 library but not confirmed using standards.

102
Chapter 4
ABA extraction and detection methodABA extraction and detection method is as described in Chapter 3 supplemental
materials “ABA extraction and detection method”.
PCA and correlation analysisPCA and correlation analysis were performed using online web tool MetaboAnalyst
2.0 http://www.metaboanalyst.ca/MetaboAnalyst/faces/Home.jsp (Xia et al., 2012). For PCA analysis, all the 124 detected metabolites in all the samples were used. The correlation analysis was performed between the 41 identified primary metabolites, ABA levels and seed performance. Data of changed maturation environments were compared to their own controls (i.e. 15°C vs 20°C, N0 vs N5, LL vs SL and HL vs SL).
Cluster analysis Cluster analysis was performed with R statistical programming environment
(R-Core-Team, 2013), using “cluster” package. Samples were clustered based on a Partitioning Around Medoids (pam) algorithm. The distance matrix was calculated by using the formula 1-r2, where r is the Spearman’s rank correlation coefficient. The number of clusters was identified based on rule of thumb by the formula k=√(n/2) , where k is the number of clusters and n is the total number of elements used (genotypes). Standard temperature (20°C) is the control of both 15°C and N0 and standard light intensity (SL) is the control of both LL and HL.
Network constructionForty one metabolites which were identified by matching to the in-house constructed
library and the NIST05 library and five metabolites matched with the NIST05 library but not confirmed using standards (β-D-Methylfructofuranoside (4TMS), glucopyranose (5TMS), hydroxyethyl-methanamine (2TMS), pentitol (5TMS) and pentonic acid (5TMS)) were used for metabolic network construction. Metabolic networks were built for 6 Ler background genotypes taken together (Ler, NILDOG1, NILDOG2, NILDOG3, NILDOG6 and NILDOG22) in different maturation environments using Spearman’s rank correlation with the following threshold: -0.49<r<0.49 and p<0.001. The correlation matrix was calculated and converted to the network format using R statistical programming environment (R-Core-Team, 2013), “igraph” package. Networks were created using Cytoscape software, version 3.1.0.

103
Parental effects on seed transcriptome and metabolome
Microarray experiment
RNA isolation
RNA was isolated from NILDOG1, NILDOG3 and NILDOG6 seeds, which were matured in low temperature (15°C), low nitrate (N0) and low light intensity (LL) regimes (as described in Chapter 3,Table 1).
Total RNA was extracted according to the hot borate protocol modified from Wan and Wilkins (1994). 3~3.5 mg of seeds for each treatment were homogenized and mixed with 800 μl of extraction buffer (0.2 M Na boratedecahydrate (Borax), 30 mM EGTA, 1% SDS, 1% Na deoxy-cholate (Na-DOC)) containing 1.6 mg DTT and 48 mg PVP40 which had been heated to 80°C. 1 mg proteinase K was added to this suspension and incubated for 15 min at 42°C. After adding 64 μl of 2 M KCl, the samples were incubated on ice for 30 min and subsequently centrifuged for 20 min at 13000 rpm. Ice-cold 8 M LiCl was added to the supernatant in a final concentration of 2 M and the tubes were incubated overnight on ice. After centrifugation for 20 min at 13000 rpm at 4°C, the pellets were washed with 750 μl ice-cold 2 M LiCl. The samples were centrifuged for 10 min at 10000 rpm at 4°C and the pellets were re-suspended in 80 μl DEPC treated water. The samples were phenol chloroform extracted, DNAse treated (RQ1 DNase, Promega) and further purified with RNeasy spin columns (Qiagen) following the manufacturer’s instructions. RNA quality and concentration were assessed by agarose gel electrophoresis and Nanodrop ND1000 spectrophotometer.
Microarray analysis
The Quality control, RNA labeling, hybridization and data extraction were performed at ServiceXS B.V. (Leiden, The Netherlands). Labelled ss-cDNA was synthesized using the Affymetrix NuGEN Ovation PicoSL WTA v2 kit and Biotin Module using 50 ng total RNA as template. The fragmented ss-cDNA was utilized for the hybridization on the Affymetrix ARAGene 1.1ST Array plate. The Affymetrix HWS Kit was used for the hybridization, washing and staining of the plate. Scanning of the Array Plates was performed using the Affymetrix GeneTitan scanner. All procedures were performed according to the instructions of the manufacturers (nugen.com and affymetrix.com). The resulting data were analysed using the R statistical programming environment (R-Core-Team, 2013) and the Bioconductor packages (Gentleman et al., 2004). The data was normalized using the RMA algorithm (Irizarry et al., 2003) using the TAIRG v17 cdf file (http://brainarray.mbni.med.umich.edu). Significant differential expression changes were computed using the limma package (Smyth, 2004) and P values were adjusted for multiple testing with the Benjamini and Hochberg method to control

104
Chapter 4
for false positives (Benjamini and Hochberg, 1995). Significant (Adjusted P value<0.05) average expression changes bigger than two-fold were in this study considered to be differential and further analysed. Over-representation analysis was performed using Pageman (Carrari et al., 2006). Microarray quality and reproducibility data are presented in Fig. S3.
Integrated analysis of phenotype, metabolome and transcriptomeCorrelation analysis was performed on expressed transcripts (log2>5 for at
least one sample), 124 detected metabolites and 15 plant and seed performance traits, with R-software, version 3.0.2. Spearman’s rank correlation was used for correlation coefficient (r). rcorr from the Hmisc package is used for calculating P value, P values were adjusted (Adjusted P value) for multiple testing with the Benjamini and Hochberg method to control for false positives (Benjamini and Hochberg, 1995). Adjusted P value <0.05 is regarded as significant. Z-score transformation was applied in figure plotting in Fig.8.
Supplemental MaterialsSupplemental files can be downloaded from http://www.wageningenseedlab.nl/
thesis/hhe/SI/chapter4/
Table S1. All the 124 detected primary metabolites abundance as well as ABA levels of 12 genotypes in all the maturation environments.
Table S2. Correlation analysis between expressed genes, all detected metabolites and seed performance traits.
Figure S1 Correlations between seed performance traits in four maturation environments.
Figure S2. Network of metabolites of combined standard light intensity and low light intensity (SL/LL).
Figure S3. Microarray quality and reproducibility.

A role for DELAY OF GERMINATION 1 in Arabidopsis seed maturation
Bas Dekkers1,2*, Hanzi He1*, Johannes Hanson2,3, Leo Willems1 Gwendal Cueff4,5, Loïc Rajjou4,5, Henk Hilhorst1, Leónie Bentsink1,2
1 Wageningen Seed Lab, Laboratory of Plant Physiology, Wageningen University, Droevendaalsesteeg 1, NL-6708 PB Wageningen, The Netherlands
2 Department of Molecular Plant Physiology, Utrecht University, NL-3584 CH Utrecht, The Netherlands
3 Umeå Plant Science Centre, Department of Plant Physiology, Umeå University, SE-90187 Umeå, Sweden
4 INRA, Jean-Pierre Bourgin Institute, Laboratory of Excellence “Saclay Plant Sciences”, RD10, F-78026 Versailles Cedex, France
5 AgroParisTech, Chair of Plant Physiology, 16 rue Claude Bernard, F-75231 Paris Cedex 05, France
*These authors contributed equally to this work.
Chapter 5

106
Chapter 5
AbstractSeed dormancy is an important adaptive trait for which a substantial amount of
variation exists in nature. Screening of natural variation for this trait in Arabidopsis thaliana led to the identification of DELAY OF GERMINATION (DOG) 1. DOG1 encodes a protein that is critical for the induction of seed dormancy but studies are impeded by the fact that the DOG1 protein lacks known functional domains. To gain a further understanding of the function of DOG1 we used a transcriptomics approach using the dog1-1 mutant. This showed that the lack of DOG1 affects the expression of hundreds of genes. Genes that normally accumulate during late maturation like ABI5, EM1 and EM6 do not accumulate in the dog1 mutant. Moreover, genes that are normally induced during germination are already expressed at higher levels in dry mature dog1-1 mutant seeds. In addition to gene expression, also the accumulation of a subset of primary metabolites was found to be affected in dog1-1. Of the differentially expressed genes, 90 are direct targets of ABI3, LEC2 and FUSCA3, three key regulators of seed maturation. We studied the genetic interaction between ABI3 and DOG1. The single mutants of the weak abi3-1 or dog1-1 alleles produced normal brown seeds that were desiccation tolerant, however the abi3-1 dog1-1 double mutant produced seeds that showed severely distorted seed maturation. Mature seeds were green, which coincided with a loss of desiccation tolerance and low storability, similar to the severe abi3 mutants, which was further confirmed by proteome analysis. These results indicate that the dog1-1 mutant acts as an enhancer of the weak abi3-1 allele. Taken together, our data strongly indicate that the function of DOG1 is not limited to seed dormancy but extends to a more general role as an important regulator of late seed maturation.
107
A role for DOG1 in seed maturation
IntroductionSeeds are important in the plant life cycle since they represent the link between
two successive generations. They are complex, stress resistant structures and the most sophisticated means of propagation evolved during plant evolution that bridges unfavourable periods and allows dispersal (Kesseler and Stuppy, 2006).
Seed development in Arabidopsis takes approximately 20 days under laboratory conditions. After fertilization embryogenesis starts via a well-organized series of cell divisions and cell specification. At late heart stage/early torpedo stage the pattering of the embryo is completed and seed development switches from embryogenesis to seed maturation.
Seed maturation starts with a cell expansion phase and ends when the embryo fills the embryo sac and only a single layer of endosperm is left. Thus during maturation the growth of the embryo stops and chlorophyll present in the embryo is degraded. The last step of seed maturation is maturation drying (desiccation) which results in a mature dry seed. During this last drying stage considerable changes occur at both the transcriptome and metabolome levels (Fait et al., 2006; Angelovici et al., 2010). It is during the maturation phase that the seed obtains some key features. First, the seed is filled with storage compounds including proteins, oils and carbohydrates. These reserves support seedling growth and establishment after germination until the seedling is well rooted and capable of autotrophic growth. Second, seeds acquire dormancy, which is defined as a temporary failure of a viable seed to complete germination under favourable conditions (Bewley, 1997). This is an adaptive strategy that allows more time for dispersal of seeds over larger distances and helps to time plant growth and reproduction in the most optimal conditions. By producing seeds with different levels of dormancy a plant is able to spread germination of its offspring in time, reducing the risk of losing an entire generation through a catastrophic event (Kesseler and Stuppy, 2006; Hilhorst, 2007). Third, orthodox seeds acquire desiccation tolerance, which allows them to withstand extreme drying at the end of seed development without losing viability. Fourth, usually seeds are storable in the dry state for considerable length of time. All these characteristics contribute to the success of seeds as propagules and their value in agriculture and as a source of food.
In Arabidopsis there are four key regulators of seed maturation. These are LEAFY COTYLEDON (LEC) 1, LEC2, FUSCA (FUS) 3 and ABSCISIC INSENSITIVE (ABI) 3. Mutants in any of these genes show severe seed maturation phenotypes: all are affected in seed storage protein accumulation, unable to induce seed dormancy, show a reduced degradation of chlorophyll and produce desiccation intolerant seeds which are barely storable (To et al., 2006). All of these genes encode transcription factors. LEC1 is a

108
Chapter 5
HAP3 family CCAAT-box binding factor whereas LEC2, FUS3 and ABI3 are B3 domain containing transcription factors (Giraudat et al., 1992; Lotan et al., 1998; Luerssen et al., 1998; Stone et al., 2001). Together with LEC1-like (L1L, (Kwong et al., 2003) they are referred to as the LAFL transcriptional network. Regulation of seed maturation involves complex interactions between the LAFL members, the regulation of downstream transcription factors and hormonal signalling pathways (for a recent review see Jia et al. (2014)).
Several agricultural problems relate directly to a suboptimal seed maturation phase. For example, a low level or a lack of dormancy may result, under cool and moist conditions, in germination of seeds that are still attached to the mother plant (known as pre-harvest sprouting or vivipary). Another example is the lack of chlorophyll degradation at the end of seed maturation. This negatively affects seed storability and, in oil seeds, the quality of the oil (Johnson-Flanagan et al., 1994; Clerkx et al., 2003; Nakajima et al., 2012). Such issues result in a low quality end product and cause significant economic losses (Whitmarsh and Ortiz-Lopez, 2000; Gubler et al., 2005).
As mentioned above the induction of seed dormancy is one of the processes that occur during the seed maturation phase. Abscisic acid (ABA) is critical for the induction of dormancy in seeds. Mutants that lack the capacity to produce ABA or transduce the ABA signal (e.g. abi1-1, abi2-1 and abi3-1) are completely non-dormant (Koornneef et al., 1982; Koornneef et al., 1984). On the other hand, mutants that over-accumulate ABA or those that show an ABA oversensitive phenotype have enhanced dormancy levels (Cutler et al., 1996; Kushiro et al., 2004). Moreover, by screening for natural variation for seed dormancy in Arabidopsis a key regulator for seed dormancy, DELAY OF GERMINATION (DOG) 1, was identified (Bentsink et al., 2006). Dormancy differences between accessions seemed to be mainly regulated by differences in expression level of DOG1. Recently, it was shown that the level of DOG1 protein is highly correlated with the depth of seed dormancy (Nakabayashi et al., 2012). Most interestingly, it was shown that during after-ripening the DOG1 protein is modified which potentially reduces its activity and therefore it was suggested that DOG1 protein may act as a timer for dormancy release (Nakabayashi et al., 2012). Despite the pivotal role of DOG1 in the induction of dormancy, its mode of action and full function are still unclear. To gain a further understanding of the function of DOG1 we used a combination of ‘-omics’ technologies, genetics and physiological experiments. In summary, our results suggest that DOG1 functions as a regulator of late seed maturation.

109
A role for DOG1 in seed maturation
Results
The dog1-1 dry seed transcriptome is severely affectedIn order to investigate the regulatory function of DOG1 we have performed
transcriptome analyses using three genotypes with different DOG1 expression levels. These included the WT Ler, the near isogenic line NILDOG1-Cvi and the non-dormant dog1-1 mutant. NILDOG1-Cvi is the WT Ler containing an introgression of the Cvi accession on chromosome 5, which includes the DOG1 gene (Alonso-Blanco et al., 2003; Bentsink et al., 2006). It has a strong expression of the DOG1 gene in comparison with Ler and this difference is visible both at the transcript and protein level (Nakabayashi et al., 2012). The dog1-1 mutant is generated in the NILDOG1 genetic background (Fig. 1A) and has a one base pair deletion resulting in a lack of any detectable DOG1 protein accumulation and is considered to be a full knock-out of the gene (Bentsink et al., 2006; Nakabayashi et al., 2012).
To assess the effects of the different levels of DOG1 expression we compared the mature dry seeds transcriptomes of the three genotypes. When comparing the transcriptome of Ler (low DOG1 expression) with NILDOG1 (high DOG1 expression) we found a low number of differentially expressed genes (39 genes down and 17 genes up regulated compared with Ler (>2 fold; p= 0.05)). Much larger changes were found in the comparisons with dog1-1. In dog1-1 seeds 458 genes were up and 245 down regulated as compared with NILDOG1 seeds and a similar number was found when we made the comparison between Ler and dog1-1 (Fig. 1B). Thus the lack of DOG1 has a profound effect on the dry seed transcriptome.
Dry dog1-1 seeds show gene expression patterns related to seed germination
To obtain insight in the expression patterns of the dog1-1 differentially expressed genes during germination we plotted these genes in the co-expression network, EndoNet. This co-expression network is constructed of gene transcript expression information of endosperm samples that were collected in a dense time series encompassing the germination time course of Arabidopsis seeds (Dekkers et al., 2013). Interestingly, the gene sets that are either enhanced or reduced in the dog1-1 mutant are positioned differently in this network (Fig. 1C). The down regulated gene set is positioned in a region which is characterized by genes that are down regulated during germination. On the other hand, the majority of the genes that are up regulated in the dog1-1 mutant are located in the region of the network that consists of genes that are up regulated during the germination process (Fig. 1C). This set consists for 10% of genes related

110
Chapter 5
to ribosome/translation and such genes are normally strongly activated during seed germination. Among the other functional classes that were over-represented are those related to developmental growth, gibberellin, transport of water and metabolites, and cell wall modification (Table 1A, Table S1). These changes in gene expression, particularly the activation of germination related gene classes, suggest that dry dog1-1 seeds show progression towards a state of germination.
Figure 1. Transcriptome analysis of dog1-1 mutant seeds. (A) Graphical representation of the three genotypes that were used for the transcriptome study (Ler, NILDOG1 and dog1-1). NILDOG1 has a Ler genetic background but has an introgression of Cvi (indicated in black) surrounding the DOG1 gene (indicated by a bar). The dog1-1 mutant is generated in the NILDOG1 background. For each genotype the relative DOG1 transcript levels (obtained from our micro array), the protein levels (based on (Nakabayashi et al., 2012)) and dormancy levels (reported by (Bentsink et al., 2006)) are indicated. (B) The graph depicts the number of genes that are differentially expressed (> 2 fold; p value < 0.05) between the three genotypes. Different fold change cut-offs are indicated by color, black > 2 fold, dark grey > 2.5 fold, light grey > 3fold and white > 5 fold. (C) The genes that are either enhanced or reduced in dog1-1 (in comparison to NILDOG1) are plotted in EndoNet co-expression network encompassing seed germination (Dekkers et al., 2013). In the middle of the network the four dominant expression profiles during Colombia seed germination are indicated.

111
A role for DOG1 in seed maturation
Table 1. Examples of over represented categories obtained by over-representation analysis, using Mapman of the genes that are enhanced or reduced in dog1-1.
A Exemplar classes that are over-represented among genes that are enhanced in dog1-1 seeds
B Exemplar classes that are over represented among genes that are reduced in dog1-1 seeds
PS major CHO metabolism.synthesis.sucrose.SPS
major CHO metabolism minor CHO metabolism.myo-inositol.InsP synthase
glycolysis S-assimilation
cell wall Sec met.N-misc.alkaloid-like
cell wall.cellulose synthesis hormone metabolism.ABA
cell wall.modification hormone metabolism.ABA.induced- ... -activated
lipid metabolism.FA desaturation stress
amino acid metabolism.aspartate family stress.abiotic
metal handling.binding,chelation and storage RNA.regulation of transcription.bZIP TF family
sec. met.isoprenoids.tocopherol biosynthesis development.LEA
sec. met.phenylpropanoids.lignin biosynthesis.COMT dormancy
hormone metabolism.brassinosteroid
hormone metabolism.gibberellin
stress
stress.abiotic
redox.ascorbate and glutathione.ascorbate.GME
protein
protein.synthesis.ribosomal protein
protein.degradation.cysteine protease
transport
transport.sugars
transport.metabolite transporters at the envelope membrane
transport.major intrinsic proteins
dormancy
germination
The expression of genes related to late seed maturation and desiccation is impaired in dog1-1 seeds
Over representation analysis of the 245 genes down-regulated in dog1-1 shows that genes related to ABA, stress, LEA, dormancy, bZIP transcription factors, among others, are over represented (Table 1B, Table S1). This includes 11 genes related to ABA signalling (including ABSCISIC ACID INSENSITIVE (ABI) 2 and ABI5) and 19 genes that were classified as DEHYDRIN, LATE EMBRYOGENESIS ABUNDANT (LEA) or HEAT SHOCK PROTEIN (Table S1). The identified expression pattern differences

112
Chapter 5
between NILDOG1 and dog1-1 were further investigated by RT-qPCR in four genotypes, including a second dog1 allele (dog1-3, which is a SALK T-DNA insertion mutant) and its corresponding wild type (Columbia). We confirmed the expression of several genes that were down regulated (EARLY METHIONINE-LABELLED (EM) 1, EM6, ABI5 and ABRE BINDING FACTOR (ABF) 4), not changed (G-BOX BINDING FACTOR (GBF) 4) as well as several genes that were found to be enhanced (ABI4, EXPANSIN A2, and ENDO-ß-MANNANASE (MAN) 7) in the dog1-1 (Fig. 2A).
Several of the above mentioned genes, like ABI5 and the LEA genes EM1 and EM6, are known to accumulate late during seed maturation (Bensmihen et al., 2002). During late seed maturation and desiccation many changes occur in seeds on the transcriptional level (Angelovici et al., 2010). This was demonstrated by analysis of a microarray dataset encompassing late maturation and seed desiccation consisting of seeds sampled at 14 days after pollination (DAP), 16 DAP and dry seeds of Wassilewskija (Ws) (Angelovici et al., 2009). We utilized this data set to reveal the gene expression patterns over these three time points during seed maturation of our differentially expressed genes. Many of the genes with a reduced expression in the dog1-1 seeds increased over two fold between 14 DAP and the dry seed stage in wild-type seeds (Fig. 2B). This indicates that many genes that are induced during late seed maturation fail to do so in the dog1-1 mutant seeds. A similar observation was made for genes that are enhanced in the dog1-1 mutant. About half of the genes in this set are down regulated >2-fold from 14 DAP compared with the dry seed stage (Fig. 2C). Thus, hundreds of genes, the expression of which is changed during the last stage of seed development are affected in their expression by the dog1-1 mutation, suggesting that DOG1 is an important regulator of gene expression during late seed maturation.
Figure 2. Analysis of the transcriptome data. (A) The relative expression in dog1-1 (compared with NILDOG1, set to 1) of several genes in the microarray (top row), by RT-qPCR in dog1-1 (compared with NILDOG1, set to 1) and RT-qPCR in dog1-3 (compared with Col, set to 1). The green color represents reduced expression compared with WT and red an enhanced expression in dog1-1. The asterisks indicate that the expression in dog1-1 is significantly different from WT (Adjusted P value<0.05). nd: not detected (B) Expression profiles of the 245 genes that are expressed at a lower level in dog1-1 seeds at three time points during seed development (14 DAP, 16 DAP and dry seeds) using a data set from Angelovici et al. (2009). The color key is shown below. (C) Same as in B, but these show the expression profiles of the 458 genes that are enhanced in dog1-1. For color key, see (B).

113
A role for DOG1 in seed maturation
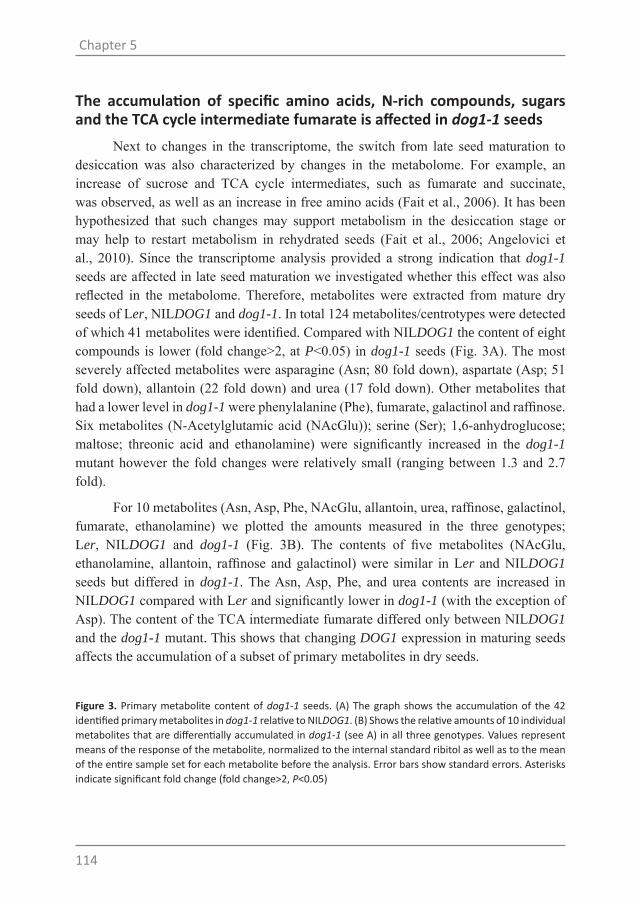
114
Chapter 5
The accumulation of specific amino acids, N-rich compounds, sugars and the TCA cycle intermediate fumarate is affected in dog1-1 seeds
Next to changes in the transcriptome, the switch from late seed maturation to desiccation was also characterized by changes in the metabolome. For example, an increase of sucrose and TCA cycle intermediates, such as fumarate and succinate, was observed, as well as an increase in free amino acids (Fait et al., 2006). It has been hypothesized that such changes may support metabolism in the desiccation stage or may help to restart metabolism in rehydrated seeds (Fait et al., 2006; Angelovici et al., 2010). Since the transcriptome analysis provided a strong indication that dog1-1 seeds are affected in late seed maturation we investigated whether this effect was also reflected in the metabolome. Therefore, metabolites were extracted from mature dry seeds of Ler, NILDOG1 and dog1-1. In total 124 metabolites/centrotypes were detected of which 41 metabolites were identified. Compared with NILDOG1 the content of eight compounds is lower (fold change>2, at P<0.05) in dog1-1 seeds (Fig. 3A). The most severely affected metabolites were asparagine (Asn; 80 fold down), aspartate (Asp; 51 fold down), allantoin (22 fold down) and urea (17 fold down). Other metabolites that had a lower level in dog1-1 were phenylalanine (Phe), fumarate, galactinol and raffinose. Six metabolites (N-Acetylglutamic acid (NAcGlu)); serine (Ser); 1,6-anhydroglucose; maltose; threonic acid and ethanolamine) were significantly increased in the dog1-1 mutant however the fold changes were relatively small (ranging between 1.3 and 2.7 fold).
For 10 metabolites (Asn, Asp, Phe, NAcGlu, allantoin, urea, raffinose, galactinol, fumarate, ethanolamine) we plotted the amounts measured in the three genotypes; Ler, NILDOG1 and dog1-1 (Fig. 3B). The contents of five metabolites (NAcGlu, ethanolamine, allantoin, raffinose and galactinol) were similar in Ler and NILDOG1 seeds but differed in dog1-1. The Asn, Asp, Phe, and urea contents are increased in NILDOG1 compared with Ler and significantly lower in dog1-1 (with the exception of Asp). The content of the TCA intermediate fumarate differed only between NILDOG1 and the dog1-1 mutant. This shows that changing DOG1 expression in maturing seeds affects the accumulation of a subset of primary metabolites in dry seeds.
Figure 3. Primary metabolite content of dog1-1 seeds. (A) The graph shows the accumulation of the 42 identified primary metabolites in dog1-1 relative to NILDOG1. (B) Shows the relative amounts of 10 individual metabolites that are differentially accumulated in dog1-1 (see A) in all three genotypes. Values represent means of the response of the metabolite, normalized to the internal standard ribitol as well as to the mean of the entire sample set for each metabolite before the analysis. Error bars show standard errors. Asterisks indicate significant fold change (fold change>2, P<0.05)
115
A role for DOG1 in seed maturation
DOG1 affects gene expression of direct targets of ABI3, LEC2 and FUS3During the last stages of seed development gene expression and the accumulation
of primary metabolites is actively regulated (Angelovici et al., 2010). The observed transcriptome and metabolome changes indicate that many of such genes as well as a subset of metabolites are affected in their accumulation by the DOG1 gene. Seed maturation is controlled by four master regulators, i.e. LEC1, LEC2, FUS3 and ABI3. For the three B3 domain containing TFs (LEC2, FUS3 and ABI3) lists of putative direct targets are available. We used a list of 718 targets of LEC2 (Braybrook et al., 2006), a list of 366 targets of FUS3 (Wang and Perry, 2013) and a list of 98 genes that were identified

116
Chapter 5
as direct targets of ABI3 (Monke et al., 2012). Within these three sets of direct targets the expression of 90 genes was affected in dog1-1 dry seeds. A total of 22 genes were identified as direct targets of ABI3, 28 genes as direct targets of LEC2 and 49 genes were identified as direct targets of FUS3 (Fig. 4A). Only 8 of these direct targets that were differentially expressed in dog1-1 are shared between LEC2, FUS3 or ABI3 (Fig. 4B). Thus DOG1 affects the expression of a subset of direct targets of three key regulators of seed development. Although the largest numerical overlap was found with the gene list of direct targets of FUS3, percentage wise (taking into account the size of the gene list of the direct targets) the largest overlap was found with ABI3 (22%) (Fig. 4A).
Figure 4. DOG1 affects the expression of direct targets of ABI3, LEC2 and FUS3. (A) The graph depicts the overlap between differentially expressed genes in dog1-1 and the direct targets of ABI3, LEC2 and FUS3. (B) The Venn diagram shows the overlap between the direct targets of ABI3, LEC2 and FUS3 that are affected in the dog1-1 mutant.
The strong DOG1 allele of Cvi is unable to suppress abi3-1 phenotypes The link between dog1-1 and ABI3 was further investigated. It had been shown
that the strong DOG1 allele present in NILDOG1-Cvi was unable to rescue the dormancy phenotype of the severe abi3-5 mutant (Bentsink, 2002). This implied that a strong DOG1 allele is unable to compensate for the lack of ABI3. However, it is plausible that this result was influenced by the severity of the abi3-5 mutation which is characterized by a lack of the seed maturation phase. This could mean that the developmental context was inappropriate to elicit DOG1 signaling/activation. To rule out this possibility we used the weak abi3-1 allele. The abi3-1 mutant seeds are ABA insensitive and non-dormant but their seed development is relatively normal (Nambara et al., 1992; Ooms et al., 1993). Plants of the abi3-1 mutant produce brown seeds (Fig. 5A) that are desiccation tolerant and storable for considerable time (although to a lesser extent than WT seeds (Clerkx et al., 2004)). We introduced the strong DOG1 allele of Cvi represented by NILDOG1 into the abi3-1 background and investigated whether the enhanced DOG1expression is able to suppress abi3-1 related phenotypes. This was apparently not the case since
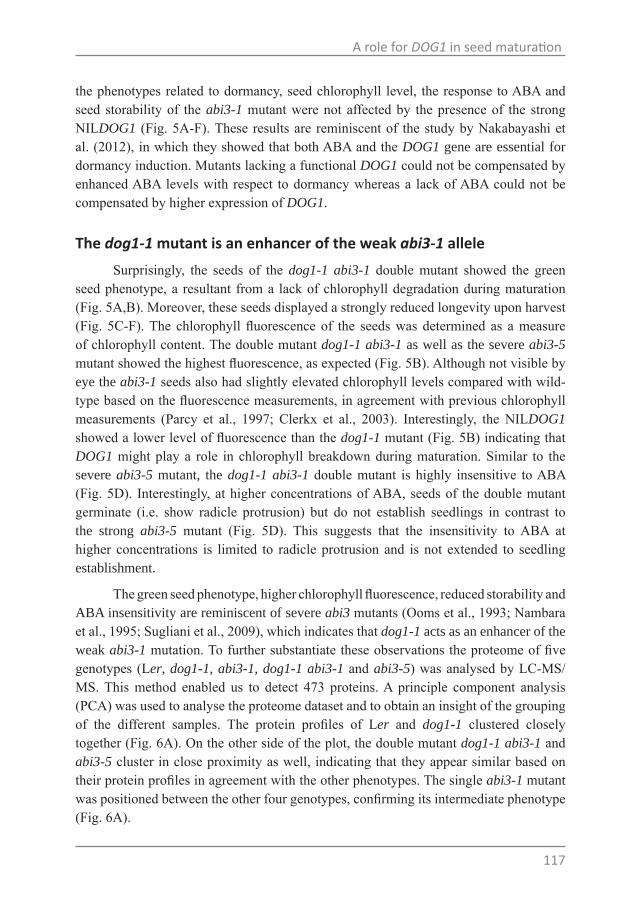
117
A role for DOG1 in seed maturation
the phenotypes related to dormancy, seed chlorophyll level, the response to ABA and seed storability of the abi3-1 mutant were not affected by the presence of the strong NILDOG1 (Fig. 5A-F). These results are reminiscent of the study by Nakabayashi et al. (2012), in which they showed that both ABA and the DOG1 gene are essential for dormancy induction. Mutants lacking a functional DOG1 could not be compensated by enhanced ABA levels with respect to dormancy whereas a lack of ABA could not be compensated by higher expression of DOG1.
The dog1-1 mutant is an enhancer of the weak abi3-1 alleleSurprisingly, the seeds of the dog1-1 abi3-1 double mutant showed the green
seed phenotype, a resultant from a lack of chlorophyll degradation during maturation (Fig. 5A,B). Moreover, these seeds displayed a strongly reduced longevity upon harvest (Fig. 5C-F). The chlorophyll fluorescence of the seeds was determined as a measure of chlorophyll content. The double mutant dog1-1 abi3-1 as well as the severe abi3-5 mutant showed the highest fluorescence, as expected (Fig. 5B). Although not visible by eye the abi3-1 seeds also had slightly elevated chlorophyll levels compared with wild-type based on the fluorescence measurements, in agreement with previous chlorophyll measurements (Parcy et al., 1997; Clerkx et al., 2003). Interestingly, the NILDOG1 showed a lower level of fluorescence than the dog1-1 mutant (Fig. 5B) indicating that DOG1 might play a role in chlorophyll breakdown during maturation. Similar to the severe abi3-5 mutant, the dog1-1 abi3-1 double mutant is highly insensitive to ABA (Fig. 5D). Interestingly, at higher concentrations of ABA, seeds of the double mutant germinate (i.e. show radicle protrusion) but do not establish seedlings in contrast to the strong abi3-5 mutant (Fig. 5D). This suggests that the insensitivity to ABA at higher concentrations is limited to radicle protrusion and is not extended to seedling establishment.
The green seed phenotype, higher chlorophyll fluorescence, reduced storability and ABA insensitivity are reminiscent of severe abi3 mutants (Ooms et al., 1993; Nambara et al., 1995; Sugliani et al., 2009), which indicates that dog1-1 acts as an enhancer of the weak abi3-1 mutation. To further substantiate these observations the proteome of five genotypes (Ler, dog1-1, abi3-1, dog1-1 abi3-1 and abi3-5) was analysed by LC-MS/MS. This method enabled us to detect 473 proteins. A principle component analysis (PCA) was used to analyse the proteome dataset and to obtain an insight of the grouping of the different samples. The protein profiles of Ler and dog1-1 clustered closely together (Fig. 6A). On the other side of the plot, the double mutant dog1-1 abi3-1 and abi3-5 cluster in close proximity as well, indicating that they appear similar based on their protein profiles in agreement with the other phenotypes. The single abi3-1 mutant was positioned between the other four genotypes, confirming its intermediate phenotype (Fig. 6A).

118
Chapter 5

119
A role for DOG1 in seed maturation
Figure 5. Seed related phenotypes. (A) Photographs showing mature dry seeds of the different genotypes. (B) Chlorophyll fluorescence of seeds of the different genotypes as a measure of chlorophyll content. (C) The dormancy relieve of Ler, abi3-1, dog1-1, dog1-1 abi3-1, NILDOG1 and NILDOG1 abi3-1. The graph shows the rapid decrease in germination ability of the double mutant. (D) ABA dose response cureves. Germination is measured by either radicle protrusion or seedling establishment. Data of abi3-5 and dog1-1 abi3-1 is plotted in separated graphs since these genotypes were already affected in their germination directly after harvest, as shown by their lower germination rates. (E) The line graph show the effect of a controlled deterioration treatment on Ler, dog1-1, ab3-1 and the double mutant dog1-1 abi3-1. (F) Shows the germination rates of all seven genotypes after 2.5 years of dry storage.
DOG1 does not affect protein storage accumulationLer and dog1-1 are clustered closely in the PCA plot, which indicates that their
protein profiles are similar. Indeed, we only detected 12 proteins that accumulated differentially between these two genotypes (>2 fold and P<0.05, Fig. 6B). We had a closer look at the seed storage proteins CRUCIFERIN (CRU) 2, CRU3 and the ALBUMIN 1, 4 and 5. The abundance of these seed storage proteins was not significantly changed in the dog1-1 mutant compared with WT but was found to be severely reduced in abi3-1, abi3-5 and the double mutant (Fig. 6C). A similar result was found for OLEOSIN proteins (Fig. 6D). These proteins function as structural components of oil bodies and were found to be lower expressed in abi3-1, abi3-5 and the double mutant but not in the dog1-1 mutant. The findings on the proteome level are in good agreement with what we observed in our micro array, as the transcript abundance of these CRUCIFERINS, ALBUMINS and OLEOSINS was not reduced in dog1-1 mutant seeds. Taken together, DOG1 is most likely not involved in seed storage protein accumulation.
DiscussionSeed dormancy is an important trait which is under selective pressure. The
exploration of natural variation in Arabidopsis resulted in the identification of an important regulator of seed dormancy, DOG1. Recently, (Nakabayashi et al., 2012) showed that the DOG1 protein accumulates during the second half of seed maturation and that the level of accumulated DOG1 protein strongly correlated with the depth of seed dormancy. The depth of dormancy is strongly affected by environmental conditions experienced by the mother plant. For example, cool temperature (10-17 ˚C) is a positive effector of dormancy and is correlated with strongly enhanced DOG1 levels (Kendall et al., 2011; Nakabayashi et al., 2012). Most interestingly, it was shown that during after-ripening the DOG1 protein is modified, probably reducing its activity, and therefore it was suggested that the DOG1 protein may act as a timer for dormancy release (Nakabayashi et al., 2012).

120
Chapter 5
Figure 6. Proteome analysis of Ler, dog1-1, abi3-1, abi3-5 and the double mutant dog1-1 abi3-1. (A) All samples (including three biological replicates) are included in a PCA plot based on the proteome data. (B) The list shows the 12 protein that differentially accumulated in dog1-1 (fold change>2, P<0.05). (C) Fold change difference of five seed storage proteins as compared with Ler. (D) Fold change difference of 7 oleosin proteins as compared with Ler.
DOG1 is a key regulator of gene expression during the final stage of seed development
It is without a doubt that DOG1 has a crucial role in the regulation of dormancy. We asked whether the function of DOG1 is limited to seed dormancy or whether it affects other seed related traits. Therefore we employed several “omics” approaches combined with genetics and physiological experiments to unravel processes that are affected by DOG1. The transcriptome analysis showed that hundreds of genes are differentially expressed in the dog1-1 mutant. To put this in perspective, we looked at the number of differentially expressed genes in seeds that are produced on plants grown under different environmental conditions. Seeds matured on plants grown under different temperature, light or nutrient conditions that affected dormancy levels of those seeds resulted in a

121
A role for DOG1 in seed maturation
maximum of 300 differentially expressed genes (Chapter 4, Table 4). The fact that, in comparison, 700 genes are differentially expressed in the dog1-1 mutant indicates that it is an important transcriptional regulator. We observed that many of the differentially expressed genes in dog1-1 are either up or down regulated between 14 DAP and the dry seed stage using a publicly available microarray data set (Angelovici et al., 2009). This suggests that DOG1 controls gene expression during the final ~6 days of seed development, encompassing late seed maturation and desiccation, which is in agreement with the DOG1 protein accumulation during this stage (Nakabayashi et al., 2012).
A total of 245 genes are expressed at a reduced level in dog1-1 seeds. A substantial number of these are related to ABA and stress, including HSPs, LEAs and DEHYDRINs. These genes are thought to play a role in stress tolerance upon desiccation by acting as molecular chaperones, enzyme protectants or antioxidants (Ellis and Vandervies, 1991; Tunnacliffe and Wise, 2007). In the proteome analysis ChlADR (AT1G54870) is one of the four proteins that is reduced in dog1-1. This gene is implicated in detoxifying reactive carbonyls which are produced as a result of lipid peroxidation (Yamauchi et al., 2011). The metabolite analysis showed that galactinol and raffinose accumulate in lower concentrations in dog1-1 than in Ler seeds (Fig. 3). These sugars are implicated in stress tolerance (ElSayed et al., 2014) and together with LEA proteins may function as “fillers” to maintain cellular integrity. Therefore these changes in the transcriptome and metabolome may be linked to the reduced longevity which is observed for dog1-1 seeds (Figure 5F; (Bentsink et al., 2006)). Although 245 genes are down-regulated in dog1-1 seeds, nearly twice as many genes are up-regulated. Many of these up-regulated genes are activated during germination and this set is over-represented for gene categories supporting germination. This suggests that an important function of DOG1 is to repress genes related to germination, which is in agreement with its function in dormancy control.
DOG1 affects the accumulation of specific metabolites but not seed storage proteins
Several changes take place at the metabolome level during the last stages of seed development. For example, at the end of seed development the accumulation of storage lipids is stopped and a small part is remobilized (Baud et al., 2002; Chia et al., 2005). Simultaneously, sugars (sucrose, galactinol, raffinose and stachyose), the TCA intermediates fumarate and succinate and free amino acids accumulate in Arabidopsis seeds (Fait et al., 2006). Our analysis of primary metabolites in dry seeds shows that a subset of these metabolites does not accumulate in dog1-1 to similar levels as in Ler. These include the amino acids Asn, Asp and Phe, the N-rich compounds allantoin and urea as well as galactinol, raffinose and fumarate. Fumarate was found to accumulate strongly during desiccation although the mechanisms of this accumulation are unclear
122
Chapter 5
(Fait et al., 2006). Our data opens up the possibility that this metabolic shift is, in part, affected by DOG1 activity. In addition to fumarate, the amino acids Asn, Phe and the oligosaccharide raffinose were reported to accumulate during desiccation (Fait et al., 2006) but accumulated to lower amounts in dog1-1 seeds (Fig 3A). Free Asn levels correlated with protein content in soybean seeds (Pandurangan et al., 2012). Perhaps accumulation of such a pool would be an important driver for early protein synthesis during rehydration and germination of seeds. In our data the N-rich compounds urea and allantoin, also accumulated to lower levels in dog1-1. These two compounds were not identified by Fait and co-workers (2006). Perhaps these compounds accumulate during desiccation as well, however this possibility needs further studies. In our data Asp content was also found be severely affected by DOG1. NILDOG1 seeds accumulated strongly enhanced levels of Asp as compared with Ler and dog1-1. However, Asp content was not affected during the desiccation stage in the Arabidopsis accession Ws (Fait et al., 2006).
The accumulation of five storage proteins present in the proteome data set was not affected in dog1-1 (Fig. 6C) but their accumulation was clearly affected in the severe abi3-5 mutant in agreement with earlier findings (Sugliani et al., 2009). We also investigated the accumulation of OLEOSIN proteins. These are structural proteins of the oil bodies. Mutations in the master regulators of seed maturation often affect storage reserve accumulation, including oil content (Baud and Lepiniec, 2010). The severe abi3-5 mutant showed a severely reduced OLEOSIN protein content indicative for reduced storage oil content. The dog1-1 seeds showed WT OLEOSIN protein content. Although we did not measure oil content directly, this may indicate that dog1-1 oil content is similar as WT.
Distorted seed maturation induced by dog1-1 in a sensitized genetic background suggests a role for DOG1 in seed maturation.
Even during the final stage of seed maturation gene expression and the accumulation of primary metabolites are actively regulated (Angelovici et al., 2010). Our results show that many of such genes and a subset of metabolites are affected in their accumulation by the DOG1 gene, which leads us to hypothesize that DOG1 is a more general regulator of seed maturation in addition to its function in dormancy control. Additional support for this hypothesis was gained by the analysis of a cross between dog1-1 and abi3-1. The leaky nature of the abi3-1 leaky allele provides a sensitized genetic background for seed maturation studies. Such a sensitized background is useful to identify genetic modifiers and enhancer mutations (those that aggravate the mutant phenotype) that are predicted to identify genes acting redundantly with the primary mutation or possibly interact physically with such a gene product (Page and Grossniklaus, 2002). Mutagenesis of abi3-1 seeds identified several of such enhancers. Examples are green seed (grs; (Clerkx
123
A role for DOG1 in seed maturation
et al., 2003) that affects seed chlorophyll level and storability, but not ABA insensitivity, as well as several intragenic enhancers including the severe abi3-4 allele (Ooms et al., 1993). Additionally, ABA deficiency was found to be a strong enhancer of abi3-1 by analysis of the double mutant aba1-1 abi3-1. These seeds showed a strongly disrupted seed maturation resulting in green seeds that are barely storable (Koornneef et al., 1989). The double mutant dog1-1 abi3-1 also has green seeds that have a reduced storability, indicating that dog1-1 is an enhancer of abi3-1 as well. The dog1-1 abi3-1 mutant differs from the grs abi3-1 double mutant in that the dog1-1 abi3-1 showed a strongly enhanced ABA insensitivity (Fig. 5D).
An interesting question to address is how dog1-1 enhances the abi3-1 phenotype. One option could be that dog1-1 reduces the expression of ABI3. Such combination of a weak allele that is expressed at a reduced level could phenocopy a severe allele. The expression of ABI3 was not found to be affected in dog1-1 in our microarray data. This was further confirmed using RT-qPCR including (a second) dog1-3 and taking into account that ABI3 is alternatively spliced as shown by Sugliani et al. (2010) (data not shown). Reduced ABA levels combined with the abi3-1 mutation also produced green seeds (Koornneef et al., 1989). Therefore, we cannot rule out a role for the observed lower ABA levels in the dog1-1 mutant (Nakabayashi et al., 2012) at this point, which should be considered as an alternative option. Nevertheless, it should be noted that the ABA levels were not that different in a second allele, dog1-2 (Nakabayashi et al., 2012) and ABA measurements between WT and dog1 mutants in our lab revealed only minor differences under standard growth conditions (Chapter 4, Table S1).
Our findings suggest a role for DOG1 in the control of seed maturation. The transcriptome data revealed that a substantial number of genes misregulated in dog1-1 are direct targets of the master regulators of seed maturation LEC2, FUS3 or ABI3. This could explain, in part, why and possibly how dog1-1 could affect seed maturation. Most interestingly in this respect is the notion that DOG1 is a putative direct target of both LEC2 as well as FUS3 and this points to a model in which DOG1 is intimately related to the core regulators of seed maturation.
Material and methods
Plant materialLer, NILDOG1 and the dog1-1 and dog1-3 mutants were retrieved as described
by (Bentsink et al., 2006). The isolation of abi3-1 and abi3-5 mutants is described by (Koornneef et al., 1982) and (Ooms et al., 1993), respectively and the gene identity by (Giraudat et al., 1992). For the transcriptome analyses Ler, NILDOG1 and the dog1-1

124
Chapter 5
were grown in a randomized complete block design with three replicates. Each replicate consisted of a bulk of eight plants. The precise growth conditions used were described by (El-Lithy et al., 2006). For the phenotypic, metabolome and proteome analyses plants were grown as described in Chapter 3.
Microarray analysisFor this experiment the Arabidopsis thaliana genotypes Ler, NILDOG1 and
dog1-1 were used. RNA was extracted from freshly harvested seeds of three biological replicates of each genotype for hybridization on Affymetrix ATH1 GeneChips. RNA extraction, quality assessment, processing and hybridization were according to (Bentsink et al., 2010). The resulting data were analysed using the R statistical programming environment (R-Core-Team, 2013) and the Bioconductor packages (Gentleman et al., 2004). The raw .cel files were normalized with Robust Microarray Averaging (RMA) (Irizarry et al., 2003), using a custom chip definition file (.cdf) from the CustomCDF project (Ath1121501_At_TAIRG.cdf v18.0.0, released 23rd January 2014 (Dai et al., 2005) obtained via http://brainarray.mbni.med.umich.edu/Brainarray/Database/CustomCDF/18.0.0/tairg.asp. Significant differential expression changes were computed using the limma package (Smyth, 2004) and P values were adjusted for multiple testing with the Benjamini and Hochberg method to control for false positives (Benjamini and Hochberg, 1995). After removal of the control probes, 21430 genes were left. A gene was considered differentially expressed between two genotypes if the difference between mean signal of the genotypes was over 2 fold and statistically significant (Adjusted P-value of 0.05 or lower). Microarray quality and reproducibility data are presented in Fig. S1. Overrepresentation analysis was performed using Pageman (Carrari et al., 2006) and the data is summarized in Table 1. For the analysis of the expression profiles during maturation the expression values for the up and down regulated genes in dog1-1 were extracted from a previously published data set (Angelovici et al., 2009) and plotted using by color key using Genemath.
To investigate the overlap between the genes differentially expressed in dog1-1 and the direct targets of LEC2, FUS3 and ABI3 we used publicly available data sets. As direct targets of LEC2 we used a set of 718 genes described by (Braybrook et al., 2006). From this list 28 probe sets were removed that detected more than one gene, thus ending up with a list 690 putative LEC2 genes. Wang and Perry (2013) identified 1,140 genes that are directly bound by FUS3 using a ChIP-chip experiment using embryonic culture tissue. They combined their data with other gene expression datasets Yamamoto et al. (2010); Chiu et al. (2012) and Lumba et al. (2012), which resulted in a set 366 genes that were both bound by FUS3 and led to a significant transcriptional change (Wang and Perry, 2013). This list of 366 direct target genes of FUS3 was used in this study. As

125
A role for DOG1 in seed maturation
direct targets of ABI3 we used a set of 98 genes that were identified using a combination of ChIP-chip and gene expression analysis which was designated as the ABI3 regulon (Monke et al., 2012).
RT-qPCR analysisFor RT-qPCR, RNA was isolated from dry mature seeds of NILDOG1, dog1-
1, Col-0 (N60000) and dog1-3 (SALK_000867; (Alonso et al., 2003) using a phenol/chloroform extraction method (described in (Schuurmans et al., 2003) and purified with columns (Qiagen). Genomic DNA was removed using a DNase treatment (RNase-free DNase set, Qiagen) and the absence of DNA was checked by comparing cDNA samples with RNA samples which were not reverse transcribed (minus RT control) and the difference was at least 5 Cq values as suggested by Nolan et al. (2006). RNA integrity of all samples was assessed by analysis on a 1% agarose gel. For all Arabidopsis samples clear ribosomal rRNA bands were visible and the OD 260/280 ratios (measured using a Nanodrop ND-1000, Nanodrop Technologies Inc.) were close to 2.0 for all samples used in this experiment.
An amount of 700ng of RNA was reverse transcribed using the iScriptTM cDNA synthesis kit (Bio-Rad) according to the kit protocol. cDNA samples were diluted in a total volume of 380µl using sterile milliQ water. Each qPCR reaction consisted of 3µl sample, 6µl iQ SYBR Green Supermix (Bio-Rad), 0.3µl of primer (from a 10µM work solution) and was supplemented with water to a final volume 12µl. The RT-qPCR reactions were run on a CFX (Bio-Rad). The qPCR run consisted of a first step at 95°C for 3 min. and afterwards 40 cycles alternating between 15 sec. at 95°C and 1 min. at 60°C.
The RT-qPCR data was loaded in qbasePLUS (Hellemans et al., 2007) which is commercially available software (Biogazelle, Ghent, Belgium, www.biogazelle.com). For normalizing the data we used four reference genes that were found to be stably expressed in seeds, AT2G28390, AT4G12590, AT4G34270 and AT2G43770 (Graeber et al., 2011; Dekkers et al., 2012). The two most stably expressed genes identified by the geNORM program (Vandesompele et al., 2002), which is integrated into the qbasePLUS software, were used for normalization. In the calculation we corrected for primer efficiency which was calculated from the amplification curve using LinReg PCR (Ramakers et al., 2003; Ruijter et al., 2009).
Primers for the target genes were designed preferably in the 3’ part of the transcript. When possible the primer or primer pair was designed in such a way that it spanned an intron/exon border. The Tm of the primers was between 59 and 62°C. Routinely a melting curve analysis was performed after the qPCR run (between 55°C and 95°C with
126
Chapter 5
0.5°C increments for 10 sec. each) and for all primers a single peak was observed. The sequences of the primers of the targets genes are:
ExpA2/AT5G05290 (for: TCGCATTCAGAAGGGTTCC, rev: CCACCCACATTCGTGATTAG)
Man7/AT5G66640 (for: GGATTACTGAAATGGCTGCTCATGTGA, rev: CAGGGTAAGAGTGAACCGTGACGAAA)
ABI4/AT2G40220 (for: CGGTGGGTTCGAGTCTATCAA, rev: CGGATCCAGACCCATAGAACA; (Dekkers et al., 2008)
GBF4/AT1G03970 (for: TTTTCCGATGCAGCGACACAGTTC, rev: ACTCCTCCACCCATTGATCCTTCA; (Czechowski et al., 2004)
EM1/AT3G51810 (for: AGATGGGACACAAAGGAGGAG, rev: TGTTGGTGAACTTTGACTCATCG; (Dekkers et al., 2008)
EM6/AT2G40170 (for: GGTACGGGAGGCAAAAGCTT, rev: TTGCGTCCCATCTGCTGATATTG; (Dekkers et al., 2008)
ABI5/AT2G36270 (for: GAGAATGCGCAGCTAAAACA, rev: GTGGACAACTCGGGTTCCTC; (Miura et al., 2009)
ABF4/AT3G19290 (for: TGAGCTGAAAGAAACGTCGAAGC, rev: TCCGGTTAATGTCCTTCTCAAGCA; (Czechowski et al., 2004)
Primary metabolite analysis by GC-TOF-MSThe metabolite extraction, derivatizing, analysing and GC-MS data processing
were performed as described in Chapter 4, materials and methods.
Construction of the double mutants dog1-1 abi3-1 and NILDOG1 abi3-1The abi3-1 mutant (Koornneef et al., 1982), NILDOG1 and dog1-1 are in the
Ler-0 genetic background. For both crosses F2 individuals were screened for the Cvi introgression surrounding the DOG1 gene by PCR using marker K15I22 which is a single sequence length polymorphism (described in (Bentsink et al., 2006)). Of the individuals that were homozygous for the introgression, the F3 seeds were screened for ABA sensitivity. Those individuals of which the offspring was completely insensitive against ABA were considered as homozygous for both mutations.
Phenotyping seed traitsSeveral phenotypic traits were assessed for the different genotypes which

127
A role for DOG1 in seed maturation
included Ler, NILDOG1, dog1-1, abi3-1, abi3-5 (Ooms et al., 1993) and the double mutants dog1-1 abi3-1 and NILDOG1 abi3-1. Chlorophyll fluorescence was measured using a Junior PAM Chlorophyll Fluorometer (Heinz Walz GmbH, Effeltrich, Germany). The measurements were performed on four biological replicates and values are relative fluorescence units.
Germination assays were performed to assess dormancy and longevity of the genotypes under study. The assays were performed as described by Joosen et al. (2010) using the Germinator set-up. Six samples of approximately 50 to 100 seeds, were sown on two layers of blue germination papers equilibrated with 50 mL of demineralized water in plastic trays (15 × 21 cm). Trays were piled and wrapped in a closed and transparent plastic bag. The bags were incubated in an incubator at 22°C and continuous light. Germination was followed daily by taking photos for up to 10 days.
ABA sensitivity was assessed using a dose response curve using the amounts as indicated. We used the germination assay as above with the difference that in this case we assessed germination both by radicle protrusion as well as seedling establishment.
Total soluble protein extraction method15 mg of dry seeds of each sample (three biological replicates) were ground with
mortar and pestle in liquid nitrogen for about one minute. Extraction buffer and protease inhibitor, as previously described by Rajjou et al. (2008), were added into seed powder, followed by a 2-min grinding. The extract was recovered into 1.5 mL eppendorf tube and incubated with DNase I, RNase A, and DTT at 4˚C for an hour on rotating disc. The total soluble protein extract was collected as supernatant after centrifugation with 14,000 rpm at 4°C for 10 min.
Protein quantification and identificationProtein extract (25 µg proteins) were loaded onto 4 % acrylamide gel. After
running for 15 min, the gel was stained with Coomassie Brilliant Blue R-250 (CBB) (Biorad). The visualized band was cut and subjected to trypsin digestion and LC-MS/MS analysis.
Eluted peptides were analysed on-line with a LTQ XL ion trap (Thermo Electron) using a nanoelectrospray interface. Ionization (1.5 kV ionization potential) was performed with liquid junction and a non-coated capillary probe (10 μm i.d.; New Objective). Peptide ions were analysed using the LTQ XL ion trap controlled by the Xcalibur 2.07 software with the following data-dependent acquisition steps: (1) full MS scan (mass-to-charge ratio (m/z) 300 to 1400, centroid mode) and (2) MS/MS (qz= 0.25, activation time= 30 ms, and collision energy = 35%; centroid mode). Step 2 was

128
Chapter 5
repeated for the three major ions detected in step 1. Dynamic exclusion was set to 30 s with a repeat count= 1. A database search was performed with XTandem (version 2010.12.01.1) (http://www.thegpm.org/TANDEM/). Enzymatic cleavage was declared as a trypsin digestion with one possible miscleavage.Cys carboxyamidomethylation and Met oxidation were set to static and possible modifications, respectively. Precursor mass and fragment mass tolerance were 2.0 and 0.5, respectively. A refinement search was added with similar parameters except that semi-trypsic peptide and possible N-ter proteins acetylation were searched.
The TAIR10 genome (ftp://ftp.arabidopsis.org) and a contaminant database (trypsin, keratins) were used. Only peptides with an E value smaller than 0.1 were. Identified proteins were filtered and grouped using the XTandem Pipeline (http://pappso.inra.fr/bioinfo/xtandempipeline/) according to: (1) a minimum of two different peptides was required with an E value smaller than 0.03, (2) a protein E value (calculated as the product of unique peptide E values) smaller than 10-3. In case of identification with only two or three MS/MS spectra, similarity between the experimental and the theoretical MS/MS spectra was visually checked.
The peptide ions not specific of a single protein were eliminated and, since a peptide ion was detected several times in one biological sample, the Total Ionic Current (TIC) area under peak corresponding to the same peptide ion was summed. We also removed peptide ions that were not reliably detectable by keeping only peptide ions detected at least twice out of the three biological replicates. Since several peptide ions corresponded to the same protein, we summed the total peptide ions’ TIC area to get the overall protein abundance and we then log2-transformed this protein abundance. Then, when a protein was identified from several peptides, we summed the peptide abundances to obtain a total abundance value for each protein.
Supplemental MaterialsSupplemental files can be downloaded from http://www.wageningenseedlab.nl/
thesis/hhe/SI/chapter5/
Table S1. Differentially expressed genes between Ler, NILDOG1 and dog1-1.
Figure S1. Microarray quality and reproducibility.

General Discussion
Chapter 6
130
Chapter 6
Higher plants maximize the survival of offspring using strategies adapted to environmental conditions encountered. The most important of these strategies is the dispersal of seeds with highly variable characteristics that are induced during seed development and maturation and determine seed performance. Thus, seed performance is highly dependent on the maternal environment during seed formation and filling, as is shown by the experiments described in this thesis.
The effect of seed maturation temperature on seed dormancyAdaptation is an evolutionary process whereby an organism adjusts to its local
environment. The analysis of natural variation in wild species is useful to elucidate the molecular basis of phenotypic differences related to plant adaptation. Such natural variation analysis is a powerful strategy to investigate the ecological and evolutionary processes involved in adaptation to diverse environments (Mitchell-Olds et al., 2007). In Chapter 2, natural variation of seed dormancy in a world-wide collection of Arabidopsis accessions was explored. We showed that eight temperature-related climatic parameters of local environments correlated positively with seed dormancy, while latitude and longitude were correlated negatively with seed dormancy (Chapter 2, Table 1). This is in agreement with Chiang et al. (2011) these authors showed that southern accessions are more dormant than northern accessions.
In Chapters 3 and 4 we have studied the acclimation of plants to changed seed maturation environments. In Chapter 3 we showed that among all different maturation environments, temperature played a dominant role in both plant and seed performance (Chapter 3, Table 3), and low temperature significantly increased dormancy whereas it decreased seed longevity in some genotypes tested. Moreover, Huang et al. (2014) investigated the effect of maternal environment on seed dormancy and seed production, by comparing two contrasting Arabidopsis thaliana accessions, Cape Verde Islands (Cvi) and Burren (Bur, originated from Ireland). Cvi is adapted to a hot dry climate and Bur to a cool damp climate. Cvi and Bur accessions were grown in controlled environments that simulated respective native environments and it was found that temperature during seed development determined the seed dormancy status, which is in agreement with our acclimation study (Chapters 3 and 4). The reason that low maturation temperature increased seed dormancy seems to conflict with the fact that southern accessions are more dormant than northern accessions, however, it is important to bear in mind that local adaptation is not only mediated by seed maturation temperature but also by complex environmental conditions and seasonal changes.
Earlier studies have shown that the expression of DELAY OF GERMINATION 1 (DOG1) correlates with the dormancy level (Footitt et al., 2011). DOG1 was the first gene identified to be associated with natural variation of dormancy in Arabidopsis thaliana (Bentsink et al., 2006), providing a unique opportunity to study allelic diversity
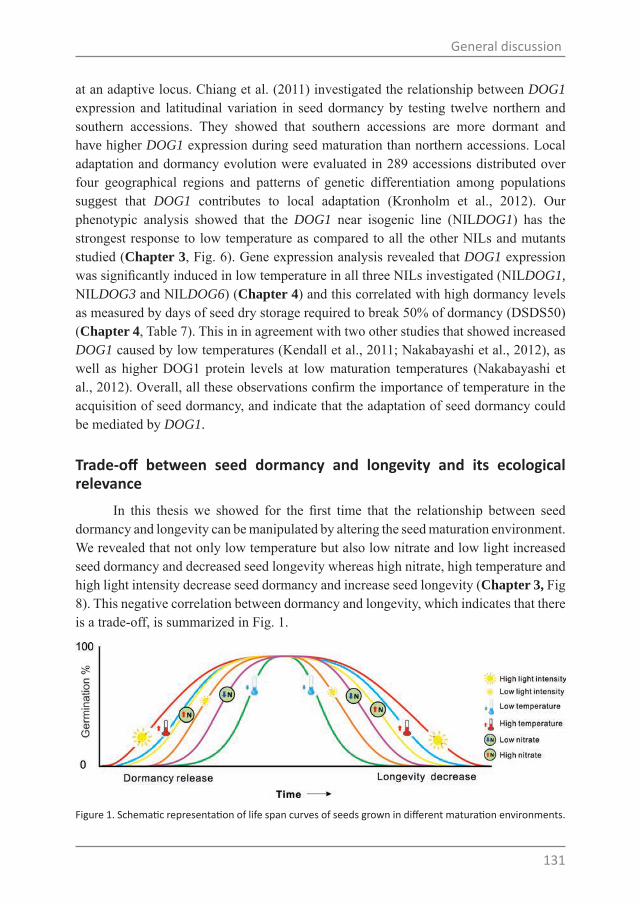
131
General discussion
at an adaptive locus. Chiang et al. (2011) investigated the relationship between DOG1 expression and latitudinal variation in seed dormancy by testing twelve northern and southern accessions. They showed that southern accessions are more dormant and have higher DOG1 expression during seed maturation than northern accessions. Local adaptation and dormancy evolution were evaluated in 289 accessions distributed over four geographical regions and patterns of genetic differentiation among populations suggest that DOG1 contributes to local adaptation (Kronholm et al., 2012). Our phenotypic analysis showed that the DOG1 near isogenic line (NILDOG1) has the strongest response to low temperature as compared to all the other NILs and mutants studied (Chapter 3, Fig. 6). Gene expression analysis revealed that DOG1 expression was significantly induced in low temperature in all three NILs investigated (NILDOG1, NILDOG3 and NILDOG6) (Chapter 4) and this correlated with high dormancy levels as measured by days of seed dry storage required to break 50% of dormancy (DSDS50) (Chapter 4, Table 7). This in in agreement with two other studies that showed increased DOG1 caused by low temperatures (Kendall et al., 2011; Nakabayashi et al., 2012), as well as higher DOG1 protein levels at low maturation temperatures (Nakabayashi et al., 2012). Overall, all these observations confirm the importance of temperature in the acquisition of seed dormancy, and indicate that the adaptation of seed dormancy could be mediated by DOG1.
Trade-off between seed dormancy and longevity and its ecological relevance
In this thesis we showed for the first time that the relationship between seed dormancy and longevity can be manipulated by altering the seed maturation environment. We revealed that not only low temperature but also low nitrate and low light increased seed dormancy and decreased seed longevity whereas high nitrate, high temperature and high light intensity decrease seed dormancy and increase seed longevity (Chapter 3, Fig 8). This negative correlation between dormancy and longevity, which indicates that there is a trade-off, is summarized in Fig. 1.
Figure 1. Schematic representation of life span curves of seeds grown in different maturation environments.

132
Chapter 6
Such a trade-off between dormancy and longevity was previously described in two genetic studies. Nguyen et al. (2012) reported a negative correlation by using naturally aged Arabidopsis thaliana recombinant inbred line populations. This corroborated studies on Eruca sativa plants that are distributed in Israel along different environmental gradients, ranging from arid- dry environments to more mesic habitats. Hanin et al. (2013) found that seed longevity decreased with an increase in aridity whereas dormancy increased with increasing aridity (Barazani et al., 2012).
Trade-offs between life-history traits have been well studied in evolutionary biology (Stearns, 1989; Roff, 2000). Genetic correlations that arise suggest the existence of loci with pleiotropic or closely linked effects (Gutteling et al., 2007). Hausmann et al. (2005) reported that the negative genetic correlations in Arabidopsis thaliana, both between fruit length and fruit production and between flowering time and branch production, were verified by pleiotropic or closely linked quantitative trait loci (QTLs). Negative genetic correlations among traits are often used as evidence for trade-offs that can influence evolutionary trajectories in populations (Roff, 2000). Trade-offs are observed for phenotypic correlations between traits such that a change in one trait by itself increases fitness and changes another trait by its antagonistic effect. For example, a decreased age to maturity will increase fitness (Lewontin, 1965). However, due to the reduced time for growth, a decreased age at maturity might result in a decreased adult body size (Roff and Fairbairn, 2007). Another example is that senescence has been explained as the antagonistic pleiotropic effect of genes that are beneficial early in life but deleterious later in life (Williams, 1957). We hypothesize that this is also the case for the relation between seed dormancy and longevity, such that by increasing seed dormancy longevity decreases. This can be a cost effect as hypothesized by Nguyen (2014): oxygen is required to overcome seed dormancy (during after-ripening) but the accumulation of oxidative damage might negatively affect seed longevity. Dormancy release is also an energy requiring process: the more energy seeds spend to release dormancy, the less energy is left to prolong longevity (Leubner-Metzger, 2005; Chibani et al., 2006; Rajjou et al., 2008; Nguyen, 2014). We have shown that the maturation environment is important for determining the levels of dormancy and longevity, likely by inducing or repressing these earlier identified loci (Nguyen et al., 2012). Overall, the trade-off between seed dormancy and longevity can reflect a choice between two survival strategies of plants in an ecological system during evolution, which is determined by environmental conditions.
How does the environment affect seed maturation?In the past two sections it has become clear that seed maturation is important in
determining seed performance after seed dispersal, and therefore getting insights into seed maturation processes may deepen our understanding.

133
General discussion
Figure 2. Overview of seed development in Arabidopsis. Dynamics of gene expression of five seed maturation regulators (LEC1, LEC2, FUS3 ABI3 and DOG1), storage products changes, seed dormancy and two central hormones (ABA and GA) during seed development are depicted. Late M.: late maturation stage. Free metabolites, include sugars (e.g. sucrose, raffinose, galactinol and trehalose), secondary metabolites (tocopherols and flavonoids), γ-aminobutyric acid (GABA), the TCA-cycle intermediates fumarate and succinate, some amino acids and free fatty acids, accumulate specifically during seed late maturation (Angelovici et al., 2010).
In Arabidopsis, seed maturation is controlled by four master regulators, which are three B3 domain transcription factors, LEAFY COTYLEDON (LEC) 2, FUSCA (FUS) 3 and ABA INSENSITIVE (ABI3) 3 and one HAP3 subunit of the CCAAT-binding transcription factor LEC1 (Giraudat et al., 1992; Lotan et al., 1998; Luerssen et al., 1998; Stone et al., 2001). These regulators are all expressed during seed development but expression peaks at different moments (Fig. 2). LEC1 peaks at 5-6 DAP (day after pollination), LEC2 peaks at 6-9 DAP, FUS3 peaks at 11-12 DAP, whereas ABI3 peaks at 16-18 DAP, (Baumbusch et al., 2004). All four abi3, lec1, lec2 and fus3 mutants are severely affected in seed maturation and share some common phenotypes, such as decreased dormancy and reduced expression of seed storage proteins. In addition to these four well described regulators, we have identified a role for DOG1 in this process (Chapter 5) (Fig. 2). The dog1 mutants, resemble the mutants of the other regulators, as they are non-dormant and have a reduced longevity. DOG1 expression peaks at 16 DAP (Bentsink et al., 2006; Nakabayashi et al., 2012), while DOG1 protein level peaks at 18 DAP (Nakabayashi et al., 2012) (Fig. 2). As ABI3 and DOG1 expression both peak at
134
Chapter 6
late maturation, their genetic interaction was investigated (Chapter 5, Fig. 5). The fact that ABI3 expression was not affected in dog1-1 in the transcriptome data, and the strong DOG1 allele of Cvi was unable to suppress abi3-1 phenotypes, as well as the fact that the double mutant of dog1-1 and the leaky abi3-1 has green seeds, indicates that DOG1 affects seed maturation, in parallel to ABI3. However, further experiments are required to investigate whether overexpression of ABI3 is able to suppress the dog1-1 phenotype.
Next to the expression of the master regulators, several compounds accumulated during seed development. These are carbohydrates, oils (triacylglycerols, TAGs), seed storage proteins (SSPs) (including 2S albumins and 12S globulins), oleosin and late embryogenesis abundant (LEA) proteins. Free metabolites also accumulated to a certain extent at the final phase of seed maturation, possibly to support the initial phase of germination (Fait et al., 2006) (summarized in Fig. 2). Although the four regulators (LEC1, LEC2, FUS3 and ABI3) affect the accumulation of seed storage proteins, oleosins and LEA proteins (Braybrook and Harada, 2008), DOG1 does not affect seed storage protein and oleosin accumulation (Chapter 5, Fig. 6). This suggests a specific role for DOG1 as compared with the four master regulators.
We also observed that seed primary metabolites are affected by the maturation environment. Moreover, we showed that the effects of temperature and nitrate on seed performance are reflected by partly overlapping genetic and metabolic pathways (Chapter 4). Nitrogen related compounds asparagine (Asn), GABA and allantoin were significantly decreased in both low temperature and low nitrate parental environments (Fig. 3), as well as the expression of four genes associated with nitrogen-metabolism.
We showed in Chapter 4 that Asn is significantly decreased in both low temperature and low nitrate maturation environments (Fig. 3) and among all metabolites, Asn displayed the highest fold decrease (80 fold) in the dog1-1 mutant as compared with NILDOG1 (Chapter 5, Fig. 3). Fait et al. (2006) demonstrated a 40-fold increase of Asn at late maturation, from 17 DAP to dry mature seeds, and proposed that the degradation of protein to free metabolites is to prepare for the initial stage of germination. Therefore, Asn might be an actor in the control of storage product accumulation. In the 1970s, it was already shown that Asn was key to the nitrogen metabolism of developing legume seeds (Atkins et al., 1975). This is supported by Hernandez-Sebastia et al. (2005) who showed a positive correlation between free Asn in developing cotyledons and seed protein content at maturity in soybean. They indicated that Asn may act as a metabolic signal of seed nitrogen status and even can be used as a physiological marker for seed protein content. The breakdown of Asn to Asp, which is catalysed by asparaginase, releases ammonia. The liberated ammonia is reassimilated and utilized for synthesis of many nitrogen containing compounds of the cell and in particular the amino acids. However,

135
General discussion
asparaginase was not expressed in our data (Chapter 4), in agreement with the finding that asparaginase expression peaked at 10 DAP and is not expressed in dry seeds (Fait et al., 2006).
Figure 3. Metabolites and genes differentially affected by four parental environments (low temperature (15°C), low nitrate (N0), low and high light intensity). Only metabolites that were changed significantly (>2 fold change, P<0.05) in two or more environments are shown. Genes that are involved in metabolic pathways or previously identified to be involved in stress response are depicted. Red solid lines indicate increased abundance of metabolites or up-regulated gene expression; blue solid lines indicate decreased metabolite abundance or down-regulated gene expression; red dashed lines indicate significant increase of gene expression but not < 2 fold.
Plant hormones are pivotal factors in many signal transduction chains in plants and are particularly important in mediating the translation of environmental signals to internal ones. Abscisic acid (ABA) plays a leading role during seed maturation and accumulates during maturation (Fig. 2) (Karssen et al., 1983; Koornneef et al., 1989; Raz et al., 2001). Gibberellins (GAs) are a group of hormones that display antagonistic functions to ABA in that these can break seed dormancy and induce germination. GAs are also important for embryo growth as they can stimulate stem elongation by promoting cell division and elongation (Bewley et al., 2013). The regulatory role of ABA and GA and the balance between them is crucial for seed maturation (Finkelstein et al., 2008).
In this thesis we used three different genotypes (nced6 nced9, cyp707a1-1 and cyp707a2-1) to study the role of ABA-mediated environmental signals. The seed specific ABA synthesis double mutant nced6 nced9 synthesizes less ABA as compared with wild type Columbia (Col) while the ABA catabolic mutants cyp707a1-1 and cyp707a2-1 accumulate 18 times and 9 times higher ABA levels than Col, respectively (Chapter

136
Chapter 6
4, Table S1). However, although cyp707a1-1 was more dormant than Col, it was less dormant than cyp707a2-1 in spite of higher ABA content in dry seeds (Chapter 3, Fig. S1), which was also shown by Okamoto et al. (2006). This indicates that ABA level alone does not explain the dormancy phenotype. This is supported by Cadman et al. (2006) who proposed that an ABA–GA hormone balance mechanism controls seed dormancy cycling.
We observed that cyp707a2-1 seeds were more sensitive to stress conditions (Chapter 3, Fig. 7). In all different maturation environments, cyp707a2-1 seeds had a lower germination percentage than cyp707a1-1 seeds under osmotic (mannitol) and salt stress (Chapter 3, Fig. S1). We hypothesize that under these stress conditions de novo synthesised ABA is inhibiting germination. In cyp707a1-1 seeds ABA could be catabolised by CYP707A2 that is expressed during late maturation until early germination, and peaks at 6h of imbibition (Liu et al., 2010). The different timing of expression may be responsible for the difference in phenotype between the mutants, but this needs further investigation.
In both low temperature and low nitrate maturation environments, DSDS50 levels increased (Chapter 4, Fig. 2). However the regulation might be different in the two environments. In low nitrate conditions the dormancy increase might be the result of increased ABA levels, likely caused by a decrease of CYP707A2 expression (significant although less than 2 fold, Chapter 4) as was shown before by Matakiadis et al. (2009). In agreement with this, the dormancy level of the cyp707a2-1 mutant remained unchanged in different nitrate maturation environments (Chapter 3, Fig. S1). In low temperature the increase in dormancy correlated with both an increase in ABA content and DOG1 expression. Kendall et al. (2011) showed that DOG1 and the regulation of the ABA-GA balance are both important for the induction of dormancy by low temperatures. Moreover, it was shown by Nakabayashi et al. (2012) that although DOG1 and ABA are both required for seed dormancy, they function by largely independent pathways. In addition, Kendall et al. (2011) demonstrated that C-REPEAT BINDING FACTORS (CBFs) are necessary for the regulation of dormancy and are important for the regulation of GA2ox6 and DOG1 expression caused by low temperatures but CBFs themselves are not regulated by low temperature.
Combining maturation environmentsIn Chapter 3 we described the effect of 13 different maturation environments
(Chapter 3, Table 3). Only one environmental factor was changed in eleven of the environments tested, whereas two environments were combinations of environments (high temperature combined with low phosphate concentration and high temperature combined

137
General discussion
with high phosphate concentration). Altered phosphate concentration alone significantly affected one plant phenotypes (siliques per plant) and three seed performance traits (Gmax in mannitol, Gmax in salt and phytate content) (Chapter 3, Table 3, Fig. 3 and Fig. 4). However, by combining phosphate with high temperature environments these effects were lost and only phytate content was still affected in these combined environments (Chapter 3, Table 3 and Fig. 4). We showed that various environmental factors triggered different genetic and metabolic pathways, but combinatorial environments may have a buffering effect on plants and thus not be as effective as single altered environmental conditions. This is confirmed by the observation that parental environmental effects were substantially weaker when offspring was produced in a garden compared with the greenhouse (Schmid and Dolt, 1994). These authors suggested that this was due to greater levels of environmental heterogeneity during growth in a garden. Thus, single altered environmental treatment under laboratory conditions is appropriate for dissecting genetic effects of a certain signal, such as cold, heat and drought. However, field experiments might be more suitable for understanding how natural environments influence plant phenotypes, from ecological and evolutionary perspectives.
Therefore, the next step of investigating how maturation environments affect seed performance will be combining the most discriminative environments or the environments that under natural conditions always accompany each other, for instance, heat and high light intensity or heat and drought.
Knowledge transfer to cropsSeed performance is of immediate importance to the seed industry, due to seed
dormancy and longevity problems encountered. One way to overcome these problems is by priming seeds. Priming is a pre-treatment of seeds that can be performed by various methods, including hydropriming and osmotic priming, and has been shown to have beneficial effects on the germination and emergence of many species (Parera and Cantliffe, 1994). Therefore, it is a general method used by the seed industry to break dormancy and to gain uniform germination. However, priming negatively affects seed longevity as shown in many species, such as lettuce (Tarquis and Bradford, 1992), pea (Sivritepe and Dourado, 1995) and corn (Chiu et al., 2002).
In this thesis we discovered several parental environments that affect seed dormancy and longevity in opposing ways. I.e. low light intensity, low nitrate and low temperature increased seed dormancy and decreased seed longevity and, conversely, high light intensity, high nitrate and high temperature decreased seed dormancy and increased seed longevity (Chapter 3) (Fig. 1). Especially this last combination (low dormancy, high longevity) is a desired combination for the seed industry. The fact that

138
Chapter 6
this combination of traits can be obtained by the seed maturation environment has important implications and potentially bypasses the need for priming. However, before this knowledge can be widely used, environments that help to prolong seed longevity with shortened dormancy release periods should be further studied and verified in crops.
Moreover, field-grown crops experience unpredictable environments. The present study provides knowledge on how environments affect seed quality and therefore provides opportunities for predicting seed performance to a certain extent. Such information is useful to decide on the post-harvesting treatment of seeds, for instance the extent and type of priming and seed coating.
Another finding that has potential for use in crops is the observation that higher galactinol levels correlate with better seed longevity (Chapter 4). If this correlation could be confirmed in a variety of crops, galactinol could serve as a potential bio-marker for seed longevity. The first analyses in crops seeds are now being performed. If successful, seed longevity might be predictable after harvest by measuring galactinol content, and increase the efficiency of determining seed longevity.
Concluding remarksThe study described in this thesis shows that by combining genetic analyses and
“omics” approaches insight can be obtained in how seed performance is affected by the seed maturation environment, both in the long term (adaptation) and in the short term (acclimation). This information helps us to gain more knowledge on the regulation of these processes but is also of great value for the seed industry to improve desirable traits by optimising seed maturation environments as well as predicting seed performance based on the actual seed maturation environments.

References

140
References
Acharjee A, Kloosterman B, de Vos RCH, Werij JS, Bachem CWB, Visser RGF, Maliepaard C (2011) Data integration and network reconstruction with similar to ~omics data using Random Forest regression in potato. Anal Chim Acta 705: 56-63
Albersheim P, Darvill A, Roberts K, Sederoff R, Staehelin A (2010) Plant cell walls: from chemistry to biology. Garland Science, Taylor and Francis Group, LLC, New York
Alboresi A, Gestin C, Leydecker MT, Bedu M, Meyer C, Truong HN (2005) Nitrate, a signal relieving seed dormancy in Arabidopsis. Plant Cell Environ 28: 500-512
Ali-Rachedi S, Bouinot D, Wagner MH, Bonnet M, Sotta B, Grappin P, Jullien M (2004) Changes in endogenous abscisic acid levels during dormancy release and maintenance of mature seeds: studies with the Cape Verde Islands ecotype, the dormant model of Arabidopsis thaliana. Planta 219: 479-488
Almaas E, Oltvai ZN, Barabasi AL (2005) The activity reaction core and plasticity of metabolic networks. PloS Comput Biol 1: 557-563
Alonso-Blanco C, Bentsink L, Hanhart CJ, Blankestijn-de Vries H, Koornneef M (2003) Analysis of natural allelic variation at seed dormancy loci of Arabidopsis thaliana. Genetics 164: 711-729
Alonso-Blanco C, El-Assal SED, Coupland G, Koornneef M (1998) Analysis of natural allelic variation at flowering time loci in the Landsberg erecta and Cape Verde islands ecotypes of Arabidopsis thaliana. Genetics 149: 749-764
Alonso JM, Stepanova AN, Leisse TJ, Kim CJ, Chen H, Shinn P, Stevenson DK, Zimmerman J, Barajas P, Cheuk R, Gadrinab C, Heller C, Jeske A, Koesema E, Meyers CC, Parker H, Prednis L, Ansari Y, Choy N, Deen H, Geralt M, Hazari N, Hom E, Karnes M, Mulholland C, Ndubaku R, Schmidt I, Guzman P, Aguilar-Henonin L, Schmid M, Weigel D, Carter DE, Marchand T, Risseeuw E, Brogden D, Zeko A, Crosby WL, Berry CC, Ecker JR (2003) Genome-wide insertional mutagenesis of Arabidopsis thaliana. Science 301: 653-657
Angelovici R, Fait A, Zhu XH, Szymanski J, Feldmesser E, Fernie AR, Galili G (2009) Deciphering transcriptional and metabolic networks associated with lysine metabolism during arabidopsis seed development. Plant Physiol 151: 2058-2072
Angelovici R, Galili G, Fernie AR, Fait A (2010) Seed desiccation: a bridge between maturation and germination. Trends Plant Sci 15: 211-218
Aranzana MJ, Kim S, Zhao K, Bakker E, Horton M, Jakob K, Lister C, Molitor J, Shindo C, Tang C, Toomajian C, Traw B, Zheng H, Bergelson J, Dean C, Marjoram P, Nordborg M (2005) Genome-wide association mapping in Arabidopsis identifies previously known flowering time and pathogen resistance genes. PLoS Genet 1: e60
Arc E, Galland M, Cueff G, Godin B, Lounifi I, Job D, Rajjou L (2011) Reboot the system thanks to protein post-translational modifications and proteome diversity:

141
References
how quiescent seeds restart their metabolism to prepare seedling establishment. Proteomics 11: 1606-1618
Ashburner M, Ball CA, Blake JA, Botstein D, Butler H, Cherry JM, Davis AP, Dolinski K, Dwight SS, Eppig JT, Harris MA, Hill DP, Issel-Tarver L, Kasarskis A, Lewis S, Matese JC, Richardson JE, Ringwald M, Rubin GM, Sherlock G, Consortium GO (2000) Gene ontology: tool for the unification of biology. Nat Genet 25: 25-29
Atkins CA, Pate JS, Sharkey PJ (1975) Asparagine metabolism—key to the nitrogen nutrition of developing legume seeds. Plant Physiol 56: 807-812
Atwell S, Huang YS, Vilhjalmsson BJ, Willems G, Horton M, Li Y, Meng D, Platt A, Tarone AM, Hu TT, Jiang R, Muliyati NW, Zhang X, Amer MA, Baxter I, Brachi B, Chory J, Dean C, Debieu M, de Meaux J, Ecker JR, Faure N, Kniskern JM, Jones JD, Michael T, Nemri A, Roux F, Salt DE, Tang C, Todesco M, Traw MB, Weigel D, Marjoram P, Borevitz JO, Bergelson J, Nordborg M (2010) Genome-wide association study of 107 phenotypes in Arabidopsis thaliana inbred lines. Nature 465: 627-631
Baerenfaller K, Grossmann J, Grobei MA, Hull R, Hirsch-Hoffmann M, Yalovsky S, Zimmermann P, Grossniklaus U, Gruissem W, Baginsky S (2008) Genome-scale proteomics reveals Arabidopsis thaliana gene models and proteome dynamics. Science 320: 938-941
Banfield MJ, Brady RL (2000) The structure of Antirrhinum centroradialis protein (CEN) suggests a role as a kinase regulator. J Mol Biol 297: 1159-1170
Barazani O, Quaye M, Ohali S, Barzilai M, Kigel J (2012) Photo-thermal regulation of seed germination in natural populations of Eruca sativa Miller (Brassicaceae). J Arid Environ 85: 93-96
Bassel GW, Gaudinier A, Brady SM, Hennig L, Rhee SY, De Smet I (2012) Systems analysis of plant functional, transcriptional, physical interaction, and metabolic networks. Plant Cell 24: 3859-3875
Bassel GW, Lan H, Glaab E, Gibbs DJ, Gerjets T, Krasnogor N, Bonner AJ, Holdsworth MJ, Provart NJ (2011) Genome-wide network model capturing seed germination reveals coordinated regulation of plant cellular phase transitions. Proc Natl Acad Sci USA 108: 9709-9714
Batak I, Devic M, Giba Z, Grubisic D, Poff KL, Konjevic R (2002) The effects of potassium nitrate and NO-donors on phytochrome A- and phytochrome B-specific induced germination of Arabidopsis thaliana seeds. Seed Sci Res 12: 253-259
Baud S, Boutin JP, Miquel M, Lepiniec L, Rochat C (2002) An integrated overview of seed development in Arabidopsis thaliana ecotype WS. Plant Physiol Bioch 40:

142
References
151-160
Baud S, Lepiniec L (2010) Physiological and developmental regulation of seed oil production. Prog Lipid Res 49: 235-249
Baumbusch LO, Hughes DW, Galau GA, Jakobsen KS (2004) LEC1, FUS3, ABI3 and Em expression reveals no correlation with dormancy in Arabidopsis. J Exp Bot 55: 77-87
Baxter I, Brazelton JN, Yu DN, Huang YS, Lahner B, Yakubova E, Li Y, Bergelson J, Borevitz JO, Nordborg M, Vitek O, Salt DE (2010) A coastal cline in sodium accumulation in Arabidopsis thaliana is driven by natural variation of the sodium transporter AtHKT1;1. Plos Genet 6
Belmonte MF, Kirkbride RC, Stone SL, Pelletier JM, Bui AQ, Yeung EC, Hashimoto M, Fei J, Harada M, Munoz MD, Le BH, Drews GN, Brady SM, Goldberg RB, Harada JJ (2013) Comprehensive developmental profiles of gene activity in regions and subregions of the Arabidopsis seed. Proc Natl Acad Sci USA 110: E435-E444
Benjamini Y, Hochberg Y (1995) Controlling the false discovery rate: a practical and powerful approach to multiple testing. J Roy Stat Soc B Met 57: 289-300
Bensmihen S, Rippa S, Lambert G, Jublot D, Pautot V, Granier F, Giraudat J, Parcy F (2002) The homologous ABI5 and EEL transcription factors function antagonistically to fine-tune gene expression during late embryogenesis. Plant Cell 14: 1391-1403
Bentsink L (2002) Genetic analysis of seed dormancy and seed composition in Arabidopsis thaliana using natural variation. PhD Thesis. Wageningen University, Wageningen
Bentsink L, Hanson J, Hanhart CJ, Blankestijn-de Vries H, Coltrane C, Keizer P, El-Lithy M, Alonso-Blanco C, de Andres MT, Reymond M, van Eeuwijk F, Smeekens S, Koornneef M (2010) Natural variation for seed dormancy in Arabidopsis is regulated by additive genetic and molecular pathways. Proc Natl Acad Sci USA 107: 4264-4269
Bentsink L, Jowett J, Hanhart CJ, Koornneef M (2006) Cloning of DOG1, a quantitative trait locus controlling seed dormancy in Arabidopsis. Proc Natl Acad Sci USA 103: 17042-17047
Bentsink L, Yuan K, Koornneef M, Vreugdenhil D (2003) The genetics of phytate and phosphate accumulation in seeds and leaves of Arabidopsis thaliana, using natural variation. Theor Appl Genet 106: 1234-1243
Bergelson J, Roux F (2010) Towards identifying genes underlying ecologically relevant traits in Arabidopsis thaliana. Nat Rev Genet 11: 867-879
Bernal-Lugo I, Leopold A (1995) Seed stability during storage: raffinose content and seed glassy state. Seed Sci Res 5: 75-80

143
References
Bettey M, Finch-Savage WE, King GJ, Lynn JR (2000) Quantitative genetic analysis of seed vigour and pre-emergence seedling growth traits in Brassica oleracea. New Phytol 148: 277-286
Bewley JD (1997) Seed germination and dormancy. Plant Cell 9: 1055
Bewley JD, Hilhorst HWM, Bradford KJ, Nonogaki H (2013) Seeds: Physiology of development, germination and dormancy, Ed 3rd. Springer, New York Heidelberg Dordrecht London
Biddulph TB, Plummer JA, Setter TL, Mares DJ (2007) Influence of high temperature and terminal moisture stress on dormancy in wheat (Triticum aestivum L.). Field Crops Res 103: 139-153
Bino RJ, Hall RD, Fiehn O, Kopka J, Saito K, Draper J, Nikolau BJ, Mendes P, Roessner-Tunali U, Beale MH, Trethewey RN, Lange BM, Wurtele ES, Sumner LW (2004) Potential of metabolomics as a functional genomics tool. Trends Plant Sci 9: 418-425
Bolouri-Moghaddam MR, Le Roy K, Xiang L, Rolland F, Van den Ende W (2010) Sugar signalling and antioxidant network connections in plant cells. Febs J 277: 2022-2037
Borner GHH, Lilley KS, Stevens TJ, Dupree P (2003) Identification of glycosylphosphatidylinositol-anchored proteins in Arabidopsis. A proteomic and genomic analysis. Plant Physiol 132: 568-577
Brachi B, Faure N, Horton M, Flahauw E, Vazquez A, Nordborg M, Bergelson J, Cuguen J, Roux F (2010) Linkage and association mapping of Arabidopsis thaliana flowering time in nature. PLoS Genet 6: e1000940
Braybrook SA, Harada JJ (2008) LECs go crazy in embryo development. Trends Plant Sci 13: 624-630
Braybrook SA, Stone SL, Park S, Bui AQ, Le BH, Fischer RL, Goldberg RB, Harada JJ (2006) Genes directly regulated by LEAFY COTYLEDON2 provide insight into the control of embryo maturation and somatic embryogenesis. Proc Natl Acad Sci USA 103: 3468-3473
Cadman CS, Toorop PE, Hilhorst HW, Finch-Savage WE (2006) Gene expression profiles of Arabidopsis Cvi seeds during dormancy cycling indicate a common underlying dormancy control mechanism. Plant J 46: 805-822
Carrari F, Baxter C, Usadel B, Urbanczyk-Wochniak E, Zanor MI, Nunes-Nesi A, Nikiforova V, Centero D, Ratzka A, Pauly M, Sweetlove LJ, Fernie AR (2006) Integrated analysis of metabolite and transcript levels reveals the metabolic shifts that underlie tomato fruit development and highlight regulatory aspects of metabolic network behavior. Plant Physiol 142: 1380-1396

144
References
Carreno-Quintero N, Acharjee A, Maliepaard C, Bachem CW, Mumm R, Bouwmeester H, Visser RG, Keurentjes JJ (2012) Untargeted metabolic quantitative trait loci analyses reveal a relationship between primary metabolism and potato tuber quality. Plant Physiol 158: 1306-1318
Carrera E, Holman T, Medhurst A, Dietrich D, Footitt S, Theodoulou FL, Holdsworth MJ (2008) Seed after-ripening is a discrete developmental pathway associated with specific gene networks in Arabidopsis. Plant J 53: 214-224
Casal JJ, Sanchez RA, Botto JF (1998) Modes of action of phytochromes. J Exp Bot 49: 127-138
Castillo EM, Delumen BO, Reyes PS, Delumen HZ (1990) Raffinose synthase and galactinol synthase in developing seeds and leaves of legumes. J Agr Food Chem 38: 351-355
Chan EK, Rowe HC, Corwin JA, Joseph B, Kliebenstein DJ (2011) Combining genome-wide association mapping and transcriptional networks to identify novel genes controlling glucosinolates in Arabidopsis thaliana. PLoS Biol 9: e1001125
Che P, Lall S, Nettleton D, Howell SH (2006) Gene expression programs during shoot, root, and callus development in Arabidopsis tissue culture. Plant Physiol 141: 620-637
Chia TYP, Pike MJ, Rawsthorne S (2005) Storage oil breakdown during embryo development of Brassica napus (L.). J Exp Bot 56: 1285-1296
Chiang GC, Bartsch M, Barua D, Nakabayashi K, Debieu M, Kronholm I, Koornneef M, Soppe WJ, Donohue K, De Meaux J (2011) DOG1 expression is predicted by the seed-maturation environment and contributes to geographical variation in germination in Arabidopsis thaliana. Mol Ecol 20: 3336-3349
Chiang GC, Barua D, Kramer EM, Amasino RM, Donohue K (2009) Major flowering time gene, FLOWERING LOCUS C, regulates seed germination in Arabidopsis thaliana. Proc Natl Acad Sci USA 106: 11661-11666
Chibani K, Ali-Rachedi S, Job C, Job D, Jullien M, Grappin P (2006) Proteomic analysis of seed dormancy in Arabidopsis. Plant Physiol 142: 1493-1510
Chiu K, Chen C, Sung J (2002) Effect of priming temperature on storability of primed sweet corn seed. Crop Sci 42: 1996-2003
Chiu RS, Nahal H, Provart NJ, Gazzarrini S (2012) The role of the Arabidopsis FUSCA3 transcription factor during inhibition of seed germination at high temperature. BMC Plant Biol 12
Cho SK, Ryu MY, Seo DH, Kang BG, Kim WT (2011) The Arabidopsis RING E3 ubiquitin ligase AtAIRP2 plays combinatory roles with AtAIRP1 in abscisic acid-mediated drought stress responses. Plant Physiol 157: 2240-2257
145
References
Clerkx EJM, Blankestijn-De Vries H, Ruys GJ, Groot SPC, Koornneef M (2003) Characterization of green seed, an enhancer of abi3-1 in Arabidopsis that affects seed longevity. Plant Physiol 132: 1077-1084
Clerkx EJM, Blankestijn-De Vries H, Ruys GJ, Groot SPC, Koornneef M (2004) Genetic differences in seed longevity of various Arabidopsis mutants. Physiol Plantarum 121: 448-461
Clerkx EJM, El-Lithy ME, Vierling E, Ruys GJ, Blankestijin-De Vries H, Groot SPC, Vreugdenhil D, Koornneef M (2004) Analysis of natural allelic variation of Arabidopsis seed germination and seed longevity traits between the accessions Landsberg erecta and Shakdara, using a new recombinant inbred line population. Plant Physiol 135: 432-443
Contreras S, Bennett MA, Metzger JD, Tay D (2008) Maternal light environment during seed development affects lettuce seed weight, germinability, and storability. Hortscience 43: 845-852
Contreras S, Bennett MA, Tay D (2009) Temperature during seed development affects weight, germinability and storability of lettuce seeds. Seed Sci Technol 37: 398-412
Cook D, Fowler S, Fiehn O, Thomashow MF (2004) A prominent role for the CBF cold response pathway in configuring the low-temperature metabolome of Arabidopsis. Proc Natl Acad Sci USA 101: 15243-15248
Cosgrove DJ (2000) Loosening of plant cell walls by expansins. Nature 407: 321-326
Cutler S, Ghassemian M, Bonetta D, Cooney S, McCourt P (1996) A protein farnesyl transferase involved in abscisic acid signal transduction in Arabidopsis. Science 273: 1239-1241
Czechowski T, Bari RP, Stitt M, Scheible WR, Udvardi MK (2004) Real-time RT-PCR profiling of over 1400 Arabidopsis transcription factors: unprecedented sensitivity reveals novel root- and shoot-specific genes. Plant J 38: 366-379
Dai MH, Wang PL, Boyd AD, Kostov G, Athey B, Jones EG, Bunney WE, Myers RM, Speed TP, Akil H, Watson SJ, Meng F (2005) Evolving gene/transcript definitions significantly alter the interpretation of GeneChip data. Nucleic Acids Res 33
Davière J-M, de Lucas M, Prat S (2008) Transcriptional factor interaction: a central step in DELLA function. Curr Opin Genet Dev 18: 295-303
Debieu M, Tang C, Stich B, Sikosek T, Effgen S, Josephs E, Schmitt J, Nordborg M, Koornneef M, de Meaux J (2013) Co-variation between seed dormancy, growth rate and flowering time changes with latitude in Arabidopsis thaliana. PLoS One 8: e61075
Dekkers BJ, Pearce S, van Bolderen-Veldkamp RP, Marshall A, Widera P, Gilbert J, Drost HG, Bassel GW, Muller K, King JR, Wood AT, Grosse I, Quint M,

146
References
Krasnogor N, Leubner-Metzger G, Holdsworth MJ, Bentsink L (2013) Transcriptional dynamics of two seed compartments with opposing roles in arabidopsis seed germination. Plant Physiol 163: 205-215
Dekkers BJ, Schuurmans JA, Smeekens SC (2008) Interaction between sugar and abscisic acid signalling during early seedling development in Arabidopsis. Plant Mol Biol 67: 151-167
Dekkers BJ, Willems L, Bassel GW, van Bolderen-Veldkamp RP, Ligterink W, Hilhorst HW, Bentsink L (2012) Identification of reference genes for RT-qPCR expression analysis in Arabidopsis and tomato seeds. Plant Cell Physiol 53: 28-37
Dick CF, Dos-Santos AL, Meyer-Fernandes JR (2011) Inorganic phosphate as an important regulator of phosphatases. Enzyme Res 103980: 28
Donohue K (2009) Completing the cycle: maternal effects as the missing link in plant life histories. Phil. Trans. R. Soc. B 364: 1059-1074
Donohue K, Dorn L, Griffith C, Kim E, Aguilera A, Polisetty CR, Schmitt J (2005) Environmental and genetic influences on the germination of Arabidopsis thaliana in the field. Evolution 59: 740-757
Donohue K, Dorn L, Griffith C, Kim E, Aguilera A, Polisetty CR, Schmitt J (2005) The evolutionary ecology of seed germination of Arabidopsis thaliana: variable natural selection on germination timing. Evolution 59: 758-770
Donohue K, Heschel MS, Butler CM, Barua D, Sharrock RA, Whitelam GC, Chiang GCK (2008) Diversification of phytochrome contributions to germination as a function of seed-maturation environment. New Phytol 177: 367-379
Donohue K, Heschel MS, Chiang GC, Butler CM, Barua D (2007) Phytochrome mediates germination responses to multiple seasonal cues. Plant Cell Environ 30: 202-212
Edwards KD, Lynn JR, Gyula P, Nagy F, Millar AJ (2005) Natural allelic variation in the temperature-compensation mechanisms of the Arabidopsis thaliana circadian clock. Genetics 170: 387-400
El-Lithy ME, Bentsink L, Hanhart CJ, Ruys GJ, Rovito D, Broekhof JL, van der Poel HJ, van Eijk MJ, Vreugdenhil D, Koornneef M (2006) New Arabidopsis recombinant inbred line populations genotyped using SNPWave and their use for mapping flowering-time quantitative trait loci. Genetics 172: 1867-1876
Ellis RJ, Vandervies SM (1991) Molecular chaperones. Annu Rev Biochem 60: 321-347
ElSayed AI, Rafudeen MS, Golldack D (2014) Physiological aspects of raffinose family oligosaccharides in plants: protection against abiotic stress. Plant Biol 16: 1-8
Fait A, Angelovici R, Less H, Ohad I, Urbanczyk-Wochniak E, Fernie AR, Galili G (2006) Arabidopsis seed development and germination is associated with temporally distinct metabolic switches. Plant Physiol 142: 839-854
147
References
Fait A, Nesi AN, Angelovici R, Lehmann M, Pham PA, Song LH, Haslam RP, Napier JA, Galili G, Fernie AR (2011) Targeted enhancement of glutamate-to-γ-aminobutyrate conversion in arabidopsis seeds affects carbon-nitrogen balance and storage reserves in a development-dependent manner. Plant Physiol 157: 1026-1042
Fenner M (1991) The effects of the parent environment on seed germinability. Seed Sci Res 1: 75-84
Filiault DL, Maloof JN (2012) A genome-wide association study identifies variants underlying the Arabidopsis thaliana shade avoidance response. PLoS Genet 8
Finch-Savage WE, Cadman CSC, Toorop PE, Lynn JR, Hilhorst HWM (2007) Seed dormancy release in Arabidopsis Cvi by dry after-ripening, low temperature, nitrate and light shows common quantitative patterns of gene expression directed by environmentally specific sensing. Plant J 51: 60-78
Finch-Savage WE, Leubner-Metzger G (2006) Seed dormancy and the control of germination. New Phytol 171: 501-523
Finkelstein R, Reeves W, Ariizumi T, Steber C (2008) Molecular aspects of seed dormancy. Plant Biol 59: 387
Foolad MR, Zhang LP, Subbiah P (2003) Genetics of drought tolerance during seed germination in tomato: Inheritance and QTL mapping. Genome 46: 536-545
Footitt S, Douterelo-Soler I, Clay H, Finch-Savage WE (2011) Dormancy cycling in Arabidopsis seeds is controlled by seasonally distinct hormone-signaling pathways. Proc Natl Acad Sci USA 108: 20236-20241
Forde BG, Lea PJ (2007) Glutamate in plants: metabolism, regulation, and signalling. J Exp Bot 58: 2339-2358
Fournier-Level A, Korte A, Cooper MD, Nordborg M, Schmitt J, Wilczek AM (2011) A map of local adaptation in Arabidopsis thaliana. Science 334: 86-89
Frey A, Effroy D, Lefebvre V, Seo M, Perreau F, Berger A, Sechet J, To A, North HM, Marion-Poll A (2012) Epoxycarotenoid cleavage by NCED5 fine-tunes ABA accumulation and affects seed dormancy and drought tolerance with other NCED family members. Plant J 70: 501-512
Fu J, Keurentjes JJB, Bouwmeester H, America T, Verstappen FWA, Ward JL, Beale MH, de Vos RCH, Dijkstra M, Scheltema RA, Johannes F, Koornneef M, Vreugdenhil D, Breitling R, Jansen RC (2009) System-wide molecular evidence for phenotypic buffering in Arabidopsis. Nat Genet 41: 166-167
Gallardo K, Job C, Groot SPC, Puype M, Demol H, Vandekerckhove J, Job D (2001) Proteomic analysis of Arabidopsis seed germination and priming. Plant Physiol 126: 835-848

148
References
Gan XC, Stegle O, Behr J, Steffen JG, Drewe P, Hildebrand KL, Lyngsoe R, Schultheiss SJ, Osborne EJ, Sreedharan VT, Kahles A, Bohnert R, Jean G, Derwent P, Kersey P, Belfield EJ, Harberd NP, Kemen E, Toomajian C, Kover PX, Clark RM, Ratsch G, Mott R (2011) Multiple reference genomes and transcriptomes for Arabidopsis thaliana. Nature 477: 419-423
Gentleman RC, Carey VJ, Bates DM, Bolstad B, Dettling M, Dudoit S, Ellis B, Gautier L, Ge Y, Gentry J, Hornik K, Hothorn T, Huber W, Iacus S, Irizarry R, Leisch F, Li C, Maechler M, Rossini AJ, Sawitzki G, Smith C, Smyth G, Tierney L, Yang JY, Zhang J (2004) Bioconductor: open software development for computational biology and bioinformatics. Genome Biol 5: R80
Giraudat J, Hauge BM, Valon C, Smalle J, Parcy F, Goodman HM (1992) Isolation of the Arabidopsis ABI3 gene by positional cloning. Plant Cell 4: 1251-1261
Gojon A, Krouk G, Perrine-Walker F, Laugier E (2011) Nitrate transceptor(s) in plants. J Exp Bot 62: 2299-2308
Goldberg RB, Depaiva G, Yadegari R (1994) Plant embryogenesis: zygote to seed. Science 266: 605-614
Gordon SP, Heisler MG, Reddy GV, Ohno C, Das P, Meyerowitz EM (2007) Pattern formation during de novo assembly of the Arabidopsis shoot meristem. Development 134: 3539-3548
Graeber K, Linkies A, Wood ATA, Leubner-Metzger G (2011) A guideline to family-wide comparative state-of-the-art quantitative RT-PCR analysis exemplified with a Brassicaceae cross-species seed germination case study. Plant Cell 23: 2045-2063
Gu XY, Kianian SF, Foley ME (2006) Dormancy genes from weedy rice respond divergently to seed development environments. Genetics 172: 1199-1211
Gubler F, Millar AA, Jacobsen JV (2005) Dormancy release, ABA and pre-harvest sprouting. Curr Opin Plant Biol 8: 183-187
Guo FO, Young J, Crawford NM (2003) The nitrate transporter AtNRT1.1 (CHL1) functions in stomatal opening and contributes to drought susceptibility in arabidopsis. Plant Cell 15: 107-117
Guo FQ, Wang RC, Crawford NM (2002) The Arabidopsis dual-affinity nitrate transporter gene AtNRT1.1 (CHL1) is regulated by auxin in both shoots and roots. J Exp Bot 53: 835-844
Gutteling EW, Doroszuk A, Riksen JAG, Prokop Z, Reszka J, Kammenga JE (2007) Environmental influence on the genetic correlations between life-history traits in Caenorhabditis elegans. Heredity 98: 206-213
Gutterman Y (1974) The influence of the photoperiodic regime and red-far red light treatments of Portulaca oleracea L. plants on the germinability of their seeds.

149
References
Oecologia 17: 27-38
Gutterman Y (2000) Maternal effects on seeds during development. In M Fenner, ed, Seeds: The ecology of regeneration in plant communities, Ed 2nd. CABI Publishing, London, pp 59-84
Guy C, Kaplan F, Kopka J, Selbig J, Hincha DK (2008) Metabolomics of temperature stress. Physiol Plant 132: 220-235
Hancock AM, Brachi B, Faure N, Horton MW, Jarymowycz LB, Sperone FG, Toomajian C, Roux F, Bergelson J (2011) Adaptation to climate across the Arabidopsis thaliana genome. Science 334: 83-86
Hanin N, Quaye M, Westberg E, Barazani O (2013) Soil seed bank and among-years genetic diversity in arid populations of Eruca sativa Miller (Brassicaceae). J Arid Environ 91: 151-154
Hannah MA, Caldana C, Steinhauser D, Balbo I, Fernie AR, Willmitzer L (2010) Combined transcript and metabolite profiling of arabidopsis grown under widely variant growth conditions facilitates the identification of novel metabolite-mediated regulation of gene expression. Plant Physiol 152: 2120-2129
Hausmann NJ, Juenger TE, Sen S, Stowe KA, Dawson TE, Simms EL (2005) Quantitative trait loci affecting δ13c and response to differential water availibility in Arabidopsis thaliana. Evolution 59: 81-96
Heisler MGB, Atkinson A, Bylstra YH, Walsh R, Smyth DR (2001) SPATULA, a gene that controls development of carpel margin tissues in Arabidopsis, encodes a bHLH protein. Development 128: 1089-1098
Hellemans J, Mortier G, De Paepe A, Speleman F, Vandesompele J (2007) qBase relative quantification framework and software for management and automated analysis of real-time quantitative PCR data. Genome Biol 8
Hendricks S, Taylorson R (1974) Promotion of seed germination by nitrate, nitrite, hydroxylamine, and ammonium salts. Plant Physiol 54: 304-309
Hennig L, Stoddart WM, Dieterle M, Whitelam GC, Schafer E (2002) Phytochrome E controls light-induced germination of Arabidopsis. Plant Physiol 128: 194-200
Hernandez-Sebastia C, Marsolais F, Saravitz C, Israel D, Dewey RE, Huber SC (2005) Free amino acid profiles suggest a possible role for asparagine in the control of storage-product accumulation in developing seeds of low- and high-protein soybean lines. J Exp Bot 56: 1951-1963
Heschel MS, Selby J, Butler C, Whitelam GC, Sharrock RA, Donohue K (2007) A new role for phytochromes in temperature-dependent germination. New Phytol 174: 735-741
150
References
Hilhorst HW (1995) A critical update on seed dormancy. I. Primary dormancy. Seed Sci Res 5: 61-73
Hilhorst HW, Karssen CM (1988) Dual effect of light on the gibberellin-and nitrate-stimulated seed germination of Sisymbrium officinale and Arabidopsis thaliana. Plant Physiol 86: 591-597
Hilhorst HWM (2007) Definitions and hypotheses of seed dormancy. In KJ Bradford, H Nonogaki, eds, Annual Plant Reviews: Seed Development, Dormancy and Germination, Vol 27. Blackwell Publishing Ltd, Sheffield, UK., pp 50-71
Hoekstra FA, Golovina EA, Buitink J (2001) Mechanisms of plant desiccation tolerance. Trends Plant Sci 6: 431-438
Holdsworth MJ, Bentsink L, Soppe WJ (2008) Molecular networks regulating Arabidopsis seed maturation, after-ripening, dormancy and germination. New Phytol 179: 33-54
Hollister JD, Smith LM, Guo YL, Ott F, Weigel D, Gaut BS (2011) Transposable elements and small RNAs contribute to gene expression divergence between Arabidopsis thaliana and Arabidopsis lyrata. Proc Natl Acad Sci USA 108: 2322-2327
Huang XQ, Paulo MJ, Boer M, Effgen S, Keizer P, Koornneef M, van Eeuwijk FA (2011) Analysis of natural allelic variation in Arabidopsis using a multiparent recombinant inbred line population. Proc Natl Acad Sci USA 108: 4488-4493
Huang XQ, Schmitt J, Dorn L, Griffith C, Effgen S, Takao S, Koornneef M, Donohue K (2010) The earliest stages of adaptation in an experimental plant population: strong selection on QTLs for seed dormancy. Mol Ecol 19: 1335-1351
Huang Z, Footitt S, Finch-Savage WE (2014) The effect of temperature on reproduction in the summer and winter annual Arabidopsis thaliana ecotypes Bur and Cvi. Ann Bot 113: 921-929
Hurtado PX, Schnabel SK, Zaban A, Vetelainen M, Virtanen E, Eilers PHC, van Eeuwijk FA, Visser RGF, Maliepaard C (2012) Dynamics of senescence-related QTLs in potato. Euphytica 183: 289-302
Irizarry RA, Hobbs B, Collin F, Beazer-Barclay YD, Antonellis KJ, Scherf U, Speed TP (2003) Exploration, normalization, and summaries of high density oligonucleotide array probe level data. Biostatistics 4: 249-264
ISTA (2012) International rules for seed testing. Baaserdorf, Switzerland.: The International Seed Testing Association (ISTA).
Iuchi S, Kobayashi M, Taji T, Naramoto M, Seki M, Kato T, Tabata S, Kakubari Y, Yamaguchi-Shinozaki K, Shinozaki K (2001) Regulation of drought tolerance by gene manipulation of 9-cis-epoxycarotenoid dioxygenase, a key enzyme in abscisic acid biosynthesis in Arabidopsis. Plant J 27: 325-333

151
References
Jia H, McCarty DR, Suzuki M (2013) Distinct roles of LAFL network genes in promoting the embryonic seedling fate in the absence of VAL repression. Plant Physiol 163: 1293-1305
Jia H, Suzuki M, McCarty DR (2014) Regulation of the seed to seedling developmental phase transition by the LAFL and VAL transcription factor networks. Wiley Interdiscip Rev Dev Biol 3: 135-145
Job C, Rajjou L, Lovigny Y, Belghazi M, Job D (2005) Patterns of protein oxidation in Arabidopsis seeds and during germination. Plant Physiol 138: 790-802
Johnson-Flanagan AM, Maret LL, Pomeroy MK (1994) Humidification of green canola seed leads to pigment degradation in the absence of germination. Crop Sci 34: 1618-1623
Joosen RVL (2013) Imaging genetics of seed performance. PhD Thesis. Wageningen University, Wageningen
Joosen RVL, Arends D, Willems LAJ, Ligterink W, Jansen RC, Hilhorst HWM (2012) Visualizing the genetic landscape of Arabidopsis seed performance. Plant Physiol 158: 570-589
Joosen RVL, Kodde J, Willems LAJ, Ligterink W, van der Plas LHW, Hilhorst HWM (2010) GERMINATOR: a software package for high-throughput scoring and curve fitting of Arabidopsis seed germination. Plant J 62: 148-159
Joosen RVL, Ligterink W, Dekkers BJW, Hilhorst HWM (2011) Visualization of molecular processes associated with seed dormancy and germination using MapMan. Seed Sci Res 21: 143-152
Kagaya Y, Toyoshima R, Okuda R, Usui H, Yamamoto A, Hattori T (2005) LEAFY COTYLEDON1 controls seed storage protein genes through its regulation of FUSCA3 and ABSCISIC ACID INSENSITIVE3. Plant Cell Physiol 46: 399-406
Kang HM, Zaitlen NA, Wade CM, Kirby A, Heckerman D, Daly MJ, Eskin E (2008) Efficient control of population structure in model organism association mapping. Genetics 178: 1709-1723
Kanno Y, Hanada A, Chiba Y, Ichikawa T, Nakazawa M, Matsui M, Koshiba T, Kamiya Y, Seo M (2012) Identification of an abscisic acid transporter by functional screening using the receptor complex as a sensor. Proc Natl Acad Sci USA 109: 9653-9658
Karssen CM, Brinkhorstvanderswan DLC, Breekland AE, Koornneef M (1983) Induction of dormancy during seed development by endogenous abscisic acid: studies on abscisic acid deficient genotypes of Arabidopsis thaliana (L) Heynh. Planta 157: 158-165
Kazmi RH, Khan N, Willems LAJ, Van Heusden AW, Ligterink W, Hilhorst HWM

152
References
(2012) Complex genetics controls natural variation among seed quality phenotypes in a recombinant inbred population of an interspecific cross between Solanum lycopersicum x Solanum pimpinellifolium. Plant Cell Environ 35: 929-951
Keegstra K (2010) Plant cell walls. Plant Physiol 154: 483-486
Kendall SL, Hellwege A, Marriot P, Whalley C, Graham IA, Penfield S (2011) Induction of dormancy in Arabidopsis summer annuals requires parallel regulation of DOG1 and hormone metabolism by low temperature and CBF transcription factors. Plant Cell 23: 2568-2580
Kendall SL, Penfield S (2012) Maternal and zygotic temperature signalling in the control of seed dormancy and germination. Seed Sci Res 22: S23-S29
Kermode AR (2005) Role of abscisic acid in seed dormancy. J Plant Growth Regul 24: 319-344
Kesseler R, Stuppy W (2006) Seeds: time capsules of life. Papadakis Publisher, London
Keurentjes JJB, Bentsink L, Alonso-Blanco C, Hanhart CJ, Vries HBD, Effgen S, Vreugdenhil D, Koornneef M (2007) Development of a near-isogenic line population of Arabidopsis thaliana and comparison of mapping power with a recombinant inbred line population. Genetics 175: 891-905
Kigel J, Gibly A, Negbi M (1979) Seed germination in Amaranthus retroflexus L. as affected by the photoperiod and age during flower induction of the parent plants. J Exp Bot 30: 997-1002
Kim JS, Mizoi J, Kidokoro S, Maruyama K, Nakajima J, Nakashima K, Mitsuda N, Takiguchi Y, Ohme-Takagi M, Kondou Y, Yoshizumi T, Matsui M, Shinozaki K, Yamaguchi-Shinozaki K (2012) Arabidopsis GROWTH-REGULATING FACTOR7 functions as a transcriptional repressor of abscisic acid- and osmotic stress-responsive genes, including DREB2A. Plant Cell 24: 3393-3405
Kim S-G, Kim S-Y, Park C-M (2007) A membrane-associated NAC transcription factor regulates salt-responsive flowering via FLOWERING LOCUS T in Arabidopsis. Planta 226: 647-654
Kim S-G, Lee AK, Yoon H-K, Park C-M (2008) A membrane-bound NAC transcription factor NTL8 regulates gibberellic acid-mediated salt signaling in Arabidopsis seed germination. Plant J 55: 77-88
Kim S-Y, Kim S-G, Kim Y-S, Seo PJ, Bae M, Yoon H-K, Park C-M (2007) Exploring membrane-associated NAC transcription factors in Arabidopsis: Implications for membrane biology in genome regulation. Nucleic Acids Res 35: 203-213
Kim Y-S, Kim S-G, Park J-E, Park H-Y, Lim M-H, Chua N-H, Park C-M (2006) A membrane-bound NAC transcription factor regulates cell division in Arabidopsis. Plant Cell 18: 3132-3144

153
References
Kobayashi Y, Kaya H, Goto K, Iwabuchi M, Araki T (1999) A pair of related genes with antagonistic roles in mediating flowering signals. Science 286: 1960-1962
Koornneef M, Alonso-Blanco C, Vreugdenhil D (2004) Naturally occurring genetic variation in Arabidopsis thaliana. Annu Rev Plant Biol 55: 141-172
Koornneef M, Bentsink L, Hilhorst H (2002) Seed dormancy and germination. Curr Opin Plant Biol 5: 33-36
Koornneef M, Hanhart CJ, Hilhorst HWM, Karssen CM (1989) Invivo inhibition of seed development and reserve protein accumulation in recombinants of abscisic-acid biosynthesis and responsiveness mutants in Arabidopsis thaliana. Plant Physiol 90: 463-469
Koornneef M, Jorna ML, Derswan DLCB, Karssen CM (1982) The isolation of abscisic acid (ABA) deficient mutants by selection of induced revertants in non-germinating gibberellin sensitive lines of Arabidopsis thaliana (L) Heynh. Theor Appl Genet 61: 385-393
Koornneef M, Reuling G, Karssen CM (1984) The isolation and characterization of abscisic acid-insensitive mutants of Arabidopsis thaliana. Physiol Plantarum 61: 377-383
Korte A, Farlow A (2013) The advantages and limitations of trait analysis with GWAS: a review. Plant Methods 9: 29
Kroj T, Savino G, Valon C, Giraudat J, Parcy F (2003) Regulation of storage protein gene expression in Arabidopsis. Development 130: 6065-6073
Kronholm I, Pico FX, Alonso-Blanco C, Goudet J, Meaux JD (2012) Genetic basis of adaptation in Arabidopsis thaliana: Local adaptation at the seed dormancy QTL DOG1. Evolution 66: 2287-2302
Krouk G, Lacombe B, Bielach A, Perrine-Walker F, Malinska K, Mounier E, Hoyerova K, Tillard P, Leon S, Ljung K, Zazimalova E, Benkova E, Nacry P, Gojon A (2010) Nitrate-regulated auxin transport by NRT1.1 defines a mechanism for nutrient sensing in plants. Dev Cell 18: 927-937
Kruijer W, Boer M, Malosetti M, Flood PJ, Engel B, Kooke R, Keurentjes J, van Eeuwijk F (Submitted) Marker-based estimation of heritability in Arabidopsis thaliana, with applications to GWAS and genomic prediction.
Kuersten S, Goodwin EB (2003) The power of the 3’UTR: translational control and development. Nat Rev Genet 4: 626-637
Kushiro T, Okamoto M, Nakabayashi K, Yamagishi K, Kitamura S, Asami T, Hirai N, Koshiba T, Kamiya Y, Nambara E (2004) The Arabidopsis cytochrome P450 CYP707A encodes ABA 8’-hydroxylases: key enzymes in ABA catabolism. Embo Journal 23: 1647-1656
Kwong RW, Bui AQ, Lee H, Kwong LW, Fischer RL, Goldberg RB, Harada JJ (2003)

154
References
LEAFY COTYLEDON1-LIKE defines a class of regulators essential for embryo development. Plant Cell 15: 5-18
Laserna MP, Sánchez RA, Botto JF (2008) Light-related loci controlling seed germination in Ler × Cvi and Bay-0 × Sha recombinant inbred-line populations of Arabidopsis thaliana. Ann Bot 102: 631-642
Lee KJ, Dekkers BJ, Steinbrecher T, Walsh CT, Bacic A, Bentsink L, Leubner-Metzger G, Knox JP (2012) Distinct cell wall architectures in seed endosperms in representatives of the Brassicaceae and Solanaceae. Plant Physiol 160: 1551-1566
Lefebvre V, North H, Frey A, Sotta B, Seo M, Okamoto M, Nambara E, Marion-Poll A (2006) Functional analysis of Arabidopsis NCED6 and NCED9 genes indicates that ABA synthesized in the endosperm is involved in the induction of seed dormancy. Plant J 45: 309-319
Leubner-Metzger G (2005) Beta-1,3-glucanase gene expression in low-hydrated seeds as a mechanism for dormancy release during tobacco after-ripening. Plant J 41: 133-145
Lewontin RC (1965) Selection for colonizing ability. Academic Press, New York, New York, USA
Li P, Wind JJ, Shi X, Zhang H, Hanson J, Smeekens SC, Teng S (2011) Fructose sensitivity is suppressed in Arabidopsis by the transcription factor ANAC089 lacking the membrane-bound domain. Proc Natl Acad Sci USA 108: 3436-3441
Li P, Zhou H, Shi X, Yu B, Zhou Y, Chen S, Wang Y, Peng Y, Meyer RC, Smeekens SC, Teng S (2014) The ABI4-Induced Arabidopsis ANAC060 transcription factor attenuates ABA signaling and renders seedlings sugar insensitive when present in the nucleus. PLoS Genet 10: e1004213
Li Y, Huang Y, Bergelson J, Nordborg M, Borevitz JO (2010) Association mapping of local climate-sensitive quantitative trait loci in Arabidopsis thaliana. Proc Natl Acad Sci USA 107: 21199-21204
Linkies A, Leubner-Metzger G (2012) Beyond gibberellins and abscisic acid: how ethylene and jasmonates control seed germination. Plant Cell Rep 31: 253-270
Lisec J, Schauer N, Kopka J, Willmitzer L, Fernie AR (2006) Gas chromatography mass spectrometry-based metabolite profiling in plants. Nat Protoc 1: 387-396
Liu KH, Huang CY, Tsay YF (1999) CHL1 is a dual-affinity nitrate transporter of Arabidopsis involved in multiple phases of nitrate uptake. Plant Cell 11: 865-874
Liu PP, Montgomery TA, Fahlgren N, Kasschau KD, Nonogaki H, Carrington JC (2007) Repression of AUXIN RESPONSE FACTOR10 by microRNA160 is critical for seed germination and post-germination stages. Plant J 52: 133-146
Liu Y, Shi L, Ye N, Liu R, Jia W, Zhang J (2009) Nitric oxide-induced rapid decrease of abscisic acid concentration is required in breaking seed dormancy in Arabidopsis.
155
References
New Phytol 183: 1030-1042
Liu Y, Ye N, Liu R, Chen M, Zhang J (2010) H2O2 mediates the regulation of ABA catabolism and GA biosynthesis in Arabidopsis seed dormancy and germination. J Exp Bot 61: 2979-2990
Lommen A (2009) MetAlign: Interface-driven, versatile metabolomics tool for hyphenated full-scan mass spectrometry data preprocessing. Anal Chem 81: 3079-3086
Lotan T, Ohto M-a, Yee KM, West MA, Lo R, Kwong RW, Yamagishi K, Fischer RL, Goldberg RB, Harada JJ (1998) Arabidopsis LEAFY COTYLEDON1 is sufficient to induce embryo development in vegetative cells. Cell 93: 1195-1205
Loudet O, Chaillou S, Camilleri C, Bouchez D, Daniel-Vedele F (2002) Bay-0 x Shahdara recombinant inbred line population: a powerful tool for the genetic dissection of complex traits in Arabidopsis. Theor Appl Genet 104: 1173-1184
Luerssen K, Kirik V, Herrmann P, Misera S (1998) FUSCA3 encodes a protein with a conserved VP1/ABI3-like B3 domain which is of functional importance for the regulation of seed maturation in Arabidopsis thaliana. Plant J 15: 755-764
Lumba S, Tsuchiya Y, Delmas F, Hezky J, Provart NJ, Lu QS, McCourt P, Gazzarrini S (2012) The embryonic leaf identity gene FUSCA3 regulates vegetative phase transitions by negatively modulating ethylene-regulated gene expression in Arabidopsis. BMC Biol 10
Ma Y, Szostkiewicz I, Korte A, Moes D, Yang Y, Christmann A, Grill E (2009) Regulators of PP2C phosphatase activity function as abscisic acid sensors. Science 324: 1064-1068
Matakiadis T, Alboresi A, Jikumaru Y, Tatematsu K, Pichon O, Renou JP, Kamiya Y, Nambara E, Truong HN (2009) The Arabidopsis abscisic acid catabolic gene CYP707A2 plays a key role in nitrate control of seed dormancy. Plant Physiol 149: 949-960
Matilla A, Matilla-Vázquez M (2008) Involvement of ethylene in seed physiology. Plant Sci 175: 87-97
Meijón M, Satbhai SB, Tsuchimatsu T, Busch W (2014) Genome-wide association study using cellular traits identifies a new regulator of root development in Arabidopsis. Nat Genet 46: 77-81
Meinke DW (1994) Seed development in Arabidopsis thaliana. Cold Spring Harbor Monograph Archive 27: 253-295
Meinke DW, Franzmann LH, Nickle TC, Yeung EC (1994) Leafy cotyledon mutants of Arabidopsis. Plant Cell 6: 1049-1064
Meraviglia G, Romani G, Beffagna N (1996) The chl1 Arabidopsis mutant impaired in the nitrate-inducible NO3- transporter has an acidic intracellular pH in the absence of

156
References
nitrate. J Plant Physiol 149: 307-310
Miflin BJ, Habash DZ (2002) The role of glutamine synthetase and glutamate dehydrogenase in nitrogen assimilation and possibilities for improvement in the nitrogen utilization of crops. J Exp Bot 53: 979-987
Mishra Y, Jankanpaa HJ, Kiss AZ, Funk C, Schroder WP, Jansson S (2012) Arabidopsis plants grown in the field and climate chambers significantly differ in leaf morphology and photosystem components. BMC Plant Biol 12: 1-18
Mitchell-Olds T (2001) Arabidopsis thaliana and its wild relatives: a model system for ecology and evolution. Trends Ecol Evol 16: 693-700
Mitchell-Olds T, Schmitt J (2006) Genetic mechanisms and evolutionary significance of natural variation in Arabidopsis. Nature 441: 947-952
Mitchell-Olds T, Willis JH, Goldstein DB (2007) Which evolutionary processes influence natural genetic variation for phenotypic traits? Nat Rev Genet 8: 845-856
Miura K, Lee J, Jin JB, Yoo CY, Miura T, Hasegawa PM (2009) Sumoylation of ABI5 by the Arabidopsis SUMO E3 ligase SIZ1 negatively regulates abscisic acid signaling. Proc Natl Acad Sci USA 106: 5418-5423
Monke G, Seifert M, Keilwagen J, Mohr M, Grosse I, Hahnel U, Junker A, Weisshaar B, Conrad U, Baumlein H, Altschmied L (2012) Toward the identification and regulation of the Arabidopsis thaliana ABI3 regulon. Nucleic Acids Res 40: 8240-8254
Munir J, Dorn LA, Donohue K, Schmitt J (2001) The effect of maternal photoperiod on seasonal dormancy in Arabidopsis thaliana (Brassicaceae). Am J Bot 88: 1240-1249
Mutwil M, Usadel B, Schutte M, Loraine A, Ebenhoh O, Persson S (2010) Assembly of an interactive correlation network for the arabidopsis genome using a novel heuristic clustering algorithm. Plant Physiol 152: 29-43
Nakabayashi K, Bartsch M, Xiang Y, Miatton E, Pellengahr S, Yano R, Seo M, Soppe WJ (2012) The time required for dormancy release in arabidopsis is determined by DELAY OF GERMINATION1 protein levels in freshly harvested seeds. Plant Cell 24: 2826-2838
Nakajima S, Ito H, Tanaka R, Tanaka A (2012) Chlorophyll b reductase plays an essential role in maturation and storability of arabidopsis seeds. Plant Physiol 160: 261-273
Nakamura S, Abe F, Kawahigashi H, Nakazono K, Tagiri A, Matsumoto T, Utsugi S, Ogawa T, Handa H, Ishida H, Mori M, Kawaura K, Ogihara Y, Miura H (2011) A wheat homolog of MOTHER OF FT AND TFL1 acts in the regulation of germination. Plant Cell 23: 3215-3229
Nambara E, Keith K, Mccourt P, Naito S (1995) A regulatory role for the ABI3 gene in the establishment of embryo maturation in Arabidopsis thaliana. Development 121:
157
References
629-636
Nambara E, Kuchitsu K (2011) Opening a new era of ABA research. J Plant Res 124: 431-435
Nambara E, Naito S, Mccourt P (1992) A mutant of Arabidopsis which is defective in seed development and storage protein accumulation is a new abi3 allele. Plant J 2: 435-441
Nambara E, Nonogaki H (2012) Seed biology in the 21st century: perspectives and new directions. Plant Cell Physiol 53: 1-4
Nelson DC, Flematti GR, Riseborough J-A, Ghisalberti EL, Dixon KW, Smith SM (2010) Karrikins enhance light responses during germination and seedling development in Arabidopsis thaliana. Proc Natl Acad Sci USA 107: 7095-7100
Nelson DC, Riseborough J-A, Flematti GR, Stevens J, Ghisalberti EL, Dixon KW, Smith SM (2009) Karrikins discovered in smoke trigger Arabidopsis seed germination by a mechanism requiring gibberellic acid synthesis and light. Plant Physiol 149: 863-873
Nelson DC, Scaffidi A, Dun EA, Waters MT, Flematti GR, Dixon KW, Beveridge CA, Ghisalberti EL, Smith SM (2011) F-box protein MAX2 has dual roles in karrikin and strigolactone signaling in Arabidopsis thaliana. Proc Natl Acad Sci USA 108: 8897-8902
New M, Hulme M, Jones P (1999) Representing twentieth-century space-time climate variability. Part I: Development of a 1961-90 mean monthly terrestrial climatology. J Climate 12: 829-856
New M, Lister D, Hulme M, Makin I (2002) A high-resolution data set of surface climate over global land areas. Climate Res 21: 1-25
Nguyen T-P (2014) Seed dormancy and seed longevity, from genetic variation to gene identification. PhD Thesis. Utrecht University, Utrecht
Nguyen TP, Keizer P, van Eeuwijk F, Smeekens S, Bentsink L (2012) Natural variation for seed longevity and seed dormancy are negatively correlated in Arabidopsis. Plant Physiol 160: 2083-2092
Nishizawa A, Yabuta Y, Shigeoka S (2008) Galactinol and raffinose constitute a novel function to protect plants from oxidative damage. Plant Physiol 147: 1251-1263
Nolan T, Hands RE, Bustin SA (2006) Quantification of mRNA using real-time RT-PCR. Nature Protoc 1: 1559-1582
Nordborg M, Hu TT, Ishino Y, Jhaveri J, Toomajian C, Zheng HG, Bakker E, Calabrese P, Gladstone J, Goyal R, Jakobsson M, Kim S, Morozov Y, Padhukasahasram B, Plagnol V, Rosenberg NA, Shah C, Wall JD, Wang J, Zhao KY, Kalbfleisch T, Schulz V, Kreitman M, Bergelson J (2005) The pattern of polymorphism in

158
References
Arabidopsis thaliana. PLoS Biol 3: 1289-1299
Obata T, Fernie AR (2012) The use of metabolomics to dissect plant responses to abiotic stresses. Cell Mol Life Sci 69: 3225-3243
Okamoto M, Kuwahara A, Seo M, Kushiro T, Asami T, Hirai N, Kamiya Y, Koshiba T, Nambara E (2006) CYP707A1 and CYP707A2, which encode abscisic acid 8’-hydroxylases, are indispensable for proper control of seed dormancy and germination in Arabidopsis. Plant Physiol 141: 97-107
Ooms JJJ, Léon-kloosterziel KM, Bartels D, Koornneef M, Karssen CM (1993) Acquisition of desiccation tolerance and longevity in seeds of Arabidopsis thaliana - a comparative-study using Abscisic Acid-Insensitive abi3 mutants. Plant Physiol 102: 1185-1191
Osorio S, Alba R, Damasceno CMB, Lopez-Casado G, Lohse M, Zanor MI, Tohge T, Usadel B, Rose JKC, Fei ZJ, Giovannoni JJ, Fernie AR (2011) Systems biology of tomato fruit development: combined transcript, protein, and metabolite analysis of tomato transcription factor (nor, rin) and ethylene receptor (nr) mutants reveals novel regulatory interactions. Plant Physiol 157: 405-425
Osorio S, Alba R, Nikoloski Z, Kochevenko A, Fernie AR, Giovannoni JJ (2012) Integrative comparative analyses of transcript and metabolite profiles from pepper and tomato ripening and development stages uncovers species-specific patterns of network regulatory behavior. Plant Physiol 159: 1713-1729
Page DR, Grossniklaus L (2002) The art and design of genetic screens: Arabidopsis thaliana. Nat Rev Genet 3: 124-136
Pandurangan S, Pajak A, Molnar SJ, Cober ER, Dhaubhadel S, Hernandez-Sebastia C, Kaiser WM, Nelson RL, Huber SC, Marsolais F (2012) Relationship between asparagine metabolism and protein concentration in soybean seed. J Exp Bot 63: 3173-3184
Parcy F, Valon C, Kohara A, Misera S, Giraudat J (1997) The ABSCISIC ACID-INSENSITIVE3, FUSCA3, and LEAFY COTYLEDON1 loci act in concert to control multiple aspects of Arabidopsis seed development. Plant Cell 9: 1265-1277
Parera CA, Cantliffe DJ (1994) Presowing seed priming, Vol 16. John Wiley & Sons, Canada
Park SY, Fung P, Nishimura N, Jensen DR, Fujii H, Zhao Y, Lumba S, Santiago J, Rodrigues A, Chow TFF, Alfred SE, Bonetta D, Finkelstein R, Provart NJ, Desveaux D, Rodriguez PL, McCourt P, Zhu JK, Schroeder JI, Volkman BF, Cutler SR (2009) Abscisic acid inhibits type 2C protein phosphatases via the PYR/PYL family of START proteins. Science 324: 1068-1071
Penfield S (2008) Temperature perception and signal transduction in plants. New Phytol

159
References
179: 615-628
Penfield S, Josse EM, Kannangara R, Gilday AD, Halliday KJ, Graham IA (2005) Cold and light control seed germination through the bHLH transcription factor SPATULA. Curr Biol 15: 1998-2006
Platt A, Horton M, Huang YS, Li Y, Anastasio AE, Mulyati NW, Agren J, Bossdorf O, Byers D, Donohue K, Dunning M, Holub EB, Hudson A, Le Corre V, Loudet O, Roux F, Warthmann N, Weigel D, Rivero L, Scholl R, Nordborg M, Bergelson J, Borevitz JO (2010) The scale of population structure in Arabidopsis thaliana. PLoS Genet 6
Porth I, Klapste J, Skyba O, Hannemann J, McKown AD, Guy RD, Difazio SP, Muchero W, Ranjan P, Tuskan GA, Friedmann MC, Ehlting J, Cronk QC, El-Kassaby YA, Douglas CJ, Mansfield SD (2013) Genome-wide association mapping for wood characteristics in Populus identifies an array of candidate single nucleotide polymorphisms. New Phytol 200: 710-726
R-Core-Team (2013) R: A language and environment for statistical computing. R Foundation for Statistical Computing, Vienna, Austria. URL http://www.R-project.org/.
Rajjou L, Duval M, Gallardo K, Catusse J, Bally J, Job C, Job D (2012) Seed germination and vigor. Annu Rev Plant Biol 63: 507-533
Rajjou L, Lovigny Y, Groot SPC, Belghaz M, Job C, Job D (2008) Proteome-wide characterization of seed aging in Arabidopsis: A comparison between artificial and natural aging protocols. Plant Physiol 148: 620-641
Ramakers C, Ruijter JM, Deprez RHL, Moorman AFM (2003) Assumption-free analysis of quantitative real-time polymerase chain reaction (PCR) data. Neurosci Lett 339: 62-66
Raz V, Bergervoet JHW, Koornneef M (2001) Sequential steps for developmental arrest in Arabidopsis seeds. Development 128: 243-252
Roessner U, Wagner C, Kopka J, Trethewey RN, Willmitzer L (2000) Technical advance: simultaneous analysis of metabolites in potato tuber by gas chromatography-mass spectrometry. Plant J 23: 131-142
Roff D, Fairbairn D (2007) The evolution of trade-offs: where are we? J Evolution Biol 20: 433-447
Roff DA (2000) Trade-offs between growth and reproduction: an analysis of the quantitative genetic evidence. J Evolution Biol 13: 434-445
Ruijter JM, Ramakers C, Hoogaars WMH, Karlen Y, Bakker O, van den Hoff MJB, Moorman AFM (2009) Amplification efficiency: linking baseline and bias in the analysis of quantitative PCR data. Nucleic Acids Res 37
Ruyter-Spira C, Al-Babili S, van der Krol S, Bouwmeester H (2013) The biology of

160
References
strigolactones. Trends Plant Sci 18: 72-83
Saito S, Hirai N, Matsumoto C, Ohigashi H, Ohta D, Sakata K, Mizutani M (2004) Arabidopsis CYP707As encode (+)-abscisic acid 8’-hydroxylase, a key enzyme in the oxidative catabolism of abscisic acid. Plant Physiol 134: 1439-1449
Saravitz DM, Pharr DM, Carter TE (1987) Galactinol synthase activity and soluble sugars in developing seeds of four soybean genotypes. Plant Physiol 83: 185-189
Schmid B, Dolt C (1994) Effects of maternal and paternal environment and genotype on offspring phenotype in Solidago altissima L. Evolution 48: 1525-1549
Schmuths H, Bachmann K, Weber WE, Horres R, Hoffmann MH (2006) Effects of preconditioning and temperature during germination of 73 natural accessions of Arabidopsis thaliana. Ann Bot 97: 623-634
Schoentgen F, Jolles P (1995) From structure to function - possible biological roles of a new widespread protein family binding hydrophobic ligands and displaying a nucleotide-binding site. Febs Lett 369: 22-26
Schulze W, Schulze ED, Stadler J, Heilmeier H, Stitt M, Mooney HA (1994) Growth and reproduction of Arabidopsis thaliana in relation to storage of starch and nitrate in the wild type and in starch-deficient and nitrate-uptake-deficient mutants. Plant Cell Environ 17: 795-809
Schuurmans JAMJ, van Dongen JT, Rutjens BPW, Boonman A, Pieterse CMJ, Borstlap AC (2003) Members of the aquaporin family in the developing pea seed coat include representatives of the PIP, TIP, and NIP subfamilies. Plant Mol Biol 53: 655-667
Schwarz D, Nodop A, Huge J, Purfurst S, Forchhammer K, Michel KP, Bauwe H, Kopka J, Hagemann M (2011) Metabolic and transcriptomic phenotyping of inorganic carbon acclimation in the cyanobacterium Synechococcus elongatus PCC 7942. Plant Physiol 155: 1640-1655
Seo M, Nambara E, Choi G, Yamaguchi S (2009) Interaction of light and hormone signals in germinating seeds. Plant Mol Biol 69: 463-472
Seo PJ, Kim S-G, Park C-M (2008) Membrane-bound transcription factors in plants. Trends Plant Sci 13: 550-556
Shindo C, Aranzana MJ, Lister C, Baxter C, Nicholls C, Nordborg M, Dean C (2005) Role of FRIGIDA and FLOWERING LOCUS C in determining variation in flowering time of Arabidopsis. Plant Physiol 138: 1163-1173
Sidaway-Lee K, Josse EM, Brown A, Gan Y, Halliday KJ, Graham IA, Penfield S (2010) SPATULA links daytime temperature and plant growth rate. Curr Biol 20: 1493-1497
Sivritepe H, Dourado A (1995) The effect of priming treatments on the viability and accumulation of chromosomal damage in aged pea seeds. Ann Bot 75: 165-171

161
References
Smyth GK (2004) Linear models and empirical bayes methods for assessing differential expression in microarray experiments. Stat Appl Genet Mol Biol 3: Article3
Snoek LB, Terpstra IR, Dekter R, Van den Ackerveken G, Peeters AJ (2012) Genetical genomics reveals large scale genotype-by-environment interactions in Arabidopsis thaliana. Front Genet 3: 317
Stearns SC (1989) Trade-offs in life-history evolution. Funct Ecol 3: 259-268
Stone SL, Braybrook SA, Paula SL, Kwong LW, Meuser J, Pelletier J, Hsieh T-F, Fischer RL, Goldberg RB, Harada JJ (2008) Arabidopsis LEAFY COTYLEDON2 induces maturation traits and auxin activity: Implications for somatic embryogenesis. Proc Natl Acad Sci USA 105: 3151-3156
Stone SL, Kwong LW, Yee KM, Pelletier J, Lepiniec L, Fischer RL, Goldberg RB, Harada JJ (2001) LEAFY COTYLEDON2 encodes a B3 domain transcription factor that induces embryo development. Proc Natl Acad Sci USA 98: 11806-11811
Strehmel N, Hummel J, Erban A, Strassburg K, Kopka J (2008) Retention index thresholds for compound matching in GC–MS metabolite profiling. J Chromatogr B 871: 182-190
Sugliani M, Brambilla V, Clerkx EJ, Koornneef M, Soppe WJ (2010) The conserved splicing factor SUA controls alternative splicing of the developmental regulator ABI3 in Arabidopsis. Plant Cell 22: 1936-1946
Sugliani M, Rajjou L, Clerkx EJ, Koornneef M, Soppe WJ (2009) Natural modifiers of seed longevity in the Arabidopsis mutants abscisic acid insensitive3-5 (abi3-5) and leafy cotyledon1-3 (lec1-3). New Phytol 184: 898-908
Sun TP (2010) Gibberellin-GID1-DELLA: a pivotal regulatory module for plant growth and development. Plant Physiol 154: 567-570
Swarup K, Alonso-Blanco C, Lynn JR, Michaels SD, Amasino RM, Koornneef M, Millar AJ (1999) Natural allelic variation identifies new genes in the Arabidopsis circadian system. Plant J 20: 67-77
Tan B, Joseph LM, Deng W, Liu L, Li Q, Cline K, McCarty D (2003) Molecular characterization of the Arabidopsis 9-cis epoxycarotenoid dioxygenase gene family. Plant J 35: 44-56
Tarquis AM, Bradford KJ (1992) Prehydration and priming treatments that advance germination also increase the rate of deterioration of lettuce seeds. J Exp Bot 43: 307-317
Tenaillon MI, Hollister JD, Gaut BS (2010) A triptych of the evolution of plant transposable elements. Trends Plant Sci 15: 471-478
Teng S, Keurentjes J, Bentsink L, Koornneef M, Smeekens S (2005) Sucrose-specific induction of anthocyanin biosynthesis in Arabidopsis requires the MYB75/PAP1
162
References
gene. Plant Physiol 139: 1840-1852
Teng S, Rognoni S, Bentsink L, Smeekens S (2008) The Arabidopsis GSQ5/DOG1 Cvi allele is induced by the ABA-mediated sugar signalling pathway, and enhances sugar sensitivity by stimulating ABI4 expression. Plant J 55: 372-381
Terpstra IR, Snoek LB, Keurentjes JJB, Peeters AJM, Van den Ackerveken G (2010) Regulatory network identification by genetical genomics: Signaling downstream of the Arabidopsis receptor-like kinase ERECTA. Plant Physiol 154: 1067-1078
Tikunov YM, Laptenok S, Hall RD, Bovy A, de Vos RCH (2012) MSClust: a tool for unsupervised mass spectra extraction of chromatography-mass spectrometry ion-wise aligned data. Metabolomics 8: 714-718
To A, Valon C, Savino G, Guilleminot J, Devic M, Giraudat J, Parcy F (2006) A network of local and redundant gene regulation governs Arabidopsis seed maturation. Plant Cell 18: 1642-1651
Toubiana D, Semel Y, Tohge T, Beleggia R, Cattivelli L, Rosental L, Nikoloski Z, Zamir D, Fernie AR, Fait A (2012) Metabolic profiling of a mapping population exposes new insights in the regulation of seed metabolism and seed, fruit, and plant relations. PloS Genet 8
Tran LSP, Nakashima K, Sakuma Y, Simpson SD, Fujita Y, Maruyama K, Fujita M, Seki M, Shinozaki K, Yamaguchi-Shinozaki K (2004) Isolation and functional analysis of Arabidopsis stress-inducible NAC transcription factors that bind to a drought-responsive cis-element in the early responsive to dehydration stress 1 promoter. Plant Cell 16: 2481-2498
Tunnacliffe A, Wise MJ (2007) The continuing conundrum of the LEA proteins. Naturwissenschaften 94: 791-812
Ueguchi-Tanaka M, Ashikari M, Nakajima M, Itoh H, Katoh E, Kobayashi M, Chow TY, Hsing YIC, Kitano H, Yamaguchi I, Matsuoka M (2005) GIBBERELLIN INSENSITIVE DWARF1 encodes a soluble receptor for gibberellin. Nature 437: 693-698
Urano K, Maruyama K, Ogata Y, Morishita Y, Takeda M, Sakurai N, Suzuki H, Saito K, Shibata D, Kobayashi M, Yamaguchi-Shinozaki K, Shinozaki K (2009) Characterization of the ABA-regulated global responses to dehydration in Arabidopsis by metabolomics. Plant J 57: 1065-1078
Usadel B, Kuschinsky AM, Steinhauser D, Pauly M (2005) Transcriptional co-response analysis as a tool to identify new components of the wall biosynthetic machinery. Plant Biosyst 139: 69-73
Usadel B, Obayashi T, Mutwil M, Giorgi FM, Bassel GW, Tanimoto M, Chow A, Steinhauser D, Persson S, Provart NJ (2009) Co-expression tools for plant biology: opportunities for hypothesis generation and caveats. Plant Cell Environ

163
References
32: 1633-1651
Vaistij FE, Gan Y, Penfield S, Gilday AD, Dave A, He Z, Josse EM, Choi G, Halliday KJ, Graham IA (2013) Differential control of seed primary dormancy in Arabidopsis ecotypes by the transcription factor SPATULA. Proc Natl Acad Sci USA 110: 10866-10871
Valluru R, Van den Ende W (2011) Myo-inositol and beyond--emerging networks under stress. Plant Sci 181: 387-400
Van den Ende W, Valluru R (2009) Sucrose, sucrosyl oligosaccharides, and oxidative stress: scavenging and salvaging? J Exp Bot 60: 9-18
van Zanten M, Snoek LB, Proveniers MC, Peeters AJ (2009) The many functions of ERECTA. Trends Plant Sci 14: 214-218
Vandesompele J, De Preter K, Pattyn F, Poppe B, Van Roy N, De Paepe A, Speleman F (2002) Accurate normalization of real-time quantitative RT-PCR data by geometric averaging of multiple internal control genes. Genome Biol 3
Vasseur F, Pantin F, Vile D (2011) Changes in light intensity reveal a major role for carbon balance in Arabidopsis responses to high temperature. Plant Cell Environ 34: 1563-1576
Velez-Ramirez AI, van Ieperen W, Vreugdenhil D, Millenaar FF (2011) Plants under continuous light. Trends Plant Sci 16: 310-318
Walck JL, Hidayati SN, Dixon KW, Thompson K, Poschlod P (2011) Climate change and plant regeneration from seed. Global Change Biol 17: 2145-2161
Wan CY, Wilkins TA (1994) A modified hot borate method significantly enhances the yield of high-quality RNA from cotton (Gossypium hirsutum L.). Anal Biochem 223: 7-12
Wang F, Perry SE (2013) Identification of direct targets of FUSCA3, a key regulator of Arabidopsis seed development. Plant Physiol 161: 1251-1264
Wang R, Liu D, Crawford NM (1998) The Arabidopsis CHL1 protein plays a major role in high-affinity nitrate uptake. Proc Natl Acad Sci USA 95: 15134-15139
Wang R, Okamoto M, Xing X, Crawford NM (2003) Microarray analysis of the nitrate response in Arabidopsis roots and shoots reveals over 1,000 rapidly responding genes and new linkages to glucose, trehalose-6-phosphate, iron, and sulfate metabolism. Plant Physiol 132: 556-567
Waterworth WM, Masnavi G, Bhardwaj RM, Jiang Q, Bray CM, West CE (2010) A plant DNA ligase is an important determinant of seed longevity. Plant J 63: 848-860
Weigel D, Mott R (2009) The 1001 genomes project for Arabidopsis thaliana. Genome Biol 10: 107
Whitmarsh CJ, Ortiz-Lopez A (2000) The de-greening of canola. USDA Agricultural

164
References
Research Magazine 48: 1
Wilkie GS, Dickson KS, Gray NK (2003) Regulation of mRNA translation by 5′-and 3′-UTR-binding factors. Trends Biochem Sci 28: 182-188
Williams GC (1957) Pleiotropy, natural-selection, and the evolution of senescence. Evolution 11: 398-411
Xi WY, Liu C, Hou XL, Yu H (2010) MOTHER OF FT AND TFL1 regulates seed germination through a negative feedback loop modulating ABA signaling in Arabidopsis. Plant Cell 22: 1733-1748
Xia JG, Mandal R, Sinelnikov IV, Broadhurst D, Wishart DS (2012) MetaboAnalyst 2.0-a comprehensive server for metabolomic data analysis. Nucleic Acids Research 40: W127-W133
Xiong LM, Zhu JK (2003) Regulation of abscisic acid biosynthesis. Plant Physiol 133: 29-36
Yamagishi K, Tatematsu K, Yano R, Preston J, Kitamura S, Takahashi H, McCourt P, Kamiya Y, Nambara E (2009) CHOTTO1, a double AP2 domain protein of Arabidopsis thaliana, regulates germination and seedling growth under excess supply of glucose and nitrate. Plant Cell Physiol 50: 330-340
Yamamoto A, Kagaya Y, Usui H, Hobo T, Takeda S, Hattori T (2010) Diverse roles and mechanisms of gene regulation by the Arabidopsis seed maturation master regulator FUS3 revealed by microarray analysis. Plant Cell Physiol 51: 2031-2046
Yamauchi Y, Hasegawa A, Taninaka A, Mizutani M, Sugimoto Y (2011) NADPH-dependent reductases involved in the detoxification of reactive carbonyls in plants. J Biol Chem 286: 6999-7009
Yano R, Takebayashi Y, Nambara E, Kamiya Y, Seo M (2013) Combining association mapping and transcriptomics identify HD2B histone deacetylase as a genetic factor associated with seed dormancy in Arabidopsis thaliana. Plant J 74: 815-828
Yoo SY, Kardailsky I, Lee JS, Weigel D, Ahn JH (2004) Acceleration of flowering by overexpression of MFT (MOTHER OF FT AND TFL1). Mol Cells 17: 95-101
Zentella R, Zhang Z-L, Park M, Thomas SG, Endo A, Murase K, Fleet CM, Jikumaru Y, Nambara E, Kamiya Y (2007) Global analysis of DELLA direct targets in early gibberellin signaling in Arabidopsis. Plant Cell 19: 3037-3057
Zhao JJ, Jamar DCL, Lou P, Wang YH, Wu J, Wang XW, Bonnema G, Koornneef M, Vreugdenhil D (2008) Quantitative trait loci analysis of phytate and phosphate concentrations in seeds and leaves of Brassica rapa. Plant Cell Environ 31: 887-900
Zhong R, Richardson EA, Ye Z-H (2007) Two NAC domain transcription factors, SND1 and NST1, function redundantly in regulation of secondary wall synthesis in fibers of Arabidopsis. Planta 225: 1603-1611

Summary

166
Summary
The seed stage is an essential episode in the life cycle of higher plants. The environmental cues that seeds experience during their development are important components of their life history. The parental environment, from pre-fertilization until seed dispersal affects performance of the dry mature seed and, therefore, affects the life cycle of the next generation. The evolutionary response to environmental perturbations has resulted in genetic changes in order to increase the fitness of the population, which is called ‘adaptation’. The aims of this study were to increase our understanding of how environments regulate seed performance, both on the long term, i.e. through adaptation of seed performance traits to local conditions and on the short term, i.e. by acclimation of plants to different seed maturation environments.
Seed dormancy is an important seed performance trait. It is an adaptive trait that optimizes the distribution of germination over time and displays strong adaptive plasticity to geographic location and seasonal conditions. In Chapter 2, natural variation of seed dormancy in world-wide collected Arabidopsis thaliana accessions was explored. The significant correlation of seed dormancy with longitude, latitude and eight temperature-related climatic parameters of local environments confirmed that dormancy indeed is a strongly adaptive trait. Genetic studies of natural variation provide a bridge between molecular analysis of gene function and evolutionary explorations of adaptation and natural selection. In Chapter 2, genome-wide association mapping of seed dormancy was performed to identify causal SNPs that affect seed dormancy. Interestingly, two major peaks were detected and likely candidate genes for each peak were identified. This will allow us to further investigate natural variation and adaptation of seed dormancy in this population.
In Chapter 3 it was shown in more detail how the maturation environment regulated seed performance and which environmental factors were the most dominant in this respect. We studied the influence of light intensity, photoperiod, temperature, nitrate and phosphate during seed development on five plant- and thirteen seed performance traits, including seed dormancy and longevity. In general, temperature played a dominant role in both plant and seed performance, which is consistent with the findings in Chapter 2. Light had more impact on plant than on seed traits. Nitrate mildly affected some of the plant and seed traits, whereas phosphate had rather minor influence on these traits. Interestingly, we identified a negative correlation between seed dormancy and seed longevity for seeds matured at low temperature, low and high light intensity conditions. To our knowledge such a contrasting effect of the maternal environment has not been reported before. Overall, low temperature, low nitrate, low and high light intensity were the most influential parental environments.
Therefore, in Chapter 4, we used the seeds grown in these most influential

167
Summary
environments to investigate the underlying metabolic pathway changes, using a combination of transcriptomics and metabolomics. This study revealed that the effect of temperature and nitrate maturation environments on seed maturation was reflected by partly overlapping genetic and metabolic pathways, as based on similar metabolite and transcript changes. We showed that three metabolites and four genes that are involved in nitrogen metabolism were significantly differentially regulated in these two maturation environments. Light intensity changes during seed maturation had specific effects on certain metabolites (galactinol) and a genotype specific effect (NILDOG6) on cell surface encoding genes, pointing towards a specific role of light. Our integrated analysis of phenotypes, metabolites and transcripts leads to new insights in the regulation of seed performance and provides new research directions as well as, potential practical applications.
Seed dormancy is one of the important seeds characteristics that are acquired during seed maturation. Thus, we investigated in Chapter 5 the role of DOG1, which was the first gene shown to be associated with natural variation for seed dormancy, during seed maturation. Transcriptome and metabolome data indicated that a lack of the DOG1 gene caused a strongly impaired late maturation phase. This was concluded from the absence of a group of genes and primary metabolites that are normally expressed or accumulated during the late maturation phase. In addition, proteome analysis demonstrated that DOG1 did not affect seed storage protein and oleosin accumulation. The large number of overlapping differentially expressed genes in dog1-1 with direct targets of ABI3, one of the key regulators of seed maturation, triggered us to study genetic interactions between them. The double mutant of the weak abi3-1 allele and dog1-1 produces mature green seeds and, together with other phenotypes, this indicated that the dog1-1 mutant acts as an enhancer of the weak abi3-1 allele. Taken together, our data strongly indicate that the function of DOG1 is not limited to seed dormancy but extends to a more general role as a regulator of late seed maturation.
Finally, the work presented in this thesis is integrated and discussed in Chapter 6. The importance of temperature during seed maturation in the acquisition of seed dormancy was emphasized, as it was observed both in acclimation and adaptation. Then, from an ecological point of view, the trade-off between seed dormancy and longevity was discussed. In addition, the question how environments affect seed maturation was extensively addressed, mainly in relation with three aspects: genetic regulators, storage compounds and the relationship between seed dormancy and the plant hormones abscisic acid and gibberellins. Finally, we implicated the potential of how the knowledge gained form this thesis work could be transferred to the seed industry to improve desirable seed traits.


Samenvatting

170
Samenvatting
Zaad is een essentieel stadium tijdens de levenscyclus van een plant. De omgevingsomstandigheden tijdens de zaadontwikkeling (rijping) zijn belangrijk voor het levensverloop van het zaad; deze beïnvloeden de uiteindelijke eigenschappen van het droge zaad en, als gevolg daarvan, de levenscyclus van de volgende generatie.
De evolutionaire aanpassing aan veranderingen in de omgeving heeft geleid tot genetische veranderingen en daarmee tot een verhoogde vitaliteit (fitness) van de populatie, dit proces noemen we “adaptatie”. Het doel van deze studie is het vergroten van onze kennis van het effect van de omgeving op zaadeigenschappen, zowel op de lange termijn door adaptatie, als op de korte termijn, middels de acclimatie van planten aan verschillende zaadrijpingsomgevingen.
Kiemrust is een belangrijke zaadeigenschap. Het is een adaptieve eigenschap die ervoor zorgt dat het tijdstip van kieming geoptimaliseerd wordt en speelt een grote rol in de plasticiteit van zaden gerelateerd aan geografische locatie en variatie gedurende de seizoenen.
In Hoofdstuk 2 onderzochten we natuurlijke variatie voor kiemrust in een wereldwijde populatie van Arabidopsis thaliana accessies. De significante correlatie van kiemrust met breedtegraad, hoogte en acht aan de temperatuur gerelateerde klimaatparameters van lokale omgevingen, bevestigde dat kiemrust een sterk adaptieve eigenschap is. Genetische studies aan natuurlijke variatie slaan een brug tussen de moleculaire analyse van genfuncties en de evolutionaire speurtocht naar adaptatie en natuurlijke selectie. In Hoofdstuk 2 hebben we genoombreed naar associaties tussen causale polymorphismen in het DNA en kiemrust gezocht. Dit heeft geleid tot de identificatie van twee hoofdpieken, waarvoor kandidaat genen geïdentificeerd zijn. Hiermee kunnen we natuurlijke variatie en adaptatie voor kiemrust in deze populatie nader onderzoeken.
In Hoofdstuk 3 kijken we in meer detail naar de relatie tussen de zaadrijpingsomgeving en zaadeigenschappen en identificeren we welke omgevingsfactoren hierbij het meest dominant zijn. We hebben de rol van lichtintensiteit, fotoperiode, temperatuur, nitraat en fosfaat tijdens de zaadontwikkeling op vijf planten- en dertien zaadeigenschappen, waaronder kiemrust en zaadbewaarbaarheid, onderzocht. Over het algemeen had temperatuur een dominant effect op zowel plant- als zaadeigenschappen, wat consistent is met de bevindingen in Hoofdstuk 2. Licht had meer effect op plant- dan op zaadeigenschappen. Nitraat had een gematigd effect op enkele planten- en zaadeigenschappen, terwijl fosfaat slechts een gering effect op deze eigenschappen had. Heel interessant is de negatieve correlatie tussen kiemrust en zaadbewaarbaarheid van zaden die gerijpt zijn bij lage temperatuur, en bij zowel lage als hoge licht intensiteit. Voor zover wij weten is een dergelijk contrasterend effect van omgevingsomstandigheden niet eerder gerapporteerd. Samenvattend waren het lage temperatuur, en lage en hoge licht
171
Samenvatting
intensiteit die van de omgevingsfactoren de meeste invloed hadden.
In Hoofdstuk 4 hebben we de zaden die in deze meest invloedrijke omgevingen gerijpt zijn gebruikt om de onderliggende metabolische reactieroutes te identificeren door gebruik te maken van analyses van transcriptoom en metaboloom. Deze studie heeft uitgewezen dat temperatuur en nitraat via gedeeltelijk overlappende reactieroutes zaadrijping beïnvloeden. Dit hebben we geconcludeerd op basis van vergelijkbare veranderingen in de metaboliet- en transcriptoomprofielen. We laten zien dat drie metabolieten en vier genen die betrokken zijn bij het nitraatmetabolisme significant differentieel gereguleerd zijn in deze twee omgevingen. Veranderingen tijdens de zaadrijping in lichtintensiteit hadden een uniek effect op een aantal metabolieten (waaronder galactinol) en een genotype specifiek effect (NILDOG6) op genen die te maken hebben met het celoppervlak, wat wijst op de unieke rol van licht. De geïntegreerde analyse van fenotypen, metabolieten en transcripten leidt tot nieuwe inzichten in de regulatie van zaadeigenschappen en voorziet ons zowel van nieuwe onderzoeksrichtingen als van mogelijke praktische toepassingen.
Kiemrust is één van de belangrijkste zaadeigenschappen die tijdens de zaadrijping geïnduceerd worden. Daarom onderzoeken we in Hoofdstuk 5 de rol van DOG1, het eerste gen dat gerelateerd is met natuurlijke variatie voor kiemrust, tijdens de zaadrijping. Transcriptoom en metaboloom data geven aan dat het ontbreken van het DOG1 gen een sterk effect heeft op de late zaadrijping. Dit werd geconcludeerd op basis van het ontbreken van een groep genen en primaire metabolieten die normaal gesproken ophopen tijdens deze fase. Verder wees de eiwitanalyse uit dat DOG1 geen effect had op de ophoping van opslageiwitten en oleosinen. De grote overlap tussen genen die differentieel tot expressie kwamen in de dog1-1 mutant en de directe doelgenen (‘targets’) van ABI3, één van de hoofdregulatoren van de zaadrijping, heeft ons ertoe aangezet de genetische interactie tussen deze twee genen nader te onderzoeken. De dubbelmutant van het zwakke abi3-1 allel en dog1-1 produceert groene zaden, dit samen met een aantal andere fenotypen aangeeft dat de dog1-1 mutant het abi3-1 allel versterkt. Samengenomen laat onze data zien dat de rol van DOG1 zich niet beperkt tot het induceren van kiemrust, maar dat het een bredere rol speelt als regulator van de zaadrijping.
Tot slot is het werk dat hier gepresenteerd is geïntegreerd en bediscussieerd in Hoofdstuk 6. De rol van de temperatuur voor het verkrijgen van kiemrust tijdens de zaadrijping is belangrijk gebleken, zowel tijdens acclimatie als adaptatie. Vervolgens is de relatie (‘tradeoff’) tussen kiemrust en zaadbewaarbaarheid vanuit een ecologisch oogpunt besproken. De vraag hoe de omgeving zaadrijping beïnvloedt is uitgebreid besproken, met daarbij de nadruk op drie aspecten: genetische regulatoren, opslagstoffen en de relatie tussen kiemrust en de plantenhormonen abscisine zuur en gibberelines. Uiteindelijk geven wij aan hoe de kennis verkregen met dit werk vertaald kan worden naar toepassingen door de zaadindustrie om gewenste zaadeigenschappen te verbeteren.


中文摘要

174
中文摘要
种子是高等植物生命周期中的一个重要阶段。种子在发育过程中经历的环境对种子的整个生命历程起着重要作用。父母本从受精之前到种子传播这整个过程中经历的环境都会影响成熟的种子的表型,从而影响下一代的生命周期。在进化中,遗传信息会随着环境的波动而改变,从而增强了整个群体的适应性,这就是所谓的“适应性”。本论文研究旨在拓宽人们对于环境如何调控种子表现型的了解。研究分两个方面:1、环境对种子表型的长期适应性效应,即通过改变种子表型来适应当地的环境;2、环境对种子表型的短期适应性效应,即通过改变种子表型来适应不同的种子成熟期的环境。
种子休眠性是种子质量的一个很重要的表型。它是一个适应性性状,用于优化种子发芽在时间线上的分布,并且呈现了很强的对地理环境和季节变化的可塑适应性。第二章,以世界范围内搜集到的拟南芥群体为研究对象,探讨了种子休眠的自然变异性状。种子休眠性与搜集到的拟南芥株系所处的地理经度、纬度以及八种与温度相关的气候参数有显著相关性。由此更进一步的充分证实了种子休眠性是一个很强的长期适应性性状。自然变异的遗传学研究为基因功能的分子研究与适应性和自然选择的进化探究之间提供了桥梁。在第二章,我们开展了种子休眠性的全基因组关联研究(GWAS),目的在于检测影响休眠性的单核苷酸多态性(SNP)。我们筛选出了两个主峰及其对应峰下的候选基因。这些信息有助于进一步探索在这个群体中种子休眠性的自然变异和适应性。
第三章,进一步地研究了成熟期的环境对种子表型的影响以及何种环境起着更为主要的作用。我们研究了光照强度、光周期、温度、硝酸盐和磷酸盐在种子发育过程当中对五种植株表型和十三种种子表型的影响,其中种子表型包括休眠性和储藏性。总体而言,温度对植株和种子表型起着最主要的影响。这一结果与第二章的相关性分析结果一致。光照对植株表型的影响大于对种子表型的影响。硝酸盐对植株和种子表型的影响相对于光照而言都较弱。然而与硝酸盐相比,磷酸盐对这些性状的影响更为微弱。相关性分析表明,种子成熟期若经历低温、高强度或低强度光照,都会使种子的休眠性和储藏性这两个重要的种子表型产生负相关性(即休眠性的增强的同时储藏性降低,反之亦然)。据我们所知,这种亲本环境对子代种子表型性状的负相关性影响尚未有报道。总体而言,低温、低硝酸盐和高强度光照是最具影响力的父母本环境因子。
因此,在第四章,我们综合运用了转录组学和代谢组学方法,进一步研究了在最具影响力的父母本环境下所生长的种子的代谢途径的变化。研究结果表明温度和硝酸盐在种子成熟期对种子代谢组学和转录组学的影响有一定的相似性,由此反映出其在遗传和代谢途径有一定的共同性。在不同温度和不同硝酸盐这两种成熟期环境下,种子三种代谢产物和四个已知参与硝酸盐代谢的基因都呈现出了显著性的共差异性调控。成熟期光照强度的变化对特定的代谢物(半乳糖苷)以及对特定的基因型(NILDOG6)里编码细胞表面的基因有特殊效果。这表明了光的特殊作用性。对植株表型、种子表型、代谢产物和转录产物的综合分析

175
中文摘要
为环境对种子表型的调控提供了新的见解,新的研究方向以及潜在的实际应用价值。
种子的休眠性是种子在成熟过程中的重要特征之一。因此,在第五章,我们着重研究了基因DOG1的功能。DOG1是研究发现的第一个在种子成熟过程中与种子休眠自然变异相关的基因。转录组学和代谢组学数据显示在正常种子里表达的一组基因和在种子后期成熟过程中累积的初级代谢产物,在DOG1突变体里表达缺失,由此证明了DOG1基因的缺失会导致很强的后期成熟阶段损伤。此外,蛋白组学分析表明DOG1并不影响种子贮藏蛋白和油质蛋白的累积。基因ABI3是种子成熟期的很重要的一个调控因子。我们发现在DOG1突变体dog1-1里差异性表达的基因与ABI3的靶基因有很大程度上的重叠,由此引发我们去研究它们之间的遗传相互作用。弱ABI3等位基因abi3-1和dog1-1双突变体产生成熟的绿色种子。综合其他的表型分析表明,dog1-1突变体是弱abi3-1等位基因的增强子。总而言之,我们的数据表明,DOG1的功能并不仅限于种子休眠,而是延伸到作为种子成熟后期的调节因子的更广泛的功能。
最后,第六章综合讨论了本文中呈现的工作。由于在驯化和适应过程中我们都观察到了温度的作用,因此温度在种子成熟过程中对种子休眠的重要性得到了强调;然后,从生态学角度,对种子休眠和寿命之间的关系进行了讨论。此外,我们就环境对种子成熟的影响展开了广泛的讨论,主要集中在三个方面:遗传调控因子、储藏化合物以及种子休眠与植物激素脱落酸和赤霉素之间的关系。最后,我们提出了新的见解,用于把从本论文研究中获得的知识运用到种业当中,以培育出所需的种子性状。


Acknowledgements

178
Acknowledgements
This PhD thesis is a big achievement, but I would never accomplish it without being a member of Plant physiology and especially Wageningen Seed Lab!
First of all, I would like to express my most sincere gratitude to my supervisor Dr. Leónie Bentsink. I still remember during my first interview, you told me to think carefully as PhD is an important step both for life and career. Indeed, you are right, PhD is an amazingly essential period during my life, and I am really lucky that I spent this period with you! Your care about all your group members, and fair to everyone, these give me good mood to work under your supervision. I really appreciate the way you dedicate yourself to sciences. I regard you as a good example of a successful scientist in many aspects so that motivates me towards that direction. Thanks for your inspiring supervision and encouraging guidance. You not only do corrections for my manuscripts but also tell me the reason why you do in this way. This is very helpful in leading me to the right track of writing. Especially, thanks for your cooperative support during the final rush of my thesis composition. On the other hand, I enjoyed all the free talks with you and sharing my happiness, even sadness and maybe sometimes together with tears (tissue prepared! haha)! I really wish I could work with you longer (and this wish comes true!) and have more future collaborations!
Dr. Henk Hilhorst, at the beginning I thought you are very serious and not easy to get along with. Time elapsed, I realized that my subconsciousness was not true. I’m grateful of your consistent support and help. You can simply cope with my difficulties by one sentence or one encouraging nod, which release a lot of my pressure and back me up. And you also spend a lot of time on discussing, structuring and correcting my thesis (until you “fed up” with my appearance in front of your office, haha), thank you for all the efforts during my scientific development, and hopefully we will keep this contact forever!
I consecrate my sincere gratitude to my promoters Prof. Harro Bouwmeester and Prof. Sjef Smeekens for your critical suggestions and valuable guidance. Bas, I am grateful of your earnest attitudes to science, which I am lacking of. I enjoyed discussing with you about sciences, which inspired me a lot (and I enjoyed exchanging my chocolate with your cucumber!). Deborah, you are a great colleague and nice friend, I learned a lot from you as we worked in the same project. Your Brazilian way of enthusiasm and passion always influence me to be more cheerful! Wilco, I am always astonished by your versatile ability of knowing almost everything, and with your happy laugh from every corner of PPH (hahahahaha). Richard, thanks for your help during my cloning and for your advices during the routine work discussions. Harm, thank you for teaching me some helpful R language skills. Basten, thanks for the datasets analysis and for your always quick and positive response to my questions. Leo, you are always so efficient that make

179
Acknowledgements
you a super technician in the lab, thanks for all of your kind helps in the lab! Kerstin, thank you for guiding me in doing ABA extractions and measurements. My gratitude also extends to my external supervisor, Maarten. Your attitudes to sciences nourish me all the time. I still clearly remember, during my first meeting with you, I am surprised that how many papers you can recall in your mind during our discussion. Thank you for all your valuable suggestions! Prof. Eric Schranz, thank you for your warm-hearted help when I tried to apply post-doc positions.
Bing, I met you the first time in Israel, I still remember you helped me packing my luggage there in a messy room with nearly ten minutes left before leaving to the airport… Without your help, I would also never be able to organize such a good Chinese dinner to the group! Phuong, I appreciated that you always have a clear goal in life and then work hard towards the targets. Cecilia, thanks for bringing me back to the gym course after two-year absence! Shuangchen, thanks for your fresh cheery! Elise, I enjoyed the minutes with you in the gym. Farzaneh, we always have nice talks together. Julio, your Brazilian charm gave me so much joy (and the charm of your eyebrow)! Alexandre, thanks for critical reading and helpful feedback on this thesis. Also thanks for your reminder of being elegant every day, haha! Anderson, I enjoyed our scientific discussions! Ronny, Rashid, Noorullah, Paolo and Gonda and all the members in Wageningen Seed Lab, I am really happy and proud of being a member of the group, you give me home atmosphere and feelings!
I would like to express acknowledgements to Aaron, who gave me the chance of three-month study in Israel, I learned a lot of first-hand metabolites analysis, and of course I enjoyed the exotic landscape and culture. Albert, thanks for squeezing your limited time to analyse my networks, and sharing your experience of drinking ethanol story. Johannes, thank you for the microarray analysis, and for your patience in answering my small doubts! Loïc, thank you for the protein analysis, and for your nice suggestions on my manuscript!
All my Chinese friends also gave me powerful support! Yanxia, I learned a lot from your persistence and clear-mind for the future, and of course I enjoy talking with you about everything! And one special thank to you as you helped as a bridge between me and Junwei at the beginning of our love, hehe~~. Li Hui, you are so enthusiasm and like a shining sun, I enjoyed swimming and jogging time with you. Xi, our friendship started from our Bachelor study and extended here, so lucky to have you around and we have so many common topics. Bo, thanks for your accompany every dinner time at my last stage of writing, and your nice food from Leiden! Yuanyuan, thanks for efficiently preparing the invitation documents for Junwei’s visit! Jun, your cute boy gave me so much joy! Yunmeng, I enjoyed the time playing volleyball together. Tingting and Suxian,

180
Acknowledgements
as Master classmates and PhD colleagues, I had so many unforgettable moments with you! Gaowei, very nice to have you as a good friend and corridor-mate! I would like to give my warm thanks to my friends Jianhua, Yanli, Zhen, Wei Song, Jimmy, Ya-Fen, Feng Zhu, Ting Yang, Qing Liu, Wei Liu, Chunting, Yan Wang, Yu Du, Juan Du, Nini, Tao, Xuan, Xu, Ningwen, Ke, Guiling, Junyou couple, Huchen, Defeng and Xianwen!
I also want to acknowledge many people from Molecular Plant Physiology Group in Utrecht, you are always friendly to me and treated me as a member, thank you!
Most importantly, my heartfelt gratitude to my beloved husband – Junwei! It was a memorable time for me to meet you in Wageningen during my PhD. I always say that I am “Fortune Fools have fortune” (傻人有傻福). Thank you for your love, and for your understanding, especially during my hard time of writing. It was amazing that how much encouragement, support and advices that you gave me even when you were so far away from me and had six hours jet lag, as well as working under such high pressure yourself. You could manage to check the status of my manuscript more often than I did just wanted to be the first one to inform me the update. Thank you, my love!
Last but not least, particular appreciation to my parents! You are great example of parents, I am so proud to be your daughter! I know that as the only child in the family, being so far away is not easy for you, but you always give me endless love, encouragement, support and enough freedom to do whatever I want to do! Wish you keep healthy, happy and successful in your careers! Thank you for all the families and friends helped my parents during my absence. I wish to express my everlasting sense of gratitude to my parents-in-law and all my families and friends for your love and support!
最后,特别的感谢献给我的父母,你们是模范父母的典范,我为能做你们的女儿而骄傲!我知道作为家里唯一的孩子,离家这么远,这么多年对你们来说特别不容易,谢谢你们对我的无尽的爱,鼓励,支持以及选择的自由!女儿衷心的希望你们身体健康,事业快乐!有成!感谢所有家人朋友在我出门在外的日子里对家里的照顾!感谢我的公公婆婆的理解和所有家人朋友的爱与支持!

Curriculum Vitae
182
Curriculum Vitae
Curriculum VitaeHanzi He was born on the 28th of December 1983 in Xiangyang, Hubei, China.
In 2003 she started her Bachelor Horticulture at the Huazhong Agricultual University in Wuhan, China. Her Bachelor thesis was performed under supervision of Professor Zhibiao Ye in collaboration with the Wuhan Vegetable Research Institute. After obtaining the Bachelor degree in June, 2007, she moved to Wageningen University to continue her Master study in Plant Science with specialisation Plant Breeding and Genetic Resources for which she received the Huygens China Scholarship and Anne van de Ban scholarship Fond from Wageningen University. The work of her Master thesis was a cytogenetic study, analysing introgressions of Tulipa fosteriana into Tulipa gesneriana. At the end of her Master study, she did her internship in Royal Van Zanten, a flower company (Lily Breeding Department). In 2009, Hanzi started her PhD at the Laboratory of Plant Physiology of Wageningen University under the supervision of Dr. Leónie Bentsink and Dr. Henk Hilhorst. During her PhD, she obtained a scholarship from the “Sixth EU Framework Programme – Transnational Access implemented as Specific Support Action (Dryland Research SSA)”, which gave her the opportunity to work for three months with Dr. Aaron Fait in Ben-Gurion University of the Negev, Jacob Blaustein Institute for Desert Research in Israel. There she worked on “Metabolites profiling of Arabidopsis seeds during seed maturation” and obtained first-hand experience of metabolites analysis. Her PhD project is focused on “Environmental regulation of seed performance”, which is described in this thesis book. She found herself interested in seed science, and will continue with a Post-doc position in Wageningen Seed Lab.

183
Curriculum Vitae
Publications:He H*, de Souza Vidigal D*, Snoek, LB, Hanson, SJ, Schnabel S, Nijveen H,
Hilhorst H, Bentsink L. Interaction between parental environment and genotype affects plant and seed performance in Arabidopsis. Journal of Experimental Botany Accepted (* co-first author)
He H, Willems L, Batushansky A, Fait A, Hanson, SJ, Nijveen H, Hilhorst H, Bentsink L. Parental temperature and nitrate effects on seed performance are reflected by partly overlapping genetic and metabolic pathways. In preparation
Dekkers BJ*, He H*, Hanson, SJ, Willems L, Rajjou L, Hilhorst H, Bentsink L. A role for DOG1 in seed maturation. In preparation (* co-first author)
He H, Hilhorst H, Bentsink L. Genome-wide analysis of a locally adapted trait in Arabidopsis thaliana: Seed dormancy. In preparation
Liu J, He H, Vitali M, Haider I, Charnikhova T, Schubert A, Ruyter-Spira C, Lovisolo C, Bouwmeester HJ, Cardinale F. Osmotic stress affects Strigolactone biosynthesis in Lotus japonicus roots as a requisite to stress-induced ABA accumulation and independently of P availability. BMC Plant Biology under review
Mruphey M, Kovach K, Elnacash T, He H, Bentsink L, Donohue K. DOG1-imposed dormancy mediates germination responses to temperature cues. Environmental and Experimental Botany under review
Marasek-Ciolakowska A, He H, Bijman P, Ramanna M, Arens P, Van Tuyl J. (2012) Assessment of intergenomic recombination through GISH analysis of F1, BC1 and BC2 progenies of Tulipa gesneriana and T. fosteriana. Plant Systematics and Evolution 298: 887-899
Zhou G, He H, Ye Z, Li H, Deng Y, Hu Z, Yao F, Wang B, Huang X (2007) Studies on nitrate accumulation in Vigna unguiculata. Abstracts compilation of National conference of Chinese Plant Physiology Society

184
Education Statement of the Graduate School
Experimental Plant Sciences
Issued to: Hanzi HeDate: 26 August 2014
Group: Plant Physiology, Wageningen University & Research Centre
1) Start-up phase date► First presentation of your project Influence of maternal growth conditions on seed quality Nov 20, 2009► Writing or rewriting a project proposal Production environment and seed quality 2010► Writing a review or book chapter ► MSc courses ► Laboratory use of isotopes
Subtotal Start-up Phase 7.5 credits*
2) Scientific Exposure date► EPS PhD student days EPS PhD student day, Wageningen University May 20, 2011 EPS PhD student day, University of Amsterdam Nov 30, 2012► EPS theme symposia EPS theme 4 ‘Genome Plasticity’ ,Radboud University, Nijmegen Dec 11, 2009 EPS theme 3 ‘Metabolism and Adaptation’, Leiden University Feb 19, 2010 EPS theme 3 ‘Metabolism and Adaptation’, Wageningen University Feb 10, 2011 EPS theme 3 ‘Metabolism and Adaptation’, University of Amsterdam Mar 22, 2013 EPS theme 3 ‘Metabolism and Adaptation’, Wageningen University Mar 11, 2014► NWO Lunteren days and other National Platforms ALW meeting ‘Experimental Plant Sciences’, Lunteren Apr 19 & 20, 2010 ALW meeting ‘Experimental Plant Sciences’, Lunteren Apr 04 & 05, 2011 ALW meeting ‘Experimental Plant Sciences’, Lunteren Apr 02 & 03, 2012 ALW meeting ‘Experimental Plant Sciences’, Lunteren Apr 22 & 23, 2013 ALW meeting ‘Experimental Plant Sciences’, Lunteren Apr 14 & 15, 2014► Seminars (series), workshops and symposia Metabolomics Workshop, Leiden Apr 12-16, 2010 Mini symposium ‘Plant Breeding in the Genomics Era’ Nov 25, 2011 SPICY symposium Mar 07, 2012 Mini symposium ‘Frontiers in Plant Morphogenesis’ Nov 05, 2012 Plant Sciences Seminars 2009-2013 Wageningen Evolution and Ecology Seminars Series (WEES) 2010-2013 “Writing for high impact journals” Andrew Sugden, Editor of Science 08 Feb 2013 2nd Dutch Seed Symposium Oct 01, 2013 Symposium: Plant Metabolomics Dec 12, 2013 Symposium Plant Developmental Biology Oct 14, 2013
CALN 2013 Annual Meeting: Innovative Horticultural Industry and Food Safety in the Netherlands Nov 09, 2013

185
Invited seminars (Justin Borevitz, Huanming Yang, Sanwen Huang, Ruibang Luo, Kent Bradford, Bert Visser, Bas Haring) Jan 12-Sep 16, 2010
Invited seminars (Robert Furbank, Stefan Kepinski) Sep 02-Sep 08, 2011
Invited seminars (Jill Farrant, Lauren McIntyre, Ruth Finkelstein, Aaron Fait) Jun 26-Dec 04, 2012
Invited seminars (Andrew Sugden, Detlef Wiegel, Kazuki Saito, Gabino Sanchez Perez, Hanhui Kuang, Wim van den Ende) Feb 08-Dec 13, 2013
► Seminar plus ► International symposia and congresses
ISSS Molecular Aspects of seed dormancy and germination, University of York, UK 2010 Jul 18-21, 2010
ASPB plant biology conference, Minneapolis US, 2011 Aug 06-10, 2011 ICAR 2012, Vienna, Austria, 2012 Jul 03-07, 2012 ISSS Molecular aspects of seed dormancy and germination, Paris, 2013 Jul 09-12, 2013► Presentations Poster presentation, Lunteren Apr 04, 2011 Oral presentation ISSS, Paris Jul 09, 2013 Oral presentation, Lunteren Apr 15, 2014► IAB interview Meeting with a membe rof the International Advisory Board Nov 14, 2012► Excursions
Subtotal Scientific Exposure 20.8 credits*
3) In-Depth Studies date► EPS courses or other PhD courses Master Class Seed Technology May 31-Jun 03, 2010 Utrecht Summer School Aug 22-24, 2011 EMBO practical course on plant bioinformatics: Going -OMICs Jun 11-19, 2012 Systems biology: “Statistical analysis of -omics data” Dec 10-14, 2012► Journal club Member of literature discussion group at Plant Physiology 2009-2013► Individual research training
Subtotal In-Depth Studies 9.0 credits*
4) Personal development date► Skill training courses PhD Competence Assessment Jan 19, 2010 EPS Career Event: ExPectationS Day, Wageningen Nov 18, 2011 Techniques for Writing and Presenting a Scientific Paper Dec 06-09, 2011 Improve your writing Nov 01-Dec 06, 2012► Organisation of PhD students day, course or conference ► Membership of Board, Committee or PhD council Activity committee of Plant Physiology 2011
Subtotal Personal Development 3.7 credits*
TOTAL NUMBER OF CREDIT POINTS* 41.0Herewith the Graduate School declares that the PhD candidate has complied with the educational requirements set by the Educational Committee of EPS which comprises of a minimum total of 30 ECTS credits
* A credit represents a normative study load of 28 hours of study.

This work was performed at the Laboratory of Plant Physiology, Wageningen University, with financial support from the Dutch Technology Foundation STW, which is part of the Netherlands Organisation for Scientific Research (NWO) and partly funded by the Ministry of Economic Affairs (project number STW 11314)
Cover design: Fahui Liu
Layout: Hanzi He
Printed by: Proefschriftmaken.nl || Uitgeverij BOXPress