Environmental Impact Evaluation of University Integrated ...
18
Citation: Jaglan, A.K.; Cheela, V.R.S.; Vinaik, M.; Dubey, B. Environmental Impact Evaluation of University Integrated Waste Management System in India Using Life Cycle Analysis. Sustainability 2022, 14, 8361. https://doi.org/10.3390/su14148361 Academic Editors: Sunil Kumar, Pooja Sharma and Deblina Dutta Received: 30 April 2022 Accepted: 4 July 2022 Published: 8 July 2022 Publisher’s Note: MDPI stays neutral with regard to jurisdictional claims in published maps and institutional affil- iations. Copyright: © 2022 by the authors. Licensee MDPI, Basel, Switzerland. This article is an open access article distributed under the terms and conditions of the Creative Commons Attribution (CC BY) license (https:// creativecommons.org/licenses/by/ 4.0/). sustainability Article Environmental Impact Evaluation of University Integrated Waste Management System in India Using Life Cycle Analysis Amit Kumar Jaglan 1 , Venkata Ravi Sankar Cheela 2, *, Mansi Vinaik 3 and Brajesh Dubey 4 1 Amity School of Architecture & Planning, Amity University, Noida 201313, India; [email protected] 2 Department of Civil Engineering, MVGR College of Engineering (A), Vizianagaram 535005, India 3 School of Management and Liberal Studies, The NorthCap University, Gurugram 122017, India; [email protected] 4 Department of Civil Engineering, Indian Institute of Technology Kharagpur, Kharagpur 721302, India; [email protected] * Correspondence: [email protected] Abstract: Decarbonization of university campuses by integrating scientific waste approaches and circular economy principles is the need-of-the-hour. Universities, the maximum energetic corpo- rations and places for clinical studies and social activities, have a duty to assemble low-carbon campuses and play a vital function in lowering CO 2 emissions. An environmental life cycle as- sessment was conducted to compare proposed municipal solid waste (MSW) treatment systems with the existing system in the residential university campus (RUC) in Kharagpur, West Bengal (India). The results show the existing MSW disposal practice in RUC (baseline scenario has the highest GWP (1388 kg CO 2 eq), which can potentially be reduced by adopting integrated waste management system with source segregation as represented in futuristic scenarios (S2—50% sorting) and (S3—90% sorting)). Compared to S1, GHG emission was reduced by 50.9% in S2 and by 86.5% in S3. Adopting anaerobic digestion and engineered landfill without energy recovery offsets the environmental emissions and contributes to significant environmental benefits in terms of ecological footprints. Capital goods play a pivotal role in mitigation the environmental emissions. The shift towards S2 and S3 requires infrastructure for waste collection and sorting will contribute to reduction of associated environmental costs in the long-term. Keywords: municipal solid waste; life cycle assessment; global warming potential; anaerobic digestion; landfill 1. Introduction With high population density and the varied nature of domestic and scientific activi- ties, universities could be considered as “small cities” [1–3]. These activities generate large quantities of waste, which have similar characteristics of that generated by different urban spaces such as towns and cities [4,5]. This makes them apt testing grounds for plans that can be replicated at city/town levels [6]. Therefore, it becomes imperative for universities to incorporate practices of sustainability, representing environments for practical learning, research, and operating as living labs [7–9]. Building a pervasive and holistic waste manage- ment system should be a major component of university planning and expansion [10,11]. This can create a synergetic effect and assist in spreading this practice to different urban spaces. By applying suitable technologies, an integrated solid waste management plan can reduce waste generation and propel recycling [12]. The stepping-stone of this plan is understanding the quantity, nature, and characteristics of the solid waste being generated on campus, allowing for the adoption of effective waste management strategies, carried out most efficiently by direct waste audit [13]. Cornell University, Brown University, Col- orado State University, Universidad Autonoma Metropolitan, Barcelona, Asian Institute of Technology, and University of Northern British Columbia are leading examples [14]. Sustainability 2022, 14, 8361. https://doi.org/10.3390/su14148361 https://www.mdpi.com/journal/sustainability
-
Upload
khangminh22 -
Category
Documents
-
view
4 -
download
0
Transcript of Environmental Impact Evaluation of University Integrated ...

Citation: Jaglan, A.K.; Cheela, V.R.S.;
Vinaik, M.; Dubey, B. Environmental
Impact Evaluation of University
Integrated Waste Management
System in India Using Life Cycle
Analysis. Sustainability 2022, 14, 8361.
https://doi.org/10.3390/su14148361
Academic Editors: Sunil Kumar,
Pooja Sharma and Deblina Dutta
Received: 30 April 2022
Accepted: 4 July 2022
Published: 8 July 2022
Publisher’s Note: MDPI stays neutral
with regard to jurisdictional claims in
published maps and institutional affil-
iations.
Copyright: © 2022 by the authors.
Licensee MDPI, Basel, Switzerland.
This article is an open access article
distributed under the terms and
conditions of the Creative Commons
Attribution (CC BY) license (https://
creativecommons.org/licenses/by/
4.0/).
sustainability
Article
Environmental Impact Evaluation of University IntegratedWaste Management System in India Using Life Cycle AnalysisAmit Kumar Jaglan 1, Venkata Ravi Sankar Cheela 2,*, Mansi Vinaik 3 and Brajesh Dubey 4
1 Amity School of Architecture & Planning, Amity University, Noida 201313, India; [email protected] Department of Civil Engineering, MVGR College of Engineering (A), Vizianagaram 535005, India3 School of Management and Liberal Studies, The NorthCap University, Gurugram 122017, India;
[email protected] Department of Civil Engineering, Indian Institute of Technology Kharagpur, Kharagpur 721302, India;
[email protected]* Correspondence: [email protected]
Abstract: Decarbonization of university campuses by integrating scientific waste approaches andcircular economy principles is the need-of-the-hour. Universities, the maximum energetic corpo-rations and places for clinical studies and social activities, have a duty to assemble low-carboncampuses and play a vital function in lowering CO2 emissions. An environmental life cycle as-sessment was conducted to compare proposed municipal solid waste (MSW) treatment systemswith the existing system in the residential university campus (RUC) in Kharagpur, West Bengal(India). The results show the existing MSW disposal practice in RUC (baseline scenario has thehighest GWP (1388 kg CO2 eq), which can potentially be reduced by adopting integrated wastemanagement system with source segregation as represented in futuristic scenarios (S2—50% sorting)and (S3—90% sorting)). Compared to S1, GHG emission was reduced by 50.9% in S2 and by 86.5%in S3. Adopting anaerobic digestion and engineered landfill without energy recovery offsets theenvironmental emissions and contributes to significant environmental benefits in terms of ecologicalfootprints. Capital goods play a pivotal role in mitigation the environmental emissions. The shifttowards S2 and S3 requires infrastructure for waste collection and sorting will contribute to reductionof associated environmental costs in the long-term.
Keywords: municipal solid waste; life cycle assessment; global warming potential; anaerobicdigestion; landfill
1. Introduction
With high population density and the varied nature of domestic and scientific activi-ties, universities could be considered as “small cities” [1–3]. These activities generate largequantities of waste, which have similar characteristics of that generated by different urbanspaces such as towns and cities [4,5]. This makes them apt testing grounds for plans thatcan be replicated at city/town levels [6]. Therefore, it becomes imperative for universitiesto incorporate practices of sustainability, representing environments for practical learning,research, and operating as living labs [7–9]. Building a pervasive and holistic waste manage-ment system should be a major component of university planning and expansion [10,11].This can create a synergetic effect and assist in spreading this practice to different urbanspaces. By applying suitable technologies, an integrated solid waste management plancan reduce waste generation and propel recycling [12]. The stepping-stone of this plan isunderstanding the quantity, nature, and characteristics of the solid waste being generatedon campus, allowing for the adoption of effective waste management strategies, carriedout most efficiently by direct waste audit [13]. Cornell University, Brown University, Col-orado State University, Universidad Autonoma Metropolitan, Barcelona, Asian Institute ofTechnology, and University of Northern British Columbia are leading examples [14].
Sustainability 2022, 14, 8361. https://doi.org/10.3390/su14148361 https://www.mdpi.com/journal/sustainability

Sustainability 2022, 14, 8361 2 of 18
The active role played by university campuses in reducing greenhouse gas emission,waste management, and creating awareness has been highlighted [15]. Different studies onvarious institutions of higher education have brought out insights into waste management.A few examples include a study on the University of Gavle, which brought out the impor-tance of training for efficient implementation of the waste management system [16]; a studyon the University of Maribor (Engineering Campus), which proposed a waste managementplan with comprehensive options to manage plastic and paper waste [17,18]. Similarly, astudy carried out at UK University provided a deep understanding of the classificationof the WRI/WBCSD Greenhouse Gas Protocol Corporate Standard [19,20]. Universitiesacross the world have been working on greening their campuses, establishing standardssuch as ISO 14001, creating an ecological campus based on an ecological technique style,ecological education, and a management style, establishing an indicator system to evaluatethe performance of one green university project [21]. Life cycle assessment (LCA) is a toolto quantify or compare the environmental impacts of product(s) or service(s) throughoutits life cycle, i.e., from raw material extraction to disposal. International Standard Organiza-tion (ISO) standardized the methodological framework for life cycle assessment (LCA) toevaluate impacts from an environmental perspective (ISO, 2006). The ISO 14040 (2006) and14044 (2006) guidelines include instructions on how to perform and report LCA studies.Application of LCA in MSW provides a holistic perspective in identifying acceptable and en-vironmentally sound solutions. Waste LCA tools have been developed since the early 1990swith an aim to evaluate the environmental performance by modelling waste managementsystems. Compared to product LCA tools, waste LCA evaluate environmental performanceof interconnected waste treatment systems based on physico-chemical characteristics ofwaste from generation to final disposal. The waste LCA model has an ability to modelvariations in fractional waste content, operation specific emissions, substitution of energysystems, include country-specific energy mix, manufacturing of primary resources, andassessment of interconnected systems ranging from collection to final disposal. However,the models suffer lack of harmonization due to complexity in waste systems modelling andapplication of country-specific datasets [22–25].
Recently, the majority of higher educational institutions (HEIs) have carried out ‘green’drives [26]. At present, more than 400 institutional organizations have marked a Presidents’Climate Leadership Commitment. Numerous HEIs are revealing their GHG emissionsstock using the Sustainability Indicator Management and Analysis Platform (SIMAP),which was already the Clean Air-Cool Planet Campus Carbon Calculator, while othersare utilizing their own custom devices and/or contracting external firms to compile theircarbon footprint [27]. The current investigation aims to evaluate the environmental profilesof the use of the life cycle approach for an Indian residential university campus (RUC).This research is the maiden work in an Indian context, which can be a base model for otherhigher education institutes in emerging economies.
2. Materials and Methods2.1. Study Area
The unlined landfill facility in the study area is located in the northeast corner of theuniversity campus in Kharagpur, West Bengal state (India). The landfill is located amid acampus within a proximity of 130 km radius from the Bay of Bengal, at an elevation of 33.5 mfrom the mean sea level. The operations in the dumpsite began in late 2005, spreadingover nine acres of land. The height of the waste heaps varies between 10 and 12 m. Theaverage amount of MSW reaching landfills is 12.6 ± 2 tons per day. The public healthand sanitation department in the Indian Institute of Technology Kharagpur is the councilauthority administrating the solid waste management activities. The geographic locationof the study area is shown in Figure 1.

Sustainability 2022, 14, 8361 3 of 18
Sustainability 2022, 14, x FOR PEER REVIEW 3 of 19
This study aims to use the life cycle analysis (LCA) approach to compare the envi-ronmental impacts of different waste management alternatives and identify the most via-ble management scenario with minimal environmental impacts. The scenarios include various MSWM options, such as MRF, composting, AD, incineration, and landfilling. The impact categories, such as global warming potential (GWP), terrestrial acidification (TA), freshwater eutrophication (FEW), marine water eutrophication (ME), human toxicity (HTP), terrestrial ecotoxicity (TE), freshwater ecotoxicity (FWT), and marine ecotoxicity (MET) impacts were determined for each option.
Figure 1. The geographic location of the study area.
2.2. Physical Characterization of Municipal Solid Waste The physical characterization of MSW was performed as per ASTM 5231D: 2016 pro-
tocol. The waste sampling campaign was performed at the unlined landfill facility in the University campus. Stratified random sampling was used for the collection of waste sam-ples. The quartering method was implemented to prepare representative samples for the determination of physicochemical characteristics. The code of practices used for the de-termination of moisture content was ASTM E1756-08, percentage of volatile matter [28], ash content [29], elemental analysis [30], and energy content was [31].
2.3. Waste Management Scenarios A waste treatment strategy was developed based on the waste characteristics deter-
mined in the aforementioned section. The systems boundaries of existing and proposed waste treatment strategies are shown in Figure 2.
Figure 1. The geographic location of the study area.
This study aims to use the life cycle analysis (LCA) approach to compare the en-vironmental impacts of different waste management alternatives and identify the mostviable management scenario with minimal environmental impacts. The scenarios includevarious MSWM options, such as MRF, composting, AD, incineration, and landfilling. Theimpact categories, such as global warming potential (GWP), terrestrial acidification (TA),freshwater eutrophication (FEW), marine water eutrophication (ME), human toxicity (HTP),terrestrial ecotoxicity (TE), freshwater ecotoxicity (FWT), and marine ecotoxicity (MET)impacts were determined for each option.
2.2. Physical Characterization of Municipal Solid Waste
The physical characterization of MSW was performed as per ASTM 5231D: 2016 protocol.The waste sampling campaign was performed at the unlined landfill facility in the Univer-sity campus. Stratified random sampling was used for the collection of waste samples. Thequartering method was implemented to prepare representative samples for the determina-tion of physicochemical characteristics. The code of practices used for the determination ofmoisture content was ASTM E1756-08, percentage of volatile matter [28], ash content [29],elemental analysis [30], and energy content was [31].
2.3. Waste Management Scenarios
A waste treatment strategy was developed based on the waste characteristics deter-mined in the aforementioned section. The systems boundaries of existing and proposedwaste treatment strategies are shown in Figure 2.

Sustainability 2022, 14, 8361 4 of 18Sustainability 2022, 14, x FOR PEER REVIEW 4 of 19
Figure 2. Scenarios for the management of municipal solid waste S1: Unlined landfill (business-as-usual); S2 and S3: Integrated waste treatment facility (waste sorting percentage is the variable pa-rameters S2 (50%) and S3 (90%)).
2.3.1. Scenario (S1)—Business-As-Usual (BAU): Open Dumping This scenario represents the current MSW disposal method in the RUC of Kharagpur.
The waste complied by the departmental workers of sanitation is further disposed within the campus in the unlined landfill. There is a huge discharge of greenhouse gas due to the decomposition of the waste. The greenhouse gas is produced due to the emission of me-thane gas during the process of anaerobic decomposition of the waste. Methane (CH4) has a global impact and methane emission is approximately 5% due to the anaerobic decom-position. The fusion of the waste with the rainwater and the moisture leads to the produc-tion of toxic liquid leachate.
2.3.2. Scenario (S2 & S3)—Integrated Waste Treatment Facility with 50 & 90% Waste Sorting
Integrated waste treatment is a systematic method used for the sustainable manage-ment of waste. In this process, waste is disposed into the landfill along with the leachate process and the gas collection system. Gas produced is further collected and flared before discharging into the environment. As suggested by the IPSS, the total landfill gas (LFG) is calculated using a first-order degradation model. The collection efficiency is estimated to be approximately 60% [32] and the surface oxidation efficiency of CH4 from the fugitive emission to be approximately 15% to 20% [33]. The overall power consumed for the leach-ate treatment is about 25 to 30 kWh/ton. In this process, the organic fraction of waste is separated and transported to the anaerobic digestion unit. The leftover waste is disposed of in the engineered landfill, with no energy recovered. In this process, the leachate treat-ment and the gas collection processes are also considered. Before releasing the gas into the environment, it is flared. During the course of the anaerobic decomposition, about 30% of the biogas is released, which is used for the generation of electricity [34]. The collection efficiency, in this case, is found to be approximately 95%. The same process is used for the
Figure 2. Scenarios for the management of municipal solid waste S1: Unlined landfill (business-as-usual); S2 and S3: Integrated waste treatment facility (waste sorting percentage is the variableparameters S2 (50%) and S3 (90%)).
2.3.1. Scenario (S1)—Business-As-Usual (BAU): Open Dumping
This scenario represents the current MSW disposal method in the RUC of Kharagpur.The waste complied by the departmental workers of sanitation is further disposed withinthe campus in the unlined landfill. There is a huge discharge of greenhouse gas due tothe decomposition of the waste. The greenhouse gas is produced due to the emissionof methane gas during the process of anaerobic decomposition of the waste. Methane(CH4) has a global impact and methane emission is approximately 5% due to the anaerobicdecomposition. The fusion of the waste with the rainwater and the moisture leads to theproduction of toxic liquid leachate.
2.3.2. Scenario (S2 & S3)—Integrated Waste Treatment Facility with 50 & 90% Waste Sorting
Integrated waste treatment is a systematic method used for the sustainable manage-ment of waste. In this process, waste is disposed into the landfill along with the leachateprocess and the gas collection system. Gas produced is further collected and flared beforedischarging into the environment. As suggested by the IPSS, the total landfill gas (LFG)is calculated using a first-order degradation model. The collection efficiency is estimatedto be approximately 60% [32] and the surface oxidation efficiency of CH4 from the fugi-tive emission to be approximately 15% to 20% [33]. The overall power consumed for theleachate treatment is about 25 to 30 kWh/ton. In this process, the organic fraction ofwaste is separated and transported to the anaerobic digestion unit. The leftover wasteis disposed of in the engineered landfill, with no energy recovered. In this process, theleachate treatment and the gas collection processes are also considered. Before releasing thegas into the environment, it is flared. During the course of the anaerobic decomposition,about 30% of the biogas is released, which is used for the generation of electricity [34]. Thecollection efficiency, in this case, is found to be approximately 95%. The same process isused for the treatment of biogas slurry, which was used for the treatment of leachate. Thedigestive residue is applied to land as a replacement for mineral fertilizer.

Sustainability 2022, 14, 8361 5 of 18
2.4. Life Cycle Assessment
The LCA methodology outlined in ISO 14040-44:2006 standards was implemented forthe evaluation of environmental impacts. The methodology includes four steps: (1) goaland scope, (2) life cycle inventory (LCI), (3) life cycle impact assessment (LCIA), and (4) lifecycle interpretation.
2.4.1. Goal and Scope Definition
The main objective of this study is to compare various MSW management techniquesusing a life cycle perspective. As the study area, the RUC Kharagpur, India, was considered.The amount of MSW generated into the campus was integrated for the study. This area wasconsidered in order to compare and analyze the various alternative processes. For the studyof this scenario, an integrated waste management plan (IWMP) was implemented at thelandfill site. In this process, anaerobic digestion, incineration, and engineered landfilling(with or without the energy recovery) were considered. The effect of a collection of wasteand transportation of waste was presumed to be identical in all the scenarios during theprocess. This is due to the same process location. Emission related to the energy producedwhile the manufacturing of the massive types of equipment and goods that were notincluded in the LCA modeling process was used widely in the study [35,36]. A first-orderdecay model calculated the production estimate of methane and carbon dioxide on thematerial fraction elemental composition of waste and associated decay rates. The volumeof leachate produced was calculated by the infiltration rate, waste layer height, and bulkdensity [37]. In the current study, an environmental assessment was performed to handleand manage 1 ton of MSW in the study area. The waste was collected at the waste facility.The complete waste was treated using a combination of treatment technologies presentedin the scenarios provided. All the environmental acknowledgments corresponding tothese scenarios are contemplated according to their corresponding abilities to generate theappropriate products such as slurry with the fertilizer and energy from incineration withthe grid electricity. The system confines all the waste treatments and processes compiled. Ithelps in monitoring the performance. Thus, the allocation was not investigated.
2.4.2. Life Cycle Inventory Data
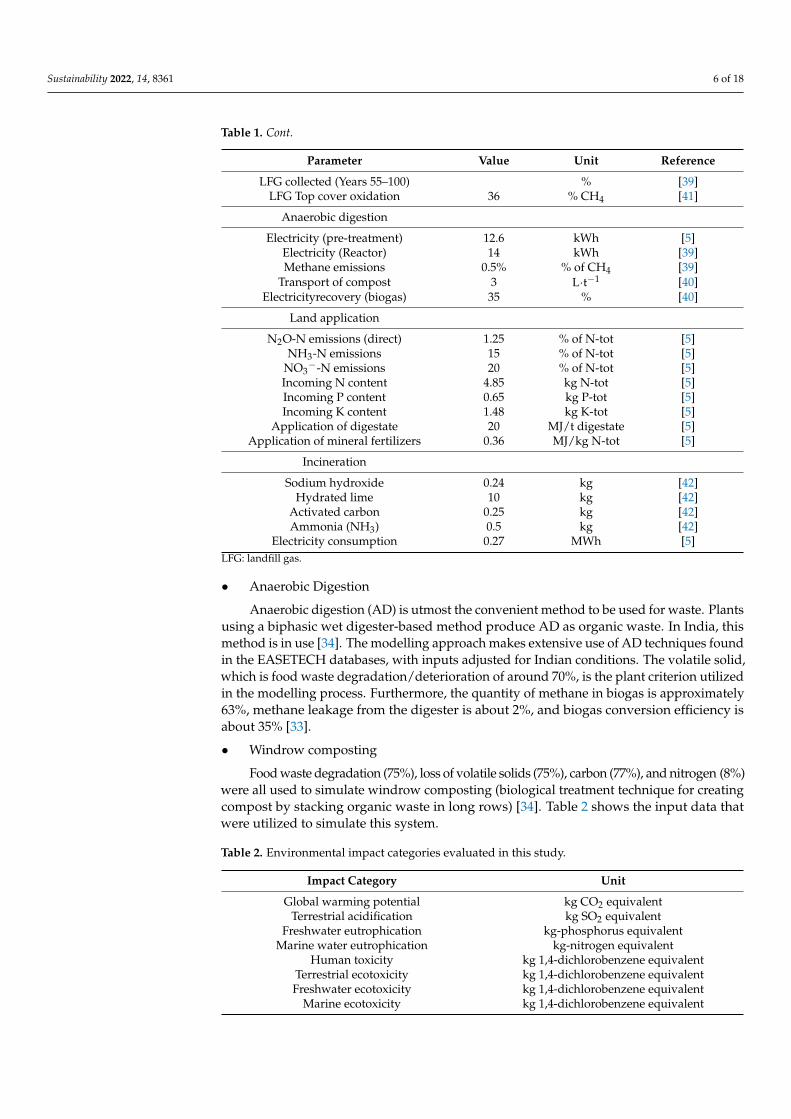
An environmental impact assessment requires the completion of a life cycle inven-tory (LCI). During the life cycle stages of waste management systems, LCI measures thenumber of inputs in terms of material and energy, as well as outputs in terms of emissionsand wastes. The inventory information is used to create the flow of inputs and outputsthrough the various stages of the life cycle. In this study, the dataset considered is from theEASETECH database (developed by the Technical University of Denmark). This databasewas used for the engineered landfills. It consists of the gas flaring and energy recoverysystem. It was treated using EASETECH v3.7-LCA-model for the assessment of the environ-mental technology. There is a significant lack of Indian-specific landfill datasets for variousgeographical areas. Gas collection and utilization were projected to occur over 55 years,with no collection assumed for the next 45 years; however, gas oxidation was expectedto occur in the top layer [38]. The dataset supplied [39] was used to examine leachatecollection and treatment. Table 1 shows the input data that were utilized to simulatethis system.
Table 1. Life cycle inventory data for 1 ton of MSW.
Parameter Value Unit Reference
Landfill
Diesel consumption 2 L·t−1 [40]Methane generation 55 % [38]
LFG Collection efficiency 90 % [38]LFG collected (Years 0–55) 95 % [39]
Sustainability 2022, 14, 8361 6 of 18
Table 1. Cont.
Parameter Value Unit Reference
LFG collected (Years 55–100) % [39]LFG Top cover oxidation 36 % CH4 [41]
Anaerobic digestion
Electricity (pre-treatment) 12.6 kWh [5]Electricity (Reactor) 14 kWh [39]Methane emissions 0.5% % of CH4 [39]
Transport of compost 3 L·t−1 [40]Electricityrecovery (biogas) 35 % [40]
Land application
N2O-N emissions (direct) 1.25 % of N-tot [5]NH3-N emissions 15 % of N-tot [5]
NO3−-N emissions 20 % of N-tot [5]
Incoming N content 4.85 kg N-tot [5]Incoming P content 0.65 kg P-tot [5]Incoming K content 1.48 kg K-tot [5]
Application of digestate 20 MJ/t digestate [5]Application of mineral fertilizers 0.36 MJ/kg N-tot [5]
Incineration
Sodium hydroxide 0.24 kg [42]Hydrated lime 10 kg [42]
Activated carbon 0.25 kg [42]Ammonia (NH3) 0.5 kg [42]
Electricity consumption 0.27 MWh [5]LFG: landfill gas.
• Anaerobic Digestion
Anaerobic digestion (AD) is utmost the convenient method to be used for waste. Plantsusing a biphasic wet digester-based method produce AD as organic waste. In India, thismethod is in use [34]. The modelling approach makes extensive use of AD techniques foundin the EASETECH databases, with inputs adjusted for Indian conditions. The volatile solid,which is food waste degradation/deterioration of around 70%, is the plant criterion utilizedin the modelling process. Furthermore, the quantity of methane in biogas is approximately63%, methane leakage from the digester is about 2%, and biogas conversion efficiency isabout 35% [33].
• Windrow composting
Food waste degradation (75%), loss of volatile solids (75%), carbon (77%), and nitrogen (8%)were all used to simulate windrow composting (biological treatment technique for creatingcompost by stacking organic waste in long rows) [34]. Table 2 shows the input data thatwere utilized to simulate this system.
Table 2. Environmental impact categories evaluated in this study.
Impact Category Unit
Global warming potential kg CO2 equivalentTerrestrial acidification kg SO2 equivalent
Freshwater eutrophication kg-phosphorus equivalentMarine water eutrophication kg-nitrogen equivalent
Human toxicity kg 1,4-dichlorobenzene equivalentTerrestrial ecotoxicity kg 1,4-dichlorobenzene equivalentFreshwater ecotoxicity kg 1,4-dichlorobenzene equivalent
Marine ecotoxicity kg 1,4-dichlorobenzene equivalent

Sustainability 2022, 14, 8361 7 of 18
2.4.3. Life Cycle Impact Assessment
Process modeling is achieved by integrating physio-chemical characteristics of thewaste fractions. Using a software tool, the EASETECH v3.7-LCA-model, various scenar-ios of environment aspects were analyzed. For analyzing the impact study, the ReCipe2016 midpoint world method/technique was considered. ReCipe technique is the con-solidation of the CML method and Eco-indicator 99 presenting the wider view of impactcategories. The LCIA impact categories were used for analyzing global warming potential,terrestrial acidification, marine eutrophication, human toxicity, terrestrial ecotoxicity, fresh-water ecotoxicity, terrestrial ecotoxicity, and marine ecotoxicity. The time horizon taken forthe reference was 100 years for global warming potential. This time is taken into considera-tion for the climate change policy [43]. Moreover, for the impact of acidification, toxicityimpact levels have had a huge impact on future generations for more than 100 years. In thisstudy, 100 years are considered as the period to find the inventory. The ReCiPE Midpoint(Heuristic) World model was used for determining the characteristics of the environmentalframe/profiles of the alternatives. Impact assessment methodologies give a hierarchicalview of about 100 years’ time period and also include large numbers of midpoint indicatorson a global scale. The impact category is subdivided into two categories, namely toxic andnon-toxic. In this study, land and water use were not included due to their dependencyon geographical locations [38]. The impact category was determined by analyzing LCAstudies accomplished in Indian scenarios (Table 1), as indexed in Table 2.
3. Results3.1. Physicochemical Characteristics of MSW
The physico-chemical characteristic of MSW collected by the first author was deter-mined as a part of this research. The MSW is majorly composed of organic matter, which isfood waste 59%, yard waste 17%, plastic 5%, cardboard 4%, polythene bags 4%, paper 2.6,glass 2.5%, inert 1.8%, leather 0.85%, other 0.80%, metal 0.60%, and e-waste 0.43%. InFigure 3, the physical characteristics of MSW are presented/demonstrated. Organic wasteis mostly composed of food and yard waste. The inert and other components consist ofsand, silt, dust, grit, ash, inseparable paper, and food residues, street sweeping waste, draincleaning waste, and construction debris. As per the chemical classification of MSW, studyshows that the moisture amount is about 7% to 52%, volatile solid is about 38% to 43%,carbon amount is about 33% to 47%, the oxygen content is about 36% to 65%, the hydrogencontent is about 3.75% to 9.1%, sulphur and nitrogen content is about 2%, and calorific isabout 4300 kcal/g to 4730 kcal/g (on dry basis).
3.2. Life Cycle Impact Assessment Results3.2.1. Global Warming Potential
Global warming potential (GWP) has a huge impact on the environment, which isestimated in the terms of kg CO2 equivalent, as demonstrated in Figure 3a. Scenario (S1)has the maximum GWP with an absolute value equivalent to the amount of 1388 kgCO2. Fugitive emission causes approximately 99% of the total emission. The remaining1% of the emissions is caused by the waste leveling process, compaction process, andtransportation process. In comparison to scenario (S1), analysis shows that in scenario (S2),the GHG emission is reduced by 50.9%, and in scenario (S3) it is reduced by 86.5%. Landfillconstruction and operation, leachate collection, and management process contribute to80% of emissions. The collection process and transportation process of MSW to the unifiedwaste facility contribute up to 9.393 k CO2 eq.
In scenario S2, the development of integrated waste management (IWM) systems with50% sorting (S2) contributes to 681.8 kg CO2 eq of GWP emissions. The LFG is the majoremissions (648.6 kg CO2 eq) contributing process. The waste technique that contributes toemission in the impact category/sector is the oxidation of gas in landfills, which is about68.7%. The landfill construction process is about 23.8% and the gas flaring process is about7.4%. The gases that are contributing the most in these scenarios are methane with about

Sustainability 2022, 14, 8361 8 of 18
76.3%, carbon dioxide with about 23.5%, and nitrous oxide with about 0.2%. In scenario S3,with 90% sorting of waste, the LFG is the major emissions (178 kg CO2 eq) contributingprocess followed by AD (26.8 kg CO2 eq) and WC (20.7 kg CO2 eq).
Sustainability 2022, 14, x FOR PEER REVIEW 8 of 19
Figure 3. Characterized impact results for (a) global warming potential; (b) terrestrial acidification; (c) fresh water eutrophication; (d) marine eutrophication; (e) human toxicity potential; (f) terrestrial ecotoxicity; (g) fresh water ecotoxicity; and (h) marine ecotoxicity.
3.2. Life Cycle Impact Assessment Results 3.2.1. Global Warming Potential
Global warming potential (GWP) has a huge impact on the environment, which is estimated in the terms of kg CO2 equivalent, as demonstrated in Figure 3a. Scenario (S1) has the maximum GWP with an absolute value equivalent to the amount of 1388 kg CO2. Fugitive emission causes approximately 99% of the total emission. The remaining 1% of the emissions is caused by the waste leveling process, compaction process, and transpor-tation process. In comparison to scenario (S1), analysis shows that in scenario (S2), the GHG emission is reduced by 50.9%, and in scenario (S3) it is reduced by 86.5%. Landfill construction and operation, leachate collection, and management process contribute to
Figure 3. Characterized impact results for (a) global warming potential; (b) terrestrial acidification;(c) fresh water eutrophication; (d) marine eutrophication; (e) human toxicity potential; (f) terrestrialecotoxicity; (g) fresh water ecotoxicity; and (h) marine ecotoxicity.
The waste technique contributing to emissions in the impact category is gas oxidationin landfills, which is about 74.3%, and the landfill construction process is about 25.7%.The gases that are contributing the most in these scenarios are methane with about 74.6%,carbon dioxide with about 25.3%, and nitrous oxide with about 0.1%. The process ofdisposing of treated leachate into the land leads to a reduction in emissions by 82.6%, whilesubstituting the grid electricity to the LFG electricity reduces the emissions by 177.4%.Moreover, the usage of landfill gas (i.e., methane, which causes 28 times more globalwarming in comparison to CO2) for energy substitution reduces the GHG emissions in
Sustainability 2022, 14, 8361 9 of 18
comparison with scenario S2, which explodes the methane gas. Anaerobic digestion andlandfill without energy recovery are analyzed as the best GHG reduction methods.
At the University of Leeds, UK, an Extended Environmental Input-Output Analysis(EEIO) was used to estimate the carbon emissions of purchases, documents production,waste, energy, rental properties, transportation, purchased goods, and services. Repeatedsemi-structured interviews were conducted with the university’s procurement staff toobtain the required data. Emissions in scope 3 account for about 51% of total emissions,while scope 1 and range 2 account for 18% and 31%, respectively [44]. The University ofIllinois, Chicago (UIC), in its estimate of greenhouse gas emissions from 2004 to 2008, foundthat in 2008, the most impactful emissions were from buildings (83%), tracked moves (16%),and waste (1%). Power plants, with cogeneration facilities, generate 63% of total GHGemissions, followed by purchased electricity (17%). UIC also used the GHG protocoldefined by the World Resources Institute (WRI)/World Business Council for SustainableDevelopment (WBCSD) [45].
At the University of Cape Town (UCT) in South Africa, this evaluation is split into threeparts: campus power emissions, shipping emissions, and goods and offerings emissions. Inthis study, if the facts precise to South Africa became unavailable, then IntergovernmentalPanel on Climate Change (IPCC) emissions elements and applicable literature were usedto estimate the carbon emissions. Electricity utilized in entire college bills for 81% of thewhole carbon emissions. From the University of Montfort, UK, this study is based on theWorld Resources Institute (WRI)/World Business Council for Sustainable Development(WBCSD) GHG protocol. Direct and indirect emissions from fossil fuels are consideredin scopes 1 and 2, and indirect emissions from shopping, tourism, commuting, and othersources are considered in scope 3 of the resolution letter designation. Scope 3 contributes79% of the total FC, with the main contribution being supplied (48%), contributing 38% ofthe total emissions. The scope definition used in this study is similar to that of ISO 14064I(ISO, 2006), to quantify, report, and eliminate GHG emissions at the organizational level [46].
3.2.2. Terrestrial Acidification
Environment impacts related to terrestrial acidification are evaluated in the termsof kg SO2 equivalent, as demonstrated in Figure 3b. In scenario (S1), the net value is0.004 kg SO2 eq. Techniques used for water handling (compacting, leveling, and internaltransportation) at the dumping area generate environmental emissions. In scenario (S2), thenet value for the terrestrial acidification category is 2.65 kg SO2 eq. The maximum emissionis produced due to the waste treatments and the construction process, and the operation oflandfills is about 89.1%, leachate process is about 6.8%, and the gas-flaring process is about4.1%. It is analyzed that in this scenario, three main gases contribute to TA, i.e., nitrogenoxide gas is about 60%, sulphur dioxide gas is about 39.8%, and ammonia gas is about0.2%. In scenario (S3), it is analyzed that the TA impact categories net value is 0.017 PE(0.610 kg SO2 eq.). The waste processes that contribute to the TA are the constructionprocess and the operation of the landfill process, which is about 85.7%, energy conversationtechniques are about 7.7%, and the leachate technique is about 6.6%. The most prominentgases that contribute to TA are sulphur dioxide with about 67.6% and nitrogen oxide withabout 32.4%.
3.2.3. Freshwater Eutrophication
The FEW’s environmental consequences are measured in kilograms of phosphorusequivalent, as shown in the Figure 3c. In scenario (S1), the effect category’s net value is in-significant. In the impact category, the net value for scenario (S2) is around 2.8 × 10⁻⁴ kg-P eq.The greatest emissions created by waste treatments include leachate treatment, which ac-counts for about 99.5% of total emissions, and landfill and construction operations, whichaccount for around 0.5%. The net value in scenario (S3) is 4.8 × 10⁻⁴ kg-P eq. Leachatetreatment accounts for 91.8% of the FEW, whereas leachate disposal accounts for 7.7%,construction accounts for 0.5%, and landfill operation account for 0.5%. The emission off-

Sustainability 2022, 14, 8361 10 of 18
setting unit process in this case is electricity substitution. Composting is the most effectivetechnique for reducing emissions, whereas electricity replacement has a minor impact. Inthis scenario, power substitution is the primary emission-reducing unit process. The bestimpact categories are AD and landfills without energy recovery, and 8.1 × 10⁻⁶ units arecontributed by MSW collection and transportation to the integrated waste facility.
3.2.4. Marine Eutrophication
Environment impacts related to the ME are evaluated in the terms of kg-nitrogen equiv-alent, as demonstrated in Figure 3d. In scenario (S2), the net value is 1.50 × 10⁻⁴ kg-N eq.in the impact category. The maximum emissions produced due to the waste treatmentsare leachate treatment with about 91% and the operation of landfills and constructionwith about 8.3%, also gas flaring with about 0.7%. In scenario (S3), the net value is3.1 × 10−4 kg-P eq. The waste processes that contribute to the FEW are leachate treat-ment, which is 91.8%, leachate disposal that is 7.7%, and the construction process andthe operation of landfill process, which is about 0.5%. In scenario (S3), the net value is0.167 kg-P eq. The waste processes that contribute to the FEW are leachate treatment, whichis 85.3%, the construction process and the operation of landfill process, which is about 7.8%,leachate disposal, which is about 3.8%, and electricity substitution which is about 3.0%.Landfills without energy recovery is analyzed as the best impact category. The collectionand transportation of MSW to the integrated waste facility contribute 0.0036 units.
3.2.5. Human Toxicity Potential
As shown in Figure 3e, the environmental consequences of the HTP, TE, FWT, andMET are measured in kilograms of 1,4-dichlorobenzene equivalent, 5 a.m. to 5 p.m. Inscenario (S2), the net value in all effect categories is zero. The net value of 3.026 kg1,4-dichlorobenzene equivalent is found in scenario S2, HTP impact category. The greatestemissions produced by waste treatments are 44.8%from landfill operations and construction,31.4% from leachate treatment, 12.7% from gas flaring, and 11.1% from the oxidation processof gas in landfills. The net value in scenario (S3) is 2.409 kg 1,4-dichlorobenzene equivalent.Construction and operation of the landfill process, which accounts for roughly 50.5%, andleachate treatment, which accounts for 35.5%, are the waste processes that contribute. In thiscase, the emission-reducing unit process is grid electricity replacement. In this scenario, theemission-reducing unit process is the land replacement, which reduces emissions by 99%.In this case, the emission-reducing unit process is electricity substitution, and 0.0182 unitsare contributed by MSW collection and transportation to the integrated waste facility.
3.2.6. Terrestrial Ecotoxicity Potential
The emissions associated with the TEP impact category are shown in Figure 3f. Inscenario (S2), the net value is 0.051 kg 1,4 DB eq in the TEP impact category. The maximumemissions produced due to the waste treatments are leachate treatment with about 97.2%and the operation of landfills and construction with about 2.8%. In scenario (S3), the netvalue is 0.052 kg 1,4 DB eq. Leachate treatment, which accounts for 92.6%of the TEP, is oneof the waste processes that contribute to it. In this case, the emission offsetting unit methodis grid electricity replacement, and 1.5 × 10⁻⁴ units are contributed by MSW collection andtransportation to the integrated waste facility.
3.2.7. Freshwater Ecotoxicity
The emissions associated with FWE impact category are shown in Figure 3g. In theFWT impact category, the net value in scenario (S2) is 0.025 kg 1,4 DB eq. The highestemission produced by waste treatments is around 98.2%by leachate treatment. The netvalue in scenario (S3) is 0.024 kg 1,4 DB eq. Leachate treatment, which accounts for 91.1%of the FWT, is one of the waste processes that contribute to it. In this case, the emission-reducing unit process is electricity substitution. In this case, the emission offsetting unit

Sustainability 2022, 14, 8361 11 of 18
method is electricity substitution, and 4.1 × 10⁻⁴ units are contributed by MSW collectionand transportation to the integrated waste facility.
3.2.8. Marine Ecotoxicity
The emissions associated with ME impact category is shown in Figure 3g. In scenario (S2),the net value is 0.039 kg 1,4 DB eq. in the ME impact category. The maximum emissionsproduced due to the waste treatments are leachate treatment with about 52.3% and theoperation of landfills and construction with about 47.1%. In scenario (S3), the net valueis 0. 0.029 kg 1,4 DB eq. The waste processes that contribute to the TEP are leachatetreatment, which is 50.2%, and the operation of landfills and construction, which is about45.2%. In this case, the emission-reducing unit process is grid electricity replacement.The primary emission offsetting unit process in this scenario is electricity substitution,and 1.1 × 10⁻³ units were provided by the collection and transportation of MSW to theintegrated waste facility.
4. Discussion4.1. Bioeconomy Fertilizers
The idea of a circular economy depends on reuse, valorization, recycling, and misuseof environmental cycles. Although this idea is broadly examined experimentally andstrategically, it has just been disjointly applied practically. In the elaboration of bio-basedcompost innovations, the following perspectives are significant: the ecological effect thatneeds to be limited, resources ought to be utilized in a regenerative manner with thethought of resource shortage issue, and advancements must guarantee productivity andmonetary advantages to modern attempts. Limitations of normal resources and naturalsecurity ought to be a need, however, with supporting business prerequisites for financialadvantages. The commitment to discard waste is the duty of agri-food makers, for example,cultivating plants that produce organic waste. Enormous agri-food cultivating plants sendbusiness staple items to the beneficiaries, without waste, for example, chickens as carcass.Slaughter waste remains should be used sustainably. In this way, facilities deliveringcomposts from organic waste need to be established close, so that transport is not needed.There is additionally an issue of disinfection. Organic waste in landfills causes rotting,which further causes emissions. Another obstruction to the implementation of inexhaustibleraw materials in the creation of fertilizers is the changeability of the raw material. Emergingtechnologies should consider all of the above.
Another quite significant method is composting. Composting is an old and customarytechnique that works with the change of biogenic organics under controlled conditions intoexcrement for farming reasons. Composting measures redirect wastes from the conven-tional landfills and recover esteem by changing them into organic-rich manures, whichconsequently affects the quality and yield of farming products. At the same time, thiscould expand the monetary worth of waste and societal health scenarios by tending to thewaste administration issues [47]. The Government of India has stated that composting isanything but a recognized type of horticultural compost and has formulated a strategy tomix it alongside inorganic manure. The use of these composts will outdate and graduallyeliminate the usage of fossil-based manures [48]. A great initiative undertaken by theGovernment is the promotion of fertilizing the soil with Government subsidized fertilizersto encourage clean and organic farming practices. Simultaneously, the Government issetting up farming instructional hubs for giving specialized data, fundamental resources,and preparation kits. As a feature of sustainable agricultural practice, organic farmingexercises are effectively increasing all over the country and the world. Organic farminguses natural fertilizers and works in agreement with nature without hurting the ecologicalequilibrium and at the same time accomplishes great harvest yields. Regarding developinginterest in organic products, treating the soil has potential business openings in India.Because of its maintainability, compositing can likewise be stretched out to a mechanicalscale using unspoiled organic MSW (municipal solid waste) as feedstock. Treating the soil
Sustainability 2022, 14, 8361 12 of 18
can be involved with the creation of biogas as a by-product and these advances can increasethe financial worth of the waste produced and set out independent job opportunities.
4.2. Bio-Methanation
Biomethanation is a technique by which organic substances are microbiologicallyconverted into biogas under anaerobic conditions, where those microbes break down theorganic substances into methane and carbon dioxide, respectively. Biogas productionis presumably one of the oldest and abused biological innovations in India. The firstbiogas plant, otherwise called the KVIC digester, which was established in 1951, was theconsequence of introductory trials led by S.V. Desai, the pioneer of anaerobic absorption [49].The digester configuration was normalized in 1962. In the middle of 1978 and 1984,different models viz., Janata Biogas Plant and the Deenbandhu Digester were well known.Around 45 lakhs of locally designed homegrown biogas plants with 36.85% of the assessedpotential were introduced with the help of the Government of India until 2013. TheMNRE (Ministry of New and Renewable Energy) has financed three showing projects atVijayawada (6 MW), Hyderabad (6.6 MW), and Lucknow (5 MW). Colossal amounts ofwaste produced from different areas viz. agricultural, municipal, food processing, andso on make bio-methanation measure as a first alternative [50]. Some of the most recentprojects like Naturally Induced Mixing Arrangement (BIMA) Digester, the ARTI CompactBiogas Plant, Confederation of Real Estate Developers’ Associations of India (CREDAI),Trash Guard, and so on, are being introduced in India. Anaerobic assimilation with a 2 MWlimit was introduced by M/S Kanoria Chemicals Ltd., Kolkata, India. At present, Indiaand China offer the anaerobic assimilation innovation similarly at a lower cost.
Now, the majority of rich organic waste that can be harnessed for utilizing in thebiomethanation procedures comes from the kitchens of India. Hence, FW (food waste)management is progressively being focused upon energy and nutrient recuperation, in-stead of landfill, primarily because the latter includes various negative natural effects onboth small and large scopes. Hence, the recuperation of energy in the form of biogasesis now being conducted. In such a manner, waste management arrangements should notjust depend upon a particularly traditional disposal situation, but it should be foundedon coordinated procedures giving, improvement and optimization of separate municipalcollection frameworks, and all the more environmentally economic disposal situations [51]to deliver new fuel sources and materials. Biogas creation from AD (anaerobic digesters)has developed quickly through the years, primarily because of the exceeding significanceof environmentally friendly power organization concerning structured mitigation of GHGdischarges and the requirement for practical management of organic waste. Advertisementis a grounded innovation to treat organically rich biomass, additionally as deposits andwastes that are progressively being conveyed as an environmentally friendly power genera-tion source [52]. It is anything but a perplexing four-stage measure that includes a differentarray of microorganisms and methanogenic archaea that is contrasted with numerous otherbioenergy innovations. AD is recognized as obliging and is a lot more extensive on thescope of substrates, even those with high moisture substance and impurities, and can beled in both enormous and limited scope digesters at all geological areas. Biogas creationyield is strictly reliant upon the nature of the input biomass, which, as a result, is greatlyinfluenced by how biomass is gathered and overseen. Furthermore, biomass assortmentand the management systems may impact the natural effects related to the later portions ofthe treatment chain, including biogas creation in the AD plant and energy-conversion insidethe cogeneration chamber, and digestate management. The accessibility of a biogas outlet ofAD plants clears the way to various opportunities for the recuperation of its energy content,beginning from the direct power creation to more refined usage arrangements, such asdiverting it into the natural gas network or utilizing it to deliver biomethane for transport.

Sustainability 2022, 14, 8361 13 of 18
4.3. Bioethanol
Bioethanol is the derived alcohol from the fermentation of main carbohydrates thatare produced in sugar or starch-bearing plants such as corn, sugarcane, sorghum, etc.The fermentation procedure requires less energy and uses a much cheaper productionsystem than biodiesel. Around 2.2 million liters of bioethanol are created utilizing 9 MT ofmolasses in India ((International Standards Organization)14040, 2006). DBT-ICT Centerfor Energy Biosciences created bioethanol innovation and exhibited the cellulosic ethanolplant at Indian Glycol Limited, Kashipur, with the undertaking cost of $5.28 million on22 April 2016. It was running at a pilot-scale (1 T/day) with a 750,000-L yearly liquorcreation limit and was equipped for changing over to different biomasses like wheat straw,rice straw, bagasse, cottontail, bamboo, and so on, as feedstock for the liquor extraction.CSIR-NIIST, Thiruvananthapuram has introduced a pilot plant office for the lignocellu-los’s bioethanol program [53]. Praj Industries Ltd. (Pune, India), Pune, and Techno SysSystems, Jaipur, have created technologies with plans of action for bioethanol creation aswell. To summarize, we can say that India will have numerous bioethanol plants settingup soon because of the governmental guidelines on mixing bioethanol with gas as anobligatory necessity.
4.4. Biohydrogen
Biomass derived from plant crops, agricultural residues, woody biomass, waste in-ferred biomass, organic portions of MSW, and industrial wastewater (IWW) can be utilizedas feedstock for the creation of biohydrogen (Bio-H2) [54]. The dark fermentation (fermen-tative conversion of organic substrate into biohydrogen, which is acidogenic) procedure isbroadly utilized for the Bio-H2 creation as it is generally less energy consuming, operational,and financially achievable. Bio-H2 creation utilizing waste is a maintainable innovationfor future energy requests and at the same time, it also adds to the development of abio-based economy. MNRE (Ministry of New and Renewable Energy) under the missionmode category is supporting CSIR-IICT, Hyderabad, and IIT Kharagpur, for setting upa pilot plant office of 10 m3 ability to depict the Bio-H2 creation utilizing biogenic wasteas feedstock. CSIR-IICT has planned and fostered an exceptional Bio-H2 pilot plant withan amazing facility to use different sorts of biogenic wastes and assistants to specificallyimprove acidogenic biocatalysts and also pretreat feedstock. Aside from Bio-H2 creation,the cycle in biorefinery mode can likewise deliver side-effects, for example, biomethaneand unsaturated fat-rich corrosive intermediates like acetic acid derivation, butyrate, pro-pionate, and so on, which have direct business significance [55]. These acids have criticalapplications as platform compounds utilized in plastics, drugs, materials, and food addi-tives, and are the intermediates for some major chemicals and fuels. A recycling plant orsorting plant sorts and pre-processes recyclable items. This facility only receives wasteseparated by source. The selected sorting process consists of a magnetic separator, a vortexseparator, and a semi-automatic process with manual sorting. A selection efficiency of 95%was assumed for all materials in the sorting plant. After sorting, the collected materialsare sent to a recycling facility. The latter was thought to be 95% efficient in converting theresulting material into new products [55]
The integration of biochemical wastewater treatment (especially by anaerobic diges-tion) and pyrolysis of sewage sludge is sustainable for urban wastewater with usefulbiofilter products containing pyrolytic syngas and bio, if well established. It appears as aninteresting suggestion to support the basics of processing. This is a preliminary study onthe recovery of Brazilian sludge from aerobic and anaerobic processes aimed at bioenergy.Further pilot-scale testing to collect evidence has not yet been conducted, but early resultsalready indicate the possibility of using this sludge for biofuel production. Finally, thebioenergy utilization of pyrolyzed ash-rich sludge is part of the zero-landfill approachand seems to be an interesting alternative to further increasing the reading of this type ofbiowaste [56].

Sustainability 2022, 14, 8361 14 of 18
4.5. Implementation of Waste Systems across the University Campus
A zero-waste program was set up on a university campus because of grassroots stu-dents’ worry over ecological administration issues. The execution technique comprised ofstarting conversations with the academics and neighborhood authority staff at a universityenvironmental forum, the development of a functioning forum, the readiness of a fundingproposal, and the foundation of an externally funded research system, an instructive yetlimited-time program led by an academic staff member. Support from senior adminis-tration existed as a written environmental policy and a signed obligation to ecologicalduty in tertiary training and university financing support followed the achievement ofthe initial funding application. Tasks were commonly led by paid examination partners,helped by student volunteers, and administered by a program chief from the academicstaff. Co-activity and support from the management office staff were acquired informally.A campus environmental forum was set up to work with correspondence on the ecologicalissue between the School for the Environment, senior university management, manage-ment office staff, academic staff, and students. To empower a full program advancementnonetheless, a requirement for linkages between all areas associated with the program andthe presentation of a formal environmental management system was identified.
The amount of food waste creation in the Chinese catering industry is roughly17–18 Mt each year. This area represents about 20% of the absolute food losses in China.China’s National Development and Reform Commission has confirmed that 100 pilot urbanareas in five bunches will be executing food waste treatment projects. Practically 80% ofthese ventures depend upon anaerobic processing. In this way, it is vital to see what theecological effect of this new bioenergy or waste-to-energy chains (particularly at a limitedscale) is. Therefore, a life cycle assessment contextual investigation was introduced in thiswork, because of an anaerobic processing plant, taken care of with the non-consumablefood waste created by 29 containers, which work inside the grounds of the HuazhongUniversity of Science and Technology (HUST). The speculated effects are climate change,acidification, eutrophication, and photochemical oxidation. The notable unit is addressedby 1 kWh of created power. This work shows that limited-scale biogas plants can be permit-ted to work seamlessly inside large Chinese university grounds and can efficiently diminishthe ecological effect of food waste management, particularly if the pyrolysis procedure isdevised to dispose of the digestate [56].
Comparing the normalized CO2 balances of different universities, we found a cleardifference. The main reason for this is that there is no unified international standardizationmethod for calculating the carbon footprint of educational institutions with specific charac-teristics compared to organizations, especially those in other disciplines. It is desirable notto extrapolate the data for a specific period. Emission factors are revised and publishedannually, so it makes more sense to use the fiscal year (rather than the academic year) asthe time base for calculating carbon footprint in educational institutions. Therefore, it isadvisable to implement a mechanism for keeping historical records.
4.6. Recommendations for Future Studies
As mentioned in each section, the lack of data was a major obstacle to this study.Future studies will proactively choose between an input and output approach, processanalysis, or mixed life cycle assessment to identify suitable GHG sources and recommenda more comprehensive registration page at the university. Due to the variety of activities,future carbon footprint studies are encouraged to consider all greenhouse gas emissions,discuss data assumptions, and include lifecycle stages in the assessment. This allows formore detailed comparisons and benchmarking of carbon emissions from higher educationinstitutions. Other greenhouse gas emission sources that can be evaluated are compostproduction, agriculture, food, beverages, furniture, laboratory supplies, agricultural prod-ucts, machinery and infrastructure, and construction activities. The GHG emission sourceevaluated in this study can be expanded to include additional life cycle stages upstream ofscope 1 GHG emissions. Downstream impacts such as greenhouse gas emissions associated

Sustainability 2022, 14, 8361 15 of 18
with landfill and recycling, construction, and disposal of demolition materials can also helpfurther improve campus carbon dioxide emissions. This includes CO2 compensation suchas purchases and forest management credits. To get a complete picture of the effects ofMSWM, social factors (respiratory diseases, etc.), economic factors (diesel costs, etc.), andpsychological factors (abnormal noise, etc.) must be considered.
5. Conclusions
This research focuses on waste characterization and emphasizes the importance ofseveral factors, including waste diagnosis and the need for regulatory standards on opendumping, the conversion of open dumps to sanitary landfills, and the establishment ofwaste treatment, material, and energy recovery units. According to the characterizationresearch, organic waste is the most common component of MSW, accounting for 76% ofthe total trash. As a result of this finding, anaerobic digestion was discovered as a viabletherapeutic option. It was also shown that separating MSW at the source improves theeffectiveness of anaerobic digestion plants. It is also critical that residents are made awareof the necessity of trash sorting and recycling through mass awareness campaigns andeducation, in which universities play a key role. Universities must invest in trash collectioninfrastructure that allows source-segregated waste to be collected separately and trans-ported to waste treatment facilities. For a smooth transition to structural and sustainablewaste management systems, LCA is being used to analyze the present MSW managementof the RUC of India. For the RUC waste management, this study evaluated a base scenarioof open dumping as well as three alternative scenarios that included a combination ofanaerobic digestion, composting, and landfilling. Material and energy recovery were evalu-ated, as well as their influence on the environment, including global warming, acidification,eutrophication, human toxicity, terrestrial and aquatic toxicity, and so on. For the GWP,FEW, HT, TE, FWT, and MET impact categories, scenario S3 (AD + LFWR) had the lowestimpact. According to the study, treating MSW RUC with an integrated waste managementfacility that combines anaerobic digestion in small-scale units, composting, and landfillwithout gas recovery alternatives is the best approach for maximizing material and energyrecovery while minimizing environmental impacts. The findings support the use of LCAas a valuable tool for developing integrated waste management systems because it allowscouncil officials to compare the environmental consequences of several alternative wastetreatment technologies. Furthermore, research into normalization factors and weights formid-point and end-point effect categories relevant to the Indian context must be conducted.The goal of this study was to give a comprehensive assessment of the environmental conse-quences associated with existing waste management treatment options, as well as possibleprospects for successful impact offsetting.
To get a complete picture of the effects of MSWM, social (respiratory diseases, etc.),economic (diesel costs, etc.), and psychological (abnormal noise, etc.) factors need to beconsidered for further assessment and the final decision. The foremost hassle within theevaluation is to locate the supply of facts and gather the facts to decide the greenhouse fuelline emissions. However, this looks at how the extent of consciousness amongst collegeand college students for feasible discount ability of GHG emissions has been raised. Thiscan serve for example Indian universities in lessening their effects because of intake andthey can also increase their carbon control plans. Therefore, following this review, thereis no standardized standard for reporting university GHG emissions, primarily related tothe organizational boundary aspects of indirect emissions and emission factors. The lackof common criteria, apart from the issue of comparability, results in inventories that donot clearly indicate potential opportunities for mitigation action. For this reason, and as afuture research proposal, it is necessary to develop methods and simplified computationaltools for the university’s carbon footprint. The goal is to achieve comparable results toother universities and to be able to identify and take into account all opportunities toreduce emissions.

Sustainability 2022, 14, 8361 16 of 18
Author Contributions: Conceptualization, A.K.J., V.R.S.C. and B.D.; methodology, A.K.J., V.R.S.C.and B.D.; software, A.K.J. and V.R.S.C.; validation, A.K.J. and V.R.S.C.; formal analysis, A.K.J. andV.R.S.C.; investigation, A.K.J. and V.R.S.C.; resources, B.D.; data curation, M.V.; writing—original draftpreparation, A.K.J.; writing—review and editing, V.R.S.C., M.V. and B.D.; supervision, B.D.; projectadministration, B.D. All authors have read and agreed to the published version of the manuscript.
Funding: This research received no external funding.
Institutional Review Board Statement: Not applicable.
Informed Consent Statement: Not applicable.
Data Availability Statement: Not applicable.
Acknowledgments: The first author is thankful to Ministry of Human Resources and Development,Government of India for providing scholarship. Acknowledgements to Rajesh Kola, TechnicalAssistant Prasad for supporting all throughout the laboratory testing and analysis.
Conflicts of Interest: The authors declare no conflict of interest.
References1. Abdul-Azeez, I.A.; Ho, C.S. Realizing Low Carbon Emission in the University Campus towards Energy Sustainability. Open J.
Energy Effic. 2015, 4, 15–27. [CrossRef]2. Adeniran, A.E.; Nubi, A.T.; Adelopo, A.O. Solid waste generation and characterization in the University of Lagos for a sustainable
waste management. Waste Manag. 2017, 67, 3–10. [CrossRef]3. AICTE. Government of India, All India Council for Technical Education. 2016. Available online: https://facilities.aicte-india.org/
dashboard/pages/dashboardaicte.php (accessed on 28 August 2021).4. Andrianisa, H.A.; Brou, Y.O. Role and importance of informal collectors in the municipal waste pre-collection system in Abidjan,
Côte d’Ivoire. Habitat Int. 2016, 53, 265–273. [CrossRef]5. Angelo, A.C.M.; Saraiva, A.B.; Clímaco, J.C.N.; Infante, C.E.; Valle, R. Life Cycle Assessment and Multi-criteria Decision Analysis:
Selection of a strategy for domestic food waste management in Rio de Janeiro. J. Clean. Prod. 2017, 143, 744–756. [CrossRef]6. Armijo de Vega, C.; Ojeda-Benítez, S.; Ramírez-Barreto, M.E. Mexican educational institutions and waste management pro-
grammes: A University case study. Resour. Conserv. Recycl. 2003, 39, 283–296. [CrossRef]7. Bahçelioglu, E.; Bugdaycı, E.S.; Dogan, N.B.; Simsek, N.; Kaya, S.; Alp, E. Integrated solid waste management strategy of a large
campus: A comprehensive study on METU campus, Turkey. J. Clean. Prod. 2020, 265, 121715. [CrossRef]8. Zen, I.S.; Subramaniam, D.; Sulaiman, H.; Saleh, A.L.; Omar, W.; Salim, M.R. Institutionalize waste minimization governance
towards campus sustainability: A case study of Green Office initiatives in Universiti Teknologi Malaysia. J. Clean. Prod. 2016, 135,1407–1422. [CrossRef]
9. Armijo de Vega, C.; Ojeda Benítez, S.; Ramírez Barreto, M.E. Solid waste characterization and recycling potential for a universitycampus. Waste Manag. 2008, 28 (Supp. 1), S21–S26. [CrossRef]
10. Fagnani, E.; Guimarães, J.R. Waste management plan for higher education institutions in developing countries: The ContinuousImprovement Cycle model. J. Clean. Prod. 2017, 147, 108–118. [CrossRef]
11. Smyth, D.P.; Fredeen, A.L.; Booth, A.L. Reducing solid waste in higher education: The first step towards ‘greening’ a universitycampus. Resour. Conserv. Recycl. 2010, 54, 1007–1016. [CrossRef]
12. Malakahmad, A.; Kutty, S.; Hasnain Isa, M. Solid Waste Characterization and Recycling Potential for University TechnologyPETRONAS Academic Buildings USM-MOSTI Project View project Detection Methods of Carcinogens in Estuaries View project.Am. J. Environ. Sci. 2014, 6, 422–427. [CrossRef]
13. Berchin, I.I.; Grando, V.D.S.; Marcon, G.A.; Corseuil, L.; Guerra, J.B.S.O.D.A. Strategies to promote sustainability in highereducation institutions: A case study of a federal institute of higher education in Brazil. Int. J. Sustain. High. Educ. 2017, 18,1018–1038. [CrossRef]
14. Tangwanichagapong, S.; Nitivattananon, V.; Mohanty, B.; Visvanathan, C. Greening of a campus through waste managementinitiatives: Experience from a higher education institution in Thailand. Int. J. Sustain. High. Educ. 2017, 18, 203–217. [CrossRef]
15. Clabeaux, R.; Carbajales-Dale, M.; Ladner, D.; Walker, T. Assessing the carbon footprint of a university campus using a life cycleassessment approach. J. Clean. Prod. 2020, 273, 122600. [CrossRef]
16. Sammalisto, K.; Brorson, T. Training and communication in the implementation of environmental management systems(ISO 14001): A case study at the University of Gävle, Sweden. J. Clean. Prod. 2008, 16, 299–309. [CrossRef]
17. Lukman, R.; Tiwary, A.; Azapagic, A. Towards greening a university campus: The case of the University of Maribor, Slovenia.Resour. Conserv. Recycl. 2009, 53, 639–644. [CrossRef]
18. Geng, Y.; Liu, K.; Xue, B.; Fujita, T. Creating a “green university” in China: A case of Shenyang University. J. Clean. Prod. 2013, 61,13–19. [CrossRef]
19. Ozawa-Meida, L.; Brockway, P.; Letten, K.; Davies, J.; Fleming, P. Measuring carbon performance in a UK University through aconsumption-based carbon footprint: De Montfort University case study. J. Clean. Prod. 2013, 56, 185–198. [CrossRef]

Sustainability 2022, 14, 8361 17 of 18
20. Dong, J.; Ni, M.; Chi, Y.; Zou, D.; Fu, C. Life cycle and economic assessment of source-separated MSW collection with regard togreenhouse gas emissions: A case study in China. Environ. Sci. Pollut. Res. 2013, 20, 5512–5524. [CrossRef]
21. Wang, M.Q.; Han, J.; Haq, Z.; Tyner, W.E.; Wu, M.; Elgowainy, A. Energy and greenhouse gas emission effects of corn andcellulosic ethanol with technology improvements and land use changes. Biomass Bioenergy 2011, 35, 1885–1896. [CrossRef]
22. Mandpe, A.; Bhattacharya, A.; Paliya, S.; Pratap, V.; Hussain, A.; Kumar, S. Life-cycle assessment approach for municipal solidwaste management system of Delhi city. Environ. Res. 2022, 212, 113424. [CrossRef] [PubMed]
23. Cheela, V.R.S.; Dubey, B. Review of Application of Systems Engineering Approaches in Development of Integrated Solid WasteManagement for a Smart City. In Water Resources and Environmental Engineering II; Rathinasamy, M., Chandramouli, S., Phanindra,K., Mahesh, U., Eds.; Springer: Berlin/Heidelberg, Germany, 2019; pp. 159–177.
24. Liikanen, M.; Havukainen, J.; Viana, E.; Horttanainen, M. Steps towards more environmentally sustainable municipal solid wastemanagement—A life cycle assessment study of São Paulo, Brazil. J. Clean. Prod. 2018, 196, 150–162. [CrossRef]
25. Oliveira, L.S.; Oliveira, D.S.; Bezerra, B.S.; Pereira, B.S.; Battistelle, R.A.G. Environmental analysis of organic waste treatmentfocusing on composting scenarios. J. Clean. Prod. 2017, 155, 229–237. [CrossRef]
26. Sharp, L. Green campuses: The road from little victories to systemic transformation. Int. J. Sustain. High. Educ. 2002, 3, 128–145.[CrossRef]
27. Institute, U.S. Climate & Emissions Sustainability. 2018. Available online: https://www.unh.edu/sustainability/operations/air-climate (accessed on 28 August 2021).
28. ASTM E1756-08; Standard Test Method for Determination of Total Solids in Biomass. American Society for Testing andMaterials: West Conshohocken, PA, USA, 2008. Available online: https://www.astm.org/Database.cart/historical/e1756-08.htm(accessed on 24 August 2021).
29. ASTM E711-87; Standard Test Method for Gross Calorific Value of Refuse-Derived Fuel by the Bomb Calorimeter(Withdrawn 2004). American Society for Testing and Materials: West Conshohocken, PA, USA, 2004. Available online:https://www.astm.org/Standards/E711.htm (accessed on 24 August 2021).
30. ASTM E777-87; Standard Test Method for Carbon and Hydrogen in the Analysis Sample of Refuse-Derived Fuel. AmericanSociety for Testing and Materials: West Conshohocken, PA, USA, 2004. Available online: https://www.astm.org/DATABASE.CART/HISTORICAL/E777-87R04.htm (accessed on 24 August 2021).
31. ASTM E872-82; Standard Test Method for Volatile Matter in the Analysis of Particulate Wood Fuels. American Society for Testingand Materials: West Conshohocken, PA, USA, 2019. Available online: https://www.astm.org/Standards/E872.htm (accessed on24 August 2021).
32. Barlaz, M.A.; Chanton, J.P.; Green, R.B. Controls on landfill gas collection efficiency: Instantaneous and lifetime performance.J. Air Waste Manag. Assoc. 2009, 59, 1399–1404. [CrossRef] [PubMed]
33. Liu, Y.; Sun, W.; Liu, J. Greenhouse gas emissions from different municipal solid waste management scenarios in China: Based oncarbon and energy flow analysis. Waste Manag. 2017, 68, 653–661. [CrossRef]
34. Bhupednra Kumar, S.; Munish, K. Life cycle assessment of potential municipal solid waste management strategies for Mumbai,India. Waste Manag. Res. J. Sustain. Circ. Econ. 2017, 35, 79–91. [CrossRef]
35. Biswas, W.K. Life cycle assessment of seawater desalinization in Western Australia. World Acad. Sci. Eng. Technol. 2009, 56,369–375. [CrossRef]
36. Silva, F.B.; Yoshida, O.S.; Diestelkamp, E.D.; De Oliveira, L.A. Relevance of including capital goods in the life cycle assessment ofconstruction products. LALCA Rev. Lat.-Am. Em Avaliação Do Ciclo De Vida 2018, 2, 7–22. [CrossRef]
37. CPHEEO. CPHEEO:Central Public Health & Environmental Engineering Organisation (CPHEEO), Govt of India. 2020.Available online: http://cpheeo.gov.in/cms/about-cpheeo.php (accessed on 28 August 2021).
38. Environmental Protection Agency (EPA). Report on “LFG Energy Project Development Handbook”. 2020. Available online:https://www.epa.gov/sites/production/files/2016-11/documents/pdh_full.pdf (accessed on 15 April 2021).
39. Bassi, A.; Højlund, T. Environmental performance of household waste management in Europe—An example of 7 countries. WasteManag. 2021, 69, 545–557. [CrossRef]
40. Babu, G.L.S.; Lakshmikanthan, P.; Santhosh, L.G. Life Cycle Analysis of Municipal Solid Waste (MSW) Land Disposal Optionsin Bangalore City. In ICSI 2014: Creating Infrastructure for a Sustainable World—Proceedings of the 2014 International Conference onSustainable Infrastructure; American Society for Civil Engineers: Pomona, CA, USA, 2014; pp. 795–806. [CrossRef]
41. Bogner, J.E.; Chanton, J.P.; Blake, D.; Abichou, T.; Powelson, D. Effectiveness of a Florida Landfill Biocover for Reduction of CH4and NMHC Emissions. Environ. Sci. Technol. 2010, 44, 1197–1203. [CrossRef] [PubMed]
42. Turner, D.A.; Williams, I.D.; Kemp, S. Combined material flow analysis and life cycle assessment as a support tool for solid wastemanagement decision making. J. Clean. Prod. 2016, 129, 234–248. [CrossRef]
43. Mistri, A.; Dhami, N.; Bhattacharyya, S.K.; Barai, S.V.; Mukherjee, A.; Biswas, W.K. Environmental implications of the use ofbio-cement treated recycled aggregate in concrete. Resour. Conserv. Recycl. 2021, 167, 105436. [CrossRef]
44. European Commission. Committee and the Committee of the Regions a European Agenda on Migration 2. 2015. Available online:http://www.europarl.europa.eu/oeil/popups/ficheprocedure.do?lang=en&reference=2015/2660 (accessed on 25 August 2021).
45. Pooja, Y.; Sukha, R. Environmental impact assessment of municipal solid waste management options using life cycle assessment:A case study. Environ. Sci. Pollut. Res. 2018, 25, 838–854. [CrossRef]

Sustainability 2022, 14, 8361 18 of 18
46. Chatterjee, B.; Mazumder, D. Role of stage-separation in the ubiquitous development of Anaerobic Digestion of Organic Fractionof Municipal Solid Waste: A critical review. Renew. Sustain. Energy Rev. 2019, 104, 439–469. [CrossRef]
47. CPHEEO. Manual on Municipal Solid Waste Management—2016:Central Public Health & Environmental Engineering Or-ganisation (CPHEEO), Govt of India. 2016. Available online: http://cpheeo.gov.in/cms/manual-on-municipal-solid-waste-management-2016.php (accessed on 28 August 2021).
48. Seruga, P.; Krzywonos, M.; Seruga, A.; Niedzwiecki, Ł.; Pawlak-Kruczek, H.; Urbanowska, A. Anaerobic Digestion Performance:Separate Collected vs. Mechanical Segregated Organic Fractions of Municipal Solid Waste as Feedstock. Energies 2020, 13, 3768.[CrossRef]
49. Goedkoop, M.; Oele, M.; Leijting, J.; Ponsioen, T.; Meijer, E. Introduction to LCA with SimaPro Title: Introduction to LCA withSimaPro. 2016. Available online: www.pre-sustainability.com (accessed on 25 August 2021).
50. El Hanandeh, A.; El-Zein, A. Life-cycle assessment of municipal solid waste management alternatives with consideration ofuncertainty: SIWMS development and application. Waste Manag. 2010, 30, 902–911. [CrossRef]
51. Ingrao, C.; Faccilongo, N.; Di Gioia, L.; Messineo, A. Food waste recovery into energy in a circular economy perspective:A comprehensive review of aspects related to plant operation and environmental assessment. J. Clean. Prod. 2018, 184, 869–892.[CrossRef]
52. Styles, D.; Dominguez, E.M.; Chadwick, D. Environmental balance of the UK biogas sector: An evaluation by consequential lifecycle assessment. Sci. Total Environ. 2016, 560–561, 241–253. [CrossRef]
53. National Research Council. Waste Incineration and Public Health; National Academies Press: Washington, DC, USA, 2000.54. Kanhar, A.H.; Chen, S.; Wang, F. Incineration Fly Ash and Its Treatment to Possible Utilization: A Review. Energies 2020, 13, 6681.
[CrossRef]55. Cheela, V.R.S.; John, M.; Biswas, W.; Dubey, B. Environmental Impact Evaluation of Current Municipal Solid Waste Treatments in
India Using Life Cycle Assessment. Energies 2021, 14, 3133. [CrossRef]56. Zhou, H.; Yang, Q.; Gul, E.; Shi, M.; Li, J.; Yang, M.; Yang, H.; Chen, B.; Zhao, H.; Yan, Y.; et al. Decarbonizing university campuses
through the production of biogas from food waste: An LCA analysis. Renew. Energy 2021, 176, 565–578. [CrossRef]