Integrated Pest Management: Dissemination and Impact
627
-
Upload
khangminh22 -
Category
Documents
-
view
0 -
download
0
Transcript of Integrated Pest Management: Dissemination and Impact


Integrated Pest Management:Dissemination and Impact

Rajinder Peshin · Ashok K. DhawanEditors
Integrated Pest Management:Dissemination and Impact
Volume 2
123
EditorsRajinder PeshinSher-e-KashmirUniversity of Agricultural Sciencesand Technology of JammuDivision of Agricultural Extension EducationFOA [email protected]
Ashok K. DhawanPunjab Agricultural UniversityDepartment of [email protected]
Cover photocredits:
Farmer field school for vegetable IPM in Sibayak Valley, North Sumatra, Indonesia (Courtesy: Photo byMike Hammig, Clemson University, Clemson, South Carolina, USA).
Onion beds where virus-infected Spodoptera exigua are used by farmers as spray in biological controlprogram. Onion beds where virus was applied (right) compared to heavily damaged control where novirus was applied. Ciladug, West Java, Indonesia. (Courtesy: Photo by Merle Shepard, Clemson Univer-sity, USA).
ISBN: 978-1-4020-8989-3 e-ISBN: 978-1-4020-8990-9
Library of Congress Control Number: 2008933376
c© Springer Science+Business Media B.V. 2009No part of this work may be reproduced, stored in a retrieval system, or transmittedin any form or by any means, electronic, mechanical, photocopying, microfilming, recordingor otherwise, without written permission from the Publisher, with the exceptionof any material supplied specifically for the purpose of being enteredand executed on a computer system, for exclusive use by the purchaser of the work.
Printed on acid-free paper
9 8 7 6 5 4 3 2 1
springer.com

ForDevansh, Udit, Sahil and Salil

Preface
Integrated Pest Management – Dissemination and Impact, Volume 2 is a sequelto Integrated Pest Management – Innovation-Development Process, Volume 1. Thebook focuses on the IPM systems in the developed countries of North America,Europe and Australia, and the developing countries of Asia, Latin America andAfrica. One of the major impediments in the dissemination and adoption of the IPMinnovation is the complexity of the technology and reaching the vast population offarmers especially in the developing countries. The IPM-innovation developmentprocess is incomplete without the diffusion and adoption of IPM methods by theend users, and through its consequences. In spite of all the efforts in the developedand developing countries, the adoption of IPM is still low with few exceptions.
The book covers the underlying concepts and methodologies of the diffusion ofinnovation theory and the program evaluation; and reviews the progress and impactof IPM programs implemented in the industrialized, the green revolution and thesubsistence agricultural systems of the world. Forty-four experts from entomology,plant pathology, environmental science, agronomy, anthropology, economics andextension education from Africa, Asia, Australia, Europe, North America and SouthAmerica have discussed impact of IPM with an interdisciplinary perspective. Eachone of the experts is an authority in his or her field of expertise. The researchers,farmers’ education, supporting policies of the governments and market forces are theelements of the IPM innovation system to achieve wider adoption of IPM strategyin agriculture.
The diffusion theory and adoption of the IPM innovation is discussed in thefirst chapter to provide theoretical foundation to biological scientists for develop-ing farmers’ compatible IPM systems. Protocols for evaluation to measure socio-economic impact of the IPM programs are provided in Chapters 2 to 4. Identifyingthe farmers’ needs, attitudes and skills for developing location specific IPM technol-ogy is detailed in Chapter 5. Implementation of IPM programs, farmers’ educationin the context of developed, and developing countries are documented in Chapters6 and 7. The focus of Chapter 8 is on the impact of extension in disseminating IPMtechnology to smallholder farmers. The implementation, impact and the impedi-ments of IPM programs in the green revolution lands of Asia and Latin America, andsubsistence agriculture of sub-Saharan Africa is the focus of Chapters 9 to 13. Theinsight into the IPM programs in Europe and the initiatives of the European Union in
vii

viii Preface
popularising integrated protection in its member states, the IPM programs in Russiaand the Commonwealth of Independent States, tracking down the history of IPMin erstwhile USSR are covered in Chapters 14 and 15. Dissemination and impactof IPM technology in the US agriculture is discussed in the subsequent Chapter16. To explore the advances in IPM with respect to introduction of transgenic inChinese and Australian agriculture and the controversy surrounding the trangenicsand its compatibility with IPM, Chapters 17 to 19 have been included. The worldfood shortage because of conversion of agriculture crops like corn and soybean forproduction of bio-fuels in the USA is one of the hotly contested issues. The con-cluding chapter on IPM, bio-fuels and a new green revolution provides an insight tothe changes in the patterns of agriculture in the USA. Renewed efforts are neededto develop the IPM innovation system for the wider adoption of IPM.
We are indebted to the contributing authors whose thought provoking insight,cooperation and guidance made it possible to realise the dream of updating IPMliterature from an interdisciplinary and global perspective. We owe a great deal toProf. A. K. Tiku for his insight in bringing out these two volumes. The book providesan invaluable resource material to the scientists, professionals, students, programplanners, farmers and market forces.
Rajinder PeshinAshok K. Dhawan

Contents
1 Diffusion of Innovation Theory and Integrated Pest Management . . . . 1Rajinder Peshin, J. Vasanthakumar and Rajinder Kalra
2 Evaluation Research: Methodologies for Evaluation of IPM Programs 31Rajinder Peshin, K. S. U. Jayaratne and Gurdeep Singh
3 Protocol for Economic Impact Evaluation of IPM Programs . . . . . . . . 79George W. Norton and Scott M. Swinton
4 Economic Evaluation of Integrated Pest Management Programs . . . . . 103Kamal Vatta, A.K. Dhawan and Rajinder Peshin
5 Eliciting Farmer Knowledge, Attitudes, and Practices in theDevelopment of Integrated Pest Management Programs for Rice inAsia . . . . . . . . . . . . . . . . . . . . . . . . . . . . . . . . . . . . . . . . . . . . . . . . . . . . . . . . . . 119James A. Litsinger, Edgar M. Libetario and Bernard L. Canapi
6 Implementing Integrated Pest Management in Developing andDeveloped Countries . . . . . . . . . . . . . . . . . . . . . . . . . . . . . . . . . . . . . . . . . . . . 275B.M. Shepard, M.D. Hammig, G.R. Carner, P.A.C. Ooi, J.P. Smith,R. Dilts and A. Rauf
7 Moving On: Farmer Education in Integrated Insect Pest andDisease Management . . . . . . . . . . . . . . . . . . . . . . . . . . . . . . . . . . . . . . . . . . . 307Janice Jiggins and Francesca Mancini
8 Impact of IPM Extension for Smallholder Farmers in the Tropics . . . . 333Jeffery W. Bentley
9 Impact of IPM Programs in Asian Agriculture . . . . . . . . . . . . . . . . . . . . 347Kevin D. Gallagher, Peter A.C. Ooi and Peter E. Kenmore
ix

x Contents
10 Evolutionary Revolution: Implementing and Disseminating IPM inIndonesia . . . . . . . . . . . . . . . . . . . . . . . . . . . . . . . . . . . . . . . . . . . . . . . . . . . . . . 359Edhi Martono
11 Principles and Methods of Rice Lepidopteroid Pest and its EnemyManagement (PEM) Program in North Vietnam . . . . . . . . . . . . . . . . . . . 383Eugeny S. Sugonyaev
12 Challenges of Integrated Pest Management in Sub-Saharan Africa . . 395Arnold van Huis
13 Evaluating Dissemination and Impact of IPM: Lessons fromCase Studies of Potato and Sweetpotato IPM in Peru and OtherLatin American Countries . . . . . . . . . . . . . . . . . . . . . . . . . . . . . . . . . . . . . . 419Oscar Ortiz, Jurgen Kroschel, Jesus Alcazar, Ricardo Orrego and WillyPradel
14 Integrated Pest Management in Europe – History, Policy,Achievements and Implementation . . . . . . . . . . . . . . . . . . . . . . . . . . . . . . . 435Bernd Freier and Ernst F. Boller
15 IPM Programs in Commonwealth of Independent States and Russia . 455Eugeny S. Sugonyaev
16 Dissemination and Impact of IPM Programs in US Agriculture . . . . . . 481Kristopher L. Giles and Nathan R. Walker
17 Advances with Integrated Pest Management as a Component ofSustainable Agriculture: The Case of the Australian Cotton Industry 507Gary Fitt, Lewis Wilson, David Kelly and Robert Mensah
18 Impact of IPM and Transgenics in the Chinese Agriculture . . . . . . . . . 525WenJun Zhang and Yi Pang
19 Can Transgenic Crops and IPM Be Compatible? . . . . . . . . . . . . . . . . . . 555George B. Frisvold
20 Integrated Pest Management, Biofuels, and a New GreenRevolution: A Case Study of the American Midwest . . . . . . . . . . . . . . . . 581John H. Perkins
Index . . . . . . . . . . . . . . . . . . . . . . . . . . . . . . . . . . . . . . . . . . . . . . . . . . . . . . . . . . . . . 609

Contributors
Jesus Alcazar International Potato Center (CIP). Integrated Crop ManagementDivision, Apartado 1558, Lima 12, Peru, [email protected]
Jeffery W. Bentley Agricultural Anthropologist, International Consultant,Casilla 2695, Cochabamba, Bolivia, [email protected]
Ernst F. Boller Swiss Federal Research Station of Horticulture, AgroscopeACW, CH-8820 Wadenswil, Switzerland, [email protected]
Bernard L. Canapi International Rice Research Institute, Los Banos, [email protected]
G. R. Carner Department of Entomology, Soils and Plant Sciences, ClemsonUniversity, Clemson, South Carolina, 29634, USA, [email protected]
A. K. Dhawan Department of Entomology, Punjab Agricultural University,Ludhiana 141004, India, [email protected]
R. Dilts Environmental Services Programme, Jl. Slamet Riyadi, No. 6., Medan,North Sumatra, Indonesia, Russ [email protected]
Gary Fitt Commonwealth Scientific & Industrial Research Organization(CSIRO) Entomology, Long Pocket Laboratories, 120 Meiers Indooroopilly, Qld,Australia 4068, [email protected]
Bernd Freier Julius Kuehan Institute (JKI), Federal Research Centre forCultivated Plants, Institute for Strategies and Technology Assessment in PlantProtection, D-14532 Kleinmachnow, Germany, [email protected]
George B. Frisvold Department of Agricultural and Resource Economics,319 Cesar Chavez Building, University of Arizona, Tucson, AZ 85721, USA,[email protected]
Kevin D. Gallagher Food and Agriculture Organisation, FAO Representative inSierra Leone, [email protected]
Kristopher L. Giles Department of Entomology and Plant Pathology, OklahomaState University, Stillwater, OK 74075, USA, [email protected]
xi

xii Contributors
M. D. Hammig Department of Applied Economics and Statistics, ClemsonUniversity, Clemson, South Carolina, 29634, USA, [email protected]
Arnold van Huis Laboratory of Entomology, Wageningen University, PO Box8031, 6700 EH Wageningen, The Netherlands, [email protected]
K. S. U. Jayaratne Department of Agricultural and Extension Education, NorthCarolina State University, 214 Ricks Hall Raleigh, North Carolina, 27695–7607USA, jay [email protected]
Janice Jiggins Communication and Innovation Studies, Wageningen UniversityResearch, The Netherlands, [email protected]
Rajinder Kalra Department of Extension Education, Punjab AgriculturalUniversity, Ludhiana 141004, India, [email protected]
David Kelly Cotton Seed Distributors, PO Box 1121, Goondiwindi QLD,Australia, 4390, dkelly@csd.,net.au
Peter E. Kenmore Chief Plant Protection Service of Food and AgricultureOrganisation Viale delle Terma di Caracalla, Rome 00153, Italy,[email protected]
Jurgen Kroschel International Potato Center (CIP). Integrated Crop ManagementDivision, Apartado 1558, Lima 12, Peru, [email protected]
Edgar M. Libetario Philippine Rice Research Institute, Munoz, Philippines,[email protected]
James A. Litsinger IPM and Farming Systems Specialist, California, USA; 1365Jacobs Place, Dixon CA 95620 USA, [email protected]
Francesca Mancini IPM Specialist, Sustainable Agriculture & FarmerEducation FAO, TST Office Tarnaka, Hyderabad, Andhra Pradesh, Indiamancini [email protected]
Edhi Martono Department of Plant Protection, Faculty of Agriculture, GadjahMada University, Bulaksumur, Yogyakarta 55281, Indonesia, [email protected]@hotmail.com
Robert Mensah New South Wales Department of Primary and Cotton CatchmentCommunities CRC, Australian Cotton Research Institute, Narrabri, NSW,Australia, 2390, [email protected]
George W. Norton Agricultural and Applied Economics, Virginia PolytechnicInstitute and State University, 205-B Hutcheson Hall, Blacksburg, VA, 24061,USA, [email protected]
Peter A. C. Ooi Regional Director of Asian Regional Center for AVRDC-TheWorld Vegetable Center, Bangkok, Thailand, [email protected]
Ricardo Orrego International Potato Center (CIP). Integrated Crop ManagementDivision, Apartado 1558, Lima 12, Peru, [email protected]

Contributors xiii
Oscar Ortiz International Potato Center (CIP). Integrated Crop ManagementDivision, Apartado 1558, Lima 12, Peru, [email protected]
Yi Pang Research Institute of Entomology, School of Life Sciences, Sun Yat-senUniversity, Guangzhou 510275, China, [email protected]
John H. Perkins The Evergreen State College, Olympia, WA 98505, USA,[email protected]
Rajinder Peshin Division of Agricultural Extension Education, Sher-e-KashmirUniversity of Agricultural Sciences and Technology of Jammu, Chatha,Jammu-180009, India, [email protected]
Willy Pradel International Potato Center (CIP). Integrated Crop ManagementDivision, Apartado 1558, Lima 12, Peru, [email protected]
A. Rauf Department of Plant Pests, Bogor Agricultural University (InstitutePertanian Bogor), Bogor 16680, Indonesia, [email protected]
B. M. Shepard Clemson University, Coastal Research and EducationCenter, 2700 Savannah Highway, Charleston, South Carolina, 29414, USA,[email protected]
Gurdeep Singh Department of Entomology, Punjab Agricultural University,Ludhiana 141004, India, sidhu [email protected]
J. P. Smith Clemson Cooperative Extension Service, Clemson University, 605Main St., Suite 109, Lexington, South Carolina 29072, USA, [email protected]
Eugeny S. Sugonyaev Laboratory Experimental Entomology and Bio-control,Zoological Institute, Russian Academy of Sciences, 199034 St. Petersburg, Russia,[email protected]
Scott M. Swinton Department of Agricultural, Food and Resource Eco-nomics, Michigan State University, East Lansing, MI 48824–1039, USA,[email protected]
J. Vasanthakumar Department of Agricultural Extension, Annamalai University,Annamalainagar, Chidambaram, India,[email protected]
Kamal Vatta Department of Economics and Sociology, Punjab AgriculturalUniversity, Ludhiana 141004, India, [email protected]
Nathan R. Walker Department of Entomology and Plant Pathology, OklahomaState University, Stillwater, Oklahoma 74075, USA, [email protected]
Lewis Wilson CSIRO Plant Industry and Cotton Catchment CommunitiesCRC, Australian Cotton Research Institute, Narrabri, NSW, Australia, 2390,[email protected]
WenJun Zhang Research Institute of Entomology, School of Life Sciences, SunYat-sen University, Guangzhou 510275, China, [email protected]

Chapter 1Diffusion of Innovation Theory and IntegratedPest Management
Rajinder Peshin, J. Vasanthakumar and Rajinder Kalra
Abstract The Diffusion of Innovation Theory dominated the theory and practice ofagricultural extension system all over the world for almost half a century. It cameunder criticism too during the period. The theory was not considered adequate tomanage the process of dissemination of IPM technology. The inadequacies may bedue to the attributes of IPM innovation as well as due to the sophisticated demandsof IPM technology that was not amenable to the limited version of the theory. Thediffusion and adoption of agricultural innovation has been a focal measure of agri-culture development. IPM is a combination of different technologies that has notdiffused as other simple one of technologies. Diffusion of IPM requires educat-ing the farmers for its adoption and it must deal with farmers’ needs, perceptions,constraints, objectives and its complexity demands. IPM is location specific and itrequires several years of experiments, trials, repetitions and validations in a givenarea. It requires a clear understanding about the IPM tactics. The IPM tactics mayvary from crop to crop and area to area. It needs a planned strategy of impartingknowledge and skill and active learning and active adoption by the farmers. Thediffusion of innovation research has to give up the “ex-post-facto” design, whichhas been a prisoner of socio-economic factors influencing the adoption of innovationand in correlating the effects to these factors. The diffusion researchers should em-ploy “action research” design to study the IPM implementation and feed the result todevelop farmer-acceptable IPM system. The coordination of all the stakeholders ofagricultural innovation system need to emphasise the outcomes of technology andknowledge generation and adoption of IPM practices rather than merely strengthen-ing of research and extension systems.
Keywords Integrated Pest Management · innovation · technology cluster ·diffusion of innovations · adopter categories · decision making · innovation system
R. Peshin (B)Division of Agricultural Extension Education, Sher-e-Kashmir University of Agricultural Sciencesand Technology of Jammu, Chatha, Jammu-180009, Indiae-mail: [email protected]
R. Peshin, A.K. Dhawan (eds.), Integrated Pest Management: Disseminationand Impact, DOI 10.1007/978-1-4020-8990-9 1,C© Springer Science+Business Media B.V. 2009
1
2 R. Peshin et al.
1.1 Introduction
Rogers’ “diffusion of innovation theory” has played central role in extension theoryand practice (Roling, 1988). Diffusion of innovation theory deals with “innovation –development process” which deals with six stages of need or problem, through re-search (basic and applied), development, commercialization (recommendation) ofinnovation through dissemination and adoption of the innovation by the end usersto its consequences (functional or dysfunctional) (Rogers, 2003). Diffusion researchstudies have dominated the extension education research in 1950s and 1960s in theUnited States of America (USA) and Europe, and in 1960s and 1970s in developingcountries (Valente and Rogers, 1995). The diffusion research provided feedback toagricultural researchers about the fate of their recommendations. Diffusion theoryprovides a basis for creating coherent body of generalisations, without which, thehuge body of completed research might be “a mile wide and an inch deep” (Rogers,1995).
Gabriel Tarde (1903) was the first to show that adoption of new idea within asocial system follows an S-shaped growth curve. Anthropologists were the firstto deal with diffusion studies. Most of the diffusion studies dealt with spread ofagriculture innovations among the farmers and most of the diffusion researcheshave been produced by the rural sociologists. A classical study which received thegreatest attention among social scientists was conducted by Bruce Ryan and NealGross (1943) on the diffusion of hybrid seed corn in two Iowa communities. Thefindings of the study showed that the adoption of innovation by farmers involved acombination of several processes. The processes of individual decision-making by afarmer to adopt or reject a practice, and diffusion of an innovation over time througha social system are closely interrelated. Diffusion studies, however, are not confinedto the field of rural sociology alone. Diffusion research publications took off after thediffusion paradigm by Ryan and Gross (1943) and the number of publications hadreached 3810 in 1995 (Rogers, 1995). This chapter aims to provide the theoreticalbackground of diffusion of innovation theory and the adoption of Integrated PestManagement (IPM) innovation by the farmers. IPM is a cluster of innovations anda decision making innovation for providing economically viable and ecologicallysound methods of pest management.
1.2 Diffusion of Innovation Theory
There are many theories that deal with generation of innovations, their diffusionand adoption or non-adoption by ultimate users. Such theories include actor net-work theory, knowledge systems and network theory, strategic niche managementtheory and adoption and diffusion of innovations theory (Rogers and Shoemaker,1971; Rogers, 1983, 1993, 2003). Among the theories, the diffusion of innovationtheory dominated the theory and practice of agricultural extension systems all overthe world for more than half a century. The classical study of 1940s provided the

1 Diffusion of Innovation Theory and Integrated Pest Management 3
initiative to target innovative farmers to adopt innovations so that other farmerswould follow in course of time (Ryan and Gross, 1943). The Diffusion Theoryprovides an adequate explanation of the relationship between the technological in-novations and the social relations. Nevertheless, with its research perspective anddeterministic outcomes emphasising the information exchange, it is an ideal lowerlevel framework for analyzing the processes of technology dissemination and thefeatures of an innovation (Gartshore, 2004).
The literature on diffusion theory during 1970–1990 revealed two distinct cate-gories of practitioners who either supported or criticized the diffusion theory. Someportions of the theory are sound while the remaining portions revealed the weaknessto address the diffusion of innovations. The literature on the characteristics of inno-vations, the stages of adoption process and the effect of interaction of farmers onadoption are considered sound. The theory’s focus on innovators and the resultingundesirable consequences of the extension approach that used the theory were theweak spots and attracted criticism (Stephenson, 2003).
Diffusion is the process by which an innovation is communicated through certainchannels over time among the members of a social system (Rogers, 1962, 1983,1995, 2003). It is a special type of communication in which the messages are aboutthe new idea. The process by which an innovation spreads within a social system iscalled diffusion. An innovation diffuses within a social system through its adoptionby individuals and groups.
Diffusion is a kind of social change. It is defined as the process by which al-teration occurs in the structure and function of a social system. Diffusion of aninnovation thus leads to social change. The diffusion of agricultural technologiesthrough mechanization, improved seeds, and better plant protection measures re-sulted in increased productivity. This ultimately led to improved standard of livingamong farming community. The impact of the green revolution on farmers can-not be denied. In case of IPM which is a complex set of decision making process,there are a number of researchable questions. Whether the diffusion of innovationtheory answers the questions related to four elements of this theory: IPM inno-vation and its attributes, communication channels for diffusion of IPM, time di-mension and rate of adoption of IPM, and the social system affecting the adoptionof IPM?
1.2.1 Elements of Diffusion of Innovation Theory
The four main elements of diffusion of innovation as identified by Rogers (1962)are:
i) An innovationii) Communication channels
iii) Time, andiv) Social system

4 R. Peshin et al.
Thus, we can say that diffusion of innovation will take place only if a new ideaor practice exists which is accepted by an individual or a group of people over aperiod of time. The rate of diffusion depends upon the availability of communicationchannels and structure of the social system.
1.2.1.1 Innovation
An idea, practice, or object that is perceived as new by an individual or an improve-ment over the existing one by the members of a social system could be termed aninnovation. The perceived newness of the idea for the individual determines his orher reaction to it. The idea constitutes central element of an innovation, which hasmaterial or behavioural form. In diffusion literature, “innovation” and “technology”are used synonymously. Most agricultural innovations are in material form such asimproved implements, high yielding variety seeds, chemical fertilizers and plantprotection chemicals, while improved cultural practices are in behavioral forms. Aninnovation (technology) has two or either of the two components, hardware (mate-rial form) consisting of physical objects and software (behavioral form) consistingof knowledge base. IPM practices are mostly in complex behavioural form, exceptfor resistant varieties. Some innovations or technologies take less time to spreadin a social system while others may take longer time. Technologies consisting ofknowledge base take longer time to spread. We can say that the time taken by aninnovation is dependent upon different factors. The characteristics of innovation asgeneralized by Rogers (1962) are:
(i) Relative advantage: It is a ratio of the expected benefits and the costs of adop-tion of an innovation. Its sub-dimensions are economic profitability, low initialcost, a decrease in discomfort, social prestige, a saving of time and effort, andimmediate reward.
(ii) Compatibility: It is the degree to which an innovation is consistent with pastexperiences and needs of farmers.
(iii) Complexity: It is the degree to which an innovation is difficult to comprehendand use.
(iv) Trialability: It is the degree to which an innovation can be experimented witheither on limited basis or in installments.
(v) Observability: It is the degree to which the results of an innovation are visible toothers. Higher the observability and communicability of results, higher wouldbe the rate of adoption.
The characteristics of IPM practices influencing its adoption are discussed inSection 1.4.2.1.
1.2.1.2 Communication Channels
Diffusion is a particular type of communication in which the message content that isexchanged is concerned with a new idea. Communication is a process by which two

1 Diffusion of Innovation Theory and Integrated Pest Management 5
or more people share or create information in order to reach a mutual understanding.A communication channel is the means by which message about an innovation ortechnology is shared among two or more individuals. The two important types ofcommunication channels that would help the communicator in diffusion of innova-tions are interpersonal and mass media channels.
(a) Interpersonal channels are those channels, which are used for face-to-face com-munication between two or more individuals. Interpersonal channels are themeans for persuading an adopting unit to accept a new idea. The interper-sonal channels may include opinion leaders, subject matter specialist, exten-sion worker, neighbours, friends, etc. Interpersonal channels help an individualto take decision about adoption of innovation by making subjective judgmentabout it.
(b) Mass media channels such as radio, television, and newspaper enable the mes-sage to reach a larger, diverse audience simultaneously in a relatively shortertime. Mass media channels are more effective to make an audience aware of theexistence of innovations.
The communication channels may also be categorized either as localite channelsor as cosmopolite channels, depending on the place of origin. Localite channelsoriginate within the social system of the receiver such as neighbours, friends, rel-atives, leaders, etc. Cosmopolite channels have their origins outside the immediatesocial system e.g., extension workers. For the diffusion of IPM practices, all com-munication channels are useful. Mass media channels like radio, television, hoard-ings, web, etc should be used to create awareness about the negative externalities ofpesticides and IPM philosophy, and to compete with the vast network and advertise-ment onslaught of pesticide companies. For changing the farmers’ behavior (cog-nition, skills and attitudes), labor intensive communication strategy like meetings,demonstrations, workshops are advisable (Lagnaoui et al., 2004) and for providingexperiential learning in the farmers’ fields for comprehension and acquiring skillsto take decision for implementation and adoption of IPM practices.
1.2.1.3 Time
Time is a third element in the diffusion process. Time does not exist independentlyof events but is an important variable of any communication process. The time di-mension is involved in three aspects of diffusion process.
(a) Innovation-decision process: It is the process through which an individualpasses from getting information about an innovation to its final adoption orrejection.
(b) Innovativeness of an individual or other unit of adoption, that is the relativeearliness or lateness of an individual with which an innovation is adopted com-pared to other members of a social system. The classification of members of asocial system on the basis of innovativeness includes innovators, early adopters,early majority, late majority and laggards.
6 R. Peshin et al.
(c) Rate of adoption: The rate of adoption is the relative speed with which themembers of a social system adopt an innovation. Most of the innovations havean S-shaped rate of adoption. However, there is variation in the slope of the “S”from innovation to innovation as some new ideas diffuse rapidly while someother innovations take time to diffuse. The rate of adoption is measured by thelength of time taken by a certain percentage of the members of a social systemto adopt a new idea. There are differences in the rate of adoption for the sameinnovation in different social systems. Rate of adoption of IPM practices likesampling for determining economic threshold level for taking pest managementdecision has been slow. The pattern of adoption of IPM practices has followedS-shaped curve only when the farmers have been provided hands on experiencein dealing with complex behavioral phenomena.
1.2.1.4 Social System
The social system, the fourth element, constitutes a boundary for the diffusion ofinnovations. A social system is a set of individuals, informal groups or organizationsthat are engaged in solving a common problem or in accomplishing a common goal.
The diffusion of an innovation gets affected by the social system. A social sys-tem is defined as a set of interrelated units that are engaged in a joint problem toaccomplish a common goal. The members of a social system may be individuals,informal groups, organizations, and/or sub-systems. Diffusion occurs within a socialsystem. Diffusion of agricultural innovations at the village level depends upon thestructural characteristics of the village or social system, which may be homogenousor heterogeneous. The homogenous village may have population similar in social ordemographic characteristics like caste, religion, culture, etc. whereas heterogeneousvillage may have population varied in the characteristics. The innovative ideas mayflow smoothly in homogeneous village rather than in heterogeneous village. Forexample, a village with Bengali population will readily accept fish-rearing prac-tices. The importance of the structure of a social system was well emphasized byKatz (1961), “It is as unthinkable to study diffusion without some knowledge ofthe social structures in which potential adopters are located as it is to study bloodcirculation without adequate knowledge of the veins and arteries.”
Another important component of social system is its communication structure.The communication structure in a village is constituted by informal interpersonallinks. The existence of these informal interpersonal linkages results in communi-cation networks. These networks follow a set pattern of information flow. The welldeveloped communication structures in a social system can facilitate the diffusion ofinnovations. A village having well integrated social structure is favorably orientedtowards change. It influences its members who may be farmers to improve theirfarming situations by adopting innovative practices. In a village, there are few whoact as leaders by influencing opinions of majority of people and they are calledopinion leaders. The effective opinion leaders provide orientation to communitymembers towards change and development by persuading them to participate indevelopment activities.

1 Diffusion of Innovation Theory and Integrated Pest Management 7
Academics complement agricultural researchers who respond to complex reali-ties by planning their activities within the context of an “Innovation System”. Aninnovation system is a group of organizations or individuals involved in the gener-ation, diffusion, adaptation, and use of knowledge of socio-economic significance,and the institutional context that governs the way these interactions and processestake place (Hall et al., 2003; Hall, 2007). They recognize that the innovation is asocial process involving interactive learning. The social side of innovation requiresthe process of networking, forming alliances, and partnerships, negotiating prioritiesand approaches that are central to IPM diffusion. Similarly, efforts of ParticipatoryTechnology Development and Transfer also delivered useful insights and lessons fordiffusion of innovations (Arulraj and Vasanthakumar, 1996). The social system forpopularising IPM consists of researchers, extension workers, farmers, policy makersand market forces. The innovation system approach for coordination of these socialforces will speed up the rate of adoption of IPM practices.
1.3 Diffusion and Adoption Process
Diffusion and adoption are closely interrelated even though they are conceptuallydifferent. An innovation diffuses within a social system through its adoption by themembers of the social system. It takes time for an innovation to diffuse throughoutthe social system. Not all farmers within a community adopt an innovation imme-diately after the introduction of a new idea. The same innovation may take differentlengths of time for adoption by different people. Some are early in adopting aninnovation while some take longer time. The members who are early in adoptingan innovation influence other members of the social system to adopt the innovation,and they in turn influence others and it goes on.
Diffusion of innovation follows a definite pattern. Different people in a social sys-tem take different time to adopt an innovation. If the cumulative number of adoptersof an innovation over time with in a social system is plotted, the result is an S-shapedcurve (Fig. 1.1). This is called the diffusion curve. The S-shaped curve rises at firstwhen there are few adopters in a time period, accelerates to maximum when almosthalf of the individuals in the system have adopted and then increases at a graduallyslower rate as few remaining individuals finally adopt. Although all diffusion curvestend to be S-shaped but there is a variation in the slope of the S from innovation toinnovation. Some innovations diffuse rapidly while some innovations take time todiffuse. “S” curve is quite steep when an innovation diffuses relatively rapidly and“S” curve is more gradual when innovations have slower rate of adoption. The rate ofdiffusion of an innovation and the diffusion curve are affected by the characteristicsof an innovation and characteristic features of a social system.
There are few first individuals to adopt the technologies called innovators (thespeed of diffusion process increases when other people in a social system observethe results and take decisions to adopt it. When other people in a social systeminteract with innovators, the rate of diffusion is more rapid). Few more farmers after

8 R. Peshin et al.
Fig. 1.1 S-shaped cumulative curve of rate of adoption
observation of results and interaction with innovators adopt the technology. Over aperiod, large number of farmers through interaction and watching the results of earlyadopters adopt the technologies. At this stage, the rate of diffusion slows down andcomes to an end. The rate of diffusion may vary with the type of innovation and thetype of social system in which it is diffused, communication networks/channels andleadership pattern. S-shaped diffusion curve is applicable only to successful innova-tions, which are accepted by all potential adopters. But in the cases of innovationswhich were accepted at the initial stage and may be rejected after some period, theS-shaped curve may take a dive. The adoption of complex IPM practices like sam-pling of pests following S-shaped curve has been reported by Grieshop et al. (1988)in California, USA. Where the communication channels used to disseminate thesepractices were the package of practices and other modes of transfer of technologyas were used for diffusion of the green revolution technologies, the farmers werenot even possessing awareness-knowledge of the thresholds of insect pests (Peshinet al. 2007a).
1.3.1 Concept of Adoption
Adoption is a decision to make full use of an innovation as the best course of actionavailable. Lionberger (1970) defined adoption as the integration of an innovationinto a farmer’s ongoing operation through repeated and continuous use. Rogers andShoemaker (1971) defined adoption as the use of a new idea continuously on a

1 Diffusion of Innovation Theory and Integrated Pest Management 9
full scale. The “full scale” means one hundred percent utilization of an innovation.The decision to adopt an innovation involves a process. The adoption process isthus decision-making process involving a period of time during which an individualpasses through mental stages before making a final decision to adopt an innovation.
1.3.1.1 Adoption Process
Ryan and Gross (1943) in their work of diffusion of hybrid corn seed into two com-munities in the United States first mentioned the sequence of stages in the processof adoption by farmers as:
i) awareness of the existence of an innovationii) conviction of its usefulness
iii) acceptance in the sense of willingness to try the innovation andiv) complete adoption
According to Wilkening (1953), adoption process involved four stages
i) initial knowledge of a practiceii) mental acceptance
iii) use on a trial basis andiv) finally its full adoption
Adoption process is conceptualized to include different stages. There is no con-sensus among researchers regarding the number and sequences of adoption stages.The widely used five stage-model of the adoption process includes the followingstages (Rogers, 1962):
I. Awareness stage: At awareness stage, the individual becomes aware of somenew idea but does not have any detailed information or knowledge about it. Theawareness of an innovation occurs either involuntarily or because of purposiveaction on the part of an individual seeking solution to a perceived need or prob-lem. At this stage, it is important to create the right atmosphere for introducingthe innovation. Mass media are widely used information sources to raise theawareness level.
II. Interest stage: At this stage, an individual develops enough interest about aninnovation and gets motivated to seek more information and knowledge aboutit. He wants to know about innovation in terms of its nature, function, opera-tion and usefulness. At this stage, the individual deliberately seeks out sourcesfor more information about an innovation. At interest stage, individuals obtaininformation about an innovation from mass media.
III. Evaluation stage: At this stage, the individual proceeds to make a mentaltrial of a new idea by determining the applicability of the innovation to hispersonal circumstances and farming situation. The individual tries to visualizethe expected outcome if he adopts the innovation. It is during this stage that

10 R. Peshin et al.
an individual decides whether to try out an innovation on a small scale or not.A favourable evaluation leads to mental acceptance of the innovation althoughthe final decision to adopt an innovation may not be taken until the innovationafter its trial on a limited scale shows better results or proves beneficial for thefarmers. At the evaluation stage, neighbors and friends are the most preferredones to seek decisions regarding adoption of an innovation.
IV. Trial stage: This stager is characterized by the small-scale experimental use.The trial provides an individual with the opportunity to evaluate the applicabil-ity of the innovation to his personal situation in concrete and tangible forms.A successful trial gives a feeling of security before deciding to adopt where asthe innovations that are not successful, trials will have a higher rate of rejectionby the individuals. An individual ranks neighbors and friends as the first in theinformation sources.
V. The adoption stage: The final stager in this mental process is the adoptionstage. This stager is characterized by large-scale continued use of the idea andmost of all satisfaction with the idea. However, an individual who has acceptedan idea need not necessarily use it continuously. It means that there may be achance of either continued adoption or discontinuance of adoption of an inno-vation. The discontinuance may be due to dissatisfaction with the innovation ordue to availability of better alternatives (replacement). In the adoption stager,neighbours and friends are the preferred information sources.
The mass media channels of communication should be used to create awarenessabout IPM. The Punjab Agricultural University, Ludhiana used “street plays” to cre-ate awareness among the farmers in the villages covered under insecticide resistancemanagement based IPM program in cotton, about the dysfunctional consequencesof insecticides and IPM (Peshin et al. 2007a). In case of IPM, it is desired that resultdemonstrations and specific practical training should be provided to create interestin the farmers about IPM practices and for making evaluation whether to adopt theIPM innovation.
1.3.1.2 Innovation-Decision Process
An individual decision to adopt an innovation is not taken instantaneously but thisprocess consists of series of actions and choices made by him or her over time. Itis the process, which consists of sequential stages in the adoption decision madeby individuals or other units of adoption. The innovation decision process is theprocess through which an individual or other decision making unit passes fromfirst knowledge of an innovation to forming an attitude towards the innovation toa decision to adopt or reject an innovation to implementation of the new idea and toconfirmation of this decision. Thus, the innovation decision process consists of fivestages (Rogers, 1983). These are:
(i) Knowledge stage: An individual is exposed to an innovation’s existence andgains an understanding about it at this stage. An individual after gaining

1 Diffusion of Innovation Theory and Integrated Pest Management 11
awareness about an innovation through communication channels develops pre-disposition towards it. Example, farmers through mass media or change agent,become aware of zero-tillage-seed drill. In order to know more about it theymay visit an institute. Mostly people have a tendency to expose themselvesto those communication messages that are in accordance with their needs andinterests. This is called selective exposure. The individual’s perceived needfor an innovation may force him to seek knowledge about an innovation anddevelop the need to know more about it. Communication channels or changeagents can create motivation among individuals to adopt it. In order to re-duce uncertainty about innovation, an individual is motivated to seek informa-tion about its advantages and disadvantages for decision-making. Three typesof knowledge possessed by an individual influence the innovation decisionprocess.
� Awareness knowledge motivates an individual to seek “how to” knowledgeand “principles” knowledge. This type of information seeking is concen-trated at the knowledge stage of innovation-decision process but it mayalso occur at persuasion and decision stages. Here individual develops basicknowledge about an innovation.
� How to knowledge consists of information necessary to use an innovationproperly. The adopter must understand what quantity of an innovation tosecure, how to use it correctly and so on. The amount of how to knowledgeneeded depends upon complexity of an innovation, for more complex in-novations amount of knowledge needed is relatively more compared to lesscomplex innovation. There may be rejection or discontinuance of an innova-tion if adequate level of how to knowledge is not obtained by an individualprior to trial and adoption of innovation.
� Principles knowledge consists of information dealing with the functioningprinciples underlying how the innovation works. It is possible to adopt aninnovation without principles knowledge but there are greater chances ofmisusing the new idea leading to discontinuance of the innovation. The in-dividual’s competence to judge whether to adopt an innovation is facilitatedby principles knowledge.
(ii) Persuasion stage: At this stage, an individual forms a favourable or unfavour-able attitude towards the innovation. The mental activity at the knowledge stageis cognitive whereas at persuasion stage it is affective. The individual becomespsychologically involved with the innovation and engages himself or herselfactively in seeking the information about an innovation. The type of informa-tion received and how it is interpreted will determine individual’s behavior atthe persuasion stage. This is the stage at which an individual wishes to reduceuncertainty about the innovation by seeking information from his or her peers,change agent, etc about the expected consequences. Individual’s attitude to-wards an innovation is developed by developing knowledge about the perceivedattributes of innovation such as relative advantage, compatibility, etc. Theformation of favourable or unfavourable attitude towards an innovation will

12 R. Peshin et al.
subsequently lead to change in overt behavior. Consistent or positive attitudemay result in adoption whereas negative attitude may lead to rejection. How-ever, in some cases discrepancy in attitude and behavior may be there. A farmermay develop positive attitude towards high yielding variety but still use tra-ditional varieties due to high input cost of chemical fertilizers. Attitude andbehavior are not always consistent. There are other closely related factors thatinhibit the use of innovation. Example, the farmer may wish to use improvedseed variety but if there is no agency in his area to supply the improved seedvariety, he will not be able to use improved seeds.
(iii) Decision stage: An individual at this stage decides whether to adopt or rejectthe innovation. Adoption is a decision to make full use of an innovation whereasrejection is a decision not to adopt an innovation. Most of the individuals par-tially try an innovation on small-scale prior to adoption. This small-scale trial isoften a part of the decision to adopt it. The partial trial process amenable for aninnovation facilitates the adoption of the innovation rather than innovation thatcannot be tried on a small scale. For instance, zero tillage seed drill needs hugeinvestment and cannot be tried on small-scale. Trial conducted by other agenciesor individuals in the form of demonstrations are quite effective in speeding upthe process of adoption. There may be a rejection decision by farmer that is notto adopt an innovation. There are two different types of rejection decisions:
� Active rejection: It consists of adoption of an innovation and then decidingnot to adopt it.
� Passive rejection: It is also called non-adoption which consists of neverreally considering the use of an innovation.
(iv) Implementation stage: It is the stage when an individual puts an innovationinto use. Implementation stage involves change in the overt behavior of theindividual as he or she actually puts an innovation into use. The individual at animplementation stage may face problems in how to use it. A certain degree ofuncertainty about the expected consequences of the innovation still exists for theindividual. There are many doubts in his mind regarding its functions, use andexpected consequences of an innovation. It is the active information-seekingperiod and the role of change agent is very significant at this stage. Change agentcan provide technical assistance and can clear many of his doubts. It may be aterminating stage for some individuals. However, in other cases confirmationmay occur. In case the adopters are organizations rather than individual, prob-lems of implementation are more serious in nature. Mostly the organizationsdiffer in size, organizational structure, type of individuals and organizationalsetting that affect the adoption of innovation. During the process of implemen-tation, an innovation may be modified or changed.
(v) Confirmation stage: It is the stage when an individual seeks reinforcementwhether to continue the use of an innovation or reject the innovation if hereceives conflicting information. The confirmation stage continues after an ini-tial decision to adopt or reject an innovation. At this stage, the individual seeksto avoid dissonance state or to reduce it if it occurs. Here the change agent plays

1 Diffusion of Innovation Theory and Integrated Pest Management 13
a special role. The change agents provide supporting messages or informationto the individuals who have earlier adopted an innovation. There are chances ofdiscontinuance of innovation. Discontinuance is a decision to reject an innova-tion after having previously adopted it. Two types of discontinuance are:
a) Replacement discontinuance: It is a decision to reject an idea because betteralternatives are available.
b) Disenchantment discontinuance: It is a decision to reject an idea because ofdissatisfaction from its performance.
1.4 Dissemination and Adoption of IPM
Diffusion is a broader term, which encompasses unplanned as well as planned anddirected spread of an innovation. In this chapter, emphasis is on planned and directeddiffusion (dissemination)1 of integrated pest management (IPM). IPM is a knowl-edge and skill intensive innovation. IPM, “is the careful integration of a number ofavailable pest control techniques that discourage pest population development andkeep pesticide and other interventions to levels that are economically justified andsafe for human health and the environment” (FAO, 1994). Many technology transferapproaches were tried for dissemination of IPM methods. While Training & Visit(T&V) system failed, Farmer Field School (FFS) approach (For details see Chap-ters 8, 9 and 10) of educating farmers followed by community IPM activities andFarmer to Farmer approach registered success in IPM implementation in developingcountries (Matteson, 2000). In developed countries like the United States of Amer-ica, the Cooperative Extension Service has the primary responsibility for dissemi-nation of IPM technology. A number of extension methodologies are used to dis-seminate IPM to the farmers. These include training about pest and natural enemiesand field scouting, on-farm result demonstrations, field days, use of electronic andprint media regarding information on the periodic/current status of pest and naturalenemies, economic thresholds, computerised pest forecasting, newsletters, etc (Fordetails see Chapter 16). In some European countries like Denmark, Netherlands,Norway, Sweden and Switzerland “IPM innovation system” approach is the cornerstone for high adoption of IPM practices by the growers. The European Parliamentis for developing regulatory frame work for taxes on pesticides. Taxes on pesticidesare levied in Norway, Sweden and Denmark. Different strategies are adopted forimplementation of IPM e.g., pest warning system, legislation, providing informa-tion about IPM to growers, employment of pest control advisors by large farmersand growers associations for plant protection, providing incentives for low pesticideIPM and support of market in encouraging sale of low pesticide use products (Fordetails see Chapters 7 and 14).
1 Diffusion and dissemination is used interchangeably in this chapter.

14 R. Peshin et al.
1.4.1 Measuring Adoption of IPM
There is no agreement as to what constitutes adoption of IPM. There have beenattempts by Economic Research Service (ERS) in the United States of America(Vandeman et al., 1994), van de Fliert (1993) in case of farmer field school IPMprogram in Indonesia, and Kogan and Bajwa (1999) in developing IPM continuumbased on levels of IPM complexity (Fig. 1.2) to measure the level of IPM adoption.ERS in the United States (Vandeman et al., 1994) divided integrated pest (insectpests, plant diseases, weeds) management into integrated insect pest management,integrated disease management and integrated weed management, and identified7–9 practices “indicatives of an IPM adoption”. The level of adoption of IPM wascategorized into the following (Benbrook and Groth, 1996):
I. low level of IPM adoption based on scouting (S) and pesticides applicationbased on economic threshold(ETL) for one pest,
Level III
Level II
Level I
Threshold for IPM
Level of IPM Integration
Asc
endi
ng le
vel o
f pe
st m
anag
emen
t co
mpl
exit
y
Syntheticpesticidesapplied bycrop phenologyor calendarConventionalPest Control
Syntheticpesticides;pest detectionand thresholds
Transition to Level I IPM
Selectivepesticides;pest detectionand thresholdscultural tactics
Same as previous+all IPM tacticswithin a pest classcategory
Same as previous +Integration of allPest categories,Use of crop-pest models
Same as previous +Multicrop interactionsEcosystem processes,And regional aspects
Integrated pest management: Increasing range of tactical componentsand level of integration.
Fig. 1.2 Diagram depicting the IPM continuum, and showing the relative complexity of differentlevels of integrationSource: (Kogan and Bajwa, 1999) With permission from: An Soc Entomol Brasil (Anais da So-ciedade Entomologica do Brasil).

1 Diffusion of Innovation Theory and Integrated Pest Management 15
II. medium level of IPM adoption based on low level adoption practices (S+ETL),plus 1–2 additional practices identified as indicative of an IPM approach, and
III. high level of IPM adoption, which requires adoption of low level adoption prac-tices (S + ETL) plus 3 or more additional IPM tactics.
Kogan and Bajwa (1999) developed a six point continuum. It has at one end con-ventional pest control, and at the other end all IPM tactics which include selectivepesticide based on threshold, cultural control, pest detection, ecosystem process, etc,depicting level of IPM adoption based on complexity of different levels of integra-tion (Fig. 1.2).The continuum can be used to study the level of adoption of IPM.
I. The conventional pest management: use of synthetic pesticides based on cropphenology or calendar based.
II. Transition to level 1 IPM: synthetic pesticides based on pest detection and eco-nomic thresholds.
III. Graduation to level 1 IPM: use of selective pesticides based on pest detectionand threshold, and crop manipulations techniques (cultural practices).
IV. At continuum 4 he placed integration of level 1 (use of selective pesticidesbased on pest detection and threshold, and crop manipulations techniques) withdecisions based on pest categories.
V. The level 2 includes: use of selective pesticides based on pest detection andthreshold, and crop manipulations techniques, decisions based on pest cate-gories and use of crop-pest models.
VI. The level 3 integration at continuum 6 is selective pesticide use, pest detection,economic thresholds tactics, for different class of pest and pest categories basedon important crop-pest models and addition of multicrop interaction, ecosystemprocesses and regional aspects.
Hence what constitutes the adoption of IPM, and what constitutes the well de-fined IPM approach at farmer level is far from clear. The IPM tactics may vary fromcrop to crop, from area to area, and the importance of a practice also varies. IPMpractices cannot be proposed as a blanket recommendation (Dilts and Hate, 1996)and cannot be developed in the USA and disseminated in India- as was the case withpesticide. IPM is location specific and it requires several years of experiments, trials,repetitions and validations in a given area (Lagnaoui et al., 2004). Cultural practicesof pest management combined with pest detection (agro- ecosystem analysis) anduse of selective pesticides based on threshold is basic requirement to consider it foradoption of IPM.
1.4.2 Adoption of IPM
Worldwide the rate of adoption of IPM has been slow compared to adoption ofpesticide use (Kogan and Bajwa, 1999). In the USA, the extent of adoption ofthe IPM practices in different crops has reached 71 percent from 40 percent in1994 (GAO, 2001). In Europe the IPM policies, programs and coordination with
16 R. Peshin et al.
private sector has resulted in promoting IPM and that has resulted in increasednumber of farms adopting IPM practices (Also see Chapter 1, Vol. 1 for details).The slow rate of adoption of IPM by farmers causes greater concern among policymakers and extension workers. The factors that make the farmer selective in adop-tion of IPM technology are numerous (Ridgley and Brush, 1992; Leeuwis, 2004).The complexity of IPM technology was cited as one of the possible reasons forlow adoption (Rogers, 1995; Kogan, 1998). IPM is a diffused technology (clusterof technologies) (Kogan and Bajwa, 1999) and IPM practices like agro-ecosystemanalysis, economic threshold levels of pests are software component innovationswhich are not highly observable as is the case with pesticides (Rogers, 1995). How-ever, there is a growing recognition that there is some serious problem with thetransfer technology (Wearing, 1988), as IPM becomes concrete only with farmer’sdirect hands-on experience with IPM (Rogers, 1995).
IPM innovation is knowledge intensive, in case of knowledge and skill inten-sive IPM practices, like economic thresholds, its rate of adoption among trainedfarmers has been slow, and its diffusion among untrained farmers has almost beennegligible (Peshin, 2005). The transfer of technology problem may be rooted inthe diffusion of innovation theory that provides the basis for the extension services.It needs different strategy through a process of knowledge and skill diffusion andactive learning and active adoption by the farmers. It has to be a planned process ofimparting knowledge and skills, and organized learning by the end users. The dif-ferent IPM practices can be classified on the complexity- simplicity continuum. TheComplexity associated with agro-ecosystem analysis, and determining threshold ofinsect pest are the deterrents in the adoption of these practices. (Wearing, 1988;Greishop et al., 1990; van de Fliert, 1998; Peshin and Kalra, 2000; Norris et al.,2003). According to Wearing (1988), IPM practices must deal with farmers’ needs,perceptions, resources, constraints and objectives, and its complexity demands con-siderable resources are devoted to IPM dissemination.
Although diffusion research has contributed to our understanding of how tech-nological innovations in agriculture spread in farming community in case of oneoff technologies like fertilizers, seeds, pesticides, etc, and recently in case of Btcotton (Peshin et al., 2007b) but its application to knowledge- intensive-complextechnologies is debated by the scientific community. IPM, which is a combinationof different technologies (practices/methods) introduced in agriculture system in1970s has not diffused like the green revolution technologies. Many practices ofIPM emphasize change in farmers’ decision making behavior, and therefore notappropriate to call these practices as innovations (Anonymous, 1996). IPM is bothsemi-continuous and discontinuous innovation. Semi-continuous because it presentsdifficulties both at communication and adoption level and farmers must partiallychange their behavior (Lagnaoui et al., 2004) regarding manipulation of agronomicpractices specifically done to reduce pest build up. Discontinuous innovation as itis a departure from the calendar based pest management to threshold based pestmanagement which requires cognition (new knowledge and comprehension) andanalytical skills. Whether the adoption theory is applicable to IPM implementation,which emphasises learning process and not technological innovation (van de Fliert,

1 Diffusion of Innovation Theory and Integrated Pest Management 17
1993) is a researchable problem. IPM is complex and knowledge intensive mix ofinnovations namely, cultural practices (again a mix of different innovations), me-chanical, biological, and chemical practices based on threshold theory. Almost alldiffusion researches and studies on rate of adoption have concentrated on singleinnovation/practice and not a mix of practices. Thus, it is important to decide as towhat can be termed as adoption of IPM and how it can be measured. The generali-sation of diffusion of IPM innovation based on diffusion of innovation theory is notpossible. Few studies have demonstrated or studied the rate of adoption of IPMforming S-shaped curve, IPM traversing innovation-decision process stages andfarmer-to-farmer diffusion. Dissemination and adoption of IPM should be studiedin the context of IPM attributes, incentives provided to farmers, quality of educatingfarmers about IPM practices, and the existing IPM innovation system of a countryor region.
1.4.2.1 Innovation Attributes Influencing Adoption of IPM
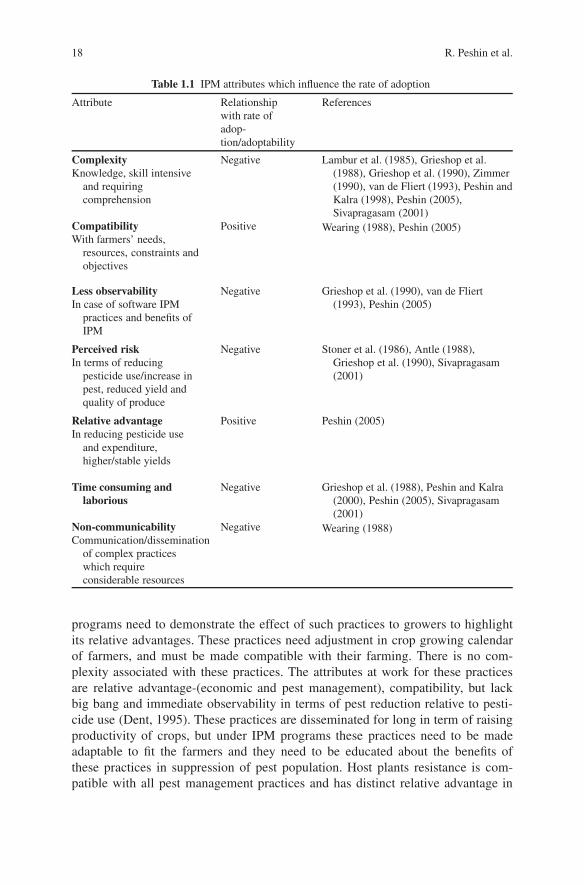
The adoption of IPM largely depends on technological attributes more than socio-personal attributes. Age, education, farm size, computer ownership and other socio-personal attributes have no significant relationship with attitude towards IPM anddecision making process of farmers (Grieshop et al., 1988, Zimmer, 1990) but landownership, type of crop and previous experience with IPM program do influencefarmers’ decision making about IPM (Zimmer, 1990; Peshin, 2005). The attributesof innovation identified and generalized by Rogers (1983) are: relatively advantages,compatibility, complexity, trialability and observability. Fliegel, et al. way back in1968 identified 15 attributes that had a relationship with rate of adoption. Thoseare: initial cost, continuing cost, rate of recovery, payoff, social approval, savingtime, saving discomfort, regularity of reward, divisibility for trial, complexity, clar-ity of results, compatibility, association with dairying, mechanical attraction andpervasiveness. Not all these attributes may be relevant to determine the adoptabilityof IPM practices. Nevertheless, the attributes like relative advantage, compatibility,complexity, observability, risk/uncertainty and communicability of different IPMtactics determine the rate of adoption and adoptability of IPM. Complexity is themost important attribute that has delayed its adoption (Norton, 1982a, Zimmer,1990). The attributes, which retard and accelerate the adoption of IPM, are listedin Table 1.1.
If we divide the IPM practices into crop plant manipulation practices, host plantsresistant cultivators, use of sampling to determine economic threshold level ofpests, conservation and augmentation of natural enemies, the effect of attributeswhich retards and accelerates the rate of adoption will vary. In case of crop ma-nipulation practices, which are done specifically to control pests like sowing time,plant geometry, fertilization seed dressing etc. and are normally adopted by thegrowers but without paying attention to the role of these practices in reducingthe pest build up (Peshin, 2005). The information about these practices can bedisseminated through different channels of communication. In case of adjustingthe sowing time to allow the crop to create asynchrony with the pest, the IPM
18 R. Peshin et al.
Table 1.1 IPM attributes which influence the rate of adoption
Attribute Relationshipwith rate ofadop-tion/adoptability
References
ComplexityKnowledge, skill intensive
and requiringcomprehension
Negative Lambur et al. (1985), Grieshop et al.(1988), Grieshop et al. (1990), Zimmer(1990), van de Fliert (1993), Peshin andKalra (1998), Peshin (2005),Sivapragasam (2001)
CompatibilityWith farmers’ needs,
resources, constraints andobjectives
Positive Wearing (1988), Peshin (2005)
Less observabilityIn case of software IPM
practices and benefits ofIPM
Negative Grieshop et al. (1990), van de Fliert(1993), Peshin (2005)
Perceived riskIn terms of reducing
pesticide use/increase inpest, reduced yield andquality of produce
Negative Stoner et al. (1986), Antle (1988),Grieshop et al. (1990), Sivapragasam(2001)
Relative advantageIn reducing pesticide use
and expenditure,higher/stable yields
Positive Peshin (2005)
Time consuming andlaborious
Negative Grieshop et al. (1988), Peshin and Kalra(2000), Peshin (2005), Sivapragasam(2001)
Non-communicabilityCommunication/dissemination
of complex practiceswhich requireconsiderable resources
Negative Wearing (1988)
programs need to demonstrate the effect of such practices to growers to highlightits relative advantages. These practices need adjustment in crop growing calendarof farmers, and must be made compatible with their farming. There is no com-plexity associated with these practices. The attributes at work for these practicesare relative advantage-(economic and pest management), compatibility, but lackbig bang and immediate observability in terms of pest reduction relative to pesti-cide use (Dent, 1995). These practices are disseminated for long in term of raisingproductivity of crops, but under IPM programs these practices need to be madeadaptable to fit the farmers and they need to be educated about the benefits ofthese practices in suppression of pest population. Host plants resistance is com-patible with all pest management practices and has distinct relative advantage in

1 Diffusion of Innovation Theory and Integrated Pest Management 19
terms of less pest infestation. The scope of this tactics is immense in IPM pro-grams provided it meets the yield and quality attributes compatible with needs ofadopters. The adoptability and rate of adoption of transgenic like Bt-cotton whichprovides resistance against Lepidopteron insect pests has been very high (Peshinet al., 2007b), in both the developed and developing countries. The attributes thatare responsible for its higher rate of adoption of resistant cultivars especially trans-genic crop varieties are: relative advantage, compatibility, observability and, lack ofcomplexity and risk (Peshin et al., 2007b). Adoption of cultural practices and re-sistant crop varieties will result in farmers growing a healthy crop, and healthy andvigorous crop is one of the best forms of pest management (Norris et al., 2003).The researchers should develop such cultural practices that have dual purpose ofincreasing productivity and reducing pest infestation. The technology developed atresearch stations should be field tested at growers’ fields for technological attributesand adoptability.
1.4.2.2 Relative Advantage
Relative advantage of IPM practices over pesticide intensive pest management andobservability of the relative advantages are important factors for its adoption. Therelative advantages in term of reduction of pesticides expenditure and increased pro-ductivity has been reported from around the world. Relative advantage of differentIPM methods like economic threshold level for taking pesticides use decisions, arenot having high degree of observability and farmers perceive it risky (Grieshop et al.,1990; Peshin and Kalra, 1998; Wearing, 1988).
Let us take the example of IPM technology being disseminated in Asia throughFarmer Field Schools (FFSs) in rice crop and the sub-dimensions of relative ad-vantage of IPM practices. In case of economic profitability/benefits over pesticidebased pest management, IPM programs resulted in saving on pesticide expendi-ture, which were small and not visible (observable) to farmers (van de Fliert, 1993)unlike economic advantages of the green revolution technologies (high yielding va-rieties, fertilisers, pesticides) and recently Bt cotton. Thus, the slow rate of adoptionof IPM practices even among the trained farmers, and no diffusion to untrainedfarmers.
The sub-dimension of relative advantage- low initial cost does not have any re-lationship with IPM practices as it is a decision making process, but the other twosub-dimensions namely, saving of time and effort, immediate reward are having abearing on adoption of sampling techniques. Sampling techniques are time consum-ing and laborious (Grieshop et al., 1988; Zimmer, 1990; van de Fliert, 1993; Peshinand Kalra, 2000; Peshin, 2005; Sivapragasam, 2001), and do not have immediateobservable reward in reducing pest infestation. Therefore, these sub-dimensions ofrelative advantage negatively affect the adoptability and rate of adoption. Diffusionof an innovation being an uncertainty reduction process (Rogers, 2003), the agenciesdisseminating IPM must ensure to reduce uncertainty about the relative advantagesof such IPM practices which are in direct conflict with conventional calendar basedapplication of pesticides.

20 R. Peshin et al.
1.4.2.3 Observability
Higher the observability and communicability of results, the higher is the rate ofadoption. IPM mostly is a software innovation and a decision making process. Thesoftware components of the technology have less observability (Rogers, 1995), thusslower rate of adoption. The observability of the benefit of sampling techniques,crop plant manipulation is distinctly far less than pesticides use to control pest. Thelow level of observability has reduced the adoption of critical IPM practices.
1.4.2.4 Complexity
Diffusion and adoption of innovations, which are complex to communicate and ap-ply, like knowledge and skill intensive IPM practices (agro- ecosystem analysis,sampling) are slow. Although, use of plant protection chemicals diffused withinthe farming community at a faster rate but the use of pesticides according to goodagricultural practices (right timing, right chemical against a particular pest, rightdosage, right method of spray and right dilution) did not. For example in Punjab,agriculturally the most advanced state of India, the adoption of pesticides accordingto good agricultural practices is low (Peshin, 2005). Complex technologies- complexinformation do not diffuse in the same manner as do the simple and one of tech-nologies. Dissemination of complex IPM practices require different menu for itsadoption by the farmers. These practices cannot be diffused through “package ofpractices” published by the agricultural universities in India or through web baseddissemination of IPM technology in the developed world. The economic thresholdfor insect pests of cotton were recommended and disseminated through its farm liter-ature and other extension programs by one of the premier agricultural universities ofIndia, Punjab Agricultural University, in the year 1979 for sucking insect pest (jas-sid Amrasca biguttula) and in 1992 for bollworm complex (Helicoverpa armigera,Earias vittella) and whitefly (Bemisia tabaci). However, the awareness- knowledgeabout these sampling procedures was zero where no IPM programs were conductedand mere three percent where IPM training was imparted, and its adoption was zeroup to 2004–2005 (Peshin et al., 2007a). The farmers perceive economic thresholdas it is knowledge, skill, labor intensive and time-consuming practice (Peshin andKalra, 2000 and Peshin, 2005). The IPM programs implemented in northern Indiahas mostly resulted in gain of knowledge about insect pests and natural enemies,but these programs did not impart skills to the farmers in pest management based onthreshold theory. The conservation of natural enemies in the crop ecosystem can beachieved by applying economic threshold of pest for taking pesticide use decision.It is observed that IPM programs have achieved little success in case of complexpractices.
The difficulty and complexity of determining ETLs could be overcome if ade-quate training is provided to farmers and if professional services are used, just likein the developed countries. The use of simplified action thresholds based on levelof pest damage may be an alternative to actual pest counts and is worth consider-ing (Walker et al., 2003). Research and development in pest management does not
1 Diffusion of Innovation Theory and Integrated Pest Management 21
always lead to practical improvements. The issues generally fall into two categories,namely, (1) design, whereby R&D is aimed at the wrong questions or at developinginappropriate practices and (2) delivery, whereby despite the product being welltargeted, the results are not getting through to be implemented by the pest managersand their advisers (Norton, 1982b). Simplifying ETLs, considering pests complexfor calculating ETLs and the experiential delivery mode of complex IPM practicescan help to increase the adoption. Supply-Push strategy (e.g., pesticide residues andhealth related issues) through legislation, enforcement or simply political will orthe Demand-Pull strategy whereby the inherent advantages of adopting the IPMprogram (financial, risks reduction, etc) are perceived by the farmer as desirabletowards meeting their farming objectives (Sivapragasam, 2001).
The combined efforts of the researchers at the research stations – the researchersand extension staff working at the farmers’ fields, and inclusion of both biologicaland social scientist on development, adaptation, evaluation and education for bring-ing in complex IPM innovation into use by farmers (Wearing, 1988; Zalom et al.,1990). By adopting this model for dissemination of complex IPM practices, the rateof adoption resembled “S” shaped curve (Grieshop et al., 1988).
1.4.2.5 Compatibility
Compatibility in terms of past experience and need of the farmers is positively re-lated to rate of adoption. An innovation that is consistent with the existing practices,past experiences and needs of potential adopters are more likely to be adopted. Inaddition to complexity of knowledge and skill intensive IPM practices, compati-bility of these practices have been questioned by many especially in case of smallfarmers in developing countries (Bentley and Andrews, 1996; van de Fliert, 1998;Zadoks, 1989) and on accounts of cost involved for scouting in developed countries(Norris et al., 2003). In the USA and other developed countries, where farmers havelarge landholdings compared to developing countries of the world, farmers hire theservices of scouts for monitoring their crops and finding threshold levels but itsfiscal sustainability remains a big question as to who will bear the cost of sampling(Norris et al., 2003).
1.4.2.6 Non-Communicability
Communicability is the ease with which, know how and usefulness of an innovationcan be communicated. Not all the IPM practices have the communicability. Thecrop plant manipulation practices done specifically to create asynchrony betweendestructive stage of pest and the crop are communicable, like adjusting sowing timeof rice to avoid stem borer infestation, or planting cotton crop early to avoid late sea-son American bollworm (Helicoverpa armigera) infestation. The communicabilityof resistant varieties is also easy if the variety has observable relative advantage overthe variety it is replacing. The communicability of Bt cotton in Indian Punjab is anappropriate example. Even before the release of Bt cotton in Punjab, the farmers didpossess awareness- knowledge about its benefits, and had purchased seed from far

22 R. Peshin et al.
off states like Gujarat (India) where it was released earlier (Peshin et al., 2007b).The non-communicability of knowledge and skills to identify pest and their natu-ral enemies and economic threshold levels is one of the attributes of IPM. Despitethe relative advantages of IPM, it is very difficult to diffuse (Rogers, 1995), as itlacks communicability, and farmers are wondering whether they should believe theextension people who were propagating the benefits of calendar based pesticide use.
1.5 Predictive Model of IPM Adoption
The diffusion researcher should move beyond the Rogers (1983) model of diffusionof innovation, as has been suggested by Rogers (1995, 2003) himself. The diffu-sion of innovation research has to give up the “ex-post-facto” type research studies,which have been prisoners of socio-economic factors influencing the adoption ofinnovation and in correlating the effects to these factors. The diffusion researchersshould employ “action research” design to study the IPM implementation and feedthe result to develop farmers’ acceptable IPM system.
The innovation attributes of IPM practice need to be studied with the farmersto evaluate innovation in terms of adoptability and adaptability. The qualitative andquantitative data be collected and fed into research system for making innovationfit the farmer. Adoptability indices of critical IPM practices for particular locations,crop etc. will help to predict the adoption or non-adoption of the innovation (Peshin,2005). The biological scientists should involve social scientist from the field of ex-tension education to find out the adoptability of their innovation to provide themthe feedback, as to how the farmers will receive the technology and what needs tobe done to make technology less complex and compatible to farmer. The extensioneducation scientist should use an objective scale to elicit the responses of the farmersat whose field the technology is tested to work out the adoptability indices based oninnovation attributes identified for a particular innovation namely relative advantage,compatibility, complexity, observability, risk and communicability. Adoptability in-dices can be worked out by the following formulae I and II (Peshin, 2005):
Index of an attribute = Maximum score obtained by a group of farmers
Maximum score obtainable(I)
It can range from 0 to 1
Adoptability index is worked out by summing up the indices of positively relatedattributes e.g., relative advantage, compatibility, etc, and from it subtracting the sumof the indices of negatively related attributes like complexity, risk, etc as given byformula II.
Adoptability index =∑ Indices of positively related
attributes of an innovation− ∑ Indices of negatively related
attributes of an innovation
Number of attributes(II)

1 Diffusion of Innovation Theory and Integrated Pest Management 23
It can range from −1 to +1.The adoptability index of a particular innovation can range from 0 to 1. Adopt-
ability indices of IPM practices in cotton were worked out by Peshin (2005) usingthe above listed formulae I and II. Based on the adoptability indices it was concludedthat adoptability of resistant cultivators (Bt-cotton) was high along with manipu-lation sowing time of cotton to reduce insect pest losses, but the adoptability ofseed dressing, sampling for insect pests to determine economic threshold level waslow. The entomologists can utilize the result of such studies to make use of ETLfarmer friendly. Such innovations do not diffuse in the social system like the one offtechnologies of the green revolution (input intensive technologies) and recently Btcotton (Peshin et al., 2007b).
The adoption process can be captured accurately if an innovation is followedover time as it traverses (courses) through the farming system (Structure of SocialSystem). According to Rogers (1995) “Conceptual and Analytical Strength is gainedby incorporating time as an essential element in analysis of human behavior”. Alter-native research approach to “after the fact data gathering (ex-post-facto)” about howIPM innovation has disseminated and adopted, the model given by Singh (2004)makes it possible to investigate the diffusion of innovation when the disseminationof technology has just begun (Fig. 1.3). Adoption decision process to determinedynamics of innovation adoption is based on the following three factors that canaffect the adoption decision process (Singh, 2004):
i. Innovation attributesii. IPM program and policy efforts
iii. Other characteristics (socio-economic)
Individual Dispositional and Social Structural Characteristics
Time
Innovation characteristics and programpolicy efforts & characteristics
Awareness Process states
Outcome States Orientation
Response (+) Orientation Response (–)
Exploratory Interest
Evaluation Decision
Action
PROBABILITIES
Favourable (+) Indifferent Unfavourable (–)
Acceptance (+) Rejection (–)
Adoption Blocked adoption Continuance Discontinuance
Fig. 1.3 Dynamics of innovation-adoption decision processSource: Singh Raghbir (2004).

24 R. Peshin et al.
The process stages can be knowledge – awareness, exploratory interest, evalua-tion decision and action and the probabilities identified for outcome by Singh (2004)with these stages are:
I. Awareness: Orientation response can be positive or negativeII. Exploratory Interest:
a. Favourable (+ve)b. Indifferentc. Unfavourable (−ve)
III. Evaluation Decision: Based on testing of innovation with farmers it can be:
a. Acceptance (+ve)b. Rejection (−ve)
IV. Action:
a. Adoption,b. Blocked adoption (Adopted, due to other reasons could not adopt)c. Continuanced. Discontinuance
This model is based on Marco chain model of probabilities. The model can beused to determine the IPM adoption process once the IPM intervention is introducedinto the farming system, and can be used by researchers to fit the IPM methods tofarming system, modelling of training or other IPM dissemination efforts to increasethe adoption, and policy efforts required for IPM dissemination and adoption. Incase of IPM the researchers should study the initial policy decision to disseminateIPM, what aspects of IPM need more emphasis. Field experiments in which pre- in-tervention, during intervention and post-intervention measurements can be obtainedto study the adoptability of IPM tactics and modify these to be compatible withparticular farming system to increase its rate of adoption.
1.6 IPM Innovation System
It is increasingly recognized that traditional agricultural science and technology in-vestments such as research and extension, although necessary, are not sufficient toenable agricultural innovation (World Bank, 2007). Research and technology devel-opment contribute only part of innovation process (Rajalahti et al., 2008). An inno-vation system comprises the organisations, enterprises and individuals that demandand supply knowledge and technologies, and the policies, rules and mechanismswhich affect the way different agents interact to share, access, exchange, and useknowledge (World Bank, 2007).
IPM has not been the creation of innovation per se, but the adaptation of the exist-ing pest management practices, like cultural practices, physical practices, cultivation

1 Diffusion of Innovation Theory and Integrated Pest Management 25
of resistant varieties and threshold based pest management. IPM program and policy(Singh, 2004) related to potential public and private sectors, which include policydecisions, coordinating all the stakeholders involved in IPM innovation system. Incase of IPM, coordination of multi-stakeholder partnership is required, and it re-quires active coordination of the researchers, extension workers, farmers, policymakers and market forces for adoption of IPM. IPM innovation system offers al-ternatives for reforming the extension system involved with dissemination of IPMtechnology. Its attraction is that it recognises that innovation is not a research-drivenprocess that relies simply on technology transfer. Instead, IPM innovation is a pro-cess of generating, accessing and putting knowledge into use. Central to the processare the interactions of different people and their ideas; the institutions (the attitudes,habits, practices and ways of working) that shape how individuals and organisationsinteract; and learning as a means of evolving new arrangements specific to localcontexts (Sulaiman, 2008). IPM innovation system requires potential public andprivate sectors be involved in the creation (like research, development and marketingof bio-pesticides, bio-gents), diffusion, adaptation and use of all types of knowledgerelevant to IPM. When all these stakeholders combine as is the case in Switzerland,where policy makers, researchers, farmers, extension services and market forceshave joined to promote low pesticide integrated production protocols. In case ofIPM, researcher/research institution, company, and farmer/farmer association enterinto a risk- and benefit-sharing arrangement in the form of contracts, joint share-holding, or revenue sharing, which guarantees that one partner alone does not sharebenefits-risks (World Bank, 2007).
Overtime, the innovation system concept has gained wide support among themember countries of the Organisation for Economic Cooperation and Development(OECD). The concept has been applied in European Union and a number of de-veloping countries as a frame work of policy analysis (OECD, 1997; 1999; Wong,1999; Cassiolato et al., 2003).
1.7 Conclusion
The major constraints limiting the adoption of IPM practices are risk and complexityperceived by the farmers (Antle, 1988; Grieshop et al., 1990; Peshin, 2005). Thoughthe farmers are aware about the toxic hazards of pesticides (Peshin, 2005), perceivedrisk factors in terms of more crops losses by reducing pesticides use, which in turnmay reduce the productivity and profit is one of the major limiting factor in adop-tion of IPM. The involvement of farmers/farm organisations in development anddiffusion of IPM practices in coordination with researchers, extension workers, andmarket forces for adoption of IPM will reduce the risk perception associated withIPM. The lack of vast trained personnel in sampling techniques for educating andproviding direct hands on experience to farmers is hindering the effective dissemi-nation and adoption of the technology. The IPM program needs to be designed withthe farmers, which will take care of their needs, perception, resource constraints andobjectives (Lambur et al., 1985; Rogers, 1995; Grieshop et al., 1990). “Good fit”

26 R. Peshin et al.
between IPM practices and the farms is one of the key principles of IPM implemen-tation (Wearing, 1988) and its examples are green house crops IPM in Europe, appleIPM in south Tyrol, cotton IPM in Texas, almonds IPM in California, apple IPM inPennsylvania (Wearing, 1988).
To do this, considerable resources need to be devoted to IPM dissemination. Thetrainers have to move from imparting awareness-knowledge to higher levels of cog-nitive domain-comprehension, application and evaluation of IPM methods relatedto role of natural enemies, economic threshold, biological control (conservation andaugmentation) as it exists in crop ecosystem, and how all IPM tactics intervenedwith each other (Grieshop et al., 1990). The diffusion researchers have to movebeyond innovation bias and individual blame, they need to study technological con-straints in terms of technological attributes, the quality of trainers and training, andother factors that limit the adoption of IPM practices. The trainers need to targetthose practices which are critical for transition of farmers to IPM practitioners. Mostof the evaluation of IPM has been in term of its advantages and focused on economicattribute of IPM (Rajotte et al., 1986), though a significant factor in decision making(Grieshop et al., 1988) but non-economic attributes of the IPM innovation such ascomplexity, compatibility and ease of use are important to its adoption (Lamburet al., 1985). The Diffusion of Innovation Theory seldom investigated the effects ofadopting such a package approach (Rogers, 2003). The effects of individual com-ponents were investigated and documented. However, effects of all the innovations,plus the synergistic effects were not investigated. Obviously, such thinking did notemerge for IPM technology too as IPM could be better considered as a technologycluster. Such a silence in Diffusion of Innovations Theory sounds louder alert onsome of the unexplained stories of IPM impact.
The financial resource and work force available with pesticide companies topropagate the adoption of pesticide with immediate observable effects in terms ofknockdown of pests is a challenge for IPM implementation agencies. ThereforeIPM innovation system approach is required to involve all the actors namely re-searcher/research institution, company, and farmer/farmer association to enter intoa risk- and benefit-sharing arrangement in the form of contracts, joint sharehold-ing, or revenue sharing, which guarantees that benefits-risks are not shared by onepartner alone.
Acknowledgments We are grateful to Prof. A.W. van den Ban, formerly professor of extensioneducation at Agricultural University Wageningen, the Netherlands, and Dr. Oscar Ortiz, Interna-tional Potato Center Peru, for their critical comments and valuable suggestions on the draft chapter.
References
Anonymous. 1996. 4th Refresher Course for Alumni of the International Course on Plant Protectiofrom Asia, International Agriculture Centre, Wageningen.
Antle, J. 1988. Integrated pest management: It needs to recognise risks, too. Choices 3: 8–11.

1 Diffusion of Innovation Theory and Integrated Pest Management 27
Arulraj, A. and Vasanthakumar, J. 1996. Participatory Technology Development- A Case Study.Discussion Papers, Sugarcane Breeding Institute, ICAR, Coimbatore.
Benbrook, C.M. and Groth, E. 1996. Indicators of the Sustainability and Impacts of Pest Man-agement Systems. AAAS 1997 Annual Meeting, Seattle, Washington, February 16, 1996.http://www.pmac.net/aaas.htm
Bentley, J.W. and Andrews, K.L. 1996. Trough the road blocks: IPM and Central American small-holders. Sustainable Agricultural Programme, Gatekeeper Series 56. International Institute forEnvironment and Development, London.
Cassiolato, J.E., Lastres, H.M.M. and Maciel, M.L. 2003. Systems of Innovation and Development.Edward Elgar, Cheltenham, U.K.
Dent, D. 1995. Integrated Pest Management. Chapman and Hall, London.Dilts, D. and Hate, S. 1996. Farmer Field School: Changing paradigms and scaling-up. AgREN
Network Paper 59b, Overseas Development Institute, London.ERS (Economic research service USA) 1994. Measuring IPM Adoption. http://www.pmac.net/
measind.htmFAO. 1994. Sustainable agriculture through integrated pest management. Twenty-Second Regional
Conference for Asia and the Pacific, Manila.Fliegel, F.C., Kivlin, J.E. and Sekhon, G.S. 1968. A cross cultural comparison of farmers’ percep-
tions of innovations as related to adoption behavior. Rural Sociology 33:437–449.GAO (United States General Accounting Office). 2001. Agricultural Pesticides Management Im-
provements Needed to Further Promote Integrated Pest Management http://www.gao.gov/new.items/d01815.pdf
Gartshore, D. 2004. Communication and cooperation: Technology transfer on family cotton farms.Journal of Issues in Informing Science and Information Technology 1:443–454.
Grieshop, J.I., Zalom, F.G. and Miyao, G. 1988. Adoption and diffusion of integrated pest man-agement innovations in agriculture. Bulletin of the Entomological Society of America 34:72–78.
Grieshop, J.I., MacMullan, E., Brush, S., Pickel, C. and Zalom, F.G. 1990. Extending integratedpest management by public mandate: A case study from California. Society and Natural Re-sources 3:33–51.
Hall, A.J., Yoganand, B., Sulaiman, R.V. and Clarke, N.G. 2003. Post-harvest Innovations in In-novation: Reflections on Partnership and Learning, CRHP South Asia, Patancheru and NaturalResources International, Kent.
Hall, A.J. 2007. Challenges to Strengthening Agricultural Innovation Systems:Where DoWe Go From Here? Working Paper United Nations University, MERIT, Maastricht,http://www.merit.unu.edu
Katz, E. 1961. The social itinerary of social change: Two studies on the diffusion of innovations.In: Schramm, W. (ed), Studies of Innovation and of Communication to the Public, StanfordUniversity.
Kogan, M. 1998. Integrated pest management: Historical perspectives and contemporary develop-ments. Annual Review of Entomology 43:243–270.
Kogan, M. and Bajwa, W.I. 1999. Integrated pest management: A global reality? Annals of theEntomological Society of Brasil 28:1–25.
Lagnaoui, A., Santi, E. and Santucci, F. 2004. Strategic communication for integrated pestmanagement. Paper first presented at the Annual Conference of the International As-sociation for Impact Assessment in Vancouver, Canada (IAIA 2004) under the confer-ence theme of Public Involvement and Risk Management. http://siteresources.worldbank.org/extdevcomsusdevt/Resources/ipmcommfinal.pdf
Lambur, M.T., Whalom, M.E. and Fear, F.A. 1985. Diffusion theory and integrated pest manage-ment: Illustrations from Michigan fruit IPM program. Bulletin of the Entomological Society ofAmerica 31:40–45.
Leeuwis, C. 2004. Communication for Rural Innovation – Rethinking Agricultural Extension,Blackwell Science Limited, Oxford.

28 R. Peshin et al.
Lionberger, H.F. 1970. Adoption of New Idea and Practice. The Iowa State University Press,Ames, Iowa.
Matteson, P.C. 2000. Insect pest management in Tropical Asian irrigated rice. Annual Review ofEntomology 45: 549–574.
Norris, R.F., Caswell-Chen, E.P. and Kogan, M. 2003. Concept in Integrated Pest Management.Prentice-Hall of India Private Ltd, New Delhi.
Norton, G.A. 1982a. Crop protection decision making- An overview. In: Austin, R. B.(ed.) De-cision Making in Practice of Crop Protection Monograph, No.25, Crop Protection Council,London, pp. 3–11.
Norton, G.A. 1982b. Philosophy and Concepts. Paper presented at the Expert System Work-shop on Rice Pest Management in the Muda Area of Malaysia, 9–13 December, 1991, AlorSetar, Kedah.
OECD (Organisation for Economic Co-operation and Development). 1997. National InnovationSystems. OECD, Paris, France.
OECD (Organisation for Economic Co-operation and Development). 1999. Managing NationalInnovation Systems. OECD, Paris, France.
Peshin, R. and Kalra, R. 1998. Integrated pest management at farmer’s level. Man and Development22:137–141.
Peshin, R. and Kalra, R. 2000. Integrated Pest Management: Adoption and its Impact on Agricul-ture. Classical Publishing Company, New Delhi.
Peshin, R. 2005. Evaluation of the Dissemination of Insecticide Resistance Management Pro-gramme in Cotton in Punjab. Ph.D Dissertation, Punjab Agricultural University, Ludhiana.
Peshin, R., Dhawan, A.K., Kalra, R. and Tript, K. 2007a. Evaluation of insecticide resistance man-agement based Integrated Pest Management program. AI & Society: Journal of Human CentredSystems 21:358–381.
Peshin, R., Dhawan, A.K., Vatta, K. and Singh, K. 2007b. Attributes and socio-economic dynamicsof adopting Bt-cotton. Economic and Political Weekly 42:72–80.
Rajalahti, R., Janssen, W. and Pehu, E. 2008. Agricultural innovation systems: From diagnosticstoward operational practices. Agriculture and Rural Development Discussion Paper 38, WorldBank. http.//www.worldbank.org/rural
Rajotte, E.C., Kazmieczak, Jr and Lambur, M.T. 1986. The National Evaluation of Extension’sIntegrated Pest Management(IPM) Programs. Virgina Tech, Blacksburg, Virginia.
Ridgley, A. M. and Brush, S. B. 1992. Social factors and selective technology innovation: A caseof Integrated Pest Management. Human Organization 51:367–378.
Rogers, E. M. 1962. Diffusion of Innovation 1st (ed.). The Free Press, New York.Rogers, E. M. and Shoemaker, F. 1971. Communication of Innovations- A Cross Cultural Ap-
proach. The Free Press, New York.Rogers, E.M. 1983. Diffusion of Innovation 3rd (ed.). The Free Press, New York.Rogers, E.M. 1993. Diffusion and the re-invention of Project DARE. In Backer, T.E. and Rogers,
M. (eds), Organisational Aspects of Health Communication Campaigns:What Works? Sage,New-bury Park, California, pp. 139–162.
Rogers, E.M. 1995. Diffusion of Innovation 4th ed., Free Press, New York.Rogers, E.M. 2003. Diffusion of Innovation 5th ed., Free Press, New York.Roling, N. 1988. Extension Science: Information Systems in Agricultural Development. Cambridge
University Press, Cambridge.Ryan, B. and Gross, N.C. 1943. The diffusion of hybrid seed corn in two Iowa communities. Rural
Sociology 13: 273–285.Singh, R. 2004. Dynamics of innovation- adoption decision process. Orientation Course on Agri-
cultural and Home Science Extension Methodologies, Department of Extension Education,Punjab agricultural University, Ludhiana June 17–July 8.
Sivapragasam, A. 2001. Brassica IPM Adoption: Progress and Constraints in South-East AsiaStrategic, Environment and Natural Resources Centre Kuala Lumpur, Malaysia. DiamondBacked Moth Workshop 2001. http://www.regional.org.au/index.htm
1 Diffusion of Innovation Theory and Integrated Pest Management 29
Stephenson, G. 2003. The somewhat flawed theoretical foundation of the extension service, Jour-nal of Extension 41. Available at: http://www.joe.org/joe/2003august/ent.shtml
Stoner, K.A., Sawyer, A.J and Shelton, A.M. 1986. Constraints to the implementation of IPMprograms in the USA. Agriculture Ecosystems and Environments 17: 253–268.
Sulaiman, R.V. 2008. Extension from an innovation systems perspective. Conference on Knowl-edge and Innovation in Agriculture organised by IFPRI April 7–9, 2008, Addis Ababa,Ethiopia.
Tarde, G. 1903. The Laws of imitation, trans. By Elsie Clews Parson. University of ChicagoPress, Chicago, USA. Cited by Rogers, E.M. 1983. Diffusion of Innovation 3rd ed., Free Press,New York.
Valente, T.W. and Rogers, E.M. 1995. The origins and development of diffusion of innovationparadigm as an example of scientific growth. Science Communication 16: 238–269.
van de Fliert, E. 1993. Integrated Pest Management: Farmer Field School Generate SustainablePractices. Wageningen Agricultural University Papers 93.3.
van de Fliert, E. 1998. Integrated pest management: Springbord to sustainable agriculture.In Dhaliwal, G.S. and Heinrichs, E.A. (eds), Critical Issues in Insect Pest Management.National Agricultural Technology Information Centre, Ludhiana, pp. 285–304.
Vandeman, A., Fernanedez-Cornejo, J., Jans, S. and Lin, B.H. 1994. Adoption of Integrated PestManagement in U.S. Agriculture. Agriculture Information Bulletin No. 707, Economic Re-search Service, Washington, DC.
Walker, G., Cameron, P. and Berry, N. 2003. Implementation of an IPM programme for vegetablebrassicas in New Zealand. In: Endersby, N.M. and Ridland, P.M. (eds), The Management of Di-amondback Moth and other Crucifer Pests, Proceedings of the Fourth International Workshop,26–29 November 2001, Melbourne, Victoria.
Wearing, C. H. 1988. Evaluating the IPM implementation process. Annual Review of Entomology33:17–38.
Wilkening E. A. 1953. Adoption of improved farm practices as related to family factors. WisconsinExperiment Station Research Bulletin 183, Wisconsin.
Wong, P. K. 1999. National innovation systems for rapid technological catch-up: An analyticalframework and a comparative analysis of Korea, Taiwan, and Singapore. Paper presented atthe DRUID Summer Conference, Rebild, Denmark, June 9–12, 1999.
World Bank. 2007. Enhancing Agricultural Innovation: How to go Beyond the Strengthening ofResearch Systems. Economic Sector Work report. The World Bank, Washington, DC, pp. 149.
Zadoks, J.C. 1989. Does IPM, give adequate attention to disease control, in particular at farmerlevel? FAO Plant Protection Bulletin 372:145–149.
Zalom, F.G., Weakley, C.V., Hoffmann, M.P., Wilson, L.T., Grieshop, J.I. and Miyao, G. 1990.Monitoring tomato fruitworm eggs in processing tomato. California Agriculture 44:12–15.
Zimmer, B. 1990. Ushering in IPM. California Farmer, April 21, 1990.

Chapter 2Evaluation Research: Methodologiesfor Evaluation of IPM Programs
Rajinder Peshin, K. S. U. Jayaratne and Gurdeep Singh
Abstract Evaluation is a systematic approach by which the program process andresults are compared with set goals and objectives to make value judgments aboutthe program. In this regard, the evaluation of integrated pest management programs(IPM) is vital for making proper programmatic decisions. Formative and summativeevaluations are the two major types of evaluation. Formative evaluation is used toassess the program process for its improvement. Summative evaluation is used to as-sess the program results for accountability. Institutions around the world are givinggreater attention to the evaluation of extension programs. However, the evaluationof IPM programs is generally not up to the level it should be in terms of qualityand rigger of evaluation research. The purpose of this chapter is to provide basicknowledge to the personnel involved in the evaluation about concept and purpose ofevaluation, and appropriate research methods for conducting IPM evaluation stud-ies. The theory based evaluation is helpful in designing the meaningful and rigorousstudies. There are evaluation standards to guide the evaluators in this process. Beforeconducting IPM evaluation studies, it is important to review the practical consider-ations to ensure the quality and the usefulness of the study. Currently the evaluationof IPM programs lack consensus in selection of the indicators, research designs andadoption of appropriate methodologies. The social, economic and environmentalindicators are taken into account while carrying out the IPM evaluation. The qualityof an IPM evaluation can be improved by proper planning and selection of appro-priate research design. Planning is helpful for achieving the evaluation objectivescost effectively. When the IPM evaluation studies are planned, it is important toconsider the social, economic and environmental context of the farming communityfor achieving the practicality and the usefulness of the evaluation study. The IPMprogram evaluation is meaningful only if the results are communicated and utilizedto achieve the evaluation objectives.
R. Peshin (B)Division of Agricultural Extension Education, Sher-e-Kashmir University of AgriculturalSciences and Technology of Jammu, Chatha, Jammu-180009, Indiae-mail: [email protected]
R. Peshin, A.K. Dhawan (eds.), Integrated Pest Management: Disseminationand Impact, DOI 10.1007/978-1-4020-8990-9 2,C© Springer Science+Business Media B.V. 2009
31

32 R. Peshin et al.
Keywords Evaluation research · formative and summative evaluation · evaluationmodels · evaluation of IPM programs · evaluation indicators of IPM programs
2.1 Introduction
There is no uniformly accepted definition of what constitutes evaluation research(Kosloski, 2000). The concept of evaluation research has been an issue of debateamong academicians. The academicians consider that evaluation research differsfrom both basic research as well as applied research. Some consider evaluationas research and applied science. Evaluation research is a form of applied socialscience which intends to assist in improving the quality of human services (Posavacand Carey, 1989). According to Douglah (1996) “Research and evaluation bothare mode of inquiry.” Alkin and Christie (2004) have discussed theories of eval-uation in their paper “An evaluation theory tree.” They explained that evaluationhas grown on three pillars of orientation i.e. research orientation, decision makingorientation and assessing worth. (i) Tyler (1942), Campbell and Stanley (1966) andmany other prominent scientists emphasized well designed experimental and quasi-experimental designs for doing evaluation. They had more methodological orienta-tion. (ii) Theorists having decision making orientation emphasized that evaluation isdone to improve the program thus the major role of evaluation is to give feedback toprogram stakeholders to make better decisions. But it is not its only function. Pro-gram evaluation provides useful, objective, and timely information about the extentto which desired program results are being achieved. Stufflebeam’s (2003) CIPP(Context, Input, Process and Product evaluation) model is one of the famous modelsfor its decision making orientation. The model has been employed in many countriesin short-term and long-term investigations. (iii) According to the third orientation,assessing worth or value is the main role of evaluation and the role of an evaluator isto give value to evaluation findings. Shadish et al. (1991) deems Scriven as “the firstand only major evaluation theorist to have an explicit and general theory of valuing”.After, that many other theorists emphasized value orientation of evaluation.
The field of evaluation research can be defined as “the use of scientific meth-ods to measure the implementation and outcome of programs for decision-makingpurposes” (Rutman, 1984). A broader and more widely accepted definition is “thesystematic application of social research procedures for assessing the conceptualiza-tion, design, implementation, and utilization of social intervention programs” (Rossiand Freeman, 1993). A much broader definition was offered by Scriven (1991) whodefined evaluation as “the process of determining the merit, worth and value ofthings”. It does not limit to a social program or specific type of intervention butencompasses everything. The object can be a program, a project, a product, a policy,or a one-off event. According to Scriven (1999) the discipline of evaluation has somemore than 20 recognized fields including program evaluation, personnel evaluation,performance evaluation, product evaluation, training evaluation etc. Evaluation assuch should start with a close examination of the purpose of the evaluation, and clearunderstanding of the Program and target clientele. It is not until the purpose and
2 Evaluation Research 33
main evaluation questions have been agreed upon that the selection of appropriatemethods should be considered (Petheram, 1998).
Integrated pest management (IPM) programs have been, and are being imple-mented throughout the world since the last four decades and the primary purpose ofthese programs is to reduce the use of pesticide by adopting alternate pest manage-ment practices. The purpose of IPM program evaluation is to seek the informationneeded for program improvement and weighing the results and consequences. Inthis chapter, the theory of evaluation research and its application to IPM programevaluation is discussed.
2.2 Historical View of Evaluation
Around 1960, the government of the United States of America (USA), invested largesums of money in programs in education, income maintenance, housing and health,and it increased the demand for evaluation (Bell, 1983). The US federal governmenttook an interventionist role on social policy during the 1960s which resulted in theincreasing interest in evaluation research as an academic pursuit (Shadish et al.,1995). Evaluation became particularly relevant in the United States of Americaduring the period of the Great Society social programs associated with the RobertKennedy and Johnson administrations. In 1965, Elementary and Secondary Educa-tion Act (ESEA) was passed and this prompted the US Senator Robert Kennedyto insist that each federal grant recipient conduct an evaluation for federally spon-sored programs. It was with this particular act “program evaluation had been bornovernight” (Worthen et al., 1997). By the late 1960s in the USA and internation-ally, evaluation research had become a growth industry (Wall Street Journal, citedby Rossi et al., 1979). It further expanded during the 1970s (Shadish et al., 1991;Petheram, 1998).The theory and practices of program evaluation emerged duringthis time. Theory of program evaluation had its roots in earlier work done by RalphTyler in the period between 1930 and 1945 in education (Tyler, 1967), Lewin (1948)in social psychology and Lazarsfeld and Rosenburg (1955) in sociology.
The systemization, standardizations and efficiency in the field of program eval-uation in education were observed during the early part of the twentieth century(Petheram, 1998). The term “educational evaluation” was coined by Tyler. Tyler hadenormous effects upon the field of evaluation and his approach called for the measure-ment of behaviorally defined objectives; it concentrates on learning outcome insteadof organizational and teaching input (Madaus et al., 1991). As evaluation strategiesand methods matured, evaluation theory developed towards one focusing on method-ology, but in a broad context (Shadish et al., 1991). Around 1973, program evaluationbegan to emerge as a semi-professional discipline (Petheram, 1998). Around late1970s and early 1980s, evaluators realized that the techniques of evaluation must:
i. serve the need of the clients,ii. address the central value issues,

34 R. Peshin et al.
iii. deal with situational realities, andiv. meet the requirements of probity, and satisfy the needs for veracity (Madaus
et al., 1991).Most of the program evaluation has been in the field of education followed byhealth- related programs. During 1960s “Great Society Program in the US,” largesums of money were invested towards programs in education, income maintenance,housing and health. The massive spending on these programs increased the demandfor evaluation. During the presidency of Ronald Reagan in the USA, program evalu-ation was given impetus in the 1980s, due to failure of the “Great Society Programs.”One hundred third Congress of the United States of America in 1993 passed an Act“Government Performance and Results Act of 19931.” The act provides for the es-tablishment of strategic planning and performance measurement in the federal gov-ernment, and for other purposes to avoid waste and inefficiency in federal programsto avoid undermining the confidence of the American people in the government andreduce the federal government’s ability to address adequately vital public needs.With this program evaluation gained momentum. Although evaluation developed inthe USA, later it began to gain ground in Australia and Europe in 1960s. In India,program evaluation has not caught the attention of policy makers.
2.3 Theoretical/Conceptual Foundation of Evaluation
Evaluation theory comprises the many possible decisions about the shape, conductand effect of evaluation, and is therefore, far from focusing on methods only (vande Fliert, 1993). The discussion on methodology includes the philosophy of sci-ence, public policy, validity, and utilization and the emphasis must be on makingthe methodology fit the needs of the society, its institution and its citizens, ratherthan the reverse (Kalpan, 1994). It is possible to conduct evaluation without payingany attention to theory and forms of evaluation, but such evaluative studies lackinternal validity because these are not based on the rigorous evaluation researchmethodologies. The main emphasis should be on the purpose of evaluation whichhelps in identifying the key evaluation questions on the basis of which appropriateform of evaluation, appropriate model of evaluation and design of research can beselected.
Huey Chen has played the most important role in developing the concept andpractice of theory-driven evaluation (Alkin and Christie, 2004). Theory-driven eval-uation is gaining importance and is considered as the future approach to programevaluation. Theory-driven evaluation has been a movement of critical importance inthe last two decades, in that sense it is a broader perspective of evaluation that hasbeen conceptualized in the past (Chen, 1994). It is a process for evaluating programsin which a program theory, or logic model of program functioning is developed.
1 http://www.whitehouse.gov/omb/mgmt-gpra/gplaw2m.html

2 Evaluation Research 35
Then program theory is tested to discern its working and its intended and acciden-tal impacts. Science demands that results should be reliable as well as valid bothinternally as well as externally. Experiments and quasi-experiments are dominantresearch designs and widely used. But if these designs are blended with programtheory, these will yield efficient, effective results with information about how theseresults were obtained (Chen and Rossi, 1983). This approach to evaluation focuseson knowledge of social sciences and classical research designs.
A common element of all theory-driven evaluation applications is the devel-opment of a program theory, or “plausible and sensible model” of the program(Bickman, 1987) is constructed to achieve the desired outcomes. Program theorydescribes how the goals of the program are likely to be achieved by the programstakeholders. Program theory is the diagrammatic representation of actions, resultsand intervening factors, i.e. the relationship between cause and effect. Program the-ory, similar to a logic model, is a graphical representation of program functioningas conceptualized by the program stakeholders (Rogers et al., 2000). Chen (1990)defined program theory as “a specification of what must be done to achieve thedesired goals, what other impacts may also be anticipated and how these goals andimpacts would be generated.” Donaldson (2001) names four sources of programtheory: prior theory and research, implicit theories of those close to the program,observations of the program, and exploratory research to test critical assumptions.
Theory-driven evaluation is an approach in which the evaluator “makes explicitthe underlying assumptions about how program are expected to work- the programtheory- and then using this theory to guide the evaluation” (Rogers et al., 2000).They note that “program theory is known by many different names”. Program phi-losophy, outcome hierarchies, theory of action, program logic, theory driven eval-uation, and theory based evaluation, are other terminologies used synonymously.There are some skeptics of this theory but as Davidson (2006) (http://evaluation.wmich.edu/jmde/) says, “Program theory and its use in evaluation seems to be anargument that just would not go away depending on which part of the world oneis in. But some of the best innovations are coming from those who understandprogram theory’s potential and limitations.” Russ-Eft and Preskill (2001) refer tofour evaluation models that have characteristics of theory-driven evaluation: logicmodels, the Input-Process-Output model, Holton’s HRD Evaluation Research andMeasurement Model, and Brinkerhoff’s Six Stage Model. There are certain short-comings of this approach. Identifying assumptions and theories can be complexfurther measurement will be a problem (Weiss, 1998). In this section of the chapterwe discuss the purpose of evaluation, evaluation standards, different forms of pro-gram evaluation and the models of evaluation to provide a theoretical backgroundof program evaluation.
2.3.1 Purpose of Evaluation
Evaluation is the systematic assessment of the benefits of the programs in termsof the systematic acquisition of information based on empirical data to provide

36 R. Peshin et al.
feedback about the program. The evaluation results can be used to influence de-cision making and policy formulation. The evaluation results influence decisionmaking or policy formulation on the basis of empirically driven feedback. Needfor accountability and control call for evaluation of programs. Primarily evalua-tion is done in response to social inquiry (Alkin and Christie, 2004). Evaluationis done to improve a program, to see its effect or impact on people, to check theperformance of personnel or organization and to do cost benefit analysis. Accordingto Powell et al. (1996) the fundamental purpose of evaluation is to create greaterunderstanding. Purpose of the evaluation may be improvement of the program orknowing immediate effect or impact of the program. Chelimsky (1997) identifiedthree purposes of evaluation research as evaluation for accountability, evaluationfor development and evaluation for knowledge. Evaluation for accountability isfor the funding agencies to incorporate accountability. Agricultural developmentprograms that include IPM programs have a specific description of what is to bedone, how it is to be done and what the intended outcome is. The accountabilityevaluation is to identify cause and effect, and research methodology should em-ploy quasi-experimental research design. The accountability evaluation is summa-tive in nature (Kosloski, 2000) and is referred to as summative evaluation (Scriven,1991). A second purpose of evaluation is for development, which is conducted toimprove the programs. It addresses questions: what are the appropriate indicatorsof programs success and what are the appropriate goals (Kosloski, 2000)? Eval-uation for development or improvement of programs is process evaluation whichis formative in nature and reports back to programs for its improvement. In thecase of IPM programs, it is concerned with implementation of programs rather thanits outcome. It asks questions like: is the IPM program implemented as designedand if so, what is the shortcoming of the designed implementation. The commonresearch paradigm is action research, and the research design is quasi-experimentalor case studies. The data collected are both qualitative and quantitative in nature.The relationship between treatment (IPM intervention) and outcome (behavioralchange and adoption of IPM practices to reduce pesticide use, and income of farm-ers etc.) are empirically verified. In this case formative evaluation is followed bysummative evaluation. A third purpose of evaluation is for adding to an alreadyexisting body of knowledge and for theory building. Evaluation for knowledge isfor academic pursuit of researchers, program designers and for evaluators (Kosloski,2000). It is diagnostic in nature to determine the etiology of causes and the ques-tions are researchable cause and effect. In case of IPM programs, it can lead tofinding the answers of questions – why does not IPM technology diffuse in socialsystem like input intensive technologies or why does not the rate of adoption ofIPM practices follow the “S” shaped curve? It is important to decide in advancethe intention of evaluation. (Powell et al., 1996) It is important to define the pur-pose of evaluation at early stage, otherwise it will lack direction and resultinginformation will not be useful. In the case of IPM programs evaluation resultsbased on scientific quasi-experimental models, the most dominant evaluation strat-egy, is based on objectivity and internal and external validity of the informationgenerated.

2 Evaluation Research 37
2.3.2 Program Evaluation Standards
Joint committee for standards for educational evaluation has laid down certain stan-dards for program evaluation. These include utility standards, feasibility standards,propriety standards and accuracy standards (Joint committee for standards for ed-ucational evaluation, 1994). Utility standards call for identification of stakehold-ers, credibility and value identification. It demands report clarity and timelinessso that intended users could get required information. Feasibility standards are toensure uninterrupted evaluation process and that it should be practical or realistic,politically viable and cost effective. Propriety standards are to protect the rightsof human welfare. They are intended to ensure that evaluation is responsible bothethically as well as legally. Accuracy standards are to ensure technical reliabilityand validity of the evaluation, and for that both qualitative and quantitative analysisneed to be done. Accuracy standards also emphasize meta-evaluation. Appreciationfor evaluation research, in terms of understanding of why a specific process needsto be followed is also important. It involves awareness of the ethical issues relatedto gathering information from program participants, knowledge of the basics of pro-gram evaluation, and understanding of incorporating evaluation as part of programplanning (Bailey and Deen, 2002).
2.3.3 Types of Program Evaluation
The overall purpose of program evaluation is to provide feedback to stakeholdersbut specific sub-purposes always need to be defined for specific evaluation studies(van de Fliert, 1993). Commonly two main types of evaluations are distinguished,called formative and summative evaluation (Scriven, 1967; Neuman, 2000). Thisclassification of evaluation studies is based on the purpose of evaluation.
2.3.3.1 Formative and Summative Evaluation
Formative and summative evaluation were first described by Scriven (1967), andthese terms are broadly accepted. “Formative evaluation attempts to identify andremedy shortcomings during the development state of a program. Summative eval-uation assesses the worth of the final version when it is offered as an alternativeto other program” (Taylor, 1976). Formative evaluation is not only concerned withthe definition given by Taylor (1976), it is conducted when the program is beingimplemented to provide program staff feedback on program weaknesses, which areuseful in improving the program. Patton (1997) outlined their sequential nature:first, formative data are collected and used to prepare for the summative evalua-tion; then, a summative evaluation is conducted to provide data for external ac-countability. These terms have become almost universally accepted in the field ofevaluation. “Formative evaluation” is conducted to provide program staff judgmentuseful in improving the program. “Summative evaluation” is generally conductedafter completion of the program (or when the program has stabilized and for the

38 R. Peshin et al.
benefit of an external audience or decision-maker). Formative evaluation is a typeof process evaluation during the program implementation phase to assess whetherthe inputs (in terms of resources for IPM program) result in desired outputs (interms of program objectives of IPM program) by employing certain processes (interms of program implementation, activities, and interventions for dissemination ofIPM practices). The information provided by formative evaluation during programimplementation can be used to modify or reorient the subsequent stages of a pro-gram that is why formative evaluation is referred to “action research” where theresults of formative evaluation of IPM program can be incorporated in the programfor improvement. While summative evaluation provides the information whetherthe program should be continued, expanded or terminated, formative evaluationprovides the feedback (report) to the program and summative evaluation reportsabout the program in terms of the achievement of the program objectives. Up to1970s the emphasis was on summative evaluation, which is generally conductedafter the completion of the program, but for the last two decades such emphasisis on formative evaluation. It involves the collection of relevant data while theprogram is being implemented to generate information for feedback. This feed-back is utilized to identify the intended and unintended outcomes, and is helpfulin improving the program to meet the needs of the situation. Summative evalu-ation, on the other hand, assesses the overall effectiveness of the program (sumtotal) in achieving the objectives of the program. Patton (1997) and others empha-size that evaluation should be an integral part of the program development processand, therefore, place equal or greater weight on the first phase, formative evalua-tion. According to Patton (1997), a formative evaluation should provide feedbackon the original program and improve program implementation, while a summa-tive evaluation should determine if the desired outcomes are achieved and canbe attributed to the revised program. Chambers (1994) argues that it is not thetiming, but the use of evaluation data that distinguishes formative from summa-tive evaluation. He emphasizes that formative evaluation provides data with whichto modify the initial intervention and its delivery so that the final intervention ismore effective as revealed by the summative evaluation. Scheirer (1994) recom-mends using formative evaluation in a pilot situation to collect information on thefeasibility of activities and their acceptance by recipients, suggesting qualitativemethods such as interviews, focus groups, and observations to gather these data.In sum, these researchers suggest that formative evaluation should examine the ef-fect of the program, the process of delivery, and the reactions of participants in theprogram.
2.3.4 Models of Program Evaluation
People use models to better explain the program theory in evaluation. Program the-ory means the underlying concept that explains how the program resources trans-form into training activities and program results. For example, in IPM programming,resources are used to develop educational materials and extension activities. As a

2 Evaluation Research 39
result of these activities, farmers will gain new knowledge and follow IPM practices.As a result of practicing IPM, farmers will save money on pesticides and improvethe quality of environment. There are different models used in evaluation. The mostappropriate models for planning IPM evaluation studies are the logic model andBennett’s model. These two models are extensively used in planning extension eval-uations studies.
2.3.4.1 The Logic Model
There are several pieces of a logic model. Program resources such as funds arecalled inputs. Training materials and activities are called program outputs. Programresults are called outcomes. Depending on the time taken to manifest, outcomes canbe categorized into immediate outcomes, intermediate outcomes and end results.The end results are called impacts.
The logic model rationally links proceeding with the antecedent explained in theprogram theory. The logic model relates proceeding rationally with the antecedentby using “if” and “then” linking words. The normal sequence of the logic modelis inputs, outputs, outcomes and impacts. It also explains the programming contextand explains the need for IPM programming and program priorities.
The logic model is very helpful to explain the IPM programming process. Itelaborates how inputs transforms into potential results and shows the exact data col-lecting points and impact indicators. Therefore, the logic model is used for planningevaluations. Figure 2.1 demonstrates the logic model for IPM programming.
2.3.4.2 Bennett’s Model
Claude Bennett (1975) developed this evaluation model for extension program eval-uation. This model (Fig. 2.2) is known as Bennett’s hierarchy of evidence in programevaluation.
Bennett’s model displays the chain of events taking place from inputs to the endresults. It starts with mobilizing inputs for the IPM programming. With inputs suchas resources, extension can develop IPM educational programs and activities. WhenIPM extension activities are presented, farmers will participate. Their participationwill lead to the next level of evidence-participants’ reactions to the IPM program. Ifthe program is effective, then participants will be able to change their knowledge,attitudes, skills and aspirations (KASA) toward IPM. That is the 4th level of evi-dence. If the program participants were able to change their KASA, then they willbe able to change their pest management practices. Adoption of IPM practices willlead to the end results. This includes social, economic, and environmental impact ofthe IPM program.
Like the logic model, Bennett’s model is helpful in understanding the chain ofevents in extension programming. It tells what types of data to collect at differentlevels of the hierarchy. Therefore, this model is useful in planning evaluations.

40 R. Peshin et al.
Inpu
tsO
utpu
tsO
utco
mes
Imm
edia
te
Int
erm
edia
te
E
nd R
esul
ts (
Impa
cts)
Nee
ds f
or I
PM
Pro
gram
min
g
•Pe
st c
ontr
ol is
an
impo
rtan
t pa
rt o
f ag
ricu
lture
.•
Incr
ease
d an
d co
ntin
ued
depe
nden
cy o
n pe
stic
ides
for
pe
st c
ontr
ol h
as
beco
me
an
impo
rtan
t iss
ue
in a
chie
ving
ec
onom
ic,
soci
al a
nd
envi
ronm
enta
l su
stai
nabi
lity
of
agri
cultu
re.
•H
eavy
use
s of
pe
stic
ides
hav
e co
ntri
bute
d to
m
any
soci
al,
econ
omic
and
en
viro
nmen
tal
prob
lem
s.
•E
duca
te f
arm
ers
to a
pply
in
tegr
ated
ap
proa
ch to
pes
t m
anag
emen
t.•
Min
imiz
e de
pend
ency
on
chem
ical
s fo
r pe
st c
ontr
ol.
•A
chie
ve
envi
ronm
enta
l su
stai
nabi
lity
and
econ
omic
pr
ospe
rity
.
Pri
orit
ies
•Fu
nds
•H
uman
re
sour
ces
•IP
M r
elat
ed
rese
arch
in
form
atio
n an
d te
chno
logy
Tar
get
Aud
ienc
e
•N
umbe
r of
fa
rmer
s an
d ot
her
grou
ps
plan
ned
to r
each
th
roug
h th
e IP
M
prog
ram
.
•E
duca
tiona
l m
ater
ials
, pr
ogra
ms,
tr
aini
ng
wor
ksho
ps
etc.
de
velo
ped
unde
r th
e IP
M
prog
ram
•Fa
rmer
s w
ill c
hang
e th
eir
know
ledg
e,
attit
udes
an
d sk
ills
rela
ted
to
IPM
and
w
ill a
spir
e to
pra
ctic
e IP
M.
•Pa
rtic
ipan
ts
will
app
ly a
n in
tegr
ated
ap
proa
ch to
pe
st
man
agem
ent.
•Pa
rtic
ipan
ts
will
clo
sely
m
onito
r th
eir
fiel
ds f
or
pest
s.•
Part
icip
ants
w
ill u
se
biol
ogic
al,
mec
hani
cal,
& a
gron
omic
m
etho
ds to
co
ntro
l pes
ts.
•Pa
rtic
ipan
ts
will
use
ch
emic
als
as
the
last
opt
ion
to c
ontr
ol
pest
s.
•Pa
rtic
ipan
ts w
ill
be a
ble
to r
educ
e th
e us
e of
pe
stic
ides
.•
Part
icip
ants
will
be
abl
e to
red
uce
the
cost
of
prod
uctio
n an
d sa
ve m
oney
on
pest
icid
es.
•E
nvir
onm
enta
lqu
ality
will
be
impr
oved
.•
Nat
ural
bal
ance
of
the
ecos
yste
m w
ill
be e
stab
lishe
d.•
Rec
orde
d pe
stic
ide
rela
ted
haza
rds
in th
e co
mm
unity
wil
l be
dec
reas
ed.
IfT
hen
IfT
hen
IfT
hen
IfT
hen
IfT
hen
Fig
.2.1
Log
icm
odel
for
IPM
prog
ram
min
g

2 Evaluation Research 41
1. Inputs
2. Programs & activities
3. Program delivery & client participation
4. Clients’ Reactions/Satisfactions
5. Changes in Knowledge, Attitudes, Skills & Aspirations
6. Changes in Practices
7. End results (Improved Social, Economic and Environmental Condition)
Chain of Events Begins
Chain of Events Ends
Fig. 2.2 Bennett’s hierarchy – chain of events in extension programming
2.4 Current Situation of IPM Program Evaluation
Impact evaluation of developmental programs is expensive in terms of moneyand efforts. Perhaps because of this reason, evaluations are rarely conducted inprofessional manner in the developing countries. In the case of the green revolutiontechnologies, viz. fertilizer use and pesticide use resulted in desired and undesiredconsequences going side by side but the studies measuring the undesired conse-quences received no attention especially in the developing countries. However, therehave been studies to measure the undesirable consequences in the United Kingdom(Pretty et al., 2000) and the US (Pimentel, 2005, see Chapter 3 Vol. 1). IPM is theenvironmentally-favored plant protection strategy since the 1970s in both the devel-oped and the developing world. The primary purpose of IPM programs is to adoptthe different available pest management tactics namely cultural, physical, biologi-cal and chemical in a compatible manner to keep the pest population below thosecausing economic losses, there by reducing pesticide use. The evaluation of IPMprograms has mainly focused on reduction of pesticide use, pesticide expenditure,increased yields and higher profits. IPM tries to achieve multiple goals, in that sensethe impact of IPM programs cannot be measured only in terms of increase in incomeof the farmers or reduction in use of pesticides, but the impact of IPM is beyond thatand perhaps more complex. There is no straightforward methodology to measurethe impact of IPM programs. Research scientists support IPM and large numbers oforganizations are funding IPM programs but evaluation of such programs is lack-ing. There is also little consensus on monitoring and assessment standards for itseconomic, social and environmental impacts, including the assessment of farmerIPM training. Up to now, there are no agreed universal standards or indicatorsto quantify IPM impacts (van den Berg, 2004; van den Berg and Jiggins, 2007).The indicators used in different studies for evaluating IPM programs are given inTable 2.1. Farmer field school (FFS) model of extension is widely used in devel-oping countries for providing season long IPM training to farmers (For detaileddiscussion on FFS, see Chapters 6 to 10) The indicators used for evaluating IPM
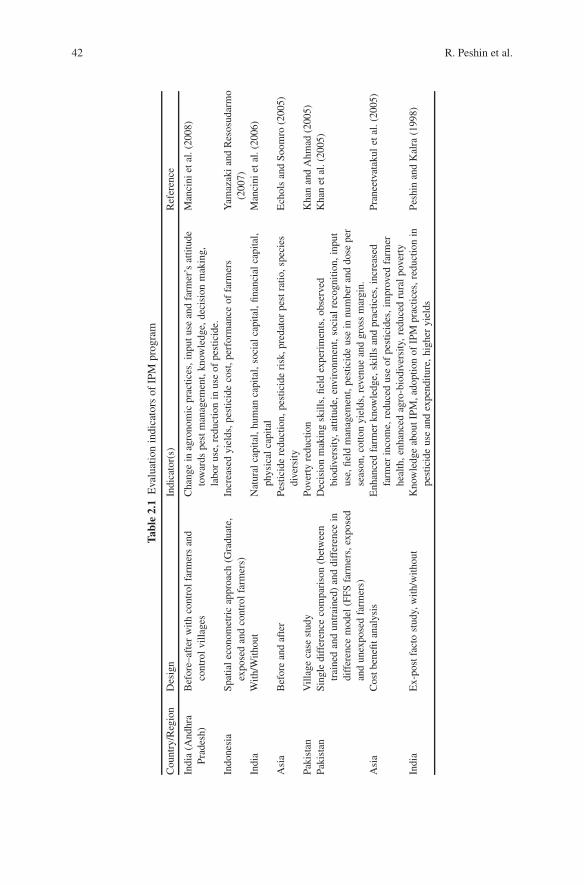
42 R. Peshin et al.
Tab
le2.
1E
valu
atio
nin
dica
tors
ofIP
Mpr
ogra
m
Cou
ntry
/Reg
ion
Des
ign
Indi
cato
r(s)
Ref
eren
ce
Indi
a(A
ndhr
aPr
ades
h)B
efor
e–af
ter
with
cont
rolf
arm
ers
and
cont
rolv
illag
esC
hang
ein
agro
nom
icpr
actic
es,i
nput
use
and
farm
er’s
attit
ude
tow
ards
pest
man
agem
ent,
know
ledg
e,de
cisi
onm
akin
g,la
bor
use,
redu
ctio
nin
use
ofpe
stic
ide.
Man
cini
etal
.(20
08)
Indo
nesi
aSp
atia
leco
nom
etri
cap
proa
ch(G
radu
ate,
expo
sed
and
cont
rolf
arm
ers)
Incr
ease
dyi
elds
,pes
ticid
eco
st,p
erfo
rman
ceof
farm
ers
Yam
azak
ian
dR
esos
udar
mo
(200
7)In
dia
With
/With
out
Nat
ural
capi
tal,
hum
anca
pita
l,so
cial
capi
tal,
finan
cial
capi
tal,
phys
ical
capi
tal
Man
cini
etal
.(20
06)
Asi
aB
efor
ean
daf
ter
Pest
icid
ere
duct
ion,
pest
icid
eri
sk,p
reda
tor
pest
ratio
,spe
cies
dive
rsity
Ech
ols
and
Soom
ro(2
005)
Paki
stan
Vill
age
case
stud
yPo
vert
yre
duct
ion
Kha
nan
dA
hmad
(200
5)Pa
kist
anSi
ngle
diff
eren
ceco
mpa
riso
n(b
etw
een
trai
ned
and
untr
aine
d)an
ddi
ffer
ence
indi
ffer
ence
mod
el(F
FSfa
rmer
s,ex
pose
dan
dun
expo
sed
farm
ers)
Dec
isio
nm
akin
gsk
ills,
field
expe
rim
ents
,obs
erve
dbi
odiv
ersi
ty,a
ttitu
de,e
nvir
onm
ent,
soci
alre
cogn
ition
,inp
utus
e,fie
ldm
anag
emen
t,pe
stic
ide
use
innu
mbe
ran
ddo
sepe
rse
ason
,cot
ton
yiel
ds,r
even
uean
dgr
oss
mar
gin.
Kha
net
al.(
2005
)
Asi
aC
ostb
enefi
tana
lysi
sE
nhan
ced
farm
erkn
owle
dge,
skill
san
dpr
actic
es,i
ncre
ased
farm
erin
com
e,re
duce
dus
eof
pest
icid
es,i
mpr
oved
farm
erhe
alth
,enh
ance
dag
ro-b
iodi
vers
ity,
redu
ced
rura
lpov
erty
Pran
eetv
atak
ulet
al.(
2005
)
Indi
aE
x-po
stfa
cto
stud
y,w
ith/w
ithou
tK
now
ledg
eab
outI
PM,a
dopt
ion
ofIP
Mpr
actic
es,r
educ
tion
inpe
stic
ide
use
and
expe
nditu
re,h
ighe
ryi
elds
Pesh
inan
dK
alra
(199
8)

2 Evaluation Research 43
Tab
le2.
1(c
onti
nued
)
Cou
ntry
/Reg
ion
Des
ign
Indi
cato
r(s)
Ref
eren
ce
Indi
aQ
uasi
-exp
erim
enta
l;be
fore
/aft
er,
with
/with
out
Kno
wle
dge
gain
and
anal
ytic
alsk
ills,
adop
tion,
adop
tabi
lity,
redu
ctio
nin
pest
icid
eus
e,pe
stic
ide
expe
nditu
rean
dnu
mbe
rof
spra
ys,i
ncre
ase
inou
tput
/inpu
tra
tio
Pesh
in(2
005)
Indi
aB
efor
ean
daf
ter,
with
and
with
outd
oubl
eda
tade
sign
Kno
wle
dge
ofco
tton
dise
ases
,pes
ts,n
atur
alen
emie
s,ec
osys
tem
,pes
tman
agem
ent,
othe
rm
anag
emen
tpra
ctic
esan
dkn
owle
dge
ofot
her
crop
sm
anag
emen
tpra
ctic
es,c
hang
ein
skill
,con
fiden
cele
veli
nm
anag
emen
tof
pest
Red
dyan
dSu
ryam
ani(
2005
)
Chi
naE
cono
met
ric
(Dif
fere
nce
indi
ffer
ence
mod
el)
Yie
ld,p
estic
ide
cost
and
gros
sm
argi
nW
uet
al.(
2005
)
Indo
nesi
aD
iffe
renc
ein
diff
eren
cem
odel
(tw
ope
riod
data
)Y
ield
and
pest
icid
eus
e,kn
owle
dge
diff
usio
n.Fe
der
etal
.(20
04)
Dif
fere
ntco
untr
ies
viz:
Indo
nesi
a,B
angl
ades
het
c.
Cas
est
udie
sof
25co
untr
ies
(Dif
fere
ntde
sign
s)Sk
illim
prov
emen
t,pe
stic
ide
use
(vol
ume,
spra
yfr
eque
ncy,
chem
ical
com
poun
ds),
yiel
d,in
putc
osts
and
profi
t,va
riat
ion
inyi
eld
orpr
ofit,
qual
ityof
prod
uce,
mar
keta
bilit
y,gr
ound
wat
erco
ntam
inat
ion,
pest
icid
e-re
late
dhe
alth
sym
ptom
s,ag
ricu
ltura
lbi
odiv
ersi
ty,a
gric
ultu
ral
sust
aina
bilit
y,po
licy
chan
ge,g
ende
rro
les,
farm
er-t
o-fa
rmer
diff
usio
n,ed
ucat
ion
and
empo
wer
men
tind
icat
ors
van
den
Ber
g(2
004)
Indo
nesi
aSu
stai
nabl
eliv
elih
ood
anal
ysis
and
part
icip
ator
yre
sear
chpr
oces
sO
rgan
izat
iona
lin
dica
tors
:pa
rtic
ipat
ion,
cohe
sive
ness
,com
mon
goal
,tim
em
anag
emen
t,pl
anto
follo
w,g
ende
rse
nsiti
ve,
lead
ersh
ip,t
echn
ical
know
ledg
e,tr
ansp
aren
cy,d
iver
sifie
dac
tiviti
es,F
FSfu
nds,
netw
ork,
linka
ges
Jigg
ins
(200
2)
Asi
aC
ostb
enefi
tana
lysi
sat
farm
leve
land
atpr
ogra
mle
vel
Farm
ers’
awar
enes
s,kn
owle
dge,
effic
ient
farm
inpu
tuse
,in
crea
sein
yiel
d,lo
wer
pest
icid
eus
ean
dne
tpro
fitof
farm
ers
Fede
ran
dQ
uizo
n(1
998)

44 R. Peshin et al.
Tab
le2.
1(c
onti
nued
)
Cou
ntry
/Reg
ion
Des
ign
Indi
cato
r(s)
Ref
eren
ce
Indo
nesi
aC
ase
stud
y,w
ith/w
ithou
tan
dbe
fore
/aft
erR
eact
ion
ofFF
Spa
rtic
ipan
ts,k
now
ledg
ega
in,r
educ
tion
inpe
stic
ide
use,
incr
ease
dyi
eld
van
deFl
iert
(199
3)
USA
Cos
t-be
nefit
anal
ysis
with
and
with
outI
PMsp
littin
gth
efie
ldfo
rtr
eatm
enta
ndco
ntro
l.
Red
uced
num
ber
ofpe
stic
ide
appl
icat
ions
per
grow
ing
seas
on,
valu
eof
pest
icid
eco
stsa
ving
spe
rhe
ctar
e,yi
eld
and
qual
ityof
prod
uce.
Siko
raet
al.(
2001
)
Peru
Cas
est
udy,
with
/with
out
Enh
ance
dfa
rmer
know
ledg
e,ad
optio
nra
te,i
nfor
mat
ion
sour
ces,
perc
eive
dch
ange
sin
pest
dam
age,
adva
ntag
esan
ddi
sadv
anta
ges
ofpe
stco
ntro
lpra
ctic
es.
Ort
iz(1
997)
Peru
Cas
est
udy,
with
/with
out
Enh
ance
dfa
rmer
know
ledg
e,pe
stda
mag
e,yi
eld,
gros
sm
argi
n,in
tern
alra
teof
retu
rn,n
etpr
esen
tval
ueO
rtiz
etal
.(19
96)
Peru
Eco
nom
etri
c,w
ith/w
ithou
tE
nhan
ced
farm
erkn
owle
dge,
prod
uctiv
ity,i
nput
-out
put
ratio
sG
odtla
ndet
al.2
004
Dom
inic
anR
epub
licC
ase
stud
y,w
ith/w
ithou
tE
nhan
ced
farm
erkn
owle
dge,
pest
dam
age,
yiel
d,gr
oss
mar
gin,
inte
rnal
rate
ofre
turn
,net
pres
entv
alue
Alv
arez
etal
.(19
96)
Cub
aC
ase
stud
y,w
ith/w
ithou
tE
nhan
ced
farm
erkn
owle
dge,
pest
dam
age,
yiel
d,gr
oss
mar
gin,
inte
rnal
rate
ofre
turn
,net
pres
entv
alue
Maz
aet
al.(
2000
)
Peru
Part
icip
ator
yas
sess
men
t,w
ith/w
ithou
tPe
rcei
ved
chan
ges
inkn
owle
dge,
prac
tices
and
orga
niza
tion
Buc
k(2
002)
Peru
Cas
est
udy,
with
/with
out,
befo
re/a
fter
Enh
ance
dfa
rmer
know
ledg
e,st
reng
then
edor
gani
zatio
n,fa
rmer
perc
eptio
ns,e
nhan
ced
data
abou
ttec
hnol
ogy
perf
orm
ance
for
rese
arch
ers
Ort
izet
al.(
2004
)

2 Evaluation Research 45
programs are mainly: reaction of farmer field school participants, knowledge gain,change in agronomic practices by adoption of IPM practices, reduction in pesticideuse (volume, spray frequency, chemical compounds), increased yield, reduction ininput use and variation in yield or profit. IPM program evaluation results based onscientific quasi-experimental designs, the most dominant evaluation strategy, can beused to improve the delivery of IPM programs. The informal evaluations being con-ducted by the stakeholders of IPM programs are unsystematic, the criteria and evi-dence used in making judgments are implicit. The trustworthiness – internal as wellas external validity and reliability of results can therefore be biased. For example,the project reports of different IPM programs implanted in Indian Punjab reflectedsignificant reduction of pesticide consumption, pesticide expenditure and increasedyields in cotton crop, but the evaluative study based on evaluation methodologyreflected many shortcomings of the informal evaluations conducted by stakeholdersand variances of the results. The impact of IPM practices, like reduction in pesticideuse and expenditure is a consequence of adoption of IPM practices, but seldom havethese informal evaluations reflected the practices adopted by trained farmers as a re-sult of IPM programs. At present evaluation of IPM programs having methodologi-cal foundations is generally missing and limited to isolated studies. The contributionof IPM programs in reducing the environmental pollution and health hazards needsto be studied and measured. The relative advantage of IPM in terms of net economicbenefits- reduced pesticide expenditure, increased yields and increased output-inputratio may not be significant but the environmental impacts may be tangible. Butthese impacts cannot be measured in terms economic value due to methodologi-cal problems. Existing measures of economic evaluation of these impacts are notsatisfactory (Waibel et al., 1998).
2.5 Practical Aspects of Evaluating IPM Programs
Before conducting IPM evaluation studies, it is important to review the practicalconsiderations to ensure the quality and the usefulness of the study. These practicalconsiderations include the following activities.
� Determining the appropriate evaluation approach for the study� Planning and conducting the study� Communication of evaluation results� Utilization of evaluation results
When these key aspects of evaluation study are formulated, it is important toconsider the social, economic and environmental context of the farming communityfor achieving the practicality and the usefulness of the evaluation study.
2.5.1 Determining the Evaluation Approach for the Study
The evaluation approach refers to the philosophical framework of conducting anevaluation study. There are different approaches to evaluation. Some of these

46 R. Peshin et al.
evaluation approaches are expert oriented while other approaches are heavily par-ticipant oriented. The empowerment evaluation and participatory evaluation are ex-amples for participant oriented evaluation approaches. The nature of IPM programsdictates the types of desirable approaches for their evaluations.
IPM is a multi faceted holistic approach to pest management. The success of IPMtraining programs primarily depends on the ability of training programs to empowerfarmers in making informed decisions to apply IPM practices. Empowerment offarmers will be achieved through educational programs. The extent to which farm-ers are empowered to make informed decisions in pest management contributes tosustain the IPM. Therefore, it is important to help farmers understand the outcomesand value of IPM programs. This implies the need for conducting the evaluationwith farmers enabling them to understand the evaluation process and the results ofthe IPM program. This can be achieved only if farmers are given an opportunity toactively engage in the program evaluation process. If the IPM participants engage inprogram evaluation, they will be able to understand the evaluation process and thevalue of IPM. Farmers’ understanding of the value of IPM is an important prerequi-site for achieving the sustainability of IPM programs. The review of this informationindicates that the participant centered evaluation approaches such as empowermentevaluation and participatory evaluation are suitable approaches for IPM programevaluation.
2.5.1.1 Empowerment Evaluation Approach
As the name indicates, an empowerment evaluation approach is based on empow-ering the target beneficiaries of the program to actively engage in program evalu-ation. Fetterman (2001, p. 3) described empowerment evaluation as an evaluationapproach to foster “improvement” and “self-determination” of the target audience.The purpose of empowerment evaluation is to help the program beneficiaries eval-uate their programs through “self-evaluation” and “reflection.” An empowermentevaluation approach expects the evaluator to actively engage with the target au-dience to build their confidence and ability in planning, conducting and utilizingevaluation. The empowerment evaluation approach is compatible with the philos-ophy of IPM programming. Both IPM program and empowerment evaluation relyheavily on building the confidence and ability of the target audience to activelyengage in the program. The evaluator’s role in empowerment evaluation is more ofa capacity builder. The external evaluator will act as a coach and a facilitator to buildparticipants’ confidence and capacity to actively engage in the evaluation process.This way the program recipients will become owners of the program and partnersof the evaluation. As a result of this, planning, conducting, and utilizing evaluationwill become a part of their responsibility. This way IPM program evaluation willbecome a joint responsibility of the evaluator and the farmers. Therefore, the em-powerment evaluation approach is more practical than the expert oriented approachin conducting IPM evaluations. The main disadvantage of empowerment evaluationis that it takes time to build the confidence and competence of the target audience.

2 Evaluation Research 47
2.5.1.2 Participatory Evaluation Approach
A participatory evaluation approach is somewhat similar to the empowermentevaluation approach. However, a participatory evaluation approach does not focusheavily on building participants’ confidence and ability to take part in evalua-tion process. Instead, the participatory evaluation approach considers the programparticipants as partners in the program evaluation process and works with them.This way, the evaluation process will become a collaboration between the eval-uator and the IPM participants. The evaluator will act as a member of the IPMfarmers and work with them in planning, conducting and utilizing evaluation. Theevaluator’s role in participatory evaluation is more of a collaborator than of a ca-pacity builder. To the extent the evaluator is able to collaborate with the IPMfarmers, their active participation in the evaluation process will be assured. Inter-national development aid groups extensively use this evaluation approach to eval-uate their projects. Since the evaluator is not focusing on building confidence andcapacity, the participatory evaluation approach is relatively less time consuming.It is also effective in building community linkages and trust in collecting data.Therefore, the participatory evaluation approach is appropriate for IPM programevaluation.
2.5.1.3 Guidelines to Determine Evaluation Approach
If the evaluator has adequate time and resources, it is appropriate to use the empow-erment approach to IPM evaluation because that will lead to sustain the evaluationpractice within the community. If the farming community is empowered to con-duct their IPM program evaluation, they will be able to continuously evaluate theirprograms and make needed changes even after completing the IPM training. If thetime and resources are limiting, participatory approach is the best option to IPMevaluation because it does not demand much time and resources.
2.5.2 Planning and Conducting the Study
The quality of an IPM evaluation study depends on proper planning and imple-mentation of the study. Planning is helpful for achieving evaluation objectives costeffectively. Planning evaluation can be described as the organizing steps to system-atically answer the following questions.
� Who wants to evaluate the IPM program?� What are their information needs?� How much resources are available for conducting the evaluation?� What is the best design for collecting and processing this information within the
limits of available resources?
The following steps can be used to find answers to above questions and plan toconduct the evaluation study.

48 R. Peshin et al.
1. Identification of key stakeholders and their information needs2. Conducting an evaluability assessment3. Setting evaluation objectives4. Defining evaluation indicators5. Selecting appropriate design for the study6. Development of necessary tools for collecting data7. Collecting data8. Analyzing and preparing reports9. Communication of results
2.5.2.1 Identification of Key Stakeholders and Their Information Needs
Identification of stakeholders of the IPM program is the first step of planning anevaluation study. The most common stakeholders of an IPM evaluation are pol-icy makers, extension administrators, agricultural researchers, extension personnel,community leaders and farmers. Information needs of each of these stakeholders de-pend on the social, economic, and environmental situation of the program location.For example, farmers may want to know whether the IPM program is economicallybeneficial. Agricultural researchers may want to know whether the IPM program iseconomically and environmentally sound. Extension personnel may want to knowhow to improve the program. The review of these information needs of key stake-holders can be categorized into the following two major groups:
� Evaluation of program outcomes to determine the economic, social, and environ-mental benefits of the IPM program.
� Evaluation of the IPM programming process to improve the cost effectiveness ofIPM programs.
The evaluation of program outcomes is called outcome or impact evaluation.The main purpose of this evaluation is to document the program results for ac-countability of the programming. The impact evaluation helps the extension staff todetermine whether the program results justify the resources spent in the program.This information is essential in communicating the value of IPM programs to pro-gram managers and funding agencies. The outcome evaluation is called summativeevaluation.
The program process evaluation is important for extension staff and programmanagers to identify strengths, weaknesses and alternatives in implementing IPMprograms in a given social and environmental condition. In addition, process evalu-ation is helpful for monitoring IPM extension programs in the field. For example, byassessing the process against the set implementation targets extension can monitorthe progress of IPM programs. The program process evaluation is called formativeevaluation.
The planning and conducting of an IPM program evaluation should focus onsummative as well as formative parts.

2 Evaluation Research 49
2.5.2.2 Conducting an Evaluability Assessment
Before conducting the full-scale evaluation, it is a good idea to conduct a prelimi-nary assessment to determine whether the program situation warrants a meaningfulevaluation. This type of preliminary assessment is called an evaluability assessmentand it critically analyzes the following aspects of the program:
� Is IPM program well planned, meaningful and realistic in terms of the adoptabil-ity within the farming system? Is the IPM program adoptable to fit a particularfarming system?
� Do the key stakeholders agree to provide the necessary support for the IPMprogram evaluation?
� Do key stakeholders agree to make programmatic changes based on the evalua-tion findings?
� Is the program evaluation feasible within the given social, economic, and envi-ronmental situation of the location?
� Can the IPM program evaluation data be collected within the allocated limits ofavailable resources and time?
The first step of this preliminary evaluation is reviewing the IPM program for itsquality and practicality within the context of social, economic, and environmentalconditions of the geographic location where it is being implemented. It is a prereq-uisite that the IPM program should be well designed to meet the needs of the localfarmers. That means the IPM practices should fit with the farming system of the ge-ographic location. It should be practical in terms of delivering within the capacity ofextension service. If these conditions are not being met, then it is necessary to revisethe program to meet this condition for achieving desired results and conducting ameaningful program evaluation.
Verification of the stakeholder support for program evaluation is the second stepof evaluability assessment. This step is important to determine whether the stake-holders agree to provide the necessary support and resources to conduct the evalua-tion. The support from extension administration, field staff, and farmers is essentialto evaluate IPM programs. If this precondition is not met, it will be impossible toconduct an evaluation.
The IPM evaluation is meaningful only if the stakeholders agree to use the eval-uation information for making necessary changes to improve their programs. At thisstep of the evaluability assessment, the evaluator should analyze the field informationto assess whether the stakeholders are willing to make any programmatic changesbased on evaluation results. If not, it is important to convince stakeholders to utilizeevaluation results forprogram improvementbefore resumingthe full-scaleevaluation.
If the necessary data cannot be obtained from the participants, it will be verydifficult to conduct any evaluation. Therefore, at the beginning it is very important tocritically analyze whether the field situation of the targeted location is favorable forcollecting evaluation data. For example, sometimes, it may not be possible to collectdata due to some social issues such as miss trust between farmers and government

50 R. Peshin et al.
agencies. If there is such an issue, it is important to address it before implementingthe full-scale evaluation.
The available resources should be assessed to determine the feasibility of theevaluation study. If the resources are inadequate, then it is necessary to ask foradditional resources or modify the design to match the available resources beforebeginning the full-scale evaluation study.
2.5.2.3 Setting Evaluation Objectives
Evaluation objectives specify the information needs of stakeholders and guide therest of the evaluation process. Evaluation objectives are clear statements about thetype of information planned to collect for meeting the information needs of stake-holders. IPM program evaluation can be conducted in different levels depending onthe availability of resources. For example, if the available resources are not adequatefor conducting a long-term impact evaluation of IPM programs, evaluation of im-mediate learning outcomes such as participants’ changes in knowledge (cognition),attitudes, skills, and aspirations may be the best practical option. Depending on theavailability of resources and stakeholder needs, it is important to focus on the levelsof outcome evaluation and set evaluation objectives.
Examples for evaluation objectives:
� To document the short-term and intermediate outcomes of IPM programs� To document the impacts of IPM programs� To identify the factors needed to improve the IPM program� To collect the information needed to monitor the progress of IPM programming.� To conduct cost-benefit analysis of IPM programs for policy decisions.
2.5.2.4 Defining Evaluation Indicators
An indicator can be defined as a variable (Indicators for the Evaluation of the EU’sRural Development Programs, 2005). The process of defining what constitutes suc-cess for a project/program is an important step in developing evaluations. Definingthe success indicators for IPM program is necessary to conduct evaluations. Thesuccess indicators allow project or program sponsors to evaluate whether they ac-complished what they set out to do and what the direct or indirect impact of theirproject has been. According to Powell et al. (1996), “Indicators are observable ev-idence of accomplishments, changes made or progress achieved.” These indicatorsare measured to quantify the changes made, inputs utilized or outcomes achieved.
Measurement of indicators helps in knowing changes brought by the program/project.
Evaluation indicators can be considered as the reasonable and meaningful mea-sures of the assessing step of the IPM program. Evaluation indicators can be cate-gorized into the following four groups:
a) Indicators for measuring program inputsb) Indicators for measuring program outputs

2 Evaluation Research 51
c) Indicators for measuring farmer participationd) Impact indicators for measuring the program outcomes and impacts
Indicators for measuring program inputs. Program input means the resourcesutilized to develop and implement the IPM program. This includes money, person-nel, and time. Input indicators are used to measure how much resources are utilizedfor the program, for example, the amount of money spent for the program. The inputlevel indicators are used to determine whether the planned resources are mobilizedinto the program. If there is a budget shortfall at the beginning of the program, itis reasonable to expect that there will be some limitations to achieving the plannedoutcomes.
Indicators for measuring program outputs. Program output includes the edu-cational materials, workshops and curricula developed and training programs, andeducational activities delivered. Output indicators are used to assess whether theIPM program implementation is progressing as planned in developing and deliver-ing targeted outputs.
Indicators for measuring farmer participation and their reactions. Farmers arethe target audience of IPM programs. Their participation in the program is usedas an indicator to assess whether the program is reaching the targeted number offarmers. The number of farmers reached and their levels of satisfaction with the IPMprogram are used as indicators for measuring the target audience’s participation andreactions.
Indicators for measuring program outcomes and impacts. Outcome is de-scribed as the extent to which farmers changed or benefited as a result of their par-ticipation in the IPM program. The outcomes of IPM programs can be categorizedinto immediate outcomes, intermediate outcomes, and end results or impacts.
Immediate outcomes are the changes in participants’ knowledge, attitudes, skillsand aspirations. These changes take place during the training programs and can berecorded at the end of the training session. Intermediate outcomes are adoption ofIPM practices and these changes take place sometime after the training. The endresults of IPM programs are social, economic, and environmental improvementsdue to the adoption of IPM practices by farmers. These end results include moneysaved on pest control, reduced amount of chemical applications, water quality im-provements, ecosystem improvements, reduced incidence of hazardous chemicalexposures, etc.
The indicators used to evaluate outcomes are referred to as impact indicators.An impact indicator can be described as a reasonable and meaningful measure ofintended client outcomes. For example, percentage of the participants who gainedIPM knowledge is an impact indicator for measuring immediate training outcomes.Depending on the level of outcome evaluation, it is necessary to define impactindicators. The summary of possible evaluation indicators for an IPM program isdisplayed in Table 2.2.

52 R. Peshin et al.
Table 2.2 Evaluation indicators for IPM program evaluation
Type ofevaluationindicator
Focus Examples for impact indicators
Input Input evaluation • Amount of money spent• Number of staff assigned• Time spent for the program.
Output Output evaluation • Number of IPM educational materialsdeveloped
• Number of IPM training sessions deliveredFarmers’
Participationand Reactions
Farmers’ participationevaluation
• Number of farmers trained.
Farmers’ levels ofsatisfaction with theprogram
• Number of farmers who said the program isuseful.
Outcome Immediate OutcomeEvaluation
• Number of participants who improved theirIPM knowledge.
• Number of participants who developedpositive attitudes toward IPM.
• Number of participants who developed IPMskills.
• Number of participants aspiring to practiceIPM knowledge.
Intermediate OutcomeEvaluation
• Number of participants practicing IPM.
End Result (Impact)Evaluation
• Reduced amount of pesticide usage.• Money saved on pesticide reduction.• Number of beneficial insects recorded in
the field.• Reduced levels of pesticide residues in
water-ways.• Reduced number of hazardous incidences
of pesticide misuse.
2.5.2.5 Selecting an Appropriate Design for the Evaluation Study
Understanding the progression of the impacts of IPM program is helpful for select-ing an appropriate design for the study. Figure 2.3 illustrates the possible progres-sion of the outcomes of an IPM program.
The possible outcomes of an IPM program begin to unfold with the farmers’ par-ticipation in training programs. If the training program is effective, participants willgain new knowledge about IPM and develop positive attitudes toward IPM. Theyalso develop new skills such as identification of beneficial insects and applicationof alternative pest control methods like sampling for economic threshold level. Ifthe farmers are convinced about the usefulness of the IPM program, they will aspireto practice IPM. These are the immediate learning outcomes of a successful IPMtraining program. If the participants left the training with an intention to practiceIPM, then it is reasonable to expect they will adopt IPM practices for pest control

2 Evaluation Research 53
Lower Levels
Learning about IPM(KASA Change)
Change of pest management practices toIPM
End Results -Improved Condition
Higher Levels
1
2
3
4
Immediate Outcomes
IntermediateOutcomes
Satisfactionlevel
Fig. 2.3 Impact hierarchy of IPM programsSource: Jayaratne (2007a).
on their farms. This practice change can be observed at some point after the training.Various social, economical, technological and environmental factors can contributeto farmers’ decision to adopt IPM practices.
Practicing IPM on their farms is the intermediate outcome of the IPM program.This includes the use of biological, mechanical and chemical methods to controlpests. Chemical methods will be used as the last option to control pests.
If farmers adopted the IPM practices, they will then be able to reap the long-term benefits individually and collectively. As individuals, farmers will experiencereduced cost of production by the reduced application of pesticides. Collectively,farmers will be able to live in a cleaner and healthier environment. Water qualitywill likely to be improved. The ecosystem will be more balanced between harmfuland beneficial insects. Fewer pest outbreaks can be the long-term results of IPMprograms. The evaluation study should be designed to document these program out-comes. The evaluation of long-term outcomes of IPM programs takes more time andresources than the evaluation of immediate and intermediate outcomes.
There are two factors to consider when selecting an appropriate design for theevaluation study. First, the design should be practical within the limits of budgetaryprovisions and other resources. Second, the design should be adequately accurateto rely on evaluation results. Randomized experimental designs are more accuratethan quasi-experimental designs. However, randomized experimental designs arenot practical in many extension settings due to various factors such as randomiza-tion difficulties, ethical issues and budget limitations. Campbell and Stanley (1963)called the experimental studies that are not randomized, quasi-experimental studies.When accuracy and practicality are considered, quasi-experimental design is themost appropriate design for conducting IPM evaluation studies.
Quasi-Experimental Designs
Quasi-experimental designs use existing conditions for studying the treatment ef-fect (Impacts of IPM program) instead of randomly assigning treatments (IPM

54 R. Peshin et al.
programs). There are different quasi-experimental designs. The following quasi-experimental designs can be considered as the most practical designs for conductingan IPM evaluation study.
� Ex post facto design� One-group before and after comparison design� One-group time-series design� Nonequivalent control-group design
(a) Ex post Facto Design: Instead of actual manipulation of the treatment, ex postfacto experimental design uses a pre-existing condition as the treatment. Therefore,this design is appropriate for studying the impacts of an already conducted IPMprogram. The pre-existing condition is the implemented IPM program. Observationsfor studying variables will be made from the IPM implemented site. These obser-vations should be compared with the similar observations made from a comparablesite where there was not any IPM programming. An ex post facto study uses acomparable site as the control to find the program effects. The main criticism of thisdesign is that there are potential sources of biases due to situational variations oftwo sites other than just the IPM program.
The following designs are appropriate if the evaluation study is planning with theIPM program implementation stage.
(b) One-group before and after comparison design: As the name indicates, thisevaluation is conducted with one group. The data related to IPM impact indica-tors will be collected before conducting the program (pre-test) with the selectedgroup. This includes collecting data related to farmers’ knowledge about pest con-trol, current pest control practices, their attitudes toward pests and chemical control,current cost of production, pesticide related environmental problems, and reportedincidences of pesticide hazards. Then the IPM program will be conducted with theselected farmer group. Conducting the IPM program is considered as the “treat-ment” of this experiment. After conducting the IPM program, the data related toimpact indicators will be collected (post-test).
Pre- and post-test data will be analyzed and compared to assess the impact ofthe program. The changes in farmers’ knowledge, attitudes, skills, aspirations, andpractices and social, economic and environmental improvements are considered asthe impacts of the program. One-group before and after comparison design is widelyused in extension program evaluation due to its simplicity and practicality. The maincriticism of this design is that there are potential sources of bias to the results.Campbell and Stanley (1963) termed these potential sources of bias as threats tothe internal validity of results and described eight different sources of threats tothe internal validity. The most significant sources of threats affecting the validity ofone-group before and after comparison design of IPM evaluation studies are history,seasonality, attrition and testing.
History. When any other event than the IPM program is taking place betweenthe pre- and post-tests and contributes to the results of the study, then it will beconsidered as an internal threat to the validity due to history. For example, if somefarmers in the IPM program have watched a documentary movie in a television

2 Evaluation Research 55
program, and learned about possible harmful effects of pesticides and decided toreduce the application of pesticides, then reduced levels of pesticides may not besolely due to the IPM program.
Seasonality. In farming, seasonality is a very important variable. If the differencebetween pre-and post-tests are due to some of the seasonal variations, then it willbe considered as an internal threat to the validity of the results. For example, if thepre-test data were collected after a favorable season for pests and post-test data werecollected after an unfavorable season for pests, then the reduced levels of pesticideapplications may be due to seasonal variability as well.
Attrition. Attrition means IPM participants leaving the study before it is com-pleted. If some of the program participants drop out from the IPM evaluation studyduring the pre- and post-tests systematically, then attrition error can take place. Forexample, if the backward farmers dropped out from the IPM program, then post-testresults might be artificially elevated toward high impacts because of the concentra-tion of innovative farmers. The error due to attrition can affect the validity of theresults of the evaluation studies.
Testing. Some farmers are smart to learn from the pre-test and may correctlyanswer at the post-test mainly due to what they learned from the pre-test. If thishappened, then the results are not only due to the IPM program but also due to thepre-test. When this type of situation happens it is called an internal threat to thevalidity.
It is important to use an evaluation design that prevents these threats to the inter-nal validity of results.
(c) One-group time-series design: In this design, the evaluator records observa-tions for a few seasons before and after implementing the IPM program. That means2–3 pre-tests and post-tests will be conducted during the study. Conducting multipletests before and after the program will be helpful to partial out the seasonal effectson the results of the IPM program. For example, data from multiple testing pointscan be analyzed to see whether there is any change in the pattern of pesticides usedby the participants due to seasonal changes other than the IPM program. However,testing, attrition and history will remain as threats to the internal validity of thisdesign. This method is time consuming and will be difficult to implement due tomultiple data collection points.
(d) Nonequivalent control-group design: In this design, two comparable siteswill be selected for the evaluation study. One site will be used as the IPM pro-gramming (treatment) site. The other site will be used as the control site for com-parison. To the extent these two sites are comparable, above described threatsto the internal validity can be controlled. These two sites should be similar interms of farming, agro-ecology, and socio-economic background of the farmers.However, two sites should be adequately distant from each other to prevent anycross contamination of information from the IPM (treatment) site to thecontrol site.
After selecting the two comparable sites, a pre-test will be conducted separatelyin both locations at the same time to establish the bench mark of the field situa-tions with regard to the measuring of impact indicators. Then, the IPM program
56 R. Peshin et al.
will be conducted at the “treatment” site. The farmers at the control site will followtheir regular farming practices without any IPM program. Then the post-test will beconducted at the same time at both sites to collect data related to the IPM impactindicators.
By comparing the pre and post-test differences between two sites, impacts ofthe IPM program can be evaluated. The control site will be helpful for neutralizinginternal threats from history, seasonality, and the test effects as long as the sites arerelatively similar. The advantage of nonequivalent control-group design is that itprovides more reliable results than the one-group pre and post design does. This isthe most practically feasible accurate design for IPM program evaluation. The maincriticism of this method is the comparability of the two sites.
2.5.2.6 Collecting Data
After designing the evaluation study the next important step of planning an IPMevaluation study is the selection of an appropriate data collection method. Thedata collection methods are categorized into two major groups, namely qualitativemethods and quantitative methods. As the name indicates quantitative methods col-lect numerical data and qualitative methods collect descriptive data or information.Quantitative data are considered as strong evidences of impacts and used for ac-countability of IPM programming. However, quantitative methods are lacking inexploring ability. For example, if the IPM program is not showing promising resultsin one location, then quantitative methods will be unable to track the reasons for thatsituation. In contrast, qualitative methods have the capacity to explore the situationand find reasons.
Quantitative Methods
As the name indicates, quantitative methods collect-numerical data. Numerical dataare appropriate for documenting program impacts and accountability purposes.Therefore, quantitative methods are widely used in summative evaluation. However,quantitative methods are not appropriate for explaining reasons for certain situa-tions. A survey is the most appropriate quantitative data collection method for IPMprogram evaluation studies. Surveys are conducted using questionnaires. There arethree different approaches to conduct surveys.
a) Personal interviews: In this method, surveys are conducted face-to-face withthe respondents using a questionnaire for collecting evaluation data. Since low lit-eracy audiences cannot respond to a written survey, this approach is appropriatefor collecting data from them. The main disadvantage of this approach is that it islabor intensive and demands more time and money than other methods. The fieldassistants who are employed to collect data should be trained to establish the uni-formity of conducting interviews. It is important to select field assistants who arefamiliar with the linguistic, social and cultural environment of the farmers to preventcommunication gaps and to facilitate the data collection process.
b) Mail surveys: This approach uses the mail service to collect data from thestudy sample. The survey questionnaire will be printed and mailed with a cover

2 Evaluation Research 57
letter to the target audience for collecting data. It is important to explain the pur-pose of the survey in the cover letter and include a return address written envelopewith a stamp to maximize the response rate. Normally, two to three weeks will begiven for farmers to respond to the survey. Then, a reminder letter will be mailed tonon-respondents. If there is not an adequate response rate, it is a good idea to senda second reminder letter to non-respondents. The main advantage of mail surveys isthey are less expensive and efficient than face-to-face interviews. However, receiv-ing a satisfactory response rate for a mail survey with farmers is a challenge. Use ofan incentive such as a prize drawing for respondents may be a strategy for achievinga high response rate.
c) Online surveys: Data collection can be achieved by using on-line surveys. Thisapproach is practical only if the target audience has access to the Internet and hasthe ability to use the web. This method is not practical in most of the developingcountries. However, this may be an option for collecting data in developed countries.The survey will be developed as an online questionnaire and the web link will bee-mailed to the target audience. Like mail surveys, respondents will be given abouttwo weeks to respond to the survey. A reminding e-mail will be sent to the non-respondents after two weeks. If the response rate is not adequate, then a secondreminder will be e-mailed to non-respondents. The main advantage of an onlinesurvey is that it is easy to conduct. This approach of data collection saves time andmoney. The major limitation is that an online survey is not feasible in some ruralparts of developed countries due to lack of Internet service.
Qualitative Methods
Qualitative methods collect descriptive information. These methods are important toidentify reasons for certain conditions. Therefore, qualitative methods are very use-ful in formative evaluation. The main purpose of formative evaluation is to identifynecessary information for the IPM program’s improvement. Qualitative methodsexplore the situation to find answers for questions such as why certain conditionsexist; how to improve the program; and what are the problems and alternatives. Themost practical qualitative methods that can be used for IPM program evaluation arefocus group interviews, observations, and case studies.
(a) Focus group interviews: A focus group interview is a guided discussion withabout 8–10 farmers to gather necessary data and information about the studyingsituation. A facilitator using a preplanned questionnaire conducts the focus groupinterview and the discussion will be recorded. During the focus group, the modera-tor/facilitator asks open-ended questions related to the information needed and thegroup will be facilitated to express their views and answers to the question. Thefacilitator should encourage everyone to provide inputs and control the discussionwithout letting a few to dominate. It is important to use exploratory type questionsand avoid “yes” and “no” answers type questions. After the interview, recordedinformation will be transcribed and analyzed to identify major points. Normally, itis important to conduct at least 2–3 focus group interviews with different farmers inthe area to identify the general situation of pest management.
58 R. Peshin et al.
Focus group interviews can be conducted before, during and after implement-ing the IPM program to collect necessary information. Interviews before and afterimplementing the IPM program are helpful to understand the field situation withregard to the pest management practices of farmers and related social, economic andenvironmental conditions. The interview before the IPM program can be used to setthe bench marks of the field situation. For example, if you identify that most farmersheavily rely on chemicals for pest control it will be a strong evidence for the needof IPM program. This information can be compared with the information gatheredfrom the interview after implementing the IPM program to assess the changes inpest control approaches and improved social, economic and environmental condi-tions. Focus group interviews conducted during the IPM program implementationwill be useful in identifying problems, issues, challenges and alternatives. The majoradvantage of focus group interview is that it is easy and quick.
(b) Observations: Observation is a practical method of collecting qualitative data.Observation can be used for collecting data when the phenomena being studied areobservable through human sensors. This includes changes that one can see, hear,smell or feel. For example, if the IPM program is effective in reducing the use ofpesticides, then the observer should be able to see an increased number of beneficialinsects in IPM fields compared to the situation prior to the IPM program imple-mentation. When observation is used as a method of collecting data, it should beorganized systematically. The following steps are helpful in conducting systematicobservations.
� Determine the observable indicators for the evaluating phenomena.� Develop a rating scale for recording the observing indicators� Train the observers to make systematic observations� Collect data.
Determine the observable indicators for the evaluating phenomena. In IPM pro-gram evaluation, it is important to identify the possible changes that one can easilyobserve if the program is effective. Some of the possible indicators that one canobserve are the number of farmers spraying pesticides in the field, levels of agro-chemical smell in the field, number of beneficial insects observed in a specific areaof the field, number of farmers using insect pest and disease resistant crop varieties,number of farmers using other pest control methods such as traps and mechanicalmethods.
Develop a rating scale for recording the observable indicators. After determiningthe observable indicators for the IPM program, it is necessary to develop a ratingscale for recording the prevalence level of the indicators. The observer rating scalescan be developed as ordinal scales for IPM program evaluation. This scale is helpfulfor transforming observations into quantifiable data. An ordinal scale is helpful incomparing situations before and after implementing the IPM program. For example,if the recording indicator is number of beneficial insects observed in a specific areaof the field, then that information can be recorded as an ordinal scale. In an ordinalscale, the recording data are categorized into a few layers of hierarchical order. Forexample, level 1 = no beneficial insects in the area, level 2 = 1–3 beneficial insects

2 Evaluation Research 59
in the area, 3 = 4–6 beneficial insects in the area, 4 = more than 6 beneficial insectsin the area. Other observing indicators such as the level of chemical smell in the areaalso can be recorded in an ordinal scale. For example, 1 = pesticide smell is heavyin the field, 2 = pesticide smell is mild in the field, and 3 = there is no pesticidesmell in the field. This will enhance the evaluation study’s reliability.
Train the observers to make systematic observations. The observers used forcollecting field data should be trained to streamline the data collection processand minimize the variability between the observers. All observing team membersshould understand the rating scales and practiced before gathering actual data. It isimportant to use the same observers before and after the IPM program for minimiz-ing observer variability.
Collect data. Observations will be conducted before implementing the programin a specific time of the cropping season. The field observations will be recorded onthe scales. The same observers and same time period of the cropping season will beused to record the field situation after implementing the program. The comparisonof these two data sets can be used to identify program impacts.
(c) Case Studies: Case study is a qualitative method useful in investigating asituation thoroughly. In a case study, the investigator uses all sources of informationavailable in the field to understand the situation. These sources of information in-clude farmers, traders, community leaders, government agencies and observations.During the case study, the investigator should be able to immerse himself/herselfas a member into the IPM farming community and study their ways of controllingpests. The success of a case study depends on the investigator’s ability to understandthe language and culture of the people in the area. The investigator has to spendan adequate amount of time studying in the field and meeting farmers to collectnecessary data and information. Case studies are time consuming. However, theyare helpful in understanding the field situation realistically and explore reasons forcertain field situations.
2.5.2.7 Development of Necessary Tools for Collecting Data
An evaluation tool is a survey questionnaire designed to collect necessary data forprocess and results evaluation of IPM programs. Development of necessary surveytools for data collection is a challenging task for those who do not have necessaryknowledge and experience in survey research. It is important to understand the na-ture of IPM programming in order to design appropriate data collecting tools. TheIPM programming involves multi-session educational programs targeting to changefarmers’ pest control practices. These multi-session educational programs are fo-cusing on changing the target farmers’ knowledge and attitude and building theirskills to apply IPM. Therefore, two sets of data collection tools can be developedto get necessary data. One set is for the assessment of the outcomes of individualtraining sessions. The other set is for the assessment of the overall program impact.The following two sets of tool templates can be used to collect necessary data. Thesetool templates can be modified for needed local situations.
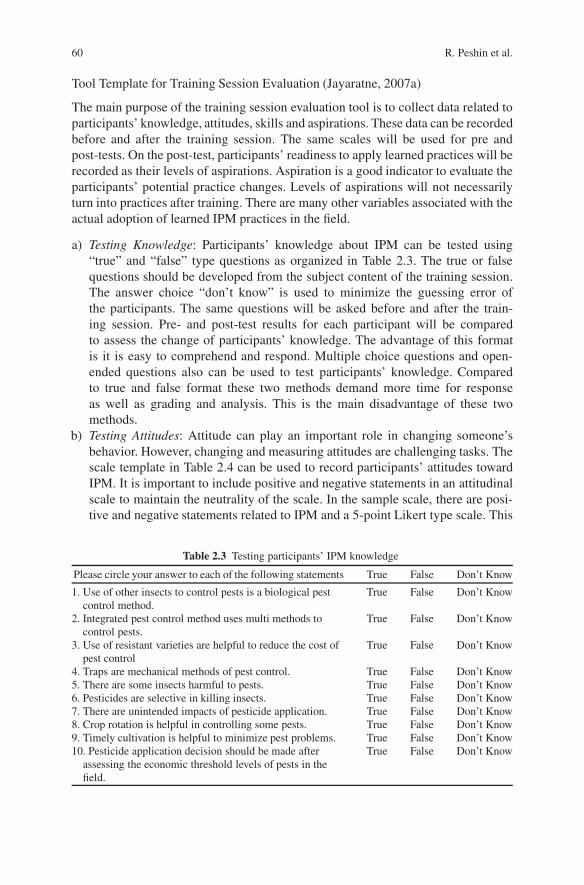
60 R. Peshin et al.
Tool Template for Training Session Evaluation (Jayaratne, 2007a)
The main purpose of the training session evaluation tool is to collect data related toparticipants’ knowledge, attitudes, skills and aspirations. These data can be recordedbefore and after the training session. The same scales will be used for pre andpost-tests. On the post-test, participants’ readiness to apply learned practices will berecorded as their levels of aspirations. Aspiration is a good indicator to evaluate theparticipants’ potential practice changes. Levels of aspirations will not necessarilyturn into practices after training. There are many other variables associated with theactual adoption of learned IPM practices in the field.
a) Testing Knowledge: Participants’ knowledge about IPM can be tested using“true” and “false” type questions as organized in Table 2.3. The true or falsequestions should be developed from the subject content of the training session.The answer choice “don’t know” is used to minimize the guessing error ofthe participants. The same questions will be asked before and after the train-ing session. Pre- and post-test results for each participant will be comparedto assess the change of participants’ knowledge. The advantage of this formatis it is easy to comprehend and respond. Multiple choice questions and open-ended questions also can be used to test participants’ knowledge. Comparedto true and false format these two methods demand more time for responseas well as grading and analysis. This is the main disadvantage of these twomethods.
b) Testing Attitudes: Attitude can play an important role in changing someone’sbehavior. However, changing and measuring attitudes are challenging tasks. Thescale template in Table 2.4 can be used to record participants’ attitudes towardIPM. It is important to include positive and negative statements in an attitudinalscale to maintain the neutrality of the scale. In the sample scale, there are posi-tive and negative statements related to IPM and a 5-point Likert type scale. This
Table 2.3 Testing participants’ IPM knowledge
Please circle your answer to each of the following statements True False Don’t Know
1. Use of other insects to control pests is a biological pestcontrol method.
True False Don’t Know
2. Integrated pest control method uses multi methods tocontrol pests.
True False Don’t Know
3. Use of resistant varieties are helpful to reduce the cost ofpest control
True False Don’t Know
4. Traps are mechanical methods of pest control. True False Don’t Know5. There are some insects harmful to pests. True False Don’t Know6. Pesticides are selective in killing insects. True False Don’t Know7. There are unintended impacts of pesticide application. True False Don’t Know8. Crop rotation is helpful in controlling some pests. True False Don’t Know9. Timely cultivation is helpful to minimize pest problems. True False Don’t Know10. Pesticide application decision should be made after
assessing the economic threshold levels of pests in thefield.
True False Don’t Know

2 Evaluation Research 61
Table 2.4 Testing participants’ attitudes
Please circle the number that bestdescribes your level of agreementwith the following statements:
Stronglydisagree
Disagree Neutral Agree Strongly agree
1. Use of pesticides is the onlymethod to control pests.
1 2 3 4 5
2. All the insects in fields aredamaging to crops.
1 2 3 4 5
3. There are different methods tocontrol pests.
1 2 3 4 5
4. Cultivation of resistant varietiesis one of the best methods ofcontrolling pests.
1 2 3 4 5
5. IPM helps you save you money. 1 2 3 4 56. IPM is not practical. 1 2 3 4 5
tool can be used to record participants’ attitudes before and after the training.Recorded responses will be aggregated to get the overall value for the attitude.Before aggregating, response data for the negatively stated items should be re-versed to get the overall value for the attitude on this scale. Pre and post-testresults of each participant will be compared for assessing the change of attitudes.
c) Recording Skill Changes: Building participants’ pest management skills is need-ed in practicing IPM. For example, participants should be able to scout theirfields for pests and make management decisions. This can be done only if theylearn how to assess pest damages and compare with economic threshold levels.Building participants’ skills can be assessed by using the sample tool templatein Table 2.5. In this template, participants’ skills will be assessed indirectly byrecording their confidence to apply learned IPM practices. By comparing pre-and post-test data one can compare the change in participants’ skills relatedto IPM.
d) Recording Potential Practice Changes (Aspirations): Participants’ readiness toapply what they learned during the IPM training is a good indicator to assessthe immediate training outcome. This intended practice change can be assessedby using the sample tool in Table 2.6. It is important to list the major practices
Table 2.5 Recording participants’ skills
How confident are you inyour ability to:
Notconfident
A littleconfident
Somewhatconfident
Confident Veryconfident
1. Identify beneficial insects? 1 2 3 4 52. Identify insect pests? 1 2 3 4 53. Estimate pest damages? 1 2 3 4 54. Select pest resistant varieties? 1 2 3 4 55. Use mechanical pest control methods? 1 2 3 4 56. Estimate the threshold level of insect
pests?1 2 3 4 5

62 R. Peshin et al.
Table 2.6 Recording participants’ aspirations
As a result of this program, do you intend to: No Maybe Yes Alreadydoing this
1. Cultivate resistant varieties. 1 2 3 42. Use traps to control pests. 1 2 3 43. Use economic threshold levels for making
decisions to apply pesticides1 2 3 4
4. Scout fields regularly to monitor pestspopulations.
1 2 3 4
5. Use pesticides as the last option to control pests. 1 2 3 4
introduced by the training session. This scale can be included in the post-testsurvey instrument.
e) Collecting Necessary Data for Training Improvement: It is important to collectthe process evaluation data useful for the trainer to improve the training session.These questions can be included in the post-test survey for collecting trainingsession improvement data.
Sample questions for collecting training improvement data:
� Would you recommend this training workshop to other farmers?
1. Yes2. No
� If not, why:� What did you like the most about this training workshop?� What did you like the least about this training workshop?� How could this training be further improved?
Tool Template for Overall Program Evaluation
The overall impact of the IPM program can be evaluated by conducting two com-prehensive surveys before and after one year of the IPM program. It is important toconduct a bench mark survey before implementing the IPM program in the selectedarea to identify the existing field situation. This survey should collect the necessarydata from the farmers in the selected evaluation sites to evaluate the overall impactof the program. These data include:a. Current agronomic practices
� Types and varieties of crops grown� Type of land preparation� Time of planting� Methods of weed control
b. Major pests
� Insect pests� Diseases� Weeds

2 Evaluation Research 63
c. Current pest control methods
� Chemical� Biological� Mechanical� Agronomical
d. Amount of agrochemical usage
� Herbicides� Insecticides� Fungicides
e. Farmers’ attitudes and values toward
� Pest control� Alternative pest control methods� Agro-chemicals� Environment� Water quality
f. Farm Production
� Crop yields/hectare
g. Cost of production
� Cost of pest control� Cost of production� Profit
h. Community information
� Reported pesticide hazardous incidences in the community� Pesticide related environmental issues reported
By collecting these data, one can evaluate the overall impact of the IPM program.For example, if the IPM program is successful, then by comparing the amount ofpesticides used before and after the IPM program one can evaluate the levels ofreduced pesticide usage. Collecting yield data is important to convince farmers thatIPM is helpful to maintain crop yields even with reduced levels of pesticide ap-plications. Costs of production and reduced levels of pesticide application data areessential to estimate the economic impact of the IPM program.
2.5.2.8 Analyzing Data
Descriptive and correlation statistics are appropriate for analyzing IPM programevaluation data. By comparing pre- and post- training workshop evaluations, onecan document the following outcomes:

64 R. Peshin et al.
i. Participants’ changes in knowledge, attitudes and skillsii. Participants’ potential practice changes (Aspirations)
iii. Ways to improve the training
By comparing the bench mark survey data and the follow-up survey, one can doc-ument the impacts of the IPM program. This includes practice changes and social,economic and environmental impacts of the IPM program.
2.5.3 Communication of Evaluation Results
The IPM program evaluation is meaningful only if the results are communicatedwith the key stakeholders to achieve evaluation objectives. There are different meth-ods to communicate the evaluation results with key stakeholders.
i. Evaluation reportsj. Presentationsk. Newslettersl. Newspapers
m. Radio programsn. TV programs
The communication method should be selected based on the type of stakeholders.For example, an evaluation report can be considered as the best method to communi-cate evaluation results with funding agencies and administrators. Evaluation reportsshould be written in lay language to help the key stakeholders understand results.It is important to include an executive summary to highlight the key findings of theevaluation study. If the report is relatively long it is necessary to include a contentpage to guide the reader. Presentations are very effective method of communicatingevaluation results with funding agencies, administrators and farmers. If the farmersare illiterate, presentation of results with pictures is the best option to communicateresults with them. A presentation followed by a report will contribute to enhance theeffectiveness of communicating evaluation results. Newsletters and newspapers areuseful to communicate evaluation results with general public and policy makers. Theonly disadvantage of written medium is that illiterate groups will not have accessto this information. Radio and TV are very effective in communicating evaluationresults with the general public.
2.5.4 Utilization of Evaluation Results
Evaluation is only of value to the extent the results are utilized to achieve the evalu-ation objectives. Normally evaluation results can be used to:
o. Establish program accountabilityp. Make programmatic decisions

2 Evaluation Research 65
q. Monitor programsr. Improve programss. Market the IPMt. Achieve program sustainability
Continued funding for IPM programs depends on the economic viability of thoseprograms. Therefore, impact evaluation results should be used to justify the costs ofIPM programming. Cost benefit data can be used to make programmatic decisions.For example, if the program impacts exceed the costs, then the management will beable to use those results to expand the IPM program. The process evaluation datacan be used for program monitoring and improvement. For example, if someoneplaned to reach 100 farmers and was able to reach only 70 farmers, then the processevaluation information can be used to identify the reasons for the achievement gapand fix those problems.
Impact evaluation results can be used to market the IPM program to potentialfunders as well as potential farmers. The communication of program impacts withpotential funders and farmers is the best strategy to convince them about the benefitsof IPM programming. Testimonials of the farmers who have positive experienceswith the program are very powerful messages in marketing IPM programs to po-tential users. Extension brochures can be developed with farmers’ testimonials toeffectively market IPM extension programs.
2.5.5 Meta-Evaluation for Evaluation Practice Improvement
Meta-evaluation means the critical review of an evaluation study. Evaluation is asystematic process. Critical review of this process is essential for someone to im-prove his/her evaluation practice. After completing the IPM evaluation, the eval-uator should critically review the process to identify the evaluation related issues,problems, challenges and alternatives to improve the evaluation next time.
2.6 Sample Studies
Process and outcome evaluation of IPM base insecticide resistant management(IRM) program conducted in Punjab employed with and without, before and afterquasi-experimental research design. The evaluation indicators were: participationof farmers in training program, reactions of participating farmers towards differ-ent aspects of training, gain in knowledge and analytical skills, application of gainin knowledge and skills for adoption of IPM practices, adoptability of IPM prac-tices by working out adoptability indices, reduces pesticide applications and pes-ticide use (technical grade material), economic benefits in terms of reduction inpesticide expenditure, increase in yields and higher input/output ratio of cotton cul-tivation. The purpose of the evaluation study was to understand how the programis being implemented, whether the IRM intervention in terms of training of farmers
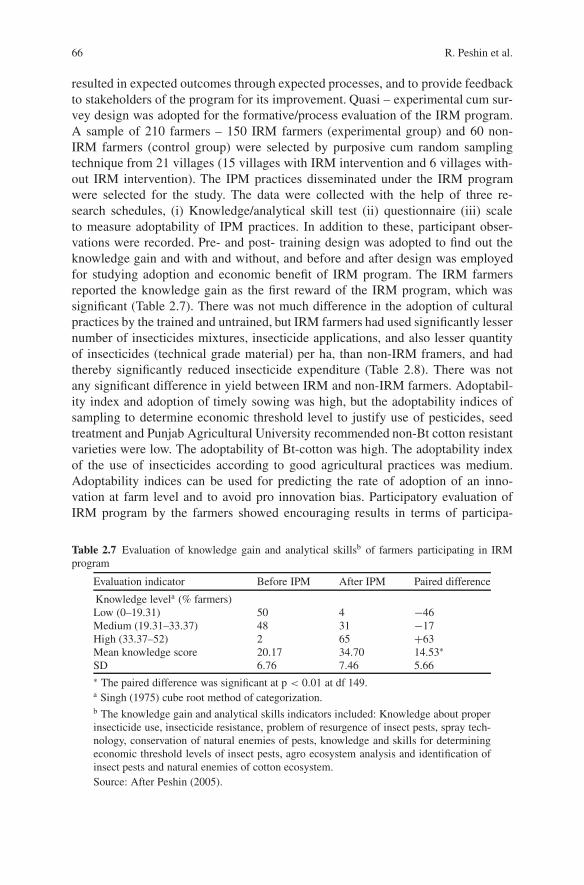
66 R. Peshin et al.
resulted in expected outcomes through expected processes, and to provide feedbackto stakeholders of the program for its improvement. Quasi – experimental cum sur-vey design was adopted for the formative/process evaluation of the IRM program.A sample of 210 farmers – 150 IRM farmers (experimental group) and 60 non-IRM farmers (control group) were selected by purposive cum random samplingtechnique from 21 villages (15 villages with IRM intervention and 6 villages with-out IRM intervention). The IPM practices disseminated under the IRM programwere selected for the study. The data were collected with the help of three re-search schedules, (i) Knowledge/analytical skill test (ii) questionnaire (iii) scaleto measure adoptability of IPM practices. In addition to these, participant obser-vations were recorded. Pre- and post- training design was adopted to find out theknowledge gain and with and without, and before and after design was employedfor studying adoption and economic benefit of IRM program. The IRM farmersreported the knowledge gain as the first reward of the IRM program, which wassignificant (Table 2.7). There was not much difference in the adoption of culturalpractices by the trained and untrained, but IRM farmers had used significantly lessernumber of insecticides mixtures, insecticide applications, and also lesser quantityof insecticides (technical grade material) per ha, than non-IRM framers, and hadthereby significantly reduced insecticide expenditure (Table 2.8). There was notany significant difference in yield between IRM and non-IRM farmers. Adoptabil-ity index and adoption of timely sowing was high, but the adoptability indices ofsampling to determine economic threshold level to justify use of pesticides, seedtreatment and Punjab Agricultural University recommended non-Bt cotton resistantvarieties were low. The adoptability of Bt-cotton was high. The adoptability indexof the use of insecticides according to good agricultural practices was medium.Adoptability indices can be used for predicting the rate of adoption of an inno-vation at farm level and to avoid pro innovation bias. Participatory evaluation ofIRM program by the farmers showed encouraging results in terms of participa-
Table 2.7 Evaluation of knowledge gain and analytical skillsb of farmers participating in IRMprogram
Evaluation indicator Before IPM After IPM Paired difference
Knowledge levela (% farmers)Low (0–19.31) 50 4 −46Medium (19.31–33.37) 48 31 −17High (33.37–52) 2 65 +63Mean knowledge score 20.17 34.70 14.53∗
SD 6.76 7.46 5.66∗ The paired difference was significant at p < 0.01 at df 149.a Singh (1975) cube root method of categorization.b The knowledge gain and analytical skills indicators included: Knowledge about properinsecticide use, insecticide resistance, problem of resurgence of insect pests, spray tech-nology, conservation of natural enemies of pests, knowledge and skills for determiningeconomic threshold levels of insect pests, agro ecosystem analysis and identification ofinsect pests and natural enemies of cotton ecosystem.Source: After Peshin (2005).

2 Evaluation Research 67
Table 2.8 Evaluation of benefits of IRM program
Evaluation indicators Before IRM program After IRM program
IRMvillages
Non-IRMvillages
Difference IRMvillages
Non-IRMvillages
Difference
Average number ofinsecticideapplications
15.34 14.93 0.41NS 13.07 15.43 2.36∗
Technical gradeinsecticide use(kg/ha)
NA NA – 5.602 8.032 2.430∗
Tank mixtures ofinsecticide (No.)
NA NA – 3.1 5.1 2.0∗
Insecticide expenditure($ US/ha)a
229.00 247.67 18.67NS 128.73 152.78 24.05∗∗
Insecticide expenditureto total cost ofcultivation (%)
39.70 42.73 3.03 30.26 34.76 4.50
Average seed cottonyield (kg/ha)
1749 1704 045NS 2300 2209 091NS
Average net income($ US)a
414.00 406.44 7.56 431.10 388.00 43.11
Output/input ratio NA NA – 1.86 1.77 5.08Adoption of sampling
for ETL(% farmers)b0 0 – 34 0 34
NS = Non significant, ∗Significant at p < 0.05, ∗∗Significant at p < 0.01. Two sample t testapplied for testing the level of significance, NA = Data not available.a At 2005 rates 1US $ = 45 Indian rupees.b Adoptability2 of sampling for ETL is low in Punjab.Source: After Peshin (2005).
tion of farmers, but the program was not implemented with active participation ofthe farmers for experiential learning of complex technologies like sampling etc.Farmers suggested that lecturing and street plays alone are not enough to makefarmers adopt complex IPM practices. To make farmers go beyond the lower levelof cognitive domain, i.e. knowledge to higher levels, mainly comprehension andapplication of the IPM technology, experiential learning of farmers is requiredto make them confident for the adoption of IPM system at farm level (Peshin,2005).
van de Fliert (1993) applied a case study method for evaluating IPM famer fieldschool in rice crop in Indonesia. The case study covered only four IPM and fourcomparison villages and it did not allow for generalization of the evaluation resultsacross the national IPM program implemented in Indonesia. The indicators of eval-uation were: implementation of IPM program as per the extension methodology offacilitation of farmers, improved knowledge on pest and natural enemy identifica-tion, changed perception of farmers with respect to pest occurrence, rice ecosystem
2 Adoptability is the likely adoption of IPM practices based on innovation attributes.

68 R. Peshin et al.
Table 2.9 Summary of evaluation results of IPM and non IPM farmers in two villages in CentralJava, Indonesia
Indicator Before training During training After one season After two seasons
IPMF NIPMF IPMF NIPMF IPMF NIPMF IPMF NIPMF
No. of pesticideapplications/season
1.4 1.5 0.7 1.5 0.8 1.3 0.3 0.8
No. of granularapplications/season
0.4 0.3 0.7 0.9 0.7 0.8 0.6 0.7
Farmers notusingpesticides (%)
2.6 31 41 19 46 24 50 43
Average insectcontrolcost(US $/haat 1996 rates,1$ = Rp1000)
16.0 11.0 9.0 15.5 9.0 10.5 4.5 9.5
Average yield(tons/ha)
5.38 5.11 5.77 4.64 3.70 3.11 6.38 5.68
N 44 134 48 129 46 120 42 115
IPMF = IPM farmers (farmers participating in season long farmer field school training program),NIPMF = non-IPM farmers, Rp = Indonesian currency.Source: After van de Fliert (1993)
management by farmers, improved skills in field monitoring, yields, lower expendi-ture on pest management, net returns on rice cultivation, diffusion of IPM practicesfrom trained farmers to other farmers. The IPM-FFS program resulted in gain inknowledge of farmers, reduced frequency of pesticide applications and insect pestcontrol costs and higher yield (Table 2.9).
2.7 Future of IPM Evaluation Research
Social scientists or extension scientists have a moral and sensible obligation toevaluate extension programs (Russ-Eft and Preskill, 2001). How IPM programswork to improve or change behavior of clients has not been practically shownby social scientists. Theory-driven evaluation has been suggested as an alterna-tive which stresses the role of social scientists in evaluation as well in plan-ning and designing of IPM programs. (Hilbert et al., 1997; Russ-Eft and Preskill,2001).
The input-process (outputs)-outcome-impact (IPOI model) based logic modelshould be used to design and conduct (Table 2.10) formative and summative evalu-ations of IPM programs. The input in terms of the resources (available time quality

2 Evaluation Research 69
Tab
le2.
10T
heor
yba
sed
logi
cm
odel
for
IPM
prog
ram
eval
uati
on
Syst
emA
ppro
ach
for
eval
uati
onof
IPM
prog
ram
sba
sed
onlo
gic
mod
el
INP
UT
S�
AC
TIV
ITIE
SO
RP
RO
CE
SS�
OU
TC
OM
E�
IMPA
CT
Met
hod
ofev
alua
tion
Inpu
tEva
luat
ion
Pro
cess
Eva
luat
ion
Out
com
eE
valu
atio
nIm
pact
Eva
luat
ion
Type
ofev
alua
tion
Form
ativ
eFo
rmat
ive
Sum
mat
ive
Sum
mat
ive
Res
earc
hde
-si
gnN
on-e
xper
imen
talr
esea
rch
desi
gnba
sed
onIP
Mth
eory
and
part
icip
ator
yev
alua
tion
mod
el
Qua
si-e
xper
imen
talr
esea
rch
and
non-
expe
rim
enta
lre
sear
chde
sign
s,in
-dep
thob
serv
atio
nan
din
terv
iew
ing
Qua
si-e
xper
imen
tala
ndno
n-ex
peri
men
tal
surv
eyde
sign
(Cri
tica
lmul
tipl
ism
mod
el)
Qua
si-e
xper
imen
tald
esig
nfo
rev
alua
ting
imm
edia
teim
pact
and
ex-p
ostf
acto
desi
gn(l
ongi
tudi
nal
stud
ies)
for
eval
uati
nglo
ng-t
erm
impa
ct
Tim
edi
men
sion
Wit
hIP
MT
1B
efor
eth
eIP
Mpr
ogra
m
Wit
h/W
itho
ut,B
efor
e/D
urin
gIP
MT
2D
urin
gth
eim
plem
enta
tion
ofIP
Mpr
ogra
m
Wit
h/W
itho
ut,B
efor
e/A
fter
IPM
T3
Att
heen
dof
IPM
prog
ram
Wit
h/W
itho
ut,B
efor
e/A
fter
IPM
T4
Ove
ra
peri
odaf
ter
IPM
prog
ram
Eva
luat
ion
indi
cato
rs1.
Eva
luat
ion
ofIP
Mte
chno
logy
�To
find
out
whe
ther
IPM
prac
tice
sfit
the
farm
erby
cond
ucti
ngpi
lots
tudi
es�
Ado
ptab
ility
ofIP
Mpr
ac-
tice
sin
term
sof
tech
nolo
g-ic
alat
trib
utes
�A
dapt
abil
ity
ofIP
Mpr
ac-
tice
s
2.E
valu
atio
nof
impl
emen
tatio
n(e
xten
sion
)m
etho
dolo
gy
3.In
put
eval
uati
onin
term
sof
hu-
man
reso
urce
s,av
aila
ble
budg
et,
etc.
Impl
emen
tati
onof
IPM
prog
ram
�A
ctiv
epa
rtic
ipat
ion
offa
rmer
san
dth
eir
reac
tion
sre
gard
ing
IPM
pro-
gram
�E
xper
ient
ial
lear
ning
offa
rmer
s,e.
g.ag
ro-e
cosy
stem
anal
ysis
,sam
-pl
ing
for
ET
L�
Dem
onst
rati
onof
IPM
tech
nolo
gyva
lida
ted
duri
ngin
pute
valu
atio
n�
Whe
ther
IPM
inte
rven
tion
yiel
dsde
sira
ble
chan
ges?
�C
ausa
lrel
atio
nshi
p
Out
com
eof
IPM
prog
ram
�G
ain
inco
gnit
ion
and
anal
yti-
cals
kill
s�
Cha
nge
inat
titu
de�
Ado
ptio
nof
IPM
prac
tice
sw
hich
have
been
iden
tifi
edat
inpu
teva
luat
ion
stag
e
Impa
ctof
IPM
prog
ram
�C
onti
nued
adop
tion
ofIP
Mpr
ac-
tice
s�
Red
ucti
onin
num
ber
ofpe
sti-
cide
appl
icat
ion
and
use
(tec
hnic
algr
ade
mat
eria
l)�
Red
ucti
onin
pest
icid
eex
pend
itur
e�
Incr
ease
dpo
pula
tion
ofna
tura
len-
emie
san
dre
duct
ion
inpo
pula
tion
ofin
sect
pest
s�
Red
ucti
onin
inse
ctic
ide
resi
stan
cein
inse
ctpe
sts
�H
ighe
rin
put/
outp
utra
tio
�M
ulti
plie
ref
fect
(far
mer
tofa
rmer
diff
usio
n)

70 R. Peshin et al.
of trainers and adoptability3/adaptability4 of IPM practices), processes or outputs(training intervention, implementation of IPM program, development and deliveryof educational materials, whether farmers are involved actively in experimenta-tion to develop adaptable practices, whether the farmers are provided experimentaltraining in agro-ecosystem analysis, use of sampling methods for determiningeconomic threshold level of pests for taking pest management decision). Processevaluation during program implementation is generally formative in nature but canalso be summative, e.g. if the stakeholders need to know about the actual deliveryof the program and its application by the farmers (Peshin, 2005) for justification ofprogram spending. Both quantitative5 and qualitative6 methods for data collectionshould be used. The outcomes in terms of immediate effects at farmers’ level shouldbe measured in terms of cognition of IPM practices, acquiring analytical skills anddeveloping favorable attitudes towards IPM, reduction in pesticide use by adoptionof IPM practices and use of pesticides based on (economic threshold level) ETL.Impacts in terms of long-term effects are continued adoption of IPM practices, re-duction in pesticide use, reduction in pesticide expenditure, increased populationof natural enemies and reduction in population of insect pests, reduction in insec-ticide resistance in insect pests, higher input/output ratio, multiplier effect (farmerto farmer diffusion).affecting a wider population including the non-beneficiaries.Measuring the impact of a program is complex and clear causal relationships areoften difficult to establish. Indicators for measuring impact of IPM program canbe increasing biodiversity, reduction in cancer deaths or other health hazards etc.Impact evaluation is summative in nature (Table 2.11).
The report of Working Group II regarding phases and indicators for evaluationsof impact concluded that evaluating the impact of agricultural technology is a chal-lenge, and evaluating the impact of an information-knowledge intensive technol-ogy such as IPM is even more challenging (Ortiz, 2001). The impact in terms ofincreased population of natural enemies and reduction in insect pest population,and insecticide resistance in insect pests should be studied and for that the evalu-ation studies have to incorporate an interdisciplinary approach to evaluation. Thesummary of the “First Workshop on Evaluation of IPM Programs” held at Han-nover in 1998 concluded that the impact evaluation requires several coordinatedsteps. “Different groups of IPM community, e.g. cost benefit analysis experts, plantprotection people, and others using different sets of methodologies to measure im-pact....., The first step is to clarify methodological issues within the disciplinarygroups” (Waibel et al., 1998, p. 60). The three working groups also identified the
3 Adoptability is the likely adoption of IPM practices based on innovation attributes. For detailsabout the methodology for working the adoptability refer Peshin (2009).4 Adaptability is whether the technology fits the farmer and can be modified for best fit.5 Quantitative data collection usually refers to hypotheses testing in quasi-experimental designs.Quantitative research deals with standardization, objectivity and reliability of measurement.6 Qualitative evaluation refers to first hand information (observation) as how IPM program isimplemented, the pattern of interactions between farmers and trainers. It is rich description ofprocesses rather than outcome of IPM programs.

2 Evaluation Research 71
Tab
le2.
11Ph
ases
and
indi
cato
rsfo
rim
pact
asse
ssm
ent
Phas
eN
eeds
and
oppo
rtun
ityas
sess
men
tTe
chno
logi
cal
optio
nsL
earn
ing
mod
elfo
r,an
din
tegr
atio
n,ad
apta
tion
ofop
tions
Impl
emen
tatio
nof
prot
ocol
s(p
ilots
cale
)
Type
ofas
sess
men
t�
PRA
�B
asel
ine
�G
IS�
Mod
elin
g
�Te
chno
logy
eval
uatio
n�
Mod
elin
g
�Te
chno
logy
eval
uatio
n�
Proc
ess
eval
uatio
n�
Impa
ctev
alua
tion
�M
odel
ing
�Pr
oces
sev
alua
tion
�Im
pact
eval
uatio
n�
GIS
�M
odel
ing
Indi
cato
rsN
atur
al�
Yie
ld�
Pest
leve
ls�
NE
activ
ity�
Pest
icid
elo
ad�
Soil
heal
th
�Y
ield
�Pe
stle
vels
�N
Eac
tivity
�In
dica
tors
ofpe
rfor
-m
ance
�Y
ield
�Pe
stle
vels
�N
Eac
tivity
�Y
ield
�Pe
sts
leve
l�
NE
activ
ity�
Pest
icid
elo
ad�
Soil
heal
thH
uman
�Pa
rtic
ipat
ion
�IP
Mkn
owle
dge
�IP
Msk
ills
�IP
Mpr
actic
e�
Hea
lth�
Gen
der
�Po
vert
y
�Pa
rtic
ipat
ion
�Fa
rmer
perc
eptio
n
�Pa
rtic
ipat
ion
�IP
Mkn
owle
dge
�IP
Msk
ills
�IP
Mpr
actic
e
�Pa
rtic
ipat
ion
�IP
Mkn
owle
dge
�IP
Msk
ills
�IP
Mpr
actic
e(a
dapt
atio
n,ad
optio
n,re
ject
ion)
�H
ealth
�G
ende
r�
Pove
rty
Soci
al�
Col
lect
ivity
�A
war
enes
s�
Reg
ulat
ory
�Fr
amew
ork
�C
olle
ctiv
ity�
Col
lect
ivity
�D
isse
min
atio
n�
Aw
aren
ess
�C
olle
ctiv
ity�
Dis
sem
inat
ion
�A
war
enes
s�
Reg
ulat
ory
fram
ewor
kFi
nanc
ial/p
hysi
cal
�Fa
rmec
onom
ican
alys
is�
Supp
ortin
gin
fras
truc
ture
�Fa
rmec
onom
ican
aly-
sis
�Fa
rmec
onom
ican
alys
is�
Farm
econ
omic
anal
ysis
�Su
ppor
ting
infr
astr
uctu
re�
Cos
t-be
nefit
san
alys
is
PRA
:Par
tici
pato
ryR
ural
App
rais
al,G
IS:G
eogr
aphi
cal
Info
rmat
ion
Syst
em,N
E:N
atur
alE
nem
ies.
Sour
ce:
Ort
iz(2
001)
.

72 R. Peshin et al.
Table 2.12 Indicators for household, village and national level impact of IPM program
Impact Level Indicators
Impact onregional,national andglobalinstitutionsand policies
Changes in policy formulation and implementation,network of influence, level of interaction with policydecision makers, IPM initiative: is itinstitutionalized?, change in the mission statements ofinstitutions, changes of role and responsibilities ofinstitutions, educational curricula, existence ofpolicies to support biological or IPM techniquesversus policies for pesticides, elimination of pesticidesubsidies (set of indicators), effectiveness of pesticidelegislation, structural change between institutions,responsiveness to farmers, changes in institutions(incentive structure), farmer social movements,evidence of acceptable good science, capacities forchange in extension approach, proportion of researchbudget for IPM, price premiums, evidence ofindependent policy analysis, incorporation ofeconomic instruments in crop protection policy, andexistence of policy workshop (who and how)
Workinggroup III
Village levelimpact
IPM and social diversity knowledge creation andsharing, durable institutional capacity, advocacy,scale effects, and extension community interactions
Workinggroup II
Farm householdlevel
Improved economic well being, adoption of newtechnologies and adaptation of technologies to localconditions, improved knowledge and analyticalcapacity, diffusion of knowledge farmer to farmer,decreased health risk, and healthier ecosystem
Workinggroup I
After: Waibel et al. (1998).
indicators of impact evaluation of IPM programs at country level, village level andfarm level (Table 2.12). The social scientists from the field of extension education,sociology, anthropology and economics, and biological scientists from entomology,plant pathology and agronomy must fine tune their evaluation methods to provideinternally and externally valid results for measuring the impact of IPM programs.They need to employ both quantitative and qualitative outcome measures as dis-cussed in this chapter. Quantitative methods are required to generalize and describecausal relationships (Cook, 1997) whereas qualitative methods are suited for de-scribing program processes (Kosloski, 2000). The internal and external validity ofthe evaluation results can be resolved by evaluation syntheses representing meta-analytical techniques. In meta-analytical techniques research results from differentindependent IPM studies will be converted to a common metric like pesticide use,pesticide expenditure, yield increase, knowledge gain, output/input ratio etc, andthen will be aggregated using different statistical techniques (Kosloski, 2000). How-ever, there is one drawback with a meta-analysis technique – the methodologicallimitations in the original IPM evaluation studies on which the syntheses are based(Figueredo, 1993). The meta-analysis of 25 impact evaluation studies carried outby van den Berg (2004) for global IPM facility has the limitation since many stud-ies are based on non-experimental designs and some suffer from internal validity

2 Evaluation Research 73
issues. Toovercome the underlying problem of external and internal validity basedon experimental and non-experimental evaluation, respectively, studies to measureoutcome and impact of the IPM programs should employ “critical multiplism” eval-uation technique (Shadish, 1993). The term “critical” refers to identifying biasesin the evaluation approach chosen by the researcher and to overcome it; the resultsof different evaluation studies on IPM (that are not homogenous) are synthesizedby avoiding constant bias. Research syntheses of different evaluation studies, pro-vided biases are identified in different approaches of evaluation, will allow gener-alizing the results by increasing external validity without reducing internal validity.A theory-driven approach to quasi-experimentation is futile unless it is demonstratedbeyond doubt that the IPM program was in fact implemented as intended at processevaluation stage. Quasi-experimentation at output evaluation stage cannot be ac-complished without doing process evaluation.
In response to social inquiry, evaluation should provide sound and accurateresults and in the interest of researchers, it should provide sufficient informa-tion so that the evaluation discipline continues to develop. Now evaluators havesound methodologies to critically analyze the evaluations. This process is calledmeta-evaluation. “Meta-evaluation is the process of delineating, obtaining, and ap-plying descriptive information and judgmental information about an evaluation’sutility, feasibility, propriety, and accuracy and its systematic nature, competence,integrity/honesty, respectfulness, and social responsibility to guide the evaluationand publicly report its strengths and weaknesses” (Stufflebeam, 2001). According toScriven (1999) meta-evaluation is the backbone of evaluation and it is the evaluationof evaluations themselves and should be done periodically. It has helped to resolvethe controversy over the priority about internal versus external validity. Accordingto Shadish (1998) meta-evaluation can be done at any stage of an evaluation, e.g.,from planning to the evaluation of completed evaluation reports. The applicationof a critical multiplism model which is based on syntheses of quasi-experimentaland non- experimental will allow the identification of biases in the evaluation ap-proach chosen by researcher. It will allow for synthesizing the results of differentevaluation studies on IPM, that are not homogeneous but are heterogeneous withrespect to source of bias and to avoid constant biases, and for generalizability ofevaluation findings (Kosloski, 2000). Research synthesis of quasi-experimental andnon experimental studies increases both internal and external validity of results.
2.8 Conclusion
Evaluation is an integral part of any development program and it should be plannedat the program designing stage to ensure that the evaluation will be useful for pro-gram management, improvement and accountability. This scientific feedback needsto be utilized for further improvement of programs and for decision making bystakeholders and policy makers. The desired as well as undesired consequence ofnew technologies needs to be measured as was not done during the green revolution

74 R. Peshin et al.
period that resulted in un-sustainability and over exploitation of natural resources.The worth of IPM technologies can not only be measured in terms of adoptionof IPM practices, reduction in pesticide use and increase in yields but it shouldconsider all aspects related to socio-economic development, health, sustainability,environment conservation etc. that will represent the true worth of IPM programs.Evaluation should be action oriented- that seeks solutions to problems of IPM dis-semination at implantation stage. The feedback needs to be made available to policymakers for further strengthening research as well as the extension of IPM programsand tapping government and non-governmental support in implementing IPM tech-nologies at farmers’ field for achieving the long-term sustainability of agro-ecosystems.
Acknowledgments We are grateful to Dr. Donna J. Peterson, the University of Arizona, USA forreviewing the chapter, and for her useful suggestions to improve the manuscript.
References
Alkin, M.C. and Christie, C.A. 2004. An Evaluation Theory Tree. http://www.sagepub.com/upm-data/5074 Alkin Chapter 2.pdf
Alvarez, P., Escarraman, V., Gomez E., Villar, A., Jimenez, R., Ortiz, O., Alcazar, J. andPalacios, M. 1996. Economic impact of managing sweetpotato weevil (Cylas formicarius) withsex pheromones in the Dominican Republic. In Walker, T. and Crissman, C. (eds), Case Studiesof the Economic Impact of CIP-Related Technology. Lima, Peru: International Potato Centerpp. 83–93.
Bailey, S.J. and Deen, M.Y. 2002. A framework for introducing program evaluation toextension faculty and staff. Journal of Extension [On-line] 40(2). Available at: http://www.joe.org/joe/2002April/iwl.html
Bell, J. 1983. Contemporary Social Welfare, Macmillan, New York. (Original not seen. Cited byPatton, M.Q. 1997. Utilization Focused Evaluation. Sage, Thousand Oaks).
Bennett, C. 1975. Up the hierarchy. Journal of Extension 75(2):7–12. Available:http://www.joe.org/joe/1975march/1975-2-a1.pdf
Bickman, L. 1987. The functions of program theory. In Bickman, L. (ed) Using Program Theoryin Evaluation. Jossey Bass Inc., Publishers, San Francisco pp. 5–18.
Buck, A. 2002. Participatory evaluation of farmers’ perceptions about impact from Farmer FieldSchools: Case study Province San Miguel, Peru. Thesis for the degree of Agricultural Engineer.Technical University of Munich.
Campbell, D.T. and Stanley, J.C. 1963. Experimental and Quasi-Experimental Designs for Re-search. Rand McNally, Chicago.
Campbell, D. and Stanley, J.C. 1966. Experimental and Quasi-Experimental Designs for Research.Rand McNally, Chicago.
Chambers, F. 1994. Removing confusion about formative and summative evaluation: Purpose ver-sus time. Evaluation and Program Planning 17(1):9–12.
Chelimsky, E. 1997. The coming transformation in evaluation. In Chelimsky, E. and Shadish,W. (eds), Evaluation for the Twenty-first Century-A Handbook. Sage Publication Inc.California.
Chen, H.-T. 1990. Theory-Driven Evaluations. Sage Publications, Newbury Park, CA.Chen, H. 1994. Current trends and future directions in program evaluation. Evaluation Practice
15(3):229–238.

2 Evaluation Research 75
Chen, H. and Rossi, P. 1983. Evaluating with sense: The theory-driven approach. Evaluation Re-view 7:283–302.
Cook, T. 1997. Lessons learned in evaluation over past 25 years. In: Chelimsky, E. and Shadish,W. (eds), Evaluation for the Twenty- First Century. Sage, Thousand Oaks, California.
Davidson, E. J. 2006. The “Baggaging” of Theory-Based Evaluation. http://evaluation.wmich.edu/jmde/
Donaldson, S. I. 2001. Mediator and moderator analysis in program development. In Sussman,S. (ed), Handbook of Program Development for Health Behavior Research. Sage Publication,Newbury Park, CA pp. 470–496.
Douglah, M. 1996. Developing a concept of Extension Program Evaluation (G 3658-7) Pro-gram Development and Evaluation. University of Winconsin-Extension (http://learningstore.uwex.edu/pdf/G3658-7.PDF)
Echols, G.W. and Soomro, M.H. 2005. Impact of the FAO-EU IPM program for cotton in Asia onthe environment. In: Ooi, P.A.C., Praneetvatakul, S., Waibel, H. and Echols, G.W. (eds), TheImpact of the FAO-EU IPM Program for Cotton in Asia. A Publication of the Pesticide PolicyProject Hannover, Special Issue Publication Series, No. 9
Feder, G. and Quizon, J.B. 1998. Integrated pest management (IPM) in Asia: Are there real returnsto IPM and its diffusion? In Waibel, H., Fleischer, G., Kenmore, P.E., and Feder, G. (eds),Evaluation of IPM programs-Concepts and Methdologies. A Publication of the Pesticide PolicyProject Hannover, April 1999 Publication Series No. 8
Feder, G., Murgai, R. and Quizon, J.B. 2004. Sending farmers back to school: The impact of farmerfield school in Indonesia. Review of Agricultural Economics 26:45–62.
Fetterman, D.M. 2001. Foundations of Empowerment Evaluation. Sage Publications, Inc. Thou-sand Oaks, California.
Figueredo, A. 1993. Critical multiplism, metaanalysisd and generalization: An Integrative Com-mentary. In: Sechrest, L. (ed), Program Evaluation: A pluralistic Enterprise (New Directionsto program evaluation, No. 60). Jossey Bass, San Francisco.
Godtland, Sadoulet, E.E., de Janvry, A., Murgai, R. and Ortiz, O. 2004. The impact of farmerfield-schools on knowledge and productivity: A study of potato farmers in the Peruvian Andes.Economic Development and Cultural Change 53(1):63–92.
Hilbert, J., Russ-Eft, D. and Preskill, H. 1997. Evaluating training. In Russ-Eft, D. (ed), Whatworks: Assessment, development, and measurement. ASTD, lexandria, VA. 109–150
Indicators for the Evaluation of the EU’s Rural Devlopment Programs Task 1–5, Final Re-port (18th November 2005) AGRI/2004/G2/12. http://ec.europa.eu/agriculture/eval/reports/indicator rd/index en.htm)
Jayaratne, K.S.U. 2007a. Collecting evaluation data. Program Evaluation Institute. North CarolinaState University Extension, Raleigh, NC.
Jayaratne, K.S.U. 2007b. Evaluation tools. Program Evaluation Institute. North Carolina StateUniversity Extension, Raleigh, NC.
Jiggins, J.L.S. 2002. New approaches to evaluation. International learning workshop onfarmer field schools (FFS): Emerging issues and challenges, 21–25 October 2002,Yogyakarta.
Joint Committee on Standards for Educational Evaluation. 1994. The Program EvaluationStandards: How to Assess Evaluations of Educational Programs (2nd ed.). Sage Publica-tions, Thousand Oaks, CA. (http://en.wikipedia.org/wiki/Joint Committee on Standards forEducational Evaluation)
Kalpan, A. 1994. The Conduct of Inquiry. Chandler, San Francisco.Khan, M.A. and Ahmad, I. 2005. Impact of FFS-based IPM knowedge and pratices on rural povery
reduction: Evidence from Pakistan. In: Ooi, P.A.C., Praneetvatakul, S., Waibel, H. and Echols,G.W. (eds), The Impact of the FAO-EU IPM Program for Cotton in Asia. A Publication of thePesticide Policy Project Hannover, Special Issue Publication Series, No. 9
Khan, M.A., Ahmad, I. and Echols, G.W. 2005. Impact of an FFS based IPM approach onfarmer capacity, production practices and income: Evidence from Pakistan. In: Ooi, P.A.C.,

76 R. Peshin et al.
Praneetvatakul, S., Waibel, H. and Echols, G.W. (eds), The Impact of the FAO-EU IPM Pro-gram for Cotton in Asia. A Publication of the Pesticide Policy Project Hannover, Special IssuePublication Series, No. 9
Kosloski, K. 2000. Evaluation research. Encyclopedia of Sociology 1. Macmillan, New Yorkpp. 861–869.
Lazarsfeld, P. F. and Rosenburg, M. 1955. The Language of Social Research. (Original not seen.Cited by Shadish W.R., Cook T.D. and Laviton L.C. Foundation of Program Evaluation. Sage,Newburg Park, USA).
Lewin, K. 1948. Resolving Social conflicts: selected papers on group dynamics. (Original notseen. Cited by Shadish, W.R., Cook, T.D. and Laviton, L.C. 1995. Foundation of ProgramEvaluation. Sage, Newburg Park, USA).
Madaus, G.F., Scriven, M. and Stufflebeam, D.L. 1991. Evaluation Models. Kluwe-Nijhoff Pub-lishing, USA.
Mancini, F. van Bruggen, A.H.C. and Jiggins, J.L.S. 2006. Evaluating cotton integrated pest man-agement (IPM) Farmer field school outcomes using the sustainable livelihood approach in In-dia. Experimental Agriculture 43:97–112.
Mancini, F., Termorshuizen, A.J., Jiggins, J.L.S. and van Bruggen, A.H.C. 2008. Increasing theenvironmental and social sustainability of cotton farming through farmer education in AndhraPradesh, India. Agricultural Systems 96:16–25.
Maza, N., Morales, A., Ortiz, O., Winters, P., Alcazar, J. and Scott, G. 2000. Impacto del manejointegrado del tetuan del boniato (Cylas formicarius) en Cuba. Lima, Peru. Instituto de Investi-gaciones en Viandas Tropicales (INIVIT). Centro Internacional de la Papa (CIP)
Neuman, W.L. 2000. Social Research Methods- Qualitative and Quantitative Approaches (4th ed.).Allyn and Bacon, London, UK.
Ortiz, O. 1997. The Information System for IPM in Subsistence Potato Production in Peru: Ex-perience of Introducing Innovative Information in Cajamarca Province. PhD dissertation. De-partment of Agricultural Extension and Rural Development. The University of Reading, Read-ing, UK
Ortiz, O. 2001. Workshop on Assessing the Impact of Participatory Research and Extension Meth-ods in IPM-Reports of Working Groups (first draft), Nairobi 15–17 March, 2001, Nairobi.
Ortiz, O., Alcazar, J., Catalan, W., Villano, W., Cerna, V., Fano, H. and Walker, T. 1996. Economicimpact of IPM practiceson the Andean potato weevil in Peru. I. In Walker, T. and Crissman, C.(eds), Case Studies of the Economic Impact of CIP-Related Technology. International PotatoCenter Lima, Peru. pp. 95–110.
Ortiz, O., Garret, K.A., Heath, J.J., Orrego, R. and Nelson, R. 2004. Management of potato lateblight in the Peruvian Highlands: Evaluating the benefits of farmer field schools and farmerparticipatory research. Plant Disease 88(5):565–571.
Patton, M.Q. 1997. Utilization-focused Evaluation: The New Century Text. Sage Publications,Thousand Oaks, CA.
Peshin, R. 2005. Evaluation of the Dissemination of Insecticide Resistance Management Programin Cotton in Punjab. Ph.D Dissertation, Punjab Agricultural University, Ludhiana, India.
Peshin, R. 2009. Evaluation of Insecticide Resistance Management Program: Theory and Practice.Daya publishers, New Delhi (In Press).
Peshin, R. and Kalra, R. 1998. Integrated pest management at farmer’s level. Man and Development22:137–141.
Petheram, R.J. 1998. Review of Evaluation in Agricultural Extension. Rural Industries Researchand Development Corporation, Kingston. http://www.rirdc.gov.au
Pimentel, D. 2005. Environmental and economic costs of the application of pesticides primarily inthe United States. Environmental Development and Sustainability 7:229–252.
Posavac, E.J. and Carey, R.G. 1989. Program Evaluation, Methods and Case Studies. PrenticeHall, Englewood Cliff, New Jersey.
Powell, E.T., Steel, S. and Douglah, M. 1996. Planning a Program Evaluation: Program De-velopment and Evaluation. University of Wisconsin-Extension (http://learningstore.uwex.edu/pdf/G3658-1.PDF)

2 Evaluation Research 77
Praneetvatakul, S., Echols, G.E. and Waibel, H. 2005. The costs and benefits of the FAO-EUIPM program for cotton in Asia. In: Ooi, P.A.C., Praneetvatakul, S., Waibel, H. and Echols,G.W. (eds), The Impact of the FAO-EU IPM Program for Cotton in Asia. A Publication of thePesticide Policy Project Hannover, Special Issue Publication Series, No. 9
Pretty, J.N., Brett, C., Gee, D., Hine, R.E., Mason, C.F., Morison, J.I.L., Raven, H., Rayment,M.D. and van der Bijl, G. 2000. An assessment of the total external costs of UK agriculture.Agricultural Systems 65:113–136.
Reddy, V.S. and Suryamani, M. 2005. Impact of Farmer field school approach on acquisition ofknowledge and skills by farmers about cotton pests and other managmement practices: Evi-dence from India. In Ooi, P.A.C., Praneetvatakul, S., Waibel, H. and Echols, G.W. (eds), TheImpact of the FAO-EU IPM Program for Cotton in Asia. A Publication of the Pesticide PolicyProject Hannover, Special Issue Publication Series, No. 9
Rogers, P.J., Petrosino, A., Huebner, T.A. and Hacsi, T.A. 2000. Program theory evaluation: prac-tice, promise, and problems. In Hacsi, T.A. (ed.), Program Theory in Evaluation: Challengesand Opportunities. Jossey-Bass, San Francisco, pp. 5–13
Rossi, P.H. and Freeman, H.E. 1993. Evaluation (5th ed.). Sage, Newbury Park, California, p. 5Rossi, P.H., Freeman, H.E. and Write, S.R. 1979. Evaluation: A Systematic Approach. Sage Pub-
lishers, Bawerly Hills, London.Russ-Eft, D., and Preskill, H. 2001. Evaluation in Organizations. Perseus Publishing, Cambridge,
Massachusetts.Rutman, L. 1984. Evaluation Research Methods. Sage, New bury park, California, p. 10.Scheirer, M.A. 1994. Designing and using process evaluation. In Wholey, J.S., Hatry, H. and
Newcomer, K. (eds), Handbook of Practical Program Evaluation. Josey Bass, San Francisco.pp. 40–68.
Scriven, M. 1967. The methodology of evaluation. In: Stake, R.E. (ed), Curriculum Evaluation.Chicaogo USA: Rand McNally.
Scriven, M. 1991. Evaluation Thesaurus (4th ed.). Sage, New-bury Park, California, USA.Scriven, M. 1999. The nature of evaluation part i: Relation to psychology. Practical As-
sessment, Research & Evaluation 6(11). Retrieved April 15, 2008 (http://PAREonline.net/getvn.asp?v=6&n=11).
Shadish, W.R. 1993. Critical multiplism: A research strategy and its attendant tactics.In: Sechrest, L. (ed), Program Evaluation: A Pluralistic Enterprise, Jossey-Bass., SanFrancisco.
Shadish, W. 1998. Some evaluation questions. Practical Assessment, Research & Evaluation 6(3).Available online: http://pareonline.net/getvn.asp?v=6&n=3
Shadish, W., Cook, T.D. and Leviton, L.C. 1991. Foundations of Program Evaluation: Theoriesand Practice. Sage Publications, Newbury Park, CA.
Shadish W.R., Cook, T.D. and Leviton, L.C. 1995. Foundations of Program Evaluation. Sage,Newbury Park, California, USA.
Sikora, E.J., Zehnder, G.W., Kemble, J.M., Goodman, R., Andrianifahanana, M., Bauske, E.M. andMurphy, J.F. 2001. Tomato IPM field demonstrations in Alabama. Journal of Extension (39)2,Retrieved May 27, 2008, from http://www.joe.org/joe/2001april/iw6.html
Singh, R. 1975. An optimum stratification for proportional allocation. Snakhya. Inidian Journal ofStatistical Series Part I, 37:109–115.
Stufflebeam, D.L. 2001. The meta-evaluation imperative. American Journal of Evaluation22(2):183–209.
Stufflebeam, D.L. 2003. The CIPP model for evaluation. Presented at the 2003 An-nual Conference of the Oregon Program Evaluators Network (OPEN). Portland, Oregonhttp://www.wmich.edu/evalctr/pubs/CIPP-ModelOregon10-03.pdf
Taylor, D.B. 1976. Eney, meeny, miney meaux: Alternative evaluation Models. North Central As-sociation Quarterly 50:353–358.
Tyler, R.W. 1942. General statement on evaluation. Journal of Educational Research 35:492–501.

78 R. Peshin et al.
Tyler, R.W. 1967. Changing the concept of educational evaluation. In Stake R. E. (ed), Perspectivesof Curriculum Evaluation. Rand McNally, New York.
van den Berg, H. 2004. IPM Farmer Field School: A Synthesis of 25 Impact EvaluationStudies. Wageningen University, Prepared for the Global IPM facility. http://www.fao.org/docrep/006/ad487e/ad487e00.htm
van den Berg, H. and Jiggins, J. 2007. Investing in farmers–the impacts of farmer field schools inrelation to integrated pest management, World Development 35:663–686.
van de Fliert E. 1993. Integrated Pest Management: Farmer Field School Generate SustainablePractices. Wageningen Agricultural University Papers 93.3
Waibel, H., Fleischer, G., Kenmore, P.E. and Feder, G. 1998. (eds), Evaluation of IPM Programs:Concept and Methodologies. Papers presented at the first workshop on evaluation of IPM pro-grams, Hannover, A publication of the pesticide policy project, Publication series no. 8.
Weiss, C.H. 1998. Evaluation: Methods for studying Programs and Policies (2nd ed.). PrenticeHall, New Jersey, USA.
Worthen, B.R., Sanders, J.R. and Fitzpatrick, J.L. 1997. Program Evaluation: Alternative Ap-proaches and Practical Guidelines. Longman, New York.
Wu, L., Praneetvatakul, S., Wiabel, H. and Wang, L. 2005. The impact of FFS on yield, pesticidecost and gross margin in Shadong Province, P. R. China: an econometric appraoch. In: Ooi, P.A.C., Praneetvatakul, S., Waibel, H. and Echols, G.W. (eds), The Impact of the FAO-EU IPMProgram for Cotton in Asia. A Publication of the Pesticide Policy Project Hannover, SpecialIssue Publication Series, No. 9
Yamazaki, S. and Resosudarmo, B.P. 2007. Does sending farmers back to school have an impact? Aspatial econometric approach. Working Papers in Trade and Development, Working paper no.2007/03, Division of Economics, Research school of Pacific and Asian Economics, ANU Col-lege of Asia and Pacific. http://rspas.anu.edu.au/economics/publish/papers/wp2007/wp-econ-2007-03.pdf
Yang, P., Wu, L., Wang, L. Xia, J. and Li, X. 2005. IPM-FFS traininng is crucial for sustainingBt cotton- A case study form Hubei Province, P.R. China. In: Ooi, P.A.C., Praneetvatakul, S.,Waibel, H. and Echols, G.W. (eds), The Impact of the FAO-EU IPM Program for Cotton inAsia. A Publication of the Pesticide Policy Project Hannover, Special Issue Publication Series,No. 9.

Chapter 3Protocol for Economic Impact Evaluationof IPM Programs
George W. Norton and Scott M. Swinton
Abstract The purpose of this chapter is to describe steps that can be followed toassess economic impacts of IPM. These steps are well established for evaluatinguser and society level profitability. The protocol is less agreed upon for evaluatingthe economic value of health and environmental impacts, but this chapter highlightssteps in applying a non-market valuation technique for that purpose. Economicimpacts of IPM are felt by IPM users, members of their households, and societyat large. IPM programs are undertaken to provide information to users, scientists,funding agencies, and the general public. Prior to any economic impact assessment,it is necessary to define the principal audience(s) and the types of impact of interest.Once that is accomplished, a protocol can be followed for economic assessment ofIPM impacts that includes five components: (1) defining IPM measures, (2) measur-ing IPM adoption, (3) assessing user-level economic effects, (4) assessing marketeffects, and (5) estimating health and environmental (non-market) impacts. We de-scribed these components and then indicate briefly a process for assessing impactsof IPM on poverty. A sample budget form, baseline survey questionnaire, and aspreadsheet for calculating economic surplus are provided. A model is describedfor assessing the extent of IPM adoption.
Keywords Economic impact evaluation · IPM · baseline survey
3.1 Introduction
The purpose of this chapter is to describe a basic protocol or set of steps thatcan be used to assess economic impacts of IPM. Several book chapters and othersources are available that summarize methods for evaluating economic impacts ofintegrated pest management (IPM) (Fernandez-Cornejo, 1998; Norton and Mullen,1994; Norton et al., 2005; Swinton and Norton, 2009). However, few sources
G.W. Norton (B)Agricultural and Applied Economics, Virginia Polytechnic Institute and State University, 205-BHutcheson Hall, Blacksburg, VA, 24061, USAe-mail: [email protected]
R. Peshin, A.K. Dhawan (eds.), Integrated Pest Management: Disseminationand Impact, DOI 10.1007/978-1-4020-8990-9 3,C© Springer Science+Business Media B.V. 2009
79

80 G.W. Norton and S.M. Swinton
provide information on the steps involved, including a sample survey form, spread-sheet, and budget form. Steps are well established for evaluating user and societylevel profitability. For evaluating the economic value of health and environmentalimpacts, methods employed have been diverse, and this chapter highlights steps ina specific non-market valuation approach.
Economic impacts of IPM are felt by IPM users, members of their households,and society at large. IPM programs are implemented to meet economic, health, andenvironmental objectives, and impact evaluations of IPM programs are undertakento provide information to users, scientists, funding agencies, and the general pub-lic. Prior to an economic impact assessment, it is necessary to define the principalaudience(s) and the types of impact of interest. For purposes of this chapter, weassume the primary audience includes IPM scientists and administrators of fundingagencies, and that economic impacts on users and society in general are of interest.Our protocol for economic assessment of IPM impacts includes five tasks: (1) defin-ing IPM measures, (2) measuring IPM adoption, (3) assessing user-level economiceffects, (4) assessing market effects, and (5) estimating health and environmental(non-market) impacts. We also highlight a process for assessing impacts of IPM onpoverty.
3.2 Define IPM Measures
IPM involves individual pest management practices as well as strategies that in-clude combinations of practices or tactics. Virtually all IPM practices are aimed atmanaging pests and improving economic efficiency for their users, since few IPMtactics are subsidized and thus must be profitable if they are to be adopted. However,some tactics are more directly aimed at achieving health or environmental goals thanare others. This multiplicity of IPM tactics and their uneven contributions to goals,creates a need to clearly define the measures of IPM to be evaluated.
Defining IPM measures means identifying the individual IPM tactics and thengrouping them into levels of IPM adoption (e.g., Rajotte et al., 1985; Vandemanet al., 1994; Benbrook, 1996), or assigning points to individual practices to derivea continue scale of IPM adoption (e.g., Hollingsworth et al., 1992). Scientists andothers can provide information to help group or score tactics so that higher levelsrepresent progress in achieving IPM goals.
The definition of IPM levels varies across program, but an impact assessmentbegins by defining the boundaries in time and space where the program is fairlyhomogeneous. Scientists, extension workers, and others can help identify the tacticsand levels. The more data that is supplied by scientists with respect to the effectsof these tactics on production or pesticide use, the easier it is to group or scorethem. Even with accurate data, groupings will differ depending on implicit weightsattached to economic efficiency (income) versus environmental goals. It makes littledifference if IPM tactics are grouped or scaled, but the make-up of the stakeholderswho do the grouping or scaling can influence results because of differing weightsapplied to the two primary IPM goals.

3 Protocol for Economic Impact Evaluation of IPM Programs 81
3.2.1 Measure IPM Adoption
Once specific IPM tactics and their time and space boundaries have been defined,IPM adoption can be measured, or in some cases, projected. While expert opinioncan also be used for this purpose, it is best to conduct a survey of users or potentialusers. Optimally, a baseline survey is conducted at the start of a program and againat the time of evaluation. This comparison over time facilitates attribution of IPMadoption to an IPM program. If a baseline does not exist, it is still possible to conducta survey and compare adopters with non-adopters using data from one point in timein a statistical regression analysis.
An example of a baseline survey that was applied in a tomato IPM programevaluation in Mali is included in Appendix. Although a baseline survey needs to beadapted to each program, the types of questions included in Appendix are illustra-tive. Questions are included in the survey for different purposes. Questions relatedto user and farm characteristics prove helpful in analyzing factors that affect IPMadoption. Often an adoption analysis is needed not only to attribute IPM adoptionto a particular program, but to predict future adoption of IPM practices as well.
A typical adoption model might be as follows: IPM Adoption = f (age, educa-tion, land tenure, income, distance to market, member of farm organization, IPMtraining). The IPM adoption measure may be a single practice, group of practices,or another measure of the degree of IPM adoption. If a variable such as IPM trainingis included, it is usually necessary to estimate a second regression to control for thefact that participation in the training program may not be random. Unless the factthat those who participate may be different from those who do not, the results of theIPM adoption regression may be biased. The second regression might be as follows:IPM training participation = f (producer characteristics, location).
The results of this second regression are used to generate a predicted IPM train-ing participation variable which is used in the first adoption regression in placeof the simple IPM training variable (Feder et al., 2004). An example of this typeof analysis is found in Mauceri et al. (2007). The model can be estimated us-ing an instrumental variables technique. The participation regression can be esti-mated as a probit or logit model due to binary or grouped nature of the dependentvariable.
Not only might this type of adoption model explain the impact of IPM partic-ipation, but it can be used to predict the adoption of a new IPM technique if it issimilar to a previous IPM technique. An example is found in Moyo et al. (2007)who predict adoption of a disease resistant variety by income level of farmers basedon estimated adoption of a previous variety.
3.2.2 Assess User Level Effects
Costs and returns per unit area and per enterprise change with IPM adoption. Bud-gets are commonly used to assess those changes. Data are required on inputs, out-puts, and prices. Budgets for pest management alternatives can be compared using

82 G.W. Norton and S.M. Swinton
Table 3.1 Budget per unit of area (hectare)
Price or cost Value or cost
Units per unit Quantity
Receipts—————————– ——— ——— ——— ————————————– ——— ——— ——— ———Variable costs—————————– ——— ——— ——— ————————————– ——— ——— ——— ———Income above variable costsFixed costs—————————– ——— ——— ——— ————————————– ——— ——— ——— ———Total costs ——— ——— ——— ———Income above total costs
data from replicated on-farm experiments or from user surveys. When using experi-mental data, budgets may incorporate only those costs that differ across treatments,and results are subjected to analysis of variance to test for significant differencesin mean profitability by treatment (Swinton et al., 2002). By developing a budgetfor each level of adoption, changes in net returns can be linked to levels of IPMadoption. An example of a form that can be used to construct an enterprise budgetfor each level of IPM adoption is presented in Table 3.1.
Results of budgeting analysis can be used by scientists and others to judge theprofitability of practices they are developing or recommending to farmers, or ofpractices already adopted. A second major use of budget information is as an inputinto a market or societal level assessment of the economic benefits and costs of anIPM program.
3.2.3 Assess Market Level Effects
When many individuals adopt an IPM practice or program for a particular commod-ity, the resulting increase in production can affect the price of the commodity at themarket level. Therefore assessing aggregate economic impacts of IPM, requires amarket model that considers changes in costs, yields, prices, and the extent of IPMadoption. In addition, because the research and the adoption can occur over severalyears, and impacts that occur sooner are valued more than those that occur fartherin the future, impact analysis must also account for the timing of benefits and costsand discount them appropriately.
Two primary methods are used to account for these price and timing effects.The first method involves calculating changes in economic surplus, and the secondmethod involves incorporating those economic surplus changes in a benefit costanalysis. These methods are described in detail in Alston et al. (1995), and aresummarized in Norton et al. (2005) and Swinton and Norton (2009) as follows:In Fig. 3.1, S0 represents the supply curve before adoption of an IPM strategy,

3 Protocol for Economic Impact Evaluation of IPM Programs 83
Fig. 3.1 IPM benefitsmeasured as changes ineconomic surplus;Source: Norton et al. (2005)
d
a
b
c
Quantity
S0
Q0 Q1
S1
D
P0
Price
P1
0
R
and D represents the demand curve. The initial price and quantity are P0 and Q0.Suppose IPM leads to savings of R in the cost of production, reflected in a shiftdown in the supply curve to S1. This shift leads to an increase in production andconsumption of Q1 (by �Q = Q1 − Q0) and the market price falls to P1 (by�P = P0 − P1). Consumers are better off because they can consume more of thecommodity at a lower price. Consumers benefit from the lower price by an amountequal to their cost saving on the original quantity (Q0 × �P) plus their net benefitsfrom the gain in quantity consumed. Their total benefit is represented by the areaP0abP1.
Although they may receive a lower price per unit, producers may be better offtoo, because their costs have fallen by R per unit, an amount greater than the fall inprice. Producers gain the increase in profits on the original quantity (Q0 × (R−�P))plus the profits earned on the additional output, for a total producer gain of P1bcd.Total benefits are obtained as the sum of producer and consumer benefits.
The distribution of benefits between producers and consumers depends on thesize of the fall in price (�P) relative to the fall in costs (R) and on the nature ofthe supply shift. For example, if a commodity is traded and production in the areaproducing the commodity has little effect on price, most of the benefits would accrueto producers. If the supply curve shifts in more of a pivotal fashion as opposed toa parallel fashion as illustrated in Fig. 3.1, the benefits to producers would be re-duced. Examples of IPM evaluation using the economic surplus approach are foundin Napit et al. (1988).
Formulas for calculating consumer and producer gains for a variety of marketsituations are found in Alston et al. (1995). For the closed economy market (notrade) in Fig. 3.1, the formula to measure the total economic benefits to producersand consumers, is KP0Q0(1 + 0.5Zn), where: K = the proportionate cost change,P0 = initial price, Q0 = initial quantity, Z = Ke/(e + n), e = the supply elastic-ity, and n = the absolute value of the demand elasticity. Other formulas would be
84 G.W. Norton and S.M. Swinton
appropriate for other market situations. For the small open economy model (trade,but no effect on world price), the measure of total economic benefits to producersand consumers is KP0Q0(1 + 0.5Ke).
These formulas can be placed in spreadsheets for the calculations. An exampleof a spreadsheet for the closed economy case is shown in Table 3.2. Benefits arecalculated year by year. The first column lists the year the benefits and costs oc-cur. Columns 2 and 3 list the elasticities of supply (e) and demand (n). Column 4gives the maximum proportionate yield change (%�Y) when the technology is fullyadopted. Column 5 divides the %�Y by the elasticity of supply to convert it to aproportionate change in cost per tonne. Column 6 gives the proportionate changein input cost per hectare and column 7 divides that cost change by 1 + %�Y toconvert the input cost change per hectare to an input cost change per tonne. Column8 subtracts the per tonne cost change from the per tonne yield change to give anet per unit cost change. Column 9 is used in cases where the research is not yetcomplete and it represents the probability of success with the research. Column10 is the adoption rate by year. Column 11 is the multiplication of the previousfour columns to give the per-unit cost reduction once the yield, cost, probability ofsuccess and adoption rates by year are taken into account. It is the proportionate shiftdown in the supply curve. Column 12 is the price of the commodity and column 13the quantity. Column 14 is the change in economic surplus per year. Column 15 isthe research costs per year and column 17 is the net of benefits minus costs.
In summary, the spreadsheet simply breaks down the formula to calculate changein economic surplus into parts and then combines them. The most difficult aspectof an economic surplus analysis is the calculation or prediction of the proportionateshift in supply following IPM adoption. Cost differences as well as adoption ratesmust be calculated. The producer surveys, information on cost and yield changes infield trials, and other methods discussed above can be used to obtain the informationrequired to estimate the supply shifts.
Once changes in economic surplus are calculated or projected over time, bene-fit/cost analysis can be completed in which net present values (NPV), internal ratesof return (IRR), or benefit cost ratios (BCR) are calculated. The benefits are thechange in total economic surplus calculated for each year, and the costs are thepublic expenditures on the IPM program. The primary purpose of the benefit/costanalysis is to take into account the fact benefits and costs need to be discounted,as the sooner they occur the more they are worth. The net present value (NPV) ofdiscounted benefits and costs can be calculated as follows:
NPV =T∑
t=1
Bt − Ct
(1 + i )t
where:
Bt = the benefit in year t (change in economic surplus)Ct = the cost in year t (the IPM program costs)i = the discount rate

3 Protocol for Economic Impact Evaluation of IPM Programs 85
Tab
le3.
2N
iger
iaca
ssav
a–
CM
Dre
sist
antv
arie
ty(c
lose
dec
onom
yas
sum
ptio
n)
Yea
re
nP
ropo
r.Y
ield
Cha
nge
Gro
ssP
ropo
r.C
ost
Cha
nge
Pro
por.
I.C
ost
Cha
nge
Per
Ha.
Pro
por.
I.C
ost
Cha
nge
Per
Ton
Net
Cha
nge
Pro
babi
lity
ofS
ucce
ssA
dopt
ion
Rat
eK
ZP
rice
$/m
tQ
uant
ity00
0mt
CT
S00
0$C
ost
000$
Net
Ben
efit
000$
2002
1.00
0.20
0.50
0.50
0.05
0.03
30.
467
0.90
0.00
0.00
00.
000
60.0
040
000
0.00
100
−100
2003
1.00
0.20
0.50
0.50
0.05
0.03
30.
467
0.90
0.00
0.00
00.
000
60.0
040
000
0.00
100
−100
2004
1.00
0.20
0.50
0.50
0.05
0.03
30.
467
0.90
0.00
0.00
00.
000
60.0
040
000
0.00
100
−100
2005
1.00
0.20
0.50
0.50
0.05
0.03
30.
467
0.90
0.00
0.00
00.
000
60.0
040
000
0.00
100
−100
2006
1.00
0.20
0.50
0.50
0.05
0.03
30.
467
0.90
0.00
0.00
00.
000
60.0
040
000
0.00
100
−100
2007
1.00
0.20
0.50
0.50
0.05
0.03
30.
467
0.90
0.00
0.00
00.
000
60.0
040
000
0.00
100
−100
2008
1.00
0.20
0.50
0.50
0.05
0.03
30.
467
0.90
0.00
0.00
00.
000
60.0
040
000
0.00
100
−100
2009
1.00
0.20
0.50
0.50
0.05
0.03
30.
467
0.90
0.02
0.00
80.
007
60.0
040
000
2017
450
2012
420
101.
000.
200.
500.
500.
050.
033
0.46
70.
900.
050.
021
0.01
860
.00
4000
050
488
5050
438
2011
1.00
0.20
0.50
0.50
0.05
0.03
30.
467
0.90
0.10
0.04
20.
035
60.0
040
000
1011
5250
1011
0220
121.
000.
200.
500.
500.
050.
033
0.46
70.
900.
200.
084
0.07
060
.00
4000
020
3011
5020
2961
2013
1.00
0.20
0.50
0.50
0.05
0.03
30.
467
0.90
0.30
0.12
60.
105
60.0
040
000
3055
7550
3055
2520
141.
000.
200.
500.
500.
050.
033
0.46
70.
900.
400.
168
0.14
060
.00
4000
040
8844
4088
4420
151.
000.
200.
500.
500.
050.
033
0.46
70.
900.
400.
168
0.14
060
.00
4000
040
8844
4088
4420
161.
000.
200.
500.
500.
050.
033
0.46
70.
900.
400.
168
0.14
060
.00
4000
040
8844
4088
4420
171.
000.
200.
500.
500.
050.
033
0.46
70.
900.
400.
168
0.14
060
.00
4000
040
8844
4088
4420
181.
000.
200.
500.
500.
050.
033
0.46
70.
900.
300.
126
0.10
560
.00
4000
030
5575
3055
7520
191.
000.
200.
500.
500.
050.
033
0.46
70.
900.
200.
084
0.07
060
.00
4000
020
3011
2030
1120
201.
000.
200.
500.
500.
050.
033
0.46
70.
900.
100.
042
0.03
560
.00
4000
010
1152
1011
5220
211.
000.
200.
500.
500.
050.
033
0.46
70.
900.
050.
021
0.01
860
.00
4000
050
488
5048
8

86 G.W. Norton and S.M. Swinton
The same spreadsheet that is illustrated in Table 3.2 can be used to calculate theNPV or IRR as these formulas are imbedded in the spreadsheet programs.
Aggregate or market level economic effects can be distributed in a variety ofways and have other social and economic effects across and within households. Forexample the formula ZP0Q0(1 + 0.5Zn) can be used to calculate consumer benefits,and producer benefits are simply total benefits minus consumer benefits.
3.2.4 Value Non-Market Effects
IPM practices may have health and environmental impacts that are not valued in themarket. Reporting on changes in use of pesticide active ingredients associated withchanges in pest management practices or in the number of pesticide applicationshave often been used to assess these types of impacts. However, specific pesticidesand how, when, and where they are applied affect health and the environment, thusrequiring a more refined approach.
Assessing physical and biological effects of pesticide use that occur under dif-ferent levels of IPM is difficult. In addition, pesticides have many distinct acute andlong-term effects on sub-components of health and the environment such as mam-mals, birds, aquatic life, and beneficial organisms. And, because the economic valueassociated with these effects is generally not priced in the market, it is difficult toknow how heavily to weight the various health and environmental effects comparedto one another and compared to income impacts.
Some impact assessments have used location-specific models that require de-tailed field information such as soil type, irrigation system, slope, and weather, andproduce information on the fate of chemicals applied (Teague et al., 1995). Butmany assessments of health and environmental effects have used non-location spe-cific models that require information only on the pesticides applied and the methodof application, and produce indicators of risks by health and environmental categoryas well as weighted total risk for the pesticide applications. Examples are the envi-ronmental impact quotient (EIQ) developed by Kovach et al. (1992), the PesticideIndex (PI) of Penrose et al. (1994), and a multi-attribute toxicity index developedBenbrook et al. (2002).
Each indexing method involves subjective weighting of risks across environmen-tal categories. These methods perform two tasks (Swinton and Norton, 2008): thefirst is to identify the risks of pesticides to the individual categories of health andthe environment, such as groundwater, birds, beneficial insects, and humans, and thesecond is to aggregate and weight those impacts across categories.
“The EIQ uses a discrete ranking scale in each of ten categories to identify asingle rating for each pesticide active ingredient (a.i.). The categories include acutetoxicity to non-target species (birds, fish, and bees), acute dermal toxicity, long termhealth effects, residue half-life (soil and plant surface), toxicity to beneficial organ-isms, and groundwater/runoff potential. The EIQ groups the ten categories into threebroad areas of pesticide action: farm worker risk, consumer exposure potential, andecological risk. The EIQ is then calculated as the average impact of a pesticide

3 Protocol for Economic Impact Evaluation of IPM Programs 87
AI over these three broad areas, and is reported as a single number” (Swinton andNorton).
“The EIQ is defined for specific pesticide active ingredients. In order to assessthe actual damage from pesticide use on a specific field, the EIQ can be convertedinto a “field use rating.” If only one pesticide is a applied, this rating is obtainedby multiplying the pesticide’s EIQ by its percent a.i. and by the rate at which thepesticide was applied.
Benbrook et al. (2002) developed an indexing method to monitor progress inreducing the use of high risk pesticides. For pesticides used in Wisconsin potato pro-duction, multi-attribute toxicity factors were calculated that reflect each pesticide’sacute and chronic toxicity to mammals, birds, fish and small aquatic organisms, andcompatibility with bio-intensive integrated pest management. These factors weremultiplied by the pounds of active ingredients of the pesticides applied to estimatepesticide-specific toxicity units. These units can be tracked over time or related touse of IPM” (Swinton and Norton, 2009)
One mechanism that can be used to reduce the subjectivity on the weights usedin multi-attribute indexing methods is to elicit information on individuals’ willing-ness to pay for risk reduction for the various health and environmental categories.Because there is usually no market price for reduced health and environmental risk,alternative monetary valuation techniques are needed such as contingent valuation(CV), and experimental auctions, and hedonic pricing (Freeman, 2003; Champ et al.,2003).
Contingent valuation uses a survey to collect data on people’s stated willingnessto pay (WTP) to receive a benefit or their willingness to accept compensation fora loss. In the context of pest management, respondents might be asked how muchthey would be willing to pay to reduce the risk of pesticides to various categories ofhealth and environment. The WTP data could then be linked to pesticide use data toarrive at a value for a change in pesticide use (Higley and Wintersteen, 1992; Mullenet al., 1997; Swinton et al., 1999; and Cuyno et al., 2001).
From the Cuyno et al. study on onion IPM in the Philippines, assessing changesin pesticide risks involved several steps. First, the environment was classified intoimpact categories. Second, risks posed by individual pesticide active ingredientswere assessed for each category. Third, the degree of IPM adoption was defined.Fourth, the effects of IPM adoption on pesticide use were estimated. Fifth, will-ingness to pay for risk reduction was obtained from a survey of residents in sixvillages. Sixth, information on risk reduction information and on willingness to paywas combined.
Environmental categories used by Cuyno et al. included the types of non-targetorganisms affected – humans (chronic and acute health effects), other mammals,birds, aquatic species, and beneficial insects. Risks posed by specific pesticides ap-plied to onions in the region were assessed by assigning one risk level for eachactive ingredient for each environmental category using a rating scheme partiallysummarized in Table 3.3.
Hazard ratings from previous studies were used as well as toxicity databases suchas EXTOXNET. Both toxicity and exposure potential were considered in arriving at

88 G.W. Norton and S.M. Swinton
Tab
le3.
3Pe
stic
ide
impa
ctsc
orin
gsy
stem
Impa
cts
Indi
cato
rsH
igh
Ris
k=
5M
oder
ate
Ris
k=
3L
owR
isk
=1
Hum
anH
ealt
hTo
xici
tyA
cute
Toxi
city
Pest
icid
eC
lass
(WH
OC
rite
ria)
Ia;I
bII
III
Sign
alW
ord
(EPA
Cri
teri
a)D
ange
r/Po
ison
War
ning
Cau
tion
Chr
onic
Toxi
city
Wei
ghto
fE
vide
nce
ofC
hron
icE
ffec
ts>
1Po
sitiv
eD
ata
Gap
Neg
ativ
eC
oncl
usiv
ePo
ssib
leIn
conc
lusi
veE
vide
nce
Prob
able
Evi
denc
eE
xpos
ure
Lea
chin
gPo
tent
ial
Gro
undw
ater
Ubi
quit
ySc
ore
GU
S>
2.8
.8>
GU
S>
2.8
GU
S<
1.8
Lea
chin
gPo
tent
ialS
core
Hig
hM
oder
ate
Low
Run
off
Pote
ntia
lN
o.of
Red
Flag
sE
xcee
ded
for
the
ffg:
>2
red
flags
1re
dfla
g0
red
flag
Soil
Ads
orpt
ion
(Koc
)>
300
Soil
1/2-
life
>21
days
Wat
erSo
lubi
lity
>30
ppm
Surf
ace
Los
sPo
tent
ial
Hig
hM
oder
ate
Low
Air
Con
tam
inat
ion
Hen
ry’s
Law
Con
stan
tPl
ace
ofA
ppli
cati
onA
eria
lC
rop/
Soil
Surf
ace
Soil
Food
Res
idue
sSy
stem
icit
ySy
stem
icN
on-s
yste
mic
Tim
eof
App
lica
tion
Post
-em
erge
ntPr
e-em
erge
ntPl
antS
urfa
ceR
esid
ueH
alf-
life
>4
wee
ks2–
4w
eeks
1–2
wee
ksA
quat
icSp
ecie
sTo
xici
ty95
hrL
C50
(fish
)m
g/L
Fish
/Oth
erA
quat
icSp
ecie
sTo
xici
ty>
10pp
m1–
10pp
m<
1pp
mE
xpos
ure
Run
off
Pote
ntia
lSco
reH
igh
Mod
erat
eL
ow

3 Protocol for Economic Impact Evaluation of IPM Programs 89
Tab
le3.
3(c
onti
nued
)
Impa
cts
Indi
cato
rsH
igh
Ris
k=
5M
oder
ate
Ris
k=
3L
owR
isk
=1
Ben
efici
alIn
sect
sTo
xici
tyB
enefi
cial
Eff
ects
Scor
e(B
EN
E)
BE
NE
>50
25<
BE
NE
<50
BE
NE
<25
Inse
ctTo
xici
tyR
atin
gsE
xtre
me/
Hig
hM
oder
ate
LO
W(1
)E
xpos
ure
Plan
tSur
face
Res
idue
Hal
f-li
fe>
4w
eeks
2–4
wee
ks1–
2w
eeks
(sam
eas
hum
anhe
alth
)
Mam
mal
ian
Ani
mal
sB
irds
Toxi
city
Bir
dto
xici
tyra
ting
sH
igh/
Ext
rem
eM
oder
ate
Low
8da
yL
C50
1–10
0pp
m10
0–10
00pp
m>
1000
ppm
Exp
osur
eSo
ilH
alf-
life
>10
0da
ys30
–100
days
<30
days
Plan
tSur
face
Hal
f-li
fe>
4w
eeks
2–4
wee
ks1–
2w
eeks
(Sou
rce:
Cuy
noet
al.,
2001
).

90 G.W. Norton and S.M. Swinton
the assigned risks for each of 44 pesticides. An overall eco-rating score was thencalculated with IPM adoption and without IPM adoption. The difference representsthe amount of risk avoided due to the program. The formula for the eco-rating was:ESij = (ISj) × (%AIi) × (Ratei), where ESij is the pesticide risk score for activeingredient i and environmental category j, ISj is the risk score for environmentalcategory j, %AI is the percent active ingredient in the formulation, and Ratei is theapplication rate per hectare.
Expected reduction in pesticide use as a result of adopting the IPM technologieswas based on experiments conducted in farmers’ fields. Willingness to pay for en-vironmental benefits of the onion IPM program were obtained through a CV surveyof 176 randomly selected farmers in the region. Farmers were asked to providewillingness-to-pay values for different formulations of their most commonly usedpesticides. Five formulations were offered, with one that avoids risk to each of thefive environmental categories. For example, farmers were asked whether they wouldpurchase their most commonly used pesticide, reformulated to avoid risk to humanhealth, at a series of prices (in 50 peso increments) higher than its existing price.The estimates of willingness to pay to avoid pesticide hazards to the various envi-ronmental categories were then adjusted downward by 30% to reflect the fact thatthe pesticides in the local area were applied 70% on onions during the dry season,and 30% on other crops, principally rice and other vegetables.
Reductions in pesticide hazards due to implementation of five IPM practices werecalculated by multiplying the risk score for each pesticide by the percent activeingredient, and then multiplying this result by the application rates per hectare, withand without the IPM practices. The percent reduction in this eco-rating hazard wasmultiplied by the willingness-to-pay value for each category to arrive at an economicbenefit per person. Aggregate benefits were obtained by multiplying the per personvalue by the number of people in the region.
3.2.5 Assess Poverty Impacts
In developing countries, the question that is often posed is not how much does anIPM program affect income, but how much does it affect poverty. IPM adoption canlower per-unit costs of production and out put price, increase the supply of foodproducts, and may or may not raise incomes of adopting producers. The poor cangain disproportionately as consumers from lower food prices, as they spend a highproportion of their income on food.
Economic surplus analysis can be combined with household-level data analy-sis to construct assess changes in poverty resulting from adopting IPM. The sur-plus analysis provides estimates of changes in prices and economic surplus. Thehousehold-level analysis uses information about changes in production costs as-sociated with IPM adoption and consumption patterns to infer household-specificchanges in income following adoption. Economic surplus can be assigned to indi-vidual producers and consumers. With appropriate survey weights, household in-come changes can be used to estimate changes in aggregate poverty. This method isdescribed in a paper by Moyo et al. (2007).

3 Protocol for Economic Impact Evaluation of IPM Programs 91
Analyses of predicted changes in poverty resulting from adoption of IPM involvethree main steps: (i) computing the household-level value of the welfare measure(income or consumption per capita) and comparing it to the poverty line; (ii) deter-mining which households did or are most likely to adopt the new IPM technologyand estimating how household welfare will change following adoption; and (iii)adding up the change in the number of poor people or households resulting fromadoption. The household analysis of income changes among adopting householdscan be used to create an estimate of market-level surplus changes (correspondingto the total change in income for all participants in the market) and of changes inpoverty in the population. Details of the procedures for this type of poverty analysisare described in Moyo et al. (2007) and are not repeated here.
3.3 Overview of Selected IPM Impacts from Previous Studies
The primary purpose of this chapter is to present a protocol for IPM impact assess-ment, not to summarize impact results. Nevertheless, it may be helpful to brieflyhighlight just a few results from previous studies. Most of the ex post impact as-sessments of IPM have occurred in the United States, although increasingly suchassessments are being completed in other countries as well as IPM spreads globally.Impacts of IPM on yields, pesticide use, and net returns estimated in publishedstudies were summarized in a presentation by Fernandez-Cornejo at the 5th NationalIPM Symposium in the United States in 2006 (Table 3.4).
In the 67 studies cited, pesticide use decreased in all but 11 cases, and net returnsper hectare increased in nearly all of them. Several studies also have estimated mar-ket level returns (e.g., Napit et al., 1988; Beddow, 2000; Debass, 2001; Moyo et al.2007). Napit for example found an internal rate of return on public investment inIPM in the United States of more than 100%. Beddow found a $7 million net presentvalue for the Pennsylvania sweet corn IPM program. Debass found a $14–29 millionbenefit for soil amendments as part of an IPM program in Bangladesh. Moyo found a$35–58 million return for Peanut IPM in Uganda. The list of such studies around theworld continues to grow. Fewer studies have estimated environmental benefits, butthat list as well continues to grow. Mullen et al. (1997) found annual environmentalbenefits of the peanut IPM program in Virginia of more than $800000. Cuyno et al.(2001) found annual environmental benefits of $150000 in six villages in the Philip-pines due to an onion IPM program. Beddow found $8 million in environmentalbenefits to the sweet corn IPM program mentioned above. One study, Moyo et al.,also found poverty rates to decline by more than 1% in a peanut growing area ofUganda due to IPM.
3.4 Conclusions
IPM programs are implemented to meet economic, health, and environmental ob-jectives, and impact evaluations of IPM programs are undertaken to provide infor-mation to users, scientists, funding agencies, and the general public. A protocol is

92 G.W. Norton and S.M. Swinton
Tab
le3.
4Im
pact
sof
IPM
onpe
stic
ide
use,
yiel
ds,a
ndne
tret
urns
Com
mod
ity
Cou
ntry
IPM
tech
niqu
esPe
stic
ide
Use
Yie
ldpe
rhe
ctar
eN
etre
turn
spe
rhe
ctar
eN
umbe
rof
stud
ies
Mos
tcom
mon
effe
ctR
ange
(%)
Cot
ton
U.S
Scou
ting
only
Incr
ease
−64
to+9
2In
crea
seIn
crea
se10
Cot
ton
U.S
Scou
ting
and
othe
rsD
ecre
ase
−98
to+3
4In
crea
seIn
crea
se11
Soyb
eans
U.S
Scou
ting
only
Dec
reas
e−2
1to
+83
Incr
ease
Incr
ease
5So
ybea
nsU
.SSc
outi
ngan
dot
hers
Dec
reas
e−1
00to
−85
naIn
crea
se2
Cor
nU
.SSc
outi
ngO
nly
Incr
ease
+15
to+4
7In
crea
seIn
crea
se1
Cor
nU
.SSc
outi
ngan
dot
hers
Dec
reas
e−1
5to
+67
Incr
ease
na2
Pean
uts
U.S
Scou
ting
and
othe
rsD
ecre
ase
−81
to+1
77In
crea
seIn
crea
se6
Frui
ts/N
uts
U.S
Scou
ting
only
Dec
reas
e−4
3to
+24
Incr
ease
Incr
ease
7Fr
uits
/Nut
sU
.SSc
outi
ngan
dot
hers
Dec
reas
e−4
1to
+37
Sam
eor
incr
ease
Sam
eor
incr
ease
8
Veg
etab
les
U.S
Scou
ting
and
othe
rsD
ecre
ase
−67
to+1
3Sa
me
Incr
ease
9R
ice
Chi
naSc
outi
ngan
dH
ost
plan
tres
ista
nce
Dec
reas
eSa
me
Incr
ease
2
Ric
eIn
dia
Mul
tipl
eD
ecre
ase
Incr
ease
Incr
ease
1R
ice
SriL
anka
Mul
tipl
eD
ecre
ase
Incr
ease
Incr
ease
1Fr
uits
/Nut
sN
ewZ
eala
ndSc
outi
ngan
dot
hers
Dec
reas
ena
Incr
ease
1V
eget
able
sPh
ilip
pine
sM
ulti
ple
Dec
reas
ena
Incr
ease
1
Sour
ce:P
rese
ntat
ion
byJ.
Fern
ande
z-C
orne
joat
the
5th
Nat
iona
lIPM
Sym
posi
um,S
tLou
is,M
isso
uri,
Apr
il4,
2006
.

3 Protocol for Economic Impact Evaluation of IPM Programs 93
described in this chapter for economic assessment of IPM programs. It includesfour steps for assessing economic impacts: (1) defining IPM measures, (2) mea-suring IPM adoption, (3) assessing user-level economic effects, and (4) assessingmarket effects. It also provides information on methods for estimating health andenvironmental (non-market) impacts and poverty impacts.
Acknowledgments The chapter draws on previous work with Jeff Mullen, Leah Cuyno, JasonBeddow, Sibusio Moyo, and Jeff Alwang among others.
References
Alston, J.M., Norton, G.W. and Pardey, P.G. 1995. Science Under Scarcity: Principles and Practicefor Agricultural Research Evaluation and Priority Setting. Cornell University Press, Ithaca,New York.
Beddow, J. 2000. Protocols for Assessment of Integrated Pest Management Programs. MS Thesis,Virginia Tech.
Benbrook, C.M. 1996. Pest Management at a Crossroads, Consumers Union, Yonkers New York.Benbrook, C.M., Sexson, D.L., Wyman, J.A., Stevenson, W.R., Lynch, S., Wallendal, J., Diercks,
S., Van Haren, R. and Granadino, C.A. 2002. Developing a pesticide risk assessment tool tomonitor progress in reducing reliance on high-risk pesticides. American Journal of Potato Re-search 79:183–199.
Champ, P.A., Boyle, K.J. and Brown, T.C. (eds) 2003. A Primer on Nonmarket Valuation. Kluwer,Dordrecht, Netherlands.
Cuyno, L.C.M., Norton, G.W. and Rola, A. 2001. Economic analysis of environmental bene-fits of integrated pest management: A Philippines case study. Agricultural Economics 25:227–234.
Debass, T. 2001. An Economic Impact Assessment of IPM CRSP Activities in Bangladesh andUganda: A GIS Application. M. S. Thesis, Virginia Tech.
Feder, G., Murgai, R. and Quizon, J.B. 2004. Sending farmers back to school: The impact of farmerfield schools in Indonesia. Review of Agricultural Economics 26:45–62.
Fernandez-Cornejo, J. 1998. Environmental and economic consequences of technology adoption:IPM in viticulture. Agricultural Economics 18:145–155.
Freeman, A.M., III 2003. The Measurement of Environmental and Resource Values: Theory andMethods. 2nd ed., Resources for the Future, Washington DC.
Higley, L.G., and Wintersteen, W.K. 1992. A novel approach to environmental risk assessmentof pesticides as a basis for incorporating environmental costs into economic injury levels.American Entomologist 38:34–39.
Hollingsworth, C.S., Coli, W.M. and Hazzard, R.V. 1992. Massachusetts integrated pest manage-ment guidelines: Crop specific definitions, Fruit Notes, Fall:12–16.
Kovach, J., Petzoldt, C., Degni, J. and Tette, J. 1992. A Method to Measure the EnvironmentalImpact of Pesticides. New York’s Food and Life Sciences Bulletin, Number 139, Cornell Uni-versity, New York State Agricultural Experiment Station, Geneva, New York.
Mauceri, M, Alwang, J., Norton, G. and Barrera, V. 2007. Effectiveness of integrated pest manage-ment dissemination techniques: A case study of potato farmers in carchi, Ecuador, Journal ofAgricultural and Applied Economics 39(3):765–780.
Moyo, S, Norton, G.W., Alwang, J., Rheinehart, I. and Deom, M. 2007. Peanut research andpoverty reduction: Impacts of variety improvement to control peanut viruses in Uganda. Amer-ican Journal of Agricultural Economics 89(2):448–460.
Mullen, J.D., Norton, G.W. and Reaves, D.W. 1997. Economic analysis of environmental benefitsof integrated pest management. Journal of Agriculture and Applied Economics 29:243–253.

94 G.W. Norton and S.M. Swinton
Napit, K.B., Norton, G.W., Kazmierczak, R.F., Jr. and Rajotte, E.G. 1988. Economic impacts ofextension integrated pest management programs in several states. Journal of Economic Ento-mology 81:251–256.
Norton, G.W., Moore, K., Quishpe, D., Barrera, V., Debass, T., Moyo, S. and Taylor, D.B. 2005.Evaluating socio-economic impacts of IPM. In G.W. Norton, E.A. Heinrichs, G.C. Luther, andM.E. Irwin (eds), Globalizing Integrated Pest Management, Blackwell, Ames, IA, pp. 225–244.
Norton, G., and Mullen, J. 1994. Economic Evaluation of Integrated Pest Management Programs:A Literature Review. Virginia Coop. Ext. Pub. 448–120, Virginia Tech, Blacksburg, Virginia.
Penrose, L.J., Thwaite, W.G., and Bower, C.C. 1994. Rating index as a basis for decision making onpesticide use reduction for accreditation of fruit produced under integrated pest management.Crop Protection 13:146–152.
Rajotte, E.G., Kazmierczak, R.F., Norton, G.W., Lambur, M.T. and Allen, W.E. 1985. The NationalEvaluation of Extension’s Integrated Pest Management (IPM) Programs. Virginia CooperativeExtension Service Pub. 491-010, Blacksburg, Virginia, February.
Swinton, S. and Norton, G.W. 2009 (in press). Economic Impacts of IPM. Chapter 2 in RadcliffeE.B., Hutcheson, W.D., and Cancelado, R.E., Integrated Pest Management: Concepts, Tactics,Strategies & Case Studies, Cambridge University Press, pp. 39–65
Swinton, S.M., Owens, N.N. and van Ravenswaay, E.O. 1999. Health risk information to reducewater pollution. In Casey, F. et al. (eds.), Flexible Incentives for the Adoption of EnvironmentalTechnologies in Agriculture, Kluwer Academic Publishers, Boston, pp. 263–271.
Swinton, S.M., Renner, K.A. and Kells, J.J. 2002. On-farm comparison of three postemergenceweed management decision aids in Michigan. Weed Technology 16:691–698.
Teague, M.L., Mapp, H.P. and Bernardo, D.J. 1995. Risk indices for economic and water qual-ity tradeoffs: An application to Great Plains agriculture. Journal of Production Agriculture8:405–415.
Vandeman, A., Fernandez-Cornejo, J., Jans, S. and Lin, B. 1994. Adoption of Integrated PestManagement in U.S. Agriculture. USDA/ERS Agric. Info. Bulletin No. 707, Washington DC.,September
Appendix: Tomato IPM Farmer Baseline Survey from Mali
Respondent Date of Interview
Code number
Gender (circle) M or F Interviewer
Community Village
I. Socio-demographic profile
1. What is your age? years
2. What is the highest grade/year in school you have completed?
3. How many working persons are there in your family?
4. What farmers’ organizations are you a member of?
5. How far is your field from the nearest market (km)?

3 Protocol for Economic Impact Evaluation of IPM Programs 95
6. How far is your village from the nearest major road (km)?
7. How far is your house from the nearest extension agent (km)?
8. What month(s) did you plant tomato in the field?
Dry season monthRainy season month
9. List crops you grew last year and the number of hectares (total for both sea-sons)? Also list the number of hectares of tomato and other vegetables pro-duced by other household members
Crop 1. 2. 3. 4. 5 6 7 8Millet/ Maize Rice TomatoSorghum
FarmerOthermembers
10. How much of the land (hectares) that you use for tomato do you own, rent,share crop, common field or control by other means?
Tomato for Farmer Tomato for other membersa. Ownb. Rentc. Share cropd. Other (specify)
11. How many years have you cultivated tomatoes?
II. Factors affecting pest management decision-making
12. Who buys the pesticides in your household (check all that apply)?a) Farmerb) Spousec) Both husband and wifed) Other members of the household
13. How much did you spend on pesticides (insecticides, fungicides, herbicides)last season for: (a) tomatoes? (b) Cotton?(c) Other crops?
14. What proportion of vegetable do you consume in your household? %
15. How many baskets of tomato did you produce last year?
Dry season Basket size kgRainy season Basket size kg
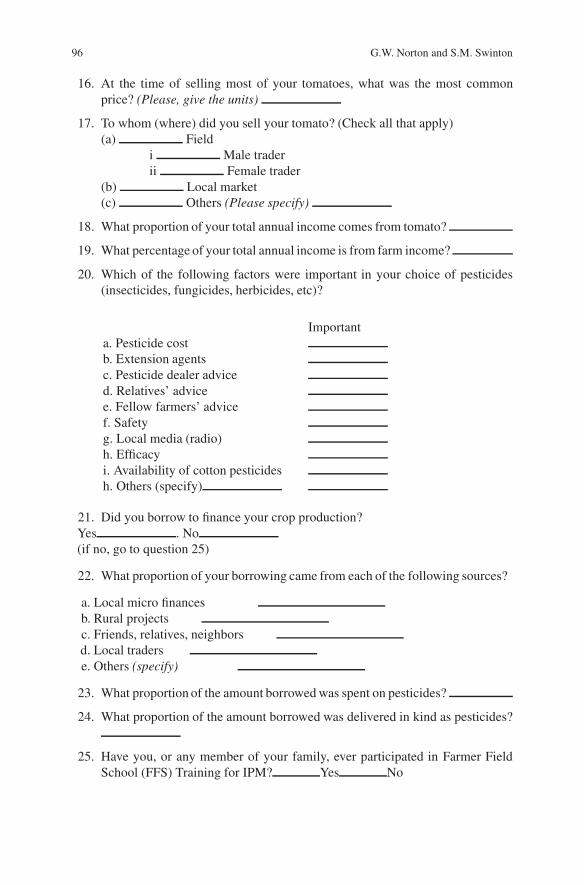
96 G.W. Norton and S.M. Swinton
16. At the time of selling most of your tomatoes, what was the most commonprice? (Please, give the units)
17. To whom (where) did you sell your tomato? (Check all that apply)(a) Field
i Male traderii Female trader
(b) Local market(c) Others (Please specify)
18. What proportion of your total annual income comes from tomato?
19. What percentage of your total annual income is from farm income?
20. Which of the following factors were important in your choice of pesticides(insecticides, fungicides, herbicides, etc)?
Importanta. Pesticide costb. Extension agentsc. Pesticide dealer adviced. Relatives’ advicee. Fellow farmers’ advicef. Safetyg. Local media (radio)h. Efficacyi. Availability of cotton pesticidesh. Others (specify)
21. Did you borrow to finance your crop production?Yes . No(if no, go to question 25)
22. What proportion of your borrowing came from each of the following sources?
a. Local micro financesb. Rural projectsc. Friends, relatives, neighborsd. Local traderse. Others (specify)
23. What proportion of the amount borrowed was spent on pesticides?
24. What proportion of the amount borrowed was delivered in kind as pesticides?
25. Have you, or any member of your family, ever participated in Farmer FieldSchool (FFS) Training for IPM? Yes No

3 Protocol for Economic Impact Evaluation of IPM Programs 97
26. If yes, for which crop(s) (a) (b)
27. when did you participate in FFS? 2001 2002 2003 2004 2005
28. Have you ever been visited by an agricultural extension agent, who dis-cussed non-pesticide means of controlling crop pests? (a) Yes(b) No
29. What is your source of tomato seeds?a) Private dealers
b) Extension servicec) Selfd) Neighbor/Friende) Others (specify)
30. What type of water source do you use for tomatoes?a) Irrigation system
b) With cansc) Rainfedd) Others (specify)
III. Perceptions of the effect of pesticides on human health and the environment
31. Using pesticides to control pests can harm water quality on the farm.AgreeDisagreeDon’t know
32. If agree, do you think your farm’s water supply has been negatively affectedby pesticide use?
YesNoDon’t know
33. Do you attribute any health problems that you or any of your family may haveexperienced to pesticides?
YesNoDon’t know
IV. Knowledge of Tomato Insect Pests and their Natural Enemies
A. Knowledge of Tomato Pests (insects, diseases, viruses)
34. What are the pests of tomato that you know?
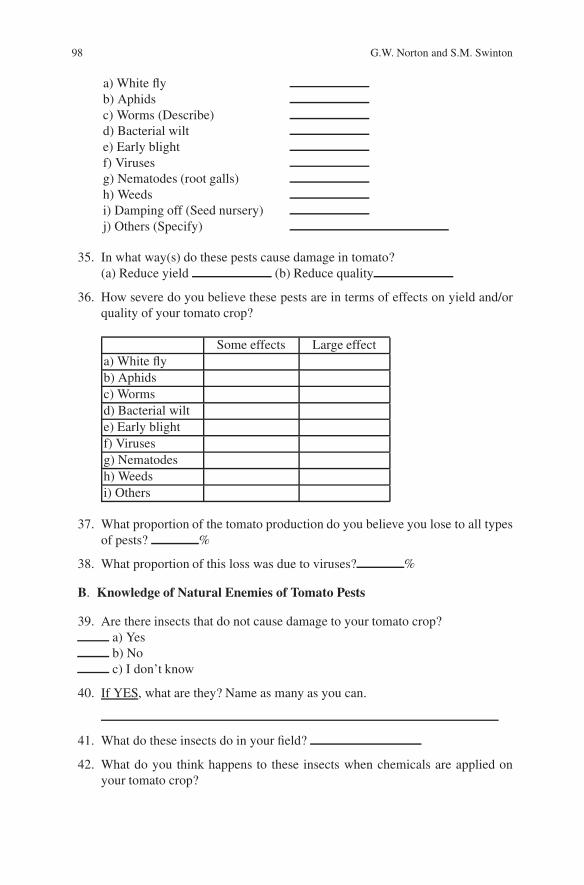
98 G.W. Norton and S.M. Swinton
a) White flyb) Aphidsc) Worms (Describe)d) Bacterial wilte) Early blightf) Virusesg) Nematodes (root galls)h) Weedsi) Damping off (Seed nursery)j) Others (Specify)
35. In what way(s) do these pests cause damage in tomato?(a) Reduce yield (b) Reduce quality
36. How severe do you believe these pests are in terms of effects on yield and/orquality of your tomato crop?
Some effects Large effecta) White flyb) Aphidsc) Wormsd) Bacterial wilte) Early blightf) Virusesg) Nematodesh) Weedsi) Others
37. What proportion of the tomato production do you believe you lose to all typesof pests? %
38. What proportion of this loss was due to viruses? %
B. Knowledge of Natural Enemies of Tomato Pests
39. Are there insects that do not cause damage to your tomato crop?a) Yesb) Noc) I don’t know
40. If YES, what are they? Name as many as you can.
41. What do these insects do in your field?
42. What do you think happens to these insects when chemicals are applied onyour tomato crop?

3 Protocol for Economic Impact Evaluation of IPM Programs 99
V. Pest Management Practices for Tomatoes
43. What do you do to control your tomato pests?a) Use of resistant variety
b) Plant extractsc) Other (specify)
d) Host free periode) Time of plantingf) Crop rotationg) Nets for seedlings in nurseryh) Others (specify)
44. How do you control your tomato virus problems? (Please check all that apply)a) Pesticide applicationb) Use of tolerant variety
c) Host free periodd) Time of plantinge) Crop rotation
f) Nets for seedlings in nurseryg) Others (specify)
45. If you use any pesticide on tomato, where did you learn about it (them)?a) Private dealers
b) Farmer field schoolc) Extensiond) Neighbor/Friend
e) NGOf) Others (specify)
46. If you used any non-pesticide control method for tomato pests, where did youlearn about that method? (Check all that apply)
a) Private dealersb) Farmer field school
c) Extensiond) Neighbor/Friend
e) NGOf) Others (specify)
47. With how many farmers did you share information about pest managementpractices?
48. What tomato varieties did you plant last year and why?
Variety1.2.3.

100 G.W. Norton and S.M. Swinton
49. Why did you use these varieties?
Variety High Good Tolerant to Tolerant to Tolerant Market Seed Othersyield quality diseases viruses to insects price availability (specify)
1.2.3.
50. Did you apply pesticides in your tomato fields last season?a) Yesb) No (Go to Q.61)
51–54. IF YES, please tell me which pesticides you applied last season on tomatoand for which pests?
Pesticides applied Target pest Number of Quantity appliedapplications per application
51. 52. 53. 54.1.2.3.4.
55. Do you apply these pesticides before you see the damage or afterwards?a) Beforeb) Afterc) Both
56. How effective were these chemicals?a) Effectiveb) Not effectivec) Don’t know
57. Who applied the pesticide on your tomato?a) Husbandb) Wifec) Sond) Daughtere) Others
58. What protection measures do you use when preparing or applying pesticides?a) Clothingb) Maskc) Glovesd) boots
e) Otherf) Nothing

3 Protocol for Economic Impact Evaluation of IPM Programs 101
59. What do you do with empty pesticide containers?a) Re-useb) Sellc) Disposal (Specify how)d) Others
60. Where do you store your pesticides?a) In the fieldb) In the granaryc) In the housed) Others (Specify)e) Do not store pesticide
61. What share (percent) of your total variable costs in tomato production is de-voted to each of the following inputs?
Input Percent of total variable costsPlowingHired LaborSeedsPesticidesFertilizerOrganic manureOther (specify)

Chapter 4Economic Evaluation of Integrated PestManagement Programs
Kamal Vatta, A.K. Dhawan and Rajinder Peshin
Abstract This paper makes an attempt to highlight important methods of economicevaluation of Integrated Pest Management (IPM) Programs. The farm level deci-sion making process in pest management can be evaluated by using the economicthreshold model, the marginal analysis model, the decision theory model and thebehavioral decision model. Economic evaluation of the IPM programs, at the farmlevel/aggregate levels, can be carried out using cost-benefit approach, economic sur-plus model and econometric model. The paper further makes an attempt for microlevel investigation of the impact of IPM program for cotton in Indian Punjab byusing the data pertaining to 210 cotton farmers comprising 150 IPM farmers and60 non-IPM farmers spread over 21 villages in three districts. The difference ofdifference technique was used to measure the impact of adoption of IPM programon extent of pesticide use and productivity of cotton.
Keywords Economic evaluation · Integrated Pest Management
4.1 Introduction
The Malthusian theory of population and food production was set false by the tech-nological developments and their adoption by the farmers throughout the world. Itresulted into relatively larger per capita increase in the food production as com-pared to the increase in population. This was made possible by the introductionof high yielding varieties (HYVs) of wheat during the mid 1960s and that of riceduring early 1970s especially in the developing countries like India and China. Theintroduction of HYVs brought more and more area under cultivation and encour-aged intensive use of external inputs. Pesticides have been one such input beingused intensively to ensure higher production and productivity by reducing the croplosses caused by the pests. By any measure whether it be volume used, hectares
K. Vatta (B)Department of Economics and Sociology, Punjab Agricultural University,Ludhiana, Indiae-mail: [email protected]
R. Peshin, A.K. Dhawan (eds.), Integrated Pest Management: Disseminationand Impact, DOI 10.1007/978-1-4020-8990-9 4,C© Springer Science+Business Media B.V. 2009
103

104 K. Vatta et al.
treated, or market value, the use of global pesticide is large and still rising. During2004, the world pesticide use reached 2.0 kg/hectare as compared to 0.5 kg/ha dur-ing 1965. In addition, the world pesticide exports also reached at the level ofUS$ 15.9 billion (http://www.envirostats.com). The developing countries, includingChina, account for approximately 31 per cent of total pesticide use in the world(http://oregonstate.edu). The pest outbreaks worldwide have resulted into a tread-mill like situation with the share of pesticides in the total cost of cultivation risingin some regions from 2.1 per cent to more than 20 per cent, over time (Peshin et al.,2007).
Despite all that, there has been no significant additional return to the pesticideuse. Rather the over-use and misuse of pesticides has led to many negative im-pacts throughout the world (Khan and Iqbal, 2005; Feenstra et al., 2000; Orphal,2001; Ahad et al., 2001). The impact has not only been restricted to agriculturein the form of reduction in productivity via increased resistance in the insect pestsbut was extended to many aspects such as human health in the form of pesticideresidues in the produce, exposure to the chemicals by the workers and the envi-ronmental impacts as well. Increased pesticide use led to a change in the pest sce-nario in many regions (Peshin et al., 2007). Very high use of pesticides has evenresulted into a decline in the area under some crops due to sharp rise in the cost ofcultivation.
To overcome this downward slide in productivity of cotton crop many integratedpest management (IPM) programs were initiated such as Regional Program onCotton IPM by Commonwealth Agricultural Bureau International (CABI) in 1993,Food and Agricultural Organization (FAO)-European Union IPM program for cot-ton in 2000, National Agricultural Technology Project (NATP) for IPM in 2000and Insecticide Resistance Management Program in 2002 (Peshin et al., 2007). Thefocus of these IPM programs was to reduce and rationalize the pesticide use byencouraging the farmers to adopt other pest management practices like cultural andmanual-mechanical practices in absence of any effective bio-agents. The utility ofsuch programs emanated out of the fact that knowledge being the fourth importantfactor of production, influences the decision making of farmers and hence their pro-ductivity as well as profitability.
IPM programs have been termed as highly successful in reducing the pesticideuse and promoting some other benefits. With increasing trend of investment/expenditure on IPM programs, the questions are being raised on such investmentsvis-a-vis the resulting benefits from such investments, which usually flow over timeand are expected to be of comparatively larger extent.
The success of these programs can be justified only if they could significantlyreduce the pesticide use along with the other perceived ill-effects of pesticide usein comparison to the costs incurred on these programs. It is pertinent to under-take economic evaluation of all such programs with a view to identify/comparethe stream of benefits and expenditure arising over the period of implementationof such programs. This paper makes an attempt to outline the methodology used ineconomic evaluation of such IPM programs. It further provides an evaluation of theIPM program being implemented in Punjab, an important food basket of India.

4 Economic Evaluation of Integrated Pest Management Programs 105
4.2 A Review of the Decision Making Process in Pest Management
Decision making process in all economic problems is largely governed by scarcity ofthe resources. Pest management is one such problem. Mumford and Norton (1984)have emphasized that both the normative and positive aspects of economics can beuseful in assessing the performance of pest management activities. There are fourimportant economic models of decision making at the farm as well as aggregatelevel: (i) the economic threshold model, (ii) the marginal analysis model or opti-mization model, (iii) the decision theory model, and (iv) the behavioral decisionmodel. A brief description of all these models has been given below.
4.2.1 The Economic Threshold Model
The concept of economic threshold in pest management has been developed throughthe contributions of both the entomologists and the economists. Economic thresholdmay be defined as that level of pest population density at which the pesticide useis justified (Stern et al., 1959). Below this level of pest population, no significanteconomic harm is caused to the crop and hence incurring cost on the pesticide use isnot justified. Above the threshold, economic losses from pests exceed the costs to beincurred to control the pest. The model requires the information on three importantparameters; (i) unit price of the crop output (P), (ii) crop yield before (Yo) and afterthe intervention (Yi), and (iii) cost of pesticide application (C). The economic lossdue to pest attack may thus be expressed as below, where the left side and right siderepresent costs and benefits of the pest control, respectively.
C = (Yi − Yo)∗P
The economic losses start accruing when the costs exceed right side of the aboveexpression. This expression may be outlined in the following form to identify thethreshold level of pest attack on a particular crop. The pest population only above Tjustifies the pest control application.
PLRT = C
Where P = Unit price of the crop output, L = Loss of crop yield per unit of pestpopulation, R = Reduction in pest attack achieved by the pest control, and T =Level of the pest attack.
The threshold level, thus is given by
T = C/PLR.
However, non availability of required information may pose problems for estima-tion of this model. Further, when more than one options exist for the pest control,the model may fail to single out the optimum strategy.

106 K. Vatta et al.
4.2.2 The Marginal Analysis or Optimization Model
While the entomologists are interested in working out the pest population levelsbeyond which the crop losses exceed the cost of control, the economists tend todetermine the most profitable level of pest control for a given level of pest popula-tion. Marginal analysis model is, thus, based on the economic principle of reducingthe pest population up to that level, where the marginal returns just exceed themarginal costs of pest control. The marginal analysis is based on three importantassumptions; (i) profit maximizing behavior of the firm, (ii) perfect knowledge ofthe production function, and (iii) prevalence of the law of diminishing marginalreturns.
Hillebrandt (1960) was the first to apply the concept of marginality to pest con-trol. Using hypothetical example, she derived a dosage response curve highlightingthe crop yields corresponding to different doses of pesticide use. Diminishing re-turns were successfully demonstrated with successive doses of pesticides. Economicthreshold was thus defined as the level to which the pest population should be re-duced, where marginal returns just exceed marginal costs. This concept, however,tended to create confusion amongst the entomologists and the economists. While,the former were interested in identifying the pest population levels for undertakingthe pest control, the latter were interested in determining optimum levels of pestcontrol for a given pest population. To avoid such confusion, Mumford and Norton(1984) recommended the use of economic threshold in the sense of break-even de-cision as given by Stern (1973).
4.2.3 The Decision Theory Model
The previous two models make an assumption of certainty, which is rarely the casein the pest management decisions. Nothing seems to be known with certainty whilemanaging the pest problem in the fields. Often, pesticides are applied even beforeactual appearance of the pest and thus application is based not on the basis ofperfect knowledge but on the basis of farmer’s perception about the pest attackand the expected losses. Risk and uncertainty arises due to the involvement ofnumerous biological, technical and economic factors in the pest management. Inaddition, the farmer (the decision maker) also lacks perfect knowledge on all thesefactors. Unlike economic threshold model, the decision theory model incorporatesuncertainty.
The model is based on the fact that the severity of pest attack may differ under dif-ferent conditions on a particular farm. The decision maker is not perfectly aware ofthe severity of pest attack in advance owing to uncertainty. However, he is aware ofthe probability distribution of severity of pest attack i.e. pest attack can be classifiedinto different severity levels along with the probability of such attacks to occur infuture, based on the previous experience of the decision maker. As there are differentpest management strategies based on the severity of pest attack, the decision maker

4 Economic Evaluation of Integrated Pest Management Programs 107
Table 4.1 A hypothetical payoff matrix for decision making
Action Severity of pest attack ExpectedoutcomeLevel 1 (p1) Level 2 (p2) – Level i (pi)
Action 1 R11 R21 – Ri1 O1
Action 2 R12 R22 – Ri2 O2
– – – – – –Action j R1j R2j – Rij Oj
is aware of the returns associated with each such strategy corresponding to differentseverity levels. All this information can be easily summarized into payoff matrix(Table 4.1). The matrix represents i-levels of severity of pest attack and j-levels ofactions for pest control.
The expected outcome of jth action is actually the probability-weighted outcomefor a particular action and can be expressed in the following manner.
O j =∑
pi∗ Rij
Where, O j = Expected outcome of j th action; pi = Probability of i th level ofpest severity; Rij = Net returns from j th action corresponding to i th level of pestseverity.
The values of pi can be assigned on the basis of subjective as well as objectiveassessment. While the former are based on expert judgments, the latter are derivedon the basis of past experience or information already available. Valentine et al.(1976) used both the objective and subjective probabilities for decision makingin the control of gypsy moth (Lymantira dispar) in New England forests. Carlson(1970) also used the subjective probabilities of different levels of losses from peachbrown rot (Monilinia fructicola) for this model to predict the crop disease and itscontrol. To derive the net returns, the cost of control and value of output can beobtained from farmer interviews.
As per the assumption of profit maximization, the decision maker will opt forthat action which corresponds to the highest level of expected returns. However,this is true only for the risk-neutral farmers, who do not consider risk as a majorconcern during their decision making. However, all the actions may entail a dif-ferent degree of risk. Risk-averse farmers try to opt for that action which reducesthe variability of outcome. Driven by twin objectives of profit maximization andrisk reduction, the farmer may opt for the action corresponding to less than maxi-mum level of outcome. Most of the decision theory models have largely consideredthe above two objectives. However, Norton (1982) introduced another approach,called “satisficing approach”, where the farmer’s tendency is to reject those ac-tions which yield more unsatisfactory results based on trial and error. The DecisionTheory Model is highly applicable when the short-term occurrences can be reliablyestimated.
108 K. Vatta et al.
4.2.4 The Behavioral Decision Model
This model is based on the assumption that a farmer’s pest control decision maynot be based on the actual situation but on his perception of the situation. Itmay result into a lot of variations in the pesticide use across the farmers evenif the crops remain the same. This is due to the reason that different farmersin a particular region, growing the same crop, perceive the pest problem andthe resulting losses to a varying extent. These perceptions vary in different de-grees from the actual situation in the region and on the farms and hence thevariations in pest-control actions and their extents. Such differences were dulydemonstrated by Tait (1977). Daku, Norton, Pfeiffer, Luther, Pitts, Taylor, Tedes-chini, and Uka (2000) also confirmed such differences among olive growers inAlbania.
Norton and Mumford (1983) explained the pest-control behavior with the helpof behavioral decision model. The model can be further classified into static anddynamic models. The static model studies the farmer’s decision for a particular cropin isolation. The model assumes that a farmer has his own perceptions of the pestproblem, which may vary from the real problem. Based on his perceptions, he makesthe assessment of the pest problem and evaluates the possible options. The dynamicmodel considers the past pest management decisions of the farmer as well as hisother farm management decisions i.e. it incorporates the past behavior of a farmerregarding pesticide use and other important decisions in crop cultivation. It impliesthat behavioral tendencies of the farmers in a region may result into a significantvariation in the pesticide use on a given crop. Further, decisions such as the culti-vation of a crop like maize for fodder or for grain may also affect the pesticide-usedecision.
4.3 Methodology of Economic Evaluation of IPM Programs
In this section, an attempt has been made to outline important methods being usedto evaluate the economic impacts of IPM programs. As the economic benefits ofIPM programs accrue not only at the individual farm level but also at the aggregatelevels of village, community or a region, it is important to look at the methodologyat two different levels. Hence, this section discusses separately, the methodology ofevaluation at the farm level as well as the aggregate level.
4.3.1 Evaluation at the Farm Level
Any farm level intervention is broadly aimed at improving the profitability or riskreduction of a particular farm operation or a group of operations, which fits wellin the overall objectives of profit maximization and risk reduction from farming.Owing to this reason, most of the evaluation efforts in past have focused largely onassessing profits and risk on the farms concerning with IPM programs.

4 Economic Evaluation of Integrated Pest Management Programs 109
The impact on profits has largely been measured with the budgeting technique.Many studies have measured profit to be the difference between gross revenue andthe cost of adopting an IPM intervention/program. However, there have been variedmeasures of profits used for such assessment, which have affected the comparabilityof the results of these studies. Napit et al. (1988) evaluated the economic benefits ofextension integrated IPM programs by using the budgeting technique for differentcrops. They used net returns as a measure of profits and used t-tests for measuringany significant differences to management per unit of land and costs of pesticidesoccurring at the user level. Trumble et al. (1997) also used the budgeting techniquefor economic and environmental impact evaluation of IPM program in celery. Netprofits for different treatments were estimated by using the partial budgets. Theevaluation established that the IPM programs caused a significant reduction in thepest population and hence, a rise in average yields and net profits. A rise in the netprofits by more than US$ 410 per ha was achieved by the program with 40 per centless use of conventional pesticides. Headley and Hoy (1987), while conducting abenefit-cost analysis of an Integrated Mite Management Program for almonds, alsoused the cost saving approach to estimate the impact at the farm level. A growerwas expected to save US$ 60–110 per ha with the adoption of such program. Apartfrom improved profits, economic benefits of an IPM program may also entail areduction in the risk. Such benefit may easily be estimated by assessing the yieldvariability. The coefficient of variation is an appropriate measure for judging theyield variability.
Another approach to estimate the farm level impact of an IPM program on a farmproducing/using multiple outputs/inputs has been provided by Feder and Quizon(1999). The objective of a farm household is maximization of profits. The house-holds tend to achieve this objective for a given level of input/output prices underthe constraint of fixed factors of production such as land, knowledge about pestmanagement and other factors, etc. A household’s profit function can be expressedas follows
� = π(P x , P y, L, K , Z )
Where, P is household’s profit, Px is the vector of input prices, P y is the vectorof output prices and L, K and Z are the land, knowledge of the pest managementand other socio-economic factors (age, family characteristics, etc.), respectively.The output and input are themselves the functions of the above variables. In theabove equation, it is the variable K (knowledge about pest management practices)which is of interest in estimating the farm level impacts of IPM. This variable im-pacts the input use of a farmer through improved knowledge on pest managementand the supply function by improvement in production through better input use.The impact of improved knowledge on input use as well as on output can be cal-culated by deriving the partial derivatives of input use function and supply functionwith respect to the variable K. Feder and Quizon (1999) have further highlightedthe limitations of before-and-after and with-and-without methods of estimating thefarm level impacts as they may ignore the spillover effects, simultaneous effect of

110 K. Vatta et al.
IPM dissemination efforts and long run outcomes of the program, and have estab-lished the superiority of two-stage and simultaneous equation procedures in suchestimation.
4.3.2 Evaluation at the Aggregate Level
There are two broad approaches for economic impact evaluation of agricultural re-search programs. These approaches are economic surplus approach and econometricapproach and both of these estimate the production functions concerning agricul-tural research or knowledge. Both these approaches have been briefly discussed inthis part.
4.3.2.1 Economic Surplus Approach
This approach is widely used in both ex-ante and ex-post evaluation of economicbenefits. The supply seems to shift up as a result of the adoption of an IPM programproducing surplus for both the producer as well consumer. The approach tends tomeasure such surplus resulting from the adoption. Economic surplus further tendsto measure the welfare impact of a research program/intervention. However, twoimportant methods used under this approach are cost-benefit analysis and economicsurplus model. These two methods are discussed below in detail.
Cost-benefit analysis: It is a simple method of comparing the costs and benefitsemerging out or expected to emerge out of a particular project over a period of time.The purpose for such analysis is to ascertain whether investments in a project or anintervention are economically viable or not. If benefits (expected) exceed the costs,the project is termed as economically viable, otherwise not. Generally two measuresare used for estimating this surplus of benefits over the costs. One, the differencebetween the benefits and the costs is calculated; two, ratio of benefits to costs iscalculated. Positive difference between the benefits and costs in first case and ratioof more than one in the other indicate economic viability. Larger difference or ratioindicates larger surplus and hence stronger viability.
The benefit cost analysis, generally consists of three steps such as (i) Identifyingthe time period for which the project/intervention generates benefits since its start,(ii) identifying and estimating the stream of economic benefits and costs duringthis period, (iii) estimation of the economic surplus by finding differences betweenbenefits and cost or by the ratio.
A major limitation of the method is that it assumes either (i) perfectly inelasticsupply curve and perfectly elastic demand curve to estimate the value of surplusproduction or (ii) perfectly elastic supply curve and perfectly inelastic demand curveto estimate the value of inputs saved due to the intervention. The methodology hassome other shortcomings as well as operative problems owing mainly to still un-resolved difficulties with quantifying certain economic consequences of IPM prac-tices such as benefits derived from sustained practices including human health and

4 Economic Evaluation of Integrated Pest Management Programs 111
the environment (Feder and Quizon, 1999). Also, there are chances of omission ordouble counting of impacts of intervention.
Economic Surplus Model: The economic surplus approach permits the estima-tion of the economic benefits generated by adoption of technological innovations,compared to the situation before (without) the adoption, where only traditional tech-nology was available. The model actually tends to assess the economic impact byevaluation of enhancement in supply as result of IPM intervention. The model tendsto estimate how an increase in output and/or reduction in costs of inputs translateinto shift in the supply function of the commodity under study. The shift in sup-ply curve may alter the point of equilibrium which may change the quantum ofbenefits/costs associated with an intervention. The surplus arising out of the inter-vention may be further split into producer and consumer surplus. The model can beeasily explained with the help of Fig. 4.1. Adoption of IPM technologies helps torestrict the movement of supply curve from S1 to S0. In the absence of adoptionof IPM technology, the pests would have developed resistance to the pesticidesrestricting the supply. Consumer surplus is measured by the difference betweenwhat a consumer is willing to pay (rather than going without IPM technology inthis case) and what he actually pays. The consumer surplus corresponding to thesupply levels of S0 and S1 is given by FAP0 and FBP1, respectively and the surplusarising due to IPM intervention is given by the difference of the above two surpluses
Fig. 4.1 Economic surplus from adoption of IPM technologies

112 K. Vatta et al.
and is represented by P0ABP1. Such a surplus arises as a result of decline in priceof commodity for the producer due to shift in the supply curve from left to right.Despite fall in prices, the producer surplus arises as a result of increase in supply,which compensates the loss in profits due to fall in prices. The loss in producer’ssurplus due to fall in prices is given by P0ABP1 and gain in surplus due to increasedsupply of the commodity is given by ABE. Finally, the producer surplus resultingfrom such intervention is given by CBE (which equals the difference between ABEand P0ABP1). The impacts on producer depend on the elasticity of demand andsupply curves. This model has an edge over the benefit cost analysis as it does notassume the perfect elasticity/inelasticity of the supply and demand curves and infact takes into account the price response to the shifts in supply curve as a resultof the intervention. The impact of IPM intervention with economic surplus modelrequires information on resulting productivity enhancement, equilibrium price ofthe product, costs, rate of adoption of the technology, time gap between researchand adoption, and price elasticities of demand and supply.
Economic surplus model can be easily used in ex-ante and ex-post evaluation ofan IPM program and can be effectively combined with other models for evaluationinvolving multiple objectives. In addition, the economic surplus model has the abil-ity to include the effects of changes in the other variables such as economic growthand population changes, etc. on potential benefits and costs of an intervention.
4.3.2.2 Econometric Approach
These methods attempt to estimate direct relationship between the crop productivityand research intervention. This method is more appropriate for ex-post economicevaluation. While specifying the production function, yields or profits can be ex-pressed as the dependent variables and the expenditure on the IPM program as oneof the independent variables. The production functions have largely been estimatedusing the parametric methods of estimation. The production function can be ex-pressed in the following manner:
Yt = f(Xt)
Where, X is the vector of different independent variables. Once the production func-tion is estimated, then the parameter estimates can be used to find out marginal re-turns of different inputs, including that of investment in an IPM program. However,the use of econometric method for impact evaluation of the IPM programs alsohas some limitations. First is the problem of multi-collinearity, indicating strongcorrelation between many of the independent variables, which affects the correctestimation of parameters. Second, some of the inputs are found jointly endogenouswith the output and hence do not yield consistent estimates. In addition, many a time,omission of some explanatory variables from the production function may yieldbiased and inconsistent estimates as most of the effect of these omitted variablesremains absorbed by the unexplained residual term of the model.
4 Economic Evaluation of Integrated Pest Management Programs 113
4.4 A Micro Level Evidence of Farm Level Impactsof IPM Program
In this section, we have presented the evaluation of farm level impacts of an IPMprogram in Indian Punjab. The state of Punjab spearheaded the green revolution inthe country as a result of introduction of high yielding varieties (HYVs) of wheatduring mid-sixties and that of rice during early seventies. With the total croppedarea, amounting to just three per cent of entire country, its share in the wheat andrice production of the country amounted to almost 22 per cent and 12 per cent,respectively. The production system in the state is the best example of an inten-sive cultivation system as almost 98 per cent of the cropped area is irrigated andcropping intensity has reached 189 per cent, one of the highest in the country. As aresult of intensive cultivation, the input use is also at one of the highest levels. Theshare of insecticide cost in the total cost of cultivation of cotton in Punjab increasedmany folds from 2.1 per cent during 1974–1975 (Dhaliwal and Arora, 2001) to21.2 per cent during 1998–1999 (Sen and Bhatia, 2004). In pesticide hotspots likeBhatinda district in Punjab, it was 50 per cent of the total cost of cultivation (Shetty,2004). This was despite the fact that many IPM programs were implemented inPunjab from time to time.
4.4.1 Sampling Details
The study was conducted in the cotton growing areas of Indian Punjab. Cotton inPunjab accounts for 10 per cent production and 5 per cent area under cotton inthe country and also achieved the highest average productivity since 2000–2001.The cotton growing districts in Punjab are Bathinda, Ferozepur, Mansa, Mukatsar,Faridkot, Sangrur and Moga with more than 70 per cent of cotton growing areafalling in the first three districts. For conducting this study, the districts of Bathinda,Ferozepur and Mansa were purposively selected due to the highest levels of pesti-cide use. The study was based on a sub-sample of the Integrated Resistance Manage-ment (IRM) program, being implemented by Central Institute of Cotton Research,Nagpur, India since 2002 in 28 districts, distributed over 10 states in India, whichaccount for more than 80 per cent insecticide use in cotton. For evaluation of the im-pact of IPM in cotton, a total of five villages in each district were selected randomlyfrom ten villages being covered under the IRM program in 2004–2005. In addition,two control villages from each district were also selected for such evaluation. Thus,out of a total of 21 villages, the data were collected from 210 farmers (10 from eachselected village) for the study (Peshin, 2005).
A semi-structured questionnaire, in the local language, was distributed amongstselected farmers before the start of the cotton-growing season in 2004–2005. Thiswas done in order to avoid the problems/discrepancies associated with recall/recollection of information by the farmers after the growing season was over. Therespondents were revisited after regular intervals (with a time gap of not more than
114 K. Vatta et al.
three weeks) during the crop growing season, to ensure proper and correct recordingof the required information and to dispel doubts emanating while recording the data.The questionnaire focused on the socio-economic characteristics of the respondents,extent and level of adoption, input use, cost of cultivation, production and returns.
4.4.2 Analytical Procedure
The study used difference of difference (DD) model to evaluate the impact of IPMprogram (Wu et al., 2005). The sample selection, not being random in such stud-ies, may result in biased estimates for the important parameters. The advantageof DD model lies in the fact that it intends to assess the program impact by dif-ferencing out the time invariant unobservable household or village characteristicswhich may influence the participant selection or program placement and thereforetend to remove the bias in estimates. IPM projects aim at changing farm and cropmanagement practices in cropping systems that have become overly dependent onchemical pesticide use. Some important effects of adoption of IPM may relate tomore efficient use of pesticides, improving crop yield and reducing yield variability(Fleishcer et al., 1999). In addition, the IPM adoption may affect the other input use(including labor use) and may also reduce the incidence and extent of health hazardsresulting due to increased pesticide use. However, the present study evaluates theimpact concerning the pesticide use, yield and yield variability of the cotton crop.
4.4.3 Results of the Impact Assessment
In this section, an assessment has been made of the impacts of adoption of IPMprogram by the farmers in the study area. Table 4.2 highlights the extent and costof pesticide use, area under cultivation and yield of the crop among IPM and non-IPM farmers before and after the adoption. There was a reduction in the numberof sprays on both the IPM and non-IPM farms. However, the reduction was higheron the IPM farms. While the number of pesticide sprays declined by 5.31 on IPMfarms, the corresponding reduction was 4.62 on the non-IPM farms. The respectivereduction in the cost of pesticide spray was approximately US$ 112.83 and 106.80per hectare. An increase in the area under cultivation and average yield of the cottoncrop was also observed on both the categories of farms. While the yield increasedby 649 and by 505 kg/ha on IPM and non-IPM farms, the area under cotton cropincreased by 0.81 hectare and 3.30 hectare, respectively. In nutshell, the resultsreveal a larger reduction in the number of pesticide sprays, cost of pesticide useand better improvement in the average yield of cotton on IPM farms as comparedto that on non-IPM farms. On the other hand, the increase in area under cotton wasmore in case of non-IPM farms.
Before concluding on the impact of IPM adoption, it is better to examinethe statistical significance of such differences on both the categories of farms. Theregression results showed no significant impact of IPM adoption in reducing thenumber of pesticide sprays and cost of pesticide use (Table 4.3). There was also no

4 Economic Evaluation of Integrated Pest Management Programs 115
Table 4.2 Pesticide use, area and yield of cotton crop amongst IPM and non-IPM farmers
Particular IPM farmers Non-IPM farmers
Before After Change Before After Change
1. Area under cotton (ha) 5.38 6.19 0.81 2.65 5.95 3.32. No. of pesticide sprays∗ 15.34 10.05 −5.31 14.93 10.31 −4.623. Cost of pesticides (US$)a 257.63 144.83 −112.83 278.63 171.83 −106.804. Average yield (kg/ha) 1749 2300 649 1704 2209 505∗Tank mixtures of insecticides taken as one application.a At present rates 1$ = 40 Indian rupees.Data source: Peshin (2005).
Table 4.3 Impact of IPM adoption on pesticide use, area and yield of cotton crop
Dependent variable Explanatory variable Coefficient Std. error Probability
Increase in area undercotton R2 = 0.11F = 26.0
Constant 10.03 1.24 0.00IPM adoption
dummy−7.54 1.48 0.00
Reduction in thenumber ofsprays R2 = 0.01F = 0.19
Constant 4.13 0.74 0.00IPM adoption
dummy0.38 0.88 067
Reduction in the costofsprays R2 = 0.01F = 0.19
Constant 39.05 4.95 0.00IPM adoption
dummy2.57 5.89 0.66
Increase inyield R2 = 0.01F = 1.84
Constant 2.61 0.33 0.00IPM adoption
dummy−0.53 0.39 0.18
Data source: Peshin (2005).
significant impact on yield improvement as a result of IPM adoption. Contrary tothe expectations, the increase in area under cotton was significantly higher in caseof non-IPM farmers. This might be due to significantly lower area under cultivationduring the year 2003. The non-IPM farmers might have acted fast to increase thearea under cotton and catch up with other farmers in the region to appropriate thebenefits of Bt-cotton which promised the revival of economic viability of this cropin the region after a long incidence of severe pest infestation, significantly harmingits economic viability.
4.5 Conclusions
Intensive crop production systems have resulted into very high use of inputs in-cluding the use of pesticides. Intensive pesticide use has raised questions regardingtheir marginal benefits and also has led to many negative impacts. Pesticide sce-nario has also undergone significant change over time in many places. There havebeen huge investments in the Integrated Pest Management (IPM) programs, aimed

116 K. Vatta et al.
at significantly reducing the pesticide use. There is need for economic evaluation ofsuch programs as huge investments need to be justified through equivalent or highermarginal returns. The farm level decision making process in pest management canbe evaluated by using the economic threshold model, the marginal analysis model,the decision theory model and the behavioral decision models. Economic evalu-ation of the IPM programs, at the farm level/aggregate levels, can be carried outusing cost-benefit approach, economic surplus model and econometric models. Amicro level investigation of the impact of IPM program in Indian Punjab reveals nosignificant impact. The non-IPM farmers shifted a larger area under cotton, perhapsin order to catch up with the IPM farmers to appropriate the benefits of Bt-cotton,which promised the revival of economic viability of this crop after a long incidenceof severe pest infestation in the region.
References
Ahad, K., Hayat, Y. and Ahmed, I. 2001. Capillary chromatography determination of pesticideresidues in Multan division. The Nucleus 38:145–149.
Carlson, G.A. 1970. A decision theoretic approach to crop disease prediction and control. AmericanJournal of Agricultural Economics 52:216–223.
Daku, L., Norton, G.W., Pfeiffer, D.G., Luther, G.C., Pitts, C.W., Taylor, D.B., Tedeschini, J. andUka, R. 2000. Farmers’ Knowledge and Attitudes Towards Pesticide Use and Olive Pest Man-agement Practices in Vlora, Albania: A Baseline Survey. IPM CRSP Working Paper 001-1,Virginia Polytechnic Institute and State University.
Dhaliwal, G. S. and Arora, R. 2001. Integrated Pest Management: Concepts and Approaches,Kalyani Publishers, Ludhiana.
Feder, G. and Quizon, J. 1999. Integrated Pest Management (IPM) in Asia: Are there real returnsto IPM and its diffusion? In Waibel, H., Fliescher, G., Kenmore, P.E. and Feder, G. (eds), Eval-uation of IPM Programs – Concepts and Methodologies. Pesticide Policy Project PublicationSeries, No. 8, Institut fUr Gartenbauokonomie, Universitat Hannover, Germany.
Feenstra, S., Jabbar, A., Masih, R. and Jehangir, W.A. 2000. Health Hazards of Pesticides inPakistan, IWMI and PARC, Islamabad.
Fleischer, G., Jungbluth, F., Waibel, H. and Zadoks, J.C. 1999. A Field Practitioner’s Guide to Eco-nomic Evaluation of IPM. Pesticide Policy Project in Cooperation with Food and AgricultureOrganization. University of Hannover, Germany, Publication Series No.9.
Headley, J.C. and Hoy, M.A. 1987. Benefit cost analysis of integrated mite management programfor almonds. Journal of Economic Entomology 80:555–559.
Hillebrandt, P.M. 1960. The economic theory of the use of pesticides: The dosage responsecurve, the rate of application and the area to be treated. Journal of Agricultural Economics13:464–472.
Khan, M., Azeem and Iqbal, M. 2005. Skill development among farmers: Evidence from Khairpurdistrict of Sindh, Pakistan. The Pakistan Development Review 44(4):695–716.
Mumford, J.D. and Norton, G.A. 1984. Economics of decision making in pest management. AnnualReview of Entomology 29:157–174.
Napit, K.B., Norton, G.W., Kazmierczak, R.F. Jr. and Rajjote, E.G. 1988. Economic impacts ofextension integrated pest management programs in several states. Journal of Economic Ento-mology 81:251–256.
Norton, G.A. 1982. A decision analysis approach to integrated pest control. Crop Protection 1:147–164.
Norton, G.A. and Mumford, J.D. 1983. Decision-making in pest control. In T.H. Cooker, (ed),Applied Biology, Vol. 8, Academic Press, New York, NY.

4 Economic Evaluation of Integrated Pest Management Programs 117
Orphal, J. 2001. Economics of Pesticide Use in Cotton Production in Pakistan. Diploma Thesis.University of Hannover, Germany.
Peshin, R. 2005. Evaluation of Dissemination of Insecticides Resistance Management Technologyin Cotton Crop in Punjab. PhD Dissertation. Punjab Agricultural University, Ludhiana.
Peshin, R., Dhawan, A.K., Vatta, K. and Singh, K. 2007. Attributes and socio-economic dynamicsof adopting Bt-cotton. Economic and Political Weekly 42(52):73–80.
Sen, A. and Bhatia, M.S. 2004. State of the Indian Farmer: A Millennium Study-Cost of Cultivationand Farm Income. Ministry of Agriculture, Government of India, New Delhi.
Shetty, P.K. 2004. Social-ecological implication of pesticide use in India. Economic and PoliticalWeekly 39:5261–5267.
Stern, V.M. 1973. Economic thresholds. Annual Review of Entomology 18:259–280.Stern, V.M., Smith, R.F., Bosch, R. van den and Hagen, K.S. 1959. The integrated control concept.
Hilgardia 29(2):81–101.Tait, E.J. 1977. A method for comparing pesticide usage patterns between farmers. Annals of Ap-
plied Biology 86:229–40.Trumble, J.T., Carson, W.G. and Kund, G.S. 1997. Economics and environmental impact of a
sustainable integrated pest management program in celery. Journal of Economic Entomology90(1):139–146.
Valentine, W.J., Newton, C.M. and Talevio, R.L. 1976. Compatible systems and decision modelsfor pest management. Environmental Entomology 5:891–900.
Wu, L., Praneetvatakul, S., Waibel, H. and Wang, L. 2005. The impact of FFS on yield, pesticidecost and gross margin in shandong province, P.R. China: An econometric approach. In Ooi,A.C., Praneetvatakul, S., Waibel, H. and Walter-Echols, G. (ed), The Impact of FAO-EU IPMProgram for Cotton in Asia. Pesticide Policy Project Publication Series, No. 9, Institut fUrGartenbauokonomie, Universitat Hannover, Germany.

Chapter 5Eliciting Farmer Knowledge, Attitudes,and Practices in the Development of IntegratedPest Management Programs for Rice in Asia
James A. Litsinger, Edgar M. Libetario and Bernard L. Canapi
Abstract Much IPM technology for rice has been developed at research stationsin Asia but on the balance little of it has been adopted by farmers who find manyof the recommendations inappropriate. The farmer field school training method hasmade valuable inroads in overcoming this problem in that it has found that farm-ers value group learning and conducting farmer-led research which provides bothknowledge and gives the farmers tools to fine tune technologies. For more effectivetraining programs, extension worker and researcher team members need to betterunderstand farmers’ knowledge, attitudes, and practices. Anthropologists have de-veloped methods to elicit ethno-scientific cultural subjective norms and perceptionsfrom farmers which are discussed and complemented by surveys as well as othermethods developed by rural sociologists and IPM practitioners.
Keywords Farmers’ pest knowledge · attitudes and practices · ethnoscience · insectpest · weeds · plant diseases · vertebrate pests · agricultural extension · participatoryresearch · farmer survey methods
5.1 Introduction
Integrated Pest Management (IPM) is the farmers’ best use of a mix of controltactics that are biologically, environmentally, economically, socially, and culturallyacceptable (Kenmore et al. 1985). Decision makers will base their control decisionson their knowledge and perception of pests, ecological principles that govern popu-lations, their relationships to yield, and the interactions and cost-benefit of the mixedtactics. The first modern rice varieties were developed in the Philippines at the In-ternational Rice Research Institute (IRRI) in 1963, at a time when insecticide trialson IRRI’s experimental farm recorded losses (mainly from stemborers) of 30–40%(IRRI 1964, Pathak and Dyck 1973). But such losses were not typical of farmers’fields as the trials were performed on highly stemborer susceptible varieties. Such
J.A. Litsinger (B)IPM and Farming Systems Specialist, Dixon, California, USAe-mail: [email protected]
R. Peshin, A.K. Dhawan (eds.), Integrated Pest Management: Disseminationand Impact, DOI 10.1007/978-1-4020-8990-9 5,C© Springer Science+Business Media B.V. 2009
119

120 J.A. Litsinger et al.
published high losses from insect pests, unfortunately, set the mindset of policymakers to believe insecticides were as necessary as fertilizer in order to attain thepromised yield potential of the new semi-dwarfs. A dependency of insecticide usageemerged for insect pest control which began in the 1950s and peaked during thefarmer adoption period of the new rices (Kenmore et al. 1987). Before the conceptof IPM was developed (Stern et al. 1959), ecological principles of pest managementwere largely unknown thus insect pest control stresses the use of insecticides.
The Green Revolution, initially based on prophylactic insecticide applications,produced unforeseen economic and environmental costs (Kenmore et al. 1987). Out-breaks of insects that were formerly rarely encountered were facilitated by the newlyconstructed irrigation systems that prompted even more insecticide usage supportedby government subsidies and loan schemes (Litsinger 1989). The brown planthop-per Nilaparvata lugens became the prime target and chemical companies focusedon new insecticides while breeders developed new resistant varieties (Heinrichs andMochida 1984). Resurgence causing insecticides promoted new brown planthopperbiotypes to be selected to overcome resistant rice genes (Gallagher et al. 1994). Asa consequence rice IPM was initiated in 1978 in Asia by Ray Smith, the father ofIPM, with a training course in the Philippines (Smith 1972, Philippine Bureau ofPlant Industry 1978). The FAO Inter-Country Program for Integrated Pest Controlin Rice in South and Southeast Asia followed on which extended IPM to farmersthrough Farmer Field School training programs (Matteson et al. 1994).
Ecological studies showed resurgence caused by insecticides destabilized thebiodiversity of insect species such that it was impossible to predict their populationdynamics (Heong 1998). As a consequence, food-web chain links were shortenedfrom loss of general and specific predators, natural enemy populations were deci-mated and slow to recover, and secondary pest development occurred (Cohen et al.1994).
IPM on rice initially began with the use of insect pest and disease resistant vari-eties (Khush 1989) supplemented with insecticide usage based on decision thresh-olds. Work on economic injury levels began at IRRI in 1972 (Dyck et al. 1981).On-farm yield loss trials began on rice as part of the Cropping Systems Programat IRRI in 1976 (Litsinger et al. 1987) which provided the basis for the setting ofthreshold levels (Litsinger et al. 2006a,b,c). Waibel (1986) and Smith et al. (1988)showed economic thresholds were economical. Although economically attractive,adoption of rice IPM has been relatively low. While research continues to build onan immense body of knowledge within agriculture, it has also become increasinglyclear that much of the post-Green Revolution knowledge does not reach farmers’fields (Price 2001). When it does, the predicted impacts often do not occur. Farmers’misperceptions was one part of the problem as they tended to overestimate the lossesof pests and feared pest outbreaks if they did not use insecticides.
Goodell (1984a), in her anthropological village studies conducted during IPMtraining courses, also concluded that pest control is the most difficult aspect of sci-entific agriculture for small-scale farmers living in developing countries to master.Bernsten (1977) had come to this same conclusion. Of the various components ofmodern agriculture, IPM presents by far the most difficult challenge as farmers make

5 Development of Integrated Pest Management Programs for Rice in Asia 121
the transition to scientific farming. The demands of irrigation, chemical fertilizers,and even of standardized agricultural credit follow more or less understandably fromthe operations of traditional farming and permit a considerable degree of self in-struction through experimentation. In contrast IPM requires the farmer to grasp a farmore complex set of concepts, much of which is often anything from self-evident,standardized, or amenable to trial and error learning.
A conclusion of the IRRI Constraints Program in Indonesia was that greater skillwas needed by farmers to spray liquid insecticide than broadcast granules, and thatspray volumes were lower than recommended thus coverage was poor (Nataatmadjaet al. 1979). It was concluded that insecticides are too complex a technology forfarmers to efficiently utilize. Most are toxic only to specific pests, can be washedoff by rain, require being placed on a specific part of the rice plant, and mustbe mixed correctly. From the farmers’ perspective, IPM technology also is some-times counter-intuitive (Goodell 1984a). Certain expensive insecticides turn out tobe the cheapest when properly used, excessive insecticide use leads to resurgence,secondary pest outbreaks and pesticide resistance, and the proliferation of somearthropods which are beneficial turns out to benefit the crop. Farmers thereforeneed exceptional incentive and intensive training to gain command over even therudiments of IPM.
The degree to which farmers adopt new pest control technology depends ontheir understanding of pests, their familiarity with the control techniques, and avail-ability of resources for their purchase. Pest recognition is basic to efficient control(Litsinger et al. 1980). Kenmore et al. (1985) offered a range of constraints that limitadoption of IPM that are itemized as political, social, and perceptual aspects of IPMprograms that impede technology being used or hinder benefits from technologyfrom arriving after use.
Morse and Buhler (1997) offered a different prognosis. For them the commonperception of IPM was that it was born out of a crisis brought on by the unrestricteduse of pesticides. The crisis was most immediately felt by farmers, but rapidly im-pacted upon society as a whole and solutions were urgently needed. IPM becamethe answer for many. But they noted that the group which promoted IPM was notfarmers or politicians but scientists. They also noted that its promotion has beenextremely effective. Although IPM originated in developed, high-input agriculturalsystems in industrialized countries, it has been heavily recommended as the appro-priate system in developing countries even in areas that historically have not hadhigh levels of pesticide usage (Conelly 1987). This effort was meant to stop the pro-cess of the pesticide treadmill from ever developing but the reality was that pesticideusage in more traditional agriculture was prohibitively expensive for farmers (Jahnet al. 1997, Heong et al. 2002).
The most common reason given for the poor adoption is the pesticide industryand their so called pesticide lobby’s influence on governments. But problems havebeen put down to extension and research as well. It has been suggested that re-searchers are too narrowly focused within disciplines and lack holistic thinking. Incontrast IPM requires a team of biological scientists, socio-economists, and anthro-pologists who can bring their many skills to bear by capitalizing on interdisciplinary
122 J.A. Litsinger et al.
teams. However the skills to do this are not possessed by many natural scientistsgiven the fact that most of their work and training has been very narrow.
Morse and Buhler (1997) believe the main constraint to adoption is a fundamentallack of appreciation of farmers’ problems by IPM implementers. Taking farmers asthe starting point in the development process goes under the rubric of farmer firstwhich embodies a partnership with outsiders acting as catalysts or facilitators inthe agricultural development process (Chambers et al. 1989). It is interesting thatthe starting point is often IPM and the choice for farmers thus is limited. One canquestion whether this is farmer first as an a priori decision. Farmers may not havebeen asked if this is the approach that they want. Seen through this viewpoint, theevolution of IPM with all of its contradictions, failures, and frustrations becomes avery natural progress and poor adoption by farmers is easily explained – after all ifit is not really meant for farmers then why should they be expected to follow it.
As in most traditional systems, rice farmers did not consider insect pests to beimportant compared to the other constraints they were facing such as drought andflooding. In other cases farmers agreed that insects were important but could donothing about them. They are willing to tolerate high losses given the high cost incash and labor for control measures. Many farmers have alternative income fromfishing, livestock, and other enterprises (Conelly 1987).
Traditional agricultural systems meet the test of sustainability but have not beenable to respond production-wise to the rate of human population increase (Litsinger2008a). Thus changes in traditional systems were necessary, but as Thurston (1990)argues, a thorough understanding of these systems is imperative as a first step be-fore changes are initiated. Part of this understanding involves learning about farm-ers’ knowledge, attitudes, and practices (KAP) (Tait and Banpot 1987). Farmers’decision-making process must be understood to understand the rationale of farm-ers’ pest management practices (Rola and Pingali 1993). Farmers’ pest controlactivities reflect their individual perceptions, not necessarily the actual situation.Most perception studies to date have not explained farmers’ behavior because theydo not differentiate between actual losses and farmers’ perception of those losses.Few KAP studies have been carried out to date, but of those that have, the primaryconclusions have been that farmers cannot differentiate between pests and naturalenemies, they are unskilled at applying pesticides, overuse them, and apply at thewrong time (Heong et al. 1994, Price 2001). New understandings are forthcominghowever (Heong et al. 2002). Eliciting of KAP typologies and paradigms falls in therealm of ethnoscience.
5.1.1 Ethno-Science
Modern agriculture is based on the scientific method. While farmers follow anothermethod based on their own understanding of what they consider as significant fac-tors and relationships in their environment and how these can be combined to forma workable whole (Brosius et al. 1986, Nazarea-Sandoval and Rhoades 1994). The

5 Development of Integrated Pest Management Programs for Rice in Asia 123
output of science is publications while for farmers it is energy, food, and survival.Systematic approaches to applied ethno-science are scarce and remain primarily thework of anthropologists. Ethno-science focuses on probing culturally relevant do-mains of indigenous people to derive folk taxonomies, hierarchies, and paradigms.Farming is an activity of indigenous people based on their own understanding ofwhat they consider as significant factors and relationships in their environmentwhich is known as their ethno-science and how these can be combined to form aworkable whole (Nazarea-Sandoval 1991, Nazarea-Sandoval and Rhoades 1994).This is a different reality than what researchers who follow the scientific methodperceive. It is unclear whether farmers perceive pests as a threat to yield or as fel-low creatures with a legitimate claim for their fair share (Brown and Marten 1986,Bjornsen-Gurung 2003). Farmers’ knowledge about their environment and their be-liefs concerning it are termed the cognized model or a subjective norm. Nature isseen by farmers through a screen of beliefs, knowledge, and purpose and it is interms of their images of nature, rather than on the actual structure of nature, thatthey act (Brosius et al. 1986). Yet it is upon nature itself that they do act and it isnature that acts on them, thus transactions between farmers and the environmentare guided by images of nature as perceived by them. These images or conceptu-alizations are partly responsible for determining how farmers evaluate, decide, andbehave given certain conditions and alternatives in their daily lives. The cognizedmodel represents farmers’ understanding about their world.
5.1.2 Why Study Farmers’ KAP
Exploring farmers’ perceptions and knowledge allows us to clarify definitions touse the proper language and farmers’ logical framework (Bjornsen-Gurung 2003).All these elements facilitate communication and thus are very important for IPMprograms. Ethno-agronomy is the subset of the cognized model that takes into ac-count the indigenous knowledge of farmers (Nazarea-Sandoval 1991). The cognizedmodel is perpetually interacting with the operational reality in which farmers findthemselves – absorbing, discarding and continuously being refined by experiencesand perceptions. At the same time it guides choice and behavior by influencingdiscrimination and explorations. Farmers cannot act on agricultural options that areunrecognized or those that are so unfamiliar that they provoke feelings of incom-petence or inadequacy. Neither can they incorporate strategies that are deemed tobe essentially incompatible with the existing system of production and rhythm oflife’s activities. In order to design and promote agricultural development programsthat have a better chance of passing thorough the farmers’ filtering systems andbeing seriously considered, researchers need to understand the ethno-agronomy ofthe indigenous farmers.
Farmer knowledge can differ profoundly from scientific knowledge but both havestrengths and weaknesses. Farmer knowledge was valid in the past but failed to adaptto the rapidly changing rice technologies that followed modern rices. Among the

124 J.A. Litsinger et al.
Tharu of Nepal the majority of farmers still perceive their knowledge and practicesas inferior to externally promoted technologies (Bjornsen-Gurung 2003).
Farmer surveys should precede applied research to ensure it is not merely anacademic exercise, but before we start our discussion we need to distinguish be-tween two cultural types of farmers’ systems, traditional and modern, and knowtheir characteristics. Discovering orderly principles for commonly occurring faunain farmers’ fields is a prerequisite for understanding the selection of managementpractices in decision making.
5.2 Two Types of Farming Systems
The first are farmers who cultivate crops using traditional practices with very fewpurchased agro-inputs such as fertilizers and pesticides. For these groups of farmersit is important to study their current systems both to learn of potential new prac-tices but also to understand the system’s subcomponents. The development strategyfor such a system is making small improvements rather than replace practices withhigh input agriculture. Unless dynamic changes such as opening a market nearby oraccessible credit at low interest, farmers will persist to be risk adverse and will notadopt modern practices wholesale.
The second group represents those farmers who already have adopted modernpractices with the objective to rationalize their use of pesticides and inject alterna-tive, more sustainable practices. In this case studying KAP is crucial in being ableto address their misconceptions in order to more effectively change them. It is stillpossible to learn of useful indigenous practices that they developed. Agriculturalextension efforts focus more on this group of farmers.
5.2.1 Traditional Low Input Systems
Traditional agriculture usually is associated with primitive agricultural systems orpre-industrial peasant farming. Poverty and socio-economic insecurity characterizethe lives of many rural people and are exacerbated among the vast number of smallor traditional farmers who often have few resources beyond the labor of their fami-lies. However traditional farming usually is based on agriculture that has been prac-ticed for many generations (Thurston 1998). The accumulated knowledge wouldbe considerable as man began crop production 10,000 years ago. Some 60% of theworld’s cultivated land is still farmed by traditional and subsistence methods (Altieri1984). Small farmers have developed complex farming systems that have allowedthem to meet their subsistence needs for centuries even under adverse environmen-tal conditions (marginal soils, in drought- or flood-prone areas and with scarce re-sources) without depending on mechanization or modern chemical inputs. Much ofthe information on indigenous and traditional agriculture is anecdotal rather thanexperimental, much to the chagrin of researchers.

5 Development of Integrated Pest Management Programs for Rice in Asia 125
Altieri (1984) pointed out that in Latin America, at the end of three projects, anevaluation team concluded that no significant new technological packages capableof yielding increased net returns could be offered to the peasants. More holisticapproaches were needed that entailed a deeper understanding of: (i) present farmingpractices, (ii) why they were practiced, and (iii) what is required of a new technologyif it is to be accepted. Researchers have failed to consider basic features of low inputpeasant agriculture such as ability to bear risk, labor constraints, symbiotic cropmixtures, and diet requirements that determine the decision criteria and resourceuse by farmers.
Among primitive and peasant societies, cultural values and attitudes, beliefs, andbehavioral patterns often play an equal or greater role than economic considerationswhen deciding whether to accept or not new production practices (Thurston 1990).Kinship obligations, peer group pressure, fatalistic beliefs, negative social sanctionsregarding accumulations or surplus, individuality, caste differences and constraints,and the perpetuations of common traditional values through family socialization allrepresent serious challenges to outside change agents. Researchers must appropri-ately address problems in the context of farmers’ systems before efficient, proventechniques can be disseminated to other farmers. Understanding traditional agri-cultural systems and taking them as a basis for development, including the use ofeffective traditional methods is the starting point for IPM (Matteson et al. 1984).The problem is that entomologists too often discount small farmers’ traditional pestcontrol systems. But not all traditional practices are environmentally friendly asbelieved by some by definition. Cultural practices, for example, include such eco-logically harmful activities as pouring kerosene and whale oil on the paddy water,use of nicotine and chili pepper sprays, arsenic laced chemicals, and the use of fire(Litsinger 1994).
The basic premise is that appropriate technology for farmers must emerge fromagro-ecological studies that identify the conditions influencing traditional croppingsystems. For example in Batangas, Philippines, farmers grow dryland rice by directseeding in furrows and even perform inter-row cultivation for weed control withthe same implement (lithao). The main weed is nutsedge Cyperus rotundus whichcannot be controlled by normal cultivation and hand weeding is too expensive. Thusfarmers run a spike-toothed, box harrow at 45◦ angles to the rice rows during thefirst month of rice growth, to uproot nutsedge but also ripping out some rice plants.This occurs repeatedly until canopy cover. Farmers overseed to compensate. Themethod works satisfactorily except in years of frequent rain during the first monthafter crop emergence making the soil too wet for the animal drawn implements to bepulled. Still until a better method to control nutsedge is found, farmers will continuewith their traditional method. A similar remedy was developed in rainfed wetlandrice in S. Asia called the beusani system for grassy weed control (Fujisaka 1991).
An analysis of small farm systems cannot be done from a conventional farm-management appraisal whereby labor scarcity, small farm size, lack of modern tech-nology, or low land productivity are singled out as the main constraints(Altieri 1984). Although the productivity per unit of land may be low, the farmermay obtain a high level of productivity from other resources which are scarcer

126 J.A. Litsinger et al.
to him, or unknowingly enhance the energy efficiency of his cropping system bymaximizing the ratio of food calories obtained to cultural energy investment. Thusmeaningful analysis must incorporate the farmers’ management standards and farm-ers’ production criteria, especially with regard to risk. Risk avoidance is traditionallyexpressed through farm diversification, often by using products of one enterprise inthe production of another. A common example is a crop-livestock system.
A first step towards the development of successful IPM strategies adapted tofarmers’ realities is an understanding of farmers’ perceptions of pests, existing con-trol methods, and costs and efficiency of control measures (Adesina et al. 1994).But there are strong arguments to build IPM strategies on the indigenous knowl-edge base of farmers. One should do so knowing there are likely to be gaps in theirknowledge, especially on biology and ecology. Thus studies should focus on bothaspects. Social and biological scientists should work closely together to understandfarmers’ perceptions in order to enhance their management skills.
5.2.2 High Input Farming Systems
Adoption rate of IPM technologies by farmers who have embraced modern vari-eties and agro-inputs is determined by the degree of relevant site-specific adaptiveresearch that is performed to identify the best fit of modern and traditional agro-nomic and pest control practices (Reichelderfer and Bottrell 1985). As a part of theknowledge required to undertake this process, researchers’ understanding of farm-ers’ current practices and the basis for them is a key component which is efficientlycarried out by a characterization of the stakeholders. Farmers often have not hadadequate training and misapply inputs such as injudicious insecticide usage whichaffects the stability of the agricultural system (Heong et al. 2002).
5.3 Useful Purposes for Eliciting Information
There are many useful reasons for gathering information from farmers in their com-munities with regard to IPM. Part of the problem is that local knowledge is relativelyunformulated and for this reason is difficult to access (Trutmann et al. 1993). It isalso a farmer’s problem. There is no forum, no institutionalization that could leadto the pooling, exchange, and local assessment of this knowledge. Consequentlyfarmers are forced to be inquisitive and innovative, but beneficial ideas of one farmerare often not extended to other farms.
5.3.1 Discovering Indigenous Technologies
Reasons to study agricultural activities of traditional farmers are first that sometraditional farming systems have excellent records of research management and

5 Development of Integrated Pest Management Programs for Rice in Asia 127
conservation (Thurston 1990). Systems that have lasted for millennia justify seriousstudy, although practices and systems developed by traditional farmers are not al-ways successful. Second, as many traditional practices are labor-intensive; this as-pect may be important and attractive in societies having an abundance of labor,chronic unemployment, and lack of jobs in urban areas to pull them away fromfarms. Capital and technical skill requirements of traditional technologies are gen-erally low and adoptions often require little structuring of traditional societies.
Although considerable evidence shows that traditional farmers experiment andinnovate, most useful traditional methods of agriculture probably were developedempirically through millennia of trial and error, natural selection, and keen obser-vation (Thurston 1990). Traditional systems, especially in the tropics, frequentlyresemble natural ecosystems that, with their high level of diversity, appear to bestable, resilient, and efficient. Traditional farmers are not always interested in thehighest yields but may be concerned more with attaining stable, reliable yields. Theyminimize risks and seldom take chances that may lead to hunger, loss of their land,and the need to seek work in low paying jobs in a crowded city.
Often traditional farming practices provide effective and sustainable means ofdisease control. Traditional practices and cultivars (land races) have had a profoundeffect on modern agriculture and most of our present practices and cultivars evolvedfrom these ancient techniques and plant materials. The agricultural system of tra-ditional farmers including their pest control practices are in danger of being lost asagriculture modernizes. Those practices should be studied carefully and conservedbefore they disappear.
5.3.2 Farmer-Led Research
Farmers, by the very act of farming, are carrying out adaptive research, a fact whichis often ignored by planners and scientists (Fujisaka 1991). “Farmer as expert” isthe credo of the farmer field school training method (Matteson et al. 1994). Farmersare professional specialists in survival, but their skills and knowledge have yet tobe fully recognized. The origins of many farmers’ contributions to current agricul-tural practices and to the research agenda are not well documented (Thurston 1990).Many ideas which have their roots in farmers’ minds and fields and are observed byresearchers, later become established as recommendations.
As Bentley (1992a) observed there is no way that scientists can develop all thetechnologies farmers need for the many different types of agricultural environments.Anthropologists can help the farmers undertake some of this adaptive research them-selves. They can help by figuring out what the farmers know and what the scientistsknow and then teaching the farmers what they need to know in a way that is con-sistent with what they already know. This sounds easy and obvious but in actualfact can take years to perform. Farmer-led research encourages farmers to under-take their own experiments. Some farmers are scientists who need to be sought outand to take part in farmer training programs. For example one farmer in Hondurasmade an artificial diet based on tortilla dough to rear armyworms to identify their

128 J.A. Litsinger et al.
parasitoids. Farmer-led research, if properly designed, can fulfill the large gap offine tuning technology to local environments.
Ooi (1996) found Indonesian farmers rely on knowledge developed by otherfarmers, reinvent ideas brought from the outside, and actively integrate them intocomplex farming decisions. Hence it is important to develop processes for farm-ers to learn how to answer their own questions. Experimentation is not alien tofarmers as they are continuously doing this as part of the farmer’s own agriculturalperformances. It is difficult for researchers to work with farmers but not the reverse(Bentley 1994). Farmers constantly experiment and some technologies spread spon-taneously such as modern varieties but rarely IPM. Although styles are different –farmers generally try one thing at a time using the field as the experimental unit,whereas scientists divide the field into small plots. Farmer participatory research isnot for beginners and requires a number of years for researchers to learn the process.Part of success in developing practical IPM systems in Zamorano, Honduras wasfilling in knowledge gaps of farmers and letting them develop the technologies.
In the past several decades, agricultural researchers have increasingly consid-ered farmers’ perspectives in asking and answering of problem solving questions(Fujisaka 1993). Farmer-oriented approaches have included building on indigenoustechnical knowledge and farmer participatory experiments. Such approaches incor-porate farmers’ knowledge in research formulation, involve farmers in testing ofinnovations, and complement research conducted in the developed world and inter-national research centers.
But there often is a social distance between university educated researchers andundereducated farmers. The social distance mentioned in Bentley and Andrews(1991) was ameliorated in part in IRRI’s on-farm research programs as researcherslived in the local town and work crews and staff were hired locally. Thus the staffwere the offspring of the targeted farmers and bridged the gap between researchersand farmers. It is the farmers who adopt and integrate technologies into their sys-tems. Farmers have both traditional- and outsider-derived knowledge as well asknowledge generated by their own experience. Many pest problems are new so thereis little traditional knowledge. Farmers have to live by their creativity and skills.Farmers undertake experiments by trying new varieties in small plots but their basisfor experimentation and invention is limited due to their scarce resources. Absenceof microscopes and knowledge of basic science limits their capabilities to observe.
Critics of the technological package approach to agricultural development chargethat past programs lacked understanding and appreciation of the ecological andsocio-economic milieu they are operating in, exclusion of the small farmer asboth collaborator and beneficiary, and inept promotion of inappropriate technol-ogy (Matteson et al. 1984). As a result the development and extension of improvedagricultural technology for small farmers in the tropics is being re-examined.
Interaction of researchers and farmers can insure appropriateness of new tech-nologies (Watson and Willis 1985). Inattention is more likely to lead to non-adoption. Farmers act in the present and researchers plan to prevent future problems.Better integration of these divergent approaches can help establish appropriate, sus-tainable, and socio-economically feasible agricultural techniques. Farmers’

5 Development of Integrated Pest Management Programs for Rice in Asia 129
knowledge is good for noting years and seasons of high or low pest infestations(time and season) as well as for spatial distribution in an area and ecological zones.
5.3.3 Facilitate the Extension Process
Studies of farmers’ knowledge should examine how pests are perceived as well asidentify gaps in their knowledge and important areas where natural scientists andextension agents could provide critical input to assist farmers (Adesina et al. 1994).It is important for social and natural scientists to work closely together in order tounderstand farmers’ pest perceptions, enhance their pest identification and manage-ment skills, and identify farm-level constraints to adoption.
The knowledge gap between what farmers know and what they should know isgreat thus research to integrate communication sciences and focus on the deliveryend of the science-practice continuum is most needed (Heong 1998). There needs tobe a synthesis and distillation of information such as heuristics which farmers cantest. Understanding how farmers make decisions is vital to being able to interjectchanges as needed. IPM is often developed with little understanding of farmers’objectives, needs, and constraints.
Matteson et al. (1994) concluded many farmers are too indoctrinated to contem-plate the possibility of not using insecticides. They excuse the insecticide’s lack ofvisible effect on the crop based on the assumption that losses would have been worsewithout treatment. Developing countries’ farmers have developed an ingrained, un-critical, and dependent attitude toward pesticides. That attitude exists because ofignorance, fear, and passivity. After four decades of demonstrations and commercialpromotions, some farmers are overconfident of their mastery of pesticide applicationand its value. Misunderstanding of costs and benefits makes simple prescriptions forprophylactic pesticide applications appear attractive and undemanding compared toIPM. Much of the insecticide is applied in a preventative manner and is unnecessary.An understanding of the roots of these misperceptions forms a basis for extensionprograms.
5.3.4 Compare Farmers’ Practice to National Recommendations
It is instructive to adaptive researchers that farmers have modified many recom-mended crop production practices including input usage (of seeding and agrochem-ical rates) and application frequencies. The current crop husbandry represents asynthesis of modern scientific farming (new semi-dwarf seeds and purchased chem-icals) with traditional practices (Goodell 1984). The outcome shows how farmershave adapted the new farming methods into their production system over a spanof less than two decades. Of twenty-one crop production and pest managementpractices evaluated, farmers and researchers agreed on only eight (Table 5.1). The
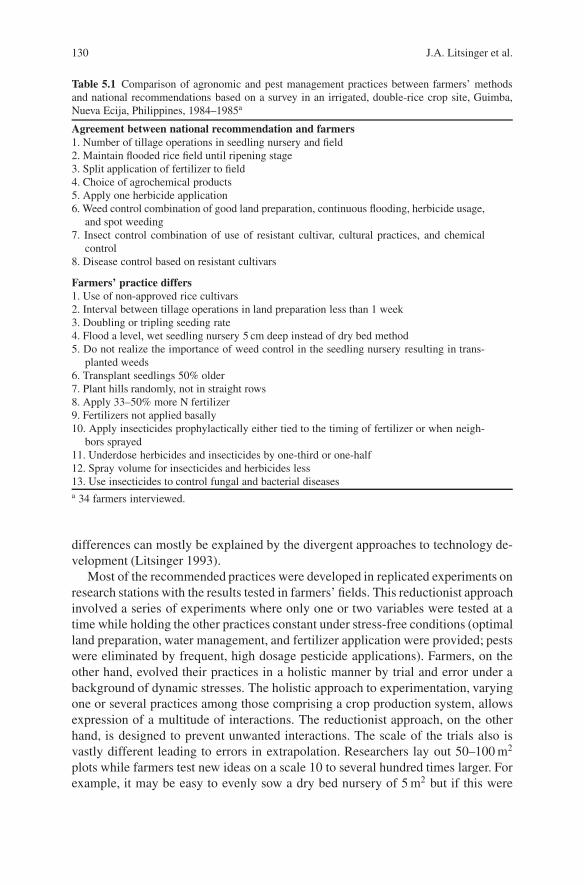
130 J.A. Litsinger et al.
Table 5.1 Comparison of agronomic and pest management practices between farmers’ methodsand national recommendations based on a survey in an irrigated, double-rice crop site, Guimba,Nueva Ecija, Philippines, 1984–1985a
Agreement between national recommendation and farmers1. Number of tillage operations in seedling nursery and field2. Maintain flooded rice field until ripening stage3. Split application of fertilizer to field4. Choice of agrochemical products5. Apply one herbicide application6. Weed control combination of good land preparation, continuous flooding, herbicide usage,
and spot weeding7. Insect control combination of use of resistant cultivar, cultural practices, and chemical
control8. Disease control based on resistant cultivars
Farmers’ practice differs1. Use of non-approved rice cultivars2. Interval between tillage operations in land preparation less than 1 week3. Doubling or tripling seeding rate4. Flood a level, wet seedling nursery 5 cm deep instead of dry bed method5. Do not realize the importance of weed control in the seedling nursery resulting in trans-
planted weeds6. Transplant seedlings 50% older7. Plant hills randomly, not in straight rows8. Apply 33–50% more N fertilizer9. Fertilizers not applied basally10. Apply insecticides prophylactically either tied to the timing of fertilizer or when neigh-
bors sprayed11. Underdose herbicides and insecticides by one-third or one-half12. Spray volume for insecticides and herbicides less13. Use insecticides to control fungal and bacterial diseasesa 34 farmers interviewed.
differences can mostly be explained by the divergent approaches to technology de-velopment (Litsinger 1993).
Most of the recommended practices were developed in replicated experiments onresearch stations with the results tested in farmers’ fields. This reductionist approachinvolved a series of experiments where only one or two variables were tested at atime while holding the other practices constant under stress-free conditions (optimalland preparation, water management, and fertilizer application were provided; pestswere eliminated by frequent, high dosage pesticide applications). Farmers, on theother hand, evolved their practices in a holistic manner by trial and error under abackground of dynamic stresses. The holistic approach to experimentation, varyingone or several practices among those comprising a crop production system, allowsexpression of a multitude of interactions. The reductionist approach, on the otherhand, is designed to prevent unwanted interactions. The scale of the trials also isvastly different leading to errors in extrapolation. Researchers lay out 50–100 m2
plots while farmers test new ideas on a scale 10 to several hundred times larger. Forexample, it may be easy to evenly sow a dry bed nursery of 5 m2 but if this were

5 Development of Integrated Pest Management Programs for Rice in Asia 131
done on a scale of 500 m2, the tedious work would result in less even seed distri-bution. Both researchers’ (reductionist/scientific) and farmers’ (holistic/-traditional)approaches have significant contributions to make, but the resultant best fit is highlylocation specific. In general, farmers need assistance in understanding scientificfarming while researchers need feedback from farmers on the performance of newtechnologies under farm conditions.
5.3.5 Training Needs Assessments
Often learning what farmers do not know is as important as what they know (Bentleyand Andrews 1991) as this will lead to what to focus on in training programs. Studieshave shown that beneficiaries of training programs, no matter what training topic,become bored if the material is already known to them. On the other hand, it isobvious that more time is needed to explain information that is less well known byfarmers. By prioritizing training efforts in terms of what is least known among theconcepts that should be learned, the courses can become more focused and there-fore more effective. KAP studies are instrumental in discovering what farmers donot know.
5.3.6 Undertaking Projects to Improve IPM
Most of the KAP studies were conducted either as part of regional projects toimprove local production or from exercises to improve extension methods. In theformer case a number of the studies were done in conjunction with farming systemsresearch that was embraced by IRRI in Asia or Zamorano Agricultural School inHonduras.
In Asia the most cited in this chapter is the study in Central Luzon, Philippinesthat involved the input of anthropologists and other social scientists working handin hand with biological scientists to test the farmers’ interest and ability to adoptIPM and examine socio-economic and organizational constraints to IPM at the fieldlevel, understand farmers’ KAP concerning pest control, evaluate IPM technologyon-farm, and incorporate IPM technology in an extension course for farmers and totest the course’s effectiveness as a method of technology transfer. The project latermorphed into the Farmer Field School method.
The Zamarano project also used the services of an anthropologist and was a longterm project to enhance IPM adoption among maize and bean subsistence farmersin Central America with many of the same objectives as in the Philippine project.
5.4 KAP Information Eliciting Methods
Elicitation of information from farmers by various methods should be confirmedby in-depth field observation of farmers’ behavior (Matteson et al. 1984). Some

132 J.A. Litsinger et al.
methods are descriptive of existing cropping systems and the array of farmers’attitudes and practices. Others are directed to pest control that describe farmers’perceptions and objectives and the control measures available to them (what meth-ods of control do they adopt, and when and at what level to use them). They mustalso assess which pests the farmer thinks attack crops, how often, what damageis thought to incur, what worst loss is thought likely to be, what control measuresfarmers are aware of, and how effective they are considered to be. Anthropologistsand ethnoscientists approach data gathering in a different manner than biologicalscientists. Pest management personnel are most interested in learning of farmers’control methods and their recognition of the most important pest problems. Anthro-pologist are interested in learning of farmers’ knowledge systems as a prerequisitefor constructive collaboration between farmers, scientists, and extension services.
5.4.1 General Information Elicitation Pointers
Gathering good data requires considerable familiarity with the farmers in terms ofproject objectives. It is best if enumerators are hired from the location itself and whoare familiar with local dialects and social conditions (Zandstra et al. 1981). Surveysto find the farmers achieving the highest yields and compare their practices to thosewith the lowest yields is a useful exercise when trying to improve farmers’ IPMpractices.
5.4.1.1 Stratification of Surveys
Surveys are normally stratified by location, farm size, rice culture, irrigation type,varietal class, subsistence vs. commercial, employment full or part time, ethnicity,or by ecological zones. Stratification allows for greater explanatory powers uponanalysis.
5.4.1.2 Accuracy of Information
Farmer surveys of all kinds involve an investment in time and resources, thus oneshould strive to conduct the inquiries in as efficient manner as practical. Adequatereplication will reduce sampling error. Within each stratification class at least 20farmers should be interviewed. During the process of analysis if questions arise onecan revisit the farmer for clarification or else follow-up surveys can be conducted.
In IRRI’s Farming Systems Program in Iloilo, Philippines, farmers said theirfarm size was significantly lower than it really was. They in turn may not knowthe real farm size as when fields were measured by a tape it was found that farmerswith small holdings overestimated and those with larger holdings underestimatedfarm size. Obtaining accurate yield data therefore is often difficult. In Thailand aconstraints study noted farmers tended to underestimate yields when compared tocrop cuts taken in the same fields (Adulavidhaya et al. 1979). Differences wereas high as 28% but in one location they overestimated by 15%. In Chhattisgarh, a

5 Development of Integrated Pest Management Programs for Rice in Asia 133
new state India, researchers at Indira Ghandi Agricultural University in Raipur whotook yield cuts and also interviewed farmers found farmers were conservative andunder-reported yield by some 10–15% on a regular basis. Their reason was to appearmore poor in order to receive entitlements handed out by government. Other sourcesof error are the measuring units used by farmers. In Chhattisgarh farmers measurerice seed used in transplanting by a box, but the size of the box varied from 2 to3 kg capacity depending on the location. Farmers also report yield in sacks and inthe Philippines these are 50 kg and in Chhattisgarh are 70–80 kg. The capacity ofthe sacks can vary a great deal and even the farmers’ memory of how many wereharvested can also vary as few take written records. Often a share of the harvest isgiven to harvesters who provide labor and is not counted as yield. The most accuratemethod is to undertake a total yield cut of 25 m2 in 5 stratified locations of 5 m2
increments in the field at harvest. Determining pesticide dosage is also dependenton knowing the area of the field, the concentration of the pesticide, and the volumeof material consumed.
Whatever method is used when asking farmers questions there is a need to focuson, a specific field, a specific crop, and a specific year for more accurate responses.For example, the question of “what insecticide do you use”, farmers may think youmean “have ever used” vs. “what I used last crop”. In such surveys one shouldask the farmer to reflect on the last harvested crop. All questionnaires should bepretested with five or more farmers for accuracy of wording and utility of questions.Each question should be carefully thought out and wording should be in the farmer’slanguage. Often farmers till several fields that may be widely separated thus it isimportant to have the farmer answer questions for one of these fields rather than allof them as the management may vary between them. Often fragmented fields are ondifferent soil types and some may be irrigated while others rainfed.
Questionnaires should be preceded by informal surveys to learn terms farmersuse and to develop ideas of the kinds of questions to ask. One should triangulatethe answers by using other elicitation instruments on the same farmer population.Informal inquiries can be followed by more formal ones. Direct observation shouldbe combined with surveys by questionnaire for verification.
The process of learning from farmers is iterative. Farmers’ responses lead to newquestions and thus more surveys. What matters more than how many farmers areinterviewed is what questions are asked. The sample size at the end of the iterativeprocess of multiple surveys may be in fact be large. In our opinion it is better toperform a number of successive surveys, each building from the last, than conducta single large survey where lengthy questions become tedious for farmers, resultingin less useful information.
Goodell et al. (1982) noted that if the interviewer were an outsider and notknown by the farmer then farmers may think the interview is a test. For example tothe question of how many insecticide applications were given last season, farmersmay want to please the interviewer and show they are a cooperating farmers withgovernment programs. They believed therefore that a “good” farmer would applypesticides more frequently. In fact we heard farmers state they sprayed weekly whenin the presence of government agents when in fact they only sprayed a few times

134 J.A. Litsinger et al.
a crop. Farmers are suspicious of outsiders that represent the government and thusmay underestimate yield and farm area. Therefore it is very important to instill trust.Once trust was established farmers were most vigorous in providing scientists withaccurate interpretation. One way to ensure trust is to hire field staff from the farmcommunity and to engage in long term contact. If these local people can be theinterviewers accuracy of information will increase.
5.4.2 Elicitation Methods
Methods fall into two major groups – informal and formal. Informal methods referto surveys undertaken without questionnaires.
5.4.2.1 Informal Survey Methods
During problem identification or when first working in an area, informal surveysare methods that can quickly gather broad descriptive data about farmers and localconditions. Informal interviews allow farmers and others to express their experi-ences without excessive structuring by the interviewer. This approach allows boththe interviewer and interviewee to pursue topics of interest freely and in depth.When interviews are conducted in a relaxed and friendly manner, the researchers andfarmers will have a chance to become better acquainted. This gives the researchertime to become acquainted with farmers’ vocabulary, concepts, and ideas. This formof inquiry should lead to a much deeper understanding of the farmers, their farm-ing systems and environment, how they reason, and their decision-making process.While informal methods have their disadvantages, they also have an important roleto play. They aid the team in quickly learning about farmers and farmers’ conditionsand obtaining an early appraisal of researchable problems and opportunities.
Participant Observation
This obvious method takes many forms starting with the most simple approach oftalking to a farmer either in his or her home or preferably in the field. Opportunitiesto verify farmers’ knowledge of pests can be realized by asking questions about apest problem that is in the field at the time of the encounter. This questioning willproduce the greatest accuracy in terms of what pest damage really looks like. Thedrawback is that only a few pests are likely to be in the field at any one day. Howeverthis method is best practiced by members of research teams who live in the area andconduct on-farm research trials, thus they are in the field almost on a daily basis andwill informally meet farmers throughout the crop cycle.
Weed scientists, Rao and Moody (1988), provided an example of participantobservation in Guimba, Philippines where three farmers were observed daily byA. N. Rao who lived at the site for a cropping season. Each day he visited thefields of the collaborating farmers to observe their work and condition of the crop.While time consuming this did lead to a number of discoveries of hitherto unknown

5 Development of Integrated Pest Management Programs for Rice in Asia 135
weed problems and the farmers’ perception of those problems along with developingpractices in dealing with them. Participant observation is useful for learning aboutpractices that the interviewer is not aware of and thus will not ask such questions ashe or she has never seen the situation before.
Photos of pests and their damage were used in early studies (Litsinger et al. 1980,Heong 1984) but it was found that farmers could not conceptualize many groups ofpests by this method. Farmers recognized the larger insects such as mole cricketand rice bug but not smaller ones. Damage, small insects, or disease were leastrecognized from photos that were not life size. In Malaysia, farmers were able torecognize tungro from photos (Heong 1984), but other diseases are less recogniz-able. Nazarea-Sandoval (1991) underscored the problem with photographs as wellas even specimens taken out of the field. In her typology of Laguna farmers she cate-gorized arthropods on the basis of locomotion, sound, and smell over morphologicalones. She added that farmers’ inability to respond correctly to static or inanimatespecimens could be easily misinterpreted to mean lack of knowledge when actuallythe informants were more attuned to discriminating among live ones that move,buzz, exude odors, and bite.
An improved method was employed to bring specimens of insects or damagedplants for farmers to identify (used by Litsinger et al. 1982 and Fajardo et al. 2000).Interviewing in the field is even a better method but is more time consuming (Fu-jisaka et al. 1989). In that way farmers can see the distribution of damage whichis diagnostic for some pest groups (occurring in patches) that can be differentiatedfrom soil problems (general uniformity) for example.
Participant observation, of course, is the method of choice of anthropologists.A deeper engagement in participant observation, involves actually living with afarm family over a season or more. Grace Goodell lived in three villages in C.Luzon, Philippines for 2.5 years and observed farmers’ behavior firsthand regardingtheir farming practices including pest control. Other anthropologists such as GrettaWatson who lived among farmers in Kalimantan, Indonesia for more than a yearproduced insights on farmers’ KAP that would not have been possible otherwise.Jeffery Bentley who worked in Honduras and Sam Fujisaka with IRRI spent weeksamong farmers but did not actually live in project villages, however their staff did.Support staff were hired from the local villages themselves thus they had familiaritywith the location and farmers. Often in sites several ethnic groups live in the areathus it is important to have field staff who are from each of the groups in order tocommunicate effectively.
Role of Anthropologists
High input systems such as irrigated rice have generally been left to economistsbut the attraction to indigenous knowledge has gone hand in hand with low-inputsystems (Price 2001). This is in part due to the unique abilities of anthropologists forlanguage and behavioral analysis. Several variables may influence the way in whichresearchers perceive the knowledge of farmers: (i) the scientists’ values, (ii) as-sumptions about the nature of scientific knowledge, (iii) dislike of simple technical

136 J.A. Litsinger et al.
alternatives, and (iv) unjustified assumptions about the farmers’ constraints and op-portunities (Moody 1994). Scientists have rarely investigated the reasons behind thepractices that farmers mentioned. Thus the science underlying rational practices andmyths behind “not-so-scientific” practices have not been understood. Considerationof the farmers’ values instead of the superimposition of researchers’ values on thoseof the farmer are valuable (Altieri 1984). Therefore the input of social sciences inmulti-disciplinary research teams becomes imperative.
Anthropologists, archeologists, ethno-scientists, and geographers and to a lesserdegree ecologists, economists, and sociologists have more disciplinary tools tobetter understand traditional agriculture than is the case for biological scientists(Thurston 1990). Those in the agricultural sciences seldom take courses in thesedisciplines or read much of their literature with the occasional exception of ecol-ogy and economics. Likewise professionals in non-agricultural disciplines often donot read agricultural literature or take courses in production sciences. Consequentlyeach discipline develops a separate language that is often unintelligible to outsiders.
Recently anthropologists utilized free listing, pile sorting, and triad testing tomeasure ethno-entomological knowledge in the Philippines and Nepal (Price andGurung 2006). Free listing is an exercise to elicit as many arthropod names as existin the particular tribe being interviewed. Pile sorting is an exercise in validating thelist and triad testing determines the classification system used. In triad tests, farmerswere asked to observe three items and to isolate one on the basis of perceived differ-ence and pair two on the basis of similarity. They were asked about the basis for theirchoice. Nazarea-Sandoval (1991) added another method which asked one farmer todescribe an arthropod to another farmer without the latter seeing the arthropod byfacing the other way. The exercise was performed as a contest or game to get thefarmers more interested in cooperating.
Farmers and scientists share different knowledge bases and can learn much fromeach other (Bentley 1992a). Scientists are generally reductionists and miss manyinteractions as they do not farm or put the system together as farmers do. On theother hand, farmers lack knowledge on ecology and biology. It is a role of socialscientists (particularly anthropologists) to bring the two together.
While it is highly useful to have anthropologists join a team of economists andbiological scientists, often distances between disciplines and personalities get inthe way of smooth working relationships. Each side must exercise patience. Beloware some of the contributions and insights that an anthropologist provided when shejoined a multi-disciplinary team; these were summarized in a workshop held at IRRIon the topic (Goodell et al. 1982):
1. The role as mediator between farmer and scientist could only be temporary andshould not be used a crutch for either party in the process. Agricultural scientistsare a part of the farmers’ world and vice versa so they must learn to deal withone another,
2. Farmers are often reluctant to deal forthrightly with scientists and their staff,3. Initially the farmers were suspicious of the motives of the anthropology team
members. A strong peasant movement in C. Luzon in the late 1940s and 1950s

5 Development of Integrated Pest Management Programs for Rice in Asia 137
left no socio-political structures in tact and few active local leaders; indeed itmade the rural population highly suspicious of outsiders, especially young orga-nizers, and
4. The anthropologist sees technology as a process in any society’s growth. Whenscientists are working in a highly competitive sector of a society with a longhistory of colonialism, they must be aware of farmers’ timidity, obedience, anddependence. Scientists developing technology for farmers must bear in mind theinfamous history of middlemen who buffer the elite from the farmers and viceversa. The role of the anthropologist was in forming lively farmers’ organizationsby helping farmers make scientists interact with them directly as partners in theirown development. Because few scientists considered farmers’ frank exchangeas a requisite to technology development, the anthropologist’s systematizing offarmers’ feedback was a service to the scientists themselves. She proposed thatfarmers might make more lively partners if they interacted with scientists ingroups (consolidated by mutual interests and the routine practice of some formof collective action) rather than as individuals in the long, formal, one on onestandard interviews IRRI is famous for.
Use of Para-Anthropologists
An experiment was conducted in the Zamarano project of training agriculturalists inanthropological techniques, to become para-anthropologists (Goodell et al. 1990).Not explicitly identifying themselves with the project, the para-anthropologists fol-lowed open-ended inquiry techniques to corroborate, at the local level, informationalready obtained through national and regional surveys and reconnaissance surveys,such as rural health and education conditions, the role of women, farm familiesrhythm of work and expenditure, off-farm economic opportunities, and communitypolitics. The para-anthropologists downplayed their knowledge of agriculture in or-der to encourage the farmers to teach them what they knew and were learning fromthe project. After an initial period in the field, these informal investigators chose keyinformants representing a range of farmers stratified according to wealth, educationlevel, initiative in and receptivity to innovation in agriculture and the home economyand industriousness.
The following are insights from the para-agronomists regarding procedural ad-vice on running a similar project:
1) Begin work in the collaborating communities several months before the re-search or extension team does,
2) Hold a meeting with as many villagers as possible to present some explana-tion for your presence in the community, so that they can give you an identity(though this need not be very detailed),
3) Expect your work to start slowly,4) Dress simply; avoid using details of dress which villagers associate with exten-
sion agents (e.g., caps, boots, uniforms),5) Do not use the same kind of motorcycle as technicians,

138 J.A. Litsinger et al.
6) Cultivate the villagers’ vocabulary,7) Do not show your knowledge of agriculture, you will get the root of their un-
derstanding if they feel they must explain the basics to you,8) Be willing to perform small favors for your informants, such thoughtful ges-
tures help cement personal relationships,9) If villagers see you frequently or for long periods of time with project staff they
will be less inclined to give you accurate feedback,10) Organize on a weekly basis the themes you want to investigate, the informants
will seek you out, and the outstanding questions left over from previous visitswhich you still want to pursue, leaving yourself some leeway for investigatingthe unexpected,
11) It is usually more efficient to conduct informal research in the late afternoonsor evening when farmers are not busy in their fields,
12) Keep a good sense of humor, don’t be aggressive, and be pleasant,13) Follow the villagers rhythm of life and participate in religious days and cele-
brations when possible,14) Every aspect of the work becomes easier during the second year, you will feel
less self conscious you will have friends in the village, and your teammates willrespect your work, and
15) If you are to be replaced have a few weeks overlap.
Role of Psychological Methods
Entomologists, attempting to change farmers’ behavior, have worked with behav-ioral scientists and have attempted to understand the farmers’ psyche to delve intohis attitudes and beliefs particularly in regard to insecticide misuse. The basic ideais to learn the current belief system in order to be able to change it. Bandong et al.(2002) undertook detailed interviews from farmers who recently applied insecticideto determine what motive did the farmer initially have in going to the field whenthe decision was made. Numerous studies have shown that farmers mostly react toseeing insect pests or their damage, although some apply in a prophylactic mannerbased on crop growth stage or react when they see a neighbor spray. Questionswere posed that followed up on what observations the farmer made: did he makethe decision from afar or did he enter the field to inspection plants, how often doeshe visit the field. What units of measurement were used in estimating pest density.What insect stage or damage symptom was measured. The researchers concludedthat in the absence of both extension workers and farmers’ organizations to provideguidance, farmers individually have evolved their own individual decision protocols.
Heong (1998) and Heong et al. (2002) have campaigned against overuse of in-secticides by farmers and have embarked on mass media extension programs toovercome this behavior. They have measured farmers beliefs, attitudes and subjec-tive norms through a series of statements posed to farmers and asked them to replyas to whether the statement as to how strongly they believed on a five point scalefrom “definitely not true”, “in most cases not true”, “may be true”, “in most casestrue”, and “always true” using prompt cards. Some of the statements were “applying

5 Development of Integrated Pest Management Programs for Rice in Asia 139
insecticides will increase yields”, “killing all insects is important”, “some insectsare beneficial to rice yields” and “insecticides are harmful to health”. They alsoelicited ways that they determine the harmfulness of insect pests and the role of peerpressure from government agents, chemical company representatives and people inthe village.
Heong and Escalada (1997a) stress that to change farmers’ misperceptions newelements must be introduced into the cognitive structure, e.g., different perception orinformation which introduces conflict to motivate change. They used psychologicaltheories to this end. The manner by which new information fits into the cognitivestructure will influence how it will be processed. New information which requiresless change in cognitive structures would have more chance of being accepted. Onthe other hand information which challenges the cognitive structure is more difficultto integrate and is likely rejected, or distorted to fit, or lead to a change in the cog-nitive structure itself. When faced with uncertainty people often use decision rulesor heuristics. Heuristics are learned through experience. Without having to retrieveall the information in stored memory these simple rules help humans organize andinterpret new information. Cognitive dissonance is information that conflicts withexisting attitudes, choices or behavior that can lead to a state of psychological dis-sonance. This usually leads to a re-evaluation of the two choices. If given a simpledecision rule that is in conflict with prevailing perceptions is introduced would farm-ers be motivated to assess it in order to resolve their dissonance. The heuristic thatwas introduced was that early season defoliating rice insects do not cause significantlosses thus farmers should not apply insecticides for the first 40 days of a crop.Heong (1998) found that simple experiments established in farmers’ fields rapidlychanged their perceptions and attitude leading to less insecticide usage.
5.4.2.2 Key Informants and Group Interviews
Multi-disciplinary team visits and informal discussions individually and with groupsof farmers normally are carried out at the start of a project during the planningstages. This was used by Litsinger et al. (1980) in interviewing rainfed rice farmersin three sites in the Philippines as part of the Cropping Systems Program on-farmproject at IRRI. Informal group interviews particularly were held. Fujisaka et al.(1989), with the same objectives, also engaged in open ended, informal interviewsof individuals or groups of farmers. Such interviews served to elicit information onfarmers’ diagnoses of pest problems and traditional and current control practices.
Farmers are more comfortable in meeting as a group, but often only a few wouldtalk. Keep in mind that most likely the group will be composed of village leadersand may not be representative of the average farmer. Group interviews are a goodway to identify farmers who are the most innovative or to learn which ones normallyobtain the highest yields. They then can be interviewed to learn of their successfulmethods. Collective memory can be invoked in obtaining more accurate dates ofhistorical events such as pest outbreaks or to know how many markets are present orwhat sources of credit are available as well as other institutional services. A historyof other such projects that occurred in the past can also be obtained.

140 J.A. Litsinger et al.
5.4.2.3 Reconnaissance Surveys
The reconnaissance surveys are used most often by multi-disciplinary developmentprojects targeting a particular location. They tend to be quick, informal, or ex-ploratory in nature and are usually followed by formal methods. There are manyvariations with the rapid rural appraisal (RRA) being most known. These methodswere developed to produce a report within a month as previously lengthy baselinesurveys were carried out with the results seldom available within a year. RRA is aflexible, low-cost and time saving set of approaches and methods with appropriatecheck lists used by teams composing researchers, extension workers, NGOs, ruralbank staff, agro-input dealers, and key farmers to collect and analyze informationabout and from the rural people and learn of the conditions existing in rural areas.RRAs also have a secondary objective of team building among the members. RRAsprovide a thorough idea regarding problems, potentials, resources, and solutionsto formulate realistic development programs feasible to achieve within a specificperiod of time in a given rural locality or to use the information and analysis bystakeholders to formulate need based research programs to solve the problems ofrural people. The survey also relies on gathering of secondary data regarding soilsurveys, rainfall and climate data, irrigation systems, population studies, etc., fromdatabases as well as interviewing extension workers, bank officials, cooperatives,and other stakeholders if their members are not on the data collecting team.
Group members attempt to gain impressions of what enters into the farmers’decision-making with regard to their farming systems such as their knowledge andbeliefs, their obligations, their goals, and their perceptions of risk. At this stage theteam formulates hypotheses to explain present farming practices.
Reconnaissance surveys generally take 4–5 days once a region has been definedas the target for the project. The first morning may be spent eliciting informationfrom all the team members about their opinion of why farmers in the area are notgetting higher yields. Over the next several days the team members break up intosmall groups that fit in a vehicle and go to a specific village to interview farmers. Atfirst the groups are told to ask individual farmers to describe their farming systemin as much detail as possible including estimated yields and to prioritize farmers’constraints to higher production. Each team member will interview different farm-ers. In the afternoon the team members debrief and combine all of their findingsin a synthesized form on whiteboards with all looking on and participating. Keyfarmers who also make up the team members can provide input and clarification.From this initial description there will be questions about certain practices whichthen become the topic for the following day’s interviews. Team members go todifferent villages and continue the process. In the end a list of prioritized researchtopics is developed based on the findings which are then tested in on-farm trials.The more experienced the team members the better is the outcome of the initialworkshop and list of priorities for research. Secondary data is collected after thefieldwork.
Diagnostic surveys are a variation of reconnaissance surveys used to iden-tify farmers’ problems and causes with a focus on prioritizing research needs.

5 Development of Integrated Pest Management Programs for Rice in Asia 141
Diagnostic methods for rice research combine complementary, but still rapid, quali-tative and relevant quantitative methods, farmer interviews, field sampling, nationaland local level statistics and substantial inputs by other scientists after the field studyis completed (Fujisaka 1990, Fujisaka et al. 1991). Participants in the diagnosticsurvey should include extension workers and researchers from various disciplinesas well as some farmer leaders. Farmers are randomly sampled within villages andinterviewed preferably in the fields where crops and problems can be observed.Villages are randomly or purposively selected to represent differences within regionor environment.
Team members learn by doing and the first task is often to unlearn conventionalideas about farmers and their practices and about ways of interacting with farm-ers. The main technique is the informal, open-ended and interactive but structuredinterview. Rather than passively asking prepared questions and recording answers,interviewers are encouraged to think and interact by:
1. Understanding the broad issues being investigated,2. Constructing questions that reflect accumulating knowledge, make sense to re-
spondents, and result in useful responses, and3. Thinking about responses and then further probing with follow-up queries until
a holistic and internally coherent picture emerges.
Diagnostic surveys proceed from more general to more specific lines of inquiryas data and understanding are accumulated. Research seeks not only to describefarmer practices but also to understand the perceptions and technical knowledgeunderlying practices. It was assumed that understanding why farmers do what theydo (e.g., not using inorganic fertilizer because of the perception that soils becomecompacted) provides a necessary (although not sufficient) basis for research leadingto development and transfer of farmer-appropriate innovations.
Understanding of the whole farm system, which implies building on farmer prac-tices and perceptions. Farmers have adapted management strategies tuned to inter-acting opportunities and constraints. Farmer perceptions and knowledge (technicallycorrect or not) underlie practices and decisions. A diagram of a weed problem withits hypothesized causes is shown as an example of the output from a RRA (Fig. 5.1).This diagram serves as a framework for field research.
5.4.3 Formal Survey Methods
Informal survey methods have limitations because rigorous methodologies are notfollowed. Farmers interviewed may have been selected purposely and not randomlythus statistics cannot be used to summarize the data. Without a written question-naire, interviewers may not ask questions in the same way for each respondent.Thus quantification, coding, computer analysis, and summarization become moredifficult and the reliability of conclusions is more subject to question.

142 J.A. Litsinger et al.
Phalaris minorweed problem in
wheat
Continuous rice-wheat
Marketingproblem forsugarcane
Low-lying fields where sugarcane
does not grow well
Labor busy planting or harvesting sugarcane
Lack of handlabor for hand
weeding
Herbicide is not used
Herbicideapplications not
effective
Shortage offunds or
knowledge
Old oradulteratedherbicides
Herbicideapplied late
Herbicide applied at below
recommendedrates
Not appplieduniformly whenmixed with sand
or urea
Need to wait forthe first
irrigation beforeapplying
isoprotauron
Shortage of funds or
knowledge
Lack of suitablesprayers
Fig. 5.1 Causes of the Phalaris minor weed problem in wheat in the rice-wheat rotation as deter-mined by a rapid rural appraisal exercise. Tarai zone of India (Hobbs et al. 1991)
5.4.3.1 Participatory Rural Appraisal (PRA)
The PRA has much the same objectives as the RRA but the data are collected bythe farmers themselves with the assistance of a few facilitators. A PRA consists ofa series of data gathering exercises, each carried out for a different subject. Thedata is quantifiable as the sample of farmers often includes most of the villagers. APRA is more likely to be carried out by NGOs or government field staff wanting the

5 Development of Integrated Pest Management Programs for Rice in Asia 143
perspective of the farmers as the primary goal. The information is owned, analyzed,and used by local villagers. The focus of intervention is also more localized thusmore detailed information is taken of each target village.
Examples of some PRA exercises are given from an exercise conducted in twovillages (Chatoud in Arang block and Tarra in Dharsiva block) in Raipur districtof Chhattisgarh, India (IGAU 1997). Farmers could recall, when undertaking anhistorical time analysis, that the villages began in the late 18th century and therewere severe famines in 1900 and 1962 and severe droughts in 1953 and 1956. Mod-ern rices were introduced in the mid 1970s. In 1975, 1977, and 1983 there weresevere epidemics of gall midge which was resolved in 1984 by the introduction ofa resistant rice variety. An epidemic of armyworm occurred in 1985 was followedby one from the brown planthopper in 1990. Farmers were then asked to determinewhen major insect pests and diseases attacked their major crops during the year.They graphed the time of each crop on a crop calendar and pinpointed the periodsduring each crop when the pests were present in the field noting when maximumattack occurred (Fig. 5.2).
Pod borer
Thrips
Sheath rotStemborers
Blast
BlightStemborers
Whitebacked planthopperBrown planthopper
Jun Jul Aug Sep Oct Nov Dec Jan Feb Mar Apr May
Grasshoppers
Stem rot
Nematodes
Brown rust
RiceGallmidge False smut
Powdery mildew
Pod borer
Downy mildew
Bacterial leaf blight
Chickpea
Wheat
Lentil
Lathyrus
Fig. 5.2 Farmers’ perception of major insect and disease pest occurrence in the various croppingpatterns in a participatory rural appraisal in two villages (Chatoud in Arang block and Tarra inDharsiva block) in Raipur district of Chhattisgarh, India, 1995. Dark arrows indicate periods ofmaximum abundance (IGAU 1997)

144 J.A. Litsinger et al.
In the same PRA, matrix ranking exercises were carried out for the farmers todecide on what crops to grow and which varieties of each crop were the mostsuited in the area. In both exercises the farmers first decided on the criteria torank each crop and variety. Often insect pests and diseases were of concern andfarmers wanted to grow crops and varieties which had less pest incidence.In anotherexercise carried out by farmers and PRA facilitators (IGAU 1997), farmers wereasked to note changes and trends in agriculture that were occurring over the pastfive years compared to earlier times. Farmers noted that there was an increase inuse of purchased inputs such as fertilizers and pesticides and at the same time pestincidence was increasing which they attributed to the heavier usage of fertilizers.In the same exercise they noted that groundwater levels were declining which wascausing alarm.
Chhattisgarhi farmers were requested to list locally developed agricultural prac-tices or indigenous technical knowledge which resulted in a number of practices toprotect stored seeds from insect pests. A receptacle was made from mud which wasused to stored grain. Neem seeds and dried leaves were mixed with stored seedsin the mud sealed containers. Another method was to make a slurry of cow dungmixed with water into which seed was mixed in sufficient quantity to coat the seedswhich then were allowed to dry before storing. Farmers had two local methods forweed control. The first is beusani or bushening which is a locally developed weedcontrol practice based on tillage. Bushening is also a form of water conservationand is used in areas where irrigation or rainfall are unpredictable (Fujisaka 1991).In another exercise farmers were asked to list all of the agricultural implements theyhave which would include pesticide sprayers. Finally farmers are asked to rank themajor constraints for their key crops and make a problem-cause diagram. In thediagram they made they pointed out the problem of pests and diseases as well aslabor shortage for weeding.
After reviewing the data from numerous PRAs we concluded that RRAs are moreappropriate for developing a research agenda whereas PRAs are best for extensionor implementing self help programs. PRAs have become very popular but oftenthe research teams that undertake them often think this is all they have to do tounderstand the practices and perceptions of farmers, but in reality the informationgathered has barely scratched the surface of uncovering technical constraints.
5.4.3.2 Surveys Using Questionnaires
Aside from PRAs, surveys using questionnaires are also very popular. Question-naires can be used for many purposes:
1. Documenting pesticide usage (kind, frequency, timing, dosage),2. Determining reasons farmers spray,3. Determining the most common target pests for sprays,4. Farmers’ knowledge and perceptions of pests, the damage they do, and control
measures, and5. Vocabulary used to name pests.

5 Development of Integrated Pest Management Programs for Rice in Asia 145
A select number of the surveys are described to give the reader a sampling ofthe kinds and purposes of the inquiries, most of which support ongoing researchor training activities. A series of interviews of some 100 farmers has been carriedout periodically since 1966 in C. Luzon by the Economics Department of IRRI(Cordova et al. 1981) called the “loop survey” as the towns where the survey wascarried out followed a circular route beginning in Bulacan province and onto SanJose, Nueva Ecija before turning westward to Tarlac province and then headingsouth to Pampanga province and back to Laguna province. This survey is unique inthat the same farmers were interviewed over time to recall their farm managementpractices over the previous season including all input usage.
IRRI’s Constraints Program included socio-economic baseline surveys that posedquestions on input usage such as agro-inputs (IRRI 1979). One of the earliest studiesof rice farmers in Asia that focused on pests, Litsinger et al. (1980), formed a ques-tionnaire to determine the capabilities of farmers to recognize pests and evaluatetheir importance. On-farm cropping systems studies were ongoing in the projectsites and responses from the farmers could be matched against field data collected onpest species and population levels. The study also hoped to reveal new pest controltechniques from farmers including new technology × technology or technology ×environmental interactions to be discovered by researchers and fed back to experi-ment stations.
A later study with a questionnaire in an irrigated rice site in Guimba, C. Luzon,Philippines was undertaken by an interdisciplinary team and found that farmershad reasons for not following many researchers’ crop production practices (Fajardoet al. 2000). The study concluded that future inquiries can evaluate more of thosereasons and determine in what areas farmers were ignorant thus needing greatertraining, or whether farmers’ actions had merit under prevailing conditions. A keyto the survey was forming a multi-disciplinary team so that input from diverse disci-plines could help guide the interpretation of farmers’ answers. The survey producedboth an agenda of verification trials and the need for more focused subsequentsurveys.
Surveys in Thailand, Cambodia, Laos, and Nepal, in rainfed areas followed onRRAs as part of the rice-wheat research consortium between CIMMYT and IRRIand the rainfed wetland and dryland rice consortia of IRRI and national programs(Fujisaka 1990). van de Fliert and Matteson (1990) undertook a farmer survey toobtain demographic data from Sri Lankan irrigated and rainfed rice farmers as wellas their KAP relating to rice pest control with a view toward training. Thereforethe questionnaire specifically delved into their media habits, organizational and re-ligious memberships, and the channels through which they get their information onnew rice cultivation practices. The data were used to design and evaluate a multi-media campaign in support of rice IPM extension and to set farmer training prioritiesfor the FAO IPM training program.
A series of surveys is important to being able to delve more deeply into farmers’reasons for undertaking their practices. Rubia et al. (1996) undertook a series ofthree surveys each with pre-tested questionnaires. The first was to learn the impor-tance of white rice stemborer Scirpophaga innotata to farmers. A second survey

146 J.A. Litsinger et al.
was conducted to determine farmers’ knowledge of white stemborer. A third surveyto determine farmers’ management practices.
Goodell et al. (1982) critiqued survey methods that called for the respondentsto recall over an entire crop which she felt was not as accurate as more frequentones. One study that followed this example was the study of farmers reasons to ap-ply insecticides which was carried out by interviews every few weeks with farmers(Bandong et al. 2002). When a farmer revealed that he had applied an insecticide hewas questioned in detail on the reasons leading up to making the decision includingthe target pest and on his method to assess its abundance, how he measured it, andthe reason for going to the field when the decision was made. He was asked to recallhis observations from the time he left his home.
5.4.3.3 Farm Record Keeping
The most rigorous data collection method is farm record keeping, an example ofwhich was carried out in the Philippines in four irrigated rice locations by IRRIbetween 1981 and 1991 (Litsinger et al. 2005). A research base for on-farm trialswas formed by renting a house in the rice community and hiring local staff fromeach area. The four sites spanned 23 crops in Zaragoza and 13 crops in Guimba,both towns in Nueva Ecija province in the heart of the Philippines largest rice bowlin C. Luzon, 17 crops in Calauan, Laguna 20 km from the IRRI campus, and 15crops in Koronadal in South Cotabato, Mindanao. Farm sizes ranged from <1–4 hawith land preparation done by rotary tillers.
Each season some 20–40 farmers were selected per site to note their farm op-erations particularly in regard to agro-input usage. Each farmer was given a smallnotebook for him or her to record all farm operations and input usage. They werevisited 3–4 times a season by local staff to check on the record keeping. In this waythe team could note trends and relate the insecticide usage to pest densities sampledin the field as part of a research project to develop action thresholds for insecticidedecisions. Additional surveys were done each season focusing on different relatedtopics and information was built up in an iterative approach.
5.5 KAP of Arthropod Pests
Price (2001) found that Filipino farmers could name 26 different insects in ricefields. A number of farmers’ classification systems were elicited by following thetriad testing and arthropod description games. Tagalog farmers in Laguna provincePhilippines first divided arthropods into harmful and harmless categories. Harm in-cluded crop damage (Nazarea-Sandoval 1991). Harmful arthropods were dividedinto those harmful to plants and humans. For arthropods that were harmful to plantsthe farmers made the distinction among those plant feeders that caused yield lossand those that did not. This is a very important distinction which not all indigenouspeople make. Among the harmless category farmers recognized useful arthropodsthat were food items, pollinators, or toys, while useless arthropods were divided into

5 Development of Integrated Pest Management Programs for Rice in Asia 147
those that made noise or emitted odor.The Tharu of Nepal recognized 80 arthropodsand classified them among the kiraa or those living animals that are harmful ei-ther directly or indirectly and include reptiles and even tigers (Bjornsen-Gurung2003). Arthropod classification is further divided by agricultural aspects followedby physiological-behavioral, ecological, and human directed features rather thanmorphology as in Western science.
5.5.1 Species Recognition Through Language and Observation
A precondition to an effective partnership between farmers and researchers/exten-sionists is effective communication. Communication is partly based on using a com-mon language. Language does not only consist of names and words, but also ofconcepts and frameworks. In the 1960s, cognitive anthropology and ethno-scienceevolved to gain a better understanding of how a culture perceives the universethrough its language (Warren 1989). Language can define a people’s physical, so-cial, and intellectual environments and how these knowledge systems enable deci-sion making process to function. For example, Indian rainfed rice farmers who havefragmented holdings do so on purpose having some in uplands and some in low-lands. They match the varieties with the topography and soil type and choose fieldlocations from inheritances in as many of them as they can as a risk aversion strategy.Having many names in a local language for soil types shows importance that the soilresource has in the life of the Indian farmers; contrariwise a lack of a name denotesnon-importance or lack of recognition (Hunn 1982). Interestingly Bjornsen-Gurung(2003) found that Tharu farmers recognize more insects than they can name.
In Chhattisgarh India, among the Tharu of Nepal (Bjornsen-Gurung 2003), andin the Philippines (Nazarea-Sandoval 1991) small scale farmers are hired as labor-ers by larger farmers and they, rather than the large scale farmers, better know theprevalent insect pests and can point out which ones that cause the damage. It isimportant for farmers to recognize the major rice pests. For example rice breed-ers have developed a number of varieties resistant to brown planthopper but notto its closely related whitebacked planthopper Sogatella furcifera. Filipino farmersdo not distinguish between the two species (Litsinger et al. 1980), while Indianfarmers do (bhura maho and safed maho). In addition confusion of two pests maylead to the wrong conclusions. Farmers in the Muda irrigation scheme in Malaysiaconfused symptoms of whitebacked planthopper with tungro virus disease (Heong1984). Thus farmers who assess whitebacked planthopper damage as tungro willembark on a multi-spray regime designed to kill a disease vector whereas white-backed planthopper, which transmits no disease, can normally be controlled withone application.
5.5.1.1 Grouping Many Species Under One Name
In Nicaragua one pest can have a number of local names in a single region anddifferent pests may be called the same in different regions (Bjornsen-Gurung 2003).

148 J.A. Litsinger et al.
In the case of pests of stored grain, while scientists may list 25 distinct species,Honduran farmers have only one term gorgojo that translates into “weevil”. Bentley(1989) found farmers lack knowledge on insect pests and often lump many speciesunder one name. Thus insects are categorized into grosser categories than is com-mon for plants or other phenomena of the natural world. They tend to gloss overmorphological and ecological differences. Bentley pointed out that the lack of dis-crete names for each species is not necessarily an indicator of a gap of knowledgebecause they know that stored grain is attacked by a different gorgojo but they usethe same name for all. The same farmers, however, have an impressive knowledgeof plant stages of common crops.
Filipino farmers were unable to identify some of the major pests at all and lumpedthem under general terms of “worms” or “hoppers”. Litsinger et al. (1980) foundFilipino farmers term greenhorned caterpillar Melanitis leda ismene, armywormsMythimna spp. and Spodoptera spp., and leaffolders Cnaphalocrocis medinalis andMarasmia spp. under the heading of “worms”. According to Waibel (1986) someFilipino ethnic groups use of the term “armyworm” is a proxy for all defolia-tors, but leaffolders were not mentioned. Leafhoppers are more prone to be rec-ognized as they dwell in the upper half of the rice plant and jump from plant toplant when disturbed. They are all lumped under one name generally includinggreen leafhopper that translates as “head of a horse” in Tagalog (Litsinger et al.1980). Planthoppers, on the other hand, are more sedentary and dwell at the baseof plants. But most Filipinos interviewed considered homopterans to be defoliators,only a few know they suck the sap. The category of “hoppers” includes not onlyplanthoppers but four or so leafhopper species. Even though there have been out-breaks of planthoppers in Malaysia, when pointed out brown planthopper was notseen as particularly worrisome, perhaps it is too small and was a new pest (Heong1984).
Dryland rice farmers in Claveria in N. Mindanao were shown samples of pestdamage or specimens which they were asked to identify (Table 5.2). The answerswere ranked into two categories. Recognition that an insect caused discolored grainswas given partial credit but full credit was given if the farmers named rice bugas the cause. Some 90% of farmers could recognize rice bug but only 32% knewthe damage it caused. Most farmers knew leaffolder damage was caused by an in-sect (58%) but only 37% could identify it. Both deadhearts and whiteheads can becaused by other phenomena than stemborers which must have confused the farmersas most did not name stemborers as the cause. Seedling maggots cause deadheartsand drought and blast disease can cause whiteheads. Scores may have been higherif the exam were done in the field. Only 37% of farmers knew root aphids werethe cause of their characteristic damage. Whereas a total of 74% knew the damagewas caused by an insect (37% + 37%) and one quarter of farmers did not recognizethem. Some 90% of farmers knew the damage caused by seedling maggot was aninsect but only 10% knew it was a fly. The brown planthopper and green leafhopperare present in dryland rice but none was recognized as they are of no economicimportance. Whereas most wetland rice farmers in the Philippines can recognizethese two common insect pests.

5 Development of Integrated Pest Management Programs for Rice in Asia 149
Table 5.2 Farmers’ recognition of dryland rice pests based on actual specimens or damage.Claveria, Misamis Oriental, Philippines, 1986
Specimen Level of recognition(% farmers responding)a
Full Partial
Rice bug adult 90 8Discolored grains (rice bug damage) 43 32Leaffolder-damaged plant 37 58Stem borer deadheart 37 52Root aphid damage symptom 37 37Stem borer white head 35 50Defoliation from leaf feeder 30 63Termite/white grub/cricket-damaged plant 18 78Seedling maggot-damaged plant 10 80Brown planthopper 0 28Green leafhopper 0 30a n = 60.
All stemborer species in the Philippines and India fall under the same name eventhough there are at least three species having distinctly different moth morphologies(Litsinger et al. 1980). In India stemborers are lumped under one name tana chedakwhich translates as stemborer.Farmers’ perception of a pest is influenced by theirobservations, knowledge, and experience in the field as well as their interactionswith extension workers, researchers, the mass media, their observations and experi-ence, chemical sales agents, family, other farmers, and available control technologyas a conceptual framework (Rubia et al. 1996)
Bentley (1992b) concluded that farmers’ knowledge worldwide of pests is un-even but follows a similar pattern. He proposed that farmers’ pest recognition couldbe characterized along two axes describing: (i) ease of observation of the pest phe-nomena and (ii) the importance according to the farmers’ perception, not necessar-ily the scientists’ perception. Thus farmers recognize species of arthropods morereadily which were both important and easily observed. While arthropods that wereunimportant and difficult to observe tended to be poorly understood. There are othercriteria as well.
5.5.1.2 Criteria for Recognition
Many researchers have noticed that cultural importance and morphological at-tributes are key to folk classifications of arthropods. Bentley and Rodrıguez (2000)constructed a folk classification in Honduras which was partly based on physicalappearance of the different arthropod groups such as Linnaean orders and majorfamilies and partly based on cultural value. Species that were easy to observe werethose that were large (“hard to ignore and therefore named”), social, colorful, abun-dant, noisy, and diurnal. Recognition based on utility was based on being a pest ofcrops or humans or livestock, dangerous or painful, used for games, toys, ornaments,rituals, or art.

150 J.A. Litsinger et al.
5.5.1.3 Size
In many situations farmers are elderly and their eyesight is generally not good(Matteson et al. 1994). This faculty needs to be taken into consideration when train-ing farmers to monitor smaller pests. Most farmers overlook insect pests due totheir small size and inconspicuousness. Only 45% of farmers in the Ivory Coastwere able to identify some rice insect pests representing both dryland and wetlandenvironments (Adesina et al. 1994). There were terms for small flies used by thosefarmers but none was associated with gall midge that damages rice.
Interestingly a high proportion of Malaysian farmers (38%) could not name anyrice insect pests (Heong 1984). Even though the main insect pest reported was stem-borers, still some farmers believed that deadhearts were attributed to the “wrath ofthe moon”. Other pests mentioned were large including Leptocorisa rice bug andblack bugs Scotinophara spp., the latter are cryptic in nature. Farmers would en-counter black bugs while weeding. Rice bug names translate as “bad odor” as wellas “beetle”. Some tended to associate any worm found in the field to be a stemborer.Farmers in C. Luzon, Philippines, in the past thought that a second crop of riceplanted in the dry season would die from hot dry wind which in fact was stemborerdamage (Cendana and Calora 1967).
Most farmers recognize the larger pests. For example in Leyte, rice bug is con-sidered as the most important insect as it is large and feeds on the grain (Heonget al. 1992). Most Leyte farmers have names for large insects such as greenhornedcaterpillar, armyworms, and leaffolder but most translate into “worm”. Greenhornedcaterpillar was commonly found in the Chhattisgarh rice plain but only womenhired for weeding and not the farmers could recognize it but still gave it no name.Leaffolder in Batangas uod sa dahon translates into leaf worm (Litsinger et al.1980).
5.5.1.4 Mobility
The more mobile insects such as leafhoppers and moths are more recognizable toFilipino farmers. There are half a dozen leafhoppers that feed on rice and they feedon the leaves and thus are prone to flight when disturbed. One leafhopper Nisia atro-venosa that feeds on nutsedge Cyperus rotundus growing in rice bunds was thoughtto be a rice pest because people saw it jump onto rice plants while walking. Studiesshowed it does not feed on rice (dela Cruz and Litsinger 1986). Also there are alarge number of moths in rice fields which are easily flushed out by people passing.Flying moths can be composed of up to four leaffolders, three stemborers, and veg-etative stage defoliators such as caseworm Nymphula depunctalis, hairy caterpillarRivula atimeta, and semi-looper Naranga aenescens plus the occasional cutwormor armyworm. Filipino farmers will make a decision to spray upon seeing mothsflushed from the foliage (Bandong et al. 2002). To the trained eye all moth speciescan be distinguished by coloration, markings, and flight behavior. Only farmers whohave been trained have developed these skills.

5 Development of Integrated Pest Management Programs for Rice in Asia 151
5.5.1.5 Abundance
In rainfed rice areas the rice whorl maggot fly Hydrellia philippina is less abundantand ignored (Litsinger et al. 1980). Commonness, therefore, does not guarantee thata pest will be recognized. Rice caseworm for example was equally abundant in tworainfed rice provinces and has a distinct name in Iloilo province salabay but not inPangasinan, even though caseworm is more prevalent there. The farmers representtwo distinct ethnic groups with distinct languages. Rice bug is not mentioned byfarmers in Nueva Ecija because it is quite uncommon there due to a lack of aestiva-tion sites, but in another area which has wooded areas, it is considered as the majorinsect pest (Pineda et al. 1984).
5.5.1.6 Importance in Terms of Damage Caused
Some pests are known more by the damage symptom than the insect itself. Forexample stemborers are more known for their damage particularly whiteheads. In astudy of three provinces, each having a specific ethnic group, only in one (Batangas)was there a term for deadheart but there is a term for whiteheads in all three groups(Litsinger et al. 1980). Even though whiteheads can be caused by other factors suchas drought and disease, Filipino farmers have seen the tunneling of the larvae at thebase of the withered panicle. They will readily show you the larvae in the field asthey have split open the stems to locate the larvae.
The least observable insects (whorl maggot, defoliators, and leaffolders) weremonitored by noting damage (Matteson et al. 1994). Malaysian farmers could nameleaffolders which they said do a characteristic damage (Heong 1984). Despite beinghighly abundant, surprisingly leaffolders are often overlooked. Farmers noticed thescarification damage at the tips of leaves after considerable damage is done and thelarva had left. Showing leaffolder larvae in their webbed shelters surprised manyFilipino farmers. Once in a while spiders will be found from such folded leavesas well.
In the Philippines, weekly IPM training sessions were held in the C. Luzon ricebowl which included a visit to the field to assess the pest situation. Goodell et al.(1982), a resident anthropologist, concluded that in some cases farmers appearedmore observant than scientists. A rice leaf damage symptom called aksep in Taga-log was described in detail. It was the result of the feeding of a combination of upto four insect pests attacking up to the first five weeks in the field. Each speciescontributed to the variation in the larval feeding injury expression. The damagesymptom was described in greater detail by the farmers than researchers and wasan amalgam of damage from rice whorl maggot, rice caseworm, semi-looper, hairycaterpillar and even the occasional armyworm or cutworm. Symptoms included dis-colored (whitish) spots and streaks, holes in leaves, neatly cut tops of leaves as byscissors, scrapings leaving only the veins, chewed areas from the margins to brown-ish colorations. Damage symptoms accumulated over time and went through agingchanges from whitish, pale green, yellowish to brownish. These symptoms wouldchange from field to field reflecting the differing proportions of each species feeding.

152 J.A. Litsinger et al.
In the beginning the scientists tried to assess the contribution of each species tothe damage but in the end followed the farmers’ method of lumping it all as onecharacter.
In rainfed rice areas of the Philippines, the same pest complex also occurs butinfestation is much less. Even so farmers do not recognize whorl maggot but theyhave a name for the damage just as with aksep although it is less richly described.In Pangasinan farmers refer to early season pest damage symptoms as gutalo whichincludes whorl maggot, caseworm, and defoliators (Litsinger et al. 1980). Inter-estingly Chhattisgarhi farmers in India have a word for the same complex chitribanki which includes a number of pests – caseworm, leaffolder, and surprisinglywhitebacked planthopper. The complex of pest damage caused in the vegetativestage appears whitish.
In Koronadal, Mindanao irrigated rice farmers of Ilocano and Ilongo ethnicgroups have names for rice planthoppers and leafhoppers which they term hoppers(ulmog or waya-waya) and state that they suck the leaves or base of the plants andcause hopperburn (inulmag or malaya ang palay). Stemborers were only given adistinct name in Ilongo (tamasok) but described the damage as causing deadhearts(aglabbaga ti uggot or malaya ang ugbos) or whiteheads (agpuraw ti unga or mag-aputi ang bunga) and that the worm bores the stem and eats the shoot of the plants.
Armyworm has a distinct name in Ilocano arabas which damage is most recog-nized as it cuts the panicle. Larvae also eat the leaves but panicle damage is mostdistinct and alarming to farmers. Whorl maggot was said to cause whitish leaves andis called a small fly kusim or langaw na gagmay. Mole cricket is readily recognizedand called ararawan or mara-mara and is said to cut, feed on, and scrape the roots.Greenhorned caterpillar is very large and distinct but is only described in Ilocano as“worm with a horn”. Rice seed bugs were called dangaw or tiyangaw with Ilocanosstating that the bugs produce a bad odor (nalapod nga dangaw) and farmers statedthat they cause empty grains, by sucking out the juice of the grains.
In a dryland area in Claveria Mindanao Philippines, untrained farmers gave ac-curate descriptions of common rice insect pests such as rice bug and stemborer(Fujisaka et al. 1989). “Ricebug sucks the milk substance in the grain from panicleinitiation to the milk stage. Damaged grains are empty, black, half-filled, and bitter.Attacks are at night. Damage is up to 50%.” “Stemborer attacks from the vegetativestage to panicle initiation. The larval stage is the most destructive because larvaebore the nodes near the plant base and eat the soft portion inside. Panicles becomewhite with empty grains. Damage is 20–40%.” On the other hand in the Ivory Coastfarmers there cannot associate whitehead damage with stemborers (Adesina et al.1994).
5.5.1.7 Metamorphosis
Insects have different morphologies in the various juvenile stages and even betweenmale and female adults. Young planthoppers and leafhoppers are whitish and thefive or so intermediate stages each take on various markings before reaching adult-hood with the adults distinctly different in color. Egg stages are rarely noticed by

5 Development of Integrated Pest Management Programs for Rice in Asia 153
farmers. Encounters with farmers in the field revealed that most Filipino farmers donot recognize the egg masses of stemborers. Metamorphosis was highly confusing tofarmers in C. Luzon according to Goodell et al. (1982). She concluded that just beingable to name a pest, however, does not mean that farmers will recognize all stagesin the field. In Laguna butterflies were considered as sources of fascination due totheir bright colors and graceful flight as well as children’s toys. Not one informantrecognized that the larva was an immature form of the butterfly (Nazarea-Sandoval1991).
The Tharu of Nepal believe that caterpillars mate and lay eggs as they are seentogether in one place and are not considered to be the immatures of butterflies. Smallinsects are generally considered to be the progeny of larger ones. In Chhattisgarhfarmers believed that dung flies came from smaller flies and then grew to be theeven larger ones they see.
Honduran farmers were ignorant of basic facts of insect biology in that manybelieved that insects sprang spontaneously from the soil or fertilizer (Bentley 1989).This idea of spontaneous generation was based on the correct fact that when fertil-izer was used more pests appeared. Farmers also noticed that the number of somepests increased after insecticides were used but were ill-equipped to understand why.The concepts of insecticide resistance and insect resurgence are difficult for farmersto grasp as they run counter-intuitive to what they had learned about insecticides inthe past.
Honduran farmers developed a conspiracy theory that the chemical companiesput new pests in each bottle (Bentley 1989). This limits of farmers’ knowledgemeans that they saw no alternatives to insecticides. It is interesting that a smallpercentage of farmers interviewed in C. Luzon, Philippines voiced similar beliefsof spontaneous generation (insect pests come from the water) as well as conspiracytheories (pests come from fertilizer bags).
Storage weevils were believed by Honduran farmers also to generate sponta-neously from the grain (Bentley 1989). Farmers know little about insect reproduc-tion and ecology, and spontaneous generation is by far the most common notion ofinsect genesis. Farmers point out that the stomach contents of the caterpillar is greenjust like the plant, thus must have come from the plant.
A number of Filipino farmers casually interviewed, however, understood the var-ious stages of insect metamorphosis, but there are still a significant number that donot. Only a few can associate a caterpillar with the adult moth or know about the eggstage. Laguna farmers did not connect the immatures of mosquitoes with the bloodfeeding adults (Nazarea-Sandoval 1991). Mayans also did not link the butterflieswith caterpillars and recognized many of the leaf feeding stages and generally dis-regarded the adult stage (Nazarea-Sandoval 1991). This is evidence that folk scienceis for the most part applied science and rarely truly theoretical.
5.5.1.8 Familiarity Due to Control Efforts
Handpicking insects used to be a more popular method of insect pest control be-fore modern pesticides appeared (Litsinger 1994). In Japan and Korea, rice farmers
154 J.A. Litsinger et al.
regularly removed deadhearts along with the stemborer larva from rice fields to limittheir spread. Special nets were made to collect caseworm larvae. Large lepidopteranswere removed by hand from the foliage.
In other places mass campaigns were undertaken to hand remove insects duringoutbreaks such as occurred in the mid-1980s in Java when the white stemborer sud-denly emerged as an epidemic pest. School children were trained to hand removemoths and egg masses from seedbeds. Consequently most farmers were able toreadily identify moths (97%) and egg masses (96%) in a study conducted duringthe epidemic (Rubia et al. 1996). According to Rubia farmers generally are unawareof stemborer egg masses and if asked in the field to explain what they were hadno idea.
5.5.1.9 Food Items or Insects as Toys
Some insect pests are more recognized and tolerated because they are collected forfood such as the mole cricket in Ilocano areas of the Philippines. Special collectingbaskets are made for this purpose where mole cricket is considered to be a delicacy.Grasshoppers and locusts are gathered from rice foliage for the same reason. Whitegrub adults as well are delicacies in Batangas and in Mindanao and are shaken fromtrees, collected, and deep fat fried. Rats in NE Thailand are eaten but not in C.Thailand as in the latter they are considered as pests while in the former locationthey are not (Brown and Marten 1986).Strings are tied to the adults by children toswing around in the air giving the insect its common name of “toy beetle” (Litsingeret al. 1983).
5.5.1.10 Ranking by Importance
Questionnaires
In KAP questionnaires farmers were asked to name insect pests that occurred ineach growth stage based on their observational experience in the area. Farmers werefirst asked to focus on the seedbed and recall all the insect pests they knew that fedon seedlings. Then the farmers were asked to shift to the vegetative stage in the fieldand finally in the maturing stage of rice to name pests from each. After the list wascompleted the pest names were read back and the farmer was asked to rank the topten in terms of importance on a scale beginning with 10, for the most important, 9for the next, etc. The average rating for each pest produced the “importance value”for all insect pests in the site (Litsinger et al. 1982). The frequency of mentioningeach pest was also ascertained.
Waibel (1986) used a different system in his interviews and asked the farmers torank their insect pests which rankings were averaged over five sites to produce thefollowing list:
1. Stem borers2. Defoliating armyworms3. Brown planthopper4. Leaffolders

5 Development of Integrated Pest Management Programs for Rice in Asia 155
Stemborers were regarded as the most important pest group in the wet season andbrown planthopper in the dry season in Nueva Ecija but not the other sites. Scientistsalso agreed that stemborers cause the greatest yield loss among all insect pests ofrice in the Philippines based on yield loss studies (Savary et al. 1994, Litsingeret al. 2006a). Defoliating armyworms, however, are much less important generallyspeaking. But this term may include other defoliating pests attacking in the vege-tative stage that are termed aksep. It is surprising that rice bug was not consideredmore important. Farmers generally rate it higher, although scientists would agreewith a low ranking as its importance is more psychological than real (Litsinger et al.1998). Modern rices produce many more grains per area than traditional rices thusits impact is diminished. Also a number of fungal diseases cause spotting on thegrains called “dirty panicle” that farmers confuse with those caused by rice bugincreasing its perception of being more important than it is (Lee et al. 1986). Un-published insecticide trials by us to specifically control the rice bug did not leadto a yield increase. The only time that losses were documented was on the IRRIexperimental station under extremely heavy infestations of >10/m2 which occurvery infrequently.
In questionnaires used in the Philippines, rainfed wetland farmers clearly assigngreater importance to epidemic pests over chronic pests which is understandable(Litsinger et al. 1980). Chronic pests such as stemborers cause yield loss seasonafter season whereas epidemics can cause harvest failures in one in ten years. InIloilo and Pangasinan provinces on rainfed wetland rice, epidemic pests also weremore greatly valued, “hoppers” in the former and tungro in the latter site. Whereas ina dryland rice site in Batangas province farmers were more concerned with termitesand “hoppers”. The “hopper” in this case was whitebacked planthopper that becamemoderately numerous but no significant yield loss occurred on traditional varieties(Litsinger et al. 1987). Their moderately high number was the result of the high rateof nitrogen farmers applied to dryland rice (110 kg/ha). Researchers dismissed ter-mites as important but placed more emphasis on other soil pests such as white grubsand ants. White grub larvae consumed the roots and killed rice seedlings whereasants removed seed to reduce the stand (Litsinger et al. 1980). Farmers have learnedto compensate by overseeding.
Target Pests for Insecticide Applications
Another method of assessing the importance of insect pests is to quantify the per-centage of insecticide applications directed at specific pest groups. This was donein two sites in the Philippines over 14 rice crops. Both sites have higher insect pestincidence than the national average. The first site Zaragoza in Nueva Ecija provinceis at the end of a large irrigation system and thus fields are planted asynchronously,whereas Koronadal in South Cotabato province is an area with artesian spring ir-rigation systems where farmers grow five crops in two years. Over a third of theapplications (20.5% + 16.5%) were directed at defoliating pests, occurring at thevegetative stage as part of the aksep syndrome (Table 5.3). Leaffolders representedthe next most important target pest group receiving 15% of applications were mainlyin the flag leaf stage. The third most important group occurred during ripening with

156 J.A. Litsinger et al.
Table 5.3 Summary of insect pest targets for insecticide applications in two irrigated rice sites,Zaragoza and Koronadal, Philippines, 1984–1991
Insect group Responses (%)b
Defoliators 21Worms 17Leaffolders 15Rice bug 8Stemborers 7Hoppers 6Planthoppers 5Whorl maggot 4Caseworm 4Leafhoppers 4Moths 3Armyworms/cutworms 2None specified 2Greenhorned caterpillar 1Ladybeetlesa 1Total 100a Insect predator misidentified as a pest.b Zaragoza 6 crops and 245 farmers 1984–1987,565 applications Koronadal 8 crops 271 farmers1984–1991, 762 applications.
the rice bug (9% of applications). Leafhoppers and planthoppers totaled 16% ofapplications which is surprising because the varieties grown in the two areas aremodern rices which are resistant to the green leafhopper Nephotettix spp. and brownplanthopper. Other pests were less targeted. A few farmers sprayed when they sawladybeetles, which are beneficial insects. An extensive list of targeted insect pestsfor insecticide application is presented in Bandong et al. (2002). Most of the targetedinsect pests were chronic pests which are also discussed in detail in Litsinger et al.(2006a,b,c) for stemborers, whorl maggot and defoliators, and leaffolders from farmrecord keeping data from four sites in the Philippines. Farmers base decisions onseeing insects and select the more mobile and thus more readily seen planthoppers,leafhoppers, and moths. The least observable insects (whorl maggot, defoliators,and leaffolders) were monitored by noting their damage. Rapusas et al. (1997) andHeong et al. (2002) produced similar lists in Laos.
5.6 Estimates of Yield Loss
For yield loss perceptions, some researchers are hesitant to askfarmers as they doubtthat farmers could estimate losses accurately, although percentages are profferedwhen asked. Conelly (1987) stated that even a researcher could not make accurateestimates so he did not report farmers’ responses. But we feel that while it is truethat farmers probably cannot estimate accurately, it is important to know farmers’perception of losses, as such understanding shapes attitudes and control decision

5 Development of Integrated Pest Management Programs for Rice in Asia 157
making. Kenmore et al. (1985) and Heong and Escalada (1999) noted that farm-ers overestimation of losses attributed to insect pests is a common misperceptionleading overuse of insecticides.
Losses in Malaysia were estimated realistically by 44% of the farmers inter-viewed to be <0.6 t/ha with 56% stating higher levels and a small number of farmers(3%) even placing losses >3 t/ha (Heong 1984). Leaf feeding insects were believedto cause high yield loss by 86% of farmers, while 9% disagreed, and 6% had noopinion.
Farmers in the Ivory Coast astutely stated that a number of factors affect lossesfrom insect pests such as soil type, soil fertility, presence of standing water, typeof forest vegetation, presence of weeds, and presence of termite mounds (Adesinaet al. 1994). Farmers’ awareness becomes more profound in that they know termitesbecome more abundant during drought when more mounds are formed which inturn exacerbates loss. Highest losses measured in yield loss studies in the Philip-pines on irrigated rice occurred with a combination of drought and stemborer attack(Litsinger et al. 2005). Ivory Coast farmers further stated that estimates of losses arehighly variable, and a large number (63%) even said losses were not important andput greater credence on insect pest abundance during specific crop growth stages.
Palis (1998) reported that farmers in C. Luzon felt that, if they did not use insecti-cide, losses would be 20%. Waibel (1986) found farmers overestimated losses givingfigures from 25–50%, which is very high, probably by remembering outbreaks morethan average years. But crop loss assessment is difficult for farmers as the yieldloss-pest density equation is highly dynamic: on the one hand modern rices have thecapacity to compensate from high levels of damage but need optimal growing con-ditions to do so while multiple stresses exacerbate loss (Litsinger 2008b). Farmersexpect high losses to occur if they do not use insecticides. Data from four irrigatedsites in the Philippines using the insecticide check method determined losses were13% or 0.62 t/ha as an average of 68 crops from 1981 to 1991 (Litsinger et al. 2005).This would be a high estimate if extrapolated for the Philippines as a whole, as twoof the four sites, as mentioned, were above average in insect pest infestation.
Javanese farmers correctly believed that the greater the infestation level thegreater the loss (Rubia et al. 1996). They, however, overestimated the loss. Mostexpected damage from the white stemborer to be 1 t/ha. But they are ignorant ofthe concept of crop compensation, and losses were considerably less based on fieldtrials.
5.7 Knowledge of Pest Ecology
Farmers’ understanding of pest ecology is mixed. In Kalimantan in a detailed studyby an anthropologist, farmers showed insightful knowledge of pest ecology and saidrice bug was more abundant when wet planting season is preceded by a long dryseason (Watson and Willis 1985). Farmers knew that both nymphs and adults suckunripe grain. They said mole crickets live in moist but not flooded ground and they

158 J.A. Litsinger et al.
are less severe in years when onset of rainy season is abrupt. Despite the conclusionreached by Bjornsen Gurung (2003) Nepalese farmers correctly concluded that ricebugs underwent a dormant period between rice crops in forested areas.
Most Javanese farmers interviewed believe white stemborer moths migrate totheir fields from neighbors’ fields (34%) or nearby villages (19%) or districts(23%) (Rubia et al. 1996). Other responses were in declining order: carried bywind/attracted to light, from infested plants, carryover from last season, due toweather, seasonal, and do not know (3%). They found that rice farmers did not knowwhite stemborer passes the dry season in the stubble. In the Philippines, farmers inIloilo encountered in the field were able to show us white stemborer larvae aestivat-ing in the crowns of stubble in the dry season. They proudly split open the plants toshow us the larvae.Some Filipino farmers know that because caseworm larvae floatwithin rolled up leaves on water they enter with the irrigation water, but few farmersunderstand that most pests enter by aerial movement (Bandong et al. 2002).
5.7.1 Knowledge of Arthropod Natural Enemies
Rapusas et al. (1997) translated the term natural enemies into “arthropods in thefield that did not damge rice” does not convey the idea of a natural enemy. There aremany arthropods in rice fields which call the aquatic habitat their home but neitherfeed on rice nor kill pests. Still the idea was grasped and farmers responded withnames like spiders, damselflies, dragonflies, preying mantis, ground beetles, frogsand wasps. Most farmers acknowledge that they have seen insect pests trapped inspider webs or know that dragonflies eat insects in flight. Some 69% of Sri Lankanfarmers interviewed knew the concept and existence of natural enemies in rice (vande Fliert and Matteson 1990). Birds (73%) and dragonflies (23%) were most men-tioned. Knowledge about predatory and parasitic arthropods, however, was slight.On the other hand, 22% of the same farmer population believed that all insects inthe field are harmful, while just 55% disagree with this statement. In Java ducks arepopular and are herded into rice fields to control pests (Brown and Marten 1986).
All farmers surveyed in Guimba (n = 30) could name a natural enemy of insectpests with spiders (80%) heading the list followed by frogs (70%), birds (40%), fish(6%), and ants (3%). The farmers believed that all groups except birds would beadversely affected by insecticide usage in the fields. In the rainfed wetland areaof Solana in the Cagayan Valley, most farmers (93%) named a natural enemy,with spiders (87%) heading the short list followed by frogs (53%) and birds (18%)(Litsinger et al. 1982). In three rainfed rice sites, only 70% of farmers could namenatural enemies listing birds, spiders, frogs and dragonflies (Litsinger et al. 1980).In Claveria 85% of dryland rice farmers could name 1–2 natural enemies with birds(72% of farmers), cats (22%), chickens (20%), reptiles (12%), spiders (8%), frogs(3%), and dogs (2%) mentioned. Some 60% said insecticides would poison them.Many Filipino farmers do not realize that insecticides will negatively affect friendlyarthropods (Palis 1998).

5 Development of Integrated Pest Management Programs for Rice in Asia 159
Bentley’s (1992a) experience with Honduran farmers was highly similar to thatof studies in the Philippines and elsewhere in Asia. Farmers are generally unawareof the existence of most natural enemies except for the larger and more conspicuoustypes. A farmer said that stored grain “generates” weevils about the size of a pinheadand then they grow to their full size. But the insect the farmer identified was actuallya beneficial parasitoid wasp. When asked to list beneficial animals, Honduran farm-ers responded by naming spiders and some vertebrates such as birds and toads. Theyhave seen spiders trapping moths in their webs (Bentley 1989).In the Philippines,untrained farmers respond by naming birds, spiders, frogs, or dragonflies as largerpredators (Litsinger et al. 1980). None knew of parasitoids or smaller predators(Nazarea-Sandoval 1991). A more recent study showed that 60% of C. Luzon farm-ers believed that all insects were harmful despite one-third of them acknowledgingthe presence of beneficials (Palis 1998). Tharu farmers in Nepal could not recognizeor name any parasitoids or beneficial predators (Bjornsen-Gurung 2003). Spiderswere considered harmful due to their irritating urine. Praying mantis are said toattack children and tear out their eyes. Mud wasps that collect larvae for food fortheir young are believed to be abducting children that they will turn into their ownkind. Insects that make noise are said to be crying for food or are expressing joy.
Farmers often spray when they see some insects in the field whether they are pestsor not. Some spray when they see dragonflies and tear down spider webs (Mattesonet al. 1994). Laotian farmers named spiders, dragonflies, beetles and wasps (Rapusaset al. 1997) while in Cambodia farmers sprayed when they saw these beneficials intheir fields (Jahn et al. 1997). Many Chhattisgarhi farmers interviewed also thoughtspiders, dragonflies, and bees were pests. In Laguna Philippines, farmers believedthat “rice spiders” at times spin cobwebs so thick that the leaves stick together andfold up and the plant causing yellowing of the leaves thus consider them as pests(Nazarea-Sandoval 1991). What the farmers described was the egg mass cocoonor shelter that spiders make. Farmers are generally less aware regarding naturalenemies but most recognize some larger ones such as web building spiders anddragonflies. The Laguna farmers hardly had any recognition of certain arthropodsas being beneficial in checking pests. Ladybeetles, spiders, and dragonflies wereperceived as children’s playthings.
Ladybeetles are normally considered as pests as farmers see the adults and larvaefeeding on pollen (they do not know that rice self-fertilizes within the flower thusthe external pollen is superfluous) (Bandong et al. 2002). But farmers observe themfeeding on the grains and believe that seed set will decline. As most Filipino farm-ers grow vegetables they are also familiar with phytophagous ladybeetles such asEpilachna philippinensis thus it is easy to see why some think ladybeetles damagerice plants. Leyte farmers also targeted ladybeetles as a pest (Heong et al. 1992). Ina survey by Heong et al. (1994) found that 5% of insecticide applications by Leytefarmers targeted ladybeetles. A similar result occurs in the Philippines (Table 5.3).In addition most farmers in Hunan, China believe ladybeetles are pests of rice (Shaoet al. 1997).
In another study based on a questionnaire C. Luzon, Philippines farmers namedspiders, dragonflies, and grasshoppers as friendly (Rola and Pingali 1993).

160 J.A. Litsinger et al.
Grasshoppers were probably confused with katydids which is mistaken for a grass-hopper. The large species Conocephalus feeds on insect pests conspicuously andcan eat entire stemborer egg masses, hairy mat, and all (Rubia et al. 1990) but it isan omnivore and will eat developing rice grains (Barrion and Litsinger 1987).
Rola et al. (1988) concluded that Filipino farmers could not differentiate betweenpests and natural enemies and 31% of respondents thought all arthropods in a ricefield were pests. An interesting response came from similar farmers in C. Luzonduring a training activity which included collecting with a sweep net. The collectionwas placed in a large, clear plastic bag which boiled with buzzing insects. Uponseeing this the owner of the field wanted to go home to fetch his sprayer and treathis field immediately. Similarly the attitude of most Honduran farmers is all insectsin a crop are harmful (Bentley 1989). This viewpoint is held by many farmers insurveys (Heong et al. 2002).
5.8 Evaluation of Control Practices
The results from a KAP study in Kenya from farmers tilling traditional rainfedcropping systems would parallel the effort of trying to improve rice culture in un-favorable environments (Conelly 1987). There, insect pests among all constraintsthat face the farmers, are far down the list in importance. Most traditional farmersdo not consider insect pests to be important. Traditional systems are subsistencesystems and do not generate much cash for the farmer to invest in inputs or hiredlabor thus there are few options against insect pests. Drought can also affect thecrop so risks from investing in inputs are high. Genetic resistance which is commonfor irrigated rice varieties is focused on epidemic pests which will not be of muchimportance in single rice cropping except with long maturing varieties. But fewfarmers used insecticides and lacked knowledge on how to apply them. Many saidchemicals were too expensive. Thus farmers are willing to tolerate losses. Botanicalinsecticides along with mechanical methods such as killing stemborer larvae byhand or uprooting heavily infested plants were more preferred. Many farmers havealternative income from fishing and livestock. Only when a market is available anda high price is offered would they be tempted.
It was recommended in Kenya for farmers to burn stalks as they harbor stemborerlarvae but the straw is used as fodder in the dry season (75% of respondents) orfuel (48%) or for construction of granaries (56%) (Conelly 1987). Early plantingwas also recommended but many farmers (60%) perceived that pests become moreabundant not less, especially birds. Erratic rains make early planting risky and it istoo costly to replant. Many felt that insect damage is only serious during droughts. Inaddition heavy rains wash off insects. Farmers need early rain for land preparation.In such cases getting farmers to accept IPM will be difficult. Recommendationsfor cultural control of rice insect pests based on early plowing after harvest to killstemborers and synchronous planting were criticized by an anthropologist as beingunacceptable to farmers (Goodell et al. 1982).

5 Development of Integrated Pest Management Programs for Rice in Asia 161
5.8.1 Genetic Resistance
Filipino farmers along with a large majority of their Asian neighbors in favorableirrigated areas have overwhelmingly adopted modern rice varieties (IRRI 1985),even in regions with weak extension services. From the first modern rices devel-oped at IRRI, insect pest resistance was bred into them as a pre-condition beforerelease (Khush 1977, 1989). IR5 and IR8, the first modern rices, were moderatelyresistant to green leafhoppers (Heinrichs et al. 1985). IR36 came some years laterand became the most popular rice variety ever developed in terms of area sown, andwas rated resistant or moderately resistant to green leafhoppers (3 species), brownplanthopper (3 biotypes), and stemborers (2 species). The large record keeping sur-vey in four sites in the Philippines conducted by us from 1981 to 1991 in four sitesfound modern cultivars grown in 97% of all rice crops planted with only 3% beingtraditional tall types (Table 5.4). Farmers planted traditional varieties in flood proneareas or for specialty foods. The survey showed Philippine Seed Board approvedvarieties were sown by 81% of all farmers when averaged over all crops, followedby 16% unapproved cultivars with 9% being named and 7% numbered by farmers.
Over the decade surveyed, farmers planted 179 different rice cultivars of whichonly 19% were approved varieties, while 26% were non-approved named cultivars,47% were numbered cultivars, and 3% traditional varieties. All of the approved vari-eties would have insect pest and disease resistance, while this would not necessarilybe true for the others. The reason that so many non-approved cultivars were adoptedby farmers was their desire to find rices that yielded even more than the approvedones. The government cannot regulate seed distribution and many enterprising lo-cals contracted with farmers to grow cultivars pinched from variety trials hopingthat these would be named. Those that were not were still sold to eagerly awaitingfarmers. These businessmen capitalized on farmers’ willing acceptance of new vari-eties and desire to continuously improve yields. Varieties with higher numbers wereconsidered better. A decade earlier an unimproved numbered line “1561” becamepopular among C. Luzon farmers but was susceptible to green leafhoppers and wasone reason put forward why a tungro epidemic emerged.
Resistant varieties when grown widely can have a significant population depress-ing effect on insect pests. In the 1990s brown planthopper once again became a rareinsect in the major rice bowls of the Philippines with the widespread acceptanceof IR64 and related varieties. In Chhattisgarh, India which during the 1980s wasdevastated by gall midge has over recent years been deprived of the pest in manyareas thanks to the wide adoption of resistant varieties such as Mahamaya, releasedin 1994 by Indira Ghandi Agricultural University in Raipur (R.K. Sahu personalcommunication).
There were differences between Philippines survey sites in the prevalence ofunapproved lines, as in Zaragoza, Calauan, and Guimba released cultivars repre-sented 44, 49, and 60% of cultivars, respectively, while in Koronadal 70% werenumbered non-approved cultivars. Over all sites, crops and seasons, IR64 was themost popular cultivar, averaging 20% of all fields sown followed by IR60 (12%)and IR42 (7%). The most popular cultivars differed within sites. IR36, IR42, IR52,

162 J.A. Litsinger et al.
Tab
le5.
4M
ost
popu
lar
culti
vars
plan
ted
inir
riga
ted,
doub
le-c
ropp
edri
cein
four
loca
tions
,Phi
lippi
nes
1981
–199
1.C
ultiv
ars
are
segr
etag
edby
rice
cult
ure
and
asth
ose
mod
ern
vari
etie
sap
prov
edby
the
Phil
ippi
neSe
edB
oard
,una
ppro
ved
mod
ern
rice
s,an
dtr
adit
iona
lric
es
Cul
tivar
Farm
ers
sow
ing
cult
ivar
per
crop
(%)a
Zar
agoz
aG
uim
baK
oron
adal
Cal
auan
Wet
bed
DSR
Site
avg
TPR
DSR
Site
avg
TPR
Dap
ogD
SRSi
teav
gD
apog
Site
avg
Gra
ndav
g
WS
DS
WS
DS
WS
DS
DS
1st
2nd
1st
2nd
1st
2nd
WS
DS
MO
DE
RN
9710
010
010
099
9610
010
099
100
9910
098
9710
099
9290
9197
App
rove
d84
8370
8881
9393
8891
6163
6465
9675
7184
7680
81IR
260
00
00
00
00
00
00
00
01
21
0IR
290
00
00
00
00
00
00
00
00
11
0IR
300
00
00
00
00
00
00
00
00
10
0IR
320
00
00
22
84
00
00
00
00
00
1IR
3612
120
2111
54
03
01
12
36
20
11
4IR
4227
200
914
50
02
00
00
00
016
812
7IR
450
00
41
00
00
00
00
00
00
00
0IR
460
00
00
00
00
00
00
00
06
03
1IR
480
00
00
00
00
00
00
00
01
01
0IR
502
20
93
00
00
00
00
00
02
11
1IR
525
120
127
10
00
00
00
00
00
00
2IR
542
30
22
00
00
00
10
40
15
24
2IR
562
20
22
72
03
31
30
00
12
11
2IR
580
10
00
92
03
00
00
00
00
00
1IR
603
510
15
514
1010
2634
2442
2945
331
21
12IR
620
10
00
11
01
1214
1611
1613
1310
68
6IR
6416
1420
2719
4143
3840
51
111
100
511
2217
20IR
650
00
00
00
00
00
00
00
02
43
1IR
664
15
03
1015
2115
32
22
74
31
42
6

5 Development of Integrated Pest Management Programs for Rice in Asia 163
Tab
le5.
4(c
onti
nued
)
Cul
tivar
Farm
ers
sow
ing
cult
ivar
per
crop
(%)a
Zar
agoz
aG
uim
baK
oron
adal
Cal
auan
Wet
bed
DSR
Site
avg
TPR
DSR
Site
avg
TPR
Dap
ogD
SRSi
teav
gD
apog
Site
avg
Gra
ndav
g
WS
DS
WS
DS
WS
DS
DS
1st
2nd
1st
2nd
1st
2nd
WS
DS
IR68
30
00
10
10
03
12
09
02
00
01
IR70
00
00
00
00
00
00
010
02
50
31
IR72
10
00
04
27
45
51
59
75
00
03
IR74
00
100
30
00
04
21
10
01
00
01
IR76
20
100
30
00
00
00
00
00
00
01
Ri1
03
415
05
27
45
00
10
00
03
23
3C
40
00
00
00
00
00
00
00
01
21
0C
120
50
01
00
00
00
10
00
00
00
0U
napp
rove
d12
1630
1218
36
137
3936
3632
225
288
1411
16N
amed
1211
3012
162
413
614
47
30
45
411
89
“IR
58”
37
09
50
00
00
00
00
00
00
01
“IR
66”
00
00
00
00
00
00
00
00
01
00
C1
00
00
00
00
00
00
00
00
1722
195
C2
00
00
00
20
10
00
00
00
00
00
C3
00
00
00
113
40
00
00
00
00
01
C10
000
30
01
00
00
00
00
00
00
21
0C
1300
01
00
00
00
00
00
00
00
00
00
0R
450
00
10
00
00
00
00
00
00
00
0V
30
00
00
00
00
00
30
00
00
00
0A
goo
30
300
80
00
00
00
00
00
00
02
Taiw
an0
00
10
00
00
00
00
00
00
00
0

164 J.A. Litsinger et al.
Tab
le5.
4(c
onti
nued
)
Cul
tivar
Farm
ers
sow
ing
cult
ivar
per
crop
(%)a
Zar
agoz
aG
uim
baK
oron
adal
Cal
auan
Wet
bed
DSR
Site
avg
TPR
DSR
Site
avg
TPR
Dap
ogD
SRSi
teav
gD
apog
Site
avg
Gra
ndav
g
WS
DS
WS
DS
WS
DS
DS
1st
2nd
1st
2nd
1st
2nd
WS
DS
Inde
x40
00
00
00
00
30
10
00
10
00
0B
orda
gal
00
00
00
00
01
20
00
00
00
00
Bor
nec
00
00
00
00
00
01
00
00
00
00
Maj
or0
00
00
00
00
91
10
04
20
00
1K
orea
n0
00
00
00
00
00
00
00
01
01
0N
umbe
redb
16
00
21
30
125
3229
292
2123
43
37
TR
AD
ITIO
NA
Lc
30
00
14
00
10
10
23
01
810
93
Tota
l10
010
010
010
010
010
010
010
010
010
010
010
010
010
010
010
010
010
010
010
0a
WS
=w
etse
ason
,DS
=dr
yse
ason
,DSR
=di
rect
seed
edri
ce,T
PR=
tran
spla
nted
wet
bed
rice
,dap
ogis
tran
spla
nted
seed
ling
s10
–14
days
old.
Onl
ycu
ltiv
ars
whi
chav
erag
ed1%
usag
ein
any
one
crop
are
list
ed.S
eete
xtfo
rde
tail
son
num
bers
offa
rmer
ssu
rvey
edby
site
.b
Mos
tpop
ular
wer
e:33
,40,
43,5
6,90
,95,
98,2
06,2
47,1
606,
1609
,180
3,18
14,1
900,
−12,
−17,
−36,
−49,
−90,
17–3
.c
Mos
tpop
ular
wer
eM
alag
kit,
Mil
agro
sa,W
agw
at,S
inan
Dig
o,Si
nan
Pedr
o,Si
nan
Feli
x,S.
Dom
eng.

5 Development of Integrated Pest Management Programs for Rice in Asia 165
IR64 and Agoo were the most popular cultivars in Zaragoza. Agoo and Ri10 wereparticularly popular for direct seeded rice in the wet season and IR36 in the dryseason also for direct seeded culture. IR60, IR64, and IR66 were most popular inGuimba. C3, a variety developed by the University of the Philippines, was popularfor direct seeding in the dry season. In Koronadal IR60, IR62, and “90” were themost popular cultivars. Many other numbered cultivars were popular in Koronadalas well. IR42 and “90” were more preferred in the second crop. In Calauan IR42,IR62, IR64, and C1 were the most popular cultivars. IR42 was more preferred inthe wet season and IR64 in the dry season. Named and numbered cultivars werequite location specific. Malagkit was the most popularly grown traditional cultivaris glutinous and is used in making sweets for festive occasions.
The survey also showed there was a wide range between sites as to the per-centage of farmers planting more than one rice cultivar in a given crop season.Highest percentage was in Calauan where 57 and 52% of farmers respectivelyplanted an average of 2.1 cultivars (maximum of 5) per crop in the wet and dryseasons. In Koronadal farmers almost always planted only one rice cultivar per crop(average 1.0 cultivar/crop, range 1–2), while Guimba farmers averaged 1.3 (range1–4), and Zaragoza farmers 1.6 (range 1–6). Planting more than one cultivar perseason is seen as a risk avoidance mechanism, although some farmers will plant abetter tasting variety for home consumption with another higher yielding cultivarfor sale.
Genetic resistance is directed against epidemic-causing insect pests such as thebrown planthopper and green leafhopper. Both of these insects transmit virus dis-eases thus are normally controlled by targeting the vector. In addition there is alsosome limited resistance against the omnipresent stemborers (Chaudhary et al. 1984).Breeders using pyramiding techniques can only incorporate so many resistant genesin a new cross while still maintaining high yield and other desirable qualities. Eachgene generally only affects one pest. Genetic resistance in a single variety only hasresistant genes to at most three insect pests and three to four diseases, that meansplacing some six or seven genes in a new cross. Breeding is much like juggling asthe “juggler breeder” in this analogy can only keep so many objects in the air at anyone time, upon adding another one in the air would fall out.
Host plant resistance has been performed by traditional agriculturalists for mil-lennia through selection of seeds from the best performing plants. The world genebank for rice has over 80,000 land races. In Solana in the Cagayan Valley, Fil-ipino rainfed wetland farmers, planting predominantly traditional tall rices, statedthat such varieties had “general insect pest resistance” (Litsinger et al. 1982). Inanother study, again with rainfed farmers in three locations, farmers also believedthat traditional varieties were resistant to “all insect pests” (Litsinger et al. 1980).Despite such statements, most traditional varieties in greenhouse trials have beenfound susceptible to almost all insect pests and diseases. Their low yield and nonresponse to inorganic fertilizers has led farmers and others the conclude that such va-rieties are “resistant”. Their long maturity gives the crop ample time to compensateand produce stable but low yields despite insect abundance. Insect pests do poorlyon these cultivars because of their low nutritive status (= low yield). Few farmers

166 J.A. Litsinger et al.
apply inorganic fertilizer to these varieties which is known to increase insect pestabundance (Litsinger 1994).
Traditional farmers have developed their own methods of minimizing pest dam-age using genetic resistance. Indonesian dryland farmers in Indramayu, Lampungprovince S. Sumatra, in a highly risky environment of uncertain rain and vulnerabil-ity to insect and vertebrate pests as well as diseases, will sow up to ten local varietiesin a field. Through interviews, we learned farmers were able to explain the qualitiesof each cultivar. Varieties differed in maturity so that in a year of early rains, theearly ones will mature, while in a good year the longer maturing varieties will givehighest yield. Some have different rates of resistance to blast and by mixing themwill temper the rate of attack in the same way as using multi-lines. Their goal isyield stability as farmers cannot endure a year with no harvest from a long drought.
Most farmers when asked to choose qualities of a rice variety opt for high yieldwith pest suppression qualities lower down in priority. Although the farmers knowthat resistant varieties reduce the need for insecticides, a survey in Sri Lanka found50% of respondents were skeptical about the high yielding qualities of such vari-eties (van de Fliert and Matteson 1990). In C. Luzon Palis (1998) found that pestresistance was not a major factor in selecting a variety. In Claveria, a farmer surveyof dryland farmers placed high yielding potential (72% of respondents) and goodtaste (58%) above “general pest resistance” (57%) as desired qualities in selectingrice varieties (Table 5.5). A further 3% of farmers valued specific resistance to blastdisease. Thus pest resistance was a sought after characteristic for more than halfof the farmers. The most popular dryland traditional varieties have resistance toblast disease in contrast to wetland environments where disease resistance is lessimportant (Arraudeau and Harahap 1986).
The survey also showed general pest susceptibility (38%) topped the list for themain reason farmers gave for changing rice varieties (Table 5.6). Susceptibilities toblast and birds were lower in the list as specific pests. Some 8% of farmers men-tioned that repeated planting of the same variety would cause it to lose resistanceover time, although they gave no explanatory reason. But some 4% did not believe
Table 5.5 Farmers’ stated preferences when choosing a dryland rice variety, Claveria, MisamisOriental, 1986
Varietal attribute Farmers responding (%)a
High yielding 72Good eating quality 58Pest resistance 57Early maturity 25Good tillering capacity 22Good storage quality 12Experimenting with new variety 10Disease (blast) resistance 3Lodging resistance 2Vigorous growth 2a n = 60, some farmers gave more than one answer. All farmersinterviewed responded.
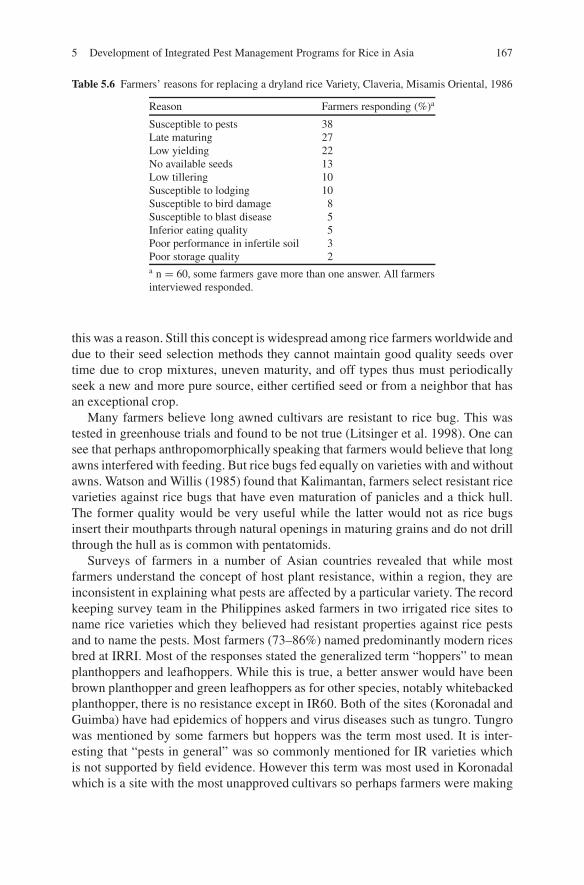
5 Development of Integrated Pest Management Programs for Rice in Asia 167
Table 5.6 Farmers’ reasons for replacing a dryland rice Variety, Claveria, Misamis Oriental, 1986
Reason Farmers responding (%)a
Susceptible to pests 38Late maturing 27Low yielding 22No available seeds 13Low tillering 10Susceptible to lodging 10Susceptible to bird damage 8Susceptible to blast disease 5Inferior eating quality 5Poor performance in infertile soil 3Poor storage quality 2a n = 60, some farmers gave more than one answer. All farmersinterviewed responded.
this was a reason. Still this concept is widespread among rice farmers worldwide anddue to their seed selection methods they cannot maintain good quality seeds overtime due to crop mixtures, uneven maturity, and off types thus must periodicallyseek a new and more pure source, either certified seed or from a neighbor that hasan exceptional crop.
Many farmers believe long awned cultivars are resistant to rice bug. This wastested in greenhouse trials and found to be not true (Litsinger et al. 1998). One cansee that perhaps anthropomorphically speaking that farmers would believe that longawns interfered with feeding. But rice bugs fed equally on varieties with and withoutawns. Watson and Willis (1985) found that Kalimantan, farmers select resistant ricevarieties against rice bugs that have even maturation of panicles and a thick hull.The former quality would be very useful while the latter would not as rice bugsinsert their mouthparts through natural openings in maturing grains and do not drillthrough the hull as is common with pentatomids.
Surveys of farmers in a number of Asian countries revealed that while mostfarmers understand the concept of host plant resistance, within a region, they areinconsistent in explaining what pests are affected by a particular variety. The recordkeeping survey team in the Philippines asked farmers in two irrigated rice sites toname rice varieties which they believed had resistant properties against rice pestsand to name the pests. Most farmers (73–86%) named predominantly modern ricesbred at IRRI. Most of the responses stated the generalized term “hoppers” to meanplanthoppers and leafhoppers. While this is true, a better answer would have beenbrown planthopper and green leafhoppers as for other species, notably whitebackedplanthopper, there is no resistance except in IR60. Both of the sites (Koronadal andGuimba) have had epidemics of hoppers and virus diseases such as tungro. Tungrowas mentioned by some farmers but hoppers was the term most used. It is inter-esting that “pests in general” was so commonly mentioned for IR varieties whichis not supported by field evidence. However this term was most used in Koronadalwhich is a site with the most unapproved cultivars so perhaps farmers were making

168 J.A. Litsinger et al.
this distinction as unapproved cultivars would have higher pest incidence. Also in-teresting is that other pests such as rice bug, worms, and moths were mentionedwhich also would be difficult to defend. A survey of farmers in Leyte said varietieswere resistant to rice bug, armyworms, cutworms, and stemborers. In only the lattercase would breeders and entomologists agree (Escalada and Heong 1993). For stem-borers, most IR varieties have some modest level of resistance which generally isless discernable at the field level. Extension services at the time of the survey wereweak thus farmers were not well trained in knowing what pests were resistant in thevarious varieties. On the other hand, there have been so many varieties released overthe past two decades that only an expert would be expected to know the resistancespectra for each variety, thus the farmers’ assessment is good.
Farmers were then asked what they believed the basis of the resistance was due to.The most common answer from informal meetings with irrigated rice farmers is thatresistance is morphologically based. This was confirmed in the Claveria study wherehalf the farmers in the survey had an opinion on a mechanism. The most commonwas that the stems were hard (25% of responses)(50% of farmers responded) as thebasis for insect pest resistance therefore not be eaten or bored into. There is somecredulity in the belief of hardness as silica is known to be actively accumulated byrice plants which acts particularly against stemborers. As rice grows it packs cellswith silica molecules to give strength and pest resistance to tillers (Bandong andLitsinger 2005).
A few Claveria farmers in the study came up with astute replies of antifeedants(8% of responses) and tolerance (2%) as mechanisms. There is evidence of ovipo-sitional deterrent chemicals in rice varieties against stemborers (Chaudhary et al.1984) and tolerance is a well known coping mechanism of modern high tilleringrices (Litsinger et al. 2006a). Some Chhattisgari farmers believed gall midge re-sistance was due to the slippery surface of the plants which did not allow eggs toadhere. This answer, although remarkable in the depth of the thinking, is not correct.
Marciano et al. (1981) and Heong et al. (1995a) concluded that because farm-ers did not understand what pests are negatively affected by resistant varieties theysowed, that they oversprayed. But when one looks at the insect pests that farmerstarget, most of them were not those that resistance checks (Table 5.3). Farmers inboth Koronadal and Zaragoza targeted mostly (82%) chronic pests whereas resis-tant varieties are designed to prevent epidemics from brown planthopper and greenleafhopper targeted by only 10% of applications. Our research using the insecticidecheck method (Litsinger et al. 2005) has shown that there is economical yield lossfrom these chronic pests but it is spread evenly over the three main growth stages:vegetative (5%), reproductive (5%), and ripening (3%) making it uneconomical toprotect with insecticides. If all of the loss occurred in one growth stage then pro-tection by insecticides may be more economical.But the farmers’ low insecticidedosage does not provide the killing power necessary to recover such low loses frommodern rice varieties.
On the other hand, modern high tillering varieties are highly tolerant if managedwell agronomically, thus the farmer is better off spending his scarce resources oncrop management practices other than insect control. The “farmers’ practice” has

5 Development of Integrated Pest Management Programs for Rice in Asia 169
led to economic returns in some situations such as when the crop is under stressesfrom other causes as well (Litsinger et al. 2005). The crop then compensates fromnot only the lowered pest injury but also from some of the other stresses. Still thefarmer is better off tackling the other stresses such as weeds than to attempt tocontrol insect pests with insecticides. The negative effects of insecticides includingkilling natural enemies and endangering the farmer and the environment normallyoverride the slim potential benefits.
The Sri Lankan farmers who named brown planthopper resistant varieties werefrom the dry zone where there have been past outbreaks (van de Fliert and Matteson1990). At the time of the survey there were three insect pest resistant varieties tobrown planthopper or gall midge. One brown planthopper resistant variety was verylong maturing and less useful. They concluded (and we support that conclusion) thatmost farmers need to become more aware of the importance of the relation betweenchoice of variety and pest control. More knowledge about existing resistant varietiesis required of farmers to be better managers and decision makers.
5.8.2 Physical or Mechanical Control
Physical and mechanical control methods are quite commonly practiced particularlywithin traditional systems (Litsinger 1994). Many of them were developed beforethe era of modern insecticides and are both labor intensive and practical. In some ar-eas of Asia, field labor is still prevalent thus many of these methods can be econom-ically used. In a survey in rainfed areas of the Philippines, 84% of farmers said theyhandpicked insect pests at least on one crop (Litsinger et al. 1980). Marciano et al.(1981) found 38% of Laguna farmers hand picked stemborer larvae and moths. InKalimanatan farmers net rice bugs from rice fields (Watson and Willis 1985). In 35%of dryland rice farmers in Claveria stated that they handpicked insects as a controlmethod when prompted by the interviewer (Table 5.7) whereas only 2% mentionedthis practice when asked to list control methods only by recall (Table 5.8). Some 5%of farmers used light traps to capture rice bugs.
Grasshoppers and crickets are collected in community-wide hunts by hand andwith nets in some rice growing villages of Cambodia. This method appears veryeffective (Jahn et al. 2007) with the benefit of using them as fried human food, fedto farm animals, or used in compost. Discussions with farmers in Thailand and Laosindicated that trapping provides adequate control of crabs, but Cambodian farmersreport that trapping does not control crabs. Crabs are pests in that they tunnel intorice bunds causing loss of water, thus are considered serious threats.
In a PRA survey in Chhattisgarh India, farmers stated a common indigenouspractice was to store rice seed in airtight clay containers (kothi) covered with aspecial mud from Pakistan (multani miti) that has water sealing properties (IGAU1997). While this would physically prevent stored product insect pests from locatingthe grains it will not kill any that entered in the field thus the grains must be air driedperiodically and exposed to the heat killing sun.

170 J.A. Litsinger et al.
Table 5.7 Dryland rice insect pest cultural, traditional, and superstitious practices affirmed byfarmers as prompted by an interviewer.a Claveria, Misamis Oriental, Philippines
Practice Farmers responding (%)
Prayers (against all pests) 97Early planting date observationb (all pests) 97Field sanitation 95
rats 30worms 18rice bugs 5other insect pests 5
Crop rotation 85Plowing under stubbles (against all pests) 85Smudging using grasses or rubber 77
rice bugs 15worms 5leaffolders 2planthoppers 2
Synchronous planting 72birds 37worms 7rice bugs 5chickens 3rats 2soil pests 2
Moon phase observation (against all pests) 72Use of plant parts 65
Bamboo (Bambosa sp.) branches 23Patulang (Macaranga sp.) branches 5Lemon grass (Andropogon citratus) 3Kilala (Pandanus sp.) branches 3Kamanian (Burseraceae) branches 3Handamay (Trema sp.) branches 2
Rouging 58aphids 7root aphids 2worms 2
Rituals and magical practices 57Trial plantings (evade bird damage) 53Installing of cross 53Talking to spirits (against selected pests) 52Overseeding 40Burning stubbles (against all pests) 38Handpicking (all pests) 38
worms 8rice bugs 2
Wider plant spacing 17Scarecrow (against birds) 11a n = 60, interviewer tape recorded the conversation and all farmers responded.b April–June.

5 Development of Integrated Pest Management Programs for Rice in Asia 171
Table 5.8 Farmers’ cultural, physical, mechanical, traditional, and superstitious practices men-tioned by recall without prompting to control dryland rice pests, Claveria, Misamis Oriental.,Philippines
Practice Farmers practicing (%)a
Superstitious 53Smudgingb/(all pests) 22Scarecrow (birds) 8Use of patulang (Trema sp.) branches 5Light trapping (rice bugs) 5Use of dead animal as baitc/(rice bugs) 3Rat poison baiting 3Use of tobacco extract spray (stem borer) 2Rouging (leaffolder damaged leaves) 2Handpicking worms 2Field sanitation (rats) 2Burning of animal fatsd/(repellent all pests) 2a n = 60, 62% of farmers responded.b Use of rubber tires, plastics.c Dead dog, star fish.d Goat meat.
5.8.3 Cultural Controls
Rice farmers are very good at developing cultural control measures which also formpart of normal crop husbandry that have negative effects on insect pests and thus aredual purpose (Litsinger 1994). The most detailed listing of cultural control practiceselicited from rice farmers comes from Guimba an irrigated site in the C. Luzonrice bowl. The 30 farmers interviewed came up with eight cultural control methods(Table 5.9). The most commonly used was rouging or removing of infested plantsto reduce the spread of tungro (83%) although one farmer mentioned removingstemborer infested whiteheads which is a mechanical control measure. In Laguna,Marciano et al. (1981) reported that 94% of farmers rouge virus infected plantsand whiteheads. The former is a recommended practice while the latter would haveminimal effect. Some 60% of Guimba farmers mentioned planting synchronouslywith their neighbors for insect and vertebrate pest control which is a viable prac-tice. 37% of the farmers correctly stated the beneficial effect of diluting the damageamong the neighbors rather than killing the pest. Draining fields is a recommendedcontrol practice against brown planthopper and caseworm (Litsinger 1994). Plowingsoon after harvest is recommended against weeds and stemborers and would havethe added benefit of removing habitat from rats. Plowing under stubble is recom-mended more than burning as the added organic matter fertility benefits the crop.The survey showed that farmers were aware of and used many non-pesticide controlmeasures. The interviewer was able to compile such a long list by coaxing out theresponses.
In Claveria, few farmers mentioned cultural control practices by recall and with-out coaxing (Table 5.8). The only practices mentioned were roguing and sanitation.

172 J.A. Litsinger et al.
Table 5.9 Cultural practices recalled by irrigated rice farmers, Guimba, Nueva Ecija, Philippines,1986
Practice Respondents (%)a
Removal of infested plants 83Plants turned red, became stunted (tungro) 83Stemborer whiteheads 3
Synchronous planting with neighbors 60Insects will scatter 37Less rat damage 7Less bird damage 3
Remove weeds in the field by hand 50Competes with rice for nutrients 40Lessens tillering in rice 10Acts as shelter for rats 7
Flooding the field 30Weed control 30Rat control 3
Draining the field 30Caseworm control 23Hopper control 7Worm control 3
Plow under rice stubble 23To control weeds 20To kill worms 7Remove shelter for rats 3
Burn rice stubble 23To kill stemborer worms 17To control tungro 3
Transplant old seedlings 10More resistant to pests 10
a 30 farmers surveyed in Bantung village, all responded.
However when a second attempt was undertaken that mentioned the practices oneby one, nine methods were elicited from farmers (Table 5.7). The interviewer useda hidden tape recorder to document the responses of farmers with the view thatfarmers would be more forthcoming with answers. This probably had less benefit ina site such as Claveria where staff lived in the town and farmers knew them. Whenprompted, 97% of the farmers said that early planting escaped seedling maggotdamage which was affirmed by field trials (Litsinger et al. 2003). Farmers did notalways associate cultural control practices with pest control as these operations arecommon crop husbandry. Very high rates of farmer adoption of cultural control prac-tices emerged upon coaxing including field sanitation, crop rotation, early plowingof stubble, synchronous planting, roguing, overseeding, burning stubble, and widerspacing.
The KAP survey in rainfed sites in the Philippines (Litsinger et al. 1980), noted6% of farmers used at least one cultural control method. The most common were:

5 Development of Integrated Pest Management Programs for Rice in Asia 173
1. Increased seeding rate (58%)2. Intercropping in dryland rice(46%)3. Crop rotation (34%)4. Time of planting (22%)
Marciano et al. (1981) in irrigated Laguna found 86% of farmers used water man-agement to control diseases and insect pests, 70% said removal of weeds controlledsome insects, 38% stated low fertilizer usage decreased insects and diseases. In rain-fed rice countries water management is also used for pest control (Fujisaka 1990).Farmers flood fields to control rice seedling maggot. These are wetland fields thatare provided with supplemental irrigation from reservoirs in the monsoon season.Sandy soils are normally without standing water in the early growth stages allowingthe Atherigona flies to invade. For rice hispa Dicladispa armigera, farmers drainfields. It was also concluded, however, that many pests had no control methods. Formole cricket, Kalimantan farmers plant in wetter areas, place seedbeds isolated fromthe previous year’s seedbed, and transplant in places that can be flooded (Watson andWillis 1985). These practices seem to be practical and effective.
Synchronized planting among neighbors as a cultural control practice was knownby 93% of Sri Lankan farmers surveyed but they say they were forced to follow thisplanting schedule due to fact that water delivery occurs by turnout areas thus allfarmers within one turnout are obliged to plant together. Fifty eight percent saidthey planted either early or late to avoid pests, but according to van de Fliert andMatteson (1990) this contradicts the synchronous planting need for planting at thesame time. In fact this not true, synchronous planting works by diluting the pestinfestation across all fields, whereas planting time is an escape mechanism where forvarious reasons pests are known to be in low numbers during a certain season. Earlyand synchronous planting would actually be two control practices that combinedwould give even a greater effect. Most farmers know the benefits of synchronousplanting, for if they plant out of step, then insect pests, rats, and birds become seriousproblems (Litsinger et al. 1980).
Many Sri Lankan farmers astutely perceived healthier crops to be more toler-ant (ie. resistant) to pests (van de Fliert and Matteson 1990). Rainfed farmers inSri Lanka try to cut costs by reducing urea by 1/3 to 1/2 which is a risk aversionstrategy; at the same time such farmers should not waste their scarce resources onprophylactic insecticide applications and if they had funds should increase fertilizerrates to increase tolerance (Litsinger 1993). Cambodian farmers said they appliedfertilizer to insect damaged areas (Jahn et al. 1997).
In Kalimantan, farmers burn weeds in surrounding non-cultivated areas to controlrice bug and time plantings so crops do not mature during March (Watson and Willis1985). Burning weeds is not a good practice because it is also a habitat for insectpest natural enemies. Their objective is to reduce rice bug habitat on wild grasses butbugs are known to disperse long distances so this method would have little effect.Avoiding planting in a certain month must be known from experience thus shouldbe effective. More important for rice bug control is planting among neighbors suchthat all crops mature at the same time.

174 J.A. Litsinger et al.
Notable cultural control methods have been developed by rice farmers by othercrops in rice-based cropping systems. Legumes such as cowpea and mungbean wererelay planted into rice a week before harvest. Harvesters step on the seeds push-ing them into the moist soil and no inputs are needed to be able to harvest up to1 t/ha. Research has shown that the standing rice stubble left after harvest protectedthe legume crop against a wide array of migratory insect pests such as aphids,leafhoppers, beanflies, and thrips (Litsinger and Ruhendi, 1984). IRRI has foundthat intercropping systems such as maize and legumes which encourage predatorssuch as spiders which linger in a legume such as groundnuts at the base of maizeplants (Litsinger and Moody 1976). However research has found that the controllinginfluence of the legume or wide spacing on maize borer was only effective in plotsof 50 m2 or smaller (Litsinger et al. 1991).
5.8.4 Biological Control
As stated earlier, genetic resistance can provide protection against at most 3–4 insectpests and for the rest IPM asks the farmer to rely on natural control and to bolstertolerance through adopting good agronomic practices. Only when other methodsfail should insecticides be used as they disrupt beneficials which are Nature’s giftto the farmer. There is ample scientific evidence to support the beneficial effect ofnatural enemies in insect pest suppression on rice (Ooi and Shepard 1994). Way andHeong (1994) concluded that wetland rice has natural stability mechanisms, morethan other crops.
Rice farmers are need to be aware of a suite of interlinked concepts related tobiological control to be able to efficiently manage their crop. After knowing thebreadth of natural enemies they should know that their densities are sufficiently highthat they can normally suppress most insect pest populations and that insecticidesdo them harm therefore precaution needs to be taken in making decisions whetherto apply them or not. Misuse of insecticides can lead to secondary pest outbreaksand resurgence. Thus natural enemies need to be managed to foster their numbersas they are more effective than most insecticides. Bentley (1992a) found Hondurancampesinos were generally unaware of the existence of most natural enemies exceptfor spiders and some vertebrates such as birds and toads. This is the same result fromthe previously mentioned surveys mostly in Asia. Small scale farmers were thoughtto be unable to comprehend biological control because it was too esoteric (Glass andThurston 1978). Many farmers perceive natural enemies as pests, even the presenceof spiders would cause some farmers to spray. Thus IPM training programs placemuch effort in trying to correct this attitude. In farmer field school extension courses,farmers become highly captivated while learning of the existence of the wide varietyof natural enemies present in ricefields and what pests they feed on (Ooi 1996).Farmers are encouraged to set up “insect zoos” where they hold natural enemieswith rice pests in cages to see if pest numbers decline.

5 Development of Integrated Pest Management Programs for Rice in Asia 175
5.8.5 Traditional Practices
Traditional practices are those that farmers develop using local materials and dif-fer from cultural controls in that the methods used are not normal crop husbandrypractices. Thurston (1990) concluded that traditional knowledge can be overvaluedor romanticized but it would be a mistake to despise or ignore it. Indigenous cropprotection practices according to Watson and Willis (1985) are often highly sitespecific, and practices do not exist for all pests and in all locations. Farmers carryout pest management in an ecological context as they often consider interactions ofcrop varieties, soil, water, and socio-economic factors. Their farming environmentdiffers by location and on a seasonal and longer term basis; farmers’ responses arelikewise variable and dynamic. Most farmers’ techniques aim at reducing rather thaneliminating crop pests, and attaining satisfactory yields. The small-scale approachof many farmers contrasts markedly with the regional emphasis and single crop orpest emphasis of researchers and institutes.
Many traditional insect pest control practices on rice are listed in Litsinger(1994). More traditional practices are followed by farmers cultivating in the marginaland risk prone environments than in favorable irrigated areas where modern ricesand agro-chemical inputs dominate.
Watson and Willis (1985) found that Kalimantan farmers in swampy rice envi-ronments burned fires to smoke out rice bugs as well as broadcast leaves of somefragrant plants (lemon grass) as control measures. For mole crickets some farmersbroadcast table salt. In Claveria 22% of dryland rice farmers also practice smudgingby burning old rubber tires and plastics to repel rice bugs (Table 5.8). Fewer numbersused a botanical insecticide, a bait to attract rice bugs, a homemade tobacco extractspray, and burning animal fats as a general repellant. The rice bug bait based onrotting protein is widespread in Asia (Dresner 1958). Even in an irrigated area wherefarmers practice modern rice culture 19% of Laguna farmers said they used baits andsmudging for rice bug control (Marciano et al. 1981). In Cambodia farmers usedsalt against pests in general, ashes against caseworm, and smoke and bait againstrice bugs (Jahn et al. 1997).
The study in three rainfed areas of the Philippines predictably resulted in a num-ber of traditional practices. Some 60% of farmers stated they practiced at least onetraditional method (Litsinger et al. 1980). Ash from fire residues is placed as abarrier around migrating armyworm larvae or spread on the crop foliage againstsucking insect pests. Smoke is burned for rice bug and other insect pests. Rocksalt is placed in the soil to combat white grubs in dryland rice. Kerosene and soapare sprayed for other pests. 15% of Laguna farmers said they sprayed soap againsthoppers (Marciano et al. 1981).
Use of plant parts was common with some 13 plant species mentioned (Litsingeret al. 1980). Some 72% of Pangasinan farmers using Gliricidia branches pushedinto the paddy for caseworm and whorl maggot control. Gliricidia sepium is knownto be resistant to termites and is used as a stand for orchids in people’s yards. InBatangas, 28% of farmers used Cordia sp. branches (a known medicinal plant)within or beside fields either to ward off or to attract pests (trap crop). Eleven

176 J.A. Litsinger et al.
other plant species are described in detail. 65% of dryland rice farmers in Clave-ria utilized plants as botanical pesticides in some manner as determined by guidedquestions. Six plant species were recorded with bamboo being the most prevalent(Table 5.7). Laotian famers mentioned Gliricidia and neem as botanical pesticides(Rapusas 1997). In Laguna 44% of farmers said they used some kind of botanicalinsecticide for caseworm and other pests (Marciano et al. 1981). Ivory Coast farmersrecalled a number of indigenous practices based on plants such as throwing eitherlemons into the field to repel insects or placing palm leaves on the ground (Adesinaet al. 1994).Chhattisgarhi farmers who say insecticides are ineffective against chitaribanki use botanical insecticides from local plants in the nearby forests. They told usthey harvest branches of the karra tree full of leaves which they place in the affectedparts of their field (15 kg of leaves for 0.2 hectare). The water turns black from theexudate from the immersed leaves. Another botanical is bantulasa medicinal plant.The dried flowers of the mahuawa tree can be used to soak up kerosene which isbroadcast for chitari banki. Neem trees were also mentioned. Several botanicalswere also used by Guimba farmers by directly placing the leaves in paddy waterin areas affected by caseworm (Table 5.10). Again botanical insecticides such asneem have been popularized but these are extracts from the seed rather as the leavesthemselves. Neem leaves are used by farmers to protect their stored grain in confinedreceptacles where their odor repels pests. Placing them in the field would greatlydilute their effect and we actually tested Gliricidia leaves against caseworm in thelaboratory with no favorable result. Rock salt was used against tungro and casewormwith dubious effect. Cooking oil as a sticker and kerosene for caseworm controlwould produce the desired effect. Kerosene has been used throughout rice growing
Table 5.10 Traditional pest control practices recalled by irrigated rice farmers, Guimba NuevaEcija, Philippines, 1986 a
Practice Respondents (%)
Detergent soap 50Sticker for insecticides 43Caseworm control 3Tungro control 3
Use of plants as botanical insecticides 40Gliricidia branches for caseworm 20Cogonb leaves for moths 13
Rock salt 17Tungro 14Caseworm 3
Bait for rat poison 10Broken rice with endrin insecticide 7Broken rice with DDT insecticide 3
Cooking oil as an insecticide sticker 7Kerosene to control caseworm 3a 30 farmers surveyed in Bantung village.b Imperata cylindrica.
5 Development of Integrated Pest Management Programs for Rice in Asia 177
Asia by applying it as a film in paddy water (Litsinger 1994) and would no doubt belethal. It is also phytotoxic to rice so it needs to be drained after a few days.
One traditional practice of Ivory Coast rice farmers was hot water for termites(Adesina et al. 1994). For rice hispa, farmers drain fields and apply a botanicalproduct (Fujisaka 1990). In Cambodia crabs are controlled by botanical repellants(Jahn et al. 2007). In C. Luzon in an irrigated rice bowl where insecticides are theusual insect pest control practice, a survey of farmers found a surprisingly largenumber of traditional practices known by local farmers in Guimba (Table 5.10). Themost commonly known is the use of detergent (40% of respondents) as a stickerfor insecticides or directly sprayed to ricefields for caseworm and tungro control.Goodell (1984) mentions that in Zaragoza, a nearby area, where some farmers spraya laundry detergent. Moore et al. (1979) tested a number of detergents in the USagainst garden pests and nowadays soap products are popular for home gardenersfor aphid control.
5.8.6 Superstitious Practices
A fine line separates farmers’ knowledge from their beliefs. Much of farmers’knowledge may appear to us as a belief or as a simple superstition. A credenceembedded in local belief system is even more than knowledge due to the givensupernatural sanction. What appears to be a silly story to the outsider is a reality tomany farmers. This would be particularly true if pests for part of indigenous mythosof origin as with the Tharu tribe in Nepal where the rice bug was created by their godto damage rice thus requires control by means of a ritual (Bjornsen-Gurung 2003).
Rituals play important roles in the adoption of farmers (such as the Bontok of N.Luzon Philippines) to ecological constraints they have faced for generations (Prill-Brett 1986). Rituals emphasize the relationship between the human social world,the material world, and the supernatural world. Rituals provide reassurance, givingindigenous people a feeling that they have some degree of control in their contin-uous encounters with unpredictable natural phenomena. Rituals also structure theway people act with their environment on a sustainable basis. Ritual sacrifices arecarried out to ensure good harvest. The bile sacs of chickens are examined and if theprognosis is not good a rest day is declared. Bontocs believe rest days are criticalto minimize pest damage to the rice crop. Because each step of the cultivation cycleis synchronized throughout the village, delays at harvest allow pests (rice bug) toconcentrate on late harvests to cause great damage.
Superstition is defined as a belief, practice, or rite irrationally maintained byignorance of the laws of nature or by having faith in magic or chance and usuallyinvolves the supernatural and is often associated with rituals. In Uttar Pradesh, In-dia women plow their fields semi-naked to invoke rains. Such practices involve thepower of certain actions, or avoidance of some actions, to diminish or deflect illeffects (of pests) and/or to promote the positive influence (pests go away). Farmersresort to such superstitious practices for pest control, often based in pagan religiousobservances that have lingered in people’s memories since ancient times. These

178 J.A. Litsinger et al.
are methods of last resort when farmers feel they have no other options and feelhelpless under a situation of threatening yield losses from pests, that they could nototherwise control, and could lead to extreme hardships for their families. Farmersbecome desperate and few options are left except practices based in superstition.They invoke the powers of spirits of ancient pagan religions even though they prac-tice more mainstream religions at the same time. At times they seek the assistanceof local shamen. In Claveria, the richest source of such practices we found in thePhilippines, some 53% of farmers when prompted admitted to using superstitiouspractices. These practices are presented in a hierarchical manner beginning withmethods that are similar to traditional practices to increasing degrees of irrationalityending in the occult (Table 5.7). Many of the practices enumerated by farmers in-volve their knowing of them, but how many are actually pursued on a regular basisis hard to know.
As is common in cultures worldwide, some rice farmers in the Philippines avoidplanting during a full moon (Litsinger et al. 1980). Most (72%) say planting by themoon phase is followed. However there is no consistency in the practices whichwere said to lead to fewer pests and varied from planting during the third quarter(12%), full moon (10%), 3, 5 or 7 days after the full moon (2–7%), last to first quar-ter (9%), or except during a new moon (2%). Other methods employ luck. Farmersavoid unlucky planting dates with the number seven (Litsinger et al. 1980) or ondeath anniversaries of relatives (Altieri 1984). In Guimba 13% of farmers avoidedunlucky planting days (Tuesdays and Fridays or Mondays in August). Some 24% ofLaguna farmers believe in unlucky planting days that if a crop were planted wouldrisk high pest incidence (Marciano et al. 1981).
The next set of practices are based on religious beliefs. The first are fromLitsinger et al. (1980) where Catholic Filipino farmers have a priest bless seed forplanting on Holy Saturday to ensure a good crop. Farmers recite prayers while cir-cling the field to appeal to a higher power to spare their crop. In Laguna 21% of ricefarmers recite prayers to seek avoidance of pest problems (Marciano et al. 1981).In Sri Lanka, a Buddhist country, religion only had a slight effect on farmers’ pestcontrol practices, where 15% of respondents were Buddhists say that for religiousreason they do not like unnecessary killing of animals including pests (van de Fliertand Matteson 1990). A practical consequence is that 1% say they avoid spraying onreligious holidays. In Bhutan, Buddhist farmers have stronger religious convictionstoward insects and do not like the idea of killing any animals such as insect pestsin a rice field. Foreigners using sweep nets were requested to leave the field onreligious holidays (G. Arida, personal communication). The Tharu of Nepal are alsoBuddhists but they believe they can kill kiraa but not other kinds (Bjornsen-Gurung2003). In Claveria 97% of farmers said they prayed to spare their crops from pests.
Others use rituals such as placing a bamboo pole in each corner of the field,but this rite can only be done by one person. The effect is that insect pests will berepelled from the field (Litsinger et al. 1980). These can be quite varied. Catchinga mating pair of insects and returning home without looking back. The insect pairis then released expecting them to lead other insect pests away. Riding a horse orcarabao around a rice field at twilight to repel rice bugs or circle the field with a

5 Development of Integrated Pest Management Programs for Rice in Asia 179
burning bamboo pole is another. In Nepal where farmers practice rice bug worship,two bugs are caught, painted red and black and carried around the community beforereleasing them outside the community to usher it away from their fields (BjornsenGurung 2003). Offerings of food items and burning of incense accompany this ritual.
Others employ shamen or other local religious people to address the spirits.African farmers stated a number of indigenous practices such as consulting tradi-tional herbalists (Adesina et al. 1994). Most farmers, however, carry this out directly.Others address spirits to control pests. In rainfed areas of the Philippines, 39% offarmers offer food (rice, eggs, chicken) to appease spirits to spare their crop frompests (Litsinger et al. 1980). We were told that the farmer should avoid becomingangry against pests otherwise spirits may become vengeful. Trial plantings also arecarried out to appease spirits. Malaysian farmers have been used to planting andleaving the crop to the mercy of the “invisible diseases”. Ignorance of damage by acasual agent is also widespread. This partly is due to the cultural element of super-stition and partly to the low level of knowledge (Heong 1984).
In Claveria farmers collectively have a rich inventory of rituals and magicalpractices. There is much individuality in how each is performed as no two wereexplained in exactly the same way. 57% of farmers stated that they practiced at leastone of such practices (Table 5.11). Rituals include making offerings, performingceremonies that would have the effect of causing the pest to avoid or leave the field.Some involve using the blood of animals. Others involve burning certain plants andoften local shamen perform the rites. These are mainly done against animal pests(insects and rats) with none done against plant diseases. Presumably this is becausethey do not have eyes thus cannot see the rituals’ effects.
The last category of superstitious practices fall under the title of black magicor witchcraft which involve sacrifice of animals and voodoo like rituals to “scare”the pests away from rice fields. A number of these incorporate parts of each typeso the division between magical and black magic is blurred. Black magic methodsare used to scare the pests and include torture or ritualized killing or threats to kill.For example rice bugs are “threatened” or tortured with needles. Many of thesemethods have similarity to voodoo rituals practiced in Haiti and are done in secrecy.In Chhattisgarh several superstitious practices are known by farmers to control ricecaseworm (chitri banki). The first is to take the leaves from a tree near to where aperson committed suicide and place them in the field to control the pest. The secondis for a person who was born legs first to eat puffed rice which makes a crunchingsound while walking around the infested field while saying out loud that he waseating caseworms in order to scare them away.
Fujisaka et al. (1989) also recorded a number of similar superstitious practicesfrom the same site in Claveria and asked if farmers would have the same or similarones for other crops. The answer produced amusement among farmers who thenexplained that such crops are grown with fertilizer and pesticides while rice is asacred crop. As the primary staple crop for many Asian countries rice is synony-mous with life and many religious practices evolve around it (De Datta 1981). Itis interesting in the case of the Philippines which is predominately Catholic thatmany farmers still believe in the ancient religions what were in place before the

180 J.A. Litsinger et al.
Table 5.11 List of superstitious pest control practices that involve rituals, black magic, and prayersof dryland rice farmers in Claveria, Misamis Oriental, Philippinesa
1) Kill white chicken in the field, let blood drain into the soil. Make offerings of prepared foodfrom the chicken carcass and talk to the spirits. This is done every year.
2) Done in the afternoon. Prepare a fire at the center of the rice field to produce smudge usingkamanian herbage. In front of the smoke, say some prayers. After finishing prayers, cross overthe smoke to exit the field.
3) Kill chickens and prepare foods. The Baylan (local priest) will perform the Panigal-i to talk tothe spirits in the fields. Prayers are said in old native language.
4) Dalawit ritual. Done at the start of planting season. Prepare lots of food, especially chick-ens, wine, cigarettes, lime, areca nuts and betel pepper leaves at the middle of the field. Alocal priest will murmur prayers to petition to the deities that the crops be spared from pests.Successful cropping would oblige the farmer to do similar food offerings as thanksgiving.
5) Palihi 1. Stick in a bamboo branch each in the 4 corners and one in the middle of the ricefield. It is believed that like a bamboo branch, a rice stem would be as hard to resist damageby stemborers and other worms.
6) Palihi 2. When about to plant, place a comb, a needle and a handful of chicken dung on topof the seeds. the comb would prevent chickens scratching the sown seeds, the needle wouldmake the seeds invisible to the chickens, and the chicken dung would filth the seeds that woulddiscourage forage by chickens.
7) Place a cross (bamboo, lumber or small round sticks) at the middle of the field. Said to invitespirits to watch crop and ward off all pests. Sometimes associated with rituals. Some farmerswould place a branch of bamboo at the side of a wooden or timber cross.
8) Scarecrow. Install a scarecrow at the middle of the field even well advance before panicleemergence. Some farmers would install it during the night, not letting anyone see him doingit. Said to frighten pests, including insect pests and birds, and never to touch the rice crop.
9) Sticking in of bamboo branches in random spots in a field to expel white grubs.10) For rice bugs. Catch 7 rice bugs. Put rice bugs in the mouth and walk around the field. Spit
bugs out at the end.11) For rice bugs. Place a pin in the anus of 4 rice bugs and release. Shoo while telling them to go
away and never to come back again.12) For worms. Get 3 worms and wrap in a black cloth. Hang over the fireplace in the kitchen. Say
begging words to the worms, asking them not to infest the crop anymore.13) For worms. Look for a rice stemborer-infested plant. Cut off parts to expose worm. Talk to the
worm ‘Go away’ then bite to kill the worm. After, walk across the field starting from east towest then north to south. Do not come back to the field for three days.
14) For worms. Get some deadhearts or whiteheads. Dissect and remove worms with the use of asharp needle. To torture worm so that others would not follow suit.
15) For worms. Look for stemborer deadhearts or whiteheads. Dissect and collect worms using thesharp end of a stingray tail. Place worms in the mouth, walk around the field and blow (spit)them at the last corner, which was also the starting corner, of the field.
16) For worms. Walk alone and look for a stemborer deadheart in the rice field. Remove the wormusing the teeth. With the worm in the mouth, close eyes and walk straight forward across tothe other side of the field where worm is blown out. Do not allow anybody to enter the fieldfor three days.
17) For worms. Save a sharp bone of a fish. Collect any lepidopteran larvae in the rice crop. Dissectand remove by piercing the worm using the sharp fish bone. Walk around the field with thepierced worm at hand. Throw the bone and the worm into the middle of the field when aboutto leave.
18) For worms. Get a larva of an infesting insect. Get a betel nut, a betel pepper and some lime.Sandwich the larva in the betel chew and let a child do the chewing.
19) For all pests. Look for a nest of a bird with eggs. Bury the nest with the eggs during the nightwith nobody else around to watch.
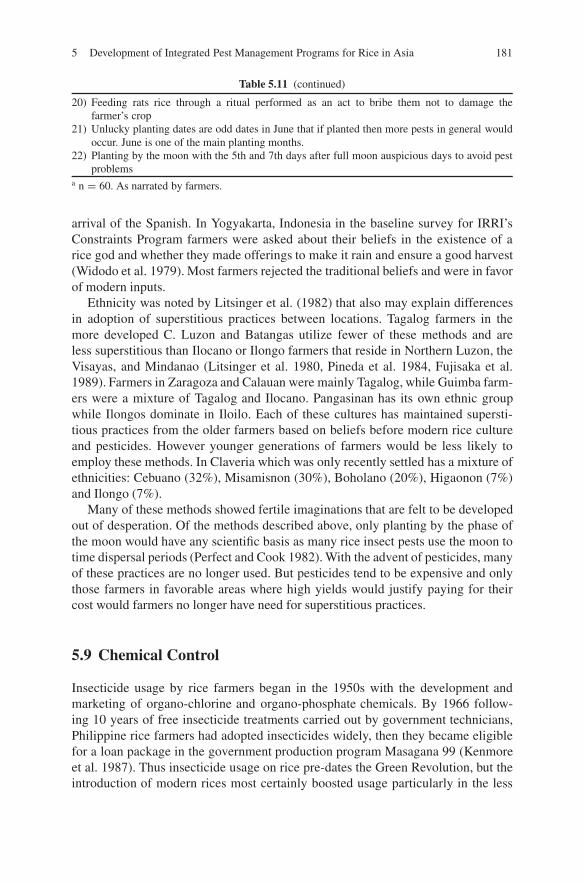
5 Development of Integrated Pest Management Programs for Rice in Asia 181
Table 5.11 (continued)
20) Feeding rats rice through a ritual performed as an act to bribe them not to damage thefarmer’s crop
21) Unlucky planting dates are odd dates in June that if planted then more pests in general wouldoccur. June is one of the main planting months.
22) Planting by the moon with the 5th and 7th days after full moon auspicious days to avoid pestproblems
a n = 60. As narrated by farmers.
arrival of the Spanish. In Yogyakarta, Indonesia in the baseline survey for IRRI’sConstraints Program farmers were asked about their beliefs in the existence of arice god and whether they made offerings to make it rain and ensure a good harvest(Widodo et al. 1979). Most farmers rejected the traditional beliefs and were in favorof modern inputs.
Ethnicity was noted by Litsinger et al. (1982) that also may explain differencesin adoption of superstitious practices between locations. Tagalog farmers in themore developed C. Luzon and Batangas utilize fewer of these methods and areless superstitious than Ilocano or Ilongo farmers that reside in Northern Luzon, theVisayas, and Mindanao (Litsinger et al. 1980, Pineda et al. 1984, Fujisaka et al.1989). Farmers in Zaragoza and Calauan were mainly Tagalog, while Guimba farm-ers were a mixture of Tagalog and Ilocano. Pangasinan has its own ethnic groupwhile Ilongos dominate in Iloilo. Each of these cultures has maintained supersti-tious practices from the older farmers based on beliefs before modern rice cultureand pesticides. However younger generations of farmers would be less likely toemploy these methods. In Claveria which was only recently settled has a mixture ofethnicities: Cebuano (32%), Misamisnon (30%), Boholano (20%), Higaonon (7%)and Ilongo (7%).
Many of these methods showed fertile imaginations that are felt to be developedout of desperation. Of the methods described above, only planting by the phase ofthe moon would have any scientific basis as many rice insect pests use the moon totime dispersal periods (Perfect and Cook 1982). With the advent of pesticides, manyof these practices are no longer used. But pesticides tend to be expensive and onlythose farmers in favorable areas where high yields would justify paying for theircost would farmers no longer have need for superstitious practices.
5.9 Chemical Control
Insecticide usage by rice farmers began in the 1950s with the development andmarketing of organo-chlorine and organo-phosphate chemicals. By 1966 follow-ing 10 years of free insecticide treatments carried out by government technicians,Philippine rice farmers had adopted insecticides widely, then they became eligiblefor a loan package in the government production program Masagana 99 (Kenmoreet al. 1987). Thus insecticide usage on rice pre-dates the Green Revolution, but theintroduction of modern rices most certainly boosted usage particularly in the less

182 J.A. Litsinger et al.
risk-prone irrigated environments. Extension services campaigned for the adoptionof insecticides as a means of ensuring the promised high yield potential in much thesame vein as use of inorganic fertilizers. Usage was monitored in the Philippines byKenmore et al. (1987) from a compilation of some 30 independent surveys carriedout over the country from the 1950s to the mid 1980s. Usage followed a linear risefrom <30% of farmer users in 1960 to >90% by 1980. Farmers adopting heavyusage of inorganic fertilizers were more prone to purchase insecticides.
5.9.1 Expected Benefits
Use of insecticides as well as modern rice varieties was a sign of a farmer beingmodern and progressive. Those who did not were considered lazy, old fashioned,or ignorant (Brunold 1981). In Quezon Province Philippines, for example, 91% offarmers surveyed adopted pesticides more readily than modern varieties (Kenmoreet al. 1985). In Mindanao rice farmers used more insecticides and herbicides thanfertilizers even though returns were greater from fertilizers (Kenmore et al. 1985).
Soon farmers perceived greater reasons to use insecticides (Litsinger 1989,Heong et al. 2002). In Sri Lanka, among the areas surveyed, the area with thehighest number of insecticide applications occurred where brown planthopper and avectored virus were prevalent (van de Fliert and Matteson 1990). Lowest insecticideusage was in an area of unsure irrigated water supply. Almost all farmers were awareof the health hazards of pesticides, but 53% believed that using more insecticidewill mean greater profits. Almost none mentioned harm to the environment frompesticide usage.
Insecticides are used by traditional farmers in very small amounts, if at all, buttheir expectations for insecticides are often unrealistically high, and once they be-came affordable, farmers sought them if they had funds (Thurston 1990). Insecti-cides are looked upon favorably by farmers in developing countries, e.g., in Mbita,Kenya farmers stated insecticides are the most effective pest control method eventhough most had never used insecticides (Bentley and Andrews 1991).
In a survey in the Philippines most (98%) rainfed farmers believe insecticide useincreases yield, with 51% expecting gains less than 25% (Litsinger et al. 1980).Field trials from the areas surveyed, showed that this estimate was correct in manycases but the practice was uneconomical due to the low yield levels. Yield was foundto be independent of the number of insecticide applications in irrigated Laguna,Philippines (Marciano et al. 1981). Rice is a difficult crop to achieve good con-trol with insecticides, principally because good coverage is essential and the lowpressure knapsack sprayers and the farmers’ penchant for low volumes means thatthis is not achieved (Litsinger et al. 2005). Motorized sprayers would overcomethis deficiency but are much more expensive and breakdown frequently and thusnot used.
In a survey in Iloilo, Philippines, some 90% of farmers believed that insecticidesincreased yield and 94% thought they will get a lower yield if they do not spray

5 Development of Integrated Pest Management Programs for Rice in Asia 183
(Brunold 1981). The farmers further estimated a 50% loss if rice were not sprayed.In a survey in Malaysia, 81% of farmers said insecticide application will increaseyield, with 14% saying it will not, and 5% had no opinion (Heong 1984). In thePhilippines farmers are highly convinced of the value of insecticides as barely norespondent perceived an insecticide as ineffective or as causing more pest problems(Warburton et al. 1995).
In Iloilo calendar based applications were mostly followed to avoid risk ofmissing an application as the farmers in the past had experienced a pest outbreak(Brunold 1981). Still most could not afford the prophylactic schedule therefore theyspray only when pests were detected. Still most farmers believed yield suffered as aresult of not following a calendar schedule despite field trials that showed low pestincidence and insignificant loss. Chemical company advertisements are effective inshaping farmers’ attitudes (Kenmore et al. 1985). Waibel (1986) and Tjornhom et al.(1997) also felt propaganda from chemical companies and dealers tended to gener-alize pest outbreaks such that even people in areas that never experienced outbreaksfeared them.
Farmers strongly believed that insecticides were effective against stemborers andthat not using them would result in low yields (Heong and Escalada 1999). Farmersrealized that insecticides would destroy natural enemies but placed moderate im-portance to this effect as well as the negative effect of insecticides on human health(Heong et al. 2002).
Spraying insecticide is considered a good practice and a social norm, thus IPMtraining will need to re-establish a new norm in society, for example that sprayingfor stemborers normally is not economical and therefore not beneficial (Heong andEscalada 1999). KAP studies showed farmers will spray when whiteheads are lessthan 1%. There is likely no yield loss from such an infestation that would be eco-nomically recoverable from insecticide sprays. Thus farmers perceptions of benefitsfrom insecticide use tend to be overestimated.
5.9.2 Change in Attitude
Modern commercial insecticides have resulted in a dramatic change in attitudesamong rice farmer adopters. An example from Java is presented from a KAP survey(Rubia et al. 1996) where overall, insects were seen as important but controllable,with the exception of a newly emerging pest, the white stemborer, which was seenas important but uncontrollable (85%). Farmers felt that the stemborer could notbe controlled because they could not control it with insecticides. No other controlpractices were considered even though the Dutch had instituted delayed planting asan effective community wide practice (Litsinger 1994).
Farmers in Iloilo, Philippines found insecticides were readily available but wereconsidered expensive (Brunold 1981). Thus farmers tended to purchase the cheapestbroad-spectrum generics in 100 ml bottles, which are the most unsafe to use andcause the greatest instability in arthropod populations in ricefields (Cohen et al.

184 J.A. Litsinger et al.
1994). Factors such as costs, side effects, and labor to spray are not seen as barriers.Iloilo farmers said that calendar-based insecticide treatments increased yields andmissing one spray would endanger the whole season thus farmers said they wouldsleep better only if they followed a spray calendar (Brunold 1981). When askedabout other strategies, 88% felt that spraying after seeing damage would be veryrisky and 55% thought that need based usage would result in lower yields. Farmersthink if they wait for signs of damage before spraying, then the crop would be lost,thus calendar basis is considered best (Kenmore et al. 1985).
Central American farmers have energetically adopted insecticides and will spraywhen a beetle eats a whole in a leaf (Bentley 1989). Honduran farmers like to seea dramatic die-off after spraying as all insects are perceived to be their enemies.Belatedly farmers accepted the observation that there were more pests after theyused insecticides than before. They could not understand the concepts of insecticideresistance, resurgence, and secondary pest outbreaks.
5.9.3 Insecticides Seen as Medicines
When encountering a pest problem, most Malaysian farmers in the Muda Irrigationscheme reacted by spraying their crops (Heong 1984). The KAP survey determinedthat insecticide application seemed to be the only tactic they were aware of. Quiteoften a pest infestation is thought to be analogous to human illness and insecticidesare seen as drugs or “medicine” just as with Filipino farmers. In most languagesthe word “insecticide” translates as “medicine” and as in human health insecticidesare perceived to cure a malady. Some farmers, however, apply insecticides for pre-vention (prophylactic applications), but most farmers would not take preventativemedicines, thus the health analogy wrong in the strict sense (Bentley and Andrews1991, Escalada and Heong 1992). But well known benefits of drugs combating hu-man illnesses are equated to insecticides and “after becoming sick” is equated to“after seeing pests”.
Another point was made that ease of use outweighs negative attributes as Fil-ipino farmers in Leyte prefer easy-to-use pesticides to labor intensive cultural andtraditional methods (Escalada and Heong 1992). Familiar, available, independent,reliable, time-saving, easy to use, and effective are preferred over not cheap andnot safe.
5.9.4 Decision Making
One of the most complicated management decisions farmers face in rice culture isto know when to react to an insect pest infestation. Farmers often spay when theysee pest damage and do not check to see if living insects are present. The insecticidecan only kill living insects and cannot repair their damage. In Java, for example,farmers did not know that applying insecticide when stemborer whiteheads were

5 Development of Integrated Pest Management Programs for Rice in Asia 185
evident was too late and a useless effort (Rubia et al. 1996). Leyte farmers, on theother hand, were motivated to prevent a worst case scenario in which they perceiveda loss of $415/ha and thus were willing to spend $39/ha to prevent it (Heong andEscalada 1999). Clearly farmers misperception of the danger posed by insects wasovervalued. Often there is little help to provide guidance to farmers who mostlymake their own decisions as shown in this example in rainfed rice culture in thePhilippines (Litsinger et al. 1980). Farmers receive guidance from:
1. Farmer himself (51% of respondents),2. Extension worker (32%),3. Neighbor (4%),4. Advertisement (4%),5. Pesticide dealer (1%), and6. Radio 1%.
Some farmers are more likely to react to pests they can see more than lessobservable types. Filipino farmers in Pangasinan province were unwilling to treatmungbean sown among rice stubble for early season insect pests such as beanfly.These Pangasinan farmers believed only pod borers were important and not beanfly.Only when they saw trials that treated during the first week of crop emergence didthey change their practice (Litsinger et al. 1977). Farmers’ misperceptions oftenlead to wastage of money and chemicals.
5.9.5 Researchers’ Decision Methods
One of the basic tenants of IPM is for farmers to undertake corrective actions such asan insecticide application only when an insect pest population attains a level that willcause a sufficient economic loss to warrant control costs termed the economic injurylevel. Economic thresholds, derived from economic injury levels, are decision toolsthat are based on a relationship between yield loss and insect abundance (Pedigoet al. 1986). If such a damage function has not been worked out then action thresh-olds, which are derived empirically, can be used. In the case of rice, action thresholdshave been used in place of economic thresholds because damage functions havebeen found to be highly dynamic due to the tremendous capacity of modern rices tocompensate for crop stresses including pest damage (Bandong and Litsinger 1988,Smith et al. 1988). Compensation in turn is dependent on many factors such as cropmanagement, crop maturity, and the number of stresses affecting the crop (Litsingeret al. 2006a, Litsinger 2008b).
The determination of economic thresholds in small farm systems is especiallycomplex because more than strict profit-loss relationships are involved and gener-ally a whole pest complex (insects, weeds, diseases) affects the crop (Altieri 1984).Moreover circumstances at the individual farm level are so highly variable that sep-arate pest-density thresholds should be established to suit individual circumstances.This is of course unrealistic as the alternative of applying a single threshold to a

186 J.A. Litsinger et al.
heterogeneous group of farmers because of their vegetational diversity, traditionalagro-ecosystems usually enjoy a high degree of natural control. Therefore in thosesystems with relatively high numbers of natural enemies, thresholds should be ad-justed upward. How to make thresholds appropriate to farming circumstances inpeasant agriculture remains a major challenge. One needs to plan insect controlinterventions with those in other pest control disciplines. Altieri’s generalizationapplies more to dryland polycultures than to rice monocultures, especially singlecrop traditional rice where natural enemy abundance is not as high as in irrigateddouble cropping due to the long dry fallow.
Despite these limitations, Litsinger et al. (2005) found that action thresholds canbe used to predict yield loss with significant accuracy. The problem encountered intheir use was the inefficiency of insecticides when applied via knapsack sprayers toadequately control a pest in response to a threshold. This inefficiency is manifestedas the “kill coefficient” and is part of the equation used to determine economicthresholds. Waibel (1986) found farmers had lower kill coefficients than researchers(e.g., 64% vs. 39% mortality for stemborers). Furthermore Litsinger et al. (2005)found kill coefficients based on the knapsack sprayer to be too low for adequatecontrol in response to thresholds.
5.9.6 Farmers’ Decision Methods
Farmers have been exposed to two different extension messages regarding insec-ticide decision making on modern rices. The first in the 1970s was prophylacticbased with applications timed to specific crop growth stages without monitoring,while since in the 1980s, farmers were encouraged to monitor and apply insecticidewhen pest density reached a specified level. Kenmore et al. (1987) believed farmersinnately preferred the more simple crop stage-based insecticide approach, but sinceinsecticides became increasingly costly, farmers could not afford protection overthe entire crop cycle. Bandong et al. (2002), on the other hand, concluded Filipinofarmers limited their usage by applying when an intolerable loss was perceived tobe imminent due to economic necessity.
5.9.6.1 Three Decision Modes
KAP studies showed that farmers’ insecticide decisions can be divided into threetypes: (i) prophylactic or based on the crop growth stage, or based on crop moni-toring regarding (ii) pest population density or (iii) amount of damage. The modeof decision making varied extensively by location. In China in the late 1950s to endof 1970s, decisions about rice production were made by commune team leaders andnot individual farmers. But a more recent a KAP survey in Zhejiang found 69%of farmers’ spray decisions were prophylactic with only 17% utilizing infestationin one’s own field and 14% when an infestation occurred in a neighbor’s field (Huet al. 1997). But this seemed to be the exception as KAP studies elsewhere showedfarmers do not predominantly make insecticide decisions by prophylactic spraying.

5 Development of Integrated Pest Management Programs for Rice in Asia 187
A mix of the three modes was most commonly employed, the degree of any onemode varied by site.
One of the first studies occurred in rainfed rice areas of the Philippines (Litsingeret al. 1980) which found that only 33% of insecticide applications were prophylacticwith 37% based on plant damage and 29% presence of pests on rice. Plant damagesymptoms were either damaged plants (37%), change of plant color (24%), floatingleaves (9%), or deadhearts (2%). Waibel (1986) reported surveys in the Philippinesthat showed less than 10% of insecticide applications were calendar based with50–60% of decisions being made upon observing the pest or its damage. In anotherKAP study in the Philippines found farmers used a mixture of the three decisionmodes rather than following any one (Bandong et al. 2002), but most decisionson the main crop were made after crop monitoring (combining insects and theirdamage) rather than prophylaxis. Prophylaxis was the mode of choice, however,in the seedbed probably because of the high risk farmers place on damage at thisstage. Loss of a seedbed may mean significant delay in planting risk of not receivingsufficient irrigation water. Reasons for farmers in Leyte spraying were 27% preven-tion (prophylactic) and 73% in response to pest infestation (Heong et al. 1992). InGuimba, Fajardo et al. (2000) also noted that two-thirds of the insecticide applica-tions in the seedbed were prophylactic, usually timed within a week after fertilizerapplication. The remaining applications were based on the presence of insect pestsor their damage.
Warburton et al. (1995) reported that farmers in two provinces in the Philippinesapplied insecticides based on the perceived intensity of infestation in Laguna (34%of applications) and Nueva Ecija (58% of applications) with lower levels prophylac-tically based. Another study in the Philippines by Rola and Pingali (1993) reportedthat only 24% of insecticide applications were prophylactic. In Sri Lanka, van deFliert and Matteson (1990) found most (79%) farmers applied insecticide based onpest monitoring rather than prophylactically. Some of the prophylactic applicationsmay have stemmed from farmers’ viewing insecticides in the same light as fertil-izers and follow a strict growth stage schedule in terms of application timing andfrequency each time they grow the crop (Bandong et al. 2002).
If insecticide cost is not a significant factor, farmers will apply more as insur-ance (Kenmore et al. 1985). This was corroborated from data reported earlier thatMalaysian farmers would apply more frequently if insecticides were given free orwere highly subsidized by the government. It is interesting that rice bug, one ofthe most recognized of rice insect pests, is treated mostly via a prophylactic basis(Bandong et al. 2002). This may be because of its being only one of four insectgroups that directly attacks the grains in the field (the other three are stemborerscausing whiteheads, katydids, and armyworms cutting rice panicles). Thus farmershave high regard for rice bug damage as noted in other studies (Litsinger et al. 1982,Heong et al. 1992), as farmers do not realize that rice plants can greatly compensatefrom rice bug damage (Litsinger et al. 1998).
Differences in decision modes noted between sites could have been due to differ-ences in the pest complexes and outbreak histories across sites as well as differencesin perception, the extent and kind of training, and risk that occurred for farmers and

188 J.A. Litsinger et al.
Table 5.12 Chronological rice crop production and input usage profiles of two selected farmers inZaragoza, Nueva Ecija, Philippines 1982–1991a
Seedbed fertilizerN per seedbed area
gnimiTAppl.no.
Appl.no.Year Crop Culture Cultivar Brand (kg / ha) (DAS)
A. Ligazon, 2.5 ha
‘84 WS TPR IR42 1 UreaMilagrosaMalagkit
‘85 DS TPR IR36 1 UreaIR42
‘86 DS TPR IR64 1 Urea‘86 WS TPR IR64 1 Urea‘87 DS TPR IR64 1 Urea
‘87 WS TPR IR42 1 Urea
‘91 WS TPR IR60 1 UreaAG-O-OMilagrosa
M. Espiritu, 2.5 ha
‘82 WS TPR IR36IR52IR54
‘83 DS TPR IR42 1 UreaIR54IR56
‘84 WS TPR IR42 1 UreaC-1000Milagrosa
‘85 DS TPR IR56 1 21-0-0
‘85 WS TPR IR62 1 Urea"IR98"
‘86 DS TPR IR64 1 Urea
‘86 WS TPR IR64 1 UreaIR56
‘87 DS TPR IR42 1 UreaIR64
‘87 WS TPR IR66 1 UreaIR42
‘91 WS TPR IR64 1 Urea
1
1
100
1
1
0
0
0
1
0
0
0
1
1
323
184184230
230
184
159
92
153
74
92
74
77
13
21
151512
12
10
9
10
10
10
10
14
13
9
11 1RC2

5 Development of Integrated Pest Management Programs for Rice in Asia 189
Table 5.12 (continued)
Seedbed insecticide rezilitrefporcniaMgnimiT)ah/gk(egasoDgnimiT Appl.
no.Appl.no.Brand N P K (DAT)Brand (DAS)
Brodan EC 061
Hytox WP 24 1 Urea +14-14-14
2 UreaAzodrin EC 17 1 Urea
1 Urea1 Urea2 Urea
Brodan EC 18 1 Urea +14-14-14
Thiodan EC 16 1 Urea +17-0-17
1 16-20-02 Urea
1 Urea
2 Urea1 14-14-14
Azocord EC 18 1 Urea2 Urea +
16-20-03 Urea +
16-20-01 Urea2 16-20-03 Urea +
16-20-01 Urea2 Urea1 Urea
Cymbush EC 28 1 Urea2 Urea3 Urea
Brodan EC 21 1 Urea +14-14-14
2 UreaEndox EC 27 1 Urea +
14-14-142 Urea
0
0
000
0
0
na
na
12
1
1
1
1
1
1
1
47
464646692944
57
1929
64
3711
4839
29
371629
445852
70601545
3144
53
1
000006
0
230
0
011
013
11
0205
000
0003
06
0
1
000006
20
00
0
011
00
0
00
000
0003
06
0
13
501018144126
15
1834
16
3836
1119
41
03540
03713
022350
3810
35
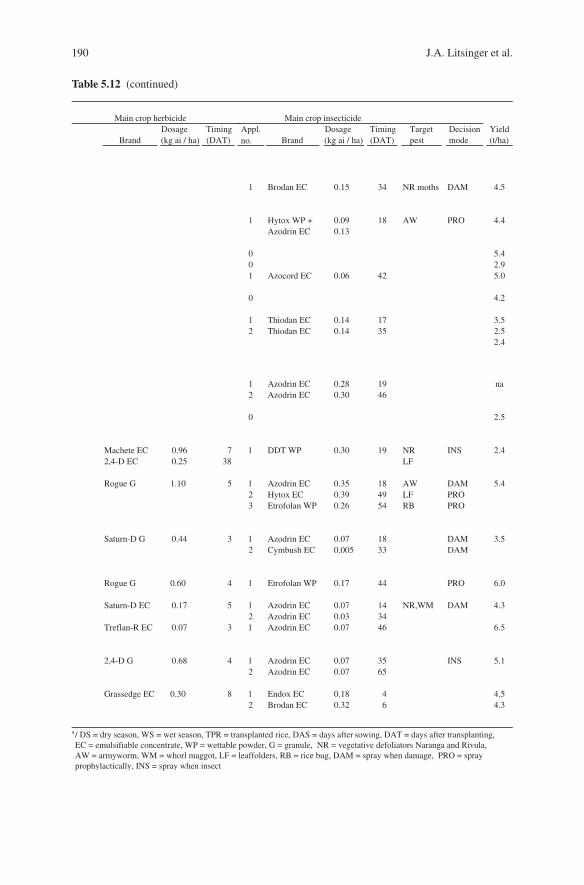
190 J.A. Litsinger et al.
Table 5.12 (continued)
gnimiTegasoDgnimiT(DAT)
tegraTpestBrand (kg ai / ha) (DAT)
noisiceDmode
dleiY(t/ha)
1 Brodan EC NR moths DAM
1 Hytox WP + AW PROAzodrin EC
001 Azocord EC
0
1 Thiodan EC2 Thiodan EC
1 Azodrin EC2 Azodrin EC
0
7 1 DDT WP NR INS38 LF
5 1 Azodrin EC AW DAM2 Hytox EC LF PRO3 Etrofolan WP RB PRO
3 1 Azodrin EC DAM2 Cymbush EC DAM
4 1 Etrofolan WP PRO
5 1 Azodrin EC NR,WM DAM2 Azodrin EC
3 1 Azodrin EC
4 1 Azodrin EC INS2 Azodrin EC
8 1 Endox EC2 Brodan EC
na
4.5
4.4
5.42.95.0
4.2
3.52.52.4
2.5
2.4
5.4
3.5
6.0
4.3
6.5
5.1
4.54.3
34
18
42
1735
1946
19
184954
1833
44
143446
3565
46
0.15
0.090.13
0.06
0.140.14
0.280.30
0.30
0.350.390.26
0.070.005
0.17
0.070.030.07
0.070.07
0.180.32
a/ DS = dry season, WS = wet season, TPR = transplanted rice, DAS = days after sowing, DAT = days after transplanting, EC = emulsifiable concentrate, WP = wettable powder, G = granule, NR = vegetative defoliators Naranga and Rivula, AW = armyworm, WM = whorl maggot, LF = leaffolders, RB = rice bug, DAM = spray when damage, PRO = sprayprophylactically, INS = spray when insect
Main crop herbicide Main crop insecticideegasoD
Brand (kg ai / ha)
Machete EC 0.962,4-D EC 0.25
Rogue G 1.10
Saturn-D G 0.44
Rogue G 0.60
Saturn-D EC 0.17
Treflan-R EC 0.07
2,4-D G 0.68
Grassedge EC 0.30
Appl.no.

5 Development of Integrated Pest Management Programs for Rice in Asia 191
their communities. Ethnicity was noted by Litsinger et al. (1982) to explain differ-ences in approaches to pest control. Heong et al. (1994) concluded that individualwetland rice farmers in either the Philippines and Vietnam showed a wide variationin loss assessment from a given pest infestation level.
Farmers may vary over time in their motivation to use insecticide. For example,farmers whose supply of rice had been decimated by a pest outbreak or by inclementweather are more prone to spray on a prophylactic basis on the next crop whenproduction rather than profit became the central goal (Litsinger 1993). Among thestudy sites, Koronadal farmers probably were more conscious of pest outbreaks dueto their recent history which may explain their behavior to spray more frequently(Bandong et al. 2002). Despite this they were no more likely to spray based oncalendar basis than for the other two sites. Tracking individual farmers showed thatthey do not always follow the same mode each time but engage in all three depend-ing on their perceptions in a particular crop (Table 5.12). Records are not complete,but Mr. Espiritu made two decisions based on a prophylactic basis while three werebased on insects and four on damage.
A caveat in the use of monitoring, exemplified in Malaysia, revealed that eventhough none of the farmers applied strictly by prophylactic decision making, theywere divided among: seeing pests in the field (84%), applying when advised by ex-tension officers (26%), and when pesticides were provided by the government (42%)(Heong 1984). Farmers, however, ended up spraying frequently because “seeing thepest” is a very low threshold level meaning that the criterion “pests were readilyseen” will occur in all crops. Even though the preponderance of insecticide appli-cations in the Philippines was based on monitoring, farmers’ action threshold levelswere usually very low. Rola and Pingali (1993), confirming the results of the currentstudy, found that in 53% of cases farmers sprayed when they saw a single insectin the field. Kenmore et al. (1987) found that farmers sprayed upon seeing a fewpests as they believed that waiting until threshold numbers occurred would be toolate. Farmers told Brunold (1981) that they would rather err by over-spraying thanunder-spraying. 63% of Sri Lanka farmers agree with the statement that one shouldspray as soon as pests are noticed (van de Fliert and Matteson 1990). Some 39% hada personal threshold for brown planthopper that was about half that of researchers.
The challenge for extension services therefore is to guide farmers to raise theirthreshold levels from a few per field to a few per hill. Farmers often perceive pestsas an aggregate rather than by species as researchers do. This attitude was ableto be changed in farmer field schools by having farmers count pests and naturalenemies and only spray when pests outnumbered them. As ricefields are rich innatural enemies it rarely occurred that pests outnumbered natural enemies in theweekly monitoring exercises.
5.9.6.2 Farmers’ Rules of Thumb to Spray
When faced with uncertainty, people often use decision rules or heuristics (Heongand Escalada 1997a). Heuristics are learned through experience. Without having toretrieve all the information in one’s stored memory, these simple rules help humans

192 J.A. Litsinger et al.
organize and interpret new information. Filipino farmers’ views that defoliatingLepidoptera are harmful make farmers become victims of pesticide misuse. Factorsthat affect this perception and pest belief model are composed of four components:
1. Perceived benefits = degree to which action will reduce pest attack or increasetolerance,
2. Perceived barrier = perceived negative aspects of action,3. Perceived susceptibility = subjective risk of getting attacks if no action is taken,
and4. Perceived severity = severity of attack.
The theory of reasoned action was used to study relationships between attitudesand behavior and is composed of two aspects (Heong and Escalada 1999):
1. Behavior intention as influenced by attitudes toward behavior and his subjectivenorms and
2. Attitudes are the extent to which a farmer sees the consequences of the actionor is in turn influenced by behavioral beliefs and evaluations of the beliefs. Theattitudinal measure can thus be obtained by summing the products of belief andevaluation scores.
Decision making in IPM like all other economic problems involves allocatingscarce resources to meet human needs. Initially there is the choice of whether, when,or how to attempt to manage insects with scarce capital or labor (Mumford andNorton 1984). Economic thresholds have been developed on the basis of objectiveinputs but are unrealistic in working situations when subjective considerations comeinto play. Thus decision making is normative (based on perceptions) and not purelyeconomic. Subjective considerations are based on changing goals and farmer be-havior. These in turn are conditioned by the number of years of similar experienceswith the specific pest problem where the outcome was noted. Decisions can alsobe tempered by how many other decisions are required and if the farmer is tired ofmaking decisions, has a change in goals, and whether crop conditions are similar.Thus the farmer’s perception of the problem becomes important as it may not beexactly the situation in the field. Decision making is dynamic in that an action takenin one time can greatly affect perceptions in the next time period.
KAP studies in the Philippines revealed two guidelines used by farmers whichare both prophylactic in nature.
When a Neighbor Sprays
Some farmers tend to rely on the advice of others on when to treat. Sometimesthey mimic their relatives or neighbors’ spraying activities without considering pestpopulations on their own fields. Rola and Pingali (1993) found that 67% of Filipinofarmers interviewed said at times they spray as a result of seeing a neighbor spray.Palis (1998) found that 67% of farmers believed the same way in that after sprayinginsect pests leave sprayed fields for unsprayed fields. Iloilo farmers also follow this
5 Development of Integrated Pest Management Programs for Rice in Asia 193
method. They said spraying just after a neighbor sprays keeps insect pests fromentering their field that would be repelled from their neighbors.
Once sprayed, in the view of farmers, the chemical acts as a repellent againstfuture invasion and build-up (Brunold 1981). In Guimba the respondents made theirown decisions as to when to spray. But, 95% of them said it was important to spray atthe same time as their neighbors (Fajardo et al. 2000). Farmers in Java also believethat if a neighbor sprays that insect pests will be repelled and move to their field(Rubia et al. 1996).
This perception does not have any scientific basis, however. Although it is truethat some insecticides such as synthetic pyrethroids and neem have repellent prop-erties, they have not been noted to drive pests to unsprayed fields. If all the fields butone were sprayed there is no evidence that insect pests are driven to the unsprayedfield. In fact quite the opposite occurs. A trial, where plots of different sizes wereleft unsprayed, showed an edge effect of depressed insect densities in the unsprayedplots for a few meters along sampling transects (Litsinger et al. 1987).
Spray when Inorganic Nitrogen Fertilizer Added
Most of the farmers in Zaragoza interviewed (66%) stated that for some insecticideapplications their timing was influenced by the timing of fertilizer, particularly dur-ing the vegetative stage, but even in the seedbed, this was done irrespective of pestdensity (Bandong et al. 2002). Rola and Pingali (1993) similarly found a significantnumber of C. Luzon farmers they interviewed (40%) applied insecticide in relationto the timing of the first fertilizer application. The farmers’ motive is to protect thenow more vulnerable plant. The timing of fertilizer afterward rather than beforeinsecticide application allows time for the softening effect to occur.
Farmers were astute in linking nitrogen application with increases in insect pestabundance and damage. The farmers’ belief that nitrogen causes the rice plant tobecome “soft” is true due to enhanced plant growth (from the greater nutrition) thatreduces the density of protective “hard” silica bundles in the tillers (Bandong andLitsinger 2005) and the crop becomes more susceptible (“soft”) to insect pest dam-age. Most rice insect pests have been found to increase in abundance, and feedingrates and survival have been found to increase in relation to application of nitrogenfertilizer (Litsinger 1994).
Insecticide use based on fertilizer use is rarely justified, however, due to thebeneficial effect of fertilizer in bolstering the plant’s ability to compensate fromdamage (Litsinger 1993). Field trials have shown that nitrogen application increasesthe tolerance of the rice plant to insect damage, thus significantly raising actionthresholds. Therefore although insect pests benefit, the crop benefits even more.Thus one should not minimize nitrogen usage to rice as a pest management technol-ogy. While true that pest numbers increase, yield also increases.
Field trials carried out by farmers forms a part of the farmer field school cur-riculum to demonstrate the beneficial effect of fertilizer in increasing crop tolerance(Matteson et al. 1994). Rubia et al. (1996) found most Indonesian farmers initiallydid not understand the concept of compensation. Farmers in Guimba, particularly

194 J.A. Litsinger et al.
in the dry season, use N rates much above those recommended (averages of 131–152 kg N/ha in 1989–1991 dry seasons vs. 90 kg N/ha recommended), and havefound by trial and error that insecticide can be substituted by fertilizer.
5.9.7 Farmers’ Crop Monitoring Methods
Compared to other rice production practices, insect pest control requires frequentassessment and decision making as pests can occur at any time. Rigorous samplingas required by scientists’ thresholds is difficult for farmers to carry out. They ex-amine their fields, generally by looking at a few plants in one or several parts ofthe parcel (subunit of a field) but this manner of sampling is not accurate. It is saidIPM is too intellectually complex as it involves pest or damage identification, vari-etal identification, threshold determination, dosage, volume, and choice of chemical(Escalada and Heong 1992).
Filipino farmers visit their fields at least once a week on average between plant-ing and harvest (Bandong et al. 2002). Reasons for field visitation at the time ofa spray decision were grouped into categories and the results varied by location(Table 5.13). Zaragoza and Guimba farmers were more concerned about checkingfield water levels, whereas Koronadal farmers were primarily concerned about pests.The finding by Waibel (1986) that, although decision making is more likely to bebased on scouting, the main purpose for field visitation was normally for other
Table 5.13 Reasons given by Zaragoza, Guimba, and Koronadal farmers for visiting their fieldswhen the decision to use insecticide was madea
Site Crops (no.) Reason Responses (%)
Zaragoza 2 Water management 38Pest control 25Fertilization 13Clean bunds or dikes 12Pest monitoring 7Check crop growth 5
Guimba 2 Water management 52Pest control 26Pest monitoring 12Fertilization 5Check crop growth 3Clean bunds or dikes 2
Koronadal 4 Pest monitoring 52Pest control 22Water management 8Fertilization 8Check crop growth stage 6Replant 2Removing coconut fronds 2
a see Bandong et al. (2002) for farmer sample size.

5 Development of Integrated Pest Management Programs for Rice in Asia 195
reasons. Farmers in other Asian countries appeared to be more vigilant. van deFliert and Matteson (1990) found that most (81%) Sri Lankan farmers visited theirfields daily, while in Tamil Nadu, India, Sivakumar et al. (1997) found nearly halfof farmers monitored their fields for pests every other day. Increased visitation forpest monitoring is warranted when fields are under threat of the brown planthopperwhich affected the farmers in the studies in Sri Lanka and India.
5.9.8 Where to Scout for Early Warning
KAP studies showed some farmers had preferred locations to scout first. Such in-sights come in farming areas where the farmers have learned to trust the projectstaff who in turn keep probing for more detailed explanations on scouting methods.Parcels near the canal tend to drain more quickly while those down slope accumu-late water, particularly after rains. Through experience some farmers preferentiallyscouted the lowest lying parcels (Bandong et al. 2002). This shows good farmerinnovation as there is ample evidence to support the farmers’ choice of the wettestparcels as a monitoring site of first choice. A number of rice insect pests are knownto be more prevalent in more flooded habitats. The most aquatic is rice casewormwhose larvae have functioning gill-like structures and require standing water for sur-vival (Litsinger et al. 1994). Other species include whorl maggot, yellow stemborerScirpophaga incertulas, black bug, and defoliators (Litsinger 1994).
Farmers with a habit of first going to higher lying parcels mentioned doing so forstemborers and leaffolders (Bandong et al. 2002), but there are no known reportsin the literature regarding this micro-habitat preference. Leaffolders are known tobe more prevalent in shade under trees which are more prevalent in higher lyingparcels (Barrion et al. 1991) while caseworm larvae are blown downwind to thesides of fields where they aggregate to cause heavy damage (Litsinger and Bandong1992).
Rola and Pingali (1993) found some farmers were not amenable to synchronousplanting as they did not want to be the first to plant as they want to be able tosee damage on neighboring fields. In C. Luzon some 5% of decisions were madeusing this rule (Bandong et al. 2002). Attempts by us, however, to utilize earlierplanted fields in the development of action thresholds, however, gave erratic resultsfor whorl maggot, defoliators, leaffolder, and stemborer (Litsinger et al. 2005). Thiswas probably because infestations can be highly variable between fields, and al-though generally true that pest infestations tend to build up over the season, naturalenemy activity also increases. The field study concluded that it was more reliable tomonitor pests in one’s own field.
5.9.9 Crop Monitoring Technique
KAP interviews found farmers developed their own subjective monitoring tech-niques (Bandong et al. 2002). Farmers’ monitoring patterns were only noted in

196 J.A. Litsinger et al.
one study where three methods were employed by a small fraction of farmers. Inthe first method the farmers crossed to other side of the parcel (6%), while othersmade a zigzag pattern (2%) or walked in a circle (1%). Researchers recommend thatmonitoring be done from inspecting hills in the field selected along a transect andnot from along the borders. Both crossing (Reissig et al. 1986) and zigzag (Shepardet al. 1988) patterns have been suggested by researchers and we see some farmersfollow these patterns.
In the study by van de Fliert and Matteson (1990), most (88%) Sri Lankanfarmers monitored without entering the field unless they saw something to take acloser look; only 7% inspect >2 hills per hectare. Similar results were found byBandong et al. (2002) with 66–87% of decision were made from the edge of fields.In Zaragoza these were broken down by crop stage and pest: 85% of decisions inthe seedbed, 91% in the vegetative stage, 92% for leaffolders, 81% for plant- andleafhoppers, 91% for stemborers, and 100% for rice bugs.
This begs the question of why don’t farmers enter the field to monitor? Scientistsbelieve that assessments cannot be accurately made without inspecting plants fromvarious locations in the field knowing that the distribution of insect pests is notrandom nor regular. Edge effects are also known to produce anomalies in the dataand most insects are very small and one has to bend over the plants to see or dislodgethem into the water. This cannot be readily done from the bund. Also bunds arehabitats for fire ants thus in the field itself is a more logical choice for monitoring.
In the authors’ experience in working with Filipino farmer groups during exten-sion exercises, farmers are quite content to observe researchers and extensionistsmoving about in a field while they stand on the dikes. Goodell et al. (1982) statedthat it was a small victory to persuade farmers to step off the bund to inspect theircrop. Farmers, under this situation, generally need to be coaxed to step into the field.It is believed in many Asian societies, farmers are concerned about getting muddyas would happen with a laborer rather than as a manager, particularly those farmerswho hire laborers such as in Zaragoza. Those who work in fields are consideredlower on the social scale as field work is dirty. A Zaragoza farmer is more likelyto enter if he is alone than if a group is present. More Koronadal farmers are proneto enter fields to monitor (43% of occasions) than Zaragoza farmers (11% of occa-sions), probably because in Koronadal there are fewer landless laborers (Bandonget al. 2002). There is social pressure for the landless in rural communities to seekwork in farmers’ fields when there is a large pool of landless labor and right toharvest arrangements are made in exchange for labor.
Discussions with farmers in Batangas, Philippines in a dryland rice area revealedthat a number share the belief that one should not enter a rice field once the paniclesare formed as plant movement will disturb pollination, reducing grain set. This cameabout during sweep net sampling for rice bugs during the ripening stage of drylandrice in Batangas. We were requested not to enter the field at this time. Knowledgeof rice plant physiology, however, would not support the farmers’ belief in this case.Rice is self-pollinated and disturbing the plants does not affect spikelet density. Thisbelief, however, may be why many farmers are hesitant to enter their field once thepanicles have emerged. It was noted that most farmers spray for rice bug based on

5 Development of Integrated Pest Management Programs for Rice in Asia 197
prophylactic decision making. Of course walking through the field during sprayingwill disturb the plants but apparently the threat of rice bug is greater than presumeddamage caused from walking. Arida and Shepard (1987) undertook a study to seeif walking in the field in earlier crop growth stages was harmful but did not find ayield reduction.
Farmers appear not to have a set idea to enter the field during monitoring and willonly enter if a decision cannot be made from the edge (Bandong et al. 2002). Somefarmers, short of entering the field, will crouch on the bund and reach into the fieldto inspect plants for insects or damage. These farmers may tap plants and submergehills from the bund. Fortunately some of the activities that were the primary reasonfor the farmer to come to the field cause him to enter the field (weeding, cleaningthe bunds, or opening the bund to manage water) and thus insect infestations maybe detected indirectly. This step-wise decision process was also noted by Waibel(1986) and Goodell et al. (1982). In Sri Lanka, van de Fliert and Matteson (1990)found that, just as in the Philippines, most of the inspection is done by farmers fromthe bund.
Vacant strips are left within irrigated rice fields by a few Sri Lankan farmers(15%) for crop monitoring and access to spraying but most say it is a waste of landand yield potential (van de Fliert and Matteson 1990). Actually the edge effect willoffset this perceived loss. Plants growing along borders will yield more as wouldhappen if deep ditches are dug for fish in rice-fish culture or monitoring strips.Border plants have less competition and thus yield more per plant than those inthe center of the field.
Just as UK farmers spray aphids when they drive along the farm road by see-ing the density of their smashed bodies on the windshield (Tait 1983), Asian ricefarmers also have rapid assessment methods. For example rice bug is detected byits smell by Kalimantan farmers (Watson and Willis 1985). Filipino farmers oftenbase their insecticide decision on seeing moths (defoliators, caseworm, stembor-ers, or leaffolders) flushed out while walking along paths (Bandong et al. 2002).This idea of relating flushed moth numbers to field larval infestations was testedin developing action thresholds, but like the earlier planted fields produced erraticresults (Litsinger et al. 2005) due no doubt to the activity of natural enemies. Whilewalking through fields it is common to flush up clouds of leaffolder moths producingthe expectation of imminent high damage levels. High infestations, however, rarelymaterialize as leaffolders have many parasitoids and predators.
The small number of farmers who tap hills to dislodge insects have indepen-dently developed this sampling technique now utilized by researchers (Bandonget al. 2002). It is quicker than by direct observation, a method also used. Activehoppers and camouflaged larvae are more readily seen when stuck by the surfacetension of water than trying to locate them on the foliage. Farmers slap several hillsat once rather than focusing on a single hill as recommended by researchers in orderto get a count on a per-hill basis. Researchers also count predators on the watersurface, not just the pests.
Submerging hills to dislodge foliage feeding larvae is done by a handful of farm-ers and is an innovative method and does work to cause the larvae to float, especially

198 J.A. Litsinger et al.
on a young crop (Bandong et al. 2002). Most commonly found are defoliators suchas semi-loopers which have small bodies and long setae and thus float. Armywormsand cutworms, however, sink due to their larger biomass and lack of long setae. Itis a good idea to look for the larvae in the field before spraying as if the populationhas mostly pupated the insecticide will not have the desired effect.
Filipino farmers related that they sampled more hills when pest populations werehigh. No farmer interviewed, however, sampled a total of 20 or more hills duringany one monitoring day as recommended (Bandong et al. 2002). In Sri Lanka, vande Fliert and Matteson (1990) found that only 7% of farmers inspected more thantwo hills of rice upon entering.
There was a large variation among farmers in their perceptions. Most Javanesefarmers applied insecticides when they saw deadhearts, whiteheads, egg masses, oreven one moth, especially if the densities were increasing from the last visit (Rubiaet al. 1996). In rainfed rice areas of the Philippines farmers noted change of colorof plants (24%), floating leaves (9%), and deadhearts (2%) as early warning indi-cators (Litsinger et al. 1980). Honduran farmers generally examine their fields byobserving some of the plants in one or more parts of a parcel (Bentley and Andrews(1991). They do not have the ability or interest to calculate percentages. They tendto overreact to visible pests or damage as any amount is excessive.
5.9.10 Sampling Units
Within a group of farmers there exists a wide divergence in sampling techniques.What is interesting is that there is a small number of farmers who appear to bemore quantitative in their approach to pest monitoring than the general populationwhich tend to favor sampling small areas. From survey results (Bandong et al. 2002),pest and damage densities of the common rice insect pests were expressed by somefarmers in units used by researchers such as fractions and percentages as well inwhole numbers in units of several rice hills, distance of rice rows, and per panicle.In addition leaffolder damage was expressed in terms of numbers of damaged leavesper several hills.
Farmers’ sampling methods, however, are not rigorous in the experience ofWaibel (1986). Units of measure are insects per hill (30% of farmers), 18% oninsects per unit area, 15% examine individual tillers, 2% use leaves, and 8% usenumber of insects per field, but 27% have no clearly defined method and use thegeneral appearance of the crop. Leaf pests are normally expressed in terms of levelsof damaged leaves. For brown planthopper, the number of infested hills was used ornumber of insects observed per hill.
Farmers’ unit of measure in C. Luzon was the parcel not individual plants orhills (Bandong et al. 2002). As insect distribution is non-uniform, damage usuallyoccurs in patches due to the fact that most insects oviposit in masses. Patch size wasnoted to increase or not on a per parcel basis. Researchers utilize different units ofmeasure for action thresholds based on percentage damaged leaves or insect pest

5 Development of Integrated Pest Management Programs for Rice in Asia 199
Table 5.14 Reasons given by Zaragoza farmers for using insecticide against leaffolders over twocropping seasonsa
Farmer responses Farmerswho applied (%)
Applications (%)
Mode Amongusers
88Prophylactic 21Crop age 17Upon fertilization 2Seeing neighbor spray 2Observing damage 70Scouting method
– Walking along bund 56– Seek low-lying parcel 10– Seek high-lying parcel 2– Enter field 6
Qualitative 37– Sparse damage over whole field 23– Damaged leaves (yellow or white) 4– Patches of damage over whole field 4– Size of patches increasing from last observation 4– Dense damage over whole field 2
Quantitative 33– Few (<5) damaged leaves per several hills 25– Many (>10) damaged leaves per several hills 4– Few (<5) damaged leves per parcel 2– Many (>20) damaged leaves per parcel 2
Presence of insect 9Scouting method
– Walking along bund 7– Enter field 2
Qualitative 9– Moths flushed from walking along bund 9
a see Bandong et al. (2002) for farmer sample size.
density on a per hill basis (Reissig et al. 1986). Farmers tend to assess insect densityand damage more in qualitative than quantitative terms, often utilizing the wholeparcel as the unit of measure as the example from leaffolders shows (Table 5.14).Farmers note any change in patch density and size and may base their decision onthe rate of change over time often without checking pest identification (Bandonget al. 2002).
5.9.11 Pest Density and Damage Assessment
Farmers have difficulty in making sound decisions on when to apply insecticidesbased on observed insect pest abundance. They are generally highly conservativeand will spray after seeing damage to one panicle or seeing very few insect pests.

200 J.A. Litsinger et al.
Farmers making an estimate of percentage whitehead infestation, 75% of farmersoverestimated by >5% based on field counts (Lazaro et al. 1993). In Hunan China,farmers lacked knowledge of thresholds and yield loss and they overestimated dam-age caused by insect pests particularly leaf feeders (Shao et al. 1997). In Chhattis-garh, India farmers were prone to spray upon seeing 1–5 plants damaged in a wholefield. Also Laguna farmers who complained of spiders making copious webbingon a few plants dismissed them as pests when the threat to the crop was insignifi-cant. Farmers’ lack of understanding of the potential of different pests to multiplyis apparent as they cannot distinguish between epidemic pests from chronic ones.The latter are the most common and will not immediately increase to the extent thatcauses economic loss, thus farmers can wait and continue to monitor their abun-dance. Their immediate reaction on pests such as locusts or planthoppers is to killthem before they multiply. Such behavior shows the fear that farmers have of pestsbecoming suddenly abundant and destroying their crop. Farmers are surprised asthey do not adequately monitor their fields. No farmer should be surprised of anoutbreak. Researchers who know the insect pest reproductive capacities and immi-gration potentials can teach farmers these distinctions. Laguna farmers can make thedistinction between plant eaters and plant pests among herbivores, but it is basedon a species distinction rather than on population level distinction. Thus the ideabehind IPM of consciously monitoring pest populations will need to be emphasizedin training programs in order to be adopted by farmers.
5.9.12 Insecticide Usage
Rice farmers in many countries consciously opt for insecticides as corrective controlmeasures against insect pests. Chemical control is achieved with timely applicationsof appropriate insecticides using lethal dosages. A number of KAP surveys haveassessed farmers’ technical abilities in selecting the right materials and applyingthem in a safe, effective and timely fashion with good crop coverage.
The multi-year farm record keeping survey undertaken in four irrigated, double-crop sites in the Philippines quantified insecticide usage in the seedbed and maincrop. In the seedbed there were differences between sites in insecticide usage inboth wet and dry seasons. In Zaragoza more than two thirds of farmers (66–76%) ap-plied insecticide to wetbed seedbeds, whereas just more than half (52%) of Guimbafarmers did (Table 5.15). Lowest usage was among Koronadal farmers (35–43%).There was little or no difference between seasons in the two C.Luzon locations withrespect to insecticide usage. Slightly more farmers in Koronadal applied insecticideto the seedbeds in the second (43%) than first (35%) crops. Many fewer Koron-adal farmers applied insecticide to dapog (13–21%) seedbeds. In Calauan, however,where only dapog seedbeds are planted, usage was very high, particularly more inthe wet season (87%) than dry season (53%).
In the main crop no two farmers managed their rice crop in the same way, varyingmostly in input usage regarding material, dosage, timing, and frequency. Insecticide

5 Development of Integrated Pest Management Programs for Rice in Asia 201
Tab
le5.
15Se
edbe
din
sect
icid
eus
age
inir
riga
ted,
doub
le-c
ropp
edri
cein
four
loca
tions
inth
ePh
ilip
pine
s,19
83–1
991a
Site
Cro
ps(n
o.)
Use
rs(%
)A
ppl.
no.b
App
lica
tion
freq
uenc
y(%
)by
appl
icat
ion
num
ber
Tim
ing
(DA
S)c
Dos
age
(kg
ai/h
a)pe
rse
edbe
dar
ea/h
a
1x2x
>2x
1st
2nd
>2n
dC
omm
onsp
rayd
Synt
heti
cpy
reth
roid
sG
ranu
les
Wet
/firs
tsea
son
wet
bed
tran
spla
nted
crop
sZ
arag
oza
876
1.3
7522
419
2728
Gui
mba
452
1.0
982
016
270.
890.
079
0.25
Kor
onad
al5
351.
098
20
1522
0.54
0.05
30.
34av
g54
1.1
909
117
220.
710.
066
0.29
5
Dry
/sec
ond
seas
onw
etbe
dtr
ansp
lant
edcr
ops
Zar
agoz
a6
661.
474
1412
1824
Gui
mba
552
1.0
936
017
2423
0.96
0.10
70.
95K
oron
adal
543
1.0
964
013
.816
0.57
avg
541.
288
84
1622
0.76
Wet
/firs
tsea
son
dapo
gtr
ansp
lant
edcr
ops
Cal
auan
31.
1K
oron
adal
r421
1.0
955
012
240.
12
Dry
/sec
ond
seas
onda
pog
tran
spla
nted
crop
sC
alau
anr3
1.0
Kor
onad
alr4
131.
010
00
020
0.91
a20
–40
farm
ers
inte
rvie
wed
each
seas
on.
bIn
sect
icid
eus
ers
only
.c
DA
S=
days
afte
rso
win
g.d
Org
anoc
hlor
ine,
orga
noph
osph
ate,
carb
amat
ecl
asse
s.

202 J.A. Litsinger et al.
usage is a case in point. The results showed that, among the farmers sampled, awide range of 37–100% farmers used insecticides depending on the location andcrop (Table 5.16). Lowest usage was in Guimba in direct seeded rice, probably be-cause farmers had to economize more as irrigation water from a communal electricpump which was very expensive, particularly in the dry season. In Calauan, 99% offarmers used insecticide compared to 92–98% in Koronadal, 87–91% in Zaragoza,and 37–75% in Guimba.
Farmers who do not understand the pest resistance status of their crop are likely tospray more than necessary. Yield loss studies have shown that Filipino farmers tendto over-apply insecticide (Kenmore et al. 1985). Farmers, however, were sprayingfor hoppers but did not know the varieties they were planting were resistant whichcould save them $50/ha per season not to spray (Goodell et al. 1982). Marciano et al.(1981) concluded that the number of applications carried out by Laguna farmers didnot seem to justify usage based on insect densities in the field.
Insecticide usage on rainfed wetland rice is less than on irrigated rice as deter-mined from a KAP study in the Philippines (Litsinger et al. 1980). In Pangasinanprovince only 27% of farmers sprayed whereas in Iloilo double the number did butthis covered only 54% of rice fields. Of those farmers that applied, some 70% amongusers applied only once. While in Iloilo of those that applied, 59% only applied oncewith a maximum of 3–5 times per crop The retail value of the insecticide appliedwas a low $5/ha in Pangasinan and $4/ha for Iloilo among users. Insecticide usageon dryland rice is essentially zero as determined from Tanauan, Batangas (Litsingeret al. 1980) and Claveria. Low yields typical of dryland rice make it uneconomicalto justify chemical purchase.
5.9.13 Complexity for Farmers
5.9.13.1 Many Brands of Insecticides
Goodell et al. (1982) posed the question, how could farmers choose the right insecti-cide? She found there were dozens of insecticides under a wide array of brand namesthat changed every few years and sometimes the same one was sold under a differ-ent brand by the same company, and with many specialized insecticides requiringdifferent dosage rates (e.g., synthetic pyrethroids), some in the metric system andsome not. To make matters worse, a number of the most popular insecticides wereimplicated in making the pest situation worse, a counter-intuitive phenomenon thatfarmers, and even some researchers, find hard to believe.
Despite farmers’ whole hearted acceptance, insecticides represent a highly com-plex technology particularly in reference to the number of brands in the market. Thevast array of available commercial insecticides and attendant brand names, formu-lations, and prices each with different efficacies against a range of pest species com-plicates the selection process. Bernsten (1977) recorded 38 brands of insecticidesused on rice in C. Luzon from a sample of 191 farmers interviewed. Carbofurangranules was the most used product (22% of the area), but eight brands were used

5 Development of Integrated Pest Management Programs for Rice in Asia 203T
able
5.16
Inse
ctic
ide
usag
ein
the
mai
ncr
ops
ofir
riga
ted,
doub
le-c
ropp
edri
cein
four
site
s,P
hili
ppin
es,1
981–
1991
a
Site
Cro
ps(n
o.)
Use
rs(%
)A
ppl.
no.b
App
licat
ion
freq
uenc
y(%
)T
imin
g(D
AT
/DA
S)c
Spr
ayvo
lum
e(l
i./ha
)
Dos
age
(kg
a.i./
ha)
1x2x
3x4x
>4x
1st
2nd
3rd
4th
>4t
hC
omm
onsp
rays
Syn
thet
icpy
reth
roid
sG
ranu
les
Wet
bed
tran
spla
nted
crop
sW
etse
ason
Zar
agoz
a8
942.
424
3725
77
2238
5056
580.
200.
013
0.33
Gui
mba
577
1.4
8215
10
226
4243
3646
0.25
0.05
40.
19K
oron
adal
593
3.2
1129
3018
1222
3751
5663
220
0.23
0.05
40.
39av
g88
2.3
3927
198
723
3948
4956
220
0.23
0.04
00.
30
Dry
seas
onZ
arat
goza
691
2.3
3629
199
822
3849
5360
0.20
0.04
10.
71G
uim
ba6
751.
645
466
30
2235
4456
0.19
0.03
4K
oron
adal
692
2.8
2126
2717
1220
3649
5967
224
0.23
0.02
60.
87av
g86
2.2
3434
1710
721
3647
5664
224
0.21
0.03
40.
79
Dap
ogtr
ansp
lant
edcr
ops
Wet
seas
onC
alau
an4
992.
824
50.
230.
013
0.41
Kor
onad
al4
982.
824
2330
1212
2339
5161
8216
70.
250.
006
avg
992.
824
2330
1212
2339
5161
8220
60.
240.
010
0.41
Dry
seas
onC
alau
an3
992.
024
50.
220.
023
Kor
onad
al5
953.
122
2623
1317
2542
4955
6220
80.
220.
013
avg
972.
622
2623
1317
2542
4955
6222
70.
220.
018
Dir
ect
seed
edcr
ops
Wet
seas
onZ
arag
oza
287
2.1
3043
1211
430
4752
620.
210.
019
0.73
Kor
onad
al1
100
2.3
4020
2010
1022
3640
5278
173
0.19
0.01
6av
g94
2.2
3532
1611
726
4246
5778
173
0.20
0.01
80.
73D
ryse
ason
Zar
agoz
a3
942.
032
3818
74
2749
5769
460.
190.
021
0.67
Gui
mba
237
1.5
759
09
429
2836
4668
0.19
0.04
50.
54K
oron
adal
397
2.5
2736
1111
1131
4752
5364
186
0.19
0.01
0av
g67
2.0
5123
610
830
3844
5066
186
0.19
0.02
80.
54a
20–4
0fa
rmer
sin
terv
iew
edea
chse
ason
per
site
.b
Inse
ctic
ide
user
son
ly.
cD
AT
=da
ysaf
ter
tran
spla
ntin
g,D
AS
=da
ysaf
ter
sow
ing
for
dire
ctse
edin
g.

204 J.A. Litsinger et al.
in 75% of the area covered. Liquids were more popular than other formulations.The computations necessary for dosage determinations add further difficulties toproper usage.
Farm record keeping data from four sites in the Philippines revealed 40 kinds ofinsecticides comprising 64 brands (Table 5.17). The most popular were the highlytoxic organo-phosphate materials with monocrotophos at the top. This insecticide isbanned in a number of countries because of the danger it poses to farmers applyingwithout protection. There were seven brand names for methyl parathion and foureach for endosulfan and BPMC. A natural product derived from a pathogenic bac-terium Bacillus thuringiensis (Bt) was included but was not popular. Also recordedwas limited usage of some indigenous botanical based products, a detergent, andkerosene. Only those products that averaged 1% usage in any one crop were in-cluded in the list.
5.9.13.2 Assessment of Farmers Competency with Insecticides
Farmers spray to keep pests off the crop rather than prevent yield loss (Heong et al.1995b). In Leyte 80% of applications were misused either against the wrong pest orthe wrong time (Heong et al. 1995b). Leyte farmers erroneously target rice bug atother stages than milky stage, even tillering stage. Insecticides applied against leaffeeding insects such as leaffolder in the early crop stages when populations werelow did not increase yields. The economic injury level for leaffolder is 5–6/hill, ararity as field averages are normally <1 larva/hill. Farmers target ladybeetles andhoppers, the former are predators and the latter are not important at low densitiesand for which genetic resistance is available. Some 78% of farmers sprayed in theearly crop stages, despite low pest infestation or imminent threat. Such practice isnot only wasteful but damage the predator-prey ratio that may lead to secondary pestoutbreaks (Way and Heong 1994).
An understanding developed by researchers in the 1980s was that insect pestproblems stemmed from injudicious use of insecticides, especially prophylactic ap-plication of broad spectrum materials (Heong 1998). In the tropics, ricefields harbora diverse mix of natural enemies that normally contain most pest problems if notdisturbed by insecticides. Chemical control as practiced by farmers is ineffective aslevels of control exerted are far less than desirable (Litsinger et al. 2005).
Farmers also react to insect damage rather than to the living pest, thus the insect isoften gone by the time they apply. Common dosages per hectare average 0.2 kg ai/habased on farmer surveys as opposed to 0.4 kg ai/ha as recommended based on fieldtrials where 80% control is the cutoff for recommending an insecticide (Litsingeret al. 2005). Dosage trials at IRRI, undertaken to see if the farmers’ practice wasviable, caused recommended dosages to be reduced from 0.75 kg ai/ha to 0.4 kgai/ha, but farmers’ spray volumes are generally less than 300 liters per hectare (Ta-ble 5.16). It is recommended that farmers increase their spray volume as the cropgrows. In older rice farmers should use 500 liters/hectare. Insect control practicesas mentioned in national recommendations are dominantly usage of insect resis-tant varieties and the use of insecticides. Most farmers spray for chronic pests for

5 Development of Integrated Pest Management Programs for Rice in Asia 205
Table 5.17 Popular insecticides applied to the main crops of irrigated, double-cropped rice in fourlocations, Philippines, 1981–1991a
Common name Applications per crop/location (%)
Zaragoza Guimba Koronadal Calauan mean
No. crops 14 11 11 7Years 1981–91 1984–90 1983–91 1986–90SPRAYABLES 98 92 99 93 95Organophosphates 44 57 59 26 46
monocrotophos 35 47 25 25 33methyl-parathion 5.0 3.3 24.3 0.5 8.3azinphos-ethyl 4.0 5.0 5.8 0.5 3.8chlorpyrifos 0.3 1.7 2.2 0 1.0triazophos 0 0 0.8 0 0.2fenitrothion 0.8 0 0.3 0 0.3methamidophos 0 0.3 0 0 0.1malathion 0 0 0.5 0 0.1
Organochlorines 12 4 3 21 10
endosulfan 9 4 3 21 9endrin 1.5 0 0 0 0.4DDT 1.3 0 0 0 0.3
Carbamates 17 3 9 4 8
MIPC 16 0.3 3.7 4 6BPMC 0.5 1.7 3.8 0 1.5methomyl 0.8 0.7 0.5 0 0.5carbaryl 0 0 0 0 0carbofuran 0 0 0.2 0 0
Pyrethroids 11 10 14 0 9
cypermethrin 11 10 7 0 7deltamethrin 0 0 5.5 0 1.4permethrin 0 0 1.7 0 0.4fenvalerate 0 0 0.2 0 0cyhalothrin 0 0 0.2 0 0
Other Sprayables 0.5 1.3 1.7 0 0.9
ethofenprox 0 1.3 1.7 0 0.8fentin hydroxide 0.3 0 0 0 0.1Bacillus thuringiensis 0.3 0 0 0 0.1
Spray Mixtures 12 18 13 42 21
chlorpyrifos + BPMC 9 11 5 36 15monocrotophos + cypermethrin 2.5 4.7 0.7 0 2.0fenitrothion + malathion 0 0.3 0.0 0 0.1azinphos-ethyl + BPMC 0 2.0 1.8 0 1.0phenthoate + BPMC 0 0 5.2 0 1.3MTMC + phenthoate 0.5 0 0 6.0 1.6
GRANULES 3 8 0 8 4gamma–BHC 0 0.3 0 0 0.1diazinon 0.8 0 0 1.0 0.4carbofuran 1.8 7.3 0.2 6.5 3.9a Average of wet and dry seasons, each season 15–30 farmers were interviewed regarding inputusage.

206 J.A. Litsinger et al.
which there are no resistant varieties, thus insecticides remain the dominant controlpractice leading to 3–4 applications per crop. Genetically modified Bt-rice wouldovercome this problem as Lepidoptera are the main targets which can be controlledby the biocontrol agent. However there is political and cultural resistance to thesevarieties being adopted.
Waibel (1986) stated that farmers overestimate losses but he showed economicthresholds as insecticide guidelines were economical. Litsinger et al. (2005) showedthresholds were economical in some cases only, but underscored the fact that mod-ern rices have high capacity to tolerate damage when well managed and with fa-vorable solar radiation during grain ripening. When environmental and health costsare factored thresholds become more attractive (Rola and Pingali 1993). Most farm-ers overestimate the importance of insect pests and are strongly motivated to useinsecticides. Thus large amounts of insecticide are applied unnecessarily and areunlikely to result in an economic return. Surprisingly Litsinger et al. (2005) foundthe farmers’ practice was at times economical even with low control.
It is evident that farmers’ insecticide use is not based on economic rationality(Heong 1998). This is supported by how farmers make pest control decisions. Ap-plication was biased largely on farmers’ perceptions of damage and high expectedlosses. Most (66%) say that pesticides are specific only against a range of pests(Litsinger et al. 1980).
5.9.14 Factors Influencing Farmers to Use Insecticides
Farmers are influenced by peer groups such as pesticide dealers and extension agentsand over influenced by outbreaks that had occurred in the area even if not in theirfield. Pests were mentioned as being important which have not caused much damagein their regions since the tungro epidemics a decade previously. These peer groupsover-generalize outbreaks that occur in other areas. The perceptual pathologies ofIPM programs are, according to Waibel (1986), largely the outcome of farmers’ at-titudes affecting their responses to information they get from government programs.
Leyte farmers are risk averse and spray when insects are spotted or before (pro-phylactic) (Escalada and Heong 1993). Emotions of fear are evoked thus farmersspray when only a few insects are present. Promotional marketing methods are usedto influence farmers to spray. Some 60% of Leyte farmers said they would sprayeven if they did not see the pest.
Advertising and pesticide sales agents have influenced unfavorable attitudes to-ward insect pests. Messages to use insecticides far outnumber those that do not.Farmers therefore have developed risk averse attitudes with little economic ratio-nale toward insecticide use. In addition negative motivators of fear, ignorance, andpassivity cause farmers to become risk averse and use insecticides as insurance.Heong et al. (1995a) noted the following factors that influence insecticide usage:
1. Advertisements,2. Over-reaction to pest density/damage,

5 Development of Integrated Pest Management Programs for Rice in Asia 207
3. Association of insecticide with modernism,4. Equating pesticides as medicines,5. Ease of use,6. Government supplied forecasting information,7. Equating pesticides as fertilizers as being necessary,8. Quick killing effect, and9. Negative motivators of fear, ignorance, and passivity thus become risk averse
and use insecticides as insurance.
Tjornhom et al. (1997) showed pesticide misuse was associated with the highvalue farmers place on advice from chemical company representatives, cooperativemembers, and visits by local technicians. Many C. Luzon farmers spray on sightand this attitude was at least partly due to past experience with varietal resistancebreaking down (Kenmore et al. 1985).
Norton and Mumford (1993) pointed out that decisions are made on farmers’perceptions which are based on earlier experience with the problem. If the previousaction, such as sprays has resulted in good harvests, then farmers will continue tospray as usual and not base the decision on the pest populations but on previousbehavior. To change farmers’ misperceptions, new elements must be introduced intothe cognitive structure, e.g., different perception or information which introducesconflict to motivate change (Heong and Escalada 1997a).
5.9.14.1 Insecticide Selection and Purchase
In Nueva Ecija province in the Philippines, insecticides selected by farmers werewith few exceptions those that were recommended at the time (Fajardo et al. 2000).Just 59% of applications in Sri Lanka were those chemicals recommended for thespecific pest, but the proportion of farmers that could name an appropriate chemicalwas less that those applying it (van de Fliert and Matteson 1990). In W. Java asurvey was carried out as part of IRRI’s Constraints Program in Indonesia askingfarmers to name a recommended insecticide for three different pests (Nataatmadjaet al. 1979). Only 51% of farmers gave a correct answer for brown planthopper,and 60% of farmers were correct with stemborers and gall midge. The constraintswork illustrated the importance of selecting the correct insecticide and applying theproper rate.
The farmer operator rather than the landlord makes the decisions on pesticideusage in Iloilo, Philippines (Brunold 1981). In another study in the Philippines, 31%of women interviewed purchased insecticides and 21% occasionally made controldecisions (Warburton et al. 1995). Liquid insecticides are more popular because theycome in small sizes whereas other formulations such as granules do not (Cordovaet al. 1981). Similarly in another KAP study in rainfed areas in the Philippines,farmers preferred cheap broad spectrum sprayable insecticides with <5% optingfor granulars (Litsinger et al. 1980).
The record keeping survey in the four Philippine sites over a decade looked atinsecticide usage in the seedbed and field. Sprayable formulations were much more

208 J.A. Litsinger et al.
Table 5.18 Popular insecticides applied to the seedbeds of irrigated, double-cropped rice in threelocations, Philippines, 1981–1991a
Common name Zaragoza Guimba Koronadal Total
SPRAYABLES 97 97 100 98
Organophosphates 54 58 77 66
monocrotophos 45 37 30 36methyl-parathion 2 7 44 23azinphos-ethyl 7 14 3 7diazinon 0 1 0 0triazophos 0 0 0 0chlorpyrifos 1 0 0 0fenitrothion 0 0 0 0
Organochlorines 8 5 1 4
endosulfan 5 5 1 3endrin 2 0 0 1DDT 1 0 0 0
Carbamates 16 4 12 11
MIPC 12 1 3 5BPMC 0 1 9 4carbaryl 2 1 0 1methomyl 2 2 1 1
Synthetic Pyrethroids 7 13 1 5
fenvalerate 0 1 0 0deltamethrin 1 0 0 0cypermethrin 6 12 1 5
Others 1 1 0 0
ethofenprox 0 1 0 0Bacillus thuringiensis 1 0 0 0
Spray Mixtures 11 18 10 12
chlorpyrifos + BPMC 9 14 6 9monocrotophos + cypermethrir 2 4 0 1azinphos-ethyl + BPMC 1 0 0 0phenthoate + BPMC 0 0 4 2
GRANULES 4 3 1 2
carbofuran 3 2 1 2diazinon 1 1 0 0Total 100 100 100 100a 20–60 farmers interviewed per crop, see text for more details.
popular (98% of applications) than granules (2%) in the seedbed, with organophos-phates predominating (66%) over mixtures (12%) and carbamates (11%)(Table 5.18). The most popular chemicals were monocrotophos (36%), methyl-parathion (23%), and chlorpyrifos + BPMC (9%). There were some differencesin farmer preference between sites. Koronadal farmers selected methyl-parathionmuch more (44%) than in Guimba (7%) or Zaragoza (2%). Guimba farmers usedrelatively more azinphos-ethyl (14%) than other sites (<7%). Synthetic pyrethroids

5 Development of Integrated Pest Management Programs for Rice in Asia 209
were more popular in Guimba as well with cypermethrin averaging 12% of all appli-cations compared to 6% in Zaragoza and 1% in Koronadal. MIPC was most popularin Zaragoza (12%) compared to Koronadal (3%) and Guimba (1%). There werenoticeable differences in the kinds of insecticides used in the dapog crop betweenthe first and second crops but these are not considered significant because of the fewnumber of users. No granules were used on dapog seedbeds.
Farmers overwhelmingly preferred sprayable (average of 96% of occasions) togranular insecticides in the main crop (Table 5.17). Koronadal farmers utilized theleast number of granular materials with only 1% usage in the first wetbed trans-planted crop. The highest occurrence of granular formulations (14%) was recordedby Guimba farmers for direct seeded rice. Carbofuran was the most preferred amonggranular compounds. Among the sprayable formulations, organophosphate materi-als were most preferred (53% of applications) compared to organochlorines (6%),carbamates (10%), and synthetic pyrethroids (12%). Spray formulations with a mix-ture of more than one compound were utilized on 15% of occasions. The mostpopular insecticides were monocrotophos (35% of applications), methyl-parathion(11%), cypermethrin (9%), and the mixture of chlorpyrifos + BPMC (8%), MIPC(7%), and azinphos-ethyl and endosulfan (both 5%).
There were noticeable differences between sites on the preference of somematerials. MIPC was most preferred in Zaragoza than the other sites. Only theorganochlorines insecticides endrin and DDT were recorded for Zaragoza farmers.Methyl parathion, deltamethrin, and phenthoate + BPMC were most preferred inKoronadal. Guimba farmers utilized the fewest kinds of insecticides.
When asked about preferred insecticide formulations, 90% of Guimba respon-dents opted for sprayables because: (i) they are easier to use, (ii) give better cov-erage, and (iii) are more effective than granular formulations (Fajardo et al. 2000).One farmer believed that granules are less safe for the applicator to use. Those (5%)who preferred granules mentioned that follow-up spraying was normal. Five percentsaid that all formulations are equally effective.
There was a noticeable improvement in the insecticides used by Philippinefarmers in terms of toxicity and human safety. In 1966 the dominant insecticideswere highly toxic: m-parathion, endrin, endosulfan, and coumaphos (Cordova et al.1981). These were mostly replaced by less dangerous materials in the ensuingdecades.
5.9.15 Source of Funds for Insecticide Purchase
Rainfed farmers in the Philippines when surveyed point to different sources of cashto purchase insecticides (Litsinger et al. 1980):
1. Personal savings (63%),2. Bank loan (62%),3. Friend (18%),4. Neighbor (15%),

210 J.A. Litsinger et al.
5. Relative (12%),6. Cooperative (11%), and7. Private money lenders (3%)
In Batangas, Philippines where dryland farmers sell vegetables to nearby Manila,64% of farmers obtain bank loans to buy inputs. Most (73%) Filipinos surveyed saidthey purchased insecticide at least one week ahead of usage. Farmers in Sri Lankawho spray a lot receive informal credit (van de Fliert and Matteson 1990). Only 23%of farmers took loans to buy inputs mainly from relatives, neighbors, and banks.Malaysian farmers are better off than most in Asia as the government subsidizedmuch of production costs, therefore chemicals were bought with cash and only afew took out a loan (Heong 1984).
The Philippine national program to promote the Green Revolution in rice,Masagana 99, began in 1973 where credit was extended by the government throughextension agents. Farmers were to follow a “cook book” (prophylactic) approachto insecticide application with a total of four beginning in the seedbed. Farmerswere even given insecticides in kind before the crop was transplanted. Cash-strappedfarmers repaid in rice after harvest at amounts which translated to high interest rates.Most farmers, however, viewed credit as a gift and defaulted. Farmers knew thatthere were not enough jails to hold them nor budget to feed them if arrested. Asa result the scheme ended in 1977. Afterwards rice buyers and agro-input dealerswho supplied pesticides to farmers before the growing season extended credit, butfarmers were free to apply as many times as they wanted (Bandong et al. 2002).
5.9.16 Land Ownership
A large proportion of the irrigated farmers in the Philippines are leaseholders ortenants rather than owner-operators. These farmers have a free choice in selectionof agro-inputs as Filipino landlords do not involve themselves in the day to daymanagement as they are mostly absentee, residing in cities far away and only comeat harvest to get their share. Tenants in Sri Lanka spray more because some getinputs from the landlord and as the goal of the farmer is highest yield they have toearn their living from their share of the harvest (van de Fliert and Matteson 1990).
5.9.17 Application Technique
Most farmers (87%) interviewed stated that no specific skills are required to sprayproperly (Litsinger et al. 1980). Farmers have a good grasp on knowledge of appli-cation technique. In addition most farmers spray in the morning 81%, while 90%say that full coverage is best. Some 85% know rain washes pesticide off of plantswhile 81% increase the dosage in response to higher infestation levels. In a numberof areas in the Philippines, farmers practice synchronized spraying among fieldsin the community (Pineda et al. 1984). This has the advantage of minimizing the

5 Development of Integrated Pest Management Programs for Rice in Asia 211
recolonization of ricefields from nearby areas later in the crop (Joyce 1985). Theirmain fault is the low spray volumes applied thus as most are contact chemicals theplants are not adequately covered with product.
5.9.17.1 Frequency and Timing
From the large record keeping survey in four locations, detailed information ontiming and frequency of application has been obtained both in the seedbed andmain crop.
In the seedbed Zaragoza farmers applied slightly more insecticide averaging1.3–1.4 applications (calculated for only those who used insecticides) than inGuimba, Koronadal, and Calauan (1.0–1.1 times per crop) (Table 5.15). In Koron-adal usage on wetbeds was higher (35–43%) than dapog (13–21%). Among insec-ticide users in Zaragoza, 14–22% applied two applications and 4–12% more thantwo applications to the wetbeds for both seasons. In Koronadal only 5% or fewerfarmers applied more than once to dapog beds. Greatest usage by a single farmerreached four applications.
Zaragoza farmers tended to delay their first application (18–19 days after sowingor DAS) more than those from Guimba (16–17 DAS) or Koronadal (14–15 DAS)over both first and second crops. Timing of the second application was similar forZaragoza and Guimba farmers (24–27 DAS) and later than for Koronadal farmers(16–22 DAS) for wetbeds. Zaragoza farmers applied most of their applications 2–3weeks after sowing (WAS), whereas farmers from Guimba and Koronadal appliedmost 1–2 WAS on wetbeds. A greater percentage of Koronadal farmer-users appliedafter 4 WAS on dapog seedbeds in the second (25%) but not the first (0%) crop.
Application frequency on the main crop varied widely by site (Table 5.16). Thelowest came from Guimba farmers who averaged 1.4–1.6 applications per cropamong users, whereas Koronadal farmer-users averaged the highest at 2.3–3.2 ap-plications. Zaragoza and Calauan farmers were in between averaging 2.0–2.4 and1.8–2.2 applications per crop, respectively. The range of values by any one farmerin the survey per crop ranged from 2 to 10, the largest value occurred several timesby different farmers in Koronadal where maximum usage ranged from 6–10 applica-tions over all crops. There was no trend in the extreme values for the Koronadal siteas extremes occurred in 1984 and 1987. There was a trend to decrease insecticideapplications from 1986 onwards in Zaragoza where extreme values decreased from5–8 to 3–4 applications. There was no indication that usage varied by season butonly a slight indication that direct seeded (pre-germinated) rice on average receivedfewest applications (1.4–2.5) compared to wetbed (1.4–3.2) and dapog (1.6–2.8).
In Guimba 75–82% of farmers who used insecticides applied only a single timewith the exception of the second wetbed crop where 45 and 46% applied onceand twice, respectively (Table 5.16). In Koronadal with highest insecticide usage of20–30% of the farmers averaged over three applications per crop. Zaragoza farmersaveraged 11–17% and Guimba 2–13% usage over three applications. The medianapplication frequency was twice averaged over all sites for all farmers.

212 J.A. Litsinger et al.
The first application was timed from 20 to 26 days after transplanting (DAT)for transplanted crops which was quite consistent regardless of season or site(Table 5.16). For direct seeded crops the range was 22–31 DAS. With few exceptionsthe second application occurred on average 13–17 days later. The third applicationsranged from 43 to 51 DAT or 36–57 DAS for transplanted and direct seeded crops,respectively. Average timings became less discernible beyond the third applicationas those farmers who applied more times had shorter intervals between applications.Therefore there was no consistent pattern beyond the third application.
Cumulative frequency distributions showed significant differences between sites.In wetbed crops in the wet season, Guimba and Zaragoza farmers had applied overhalf of their applications by 3 weeks after transplanting (WAT) and 4 WAT, respec-tively (Fig. 5.3A). A significant number of applications occurred in the later cropgrowth stages in Koronadal as very few applications occurred during the first threeweeks. Greatest insecticide activity among Guimba farmers occurred from 2 to 6WAT, but 2–9 WAT in Zaragoza and 4–11 WAT in Koronadal. A similar patternprevailed in the dry season for Guimba and Zaragoza, but the pattern for Koronadalfarmers became highly similar to that of Zaragoza farmers where greatest usageoccurred 2–9 WAT (Fig. 5.3B). A linear relationship between application rate andcrop age was more evident in the dapog culture in Calauan and Koronadal from 2 to11 WAT (Fig. 5.3C). For direct seeding 75% of the applications occurred from 1 to 6WAS, whereas in Zaragoza and Koronadal this level was not reached until 8–9 WAS(Fig. 5.3D). In Guimba relatively few applications occurred from 7 to 12 WAS.
The survey revealed that farmers often mixed several brands of insecticides to-gether when applying to the field. Highest incidences of mixing brands occurred inZaragoza with 11–12% in wetbed culture in the wet and dry seasons (Table 5.19).Less occurred in direct seeded rice. Fewer cases of mixing insecticides occurred inGuimba which averaged 11% mixtures for wet season wetbed and direct seeded dryseason crops. Least mixing occurred in the wetbed dry season culture 2%. Low-est site averages occurred in Koronadal a site with the highest insecticide usageand averaged 4% mixtures over all crop cultures. Highest usage was in wetbedand dapog with least in direct seeded. Farmers often mixed insecticides that werealready composed of two insecticides thus they were mixing mixtures. This isan ill-advised habit as on other crops this quickly leads to insecticide resistanceand is wasteful. Insecticide resistance on rice has been recorded particularly inJapan and Taiwan where farmers apply frequently and at high dosages (Nagata andMochida 1984). What saves farmers in other countries is the small field size andindependent decisions of farmers concerning what products they use thus there isa wide and diverse mosaic of materials as well as low dosages. More importantis insecticide resurgence which has been much more common (Gallagher et al.1994).
Surveys of farmers in Leyte, Nueva Ecija, and Vietnam resulted in positive cor-relations that established those farmers who apply early also apply late in the crop,thus applications were not independent (Heong et al. 1995b). Thus those who ap-plied both early and late may have been risk averse, inclined to use more inputs, andto be better off economically.

5 Development of Integrated Pest Management Programs for Rice in Asia 213
0
0.1
0.2
0.3
0.4
0.5
0.6
Cumulative insecticide frequency
Cumulative insecticide frequency Cumulative insecticide frequency
Cumulative insecticide frequency0.7
0.8
0.91 0
0.1
0.2
0.3
0.4
0.5
0.6
0.7
0.8
0.91
0
0.1
0.2
0.3
0.4
0.5
0.6
0.7
0.8
0.910
0.1
0.2
0.3
0.4
0.5
0.6
0.7
0.8
0.91
01
23
45
67
89
1011
12W
eek
afte
r tra
nspl
antin
g
01
23
45
67
89
1011
12W
eek
afte
r tra
nspl
antin
g
01
23
45
67
89
1011
12W
eek
afte
r tra
nspl
antin
g
01
23
45
67
89
1011
12W
eek
afte
r sow
ing
Zara
goza
Gui
mba
Kor
onad
al
AW
etbe
d, w
etse
ason
Zara
goza
Gui
mba
Kor
onad
al
B
Wet
bed,
dry
se
ason
crop
s
Cal
auan
wet
sea
son
Cal
auan
dry
sea
son
Kor
onad
al 1
st c
rop
Kor
onad
al 2
nd c
rop
CD
apog
seed
bed
Zara
goza
Gui
mba
Kor
onad
al
DD
irect
see
ded
dry
seas
on
Fig
.5.3
Cum
ulat
ive
freq
uenc
yof
inse
ctic
ide
appl
icat
ion
bygr
owth
stag
efo
rfo
ursi
tes
inth
ePh
ilip
pine
sse
greg
ated
bycr
opse
ason
and
rice
cult
ural
met
hod.
Dat
aba
sed
onfa
rmer
ssu
rvey
sun
dert
aken
from
1981
to19
91.H
oriz
onta
llin
ere
pres
ents
50%
offr
eque
ncy

214 J.A. Litsinger et al.
Tab
le5.
19Fr
eque
ncy
ofag
roch
emic
alap
plic
atio
nsas
mix
ture
sof
mor
eth
anon
ebr
and
inir
riga
ted,
doub
le-c
ropp
edri
cein
thre
elo
catio
nsin
the
Phili
ppin
es,
1981
–199
1
Agr
oche
mic
alA
ppli
cati
ons
per
crop
asm
ixtu
res
(%)a
Zar
agoz
aG
uim
baK
oron
adal
Wet
bed
Dir
ect
seed
edSi
teav
gW
etbe
dD
irec
tse
eded
Site
avg
Wet
bed
Dap
ogD
irec
tse
eded
Site
avg
Gra
ndav
gW
SD
SW
SD
SW
SD
SD
S1s
t2n
d1s
t2n
d1s
t2n
d
Seed
bed
Fert
iliz
er0.
84.
52.
712
.920
.916
.90
0.9
01.
10.
56.
7In
sect
icid
e3.
03.
43.
25.
00
2.5
1.0
00
00.
22.
0
Mai
ncr
opFe
rtil
izer
3431
4719
3368
6272
679
712
740
2016
39In
sect
icid
e12
.011
.110
.26.
710
.011
.42.
111
.18.
25.
05.
03.
34.
60
3.1
3.5
7.2
Her
bici
de2.
34.
10
01.
60
1.3
00.
41.
60.
90
00
00.
40.
8a
WS
=w
etse
ason
,DS
=dr
yse
ason
.

5 Development of Integrated Pest Management Programs for Rice in Asia 215
5.9.17.2 Dosage
Use of sublethal dosages is not only ineffective and wasteful but can cause pestresurgence. C. Luzon farmers told an anthropologist that they were satisfied that theywere applying enough insecticide in proper concentrations (Goodell et al. 1982).Filipino farmers often overestimate control effectiveness (Waibel 1986). In realitythey under-dose to the point of risking that the chemicals are not toxic to insects(Litsinger et al. 2005). The dosage-mortality relationship is not linear and mortalityonly occurs once the threshold level of mortality (as with drugs) is reached whichmost farmers do not achieve. Farmers also do not realize that some insecticides areactive at very low dosages (such as synthetic pyrethroids) while the rest are activeonly at higher dosages (they under-dose both, see Table 5.16). What is amazing isthat they do not perceive they are not achieving good control. Most likely farmers seethe pest damage decrease which is probably from the activities of natural enemiesmore than the chemical. Understanding dosages is extremely complex for farmersand is in reality impossible to teach to farmers who have limited math skills. Farm-ers in Zhejiang, China on the other hand were surveyed and found they over-usedpesticides by making cocktails (mixing several pesticides in the same tank-load),applying frequently, and overdosing excessively (Hu et al. 1997).
The farm record keeping survey spanning over a decade documented Filipinofarmers’ insecticide dosages in the seedbed and main crop. Dosages in the seedbedwere high when calculated on the stated area of the seedbeds in both Guimba andKoronadal where they were determined (Table 5.15). Common sprays were appliedat slightly higher dosages in Guimba (0.57–0.61 kg ai/ha) than Koronadal (0.39–0.42 kg ai/ha). These dosages are at or higher than those recommended (0.40 kgai/ha) based on seedbed area. Synthetic pyrethroids were generally under-dosed(0.052–0.059kg ai/ha) compared to recommendations (> 0.10 kg ai/ha). Gran-ules were also under-dosed (0.23–0.44 kg ai/ha) compared to recommended levels(> 0.50 kg ai/ha).
On the main crop, organochlorine, organophosphate, and carbamate insecticidesin spray formulations (termed common sprays) were applied in dosages that rangedfrom 0.18–0.24 kg ai/ha (Table 5.16). There was no apparent trend by site, cropculture or season. Similarly with synthetic pyrethroids the observed ranges (0.006–0.054 kg ai/ha) were without a noticeable trend (dosages should be 0.010–0.025kgai/ha). Farmers therefore were within the range of effective dosages with syntheticpyrethroids and would have had good efficacy, but represent only 10% of applica-tions (Table 5.17). With granules higher dosages were observed in the dry seasons(0.54–0.87kg ai/ha) compared to wet season (0.19–0.39 kg ai/ha) for wetbed but notdirect seeded crops. Granules are effective at 0.75–1.5 kg ai/ha, thus most farmerswere below this level and granules require standing water of >10 cm for them towork well (Bandong and Litsinger 1979).
The dosages were graphed in cumulative frequency distribution which showedthat half of the common insecticide applications (not including synthetic pyrethroidsand granulars) were below 0.20 kg ai/ha in Zaragoza, Guimba, and Koronadal(Fig. 5.4). Over 90% of all insecticide applications were below the recommendedrate of 0.40 kg ai/ha for all comparisons. What is remarkable about the data was the

216 J.A. Litsinger et al.
0
0.1
0.2
0.3
0.4
0.5
0.6
0.7
0.8
0.91
Do
sag
e (k
gai
/ha)
Zar
agoz
a
Gui
mba
Kor
onad
al
AW
etbe
d,w
et s
easo
n B
Wet
bed,
wet
sea
son
Zar
agoz
a
Gui
mba
Kor
onad
alCumulative insecticide dosage frequency
0
0.1
0.2
0.3
0.4
0.5
0.6
0.7
0.8
0.91
Cumulative insecticide dosage frequency
0
0.1
0.2
0.3
0.4
0.5
0.6
0.7
0.8
0.91
Cumulative insecticide dosage frequency
0
0.1
0.2
0.3
0.4
0.5
0.6
0.7
0.8
0.91
Cumulative insecticide dosage frequency
Kor
onad
al 1
st c
rop
Kor
onad
al 2
nd c
rop
C
Dap
og
c
ultu
re
Zar
agoz
a
Gui
mba
Kor
onad
al
D
0.65
0.6
0.55
0.5
0.45
0.4
0.35
0.3
0.25
0.2
0.15
0.1
0.05
0
Do
sag
e (k
gai
/ha)
0.65
0.6
0.55
0.5
0.45
0.4
0.35
0.3
0.25
0.2
0.15
0.1
0.05
0D
osa
ge
(kg
ai/h
a)0.
650.
70.
60.
550.
50.
450.
40.
350.
30.
250.
20.
150.
10.
050
Do
sag
e (k
gai
/ha)
0.65
0.6
0.55
0.5
0.45
0.4
0.35
0.3
0.25
0.2
0.15
0.1
0.05
0
Dire
ct s
eede
d,dr
y se
ason
Fig
.5.4
Cum
ulat
ive
freq
uenc
yof
inse
ctic
ide
appl
icat
ions
bydo
sage
inth
ree
site
sin
the
Phil
ippi
nes
segr
egat
edby
crop
seas
onan
dri
cecu
ltur
alm
etho
d.D
ata
base
don
farm
er’s
surv
eys
unde
rtak
enfr
om19
81to
1991
.Hor
izon
tall
ine
repr
esen
ts50
%of
freq
uenc
y

5 Development of Integrated Pest Management Programs for Rice in Asia 217
consistency of insecticide dosages over sites, rice culture and season. As mentionedin other sections of the chapter dosages of 0.20 kg ai/ha are not lethal to most riceinsect pests. These insecticides were originally recommended at a dosage of 0.75 kgai/but trials at IRRI revealed that the dosage could be reduced to 0.40 kg ai/ha butno further.
Waibel (1986) also noted that farmers in his surveys also under-dosed from 0.20to 0.30 kg ai/ha. Similarly Marciano et al. (1981) found Laguna farmers under-dosed35–40%, and used less than recommended spray volume. Tank mix concentrationwas properly followed but the number of sprayerloads needed to be increased. Farm-ers use low water volumes and select nozzles which project the spray to reduce thenumber of passes through the field, but as a result severely under-dose (Bandonget al. 2002).
In the favorable rainfed areas of the Philippines, insecticide dosages ranged from0.03 to 0.38 kg ai/ha (Litsinger et al. 1980). Farmers determined the dosage byreading insecticide labels (77% of respondents) or guessed (13%). They measuredinsecticide from the bottle via the bottle cap (69%), spoons (26%), graduated cups(10%), or guessed (5%).
The survey of Litsinger et al. (1980) asked farmers to list the constraints theyfaced in achieving more lethal dosages and there were many:
1. Lack of pest recognition,2. Lack of capital,3. Lack of knowledge of pesticide application,4. Aversion to debt,5. Lack of labor,6. Lack of sprayers,7. Unavailability of pesticide locally,8. Disbelief that the yield increase from pest control was enough to warrant us-
age, and9. Toxic effects of pesticide to operator.
The last constraint is perhaps the most real as farmers insisted they would notincrease their spray volume so the only way to increase dosage was to put moreinsecticide in each tank load. As farmers typically walk through the spray path,contact with insecticide is inevitable and even more so as they do not don protectiveclothing.
5.9.17.3 Farmers’ Use of Sprayers
In the Philippine farm record keeping survey, it was found that farmers appliedinsecticide with stainless steel, lever-operated knapsack sprayers with a capacity of19 liters as being most popular. Smaller ones are 15 and 11 liter capacity. Farmersuse the same sprayers for herbicides but know to wash them thoroughly before use.
Heong (1984) determined that most (85% of respondents) Malaysian farm-ers in irrigated rice areas owned sprayers (knapsack 64%, motorized 18%, both18% among owners). For those who do not own they can contract spraying using

218 J.A. Litsinger et al.
equipment loaned by neighbors and equipment borrowed from the government orpay others to spray. This survey of sprayers, in fact, contributed to improved researchand extension and identified urgent needs for improving knapsack sprayers, trainingfarmers in sprayer techniques, and improving the quality of locally produced knap-sack sprayers. It led to sprayer clinics being established (Norton 1993). In India it iscommon for farmers to rent sprayers for less than $1/day or to hire someone. Alsofarmers do not fill the sprayers full as they believe air is needed. Some only fill a15 liter sprayer with 10 liters of water. The most popular sprayers in Chhattisgarhare made of plastic and leak from the loose seal at the cap and thus are extremelydangerous to use. Farmers balk at purchasing better made sprayers.
In rainfed rice culture in the Philippines all farmers had access to sprayers(Litsinger et al. 1980). Ownership was 65% of farmers and 59% had used sprayersfor more than 10 years. Water availability is a problem for 31% of farmers. Inter-estingly rainfed wetland farmers experienced greater problems than the dryland ricesite of Batangas (22%). Farmers in Batangas use wells and ox drawn sleds withmetal oil drums to bring water to the field. Fewer farmers had problems in Pangasi-nan (25%) than Iloilo (44%). Sprayer size was 11–19 liters but 15 liters was mostpopular (54%). Many farmers found the 19 liter size as too heavy. Some 13% offarmers contract helpers from time to time. Some 65% of farmers in Sri Lanka hiredlabor locally for land preparation, as well as harvesting (62%), crop establishment(45%), pesticide application (43%), and weeding (33%) (van de Fliert and Matteson1990).
5.9.17.4 Spray Volume
In the large survey in four Philippine sites spray volume was determined for Koron-adal farmers which ranged from 173–220 liters/ha, while that in Calauan was higher(245 liters/ha) (Table 5.16). In Koronadal, slightly higher spray volumes occurred intransplanted wetbed crops (214–220 liters/ha) than in direct seeded crops (173–181liters/ha). Half of the applications in Koronadal were less than 150 liters/ha and 80%less than 200 liters/ha, the recommended volume (Fig. 5.5). The maximum volumeper farmer was 550 liters/ha. Most farmers in Guimba used a spray volume of 8–20tank-loads or 128–320 liters/ha (mean = 144 ± 34 liters) which is much less thanrecommended (300–500 liters/ha) increasing with crop growth (Fajardo et al. 2000).This data agrees with that of Waibel (1986) to confirm that farmers use low sprayvolumes. In Chhattisgarh a survey of 80 farmers revealed a mean spray volume of202 liters/ha.
5.9.17.5 Safe Use Practices
Safety considerations among farmers appear to be lacking in all sites in the rainfedsurvey (Litsinger et al. 1980):
1. No farmer knew that pesticides can enter through skin,

5 Development of Integrated Pest Management Programs for Rice in Asia 219
0
10
20
30
40
50
60
70
80
90
100
0 50 100 150 200 250 300 350 400 450 500 550 600
Spray volume ( liters/ha )
Cu
mu
lati
ve f
req
uen
cy (
% )
First cropSecond crop
Koronadal
Fig. 5.5 Cumulative frequency of water volumes employed by farmers in applying insecticides,Koronadal, Philippines, 1983–1991. See Table 5.15 for information on the farmers interviewed
2. Most farmers (69%) take precautions not to inhale the pesticide while sprayingwith a handkerchief around nose,
3. But some farmers do take some precautions:
a. The safety period before it is safe to eat a sprayed vegetable is >5 days ac-cording to 61%, and
b. 28% feared using pesticides (endrin, carbofuran, methyl parathion mostly)
Most farmers felt insecticides were the most toxic because:
1. Bad odor 41%2. Personal experience 20%3. Knew from label 13%4. Inherently dangerous 11%5. Harmed animals 9%6. Affects the skin 6%
Therefore the farmers have this misperception that the way to avoid poisoningis only not to breathe or eat the chemicals (keeping off the skin is not consideredimportant) (Warburton et al. 1995). Farmers need to take more precautions whenmeasuring product in the spray tank as they are dealing with concentrated insec-ticide. Often farmers use only the bottle cap which is bound to spill on their skinas these are not meant for this purpose and they have no gloves. They should notspray in front while walking through the spray path and they should wear protective

220 J.A. Litsinger et al.
clothing on their legs and wear rubber boots. One method is to wrap a sheet of plasticaround the waist to act as a water repellant. If clothing gets soaked with pesticidetainted solution this acts as a wick causing the chemical to enter the body. Lastlyfarmers should repair leaky sprayers as if they solution spills down their back whilespraying the wicking from their soaked clothing becomes highly hazardous.
In Laos Rapusas et al. (1997) asked farmers what precautions they took whilespraying and the most commonly mentioned precaution was not to spray at all(27%of respondents). Some 12% were wore long trousers and long sleeves andcovered their mouth and nose (10%) while spraying. Some 10% were also awarethat eating or smoking should be avoided, 8% took a bath after spraying, and 5% re-frained from entering recently sprayed fields. A few of the 463 farmers interviewedsaid they kept pesticides away from children and animals and rinseate from sprayerswas not dumped into canals or rivers.
5.9.17.6 Negative Effects on Environment
Surveys in Thailand, Cambodia, Laos, and Nepal among rainfed rice farmersshowed they were aware that useful paddy organisms would be killed if they usedinsecticides (Fujisaka 1990). In the Philippines it is said there are three harvests ina rice field. First is to harvest rice, second is to harvest the rats that eat the rice(barbequed delicacy in the countryside), and third are the aquatic organisms in thepaddy. After harvest one can see farmers fishing out aquatic organisms from thestagnant pools left in the drained field. Such food enriches local diets. Poorer farm-ers in many areas traditionally harvest snails, fish, and crabs from the ricefield tosupplement their diet. In irrigation canals farmers collect an aquatic plant kangkongIpomoea aquatica to use as a vegetable but their health is jeopardized as it absorbsand concentrates pesticides (Tejada and Magallona 1985). One of the comments offarmers after successful IPM programs is how many of the aquatic organisms havereturned to their fields. Many of these organisms are highly sensitive to insecticides.It is beyond the scope of this chapter to detail much of this but the reader is referredto Pingali and Roger (1995).
5.10 KAP of Weeds
5.10.1 Identification and Damage Caused
Bentley (1989) noted that Honduran farmers possess an impressive knowledge ofplants (and by extension weeds) growing in their surroundings, having a name foreach and knowing about their utility and ecology. Ivory Coast rice farmers accordingto a survey by Adesina et al. (1994) also know weeds very well but will producea shorter list of species than one developed by scientists. This is due to the factthat farmers place higher importance on only a few of the prevailing weeds andmay lump two closely related species. If farmers do not give high importance to aweed, they are unlikely to want to control it. They consider some weeds which are

5 Development of Integrated Pest Management Programs for Rice in Asia 221
used for food or medicine or have the ability to suppress other weeds as beneficial(Altieri 1984). This same view was shared by farmers in SE Mexico who have a“non-weed” concept where non-crop plants are classified according to use potentialand complementary positive effects, on the one hand, with negative effects on soiland crops on the other. Such classifications indicate that local farmers understandthe intricate role of non-crop plants in their agricultural activities. Thus insteadof considering all weeds as noxious, certain weeds are allowed to remain in thefield.
In many parts of Asia, rice farmers routinely submerge weeds that they just pulledfrom the field back into the paddy mud, roots up. This is a convenient way to controlthem and also is a source of green manure. Filipino farmers were observed pushingyoung water hyacinth plants under the soil while weeding, in this way weeds servea useful purpose. In Chhattisgarh farmers know those weeds that will not regenerateif buried so roll them into a ball and push them into the soil. Those species that willregenerate (with runners) are thrown on the bunds to desiccate or can be used asfodder. In Guatemala, weeds are allowed to grow in order to feed cattle even theyknow letting them grow tall will lower yield of their crop (Altieri 1984). In Javawhere rice farms are at their smallest there are no weeds as all are harvested forfodder.
Rice farmers in the Ivory Coast were asked to cite all the weeds they knewas pests and identify the most important (Adesina et al. 1994). They noted Chro-molaena has vigorous regrowth and requires more labor to remove. Centrosemaentangles young plants and is difficult to remove. Rottboellia has irritating hairs.Echinochloa is difficult to distinguish from rice. Some weeds such as Ageratumand Euphorbia rapidly form a dense canopy. The farmers noted some weeds havebecome more important in recent times while others less so.
Most farmers believe they know how to control weeds thus undervalue themcompared to insect pests and diseases which give them more problems. A surveyin Guimba, Philippines found farmers agreeing with researchers on the compositionof weed species (Fajardo et al. 2000). However on the main crop only 40% of thefarmers regarded weeds as a major problem in their fields but all applied herbicidesto control them. Farmers may have misunderstood the question to mean weeds werenot a problem to them. This is a common misunderstanding of the question by farm-ers thus those who survey farmers need to make the distinction between whetherif uncontrolled farmers think weeds are a problem or if farmers rank weeds highbecause they are difficult to control. Although weeds were considered a secondaryproblem by the farmers, most farmers believed that weeds, if left uncontrolled, couldcause 50% yield reduction. Research shows that almost 100% of yield is lost with-out weeding, particularly in areas with less water control. Another indication ofthe importance of weeds is that all farmers interviewed used herbicides and over90% carried out labor-intensive hand weeding to keep their fields free of weeds.Traditional cultivars are more competitive with weeds but are less responsive toweed control. On the other hand, modern cultivars are less competitive with weedsbut are more responsive to weed control, thus farmers have increased their timeweeding with adoption of modern cultivars.

222 J.A. Litsinger et al.
Both farmers and researchers in Guimba observed that all fields were infestedby Paspalum distichum and Echinochloa spp. [E. glabrescens, E. oryzoides]; 85%were infested with Monochoria vaginalis; and 65% were infested with sedges [Fim-bristylis miliacea, Scirpus supinus, Cyperus iria]. Other weeds of minor importancewere C. difformis, Ipomoea aquatica, Eclipta prostrata, and Ischaemum rugosum.But farmers did not distinguish among species of Echinochloa. 60% of the respon-dents regarded P. distichum as the most important weed, while 25% stated thatEchinochloa spp. were. 15% thought that other weeds, such as M. vaginalis andsedges were most important. Thus weed incidence is to a large part site specific.This interpretation basically agrees very much with researchers in terms of the sitespecific nature of weeds and the weed importance.
Guimba farmers showed they have a sophisticated understanding of the role ofweeds in ricefields and listed eight ways in which weeds negatively affect yield andrice farming (Table 5.20). High on the list were competition for nutrients, loweryields, reduced tillering, and difficulty in harvest. They also estimated that weedsreduced yield by 12–49% in the dry season and 12–55% (mean 36%) in the wet sea-son. Such ranges in loss were corroborated by IRRI researchers who hand weededsmall plots on farmers’ fields above the weed control level practiced by farmers. Thismethod is a way to measure the degree to which farmers’ weed control methods areeffective. If there is no difference in yield between extra weeded plots and farmers’fields then the farmers’ practice is optimal.
Filipino farmers are said to allow Echinochloa crus-galli. to grow side by sidewith rice (Moody 1990). The grassy weed is said to drive away birds because ofthe long awns and thus protects rice from attack. In reality Echinochloa may attractbirds to rice fields as a source of food.
5.10.2 Evaluation of Control Practices in Irrigated Rice
Rainfed farmers in Sri Lanka stated they experienced fewer weed problems than ir-rigated farmers and combat weeds by hand weeding and water management (van de
Table 5.20 The negative effect of weeds as stated by farmers, Guimba, Nueva Ecija, 1986 dryseason
Problem caused by weeds Respondents (%)a
Competition for nutrients 70Lower yields 40Reduce tillering 30Difficulty in harvesting 20Stunt crop growth 15Difficulty in land preparation 10Alternate hosts for insect pests 5Hamper irrigation 5a Total adds up to more than 100% because most farmers gavemore than one answer.

5 Development of Integrated Pest Management Programs for Rice in Asia 223
Fliert and Matteson 1990). Farmers in general are knowledgeable about the impor-tance of timely weeding but still have problems in weed control due to inadequatewater supply and misuse of herbicides. 31% used the right type of herbicides at theright development stage but only 9% used them at the appropriate rate. The farmerscomplained that even though they used herbicides, they end up undertaking signif-icant hand weeding. They have a choice between direct seeding or transplanting toestablish their crop. The latter requires less herbicide and weeding (93% believe so)but more labor.
Watson and Willis (1985) found farmers in Kalimantan select tall droopy-leavedrice varieties to compete with weeds particularly on newly cleared fields. Moreweeding was needed in older fields when grasses appear. Weeding is curative, how-ever, and is only done when weeds threaten to overwhelm the crop – too late toprevent significant loss. In NE Thailand burning rice stubble controls weeds (Brownand Marten 1986). Surveys in Thailand, Cambodia, Laos, and Nepal in rainfed ricefound farmers noting that weed control was not such a problem due to good landpreparation, use of the stale seedbed method, and hand weeding (Fujisaka 1990).Kenmore et al. (1987) noted Filipino farmers control weeds well and use crop hus-bandry practices and herbicides. On the contrary, the authors concluded that the useof insecticides was not as well carried out by farmers as herbicides. An explanationis that the effect of not using herbicides well is immediate, whereas of not applyingthe right amount of insecticides is not.
Farmers can be innovative. In parts of India where wild rice Oryza sativa f spon-taneum is a serious weed problem farmers have taken to planting a purple coloredrice variety (red rice) Shayamala. When the crop is about a month old the greenwild rice plants can be easily distinguished from those of rice and can be readilyremoved by hand. The farmer would perform this operation only after a season withhigh incidence of wild rice.
The “loop survey” in the Philippines (Cordova et al. 1981) in which IRRIeconomists periodically interviewed the same farmers every five years, showed thatirrigated rice farmers adopted herbicide technology on a linear scale from 1965 to1975, rising from 9 to 58% users. The farm record keeping survey in the Philippinesdocumented detailed herbicide usage by farmers. The survey served as a report cardon farmers’ mastery of herbicide usage pointing out their resourcefulness as well asdeficiencies in certain areas. We found that herbicides were used only minimally inthe seedbed in the four irrigated rice sites. In the field we found that herbicide usagewas generally high as in three of the four sites an average of 73–100% of farmersapplied them. Thus farmers have been high adopters of herbicides as a labor savingtechnology. Overall, herbicide usage varied widely between sites and crop culturesand to a certain extent seasons (Table 5.21).
Sprayable formulations are delivered by stainless-steel, lever-operated, knapsacksprayers (15–19 liter capacity) while granular herbicides are broadcast by hand.Fewest herbicide users were in Zaragoza with only a mean of 45% of farmers, ascrop culture averages. Least usage in a year occurred in Zaragoza in the 1986 wetseason wetbed crop with only 21% of farmers and 14% of farmers in the 1983 directseeded wet season crop. In Zaragoza irrigation comes from a large river diversion

224 J.A. Litsinger et al.
Tab
le5.
21H
erbi
cide
usag
eon
irri
gate
d,do
uble
-cro
pped
rice
info
urlo
cati
ons,
Phili
ppin
es,1
981–
1991
Tim
ing
(DA
T/D
AS
)a
App
licat
ion
freq
uenc
y(%
)P
re-
emer
genc
eap
pl.(
%)
Pre
-em
erge
nce
Pos
t-em
erge
nce
Dos
age
(kg
ai/h
a)
Site
Cro
ps(n
o.)
Use
rs(%
)A
ppl.
no.
1x2x
3xS
pray
able
sG
ranu
les
Wet
/firs
tsea
son
wet
bed
tran
spla
nted
crop
sZ
arag
oza
635
1.1
8910
176
728
0.24
1.12
Gui
mba
473
1.0
100
00
100
40.
44K
oron
adal
590
1.1
955
093
2546
0.48
avg
661.
195
50
9012
370.
391.
12
Dry
/sec
ond
seas
onw
etbe
dtr
ansp
lant
edcr
ops
Zar
agoz
a3
461.
194
60
805
290.
180.
86G
uim
ba5
100
1.0
100
00
984
260.
46K
oron
adal
689
1.1
964
096
2746
0.54
avg
781.
197
30
9112
340.
390.
86
Wet
/firs
tsea
son
dapo
gtr
ansp
lant
edcr
ops
Cal
auan
487
1.1
0.40
Kor
onad
al4
921.
193
80
8814
350.
45av
g89
1.1
938
088
1435
0.43
Dry
/sec
ond
seas
onda
pog
tran
spla
nted
crop
sC
alau
an3
891.
00.
66K
oron
adal
591
1.1
908
293
1541
0.46
avg
901.
190
82
9315
410.
56
Wet
/firs
tsea
son
dire
ctse
eded
crop
sZ
arag
oza
252
1.8
6139
080
751
0.37
1.39
Kor
onad
al1
901.
356
440
100
80.
44av
g71
1.6
5942
090
851
0.41
1.39
Dry
/sec
ond
seas
ondi
rect
seed
edcr
ops
Zar
agoz
a1
451.
010
00
094
338
0.23
Gui
mba
291
1.1
974
010
04
0.32
Kor
onad
al3
941.
376
240
100
50.
47av
g77
1.1
919
098
438
0.34
aD
AT
=da
ysaf
ter
tran
spla
ntin
g,D
AS
=da
ysaf
ter
sow
ing.

5 Development of Integrated Pest Management Programs for Rice in Asia 225
system and farmers maintain higher water depths in their fields than is true of theother sites typified by smaller irrigation systems. Farmers in Calauan (90%) and Ko-ronadal (90%) were highly consistent on average between crops, whereas in Guimbaonly 73% used in the wet season compared to 91–100% for dry season crops. InCalauan the lowest usage per year was 78% in the 1985 wet season and in Koronadal62% in the 1987 second wetbed crop. Overall there was a slight indication that morefarmers chose herbicides in the dry season crops compared to the wet season.
Except in wetbed crops in Zaragoza, sprayable formulations were more preferredthan granulars (Table 5.22). The pre-emergence herbicide butachlor was the mostpreferred sprayable material for transplanted crops by farmers in Calauan (84–97%of applications). In direct seeded rice with pre-germinated seeds, Zaragoza farm-ers preferred pretilachlor (34–56% of applications) in both wet and dry seasons.Guimba farmers who direct seeded in the dry season also selected pretilachlor (61%of applications). Koronadal farmers who direct seeded preferred pretilachlor in thesecond crop (53% of applications) but 2,4-D + piperophos in the first crop (46%of applications). Koronadal farmers selected mixed formulations of sprayable her-bicides which ranged from 19–69% of all applications. Zaragoza farmers selectedgranular herbicide formulations for wetbed transplanted crops in both the wet anddry seasons which predominated in 55–60% of total applications. The most pre-ferred materials including mixtures were butachlor; 2,4-D; MCPA; and pretilachlor.
With the exception of direct seeding rice culture, farmer-users averaged onlyone application per crop (Table 5.21). In the wet or first rice crop from 39–44% offarmers who used herbicides in Zaragoza and Koronadal applied a second time. Themost number of applications recorded was three which occurred in less than 13%among farmer users on any crop (the 1986 second dapog crop in Koronadal).
Choice of pre-emergence herbicides varied widely by site, season, and crop cul-ture (Table 5.21). Highest usage by site was in Guimba (77–79% of all applica-tions). Koronadal farmers used pre-emergence chemicals sparingly in wetbed anddapog crop culture (14–24% of all applications), but were among the highest (67–98%) in direct seeded crops. Farmers planting direct seeded crops utilized the mostpre-emergence applications (43–98%). Zaragoza farmers used more pre-emergenceherbicides in the dry season for both wetbed (70 vs. 53%) and direct seeded (94 vs.43%) crops.
Timing of pre-emergence herbicides averaged 3–5 days after transplanting (DAT)or days after sowing (DAS) for all crops (Table 5.21). Post-emergence applicationswere timed 8–38 DAT or DAS with no trend evident by crop culture or season.Zaragoza (21–38% of applications) and Koronadal (11–32%) farmers generallytimed their post-emergence applications later than those in Guimba (8–12%) overall crops.
The cumulative frequency distribution graphs for herbicide applications by cropage showed for wetbed, wet-season crops that Guimba farmers had applied over95% of total applications by the first week after transplanting (Fig. 5.6A). Zaragozafarmers also had a high rate of pre-emergence applications but continued to applypost-emergence applications until the seventh week after transplanting. Koronadalfarmers applied the most during 4–5 weeks after transplanting (WAT). Similar trends

226 J.A. Litsinger et al.
Tab
le5.
22Po
pula
rhe
rbic
ides
appl
ied
toir
riga
ted,
doub
le-c
ropp
edri
ceav
erag
edby
site
,cro
pcu
ltur
e,an
dse
ason
info
urlo
catio
ns,P
hilip
pine
s,19
81–1
991
Com
mon
nam
eA
ppli
cati
ons
per
crop
(%)a
Zar
agoz
aG
uim
baK
oron
adal
Cal
auan
Wet
bed
Dir
ect
seed
edSi
teav
gW
etbe
dD
irec
tse
eded
Site
avg
Wet
bed
Dap
ogD
irec
tse
eded
Site
avg
Dap
ogSi
teav
gG
rand
avg
WS
DS
WS
DS
WS
DS
DS
1st
2nd
1st
2nd
1st
2nd
WS
DS
Spra
yabl
es45
3496
100
6910
010
010
010
010
010
010
010
010
010
010
010
010
010
092
Sing
leco
mpo
unds
3116
5990
4985
8883
8578
8170
5431
5361
100
100
100
742,
4-D
184
46
80
00
06
711
40
05
163
106
MC
PA3
104
04
02
01
10
03
00
10
00
1bu
tach
lor
102
1728
1484
6922
5869
7159
478
5351
8497
9154
pret
ilac
hlor
00
3456
231
1761
261
10
023
04
00
013
pend
imet
hali
n0
00
00
00
00
12
00
00
10
00
0
Mix
edsp
rays
1418
3710
2015
1217
1522
1930
4669
4739
00
018
2,4-
D+
pipe
roph
os6
629
512
39
118
1512
2233
4630
260
00
112,
4-D
+bu
tach
lor
20
05
20
10
01
20
30
01
00
01
2,4-
D+
trio
benc
arb
62
80
412
26
76
58
1023
1712
00
06
MC
PA+
trifl
ural
in0
100
03
00
00
00
00
00
00
00
1
Gra
nule
s55
664
031
00
00
00
00
00
00
00
8Si
ngle
com
poun
ds50
600
028
00
00
00
00
00
00
00
72,
4-D
2136
00
140
00
00
00
00
00
00
04
MC
PA15
60
05
00
00
00
00
00
00
00
1bu
tach
lor
1418
00
80
00
00
00
00
00
00
02
Mix
edgr
anul
es5
64
04
00
00
00
00
00
00
00
12,
4-D
+bu
tach
lor
16
00
20
00
00
00
00
00
00
00
2,4-
D+
thio
benc
arb
20
40
20
00
00
00
00
00
00
00
MC
PA+
trifl
ural
in2
00
01
00
00
00
00
00
00
00
0a W
S=
wet
seas
on,D
S=
dry
seas
on,d
irec
tsee
ding
used
pre-
germ
inat
edse
eds,
see
Tabl
e5.
21fo
rde
tail
son
sam
plin
gsi
ze.

5 Development of Integrated Pest Management Programs for Rice in Asia 227
continued for the wetbed dry season crop for Guimba and Koronadal farmers, butZaragoza farmers applied earlier showing a greater proportion of pre-emergence ap-plications. Dapog crops showed a marked contrast between Calauan and Koronadalfarmers (Fig. 5.6B), where farmers from the former site applied at the time of trans-planting or earlier. Herbicide timing in dapog culture mirrored that in wetbed culturewhere Calauan farmers applied herbicide within the first two weeks while those inKoronadal were more delayed (Fig. 5.6C). There was a slight difference betweenrice cultures in Koronadal as wetbed culture most applications occurred from 3 to 5WAT whereas in dapog for the second crop particularly most applications occurredby 3 WAT. For direct seeded crops, Koronadal and Guimba farmers had appliedmost applications by the second week after sowing whereas in Zaragoza some 20%of farmers delayed until the nineth week (Fig. 5.6D).
Herbicide rates in general were several-fold lower than those recommended onthe label (0.50–1.00kg ai/ha). Farmers applied an average dosage of 0.18–0.55 kgai/ha per crop (Table 5.21). As a site, Zaragoza farmers applied lowest mean dosages(0.18–0.37kg ai/ha). There was no other observable trend for crop culture or sea-son. Zaragoza farmers used the highest amount of granular herbicides and aver-aged 0.86–1.39kg ai/ha. Still dosages were about half of those recommended. Thefrequency distribution graphs of dosages showed that over half of the applicationsby Zaragoza wetbed farmers were severely under-dosed – less than 0.15 kg ai/ha(even some 18% applied at rates less than 0.05 kg ai/ha), whereas more than halfof Guimba and Koronadal farmers applied at rates above 0.40 (Fig. 5.7A). In thedry season wetbed crop, 80% of Zaragoza farmers applied at rates less than 0.20 kgai/ha, whereas more than half of Koronadal farmers applied at rates above 0.50(Fig. 5.7B). A similar trend was noted for Koronadal dapog farmers as over halfapplied at rates above 0.45 kg ai/ha (Fig. 5.7C). This was remarkably consistent forboth first and second crops. Farmers who direct seeded in the dry season averagedsimilar dosage distributions as wetbed dry season farmers (Fig. 5.7D) with half ofZaragoza farmers averaging herbicide dosages of less than 0.20 kg ai/ha while overhalf of Koronadal farmers averaged more than 0.45 kg ai/ha per application.
A more detailed survey in Guimba by a multidisciplinary team (Fajardo et al.2000) found a surprisingly high 35% of farmers who used herbicide in the seedlingnursery. 85% of those chose butachlor and 15% applied a tank mixture of butachlorplus Rilof H (piperophos + 2,4-D) with knapsack sprayers. Herbicides were ap-plied before seeding – 29% of the farmer-users applied them 7 days before seeding(DBS), 57% at 4 DBS, and 14% at 3 DBS. Furthermore farmers knew preventingweed growth in the seedling nursery occurs through site selection (for least weedyareas) and land preparation. Weeds, pulled and transplanted with rice seedlings,cannot be controlled with herbicides, and hand weeding is impractical. But somefarmers stated that weed control in the nursery was a problem despite more thanadequate tillage. Strategies to prevent weeds in the nursery are warranted such asa low cost herbicide application or longer periods between harrowings. Delaying afew days between tillage operations allows weed seeds to germinate and the result-ing seedlings are readily killed by tillage. Longer periods between tillage operationsalso helps to control creeping weeds such as P. distichum.

228 J.A. Litsinger et al.
0
0.1
0.2
0.3
0.4
0.5
0.6
0.7
0.8
0.91
01
23
45
67
89
10
Wee
ks a
fter
tra
nsp
lan
tin
g
Gui
mba
Zar
agoz
a
Kor
onad
al
Cal
auan
A
Wet
bed,
wet
sea
son
Cumulative herbicide application frequency
0
0.1
0.2
0.3
0.4
0.5
0.6
0.7
0.8
0.91
01
23
45
67
89
10
Wee
ks a
fter
tra
nsp
lan
tin
g
Gui
mba
Zar
agoz
a
Kor
onad
al
Cal
auan
B
Wet
bed,
dr y
sea
son
Cumulative herbicide application frequency
C
Cumulative herbicide application frequency
01
23
45
67
89
10
Wee
ks a
fter
tra
nsp
lan
tin
g
0
0.1
0.2
0.3
0.4
0.5
0.6
0.7
0.8
0.91
Kor
onad
al 1
st
Kor
onad
al 2
nd
Cal
auan
WS
Cal
auan
DS
Dap
og c
ultu
re
D
01
23
45
67
89
10
Wee
ks a
fter
so
win
gCumulative herbicide application frequency
0
0.1
0.2
0.3
0.4
0.5
0.6
0.7
0.8
0.91
Gui
mba
Zar
agoz
a
Kor
onad
al
Dire
ct s
eede
d, d
ry s
easo
n
Fig
.5.6
Cum
ulat
ive
freq
uenc
yof
herb
icid
eap
plic
atio
nsby
rice
cult
ure
and
seas
onin
thre
eir
riga
ted
rice
site
sin
the
Phil
ippi
nes.
Dat
aba
sed
onfa
rmer
ssu
rvey
sun
dert
aken
from
1984
to19
91.H
oriz
onta
llin
ere
pres
ents
50%
offr
eque
ncy
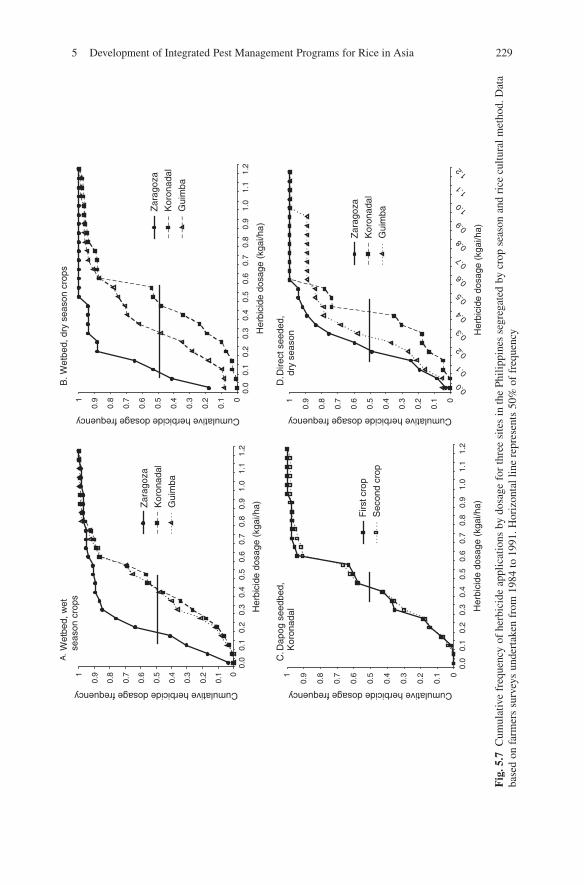
5 Development of Integrated Pest Management Programs for Rice in Asia 229
0
0.1
0.2
Cumulative herbicide dosage frequency Cumulative herbicide dosage frequency
Cumulative herbicide dosage frequency
0.3
0.4
0.5
0.6
0.7
0.8
0.91
0.0
0.1
0.2
0.3
0.4
0.5
0.6
0.7
0.8
0.9
1.0
1.1
1.2
Zar
agoz
a
Kor
onad
al
Gui
mba
A. W
etbe
d, w
etse
ason
cro
ps
0
0.1
0.2
0.3
0.4
0.5
0.6
0.7
0.8
0.91
0.0
0.1
0.2
0.3
0.4
0.5
0.6
0.7
0.8
0.9
1.0
1.1
1.2
Zar
agoz
a
Kor
onad
al
Gui
mba
B. W
etbe
d, d
ry s
easo
n cr
ops
0
0.1
0.2
0.3
0.4
0.5
0.6
0.7
0.8
0.91
0.0
0.1
0.2
0.3
0.4
0.5
0.6
0.7
0.8
0.9
1.0
1.1
1.2
Her
bici
de d
osag
e (k
gai/h
a)
Firs
t cro
p
Sec
ond
crop
C.D
apog
see
dbed
,K
oron
adal
Cumulative herbicide dosage frequency
0
0.1
0.2
0.3
0.4
0.5
0.6
0.7
0.8
0.91
0.0
0.1
0.2
0.3
0.4
0.5
0.6
0.7
0.8
0.9
1.0
1.1
1.2
Her
bici
de d
osag
e (k
gai/h
a)
Zar
agoz
a
Kor
onad
al
Gui
mba
D.D
irect
see
ded,
dry
seas
on
Her
bici
de d
osag
e (k
gai/h
a)H
erbi
cide
dos
age
(kga
i/ha)
Fig
.5.7
Cum
ulat
ive
freq
uenc
yof
herb
icid
eap
plic
atio
nsby
dosa
gefo
rth
ree
site
sin
the
Phil
ippi
nes
segr
egat
edby
crop
seas
onan
dri
cecu
ltur
alm
etho
d.D
ata
base
don
farm
ers
surv
eys
unde
rtak
enfr
om19
84to
1991
.Hor
izon
tall
ine
repr
esen
ts50
%of
freq
uenc
y

230 J.A. Litsinger et al.
Rao and Moody (1988) reported from observing and interviewing Guimba farm-ers that weeds emerging in the seedling nursery, which were inadvertently trans-planted together with rice, caused yield losses ranging from 18% to as much as35%. Using herbicides in the seedling nursery is not commonly practiced by Filipinofarmers and is usually not given attention by herbicide manufacturers. This omis-sion may be because farmers generally do not recognize the yield losses caused bytransplanted weeds (mostly grasses such as Echinochloa spp.). Those farmers whoused herbicides in the seedling nursery applied low rates. Farmers reported that theyfeared phytotoxicity if higher rates were used.
On the main rice crop 95% of Guimba farmers used butachlor while others used2,4-D; MCPA; or Rilof H alone or in combination with butachlor. Application ofbutachlor was mostly timed at 1–5 DAT (latest was 7 DAT). When used, 2,4-D wasapplied at 14–21 DAT, MCPA at 44 DAT, and Rilof H at 2–4 DAT. The spray volumeper hectare (mean = 143 ± 37 liters, range = 64–272 liters) was about the same asthat used for insecticide. All farmers interviewed applied butachlor at a rate lower(most 0.20–0.30 kg ai/ha with a mean = 0.38 kg ai/ha) than the label recommen-dation of 1.0 kg ai/ha. Follow-up research found that rates as low as 0.50 kg ai/hawere justified in direct seeded rice culture but control dramatically dropped belowthis level.
Guimba farmers said control of P. distichum and Echinochloa spp. was consid-ered by half of the farmers to be equally difficult because: (i) herbicides cannotkill them, (ii) they produce many seeds (particularly Echinochloa spp.), (iii) havedense roots, (iv) decompose slowly, or (v) germinate readily (Fajardo et al. 2000).21% of the respondents regarded P. distichum as the most difficult weed to con-trol because of its fast growth and slow decomposition. Another 18% mentionedI. rugosum as equally difficult to control for the same reasons. These observationsshow farmers have great knowledge of weed ecology and control. According tomost farmers (74%), butachlor can control M. vaginalis and sedges (F. miliacea,C. iria, and Scirpus supinus). A few farmers (37%) said that Echinochloa spp. (E.glabrescens, E. oryzoides and E. picta) can be controlled by butachlor. All of therespondents said that P. distichum cannot be controlled by butachlor; 55% said thatbutachlor cannot control Echinochloa spp. either.
The majority of farmers supplemented herbicide application with hand weeding.45% did two additional hand weedings: (i) to increase yield, (ii) for ease of harvest-ing, (iii) to lessen competition, (iv) induce tillering, and (v) to promote faster cropgrowth. 35% performed only one additional hand weeding to lessen competition.Three additional hand weedings were carried out by 15% of the farmers to reduceharvesting and threshing losses and to “totally eradicate weeds”. One farmer did notdo any supplemental hand weeding because he claimed that he already had adequateweed control resulting from good land preparation and the use of herbicides.
Additional comments made by farmers about herbicides that were questioned byresearchers included: (i) 2,4-D is for the control of M. vaginalis, F. miliacea, and C.iria (20%); (ii) Lambast (a brand name of butachlor) is more effective than Machete(another brand of butachlor)(10%); and (iii) MCPA controls broadleaved weeds andsedges but not P. distichum or the Echinochloa species (5%). M. vaginalis is a seri-ous weed in paddy fields but is more easily controlled by herbicides when applied

5 Development of Integrated Pest Management Programs for Rice in Asia 231
at the correct rate and time. Most farmers said that butachlor prevented seeds of M.vaginalis, F. miliacea, C. iria, and S. supinus from germinating, but herbicides onlyaffect germinating weed seeds (Fajardo and Moody 1990). A few farmers believethat 2,4-D applied post-emergence is for the control of some broadleaved weeds andsedges which is supported by research (Moody 1977). The allegation that Lambastis less effective than Machete is hard to understand because both are brands of thesame product. Perhaps adulteration is the reason for the discrepancy.
5.10.3 Rainfed Rice Production Systems
Many polycultures have built-in pest protection mechanisms. For example in fores-ted slash and burn rice, maize, cassava intercropping culture in Sumatra, Indonesia,as determined from a diagnostic survey (Fujisaka et al. 1991), is a stable systemif a sufficient fallow period is followed. Yields are low and the burning, neededto clear up the cut brush and small trees, controls weeds and soil pests as well asprovides nutrients. Seeds are sown with a dibble stick. Weediness and low fertilitycause farmers to be limited to three years of cropping without resort to heavy inputsof hand weeding labor. Rice is grown only in the first year with cassava lasting untilthe third year.
Weed control by rainfed wetland farmers in Orissa, Madhya Pradesh, Bihar, andUttar Pradesh in India is called bushening which was described during a diagnosticsurvey (Fujisaka 1991). The direct seeded (dry) fields are plowed around 30 DASwhen there is a minimum of 2–3 cm of water standing in the field. The chisel plowloosens the soil, uproots and incorporates weeds, disturbs the roots of the rice plantwhich are stimulated to tiller more, and aerates the soil. A dozen or more passesare made (laddering) in different directions with a leveling plank with large spikeson one side that rip out mainly grassy weeds including rice. Uprooted rice plantsare re-transplanted into open areas as a means of evening the stand called “gapfilling”. They also report this method lessens pest incidence by knocking insects offthe plants. Soil aeration from the plowing improves nutrient uptake. The method ishighly labor intensive and Indian researchers have been trying for years to replacethe method particularly in irrigated areas. Only in systems with more reliable irriga-tion delivery and where weeding labor is readily available will farmers desist usingthis method. It is to be noted that pre-germinated herbicides have been attempted tobe used in these areas with little achievement as farmers have not been as successfulas irrigated rice farmers in mastering them. One of the major weeds is wild ricewhich cannot be controlled by herbicides and only by hand weeding near harvest(for the benefit of the next year’s crop).
5.11 KAP of Plant Diseases
5.11.1 Identification and Damage Caused
Farmers appear to know much about their crops, animals, soil, and flora includingweeds, but less about insects and little of plant diseases (Trutmann et al. 1993). Plant
232 J.A. Litsinger et al.
diseases in general present greater problems of understanding for farmers than theother pest groups. Farmers often relate disease symptoms to soil deficiencies or otherabiotic causes. In Chhattisgarh, India farmers will call blast, bacterial leaf blight,zinc deficiency and even planthopper burn by the same descriptive term called ghu-lasa which translates as a browning or burning. Many disease symptoms have namesbut farmers either consider them non-important or do not realize they are caused bysomething living and thus can be managed. Most are unaware of micro-organismsand only perceive their consequences as diseases indirectly. Those that do realizea disease relate it to human health and they manage conditions that promote goodhealth rather than treat disease symptoms (Bentley and Thiele 1999).
Filipino farmers believe that tungro a virus disease can be spread by air, water,and soil is consistent with their perception that is like germs that attack humanssuch as AIDS. Farmers are unaware that diseased plants are a source of inoculumfor green leafhoppers and see little urgency in their removal. They know that tungrois connected with insects, although they are not always clear which ones. The rec-ommendation of an insecticide for a plant disease such as tungro must be confusingto farmers who readily apply insecticides for fungal diseases as well.
Only 19% of Sri Lankan farmers recognized plant diseases of rice in the field (vande Fliert and Matteson 1990). Diseases, even when recognized, were not consideredas important problems by farmers when asked to name their pest problems. In thesame study only 4% used fungicides on rice. When shown a specimen of fungalinfection only 4% could identify it as a fungus. Some farmers ignorantly spray in-secticides for disease problems or a fungicide for an insect pest. Farmers in the IvoryCoast had a difficult time diagnosing diseases (Adesina et al. 1994). Disease symp-toms such as brown spotting are often confused with nutrient deficiencies, toxicities,and drought. The presence of spots was believed to have no impact on yield.
Kalimantan farmers appeared indifferent to leaf spotting particularly in an earlycrop (Watson and Willis 1985). Bentley (1989) noted Honduran farmers’ agricul-tural ability is uneven and they know more about large and stationary plants thanthey do about small mobile insects and even less about diseases. They have wordsto describe the damage from diseases but the name they use does not support anycausal agent. Bentley concluded they are unaware of the causal agent but know itsrelationship to the environment, i.e., more prevalent when humid. When farmerswere taught about maize diseases and shown spores via a microscope that were thereproductive forms and taught how disease spreads by wind or soil or water, a farmerwent home and planted maize in a field that had not been planted to maize in severalyears. He reasoned that the soil borne spores would have died by then. Thus we seethat at least some traditional farmers can assimilate new information even when itcontradicts previously held notions.
Malaysian farmers were shown photos of tungro virus disease in a rice field and77% identified it correctly by name and some 10% said it was caused by insectswhile 6% did not know what it was (Heong and Ho 1987). A photo of green leafhop-per, the vector, produced 85% correct answers by farmers but only 70% knew ittransmitted the disease. Some farmers misidentified tungro as being iron toxicityor other causes. When asked to speculate on what conditions favored tungro, 54%

5 Development of Integrated Pest Management Programs for Rice in Asia 233
said they did not know, while others correctly said staggered planting (17%), beingunable to dry the fields (10%), and high green leafhopper densities (9%).
Litsinger et al. (1980) found tungro is well known in the rainfed wetland riceareas surveyed in the Philippines. Farmers had names for rice fungal and bacterialdiseases when shown photographs or plants in the field. But very few knew thesymptom described were diseases caused by microorganisms. A few (8%) Pan-gasinan farmers surprisingly correctly named grassy stunt from a photo (it is nota common disease anywhere in the Philippines). Batangas farmers had names forvirus disease symptoms but no recognition of specific virus diseases.
In irrigated areas of the Philippines farmers observing fungal disease symptomswere mistaken as insect in origin thus their presence was highly correlated to in-secticide use in Laguna (Marciano et al. 1981). However this same group of farm-ers recognized nine different rice diseases including two bacterial in origin, fivefungal, and two viral. Thus the diseases were recognized but the farmers did notunderstand that fungal diseases need to be controlled by a fungicide. We also notedFilipino farmers applying insecticides against symptoms of soil problems. Bentleyand Thiele (1999) as well noted the same with Honduran farmers.
In Guimba the interdisciplinary team found that 90% of the respondents said theyrecognized tungro as a rice disease; 5% also named rice blast Pyricularia oryzae,while 10% knew of no rice diseases (Fajardo et al. 2000). Tungro is endemic to theGuimba area thus farmers were more aware of the problem. The farmers recognizeda tungro-infected plant as stunted with yellowish leaves, while 20% also said thattungro-infected plants had brown spots and drying leaves. Researchers, but not farm-ers, observed sheath blight [Rhizoctonia solani], sheath rot [Sarocladium orzyae],stem rot [Sclerotium oryzae], bacterial leaf streak [Xanthomonas campestris pvoryzicola], bacterial leaf blight [Xanthomonas campestris pv. oryzae], and falsesmut [Ustilaginoidea vierns].
5.11.2 Evaluation of Control Practices
5.11.2.1 Traditional Methods and Superstitious Practices
The knowledge of traditional farmers is often broad, detailed, and comprehensive.Although traditional farmers may not know what fungi, bacteria, or viruses are, inmany cases they have effective, time tested practices for managing them. Glass andThurston (1978) stressed that traditional agricultural practices must be understoodand conserved before they are lost. For example in Peru before the arrival of Spanish,the Incas instituted a strict seven year rotation on potato farming enforced by law.This is now believed to be a cultural control for cyst nematode.
The Ayamara Indians in Peru have many myths to explain the origin of plantdiseases as well as beliefs: entrance into a field of animals in heat, pregnant or men-struating women, drunk men, or people or animals when the dew is on the groundare all thought to cause disease (Thurston 1990). They dust their crops with ash,spray them with fish water infusion, place branches of a herb (traditional insect

234 J.A. Litsinger et al.
repellant) between plants, and rogue diseased plants. They also carefully select seedand practice crop rotation and do not plant when the moon is full or the sun hasa halo.
From their studies, Bentley and Thiele (1999) concluded that traditional practicesare a mixture of the useful and useless. Farmers nevertheless have come up withcultural methods for disease control even though they do not know the concept ofplant disease as being living organisms different than insects. Therefore they aretrying by trial and error to find remedies for such symptoms. The challenge is to siftthe wheat from the chaff.
It is noted that farmers exchange seeds with neighbors even seeds of the samevariety on a regular basis or when they observe that any particular variety tendsto accrue pest problems if grown on the same land for several years (Mattesonet al. 1984). They will select seed from a neighbor from fields which are not fullof mixtures of off types and the crop is vigorous. This practice may also be fordisease control as local strains of particularly fungal diseases can become adaptedto the same genotype if planted for many years in one place. Maize plants seen inAngola after 25 years with no new germplasm introduction were severely infectedwith fungal diseases.
In a survey in Malaysia most (95%) farmers had attempted to control tungrovirus during an outbreak, and 61% said the crop recovered as a result (Heong andHo 1987). Some of the methods used were traditional or superstitious, tried by 33%of the farmers and included: (i) spreading kitchen or padi husk ash, (ii) pushing abranch of the Sapium indicum tree or a piece of bamboo painted red into the paddymud, (iii) scattering branches of Lantana in the field, and iv) spreading salt. Filipinofarmers said they applied sand to control Cercospora leaf spot disease on rainfedrice (Litsinger et al. 1980).
5.11.2.2 Cultural and Other Control Methods
Most practices of traditional farmers for disease management in developing coun-tries consist of cultural controls (Thurston 1990). Some practices of traditionalfarmers are: altering plant and crop architecture, burning, adjusting crop densityor depth or time of planting, planting diverse crops, fallowing, flooding, mulching,multiple cropping, planting without tillage, using organic amendments, planting onraised beds, rotation, sanitation, manipulating shade, and tillage. Most but not allare sustainable.
Farmers responded poorly to a campaign in Malaysia with extension officersgiving away paraquat herbicide to destroy rice ratoon infected with tungro in orderto quell an epidemic in the Muda scheme (Heong and Ho 1987). They knew theyhad tungro in their fields but were unable to perceive that the infected stubbles afterharvest could transmit the problem to the next crop (Kenmore et al. 1985). Whenasked what steps they would take next season if attacked, they replied: (i) insecti-cides (79% of farmers), (ii) destroy diseased plants (2%), (iii) do nothing (9%), (iv)use fertilizer (4%), and (v) if their neighbors’ fields were attacked would also sprayinsecticide (55%).

5 Development of Integrated Pest Management Programs for Rice in Asia 235
Among other methods recommended in the tungro control campaign were: (i)burning affected crop after harvest and (ii) hand weeding (Heong and Ho 1987). Arange of strategies for tungro was suggested by farmers during the survey:
1. Insecticide in nursery (23% of farmers),2. Early detection and control (19%),3. Clearing fields (10%),4. Drying fields (5%),5. Growing resistant varieties (5%),6. Synchronous planting (4%),7. Organizing community-wide control (2%),8. Using less fertilizer (1%), and9. Roguing infected plants (1%)
When asked about the synchronous planting water delivery plan to create a ricefree period, 90% agreed to it; for those who disagreed their reasons were: (i) loss ofincome (63% of farmers), (ii) farmers would be forced to plant late (13%), or (iii)they believed the strategy would not work (25%) (Heong and Ho 1987).
The Malaysian government recommended dry season fallow for one month byshutting off the water: (i) to save water, (ii) improve crop scheduling, and (iii)to dry out the soil to prevent weed and ratoon growth. After the fallow periodwas initiated, tungro was controlled and so 90% of farmers were in favor of it.Farmers, however, were not convinced of the cultural control methods but thiswas based on their lack of knowledge that they were really required to control adisease as well as an insect. Farmers exhibited risk averse strategies when theyreacted when neighbors sprayed. Muda farmers actually spent little time on theirfarms, some 15 full working days per season and only 1% of their time in cropprotection.
In Guimba farmers said most farmers controlled diseases by: (i) spraying insec-ticides (53%) (for tungro and fungal/bacterial diseases) or (ii) by roguing infectedplants (18%), while (iii) 29% did nothing (Fajardo et al. 2000). In terms of chemicaldisease control, (i) 76% knew of no chemicals to control rice diseases; (ii) 18% saidthat insecticides such as monocrotophos, chlorpyrifos + BPMC, or DDT can controltungro (insect vectors), and (iii) 6% said that copper oxychloride and edifenphos canbe used for the control of blast.
5.12 KAP of Vertebrate Pests
5.12.1 Identification and Damage Caused
Of all the pest groups, farmers recognize vertebrate pests best as they are large andare prevalent mostly in crops. They are also noted because they often are highlydestructive and feed on grains. Rice plantings near forested areas are beset by thedepredations of often a wide array of vertebrate pests that can run the gamut from

236 J.A. Litsinger et al.
elephants, rhinos, monkeys, squirrels, and pigs (Grist and Lever 1969, Fujisaka et al.1991). These forest animals are highly attracted to a grain crop, as in the forest, fooditems are scarce. Some pests such as pigs and rhinos do not eat rice plants but like tobed down in rice fields, with disastrous consequences on the crop. To make mattersworse some are diurnal (monkeys) while others are nocturnal (pigs, rhinos) causingmany sleepless nights and days for vigilant farmers and their families.
From diagnostic surveys in Thailand, Cambodia, Laos, and Nepal, rainfed ricefarmers said rats eat the crop and open tunnels in bunds to cause water loss (Fujisaka1990). Farmers notice rat population fluctuations and species distribution. Rats areespecially a problem in late planted fields and ratoons in Kalimantan (Watson andWillis 1985)
Factors affecting the extent of damage by squirrels as stated by farmers in theIvory Coast are: (i) sowing date, (ii) type of variety, (iii) plant architecture, (iv)presence of awns, (v) date of maturity, and (vi) season (Adesina et al. 1994). Kali-mantan farmers said birds attack in flocks early in the morning and 1 h before sunset(Watson and Willis 1985). They are worst near forests or trees where they roost.
5.12.2 Evaluation of Control Practices
Ivory Coast farmers, to combat squirrels, build fences requiring much labor, whileothers: (i) dig up burrows, (ii) set out traps, (iii) burn surrounding fallow fields, (iv)use hunting dogs, and (v) guns (bush meat) (Adesina et al. 1994).
Rat control in rainfed ricefields in a number of Asian countries is by: (i) traps,(ii) poisoned baits, and (iii) digging burrows (Fujisaka 1990). Removal of weeds byhand by Claveria farmers was astutely seen as having additional benefits of remov-ing habitat for rats. Flooding the field was seen as having the dual effect of weedand rat control. The beneficial effect of flooding against weeds is well known, butPhilippine rats prefer aquatic habitats thus there would be little benefit from thismethod.
Kalimantan farmers have many control methods for rats (Watson and Willis1985). The techniques are both preventative and curative. Farmers claim to selecttolerant varieties that have (i) thick stems, (ii) hard tillers, (iii) bitter hulls, and (iv)firm rooting to prevent lodging. Farmers clear out above-ground rat nests. Theyplant fields in groups for synchronous harvesting to dilute damage. They sow rice inburned areas which are said to be avoided by rats. They cover seed holes with ash.They sow wet seeded rice to encourage quick sprouting, or if they transplant theyraise the water level in the field. Also they isolate seedlings from embankments. Ratrepellants are made from mashing and soaking sugarcane refuse and spraying it onthe field. Many of these methods have questionable value but should be tested byresearchers.
The Kalimantan farmers also have some superstitious practices such as they burnrats and sprinkle their ashes in the field or they leave rat bodies to rot on a stake inthe field for “the others to see” and “be afraid to enter” (Watson and Willis 1985).

5 Development of Integrated Pest Management Programs for Rice in Asia 237
More pragmatic solutions of rat baits are used. The most common rat bait is the acutepoison zinc phosphide which produces a rapid killing effect. Rats soon learn to avoidacute bait in a behavior called “bait shyness”. Anti-coagulants were developed toovercome bait shyness as they work to prevent vitamin K synthesis, thus rats bleedto death (vitamin K is a key constituent in the chemical process of coagulation ofblood). But farmers do not like such rodenticides as they cannot see the dead rats,thus believe the poison is ineffective. Farmers cooperate in rat control campaignssuch as beating foliage and driving them into openings to be killed by sticks ormachetes.
Rodent and bird control methods in the Philippines as noted by a questionnaireconsisted of: (i) scarecrows (55% of respondents), (ii) flags (57%), (iii) tin cans(29%), and (iv) crosses (29%) (Catholicism is the major religion) (Litsinger et al.1980). Other methods mentioned by farmers for bird control were: (i) hangingplastic string above the crop, (ii) clapping bamboo sticks, and (iii) using bamboopropellers.
Birds are controlled with: (i) scarecrows, (ii) synchronous planting (synchronousripening), and (iii) vigilance for birds around fields from before dawn to dusk (Fu-jisaka 1990). For birds, hard seeds (8%) and long strong awns (5%) were mentionedas qualities of resistant varieties by Claveria farmers. Ivory Coast farmers use: (i)slingshots, (ii) tin cans for noise, (iii) scarecrows, and (iv) repellant wild plants.Rituals were preformed using a special plant where the parts were placed in thefield and the person applying has to be the last to leave (Adesina et al. 1994). InCambodia farmers use cassette magnetic tape which they unwind from the reel andstring around their field. Sunlight reflects off of the surfaces of the wind blown tapewhich acts as a repellant (Jahn et al. 1997).
Kalimantan farmers combat birds by: (i) scarecrows, (ii) noise makers such asstrings of metal above the fields in mature fields, (iii) seedbeds are camouflagedby ash or weed mulch, and (iv) fields are guarded cooperatively (Watson andWillis 1985). In Claveria 8% of dryland farmers used scarecrows for bird control(Table 5.8).
5.13 Pest Group Ranking in Terms of Importance
This section looks at how farmers cross evaluate the various pest groups witheach other. Among pest groups, 34 irrigated farmers in Guimba, C. Luzon polledconsidered insects (45% of the respondents) and weeds (40%) to be of greater con-cern than diseases (15%) (Fajardo et al. 2000). Through experience, farmers realizethat neglect of weed control practices will invariably result in significantly reducedyield. By contrast, insect pests and diseases are less chronic and severe, thus areperceived to be less threatening to yield. Weeds were probably ranked of lower im-portance than insects because farmers can more readily manage them. Most insectsare recognized by farmers but their effects are more subtle and are more difficult tocontrol than weeds.

238 J.A. Litsinger et al.
Two other groups of farmers expressed opinions on the most important pestgroups. In Ivory Coast farmers considered that weeds were most important (100%)followed by birds (84%), rodents (60%), insects (40%), and diseases (9%) (Adesinaet al. 1994). While in Java most farmers believed rats (89%), insects (82%), anddiseases (77%) were important problems causing substantial yield loss in irrigatedrice (Rubia et al. 1996).
The researchers assessment of the most important pest groups agrees with thefield surveys. The lesson is that research should not be focused on only one pestgroup as all must be seen as a part of a complex of constraints and farmers may beunwilling to adopt new farm practices designed to reduce insect pests if they ignoreor exacerbate other serious agricultural hazards (Conelly 1987).
In a rainfed rice site in N. Luzon in the Cagayan Valley, farmers ranked theirpest problems among all groups (Litsinger et al. 1982). Three insect pests wereranked highest (rice bug, caseworm, and armyworm) followed by rats and birds.Tungro disease ranked number ten even though the disease was not present in thesite and discolored grains ranked number 14. Weeds were not considered in theevaluation.
In Claveria most (93%) dryland rice farmers mentioned a number of pests thatcaused outbreaks based on their experience exclusive of weeds. Of those respondingoutbreaks were most common with rats (68% of respondents) and rice bug (33%)(Table 5.23). Some farmers gave more than one answer but none mentioned dis-eases. Weeds were not considered in this study. Farmers were asked to rank thepests they recalled in terms of importance and rice bug ranked highest (6.9). If
Table 5.23 Local names of rice pests recalled by upland farmers during the interview process andtheir relative importance.a Claveria, Misamis Oriental
Common name Farmers responding
English Local Causingoutbreak
(%) Recall ImportanceIndexb
Rice bug Tayangaw, piyangaw 33 67 6.9Stemborer deadhearts Buko 0 65 4.9Rats Ilag 68 52 4.5Birds Langgam, maya 20 55 4.1Root aphids Bunhok, dagabdab, Iayabc 12 45 4.0Stemborer whiteheads Buko 0 52 3.9White grubs Ingan, bunlod 13 28 2.3Seedling maggot
damageTag’t, undol-undol, dugy,
lagos0 27 1.8
Leaffolder wormsdamage
Ulod Likis-likis, lok-lok 0 3 1.8
Locusts Dulon, duwon 19 18 1.3Armyworms Ulod 7 17 1.2a n = 60, 93% of farmers responding.b Farmers were asked to rank each pest they named and the most important was given a value(index) of 10 if it were not mentioned it received a value of 0, thus a higher number indicatesgreater importance in severity and commonness.

5 Development of Integrated Pest Management Programs for Rice in Asia 239
all farmers had ranked rice bug of highest importance it would have scored a 10.Stemborers ranked high in importance for both deadheart and whitehead damage.Farmers associated stemborers by the damage they caused as was also the case withseedling maggot which they only know by its damage symptom. They do not knowa fly causes it but know it is an insect.
Omnipresent stemborers are chronic pests but rarely become as significant as ratsand birds. When asked to recall their pest problems rice bug was most commonlymentioned. But if stemborer deadhearts and whiteheads were combined they wouldhave been the most commonly mentioned pest guild. Farmers know both symptomsare caused by the same group of insects although there are some five species in-volved which they do not distinguish. Other pests recalled the most were rats, birdsand root aphids. The latter cause stunting which they give a name based on thedamage symptom.
5.13.1 Trends in Pest Control Practices Over Time
5.13.1.1 Agro-Input Usage
The farm record keeping survey conducted over 10 years in the Philippines enabledtrends in agro-input usage to be plotted. In Fig. 5.8A the data from the four sites wascombined with earlier data from the “loop survey” covering the period from 1965 to1977 (Cordova et al. 1981). Insecticide users was defined as the frequency of appli-cation among the respondents in the figure. In 1965 few farmers applied insecticideson rice but this number dramatically increased to a peak in 1977 when the govern-ment low interest credit program heavily subsidized insecticides. Further subsidieswere in effect until 1984. Whereupon insecticide usage declined at a steady rate.Wet and dry season data were highly similar and decreased dramatically from thehigh of almost an average of five insecticide applications per crop per farmer to 0.5applications in 1990, returning to pre-Green Revolution levels. The farmers in thefarm record keeping dataset had minimal contact with extension workers and thedecline was attributed to farmers learning on their own that insecticide applicationwas less useful, a fact now supported by research (Heong 1998, Litsinger et al.2005).
Linking herbicide usage with the loop survey data also gave a trend of increase,this time until the mid-1980s before declining into the 1990s due to the withdrawalof subsidies (Fig. 8B). The peak ranged over a decade where some 60–70% of farm-ers used herbicides. There was a somewhat higher usage in the dry season probablybecause farmers expected higher yields, but this was not the case with insecticides.Weed control, however, leads to higher yield gains than is the case with insect con-trol. Farmers learned to control weeds with a single application supplemented byhand weeding and ponding. Zaragoza farmers with more access to irrigation waterwere able to pond their fields at greater depths to the extent that they did not need touse herbicides as much as in other sites even on direct seeded rice where they reliedon higher seeding rates.

240 J.A. Litsinger et al.
012345
'65
'70
'75
'80
'85
'90
Wet
sea
son
Dry
sea
son
A.
Inse
ctic
ide
usag
e
0102030405060708090
'65
'70
'75
'80
'85
'90
B.
020406080100
120
'65
'70
'75
'80
'85
'90
Year
C.
Nitr
ogen
dos
age
Applications (no./crop)
% farmer users/crop Yield (c / ha)
KgN /ha/crop
2
2.53
3.54
4.55
5.5
'65
'70
'75
'80
'85
'90
Year
D.
Her
bici
de u
sage
Cro
p pr
oduc
tion
Fig
.5.8
Tre
ndin
agro
-inp
utus
ean
dcr
oppr
oduc
tion
inir
riga
ted,
doub
le-
rice
cultu
reas
dete
rmin
edfr
omfa
rmer
surv
eys
info
urlo
catio
nsin
the
Phili
ppin
es,
1965
–199
1.D
ata
from
1965
to19
77ar
efr
omC
ordo
vaet
al.(
1981
),fr
om19
77fr
omK
enm
ore
etal
.(19
85),
and
from
1979
to19
91fr
omfa
rmre
cord
keep
ing
of20
–40
farm
ers
per
crop

5 Development of Integrated Pest Management Programs for Rice in Asia 241
Farmers use of nitrogen increased linearly since 1965 when the base rate was10 kg/ha in the wet season crop (Fig. 8C). It rose up to over 70 kg/ha by 1991, thelast data point. Nitrogen rates were higher in the dry season, again as with more solarradiation and no typhoons dry season cropping is less risky and more productive.Fertilizer subsidies remained but farmers transferred their savings from pesticide tonitrogen which is supported, at least in the insecticide component, by the conclu-sions of studies that showed greater use of nitrogen fosters crop compensation frominsect pest damage (Litsinger 1993 Fig. 3.4). Farmers no doubt learned this by trialand error explaining their deviation from recommended practices (Table 5.1).
Despite the removal of pesticide subsidies, average yields made a marked in-crease from 1985 onwards to 1990, the end of our dataset (Fig. 5.8D). Dry seasonyields still tended to be higher than those in the wet season in the typhoon plaguedN. Philippines which contained three of the four sites.
Farm record keeping data revealed trends in insecticide and herbicide materi-als over the decade of surveys. For insecticides (Fig. 5.9A), organo-phosphatesremained the most popular, while pyrethroids increased. Carbamate materials de-clined over the period while organochlorines initially decreased but endosulfan be-came popular once more in 1991, offsetting the trend. Carbamates are particularlymarketed for leafhoppers and planthoppers whose densities declined as insecticideswere less used allowing resistant varieties to have longer field lives. Mixtures, no-tably chlorpyrifos+BPMC became increasingly popular although cyclic and wasmarketed as a broad spectrum material. Butachlor was the most popular herbicideespecially in the late 1980s when direct seeding became popular (Fig. 5.9B). 2,4-Ddeclined steadily as a sole material but was a popular component of mixtures thathad broad spectrum efficacy against more weed groups.
5.13.1.2 Individual Farmer’s Practices Over Time
In Zaragoza, as in the other sites, farmers were interviewed each season for thefarm record keeping dataset to determine their inputs. It was not designed to followindividual farmers over time but by chance, in a few instances, some were. Wepresent data from two Zaragoza farmers by crop 1982–1991. Interestingly, whenwe examined these two farmers over a number of seasons we found as much vari-ation in agricultural practices as noted between the farm population has a whole(Table 5.12). Two farmers were monitored over seven to ten seasons. The firstfarmer Mr. Ligazon still grew traditional varieties from time to time and had astandard practice across seasons only in fertilizer usage in the seedbed and her-bicides (none used). All other practices were different each season. In five of theseven seasons he sprayed a single insecticide application to the seedbed, select-ing some four kinds. Fertilizer application to the main crop varied from one totwo times using four different materials with the first application from 10 to 26DAT. Only in one crop did he not apply fertilizer. Nitrogen dosage was quitesteady crop to crop. Insecticide application varied from 0 to 2 times; usage oc-curred in only four of the seven seasons with four products although he made

242 J.A. Litsinger et al.
0
10
20
30
40
50
60
70
80%
usa
ge/
cro
p
% u
sag
e/cr
op
OrganophosphateMixtureCarbamatePyrethroidsOrganochlorine
A Insecticide type
0
10
20
30
40
50
60
70
80
90
100
'83 '84 '85 '86 '87 88 89 90 '91Year
Butachlor
2,4-D
Mixtures
B Herbicide type
Fig. 5.9 Trend in insecticide and herbicide types over the period of farm record keeping in fourirrigated rice sites in the Philippines, 1983–1991. Data are from surveys of 20–40 farmers per cropin each site
a mixture once. Yield of modern rices varied dramatically from 2.9 to 5.4 t/haper crop.
The second farmer Mr. Espiritu planted nine modern rices and often up to threevarieties per season. Except for one occasion he used fertilizer in the seedbed andsprayed insecticide to the seedbed only four times in ten. He always used fertilizer

5 Development of Integrated Pest Management Programs for Rice in Asia 243
on the main crop but varied the number of fertilizer and insecticide applications upto three times. He applied seven kinds of insecticides, even once using DDT soldby traders selling house to house from stock illegally acquired from public healthprograms. Reasons for spraying were prophylactic as well as the presence of insectsor their damage. Yields also fluctuated greatly from 2.4 to 6.5 t/ha per crop.
This individuality shown among farmers in products used is partly due to havingso many choices as, in the Philippines, there is a thriving business in input suppliesand many local businessmen and farmers are seed dealers. Small formulators takeadvantage of farmers’ curiosity to try new technologies by introducing new brandseach year and as farmers do not know that most these are not new products, butjust new packaging of the same array of insecticides. Older and cheaper chemicalsare preferred by farmers due to more affordable prices. Farmers are motivated toexperiment with new brand names in the hope of finding better products. Goodell(1984) mentioned the confusion that exists in the range of choices available to farm-ers and the lack of a more unified process of narrowing down the choices to thebetter products. Recent studies show that the farmers’ preferred method of knapsacksprayer application results in suboptimal levels of control (Litsinger et al. 2005).The results pose a question for economists who have classified farmers on the basisof yield placing them into three categories with the top one third at levels equalto those of research stations (Pingali et al. 1990). What class do Mr. Ligazon andMr. Espiritu belong to?
5.13.1.3 Survey Parameter Correlations
The datasets derived from the farmer surveys in three irrigated rice sites (Zaragoza,Koronadal, Guimba) in the Philippines were analyzed to determine relationshipsbetween variables. It should be kept in mind that significant regressions do not provecause and effect relationships but can provide valuable insights to be followed upby more detailed studies. The linear regressions are presented separately by site andseason in Table 5.24.
The data indicated that highest users of fertilizer and herbicide also applied moreinsecticides. The positive relationship of these two inputs has been cited by Kenmoreet al. (1985). In addition the timing of the first fertilizer application was correlatedto the timing of the first insecticide application. This relationship was found to holdtrue as Filipino farmers believed that applying fertilizer predisposes the rice crop togreater insect damage (Fajardo et al. 2000, Bandong et al. 2002). Those promotingIPM, however, would take issue with the prophylactic application of insecticidesbased on other input usage and not on insect pest populations in the field.
In Guimba significant correlations between yield and field area occurred in bothwet and dry seasons. This can be explained in that the irrigation systems are deeptube wells and those farmers with larger holdings often exert more political pressureamong the farmers in the command area to direct more water to their fields. Thiswas a common complaint among the disenfranchised farmers in the area. In addi-tion higher seeding rates were correlated with higher yields only in Guimba. Theexplanation for this may be that Guimba farms suffered from the greatest number

244 J.A. Litsinger et al.
Tab
le5.
24L
inea
rre
gres
sion
anal
ysis
corr
elat
ions
ofcr
oppr
oduc
tion
vari
able
sin
thre
eir
riga
ted,
doub
le-c
ropp
edri
cesi
tes
inth
ePh
ilip
pine
s.D
ata
ista
ken
from
farm
ersu
rvey
sin
Zar
agoz
aan
dG
uim
ba,N
ueva
Eci
jaan
dK
oron
adal
,Sou
thC
otab
ato,
1983
–199
1
Yva
riab
leX
vari
able
Cor
rela
tion
coef
ficie
nt(r
)a
Zar
agoz
aG
uim
baK
oron
adal
WS
DS
WS
DS
1st2nd
Fert
iliz
erap
plic
atio
nsnu
mbe
rpe
rfie
ldIn
sect
icid
eap
plic
atio
nsnu
mbe
rpe
rfie
ld0.
26∗∗
∗0.
18∗∗
0.16
∗∗0.
18∗∗
0.37
∗∗∗
0.20
∗∗∗
Her
bici
dera
teIn
sect
icid
era
te0.
20∗∗
∗0.
40∗∗
∗0.
24∗∗
∗0.
26∗∗
∗0.
20∗∗
∗0.
21∗∗
∗D
ate
1stf
erti
lize
rap
plic
atio
nfie
ldD
ate
1sti
nsec
tici
deap
pln.
field
0.32
∗∗∗
0.22
∗∗0.
32∗∗
∗0.
33∗∗
∗0.
33∗∗
∗0.
20∗∗
∗Y
ield
Are
aof
field
nsns
0.23
∗∗∗
0.31
∗∗∗
nsns
“Se
edin
gra
tens
ns0.
13∗
0.17
∗ns
ns“
Seed
bed
Nra
te0.
26∗∗
∗ns
0.15
∗0.
18∗
nsns
“N
PKra
tein
field
ns0.
33∗∗
∗0.
47∗∗
∗0.
55∗∗
∗0.
15∗
0.16
∗∗“
Nra
tein
field
ns0.
35∗∗
∗0.
41∗∗
∗0.
58∗∗
∗0.
14∗
0.22
∗∗∗
“P
rate
infie
ldns
ns0.
20∗∗
∗0.
25∗∗
∗ns
ns‘”
Kra
tein
field
nsns
0.29
∗∗∗
0.31
∗∗∗
nsns
“D
ate
1stf
erti
lize
rap
plic
atio
nin
field
ns0.
25∗
nsns
nsns
“D
ate
2nd
fert
iliz
erap
plic
atio
nin
field
ns0.
29∗
nsns
nsns
“R
ate
1stN
appl
icat
ion
infie
ldns
ns0.
26∗∗
∗0.
34∗∗
∗0.
17∗∗
0.13
∗
“R
ate
1stP
appl
icat
ion
infie
ldns
nsns
nsns
ns“
Rat
e1s
tKap
plic
atio
nin
field
nsns
0.24
∗∗∗
0.35
∗∗∗
nsns
“Pr
e-em
erge
nthe
rbic
ide
rate
0.22
∗∗∗
0.26
∗∗ns
nsns
ns“
Post
-em
erge
nthe
rbic
ide
rate
nsns
nsns
0.14
∗ns
“D
ate
ofpr
e-em
erge
nthe
rbic
ide
appl
icat
ion
ns0.
28∗
nsns
nsns
“In
sect
icid
eus
age
inse
edbe
dns
nsns
nsns
ns“
Num
ber
ofin
sect
icid
eap
plic
atio
ns0.
25∗
nsns
ns0.
27∗
ns“
Inse
ctic
ide
dosa
gepe
rap
plic
atio
nns
nsns
nsns
ns“
Inse
ctic
ide
spra
yvo
lum
ens
0.13
∗
“C
rop
mat
urit
yns
0.28
∗ns
0.31
∗
aW
S=
wet
seas
on,D
S=
dry
seas
on,l
evel
sof
prob
abil
ity:
ns=
P>
0.05
,∗
=P
≤0.
05,
∗∗=
P≤
0.01
,∗∗
∗=
P≤
0.00
1.

5 Development of Integrated Pest Management Programs for Rice in Asia 245
of crop stresses among the sites (water deficiency, weeds) and higher seeding rateshave been shown to aid the crop in tolerating stemborer (Litsinger 1993) and whorlmaggot (Bandong and Litsinger 1986) damage.
Usage of N in the seedbed was positively correlated with yield in Guimba in bothgrowing seasons, but only in the wet season in Zaragoza. Nitrogen enhances cropvigor and improves the crop’s ability to withstand crop stresses. The interpretation isless clear cut. As mentioned, crop stresses were more prevalent in Guimba. Farmersin Zaragoza told us that they use fertilizer in the seedbed not for yield but to makeit easier to pull seedlings as when fertilizer is used roots do not penetrate deep intothe soil. Less stress on the seedlings from reduced transplanting shock also wouldtranslate into higher yield.
In the field, fertilizer usage (NPK) and particularly N was positively and signif-icantly correlated with yield increases in all crops compared with the exception ofthe wet season in Zaragoza. The positive relationship between fertilizer and yield isno surprise but its lack of response in Zaragoza during the wet season is probablydue to the high frequency of typhoons. Farmers in Zaragoza, being at the tail end ofthe irrigation system, typically plant late and therefore the crop matures during themonths of the most frequent typhoons, particularly those with the strongest winds.The amount of N applied in the first fertilizer application was correlated with yieldonly in Guimba and Koronadal, the latter only in the seasonal data sets but not bycrop culture. Interestingly P and K usage when isolated from use of N was onlysignificantly correlated with high yield in Guimba. Highest dosages of N were usedby farmers in Guimba thus balancing the nutrients may have been the reason for thepositive relationship.
The timing of the first and second fertilizer applications had only a significant re-lationship with yield in the Zaragoza dry season crop. This was the highest yieldingof all site x season combinations in the study (Litsinger et al. 2005) and thereforetimely application of fertilizer was perhaps more important than in other sites. Therate of the first N application was important in all sites except Zaragoza. On theother hand the rate of the first application of P was unimportant in all sites, whereasK was important only in Guimba. We have no explanation for these results.
Rates of the only pre-emergence herbicides were correlated to high yield in bothseasons in Zaragoza but not in the other two sites. Zaragoza farmers have the low-est usage of herbicides and depend mostly on ponding for weed control. Labor forhand weeding is difficult for farmers to arrange as well. Farmers tend to under-doseherbicides thus there appears to be a distinct advantage among those farmers whouse herbicides to use more effective rates. Only in the first crop in Koronadal wasthe rate of post-emergence herbicides correlated with high yield showing that lateseason weeds are more important to the crop. In Koronadal the first crop is higheryielding and thus removing weeds would have a more significant effect. In the othersites, weed control by ponding, pre-emergent herbicides, and hand weeding appearsto be effective. The date of the pre-emergence herbicide application was negativelycorrelated to high yields in the dry season in Zaragoza, meaning that the earlier theapplication the greater was the effect. This stands to reason as weeds are smallerand more vulnerable.

246 J.A. Litsinger et al.
It was no surprise that insecticide usage in the seedbed did not translate intoimproved yield. There is little insect damage to the seedbed and initially in theinsecticide check method we included the seedbed as a growth stage but dropped itafter two years as no losses were recorded in four sites (Litsinger et al. 1987). Totalnumber of insecticide applications was positively associated with higher yields inonly the wet season crops in Zaragoza and Koronadal but not in Guimba or dry sea-son crops. Greater stresses occur to the rice crop in the rainy seasons thus alleviationof some stress probably translated into higher yields. Marciano et al. (1981) foundrice yield was independent of the number of insecticide applications in irrigated ricein Laguna province.
Average insecticide rates per application showed no correlation with yield inany site probably because the top of the range still was only marginally lethal.Studies have shown that insecticide usage on rice is not economical in most oc-casions due to the poor control (Litsinger et al. 2005). Improved insect control cancome from more thorough coverage of the rice crop. During the second rice crop inKoronadal there was a correlation with spray volume to yield and this crop has lessrainfall thus insecticide sprays had longer residual activity on the crop. The over-all range, however, was much below recommended amounts to explain the weakcorrelation.
Crop maturity measured only in Zaragoza and Koronadal was positively corre-lated to high yields in only the dry season crops. It has been shown that extendingthe growth of rice through longer maturing varieties allows greater compensation tooccur and hence higher yields (Litsinger et al. 1987). It was significant that the cor-relations were only in the dry season during greater solar radiation and thus higheryield potential.
5.14 Feedback to Research
5.14.1 Making Technology in a More Usable Form for FarmerAdoption
The approach to enhancing farmer management of high-productivity, high-inputsystems has primarily been one of blanket recommendations but following themwithout understanding enhances farmers uncertainty. It has been well establishedthat uncertainty is a driving force in farmer behavior and that farmers act rationallygiven their grasp of the available alternatives and their comprehension of cause andeffect relationships (Price 2001). Any new technology should be modified by aperiod of adaptive research before it is introduced into a location, the process ofwhich forms the central theme of farming systems research (Zandstra et al. 1981).Researchers therefore should not only look at the technical worth of a given practicebut also in relation to the socio-cultural milieu into which it is to be introduced.Failure to do so, particularly among the more capital intensive technologies, leadsto non-adoption (Fujisaka 1991, 1993).

5 Development of Integrated Pest Management Programs for Rice in Asia 247
A finding of the IPM training project in C. Luzon, Philippines was that re-searchers began to realize more ways in which tailoring technology to the realitiesof farmers could be improved (Goodell et al. 1982). The farmers in the project didnot directly demand this of the scientists but unwittingly did so by requesting thescientists to conduct an IPM course in exchange for their willingness to try groupmanagement. While training helped farmers and researchers to become acquaintedand began a process of vocabulary sharing, it became clear that the technologyshould provide farmers with much more concrete, systematic, and equilibrium-focused management practices and perceptions. The exchange would be essentialin the technology development process. It is difficult to imagine any technology asin-place before scientists have involved themselves in extension efforts. In retrospectwe realized that scientists too often drop out of the process of technology develop-ment long before it has been completed. The discipline of bringing technology fullyto the level at which farmers can use it should be central to all research in technologydevelopment.
It was concluded that researchers were reluctant to examine whether the centralcomponents of IPM technology actually pay off at the field level, such as pesticidesand seeds being subject to no effective monitoring, they hand over highly inap-propriate technology to extension agencies which hardly exist at the village level(Goodell 1984a). Researchers must determine if the technologies are economicalas practiced by the farmer. Goodell questions whether IPM is worth the farmers’effort?
That economic returns of IPM to the farmer are relegated to the periphery ofresearch rather than receiving top priority suggests that scientists and policy makersexpect farmers simply to obey what they dictate (Goodell 1984a). But the poverty offarmers may give them less rather than more incentive to adopt IPM. Are we seriousthat the technology should actually be implemented at the field level? If so we mustask whether it is worth a farmer’s investment.
There is a need to streamline technology to suit farmers’ aptitudes as IPM tech-nology is very complex. Here are the four steps that technology must pass to be in amore usable form for farmer adoption (Heong 1999):
1. Research: Research has focused on technology generation and evaluation withlimited emphasis on adaptation, integration, dissemination, and adoption in whatshould be a continuous and dynamic process between science and practice. Re-search may stop too soon creating a fatal gap.
2. Synthesis: Information not in a form that can be assimilated into the farmingsystem.
3. Distillation: Information may be too complex.4. Communication: Information does not reach the farmer in a form that can be use-
ful caused by language, jargon, and selective hearing on the part of the recipient.
We share some lessons learned from the IPM training project in C. Luzon, Philip-pines (Goodell et al. 1982, 1990):

248 J.A. Litsinger et al.
Initial expectationsand assumptions
Findings Comments How the projectchanged
A. Technological information
1. IPM forresource-poorfarmers mustconcentrate onlabor-intensiverather than capitalintensivetechnologies
Farmers almostinvariably preferchemicals to otherlow labortechnologies butmost farmers canonly afford onewell timedapplication
Poor farmers do notwish to work harderthan wealthierfarmers; they tooseek ways tominimize physicallabor
The project no longerassumes it can rankfarmers’ resourceallocation priorities.Research shouldrely on a menuapproach providingfarmers withoptions that havedifferentcapital:laborrequirements
Initial expectationsand assumptions
Findings Comments How the projectchanged
2. Farmersineffective use ofinsecticides (lowspray volume andlow dosages) canbe remedied bymore educatedmeasurements
Excessive frequencyof farmers’insecticide hasbeen reduced as aresult of trainingbut dosages andvolume are stilltoo low. Noeffective methodis know to bridgethis gap
Farmers were afraidfor health reasons toincrease theconcentration ofinsecticides in spraytanks, they also didnot want to allocatemore labor toincrease sprayvolume per hectare
The project focused onfinding ways toeliminate insecticideusage through moreemphasis on yield lossstudies and to exploitmodern rices ability tocompensate for lossesby better agronomicmanagement
3. Control of keypests early in thefirst season is animportantcomponent ofIPM. Its value willbe evident tofarmers
Farmers use veryshort timehorizons in theircrop protectionstrategies evenwhen managingIPM pests andmasteringscientificexplanations
Farmers scrupulouslyavoid possibleunnecessaryexpenses
Anthropologist hired tounderstand farmers’cognition (perceptionor lack or process ofknowing) time and riskmanagement
4. Substitution ofeconomicthresholds forprophylacticpesticideapplication isessential forresource-poorfarmers
Farmer’ cropprotectionstrategies arealmost solelyresponsive toempiricalevidence ofdamage orobservablepresence of pests
Project is left with adifficult challenge;for some pests, thebest control ispreventative
Project sobered by muchlower expectation ofadoption rates whentechnology innovationrequires farmers tothink in terms ofprevention rather thansuppression

5 Development of Integrated Pest Management Programs for Rice in Asia 249
5.14.2 Challenge for Research to Find Alternative Methodsto Pesticides
KAP studies showed that farmers know and practice a wide range of cultural controlmethods in C. Luzon. There was a need to broaden the IPM tool box of technolo-gies for insect pest control as the two key methods recommended were host plantresistance and chemical control. The latter technology compromises the beneficialeffect of natural enemies leading to resurgence and secondary pest outbreaks spawn-ing new biotypes which shorten the field life of insect resistant varieties. Teachingfarmers to use more insecticides, encouraged initially in the launch of the GreenRevolution, needed to be reversed in order for the farmers to benefit from the richnatural fauna and greater stability of genetic resistance.
Two cultural control methods were emphasized in farmer training programs. Thefirst was to encourage farmers to plow down the stubble immediately after harvestfor stemborer and disease control. The farmers told the researchers that this methodwas too expensive and impractical. An additional irrigation would have to be givenin order to be able to till the soil which had dried. It proved very difficult to organizethe additional off season irrigation. Farmers also did not see the need to controlsomething that was not imminent (Goodell et al. 1982).
Researchers also believed that soil incorporation of carbofuran or fertilizer is soprofitable that Filipino farmers will try it despite initial expense but later found farm-ers do not incorporate insecticide granules before transplanting nor basally apply N(Fujisaka 1993). In addition sustained baiting for rat control was seen is a valuableaddition to or replacement of farmers’ practices. Sustained baiting turned out to beless attractive than current methods as farmers cannot see the rats die so do not givethe method credence.
The second cultural control method was synchronous planting which would bemost effective if carried out over a large area. However there was not enoughresearch information on the specifics of how the method would be implemented(Goodell et al. 1982). The key question was what is the minimum area that was re-quired as it was impractical in terms of water delivery to have the whole 200,000 haof the irrigation system plant at the same time. The second question was what wasdegree of coordination that was expected in terms of planting date variability thatwould be allowed between the fields.
Both of these methods suffered the same problem of farmers not placing a highpriority on insect control in terms of the effort required (Goodell 1984b). Despitethese caveats farmers after numerous meetings agreed to follow synchronous plant-ing and a project developed which spurred a large research program that eventuallyanswered the two questions as well attempted to involve farmers in a 2,000 ha syn-chronous planting scheme (Loevinsohn et al. 1993). The farmers were willing tofollow synchronous planting because one of the benefits was earlier water deliverywhich would mean harvest before the season of the large typhoons damage wetseason crops.
But the synchronous planting pilot project in the end failed as the water man-agement engineers could not control the release of the water as the irrigation system

250 J.A. Litsinger et al.
was also one of the main suppliers of electricity to Manila, thus when the power gridneeded more electricity, water was released from the dam irrespective of the irriga-tion needs of rice farmers. This priority for the urban masses in Manila trumped thatof the farmers and the flow occurred often without warning. The project, however,was instrumental in popularizing the technology which was successfully followed inIndonesia and Malaysia in systems where delivery water was given greater priorityto farmers’ needs (Koganezawa 1998, Litsinger 2008a).
5.14.3 Research Methods Need to Be Developed to ValidateIPM Inputs
The C. Luzon farmer training project underscored the need to develop methodsto validate resistant varieties and identify adulterated pesticides/fertilizers. Goodell(1984a) found that Filipino farmers who believed they were planting resistant rices,when tested in IRRI’s greenhouses, revealed > 40% were highly susceptible tobrown planthopper. Thus farmers did not have the variety they believed they did.Similarly 70% of pesticide bottles were found to be adulterated, either significantlydiluted and substituted with less effective or out-of-date materials. Adulteration iscommon in a number of neighboring countries (Nesbitt et al. 1996).
In Chhattisgarh farmers have developed simple tests (dissolving urea in water orby odor or feel for rock phosphate) to determine if inorganic fertilizers are bogusor not. Most countries have Bureaus of Standards whose job it to monitor pesticideand fertilizer quality in the marketplace to determine if products are genuine. Sim-ilar government agencies have the same role with drugs sold in pharmacies. Theagencies invariably exist but most are so underfunded that that they are impotent.NGOs have become involved in a number of countries to lend support to govern-ment efforts. There is a need to make a few convictions against some of the dealersthat adulterate products. The chemical industry is also highly supportive of suchmeasures and would be a collaborator.
5.14.4 How to Deal with Multiple Pests and Stresses
Goodell (1984a) concluded that because of the way scientists are taught to thinklinearly that recommendations are made for single pests whereas farmers who thinkcontextually look at the whole field and all the problems before making a controldecision. Farmers therefore need measures of how to deal with multiple pests thatoccur in the same growth stage.
In response to this need, data was analyzed from field trials that incorporatedthe concept of multiple pests in terms of defining action thresholds of several insectpests occurring in the same growth stage (Palis et al. 1990). Yield loss trials alsopoint out that the more stresses acting on a crop the greater the yield loss as there isless ability of the crop to compensate (Savary et al. 1994, Litsinger 1993, 2008b).

5 Development of Integrated Pest Management Programs for Rice in Asia 251
Litsinger et al. (2005) concluded that farmers, rather than measuring the incidenceof each stress, need to assess the number of stresses attacking the crop at one time.Due to the compensating ability of modern rices, the farmer needs to remove onlysome of the stresses freeing the crop to compensate for the rest. The farmer canchose to tackle stresses that are most feasible and economical to deal with as anIPM strategy.
5.14.5 Build on Farmers’ Knowledge and Farmer First
Chambers et al. (1989) has observed that there are some things that farmers knowthat scientists don’t and vice versa, also there are some things that both know as wellas don’t know. Farmers and scientists both tend to know the growth stages of cropsand the benefits of irrigation (Bentley 1992c). But both groups were oblivious of thedetrimental ecological effects of pesticides at the start of the Green Revolution. Inthe foregoing sections Goodell et al. (1982) pointed out that in attempting to intro-duce IPM concepts to farmers, researchers began to realize the original questionswere backwards. If technology is to be used by farmers its development must startwith them and not at the research stations.
5.14.5.1 Indigenous Technical Knowledge
Farmers may have a lot to contribute to the development of appropriate agriculturaltechnologies. Traditional peasant systems of agriculture are not primitive leftoversfrom the past but are, on the contrary, systems finely tuned and adopted both bio-logically and socially to counter the pressures of what are often harsh and inimicalenvironments (Haskell et al. 1980). These systems often represent hundreds if notthousands of years of adaptive evolution in which the vagarities of climate, the avail-ability of land and water, the basic needs of the people and their animals for food,shelter and health have been amalgamated in a system which has allowed society toexist and develop in the face of enormous odds.
A potential wealth of unexplored information on crop protection in traditionalagriculture appears to await investigation and documentation (Glass and Thurston1978). We must learn from the practices of traditional agriculture. Rice culture,even though it appears to be a monoculture, has surprising diversity. In traditional,low-intensity farming systems, pests were controlled by a variety of cultural meth-ods including burning stubble, flooding, crop rotation, and the use of pest- andstress-tolerant varieties (Zelazny et al. 1985). Food webs of pests and regulatoryorganisms are highly intricate and interwoven, as due to the large world wide areaof domesticated rice, many pests and natural enemies have transferred to it from thegrassland it replaced (Schoenly et al. 1996). Flooding reduces the diversity of soilfauna which is replaced, however, by a diverse flora and fauna in the paddy water(Settle et al. 1996). Local people depend on aquatic organisms for protein whichfarmers harvest after draining the field or by nets; this particularly true for riverdiversion irrigation systems which would include fish (Fernando et al. 1980).

252 J.A. Litsinger et al.
We have argued that obtaining information on KAP of local farmers is a neces-sary step in IPM programs. It may be found that:
1) Farmers may have found ways of coping thus do not need a new technology,2) On the other hand they may have wrong perceptions and attitudes that must be
addressed if improvements are to be made, or3) Embracing useful farmers’ knowledge and practices in IPM programs will im-
prove acceptability of newly introduced practices (each side meeting the otherhalf way rather than a total replacement) (Kenmore et al. 1985).
Therefore it is essential that IPM programs are designed to include local pestcontrol practices as much as practical. KAP studies have explored not only howparticular farming communities perceive their natural environment, but also describetheir technological inventory against pest infestation (Gabriel 1989).
5.14.5.2 Comparison of Farmers’ to Recommended Practices ProducesNew Research Teads
One way to start an IPM project is to compare farmers’ practices with national rec-ommendations to see where they are similar or differ. Shao et al. (1997) in Hunan,China, found large gaps exist between farmers’ practices and research recommen-dations as farmers used only 30% of recommended practices. They concluded thatan important first step is to understand what farmers think, perceive, and practice.
In Guimba we saw that farmers have evolved their own set of practices and onlyfollow some of the national recommendations (Table 5.1). Farmers still have roomfor improvement. For example the importance of weeds in the seedbed was discov-ered by KAP investigations by observing farmers on a daily basis. Losses were veryhigh from farmers who transplanted weeds. Thus a low cost technology using $1/haworth of herbicide can resolve the problem. On the other hand, taking the lead fromfarmers, trials were carried out to study the effect of their practices of increased Nand increased seeding rates. We found that the crop’s ability to tolerate stemborerdamage occurred with their “high” N level and “high” seeding rates with a favorableresult obviating the need for chemical control (Litsinger 1993). It was more practicalto use higher rates of N and seed than to spray.
The Guimba KAP survey which compared existing farmers’ practices in riceculture with the national recommendations produced an agenda for new researchdirections and underscored the need to rethink experimental methods (Fajardo et al.2000). Adaptive researchers should look closer at practices that differ between farm-ers and researchers and ask if the farmers could be right under their local conditions.Studies have shown that farmers continually experiment with production practicesin an effort to improve upon them and that each crop is an experiment (Litsinger1993).
The reason that IRRI agronomists concluded that lower seeding rates, fewerseedlings per hill, and lower N rates were optimal is that these variables werestudied one at a time in a reductionist fashion under ideal conditions where in-secticide application eliminated pest damage, water levels were ideal, etc. These

5 Development of Integrated Pest Management Programs for Rice in Asia 253
optimal management practices resulted a relatively stress free condition that is notthe reality in most rice fields. Farmers therefore found that increasing inputs had theeffect of attaining higher yields under their conditions. When the agronomist testedthese levels he concluded that they were wasteful and similar results were achievedmore economically at lower levels. Thus the researcher and farmer each found theideal set of practices for their respective environments but it is significant that thesewere different environments.
The differences can mostly be explained by the two divergent approaches totechnology development (Litsinger 1993). Most of the recommended practices weredeveloped in replicated experiments on research stations with the results tested infarmers’ fields. This reductionist approach involved a series of experiments whereonly one or two variables were tested at a time while holding the other practicesconstant under stress-free conditions. Farmers, on the other hand, evolved theirpractices in a holistic manner by trial and error under a background of dynamicstresses. The holistic approach to experimentation, varying one or several practicesamong those comprising a crop production system, allows expression of a multitudeof interactions. The reductionist approach, on the other hand, is designed to preventunwanted interactions.
The scale of the trials also is vastly different leading to errors in extrapolation.Researchers lay out 25–100 m2 plots while farmers test new ideas on a scale 10to several hundred times larger. For example, it may be easy to evenly sow a drybed nursery of 5 m2 but if this were done on a scale of 500 m2, the tedious workwould result in less even seed distribution. A classic example is the mud ball methodof incorporating urea into balls of mud and then distributing them among groupsof four hills, stepping on each one to push it into the soil where it will releasenitrogen slowly. The technology is sound and in a small plot is feasible but interms of a 1 ha field it is unrealistic at today’s price of labor. Both researchers’ (re-ductionist/scientific) and farmers’ (holistic/traditional) approaches have significantcontributions to make, but the resultant best fit is highly location specific. In gen-eral, farmers need assistance in understanding scientific farming while researchersneed feedback from farmers on the performance of new technologies under farmconditions.
More attention should be given by researchers to potential interactions betweenpractices that may vary by location. Many are presented in Litsinger (1993). In-teractions, particularly those involving pests, are normally prevented in traditionalexperiment station trials by the elimination of pest damage altogether (in agronomictrials) or selectively (in pest control trials), usually by heavy use of pesticides. Onthe other hand, farmers, are contextual thinkers and look at pest complexes and thecrop as a whole.
Farmers’ practices should be elicited and reviewed objectively. Not all farmersfollow the same set of practices and as we saw even the same farmer can changethem dramatically season to season, so that more attention should be placed on themost commonly mentioned responses. Also the criteria used by farmers to favora certain practice may be due to risk aversion behavior or less labor requirementrather than because it obtains a higher yield. Surveys should be able to discover therange of farmers’ responses. For example the number of interpretations mentioned

254 J.A. Litsinger et al.
Table 5.25 Agronomic and pest management practices noted from the surveya
Practice Purported Effecton Yield
Purported Benefit
1. Transplant older seedlings Lower on early but noton medium durationcultivars
Less breakage of pulled seedlings,more flood tolerance, moretolerance to insect pests anddiseases, more competitionagainst weeds
2. Straight, rather than randomrows, where labor is cheap
None Mechanical weed control
3. N applied to seedling nursery None Ease (less cost) in pullingseedlings (vs blast)
4. P K rates dependent onfertilizer formulationcommercially available
None None
5. Increase in N leads to greatertolerance of pest damage
Increases Less risk of insect damage atexpense of higher N cost (vsgreater weed competition)
6. Wetbed preferred overdrybed seedling nursery
None Less risk of seedling nurseryfailure from bird or rat damage,heavy rains, ease of pullingseedlings: Fewer weed problems
7. Higher seeding rates Increase in certainconditions
Less risk of insect damage atexpense of higher seed cost:Weed suppression
8. Farmers pond deeper waterbecause less reliable water
Lower (if > 20 cm) Less risk from drought stress:Better weed control
9. Use of cultural practices canmean that lower herbicidedosages are effective
None Less cost for herbicide
a Adapted from Fajardo et al. (1990).
by Guimba farmers in Table 5.25 should lead to verification trials. Follow-up, shortsurveys can be carried out as well to allow further clarification.
5.14.5.3 Farmer-Led Research
The sustainable agricultural movement has an admirable tendency to work moreclosely with farmers and to respect traditional knowledge and practices. Researchersparticipating with small farmers to strengthen, invent or reinvent appropriate tech-nology should understand that farmers have information gaps in certain predictabledomains of knowledge. Field workers may wish to identify these gaps and help fillthem in while relying on farmer knowledge to help improve the quality of on-farmresearch and repay collaborating farmers with useful information (Bentley 1989).
Farmers are often viewed as objects of study rather than collaborators or realpeople providing valuable input. IPM has to be built from the client up ratherthan from the researcher down (Bentley and Andrews 1991). Documenting farmers’experience and knowledge as valid in their specific context and using their inputs,approaches, and ideas not only strengthens their self-esteem, but also contributes to

5 Development of Integrated Pest Management Programs for Rice in Asia 255
a balanced research partnership between farmers and researchers (Bjornsen-Gurung2003). Goodell et al. (1982) sagely remarked that the only conclusion that can bemade is for the farmers themselves to do the fine tuning, preferably in groups. Iftechnology is to be used by farmers, its development must start with them and noton the research station. Farmers experiment to satisfy curiosity, to solve problems,and to adopt technology. Farmers are by nature experimenters, in that many contin-ually try out and adjust their practices and uses of plants in response to changingconditions. That is, “a farmer is a person who experiments constantly because he isconstantly moving into the unknown”.
According to Norton and Mumford (1993), due to not understanding farm-ers, researchers may be trying to answer the wrong questions or at developinginappropriate technologies. Farming systems research programs pioneered the con-cept of farm description to understand the current cropping systems before makinginterventions for their improvement (Zandstra et al. 1981). The next gap we need toclose is the farmer-scientist gap or we will remain as described: the scientist is asdistant to the farmer who the scientist claims to be benefiting by his research as themoon is from the earth (Fujisaka 1991). When farmers are seen as experimenters andinnovators, other views also change. More dynamic and flexible research processesbuilding on farmer research interactions and supporting farmers’ innovation becomepossible. Farmers have much of importance to say to scientists, and farmers’ meth-ods of practical research are complimentary to those of scientists. Experimentationby farmers has long been under-perceived. Farmers by the very act of farming arecarrying out adaptive research which is often ignored by planners and scientists.
Farmers in many traditional agricultural societies are not at all adverse to ex-perimentation. Experimentation is probably as natural as conformity in traditionalcommunities (Brosius et al. 1986). The farmer field school training method whichhas pioneered the farmer-led research movement, emphasizes the farmers as an ex-perts due to their accumulated experiences. Researchers believe that pests significantto a site can be specified beforehand for all practical purposes in training programs.Farmers and researchers should conduct trials on pests that appear during the currentseason and should be vigilant to take advantage of whatever nature gives.
5.14.5.4 Examples of Farmers’ Knowledge in Generating “New” Technologies
Participation not only means farmers’ physical presence but also the use of theirknowledge and expertise (Bjornsen-Gurung (2003). Understanding potentials anddrawbacks of their local knowledge system is a pre-requisite for constructive col-laboration between farmers, scientists, and extension services. Farmers are behindmany of the recommendations that researchers then undertake research to confirm.These examples were gleaned from KAP studies in the Philippines by IRRI’s Farm-ing Systems Program for improved weed and insect pest control. Farmers wereshown to have keen sense of observation and linking cause and effect:
1) Farmers under-dose both herbicides and insecticides but field trials showed thatdosages based on manufacturers’ recommendations can be reduced 50% withno loss in efficacy,

256 J.A. Litsinger et al.
2) Farmers, perhaps to avoid phytotoxicity by using the same knapsack sprayerfor herbicides and insecticides, decant herbicide directly on top of the floodwater which allows it to spread evenly over the field, research found that it waseffective,
3) Mixing liquid herbicide with fertilizer, typically urea as other fertilizers “melt”or with sand and broadcast the mixture on the field with no need for a sprayer.These methods are simpler, more economical, and less phytotoxic,
4) Spot weeding rather than weeding the whole field,5) Use of weeds as livestock feed. Harvesting rice and weeds was as profitable as
intensive weeding and harvesting grain only,6) Pest damage is additive combining all species that cause similar injury such as
defoliation,7) Pre-transplanting chemical treatment of seedlings for whorl maggot control
such as seedling soak based on farmer practice (farmers deduced a carryovereffect of systemic insecticide applied in the seedbed to the main crop),
8) Synergism of early season pests: rice whorl maggot is not serious in isolationbut only in certain contexts with other stresses,
9) Monitoring earlier planted fields as a sign of pest buildup,10) Prioritizing monitoring first in low lying fields which are more aquatic loca-
tions for whorl maggot, caseworm, defoliators or shady portions of fields forleaffolders,
11) Inspecting the downwind side of a field for caseworms which float inside tubesof rice leaves, and
12) Submerging young seedlings to dislodge camouflaged defoliators green larvaefor rapid counting (they float)
The following are farmer thoughts regarding weed ecology and control, inno-vations, and practices that illustrate farmers’ ability to classify, choose, improvise,adapt, and test based on their particular circumstances (Moody 1994):
1) Wet seeded rice culture has greater weed problems than transplanted rice. Thecompetitive advantage of transplanted rice is due to the size difference betweenrice seedlings 15–30 cm tall and weeds just germinating. In wet seeded ricehand weeding is more difficult and the crop is more sensitive to pre-emergenceherbicides,
2) Bury weeds into the mud as green manure was validated by research but has tobe young weeds that can produce 6–8 kg N/ha and 200 kg C/ha and 18% yieldincrease,
3) Good water management is needed for enhanced herbicide effectively has beenshown experimentally,
4) Knowledge of shift in weed species over time from Echinochloa spp. to Is-chmaemum rugosum particularly in wet seeded rice as a result of poor watermanagement, application of the wrong herbicide, failure to apply herbicide atthe correct time, and planting contaminated seeds,
5) Removing weeds late in a crop as control on the next crop (such as Echinochloaseed heads and wild rice), and

5 Development of Integrated Pest Management Programs for Rice in Asia 257
6) Transplanted rice with weeds growing in the seedbed leads to very high losses.From this observation came a low cost control of grasses in the seedbed with asmall amount of herbicide.
There are not as many examples regarding plant pathology probably becausefarmers often do not recognize the many plant diseases as something that can beaffected by management (ie., are living), but also there are fewer options in termsof management. The main control for the fungal and bacterial diseases is geneticresistance. The farmers’ method of careful seed selection from well adapted andhealthy plants is a sound practice as is sorting through seed by hand to remove offtypes and diseases and small seeds before sowing. This may explain the farmers’widespread habit of finding new sources of seed from neighbors’ fields every threeor so years. The dryland farmers in Sumatra who mix up to ten rice cultivars in asingle field is a sound strategy to temper the effect of blast disease (multi-line).
With the exception of sustained rat baiting with anti-coagulants, all of the prac-tices for rat and bird control mentioned in the KAP section on vertebrate pests comefrom farmers.
5.15 Feedback to Extension
5.15.1 Farmers’ Sources of Information
KAP studies identified the most influential sources of agricultural information tofarmers. In the most detailed study in the Philippines (Brunold 1981), the agricul-tural technician was the most important (89%) closely followed by radio programs(86%) (Table 5.26). Brunold concluded that farmers have the greatest confidencein their technician as he or she is the one with the newest information, and farmers
Table 5.26 The most important sources of information on pest control utilized by irrigated ricefarmers, Iloilo, Philippines
Source Respondents (%)a
Extension technician 89Radio 85Friends and neighbors 66Local extension seminars 47Pesticide dealer 36Informal group meetings 30Own experience 15Head of village 13Agriculture magazine 10Training program 9Extension leaflets 6Pesticide label 5TV 1Chemical company representative 1On-farm demonstration 1a n = 40 and more than one answer was given, afterBrunold (1981).

258 J.A. Litsinger et al.
do not value highly their own experience. Friends and neighbors were also seen asinfluential. In a study in rainfed areas of the Philippines, which asked what sourcesdid the farmers seek for information on pesticide usage, most relied on their ownexperience (51%); less important were the extension technician (32%), neighbors(4%), advertisements (4%), pesticide dealers (1%), and radio (1%). In Malaysiawhere a similar KAP survey was carried out, most irrigated rice farmers in the Mudascheme sought farming advice from government technician (86%) with relatives andfriends (6%), or chemical sales representative (1%) much less important (Heong andHo 1987).
5.15.2 Institutional Constraints
Writing up her observations of IPM extension training in C. Luzon, Goodell et al.(1982) posed the question “Is IPM extension doing its part?” In her project locationshe found government institutions were not there to support the Filipino farmers,including: (1) extension services, (2) technicians for crop monitoring, and (3) pes-ticides sales not tied to credit. The research team had to incorporate into the tech-nology many of the components originally expected from government. The onlyconclusion that can be made is for the farmers themselves to do the fine tuning andextension program.
In a later visit to six Southeast Asian countries Goodell concluded that exten-sion services were often inadequate, as due to the increasing complexity of irrigatedagriculture, technicians and their supervisors were found to need more training inboth social and intellectual initiative (Goodell 1983). She advised that we must bearin mind that some of the extensionists mistakes can be traced directly to misconcep-tions on the part of researchers. Escalada and Heong (1992) noted farmers living inremote locations were not visited due to few staff, lack of transport, infrequent andwrong timing of visits, extension workers of wrong culture, language semantics, andcompeting messages.
5.15.3 Facilitating the Research-Extension-Farmer Dialogue
A conclusion of another anthropologist that worked with biological scientists is thatthe scientists also have gaps in their knowledge (Bentley 1992c). For example plantbreeders easily become blinded in the search for high yielding types rather than totake the time to perform agriculture like farmers do and grow the crop. Scientiststend to see agriculture in a disciplinary reductionist way, sanitized and confined ina petri dish. Top-down extension messages often are irrelevant to farmers.
Many of the limitations of IPM research in the Third World are often the result ofresearcher isolation and could be alleviated if researchers had more contact with thefarmers whom they hope will adopt their recommendations (Goodell et al. 1982).Recommendations from scientists frequently run counter to the farmers’ best inter-

5 Development of Integrated Pest Management Programs for Rice in Asia 259
ests. IRRI scientists advocated burying the stubble after harvest which farm familiesdepend on for many uses. Extended interaction with farmers and technicians suffi-cient to develop mutual trust can open up scientists to the vast world of farmers’perceptions which bear directly on IPM.
The IPM scientists have numerous ways by which they can enter the world of thesmall-scale farmer for the optimal development of IPM technology. These includeholding small informal field days in which farmers can mix freely with the scientists,offering village level IPM courses through the season attended regularly by the sci-entist or one of his/her assistants, employing the same villagers over and over againin field experiments and surveillance in part to develop a sustained consultation re-lationship with them, requesting that farmers help prepare and test IPM instructionalmaterial and curricula (Goodell 1984a). However the IPM manager should be waryof traditional approaches for linking with the village such as post harvest question-naires that are often unreliable and consultation centered on village headmen who“know” what the outsiders want to hear and in any event are frequently exceptionalfarmers.
Finally the technology is inseparable from the problems and possibilities of ex-tending it to farmers. IPM researchers would find it easier to develop appropriatetechnology if they became more familiar with some extension agents working atthe grassroots level, again by building up a relationship of mutual confidence theresearcher could learn the difficulties that extensionists encounter in discussing IPMwith farmers and perhaps also the obstacles farmers meet in learning from the ex-tensionists (Goodell 1984a).
In Chhattisgarh, India farmers of tribal origins often earn most of their incomefrom foraging in nearby forests rather than from farming thus have been difficult toincorporate into extension activities thus inqueries should be made as to off-farmincome. We cite a another case in point from the C. Luzon farmer training project.The initial assumption of IPM researchers was that because farmers rely on farmingfor their income they will adopt any “appropriate” technology that offers economicbenefits. The findings were somewhat different as interpreted by the anthropologist.Farmers’ disinterest in many technologies the project considers appropriate (oftensubstitution labor for capital costs) is frequently explained by the economic impor-tance of off-farm activities not reported in formal surveys or RRAs. Such off-farmactivities often reduce the relative impact of IPM innovations on the family budget,minimizing extension success. Many important sources of family income are notreadily apparent to outside investigators. Each discipline overemphasizes the con-tribution to the whole family budget of activities relating to it. The project changedby lowering expectations of adoption rates and potential economic benefits of IPMtechnologies.
In Honduras encouraging results came about by the intensive interaction of >500farmers and the fusion of on-farm research and extension (Goodell et al. 1990).This constituted a farmer-scientist-farmer information exchange upon which theprogram’s work depended, with its goal of developing a menu of economically vi-able pest management technologies from which each producer can choose among amenu of technologies to find those that suit their needs and particular resource mix.

260 J.A. Litsinger et al.
The project’s goal was to feed directly into public and private programs servingresource poor farmers rather than undertaking extensive educational campaigns.
Heong and Escalada (1997b) initiated several successful extension projects inAsia to show farmers that they did not have to apply insecticides during the first 40days of the rice crop. They each began with an understanding of farmers’ percep-tions and yield loss caused by insect pests in any given area. Research should bebased on problems defined from farmer perspectives in order to ensure that resultswill be adopted. Farmers live in an environment of conflicting messages regardinguse of pesticides, thus they needed to start from the farmers’ perspectives rather thanthe researcher’s perspectives. Many of farmers’ decisions are based on risk aversionand fear of outbreaks and fear of pests migrating from neighboring farms.
5.15.4 Making a More Effective Extension Program
The main extension method in the 1970s and 1980s was the training and visit sys-tem. In the T & V method, as it was known, extension workers received a programeach week from their supervisors in the top down method. The extension workerlectured to the farmers and demonstrated the week’s featured technology. The majorcriticism of T & V was that the agenda was not decided by farmers. A KAP survey,found that only about 5–20% of the targeted farmers, rarely exceeding 25%, actuallyattended T & V meetings reflecting lack of interest in the topics (Matteson et al.1984). Farmers did not “own” the extension program thus showed little interest.In addition technicians usually ended up talking with farmers individually or inpairs. Structured classes held by technicians appeared to stifle intellectual initiative,becoming lectures rather than an opportunity for the technicians to suggest newideas or bring up particular farmers’ difficulties for discussion and specialist advice.Farmers’ feedback upward into the plant protection research and policy systems wasthus handicapped.
IRRI biological scientists were challenged by anthropologists to take the researchreports “off the shelf” and extend them to farmers. A curriculum was developed foran IPM course for Filipino farmers in seven villages in C. Luzon. Each weeklymeeting lasted four hours over a 13-week period which followed a rice crop fromseedbed preparation to harvest. The effort was made into a research project by test-ing pedagogical methods for teaching farmers to scout their own fields (Goodellet al. 1982). The project compared two extension methods: (i) the current top-downT & V system and (ii) the anthropologist’s bottom-up system where farmers de-cide the material to be presented in the classes. Classes were held in the field aswell. Research showed that IPM skills can be transferred to farmers if an organizedcourse is presented that includes field exercises to raise awareness, followed byweekly follow-up sessions during succeeding crops for farmer group leaders andlocal technicians. Classes were held in a meeting place next to the field and after ashort presentation of a technical subject, the farmers and extension worker went tothe field to diagnose field problems of the moment. Different than T & V’s central

5 Development of Integrated Pest Management Programs for Rice in Asia 261
planning method, this part of the training was determined by pests Nature broughtthat season. This initial testing of this more hands-on learning style, began in 1979,eventually morphed into the farmer field school method some six years later.
The success of the method became apparent as a result of follow-up weekly meet-ings held in the villages during succeeding rice crops. The meetings lasted severalhours and began with the farmers describing what they found while scouting theirfields over the past week. The technician listened to what the farmers had concludedand then all went to the field to verify their findings (problem diagnosis and decisionmaking). By making weekly reports the burden was placed on the farmers to monitortheir own fields and make a group decision on corrective action. Farmers are highlysocial, and a program favoring group decisions produces results. If the farmers didnot diagnose the problem correctly, a lesson was held in the field showing them theright cause and discussing the recommended remedy.
In Table 5.27 we see the results of a farmer group during the second follow-upseason after a 13-week training. These farmers showed good diagnostic skills forproblems they previously encountered. Still new problems arose that had not beencovered in other trainings thus the value of continued follow-up is shown. In thistraining method Nature dictates the subjects for training. Farmers later learned todistinguish the various planthopper species during an unusually heavy infestation ofwhitebacked planthopper. The farmers scored 89% correct problem diagnoses and56% correct decisions on what action to take.
The value of continual follow-up is shown in Table 5.28 which presents the re-sults of the weekly encounters with a farmer group that had only one season offollow-up meetings and no formal class that was used as a control group in the ex-periment. Initially untrained farmers had difficulty in problem diagnosis and wantedto apply insecticides at every turn. Becoming familiar with each pest over severalweeks of practice, farmers gained confidence and proficiency. Initially they thoughtbacterial leaf streak was tungro. Later they thought neck rot was armyworm. La-dybeetles were identified as pests. In weeks 6 and 7 they saw two instances ofleaffolder, one that had densities that were below action thresholds and in week7 there were greater densities. In this way farmers could gauge the difference ina light infestation and a heavier one that would cause losses. Farmers still resistedusing chronic rat baits and prefer acute bait. It was expected that if the sessions werecontinued that each year farmers would continue to improve in both groups. Usingthis model an extension worker could cover two villages a day and eight overallduring a season assuming four days in the field and one in the office.
Unfortunately a personal approach places enormous demands on a developingnation’s limited extension resources. Moreover some successful programs may notbe easily replicable (Matteson et al. 1984). It appears that group learning can beused to advantage in a more unstructured, less authoritarian context. Filipino farm-ers in classes are unsure of themselves, their ability to experiment, and their owncommon sense especially when dealing with a new crop production technology andunfamiliar instructors. In this setting they are uncomfortable when asked to thinkon their own. Frequent group discussions are successful because farmers feel lessthreatened and learn better from their peers by talking and listening rather than by

262 J.A. Litsinger et al.
Table 5.27 Weekly farmer groups’ report to the extension technician from lmbunia village witha farmers’ class in 1980, and one previous follow-up season, Zaragoza, Philippines, 1982 wetseason1
Week aftersowing2
Farmers’ assessment Extension worker’s assessment3
Problem Decision Problem Decision
5 Caseworm Apply insecticide + +Whorl maggot Apply insecticide + +Bacterial leaf
streakNo action + +
Zinc deficiency Broadcast fertilizer + Apply zinc sulfate
6 Yellowing ofleaves
Apply nitrogen + +
Rat damage Use acute rat poison + Use chronic ratpoison
Bacterial leafstreak
No action + +
Whorl maggot Apply insecticide + Keep monitoring
7 Rat damage Use acute rat poison + Use chronic ratpoison
Leaffolder Apply insecticide + Insecticideunnecessary
Echinochloaweed
Apply herbicide + Spot weeding
Monochoriaweed
Apply herbicide + Spot weeding
8 Leaffolder Insecticideunnecessary
+ +
Bacterial leafstreak
No action + +
Yellowing ofleaves
Apply nitrogen + +
9 Leaffolder Insecticideunnecessary
+ +
Hoppers Apply insecticide Whitebackedplanthopper
Insecticideunnecessary
10 Leaffolder Insecticideunnecessary
+ +
11 Spots on stem ofpanicle
Apply insecticide Neck rot Apply fungicide
Problems (no.) 19 19Farmers’ correct
responses89% 53%
1 Farmers’ class 1980, follow-up meetings in 1982 dry season.2 Weeks 1–3 seedbed, 4–6 vegetative, 7–8 reproductive, 9–10 ripening stages.3 + = technican agreed with farmers’ decision.

5 Development of Integrated Pest Management Programs for Rice in Asia 263
Table 5.28 Week farmer groups’ report to the extension technician from Carmen village with onlyone previous follow-up season and no other training, Zaragoza, Philippines, 1982 WS1
Week aftersowing2
Farmers’ assessment Extension worker’s assessment3
Problem Decision Problem Decision
5 Tungro Apply insecticide Bacterial leaf streak Do not applyinsecticide
6 Worms Apply insecticide Semi-looper Insecticideunnecessary
Leaves damaged Apply insecticide Whorl maggot Insecticideunnecessary
Caseworm Apply insecticide + Insecticideunnecessary
Yellowing ofleaves
Apply insecticide Leaffolder Insecticideunnecessary
7 Leaffolder Insecticideunnecessary
+ +
Rat damage Use acute ratpoison
+ Use chronic ratpoison
Bacterial leafstreak
Pesticideunnecessary
+ +
8 Stemborerdeadheart
Apply insecticide + Insecticideunnecessary
Rate damage Use acute ratpoison
+ Use chronic ratpoison
Leaffolder Apply insecticide + Insecticideunnecessary
Bacterial leafstreak
Pesticideunnecessary
+ +
9 Hoppers Apply insecticide Whitebackedplanthopper
+
Leaffolder Insecticideunnecessary
+ +
10 Armyworm Apply insecticide Neck rot Apply fungicideTurtle-like beetle Apply insecticide Ladybeetle predator Do not apply
insecticide
Problems (no.) 16 16Farmers’ correct
responses56% 31%
1 Follow-up meetings in 1982 dry season but no farmers’ class.2 Weeks 1–3 seedbed, 4–6 vegetative, 7–8 reproductive, 9–10 ripening stages.3 + = technican agreed with farmers’ decision.
reading. This sociability in learning meant that technology was rarely criticized dur-ing field interviews with individuals, but those same farmers, responding to the samequestions as members of a group spurred each other to press the questions or issuesfurther. Farmers trained as a group with frequent discussion as they learned best by

264 J.A. Litsinger et al.
talking and listening to their peers. Responding to questions as a part of a group wasless threatening and group reinforcement of concepts. In a society where farmers arenormally timid, obedient, and dependent and associate science with authority theybecome easily uncomfortable.
Farmer field schools developed new and positive motivators for developingcountry farmers through understanding, excitement in learning, and empowerment(Matteson et al. 1994). Methods used have been borrowed from commercial adver-tising, community organizing, and participatory non-formal education. Focus hascentered increasingly on the need to teach IPM knowledge and skills in a con-sciousness and confidence raising framework that changes people’s view of thenatural world. Learning about natural enemies fascinates farmers. Local names aredeveloped as often there are no names in local languages for many of them. Naturalenemy studies are one of the strongest motivators for farmers to change sprayingpractices. Farmers were taught to change their classification system to make dis-tinctions between pests and friendly arthropods as well as monitor pest and naturalenemy abundance. KAP studies that determined some arthropods are used as chil-dren’s toys or group dynamics activities can help break the ice and establish rapport,create awareness, and pave a common consciousness so communication can proceedon less ambiguous grounds (Nazarea-Sandoval 1991).
Conventional top down extension training should be replaced by a more robusttraining process that centers on farmer participation. Adults are most motivated tolearn things that relate directly to their life experience (non-formal education). Inter-est and exhilaration in learning is connected with understanding why things happenas they do and the presentation of knowledge is a tool for action, so that peoplecan change their lives for the better. There is a need for scientists and extensionworkers to become collaborators, facilitators, and consultants, empowering farmersto analyze their own situation, to experiment, and to make constructive choices.Learning should be dynamic and liberating, spurring people who were passive tobecome searchers and innovators. The training process and the relationship betweenextension agent and farmer are changed. Trainers are taught not to answer questionsto appear as “experts” but to ask further leading questions. Trainers give farmersmissing information when needed but only to enable farmers to observe and thinkfor themselves.
References
Adesina, A.A., Johnson, D.E. and Heinrichs, E.A. 1994. Rice pests in the Ivory Coast, West Africa:farmer’s perceptions and management strategies. International Journal of Pest Management 40:293–299.
Adulavidhaya, K., Bhasayavan, N., Chungtes, T., Kirithavip, R., Duangratana, S., Isvilanonda, S.,Janprasert, J., Nakatat, S. and Pisithpun, S. 1979. Constraints to high yields, NorthwesternCentral Plain, Thailand. In: Farm Level Constraints to High Rice Yields in Asia. IRRI, LosBanos, pp. 287–322.
Altieri, M.A. 1984. Pest-management technologies for peasants: a farming systems approach. CropProtection 3:87–94.

5 Development of Integrated Pest Management Programs for Rice in Asia 265
Arida, G.S. and Shepard, B.M. 1987. Walking the rice paddy for pest sampling does not affectyield. International Rice Research Newsletter 12(3):33.
Arraudeau, M. and Harahap, Z. 1986. Relevant upland rice breeding objectives. In: Progress inUpland Rice Research. IRRI, Los Banos, pp. 189–197.
Bandong, J.P. and Litsinger, J.A. 1979. Evaluation of granular insecticides for rainfed wetland ricein the Philippines. International Rice Research Newsletter 4(2):15.
Bandong, J.P. and Litsinger, J.A. 1986. Oviposition of rice whorl maggot on wet seedbeds. Inter-national Rice Research Newsletter 11(1):16–17.
Bandong, J.P. and Litsinger, J.A. 1988. Development of action control thresholds for major ricepests. In: Teng, P.S. and Heong, K.L. (eds), Pesticide Management and Integrated Pest Man-agement in Southeast Asia, CICP/USAID, College Park, Maryland, pp. 95–102.
Bandong, J.P. and Litsinger, J.A. 2005. Rice crop stage susceptibility to the rice yellow stemborerScirpophaga incertulas (Walker) (Lepidoptera: Pyralidae). International Journal of Pest Man-agement 51:37–43.
Bandong, J.P., Canapi, B.L., dela Cruz, C.G. and Litsinger, J.A. 2002. Insecticide decision proto-cols: A case study of untrained Filipino rice farmers. Crop Protection 21:803–816.
Barrion, A.T. and Litsinger, J.A. 1987. Meadow grasshopper Conocephalus longipennis damageto rice spikelets. International Rice Research Newsletter 12(1):18.
Barrion, A.T., Litsinger, J.A., Medina, E.B., Aguda, R.M., Bandong, J.P., Pantua Jr., P.C., Viajante,V.D., dela Cruz, C.G., Vega, C.R., Soriano Jr., J.S., Camanag, E.E., Saxena, R.C., Tryon, E.H.and Shepard, B.M. 1991. The rice Cnaphalocrocis and Marasmia (Lepidoptera: Pyralidae) leaf-folder complex in the Philippines: Taxonomy, bionomics and control. Philippine Entomologist8:987–1074.
Bentley, J.W. 1989. What farmers don’t know can’t help them: The strengths and weaknesses ofindigenous technical knowledge in Honduras. Agriculture and Human Values 6:25–31.
Bentley, J.W. 1992a. Alternatives to pesticides in Central America: Applied studies of local knowl-edge. Culture and Agriculture 44:10–13.
Bentley, J.W. 1992b. The epistemology of plant protection: Honduran campesino knowledge ofpests and natural enemies. In: Gibson, R.W. and Sweetmore, A. (eds), Proceedings of a Seminaron Crop Protection for Resource Poor Farmers, (Copenhagen: Technical Centre for Agricul-tural and Rural Cooperation/Natural Resources Institute, pp. 107–118.
Bentley, J.W. 1992c. Alternatives to pesticides in Central America: Applied studies of local knowl-edge. Culture and Agriculture 44:10–13.
Bentley, J.W. 1994. Facts, fantasies, and failures of farmer participatory research. Agriculture andHuman Values, pp. 140–150.
Bentley, J.W. and Andrews, K.L. 1991. Pests, peasants, and publications: Anthropological andentomological views of an integrated pest management program for small-scale Honduranfarmers. Human Organization 50:113–124.
Bentley, J.W. and Thiele, G. 1999. Bibliography: Farmer knowledge and management of cropdisease. Agriculture and Human Values 16:75–81.
Bentley, J.W. and Rodrıguez, G. 2000. Honduran folk entomology. Current Anthropology 42:285–301.
Bernsten, R.H. 1977. Constraints to Higher Rice Yields in the Philippines. Ph.D dissertation, De-partment of Agricultural Economics, University of Illinois, Urbana-Champaign.
Bjornsen Gurung, A.B. 2003. Insects – a mistake in God’s creation? Tharu farmers’ perceptionand knowledge of insects: A case study of Gobardiha village development committee, Dang-Deukhuri, Nepal. Agriculture and Human Values 20:337–370.
Brosius, J.P., Lovelace, G.W. and Marten, G.G. 1986. Ethnoecology: an approach to understandingtraditional agricultural knowledge. pp. 187–198. In: Marten, G.G. (ed), Traditional Agriculturein Southeast Asia: A Human Ecology Perspective. Westview Press, Boulder, 358 pp.
Brown, B.J. and Marten, G.G. 1986. The ecology of traditional pest management in SoutheastAsia. pp. 241–272. In: Marten, G.G. (ed), Traditional Agriculture in Southeast Asia: A HumanEcology Perspective. Westview Press, Boulder, 358 pp.

266 J.A. Litsinger et al.
Brunold, S. 1981. A survey of pest control practices of small rice farmers in Iloilo Province. Philip-pine Bureau of Plant Industry Plant Protection News 10(3):15–17.
Cendana, S.M. and Calora, F.B. 1967. Insect pests of rice in the Philippines. In: Major Insect Pestsof the Rice Plant. Johns Hopkins Press, Baltimore, Maryland, pp. 591–616.
Chambers, R., Pacey, A. and Thrupp L.A. 1989. Farmer First: Farmer Innovation and AgriculturalResearch. Intermediate Technology Publications, London, 218 pp.
Chaudhary, R.C., Khush, G.S. and Heinrichs, E.A. 1984. Varietal resistance to rice stem-borers inAsia. Insect Science and its Application 5:447–463.
Cohen, J.E., Schoenly, K., Heong, K.L., Justo, H., Arida, G., Barrion, A.T. and Litsinger, J.A.1994. A food web approach to evaluating the effect of insecticide spraying on insect pestpopulation dynamics in a Philippine rice irrigated ecosystem. Journal of Applied Ecology 31:747–763.
Conelly, W.T. 1987. Perception and management of crop pests among subsistence farmers in SouthNyanza, Kenya, In: Tait, J. and Napometh, B. (eds), Management of Pests and Pesticides: Farm-ers Perceptions and Practices. Westview Press, Boulder CO, pp. 198–209.
Cordova, V., Papag, A., Sardido, S. and Yambao L.D. 1981. Changes in practices of rice farmersIn: C. Luzon 1966–1979. 12th Annual Scientific Meeting of the Crop Science Society of thePhilippines, Bacnotan, La Union 22–24 April 1981, 23 pp.
De Datta, S.K. 1981. Principles and Practices of Rice Production. John Wiley, New York, 618 pp.dela Cruz, C.G. and Litsinger, J.A. 1986. Host plant range of the planthopper Nisia atrovenosa.
International Rice Research Newsletter 11(2):26–27.Dresner, E. 1958. A poison bait for the control of Leptocorisa acuta (Thunb.). Journal of Economic
Entomology 51:405.Dyck, V.A., Than Htun, Dulay, A.C., Salinas Jr., G.D. and Orlido, G.C. 1981. Economic injury
levels for rice insect pests. Agriculture Research Journal of Kerala 19:75–85.Escalada, M.M. and Heong, K.L. 1992. Human and social constraints to the implementation of
IPM programmes. 15th Session of the FAO/UNEP Panel of Experts on Integrated Pest Control31 August–4 September 1992, FAO Headquarters, Rome, Italy.
Escalada, M.M. and K.L. Heong. 1993. Communication and implementation of change in cropprotection, In: Crop Protection and Sustainable Agriculture, John Wiley, Chichester, (CibaFoundation Symposium #177), pp. 191–207.
Fajardo, F.F. and Moody, K. 1990. Weed control and related cultural practices for wet-seeded rice(Oryza sativa L.) in Guimba, Nueva Ecija. Philippine Journal of Weed Science 17:51–64.
Fajardo, F.F., Canapi, B.L., Roldan, G.V., Escandor, R.P., Moody, K., Litsinger, J.A. and Mew, T.W.2000. Understanding small-scale rice farmers’ pest perceptions and management practices asa foundation for adaptive research and extension: a case study in the Philippines. PhilippineJournal of Crop Science 25:55–67.
Fernando, C.H., Furtado, J.I. and Lim, R.P. 1980. The ecology of ricefields with special referenceto the aquatic fauna. In: J.I. Furtado (ed), Tropical Ecology and Development, Proceedings ofthe 5th International Symposium of Tropical Ecology, 16–19 April 1979, Part 2, Kuala Lumpur,Malaysia, The International Society of Tropical Agriculture:943–951.
van de Fliert, E. and Matteson, P.C. 1990. Rice integrated pest control training needs identifiedthrough a farmer survey in Sri Lanka. Journal of Plant Protection in the Tropics 7:15–26.
Fujisaka, S. 1990. Rainfed lowland rice: Building research on farmer practice and technical knowl-edge. Agriculture, Ecosystems and Environment 33:57–74.
Fujisaka, S. 1991. What does “build research on farmer practice” mean? Rice crop establishment(beusani) in Eastern India as an illustration. Agriculture and Human Values 8:93–98.
Fujisaka, S. 1993. Were farmers wrong in rejecting a recommendation? The case of nitrogen attransplanting for irrigated rice. Agricultural Systems 43:271–286.
Fujisaka, S., Dapusala, A. and Jayson, E. 1989. Hail Mary, kill the cat: A case of traditionalupland crop pest control in the Philippines. Philippine Quarterly of Culture and Society17:202–211.

5 Development of Integrated Pest Management Programs for Rice in Asia 267
Fujisaka, S., Kirk, G., Litsinger, J.A., Moody, K., Nasrul, H., Adly, Y., Firdos, N., Tasmin, N.,Farida, A., Abdul, A., Winardi, K., and Yustisia. 1991. Wild pigs, poor soils, and upland rice:A diagnostic survey of Sitiung, Sumatra, Indonesia. IRRI Research Paper Series No. 155: 1–9.
Gabriel, T. 1989. Pest control, pest management and the ‘human factor’. Tropical Pest Management35:254–256.
Gallagher K.D., Kenmore, P.E. and Sogawa, K. 1994. Judicial use of insecticides deter planthopperoutbreaks and extend the role of resistant varieties in Southeast Asian rice. pp. 599–614. In:Denno, R.F. and Perfect, T.J. (eds), Planthoppers Their Ecology and Management, Chapmanand Hall, London, 772 pp.
Glass, E.H. and Thurston, H.D. 1978. Traditional and modern crop protection in perspective. Bio-science 28:109–117.
Goodell, G. 1983. Improving administrators’ feedback concerning extension, training and researchrelevance at the local level: new approaches and findings from Southeast Asia. AgriculturalAdministration 13:39–55.
Goodell, G. 1984a. Challenges to international pest management research and extension in theThird World: Do we really want IPM to work? Bulletin Entomological Society of America.30:18–26.
Goodell, G.E. 1984b. Bugs, bunds, banks, and bottlenecks: organizational contradictions in thenew rice technology. Economic Development and Cultural Change 33:23–41.
Goodell, G.E., Kenmore, P.E., Litsinger, J.A., Bandong, J.P., dela Cruz, C.G. and Lumaban, M.D.1982. Rice insect pest management technology and its transfer to small-scale farmers in thePhilippines. pp. 25–41, In: Report of an Exploratory Workshop on the Role of Anthropologistsand other Social Scientists in Interdisciplinary Teams Developing Improved Food ProductionTechnology. IRRI and the Division for Global and Inter-regional Projects, UNDP, 101 pp.
Goodell, G., Andrews, K.L. and Lopez, J.I. 1990. The contributions of agronomo-anthropologiststo on-farm research and extension in integrated pest management. Agricultural Systems 32:321–340.
Grist, D.H. and Lever, R.J.A.W. 1969. Pests of Rice. Longmans, London, 520 pp.Haskell, P.T., Beacock, T. and Wortley, P.J. 1980. World wide socio-economic constraints to crop
production. In: Kommedahl, T. (ed), Proceedings of Symposia IX International Congress ofPlant Protection, Washington DC, August 5–11, 1979. Vol. I. Plant Protection: FundamentalAspects, pp. 39–41.
Heinrichs, E.A. and Mochida, O. 1984. From secondary to major pest status: The case of insec-ticide induced rice brown planthopper, Nilaparvata lugens, resurgence. Protection Ecology 7:201–218.
Heinrichs, E.A., Medrano, F.G., Rapusas, H.R., Vega, C., Medina, E., Romena, A., Viajante, V.,Sunio, L., Domingo, I. and Camanag, E. 1985. Insect pest resistance of IR5-IR62. InternationalRice Research Newsletter 12(10):6.
Heong, K.L. 1984. Pest control practices of rice farmers in Tanjong Karang, Malaysia. Insect Sci-ence and its Application 5:221–226.
Heong, K.L. 1998. IPM in developing countries: Progress and constraints in rice IPM. In: Za-lucki, M. Drew, R. and White, G. (eds), Proceedings Sixth Australasian Applied EntomologicalResearch Conference, University of Queensland, Brisbane, pp. 68–77.
Heong, K.L. 1999. From research-to-farmer practice: A case study in rice pest management. In:Ladha, J.K. and Denning, G.L. (eds), Resource Management in Rice Systems: Nutrients, IRRI,Los Banos, Philippines, pp. 199–211.
Heong, K.L. and Escalada, M.M. 1997a. Perception change in rice pest management: a case studyof farmers’ evaluation of conflict information. Journal of Applied Communications 81:3–17.
Heong, K.L. and Escalada, M.M. 1997b. A comparative analysis of pest management practices ofrice farmers in Asia. pp. 227–245, In: Heong, K.L. and Escalada, M.M. Pest Management ofRice Farmers in Asia. IRRI, Los Banos, 245 pp.
Heong, K.L. and Escalada, M.M. 1999. Quantifying rice farmers’ pest management decisions:Beliefs and subjective norms in stem borer control. Crop Protection 18:315–322.

268 J.A. Litsinger et al.
Heong, K.L. and Ho, N.K. 1987. Farmers’ perceptions of the rice tungro virus problem in theMuda Irrigation Scheme, Malaysia. pp. 165–174. In: Tait, J. and Napompeth, B. (eds), WestviewStudies in Insect Biology, Westview Press, London, 244 pp.
Heong, K.L., Escalada, M.M. and Lazaro, A.A. 1992. Pest Management Practices of Rice Farmersin Leyte, Philippines. Rice IPM Network, IRRI, Los Banos, Philippines, 56 pp.
Heong, K.L., Escalada, M.M. and Vo Mai. 1994. An analysis of insecticide use in rice: case studiesin the Philippines and Vietnam. International Journal of Pest Management 40:173–178.
Heong, K.L., Nguyen Thi, T.C., Nguyen, B., Fujisaka, S. and Bottrell, D.G. 1995a. Reducingearly-season insecticide applications through farmers’ experiments in Vietnam. In: Vietnamand IRRI: A Partnership in Rice Research, IRRI and Ministry of Agriculture and Food Industry,Hanoi, Vietnam, pp. 217–222.
Heong, K.L., Escalada, M.M. and Lazaro, A.A. 1995b. Misuse of pesticides among rice farmers inLeyte, Philippines. pp. 97–108, In: Pingali, P.L. and Roger, P.A. (eds), Impact of Pesticides onFarmer Health and the Rice Environment, IRRI, Los Banos, 664 pp.
Heong, K.L., Escalada, M.M., Sengsoulivong, V. and Schiller, J. 2002. Insect managementbeliefs and practices of rice farmers in Laos. Agriculture Ecosystems & Environment 92:137–145.
Hobbs, P.R., Hettel, G.P., Singh, R.P., Singh, Y., Harrington, L.W. and Fujisaka, S. 1991. Rice-wheat cropping systems in the Tarai areas of Nainital, Rampur, and Pilibhit Districts in UttarPradesh, India: Diagnostic surveys of farmers’ practices and problems, and needs for furtherresearch. ICAR/GBPUAT/CIMMYT/IRRI publication, Mexico D.F.
Hu, R., Cheng, J., Dong, S. and Sun, Y. 1997. The role of women in rice pest management inZhejiang, China. pp. 63–73, In: Heong, K.L. and Escalada, M.M. (eds), Pest Management ofRice Farmers in Asia. IRRI, Los Banos, 245 pp.
Hunn, E. 1982. The utilitarian factor in folk biological classification. American Anthropologist 84:830–847.
Indira Ghandi Agricultural University (IGAU). 1997. Pilot project on technology assessment andrefinement through the Institution-Village Linkage Programme. Project Proposal (1996–1997),Indira Gandhi Agricultural University, Raipur.
International Rice Research Institute (IRRI). 1964. Entomology Department. pp. 119–134, In: IRRIAnnual Report for 1963, Los Banos, Laguna, 302 pp.
International Rice Research Institute (IRRI). 1979. Farm Level Constraints to High Rice Yields inAsia. IRRI, Los Banos, Laguna.
International Rice Research Institute (IRRI). 1985. International Rice Research: 25 Years of Part-nership, Los Banos, 188 pp.
Jahn, G.C., Sophea, P., Bunnarith, K. and Chanthy, P. 1997. Pest management practices of low-land rice farmers in Cambodia. pp. 35–51. In: Heong, K.L. and Escalada, M.M. (eds), PestManagement of Rice Farmers in Asia, IRRI, Los Banos, 245 pp.
Jahn, G.C., Litsinger, J.A., Chen, Y. and Barrion, A.T. 2007. Integrated Pest Management of Rice:Ecological Concepts. pp. 315–366, In: Koul, O. and Cuperus G.W. (eds), Ecologically BasedIntegrated Pest Management, CAB International, Wallingford, 462 pp.
Joyce, R.J.V. 1985. Migrant pests. In: Haskell, P.T. (ed), Pesticide Application: Principles andPractice. Oxford Science Publication, pp. 322–353.
Kenmore, P.E., Heong, K.L. and Putter, C.A. 1985. Political, social and perceptual aspects ofintegrated pest management programmes. In: Lee, B.S., Loke, W.H. and Heong, K.L. (eds),Proceedings of a Seminar on Integrated Pest Management in Malaysia. Malaysian Plant Pro-tection Society, Kuala Lumpur, pp. 47–67.
Kenmore, P.E., Litsinger, J.A., Bandong, J.P., Santiago, A.C. and Salac, M.M. 1987. Philippine ricefarmers and insecticides in thirty years of growing dependency and new options for change.pp. 98–108. In: Tait, J. and Napompeth, B. (eds), Management of Pests and Pesticides: Farm-ers’ Perceptions and Practices. Westview Studies in Insect Biology, Westview Press, London,244 pp.
Khush G.S. 1977. Disease and insect resistance in rice. Advances in Agronomy 29:265–341.

5 Development of Integrated Pest Management Programs for Rice in Asia 269
Khush, G.S. 1989. Multiple disease and insect resistance for increased yield stability in rice. In:Progress in Irrigated Rice Research, IRRI Los Banos, pp. 79–92.
Koganezawa, H. 1998. Present status of controlling rice tungro virus. In: Hadidi, A.Khetarpal, R.K. and Koganezawa, H. (eds), Plant Virus Disease Control, American Phy-topathological Society, St. Paul, MN, pp. 459–469.
Lazaro, A.A., Rubia, E.G., Almazan, L.P. and Heong, K.L. 1993. Farmers’ estimates of percentwhiteheads. IRRI Rice Research Notes 18(4):31.
Lee, S.C., Alvenda, M.E., Bonman, J.M. and Heinrichs, E.A. 1986. Insects and pathogens associ-ated with rice grain discoloration and their relationship in the Philippines. Korean Journal ofPlant Protection 25:107–112.
Litsinger, J.A. 1989. Second generation insect pest problems on high yielding rices. Tropical PestManagement 35:235–242.
Litsinger, J.A. 1993. A farming systems approach to insect pest management for upland and low-land rice farmers in tropical Asia. pp. 45–101, In: Altieri, M.A. (ed), Crop Protection Strategiesfor Subsistence Farmers. Westview Studies in Insect Biology. Westview Press, Boulder, CO,197 pp.
Litsinger, J.A. 1994. Cultural, mechanical, and physical control of rice insects. In Heinrichs, E.A.(ed), Biology and Management of Rice Insects. Wiley Eastern Ltd., New Delhi, pp. 549–584.
Litsinger, J.A. 2008a. Areawide rice insect pest management: A perspective of experiences inAsia. pp. 351–440. In: Koul, O., Cuperus, G. and Elliott, N. (eds), Areawide Pest Management:Theory and Implementation, CABI, Wallingford, 590 pp.
Litsinger, J.A. 2008b. When is a rice insect a pest: Yield loss and the Green Revolution (Citationis Chapter 16 in this book).
Litsinger, J.A. and Bandong, J.P. 1992. Response of the rice caseworm Nymphula depunctalis(Guenee) to insecticides. Journal of Plant Protection in the Tropics 9:169–177.
Litsinger, J.A. and Ruhendi. 1984. Rice stubble and straw mulch suppression of preflowering insectpests of cowpeas sown after puddled rice. Environmental Entomology 13:509–514.
Litsinger, J.A. and Moody, K. 1976. Integrated pest management of multiple cropping sys-tems. pp. 293–316, In Papendick, R.I., Sanchez, P.A. and Triplet, G.B. (eds), Multiple Crop-ping. Special Publication No. 27. American Society of Agronomy, Madison, Wisconsin.378 pp.
Litsinger, J.A., Price, E.C., Herrera, R.T., Bandong, J.P., Lumaban, M.D., Quirino, C.B. andCastillo, M.B. 1977. Introducing pest control technology to a low management crop: Themungbean example in the Philippines. pp. 183–191. In: Proceedings of the First InternationalSymposium on Mungbean, August 16–19, 1977. Los Banos, Philippines. Asian Vegetable Re-search and Development Center, Tainan, Taiwan, 262 pp.
Litsinger, J.A., Price, E.C. and Herrera, R.T. 1980. Small farmer pest control practices for rainfedrice, corn, and grain legumes in three Philippine provinces. Philippine Entomologist 4:65–86.
Litsinger, J.A., Canapi, B. and Alviola, A. 1982. Farmer perception and control of rice pests inSolana, Cagayan Valley, a pre-green revolution area of the Philippines. Philippine Entomologist5:373–383.
Litsinger, J.A., Apostol, R.F. and Obusan, M.B. 1983. White grub, Leucopholis irrorata(Coleoptera: Scarabaeidae): Pest status, population dynamics, and chemical control ina rice-maize cropping pattern in the Philippines. Journal of Economic Entomology 76:1133–1138.
Litsinger, J.A., Canapi, B.L., Bandong, J.P., dela Cruz, C.G., Apostol, R.F., Pantua, P.C., Lumaban,M.D., Alviola III, A.L., Raymundo, F., Libetario, E.M., Loevinsohn, M.E. and Joshi, R.C. 1987.Rice crop loss from insect pests in wetland and dryland environments of Asia with emphasison the Philippines. Insect Science and its Application 8:677–692.
Litsinger, J.A., Bandong, J.P. and Chantaraprapha, N. 1994. Mass rearing, larval behaviour, andeffects of plant age on the rice caseworm Nymphula depunctalis (Guenee) (Lepidoptera: Pyral-idae). Crop Protection 13:494–502.

270 J.A. Litsinger et al.
Litsinger, J.A., Gyawali, B.K. and Wilde, G.E. 1998. Feeding behaviour of the rice bug Leptocorisaoratorius (F.) (Hemiptera: Alydidae). Journal of Plant Protection in the Tropics 11:23–35.
Litsinger, J.A., Hasse, V., Barrion, A.T. and Schmutterer, H. 1991. Response of Oriental maizeborer Ostrinia furnacalis (Guenee) (Lepidoptera: Pyralidae) to intercropping. EnvironmentalEntomology 20:988–1004.
Litsinger, J.A., Libetario, E.M. and Barrion, A.T. 2003. Early planting and overseeding in thecultural control of rice seedling maggot Atherigona oryzae Malloch in the Philippines. Inter-national Journal of Pest Management 49:57–69.
Litsinger, J.A., Bandong, J.P., Canapi, B.L., dela Cruz, C.G., Pantua, P.C., Alviola III, A.L. andBatay-an, E. 2005. Evaluation of action thresholds against chronic insect pests of rice in thePhilippines: I. Less frequently occurring pests and overall assessment. International Journal ofPest Management 51:45–61.
Litsinger, J.A., Bandong, J.P., Canapi, B.L., dela Cruz, C.G., Pantua, P.C., Alviola III, A.L. andBatay-an, E. 2006a. Evaluation of action thresholds against chronic insect pests of rice in thePhilippines: IV. Stemborers. International Journal of Pest Management 52:194–207.
Litsinger, J.A., Bandong, J.P., Canapi, B.L., dela Cruz, C.G., Pantua, P.C., Alviola III A.L.,Batay-an, E. 2006b. Evaluation of action thresholds against chronic insect pests of rice inthe Philippines: II. Whorl maggot and defoliators. International Journal of Pest Management52:167–180.
Litsinger, J.A., Bandong, J.P., Canapi, B.L., dela Cruz, C.G., Pantua, P.C., Alviola III A.L. andBatay-an, E. 2006c. Evaluation of action thresholds against chronic insect pests of rice in thePhilippines: III. Leaffolders. International Journal of Pest Management 52:181–194.
Loevinsohn, M.E., Bandong, J.P., Alviola, A.L. and Litsinger, J.A. 1993. Asynchrony of cultiva-tion among Philippine rice farming: causes and prospects for change. Agricultural Systems 41:419–439.
Marciano, V.P., Mandac, A.M. and Flinn, J.C. 1981. Insect management practices of rice farmersin Laguna. Philippine Journal of Crop Science 6:14–20.
Matteson, P.C., Altieri, M.A. and Gagne, W.C. 1984. Modification of small farmer practices forbetter pest management. Annual Review of Entomology 29:383–402.
Matteson, P.C., Gallagher, K.D. and Kenmore, P.E. 1994. Extension of integrated pest managementfor planthoppers in Asian irrigated rice: Empowering the user. pp. 656–685. In: R.F. Dennoand T.J. Perfect (eds), Planthoppers: Their Ecological Management. Chapman and Hall, NY,799 pp.
Moody, K. 1977. Weed control in rice. In: 5th Biotrop Weed Science Training Course, 14November–23 December 1977, Rubber Research Institute, Kuala Lumpur, pp. 374–424.
Moody, K. 1990. Pest interactions in rice in the Philippines. In: Grayson, B.T. (ed), Pest Manage-ment in Rice, pp. 269–299.
Moody, K. 1994. Farm environment assessment: A tool for weed research planning and implemen-tation. Philippine Journal of Weed Science, Special Issue 12–28.
Moore, W.S., Profita, J.C. and Koehler, C.S. 1979. Soaps for home landscape insect control.California Agriculture 33:3–14.
Morse, S. and Buhler, W. 1997. IPM in developing countries: The danger of an ideal. IntegratedPest Management Reviews 2:175–185.
Mumford, J.D. and Norton, G.A. 1984. Economics of decision making in pest management. AnnualReview of Entomology 29:157–174.
Nagata, T. and Mochida, O. 1984. Development of insecticide resistance and tactics for preven-tion. pp. 93–106, In: Proceedings of the FAO/IRRI Workshop on Judicious and Efficient Use ofInsecticides on Rice. IRRI, Los Banos, 180 pp.
Nataatmadja, H., Tjitropranoto, P., Bernsten, R.H., Bagyo A.S. and Hurun A.M. 1979. Constraintsto high yields in Subang, West Java, Indonesia. pp. 97–121. In: Farm Level Constraints to HighRice Yields in Asia. 1979. IRRI, Los Banos.
Nazarea-Sandoval, V.D. 1991. Ethnoagronomy and ethnogastronomy: on indigenous typology anduse of biological resources. Agriculture and Human Values 8:121–131.
5 Development of Integrated Pest Management Programs for Rice in Asia 271
Nazarea-Sandoval, V.D. and Rhoades, R.E. 1994. Rice, reason, and resistance: a comparative studyof farmers’ vs. scientists’ perceptions and strategies. pp. 559–575, In: Zeigler, R.S., Leong, S.A.and Teng, P.S. (eds), Rice Blast Disease, CAB International, Wallingford, 626 pp.
Nesbitt, H.J., Hickery, A., and Phirum, I. 1996. Adulterated pesticides in Cambodia. InternationalRice Research Newsletter 21(1):51.
Norton, G.A. 1993. Philosophy, concepts, and techniques. pp. 1–21. In: Norton, G.A. andMumford, J.D. Decision Tools for Pest Management, CAB International, Wallingford.
Norton, G.A. and Mumford, J.D. 1993. Decision Tools for Pest Management, CAB International,Wallingford.
Ooi, P.A.C. 1996. Experiences in educating rice farmers to understand biological control. Ento-mophaga 41:375–385.
Ooi, P.A.C. and Shepard, B.M. 1994. Predators and parasitoids of rice insect pests. pp. 585–611.In: Heinrichs, E.A. (ed), Biology and Management of Rice Insects, Wiley Eastern Ltd., NewDelhi, 779 pp.
Palis, F.G. 1998. Changing farmers’ perceptions and practices: the case of insect pest control in C.Luzon, Philippines. Crop Protection 17:599–607.
Palis, F., Pingali, P. and Litsinger, J. 1990. Multiple pest thresholds for rice production: the case ofthe Philippines. pp. 93–117 in Proceedings of the Conference on Integrated Pest Managementin Tropical and Subtropical Cropping Systems, Frankfurt, Germany. Deutsche Landwirtschafts-Gesellschaft No. 1.
Pathak, M.D. and Dyck, V.A. 1973. Developing an integrated method of rice insect pest control.PANS (Pest Articles and News Summaries) 19:534–544.
Pedigo, L.P., Hutchins, S.H. and Higley, L.G. 1986. Economic injury levels in theory and practice.Annual Review of Entomology 31:341–368.
Perfect, T.J. and Cook, A.G. 1982. Diurnal periodicity of flight in some Delphacidae and Cicadel-lidae associated with rice. Ecological Entomology 7:317–326.
Philippine Bureau of Plant Industry. 1978. Proceedings Regional Training Seminar on IntegratedPest Control for Irrigated Rice in South and Southeast Asia, October 16-November 18, 1978,Manila Philippines. FAO, USAID, and the Philippine Bureau of Plant Industry.
Pineda, R., Duff, B., Heinrichs, E.A. and Carbonell, P. 1984. Insect control practices on irrigatedand rainfed rice farms in Nueva Ecija, Philippines. The Consequences of Small Rice FarmMechanization Project. Working Paper No. 102: 1–19, IRRI, Los Banos, Philippines.
Pingali, P.L. and Roger, P.A. 1995. Impact of Pesticides on Farmer Health and the Rice Environ-ment, IRRI, Los Banos, Philippines, 664 pp.
Pingali, P.L., Moya, P.F. and Velasco, L.E. 1990. The Post-Green Revolution Blues in Asian RiceProduction. IRRI Social Science Division Papers, No. 90, Los Banos, 1–33 pp.
Price, L.L. 2001. Demystifying farmers’ entomological and pest management knowledge: Amethodology for assessing the impacts on knowledge from IPM-FFS and NES interventions.Agriculture and Human Values 18:153–176.
Price, L.L. and Bjornsen Gurung, A.B. 2006. Describing and measuring ethno-entomologicalknowledge of rice pests: tradition and change among Asian rice farmers. Environment, De-velopment & Sustainability 8:507–517.
Prill-Brett, J. 1986. The Bontok: traditional wet-rice and swidden cultivators of the Philippines.pp. 54–84. In: Marten, G.G. (ed), Traditional Agriculture in Southeast Asia: A Human EcologyPerspective, Westview Press, Boulder, 358 pp.
Rao, A.N. and Moody, K. 1988. Weed control in rice seedling nurseries. Crop Protection 7:202–206.
Rapusas, H.R., Schiller, J.M. and Sengsoulivong, V. 1997. Pest management practices of ricefarmers in the rainfed lowland environment of the Lao PDR. pp. 99–114. In: Heong, K.L. andEscalada, M.M. (eds), Pest Management of Rice Farmers in Asia, IRRI, Los Banos, 245 pp.
Reichelderfer, K.H. and Bottrell, D.G. 1985. Evaluating the economic and sociological implica-tions of agricultural pests and their control. Crop Protection 4:281–297.
Reissig, W.H., Heinrichs, E.A., Litsinger, J.A., Moody, K., Fiedler, L., Mew, T.W. and Barrion.A.T. 1986. Illustrated Guide to Integrated Pest Management in Rice in Tropical Asia. IRRI,Los Banos.

272 J.A. Litsinger et al.
Rola, A.C. and Pingali, P.L. 1993. Pesticides, Rice Productivity, and Farmers’ Health: An Eco-nomic Assessment. IRRI and World Resources Institute, 100 pp.
Rola, A.C., Chupungco, A.R., Adalla, C.B., Hoque, M.M., Stuart, T.H. and Sumayao, B.R. 1988.Results of the Benchmark Survey. Integrated Pest Management and Extension and WomenProject. University of the Philippines at Los Banos.
Rubia, E.G., Ferrer, E.R. and Shepard, B.M. 1990. Biology and predatory behavior of Cono-cephalus longipennis (de Haan) (Orthoptera: Tettigoniidae). Journal of Plant Protection in theTropics 7:47–54.
Rubia, E.G., Lazaro, A.A., Heong, K.L., Diah, N. and Norton, G.A. 1996. Farmers’ perceptions ofthe white stem borer Scirpophaga innotata (Walker), in Cilamaya, West Java, Indonesia. CropProtection 4:327–333.
Savary, S., Elazequi, F.A., Moody, K., Litsinger, J.A. and Teng, P.S. 1994. Characterization ofrice cropping practices and multiple pest systems in the Philippines. Agricultural Systems 46:385–408.
Schoenly, K.G., Cohen, J.E., Heong, K.L., Arida, G.S., Barrion, A.T. and Litsinger, J.A. 1996.Quantifying the impact of insecticides on food web structure of rice-arthropod populations ina Philippine farmer’s irrigated field: A case study. In: Polis, G.A. and Winemiller, K.O. (eds),Food Webs: Integration of Patterns and Dynamics. Chapman & Hall, NY, pp. 343–351.
Settle, W.H., Hartiahyo, A., Endah, Tri, A., Widyastama, C., Arief, Lukman H., Dadan, H., Al-ifah, Sri L. and Pajarningsih, S. 1996. Managing tropical rice pests through conservation ofgeneralist natural enemies and alternative prey. Ecology 77:1975–1988.
Shao-Shi, L., Yu-Jie, G., Guo-Wen, H. and Di-Yun, L. 1997. Pest management practices of ricefarmers in Hunan, pp. 53–61. In: Heong, K.L. and Escalada, M.M. (eds), Pest Management ofRice Farmers in Asia. IRRI, Los Banos, 245 pp.
Shepard, B.M., Ferrer, E.R. and Kenmore, P.E. 1988. Sequential sampling of planthoppers andpredators in rice. Journal of Plant Protection in the Tropics 5:39–44.
Sivakumar, S.D., Subramanian, S.R., Suresh, S. and Gopalan, M. 1997. Pest management practicesof rice farmers in Tamil Nadu, India. pp. 75–85, In: Heong, K.L. and Escalada, M.M. (eds), PestManagement of Rice Farmers in Asia, IRRI, Los Banos.
Smith, J., Litsinger, J.A., Bandong, J.P., Lumaban, M.D. and dela Cruz, C.G. 1988. Economicthresholds for insecticide application to rice: Profitability and risk analysis to Filipino farmers.Journal of Plant Protection in the Tropics 6:67–87.
Smith, R.F. 1972. The impact of the green revolution on plant protection in tropical and subtropicalareas. Bulletin of the Entomological Society of America 18:7–14.
Stern, V.M., Smith, R.F., van den Bosch, R. and Hagen, K.S. 1959. The integration of chemicaland biological control of the spotted alfalfa aphid. The integrated control concept. Hilgardia29:81–101.
Tait, E.J. 1983. Pest control decision making on Brassica crops. Advances in Applied Biology 8:121–188.
Tait, J. and Banpot N. 1987. Management of Pests and Pesticides: Farmers’ Perceptions and Prac-tices. Westview Studies in Insect Biology, Westview Press, London, 244 pp.
Tejada, A.W. and Magallona, E.D. 1985. Fate of carbosulfan in a rice paddy environment. Philip-pine Entomologist 6:255–273.
Thurston, H.D. 1990. Plant disease management practices of traditional farmers. Plant Disease 74:96–102.
Thurston, H.D. 1998. Assessing indigenous and traditional knowledge in farming systems.pp. 541–558. In: Zeigler, R.S., Leong, S.A. and Teng, P.S. (eds), Rice Blast Disease, CABInternational, Wallingford, UK, 626 pp.
Tjornhom, J.D., Norton, G.W. Heong, K.L., Talekar, N.S. and Gapud, V.P. 1997. Determinants ofpesticide misuse in Philippine onion production. Philippine Entomologist 11:139–149.
Trutmann, P., Voss, J. and Fairhead, J. 1993. Management of common bean diseases by farmers inthe Central African Highlands. International Journal of Pest Management 39:334–342.
Waibel, H. 1986. The economics of integrated pest control in irrigated rice: A case study from thephilippines. Crop Protection Monographs, Springer-Verlag, Berlin, 196 pp.

5 Development of Integrated Pest Management Programs for Rice in Asia 273
Warburton, H., Palis, F.G. and Pingali, P.L. 1995. Farmer perceptions, knowledge, and pesticideuse practices. In: Pingali, P.L. and Roger, P.A. (eds), Impact of Pesticides on Farmer Healthand the Rice Environment, IRRI, Los Banos, pp. 59–95.
Warren, D.M. 1989. Linking scientific and indigenous agricultural systems. pp. 153–170. In:Compton, J.L. The Transformation of International Agricultural Research and Development,Lynne Reineer Publishers, Boulder, Colorado 237 pp.
Watson, G.A. and Mahrita, W. 1985. Farmers’ local and traditional rice crop protection techniques:some examples from coastal swamplands, Kalimantan, Indonesia. Indonesian Agriculture andResearch Development Journal 7:25–30.
Way, M.J. and Heong, K.L. 1994. The role of biodiversity in the dynamics and managementof insect pests of tropical irrigated rice – a review. Bulletin of Entomological Research 84:567–587.
Widodo, S., Nasrullah, Prajitno, D. Sumartono, Sudjono, S. Sumangat, Mudjito P.S., Wurjono,and Widodo. 1979. Identifying constraints to higher rice yields in Yogykarta, Indonesia.pp. 123–161. In: Farm Level Constraints to High Rice Yields in Asia. 1979. IRRI, Los Banos.
Zandstra, H.G., Price, E.C., Litsinger, J.A. and Morris, R.A. 1981. A Methodology for On-FarmCropping Systems Research. International Rice Research Institute, Los Banos, 149 pp.
Zelazny, B, Chiarappa, L. and Kenmore, P. 1985. Integrated pest control in developing countries.FAO Plant Protection Bulletin 33:147–158.

Chapter 6Implementing Integrated Pest Managementin Developing and Developed Countries
B.M. Shepard, M.D. Hammig, G.R. Carner, P.A.C. Ooi, J.P. Smith, R. Diltsand A. Rauf
Abstract Integrated Pest Management (IPM) systems in developed countries arelargely based on substantial bodies of available information from a number ofsources, including published material, extension agents, contract crop consultantsand, more recently, the internet. Delivery systems for this information have tra-ditionally been through extension agents in the USA but the internet is playing alarger role. IPM in developing countries, such as those in Southeast Asia, has beenaddressed most effectively through massive training of farmers through farmer fieldschools and farmer participatory research in the region. S.E. Asia is characterizedby large numbers of farmers cultivating small plots. Production systems involvesubstantial amounts of labor inputs, which often put farm laborers at risk from ex-posure to harmful chemicals. Mechanical devices that replace labor in developedcountries are not common in the S.E. Asia region. Technological advances havemade an impact mainly through improved plant varieties and cultural practices toenhance yields. IPM training has taken hold throughout the region as a means toestablish the farmer as the primary decision-maker and to equip him or her withan understanding of the critical relationship between agricultural output and fieldecology. Training programs in all S.E. Asian countries are aggressively spreadingthe message to “grow a healthy crop” as the first step in establishing sound IPMprograms. Results from some IPM programs are presented and discussed but the listis not all inclusive and is always evolving and changing with the farmers’ crop mixand increased knowledge of the agricultural ecosystem.
Keywords Integrated Pest Management · IPM · developing countries · developedcountries · farmer field schools · farmer participatory research · IPM tactics
B.M. Shepard (B)Clemson University, Coastal Research and Education Center, 2700 Savannah Highway,Charleston, South Carolina, 29414, USAe-mail: [email protected]
R. Peshin, A.K. Dhawan (eds.), Integrated Pest Management: Disseminationand Impact, DOI 10.1007/978-1-4020-8990-9 6,C© Springer Science+Business Media B.V. 2009
275

276 B.M. Shepard et al.
6.1 Introduction
Much has been written on the subject of integrated pest management (IPM) over thepast 40 years. As one might expect, most of the published literature is focused onIPM in developed countries (Dent 1991, Kogan 1998, Metcalf and Luckman 2004,Pedigo 1989, Pimentel 1991, Olsen et al. 2003, Smith and Reynolds 1966, CAST2003, and others). More recent publications deal with “globalizing” IPM (Nortonet al. 2005, Maredia et al. 2003) with examples from several parts of the developingworld. This chapter will draw heavily on the authors’ experiences in S.E. Asia andthe USA for the comparisons between implementing IPM in developing and devel-oped countries. Examples presented, however, are not all inclusive and methods andtechniques are evolving and changing as IPM systems, worldwide, are refined.
6.2 Implementing IPM in Developed Countries
The impetus for developing IPM programs in the USA came from problems andconcerns from overuse of chemical pesticides which was highlighted in RachelCarson’s book Silent Spring (Carson 1962). As early as 1959, Stern et al. empha-sized the need for integrating various control tactics in a classic publication entitled“The Integrated Control Concept”. As Olsen et al. (2003) pointed out, IPM has overa 40 year history in the USA that combines biological, cultural and chemical tech-niques into an ecologically sustainable system. This chapter barely touches upondevelopment of IPM in the USA because this is so well documented elsewhere.Instead we will emphasize development and implementation of IPM in developingcountries, with major emphasis on Indonesia.
Implementation of IPM in developed and developing countries requires com-pletely different approaches. Many mistakes have been made using developedcountry models that simply do not work in a developing country context. First, theinfrastructure, extension, information and delivery systems are usually not availablein developing countries. Developed countries have highly sophisticated extensionand information systems readily available to farmers. Also, even if developing coun-ties have extension agents or other agricultural agents, they are limited in number,superficially trained, and often provide only token services to large coverage areas.Also, developed countries have access to information via various published media,agricultural extension agents and the internet. In contrast, many rural agriculturalvillages in S.E. Asia have only recently gotten electricity. Developed country IPMprograms are built on years of research information. This information is generatedby US Land Grant Universities, the US Department of Agriculture, private industryand other national and international research institutions. Various tactics includethe use of high-yielding varieties with resistances against various diseases and in-sect pests, field monitoring to determine action or economic thresholds, and highlyregulated pesticide testing, sales, and disposal systems. Some crop production in-dustries have their own crop protection specialists that conduct research on variouscommodities.

6 Implementing Integrated Pest Management in Developing and Developed Countries 277
A review of IPM in the USA is presented by Olsen et al. (2003). Maredia et al.(2003) provided an overview of IPM in the global arena. A major impetus to the IPMapproach in the USA was initiated in 1972 through support from NSF, EPA and USDAfor research in five major crops and pine forests. This effort, called the “HuffakerProject”, lasted for 6 years and was continued for 6 more years as the “AdkissonProject” funded by EPA, and USDA/CSRS. It required close collaboration betweenteams of agronomists, ecologists, economists, entomologists, plant pathologists andsystems analysts from 18 land-grant institutions. Pimentel’s three volume Handbookof Agricultural Pest Management summarized the state of IPM at that time (Pimentel1991). Seven of the 8 commodities under the Huffaker/Adkisson projects showed adecrease in production costs and yields increased for six out of the eight commodities(Olsen et al. 2003). Risks of crop loss decreased in the three commodities where thiswas evaluated (Norton and Mullen 1994).
In general, pesticides are still overused by farmers in both developed and devel-oping countries. The propensity to apply pesticides when not needed seems to makefarmers feel better about their crops even though serious problems frequently arise,such as resistance, resurgence and negative impacts such as contamination of watersupplies, and harm to non-target species such as pollinators, predators, parasitoidsand humans (Kishi 2002, Murphy et al. 1999). In the Southeastern USA, applica-tions of insecticides actually caused resurgences of several species of lepidopteranpests of soybean (Shepard et al. 1977). The most likely cause for this rapid increasein pest populations was destruction of natural enemies. Therefore, it is important tounderstand that application of chemical insecticides, whether targeting pod and stemborers or foliage feeders, may cause non-pests to be elevated to primary pest status.
The basis for most IPM systems in developed, temperate countries involves iden-tifying “damage” or “economic” or “action” thresholds and understanding the roleof natural enemies (predators, parasitoids and entomopathogens). Field scouting orsampling programs are usually developed based on this information. Examples in-clude sequential sampling programs that are easy to use, reliable and save time inmonitoring pest populations or damage in the field. These have been developed forinsect pest species such as cabbage loopers, Trichoplusia ni (Hubner) (Noctuidae,Lepidoptera) (Shepard 1973), diamondback moth, Plutella xylostella (Linnaeus)(Lepidoptera: Plutellidae) in collard (Smith and Shepard 2004), and many otherpests. The economic threshold (ET) idea is not appropriate in a developing countrycontext as this suggests that a “treatment” is necessary at a certain pest or damagelevel. It also is based on the notion that a pesticide is available and ready for use.The economic threshold idea usually does not take into account natural enemy pop-ulations or the constant price fluctuations of chemical inputs and commodity prices.Thus, the threshold is often drastically lowered or ignored altogether to account forperceived “risk”.
Some plant protection systems include forecasts of pest problems using environ-mental monitoring with instruments to help determine if conditions are favorable forcertain diseases to occur. In addition, economic analyses are available for selectedcrops. Precision agriculture, requiring highly sophisticated equipment, includingcomputers, also is increasing in developed countries.

278 B.M. Shepard et al.
6.2.1 A Field Level Example of IPM Adoption: Collard
Fresh market collard, Brassica oleracea (L.) var. acephala DC, is one of the mosteconomically important vegetable crops grown South Carolina where the 4,000acres (1600 ha) grown in the state comprises over one-half of the acreage of bras-sica crops grown annually. The climate allows year-round collard production whichcauses pest pressure to be severe in most years. Major insect pests that can be con-straints to production include the diamondback moth (DBM), P. xylostella and thecabbage looper (CL), T. ni.
Pest management strategies are available for lepidopteran pests of cabbage(Maltais et al. 1998, Shelton et al. 1983, 1982, Chalfant et al. 1979, Shepard 1973,Greene 1972) and other brassica crops (Maltais et al. 1994, Stewart and Sears 1988)in North America but collard integrated pest management (IPM) was lacking priorto 1997. Damage thresholds were not available and scheduled applications of insec-ticides (as often as every four or five days) were made in response to the detection oflive caterpillars or the presence of larval feeding damage based on periodic, cursoryfield examinations.
In response to widespread DBM control failures in 1994, a program to study theDBM/collard pest/crop system was initiated in 1996. Khan (1998) identified resis-tance to the cryIAc and cryIC endotoxins of Bacillus thuringiensis Berliner (B.t.)in DBM. He also found that parasitism by Diadegma insulare (Cresson) (Ichneu-monidae, Hymenoptera) was low, probably due to the use of broad-spectrum insec-ticides and high temperatures. Collard growers were informed of the B.t. resistancein DBM and a four-point IPM program was initiated with the following compo-nents: (1.) calendar-based applications of insecticides were stopped, including thosecontaining B.t., (2.) fields were systematically monitored and a threshold was usedto determine the need for a pesticide application, (3.) broad-spectrum insecticide usefor caterpillar control was curtailed, and (4.) augmentative releases of parasitoids,were begun. Growers reported that aphid problems were reduced after curtailing theuse of broad-spectrum insecticides for caterpillar management.
Greene (1972) reported that a threshold of 0.1-cabbage looper equivalent (CLE)per plant prevented damage that was economical in cabbage, so this threshold levelwas used in the collard system. Harcourt et al. (1955) found that CL larvae con-sumed around 20 times as much leaf tissue as DBM larvae. However, this level wasconsidered too high for collard, so a ratio of 5:1 (DBM to CL), which was usedearlier by Maltais et al. (1998), was adopted. Implementation of this program beganin 1996 and by 1997, populations of DBM were significantly reduced, the efficacyof B.t. products against the DBM was restored, total numbers of insecticide applica-tions were reduced without losses in marketable yield (J.P. Smith – unpub. data), andthe overall economics of summer collard production was improved (Anonymous2001).
Further refinements of the IPM system included streamlining field scouting tech-niques. Although there was a reduction in insecticide applications from an averageof 14 to an average of less than 6 applications in 10 weeks (time from seedingin plant beds to harvest), field scouts were using a fixed-number scheme (FNS).

6 Implementing Integrated Pest Management in Developing and Developed Countries 279
A major criticism of the pest management program by producers was that theFNS field scouting required too much time in order to make a decision aboutwhether or not a treatment was required. In addition, an ET specific for collard waslacking.
A study was conducted in response to these concerns with the objectives of:(1.) developing a location-specific ET for management of CL and DBM in collard,(2.) developing and testing a sequential sampling scheme (SSS) for identifying fieldswith potentially damaging populations of CL and DBM, (3.) comparing the sam-pling methods that utilized one plant per observation point to those requiring fiveplants per point, and (4.) comparing the time and precision of the SSS to the moreintensive FNS.
The results of this study were published (Smith and Shepard 2004) and dissem-inated to growers using traditional extension education methods such as growersmeetings, field demonstrations with “field day” meetings, fact sheet publications,booklets (Francis et al. 2005) and direct-contact farm visits by extension agents.The work was demonstrated and implemented by large commercial collard growersin the state, and also to limited-resource (LR) farmers with small acreages. Thestudy showed that the 0.1 CLE/plant ET was appropriate for production of mar-ketable collard. Also, the sequential sampling plan was efficient with no differencesin population estimates whether one plant was sampled at one-hundred locationsor five plants were sampled in twenty locations. Thus, significantly more time wassaved using the SSS approach compared to the conventional FNS.
Several large commercial farms that began to use the FNS in the late 1990’s neveradopted the SSS, although these growers were among the ones who complainedabout the amount of time required by the FNS. There were a number of reasons forthe failure of wide-spread adoption by many growers. Among the most importantwas that in the late 1990’s and early 2000’s a number of new insecticides wereregistered, and many growers switched to these for crop protection. New, “soft”insecticides for caterpillar management such as spinosad, emamectin, indoxacarb,methoxyfenozide, and novaluron gave growers materials that could be used forDBM management without the same level of non-target effects as the older broad-spectrum insecticides. With this number of effective materials, rotation of modes ofaction could be practiced with less chance of encouraging resistance to a particularmode of action. Initially, excellent management of caterpillars was accomplishedwithout the immediate side effects seen when using older broad-spectrum insecti-cides such as resurgence of primary and secondary pests and elimination of naturalenemies. This led to reduction in emphasis on scouting, failure to scout methodi-cally using the FNS, failure to use the ET to justify applications, and eventual returnto calendar-based spray programs. Growers used the new materials in many caseswithout having adequate scouting data on which a decision could be based to treat.Despite increased use of these new materials, DBM populations in South Carolinawere not found to be statistically less susceptible to spinosad (the most widely usedmaterial) (L. Walton, DowAgroSciences – unpub. data). However, in neighboringGeorgia, where no scouting or ET were used to time or justify insecticide applica-tions for caterpillar on collard, resistance to spinosad in certain DBM populations

280 B.M. Shepard et al.
has been documented; the same study showed increased LC50 values in these pop-ulations for both indoxacarb and emamectin (Zhao et al. 2006). A particularly dis-turbing fact about this incidence of insecticide resistance was that in 2001 and 2002,when the field control failures were reported, indoxacarb was not yet registered oncollard, the crop on which growers were attempting to manage DBM.
One major consideration was that most of the field scouts were of Hispanic originand communication of technical information presented a challenge. In LexingtonCounty, almost 100% of the field scouts were from Mexico and were trained toexamine the crops for insect pests. They were adept at finding caterpillars andcaterpillar damaged plants as well as some other pests but had no formal train-ing in IPM, identification of pests and natural enemies, scouting procedures, andmost did not speak, understand, or read English well enough to receive such train-ing in English. In addition, crew chiefs and farm managers who were bilingualdid not have adequate technical training to act as interpreters. The authors foundthat field scouts basically adopted a “better to be safe than sorry” approach totheir jobs and if caterpillars could be found in a field, their scouting reports re-flected a need to treat regardless of the number or distribution of the pests. By the2003–2004 season, actual methodical field scouting with record keeping and utiliza-tion of an ET was implemented and numbers of insecticide treatments drasticallydeclined.
Several events in 2005 began to change this situation in Lexington County, SouthCarolina. The resistance problem experienced by the Georgia industry created in-creased awareness that even with the new, effective materials, the resistance scenarioseen in the mid-1990’s with the B.t. insecticides could be repeated. Field scoutingforms and background instructions were translated into Spanish. Pest managementadvisors became interested in the SSS when it was demonstrated to them in early2007 due to the high efficiency and time-savings associated with the method. Apost-season evaluation indicated that this approach had been very effective in lim-iting damage to the crop and numbers of insecticide applications had been reducedcompared to FNS.
Powell Smith, in conjunction with the local county agent, carried out two yearsof demonstrations of SSS and other IPM practices with limited resource farmers inMarlboro County, South Carolina. Although these growers’ fields are small, they ap-preciated the savings in time that the SSS provided, which in their case, also resultedin reduction of insecticide applications with resulting savings in costs. Also, thereis an increasing awareness of environmental issues among this group of growers,which has contributed to more interest in reducing numbers of pesticide applica-tions. In Orangeburg County, South Carolina, where a large limited resource farmeris attempting to use the program, the major constraint is the lack of adequatelytrained and motivated individuals who can be trained to carry out the field scouting.
In conclusion, adoption of any new approach to management ofpests on high-valuecrops will be slow with much trepidation on the part of growers who feel that they maysuffer economic loss if the approach is unsuccessful and on the part of field workerswhose employment success may depend on how well the crop is protected and/ormanaged. Being able to successfully demonstrate on significant acreage (with grower

6 Implementing Integrated Pest Management in Developing and Developed Countries 281
groups involved) that the method will not result in increased costs, or particularlyincreased crop damage, is very important to convince farm operators to try new ap-proaches. Avenues which are successful in improving chances of adoption of IPMin collard at the field level involve proper training of pest management profession-als retained by growers. It is particularly important that field scouts have access tobilingual individuals with sufficient technical training to be able to translate or conveyfairly complex biological and spatial information to workers in their native language.Demonstrating to field scouts that the SSS was much more efficient than the FNS wasthe most useful approach toward gaining a greater level of adoption. The SSS agreedwith the FNS more than 90% of the time and sampling 5 plants at each sampling sitewas more efficient that sampling one plant at each site with an overall reduction infield sampling time of 75% (Smith and Shepard 2004).
6.3 Implementing IPM in Developing Countries
A review of early IPM efforts in the Asia and Pacific regions is summarized in Ooiet al. (1992). Most developing country farms are small and heterogeneous. Unlikemost farms in developed countries, the IPM decisions in developing countries mustbe derived locally to be applicable to a particular setting. Due to the absence of“over-wintering”, agro-ecosystems in S.E. Asia are ferociously local specific withlarge variance from field to field and area to area. The authors do not think that theuse of the term “IPM Packages” is appropriate as this suggests that all the answersare known and neatly “packaged” and ready for farmer use. Instead, there is a needto empower farmers with knowledge of their crops through FFS and/or participa-tory research in farmers’ fields, workshops, field guides, etc. In some cases, simplemessages may be effective in changing behavior about IPM (Heong et al. 1998) butthis approach will be effective only in certain circumstances and is very close to the“spray and pray” recommendations that have contributed to the current problems ofpesticide overuse and abuse leading to resistance and resurgence in pest populationsand poisoning of non-target organisms, including farmers.
Another aspect of IPM in developing countries, that complicates developmentof sustainable IPM systems, has to do with chemical pesticides. These are often“dumped” on developing countries where there is little or no enforcement of pesti-cide regulations, even if they exist. In countries like Cambodia, parathion floodsinto that country from Thailand and the government has literally no regulatorystaff in the field to prevent this. Even when pesticides are available to developingcountry farmers, these farmers are not trained in their safe use. In fact, “safe use”of highly and moderately hazardous pesticides most commonly applied in S. E.Asian countries is all but impossible for small scale farmers (Kishi et al. 1995). Itis common to find chemical pesticides that have been banned in developed coun-tries, still being sold freely in developing countries. This presents a huge challengefor IPM, and an ongoing threat to the human and environmental health of poorcommunities.

282 B.M. Shepard et al.
6.3.1 Rice
An important outcome of pesticide misuse is that many insects, particularly in trop-ical lowland rice, have risen to primary “pest” status because of the destruction ofthe natural enemies that kept pests in check for thousands of years before pesticideswere being used. Pesticide overuse was the cause for outbreaks of the brown plan-thopper (Nilaparvata lugens Stal) (Hemiptera: Delphacidae) in Indonesia (Fig. 6.1),the Philippines and in other tropical lowland rice-growing areas of S.E. Asia. Theseoutbreaks prompted the government of Indonesia under President Suharto, to ban56 kinds of pesticides. The rich compliment of natural enemies, reported by manyauthors (Settle et al. 1996, Shepard and Barrion 1998, Shepard et al. 1999, Kenmore2006, Kenmore et al. 1984, Ooi and Shepard 1994, Shepard et al. 2000), quicklybrought brown planthopper populations under control after pesticide use subsidedwith concurrent increases in rice yields (Fig. 6.2).
Sadly, chemical insecticides were part of the “package” of recommendations thatwere ushered in as part of the green revolution. Other parts of the package includedhigh-yielding varieties, nitrogen fertilizers, large scale investments in irrigation, andwider access to farm credit.
Rice IPM programs in S.E. Asia, through farmer field schools (FFS), laid thefoundation for moving the approach to other crops. Major funding by the WorldBank and others made the FFS concept the major paradigm for putting IPM on thelandscape through empowerment of thousands of farmers. This approach requiredthat researchers and extensionists participate with farmers in farmers’ fields to actu-ally carry out field activities so that farmers became empowered with knowledge ofIPM principles (Dilts 1990). IPM experiments have been conducted with farmers intheir own fields on such things as soil ecology, plant compensation, and benefits ofnatural enemies. Between 1990, when the first FFS was conducted in Indonesia, and
0
100,000
200,000
300,000
400,000
500,000
600,000
700,000
800,000
74 75 76 77 78 79 80 81 82 83 84 85 86 87 88 89 90 91
area infested (ha)
Fig. 6.1 Brown planthopper in rice in Indonesia, 1974–1991Source: Kenmore (2006).

6 Implementing Integrated Pest Management in Developing and Developed Countries 283
0
20
40
60
80
100
120
140
160
180
73 76 79 82 85 88 91 94 9720
00
year
$ m
illio
n
0
10
20
30
40
50
60
mill
ion
met
ric
ton
s
Rice Pesticides
Paddy Production
Fig. 6.2 Rice pesticide expenditures and paddy production in Indonesia, 1973–2001Source: Kenmore (2006).
1999, over two million rice farmers participated in the program (Pontius et al. 2002).Rice yields continued to improve and pesticide use was dramatically reduced inareas where FFS were being carried out (Fig. 6.2). Farmers that participated in riceFFS had significantly higher yields in secondary food crops, produced in rotation inrice-based systems (Hammig and Rauf 1998).
Field studies carried out with farmers in vegetables and soybean showed thatinsecticide use in these crops was excessive and not economically viable (Shepardet al. 2001). The following are examples of farmer participatory research activitiesthat were conducted for non-rice crops in Indonesia (Table 6.1).
6.3.2 Soybean
Soybean in Indonesia is considered a major “palawija”1 crop. This crop is the mostimportant non-rice crop with over 1,407,000 hectares grown in Indonesia. A largeproportion of soybean is used for human consumption. Even with this large plantingarea, Indonesia still imports between 600,000 and 800,000 tons of soybean annually.This crop is an important protein source and is the base for food items such as tofu,tempe and others.
The most important insect pests of soybean in Indonesia are pod boring insects,Etiella zinckenella (Treitschke) (Lepidoptera: Pyralidae,) and Helicoverpa armigera(Hubner), the corn earworm (CEW). Of these, E. zinckenella is the most destructive,
1 The Indonesian word palawija refers to secondary crops grown in rotation with rice.

284 B.M. Shepard et al.
Table 6.1 Majora IPM tactics that have been tested with vegetable farmers in S. E. Asia
Crops Tactics
Tomato Varieties resistant to viruses and fungiStaking (with appropriate variety)PruningGrafting
Chili Resistance to virusesEggplant Straw mulching
GraftingHost plant resistance to nematodesB.t.-transgenic plants
Shallots Microbial Control of Spodoptera exigua with SeNPVOnions VAM and Trichoderma
Straw mulchPheromone traps for timing interventions (Spodoptera litura)SlNPV (insect virus of S. litura)SeNPV (insect virus of S. exigua)
Cabbage Field scouting for CrocidolomiaMicrobial control/spot sprayingHand picking egg masses/larval clusters(also conserves natural enemies for DBM)
Soybean Early planting in the dry season(to avoid pod-borers/Etiella sp. and Helicoverpa sp.)Avoiding needless sprays for defoliators
Yardlong beans Spot treatments for aphidsCitrus (for Papaya fruit fly control)
SanitationProtein bait spraysTraps to monitor populationEarly harvest
All vegetable crops Weed control using stale seedbed techniquesa Tactics listed here are not all inclusive. From Hammig et al. (2008).
based on field surveys carried out in Indonesia. The stemfly, Melanagromiza sojae(Zehntner) (Diptera: Agromyzidae,), the seedling fly, Ophiomyia phaseoli (Tryon)(Diptera: Agromyzidae,), pod-sucking bugs such as Nezara viridula (Linnaeus)(Hemiptera: Pentatomidae,) and Riptortus linearis (Fabricius) (Hemiptera: Alydi-dae,) also can be important. Foliage feeders such as Spodoptera litura (Fabricius)(Lepidoptera: Noctuidae,), Omiodes indicata (Fabricius) (Lepidoptera: Pyralidae,)and semi-loopers, mainly Chrysodeixis chalcites (Esper) (Lepidoptera: Noctuidae,),are often targeted by farmers for insecticide sprays because they are large and con-spicuous, but these insects rarely affect yields. Broad spectrum insecticides thattarget this foliage-feeding complex, often have profoundly negative effects on in-digenous biological control agents that control pod borers and pod-sucking bugs inthe absence of these chemicals.
There is an abundance of natural control agents in the soybean system and pop-ulations of most of the plant-feeding species are effectively regulated by these nat-ural enemies (Shepard et al. 1999) The parasitoid complex is particularly rich onsome plant feeding species (Shepard and Barrion 1998). However, it is apparent

6 Implementing Integrated Pest Management in Developing and Developed Countries 285
from pest and natural enemy surveys that some key pests are lacking an effec-tive complement of biological control agents. For example, the pod-boring pyralid,E. zinckenella has relatively low levels of parasitism. Only three parasitoid species,Phanerotoma philippinensis (Ashmead) (Hymenoptera: Braconidae), Baeognathajavana Bhat & Gupta (Hymenoptera: Braconidae), and Temelucha etiellae Kusegi-mati (Hymenoptera: Ichneumonidae) were encountered (Shepard et al. 1999) andno entomopathogens were found.
6.3.2.1 Farmer Participatory Research to Test IPM Strategies in Soybean
Considering all the secondary food crops, soybean stands out as one in which goodagronomic practices are often sadly lacking. Farmers and researchers often focustheir activities on pest control without first understanding that “growing a healthycrop” is frequently the most important constraint to production. Field studies werecarried out with farmers to identify strategies for inclusion in IPM training programs(Shepard et al. 2001). Soybean is usually grown after rice (during the dry season).The following are highlights of farmer participatory research obtained from fieldstudies:
Planting dates profoundly affected the presence of pod-feeding lepidopteranpests such as Etiella and Helicoverpa. Their populations were higher and yieldswere lower in late-planted soybeans. These studies underline the importance of acultural techniques of planting as early as possible to escape build-up of these podboring pests. In addition, farmers would probably benefit if their early plantingscould be synchronized with other farmers. Applications of insecticides caused anincrease in foliage- and pod-feeding insect populations and an increase in damageby Helicoverpa and Etiella. Applications of chemical pesticides decreased numbersof several important arthropod predators such as spiders (mainly, Pardosa spp.),staphylinids [mainly Paederus fuscipes Curtis (Coleoptera: Staphylinidae)], and antsthat build up and keep other soybean insect pests under control.
Little information is known about stem flies and their importance in soybeanproduction. Results from our studies with this potential pest revealed the following:
1. Yield reductions by the stem fly, M. sojae, could not be detected except when thestem was attacked below the hypocotyl (van den Berg et al. 2000); thus, therewas little justification for insecticide treatments.
2. Although chemical insecticide treatments were aimed at stem flies, these chem-icals adversely affected populations of major predators and caused populationsof S. litura to resurge (Shepard et al. 2001).
3. No yield reductions were caused by S. litura. Therefore, it may be a beneficialinsect providing food for natural enemies that attack more serious insect pests.
Any IPM strategy that is used in soybean, as in other crops, must involve farm-ers. Field exercises developed and carried out with farmers will serve to illustratethe principles and practices of IPM. Secondly, devising field studies with farmerscan illustrate that foliage-feeding pests such as loopers, Omiodes sp., geometrids,lymantriids, and S. litura, rarely cause yield losses.

286 B.M. Shepard et al.
According to Indonesia’s Central Bureau of Statistics, about US $2 million isspent annually for insect pest control on soybean. Most of these pest control expen-ditures occur in the major growing areas in Java and Sumatra where IPM programsare concentrated. Data from field surveys in East Java conducted in 1996 provideinformation on frequency of sprays, showing that farmers applied from zero to 8sprays through the season, with an average of 3.4 for the 100 farmers surveyed (vanden Berg et al. 1998). Seventy percent of insecticide sprays were applied during thefirst 45 days after planting, before pod-set, and were mainly aimed at defoliators.Because these pests cause little if any yield reduction, it is clear that insecticidesprays can be reduced without causing economic losses. Thus, IPM strategies thatreduce the number of pesticide applications have immediate and direct payoffs tofarmers by reducing their costs of production and consequently increasing theirprofits. If IPM strategies enhance yields as well – which is likely as a result of theprogram focus to “grow a healthy crop” (Gallagher 1990) with particular emphasison basic agronomy – then the benefit is increased.
6.3.3 Cabbage
Cabbage is planted to over 67,000 hectares in Indonesia, second only to soybeanamong non-rice food crops, with a total of 1,417,000 metric tons produced annually.This crop is produced mainly in upland areas of Java, Sumatra and Sulawesi. Majorpests of cabbage in Indonesia are the cabbage head caterpillar (CHC), Crocidolo-mia pavonana Zeller (Lepidoptera: Pyralidae) and the diamondback moth (DBM),P. xylostella, but the latter is generally kept under good control in most areas bythe parasitoid, Diadegma semiclausum (Hellen) (Hymenoptera: Ichneumonidae),when chemical insecticides are avoided. Hellula undalis (Fabricius) (Lepidoptera:Pyralidae,) and the looper complex can be important locally but are not wide spreadproblems. We have seen outbreaks of CEW on cabbage in S. Sulawesi.
Diadegma semiclausum was introduced into Indonesia for DBM control in the1950s (Ooi 1992) and later was distributed to most of the major cabbage-growingareas (Sastrosiswojo and Sastrodihardjo 1986). Even in areas where the parasitoidis firmly established, farmers do not recognize its importance in biological controlof DBM and mixtures of chemical insecticides are routinely applied. This action in-variably causes resurgence of populations of DBM by reducing parasitoids and otherimportant natural enemies that normally keep it under control. Interestingly, one canascertain the spray history of a cabbage field depending on the presence or absenceof dense populations of DBM. High populations are almost always indicative ofheavy chemical sprays; the presence of high levels of CHC usually indicates fewor no chemical sprays. This underscores the importance of considering CHC alongwith DBM in developing an effective IPM program for cabbage (Sastrosiswojo andSetiawati 1992). When chemical sprays for DBM are decreased or terminated alto-gether, CHC often causes heavy damage. Indigenous natural enemies are not able tokeep CHC in check. Recently, several pathogens (mainly entomogenous fungi) havebeen isolated from field populations of CHC and are being tested by collaboratorsand farmers in N. Sulawesi.

6 Implementing Integrated Pest Management in Developing and Developed Countries 287
Another major challenge for cabbage IPM is development of strategies that canhelp suppress CEW and Hellula; the latter occurs mostly in lowland cabbage. Al-though these pests are sporadic and localized, our extensive surveys throughout ma-jor vegetable growing areas revealed heavy populations of CEW in Central Java,South Sulawesi (Malino) and East Java (Batu).
6.3.3.1 Farmer Participatory Research to Test IPM Strategies in Cabbage
Field tests were conducted with farmers to determine if hand picking egg massesand larval clusters of CHC, along with spot applications of Bacillus thuringiensis(B.t.), was a practical approach for CHC control (Shepard and Shellhorn 1997).Applications of B.t. and concurrent elimination of chemical sprays would allowD. semiclausum and other natural enemies to fully operate against DBM and CHC.
Tests were carried out with farmers in West and North Sumatra to develop an IPMsystem for DBM and CHC. Treatments included: (1.) Collecting CHC egg massesand larval clusters up to 30 days after transplanting seedlings, then hand-pickingplus spot spraying with B.t. (after about 30 days, the egg masses are difficult tofind); (2.) Hand picking throughout the season and spraying the entire plot withB.t.; (3.) Standard farmer practice, and; (4.) Untreated control.
Hand picking egg masses and larval clusters plus spot treatments of B.t., resultedin over 90% of the cabbage heads rated as marketable in west Sumatra. The farmers’usual practice provided the highest yields (about the same as hand picking and spotspraying) but 8 B.t. and chemical sprays were applied compared to only 7 B.t. spottreatments when egg masses and larval clusters were hand picked. We concludedthat results may have been better by applying B.t. using a backpack sprayer ratherthan a small hand held sprayer that we used for these studies. In the untreated controlplots, nearly 40% of the heads were severely damaged by CHC and were consideredunmarketable.
Results were more impressive in North Sumatra where a backpack sprayer wasused to apply spot sprays of B.t. This study, planned and executed with personnelfrom World Education and farmers, revealed that yields and marketability of cab-bage were significantly lower in the untreated plots. Only 7 spot sprays with B.t.were required in the hand picking/B.t. spot spray treatment. Thus, the profitabilityof hand picking eggs and larval clusters plus spot spraying with B.t. may be a viableapproach in areas where cabbage fields are small and not much time is required tosearch the field for egg masses and larval clusters. Thus, this approach could resultin considerable build-up of natural enemy communities of both DBM and CHC,and reduce or eliminate the usual practice of farmers who make weekly applications(12) of chemicals.
6.3.4 Shallots/Onions
Of all the vegetable crops, shallots are most heavily sprayed with chemical pesti-cides. In large shallot-producing areas of Brebes, in Central Java, it is not uncommonfor farmers to apply chemical insecticides every other day. This has resulted in high

288 B.M. Shepard et al.
levels of resistance in the target pest, the beet armyworm (BAW), Spodoptera ex-igua (Hubner) (Lepidoptera: Noctuidae). The only viable control tactic was “handpicking” larvae from the plants. Health impact studies carried out in these areasshowed that fully one in five (21%) of all spray operations resulted in clinical poi-soning events (Kishi et al. 1995). Heavy damage by S. exigua also was prevalentin West Sumatra (Alahan Panjang), East Java (Batu and Proboling.) and West Java(Cisantana and Pangalengan).
BAW is more serious during the dry season. During the rainy season, fungiare most important, notably Alternaria, Colletotrichum and Peronospora destructor(Meity Sinaga, personal communication). Weeding is normally carried out on an“as needed” basis, most often simultaneously with “hand picking” S. exigua larvae.Aphids, Neotoxoptera formosana (Essig) (Homoptera: Aphididae), can be locallyimportant in highlands but we have not observed them in high numbers in mostmajor production areas.
Heavy infestations of a leaf-mining agromyzid, Liriomyza huidobrensis (Blan-chard) (Diptera: Agromyzidae), were found on shallots in Alahan Panjang, WestSumatra in the mid-1990s (Shepard et al. 1996) and this pest has since beenfound in several other areas of Indonesia. The extent to which these infestationsaffected yields has not been determined but judging from the severity of infesta-tions, yield losses were substantial. More recently, heavy infestations of anotherexotic leafminer species, Liriomyza chinensis Kato (Diptera: Agromyzidae), wereobserved in Brebes, Central Java in 2000.
In the Philippines, the most important soil-borne diseases are Sclerotium cepivo-rum, Fusarium oxysporum and Phoma terrestris and the use of fungicides for con-trol of these pathogens has been unsuccessful (Gapasin et al. 1998). Anthracnose isone of the most important diseases of onions in the Philippines. At present, the onlyeffective means of control is intensive fungicide applications. Purple nutsedge andhorse perslane are the most important weed pests of onion (Miller et al. 2005).
6.3.4.1 Farmer Participatory Research to Test IPM Strategiesin Shallots/Onion
A microbial control agent – a Nucleopolyhedrovirus (SeNPV) – was discoveredin populations of S. exigua in Cimacan, in the Puncak region of West Java, throughroutine field surveys of shallots (Shepard et al. 1996). Results from preliminary testsin the Puncak revealed that damage to leaf onion was significantly lower when theSeNPV was applied in farmers’ fields. The virus was then tested in the Brebes areawith our collaborator, Pak Karsum, a shallot farmer in Ciledug, Central Java. Resultswere so impressive that Karsum asked for the SeNPV from USAID-supported labo-ratories in Bogor. Project scientists worked with him closely to develop productiontechniques and soon after he was able to mass-produce the material and carried outtests in his own fields. A unique feature of the biological control system is that themicrobe is easily mass produced because of a ready supply of S. exigua larvae thatare collected daily by women. This hand picking is carried out as part of an effort,along with chemical insecticides, to control the pest.
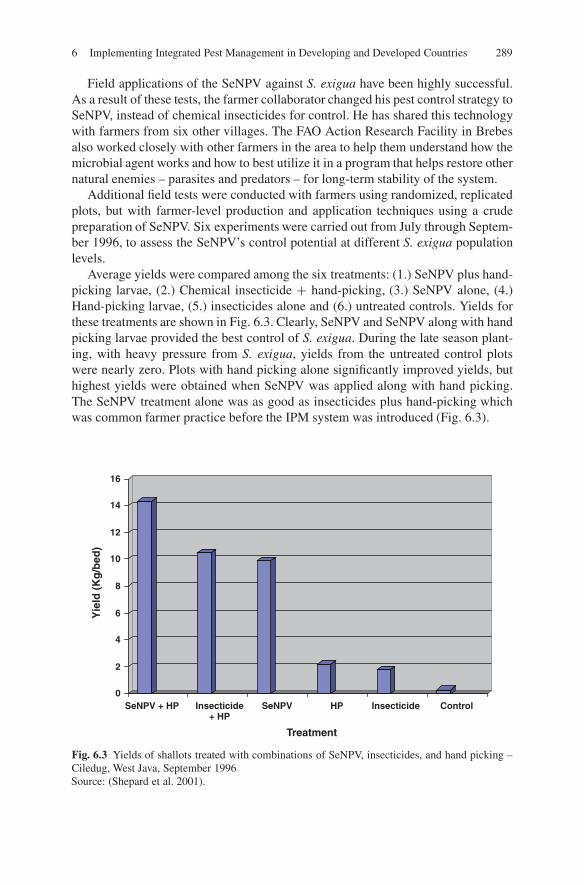
6 Implementing Integrated Pest Management in Developing and Developed Countries 289
Field applications of the SeNPV against S. exigua have been highly successful.As a result of these tests, the farmer collaborator changed his pest control strategy toSeNPV, instead of chemical insecticides for control. He has shared this technologywith farmers from six other villages. The FAO Action Research Facility in Brebesalso worked closely with other farmers in the area to help them understand how themicrobial agent works and how to best utilize it in a program that helps restore othernatural enemies – parasites and predators – for long-term stability of the system.
Additional field tests were conducted with farmers using randomized, replicatedplots, but with farmer-level production and application techniques using a crudepreparation of SeNPV. Six experiments were carried out from July through Septem-ber 1996, to assess the SeNPV’s control potential at different S. exigua populationlevels.
Average yields were compared among the six treatments: (1.) SeNPV plus hand-picking larvae, (2.) Chemical insecticide + hand-picking, (3.) SeNPV alone, (4.)Hand-picking larvae, (5.) insecticides alone and (6.) untreated controls. Yields forthese treatments are shown in Fig. 6.3. Clearly, SeNPV and SeNPV along with handpicking larvae provided the best control of S. exigua. During the late season plant-ing, with heavy pressure from S. exigua, yields from the untreated control plotswere nearly zero. Plots with hand picking alone significantly improved yields, buthighest yields were obtained when SeNPV was applied along with hand picking.The SeNPV treatment alone was as good as insecticides plus hand-picking whichwas common farmer practice before the IPM system was introduced (Fig. 6.3).
0
2
4
6
8
10
12
14
16
Yie
ld (
Kg
/bed
)
SeNPV + HP Insecticide+ HP
SeNPV HP Insecticide Control
Treatment
Fig. 6.3 Yields of shallots treated with combinations of SeNPV, insecticides, and hand picking –Ciledug, West Java, September 1996Source: (Shepard et al. 2001).

290 B.M. Shepard et al.
A program for farmer production and use of SeNPV has been developed and isbeing carried out in Alahan Panjang, West Sumatra (Zamzami and Djoni, personalcommunication). West Sumatra Plant Protection Agency staff from laboratories atPadang and Bukittinggi were supplied the inoculum and training in propagationtechniques. They, in turn, have trained 150 shallot farmers. These farmers are cur-rently using the SeNPV in their own fields. A Farmer Field Seminar for BiologicalControl was conducted in Alahan Panjang to bring together farmers, trainers andresearchers from all of the major shallot-growing areas of Indonesia, to share experi-ences and design plans to expand the understanding and use of SeNPV. Over 10,000farmers currently use the SeNPV as part of their control program on shallots in WestSumatra (Zamzami, personal communication). The IPM system, based on the useof the SeNPV virus together with hand-picking, provides a dramatic opportunityfor economic benefits to farmers. Insecticide costs are eliminated and hand-pickingrequirements are reduced. These factors alone imply that production costs can bereduced by $1,100 per hectare. In addition to these cost savings, evidence from thefield studies implies that crops produced under the IPM system have higher yieldsand improved quality over the common farmer practice. The combination of theyield boost and the price premium paid for high quality product results in an addi-tional $2,800 per hectare gain from IPM. Thus, the net benefit is about $4,000 perhectare. In addition, health benefits from development of IPM should be substantialbecause pesticide poisoning continues to be a major, and poorly diagnosed, publichealth problem in rural agricultural communities (Kishi et al. 1995).
In summary, the use of SeNPV has excellent potential for providing long termcontrol of S. exigua while stabilizing the shallot ecosystem by allowing natural en-emies to re-colonize the areas. Farmer training in IPM is the key to the success ofthe program.
The fundamental comparison of common farmer practice to the IPM alternative,based on the use of SeNPV virus, is shown in Table 6.2. The data were obtained fromfield studies conducted in the Ciledug sub-district of Cirebon District, Central Java.This area is typical of the major shallot growing area of Indonesia that includes Tegaland Brebes Districts, as well as Cirebon. The irrigated production system used alsois common in Probolinggo, East Java, another important shallot area. Combined,these areas account for about one-third of all shallot production in Indonesia.
The use of fungicides is largely unsuccessful for control of soil-borne pathogensof onions. However, Trichoderma spp. are known for their antagonistic effectsagainst these fungal pathogens. In the Philippines, Trichoderma isolates were as ef-fective as chemical fungicides in reducing the incidence of these soil-borne diseases.VAM (vesicular arbuscular mycorrhizae) has been found to be an economically andenvironmentally friendly supplement that can help reduce fertilizer input and helpsonion plants tolerate infection from soil-borne pathogens and nematodes (Gergonet al. 2003). For control of Anthracnose, the combination of cultural and chemicalcontrol reduced the number of fungicide applications (Alberto et al. 2003).
For weed control, IPM CRSP on-farm studies showed that one application of thecorrect herbicide followed by timely hand-weeding controlled weeds as well as thefarmer practice of two herbicide treatments followed by three hand weedings. Weed
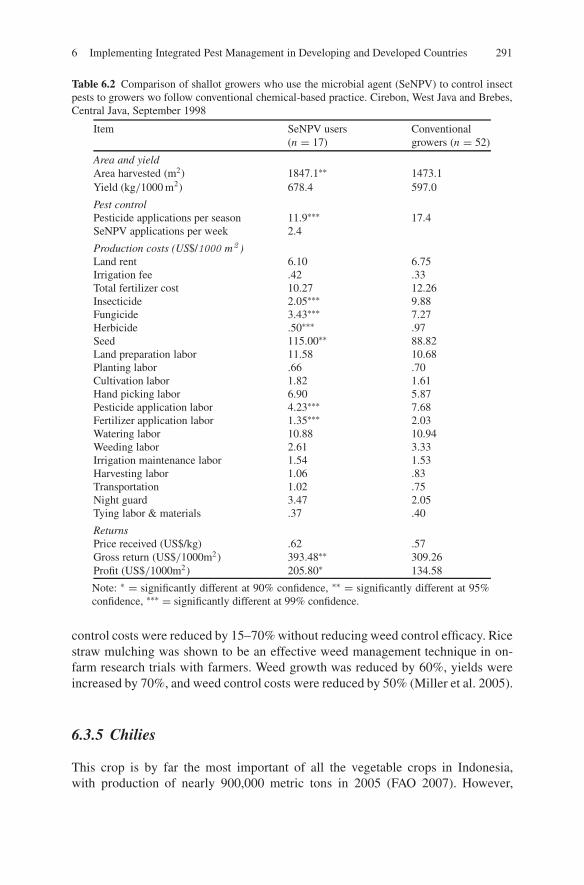
6 Implementing Integrated Pest Management in Developing and Developed Countries 291
Table 6.2 Comparison of shallot growers who use the microbial agent (SeNPV) to control insectpests to growers wo follow conventional chemical-based practice. Cirebon, West Java and Brebes,Central Java, September 1998
Item SeNPV users(n = 17)
Conventionalgrowers (n = 52)
Area and yieldArea harvested (m2) 1847.1∗∗ 1473.1Yield (kg/1000 m2) 678.4 597.0
Pest controlPesticide applications per season 11.9∗∗∗ 17.4SeNPV applications per week 2.4
Production costs (US$/1000 m2 )Land rent 6.10 6.75Irrigation fee .42 .33Total fertilizer cost 10.27 12.26Insecticide 2.05∗∗∗ 9.88Fungicide 3.43∗∗∗ 7.27Herbicide .50∗∗∗ .97Seed 115.00∗∗ 88.82Land preparation labor 11.58 10.68Planting labor .66 .70Cultivation labor 1.82 1.61Hand picking labor 6.90 5.87Pesticide application labor 4.23∗∗∗ 7.68Fertilizer application labor 1.35∗∗∗ 2.03Watering labor 10.88 10.94Weeding labor 2.61 3.33Irrigation maintenance labor 1.54 1.53Harvesting labor 1.06 .83Transportation 1.02 .75Night guard 3.47 2.05Tying labor & materials .37 .40
ReturnsPrice received (US$/kg) .62 .57Gross return (US$/1000m2) 393.48∗∗ 309.26Profit (US$/1000m2) 205.80∗ 134.58
Note: ∗ = significantly different at 90% confidence, ∗∗ = significantly different at 95%confidence, ∗∗∗ = significantly different at 99% confidence.
control costs were reduced by 15–70% without reducing weed control efficacy. Ricestraw mulching was shown to be an effective weed management technique in on-farm research trials with farmers. Weed growth was reduced by 60%, yields wereincreased by 70%, and weed control costs were reduced by 50% (Miller et al. 2005).
6.3.5 Chilies
This crop is by far the most important of all the vegetable crops in Indonesia,with production of nearly 900,000 metric tons in 2005 (FAO 2007). However,

292 B.M. Shepard et al.
development of a sound IPM program for chilies is the most challenging of allvegetable crops. The crop is attacked by numerous pests including insects, mitesand plant pathogens (Vos and Frinking 1998). In addition, inappropriate agronomicpractices, e.g., planting in low, wet areas which hinders healthy growth due to poorsoil drainage often are major constraints to achieving maximum production. Majorarthropod pests include mites, Polyphagotarsonemus latus (Banks) (Acarina: Tar-sonemidae), and the CEW. Thrips and aphids may be important locally as vectors ofplant viruses. Occasionally, farmers spray to control S. litura, but this insect feedsmostly on leaves and probably causes little damage in most cases. CEW, on the otherhand, selectively feeds on the pods as does the gall fly, Asphondylia sp. (Diptera:Cecidomyidae), and these can cause significant pod loss. However, populations ofthese two pests are highly variable between seasons and locations. Recent informa-tion from West Sumatra suggests that parasites build up during the growing seasonand fruits that mature early are most affected. The fruit fly, Bactrocera (= Dacus)dorsalis (Hendel) (Diptera: Tephritidae), seems to be ubiquitous but the incidence ofpod attack is usually not high in the major chili growing areas of Indonesia. Detailsof the agronomic factors and pests of chilies on Java were reported by Vos (1994).Colletotrichum, Phytophthora, Alternaria, Cercospora, Pseudomonas and virusesare usually among the most important groups of pathogens.
6.3.5.1 Farmer Participatory Research to Test IPM Strategies in Chilies
Field tests conducted in W. Sumatra demonstrated that seedbed height and controlof soil pH with lime were effective in reducing the incidence of bacterial wilt. In-secticide sprays were not effective in increasing yields. This study was carried outin an area where CEW was not an important pest. In other areas, the use of the CEWvirus (HaNPV) might be a viable tactic to replace chemical pesticides. Plant viruses,prevalent in many parts of S.E. Asia, may be managed using resistant varietiescurrently under development at the Asian Vegetable Research and DevelopmentCenter (The World Vegetable Center) in Taiwan. Field tests are planned for 2008to test these in Indonesia through support by USAID through the IPM CollaborativeResearch Support (CRSP) program administered by Virginia Tech University.
6.3.6 Yardlong Beans
Yardlong beans are second only to chilies in terms of area planted among vegetablesand are an important part of the Indonesian diet. Major insect pests are the pod borer,Maruca vitrata (= testulali s) (Geyer) (Lepidoptera: Pyralidae), and aphids (usuallyAphis craccivora Koch) (Homoptera: Aphididae). The extent to which M. vitratacauses economic losses is not understood and varies widely according to locationand market supply and demand. This pod-borer damaged an average of only about3 cm along the length of maturing pods but caused much more severe damage inyounger ones. Economic losses from M. vitrata damage in yardlong beans in WestSumatra were estimated at about 25% (Zamzami, personal communication). Aphids

6 Implementing Integrated Pest Management in Developing and Developed Countries 293
are important both as a direct feeders on blooms and pods and also as virus vec-tors. Sucking bugs are almost always present in the crop but their importance maybe over emphasized. Ophiomyia phaseoli also can cause yield reductions locally.
6.3.6.1 Farmer Participatory Research to Test IPM Strategiesin Yardlong Beans
A field study, carried out by the USAID-Funded Clemson University Palawija IPMProject, FAO and the Provincial Plant Protection laboratory in Padang, West Suma-tra, compared: (1.) farmers’ usual practice (2.) no treatment but with good culturalpractices and, (3.) designated “action windows” that we generated: for aphids, basedon the literature (>100/hill), pod borer (>10% of pods damaged), Anthracnose(>10% infected leaves), and leaf spot (>10% infected leaves).
Yield from the farmers’ practice treatment and the IPM “action windows” treat-ment were about the same, although the farmers’ treatment called for eight sprayscompared to two in the IPM treatment. The major difference was in the “untreated”control where O. phaseoli and aphids seriously reduced yields.
Another field study carried out with personnel from the University of Lampungrevealed that late-planted yardlong beans were more severely attacked by CEW thanthose planted early. This difference was not as obvious for M. vitrata. In tests at theMuara field station in Bogor, mosaic virus reduced the plant population by 50%.IPM strategies must include tactics for dealing with aphid-borne viruses. Untreatedlongbean plots near Ciloto, W. Java resulted in over 50% losses due to the directfeeding by aphids (A. craccivora). Recent results indicate that “spot” treatmentswith aphicides versus treatment of the entire plot, may conserve natural enemies,but this approach requires that the crop be monitored at least twice weekly.
6.3.7 Eggplant
The major insect pest of eggplant is the fruit and shoot borer (FSB), Leucinodesorbonalis Guenee (Lepidoptera: Pyralidae). In some areas, this insect is the limitingfactor to eggplant production. Farmers may apply insecticides 50 times or more in asingle growing season (Miller et al. 2005). In spite of frequent pesticide applications,yields are reduced by more than one third due to this pest. Also, leafhoppers maybe important locally. Of the plant diseases, bacterial wilt is most common. Lossesto bacterial wilt in Central Luzon consistently reached 30–80%.
6.3.7.1 Farmer Participatory Research to Test IPM Strategies in Eggplant
Data from on farm research in the Philippines showed that simply removing damagedfruits and shoots reduced infestations by FSB and if carried out at harvest time, laborcosts are reduced. This resulted in a net incremental benefit of $2,500 perhectare whenconducted weekly and $1,000 per hectare for bi-weekly removal (Miller et al. 2005).The second approach is the identification of eggplant resistant varieties.

294 B.M. Shepard et al.
Bacterial wilt susceptible eggplant grafted onto resistant rootstock (EG 203) in-creased resistance to the disease by 30% and yields were higher. The stale seedbedtechnique which includes sequential harrowing or harrowing followed by a non-selective herbicide at bi-weekly intervals carried out during the fallow period be-tween the rice and onion crops, was effective in reducing purple nutsedge tuberpopulations by 80–90% (Miller et al. 2005).
6.3.8 Tomato
Diseases such as early and late blight, powdery mildew, bacterial wilt, Alternariaand viruses are the major constraints to tomato production. Insects that vectorviruses include thrips, aphids, and whiteflies. CEW and, sometimes, S. litura oftenfeed directly on the fruit.
6.3.8.1 Farmer Participatory Research to Test IPM Strategies in Tomato
In North Sulawesi, Indonesia staking of tomatoes is not a common cultural practiceand incidence of fungal diseases is high due to contact of plants with soil. Field testsin farmers’ fields have demonstrated that staking decreases disease incidence andincreases yield. This cultural practice has been readily accepted by many farmersand is now standard practice for the area.
In the Philippines, tomato plants did not survive well under the constant highmoisture conditions during the rainy season. Farmer participatory field tests haveshown that grafting tomato onto resistant eggplant rootstock greatly increases cropsurvival and improves yields.
6.3.9 Citrus
Surveys were carried out in a large citrus growing in the Karo District ofN. Sumatra. Heavy infestations of fruit flies (20% of the fruit was infested) wereobserved. The fruit fly was identified as the papaya fruit fly, Bactrocera papayaeDrew & Hancock (Diptera: Tephritidae). All growers in the area were reporting highlevels of fruit loss from this pest. In addition to fruit flies, we observed lepidopteranlarvae, Citripestis sagittiferella (Moore) (Lepidoptera: Pyralidae), in about 3% ofthe fruit.
6.3.9.1 Farmer Participatory Research to Test IPM Strategies in Citrus
Due to the intensity of citrus growing in North Sumatra, the only effective fruitfly management strategy would be an area-wide approach with all citrus growersparticipating. Without this, re-infestations of fruit flies would continue to occur inIPM managed areas. Tactics to be included in this management plan should includesanitation activities, spot spraying of protein baits mixed with insecticides, traps tomonitor adult fruit fly populations, and early harvesting of fruit. If farmers can be

6 Implementing Integrated Pest Management in Developing and Developed Countries 295
organized in area-wide programs, there is great potential developing an effectiveIPM system for fruit fly in citrus-growing areas of Indonesia. Results from recentFarmer Field Schools emphasizing the use of compost and organic fertilizer alongwith reduced chemical pesticide applications in citrus in this area have shown thatfarmers can drastically reduce their input costs for fertilizer and pesticides (over50%), allowing them to make a profit even when commodity prices are at theirlowest point (Cahyana, personal communication).
6.3.10 Cotton
Cotton in these six countries of an IPM program for cotton sponsored by FAO andthe European Union was implemented in six developing countries of Asia repre-sented about 51% of the land area under cotton production world-wide and con-tributed to ca. 48% of the cotton produced. In India and Pakistan, more than 50%of all pesticides used were applied on cotton (Ooi et al. 2004). In the Philippines,pesticide costs on cotton account for nearly 65% of the costs of production. Thishas led to unsustainable production and resulted in a decline in areas under cotton.The entry point for IPM in cotton is the excessive use of insecticides. Using thisentry point, Farmer Field Schools focused on a more ecological approach and thebenefits of this change included a 34% decline in use of insecticides by farmers whoparticipated in FFS (Ooi et al. 2005).
Cotton cultivation was first developed in Asia and this partly contributed to thelarge area of land devoted to cotton production. However, the relative small sizeof farms in Asia is challenging and indeed, demands an alternative approach tobringing IPM to cotton farmers (Fig. 6.4).
Fig. 6.4 Estimates of number of cotton farmers per 1000 hectares based on data compiled fromvarious sources for year 2000 by the FAO-EU IPM Program for Cotton in Asia
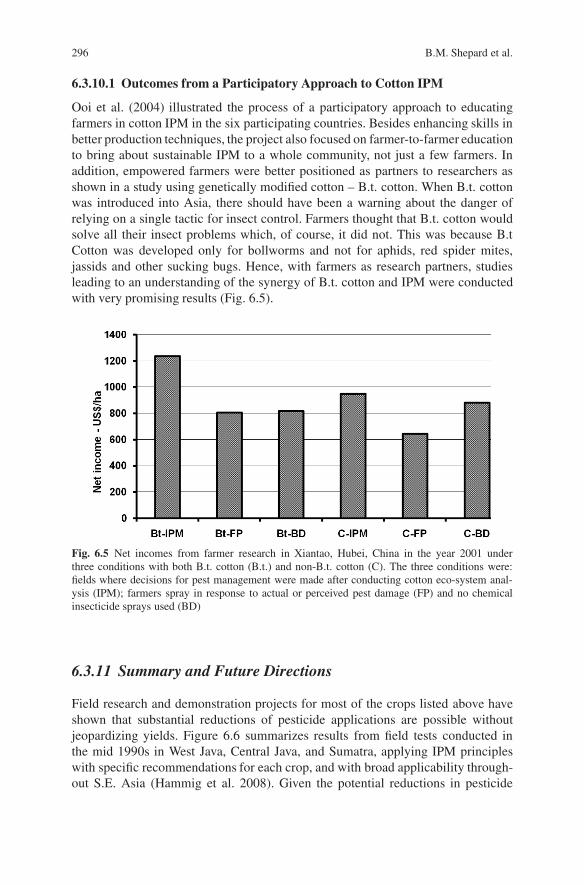
296 B.M. Shepard et al.
6.3.10.1 Outcomes from a Participatory Approach to Cotton IPM
Ooi et al. (2004) illustrated the process of a participatory approach to educatingfarmers in cotton IPM in the six participating countries. Besides enhancing skills inbetter production techniques, the project also focused on farmer-to-farmer educationto bring about sustainable IPM to a whole community, not just a few farmers. Inaddition, empowered farmers were better positioned as partners to researchers asshown in a study using genetically modified cotton – B.t. cotton. When B.t. cottonwas introduced into Asia, there should have been a warning about the danger ofrelying on a single tactic for insect control. Farmers thought that B.t. cotton wouldsolve all their insect problems which, of course, it did not. This was because B.tCotton was developed only for bollworms and not for aphids, red spider mites,jassids and other sucking bugs. Hence, with farmers as research partners, studiesleading to an understanding of the synergy of B.t. cotton and IPM were conductedwith very promising results (Fig. 6.5).
Fig. 6.5 Net incomes from farmer research in Xiantao, Hubei, China in the year 2001 underthree conditions with both B.t. cotton (B.t.) and non-B.t. cotton (C). The three conditions were:fields where decisions for pest management were made after conducting cotton eco-system anal-ysis (IPM); farmers spray in response to actual or perceived pest damage (FP) and no chemicalinsecticide sprays used (BD)
6.3.11 Summary and Future Directions
Field research and demonstration projects for most of the crops listed above haveshown that substantial reductions of pesticide applications are possible withoutjeopardizing yields. Figure 6.6 summarizes results from field tests conducted inthe mid 1990s in West Java, Central Java, and Sumatra, applying IPM principleswith specific recommendations for each crop, and with broad applicability through-out S.E. Asia (Hammig et al. 2008). Given the potential reductions in pesticide

6 Implementing Integrated Pest Management in Developing and Developed Countries 297
0
5
10
15
20
25N
um
ber
of
inse
ctic
ide
trea
tmen
ts
cabbage shallots chilies yardlongbeans
soybean
farmer practice
IPM
Fig. 6.6 Numbers of pesticide applications per crop per season made by vegetable farmers usingtheir normal practice compared to IPM practicesSource: (Shepard et al. 2001).
applications, associated environmental and human health benefits justify a policycommitment to expand IPM to other areas.
Some of the IPM tactics that could have a major impact if adopted on a widearea are listed in Table 6.1. One constraint is that information about strategies andtactics found useful in one area is often not transferred to another. A mechanismto transfer information through FFS and farmer participatory research from onearea to another would greatly expedite adoption on a wider scale. The informationtechnology component of the IPM CRSP also will be helpful in this regard. Wehave found that workshops, which allow participants from different countries andregions within countries, to come together and exchange information, is a good wayof exchanging information among researchers. Thus, researcher/farmer workshopsshould be an integral part of developing an IPM program. At another level, farmerparticipatory field studies and FFS is the most appropriate way to determine if thevarious tactics are applicable for specific locations and socio-economic settings.
6.4 Socioeconomic and Environmental Impacts
The impact on crop yields of IPM systems that reduce use of chemical inputs is pos-itive in most cases, translating into higher gross economic returns. Evidence fromfield sites where developing country farmer groups employ the IPM approach showsthat costs of inputs, because of dramatically reduced outlays for pesticides, decrease.

298 B.M. Shepard et al.
Thus, IPM farmers may enjoy higher profits than their traditional counterparts(Hammig and Rauf 1998, Hammig et al. 2008). Much of the economic evidenceis anecdotal, but results from Indonesia consistently show improved returns by IPMfarmers. A report by van den Berg (2004) analyzed 25 IPM impact evaluations.Although most of the examples were rice, they also included vegetables. The con-clusion was that farmers who had participated in FFSs reported substantial andconsistent reductions in pesticides attributable to the effects of the IPM training.Further, more pesticide reductions and higher farm-level revenues were realizedin vegetables than in rice. Clearly, the anticipated economic bottom line is a keydeterminant of farmers’ adoption of alternative production practices. Therefore it isimportant that analysts address long-term adoption patterns and the persistence ofthe benefits of IPM training. A survey of West Java vegetable farmers, some withIPM training and others without training, showed that the farmers with IPM trainingemployed more sustainable farming practices compared to untrained farmers, evenyears after the training had occurred (Norvell and Hammig 1999).
The IPM training routine includes comparisons of fields employing IPM andtraditional farmer practice. These comparisons are not just of what is happening topests and crop yields, but also the impact on market returns. Farmer groups keepcareful accounts of their expenses and the comparison of IPM and non-IPM resultsare the focus of group discussions during the training process. There is no doubtthat area-wide adoption of IPM is contingent on positive results in the marketplace.If adequate returns are not assured, then the traditional practice will dominate, evenafter training. Fortunately, sound application of IPM principles invariably results inbetter bottom lines for farmers.
Health benefits from IPM must be considered along with higher market returns.Farmers relying on chemical pesticides pose a significant danger to themselves,their families and their neighbors, not to mention the environment of rural areas.Sustainable IPM systems reduce human health and ecological risks by reducingthe volumes of many of the most toxic chemicals applied to crops. In a study fromVietnam, Murphy (2002) showed a direct correlation between frequency of pesticideapplications and farmer illnesses. Kishi et al. (1995) found that IPM-trained farmersin Indonesia make fewer pesticide applications to their crops and when they doapply pesticides, they use less toxic chemicals than comparable farmers who havenot participated in IPM training.
Impacts beyond the farm gate are meaningful components of comprehensive im-pact assessments. The highland vegetable areas of Indonesia, in almost all cases, aresituated upstream from major population centers. USAID/Jakarta has recognizedthe critical importance of upland water catchment areas and agricultural practiceson urban water systems by funding an Environmental Services Project (ESP). In co-operation with the Government of Indonesia, USAID is mounting a comprehensiveeffort to improve water quality in selected urban centers through improved land andagricultural management.
IPM programs are integral components of the ESP effort. Examples of this link-age include IPM training in West Java focused in the watershed feeding Jakartaand surrounding communities. Jakarta fresh vegetable markets are served from the

6 Implementing Integrated Pest Management in Developing and Developed Countries 299
mountainous region immediately to the south of the city. Local governments, Bo-gor Agricultural University, and international collaborators have been working withfarmers in that region to reduce the runoff of harmful chemicals through IPM train-ing for selected vegetable crops. Unfortunately, meaningful changes are constrainedby the relatively slow process of farmer education. Local government budgets forIPM training are limited, so reaching large numbers is a slow process (Hammiget al. 2008).
In North Sumatra, the headwaters of the Deli River that provides water to Medan,the provincial capital is another area of concentrated vegetable production. TheLembah Gulen (Vegetable Valley) at the foot of Sibayak Volcano is a relativelysmall area composed of two villages, where the population is almost entirely depen-dent on vegetable production for its livelihood. Traditional production systems aresimilar to those observed elsewhere. Tomatoes, cabbage, shallots, chilies, and othervegetables are grown in continuous rotations. Prior to the ESP project, productionsystems were chemical-intensive, and farmers were frustrated by poor response totheir control efforts. IPM training was first introduced in 2006, and farmers areeagerly adopting different approaches (Hammig et al. 2006). At the time of thiswriting, budget cuts to the ESP have reduced resources available for IPM in Lem-bah Gulen; however, farmers themselves are carrying on the program with somecontinuing support from the NGO, Farmer Initiatives for Ecological Literacy andDemocracy (FIELD) (Weinarto, personal communication).
In North Sulawesi, the Lake Tondano watershed provides another example of thelink between upland vegetable production systems and urban centers. The lake islocated in a mountain valley, and the Tondano River flows from the lake to Manado,another provincial capital. It drains into the Molucca Sea at Bunakan, an IndonesianNational Marine Park. The mountain slopes surrounding Lake Tondano are coveredby vegetable fields with the usual mix of crops growing year around. An earlier US-AID/Jakarta natural resource management program focused on environmental stew-ardship by local communities, spearheaded an effort to motivate local groups to seekbetter ways to improve the conditions of their environment. IPM training formed apart of this effort, and with assistance from scientists at Sam Ratulangi University,training programs were initiated for onion, cabbage, and tomato growers in the areain 1997 (Sembel, personal communication, 1998). Vegetable IPM continues to be ahigh priority activity for farmers and university scientists working in the area.
When farmers experience training for one of the selected crops, they recognizethe need for training on the other crops they plant as well. This presents a chal-lenge to IPM farmers and IPM trainers. Each crop has different pest managementproblems, and proposed alternatives for one crop may not be applicable to another.Therefore, the key to obtaining significant widespread impact is to establish a con-tinuous process of field monitoring, research, and experimentation with the farmeras the central figure. Farmers can be introduced to IPM principles through train-ing, and they can access technical support in critical times of need, but the greatestimpact occurs when farmers themselves do their own experiments, and learn withexperience how an ecological balance can be maintained in their fields while theycontinue to obtain positive economic returns.

300 B.M. Shepard et al.
Gender roles are important in determining socioeconomic impacts of IPM. InSoutheast Asia, gender roles in agriculture vary from region to region. In someareas, field work activities are differentiated by gender. For example, planting,weeding, harvesting, and/or pest management tasks such as spraying or hand pick-ing of pests may be jobs for which gender is the first order of selection.2 Withinthe household, women are responsible for child rearing and common householdtasks. Men do most of the heavy lifting, but by no means all. Data from thePhilippines indicates that in Nueva Ecija province, women manage the house-hold and farm budgets in the majority of cases (Hamilton et al. 2005). Therefore,IPM training, if it is to be effective, must be sensitive to gender roles in the pro-duction and management of the crops. Decision-making is the essential founda-tion of IPM, so it is essential that the key decision-makers are informed of theramifications of their choices. In Southeast Asia, trainers include both men andwomen, and they are sensitive to the need to ensure that there is no gender biasin selection of training groups. However, recognizing the need does not mean thatovercoming obstacles to attaining the ideal gender mix in IPM training is easilyaccomplished.
In the Philippines, Tanzo (2006) found that the following key gender-related is-sues must be considered for effective IPM training. Domestic tasks overlap withfield activities. In the field, women are frequently found weeding, handling pes-ticides and hand picking pests. Household tasks include clothes washing, foodpreparation, and family health care. Women are more involved in vegetable pestmanagement than with rice because of their frequent roles in field monitoring andhand picking. They are exposed to pesticides both in the field and while washingpesticide-soaked clothing. Daily schedules often conflict with IPM training pro-grams, so few women, relative to their importance in the decision-making process,can take advantage of IPM training opportunities.
Impacts of area-wide pest control efforts in Indonesia, implemented over thenearly 20 year history of IPM training, have yielded important benefits to farmers,the environment, and consumers of farm products. Evidence of these benefits isapparent from many studies addressing a range of issues. However, in Indonesiaand other countries in S.E. Asia with similar demographics, where over 40% of thepopulation is involved in production agriculture, the process of spreading the IPMmessage is slow. The best sign suggesting that there is significant momentum tothe IPM paradigm comes from farmers who have embraced IPM and who are theprimary motivators for engaging their peers.
The effect of educating farmers in FFS in an attempt to empower poor cottonfarmers to make better production management decisions and thus take greater con-trol of their lives in six developing countries in Asia was reported in Ooi et al.(2004, 2005). Using a double delta model enabled the FAO-EU IPM Program forCotton in Asia to use impact assessment both as a tool for strategic planning as well
2 In Central Java shallot fields the traditional pest control practice is for women to handpick pestegg masses from shallot plants at the same time that men apply chemical pesticide sprays.

6 Implementing Integrated Pest Management in Developing and Developed Countries 301
as quantifying the benefits of change brought about by IPM. That cotton farmersaveraged 23% increase in gross margin relative to the control group (USD$175/-per ha), suggests that the project was on target to improving farmer livelihoods andreducing poverty.
A similar effort to study the impact of FFS in sustainable vegetable productionin the Mekong region was reported by Ooi et al. (2007). This project has a largecomponent of IPM to ensure safe vegetable production.
6.5 Conclusions
This chapter discusses IPM strategies for developing country situations as they con-trast with strategies for developed countries. At their most basic, IPM strategieseverywhere are designed to provide acceptable pest control at some optimal level ofintervention. With IPM, pests are controlled in effective, environmentally friendlyways. To be effective, farmers must obtain pest control suitable for their crops in acost effective manner. To be environmentally friendly, the negative secondary effectsof pest control – water pollution, human exposure, harm to biodiversity, etc. – mustbe taken into account. Achieving these ends requires an astute decision-making pro-cess that is based on solid understanding of the consequences of actions taken. Thus,the farmer must have the critical information necessary to judge when to act andwhen not. Systems for providing and utilizing this information differ significantlybetween developed and developing country situations.
In developed countries, farms tend to be larger and farmers are, in general, bet-ter educated and better equipped to access information from outside the farmstead.Therefore, considerable success has been achieved by professional extension ser-vices that focus specifically on pest control issues, and private firms that providefarm-specific input to aid the decision process. In the end, the farmer determines theactions appropriate for his situation, but he is operating in a well-informed environ-ment for making those decisions.
In developing countries, large numbers of small farms operated by farmers hav-ing very limited resources – financial as well as knowledge-based – provide a verydifferent environment for IPM implementation. Farmer Field School training pro-grams, begun in Indonesia and expanded to developing countries worldwide, take avery different approach to farmer education with respect to pest control from IPMeducation in developed country situations. Farmers learn to closely monitor the ecol-ogy of their fields and to identify beneficial organisms as distinct from pests. IPMprinciples are simple, but field ecologies can be very complex. Thus, it is imperativethat strategies for developing countries are backed by a strong research infrastruc-ture as well as a commitment by national and local governments, NGOs, and inter-national institutions to invest heavily in continuing training and research programsto convey the lessons of IPM to small-scale, limited-resource farmers so that, in theend, farmers, rural communities, and the vast numbers of urban consumers all sharein the benefits of IPM.

302 B.M. Shepard et al.
Acknowledgments The authors’ thanks go to our farmer collaborators for helping to design andexecute the field studies. We thank the United States Agency for International Development forhelping to fund the work. Technical contribution number 5464 of the Clemson University Agricul-tural Experiment Station.
References
Alberto, R.T., Duca, M.V. and Miller, S.A. 2003. Management of Anthracnose (Colletotrichumgloeosporiodes) a disease of increasing importance in onion. In: Management Entity of the IPMCRSP (eds), IPM CRSP Integrated Pest Management Collaborative Research Support Progra-mme, Tenth Annual Report, 2002–2003. Virginia Tech University, Blacksburg, Virginia. 48–51.
Anonymous. 2001. South Carolina Fresh Fruit and Vegetable Report. State of South Carolina,Columbia, SC.
Carson, R. 1962. Silent Spring. Houghton Mifflin, Boston, Massachusetts. 386.CAST (Council for Agricultural Science and Technology). 2003. Integrated Pest Management:
Currrent and Future Strategies. Task Force Report No. 140. 246.Chalfant, R.B., Denton, W.H. Schuster, D.J. and R.B. Workman. 1979. Management of cabbage
caterpillars in Florida and Georgia by using visual damage thresholds. Journal of EconomicEntomology 72: 411–413.
Dent, D. 1991. Insect Pest Management. C. A. B. International, Redwood Press, Whitshire, pp. 604.Dilts, R. 1990. IPM and farmer empowerment: the marriage of social approaches and technological
content. In: Third International Conference on Plant Protection in the Tropics, Malaysian PlantProtection Society, Genting Highlands, Pahang, p. 24.
FAO. 2007. Major Food and Agricultural Commodities and Producers. FAO, Rome(http:/www.fao.org/es/ess/top/country.html).
Francis, R.L., Smith, J.P. and Shepard, B.M. 2005. Integrated Pest Management for Cabbage andCollard: A Growers’ Guide. Clemson University PSA. Booklet No. EB 156. 31pp.
Gallagher, K.D. 1990. Implementation of integrated pest (plant?) management. In: Third Inter-national Conference on Plant Protection in the Tropics. Malaysian Plant Protection Society.Genting Highlands, Pahan, p. 100.
Gapasin, R., Judal, M.V., Pile, C., Gergon, E.B., Gapod, V. and Obien, S.R. 1998. Alternative man-agement strategies against rice root-knot nematode, Meloidogyne graminicola, in rice-onionsystem. Philippine Technology Journal 23:69–75.
Gergon, E.B., Gapasin, R.M., Padua, L.E., Donayre, D.K.M., Antolin, M.M. and Miller, S.A.2003. Management of soil-borne diseases of onion with selected biological control agents andsoil admendments. In: Management Entity of the IPM CRSP (eds), IPM CRSP Integrated PestManagement Collaborative Research Support Programme, Tenth Annual Report. 2002–2003.Virginia Tech University, Blacksburg, Virginia, pp. 67–77.
Greene, G.L. 1972. Economic damage threshold and spray interval for cabbage looper control oncabbage. Journal of Economic Entomology 65:205–208.
Hamilton, S., Moore, K., Harris, C. Erbaugh, M., Tanzo, I., Sachs, C. Asturias de Barrios, L. 2005.Gender and IPM. In: Norton, G.W., Heinrichs, E.A., Luther, G.C. and Irwin, M.E. (eds), Glob-alizing Integrated Pest Management: A Participatory Research Process. Blackwell PublishingCo., Ames, Iowa, pp. 263–293.
Hammig, M.D. and Rauf, A. 1998. West Java soybean and vegetable production efficiency. Journalof Plant Protection in the Tropics 11:15–21.
Hammig, M.D., Shepard, B.M. and Carner, G.R. 2006. Ecologically-based Participatory IPM forSoutheast Asia. IPM CRSP Trip Report. Clemson University, Clemson, South Carolina.
Hammig, M. D., Shepard, B. M., G. R. Carner, R. Dilts and A. Rauf. 2008. Areawide pest man-agement for non-rice food crops in Southeast Asia. In: O. Koul, G. Cuperus and N. Elliot (eds),Areawide Pest Management: Theory and Implementation. CAB International, pp. 326–350.

6 Implementing Integrated Pest Management in Developing and Developed Countries 303
Harcourt, D.G., Backs, R.H. and Cass, L.M. 1955. Abundance and relative importance of caterpil-lars attacking cabbage in eastern Ontario. Canadian Entomologist 87:400–406.
Heong, K.L., Escalada, M.M., Huan, N.H. and Mai, V. 1998. Use of communication media inchanging rice farmers’ pest management in the Mekong Delta, Vietnam. Crop Protection.17: 413–425.
Kenmore, P.E. 2006. Delivering on a promise outside the USA, but inside the same globalizedworld. Presentation at The Fifth National IPM Symposium. 4–6 April, St. Louis, Missouri.
Kenmore, P.E., Carino, F.O., Perez, C.A., Dyck, V.A. and Gutierrez, A.P. 1984. Population regu-lation of the rice brown planthopper (Nilaparvata lugens) within rice fields in the Philippines.Journal of Plant Protection in the Tropics 1:19–37.
Khan, M.F.R. 1998. An Integrated System for Managing Diamondback Moth of Collards in Lex-ington County, South Carolina. Ph.D. dissertation, Clemson University, Clemson, SC.
Kishi, M. 2002. Farmers’ perceptions of pesticides, and resultant health problems from exposures.International Journal of Occupational and Environmental Health 8:175–181.
Kishi, M. Hirshchorn, N., Djajadisastra, M., Saterlee, L.N., Strowman, S. and Dilts, R. 1995. Re-lationship of pesticide spraying to signs and symptoms in Indonesian farmers. ScandinavianJournal of Work, Environment and Health 21:124–133.
Kogan, M. 1998. Integrated pest management: Historical perspectives and contemporary develop-ments. Annual Review of Entomology 43:243–270.
Maltais, P.M., Nuckle, J.R. and LeBlanc, P.V. 1994. Economic thresholds for management of lepi-dopterous larvae on broccoli in southeastern New Brunswick. Journal of Economical Entomol-ogy 87:766–774.
Maltais, P.M., Nuckle, J.R. and LeBlanc, P.V. 1998. Economic threshold for three lepidopterouslarval pests of fresh-market cabbage in southeastern New Brunswick. Journal of EconomicalEntomology 91:699–707.
Maredia, K.M., Dakouo, D., Mota-Sanchez, D. (eds) 2003. Integrated Pest Management in theGlobal Arena. CABI Publishing. 512.
Metcalf, R.L. and Luckman W.H. (eds). 2004. Introduction to Insect Pest Management. John Wileyand Sons, NY.
Miller, S.A., Razzaul Karim, A.M.N., Baltazar, A.M., Rajotte, E.G. and Norton, G.W. 2005. De-veloping IPM packages in Asia. In: Norton G.W., Heinrich, E.A., Luther, G.C. and Irwin, M.E.(eds), Globalizing Integrated Pest Management: A Participatory Research Process. Blackwell,Ames, Iowa, pp. 27–50.
Murphy, H.H. 2002. A Farmer Self-surviellance System of Pesticide Poisoning. FAO CommunityIntegrated Pest Management in Asia. Mimeo. FAO, Rome.
Murphy, H.H., Sanusi, A., Dilts, R., Djajadisastra, M., Hirshhorn, N. and Yuliatingsih, S. 1999.Health effects of pesticide use among Indonesian women farmers. Part 1: Exposure and acutehealth effects. Journal of Agromedicine. 6:61–85.
Norton, G.W., Heinrich, E.A., Luther, G.C. and Irwin, M.E. (eds) 2005. Globalizing IntegratedPest Management: A Participatory Research Process. Blackwell Publishing. 338.
Norvell, S.D. and Hammig, M.D. 1999. Integrated pest management training and sustainable farm-ing practices of vegetable growers in Indonesia. J. Sust. Agr. 13:85–101.
Norton, G. W., and Mullen, J. 1994. Economic evaluation of integrated pest management programs:A literature review. Virginia Polytechnic Institute and State University, Blacksburg, Virginia,Extension Publication, pp. 448–520.
Olsen, L. Zalon, F. and Adkisson, P. 2003. Integrated Pest Management in the USA. In: Maredia,K. M., Dakouo, D., Mota-Sanchez, D. (eds) 2003. Integrated Pest Management in the GlobalArena. CABI Publishing, Cromwell Press, pp. 249–271.
Ooi, P.A.C., 1992. Role of parasitoids in managing diamondback moth in the Cameron Highlands,Malaysia. In: Talekar, N. S. (ed), Diamondback Moth and Other Crucifer Pests. Proceedings ofthe Second International Workshop. AVRDC, Shanhua, Taiwan, pp. 255–262.
Ooi, P.A.C., Lim, G.S., Ho, T.H., Manalo, P.L. and Waage, J. (eds) 1992. Integrated Pest Manage-ment in the Asia-Pacific Region. Proceedings of the Conference on Integrated Pest Managementin the Asia-Pacific Region. 23–27 Dept. 1991. CAB International. 439.
304 B.M. Shepard et al.
Ooi, P.A.C. and Shepard, B.M. 1994. Predators and parasitoids of rice insect pests. In: HeinrichE.A. (ed), Biology and Management of Rice Insect Pests. Wiley Eastern Ltd. pp. 585–612.
Ooi, P.A.C., Walter-Echols, G. Dai, W.D., Morales-Abubakar, A.L., Lim, G.S., Pachagounder, P.,Soomro, M.H., Galvan, C., Mancini, F., Petersen, R. and Kamp, K. (eds) 2004. EnvironmentalEducation for Poor Farmers FAO-EU IPM Programme for Cotton in Asia. Food and AgricultureOrganization, Regional Office Asia and Pacific, Bangkok THAILAND 62 pp.
Ooi, P.A.C., Praneetvatakul, S., Waibel, H. and Walter-Echols, G. (eds) 2005. The Impact of theFAO-EU IPM Programme for Cotton in Asia. Publication Series Special Issue No. 9. UniversitatHannover, GERMANY 123 pp.
Ooi, P.A.C., Canillas, M.D.B. and Yambao, R.T. 2007. SDC-AVRDC Partnership – PromotingSustainability: Beyond Capacity Building. AVRDC-ARC, Bangkok, Thailand 71 pp.
Pedigo, L.P. 1989. Entomology and Pest Management. MacMillan Publishing Company, NY,p. 646.
Pimentel, D. (ed) 1991. Handbook of Pest Management in Agriculture. 2nd Edn, Vol 1–3. CRCpress. Boca Raton, FL, p. 2271.
Pontius, J., Dilts, R. and A. Bartlett, A. 2002. From farmer field schools to community IPM: Tenyears of IPM training in Asia. FAO Community IPM Programme, Food and Agriculture Orga-nization of the United Nations. Regional Office for Asia and the Pacific. RAP/2002/15. 106.
Sastrosiswojo, S. and Sastrodihardjo, S. 1986. Status of biological control of diamondbackmoth by introduced parasitoid, Diadegma eucerophaga in Indonesia. In: Diamondback mothManagement, Telekar, N.S. and Griggs, T. D. (ed), Proceedings of the First InternationalWorkshop, Tainan, Taiwan, Asian Vegetable Research and Development Centre. Taiwan,185–194.
Sastrosiswojo, S. and Setiawati, W. 1992. Biology and control of Crocidolomia binotalis in Indone-sia. In: Telekar, N. S. (ed), Diamondback Moth and Other Crucifer pests: Proceedings of theSecond International Workshop. December 1990. Tainan, Taiwan, Asian Vegetable Researchand Development Center, Publication no. 92–368.
Settle, W.H., Ariawan, H., Astuti, E.T., Cahyana, W., Hakim, A.L., Hindayana, D., Lestari, A.S.,Pajarningsih and Sartanto. 1996. Managing tropical rice pests through conservation of general-ist naturalist enemies and alternative prey. Ecology 77:1975–1988.
Shelton, A.M., Andaloro, J.T. and Barnard, J. 1982. Effects of cabbage looper, imported cabbage-worm, and diamondback moth on fresh market cabbage and processing cabbage. Journal ofEconomic Entomology. 75:742–745.
Shelton, A.M., Sears, M.K., Wyman, J.A. and Quick, T.C. 1983. Comparison of action thresh-olds for lepidopterous larvae on fresh-market cabbage. Journal of Economic Entomology76:196–199.
Shepard, M. 1973. A sequential sampling plan for treatment decisions on the cabbage looper oncabbage. Environmental Entomology 2:901–903.
Shepard, B.M. and Barrion, A.T. 1998. Parasitoids of insects associated with soybean and vegetablecrops in Indonesia. Journal of Agriculture and Entomology 15:239–272.
Shepard, B.M., Barrion, A.T. and Litsinger, J.A. 2000. Helpful Insects, Spiders and Pathogens:Friends of the Rice Farmer. International Rice Research Institute, Los Banos, Philippines.pp 127.
Shepard, B.M., Braun, A. Rauf, A. and Samsudin. 1996. Liriomyza huidobrensis: A newly intro-duced pest of vegetables. Palawija and Vegetable Newsletter 1: 2.
Shepard, B.M., Carner, G.R., Barrion, A.T., Ooi, P.A.C. and van den Berg, H. 1999. Insects andTheir Natural Enemies Associated with Vegetables and Soybean in Southeast Asia. QualityPrinting Company, Orangeburg, SC. 108.
Shepard, M., Carner, G.R. and Turnipseed, S.G. 1977. Colonization and resurgence of insect pestsof soybean in response to insecticide and field isolation. Environmental Entomology 6:501–506.
Shepard, B.M., Shepard E.F., Carner, G.R., Hammig, M.D., Rauf, A. and Turnipseed, S.G. 2001.Integrated pest management reduces pesticides and production costs of vegetables and soybeanin Indonesia: Field studies with local farmers. Journal of Agromedicine 7:31–66.

6 Implementing Integrated Pest Management in Developing and Developed Countries 305
Shepard, E.F., Shepard, B.M. and Rauf, A. 1996. Virus of Spodoptera exigua. Palawija and Veg-etable Newsletter 1(1):2–3.
Shepard, B.M. and Shellhorn, N.A. 1997. A Plutella/Crocidolomia management programme forcabbage in Indonesia. In: Proceedings of the Third International Symposium on Management ofDiamondback Moth and Other Crucifer Pests. Kuala Lumpur, 29 October–1 November, 1996.262–266.
Smith, R.F. and Reynolds, H.T. 1966. Principles, definitions and scope of integrated pest control.Proceedings FAO Symposium in Integrated Pest Control 1:11–17.
Smith, J.P. and Shepard, B.M. 2004. A binomial sequential sampling plan using a composite thresh-old for caterpillar management in fresh market collard. Journal of Agricultural and UrbanEntomology/South Carolina Entomological 21: 171–184.
Stern, V.M., Smith, R., van den Bosch, R. and Hagen, K. 1959. The integrated control concept.Hilgardia 29:81–101.
Stewart, J.G.G. and Sears, M.K. 1988. Economic threshold for three species of lepidopterouslarvae attacking cauliflower grown in southern Ontario. Journal of Economic Entomology81:1726–1731.
Tanzo, I. 2006. IPM and social science. Presentation at Ecologically Sensitive Participatory IPMfor S.E. Asia Workshop. Ciloto, West Java.
van den Berg, H. 2004. IPM Farmer Field Schools: A synthesis of 25 impact evaluations. Preparedfor the Global IPM Facility. Wageningen University. Wageningen, Netherlands. 53.
van den Berg, H. Aziz, A. and Machrus, M. 2000. On farm evaluation of measures to monitor andcontrol soybean pod-borer, Etiella zinckenella in East Java, Indonesia. International Journal ofpest Management 46:219–224.
van den Berg, H., Shepard, B.M. and Nasikin. 1998. Damage incidence by Etiella zinckenellaand Helicoverpa armigera in soybean in East Java, Indonesia. International Journal of pestManagement 44:153–159.
Vos, J.G.M. 1994. Integrated Pest Management of Hot Pepper (Capsicum spp.) in the TropicalLowlands. Ph.D. Thesis. Wageningen Agricultural University, Wageningen.
Vos, J.G.M. and Frinking, H.D. 1998. Pests and diseases of hot pepper (Capsicum spp.) in tropicallowlands of Java, Indonesia. Journal of Plant Protection in the Tropics. 11:53–71.
Zhao, J.-Z., Collins, H.L., Li, Y.-X., Mau, R.F.L., Thompson, G.D., Hertlein, M., Andaloro, J.T.,Boykin, R. and Shelton, A.M. 2006. Monitoring of diamondback moth resistance to spinosad,indoxacarb, and emamectin benzoate. Journal of Economic Entomology 99:176–181.

Chapter 7Moving On: Farmer Education in IntegratedInsect Pest and Disease Management
Janice Jiggins and Francesca Mancini
Abstract This chapter explores intensive hands-on occupational education for farm-ers in selected European, African, Latin American countries and in south India.An Indian case study of Farmer Field Schools for Integrated Pest and ProductionManagement (IPPM) to ensure food security and livelihood improvement is pre-sented, to introduce discussion of the role of IPPM beyond improving agricultureproductivity. Does it enable farmers to adopt practices that move food and farmingsystems toward a low carbon economy? Does it help mitigate the effects of climatechange? Does it help small farmers reach the combined goals of sustainability anddevelopment?
India is experiencing unprecedented economic growth, based primarily on ser-vice sector development, yet income inequalities are widening and the number ofpoor – 300–400 million living mainly in rural areas – is not decreasing as a con-sequence of a deepening agrarian crisis. Agriculture for marginal farmers providesthe major part of their family’s nutritional requirements; however, it is no longerthe primary source of income, neither does it ensure food security. Climatic changeeffects, with higher temperatures and less rainfall, have reduced further the viabilityof farming in drought-prone areas. The tendency is for millions of poor farmers toleave agriculture, aspiring to join the service sector but more commonly ending upamong the urban destitute.
The prospect for agriculture in India is thought to lie in a mix of high scienceapplied in favourable areas to sustain the grain, legume, and oil seed output neededfor basic food security; for high value crops for the rising domestic consumer andexport markets; expanded investment in market-led enterprise development andskills training in rural areas; and renewed attention to farm-based livelihoods andagro-ecosystem functioning, especially in rainfed farming. This chapter addresseslivelihoods and agro-ecosystem functioning, and specifically the role of IPPM asa means for strengthening agro-ecosystem resilience in the face of environmentalchanges.
J. Jiggins (B)Communication and Innovation Studies, Wageningen University Research, The Netherlandse-mail: [email protected]
R. Peshin, A.K. Dhawan (eds.), Integrated Pest Management: Disseminationand Impact, DOI 10.1007/978-1-4020-8990-9 7,C© Springer Science+Business Media B.V. 2009
307

308 J. Jiggins and F. Mancini
Keywords Farmer education · Integrated Insect Pest and Management · recentexperiences · India and rest of world
7.1 Introduction
Agricultural development effort over the last half century has focussed on the intro-duction of new technology and practices for increasing yield, and on the strength-ening of agricultural services and markets. At the same time, governments in de-veloping countries have struggled to provide to all citizens a general school-basededucation, focussing on primary-level numeracy and literacy, even in remote rurallocations. But there has been a big gap in provision that is in itself hard to under-stand: the lack of serious effort to provide and sustain occupational education thataddresses the core tasks of the majority of rural people, that is, their farming andpost-harvest enterprises. This chapter addresses recent efforts to develop farmer-centred occupational education, in particular in relation to the management of insectpests and diseases.
Our principal concern is to explore by means of a case study from India thecontribution of Farmer Field Schools (FFSs) to the provision of occupational edu-cation in Integrated Pest and Production Management (IPPM). However, we beginby briefly presenting examples of innovation in the way that opportunities to learnabout integrated management of insect pests and diseases are being brought to farm-ers in other parts of the world. We do this in order to provide a frame of reference fordiscussing in the third section the potential of combining different ways of providingoccupational education to farmers in India.
Although we take IPPM as our theme we believe the lessons we draw may havemuch wider application. Recent scientific assessments provide strong evidence thatagriculture is substantially implicated in the exhaustion and degradation of naturalresources (Comprehensive Assessment of Water Management in Agriculture, 2007),negatively impacts biodiversity and ecological function (MEA, 2005), is a largeemitter of the gases forcing climate change (IPCC, 2007), and that the costs areunequally distributed among income classes (Srinivasan et al., 2007). Many effortsare ongoing throughout the world to reduce these impacts on the one hand and on theother to move toward creating agricultures that absorb carbon and sustain ecologicalfunctioning. The two outstanding characteristics that these efforts share is that they(i) require farmers to make informed, site-dependent decisions based on a thoroughunderstanding of the principles of what tends toward sustainability; and (ii), dependon the millions of small farmers becoming organised to take the lead or enter intoeffective partnerships with other organisational actors to defend their ‘freedom tooperate’ in a highly unequal competitive marketplace. Obviously, simple ‘transferof technology’, extension campaigns and mass media messages will continue to playtheir part in bringing about change. Yet the key message is that resilient, sustainableagro-ecologies require confident farmers, well-educated in their occupation, whohave the skills to learn and who are able to network and organise for self-directedchange. We return to these points in Part III.

7 Farmer Education in Integrated Insect Pest and Disease Management 309
7.2 Part 1: Innovations in IPM Education from Aroundthe World
We present here initiatives in six European countries, the push-pull program in EastAfrica and mobile plant health clinics in various countries in Latin America. To-gether they represent ‘cutting edge’ practices that seek to extend farmers’ access toknowledge and knowledge products and to offer new means for farmers to gener-ate their own reliable site-specific knowledge. They also represent new pathwaysfor closing institutional gaps. Institutional failures, under development trajectoriesled either by Green Revolution actors or more recently by private industry, so farhas prevented the placement of science in society in ways that are effective for thecombined goals of sustainability and development for the mass of the rural poor.
7.2.1 Assorted European Initiatives
A new Directive for the Sustainable Use of Pesticides1 and a new Regulation2 forthe placing of pesticides in the European Union (EU) market were adopted by theEuropean Commission in July 2007 and completed the approval process by the Eu-ropean Parliament and Council of Ministers in January 20083. The provisions in theDirective include training activities to raise public awareness, compulsory checks onspraying equipment, a ban with restrictions on aerial crop-spraying, establishmentof ‘reduced’ or ‘pesticide-free’ areas, measures to protect water resources and thecompulsory implementation in all Member States (MS) of Integrated Pest Manage-ment (IPM) from 2014 onwards. IPM is defined as:
Careful consideration of all available pest control techniques and subsequent integration ofappropriate measures that discourage the development of pest populations and keep plantprotection products and other forms of intervention to levels that are economically justi-fied and reduce or minimise risks to human health and the environment. Integrated pestmanagement emphasises the growth of a healthy crop with the least possible disruption toagro-ecosystems and encourages natural control mechanisms
This definition is in line with the definition in the FAO Code of Conduct that al-ready has been agreed by FAO Member States, CropLife International (the umbrellaorganisation of the crop protection industry) and non-government organisations.However, the Directive leaves open to MS how far they want to go in pushing re-duction of use of crop protection chemicals and in risk avoidance, providing fundingto support farmers to take up IPM, and introducing alternative options as standardpractice. There are no specific measures for collecting and dealing with stocks ofobsolete pesticides.
1 http://ec.europa.eu/environment/ppps/home.htm2 http://ec.europa.eu/dgs/health consumer/dyna/press room en.cfm3 Directive 2008/17/EC; Regulation No149/2008

310 J. Jiggins and F. Mancini
The Regulation maintains the current dual system of approval of substances bythe EU and approval of products by MS. However, it introduces a positive obliga-tion to replace riskier pesticides with safer alternatives and requires the adoptionof hazard-based criteria for the approval of substances. Very hazardous substancesare no longer accepted4. Substances defined as very hazardous include Carcino-genic, Reprotoxic or Mutagenic (CRM) categories I and II as defined by Direc-tive 67/548/EEC; Persistent, Bio-accumulative, and Toxic (PBT) substances; verypersistent, very bio-accumulative (vPvB) substances; Persistent Organic Pollutants(POPs), as defined by the Stockholm Convention; and those listed under EU Com-munity or internationally agreed test guidelines that consider substances with en-docrine disrupting properties. However, the approval criteria in effect remove veryfew of the currently used substances from the market altogether.
A new element in the registration and approval procedure is that protection ofchildren and vulnerable groups is specifically mentioned as an obligatory criterionin the assessment procedure but a methodology to assess safety factors in settingMaximum Residue Limits (MRLs) and Acute Reference Doses is missing, as arecriteria for defining Low Risk Substances (which enjoy a simplified registrationprocess). Further, the Regulation appears to give more weight to market efficiencycriteria than to health and environment considerations. For instance, the designationof zones, within which products authorised for sale in one country are automati-cally authorised for all countries in that zone, has been revised on market efficiencygrounds. The new ‘zonal authorisation’ boundaries bizarrely couple unlike agro-ecosystems and unlike climates5. The zonal designations may threaten countriessuch as the Netherlands, Sweden and Denmark with the re-introduction to theirmarkets of a number of products they have successfully removed from sale. How-ever, some authorities think, to the contrary, that the designation will push standardswithin the zones toward IPM best practices and clear the more toxic products frommarkets where regulation has been weakest.
The EC estimates the agreed measures will lead overall to a 13 per cent reductionin pesticide use. Some MS already are forging ahead regardless, aiming to achieveuse reduction levels considerably above this level. The urgent necessity of doingso has been unequivocally demonstrated by the EC’s own monitoring report, thatcovered 60,450 food samples (European Commission, 2006). It showed that 40%contained pesticide residues with an additional 3% containing levels in excess of
4 The hazardous substances covered are given in Annex I of Regulation No149/2008 of29 January 2008; they include acephate, acetamiprid, acibenzolar-S-methyl, aldrin, benalaxyl,benomyl, carbendazim, chlormequat, chlorothalonil, chlorpyrifos, clofentezine, cyfluthrin, cyper-methrin, cyromazine, dieldrin, dimethoate, dithiocarbamates, esfenvalerate, famoxadone, fen-hexamid, fenitrothion, fenvalerate, glyphosate, indoxacarb, lambda-cyhalothrin, mepanipyrim,metalaxyl-M, methidathion, methoxyfenozide, pymetrozine, pyraclostrobin pyrimethanil, spirox-amine, thiacloprid, thiophanate-methyl and trifloxystrobin.. The MRLs are given in Annexes II,III, IV.5 North – Denmark, Estonia, Latvia, Lithuania, Finland, Sweden; Centre - Belgium, CzechRepublic, Germany, Ireland, Luxembourg, Hungary, Netherlands, Austria, Poland, Slovenia,Slovakia, United Kingdom; South – Greece, Spain, France, Italy, Cyprus, Malta, Portugal.

7 Farmer Education in Integrated Insect Pest and Disease Management 311
EC MRLs. An analysis of pesticide residues in eight fruit samples on sale in theGB Express Supermarket (owned by Carrefour, Belgium, one of the world’s leadingsupermarket chains) that is located in the European Parliament building, Brussels,revealed the presence of 28 toxic pesticides, averaging almost five residues per fruit;none were uncontaminated (PAN Europe, 2007a). Three of the samples containedpesticide residues in excess of EC MRLs (in the case of oranges from Spain, thelevel of imazalil, a known carcinogen, was 40% above the Acceptable Daily Intakefor a 5 year old, who would also eat 70% of the Acute Reference Dose by eatingjust one orange).
A six-country case study (PAN Europe, 2007b) showcases successful strategiesthat farmers are adopting ahead of the new Directive and Regulation. They demon-strate that competitive and effective alternatives to harmful pesticides exist thatcan be brought into widespread practice when supported by creative institutionalchanges. The cases6 are briefly highlighted in turn. It is not possible to give compar-ative data for these countries on trends in pesticide use, active ingredients or salesbecause of differences in the ways that data have been collected between countriesand over time. The new European Directive will considerably aid the effort to collectand register uniform data in future years.
7.2.1.1 Belgium
A not-for-profit fruit farmers’ association in Wallonia, Belgium, supports IPM infruit production in approximately two-thirds of the fruit growing area in the region.It has developed standards for Integrated Production (IP) based on guidelines issuedby the International Organisation for Biological and Integrated Control of NoxiousAnimals and Plants (IOBC). The guidelines include, for instance, requirements toplant or preserve natural hiding places for beneficial insects, placement of nest boxesand perches for birds, planting or enrichment of mixed hedges around the orchards,and specification of permitted weed management and of the alleys between rows.Soil fumigation and bare soil between trees are not permitted.
Permitted pesticides are confined to those listed in the guidelines. All pesticidesare classified as either ‘green’ – may be used when use is justified; or ‘yellow’ – maybe used only when no ‘green’ product is suitable; or ‘orange’ – may be used only ifnecessity is established and permission granted by the association. Pesticides on a‘red’ list are prohibited; growers cannot use more than two products on the orangelist per year per hectare. The association provides training to its member farmersbased on group meetings through the year, typically held in a grower’s orchard,organises field visits and study trips, provides a warning service for major pests anda telephone advisory service. A members’ marketing cooperative, operating underthe label, FRUITNET, has captured 12% of the Belgian pome fruit market, througha supermarket chain (Delhaize-Le-Lion), selling through 120 national outlets.
6 The full report can be read on www.pan-europe.info

312 J. Jiggins and F. Mancini
7.2.1.2 Denmark
Here the initiative was taken at the political level, with the launch of the first Pes-ticide Action Plans (PAPs) in 1986, as politicians became alarmed at the evidenceof contamination of food and water resources by pesticides. Wild plant diversityin farmland for instance decreased by 60% from 1970 to 1990. The aim from thestart has been to use the PAPs to reduce pesticide use. The 1985–1997 PAP targeteda 25% reduction in total pesticide consumption by 1992 and 50% by 1997. The1997–2003 PAP introduced a new monitoring and control instrument, the ‘indicatortreatment frequency index’7; farmers were required to register data on their ‘treat-ment frequency’ per crop/season, with the aim of reducing this to 2.0 by 2003.The PAP also established 20,000 hectares of pesticide-free zones along the marginsof waterways and lakes. The current PAP, 2003–2009, aims to reduce the treatmentfrequency to below 1.7, to promote pesticide-free cultivation, establish an additional25,000 ha pesticide free margins along waterways and lakes. While the first andsecond PAPs impacted mainly arable and grassland, the current PAP includes alsofruit and vegetable production.
The farmers’ organisations, that in Denmark provide by far the majority of advi-sory activities, responded by developing information materials and services to helpfarmers make the transitions required. A key to changing farmers’ decision-makingand behavior have been the plant protection groups, established from 2001 onwards,that meet in the field several times during a season, to observe, measure and dis-cuss the options. Changes also were introduced in the pesticide approval scheme.Some 209 pesticide active ingredients were reassessed at the beginning of the 1990sand only 78 were given renewed approval. The government also used the ‘stick’ ofchanges in taxation, replacing the former 3% charge on wholesale turnover by anad valorem tax (value added tax) on pesticides, herbicides and fungicides. Currentlythe tax amounts to 34% of the wholesale price of herbicides and fungicides and 54%for pesticides. Thirteen per cent of the revenue from the tax is retained by the gov-ernment to cover the costs of the approval and regulatory authorities and research;83.5% is returned to farmers through funds targeted to maintain the resilience ofthe farm sector. Danish farmers indeed now use more than 50% less pesticides (byactive ingredient) than they did twenty years’ ago; a drop from some 7000 tonnes ofsolid active pesticide ingredient to 3000 tonnes. Water quality has improved twofold,the number of domestically produced food samples with detectable residues hasmarkedly decreased – and the economic consequences for farmers has been neutralor positive.
Robust analyses pinpoint as decisive factors in this success as: decisive politicalleadership (sustained through three cycles of PAPs), clear targets and indicators, arevision of all substances permitted for sale on the Danish market, introduction ofbuffer zones to protect water resources and mandatory record keeping by farmers.
7 The treatment frequency index expresses the average number of times an agricultural plot can betreated with the recommended dose, based on the quantities sold.
7 Farmer Education in Integrated Insect Pest and Disease Management 313
The PAPs in addition have provided comprehensive and independent training, im-plemented largely through Denmark’s network of strong farmers’ organisations.
7.2.1.3 Switzerland
Switzerland has achieved a 40% reduction in insecticide (including acaricide) salesover the five years 2000–2005, and from just under 16,000 tons active ingredient to14,000 tons active ingredient for all agro-chemicals8, an overall decrease of 11.6%.It has done so in part by directing the subsidy program (that almost all farmers areeligible for) toward regulations that require farmers to adopt minimum ecologicalstandards. These include limiting the use of pre-emergence pesticides, using pestwarning services and prognosis models when taking pest management decisionsand testing spray equipment at least once every four years. Farmers can accessfurther subsidies if they demonstrate additional substantial decreases in pesticideuse: in 2004, 11,000 cereal farmers, 13,000 animal fodder producers, and 2000rape seed producers enjoyed these additional payments. The second main pillar ofSwiss efforts to reduce pesticide use is the development and wide application ofIntegrated Production (IP) protocols. Over 18,000 farmers have joined IP Suisse, afarmers’ association that works to support its members in adopting strict measures.Together they have grown 110,000 tonnes of wheat, 30,000 tonnes of potatoes and2000 tonnes of rapeseed. Over 3000 of Switzerland’s 4000 professional fruit grow-ers grow IP certified fruit and account for the main output of apples, strawberriesand raspberries. All major retailers and food processors in Switzerland sell IP Su-isse products, including Migros, Switzerland’s largest supermarket chain. Further,in Switzerland all McDonald’s buns are baked from IP Suisse certified wheat and63% of its meat and 30% of its rapeseed oil are from IP Suisse farms.
7.2.1.4 Netherlands
The Netherlands is the second largest exporter of agricultural products, by value, inthe world (at 40.9 billion Euros, compared to USA’s 57.2 billion Euros, 2003 data).Dense human settlement, highly intensive production in the presence of three largeriver systems, numerous waterways and drainage canals and mounting evidence ofthe harmful effects of agricultural pollution, coupled with increasing public pressureto move toward safe, productive and profitable management of the ‘green space’commanded by agriculture, meant that by the mid 1980s the government had to actto restrain pesticide use. It forced through a new policy requiring within a specifiedtime period major reductions in the amount of active ingredients reaching the soils,water and air but it left it up to the agricultural industry how to achieve these targets.By the turn of the century the easy gains had been made: over-use had been elim-inated, less toxic products were brought into use, glasshouses made greater use of
8 Rodenticides, insecticides, aracnicides, fungicides, bactericides, seed treatments, plant growthregulators, herbicides.
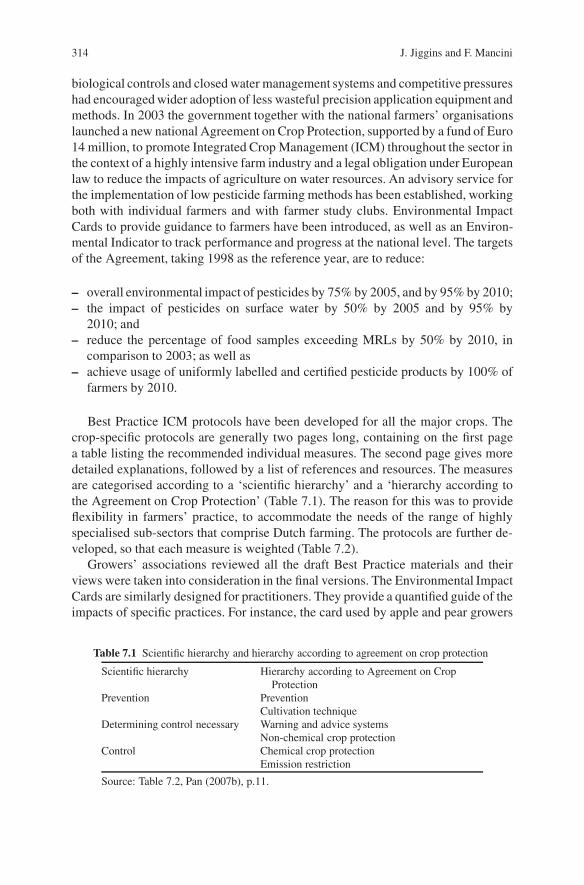
314 J. Jiggins and F. Mancini
biological controls and closed water management systems and competitive pressureshad encouraged wider adoption of less wasteful precision application equipment andmethods. In 2003 the government together with the national farmers’ organisationslaunched a new national Agreement on Crop Protection, supported by a fund of Euro14 million, to promote Integrated Crop Management (ICM) throughout the sector inthe context of a highly intensive farm industry and a legal obligation under Europeanlaw to reduce the impacts of agriculture on water resources. An advisory service forthe implementation of low pesticide farming methods has been established, workingboth with individual farmers and with farmer study clubs. Environmental ImpactCards to provide guidance to farmers have been introduced, as well as an Environ-mental Indicator to track performance and progress at the national level. The targetsof the Agreement, taking 1998 as the reference year, are to reduce:
– overall environmental impact of pesticides by 75% by 2005, and by 95% by 2010;– the impact of pesticides on surface water by 50% by 2005 and by 95% by
2010; and– reduce the percentage of food samples exceeding MRLs by 50% by 2010, in
comparison to 2003; as well as– achieve usage of uniformly labelled and certified pesticide products by 100% of
farmers by 2010.
Best Practice ICM protocols have been developed for all the major crops. Thecrop-specific protocols are generally two pages long, containing on the first pagea table listing the recommended individual measures. The second page gives moredetailed explanations, followed by a list of references and resources. The measuresare categorised according to a ‘scientific hierarchy’ and a ‘hierarchy according tothe Agreement on Crop Protection’ (Table 7.1). The reason for this was to provideflexibility in farmers’ practice, to accommodate the needs of the range of highlyspecialised sub-sectors that comprise Dutch farming. The protocols are further de-veloped, so that each measure is weighted (Table 7.2).
Growers’ associations reviewed all the draft Best Practice materials and theirviews were taken into consideration in the final versions. The Environmental ImpactCards are similarly designed for practitioners. They provide a quantified guide of theimpacts of specific practices. For instance, the card used by apple and pear growers
Table 7.1 Scientific hierarchy and hierarchy according to agreement on crop protection
Scientific hierarchy Hierarchy according to Agreement on CropProtection
Prevention PreventionCultivation technique
Determining control necessary Warning and advice systemsNon-chemical crop protection
Control Chemical crop protectionEmission restriction
Source: Table 7.2, Pan (2007b), p.11.
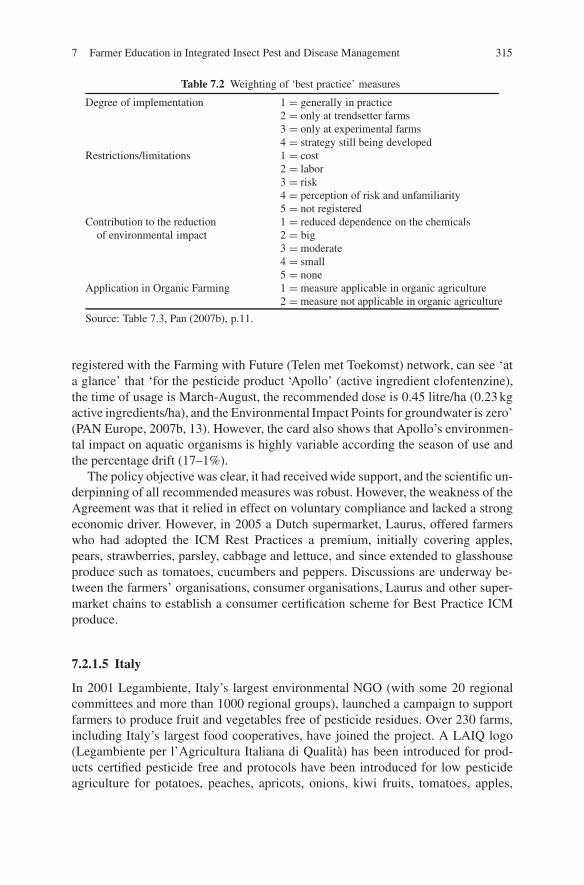
7 Farmer Education in Integrated Insect Pest and Disease Management 315
Table 7.2 Weighting of ‘best practice’ measures
Degree of implementation 1 = generally in practice2 = only at trendsetter farms3 = only at experimental farms4 = strategy still being developed
Restrictions/limitations 1 = cost2 = labor3 = risk4 = perception of risk and unfamiliarity5 = not registered
Contribution to the reductionof environmental impact
1 = reduced dependence on the chemicals2 = big3 = moderate4 = small5 = none
Application in Organic Farming 1 = measure applicable in organic agriculture2 = measure not applicable in organic agriculture
Source: Table 7.3, Pan (2007b), p.11.
registered with the Farming with Future (Telen met Toekomst) network, can see ‘ata glance’ that ‘for the pesticide product ‘Apollo’ (active ingredient clofentenzine),the time of usage is March-August, the recommended dose is 0.45 litre/ha (0.23 kgactive ingredients/ha), and the Environmental Impact Points for groundwater is zero’(PAN Europe, 2007b, 13). However, the card also shows that Apollo’s environmen-tal impact on aquatic organisms is highly variable according the season of use andthe percentage drift (17–1%).
The policy objective was clear, it had received wide support, and the scientific un-derpinning of all recommended measures was robust. However, the weakness of theAgreement was that it relied in effect on voluntary compliance and lacked a strongeconomic driver. However, in 2005 a Dutch supermarket, Laurus, offered farmerswho had adopted the ICM Rest Practices a premium, initially covering apples,pears, strawberries, parsley, cabbage and lettuce, and since extended to glasshouseproduce such as tomatoes, cucumbers and peppers. Discussions are underway be-tween the farmers’ organisations, consumer organisations, Laurus and other super-market chains to establish a consumer certification scheme for Best Practice ICMproduce.
7.2.1.5 Italy
In 2001 Legambiente, Italy’s largest environmental NGO (with some 20 regionalcommittees and more than 1000 regional groups), launched a campaign to supportfarmers to produce fruit and vegetables free of pesticide residues. Over 230 farms,including Italy’s largest food cooperatives, have joined the project. A LAIQ logo(Legambiente per l’Agricultura Italiana di Qualita) has been introduced for prod-ucts certified pesticide free and protocols have been introduced for low pesticideagriculture for potatoes, peaches, apricots, onions, kiwi fruits, tomatoes, apples,

316 J. Jiggins and F. Mancini
carrots, lettuce and figs. The scheme promotes the use of IPM, the use of pesticideswith low persistence and the extension of the period between the time of final sprayand harvest. Legambiente every year carries out, without prior notification, pesticideanalysis for 5–10% of the participating farms and checks farmers’ spray records andtheir plant protection methods. In the few cases where residues are detected, the foodis withdrawn from the scheme and the farmers receive special advisory services tohelp them improve their performance. Recent results of the random testing showthat the goal of supporting pesticide-free produce (i.e. in compliance with MRLs)has been achieved almost completely, though not all co-operatives managed to reachzero residues.
7.2.1.6 United Kingdom
UK has one of the largest co-operative retailers in the world, the Co-operative Group(known simply as ‘the Co-op’). Its food retail operations generate sales of over Euro4.4 billion a year. Its agricultural division, Farmcare, is the largest farmer in the UK,managing some 10,000 ha of Co-op owned land and 20,000 ha of farm land ownedby other landowners. In 1999 the Co-op brought in an international Code of Prac-tice on pesticide use. The Code prohibited 23 pesticides from use on all farmlandmanaged by itself and in all farms worldwide supplying the Co-op’s retail outlets(Table 7.3). It thereby raised standards within the UK (seven of the pesticides onthe banned list were authorised for use in the UK) and it used its purchasing powerto raise standards beyond the reach of its own agricultural operations. A further 32pesticides were placed on a restricted list that farmers could use only with writtenpermission.
Recent analysis shows that the Co-op receives only 3–4 such monthly requests,signalling major impact in overall use reduction. The Co-op at the same time pro-vides guidance on Integrated Farm Management (IFM) and farmer advisory sheetsexplaining the IFM protocols for a range of crops. In addition, Farmcare at certainsites in its own landholding portfolio conducts research into low pesticide produc-tion. An independent ten-year assessment showed that the Co-op’s IFM methods,which prioritise biological and mechanical strategies, can halve pesticide use with-out compromising profitability.
These examples from six European countries show that there is no single routeto achieving pesticide use reduction. Some have been led by government policy,others by civil society initiatives or by food retailers. Some have used the ‘carrot’of subsidies and others have relied more or in addition on the ‘stick’ of regulation.But in all cases farmer organisations have played a central role; focussed scientificresearch has been essential; and the provision of high quality support materials,opportunities for learning along the entire food chain, and targeted advisory serviceshave been a necessary ingredient in the successes achieved. It is worth stressingthat in all six cases substantial and widespread reduction in use has been achievedwithout loss of yield or profitability in highly competitive markets. When pesticideuse reduction is associated with new branding of farm products and development of

7 Farmer Education in Integrated Insect Pest and Disease Management 317
Table 7.3 List of prohibited and restricted pesticide by the Co-operative group (July 2006)
Prohibited Restricted: usage with permission by Co-op only
Dieldrin+ AldicarbEndrin+ BenomylAldrin+ CaptanChlordane+ CarbenazimHexachlorobenzene+ Chlordimiform+Heptachlor+ ChlorothalonilLindane DaminozideDDT+ DicofalCadusaphos+ Dienochlor+Chlorfenvinphos DisulfotonDemeton-S-methyl+ EndosulfanEthoprophos FentinFenamiphos+ Ferbarn+Omethote+ LeadPhorate LinuronPhosphamidon+ Mancopper+Prothiophos+ MancozebTebupirimiphos+ ManebTerbufos+ MercuryHaloxyfop+ Methoxychlor+Triazoxide Metiram+Captfol NabamChlordecone Nickel Bis (dimethyldithiocarbamate)+
PropinebThiophanate MethylThiramToxaphene+Tributly tin+VinclozolinZinebZiramOther thylene thiourea and propylene thiourea generators
+ = not authorised in Great Britain.Source: Table 8 in PAN Europe 2007b, p. 34.
new market outlets, it can generate additional profits for farmers and others alongthe food chain.
7.2.2 Push-Pull in East Africa
So-called push-pull strategies are based on the manipulation of insect pests andtheir natural enemies by means of stimuli that act to make the protected crop re-source unattractive or unsuitable to the pests (push) while attracting them towardanother source (pull) where the pests can be removed. In general the push and pullcomponents are non-toxic and are integrated in methods for reducing the populationof the target pests by measures such as biological controls.

318 J. Jiggins and F. Mancini
The efficacy of the strategy relies on careful orchestration of the additive andsynergistic effects of the stimuli, with the aim to reduce pesticide use (Cook et al.,2006). There is thus no specific ‘recipe’. The strategy requires adequate scientificresources to develop clear understanding of a pest’s biology and on the behaviouraland chemical ecology of its interactions with its hosts, other insects of the samespecies and natural enemies, at the level both of principle and in any given set oflocal conditions.
Potential components for push stimuli include visual cues, synthetic repellents,non-hostvolatiles,host-derivedsemiochemicals,anti-aggregationpheromones,alarmpheromones, antifeedants, oviposition deterrents and oviposition-deterringpheromones. Potential components for pull stimuli include visual stimulants, hoststimulants, host volatiles, sex and aggregation pheromones, gustatory and ovipositionpheromones.
Practitioners can build the appropriate components into a viable crop protectionpractice by a variety of means. These could include, for instance, the introductionof natural products (such as plant extracts) or nature-identical analogues (usuallythrough synthetic production and release in formulations such as slow release dis-pensers that may add robustness to the strategy). The use of plant extracts mayprovide opportunities for local production and new income opportunities for ruralcommunities. Vegetative diversification by means of intercropping and trap crop-ping are common traditional practices that often can be improved in collaborationwith scientists. Further modification of the vegetation mix, for instance by the in-troduction of cultivars with antixenotic properties i.e traits that modify herbivorebehavior by conferring nonpreference, that typically are exploited in non-host in-tercrops but that also may deliver push stimuli in the main crop. Plant hormonessuch as salycilic acid or jasmonic acid may be used as chemical elicitors that inducethe mobilisation of plant defences in a crop; since the same chemical may inducesusceptibility in other plants, and different elicitors can elicit different responses inthe same crop, this competent requires informed choices to be made. The use ofmass-trapping and attractor traps, when appropriately designed and positioned, mayprove more robust in general farm practice, especially among poor farmers whohave few opportunities for learning.
Although this brief review of some of the potential components of push-pullstrategies may give the impression that the strategy is too complicated to be intro-duced to small farmers in developing countries, it is the fact that the most suc-cessful documented application of the strategy was developed in eastern Africafor subsistence farmers, based on trials in Kenya (Khan and Pickett, 2004). Over160,000 small farmers are now (2006) using push-pull strategies to protect theirmaize and sorghum against stem borer (Chilo partellus), based on the combined useof intercrops such as molasses grass (Melinis minutiflora) and silverleaf desmodium(Desmodium unicinatum), and trap crops (such as for instance Napier grass (Pen-nisteum purpureum) or Sudan grass (Sorghum vulgare sudanense) that are locallyavailable and exploit natural enemies (Khan et al., 2006). The rapid spread of FarmerField Schools and Junior Life Schools (for school age children) throughout easternand southern Africa is helping to carry the strategy to an increasing number of
7 Farmer Education in Integrated Insect Pest and Disease Management 319
farmers9. The adoption of the push-pull strategy for stem borer has led to increasedcrop yields and livestock production (animals commonly are fed on the stover), withsignificant impact on food security throughout the region.
Moreover, an increasing number of public extension agents who used to pro-mote chemical methods of control that small farmers could not afford and that arehazardous in the actual conditions of use, have also begun to throw their weightbehind push-pull as the preferred strategic option. Some agrochemical companies,such as Syngenta, after initially seeing the strategy as a threat to their chemi-cal sales, have begun to show interest, for instance in promoting semiotic sig-nalling products as components of effective push-pull crop protection in small farmpractice.
7.2.3 Mobile Plant Health Clinics10
We have chosen to include plant health in our examples partly because some plantdiseases are transmitted by insect vectors and partly because it is an idea that couldbe further developed to include pest management. The Global Plant Clinic (GPC)’sdevelopment of mobile plant health clinics was initiated to answer for as many farm-ers as possible their question: What do I do? While scientists are good at askingquestions and probing causes, farmers have problems of plant health defined bysymptoms and an implicit or explicit demand for speedy advice on practical methodsthat solve these problems in the specific context of their own farm.
The GPC is an alliance established in 2005 between three UK-based sciencecentres, Commonwealth Agriculture Bureaux International (CABI), RothamsteadResearch and the Central Science Laboratory, as a worldwide diagnostic and ad-visory service, primarily for scientists. The spread of email and internet servicesexpanded the demand as physical samples began to be supplemented by photos.Yet little of the benefits seemed to be reaching farmers nor the agronomists andextension workers who work regularly with farmers. On reflection, those concernedchose to re-think their diagnostic role, using the metaphor of plant doctors (ratherthan merely plant scientists) with social and clinical skills. Uganda, Bangladesh andBolivia were the first three countries to experiment with mobile plant health clinicswith GPC support.
In the preparatory training courses in field diagnosis, participants realised throughhands-on practice and peer evaluation of their own performance, the necessity offirst carrying out a careful inventory and recognition of the ‘symptoms’ and thecontext in which they arose, before rushing to premature diagnosis or proposing
9 Information available on <[email protected]>; bibliography on<[email protected]> (accessed January 2008).10 This section is based in part on discussion with Eric Boa, CABI, U.K., and Boa, E. 2007. PlantHealthcare for Poor Farmers: An Introduction to the Work of the Global Plant Clinic. An APSnetFeature Story. (The American PhytoSanitary service is the largest in the world). Accessed on lineJanuary 16, 2008, at: http://www.apsnet.org/online/feature/clinic/

320 J. Jiggins and F. Mancini
remedies. In Bolivia, the first exercise in ‘going public’ was held in a crowdedmarket place from the back of a pick-up truck. The agronomist from the national re-search and extension service, PROINPA, quickly attracted a crowd with his demon-stration of a simple test to detect the presence of nematode cysts in the soil. CIAT,an international agricultural research organisation, at around the same time began tosupport community plant health clinics focussing on the integrated management ofpotato pests and diseases. The clinics are open most days of the week and located insmall rural towns in key potato-growing areas.
In addition to the training another key to the early impact of the clinics has beentheir success in creating and sustaining routine links between those staffing the clin-ics, networks of specialists to whom samples and photos can be sent and laboratoriesable to help with ‘hard to diagnose’ cases.
By October 2007 eight countries had begun experimenting with the concept ofplant health clinics, operating on a regular basis some 60 facilities. The biggestschemes currently are those operating in Bangladesh and in Nicaragua (Danielsenet al., 2006). In both countries effective links have been built among science facil-ities, non-government organisations (NGOs) and farmers’ organisations, includingin Bangladesh the Grameen Bank’s women’s groups. There are numerous experi-ments taking place, as yet insufficiently evaluated, that explore the potential syner-gies between plant clinics and Farmer Field Schools (for instance in Sierra Leone),community-based technical colleges, NGOs and farmers’ organisations, and the useof modern media (such as farmer-generated short videos or DVDs) to support andspread information and skills in diagnosis and treatment options.
7.3 Part II: An Indian Case study
7.3.1 The Agrarian Crisis
Indian agriculture has undergone a major transformation from the time of indepen-dence, primarily as a result of the private and public investments made in a broadspectrum of technology (including plant breeding and cropping, irrigation, agricul-tural engineering and animal traction, food processing). After the production jumpachieved in the 1980s, which enabled the country to become self-sufficient in itsmajor foodstuffs, farmers by the turn of the millennium were reporting a decline infactor productivity caused by the overexploitation of natural resources, especiallyof water and land (Hanumathan Rao, 2004). The average annual growth rate ofagriculture output in the years 2002–2006 has been the lowest since independence(1.87%). Annual grain production per capita has declined from 207 kg in 1995 to186 kg in 2006 (National Planning Commission, 2007). Moreover, income inequal-ities are widening and the number of poor – 300–400 million living mainly in ruralareas is not decreasing (World Bank, 2006, IFAD, 2006) as a consequence of whatis now recognised as a renewed agrarian crisis that threatens the huge developmentgains of the recent past (Patil, 2007).

7 Farmer Education in Integrated Insect Pest and Disease Management 321
The policy and research strategies adopted to achieve rapid advances in agricul-ture productivity targeted mainly the favourable resource areas. However, two-thirdsof the cultivated land of the country falls within semi-arid zones where large num-bers of India’s poorest people live (Vaidyanathan, 2004). State-level consolidatedstatistics on productivity have hidden the financial distress faced by marginal pro-ducers. For instance, a sharp rise in the proportion of indebted rural households, andin the amount of debt, was recorded in the same areas where high production levelswere achieved. Forty percent of the credit requirements of farmers was, and still is,met by unofficial sources at high interest rates (Hanumathan Rao, 2004).
Public investments in agriculture are now down to 1.7% of Gross Domestic Prod-uct. The expansion of cultivated land is fast approaching its saturation point, asindicated by the decrease in the per annum growth rate of net area sown recordedsince 1962 (Bhalla and Singh, 2001). An estimated 750,000 hectares of cultivatedland are yearly diverted to industrial and infrastructure development purposes.
7.3.2 The First National Policy for Farmers
The Government of India has acknowledged the urgency of addressing the crisis inthe agrarian sector by focusing policies on educating farmers and developing neweco-technologies. The National Policy for Farmers, approved in 2007, brings for thefirst time farmers’ livelihoods, rather than agriculture, to the centre of governmentthinking. Its primary objective is to improve the economic viability of farming whileprotecting the natural resources that ensure the food and nutritional security of thecountry. The policy acknowledges that achievement of the policy entails retainingeducated youth in agriculture. Creating ‘science literacy’ at the grass roots is thusseen as an essential investment that underpins the development of farmers’ skills,practices and understanding of technical advances and, notably, signals that farmingcan become a dynamic pathway to a sustainable modern lifestyle in the countryside.
Integrated Pest Management (IPM) was introduced first in rice and cotton in1974–1975 under the Operational Research Project led by the Indian Council forAgricultural Research (ICAR), that sought to develop area-specific IPM. In 1985IPM was adopted nationally as the main plant protection strategy and implemen-tation effort was intensified. The IPM strategy represents the earliest effort by theGovernment of India to promote agricultural growth based on a sustainable practice.The lessons learned from attempts to apply IPM principles in farmers’ field condi-tions, and from a range of IPM extension approaches, over time have moved practicetoward a higher involvement of farmers in the development and implementation ofplant protection strategies.
At the onset, IPM was brought into practice through the use of the EconomicThreshold Level (ETL). The ETL is an equation for calculating the level of plantinfestation at which the economic returns resulting from pest control compensate forthe cost of applying pest control (Thompson and White, 1979, Stern et al., 1959).The ETL’s parameters include management cost, price of the farm produce and the

322 J. Jiggins and F. Mancini
expected damage or yield losses. These values are calculated in research stations andthen extrapolated for national and state level application. In practice, the variabilityof the parameters used for the computation of ETL values proved to be a limitationto the reliable generalisation of ETLs over large geographical scales. Moreover,national recommendations were set at conservative levels with the benign intentof reducing the risk associated with late interventions. In practice, this was foundto have the unintended counter effect of encouraging an unnecessarily high use ofchemicals. Today, the reported adoption of ETLs at farmers’ level is low (for Punjab,see Peshin, 2005).
The ETL concept is in principle functional if all factors influencing yield lossare considered and if it is applied in the specific situation used in the computation.But the requirement for specificity and precision to make pest control decisionsthat are effective in a specific time and place has led to the introduction of a moreflexible tool called Agro-Ecosystem Analysis (AESA). AESAs enable farmers tocalculate their own local thresholds for intervention on the basis of the actual fieldsituation, by taking into account observations and measurements of the presence ofnatural enemies, plant health, weather factors, social aspects etc. (Berg and Jiggins,2007). As a result of AESA, decisions on the overall plant management includingnutrient and weed management are implemented to prevent or control pest prob-lems (Table 7.4). Trained farmers tend to intervene at a higher pest incidence, if theenvironmental conditions are not conducive for pest build up, as compared to theofficially recommended ETLs (Table 7.5). Farmers learn to perform this ecologicalanalysis in a season-long educational intervention, the Farmer Field School (FFS).Farmers also learn good agronomic practices aimed to prevent the insurgence ofpest problems.
7.3.3 The New Agenda: Meeting Current and Future Concerns
There are several advantages associated with the practice of IPM based on eco-logical analysis that are of particular relevance to current and future environmentalconcerns.
First, at the international level, all countries are urged to develop adequate agri-cultural research, extension and policy tools to respond to the requirements of theemerging global environmental and trade regimes. Numerous authors point to the re-sultant conflicts and tensions in deciding what is ‘good practice’ because the globalpolicy drivers for ‘sustainability’ and ‘profit’ today are pulling in different directions(Tansey and Rajotte, 2008). Commercial biotechnology, seed and agro-chemicalcompanies have sought to preserve their own freedom to operate by developingglobal quasi-monopolies and by centralisation (through mergers, acquisitions andcross-licensing agreements) (Graff et al., 2003; ETC Group, 2005). The resultantpattern of Research and Development (R&D) indicates a severe under-investmentfrom the point of view of the social good (millions of poor farmers’ livelihoods) andof environmental sustainability, because these commercial interests will not work on

7 Farmer Education in Integrated Insect Pest and Disease Management 323
Table 7.4 Cotton ecosystem analysis summary (Village: Aloor, Ranga Reddy district, AndhraPradesh, India 2003)
Subject IPM decisions Reasons
Insect pestmanagement
NSKE 5% spray at 51 DAS Sucking pests Thrips 8.7/leaf, Aphids 5.1/leaf,Helicoverpa eggs 2/plant. Defender populationlow. Plants look unhealthy
Chlorpyriphos spray at 58DAS
Helicoverpa eggs and larvae 4.0/plant,Chrysoperla eggs 2.7/plant. Cloudy weatherpersists, crop stage vulnerable
Do nothing at 65 DAS Thrips 25/leaf, Helicoverpa eggs 0.2/plant, LadyBeetles 1.0/plant and Spiders 2/plant. Dryweather. Plants look healthy
NPV spray and installationof Yellow Sticky Traps at79 DAS
Helicoverpa eggs 1/plant and larvae 2/plant,White flies 3/leaf and Spiders 2/plant
Fertilizermanagement
Apply DAP 125kgs/ha at 30DAS
Sufficient moisture in the soil and good rootdevelopment is required since the crop is inearly vegetative stage
Apply Urea 62.5kgs/ha andDAP 62.5kgs/ha at 60DAS
Sufficient moisture in the soil and the crop isentering into reproductive stage
Apply Urea 62.5kgs/ha andPotash 62.5kgs/ha at 100DAS
Sufficient moisture in the soil and good nutritionis required for retention and enlargement ofbolls
Weedmanagement
Do weeding at 30 DASDo weeding at 60 DAS
More weeds around the cotton plantsMore weeds around the cotton plants competing
for space and nutritionDisease
managementDo nothing Diseases are not severe
Irrigation Irrigate at 90 DAS Crop is in flowering stage and the soil is too dry
Source: FAO Training of Facilitators Report, Warangal District, Andrha Pradesh, Annex-3 FFSreport.
Table 7.5 Reccomended Economic Threshold Levels (ETL) for major cotton pests by theGovernment of India, 2003
Insect pest ETL
1. American andSpotted bollworm
5% damaged fruiting bodies or 1 larva per plant or total 3damaged square/plant taken from 20 plants selected atrandom for counting
2. Pink bollworm 8 moths/trap per day for 3 consecutive days or 10% infestedflowers or bolls with live larvae
3. Spodoptera 1 egg mass or skeletinized leaf/10 plant4. Jassids∗ 2 jassids or nymphs per leaf or appearance of second grade
jassid injury (yellowing in the margins of the leaves)5. Whitefly∗ 5–10 nymphs or adults per leaf before 9 AM6. Aphids 10% affected plants counted randomly7. Thrips∗ 5–10 thrips/leaf8. Nematode 1–2 larvae per gm of soil∗3 leaves (top, middle, bottom) per plants from 10 plantsSource: Integrated Pest Management Package for cotton, IPM package N.25, Directorate of PlantProtection, Quarantine and Storage, Government of India, 2003.

324 J. Jiggins and F. Mancini
pest management for poor farmers who have no money to spend on their products,nor on pest management approaches and products that can be freely copied or givenaway, nor on approaches that are very context-dependent.
Under increasingly probable climate change scenarios, agricultural systems arelikely to be transformed at an accelerated pace and new plant protection concernswill emerge. Centralised, formal science is not well-placed to monitor locally signif-icant emergent problems, and centrally-derived technological management practicesand products will take time to reach the millions of small producers, even thosewho already are growing industrial crops such as cotton or food crops for sale.Farmers trained in the practice of adaptive ecological management, and with en-hanced skills for learning based on observation, measurement and experimentation,are more resilient. They are better prepared to develop and evaluate technologicaloptions for dealing with problems caused by the ‘surprises’ of climate change andthe fast depletion of natural resources under competitive pressure from very largecorporations and industries, infrastructure developments and rapidly expanding ur-ban areas.
Secondly, the community approach to IPM used in FFS programs supportscollective action, group management and leadership development. The learning ex-ercises used to support pest monitoring, interpretation of measurements, joint anal-ysis of experimental results and peer review, and in planning have spin-off effectsbeyond only IPM, that are critical to the advancement of farming communities andthe farming sector (Pontius et al., 2002, Braun et al., 2006). The same skills are alsocritical elements in actions to reduce area-wide pest infestation, in community-wideand landscape scale risk estimation, and to prevent pest diffusion.
The current performance of the genetically engineered Bt cotton in north Indiais reinforcing the evidence that the introduction of new technologies does not dis-pense with the need to provide end users, farmers, with an ecological education.Bt cotton was introduced to control the heavy application of pesticides against thebollworm complex and it has performed as expected in this respect. However, thecontinuous expression of the Bt control has induced the insurgence of secondarypests – also as predicted by the entomological and ecological sciences. For in-stance, economically damaging infestations of mealy bugs have appeared in thelast two seasons in some regions of north India, especially in Punjab. The pri-mary causes of these infestations are yet unclear to researchers but farmers, ac-cording to press reports, have responded with an increase in the use of chemicalcontrols.
A large cadre of trained FFS farmers and facilitators has been created in thecountry through State departments of agriculture and horticulture, universities, in-ternational and national research centres, NGOs, Foundations and the private sector(e.g. by IKEA through the Better Cotton Initiative). In Andhra Pradesh alone, 35,000farmers were directly trained by the FAO in Farmer Field Schools between 2000 and2004. In subsequent years the State Department has made provision for the fundingof IPM FFSs at the rate of 3-4000 schools per year. Non-profit organisations likeAME Foundation and its partner NGOs, that have embraced the FFS methodology,have reached about 10,000 farmers.

7 Farmer Education in Integrated Insect Pest and Disease Management 325
Fig. 7.1 Example of risk estimation map prepared by FFS in Pozarevac (Jiggins et al., 2005)
The National Plan to upgrade the Plant Protection System, which is currentlybeing implemented with technical assistance from FAO, foresees a key role for theIPM trained farmers in pest surveillance and risk estimation. This initiative parallelsthat of IPM farmers in Eastern and Central Europe, who are working with phyto-sanitation authorities and pest surveillance experts to control a pest introduced fromAmerica during the Yugoslav conflict, the Western Corn Rootworm (Kiss, et al.,2007). Figure 7.1 is an example of a risk estimation map developed by FFS grad-uates for a maize-growing community in Serbia. The red, black and yellow circlesindicate the number of years under continuous maize succession. The red circlesindicate the maize fields under continuous succession for three years that are at highrisk of economically damaging loss if farmers chose not to break the biological cycleof the WCR by growing a different crop but to go for a fourth year of maize in thesame fields.
7.3.4 IPM Farmers’ Potential Role in Risk Estimation in India11
The Indian Department of Agriculture and Cooperation has recently (2007–2008)sponsored a project to upgrade the pest surveillance system in India. This includes
11Information in this section has been provided by Mike Robson, FAO (March, 2008); his contri-bution is gratefully acknowledged.

326 J. Jiggins and F. Mancini
the creation of small, specialised organisational units with national, state and districtresponsibilities for surveillance, and the introduction of hand-held digital technol-ogy for field data recording. Field data recording efforts previously tended to befragmented – different parties have used very different methodologies, data werenot geo-referenced; data have often been obtained late (at end of season) or in aform where the detail has been ‘lost’ in aggregation. The tool is intended to over-come these problems, providing timely and accurate detailed data to a new nationalsurveillance database. The equipment itself consists of a personal digital assistant(PDA) adapted for use in field conditions, with a simple bespoke software applica-tion for geo-referenced data collection. Data collected includes field conditions atthe time of observation, and quantification of observed pests and defenders presentin the field, following a pre-agreed crop-specific sampling protocol. Data is up-loaded at the end of the working day to a national database, which is available overthe web for users at national, state and district level. Indicators designed by cropspecialist groups – combining crop stage and weather parameters as well as insectpopulations (and disease incidence/severity) – have been derived in order to generatea simple 3 or 5 point scale to show the level of threat to the crop. The system has beentrialled in four districts of Andhra Pradesh and was launched nationally in February2008. The development and implementation of a new tool for data recording is use-ful in itself, but also because it provides a focus around which broader efforts canconverge. It is expected that the tool will improve significantly the quality of dataavailable, to both policy makers and, at district level, to farmers, and will becomea key element in revitalising the national pest surveillance network in India. It isenvisaged that IPM – trained farmers will play an active role in the monitoring ofdomestic and exotic pests in the field and in providing data to update pest databaseand maps and in farmer-to-farmer communication of alerts on enhanced risks.
7.3.5 Case Study from South India: the Contribution of IPPMto Food Security
In South India, FFSs on IPM and sustainable agriculture practices are now organ-ised largely to strengthen the agricultural knowledge and skills of poor farmers as astrategy for reducing the hardship and vulnerability of poor households with respectto food and financial security. In 2007 the authors collaborated in a survey con-ducted by the AME Foundation, Bangalore, to understand the role of agriculturalservices, including IPM, to the betterment of farmers’ livelihoods. The SustainableLivelihood framework, which is constructed around the identification of five capi-tals’ assets: natural, human, social, physical and financial, was used to investigatechanges attributable to attending FFSs. Nearly five hundred marginal farmers wereinterviewed in the drought-prone areas of the states of Tamil Nadu, Karnataka andAndhra Pradesh; half of the sample was FFS graduates. The variability of rainfallhad led the majority of small farmers into debt under the conventional recommendedpractices (including agro-chemical input purchases). The contribution of agriculture

7 Farmer Education in Integrated Insect Pest and Disease Management 327
to the overall house income has become minimal in the case of marginal households.One hectare of rainfed land in the area generates Rs. 8250 (US $ 183), which can beas low as 5% of the total cash income, in addition to food for self consumption.Marginal farmers with access to groundwater through bore wells have achieveda better financial status, diversifying cropping patterns with crops of commercialvalue, the most effective farms generates up to 50% of the total household incomein cash. However their economic growth is based on an unsustainable use of water(Fig. 7.2).
The study showed that the FFS graduates were practising improved agriculturalmanagement embracing the principles of integrated pest and production manage-ment. The practices included: seed germination test, seed treatment, intercropping,use of biopesticides and biofertiliser; cultural practices to conserve moisture in thesoil and to restore soil fertility. Farmers using these practices reported to have ob-tained higher, more stabile yield levels. The stability of yield, and not just the factthat yield levels were higher, was perceived to be an important contribution to thefood security by marginal farmers who were meeting their needs primarily fromtheir small-holdings. FFS farmers reported a higher level of satisfaction with theirlivelihood than the control group (Table 7.6). The average income from agriculturereported by the FFS graduates (12,822 Rs, about 320 US $ at the exchange rateof 1$ = 40 Rupees) was 3-fold higher than the control group. Nevertheless, theincome difference was too small to allow FFS graduates to make a financial break-through and free themselves from their historic debt burden. The Government ofIndia has responded to data such as these by proposing in the budget for financialyear 2008–2009 to write off all farm loans taken from banks (i.e. not includingdebts incurred with moneylenders), for all farmers with landholdings up to 2 ha.Full implementation of this measure would cost the government exchequer Rs.600billion (US $15billion US) (Union Budget, 2008, presented on 29 February, 2008).
0
1
2
3
4Natural capital
Physical capital
Financial capitalSocial capital
Human capital
FFS
Control
Fig. 7.2 Visualisation of the score assigned to the five capitals with reference to the year 2006using a 0–5 scale by FFS and control farmersSource: modified from ‘One acre (1 acre = 0.4 hectare) of land’, survey conducted in 2007 by AMEFoundation.

328 J. Jiggins and F. Mancini
Table 7.6 Sources of income (Rupees) of two types of marginal 1.1 acres (0.44 ha) rural house-holds (HH)
Source of income Dry land, (27 farms) 50% access to water, (9 farms)
Agriculture (average) 3.300 9.700Range (0–7.800) (0–35.000)Agri-labor 2.820 4.000Dairy/poultry 6.250 12.700Off-farm labor 23.200 32.800Loan/saving 35.570 26.750Total 71.140 85.950
1 American $ = 40 rupees.Source: this study.
Without investments such as the FFSs the push out of agriculture, under increas-ingly variable rainfall and temperature conditions, will increase for millions of poorfarmers. The Government is committed to moderating the exodus by adopting policydrivers to increase the profitability of small-scale farming. These will include theabandonment of ‘one-size fits all’ approaches and adoption of State-specific strate-gies based on local agro-climatic conditions and constraints, adoption of precisionfarming’ techniques adapted to small scale management, investment in Agri-clinicsto provide services such as integrated soil health, nutrient management and inte-grated insect pest and disease management diagnoses and advice, and KnowledgeCentres located at Gram Panchayats (the lowest level of local government) (Patil,2007).
However, improving agriculture productivity and resilience, even in the mostsustainable fashion, might not offer a way out of a subsistence livelihood for themajority of the poorest farmers unless attention is also given to the design of fundingflows that can reward farmers for their role in the management of agro-ecosystemfunctioning. This implies that the central and State governments would need to re-consider their embrace of ‘free trade’ policies and of global Intellectual PropertyRights regimes that have been designed to meet the interests of industrial farmingand global corporations. It seems certain that the world has entered an era of struc-tural change in food prices, driven by increased demand for feedstock for poultryand animals as incomes rise, higher oil prices, increasing climate instability in themajor cereal exporting regions of the world, diversion of food crops into biofuelsand the rapidly increasing limits to production from irrigation as the competitionfor water increases. Higher market prices will negatively impact poor consumerseverywhere; they may offer opportunities for some small producers to get out ofpoverty. However, the extent to which small farmers may benefit depends criticallyon their capacity rapidly to organise to meet market demand, and the procurementpolicies of the dominant actors in the wholesale and retail sector (Berdegue andReardon, 2008)
In the case considered here, low farm-gate prices and competition from large-scale producers threaten to keep the dryland farmers trapped in poverty. The value ofoutput per hectare in 1992–1995 was Rs 9390 (about 235 US $) in Andhra Pradesh,Rs. 5176 (about 129 US $) in Maharastra (Bhalla and Singh, 2001); small and

7 Farmer Education in Integrated Insect Pest and Disease Management 329
marginal farmers will remain below the poverty line in the future if they continue todepend solely on agriculture. There is evidence that FFS education can contributeto the development of personal and social capital (Mancini et al., 2007), i.e. FFSsassist farmers to develop the self-confidence, awareness and learning capacities toorganise themselves and their communities in a search for and investment in resilientlivelihood options.
7.4 Part III: Discussion: Moving On in India
The information and case materials presented so far begin to build a picture of howa much wider and deeper impact might be gained by combining approaches. Theones we consider most salient are the following.
1. Linking second and third generation IPPM FFSs to development of market op-portunities. Pro-poor marketing approaches to add value to agri-products forlocal markets, to link farmers’ organisations to big retail chains, and in somelimited areas and specialised crops also to export opportunity, offer real oppor-tunities for farmers’ financial uplift. However, it is worth noting that the devel-opment of such opportunities has required policy action by the government toencourage preferential procurement (or at the least, equalisation of opportunityto supply) from the small farm sector and an appropriate degree of protectionfor India’s own wholesale and retail entrepreneurs as they develop a marketpresence strong enough to compete globally with the dominant actors. Whilelimited financial investment has been made so far to upgrade storage, processingand marketing activities for high value addition at farm level, the relaxation ofthe post-independence political instruments regulating domestic trade of nationalcommodities (Essentials Commodities Act, Agricultural Produce Marketing Actand Small Scale Industry reservation) has facilitated the entrance of larger pri-vate companies into agri-businesses, which have rapidly established vegetableand cereal retail chains across the nation. Diversification of agriculture and al-lied activities in turn requires that greater effort is made to develop rural-urbanlinkages and integration. Post-harvest technologies and small agro-processingindustry, particularly of perishable produce such as fruits, have the potential tofurther increase producers’ returns without affecting negatively the stocks of nat-ural resources. The increasing domestic demand for ‘pesticide-free produce’ andnation-wide concern for the state of India’s natural resources opens a potentiallywide market for IPM-labelled produce and for FFS graduates to develop nicheproducts and micro-enterprises.
2. In a number of instances, federations of small farmers’ organisations, in whichFFS graduates are beginning to play important leadership roles, are becominginvolved in the creation of entire value chains. Intermediary organisations –specifically, NGOs, development organisations and community institutions –are playing a vital role in developing value chains that benefit small-scalefarmers, for instance in certified organic produce and Fair Trade products, and

330 J. Jiggins and F. Mancini
in cotton/textile chains (through to links with the international fashion industry).Successful examples are reported also from Africa, where small producers haveimproved their competitiveness by achieving economies of scale through collec-tive action. The actions include the collective organisation of inputs, productionpractices, marketing or diversification into higher-value crops or livestock prod-ucts, linked to identified market demands (spices, medicinal herbs) using FFSsas a platform for learning business and technical skills (KIT, 2006).
3. There is robust evidence that high social capital underpins the development ofadded value and the effective coordination and management of small farmers’organisations as they move into competitive markets. Collective action and will-ingness to collaborate in turn facilitate the diffusion of new agricultural tech-nologies and management practices. Villages with higher levels of social capitalwhen paired with the agency of capable, educated young leaders, achieve betterdevelopment outcomes (Krishna, 2003)
4. IPM/IPPM Farmer Field Schools cannot alone achieve the agenda sketched un-der 1–3 above. As the opening sections of this chapter indicate, there are comple-mentary investments in agro-technology services that India could be considering.There would seem to be both opportunity and urgent need for experimentation inhow, in the specific conditions of diverse agro-ecosystems, market opportunity,and State histories, a mix of IPPM interventions would complement what FFSsare able to deliver.
7.5 Conclusion
We have sought in this chapter to illustrate how investment in Integrated Pest Man-agement, applied in the context of an appropriately designed mix of policy, reg-ulatory and market drivers, can contribute to the resilience of food security andlivelihoods in the face of climate change effects and market shocks. We suggest,with evidence that India stands at the threshold of decisive choices that can stabilisethe sustainability of its production base without sacrificing yields or profits. Wefurther indicate that IPPM Farmer Field Schools have an important though by nomeans exclusive role to play in moving the small farm sector toward achievementof combined sustainability and development goals. Finally, we argue that the time isripe for experimentation in delivering a mix of investments in farmer education thatcan equip farmers for the demands of the 21st century.
References
Berdegue, J.A. and Thomas, R. 2008 (in press). The Retail-Led Transformation of Agrifood Sys-tems. Chapter 2 in Farnworth, C., Jiggins, J., and Thomas, E.V. (eds), Creating Food Futures:Ethics, Trade and the Environment, Gower Publishers, London.
van den Berg, H. and Jiggins, J. 2007. Investing in Farmers—The Impacts of Farmer Field Schoolsin Relation to Integrated Pest Management. World Development.

7 Farmer Education in Integrated Insect Pest and Disease Management 331
Bhalla, G.S. and Singh, G. 2001. Indian Agriculture: Four decades of development, Sage Publica-tion, New Delhi.
Braun, A., Jiggins, J., Roling, N., van den Berg, H. and Snijders, P. 2006. A Global Survey and Re-view of Farmer Field School Experiences, International Livestock Research Institute, Nairobi,and Endelea, Wageningen.
Comprehensive Assessment of Water, 2007. Water for Food, Water for Life: A Comprehensive As-sessment of Water Management. International Water Management Institute, London, Earthscanand Colombo.
Cook, S.M., Khan, Z.R. and Pickett, J.A. 2006. The use of push-pull strategies in integrated pestmanagement. Annual Review Entomology 52:375–400. First published online as a Review inAdvance on September 1, 2006. DOI: 10.1146/annurev.ento.52.110405.091407
Danielsen, S., Boa, E. and Bentley, J. 2006. Puesto para Plantas in Nicaragua. A Clinic Where YouCan Bring Sick Plants. Copy Express for FUNICA, Managua.
ETC Group, 2005. Global seed industry concentration – 2005. Communique No. 9, Ac-tion group on Erosion, Technology and Concentration. ETC Group, Ottawa, Available atwww.etcgroup.org/en/
European Commission 2006. Monitoring of Pesticide Residues in Products of Plant Origin in theEuropean Union, Norway, Iceland and Lichtenstein, 2004 European Commission, Brussels.
Graff, G.D., Cullen, S.E., Bradford, K.J., Zilberman, D. and Bennet, A.B. 2003. The public-privatestructure of intellectual property ownership in agricultural biotechnology. Nature Biotechnol-ogy 21:9, 989–995.
KIT, 2006. Supporting African farmers to develop markets Royal Tropical Institute, KIT, Amster-dam and International Institute of Rural Reconstruction (IIRR), Los Banos.
Krishna, A., 2003. Understanding, measuring and utilizing social capital: Clarifying concepts andpresenting a field application from India. CAPR: Working Paper No. 28. CGIAR SystemwideProgram on Collective Action and Property Rights, Washington, DC.
Hanumathan Rao, C.H., 2004. Preface to the Millennium Study, pp. 15–27. In: State of the IndianFarmer. A Millennium study. No. 10 Rainfed Agriculture. Dept. of Agriculture and Cooper-ation, Ministry of Agriculture, Government of India, and Academic Foundation, Publisher,New Delhi.
IFAD, 2006. Poverty in India. http://www.ruralpovertyportal.org/english/regions/asia/ind/index.htmAccessed January 3, 2008.
IPCC, 2007. Climate Change 2007: Synthesis Report. 4th. Report IPCC, Geneva.Jiggins, J., Governatori, G. and Roggero, P-P. 2005. Report of the Mid term Review. Regional
Programme “Integrated Pest Management for WCR in Central and Eastern Europe”, FAO,Rome.
Khan, Z.R. and Pickett, J.A. 2004. The ‘push-pull’ strategy for stemborer management: A casestudy in exploiting biodiversity and chemical ecology. In G.M. Gurr, S.D. Wratten, M.A. Altieri(eds) Ecological Engineering for Pest Management: Advances in Habitat Manipulation forArthropods CABI, Wallinford, Oxford, pp. 155–164.
Khan, Z.R., Pickett, J.A., Wadhmas, L.J., Hassanali, A. and Midega C.A.O. 2006. Combined con-trol of Striga hermonthica and stemborers by maize-Desmodium spp. Intercrops. Crop Protec-tion 25:989–995.
Kiss, J., Papp Komaromi, J., Baufeld, P., Bazok, R., Bloc, D., Bokor, P., Cagan, L., Cate,P., Governatori, G., Grabenweger, G., Hoffman, P., Igrc-Barac, J., Ivanova, I., Ivezic, M.,Jiggins, J., Kalinovic, I., Karic, N., Modic, S., Pasti, M., Poiviczinger, G., Raspudic, E.,Rosca, I., Rozsavolgyi, P., Schuster, Stevo, J., Terpo, I., Urek, G. and Weigl, H. 2007. Reporton the First International Workshop on WCR Integrated Management. EU research programmeDO1.06. DIABR-ACT: Harmonising the Strategies for Fighting Diabrotica virgifera virgifera(WP1 Task 7.1 under Specific Support Action FP6-2004-SSP-4-022623). (Godollo, Hungary:Szent Istvan University).
Mancini, F., van Bruggen, A.H.C. and Jiggins, J.L.S. 2007. Evaluating Farmer Field School Out-comes using the Sustainable Livelihood Approach, Experimental Agriculture 43(1), 97–112.
Millennium Ecosystem Assessment, 2005. Ecosystems and Human Well-Being: General Synthesis.Island Press, Washington DC.

332 J. Jiggins and F. Mancini
National Planning Commission, 2007. http://www. planningcommission.nic.in Accessed January3, 2008.
PAN Europe 2007a. Hazardous Pesticides in the European Parliament. A Report by Milieudefensieand Friends of the Earth, Amsterdam, and PAN Europe, London PAN Europe, London.
PAN Europe 2007b. Pesticide Use Reduction Strategies in Europe. Six case studies. PAN Europe,London.
Patil, P.D. 2007. Address by the President of India on the Occasion of Special Lecture “AgricultureCannot Wait”. August 6th. New Delhi.
Peshin, R. 2005. Evaluation of Dissemination of Insecticide Resistant Programme in Cotton Cropin Punjab. Ph.D. Dissertation, Punjab Agricultural University, Ludhiana, India.
Pontius, J., Dilts, R. and Bartlett, A. 2002. From Farmer Field Schools to Community IPM. TenYears of IPM Training in Asia. Regional Office for Asia and the Pacific, FAO, Bangkok.
Srinivasan U.T., Carey, S.P., Hallstein, E.R., Higgins, P.T., Kerr, A.C., Koteen, L.E., Smith, A.B.,Watson, R., Harte, J. and Norgaard, R.B. 2007. The debt of nations and the distribution of eco-logical impacts from human activities. PNAS Early Edition online article 07-09562, availableat www.pnas.org/cgi/doi/10.1073/pnas.0709562104 (Accessed 11.01.08)
Stern, V., Smith, R., van den Bosch, R. and Hagen, K., 1959. The integrated control concept.Hilgardia 29:81–101.
Tansey, G. and Rajotte, T. (eds) 2008. The Future Control of Food. A Guide to International Nego-tiations and Rules on Intellectual Property, Biodiversity and Food Security. Earthscan, London.
Thompson, P. and White, G.B. 1979. Linking Economic and Action Thresholds in Pest Manage-ment, Implications for Advisory Services, Cornell Ag. Economics Staff Paper, No. 79–38.
Vaidyanathan, A and Oudshoorn, H.M. (eds), 2004. Managing Water Scarcity: Experiences andProspects, IDPAD Series, Manohar Publishers
World Bank 2006. World Development Report 2006: Equity and Development. Paperback, pp.336.World Bank 2007. World Development Report 2007: Development and the next generation, Paper-
back, pp. 23.

Chapter 8Impact of IPM Extension for SmallholderFarmers in the Tropics
Jeffery W. Bentley
Abstract In recent years, IPM extension came to mean FFS (farmer field school).Most studies of FFS pilot projects suggest that IPM helps farmers to lower costsor to increase yields, although the farmers pass on little of their new knowledgeto their neighbours, which limits the cost-effectiveness of FFS. Some quantitativestudies of FFS suggest that there is actually little overall impact of FFS programs.FFS may be better suited to stimulating collaborative research with farmers thanfor extension itself. In other words, FFS may help to perfect the extension message(the technology) which can then be communicated with other methods. There aremany alternative extension methods available, although their impact needs furtherstudy. The challenge is to find methods that deliver quality and quantity messages(reaching a large audience with an appropriate, understandable message).
Keywords IPM · extension · FFS · smallholder farming
8.1 Introduction
The impact of extension depends on an appropriate message, delivered with an un-derstandable extension method, although it is not always that simple. In the scrambleto adopt Bt cotton in Warangal District, Andhra Pradesh, India, farmers may beled to plant genetically modified cotton because of clever marketing. Some farmersplanted a new cotton seed after being taken to the field of an influential farmer,and given lunch (Stone 2007). In another experience, a group of Bolivian farmersexpressed an increased demand for growing quinoa after being given a piece ofquinoa cake at a technology fair (Bentley et al. 2007).
However, adoption fuelled only by convincing extension messages may be shortlived. In the cotton example above, farmers often abandon the new variety after asingle planting (Stone 2007). In the 1990s in Colombia, researchers insisted thatextensionists teach coffee farmers to culture the fungus Beauveria bassiana (Bb)
J.W. Bentley (B)Agricultural Anthropologist, International Consultant, Casilla 2695, Cochabamba, Boliviae-mail: [email protected]
R. Peshin, A.K. Dhawan (eds.), Integrated Pest Management: Disseminationand Impact, DOI 10.1007/978-1-4020-8990-9 8,C© Springer Science+Business Media B.V. 2009
333

334 J.W. Bentley
to control the coffee berry borer. A nation-wide network of dedicated extensioniststaught the farmers to boil rice, to place it in used rum bottles, and then inoculate itwith Bb, with which they would later prepare a solution to spray on their groves.The farmers adopted, and then abandoned the technology because they could notget enough rum bottles, and could not keep the rice medium sterile in their kitchens,plus the whole operation was too much work, and took up too much space (Bentleyand Baker 2002).
In 2003 I saw some excellent extensionists in Nicaragua, trying to teach farmersto calculate the percentages of pest incidences, using a complex pest sampling chartdivided into about 625 squares of data (personal observation). The chart had rowsof sampling sites and columns for different pests. It arguably offered a completepicture of all the pests and diseases in coffee, but it took 20 people two hours (i.e. 40person-hours) to gather the data. Even the agronomists had to use a calculator tofigure out all the percentages. The sampling scheme “worked” but it demanded toomuch time, and math skills. The sampling method was never adopted, even afterpersistent extension efforts.
While there is not a direct, mechanical relationship between extension method,message and impact of a program, method and message still have to be taken intoaccount. In recent years the IPM message has been linked with one particular exten-sion style: farmer field schools, even though IPM can be taught with other methods,and FFS can be used for other messages.
8.2 Evaluation of Farmer Field Schools
Farmer field schools (FFS) became a kind of standard in IPM extension after thelate 1980s, even though they are now being questioned. In spite of the great interestthey enjoyed, the evaluation of their impact is hardly straightforward. FFSs werecreated by the FAO IPM in Asia program in the 1980s to teach Indonesian farmersto avoid needless insecticide applications on rice, especially for white rice stemborer and brown plant hopper. An FFS teaches about 25 farmers at a time. Theymeet once a week for half a day during the whole cropping cycle. In theory, the FFSdo not involve lectures (Gallagher 2003), although field observations show that thefacilitators do actually give talks (Winarto 2004, Palis 2006). This is not a criticism;talking is a legitimate way of conveying ideas, but it does suggest that the designersof FFS over-packed the method with unhelpful rhetorical baggage.
The first attempts to measure impact were qualitative. This was a useful first step.Anthropologists Vayda and Setyawati (1995) found that while taking a field school,farmers in a village in Indonesia learned much about insect natural enemies, andbegan to use pesticides less often.
During an intensive, two-year study of a village on Java, Winarto (2004) foundthat FFS graduates experimented with the new ideas, e.g. inventing early ploughing,and hand collecting egg masses to control white rice stem borers. Ooi (1998) alsofound that farmers experimented after taking an FFS. Winarto learned that farmerswho took the training were flattered to be involved, and took it seriously. They once

8 Impact of IPM Extension for Smallholder Farmers in the Tropics 335
organized a trip to a research station to ask researchers questions which had arisenduring training. The farmers enjoyed the FFS, but it was difficult for them to teachthe messages to their neighbours, because the messages were complex, because thefarmers did not have a convenient time and place to convey the information andbecause the untrained villagers were sceptical. Farmers were also disappointed thatresearchers did not visit them to learn about the farmer inventions (Winarto 2004).
Various studies show that farmers adopt the principles taught in FFS. For ex-ample, a study in the Philippines found that FFS farmers had learned enough fromthe field school to adopt organic rice growing (Carpenter 2003). A study in Perufound that potato farmers who had attended FFS had higher yields than their neigh-bours (Ortiz et al. 2004, see also Godtland et al. 2004). In the Central Philippines,a long-term village study showed that farmers learned to observe insects in the fieldschool, and that each year fewer of them used insecticides, until some six years aftertraining, when all or nearly all of them had stopped spraying for insects in rice (Palis2006). A study of cotton farmers in Southern India showed that IPM adoption (fol-lowing FFS) reduced pesticide use by 78% without affecting crop yields, suggestingthat IPM is profitable and that much of the current use of pesticides is unnecessary(Mancini 2006).
However, quantitative studies of some of the original FFS cohorts by Feder andcolleagues raise doubts. They found that the most prosperous farmers had beenpreferentially chosen for the field schools, biasing the results. There was little dif-ference between FFS graduates and their neighbours; i.e. the FFS graduates werenot getting better rice harvests, and were not using less pesticide. Trained farmerswere not teaching their new IPM knowledge to their neighbours (Feder et al. 2004a,2004b). This is a problem because only about 25 people can take an FFS at one time.Small class sizes help ensure a quality experience. However, if the 25 people whotake a field school do not teach the information to their neighbours, a message thatreached more people might be more effective. Rola et al. (2002) also found that FFSgraduates do not teach new information to friends and neighbours. van den Berg andJiggins (2007) critique Feder et al.’s methods, e.g. arguing that information mighthave spread from IPM farmers to the non-trained ones, and that the study gaveinsufficient attention to savings in insecticide by IPM farmers. There is clearly apartisan flavour to this debate, and various other studies do suggest that the results ofFFS are often modest. For example, Ricker-Gilbert (2005) in Bangladesh concludedthat a visit from an extension agent was a more cost-effective method than FFS forteaching IPM technology.
Rice farmers in Bangladesh who had taken FFS could not identify planthoppernymphs; most thought the nymphs were related to stem borers (which are lepidopter-ans, i.e. entirely different insects). After IPM training by various NGOs, few if anyfarmers practiced new techniques that they were taught, because the technologieswere perceived as being labor intensive or risky. Over time, farmers tended to forgetmuch of what they were taught (Robinson et al. 2007).
Two reviews of African field schools suggest that FFS do lower pesticide use andraise yield, but that these benefits do not spread beyond the FFS graduates, in partbecause farmers are not rewarded for taking time to teach others. Also, field schools

336 J.W. Bentley
are not integrated into local extension programs, churches or other grassroots organi-zations. Field schools are expensive and dependent on foreign donors. Their impacthas not been sufficiently evaluated, but FFS are probably not a feasible model fornational extension programs, at least not in Africa (Davis 2006, Anandajayasekeramet al. 2007).
One rather sobering review of insecticide use suggests that despite the popularityof IPM, insecticide use is increasing around the world, even in areas that favour IPM,like California and the UK. Perhaps insecticide use would have been even morewidespread if not for IPM, but it will be unlikely to do away with insecticides, inpart because new compounds are being invented which cause lower environmentalimpacts. The major new pest management technology that is making an impact onthe way that insecticides are targeted is genetically modified (GM) crops (Devineand Furlong 2007).
FFS has been a popular IPM extension method in tropical countries for severalyears, and yet its full impacts and cost-benefit are only partially understood. FFS wasalready being promoted outside of its pilot areas before its impact was well known.
Most studies of the impact of FFS report reduced expenses for inputs, increasedyields, and higher income for farmers. However, most of these studies are of pilotprograms, and there is less information on the cost-effectiveness of large-scale IPMPrograms (Sorby et al. 2003 cited in Kelly 2005).
A study of FFS graduates, their neighbours and “control” farmers from non-FFSvillages in Sri Lanka concluded that FFS graduates do make fewer applicationsof insecticide than others, and that the field school did teach them about naturalenemies and the importance of not making early sprays. However the FFS farmersdo not teach what they learn to their neighbours (after all, what people learn throughdiscovery learning may be difficult to transmit by talking). There is little or no im-pact of FFS at the national level, because so few farmers actually attend an FFS, lessthan 2% of Sri Lanka’s farmers (similar to figures from Indonesia, the Philippinesand elsewhere). In other words, FFS does teach valuable ideas to individual farmers,but the new ideas do not spread to others, and national programs are not able toteach enough field schools to directly reach most farmers in the country (Tripp et al.2005).
8.3 The Message
The first FFS (Rice in Asia) had an appropriate message: natural pest control, withnative, natural enemies of insect pests. The message was well suited to the FFSmethod: talking about natural enemies of pests, observing them in the field. Farm-ers experimented by leaving a small part of their field untreated with insecticides.Then they observed the counter-intuitive results: there were fewer pests withoutinsecticide. The new technology (no insecticide) was cheaper and easier to use thanthe technology it replaced (insecticide abuse). This fortunate match of message andmethod helped to make FFS appealing, but when FFS began to be applied morewidely, pesticides were occasionally added to the curriculum.

8 Impact of IPM Extension for Smallholder Farmers in the Tropics 337
For example, when FFS came to South America in 1999, it was forced to in-clude fungicides, for late blight in potatoes (Nelson et al. 2001). In Bangladesh alarge, international NGO received training from some of the best experts in FFS,and conducted a widely-publicized FFS program. After the project ended, some ofthe staff formed their own NGO. By the early 2000s, the problem in Bangladesh waslabor shortage, as young people took jobs in the garment factories. Farmers couldnot hand weed all their own rice. In 2005 I interviewed extensionists and farmers inBangladesh, who were excited about having conducted an FFS to teach herbicides.The extensionists taught the farmers to apply herbicides to the water in the floodedfield, and to count days of labor, keep costs, and to observe fish and frogs, to ensurethat wild animals were not killed by the chemicals. Farmers had been reluctant to tryherbicides, fearing they would damage their land, but were pleased with the results.FFS is versatile enough to teach many messages, including chemicals.
There are many versatile extension methods available, but choosing the messageis often more difficult. When the coffee berry borer entered Colombia in the early1990s, researchers were keen to find an alternative to chemicals. They tried Bb,which failed. They invented sampling methods which took six hours to conduct,so no one would adopt them. They brought parasitic wasps from Africa, which didbecome established, but which parasitized only 5% of the berry borer population.Five percent fewer pests is a significant savings in a crop as valuable as Colombiancoffee, but farmers still demanded more control (Baker 1999, Bentley and Baker2002).
Through rigorous entomological studies, researchers knew that the borer onlylived in coffee berries. It had no alternative host. So by gathering up all berriesfrom the ground and by gleaning over-ripe fruit from the trees, the growers couldeliminate the pest’s habitat. Researchers called the gleaning-plus-clean harvest “Re-Re.” Extension agents taught Re-Re, but farmers would not pick fallen fruit fromthe ground. The hillsides were usually so steep that bending over was uncomfortableand could lead a person to slip or fall; the fallen fruit was often hidden by leaves. Theberries on the ground were often rotten and could not be sold. But farmers adaptedRe-Re, and began to make more of an effort to harvest all the coffee berries fromthe trees (clean harvest), because the good berries could be sold, which usually paidfor the labor to pick them. At first researchers and extensionists were displeasedthat farmers were modifying Re-Re, but they eventually realized that the farmermodifications made the technology more acceptable, that clean harvest was beingadopted, and it was controlling the pest (Aristizabal et al. 2002).
Clean harvest is also being used by farmers to control the coffee berry borer inother parts of Latin America and in India. Even though Re-Re is a low, unglam-orous technology, farmer modifications made it simple and functional enough sothat others would use it.
FFS may be more useful for research than for extension, because it givesscientists a chance to see how farmers react to scientific ideas, and because theFFS permits farmers to understand the reasons behind a new technology, and tosuggest improvements (Paul Van Mele, personal communication). In the 1990s, aSwiss-funded project by Zamorano in Nicaragua and El Salvador taught farmers

338 J.W. Bentley
using various FFS (some farmers learned about maize and beans, some learnedabout vegetables, etc.). Farmers combined the new ideas creatively with their ownknowledge, even though the program did not actively encourage them to do so.Some of the changes were especially useful. For example, twenty years earlier,in the 1980s, researchers had tried to develop “trash trap” (piles of leaves, whereslugs would hide; farmers could turn the piles over and kill the slugs by hand). Theoriginal traps did not work very well, but over the years the farmer experimentsimproved them in several ways (e.g. combining the traps with commercial pellets,using old sacks as the traps), which made them more practical (Bentley 2006).
Field schools are starting to be combined with CIALs (the Spanish acronym for“local agricultural research committees”), to fine tune technologies (Van Mele andBraun 2005, Braun et al. 2000). Researchers in Peru used FFS and CIALs to inventcultural controls for bacterial wilt in potatoes. The farmers who had studied in FFSliked the experience, and readily agreed to stay organized, but as a CIAL. Manytechnologies came from the experience. One of the most interesting was a set ofrotational crops for reducing the bacteria in the soil. This was investigated in formaltrials, under the leadership of the researchers, with collaboration from the farmers.Some of the technologies emerged serendipitously. For example, researchers taughtfarmers to clean their sandals with lime before entering a field, so as not to trackin bacteria. CIP plant pathologist Sylvie Priou noticed that when farmers ran out oflime, they used wood ash instead. She tested the ash in her laboratory and found thatit effectively killed the Ralstonia bacteria (Bentley et al. 2006).
FFS experts are now arguing that field schools “are not meant for technologytransfer” and there is a need to experiment with how to combine FFS with massmedia, extension etc. (Braun et al. 2006).
8.4 Reaching the Largest Audience Possible
Once the IPM message is right, the challenge is to take it to as many people as pos-sible. There are basically two types of extension methods: face-to-face (i.e. peopleteaching other people), and mass media.
Face-to-face methods are not necessarily limited to small audiences. Promotersare a kind of farmer extension agent, which are popular in Central America, dueto World Neighbours and other institutions. They are a low cost, personal way ofreaching many people, which allows the technology to be adapted by the peoplewho will use it. In Central America, farmers burned crop stubble from fallow landsevery year before planting. This killed pests, and released nutrients as ash for thecrops, but it also increased soil erosion. Burning was common until the 1980s, buthas now stopped almost entirely in Central America, thanks to efforts by promoterslinked with Elıas Sanchez, World Neighbours and other.
Morales et al. (2002) found that the promoters were a kind of filter for tech-nologies, simplifying them and passing them on. For example, in 2001, when theNicaraguan Ministry of Health insisted that coffee growers keep coffee pulp out ofstreams, NGOs responded by inventing a kind of cess pool for coffee. It was made of

8 Impact of IPM Extension for Smallholder Farmers in the Tropics 339
two pits, with a wooden sluice between them and a gravel filter in a bucket. Farmerpromoters saw the technique, and adapted it, by making just one pit. This saved onexpenses (no wooden sluice, no plastic bucket), but it also kept coffee pulp out ofstreams. The promoters had grasped the essential concepts of the technology, butredesigned it to be much more affordable.
Picture songs in Bangladesh: singing and dancing about IPM, while showing large illustrations
In Bangladesh, one innovative NGO, Shushilan, used “picture songs” (song anda very large painting on a scroll) as a kind of moving picture, to teach appropriaterice technology to thousands of people, especially about natural enemies and usingorganic fertilizer. As a performer sings out the message (and dances), the rest ofthe troupe accompanies her with music, and rolls out the illustrations on the scroll.Hundreds of people can see each memorable performance at one sitting, and as of2005, some 25,000 people had seen and heard the message (Bentley et al. 2005).
Videos have been used in Bangladesh, combined with farmer participatory re-search, and community meetings. Researchers at RDA (Rural DevelopmentAcademy) developed appropriate rice seed technology with farmers (e.g. dryingrice seed on a bamboo table, keeping seed dry in a painted pot). Then they madevideos where farmers spoke on camera. Their honest words were convincing toother farmers, who could identify with them. Extension agents showed the videos incommunities, and then answered questions from the audience, which allowed manypeople to be trained at once, in a relatively short time (Van Mele et al. 2005, VanMele in press).
An evaluation in Bangladesh in eight villages (in four districts, around the coun-try) show that one year after villagers watched the videos mentioned above, they hadimproved their seed storage practices, and had adopted various technologies recom-mended in the videos, and abandoned other practices which the videos discouraged.

340 J.W. Bentley
Adoption of seed health technology in Bangladesh one year after seeing videos
Seed storage method Before (%) 1 year later (%)
Not recommendedGunny bag 27 13Motka (large earthen jar) 28 11Earthen pot 9 6
RecommendedPoly bag 24 56Metalic drum 7 7Painted earthen pot 0 3
Source: adapted from Harun-Ar-Rashid (2007)
Plant health clinic in Bolivia: farmers consult the weekly clinic at a farmers’ market
Plant health clinics are a new extension method being implemented in Nicaragua,Bolivia, Uganda, Bangladesh and elsewhere, pioneered by the Global Plant Clinic.They started in Bolivia in the 1990s, so farmers from distant areas could bring plantsamples and get advice about plant health problems. Most of the clinics are “mobile”(only open one morning a week, e.g. on fair day, when the small town fills withfarmers from many kilometres around). The plant clinics provide a place for per-sonalized consultations between farmers and agronomists. The plant clinics can beeasily combined with other methods like fact sheets, radio, short courses (Danielsenet al. 2006).
Going Public is another face-to-face method for a mass audience. An extensionistgoes to a market or another crowded place, and delivers a short message, and thenrepeats it. The audience comes and goes, but if the message is kept to five minutes,several hundred people can hear it in a few hours. It is especially well suited torather simple messages that must show something (e.g. a disease symptom, a newtool). Going Public has been used in Bolivia, Bangladesh, Uganda and elsewhere(Bentley et al. 2003).

8 Impact of IPM Extension for Smallholder Farmers in the Tropics 341
Going Public in Kenya: Nelson Wekulo tells a crowd how to vaccinate hens for Newcastle dis-ease. IPM topics work equally well with this soap-box style of extension
Written material in Bolivia: Gonzalo Sandoval (left) hands out fact sheets on onion diseases, anddiscusses them with farmers
342 J.W. Bentley
Written material, including fact sheets, journals and newspapers are also useful,especially when written for farmers and validated by farmers before distribution.In India, coffee farmers in Karnataka have journals and magazines in their homes.Adike Pathrike is a magazine that started as a newsletter in the 1980s and rapidlyexpanded. It is published entirely in the Kannada language. It has a color cover andadditional black and white photos inside. Almost all of the material is based onfarmer experiences. Although the title literally means “areca magazine” only 10%of the material is on areca. But whatever the topic, the new technology describedhas to be validated by farmers, even though agricultural scientists write most of thematerial. The readers are solid commercial growers, family farmers who are literateand who can afford a magazine. The strong local tradition of publishing and readingalso helps. Advertisers help keep the costs down, and a good postal system helps tomove it. Journals would not be effective everywhere, but in this situation they are(Padre and Tripp 2003).
Radio is a promising method, and has been used recently in Vietnam to teachpeople to avoid insecticide abuse in rice. A project using radio, leaflets and othermedia led to a 53% reduction in insecticide use and no loss in production in projectsites, and the change eventually spread to more than a million rice farmers threeyears later (Escalada and Heong 2004). Vietnam recently experienced an outbreakof a virus disease in rice. Researchers helped to adjust an environmental radio soapopera to communicate essential information to farmers. This together with leaflets,TV broadcasts reached two million farmers in three months and spread the use ofthe “Escape Strategy” (light traps to detect peak immigrations of the brown planthoppers that transmit the virus, to make group decisions as to when to plant in orderto escape virus infection though synchronized rice planting). The “escape strategy”helps farmers to avoid virus transmission without pesticides and is now widespreadin the Mekong Delta (KL Heong, personal communication).
A study in Bolivia compared FFS to radio and community workshops, which arelike FFS, but more people attend, as many as 80. Community workshops only meetthree times instead of a dozen, saving time and expense. The community workshopswere nearly as effective as FFS at getting a message across, and the radio made arespectable showing, but at a fraction of the cost (Bentley et al. in press).
8.5 Impact of IPM Extension
Studies of other IPM extension methods are even harder to find than evaluations ofFFS. But there are a few.
Like the brown plant hopper in rice, the fall armyworm in Central America is apest of maize which is usually controlled by its natural enemies, as long as peopledo not spray insecticides. IPM training in Honduras in the 1980s used short courses,but like FFS the courses emphasized learning by observation. Honduran farmers whohad taken IPM training could name more natural enemies, and were less likely to useinsecticide than neighbouring farmers who had not taken IPM courses. However, the

8 Impact of IPM Extension for Smallholder Farmers in the Tropics 343
IPM farmers were not likely to practice other technologies they had learned on courses(like using sugar-water to attract natural enemies) and over time some farmers cameto doubt that social wasps (Vespids) were effective predators of army worms, becausefarmers observed that the wasps were abundant when there were also high levelsof armyworms in their maize (Wyckhuys 2005, Wyckhuys and O’Neil 2007). Localknowledge, behavior, and training interact in non-obvious ways.
In Bangladesh there is now runaway pesticide abuse, especially as farmers growmore vegetables for the ever more sophisticated internal market. In a study spon-sored by the Global Plant Clinic, based on in-depth interviews and multiple com-munity meetings in 30 communities, researchers found that farmers used common aswell as some unauthorized pesticides, making frequent use of chemicals to controlthe bean aphid, bean pod borer, cabbage butterfly, brinjal shoot and fruit borer, cu-curbit fruit fly, cutworm, banana leaf and fruit beetle etc. In Natore district, farmersmade 40–50 pesticide applications to protect a single bean crop from bean pod borer.To protect the brinjal shoot and fruit borer, farmers used the pesticides almost everyday and in some cases, 150–200 times in a single crop season. Farmers of Norsingdidistrict applied pesticides at least 1–3 times in a week on vegetable crops. Somefarmers in Natore and Norsingdi district spray high amounts of chemicals to theirmarket crops, but avoid spraying the part they intend to eat at home (Harun-Ar-Rashid et al. 2006).
Part of the problem is that in many countries, there is no longer a formal ex-tension service, or there is a highly fragmented, donor-driven service, which haspoor links to research. There are some exceptions. Researchers in Uganda reportsuccess with banana Xanthomonas wilt (BBW), which was new to Uganda and wasdevastating the staple food crop, banana, in the early 2000s. Researchers developedcultural controls, especially twisting off the fleshy, red male flower, because insectsvisited it, and transmitted the bacteria. BBW control required a simple message,delivered to millions of people, and urgently. The Ministry of Agriculture and vari-ous donor-funded programs used a mix of posters, radio programs, newspaper ads,conventional extension and Going Public to get the message out. Cultural control ofBBW is catching on in Uganda, not unlike the way cultural control was adopted inColombia for the coffee berry borer.
A well-funded, well-organized agency can make a difference. For example, inBolivia after public extension collapsed in the early 1990s, one of the few programsleft was IBTA-Chapare (Bolivian Institute of Agricultural Technology), funded byUSAID to provide alternatives to coca-growing. One of the alternative crops wasbanana, which was attacked by the Sigatoka disease. IBTA-Chapare responded withfungicides and also by cutting off diseased leaves. Although slicing off the leaves(with a blade attached to a pole) was tedious, commercial farmers adopted it moreor less en masse, in part because the technology worked, and in part because of awell-funded, well-coordinated effort by extension agencies to convey the messageto farmers.
Money is not always the answer. Certain well-funded agencies continue to teachdysfunctional technologies after many years. For example sticky, yellow traps werepromoted to capture whitefly in tomato as early as 1991 in Nicaragua. They are

344 J.W. Bentley
still being promoted, from Guatemala to Bolivia, 16 years later, even though theydo not work. The traps are big sheets of yellow plastic, tacked between two sticksand set out in the field, coated with sticky oil. Insects are attracted to them, stick tothem and die. Even a cursory look at one of the sheets shows that many beneficialinsects are killed, and many pest insects escape. After a season or so, farmers realizethat the traps are ineffective and abandon them. That does not stop extension agentsfrom teaching yellow traps to a new set of farmers. So the traps have been tried,abandoned, and tried again for nearly a generation, all over the American tropics.Extension agents teach them because they are non-chemical, colourful, visual andeasy to teach.
8.6 Conclusion
There is still a great deal of work to be done in order to understand the impact of IPMextension in the developing world. There is some cause for optimism; regardless ofthe method used, most farmers who have received IPM training seem to have eitherlowered costs, raised their yields, or both. In order to get sound IPM information toas many farmers as possible, at an affordable cost, more extension needs to be donewith mass media, especially videos, TV and radio. More work also needs to be donewith face-to-face methods that can reach large audiences, but which are not massmedia, strictly speaking. Face-to-face extension methods may not be cost-effectivein many cases, unless they are used to do more than simply teach farmers. For exam-ple, extension can be a way for researchers to learn about farmers’ conditions andto conduct adaptive research with farmers, who can then speak on radio or videoprograms and reach a much larger audience.
Acknowledgments Thanks to Graham Thiele and Eric Boa for their comments on earlier versions.
References
Anandajayasekeram, P., Davis, K. and Workneh, S. 2007. Farmer field schools: An alternative toexisting extension systems? Experience from Eastern and Southern Africa. Journal of Interna-tional Agricultural and Extension Education 14(1):81–93.
Aristizabal, A., Salazar, L.F., E., Mejıa, H.M., M, C.G. 2002. Cambios en la adopcion de loscomponentes del manejo integrado de la broca del cafe, Hypothenemus hampei (Coleoptera:Scolytidae), a traves de metodologıas participativas con agricultores. Revista Colombiana deEntomologıa (Colombia) 28(2):153–160.
Baker, P.S. 1999. The Coffee Berry Borer in Colombia. Silwood Park, Ascot, UK, CABIBioscience. 144 pp.
Bentley, J.W. 2006. Folk experiments. Agriculture and Human Values 23(4):451–462.Bentley, J.W. and Baker, P.S. 2002. Manual for Collaborative Research with Smallholder Coffee
Farmers. CABI Commodities, Egham, 130 pp.Bentley, J.W., Boa, E., Van Mele, P. Almanza, J., Vasquez, D. and Eguino, S. 2003. Going Public:
A new extension method. International Journal of Agricultural Sustainability 1(2):108–123.

8 Impact of IPM Extension for Smallholder Farmers in the Tropics 345
Bentley, J.W., Nuruzzaman, M., Nawaz, Q.W. and Haque, M.R. 2005. Picture songs. In Van Mele,P., Salahuddin, A. and Magor, N.P. (eds), Innovations in Rural Extension: Case Studies fromBangladesh. CABI and IRRI, Wallingford, pp. 115–123.
Bentley, J.W., Priou, S., Aley, P., Correa, J., Torres, R., Equise, H., Quiruchi J.L. and Barea, O.2006. Method, creativity and CIALs. International Journal of Agricultural Resources, Gover-nance and Ecology 5(1):90–105.
Bentley, J.W., Velasco, C., Rodrıguez, F., Oros, R., Botello, R., Webb, M., Devaux, A. andThiele, G. 2007. Unspoken demands for farm technology. International Journal of AgriculturalSustainability 5(1):70–84.
Bentley, J.W., Barea, O., Priou, S., Equise, H. and Thiele, G. 2007. Comparing farmer field schools,community workshops and radio: Teaching Bolivian farmers about bacterial wilt of potato.Journal of International Agricultural and Extension Education 14(3):45–61.
Braun, A.R., Thiele, G. and Fernandez, M. 2000. Farmer field schools and local agricultural re-search committees: Complementary platforms for integrated decision-making in sustainableagriculture. ODI, London, AgREN Network Paper No. 105.
Braun, A., Jiggins, J., Roling, N., van den Berg, H. and Snijders, P. 2006. A Global Survey andReview of Farmer Field School Experiences. A Report for the International Livestock ResearchInstitute, Wageningen, 101 pp.
Carpenter, D. 2003. An investigation into the transition from technological to ecological rice farm-ing among resource poor farmers from the Philippine Island of Bohol. Agriculture and HumanValues 20(2):165–176.
Danielsen, S., Boa, E. and Bentley, J.W. 2006. Puesto Para Plantas: A Clinic Where You Can BringYour Sick Plants. Funica, Managua. (available on-line at http://www.funica.org.ni/docs/Book-PPP-Eng.pdf, accessed 6 February 2008).
Davis, K. 2006. Farmer field schools: A boon or bust for extension in Africa? Journal of Interna-tional Agricultural and Extension Education 13(1):91–97.
Devine, G.J., Furlong, M.J. 2007. Insecticide use: Contexts and ecological consequences. Agricul-ture and Human Values 24(3):281–306.
Escalada, M.M. and Heong, K.L. 2004. The case of using mass media: Communication and be-havior change in resource management. In New Directions for a Diverse Planet. Proceedingsof the Fourth International Crop Science Congress. Brisbane.
Feder, G., Murgai, R. and Quizon, J. 2004a. Sending farmers back to school: The impact of farmerfield schools in Indonesia. Review of Agricultural Economics 26(1):45–62.
Feder, G., Murgai, R. and Quizon, J.B. 2004b. The acquisition and diffusion of knowledge: Thecase of pest management training in farmer field schools, Indonesia. Journal of AgriculturalEconomics 55(2):221–243.
Gallagher, K. 2003. Fundamental elements of a farmer field school. LEISA Magazine 19(1):5–6.Godtland, E.M., Sadoulet, E., de Janvry, A., Murgai, R. and Ortiz, O. 2004. The impact of farmer
field schools on knowledge and productivity: A study of potato farmers in the Peruvian Andes.Economic Development and Cultural Change 53:63–92.
Harun-Ar-Rashid, M. Good Seed Initiative (GSI) in South Asia Survey Report: Assessment onAdditional Impact of Video Show On Rice Seed Post Harvest Practices. Agricultural AdvisorySociety, Dhaka.
Harun-Ar-Rashid, M., Rahman, A.M., Kelly, P. and Bentley, J.W. 2006. Local Knowledge of PlantHealth in Bangladesh The Meanings of Names Farmers Use for Pests and Diseases and HowThey Control Them. Agricultural Advisory Society and Global Plant Clinic, Dhaka.
Kelly, L. 2005. The Global Integrated Pest Management Facility: Addressing challenges of glob-alization: An independent evaluation of the World Bank’s approach to global programs. Casestudy. World Bank, Washington DC.
Mancini, F. 2006. Impact of integrated pest management farmer field schools on health, farmingsystems, the environment, and livelihoods of cotton growers in Southern India. WageningenUniversity dissertation no. 3936.
Morales, L., Zamora, A. and Bentley, J.W. 2002. La Gente Habla con la Tierra: ComunicacionHorizontal de MIP en Nicaragua. Report submitted to CATIE, Managua.
346 J.W. Bentley
Nelson, R., Orrego, R., Ortiz, O., Tenorio, J., Mundt, C., Fredrix, M. and Vien, N.V. 2001. Workingwith resource-poor farmers to manage plant diseases. Plant Disease 85:684–695.
Ooi, P.A.C. 1998. Beyond the farmer field school: IPM and empowerment in Indonesia. IIED,London, Gatekeeper Series, No. 78.
Ortiz, O., Garret, K.A., Heath, J.J., Orrego, R. and Nelson, R.J. 2004. Management of potato lateblight in the Peruvian Highlands. Evaluating the benefits of farmer field schools and farmerparticipatory research. Plant Disease 88:565–571.
Padre, S., Sudarshana, Tripp, R. 2003. Reforming farm journalism: The experience of AdikePathrike in India. Overseas Development Institute, London, Agricultural Research and Ex-tension Network Paper No. 128.
Palis, F. 2006. The role of culture in farmer learning and technology adoption: A case study offarmer field schools among rice farmers in Central Luzon. Agriculture and Human Values23(4):491–500.
Ricker-Gilbert, J. 2005. Cost-Effectiveness Evaluation of Integrated Pest Management (IPM) Ex-tension Methods and Programs: The Case of Bangladesh. Virginia Polytechnic Institute andState University, M.Sc. thesis.
Sorby, K. Fleisher, G. and Pehu, E. 2003. Integrated pest management in development, review oftrends and implementation strategies. ARD working paper 5. World Bank, Washington DC.
Stone, G.D. 2007. Agricultural deskilling and the spread of genetically modified cotton in Waran-gal. Current Anthropology 48(1):67–103.
Robinson, E.J.Z., Das, S.R. and Chancellor T.B.C. 2007. Motivations behind farmers’ pesticideuse in Bangladesh rice farming. Agriculture and Human Values 24(3):323–332.
Rola, A.C., Jamias S.B. and Quizon, J.B. 2002. Do farmer field school graduates retain and sharewhat they learn? An investigation in Iloilo, Philippines. Journal of International Agriculturaland Extension Education 9(1): 65–76.
Tripp, R., Wijeratne, M. and Piyadasa, V.H. 2005. What should we expect from farmer fieldschools? A Sri Lanka Case Study. World Development 33(10):1705–1720.
van den Berg, H. and Jiggins, J. 2007. Investing in farmers—The impacts of farmer field schoolsin relation to integrated pest management. World Development 35(4):663–686.
Van Mele, P. 2006. Zooming-in, zooming-out: A novel method to scale up local innovations andsustainable technologies. International Journal of Agricultural Sustainability 4:131–142.
Van Mele, P. and Braun, A.R. 2005. Importance of methodological diversity in research and devel-opment innovation systems. In Gonsalves, J. Becker, T., Braun, A., Campilan, D., de Chavez,H., Fajber, E., Kapiriri, M., Rivaca-Caminade, J. and Vernooy, R. (eds), Participatory Researchand Development for Sustainable Agriculture and Natural Resource Management: A Source-book. Volume 1. Understanding Participatory Research and Development. CIP-Upward/IDRC,Manila, pp. 151–156
Van Mele, P. Zakaria, A.K.M. and Bentley, J.W. 2005. Watch and learn: Video education forappropriate technology. In: Van Mele, P., Salahuddin, A. and Magor, N.P. (eds), Innova-tions in Rural Extension: Case Studies from Bangladesh. CABI and IRRI, Wallingford,pp. 77–88.
Vayda, A.P., Setyawati, I. 1995. Questions about culture-related considerations in research on cog-nition and agro-ecological change: Illustrations from studies of agricultural pest managementin Java. In: de Ruijter, A. and van Vucht Tijssen, L. (eds), Cultural Dynamics in DevelopmentProcesses. UNESCO, Netherlands, pp. 259–278.
Winarto, Y.T. 2004. Seeds of Knowledge: The Beginning of Integrated Pest Management in Java.Yale Southeast Asia Studies, New Haven, Connecticut, 429 pp.
Wyckhuys, K.A.G. 2005. Evaluating the Relative Contribution of Training and Ecological Factorson the Adoption of Insect Pest Management Technologies in Honduran Smallholder Communi-ties. Ph.D. thesis, Purdue University.
Wyckhuys, Kris A.G. and O’Neil, R.J. 2007. Local agro-ecological knowledge and its relation-ship to farmers’ pest management decision making in rural Honduras. Agriculture and HumanValues 24(3):307–321.

Chapter 9Impact of IPM Programs in Asian Agriculture
Kevin D. Gallagher, Peter A.C. Ooi and Peter E. Kenmore
Abstract IPM Programs in Asia, including on rice, cotton and vegetables, havebeen broadly based on three dimensions. First is a solid IPM science basis includingecological interaction, plant physiology and soil-plant interactions. Second is policyfor IPM, especially elimination of pesticide subsidies which cause over-use of pes-ticides and disrupt natural enemies leading to secondary pest outbreaks particularlyon rice and cotton. Finally, the third dimension is farmer education through hands-onpractical training. Lessons are drawn from the FAO Inter-Country Program for RiceIPM in Asia, the FAO-EU for Cotton in Asia and FAO Regional Vegetable IPMProgram in South and Southeast Asia. A case study on cotton highlights broadenedaspects of IPM activities through farmer empowerment.
Keywords Integrated Pest Management (IPM) · farmer empowerment · FarmerField School (FFS) · IPM policy · environmental education
9.1 Introduction
This chapter will draw heavily from the experience of the authors working directlywithin a few large-scale IPM Programs, especially on the FAO Inter-Country Pro-gram for Rice IPM in Asia, the FAO-EU for Cotton in Asia and FAO RegionalVegetable IPM Program in South and Southeast Asia. These long running programs,supported by national and international funds, provided the basis to develop thescience, policy and mass education for development of IPM programs in the re-gion. The objectives of these IPM programs were to promote an environmentallysound system of plant protection through better science, better policy and massimplementation.
This chapter will attempt to provide background on the role of a programapproach to achieve the objectives from the viewpoints of the authors. It will
K.D. Gallagher (B)Food and Agriculture Organisation, FAO Representative in Sierra Leonee-mail: [email protected]
R. Peshin, A.K. Dhawan (eds.), Integrated Pest Management: Disseminationand Impact, DOI 10.1007/978-1-4020-8990-9 9,C© Springer Science+Business Media B.V. 2009
347

348 K.D. Gallagher et al.
also present a case study on cotton programs to illustrate how a program ap-proach enriched the key IPM program dimensions of science, policy and massimplementation.
9.2 Impact Studies
Most readers of this chapter will be looking for impact studies on IPM, althoughthe focus of the chapter is on IPM programs overall. Nonetheless, a number of im-pact studies on IPM outcomes in Asia have been undertaken. Waibel et al. (1998)provided specific protocols to measure changes in pesticide usage with before/afterproject surveys including control villages outside the project area. Social-economicanalysis (Praneetvatakul and Waibel 2002) have been rigorously conducted underacademic conditions. An extensive literature review of peer reviewed journals byDavis (2006) attempted to draw conclusions from the body of academic studiesalone. Her paper provided a much needed electronic debate over the FFSnet1 onthe role of peer reviewed papers while the literature on IPM programs is largely“grey literature” consisting of reports prepared by practitioners and farmers (Gal-lagher et al. 2006). For example, Pontius (2003) provided methods for farmers toexpress their viewpoints through an illustrative and narrative method. Other impactstudies (for example, Tripp et al. 2005, Ooi et al. 2005 and van den Berg et al. 2006)focused on specific countries or topics within IPM programs and provided criticalfeedback for narrowly defined specific situations. A number of thesis have also beenpublished following the Waibel et al. (1998) protocol, testing specific hypothesisrelated to pesticide use and yields. Other recent research focused on the social di-mensions (Mancini et al. 2007 and Ogawa 2007) and examined the social aspects ofIPM programs especially livelihood improvements and social relationships.
On program level impact assessments, Pontius et al. (2002) prepared athorough review of the FAO Inter-Country Program on Rice IPM, including itsevolution towards a wider Community IPM approach in which the science of IPMprovided an essential entry point within farmer communities but extended to touchon the social, economic and political basis of crop production in those communities.An extensive review (van den Berg 2004) of twenty five impact evaluations in Asiaconcluded that none of the reviewed evaluations were able to cover the entire rangeof science, policy and mass education objectives of IPM program approaches. Healso concluded that there is a great need for better designed impact evaluation start-ing with better baseline information, clearer indicators and long term commitmentto impact assessment. Ooi et al. (2005) review of cotton IPM program is discussedin the case study below.
9.2.1 Science Within IPM Programs
A key first step of the FAO IPM Programs has been to ensure a firm scientificfoundation. To take the example of the FAO Inter-Country Program for Rice IPM,
1 Global FFS Network and Resource Centre: www.farmerfieldschool.info

9 Impact of IPM Programs in Asian Agriculture 349
the science of IPM began with the plant resistance and new variety approachesof the International Rice Research Institute (IRRI) of the 1970s and 1980s. How-ever, IPM programs expanded IPM to the importance of maintaining natural en-emies which were being disrupted by pesticide applications: pesticides that wereheavily subsidized during the early years of the Asian Green Revolution. The ricebrown planthopper (Nilaparvata lugens Stal) was a particular problem threateningrice production in Asia in the 1970s (Sogawa and Cheng 1979) and was linkedto early-season insecticide sprays for leaf folders (Cnaphalocrocis medinalis Gue-nee) and stemborers that were thought to cause high yield losses in rice. Kenmore(1980) and Kenmore et al. (1984) working at IRRI provided a clear basis for abroadened IPM system which protected the integrity of natural enemy communitiesfrom disruptive pesticide applications. It is now known that not just insecticides butalso certain herbicides and fungicides (for example Kitazin R© is a fungicide in theorganophosphorous group and popular for rice disease control) also disrupt naturalenemy populations leading to resurgence of primary pests and severe secondarypest outbreaks. Ooi (1986 and 1988) confirmed these findings and provided a goodgeneral review (Ooi and Shepard 1994). Settle’s Indonesian team (Settle et al. 1996)working under the Inter-Country Rice Program, further elaborated the key role ofnon-pest species such as Chironomidae in the rice ecosystem to maintain generalpredators, even in the absence of pest species. Settle also provided a key link to therole of organic matter in the soil to higher populations of detritivores and ultimatelyto lower pest populations. Finally linkages between plant compensation to stemborerand leaf folder damage (Rubia et al. 1996) showed that yield losses were much lessthan expected, when plants were able to recover, thus reducing pressure to applydisrupting early-season sprays.
Thus the scientific basis for an IPM rice program was eventually well established.These scientific results became the basis for the “rice IPM principles” which whentranslated into lay-language, were to first “grow a healthy soil and crop” usingresistant varieties and ensuring adequate plant compensation capacity (classically“cultural controls”); “conserve natural enemies” through avoidance of disruptivesprays and active maintenance of natural enemy habitat in the off season (“biologicalcontrols”); “observe fields regularly” for good water, weed, plant, rat, bird, pest andnatural enemy management; and, “farmers become experts” to be able to understandand implement these principles of rice IPM (Matteson et al. 1994).
The IPM programs in vegetables and cotton have followed similar first steps tobuild a foundation of the underlying science of IPM from an ecological and eco-nomic point of view far beyond more classical economic threshold and samplingbased IPM systems developed in the 1970s and 1980s. IPM Program support hasbeen essential to maintain focused research both on and off research stations. In-deed, off-station research has been as important as on-station research (van de Fliertet al. 2002). Most of the work of Settle et al. (1996) was conducted in farmers’ fieldsnear the Indonesian Ministry of Agriculture’s Pest Surveillance Laboratories, butwith the backstopping by experts at the University of Gadjah Mada, Bogor Instituteof Agriculture and other national experts. In another off-farm approach, van denBerg et al. (2004) showed the effectiveness of farmers carrying out common robustresearch protocols in multi-location trials to gain area wide data on key IPM issues.

350 K.D. Gallagher et al.
9.2.2 Policy Within IPM Programs
As noted above, high pesticide inputs during the early stages of the Asian GreenRevolution, especially during the 1970s were one of the underlying causes for sec-ondary outbreaks of brown planthopper that widely threatened rice production inAsia (IRRI 1979). IRRI, national research and the FAO Inter-Country Rice IPMProgram (see Section 9.2 above) scientific basis showed that this pest was actuallycaused by pesticide applications. For policy makers across the region, the notionthat a pest could actually be caused by the pesticides they were subsidizing to getrid of pests was difficult to accept (and still is through out the world today amongnon-entomologists). Pesticide subsidies in Indonesia for example “were a financialburden to the government: for example, in 1986 subsidies amounted to 179 million1995 U.S. dollars (about 0.17 percent of GDP and 0.8 percent of the total govern-ment expenditure) and in the period of 1976–87 nearly $1.5 billion 1995 U.S. dollars(World Bank data2)”.
Indeed, the role of natural enemies was not widely known by decision makerswho even came up against some simplistic IPM notions of economic thresholds thatmany policy level decision makers had been exposed to in their university courses.Secondary pests and pest resurgence had to be demonstrated in the field to deci-sion makers (Kenmore 1991, 1997). This was one of the major roles of the IPMPrograms: that is setting up field demonstrations with farmers in a relatively smallnumber of sites so that policy makers could see for themselves the effect of overspraying which resulted from the low cost of subsidized insecticides. Policy makerswere exposed to side-by-side fields, with unsprayed fields having very low popu-lations of brown planthoppers and good yields while sprayed fields had extremelyhigh “hopper-burnt” fields with low yields. In retrospect, it is not surprising thatthis should be the case as IRRI scientists testing resistant varieties had developed amethod of building up brown planthopper populations by applying pesticides. Al-though undocumented, it is important to realize the subsidies also mean kick backsto decision makers granting large contracts to supplies of pesticides and thus thereis a strong reluctance to remove subsidies once started, no matter how much scienceand field evidence.
In the case of Indonesia, to cite the World Bank4 again “in 1986 many pesticideson rice were banned and direct subsidies for pesticides were phased out in 1986–89.The policy shift not only saved more than $100 million per year in governmentexpenditure but also made the country economically and environmentally better off.Pesticide production dropped to 22,100 metric tons in 1990 and meanwhile pesti-cide imports fell to a third of mid-1980s levels. Although no data exist to quantifythe environmental impact of the subsidy elimination, the significant drop in pesti-cide use is thought to have alleviated damage to the environment—particularly topublic health and to biological diversity. The reduction in pesticide use has been
2 wbln0018.worldbank.org/essd/eeipm.nsf/c0219bb8ef063b4c8525663b00657a5d/0ac89ed75640c61785256642004e6077

9 Impact of IPM Programs in Asian Agriculture 351
accomplished without adverse effects on rice production. Total milled rice produc-tion rose from 27 million metric tons in 1986 to 30 million metric tons in 1990.”
Bangladesh, India, Philippines and other Asian countries also reduced or elim-inated pesticide subsidies for rice and also reduced brown planthopper problems.Unfortunately, lessons are lost over time with changes in policy makers such thatthere is again a push to encourage subsidies for rice production with the notion thatyields and pesticide applications are positively correlated in all cases.
The results of policy change for pesticide subsidies were thus an important partof IPM programs and integrated policy with policy maker education for better deci-sion making (McClelland 2002). It is likely that policy changes in themselves hadthe largest impact on pesticide reductions as the cost of pesticides increased anduse declined. However, policy changes also led to changes in extension for cropproduction as seen in the next section.
9.2.3 Empowering Farmers Within IPM Programs
One of the fundamental truths of nature is its diversity and variation. For IPM man-agement, each field will have its own dynamic and each farmer will have their owncapacity to manage the situation. Blanket recommendations for crop production mayprovide good guidelines but in general are just guidelines that must be assessed foreach case differently. Within IPM programs, specific education should be under-taken for farmers to have basic information for better decision making, recognizingthat farmers also have their own valid knowledge and experiences that must be testedalongside outside knowledge.
IPM programs have frequently developed as hands-on programs in many parts ofthe world. RiceCheck seminars in Australia, for example, help farmers to recognizestemborers and know their ecology in order to improve decision making. The FAOInter-Country Rice IPM Program in Indonesia was also able to develop a hands-on practical system for rice IPM building on various experiences in the region aswell as building on models developed for functional literacy and primary healthcare (Matteson et al. 1994). Dilts (1985), as FAO officer in charge of the IndonesiaIPM project with others from World Education, provided the strong basis for adultbased experiential learning while IPM practitioners provided practical managementtools. Thus for rice IPM farmer education in Indonesia, the successful Farmer FieldSchool (FFS), indeed “schools without walls”, evolved from the Training and Visitmethods of the extension service of the Government of Indonesia to provide a placefor farmers to test IPM methods and improve on their own methods. The main thrustwas to implement the principles of rice IPM cited above – while learning why heavyinputs of spraying only caused more problems with brown planthoppers (van deFliert et al. 2002). The FFS model allowed local learning and decision making inways that created local ownership leading to demand driven programs and farmerled actions (Dilts and Pontius 2000, Pontius et al. 2002).
The FFS model proved to be very flexible and easily adapted to other crops andtopics (Mangan and Mangan 2003, Kjetil Øyna 2006, Stigter 2007, Braun et al.

352 K.D. Gallagher et al.
2006) on IPM. However, FFS groups themselves were able to use FFS skills inorganizing to move past education programs to research groups (van de Fliert et al.2002, van den Berg et al. 2004) and advocacy (Rahadi and Widagdo 2003). As FFSgroups expanded their confidence and organization, the notions of Community IPMemerged with local communities engaging policy makers on issues such as cropcredit forcibly linked to pesticides, local environmental regulations and pesticides,health impact of pesticides, and other IPM related issues while also developing lo-cal initiatives for marketing IPM products and building alumi associations (Pontiuset al. 2002).
IPM Programs have encouraged development of FFS to empower farmers to beable to make their own individual decisions as well as to develop community levelapproaches to dealing with community level pest management (e.g. rats) and policyissues such as pesticide impact on the environment and health of the community.Science-based understanding combined with advocacy and organizational skills toinfluence policy therefore come together at community levels, but influence overallIPM policy.
9.3 Cotton Case Study
9.3.1 Genesis of Cotton IPM Project Headed by FAO
The IPM program promoted by the Food and Agriculture Organisation (FAO) ofthe United Nations, focused on farmer education that helped made farmers ex-perts in shifting from dependence on chemical insecticides to a higher appreciationof existing natural biological control. By 1990, the FAO initiated a program thatbrought farmers to IPM field schools (Pontius et al. 2002). The lessons learnedin rice benefited in the development of cotton IPM and a major focus of imple-menting the Cotton IPM project in Asia is based on the IPM Farmer Field Schoolsmodel.
The IPM Farmer Field School (FFS) is the primary learning approach used withinthe context of farmer education (Dilts and Pontius 2000). Irrespective of the cropthe IPM Field School is a season long learning experience. The important aspectof FFS is that the resulting process is learner-centred, participatory and relies on anexperiential learning approach (Pontius et al. 2002).
9.3.2 The Farmer Field School in Cotton IPM
The FAO-EU Integrated Pest Management (IPM) Program for Cotton in Asia hadsix member countries, namely Bangladesh, China, India, Pakistan, the Philippinesand Vietnam. Approved in 1999, the project activities started in 2000 in China,India and Vietnam, and in the remaining countries in 2001. It had the developmentobjective of “sustainable, profitable and environmentally sound production of cotton

9 Impact of IPM Programs in Asian Agriculture 353
in the participating countries, through the development, promotion and practice ofIPM by farmers and extension staff”. The immediate objectives included:
� developing a cadre of IPM cotton trainers from existing extension or field plantprotection staff to train farmers in Farmer Field Schools (FFS)
� promoting co-operation for cotton IPM among governments, research institu-tions, development agencies, extension services and farmers’ and other NGOsand to improve access for all interested parties to information from within andoutside of the Program area
� enhancing national policies on plant protection in cotton to support IPM devel-opment in the six Program countries
To facilitate farmer education in FFS, there is a need to invest in training of IPMFacilitators. This is achieved in Training of Facilitators (ToF) programs initiated ineach participating country. A ToF, like FFS, is a season long education experiencewhere potential educators are trained in leadership, facilitation, and ecology.
The Program piloted a way towards skill development to overcome inefficiencyin cotton production resulting from over-reliance on the use of chemical insecticidesto control perceived pest problems. FFS are schools without walls, organized next tothe cotton fields. About 25–30 farmers meet in the morning for a half day each weekfor one whole season. At each FFS meeting, participating farmers broke into smallgroups to make detailed observations of the cotton crop in the study field (Fig. 9.1),comparing the field situation between an IPM plot and a “farmer practice” plot.
Fig. 9.1 Farmers from an FFS in Vietnam examining cotton plants in their study plot, in southernVietnam in 2000

354 K.D. Gallagher et al.
Fig. 9.2 A cotton ecosystem drawing by cotton farmers in an FFS from Anhui Province,China, 2000
Observations were recorded, discussed, and interpreted by the group and collated,resulting in an agro-ecosystem drawing (Fig. 9.2) summarizing the data collectedfrom the respective plots. Farmers would share their findings with other farmers(Fig. 9.3)
9.3.3 Impact of Educating Farmers in Cotton IPM
The benefits of farmer education in FFS can be gauged by the results from selectedFFSs in six participating countries of the FAO-EU IPM Program for Cotton in Asia(Fig. 9.4). Usually, fields with IPM practices that encompass an understanding of

9 Impact of IPM Programs in Asian Agriculture 355
Fig. 9.3 IPM facilitators learning techniques to encourage farmers to share cotton ecosystemanalysis to fellow farmers in an Sukkur, Pakistan in 2003
the cotton agro-ecosystem in making agronomic decisions have a higher net profitas compared with that of a similar field that followed normal practices (Ooi 2004).This may be attributed to a better knowledge of beneficial insects that exist in thefield as noted by Thai rice farmers (Praneetvatakul and Waibel 2002). Often this is
0
200
400
600
800
1000
1200
1400
1600
Bangladesh China India Pakistan Philippines Vietnam
Net
inco
me
(US
$/h
a)
FP IPM
Fig. 9.4 Net income (US$/ha) obtained at selected Farmer Field Schools in six participating coun-tries of the FAO-EU IPM Program for Cotton in Asia (see Ooi, 2004)

356 K.D. Gallagher et al.
translated into reduced use of chemical insecticides and greater attention to agro-nomic practices that are directly related to plant growth and productivity (Ooi et al.2004). Impacts of the FFS in cotton in other related fields are provided in the pub-lications on the Impact of the FAO-EU IPM Program for Cotton in Asia (Ooi et al.2005).
9.4 Conclusions
Asian IPM Programs, especially the FFS aspects, have fostered programs in Africa(Anandajayasekeram et al. 2007), Latin America (for example: Schut 2006), EasternEurope and Central Asia. Many examples are found on FFSnet mentioned above.These programs not cover more than 70 countries and 30 topics (Braun et al. 2006)and thus one may claim a massive impact of the Asian programs.
There is a growing concern, however, that the wider aspects of scientific ba-sis and policy are left behind while FFS and other mass education programs pro-ceed as strong demand driven extension programs. The authors feel that while itis extremely important that farmer education is mainstreamed in extension pro-grams of government, non-government and private sector activities, there is a cor-responding need to promote a solid IPM scientific foundation and ensure eachnew generation of policy makers are on target for budget and legislative deci-sions which build on past lessons of solid IPM management and not yield to yetanother cycle of pesticide subsidies, especially in the face of high food and fuelcosts.
Acknowledgments The authors would first like to recognize the large number of scientists, facil-itators and farmers that provide the foundation of IPM programs. Many senior mentors in all theAsian countries provided the fabric within which these programs were able to be implemented. Theauthors specifically lay no claim to the innovations achieved in the programs but do acknowledgetheir deep appreciation to have been a part of this IPM community. For literature cited, much ofit grey literature prepared by colleagues without the access or funding to publish in peer-reviewedjournals, we would like to thank Arnoud Braun for establishing and maintaining the Global FFSNetwork and Resource Centre where most of the articles cited my be found. Finally, last but notleast, the authors would like to thank Dr R. Peshin for his leadership to prepare this monumentalbook and his extremely kind patience with us in preparation of this chapter.
References
Anandajayasekeram, P., Davis, K. and Workneh, S. 2007. Farmer field schools: An alternative toexisting extension systems? experience from Eastern and Southern Africa. Journal of Interna-tional Agricultural and Extension Education 14–1:81–93.
Braun, A. R., Jiggins, J., Roling, N., van den Berg, H. and Snijders, P. 2006. A Global Survey andReview of Farmer Field School Experiences. Final Report. Report prepared for ILRI. Endelea,Wageningen. 91 p. http://www.infobridge.org/ffsnet/output view. asp?outputID=3200
Davis, K. 2006. Farmer field schools: A Boon or a Bust for extension in Africa? Pub-lished in the Eastern and Central Africa Programme for agricultural policy analysis

9 Impact of IPM Programs in Asian Agriculture 357
(ECAPAPA) Electronic Newsletter 07 April 2006—Volume 9 Number 06. Available at:http://www.w1.co.ug/asareca/htdocs/ecapapa/newsletter/1145612746ECAPAPA%20Newsletter%20Vol.%209%20No.%2006.doc
Dilts, R. 1985. Training: Re-schooling society? in Prisma 38, December:78–90.Dilts, R. and Pontius, J. 2000. IPM and farmer-led development: lessons from Indonesia. In: Ooi,
A. C. P. (ed), Farmer-led Integrated Pest Management. Asian Productivity Organization, Tokyo,Japan, pp. 34–42.
Gallagher, K., Braun, A. R. and Duveskog, D. 2006. Demystifying Farmer Field SchoolConcepts. Paper prepared in response to JIAEE paper by K. Davis. 6 pp. Available at:http://www.infobridge.org/FFSnet/output view.asp?outputID=3200.
IRRI. 1979. Brown Planthopper: Threat to Rice Production in Asia. International Rice ResearchInstitute, Los Banos.
Kenmore, P.E. 1980. Ecology and outbreaks of a tropical insect pest of the green revolution,the rice brown planthopper, Nilaparvata lugens Stal, PhD thesis. University of California,Berkeley.
Kenmore, P.E. 1991. Indonesia’s Integrated Pest Management: A Model for Asia. The Indone-sian National IPM Program and the Food and Agriculture Organization of the United NationsRegional Office, Jakarta.
Kenmore, P.E. 1997. A Perspective on IPM. ILEIA Newsletter 13–4:8–9.Kenmore, P.E., Carino, F.O., Perez, C.A., Dyck, V.A. and Gutierrez, A.P. 1984. Population regula-
tion of the rice brown planthopper (Nilaparvata lugens Stal) within rice fields in the Philippinesin Journal of Plant Protection in the Tropics 1–1 (1984):19–37.
Kjetil Øyna, D. 2006. A Holistic Approach to Improving Lives for Cocoa Farmers and their Fami-lies. Norwegian Association of Chocolate Manufacturers, 24 pp.
Mancini, F., Van Bruggen, A.H.C. and Jiggins, J.L.S. 2007. Evaluating cotton integrated pestmanagement (IPM) farmer field school outcomes using the sustainable livelihoods approachin India. Experimental Agriculture 43:97–112.
Mangan, J. and Mangan, M.S. 2003. FFS for tree crops. LEISA Magazine 19–1:30–31.Matteson, P.C., Gallagher, K.D. and Kenmore, P.E. 1994. Extension of integrated pest man-
agement for planthoppers in Asian irrigated rice: Empowering the user. In: Denno, R.F.and Perfect T.J. (eds), Ecology and Management of the Planthopper. Chapman and Hall,London.
McClelland, S. 2002. Indonesia’s Integrated Pest Management in Rice: Successful Integration ofPolicy and Education. Environmental Practice, 4:191–195.
Ogawa, Y. 2007. Social relations and female farmers’ participation in the learning activities of twofarmer field schools in Cambodia, Dissertation No. GD-07-03, Asian Institute of Technology,Pathum Thani, Thailand, 241 pp.
Ooi, P.A.C. 1986. Insecticides disrupt natural control of Nilaparvata lugens in Sekinchan,Malaysia. In: Hussein, M.V. and Ibrahim, S.G. (eds), Biological Control in the Tropics. Univer-sity Pertanian Malaysia, Serdang.
Ooi, P.A.C. 1988. Ecology and Surveillance of Nilaparvata Lugens (STAL)-Implications for itsManagement in Malaysia. Thesis submitted to University of Malaysia in fulfilment of the re-quirements for the degree of Doctor of Philosophy.
Ooi, P.A.C. 2004. Realities of educating resource poor farmers: Experiences in IPM implemen-tation. In: Swanepoel, et al. (ed), Proceedings of the World Cotton Research Conference -3:Cotton production for the new millennium: submitted papers. Cape Town, South Africa, 9–13March, 2003, pp. 953–958.
Ooi, P.A.C. and Shepard, B.M. 1994. Predators and parasitoids of rice insect pests In:Heinrichs, E.A. (ed), Biology and Management of Rice Insects. Wiley Eastern Ltd-New AgeInternational, New Delhi.
Ooi, P.A.C., Walter-Echols, G., Dai, W.D., Morales-Abubakar, A.L., Lim, G.S., Pachagounder,P., Soomro, M. H., Galvan, C., Mancini, F., Petersen, R. and Kamp, K. (eds) 2004. Environ-mental Education for Poor Farmers FAO-EU IPM Programme for Cotton in Asia. Food andAgriculture Organization, Regional Office Asia and Pacific, Bangkok, 62 pp.

358 K.D. Gallagher et al.
Ooi, P.A.C., Praneetvatakul, S., Waibel, H. and Walter-Echols, G. 2005 (eds), The Impact of theFAO-EU IPM Programme for Cotton in Asia. Publication Series Special Issue No. 9. UniversitatHannover 123 pp.
Pontius, J., 2003. Picturing impact! LEISA Magazine 19–1:18–21.Pontius, J., Dilts, R. and Bartlett, A. (eds) 2002. From Farmer Field School to Commu-
nity IPM. Ten years of IPM Training in Asia. FAO, Bangkok 106 pp. Available athttp://www.fao.org/docrep/005/ac834e/ac834e00.htm.
Praneetvatakul, S. and Waibel, H. 2002. A Socio-Economic Analysis of Farmer Field School (FFS)Implemented by the National Program on Integrated Pest Management of Thailand. Paper pre-sented at the CYMMIT impact assessment conference, 4–7 February 2002 San Jose Costa Rica.
Rahadi and Widagdo, H., 2003. Applying the farmer field school approach to farmer-based advo-cacy in Indonesia. In: CIP-UPWARD. Farmer Field Schools: Emerging Issues and Challenges.International Potato Center – Users’ Perspectives With Agricultural Research and Develop-ment, Los Banos, Laguna, pp. 169–175.
Rubia E.G., Heong, K.L., Zalucki, M., Gonzales, B. and Norton, G.A. 1996. Mechanisms of com-pensation of rice plants to yellow stem borer Scirpophaga incertulas (Walker) injury. CropProtection, 15(4):335–340(6).
Schut, M., 2006. ‘A house does not make a home’; Challenging paradigms through Farmer FieldSchools. MSc-thesis, Wageningen University, Wageningen, 161 pp.
Settle, W.H., Ariawan, H., Astuti, E.T., Cahyana, W., Hakim, A.L., Hindayana, D., Lestari,L .S., Pajarningsih and Sartanto. 1996. Managing tropical rice pests through conservation ofgeneralist natural enemies and alternative prey in Ecology 11:1975–1988.
Sogawa, K. and Cheng, C.H. 1979. Economic thresholds, nature of damage, and losses caused bythe brown planthopper In: Brown Planthopper: Threat to Rice Production in Asia. IRRI, LosBanos.
Stigter, K. 2007. An account of visiting those involved in climate field schools in In-donesia. INSAM web site, Accounts of Operational Agrometeorology. Available at:http://www.agrometeorology.org/index.php?id=12&backPID=12&tt news=708.
Tripp, R., Wijeratne, M. and Piyadasa, V.H. 2005. What should we expect from farmer fieldschools? A Sri Lanka case study. World Development 33–10:1705–1720.
van den Berg, H. 2004. IPM Farmer Field Schools: A Synthesis of 25 Impact Evaluations.FAO Corporate Document Repository. Available at: http://www.fao.org/docrep/006/ad487e/ad487e00.htm.
van den Berg, H., Ooi, P.A.C., Hakim, A.L., Ariawan, H. and Cahyana, W. 2004. Farmer fieldresearch: an analysis of experiences from Indonesia. FAO-EU IPM Programme for Cotton inAsia, FAO. Available at: http://www.infobridge.org/FFSnet/output view.asp?outputID=3120.
van den Berg, H., Das H., Hildebrand, P.K. and Ragunathan, V. 2006. Evaluation of the IntegratedPest and Vector Management (IPVM) Project in Sri Lanka. WHO publication. WHO South-EastAsia Region, New Delhi, 42 pp.
van de Fliert, E., Dilts, R.D. and Pontius, J. 2002. Farmer researcher teams, farmer field schoolsand community IPM: different platforms for different research and learning objectives. In:Leeuwis, C. and Rhiannon, P., Wheelbarrows full of frogs: Social learning in rural resourcemanagement. Van Gorcum Publishers, Assen, pp. 121–133.
Waibel, W., Fleischer, G., Kenmore, P.E. and Feder, G. (eds), 1998. Evaluation of IPM Programs –Concepts and Methodologies Papers presented at the First Workshop on Evaluation of IPMPrograms Hannover, March 16–18, pp. 61.

Chapter 10Evolutionary Revolution: Implementingand Disseminating IPM in Indonesia
Edhi Martono
Abstract Integrated Pest Management (IPM) program in Indonesia was imple-mented after the government’s rice self-sufficiency program failed, in most part, dueto brown planthopper attack during the 1970s and 1980s. The IPM program imple-mentation, modeled after some pioneer projects, introduced a new plant protectionapproach, mainly by involving farmers as early as possible in decision making,and reducing their use of pesticides. Since farmers had already been accustomedto chemical-based approach, at the beginning many farmers got confused, lost theirconfidence in extension sevices, and were hard to convince that the new approachis more feasible. The Indonesian experts then created a training-cum-extension pro-gram called Farmer Field School (FFS) on rice, and for about five years (1988–1993)trained about one million rice farmers. The training was later extended for othercrops such as dry-land, vegetables and estates’ commodities. A considerable numberof farmers became familiar with IPM, but the change expected in their attitudes didnot really emanate, especially when they were faced with problems other than plantinsect pests and diseases.
This chapter details the development of IPM program in Indonesia, the way ofits dissemination and the result among Indonesian farmers. The complexity of theproblems shows that technology transfer and program dissemination cannot dependon single approach. A multidisciplinary study should follow the development of atechnology introducing program, and monitor it until it is assured that the programworks as expected.
Keywords Indonesia · IPM national program · FFS
E. Martono (B)Department of Plant Protection, Faculty of Agriculture, Gadjah Mada University,Bulaksumur, Yogyakarta 55281, Indonesiae-mail: [email protected]
R. Peshin, A.K. Dhawan (eds.), Integrated Pest Management: Disseminationand Impact, DOI 10.1007/978-1-4020-8990-9 10,C© Springer Science+Business Media B.V. 2009
359

360 E. Martono
10.1 Indonesia’s Rice Cultivation: A Problem from the Start
Rice self-sufficiency has long been an obsession with the Indonesian governmentever since Indonesian people proclaimed their independence in 1945. There were alsopolitical challenges concerning Indonesian governmentpolicy on economic develop-ment. By the end of 1950s, a clear and well-rounded agricultural policy had yet tobe formulated. President Dr. Soekarno tried to foster self-sufficient plans, includingprograms on food crops such as rice and corn (maize), with only meager results, asincompetence and the disadvantages of the newly formed state haunted those pro-grams. He rejected western help, but the agricultural policy applied by Indonesiangovernment reflected moreof thewesternapproach to increaseproduction.Quietly theGreen Revolution was applied to Indonesian agriculture. There was “Pancha Usaha”,five agricultural principal practices to be adopted by farmers, which included seedtechnology, irrigation improvement, pesticides usage as plant protection measures,use of synthetic inorganic fertilizers, and improved marketing techniques. The useof synthetic chemicals in many of Indonesian rice paddies started in late 1950s.
IR 5 and IR 8 rice varieties were introduced to boost production by Interna-tional Rice Research Institute (IRRI). Rice intensification through program calledBIMAS (Bimbingan Massal, Mass Guidance) was intensified in 1966. The results,however, seemed slow and uncertain, and was not been able to provide Indonesiawith staple food. Some of the introduced rice varieties were not popular amongIndonesian farmers, due to their unacceptable taste and too low plant habitus. Mean-while, in regional level, FAO/UNEP (United Nation Environmental Program) Panelof Experts on Integrated Control advised on the initiation of cooperative RegionalProgram on the integrated control of rice pests in Asia (Oudejans, 1999). Duringthose times, major rice insect pests were various stemborers—white and yellowstem borers (Scirpophaga innotata and S. incertulas), striped borer (Chilo suppre-salis); leafhoppers not only the one vectoring tungro diseases i.e. green leafhopperNephotettix impicticeps, but also whitebacked and zigzag leafhoppers (Sogatellafurcifera and Inazuma/Recilia dorsalis); rice gall midge (Orseolia oryzae); and riceseed bug (Leptocorisa oratorius). The field rats (Rattus argentiventer, R. brevi-caudatus) inflicted major damage in some regions (De Datta, 1981; Van de Fliertet al., 1994). The solution to these pest problems was that pesticides—insecticides,rodenticides—were always included in Bimas’ technology package, either in kindor in credit loans. Therefore, farmers in Bimas program would always use pesti-cides in scheduled treatment, because “we have the chemicals and were urged touse them” as recalled by a farmer (Winarto et al., 1999). This resulted in imbalancein rice ecosystem. The outbreak of brown planthopper (BPH), Nilaparvata lugenshit Indonesian rice farming very hard. Many rice producing regions were left withno harvest, and rice production was threatened as hundred thousand hectares of riceplanting suffered from BPH attack and only a small number of agronomists andexperts realized that BPH attack was the result of indiscriminate use of pesticides(Untung, 2006). Kenmore et al. (1985) had reported that pesticides could resurgeBPH population but his work had no immediate effect in terms of policy or imple-mentation of improved pest control measures to prevent BPH.

10 Evolutionary Revolution: Implementing and Disseminating IPM in Indonesia 361
Some Indonesian entomologists from government offices and universities rec-ognized the need of a more holistic and comprehensive approach to control BPH.They started the IPC (Integrated Pest Control) Pioneering Project on Rice in 1980,although efforts to introduce IPC on rice had started since 1975, when the Direc-torate of Food Crops Protection in Pasar Minggu, Jakarta adopted IPC conceptin their policy and was responsible for its implementation (Oka, 1990; Partoat-modjo, 1981). The IPC Pioneering Project was implemented in six rice producingprovinces, i.e. West Java, Central Java, East Java, Yogyakarta, South Sulawesi andNorth Sumatera. The result of this project was a confirmation on IPC practices, sincerice fields with IPC produced as much as those without IPC practices, but with lowerpesticide inputs. The policy and decision making impacts, however, were a little bitdelayed as the government was still obsessed with the self-sufficiency program, andpesticide packages in the intensification program were still considered beneficial tomaintain the sufficiency (Untung, 2006).
The rice self-sufficiency for Indonesia was eventually achieved in 1984. Onceagain BPH threat loomed in 1985/1986, caused by local BPH population explo-sion in Java. Research showed that insecticides use affected the BPH populationto become explosive as resurgences followed insecticides treatments (Untung andMahrub, 1988). With scientific evidence being available, President Suharto in 1986issued a presidential decree banning 57 insecticides formulations used in rice farm-ing. This is an important step of IPC (by then was known as IPM, Integrated PestManagement) on rice, as the decree also stated the importance of IPM approachin rice pest control. The decree was also followed up by the gradual cut back ofpesticide subsidy, and by 1989 pesticides were no longer supported by governmentsubsidy. The establishment of IPM policy was completely ensured, when in 1992,the Indonesian House of Representatives amended the Crops Husbandry SystemBill, which explicitly states that IPM is the only system recognized as legal plantprotection measure in Indonesia.
10.2 Disseminating Farming Technology to Farmers
The development of IPM program on rice in Indonesia happened in about the sametime with the advance of similar programs in other rice producing countries. TheInter-country Program for the Development and Application of Integrated Pest Con-trol in Rice in South and South East Asia was established in 1977 after repeatedadvices by FAO/UNEP Panel of Experts on Integrated Control and Host Plant.The program was finalized with a plan of operation between seven governments(Bangladesh, India, Indonesia, Malaysia, Philippines, Sri Lanka and Thailand), wasdrafted in a technical consultation meeting held in Bangkok in 1978 (Waterhouse,1983). The funds for this program came from several donor countries, namelyAustralia, the Netherlands, United States and Arab Gulf countries. The objectiveof this program was to encourage applied research mainly for farmers’ rice fields,foster traditional extension approaches, and strengthen national IPM policies andcapacity building.

362 E. Martono
The first step in applying IPM practice at farmers’ level is to instill a new pestcontrol paradigm, which would mostly oppose current practice of heavily relying onpesticides. As by the time it is proven that pesticides induced the BPH outbreaks, in-secticides usage should be limited under the guidance of economic injury threshold(Kenmore, 1987). Local and national findings further confirmed the benefit of IPMprogram. These and other research findings developed at IRRI provided NationalIPM programs to formulate and implement strategies for BPH control. Nationalleaders and policy makers were duly impressed by these evidences, but implement-ing policies into action by farmers and growers needed different approach as itwould be they who would suffer if the IPM action and practices failed to bringabout sufficient rice production free from BPH and any other pests’ attack. In short,IPM program had to assure economic gains and prevent any pest-induced losses.
The challenge was a formidable task. In most extension sessions for rice in-tensification programs, farmers were advised to practice crop protection technolo-gies which permit the use of toxic chemicals (with euphemistic term “crop/pestmedicines”). Treatments were done according to calendars and schedules, regard-less of the pests’ existence and it was believed that pesticides were indispensable.The use of agrochemicals was thought as an obligatory input in their farming. WithIPM strategies, the relatively new, acquired belief had to be drastically changed.Pesticides could worsen their farming, and change of attitude was needed to practiceIPM. The thinking was not only dominant among farmers, even extension workersand agronomists were deeply convinced by the important role of pesticides usage.
With these background conditions, conventional extension technique such asT&V (Training and Visit) would not be effective. This technique commonly used tospread the Green Revolution technology and to relay the messages of intensificationdown to farmers’ level, would not be able to instill the paradigm of change necessaryfor the farmers and farming practitioners. Integrated Pest Management is not just anew technology; it is a new way of looking into farming and farming system. AT&V session, however, would provide farmers with materials coming from exten-sion workers and “contact farmers”, a “second-hand” (even “third-hand”) materialwith little experiencing involved, because the farmers were not the direct subject ofthe training.
The designation and underlying concept of T&V extension is actually acceptableand might work well in a hierarchical, top down structure of the Ministries of Agri-culture in most South and South East Asian countries along with their extension ser-vices. Under this system, schedules, duties and responsibilities are clearly defined,and their practices are closely supervised at all levels. A “transfer of technology”implementing concept, T&V extension emphasizes regular training for extensionfield workers and contact farmers, with better linkage between research and exten-sion. The responsibility of providing administrative control and technical materialto the extension workers is in the hand of a directorate in the Ministry of Agriculture(Oudejans, 1999). The training for extension workers is given once a week, whileon the other days during the week the workers are supposed to extend the messagesfrom the training to the contact farmers. The contact farmers is a member of a farmergroup, which in Indonesia consists of about 70–150 farm families. The member of

10 Evolutionary Revolution: Implementing and Disseminating IPM in Indonesia 363
this group is farmers operating in certain tract of rice fields. One contact farmerfrom the group receives recommendation for the forthcoming one or two weeks ofthe planting season from extension worker and then spreads the messages to theother group members.
Van de Fliert (1993) observed that the system often did not work out as expected.The visits did not happen as scheduled, or simply did not happen. When it happened,the information conveyed by the extension workers did not relate to the conditionof the planting schedules. The low social status and salary of the extension workersdid little to their motivation and most of them spent some of their time lookingfor additional income opportunities. However, the more fundamental failure of theT&V system is in developing the farmers’ capacity to deeply involved in the farmingsystem, mainly in term of accessing external information anytime they need it, doingexperimental works to be concluded and applied on their plantings, and enhanc-ing their ability, both individual and collective, to take right and feasible decisions(Roling & van der Fliert, 1994).
One of the Training and Visit methods of extension’s legacy is in the availabil-ity of farmers groups formed for its purposes, which could be useful for the IPMextension as well. The T&V extension also gave rise to broadcast material andnetworks. The so-called “Siaran Pedesaan” (Rural Programs) on radio, and later onTV, became popular with most farmers that many formed their groups based on theircollective schedule of listening or watching the programs. By considering these andsimilar farmer groups, extension for IPM would then be designated. The extensionmodel was what is called Farmer Field School or FFS. This development was partlythe result of the IPC Pioneering Projects in six provinces in the early 1980s. In lateryears it spread to other countries and was approved by FAO and many NGOs as themore preferable extension model for IPM dissemination and implementation.
10.3 IPM Extension: Disseminating Concept and Practices
The traumatic experience of BPH outbreak which recurred in 1985, approximatelya decade after the first one, convinced policy makers that a working concept of IPMshould be developed, introduced and implemented. The concept must be based onreal condition but must have strong scientific justifications. The basic principles ofIPM to be disseminated in Indonesia were formulated by experts from the Ministryof Agriculture, working together with academicians from various universities. Theseprinciples compiled by Oka (1994) and Untung (2006) are:
10.3.1 Understand the Agroecosystem
Agricultural production process, ecologically speaking, is a set of activities in man-aging agricultural- or agro-ecosystem. The process’ goal is to achieve optimal yieldand production, both quantitatively and qualitatively, so they fulfill the need of the

364 E. Martono
farmers or the ecosystem “managers”. Therefore an implementing IPM programshould be placed as an integral part of a comprehensive agroecosystem. The ecosys-tem managers, i.e. farmers or growers, have to understand the character and dynam-ics of the ecosystem they manage in order to be able to control pest and diseasesproblems by practicing IPM.
Although the general rules of agroecosystem dynamics are widely known, someare locally specific, and have to be honored as such. Agroecosystem is an artificialecosystem, as it is defined by humans to fulfill humans needs. Its biological andgenetic diversity are usually low and tend to become uniform, which make it un-stable and vulnerable to insect pest or disease population domination. It developsover time and varies between spaces, with a unique yet dynamics changes. Changesmay alter an agroecosystem drastically, since its sensitivity to any kinds of changeis commonly high. By understanding agro-ecosystem structures such as plants andcrops, pests, natural enemies and other biotic factors compositions, the dynamicsinteraction among them, and the influence of abiotic factors, the right and properstrategy will prevent pests to inflict economic damages.
10.3.2 Benefit and Cost of Crop Protection
Farming or planting system, economically speaking, is an enterprise to gain profit.This profit is the difference between income generated by agricultural product saleand the cost to produce. To adequately protect the crops, farmers have to spendtheir money to purchase materials such as pesticides, resistant variety seeds, takeon rent chemical treatment euipments and to hire farm-workers. The gain of thesespending is the prevention of economic damage, which can be quantified. Thence,the difference between this economic loss prevented and the cost of protecting thecrops is the (economic) benefit of the crop protection measure.
In the long term this benefit will increase the profit, since a rightly practiced IPMensure the sustainability of the agroecosystem. The benefit would also extend toother ecosystems and increase farmers’ welfare since they would tend their farmsin an eco-friendly condition. The price of their produce as well as the environmentwhere they live, would be better under more organized and carefully executed plantprotection schemes.
10.3.3 Plant Tolerance to Damage
All plants have tolerance level to pest damage, and at this level damage actuallydoes not cause economic loss. Low pest population, slow development of plantdiseases or tough and resistant crops may result in affordable losses, which can becompensated by recuperating crops and unaffected produces. Therefore, pest man-agement is not aimed to decimate pest population, but to lower the pest population

10 Evolutionary Revolution: Implementing and Disseminating IPM in Indonesia 365
up to a tolerable level. Plant protection measure, specifically pesticides treatment,is done only when the pest population has risen over that tolerable level referred aseconomic threshold level.
10.3.4 Letting Small Numbers of Individual Pest to Surviveon the Field
IPM concept recognizes the role of population balance between pests and their natu-ral enemies. Without any pests, natural enemies might not survive and will decrease,probably into extinction. It is fortunate if they are able to move out of the areaand find some kinds of refuge where their survival may be ensured. The field thatthey leave, however, is in danger of being devoid of any natural enemies, and pestpopulation outbreaks may happen. Managing pest population in such a way that asmall number of individual pests still exist proves very important to sustain naturalenemies’ role.
10.3.5 Sustain and Maintain Natural Enemies
Natural enemies must be managed to ensure their ecological functions in an agroe-cosystem. The important role of natural enemies to control pests is already commonknowledge. People have already used parasitoids, predators and pathogens to con-trol pests. If local species is insufficient, exploration and introduction are sought,either to provide the non-existent or to enhance the low potential natural enemies.In essence, sustaining and maintaining natural enemies meant for tending and caringmore for the agroecosystem, would only be possible with adequate knowledge aboutits characters and behavior. It is now understood that maintaining an ecological bal-ance using available components is more preferable than importing alien species, beit useful or otherwise.
10.3.6 Healthy Plant Culture
Plant health is now recognized more as an important factor in ensuring potentialyield and production. With healthy plant culture, pests and pathogens are kept awayfrom invading the farm or plantation. The efforts to keep the pests away from theplants are not necessarily coming from pests control practices, but there are cul-tural practices which are effective in preventing the pests and protecting the crops.Some of the practices were actually followed by growers, and were handed downas traditional practices that once too often were thought as ineffective or having nobeneficial effect. A lot of those traditional practices came from long experiences ofmany diligent and industrious farmers. There were proofs that traditional practiceof choosing the right planting time by observing natural phenomena (the rising and

366 E. Martono
setting of certain star constellations, the emergence of some insects or wild animalsaround the fields) often helps farmers in avoiding one or two kinds of key pests.
On the other hand, lack of knowledge, limited education and difficult access tofunding sources seem to hinder the proper care of farmers’ fields and plantations,make them prone to pest and diseases threats. Dissemination of IPM knowledgehelps farmers to understand more of their farming, and how to take care of theircrops from land preparation up to marketing. IPM is introduced as an overall prac-tice, in which every step is ensured to prevent economic loss by emphasizing theimportance of plant health. Planting practices that enhance plant resistance to insectpests and diseases are implemented.
10.3.7 Field Monitoring
The dynamics character of agroecosystem needs close observations from time totime. A lot of its components interact in interrelated patterns, resulting in a cause-effect condition which may or may not support living organism population lifetherein. Both crops and herbivores benefit from this condition, therefore, regularmonitoring of the field has to be done to provide information needed for decisionmaking in handling the farm. To predict accurately when an outbreak will happenis not easy, since the pest population dynamics is very specific for different timesand places. Monitoring should be done by farmers, which is an important tool indecision support system for pest management. The ability of farmers to composethe right schedule of monitoring activities for each planting season is as impor-tant as possessing a comprehensive working knowledge on the pest population andmanagement.
10.3.8 Farmers Empowerment
For Indonesia, farmers are the biggest producers of agricultural goods. The smallfarmland ownership, non-existent capital, and low educational level contribute tothe substandard performance. The need of farmers’ empowerment becomes moreimportant with the introduction of IPM. For the farmers to effectively understandand implement IPM principles and technology, empowerment is a prerequisite: theyneed that basic knowledge given to them in their own language. This is whereFarmer Field School plays its crucial role, and serves as an agent of farmers attitudereforms.
10.3.9 IPM Concept Socialization
It is not only farmers who need to know more about IPM. The bureaucracy, thelawmakers, the technical officers must also understand the basic idea behind IPM
10 Evolutionary Revolution: Implementing and Disseminating IPM in Indonesia 367
concept. Extension, education, training and publication both formal and informal areways to disseminate IPM to all members of the society. Changing farmers’ attitudesthat had been nurtured under conventional view of plant protection, e.g. emphasizingchemical control, into those under more holistic concept such as IPM need time,energy and commitment from all stakeholders of agriculture. The socialization willdetermine the success of an IPM program implemented on any crop planting system.
IPM basic elements and the IPM components, as defined by Watson et al. (1975),are the core knowledge and information of IPM which have to be recognized beforeplanning and composing an IPM working concept. When implemented, knowledgeon ecosystem and social-economic system must be fully understood so that the op-timal combination of technical and tactical pest control measures is achieved. Thesebasic elements and components are:
i. Basic elements:
a. Natural controlb. Sampling techniquec. Economic thresholdd. Biology and ecology
ii. IPM components:
a. Cultural controlb. Biological controlc. Resistant varietiesd. Physical controle. Mechanical controlf. Legislative control, mainly through quarantine measuresg. Chemical control
10.4 Farmer Field School as Extension and Training Process
IPM National Project in Indonesia had its milestone point in 1989 when FarmerField School training method was adopted for the implementation of IPM. Thedecision was taken following the 1986 presidential decree banning a number ofinsecticides, and it was a very timely one. With the withdrawal of those insecticides,not only people need to be assured that farming with fewer chemicals is possible,but also there must be information on how ecologically correct farming should bedone. The IPM Pioneering Project in early 1980s, provided the base for training andextension model, which was developed together by experts from FAO IPC and ma-jor Indonesian universities such as Gadjah Mada University in Yogyakarta, BogorAgriculture Institute in West Java, and Hasanuddin University in South Sulawesi.The training was first planned for rice farmers, but later was extended to cover alsosoybean, corn, potato, cabbage, chili and shallot farmers. In 1997, the same FFS

368 E. Martono
model was further adopted for estate crops smallholders i.e. coffee, tea, pepper,cacao, cotton and cashew (Untung, 2006).
Intensive training on rice for the first time was aimed at obtaining a sufficientnumber of trainers, the very first ones or the master trainers. This was carried out insome kind of community college level course in selected universities. Afterwards,these master trainers would train Field Scout 1 (FS1) and FS2 personnel in 12Field Training Facilities (FTFs) around Indonesia. The personnel trained were PestObservers who were Ministry of Agriculture employees, especially those stationedin rice producer provinces. They underwent a four planting seasons (15 months)rigorous learning on rice and dry-land crops, followed by one season (four months)in-campus training at a designated university. The trainees learned how to do the ba-sics of IPM by themselves. They observed, analyzed, made decisions and practisedthose directly in the fields. Activities such as field experiments and studies werealso part of the curriculum, under the guidance and support of master trainers andcollege lecturers (Martono, 1996).
FFS relies on these trained pest observers as the training guides who lead and or-ganize the school for one planting season. The school itself is actually an extensioncum training activity, with the goal of IPM implementation on one crop in the sametract of land, representing a definite agroecosystem. What these guides obtained inthe FTFs was applied on the FFSs, step by step. A typical schedule is presented inTable 10.1. The experience-based training helps participants to adopt knowledge andtechnology in rapid yet sustainable manners. The FFS for rice and food crops’ farm-ers were started in 1989 and ended after ten years in 1998. The number of farmersparticipated in FFS was estimated to be around 1,500,000 to 2,000,000, with morethan 10,000 officers served as their guides. In 2005, when the FFS on estate cropssmallholders was terminated, another 160,000 smallholder planters were trained inseveral provinces, under a similar system based on the model developed on food andhorticultural crops (Oka, 1994; Untung, 1993; 2006).
To make IPM concept easily understood by the farmers, the IPM basic principlesare developed into four IPM working principles, which are simpler, easy to under-stand and applicable in field condition. These four principles also represent a newparadigm approach, as described by Untung (2006).
10.4.1 Healthy Plant Culture Maintenance
Farmers need to be assured that the first important step toward successful plantingis maintaining plant health. The plants must be healthy and strong so that they arequalitative and quantitatively productive. This will lead to better value, and eventu-ally good price. Healthy and strong plants will also improve their resistance to pestand diseases. This principle is emphasized to FFS participants, and should motivatethem as long as the participants find out by themselves what healthy plants mean intheir farming. “Finding by themselves” become the main theme of FFS’s materialstransfer.

10 Evolutionary Revolution: Implementing and Disseminating IPM in Indonesia 369
Tab
le10
.1T
heC
ompo
siti
onan
dSt
ruct
ure
ofan
FFS
Cur
ricu
lum
No.
Act
ivit
ies
Goa
lT
ime
Invo
lved
Peop
le
1.Pr
epar
ing
mat
eria
lfor
gene
ralo
verv
iew
onth
eFF
Sac
tivit
ies
Are
ady-
mad
em
ater
ialo
nIP
Min
clud
ing
defin
ing
IPM
and
FFS,
map
ofth
elo
cati
on,F
FSac
tivit
ies
renu
mer
atio
n,le
arni
ngco
ntra
ct
One
hour
allo
cati
onSc
outi
ngfa
rmer
s
2.Pr
epar
ator
ym
eeti
ngw
ith
loca
ladm
inis
trat
ors
Sam
eas
abov
e,ad
ded
wit
hre
ques
tfor
supp
orts
Any
tim
ebe
fore
the
FFS
star
t,pr
efer
ably
abou
ttw
ow
eeks
Dis
tric
thea
d,C
onta
ct/s
cout
ing
farm
ers,
Pest
Obs
erve
ran
dE
xten
sion
Offi
cers
3.Pr
epar
ator
ym
eeti
ngw
ith
vill
age
adm
inis
trat
ors
Sam
eas
abov
e,w
ith
requ
estf
orsu
ppor
tsO
neho
ural
loca
ted,
supp
osed
ly2–
3w
eeks
befo
repl
anti
ngti
me
Con
tact
/sco
utin
gfa
rmer
s,V
illa
gehe
ad,V
illa
geof
ficer
s,Pe
stO
bser
ver
and
Ext
ensi
onO
ffice
rs,R
epre
sent
ativ
eof
farm
ers’
grou
p4.
Prep
arat
ory
mee
ting
infa
rmer
s’gr
oup
leve
lIn
form
atio
nan
dde
scri
ptio
non
FFS
activ
itie
sas
abov
epl
usre
quir
emen
tfo
rpa
rtic
ipan
ts,t
hepr
oces
sof
FFS
activ
itie
s,an
dsi
gned
lear
ning
cont
ract
.
3–4
hour
sFi
rstw
eek
befo
rese
edbe
dpr
epar
atio
n
Sam
eas
abov
e
5.W
eek
1of
FFS
1.T
rain
ing
desc
ribe
d
2.B
allo
tbox
:Pre
test
3.G
roup
dyna
mic
s(i
ntro
duci
ngpa
rtic
ipan
ts)
4.Sa
mpl
ing
and
land
esti
mat
es
5.B
reak
6.R
aisi
ngqu
esti
ons
7.A
groe
cosy
stem
obse
rved
Wee
kw
hen
the
farm
ers
star
tpl
anti
ng
Scou
ting
farm
eran
dFF
Spa
rtic
ipan
ts(2
5pe
ople
,70%
mal
esan
d30
%fe
mal
es)

370 E. Martono
Tab
le10
.1(c
onti
nued
)
No.
Act
ivit
ies
Goa
lT
ime
Invo
lved
Peop
le
6.W
eek
2–11
ofFF
S1.
Agr
oeco
syst
emob
serv
atio
n
2.D
raw
ing
and
disc
ussi
ngob
serv
edec
osys
tem
3.Pr
esen
ting
the
anal
ysis
and
deci
ding
the
acti
on
4.B
reak
5.G
roup
dyna
mic
s
6.Sp
ecia
lTop
ic
07.3
0–08
.30
a.m
.08
.30–
09.4
5a.
m.
09.4
5–10
.00
a.m
.10
.00–
10.1
5a.
m.
10.1
5–10
.30
a.m
.10
.30
a.m
.–12
.00
noon
Sam
eas
abov
e
7.W
eek
12of
FFS,
the
last
1.A
groe
cosy
stem
obse
rvat
ion
2.D
raw
ing
and
disc
ussi
ngob
serv
edec
osys
tem
3.Pr
esen
ting
the
anal
ysis
and
deci
ding
the
acti
on
4.B
reak
5.G
roup
dyna
mic
s
6.Y
ield
/har
vest
mea
suri
ng
7.C
losi
ngan
dpl
anfo
rth
ene
xtse
ason
Uns
ched
uled
Vil
lage
head
,Vil
lage
offic
ers,
Con
tact
/sco
utin
gfa
rmer
s,Pe
stO
bser
ver
and
Ext
ensi
onO
ffice
rs,F
FSpa
rtic
ipan
ts
Sour
ce:
IPM
Fiel
dG
uide
,200
1.

10 Evolutionary Revolution: Implementing and Disseminating IPM in Indonesia 371
10.4.2 Natural Enemies’ Manipulation and Conservation
Most farmers actually know that there are “bad” and “good” organisms in theirfields. This principle helps farmers to confirm and also to deliberately recognizethose organisms, to learn how they function in the ecosystem, and to propose howto get the best out of them. In some FFS, there are also special topics on “insect gar-den”, by which participants observe the life cycle and behavior of several organismsfound in the fields. The old concept of “learning by doing” is implemented true toits meaning.
10.4.3 Weekly Field Monitoring
Since population dynamics fluctuates over time, climatic change occurance andcultural practices applied according to crop’s growth and development, and ever-changing condition of the field should be well observed and documented with reg-ularly executed monitoring. A weekly monitoring is about enough to record whathappens in the field. The information is then analyzed and the decision making isbased on the result of the analysis. Actions which follow after the decision shouldbe evaluated, and the following weekly field monitoring should be able to yield theevaluation needed.
10.5 Farmers as IPM Experts in Their Fields
Farmer is the manager, the person in charge, the person responsible, and the soledecision maker for the field. Officers such as Pest Observers, Extension Workersare resources giving information, should the need arise. IPM put farmers in theirright place, as in this concept the farmers must know anything that happen in thefield, and be accountable to themselves. FFS tries to train farmers to be “IPM Ex-perts” at least on their own fields. Farmers’ confidence and their independence areexpected to encourage farmers to apply IPM principles and technology for theirown benefits. As experts, farmers should be able to monitor the ecosystem, toanalyze the information obtained, to make decision and to apply the right controltechnology.
Farmer Field School is distinctly different from classical extension pattern men-tioned in the previous part of this article. The FFS training is much more partici-patory, with a bottom up approach implementing an androgogy method of learning.Farmers are encouraged to learn from their experiences on IPM principles and tech-nology by observing what happens in their fields.
Technically, the implementations of IPM concept into basic practical guidelinesare composed together by FFS participants and their scout. They consist of follow-ing points:

372 E. Martono
10.5.1 Land/Field as Main Learning Site
All learning and discussion are conducted in the field/plantation patch/farming site,not indoors. The land sites provide references, learning materials and a place wheregroup members interact.
10.5.2 Learning from Experiences
All activities of FFS, starting on the first meeting day up to the last, are done bymonitoring, calculating, measuring, and directly observing the events which takeplace in the field. Expressing group members’ experiences, analyzing the observa-tion results, and formulating the decisions to achieve the right measures become partof the training, since participative method makes farmers to find out by themselvesfield’s concept and technology, both individually and in groups.
10.5.3 Agroecosystem Study
The training process motivates farmers to actively analyze agroecosystem in orderto sharpen their ability in managing pest and other planting problems based on eco-logical dynamics. Every week farmers analyze information and data gathered fromthe field so that they can make appropriate decisions. The weekly frequency willprepare farmers to get used to monitoring and ecosystem analysis on their own fieldbefore applying control measures.
10.5.4 Practical and Functional Materials and Methods
FFS participants, with the help of their scouts, are urged to use local resources andmaterials, such as manure, compost, botanicals, and other eco-friendly complementsin their fields.
10.5.5 Skill-Based Curriculum
The FFS curriculum develops flexibly, in accord with local agroecosystem problemsdevelopment but without ignoring IPMs four basic principles. Parts of the curricu-lum are prepared by field scouts who have been participants in training of trainersprogram. Every meeting starts with ecosystem monitoring, followed by informationanalysis, decision making, group dynamics and special study. The curriculum is alsotailored to farmers’ need i.e. improve their special skills, such as biological controlagents rearing, botanicals mixing etc.

10 Evolutionary Revolution: Implementing and Disseminating IPM in Indonesia 373
10.5.6 Train Farmers to be Trainers
FFS does not only train farmers but also equips them with knowledge and skillson scouting and carrying out an FFS. FFS lets farmers to find out by themselvesanything about ecosystem as they observe pests and natural enemies, recognizeecosystem dynamics, make decisions and take actions in the fields based on IPMprinciples. Group dynamics helps them to improve their activity, creativity andensures their confidence in expressing themselves, individually or in groups. Bythe time they finish the training, participants are able to lead their peers in similartraining.
10.5.7 Bottom Up Planning
To ensure that the training and its curriculum coincide with local needs, a TNA(Training Need Assessment) is done before carrying out the FFS. The TNA forinstance will decide which field site is used as trial site, what topics will be the maintheme of the training etc. The farmers scout and trainer should be responsible forthe TNA.
10.5.8 Select Participants
The optimum number of participants in FFS training is 25, therefore, there must becertain criteria for a farmer to be a participant, since often the number of farmers ina certain land tract wanting to join the FFS exceed the optimum. If there are morethan 25 participants in a training group, the schooling is just ineffective. Also, theseparticipants must have very high commitment to the activities, otherwise they won’tbe able to completely understand and practice IPM on their field. The commitmentis also important since food and vegetable crops planters have to attend at least 11weekly meetings, while estate smallholders must attend at least 15 such meetings.A participant should also be, no more than 45 years old, literate and a farm owner,not just a farm worker. A kind of “learning contract” has to be signed by farmersat the beginning of the training to make sure that they stay through the program tothe end.
10.5.9 Participant Evaluation Test
The effectiveness of knowledge and skill transfer of the participants are checkedthrough “before” and “after” tests device called the ballot box. The first test is tomeasure the participants’ knowledge and perception on IPM before they undergotraining, while the second is to evaluate the FFS through the skill, knowledge andattitude changes, acquired and shown by the trainees.

374 E. Martono
10.5.10 FFS Structure
Every FFS participants’ group of 25 farmers is divided into 4–5 subgroups, of whicheach group is facilitated by two field scouts who have previously been trained undersimilar program. There are Field Scouts 1 (FS1) who train FS2, and these FS2s arethe ones who train farmers in an FFS. These farmers, who are called Scouting Farm-ers, are also known as FS3, and responsible for the training of their fellow farmers.The routine schedule of an FFS during any meeting day from 7 a.m. to 1 p.m. isagro-ecosystem monitoring by observation, drawing and analysis of the ecosystem,group presentation and discussion, conclusion and decision making, group dynam-ics and special topics considered urgent and specific for the area (Table 1 presents adetailed list).
10.5.11 FFS Follow-Ups
The ultimate goals of an FFS program, i.e. change farmers’ behavior and establishfarmers’ self-reliability in managing their lands, will not be easily gained only aftera season or two. FFS alumnae should continue the activities they have learned fromthe school, and use all the experience and knowledge from the group-based workto solve their planting problems. Follow up activities will mostly rely on the con-science and self-activity of former FFS trainees, and each season they have to adaptthemselves to different problems and challenges. FFS-trained farmers often discussproblems on group’s plan scheduling, post-harvest work, product marketing, marketinstitutionalization, organic and sustainable farming practices etc. Field Scouts andother government officers play their role as facilitators, partners and motivators forfarmers’ groups with FFS experiences.
10.6 Experiences as the Best Learning Motivation
What was the real achievement of this almost three decades of IPM implementation?There were claims on the success of the program, but the definition of success variedaccording to those who made the claims. During the program implementation undergovernment-backed funding (with loan from foreign donors), survey and researchwere also undertaken to evaluate the technological, policy and socio-economic im-pacts of the practices. Most of these surveys showed the superiority of IPM programto the conventional approach. They recorded that more environmental-friendly prac-tices were not only possible, but in some cases also profitable. These “first phase”results, however, still viewed IPM as technological transfer and change program,and only a limited number of researches were aimed at describing the social andcultural acceptance by the farmers. Within the “second phase”, socio-economicbaseline studies were emphasized, although technological and farming practices ob-servations were also carried out. The latter studies were aimed more to confirm IPM

10 Evolutionary Revolution: Implementing and Disseminating IPM in Indonesia 375
practices rather than to justify IPM concept. The success of IPM was later measuredin the terms of the farmers’ benefits and not only from technical indicators whichstated that IPM program was running well.
The major result of the first phase of implementation (1983–1993), aside fromcontrolled population of brown planthopper, was the establishment of IPM FarmersField School, FFS, which proved crucial to the dissemination of the program. Fromthe point of introducing and establishing a national IPM program, especially on rice,this is an undeniable success. Furthermore, the program success including the riceself-sufficiency were achieved in 1984, albeit for a very brief period, and the boldand unconventional government policy of banning 57 pesticides from being used onrice in 1986 through a presidential decree. In the second phase (1993–1998), IPMnational program was implemented not only on more commodities (corn, soybean,cabbage and potato), but also with better methods as FFS was built after recognizingconstraints, threats and failures of the preceding phase. The political gain of thisphase is the ratification of Bill no. 12/1994 on Crop Husbandry System, in whichIPM is recognized as “the only plant protection system to be practiced”; followedby governmental regulation no. 6/1995 on crop protection as a technical guidanceof IPM implementation. But the most important gain was that, since farmers knowl-edge was significantly improved, they became more empowered. Not only was theirtechnical knowledge and ability upgraded, they also began to recognize their rights,and to express their opinions. IPM-FFS alumni organized themselves, and estab-lished a network system among them to exchange thoughts, ideas and information.With Indonesian farmers, these were beneficial steps toward accommodating themin a more democratic setting.
The typical examples of those phases’ evaluation research are discussed here.The impact studies reported decrease of insecticide use (frequency/planting sea-son) and increase in rice yield (tons/hectare) (Anonymous, 1988, Fig. 10.1), whileFig. 10.2 depicts how in 8 years the use of pesticides increased, only to be cut downby IPM-based policy in 1986 (Anonymous, 1990). In the beginning, convincingfarmers to be critical to conventional control measures, which mostly consisted ofthe use of pesticides, was the main concern. Soejitno (1990) confirmed the overuse
Fig. 10.1 Frequency ofpesticides used before andafter IPM in Indonesia
0
1
2
3
4
5
6
7
8 Insecticide useno./Season
Rice Yield tons/ha
1986/Before IPM 1987/After IPM

376 E. Martono
Pesticides Productions in Indonesia
0
10
20
30
40
50
60
70
19721974
19761978
19801982
19841986
19881990
Pes
ticid
es P
rodu
ctio
ns (
× 1
000
tons
)
Fig. 10.2 Pesticides production in Indonesia, 1972–1991
of pesticides in Indonesia since many pesticides were recommended under rice in-tensification programs carried out since 1960s. But until early 1990s, studies onpesticides were emphasized in testing different types of pesticides, for finding theoptimal dose, timing and methods of applications (Panudju et al., 1974; Sama et al.,1977; Mochida, 1985). No resistance study, for instance, was ever done until 1993although field reports and IPM preliminary survey found out that insecticides’ resis-tance was prevalent (Soejitno et al., 1994). About that time a comprehensive studyon carbofuran insecticides showed that faunal diversity was lower and pest attackwas higher in carbofuran-intensive areas along Java north shore due to lower ratioof natural enemies/pests (Martono et al., 1994). Other technological componentsstudies such as measuring the effect of Fluid Supplemental Fertilizers on soybean(Adisarwanto, 1996), crop rotation patterns on different fields (Hendarsih, 1996), orpotato seed selection for more vigorous crops (Suryadi, 1996), uniformly pointedout their positive contribution to IPM program on vegetables. But farmer-orientedresearch was still rare, and the few researches that were done used to employobserver-object attitude, and were conducted as partial studies, which often exposedfarmers’ weaknesses without trying to fully understand their overall background(Cholil et al., 1996; Maman, 1996). These weaknesses were frequently blamed asto be counter-productive to IPM program, yet the solution by which problems couldbe holistically, comprehensively and realistically solved almost never emerged.
More interesting observation arose when social and cultural aspects were exam-ined thoroughly by specially trained scientists such as sociologists and anthropolo-gists. Most of the studies took place by the end of the loan-backed IPM programson food crops and vegetables (1998); followed by those on estate crops (2003). Al-though the success of those programs was imminent, few farmers were convinced

10 Evolutionary Revolution: Implementing and Disseminating IPM in Indonesia 377
to continue practice of the programs, while local and regional governments werealso reluctant to put the programs in their annual budget. The latter became im-portant as government administration in Indonesia started to move toward moreautonomous system, in which the national government budget no longer providedfor many technical programs. Meanwhile, several farmers who became empoweredfound a break from the repressive, highly centralized and paternalistic governmentof Suharto after his fall. The so-called “reformation” period provided them withopportunity to coordinate themselves, and to build networks to share informationand new technologies among them. Many farmers who graduated from the FFSwere so well motivated that they learned a lot, and started to develop their kindof farming techniques based on IPM. The techniques they developed are close toLEISA (Low External Input Sustainable Agriculture) and organic farming tech-niques, which greatly enhance farmers’ self-reliance, since they select crops’ seed,make organic fertilizers, and prepare botanical pesticides all by themselves. Thisprogress was the least expected by the government, as it cut farmers’ dependencyon bureaucracy, something that have not been anticipated properly by many nationaland regional administrators.
The farmers’ achievement reflects the changing atmosphere in farming commu-nity after the introduction of IPM. As Winarto (2002) stated, IPM sowed the seeds ofempowerment which grew into self-governance and freedom. This is an importantaspect of agricultural development in most developing countries, including Indone-sia. The development through the so-called Green Revolution movement imposedinternal intervention by the authorities in individual farmers’ decision situation.The government intervention has also heavily affected the environment, agricul-tural practices and methods, and the structure of farmers’ organizations (Winarto,1996; Winarto et al., 1999). This was the condition under which Indonesian farm-ers worked and made their living since technology-based agriculture developmentstarted in early 1960s, mainly in the form of rice intensification programs. Afterabout thirty years, IPM, more specifically IPM-FFS, provided farmers with alter-native condition: that they may act from, for and by themselves. The shift from“doing what have been told” to “doing what they consider right according to fielddata” was not merely a change of technique. It represented bigger change: the wayfarmers think, the way they observe their farms, the way they make decision. Thechange was much more basic, it was a change of paradigm (Untung, 2001; Winarto,2002).
The empowerment can be graphically illustrated with farmers’ new understand-ing on the role of fauna in their fields. IPM farmers became more familiar with nat-ural enemies, and recognize their important role in agroecosystem, after they werebriefed by IPM facilitators (Martono et al., 1998; Mahrub et al., 1998; Wagimanet al., 1998; Winarto, 1995; Winarto, 1998). With this knowledge, farmers started totend their fields differently (= according to IPM principles). The existence of naturalenemies was used then to justify pest control measures applied during the plantingseason. This fact shows that farmers’ improved knowledge also improved the farm-ing system, but further it also indicates that farmers were willing to change, and thatgiven the opportunity, they were able to make their own decision to do whatever they

378 E. Martono
thought beneficial for their farming. These thoughts were then consolidated throughmeetings, talks, negotiations and agreements. This led to new perspective in viewingtheir farmings. Farmers also became more outspoken, and they began to understandwhat they could and could not (or need not) do. The new experiences gained bythe farmers were effectively utilized not only as additional or new knowledges, butmore importantly as motivational drives toward better agricultural practices.
The empowered farmers also realized that the right information would helpthem to maintain the sustainability of their land; therefore they started to use dif-ferent media for that purpose. Alumni of IPM-FFS presently publish bulletin andnewsletters, have their own websites, use cell phones to exchange information, evenwith some professional help launched short films. There are currently two filmson preparing rice farming “the farmers’ way”. One, entitled “Bisa Dewek” (2006,Javanese for “We can do it by ourselves”) tells how farmers breed rice seeds bythemselves, and how they are able to select seeds which suit their lands and are lessdemanding in chemical inputs. This film (which is also available in English) illus-trates the somewhat “deviant” attitudes of farmers, a change which was completelyunimaginable before IPM. The other film (which was called SRI, System of RiceIntensification, 2007), relays a similar message. It shows how farmers are able tomanage their own rice farming, apply their own brand of technology, and producebetter yields than the average “guided” farming. These films confirm the meaningfulchange in thinking and attitude of farmers after they were introduced to IPM-basedfarmings.
Other surprising finding is the one stated by Untung (2004). He has pointed outthat despite all the efforts to limit pesticides, even up to the issuance of the 1986presidential decree banning several pesticides, in larger scale the IPM policy has notbeen able to put pesticides business under control. As shown by his compiled figures(Fig. 10.3), pesticides use which had dipped after the 1986 decree, started to climbup and matched the previous amount used before the ban. Untung (2004) suggestedthat this condition indicates an imbalance between increasing pesticides distributionand use, and the existing rules and regulations. A regular and thorough evaluation
0
10000
20000
30000
40000
50000
60000
70000
80000
90000
1989 1991 1993 1995 1997 1999 2001
Years
For
mul
atio
ns a
mou
nt (
ton
per
1000
L)
Pesticides
Herbicides
Insecticides
Fungicides
Fig. 10.3 Formulated pesticides produced in Indonesia, 1989–2002

10 Evolutionary Revolution: Implementing and Disseminating IPM in Indonesia 379
should be done comprehensively, not only for the pesticides component, but forIPM as a program and policy, since technically IPM will always depend on ever-changing inputs, which in most part constitute the “after-effect” of implementingIPM principles to the ecosystem.
10.7 Afterthought
The development of IPM programs in Indonesia reflects evolutionary changes ofconventional agricultural practices based on Green Revolution which were oncerelayed by the government through intensifications programs. The changes wereof such magnitude that it opened up farmers perspectives and provided them withnew attitudes to cope with the problems in their farmings. Many of these changeshappened under accomodative conditions, some were deliberately prepared, whileothers were not. The ability to observe the process of changes, and the conditionunderlying the changes, proved to be very important in implementing IPM in anyfarming community.
References
Anonymous. 1988. IPM Results of the IPM National Programs. Report to 1988 IGGI Meeting,The Hague.
Anonymous. 1990. Annual Report of the Ministry of Finance. Jakarta, 110 p.Adisarwanto, T. 1996. Evaluation of Liquid Supplemental Fertilizer Used on Soybean as IPM
Component. Paper presented at Technology and Preparatory IPM Impelementation Meeting,IPM National Program & Vegetable Research Institute, Lembang, May 1996.
Cholil, A., Abadi A. L., Mudjijono G., Trirahardjo B. and Himawan, T. 1996. The Role of FemaleLabor in IPM FFS in East Java Plateau. Paper presented at Technology and Preparatory IPMImpelementation Meeting, IPM National Program & Vegetable Research Institute, Lembang,May 1996.
De Datta, S.K. 1981. Principles and Practices of Rice Production. New York, John Wiley & Sons,618 pp.
Hendarsih, S. 1996. The Role of Varieties and Planting Pattern as IPM Component. Paper pre-sented at Technology and Preparatory IPM Impelementation Meeting, IPM National Program& Vegetable Research Institute, Lembang, May 1996.
Kenmore, P.E. 1987. Crop loss assessment in a practical integrated pest control program for tropicalAsian rice. In: Teng, P.S. (ed), Crop Loss Assessment and Pest Management. St. Paul, APCPress, pp. 225–241.
Kenmore, P.E., Heong, K.L. and Putter, C.A. 1985. Political, Social and Perceptual Aspects ofIntegrated Pest Management. In: Lee, B.S., Loke, W.H. and Heong, K.L. (Eds). Integrated Pestmanagement in Malaysia. Kuala Lumpur, Malaysia Plant Protection Society, pp. 47–67.
Mahrub, E., Triman, B. and Witjaksono R. 1998. Effectiveness and Efficiency of IPM FFSCurriculum Implementation on Rice. Paper presented at Technological Meeting of IPM Re-search Result, Cisarua, Aprl 1998, 6 pp.
Maman, K.H. 1996. The Relationship of IPM FFS Participants’ Character and Knowledge andAdoption Discrepancies in Several Selected Villages of Indramayu Regency, West Java. Paperpresented at Technology and Preparatory IPM Impelementation Meeting, IPM National Pro-gram & Vegetable Research Institute, Lembang, May 1996.
380 E. Martono
Martono, E. 1996. Elementary Representative Pests Observation Practices. Paper presented atPests Observation Workshop, Directorate General of Food and Horticultural Crops, Bandung,12 pp. [In Indonesian: Dasar-dasar Pengamatan OPT yang Representatif. Makalah pada Work-shop Pengamatan OPT Ditjen Tanaman Pangan dan Hortikultura, Bandung, 12 hal].
Martono, E., Mahrub, E., Priyatmojo, A. and Wijonarko, A. 1994. Use of Carbofuran in IPMand Non-IPM Practicing Rice Fields in West Java Northern Coast Regencies (Biological As-pects). In: Sosromarsono S., Untung K., Sastrosiswojo S., Darmawan E.D., Soejitno J., RaufA. and Mudjiono G. (eds), Proceedings Seminar on IPM Supporting Research, Lembang. Na-tional IPM Research & Development Committee & Lembang Horticultural Research Institute,pp. 313–322.
Martono, E., Rasdiman, Harsoyo, Rahayu, B., Koestoni, T. and Prabaningrum, L. 1998. Identifyingthe Weakness of FFS IPM on Cabbage and Shallot. Paper presented at Technological Meetingof IPM Research Result, Cisarua, Aprl 1998. 12 pp.
Mochida, O. 1985. Evaluation of Insecticides to Rice Insect Pests. Sukamandi, Res. Inst. FoodCrops. 31 pp.
Oka, I.N. 1990. Visits to FFS IPM on Rice: Impression and Analysis. Jakarta, National Programfor Development and Training of IPM in Rice-based-Cropping Systems, 11 pp.
Oka, I.N. 1994. Integrated Pest Control and Its Implementation in Indonesia [In Indonesian:Pengendalian Hama Terpadu dan Implementasinya di Indonesia.] Yogyakarta, Gadjah MadaUniversity Press, 325 pp.
Oudejans, J.H.M. 1999. Studies on IPM Policy in South East Asia: Two Centuries of Plant Protec-tion in Indonesia, Malaysia dan Thailand. Wageningen Agricultural University, Wageningen,316 pp.
Panudju, P., Leeuwangh, J., Sama, S. and Halteren, P. 1974. Insecticide selection for stemborersand other rice insects control in Indonesia. Agric. Cooper. Indon-Neth. Res. Report. 1968–1974:63–72.
Partoatmodjo, S. 1981. Problems of Implementation of Insect Pest Management for Rural Commu-nities in Indonesia. Japan Tropical Agriculture Research Center for Agriculture, Forestry andFisheries, Yatebe, Tsukuba, Ibaraki, pp. 115–121.
Roling, N. and van der Fliert, E. 1994. Transforming extension for sustainable agriculture: Thecase of integrated pest management in rice in Indonesia. Agric. and Human Values, XI (2/3):Spring/Summer 1994.
Sama S., Manwan, I. and Baco, D. 1977. Insecticide use efficiency in rice pest control [In Indone-sian: Efisiensi Penggunaan Insektisida dalam Pengendalian Hama Padi]. Proceedings Sympo-sium I on Rice and Dryland Crops Research, III:603–616.
Soejitno, J. 1990. Pesticides Use to Control Rice Stemborers [In Indonesian: Perkembangan Peng-gunaan Insektisida untuk Penanggulangan Penggerek Padi]. Paper presented in Seminar of IPMon Rice as Self-Supporting Food Crops. Bogor Agric. Univ. April 1990. 19 pp.
Soejitno, J., Samudra, I.M. and Kilin, D. 1994. The evaluation of resistance of white rice Stemborer(Scirpophaga innotata) to Carbofuran in Northern Coastal Area of Java. In: Sosromarsono S.,Untung K., Sastrosiswojo S., Darmawan E. D., Soejitno J., Rauf A. & Mudjiono G. (eds),Proceedings Seminar on IPM Supporting Research, Lembang. National IPM Research & De-velopment Committee & Lembang Horticultural Research Institute, pp. 323–326.
Suryadi. 1996. Rapid Field Multiplication Technique for Potato Seed Variety Resistant to LeafBlight [In Indonesian: Teknik Perbanyakan Cepat Bibit Kentang Varietas Tahan PenyakitBusuk Daun di Lapangan]. Paper presented at Technology and Preparatory IPM Impele-mentation Meeting, IPM National Program & Vegetable Research Institute, Lembang,May 1996.
Untung, K. 1993. Introduction to Integrated Pest Management [In Indonesian: Pengantar Pengen-dalian Hama Terpadu]. Yogyakarta, Gadjah Mada University Press, 234 pp.
Untung, K. 2001. Sustainable Agriculture, The Best Alternative for Indonesian Agricultural Devel-opment [In Indonesian: Pertanian Berkelanjutan, Alternatif Terbaik Pembangunan Pertanian diIndonesia]. Paper for Training of Basic Agriculture Aventis Academy, Yogyakarta—Cianjur—Malang, 2000–2001, 12 pp.

10 Evolutionary Revolution: Implementing and Disseminating IPM in Indonesia 381
Untung, K. 2004. Impact of integrated pest management to the registration and use of pesticides inIndonesia. Indonesia Journal of Plant Protection 10(1):1–7.
Untung, K. 2006. Introduction to Integrated Pest Management [In Indonesian: Pengantar Pengen-dalian Hama Terpadu]. 2nd ed., Yogyakarta, Gadjah Mada University Press, 248 pp.
Untung, K. and Mahrub, E. 1988. Rice Pests Threshold Levels Based on Natural Enemies Popula-tion. [In Indonesian: Ambang Pengendalian Hama Padi Berdasarkan Populasi Musuh Alami].Paper presented on Pertemuan Perbaikan Rekomendasi PHT. Cisarua. 27–30 Oktober 1988, 6 p.
van de Fliert, E. 1993. Integrated Pest Management: Farmer Field Scholls Generate SustainablePractices. A Case Study in Central Java Evaluating IPM Training. Wageningen, WageningenResearch Programme on Knowledge Systems for Sustainable Agriculture, 304 pp.
van de Fliert, E., van Elsen, K. and Soenanto, N.F. 1994. Integrated Rat Management: A Commu-nity Activity. Paper presented at National Seminar on Integrated Rodent Management, Cisarua,West Java, 13 pp.
Wagiman, F.X., Sumardiyono, Y.B., Supriyanto, M. and Suharsono. 1998. Problem Inventarisationof FFS IPM on Soybean. Paper presented at Technological Meeting of IPM Research Result,Cisarua, April 1998. 10 pp.
Waterhouse, D.F., Putter, C.A.J., Theunissen, J. and van Halteren, P. 1983. Report of the JointADAB/DGIS/FAO Mission to Review the Progress of the Inter-country Programme for the De-velopment and Application of Integrated Pest Control in Rice Growing in S and SE Asia. Rome,FAO. Unpubl. Report, 82 pp.
Watson, T.F., Moore L., and Ware, G.W. 1975. Practical Insect Pest Management: A Self-Instruction Manual. San Fransisco, W.H. Freeman & Co., 196 pp.
Winarto, Y.T. 1995. State intervention and farmer creativity: Integrated pest management amongrice farmers in Subang, West Java. Agriculture and Human Values 12(4):47–57
Winarto, Y.T. 1996. Seeds of Knowledge: The Consequences of IPM Schooling on a Farming Com-munity in West Java. Unpublished Ph.D thesis, The Australian National University, Canberra.
Winarto, Y.T. 1998. Pests and Natural Enemies, Cures and Toxins: Rice Farmers’ KnowledgeDynamics in Controlling Pests [In Indonesian: Hama dan Musuh Alami, Obat dan Racun:Dinamika Pengetahuan Petani Padi dalam Pengendalian Hama]. Antropologi Indonesia 22(55):53–68.
Winarto, Y.T. 2002. From farmers to farmers, the seeds of empowerment: The farmers’ self gover-nance in central Lampung. In: Sakai, M. (ed), Beyond Jakarta Regional Autonomy and LocalSocieties in Indonesia. Crawford House Publishing, Adelaide, pp. 270–289.
Winarto, Y.T., Maidi and Darmowiyoto. 1999. Agricultural development and farmers’ freedom[In Indonesian: Pembangunan Pertanian dan Pemasungan Kebebasan Petani]. AntropologiIndonesia 23(59):66–79.

Chapter 11Principles and Methods of Rice LepidopteroidPest and its Enemy Management (PEM)Program in North Vietnam
Eugeny S. Sugonyaev
Abstract The principle technological scheme of lepidopteroid rice pest and its nat-ural enemy management (PEM) on an ecosystem basis is elucidated. The elabo-rated algorithm of rice agro-ecosystem management includes; (a) well groundedeconomic thresholds (ET) both for rice leaffolder and yellow stem-borer; (b) mon-itoring of number dynamics of lepidopteroid pests and their natural enemies; (c)decision making with employment of the standard survey forms; (d) registration ofquantitative index – the zoophage efficiency level as an indicator of ecological re-sistance of paddy agro-ecosystem on rice pest injury, and its usage for lepidopteriodpest ET correction; (e) environment friendly tool set and tactics of lepidopteroidpest population management.The tactics of PEM program implementation allows tocontrol of lepidopteroid pest populations (and secondary pests) and cutting down ofthe quantity of chemical insecticide treatments six times under the condition of theRed River Delta.
Keywords Lepidopteroid rice pest · economic threshold · paddy agro-ecosystem ·generalist predator · monitoring · decision making
11.1 Introduction
At the end of 20th century a dependency of rice production on pesticide applicationin South-East Asia was one of the main factors which, side by side with populationgrowth, degradation of soil fertility and water resources, created constant tensionin food security and pesticide pollution of the environment (Bull, 1982; Kenmore,1991; Lampe, 1994). Pesticides are significant inputs to rice production: in 1988alone, insecticides costing US$ 910 000000 were used in rice world wide, morethan for any other crop (Lampe, 1994). At the same time it is a known fact that anoveruse of pesticides has negative impact on natural enemies of rice pests which isthe cause of outbreaks of some secondary pests, for example, brown planthopper
E.S. Sugonyaev (B)Zoological Institute, Russian Academy of Sciences, 199034 St. Petersburg, Russiae-mail: [email protected]
R. Peshin, A.K. Dhawan (eds.), Integrated Pest Management: Disseminationand Impact, DOI 10.1007/978-1-4020-8990-9 11,C© Springer Science+Business Media B.V. 2009
383

384 E.S. Sugonyaev
(Nilaparvata lugens). Brown planthopper was a minor pest of tropical rice in thepast but increased dramatically in the early 1970s when pesticides used againstlepidopteroid rice pests eliminated its natural enemies. It is obvious that develop-ment of environment-friendly rice pest and its enemy management is essential forsustainable productivity of rice.
In 1993, the Russian-Vietnamese Tropical Centre, Hanoi, Vietnam, began eco-logical studies on lepidopteroid pest and its enemy management (PEM) program inthe Red River Delta which produced 20 per cent of the country’s rice. The study wascarried out at of Hanoi Agriculture University, Hanoi and in the Quoc Oai District,Ha Tay Province, during six rice seasons.
IPM principles and methods used in the Philippines (Reissig et al., 1986) and In-donesia (Kenmore, 1991) provided the basis for development and implementation ofrice IPM in some areas of South-East Asia. However, the peculiarity of approach inVietnam was the specific environment, pest and beneficial arthropod fauna, and localtraditions on rice growing which helped to best address PEM tools and methods.
The choice of rice lepidopteroid pests as target species was conditioned by thepotential hazard of its injury activity, and the visibility of plant damage whichwas used by farmers as a signal for insecticide treatment early in the season. Thispractice abolished natural enemies and disturbed the natural control of the pest,which resulted in resurgence of some secondary pests such as brown planthopper.The key rice pests in North Vietnam are: the leaf folder, Cnaphalocrocis medinalis(LF), the yellow stem-borer, Scirpophaga incertulas (YSB) (Pyralidae). Vu QuangCon (1992) brought out data on these species and other lepidopteroid rice pests andtheir parasites in Vietnam.
The feature of our approach was an elaboration of pest and its enemy man-agement strategy assuming conservation of biodiversity at different trophic levels(zoophages mainly) in the rice agro-ecosystem and strengthening of an ecologicalstability in this ecosystem in order to turn events in the life of the rice arthropodcommunity into a desirable direction. Hence, the main objectives were: a) Develop-ment of well-grounded economic threshold (ET) for main lepidopteroid pest specieswith obligatory consideration of associated circumstances; b) Rice plant ability tocompensate for pest damage at different stages of plant growth; c) Pest populationdynamics pattern during the spring and summer rice seasons; d) Share of natural en-emies activity in the formation of resistance of the rice agro-ecosystem to pest injuri-ous activity; e) Analysis of the pattern of pest population dispersion and elaborationsof the method of monitoring of pest and its enemy populations for improvement ofdecision making; f) Use of bacteria compounds as the most environment-friendlyinsecticides; and g) Elaboration of the principle technological scheme (program) ofPEM under the condition of the Red River Delta.
11.2 Paddy Agro-Ecosystem
The basic feature of the paddy agro-ecosystem is a combination of two life environ-ments – aquatic and terrestrial ones that determine trophical relations of organisms

11 Methods of Rice Lepidopteroid Pest and its Enemy Management (PEM) 385
connected with both kinds of environments (Settle, 1991). The detritophages andscreeners build up the first level of substance and energy circulation which is not re-served because of many detritophagous arthropods and screeners areprey of generalistpredators, e.g. spider-wolf, Pardosa pseudoannulata, during 20 days after transplant-ing (DAT) of rice sprouts particulary in the beginning of rice season (Table 11.1).
Thus, in a paddy agro-ecosystem, long before rice plant begins to play an im-portant role in the environment formation in a given paddy field, significant stockof natural enemy populations are formed that will later determine an ecologicalsituation in paddy agro-ecosystem. Overall, more than 220 species of predators andparasites are regular for the paddy agro-ecosystem in south China (Pu Zhelong andZhou Changqing, 1986). During our investigation about 20 species of predators andparasitic Hymenoptera were most visible and important in natural biological controlof rice pests (Table 11.2) (Sugonyaev et al., 1995).
The natural enemies are very convenient for identification from practical pointof view as indicative zoophagous species the farmers recognize most of themin a field easily (after some training). It is believed that the number of indica-tive zoophagous species counted in a given paddy field reflects a general speciesdiversity of zoophages. Besides there are four species of microhymenopteroid eggparasites of LF – Trichogramma chilonis, and YSB – T. japonicum, Tetrastichusschoenobii (Chalcidoidea) and Telenomus dignus (Scelionidae).
In general, an increase of zoophage numbers in paddy field without the useof insecticide treatment displays some correlation with rice growth. Although the
Table 11.1 Main functional groups of the paddy agro-ecosystem (sweep samplings with standardentomological net, 50 beats) in rice summer season
Date DAT Functional groups (%)
Zoophage Phytophage Detritophage and Screener
19935.07 9 3.8 0.61 95.6
22.07 15 15.2 5.1 79.705.08 29 20.7 5.3 74.012.08 35 50.9 14.4 34.719.08 42 41.1 12.08 46.924.08 48 30.7 16.0 52.531.08 54 51.1 23.2 25.709.09 63 32.5 7.3 60.116.09 70 38.4 12.1 49.521.09 75 43.8 10.7 46.7
199425.07 14 10.7 0.0 89.301.08 21 12.0 0.0 88.008.08 28 8.2 1.4 90.415.08 35 12.0 1.0 87.024.08 44 37.3 22.6 31.112.09 65 19.6 25.0 55.419.09 72 12.6 12.5 58.9

386 E.S. Sugonyaev
Table 11.2 The main zoophagous species in the paddy arthropod community
Type of zoophage, species and species group Prey, host
LF YSB Other moth-species Plant hopper1 2 3 4 5
PredatorAraneiPardosa pseudoannulata + + + +Oxyopes javanus + + +Tetragnatha maxillosa + +Araneus spp. + + +Clubionia japonicola + + +Phidippus sp. +ColeopteraMicraspis spp. + + +Ophionea nigrofasciata + +Pederus fuscipes + + +Carabidae, gen., sp. + + +OdonataAgriocnemis spp. +HeteropteraMicrovelia sp. +Cyrtorhinus lividipennis Reut. +TettigoniidaeConocephalus spp. +Parasitic HymenopteraCardiochiles philippinensis +Temilucha philippinensis + +Xanthopimpla flavilineata +Apanteles ruficrus, inc. coccon group +A. cypris, inc. single coccon +Charops bicolor, inc.coccon suspended at leaf +
numbers of any single species of entomophage may change. Nevertheless, theirmean number is relatively high and constant during the season, forming a socalled biological barrier. Which put together are hundreds of specimens indica-tive zoophagous species registered during 30 minutes of walk through the plot,in the peak for the mid-season (40–60 DAT) (Sugonyaev and Monastyrskii, 1997,2008). In the first half of both rice seasons spider-wolf, P. pseudoannulata, is themain dominating species – the curve of its numbers correlates best with that of thetotal numbers of all registered predators. In the spring rice season small beetles(Staphylinidae, Carabidae) also reach significant numbers in the middle of crop-ping season whereas lady beetles, Micraspis spp., reach the most numbers in themiddle – end of the season. In the middle of the summer rice season spiders (Oxy-opes javanus, Araneus spp., etc), dragon-fly (Agriocnemis spp.) and predaceousgrasshopper (Conocephalus sp.) have significant contribution to the total numberof predators. Thus, the probable importance of zoophages rises until the numbersof detritophages and screeners decline while pest populations grow uniformly. The

11 Methods of Rice Lepidopteroid Pest and its Enemy Management (PEM) 387
change of the zoophagous species numbers is almost similar, both in optimal andlate-planted paddy fields in contrast to cotton, for instance (Sugonyaev, 1994).
11.2.1 Economic Threshold (ET)
For solution of ET issues, data of experimental research in laboratory and field sur-veys was critically analyzed. The main variety of rice was CR203, and in specialcases other varieties were also used. Concept of ET accepted fixed quantity of both5 per cent and 7 per cent yield loss admissible levels (YLAL) which form the eco-nomic basis of ET.
11.2.1.1 ET of Leaf Folder (LF)
From the studies, it was found that if the average rate of leaffolder damaged leavesincreased by 1% then the loss of grain increased by 0.3% approximately. Sinceplant ability for damage compensation decreases with growth of a plant, the equa-tions have been developed for both vegetative (1) and reproductive (2) periods ofthe plant cycle (Monastyrskii and Sugonyaev, 1995; Sugonyaev and Monastyrskii,1997, 2008).
a(%) =[
(0.088 + 0.844N) × e(0.204−0.0085N )T
−53.95 + 30.021 ln(t0 + T )
]
× 100 (11.1)
where: a (%) – level of damage leaves in %;
N – density of pest population;T – duration of pest activity;t0 – days after transplanting (DAT);e – basis of natural logarithm.
a(%) =[
(0.088 + 0.844N) × e(0.204−0.0085N )T
485 − 106.91 ln(t0 + T )
]
× 100 (11.2)
The equations allow calculating ET of leaf folder at any time during the cropgrowing season. But as a guide, some data would be useful. For instance, for plantaged 20–30 DAT the ET is 20 (lower level) – 25 (upper level) per cent of damagedleafs; for 50–70 DAT – 6–8 per cent of damaged leafs. Of course, the informationwill be more useful if lower and upper levels of larvae number are also used. Thus,till 25 DAT, the ET is 1.5–2 larvae per hill, for 70 DAT – 0.15–0.25 larvae per hill(Sugonyaev and Monastyrskii, 1997, 2008).

388 E.S. Sugonyaev
11.2.1.2 ET of Yellow Stem-Borer (YSB)
“White head” damage appears because of yellow stem borer activity during thereproductive period, i.e. 50–80 DAT, and it has provocative effect on the farmerto treat his paddy field with chemical insecticide. Of course, knowledge of the realYSB, ET is urgently needed (Monastyrskii and Sugonyaev, 2001).
There is a negative correlation between pest damage activity and quantity ofstems per hill, a count of stem average for at least 20 hills need to be done. Forexample, the mean number of stems per hill is 7.0. If the unit is a hill, make use ofthe counted diagram (Fig. 11.1). The equation for calculation is:
Dst (%) =(
n
N × x
)
× 100 (11.3)
where: n – quantity of damaged hills;
N – quantity of hills in the sample;x – a mean of stems per hill.
For example, there are 100 damaged hills in the sample out of 500 total hillswhile the mean number of stems per hill is 7.0.
5 7 9 12 14
0 1 2 3 4 5 6 7 8
5%
7%
9%
Fig. 11.1 The diagram showing on dependence of grain loss as a result of damaged stems byyellow stem-borer, Scirpophaga incertulas, into hills with different quantity of stems per 1 hill –5, 7, 9, 12 and 14 ones. On ordinate axis – grain loss in %; on absciss axis – stem in %

11 Methods of Rice Lepidopteroid Pest and its Enemy Management (PEM) 389
Table 11.3 The probable threshold meanings of YSB damages for 5 and 7% YLAL
Plant age, DAT YLAL Maximalquantity ofdamaged stemsper hill
20–35 5% 0,97% 1,7
36–55 5% 0,47% 0,8
56–75 5% 0,77% 1,1
Dst (%) =(
100
500 × 7.0
)
× 100 = 2.86%
In order to know the weight of this value use diagram (Fig. 11.1), and draw theperpendicular from the found point 2.86% to the intersection with the inclined linegiving the mean of stems per hill. In our case, the point of the intersection will be onthe horizontal line giving 5% YLAL, i.e. no serious injury. Next 7% YLAL wouldbe about 4% of damaged stems.
The relation between the growth stage of plant, the quantity of damaged stemsand YLAL for preliminary decision making can be determined by Table 11.3.
The recommended ET is characterized by two levels – a lower and upper one.In other words, ET is not one fixed line but a sort of strip. The notion of ET levelsis useful for improving decision making because it allows in evaluating a change inpest population density not only at one moment of time but over a period of timealso. Really, if ET is just a line then any crossing of the line will mean a need forimmediate managing action – often treatment with insecticide. However, if two-leveled ET is used then the process of population density change can be watchedbecause the crossing of the lower level by pest number curve does not mean a needof immediate managing action. In fact, the curve perhaps will not reach the upperlevel of the ET, and consequently no measure is required. Thus, two-leveled ETinforms and improves the decision making process. In terms of this concept, thelower and upper levels of ET are threatening and operative ones, respectively.
11.2.2 Zoophage Efficiency Level (ZEL)
Zoophage Efficiency Level is a definite summed up population density of indicativezoophagous species, which is typical for field study state in ecological science, andused for cotton field monitoring (Sugonyaev, 1994). From our studies of severalyears it is clear that the higher the indicative zoophagous species number, the lowerthe number of leaves damaged by LF, (Sugonyaev and Monastyrskii, 1997).
A pattern of indicative zoophagous species appearance during the season showsthat its number reaches the peak mostly during the mid-season. Based on empirical

390 E.S. Sugonyaev
data we consider that the zoophage numbers in the range of 70–100 specimensper survey in mid-season (about 50 DAT) is the minimal zoophage efficiency level(ZEL). It shows a probable steady type of a given paddy agro-ecosystem whichis most resistant to lepidopteroid pest injury. On the contrary, a number of 30–50specimens of indicative zoophagous species imply an unsteady type of paddy agro-ecosystem that is more prone to lepidopteroid pest problems. The advantage of thismethod is an opportunity to estimate both a probable injury level of pest and anecological situation in paddy that is important for decision making process.
The next important point for decision making is to take into consideration the par-asitization of egg masses of yellow stem borer by hymenopteroid parasitic speciescollected during examination of 100 hills. Each single egg mass is put into a separatesmall test tube for rearing, either yellow stem borer larvae or minute parasitic wasps,or the former and the latter together. If the parasitization of egg masses is about 70per cent, then approximately 50 per cent of host eggs will be eliminated, i.e. prob-ability of pest damage reduces by two times. The parasitization of egg masses byabout 90 per cent indicates insignificant damage in the coming week.
11.3 Monitoring for Decision Making
Decision making based on the sequential method of sampling and analysis, and aweekly ZEL field survey is the operative ground of rice pest and its enemy manage-ment (PEM) program. Of course, a standardization of survey methods is a prereq-uisite of PEM implementation. Standard survey forms (SSF) for definite age periodof rice plant based on biometrical interpretation of an insect dispersion pattern areoffered. SSF are used for quick field survey and preliminary decision making bysumming up of both pest infested and non infested rice hills till the drawn curvewill cross either lower or upper inclined lines of the figure, meaning lower and upperlevels of the ET. Accordingly, the lower intersection means there is no necessity formanaging action while the higher intersection implies the need for such action.
Besides the SSF include definite predictable information because the size ofthe first, “harmless” zone lying under lower level gives objective guidance on thegeneral susceptibility of paddy field to lepidopteroid pest problems. Actually, thedeclining of the 1st zone and an increase of the 2nd “harmful” zone show how alepidopteroid pest problem probability grows from early to mid-season. The abovedescribed method is used directly for the counting of leaffolder larvae and stemsdamaged by yellow stem borer in rice hills (Sugonyaev and Monastyrskii, 1997,2008; Sugonyaev et al. 1997; Monastyrskii and Sugonyaev, 2005).
In any case, the calculation of indicative zoophagous species needs thirty-minuteswalking on ridge along the edges of the paddy fields. During final decision makingthere is a necessity to follow next directions. For example, the density of indicativezoophages reaches the ZEL, and at the same time the summed up curve of leaffoldernumber crosses the upper level of the ET after examination of at least 40 hills thena managing action is not needed. If the upper level of the ET is crossed after exam-

11 Methods of Rice Lepidopteroid Pest and its Enemy Management (PEM) 391
ination of less than 40 hills, for instance 20–30 hills, a managing action is needed.The density of 20–50 indicative zoophages in a given paddy field in any case showsa necessity of a managing action.
In case of yellow stem borer, counting of egg masses parasitization by parasitewasps is essential for taking any management action. This way of identification ofecological situation in a given paddy field seems complicated but there is a need toget improved information because every chemical insecticide application is undesir-able from ecological point of view and it must be rejected even if there is some risk.
11.4 IPM Tools
11.4.1 Application of Bacteria Compound
From our studies, it was clear that one application of 1% solution of BitoxibacillinTM
(BTB-202) decreases a leaf folder population by about 60% within 5 days of treat-ment. In PEM program, such effectiveness is satisfactory because the remainingpart of the pest population will be devoted by entomophages owing to a change ofentomophage: pest ratio in favor of the former. On the other hand, BTB-202 madein Russia showed itself to be a effective compound under the tropical condition.But BTB-202 is not recommended for suppression of yellow stem borer populationbecause of protective mode of life of the latter.
11.4.2 Manipulation of Transplanting Time
Time of rice transplanting largely determines the feature of a relationship betweenrice plant and pest. There is a link between plant growth studies and probabilityof yellow stem borer injury. The critical point is the time of panicle initiation: therice crop with early panicle initiation is much less susceptible to the pest injuryactivity. So, the variety with the early panicle initiation (∼56 DAT) is not damagedby yellow stem borer or damage is upto 1–1.5% only. Yellow stem borer to the extentof 8–10% may damage v.v., variety with comparatively late panicle initiation (∼77DAT) because in this case plant growth stage coincides with the peak of yellow stemborer moths flying stage (Sugonyaev and Monastyrskii, 2007).
In general, under the condition of the Red River Delta, (a) In the spring riceseason if the plant ripening stage in a given paddy begins in the middle of May thenthe crop will be less prone to lepidopteroid pest problems; (b) In case of summer riceseason a ripening stage begins first, partly in second ten-day period of Septemberthen a given paddy will have more tolerance to lepidopteroid pest injury.

392 E.S. Sugonyaev
11.4.3 Monitoring and Decision Making
The SSF for revealing of lepidopteroid pest density and damage level are goodground for PEM program implementation. However, PEM will run the risk if prin-ciple of ET is used as a sort of a trigger for chemical insecticide application. That iswhy an incorporation of the ZEL and YSB egg masses parasitization (70%) in thedecision making process is a necessity.
11.4.4 Application of Broad-Spectrum Chemical Insecticides
From the PEM strategic point of view, less is always better when it comes to insecti-cide application in rice. The regulation of insecticide application are: (a) when pestnumber curve crosses the upper level of the ET and when the density of indicativezoophages is low (20–50 specimens per survey); (b) unavailability of bacterial com-pounds and other biological means of control; (c) local use of insecticide at damagedplot or spot application only; (d) rejection of so called “prophylactic” application;(e) screening of most safe insecticides for zoophages, its dosage and applicationmethods.
11.4.5 Tactics of the PEM Program Implementations
There is a definite pattern of population density dynamics of lepidopteroid pest ineach rice growing season. In the spring (1st) season the increase of lepidopteroidpest abundance has a low rate, and as a rule it does not reach ET. On the contrary, thesummer (2nd) season is characterized by fast increase in their population density,and a strong probability of crossing the upper (operative) level of ET (Vu QuangCon, 1992; Sugonyaev and Monastyrskii, 1997, 2007). Almost every year, the crit-ical situation necessitating rice protection appears during rice flowering at the endof August and in the first ten days of September when the peak of 6th generation ofleaf folder and 5th generation of yellow stem borer take place. Thus, perennial dataallows us to distinguish the period of natural history for both leaf folder and yellowstem borer when their damage activity is high, and at the same time, the opportunityfor suppression of pest populations is also good. During this period one treatmentby bacterial compound, for instance BTB-202, will take care of lepidopteroid pestproblem in rice and address two main tasks: a) rice protection and b) particularlyconservation of paddy agro-ecosystem biodiversity and natural enemy populations.It is assumed that suppression of leaf folder population and preservation of zoophagenumber in a given paddy creates the ground for natural control of yellow stem borer,brown planthopper and other insect pests by maintaining their population belowtheir economic thresholds (Sugonyaev and Monastyrskii, 1997, 2008).

11 Methods of Rice Lepidopteroid Pest and its Enemy Management (PEM) 393
11.5 Effectiveness of Rice Pest and Its EnemyManagement Program
The principle technological scheme of rice pest management on ecological basisis the creation of the optimized ET for both leaf folder and yellow stem borer, as-certaining the ZEL, and formalization of survey through SSF for improveing to agreat extent the decision making process and rice protection on the whole under theconditions of the Red River Delta.
The tactics of PEM program implementation allows six times decrease in the ofquantity of chemical insecticide treatments which are conventionally in use here.As it has been discussed above, one per year and time fixed treatment with bacterialcompounds would be more effective and cheaper than two-three treatments withchemical insecticides during the same period. Simultaneously, the former removesthe problem of pest resurgence, for example, brown planthopper, the cost of whichmay be much higher. This feature of the paddy agro-ecosystem is the direct con-sequence of high activity of natural enemies there by maintaining most of the ricepest species below their economic threshold level. The similar conclusion has beendrawn by our Vietnamese colleagues as a result of organization of farmers’ IPMdemonstration schools in the south and north parts of the country. Almost every-where, both in rice crop treated with chemical insecticides and untreated ones, therice harvests have been similar (Tran Quy Hung and Pham Thi Nhat, 1994).
The worth of the suggested PEM program is its relative simplicity for rice farmerafter training, e.g. in farmer’s school. The result of our research have proved thatit is not necessary to spend about $1 billion (Lampe, 1994) on chemical pesticidetreatments under the tropical condition in South-East Asia because a mobilizationof natural control resources on an ecological basis, and the definite investment into
production and distribution of bacteria compounds, e.g. BitoxibacillinTM
, ensuresuccess in productive rice growing, removal of the danger of both outbreaks ofsecondary rice pest and pesticide pollution of the environment.
Acknowledgments I am thankful to V.S. Roumak and Chang Suan Thu (Russian-VietnameseTropical Centre), Ha Quang Hung (Hanoi Agriculture University) who supported our investigationand Russian and Vietnamese colleagues for their valuable contribution to research. I am greatful toS.Ya. Reznik (Zoological Institute RAS) for help in manuscript preparation, and Ashok Dhawan(Punjab Agricultural University, Ludhiana, India) for editing.
References
Bull, R.F. 1982. A Growing Problem: Pesticides and the Third World Poor. OXFAM Press, Oxford.Kenmore, P.E. 1991. Indonesia’s Integrated Pest Management a Model for Asia. Inter-Country
Programme for Integrated Pest Control on Rice in South and South-East Asia. FAO, Manila.Lampe, K. 1994. Rice Research for The 21st Century. Vietnam-IRRI Rice Conference, Hanoi, Viet-
nam, 1–10 pp.Monastyrskii, A.L. and Sugonyaev, E.S. 1995. Ecological basis of integrated rice lepidopteroid pest
management in North Vietnam I. The model of leaffolder, Cnaphalocrocis medinalis Gueen,injury. Entomologicheskoe Obozrenie 74:19–37 (in Russian)

394 E.S. Sugonyaev
Monastyrskii, A.L. and Sugonyaev, E.S. 2001. Ecological basis of integrated rice pest managementin North Vietnam. III. A suggested method of counting economical threshold of yellow stem-borer, Scirpophaga incertulas Walk. (Lepidoptera, Pyralidae). Entomologicheskoe Obozrenie80:585–592 (in Russian).
Monastyrskii, A.L. and Sugonyaev, E.S. 2005. Ecological basis of integrated lepidopteroid ricepest management in North Vietnam. IV. A method of successive taking and analyzing sam-ples for estimation of the damage caused by pyralid moths (Lepidoptera, Pyralidae) to rice.Entomologicheskoe Obozrenie 84:492–511 (in Russian).
Pu Zhelong and Zhou Changqing. 1986. Integrated control rice insect pests in China. Naturalenemies of insects 8:41–51.
Reissig, W.H., Heinrich, E.A., Listiner, J.A., Moody, K., Fidler, L., Men, J.W. and Barrion, A.T.1986. Illustrated Guide to Integrated Pest Management in Rice in Tropical Asia. IRRI Press,Manila.
Settle, W. 1991. Ecological Supporting Studies: A Summary of Results. The Indonesian NationalIPM programme, Jakarta, Indonesia.
Sugonyaev, E.S. 1994. Cotton pest management: part 5. A Commonwealth of Independent Statesperspective. Annual Review of Entomology 39:579–592.
Sugonyaev, E.S. and Monastyrskii, A.L. 1997. An Introduction in Ecological Integrated Lep-idopteroid Rice Pest Management in North Vietnam (Lepidoptera, Pyralidae). Russian-Vietnamese Tropical Centre Press, Hanoi (in Russian, English partly).
Sugonyaev, E.S. and Monastyrskii, A.L. 2007. Ecological basis of integrated lepidopteroid ricepest management in North Vietnam V. Characteristic of population dynamics of the main lep-idopteroid rice pest in the Red River Delta. Entomologicheskoe Obozrenie 85:267–275. (inRussian)
Sugonyaev, E.S. and Monastyrskii, A.L. 2008. Basic components of the ecological integrated ricelepidopteroid pest management programme under the condition of the Red River Delta in NorthVietname (Lepidoptera, Pyralidae) VI. General guidance for employment. EntomologicheskoeObozrenie 87:241–252 (in Russian)
Sugonyaev E.S., Monastyrskii, A.L. and Vu Quang Con. 1995. Ecological basis of integrated ricepest management in North Vietnam. II. Some peculiarities of the rice agro-ecosystem. Entomo-logicheskoe Obozrenie 74:280–286. (in Russian)
Sugonyaev, E.S., Monastyrskii A.L., Do Ngoc Lanh, Bui Suan Phyong and Nguen Duy Toan. 1997.Principles and Methods of the Ecological Integrated Lepidopteroid Rice Pest Management inNorth Vietnam (Lepidoptera, Pyralidae). Biological Diversity and Up-to-Date Condition ofTropical Ecosystems in Vietnam. Russian-Vietnamese Ttropical Centre Press, Moscow-Hanoi,218–240 pp. (in Russian)
Tran Quy Hung and Pham Thi Nhat. 1994. Intercountry programme for the development and appli-cation of integrated pest control in rice in South and South-East Asia. Phase III. National Coun-try Paper of Vietnam. Programme Advisory Committee Meeting, Davao, Philippines, 15 pp.
Vu Quang Con. 1992. Host-parasite Relationships Lepidopterous Rice Pest and Their Hymenopter-ous Parasites in Vietnam (E.S. Sugonyaev ed.). Zoological Institute Russian Academy of Sci-ences Press, St.-Petersburg (in Russian).
Chapter 12Challenges of Integrated Pest Managementin Sub-Saharan Africa
Arnold van Huis
Abstract As a response to the negative side effects of chemical control in thedeveloped world, Integrated Pest Management (IPM) developed with an emphasison reducing the role of pesticides. Later the role of natural enemies was recog-nized as being the cornerstone for sustainable pest management strategies. The IPMconcept initially stressed the combination of control tactics while afterwards theempowerment of farmers in managing their own agro-ecosystems became the focus.Reasons are given why integrated pest management has been instrumental in makingthe Farmer Field School (FFS) prominent in sectors such as nutrient management,animal husbandry and health. FAO started with an IPM project in subsistence cropsin Africa, but because of its low impact on farmers’ livelihoods changed to cropswith a higher consumption of pesticides such as cotton and rice. Some pests likelocusts require the attention of the central government. The multiple dimensionsof desert locust problems are highlighted, and the realization that its solution ismore operational than technical. Invasive pests are a continuous threat, and classicalbiological attempts have been highly successful. Some examples of technical IPMcomponents such as varietal resistance, the judicious use of chemicals, agronomicpractices, and biological control are given. However, it appeared that the adoptionrate by farmers of proposed technologies is low. It is argued that farmers face verysmall windows of opportunities. Therefore, institutional development needs as muchattention as technological improvement. A number of examples are given to illus-trate this point.
Keywords Integrated pest management · Sub-Saharan Africa · institutionaldevelopment · locust · invasive insect species
A. van Huis (B)Laboratory of Entomology, Wageningen University, P.O. Box 8031,6700 EH Wageningen, The Netherlandse-mail: [email protected]
R. Peshin, A.K. Dhawan (eds.), Integrated Pest Management: Disseminationand Impact, DOI 10.1007/978-1-4020-8990-9 12,C© Springer Science+Business Media B.V. 2009
395

396 A. van Huis
12.1 Introduction
The rapid population increase in Africa (expected to double from about 1 billionin 2007 to 2 billion in 2050 (UN, 2007) will bring about an intensification of agri-culture. The demand for agricultural products will also increase because standardsof living are expected to rise and because of the recent developments in biofuel.Shortening of fallow periods, adoption of high yielding varieties, use of syntheticfertilizers, the increased use of monocultures, and more intensive use of pesticideswill create favourable conditions for pest outbreaks (Abate et al., 2000).
The Integrated Pest Management (IPM) approach emerged in the 1970s in cottonin the USA, mainly because of the problems associated with the use of pesticides, inparticular those concerning human health and the environment (Perkins, 1982). Theeffect on the population of pest insects was often contrary to what was intended. Thiswas due to pesticides not only causing the development of resistance in arthropods,but also its negative effect on natural enemies leading to resurgence and secondarypest outbreaks.
Natural enemies are usually more susceptible to insecticides than their prey orhost because of differential mortality. This is caused by a number of factors: differ-ences in intrinsic toxicity (Theiling and Croft, 1989), the level of exposure (Waage,1989), disruption of synchronization between the pest and its natural enemy (Waage,1991), differential resistance development (Croft and Strickler, 1983), disruption offood chains (Reynolds et al., 1982), and agrochemicals affecting entomopathogens(Ignoffo et al., 1975). Concerning the level of exposure a search of literature re-vealed that most research on resurgence relate to three pest groups: Homoptera(44%), Lepidoptera (24%), and mites (26%) (Waage, 1989). This can be expectedas relatively sessile pests, such as scale insects and mealybugs, are protected fromcontact insecticides by a waxy covering, lepidopterous leaf miners or stemborers byplant tissue, and mites by a web at the underside of the leaf. These pests are poorertargets for contact insecticides than their natural enemies which must forage overthe plant to find them.
Integrated pest management often focuses on the best technical means to keepherbivores under damaging thresholds. This is achieved by integrating differentcontrol components. Resistance or tolerance of plants to herbivores is increasedby varietal resistance or making the cropping environment less favourable for pests(cultural control methods) or more favourable for natural enemies (conservation bi-ological control). Pesticides less harmful to natural enemies are introduced like theuse of entomopathogens, and botanicals. Against invasive pests classical biologicalcontrol is attempted.
However, integrated pest management has often not been very successful. Likelybecause the human dimension was underestimated, and this was realized from 1990onwards. As a response the Farmer Field School (FFS) approach was introducedin rice in Asia. The FFS approach was different from the conventional integratedpest management approach in the sense that empowerment of farmers became thefocus and not the management of pests and diseases. Farmers when having a bet-ter understanding of their own agro-ecosystem, become better practitioners in pest

12 Challenges of Integrated Pest Management in Sub-Saharan Africa 397
management. Ghana was the first country in Africa where the Farmer Field Schoolconcept was implemented.
The FFS approach is currently used for a variety of disciplines such as animalhusbandry, integrated nutrient management, conservation agriculture HIV/AIDS(Life Schools), and nutrition (Bunyatta et al., 2006). So, pest management was thestarting point for the FFS approach? Why? Likely because a number of effective pestmanagement decisions are counter-intuitive, and requires a learning environment tobe understood. For example, a considerable amount of injury by a defoliating in-sect does not necessarily lead to economic loss. Completely defoliated young maizeplants are able to recover completely without any reduction in yield (Brown andMohamed, 1972; Hicks et al., 1977) The same is true for rice plants which cantolerate up to 50% leaf loss without affecting the yield (Matteson, 2000). Farmersthemselves can observe that yields do not diminish after they defoliate plants withscissors. Another counter intuitive phenomenon is that spraying with insecticidesoften leads to a higher pest incidence. Farmers are often unaware of the conceptof a beneficial fauna. They learn that natural enemy do exist in their own agro-ecosystem, and that they play a very important role in maintaining pests at low inci-dence levels. The insect zoo exercise during FFS is an eye opener for many farmers.By bringing together natural enemies and pests, they can observe for example thatearwigs eat young caterpillars. This is a clear example of how understanding of nat-ural control by beneficials may guide farmers’ decision to refrain from pesticide use.
In this article a short history of integrated pest management programs will begiven, migratory pests and invasive pest species are discussed as well as institutionalissues which are a constraint for application and therefore a challenge to many in-tegrated pest management programs. Framework conditions are often conditionalto the success of IPM projects. Small farmers in Africa have small windows of op-portunities. The question is whether to work within those windows of opportunitiesor to stretch those (van Huis et al., 2007a). Therefore, we focus on institutionalconditions under which integrated pest management will be possible.
12.2 History IPM Programs in Africa
Without trying to give a complete overview of all past pest management activitiesin Africa some major historical developments will be highlighted.
The first large scale integrated pest management program was executed in eightSahelian countries in the 1980s. It was financed for about US$ 30 million by USAIDand implemented by FAO in cooperation with the Permanent Inter-State Committeeon Drought Control in the Sahel (French acronym CILSS). The project entitled “Re-search and development of IPM for basic food crops in Sahelian countries” startedin 1979 and terminated after the first of three planned phases (Zethner, 1995). Theeffect of the project on the improvement on the livelihoods of farmers proved to bevery limited. The perception of the scientists at that time was that a farmer cannotbe approached without having full proof technology. Participatory technology de-
398 A. van Huis
velopment was considered irresponsible. Another factor was that pests and diseaseswere not the main problems in subsistence farming in crops like millet, sorghum,and maize, certainly not when compared to the erratic rainfall and low soil fertility.Unlike cotton, there was no problem with injudicious use of pesticides, because thelow revenues in those subsistence crops did not justify use of chemical control mea-sures (Jago et al., 1993). Another question was whether integrated pest managementwould work for resource-poor farmers with low-value staple food, low yields, no orlow pesticide use, mixed cropping systems and unreliable markets (van Huis andMeerman, 1997; Orr, 2003).
After the Sahel IPM experience in subsistence crops, FAO concentrated on cropswith a high intake of pesticides, such as rice in Asia, where insecticide-triggeredoutbreaks of the brown plant hopper (Nilaparvata lugens (Stal)) created problems(Heinrichs and Mochida, 1984), and of the whitefly (Bemisia tabaci (Gennadius))in cotton in the Gezira in Sudan (Bashir et al., 2003). Cotton alone consumes 11%of world’s pesticides, while for insecticides this figure is 25% (FAOSTAT, 2007). Indeveloping countries it is estimated that roughly 50% of all pesticides are appliedon cotton (Caldas, 1997). In 2005/06, cotton production in Africa was 1.7 milliontons of lint, equal to 7% of world production and worth approximately $2 billionto African economies (Anonymous, 2006). African cotton exports account for 17%of world exports. Employment in the cotton sector of Africa is estimated at about20 million. Cotton is the largest employer (estimated at 3 million) in countries suchas Burkina Faso, Chad, Mali, and Togo. Equally in Mali, Sudan, and Zambia manyfamilies depend on cotton for their livelihoods. Eveleens (1983), giving the historyof pest management in cotton in the Gezira in Sudan, indicated that the averagenumber of sprays increased from one in 1960–61 to eight in 1980–81. Before 1965,the whitefly B. tabaci (Gennadius) was an occasional, early to mid-season pestcontained at insignificant levels by natural mortality. With the increase of the non-selective use of broad spectrum insecticides the whitefly population increased andpersisted at sustained high levels into picking time. The impact on cotton productionwas considerable, not only in yield but also in quality of lint because of honeydewcontamination. The FAO project “Development and application of integrated pestcontrol in cotton and rotational food crops in the Sudan”, initiated in 1979, rec-ommended judicious use of pesticides, varietal resistance, conservation biologicalcontrol and cultural control methods (Eveleens, 1983). Similarly, in South Africa,insecticide applications in cotton seemed to be correlated with decreasing yields, be-cause of their negative impact on beneficial arthropods (Hamburg and Guest, 1997).
The FAO Global IPM Facility introduced the FFS approach in West Africathrough a season-long training and three associated FFS held in 1995 in rice Ghana(Simpson and Owens, 2002). Following the efforts in Ghana, a major FFS efforton irrigated rice was launched in the Office du Niger in Mali. Similar efforts werelaunched in Kenya and Zimbabwe. To date the FAO Global IPM Facility (GIF) hashelped to start, or is currently working with pilot FFS programs in over a dozencountries, from Senegal to South Africa. For example, in Kenya FFS was first in-troduced on a small scale in 1995 by the FAO’s Special Program for Food Securityto promote maize based IPM in western Kenya (Bunyatta et al., 2006). Since 1995,

12 Challenges of Integrated Pest Management in Sub-Saharan Africa 399
1500 FFS has been conducted in issues such as the production of dairy cattle andpoultry, soil fertility management, water harvesting, and HIV/AIDS. The nationalprogram (Kenya Agricultural Research Institute) is taking over and is involved inFFS implementation.
The CGIAR Systemwide Program on Integrated Pest Management (SP-IPM)was initiated in 1995 with as main aims to achieve synergies and greater impactin IPM research and implementation, and to ensure that these activities are fullyresponsive to the needs of IPM practitioners (Lenne and Chancellor, 2007). Oneof the major achievements of this program has been the establishment of a largemulti-stakeholder Tropical Whitefly Project, initiated in 1995 and now in Phase III.It deals with the sustainable integrated management of whiteflies as pests and vec-tors of plant viruses in the tropics, and with exchanging information and to achievea collaborative research agenda.
12.3 Invasive Pests
Unintentional introduction of pests and diseases of agriculture as contaminantsin crops and animals has led to severe problems, because alien species thrive innew ecosystems where their hosts are abundant and their own natural controllingfactors may be absent. In Africa, the classical biological control approach (theuse of introduced natural enemies to control an exotic, invasive pest species) hasshown impressive results, in particular in Africa. Neuenschwander (2001) reviewedthe biological control of the cassava mealybug in Africa, and estimated that theproject saved 8 tot 20 billion US$ (Neuenschwander, 2004). Similarly, the con-trol of the cassava green mite saved 2 billion US$, and the control of invasiveweeds like the water hyacinth and the red water fern each half a billion US$.These savings were obtained against costs lower than one percent of the benefits.The stemborer, Chilo partellus (Swinhoe) was accidentally introduced from Asiabefore the 1930s and became the predominant stemborer in the 1990s in easternand southern Africa with more than 70% yield loss in lowland and mid-altitudeareas. The parasitoid Cotesia flavipes (Cameron) was introduced from Asia in 1991and released in coastal Kenya in 1993 (Overholt et al., 1997). It established innine countries in eastern and southern Africa. It is estimated that the parasitoidwill accumulate a net present value of US$ 183 million 20 years since its release(Kipkoech et al., 2006). The advantage of classical biological control is that it canbe done without farmer involvement. Scientists from international research orga-nizations carry out such programs almost entirely relying on funding by donororganizations.
However, challenges remain such as the larger grain borer, Prostephanus trun-cates (Horn) (Coleoptera: Bostrichidae) introduced in the 1980s and a serious pestin farm-stored maize and cassava (Schneider et al., 2004). The histerid predatorybeetle Teretrius nigrescens Lewis (Col.: Histeridae) was introduced from CentralAmerica in several countries. Although in West Africa, the predator was effec-tive in humid-hot zones, it did not have an impact in the hot-dry and cool zones

400 A. van Huis
of eastern and southern Africa. Some other introduced pests are: the SpirallingWhitefly, Aleurodicus dispersus (Russell), first reported in West Africa in 1993(D’Almeida et al., 1998) and now reported in East Africa; the Mango Fruit Fly,Bactrocera invadens, from the Asian subcontinent and since its detection in Kenyain 2003 has spread to over at least ten countries in central Africa attacking a widerange of host plants, including important food crops (Drew et al., 2005); the Red Spi-der Mite Tetranychus evansi Baker & Pritchard is an important pest of Solanaceae(e.g. tomatoes, egg plant), accidentally introduced probably from South Americainto Africa in the 1980s, and presently occurring as a key pest in many Africancountries (Furtado et al., 2006).
Continuing globalisation, with increasing trade, travel, and transport of goodsacross borders, will facilitate the spread of invasive alien species with increas-ing negative impacts. Studies in the United States and India show that the eco-nomic costs in these countries amount to approximately US$130 billion per year.Emergency food aid is also a pathway of agricultural invasives. The neotropicalweed Parthenium hysterophorum recently arrived in Africa through grain shipmentsfor famine relief to Ethiopia, where it has earned a local indigenous name whichtranslates to “no crop” (McNeely et al., 2001).
12.4 Migratory Pests (Emphasis on Desert Locust)
The desert locust, Schistocerca gregaria (Forskal), inhabits the central, arid, andsemi-arid parts in Africa, the Middle East, and South-West Asia. The species re-cession is estimated at 14.6 million km2. This is about half that liable to be in-vaded by swarms, with an area estimated at 29.3 million km2. In the recessionarea there are 25 countries involved, and large scattered populations are potentialsources for outbreaks (van Huis et al., 2007b). These countries have different ca-pabilities of dealing with recession populations of locusts. This has to do with thesize of the area to be surveyed, with the Gross National Income of the country(e.g. Morocco, Sudan and Niger relate to each other as 17 : 6 : 1 - Atlas method –World Bank data 2003), with the value of agricultural produce to be protected, andwith their level of priority for locust control. A number of the more poor countrieshave difficulties in maintaining an effective functioning locust unit. Commitment ofgovernments and donors is strongly correlated to the occurrence of upsurges andplagues.
Pests like locusts and armyworms occur occasionally in large numbers destroyingwhole crops of some farmers. Because of their localized heavy impact on liveli-hoods, they get more attention from national authorities then less conspicuous pestslike stemborers which may inflict the same level of damage or even more whencalculated at a national scale. The spectacular occurrence of locusts is quickly takenup by the public media, and therefore the motives for locust control become politi-cal. For donors contributing to campaigns it is rewarding in terms of contributing tointernational solidarity, peace and good relationships. Locusts are an international

12 Challenges of Integrated Pest Management in Sub-Saharan Africa 401
event, and therefore political. Uvarov (1953) already indicated “Locusts recognizeno frontiers” and he added “in many cases, the ability of locust swarms to crossfrontiers is more readily admitted when they are entering a country than when theyare leaving it for the neighbouring one.” Recrimination from neighbours may occurif they are invaded by large number of locusts, although swarms may have alreadycrossed several frontiers before.
The interdisciplinary character of the event requires the involvement of manystakeholders: farmers, plant protection departments, different ministries, local au-thorities, private enterprise (e.g. pesticide, vehicles, aircraft, and equipment), donors,international organizations, etc. locust control requires the coordination at the na-tional level from a number of Ministries such as Agriculture, Defence, Health andEnvironment, Planning, Interior Affairs, Finance). That is why Head of States be-come involved. The military are often asked to assist in surveys and control opera-tions in insecure areas, or the military run campaigns because of their often excellentorganizational and logistic capabilities (e.g. Morocco), or they put their vehicles atthe disposal of locust units (e.g. in Algeria).
The economic dimensions of the desert locust problem have national impli-cations. For example do control investments justify potentially prevented losses?(FAO, 1998; Herok and Krall, 1995) or would it be better to invest in insuranceschemes (van Huis, 2007). Is locust control sustainable? Can we prevent plaguesfrom happening? What is the effect of control measures in terms of containing theproblem? How is the problem perceived, in particular by donors? The victims areeither the farmers (appeal to national governments) or the locust affected countries(appeal to donors). Donors often classify migrating pests under “Disasters” and assuch can respond quicker to emergencies. Investments in emergency assistance areoften obtained easier and faster than structural assistance. Unfortunately, the fundsallocated for the first are often much larger than for the last. Misappropriation andmisallocation of funds and resources often occur (Lockwood et al., 2001), as nar-rated in the novel “Locusts” of 1927 by Sergei Budantsev. Desert Locust outbreaksand upsurges are considered by some as opportunities. This in particular taken intoaccount the large amounts of money involved in locust operations: an estimated US$315 million during the plague of 1986–1889 (Gruys, 1991) and US$ 260 millionused during the latest upsurge of 2003–2004 (van Huis et al., 2007b). A large portionof those funds are allocated by donors.
Desert locust control relies on synthetic insecticides, and for emergency situa-tions this is unlikely to change. However, effective oil formulations of Metarhiziumanisopliae spores have been developed in Africa and Australia. The Metarhiziumbiopesticide kills 70%–90% of treated locusts within 14–20 days (Lomer et al.,2001). In Madagascar the effect of this biopesticide on the biodiversity was inves-tigated using 225 species of Coleoptera. It showed that from the two native isolatesof the biopesticide one had minimal detrimental effects (Ivie et al., 2002). In Aus-tralia, an incentive to use the biopesticide to control the Australian Plague Locust,Chortoicetes terminifera, was the requirement of pesticide residue free export ofbeef production (Milner and Hunter, 2001). Such an incentive is currently lackingin Africa, although donors could opt for such a strategy. However, although donors

402 A. van Huis
financed the development of the product, even during the upsurge of 2002–2003, itwas not tested or used.
Political and technical issues get mixed up in emergency situations making itextremely difficult to separate those in managing outbreaks, upsurges or plagues(see also Lockwood et al., 2001). As LeCoq (2001) concluded in his overview oflocust control in Africa: “Locust control seems now more to depend on politicaland institutional choices than on scientific and technological innovations.” How dowe separate the political from the scientific and technical domains? Can we createthe social space necessary for scientific and technical people to deal with locustsrationally?
12.5 IPM Components
Kogan (1998) reviewed 64 definitions for integrated pest management and proposed“IPM is a decision support system for the selection and use of pest control tac-tics, singly or harmoniously coordinated into a management strategy, based oncost/benefit analyses that take into account the interests of and impacts on pro-ducers, society, and the environment.” This definition takes into account technical,societal, environmental and economic considerations. Most definitions stress thecombination of tactics: chemical, cultural, biological and varietal control.
12.5.1 Chemical Control
Pesticide use in sub-Saharan Africa was 0.16 kg per ha of arable land, while thisfigure for developing and developed countries was 1.02 and 1.55 kg respectively,meaning that it is still very low (FAOSTAT, 2007). Most pesticides in Africa arespent on cash crops like cotton, oil palm, coffee and vegetables, and migratorypests. Williamson (2005) reported on the percentage of production costs spent onpesticides for several countries in Africa: 22–31% in cotton and 40% on cucumberin Senegal, 16 tot 20% in pineapple and 32–61% in cowpea in Ghana and 10–54%in mixed cropping in Ethiopia.
The negative side effects are well-known. In particular for resource-poor farmersthe health risks are high as they often lack the means to buy and maintain applicationequipment. Besides they lack proper storage facilities, are often not instructed touse it safely. When pesticides are bought on credit, farmers take a risk becomingindebted when the crop fails. There is further the danger of falling into the trapof the pesticide treadmill, caused by the build-up of pesticide resistance and resur-gence and secondary pest outbreaks. The danger is largest in a crop like cotton. InWest Africa pyrethroid resistance to Helicoverpa armigera in cotton was reportedin West Africa (Martin et al., 2002), and the resurgence of whitefly in the Sudan(Abdelrahman and Munir, 1989; Eveleens, 1983).

12 Challenges of Integrated Pest Management in Sub-Saharan Africa 403
In subsistence crops Jago et al. (1993) concluded that in millet the use of pesti-cides was not economically justified. Nevertheless in some Sahelian countries, likeNiger, village crop protection brigades were set up (de Groot, 1995). They appliedpesticides donated by donors for their fellow farmers on millet. The uniforms of thebrigade members and the sophisticated equipment gave the erroneous impressionof modernity and prosperity to the farmers. Apart from introducing unsustainablemethods by donors, in the process traditional pest management practices are gettinglost (Atteh, 1984).
Migratory pests, like locust plagues, armyworm outbreaks and quelea birds arecontrolled by the government through the Plant Protection Divisions that applypesticides free of charge. This also strengthens the impression to farmers that pestcontrol is not their responsibility, but that of the government.
The unused pesticides donated for locust control may eventually be spent forother pests. It happens also with pesticides of which the procurement is facilitatedby the government in crops like cotton. It eventually may be applied on food crops,in particular when producer prices for cotton are low. For example in Benin, farm-ers indicated that they grew cotton in order to obtain sufficient pesticides to treattheir cowpea plots (Prudent et al., 2006). Locust upsurges often results in donatedpesticides which often become obsolete stocks that effects the environment. FAO(2004) estimated the amount of obsolete stocks in 53 African countries to be 50,000tonnes. FAO is participating in the Africa Stockpiles Program (ASP), a multi-partnerinitiative, which aims to clear obsolete pesticide stocks from African countries andput in place measures to prevent the problem from recurring.
Farmers often use natural products to control insect pests. Nkunika (2002) indi-cated that in the Muswishi area in Zambia maize farmers hardly use pesticides, butthey do use plant products, wood ash and cow dung to control pests.
Fruits and vegetables are one of the fastest growing agricultural markets in de-veloping countries, with production increasing by 3.6 percent a year for fruits and5.5 percent for vegetables over 1980–2004 (McCulloch et al., 2007). A variety ofthese management-intensive crops are grown with a heavy use of chemicals, viz.horticulture crops account for 28 percent of global pesticide consumption (Fosterand Rosenzweig, 2004). For example, farmers in Benin increased their applicationson cabbage from three per season to 12–20 by 2001 (PAN, 2001).
12.5.2 Varietal Control (GMOs)
The International Board for Plant Genetic Resources and CGIAR institutes collectlandraces and wild relatives of crops, conserve germplasm and use this to developresistant and tolerant crop varieties. It is an appealing strategy for resource-poorfarmers as just planting a crop variety provides control. However, Zannou et al.(2007) showed that for yam and cowpea in Benin that the diversity of rituals, foodhabits, technological traits, food security strategies, and market demands contributesto the maintenance of varietal diversity by farmers. It is not possible for one or even

404 A. van Huis
a few varieties to meet all needs. The management of on-farm genetic resourcesis a socially and culturally constructed system. Any external strategy to improvevarieties should take into account these social and cultural aims. It is probablyfor the above mentioned reasons that sub-Saharan Africa has seen very incompleteadoption of improved varieties (World Bank, 2007).
In 2006, farmers in 22 countries worldwide planted transgenic seeds on about100 million ha, which is about 8% of the global crop area (World Bank, 2007).South Africa is currently the only country in sub-Saharan Africa, where Bt cotton isgrown commercially. Toenniessen et al. (2003) mentioned that small farmers in theMakhathini Flats the Northern Kwa-Zulu Natal received a 77% higher return fromBt cotton than from conventional varieties and also benefited through a significantreduction in the number of necessary insecticide applications. However, Hofsa et al.(2006) found in the same area that cropping Bt cotton did not generate a tangibleand sustainable socio-economic improvement. The problem they mentioned wasthat these farming systems are characterized by recurrent low crop yields and broadvariations due to climatic and environmental factors. In this setting, the adoptionof Bt cotton increases the financial risk for farmers. Focussing on Bt cotton withoutconsidering other factors was considered misguided. Hillocks (2005) also concludedthat Bt cotton cannot deliver yield increases if crop management is poor. Therefore,it should be used in an integrated crop management system, and to have the full ben-efits spraying against non-lepidopterous pests would be necessary. Another problemis that incentives are provided to smallholders to grow cotton, such as fertilizerswhich are often diverted to food crops and seed. Therefore, farmers are reluctant topay for Bt cotton seed which is about 50 US$ per ha (Hillocks, 2005).
Toenniessen et al. (2003) mentioned a method to control Striga in maize. Resis-tance to the herbicide imazapyr was bred into maize varieties that were adapted toEast African conditions. The seed coating of these varieties with a magnesium salt ofimazapyr against a cost of 4 US$ per ha before planting prevented the developmentof Striga parasitized plants.
12.5.3 Biological Control
The classical biological approach has been treated in the paragraph on invasivepests. The inundation type of approach is not very important in Africa. It wouldonly be beneficial for large plantation crops in Africa, and not for small farmers, asit requires the rearing of natural enemies.
Conservation biological control involves the enhancement of naturally occurringnatural enemies. Van Mele et al. (2007) showed in Benin that at high ant abun-dance levels, Oecophylla longinoda (Latreille) (Hymenoptera: Formicidae) signif-icantly reduced fruit fly (Ceratitis spp. and Bactrocera invadens) infestation inmango (Mangifera indica L.). Ayenor et al. (2007a) also showed in Ghana thatthis ant species was able to control the capsids, Sahlbergella singularis Hagl.and Distantiella theobroma (Dist) (both Hemiptera: Miridae) in cocoa (Theobroma
12 Challenges of Integrated Pest Management in Sub-Saharan Africa 405
cacao L.) as effectively as applying crude aqueous neem Azadirachta indica A. Juss.(Meliaceae) seed extract. When ant abundance was high, capsid incidence was low.One of the most important issues to conserve natural enemies is to refrain from usinginsecticides, especially in agro-ecosystems where no pesticides are used. This pro-vides a challenge with the intensification of agriculture. Although adoption rates toconserve predatory ants are still low, emerging markets for organic and sustainably-managed fruit, nut and timber products are likely to boost investment in weaver ants(Van Mele, 2008).
12.5.4 Cultural and Mechanical Control Practices
Traditional pest management practices are often cultural or physical, and of specialinterest for farmers that cannot afford expensive inputs. Cultural control is makingthe cropping environment less suitable for insect pests and more suitable for theirnatural enemies.
An interesting example is the push-pull strategies, which is a behavioural manip-ulation of insect pests and their natural enemies. The crop is protected by associatingit with stimuli that makes it unsuitable of unattractive (push), while luring them to anattractive source (pull) where the pest is subsequently removed (Cook et al., 2007).An example is the control of stemborers in maize and sorghum in eastern and south-ern Africa. Stemborers are repelled by non host intercrops (Molasses minutiflora,Desmodium uncinatum and D. introtum (push) and concentrated on attractive trapplants (Pennisetum purpureum and Sorghum vulgare sudanense) (pull). Molassesminutiflora at the same time increases parasitism by Cotesia flavipes and Desmod-ium suppress the parasitic weed Striga hermonthica.
Melon production in the north of Kordofan in the Sudan was in the 1990s severelyaffected by the melon bug, Aspongopus viduatus. This bug congregate and aes-tivate in large numbers from May to June. Due to a hand picking campaign inwhich in particular women and children participated more than 200 tons of bugswere collected and burned (Bashir et al., 2003). Brader (1979) also mentioned thatSpodoptera littoralis egg masses in cotton has been hand picked in Sudan since1905. He also mentioned the picking and burning of bolls infested with the pinkbollworm Pectinophora gossypiella, at the end of the growing season, to reduce itscarry-over. Heat treatment of seeds was also applied.
12.6 Institutional Constraints and Challenges
Thompson (2006) stated: ‘Much of the failure of agriculture to achieve its potentialis institutional and political. Support by the state has been unresponsive to the needsof the poor and inefficient in marketing producers’ output, sometimes preventing thenatural development of market for producers. Public institutions need to be strength-ened in their capacity to develop an appropriate blend of policies, regulatory

406 A. van Huis
Fig. 12.1 Innovation as afunction of institutional andtechnical change (Giller,2001; based on Dorwardet al., 1998)
frameworks and investments to re-launch the agricultural sector’. Figure 12.1 showsinstitutions and technology as two dimensions of innovation.
The dominant narrative in agricultural research is, after all, that science-basedtechnologies for raising farm productivity can, in principle, raise incomes the ruralpoor earn from the food they sell. In this view, innovation is seen as change alongthe horizontal axis. Cultivating a resilient, bountiful crop and managing pests maybe easier than cultivating an equally thriving market, with access to credit and dis-tribution channels. In other words, one could argue that markets, access to inputs,farmers’ political influence, etc. are the factors in the minimum. In this view, tech-nology development is hampered by institutional innovations, such as better priceswhich motivate farmers to invest in innovation on their farms, or strengtheningfarmer organizations in order to increase their political clout such that needs andopportunities of farmers are better addressed (Altieri 1989).
12.6.1 Markets
Ghana was on the way to becoming self-sufficient in rice production in the 1970sand 1980s. It was the first country where FAO started with the Farmer Field Schoolapproach (Afreh-Nuamah, 2003). However, rice growing is close to being not longerprofitable as the farmers cannot compete against the rice imported from the U.S.A.Ghana now produces a mere 150,000 tonnes of rice, or 35 percent of its domesticneed. Ghana is the largest importer of high quality American long grained rice inSub-Saharan Africa and typically the only major commercial market for USA rice inthe region (Childs and Livezey, 2006). However, the USA farmers producing the riceimported in Ghana has been subsidized for more than 50%, while the IMF structural

12 Challenges of Integrated Pest Management in Sub-Saharan Africa 407
adjustment program halted farm subsidies to Ghanaian rice farmers. According toOxfam (2005), 110.000 tonnes were imported from the USA in 2003, the importedrice displacing local Ghanaian rice. The question is whether under these conditionsit is still worthwhile to set up FFS in rice in Ghana.
With an increase in producer’s price, it may become interesting to protect thepotential yield loss by pests or diseases. For example, from 2001 to 2004 producerprice of cocoa increased in Ghana, and production increased by 80 percent duringthe same period (Dormon, 2006). This can only have been achieved by farmerspaying more attention to production issues. For example, in this period of priceincrease, Dormon et al. (2007a) was able with farmers to come to an arrangement ofreciprocal and communal labor arrangement in order to clear one farmer’s field inone day of black pods, diseased by Phytophtora palmivora and this increased yieldsthreefold. Many farmer practices are resilient and adaptable to changing conditions(Stoop and Hart, 2005).
Ayenor (2006) studying integrated pest management in cocoa in Ghana in orderto produce organic cocoa, used neem to control capsids (Myridae). However, theAmerican company that wanted to buy organic cocoa withdrew when the GhanaCocoa Board proved reluctant to cooperate in organizing certification.
12.6.2 Government Interference
In Zanzibar rainfed rice is produced on 15,000 ha on the southern island of Unguja.Rice farmers form a stable electorate for the ruling party, reason that rice growingbenefits from many types of subsidy (Bruin and Meerman, 2001, p. 95). Depen-dency on these subsidies erodes initiatives for more efficient production methods.On Pemba the northern island of Zanzibar on 600 ha irrigated rice, farmers are as-signed seasonally to 0.1 ha plots. They need to obey the directions of the Ministryotherwise they will loose the plot. They are also not allowed to switch to vegetables,which according to them is much more profitable. These government policies ofdependence do not make farmers very motivated, and hampers the FFS approach(Bruin and Meerman, 2001, p. 91).
African countries have programs to provide direct or indirect subsidized inputs,among which pesticides, as Fleischer and Waibel (2003) showed for Benin, Ghanaand Mali. It not only drains financial resources of the country but also contributesto farm inefficiency, and to a lower chance of IPM implementation. A general prob-lem is that pesticide externalities are often not monitored and not economicallyassessed.
Dormon (2006) reports from Ghana that mass spraying of all cocoa farms isorganized by the government as a way of reducing pest incidence. These campaignsare “free of charge”, although the costs are indirectly paid by farmers through thecocoa revenues received by the government. He disputes the effectiveness of suchprograms as the spraying is calendar based and not need based. Besides, sprayinggangs are used being area-based paid, causing them to rush through the farms.

408 A. van Huis
Another danger is that it discourages farmers’ innovation, because they becomeover-dependent on the government for pest and disease control. Besides, thesecampaigns will reduce the abundance of predatory ant species which have shownto be effective in controlling capsids (Ayenor et al., 2007a). Applying neem wouldbe a better combination as it does not seem to affect ant abundance.
From 1982 to 1985 the author was leading a pest management training programfor eight Sahelian countries. The focus of the training was on integrated pest man-agement options. Most of the trainees were employees of Plant Protection Divisions(PPDs) of the countries involved. However, the main task of the PPDs was not inIPM issues but in the application of pesticides. Many applications by PPDs arepolitically motivated, in particular when it concerns migratory pests. Therefore, de-cisions based on pest management rationality are often not followed. This showsthat unless IPM becomes a national strategy, the usefulness of training in IPM isquestionable.
12.6.3 Pest Management in Relation to Other Constraints
In subsistence crops, yields are often so low that saving the percentage loss by pests,does not pay, not in labor and not in costs for pesticides. As Orr (2003) states:“the main production problem facing smallholders is not crop losses from pests butlow average yields.” The marginal benefits from crop protection are often less thanthose from improved water management or increased soil fertility. In the absenceof pesticides, pests may be adequately controlled by natural mortality factors. Adisciplinary entry point when dealing with subsistence farmers without a properidentification of their needs and opportunities is a wrong approach. For examplein Zanzibar cassava farmers confronted the Plant Protection Service of Pemba whoconducted FFS that their main problem was not pests but marketing, which in thiscase was addressed.
12.6.4 FFS Abused
Nederlof and Odonkor (2006) studied a cowpea FFS project in Ghana. They showedthat farmers had predetermined ideas about the objectives of the FFS. Instead ofgrounding the curriculum in the needs and opportunities of farmers, the scientistsinvolved in the program pushed their ideas about improved varieties and pesticideuse. The curriculum was adapted by the researchers and used as a blueprint totransfer technologies ‘that work’. FFS is often wrongly considered as an extensionmethodology to push technology.
This misconception is widespread, e.g. Bunyatta et al. (2006) stating “KARI hasadopted the methodology as an up-scaling approach for its promising technolo-gies”. Isubilalu (2007) analyzed the functioning of five FFS in Uganda, dealingwith IPM in cowpea and groundnut, safe pesticide use and handling in vegetables,

12 Challenges of Integrated Pest Management in Sub-Saharan Africa 409
soil productivity improvement in maize and groundnut, and IPM and post harvestmanagement in sweet potato. It was concluded that farmers had no negotiatingpower to influence the curriculum and the decisions were made top down by donorsand researchers. She stated: “FFS is turned into a platform where researchers pro-mote their mandates and interests rather than addressing farmers’ interests.” Scien-tists for FFS focussed on low yields and pest management while farmers consideredhealth and income generating activities as more important priorities.
12.6.5 Impact FFS Questioned
FFS has been criticised for having little impact on farmers others than the directparticipants (Feder et al., 2004a,2004b). Complex pest management informationhowever does not readily diffuse among farmers as it requires experiential learning(van den Berg and Jiggins, 2007; Ayenor et al., 2007b). van den Berg and Jiggins(2007) also argue that impact cannot only be measured in yield increase. Techni-cal impact should also consider externalities of pesticide use (health costs throughpoisoning and resistance build up of malaria vectors, environmental costs by loss ofbeneficial insects). Besides there are also a number of development impacts such asexperimentation, collective action, leadership, planning and organization.
12.6.6 Insects and Diseases Not Considered a Pest
Some insect species assumed to be pests may in fact be considered a benefit. Forexample, in 1995 in Niger many grasshopper species are collected by women earlyin the morning in millet fields after which they are sold as food on the localmarket (van Huis, 2003). Apparently they earn more by selling edible grasshop-pers then by marketing their millet crop. Also, in Malawi we were informed thatwomen may prefer cassava leaves infected by Cassava Mosaic Virus because theinfected leaves taste sweeter than healthy leaves (Dr.Nzola M. Mahungu, personalcommunication).
12.6.7 Land Tenure
Cassava grown on fertile soils suffers less from Cassava Mosaic Virus. Agroforestryis often an attractive option. Spittel and van Huis (2000) demonstrated from Zanz-ibar that application of Gliricidia sepium leaves increased yields most in plantshaving highest CMD scores, and that increasing organic matter content in the soillowers CMD severity. However, the land tenure system in Zanzibar often prohibitsfarmers to grow trees as it is a covert claim to landownership (Bruin and Meerman,2001).

410 A. van Huis
12.6.8 Exploitive Networks
Sinzogan et al. (2007) reported how a large enterprise with stakes in the cotton chainand a licensed provider failed to provide the inputs necessary for a pest managementstrategy, called Lutte Etagee Cible, (targeted staggered control). This method useseconomic thresholds and reduces the amount of pesticides considerably comparedto the conventional recommendations. The non provision of the inputs forced thefarmers to resort to the conventional crop protection products. This and other meth-ods entrapped the producers in formal institutional linkages.
Dormon et al. (2007b) tackled complaints by cocoa farmers in Ghana that pur-chasing officials of the Cocoa Licensed Buying Companies were cheating them byadjusting their weighing scales. They set up a task force of relevant stakeholders andsolved the problem. Increasing their revenues in this way may also motivate farmersto invest in IPM.
12.6.9 HIV/AIDS
The ‘new variant famine’ hypothesis argues that HIV/AIDS pandemic is one majorcontributing factor for the current food insecurity in southern Africa, particularlydue to four new factors: labor shortages, asset and skill loss, increasing burden ofcare for the sick and orphans, and malnutrition (de Waal and Whiteside 2003).It also argues that the reduced farm labor is likely to be directed towards lesslabor-intensive root crops such as sweet potatoes and cassava, but compromisingnutritional value. That is because cassava is easy to grow, resilient to droughts andother harsh environments, and commands little farm inputs such as fertilisers andlabor. With HIV/AIDS as the leading cause of death in the age group 15–49 years inMalawi, cassava is for those reasons in high demand inducing widespread theft ofthe standing cassava crop. This also lead to loss of viable planting stems. Farmersthen have to resort to other means and sources of obtaining planting stems, ofteninfected by Cassava Mosaic Virus (CMV). Thus, the loss of clean planting stemsby theft aggravates the already prevalent damage by CMV in the area (Chiwona-Karltun et al., 2005)., which can compromise the yield up to 70%.
In addition, Charleston et al. (2003) indicated that many IPM practices are laborintensive and or for that reason would comprise such an approach.
12.7 Conclusions
Demand for food production in sub-Saharan Africa is expected to reach 100 US$billion by 2015, double its level of 2000 (World Bank, 2007). The question how thiscan be done in a sustainable manner? In the 1990s public spending on R&D fell innearly half of the countries in the region and as stated by the World Bank this is a

12 Challenges of Integrated Pest Management in Sub-Saharan Africa 411
risk, as Africa’s agroclimatic conditions and crops are rather unique. The question isof course where to put scarce resources in the case of pest and disease development.
Improved varieties are one of the most effective components of IPM. However,new challenges in pest and diseases will come up. For example, in 1999, high sus-ceptibility of CIMMYT germplasm to stem or black rust (Puccinia graminis triticiUG99) was noted in Uganda and an increase in stem rust incidence and severitywas seen in Kenya, although in the past 30 years genetic resistance in semidwarfwheat cultivars (Triticum aestivum tritici) was a remarkable success story (Singhet al., 2007). Progress in resistance breeding has been mostly in pest and diseaseresistance, but developing varieties that perform well under drought, heat, flood andsalinity are new challenges in the adaption to climate change.
Morse and Buhler (1997) talk about an IPM paradigm, an ideal way to deal withpests but it is very knowledge and expertise intensive. They consider IPM a creationof scientists, with the emphasis on technical excellence, reason for poor adoptionby farmers. In particular they question whether pests or diseases are a concernof the farmer. Although the FFS approach is supposed to be demand driven, thequestion is whether the choice for the issues to be tackles, e.g. soil fertility or pestmanagement, is negotiable. Choices may have been made before, without havingproperly identified the real needs and opportunities of the farmers. This could bedue to the priorities of the funding or the executing agency, the national authoritiesor the experts involved (see Schut and Sherwood, 2007). An a priori choice mayaffect the success of any IPM approach.
When IPM specialists talk about constraints of IPM, they mention of course inad-equate funding for research, but also issues as lack of collaboration between researchand extension (meaning that research results are not taken on by the farmers), lowincome of farmers who cannot afford costly inputs and the use of traditional varietieswhich result in low yields (e.g. Dakoua et al., 2003; Nyambo et al., 2003). It showsthe paradigm problem in which the conditions of the farmer are not taken as thestarting point but as a constraint. It should be realized that the farmers ultimatelyhave veto power over the recommendations proposed by scientists.
The examples of institutional constraints given above suggest that scientific andfarmers’ knowledge needs to converge and that innovations comprise a mix oftechnical, economical, social and institutional elements requiring an effective en-counter between social and biological science (Nederlof et al., 2007). The bottle-neck in agriculture is often not so much innovativeness and productivity at the farmlevel, within the existing very small windows of opportunity. The challenge is tostretch those windows in this way enlarging the space for innovations. Efforts tofoster agricultural development through technology push in absence of institutionalsupport structures will most probably fail. Institutional development arises out ofcoalitions, networks, or configurations of multiple stakeholders in agricultural in-novation across multiple scales. Institutional development allows them to act inconcert with respect to fostering conditions for growth. This requires investmentin experimentation with, learning in, and capacity building of innovation systemsat the international, national and local levels, involving agricultural research organ-isations, universities, farmers’ organisations, parastatals, private companies, NGOs

412 A. van Huis
and donors. This concept of enhancing agricultural innovation systems is largelyunexplored (World Bank, 2007). FFS emphasized farmer empowerment, but theabove examples show that the range of stakeholders need to be broadened alongproduction chains and institutions involved.
References
Abate, T., van Huis, A. and Ampofo, J.K.O. 2000. Pest management strategies in traditional agri-culture: An african perspective. Annual Review of Entomology 45:631–659.
Abdelrahman, A.A. and Munir, B. 1989. Sudanese experience of integrated pest management ofcotton. Insect Science and its Application 10:787–794.
Afreh-Nuamah, K. 2003. Ghana national integrated pest management program. In: Maredia, K.M.,Dakouo, D. and Mota-Sanchez, D. (eds), Integrated Pest Management in the Global Arena.CAB International, London, pp. 119–129.
Altieri, M.A. 1989. Agroecology: A new research and development paradigm for world agriculture.Agriculture, Ecosystems and Environment 27:37–46.
Anonymous, 2006. The importance of cotton in Africa. Remarks prepared for delivery at aconference organized by the Woodrow Wilson Center, the International Food & Agricul-tural Trade Policy Council and the IDEA Centre on Cotton – The Next Steps for Africa,October 26, 2006, Washington, DC. International Cotton Advisory Committee, Washington.http://www.agritrade.org/events/speeches/CottonConference/Townsend.pdf
Atteh, O.D. 1984. Nigerian farmers’ perception of pests and pesticides. Insect Science and ItsApplication 5:213–220.
Ayenor, G.K. 2006. Capsid Control for Organic Cocoa in Ghana: Results of Participatory Learn-ing and Action Research. Wageningen University dissertations, Wageningen, The Netherlands.
Ayenor, G.K., van Huis, A., Obeng-Ofori, D., Padi, B. and Roling, N.G. 2007a. Facilitating theuse of alternative capsids control methods towards sustainable production of organic cocoa inGhana. International Journal of Tropical Insect Science 27:85–94.
Ayenor, G.K., Roling N.G., van Huis, A., Padi, B. and Obeng-Ofori, D. 2007b. Assessing theeffectiveness of Local Agricultural Research Committee in diffusing sustainable cocoa pro-duction practices: the case of capsid control in Ghana. International Journal of AgriculturalSustainability 5:109–123.
Bashir, Y.G.A., Elamin, E.M. and Elamin E.M. 2003. Development and implementation of in-tegrated pest management in the Sudan. In: Maredia, K.M., Dakouo, D. and Mota-Sanchez,D. (eds), Integrated Pest Management in the Global Arena. CAB International, London.pp. 131–143.
Berg, H. van den and Jiggins, J. 2007. Investing in farmers – The impacts of Farmer Field Schoolsin relation to integrated pest management. World Development 35:663–686.
Brader, L. 1979. Integrated pest management in the developing world. Annual Review of Entomol-ogy 24:225–254.
Brown, E.S. and Mohamed, A.K.A. 1972. The relation between simulated armyworm damage andcrop loss in maize and sorghum. East African Agricultural and Forestry Journal 37:237–257.
Bruin, G.C.A. and Meerman, F. 2001. New Ways of Developing Agricultural Technologies: TheZanzibar Experience with Participatory Integrated Pest Management. Wageningen Universityand Research Centre/CTA, Wageningen, The Netherlands.
Bunyatta, D.K., Mureithi, J.G., Onyango, C.A. and Ngesa, F.U. 2006. Farmer Field School ef-fectiveness for soil and crop management technologies in Kenya. Journal of InternationalAgricultural and Extension Education 13(3):47–63.
Caldas, T. 1997. Organic cotton: Not just a matter of fibre. IATP Organic Cotton Monitor 3:3.Charleston, D.S., Kfir, R., Rensburg, N.J. van, Barnes, B.N., Hattingh, V., Conlong, D.E., Visser,
D. and Prinsloo, G.J. 2003. Integrated pest management in South Africa. In: Maredia, K.M.,

12 Challenges of Integrated Pest Management in Sub-Saharan Africa 413
Dakouo, D. and Mota-Sanchez, D. (eds), Integrated Pest Management in the Global Arena.CAB International, London, pp. 169–195.
Childs, N. and Livezey, J. 2006. Rice backgrounder. Outlook Report from the Economic ResearchService, United States Department of Agriculture. RCS-2006–01.
Chiwona-Karltun, L., Kambewa, P., Yajima, M., Mahungu, N.M. and Jiggins, J. 2005. Market-Oriented Responses among Cassava Farmers in Domasi, Malawi. HIV/AIDS & Food and Nutri-tion Security: from evidence to action. IFPRI International Conference, Durban - South Africa.14–16 April, 2005.
Cook, S.M., Khan, Z.R. and Pickett, J.A. 2007. The use of push-pull strategies in integrated pestmanagement. Annual Review of Entomology 52:375–400.
Croft, B.A. and Strickler, K. 1983. Natural enemy resistance to pesticides: Documentation, char-acterization, theory and application. In: Georghiou, G.P. and Saito, T. (eds), Pest Resistance toPesticides. Plenum Press, New York, pp. 669–702.
Dakoua, D., Bonzi, M.S., Sawasogo, A., Dabire, C.L., Nacro, S. and Thio, B. 2003. Integrated pestmanagement in Burkina Faso. In: Maredia, K.M., Dakouo, D. and Mota-Sanchez, D. (eds),Integrated Pest Management in the Global Arena, CAB International, London, pp. 109–118.
D’Almeida, Y.A., Lys, J.A., Neuenschwander, P. and Ajuonu, O. 1998. Impact of two accidentallyintroduced Encarsia Species (Hymenoptera: Aphelinidae) and other biotic and abiotic factorson the Spiralling whitefly Aleurodicus dispersus (Russell) (Homoptera: Aleyrodidae), in Benin,West Africa. Biocontrol Science and Technology 8:163–173.
Dormon, E.N.A. 2006. From a Technology Focus to Innovation Development. The Management ofCocoa Pests and Diseases in Ghana. Wageningen University dissertations, Wageningen, TheNetherlands.
Dormon, E.N.A., van Huis, A. and Leeuwis, C. 2007a. Effectiveness and profitability of integratedpest management for improving yield on smallholder cocoa farms in Ghana. International Jour-nal of Tropical Insect Science 27:27–39.
Dormon, E.N.A., Leeuwis, C., Fiadjoe, F.Y., Sakyi-Dawson, O. and van Huis, A. 2007b. Creatingspace for innovation: The case of cocoa production in the Suhum-Kraboa-Coalter District ofGhana. International Journal of Agricultural Sustainability 5:232–246.
Dorward A., Kydd, J. and Poulton, C. (eds), Smallholder Cash Crop Production under MarketLiberalisation: A New Institutional Economics Perspective, Wallingford, CABI, 1998.
Drew, R.A.I., Tsuruta, K. and White, I.M. 2005. A new species of pest fruit fly (Diptera: Tephriti-dae: Dacinae) from Sri Lanka and Africa. African Entomology 13:149–154.
Eveleens, K.G. 1983. Cotton-insect control in the Sudan Gezira: Analysis of a crisis. Crop Protec-tion 2:273–287.
FAO, 1998. FAO/EMPRES Workshop on Economics in Desert Locust management, Cairo, Septem-ber 1997, and Economics and Policy Issues in Desert Locust Management: A Preliminary Anal-ysis (by Steen Joffe). FAO/AGP/DL/TS/27, Food and Agriculture Organization of the UnitedNations, Rome, Italy.
FAO, 2004. FAO Warns of Pesticide Waste Time Bomb in Poor Countries. FAO newsroom, 9September 2004. Food and Agriculture Organization of the United Nations, Rome, Italy.
FAOSTAT, 2007. http://faostat.fao.org/site/291/default.aspx. Food and Agriculture Organization ofthe United Nations, Rome.
Feder, G., Murgai, R. and Quizon, J.B. 2004a. Sending farmers back to school: The impact offarmer field schools in Indonesia. Review of Agricultural Economics 26:45–62.
Feder, G., Murgai, R. and Quizon, J.B. 2004b. The acquisition and diffusion of knowledge: Thecase of pest management training in farmer field schools, Indonesia. Journal of AgriculturalEconomics 55:221–243.
Fleischer, G. and Waibel, H. 2003. Pesticide policy and integrated pest management. In: Maredia,K.M., Dakouo, D. and Mota-Sanchez, D. (eds), Integrated Pest Management in the GlobalArena, CAB International, London, pp. 49–63.
Foster, A.D. and Rosenzweig, M.R. 2004. Agricultural productivity growth, rural economic diver-sity, and economic reforms: India, 1970–2000. Economic Development and Cultural Change52(3):509–542.

414 A. van Huis
Furtado, I.P., Moraes, G.J. de, Kreiter, S. and Knapp, M. 2006. Search for effective natural ene-mies of Tetranychus evansi in south and southeast Brazil. Experimental and Applied Acarology40:157–174.
Giller, K.E. 2001. Nitrogen Fixation in Tropical Cropping Systems, 2nd edition. CAB International,Wallingford, p. 306.
Groot, A.B.A. de. 1995. The functioning and sustainability of village crop protection brigades inNiger. International Journal of Pest Management 41:243–248.
Gruys, P. 1991. Grasshopper and locust campaigns 1986–89 and FAO’s role: a review. Unpublishedreport FAO-AGPP, Rome, Italy.
Hamburg, H. van and Guest, P.J. 1997. The impact of insecticides on beneficial arthropods in cottonagro-ecosystems in South Africa. Archives of Environmental Contamination and Toxicology32:63–68.
Heinrichs, E.A. and Mochida, O. 1984. From secondary to major pest status: the case ofinsecticide-induced rice brown planthopper Nilaparvata lugens, resurgence. Protection Ecol-ogy 7(2& 3):201–218.
Herok, C.A. and Krall, S. 1995. Economics of Desert Locust control. GTZ, Rossdorf, TZ-Verl.-Ges., Germany.
Hicks D.R., Nelson, W.W. and Ford, J.H. 1977. Defoliation effects on corn hybrids adapted to theNorthern Corn Belt. Agronomy Journal 69:387–390.
Hillocks, R.J. 2005. Is there a role for Bt cotton in IPM for smallholders in Africa. InternationalJournal of Pest Management 51:131–141.
Hofsa, J-L., Fok, M. and Vaissayre, M. 2006. Impact of Bt cotton adoption on pesticide use bysmallholders: A 2-year survey in Makhatini Flats (South Africa). Crop Protection 25:984–988.
Huis, A. van. 2003. Insects as food in sub-Saharan Africa. Insect Science and its Application23(3):163–185.
Huis, A. van, Jiggins, J., Kossou, D., Leeuwis, C., Roling, N., Sakyi-Dawson, O., Struik, P.C. andTossou, R.C. 2007a. Can convergence of agricultural sciences support innovation by resource-poor farmers in Africa: the cases of Benin and Ghana. International Journal of AgriculturalSustainability 5(2&3):91–108.
Huis, A. van, Cressman, K. and Magor, J.I. 2007b. Preventing desert locust plagues: Optimizingmanagement interventions. Entomologia Experimentalis et Applicata 122:191–214.
Huis, A. van and Meerman F. 1997. Can we make IPM work for resource-poor farmers in sub-Saharan Africa? International Journal of Pest Management 43(4):313–320.
Huis, A. van. 2007. Strategies to control the Desert Locust Schistocerca gregaria. In: Vreysen,M.J.B., Robinson., A.S. and Hendrichs J. (eds), Area-Wide Control of Insect Pests: From Re-search to Field Implementation. Springer, Dordrecht, The Netherlands, pp. 285–296.
Ignoffo, C.M., Hostetter, D.L., Garcia, C. and Pinnell, R.E. 1975. Sensitivity of the ento-mopathogenic fungus Nomuraea rileyi to chemical pesticides used on soybeans. EnvironmentalEntomology 4:765–768.
Isubilalu, P. 2007. Stepping-Stones to Improve upon Functioning of Participatory Agricultural Ex-tension Programmes: Farmer Field Schools in Uganda. Wageningen University dissertations,Wageningen, the Netherlands.
Ivie, M.A, Pollock, D.A., Gustafson, D.L., Rasolomandimby, J., Ivie, L.L. and Swearingen,W.D. 2002. Field-based evaluation of biopesticide impacts on native biodiversity: MalagasyColeoptera and anti-locust entomopathogenic fungi. Journal of Economic Entomology 95:651–660.
Jago, N.D., Kremer, A.R. and West, C. 1993. Pesticides on millet in Mali. NRI Bulletin 50,Chatham, U.K. Natural Resources Institute.
Kipkoech, A.K., Schulthess, F., Yabann, W.K., Maritim, H.K. and Mithofer, D. 2006. Biologicalcontrol of cereal stem borers in Kenya: A cost benefit approach. Annales de la Societe Ento-mologique de France 42(3–4):519–528.
Kogan, M. 1998. Integrated pest management: Historical perspectives and contemporary develop-ments. Annual Review of Entomology 43:243–270.
12 Challenges of Integrated Pest Management in Sub-Saharan Africa 415
LeCoq, M. 2001. Recent progress in Desert and Migratory Locust management in Africa. Arepreventive actions possible? Journal of Orthoptera Research 10:277–291.
Lenne, J. and Chancellor, T. 2007. Centre Commissioned External Review of the SystemwideProgramme on Integrated Pest Management. International Institute of Tropical Agriculture.http://www.spipm.cgiar.org/PDFs/SPIPM.%202007%20CCER%20report.pdf
Lockwood, J.A., Showler, A.T. and Latchininsky, A.V. 2001. Can we make locust and grasshoppermanagement sustainable? Journal of Orthoptera Research 10:315–329.
Lomer, C.J., Bateman, R.P., Johnson, D.L., Langewald, J. and Thomas, M. 2001. Biological controlof locusts and grasshoppers. Annual Review of Entomology 46:667–702.
Martin, T., Chandre, F., Ochou, O.G., Vaissayre, M. and Fournier, D. 2002. Pyrethroid resistancemechanisms in the cotton bollworm Helicoverpa armigera (Lepidoptera: Noctuidae) from WestAfrica. Pesticide Biochemistry and Physiology 74:17–26.
Matteson, P.C. 2000. Insect pest management in tropical Asian irrigated rice. Annual Review ofEntomology 45:549–574.
McCulloch, N., Weisbrod, J. and Timmer, C.P. 2007. Pathways Out of Poverty During an EconomicCrisis: An Empirical Assessment of Rural Indonesia. World Bank. Washington, DC.
McNeely, J.A., Mooney, H.A., Neville, L.E., Schei, P. and Waage, J.K. (eds), 2001. A Global Strat-egy on Invasive Alien Species. IUCN Gland, Switzerland, and Cambridge, United Kingdom.
Milner, R.J. and Hunter, D.M. 2001. Recent developments in the use of fungi as biopesticidesagainst locusts and grasshoppers in Australia. Journal of Orthoptera Research 10:271–276.
Morse, S. and Buhler, W. 1997. IPM in developing countries: The danger of an ideal. IntegratedPest Management Reviews 2:175–185.
Nederlof E.S., Roling, N. and van Huis, A. 2007. Pathway for agricultural science impact in WestAfrica: lessons from the Convergence of Sciences programme. International Journal of Agri-cultural Sustainability 5:247–264.
Nederlof, E.S. and Odonkor, E.N. 2006. Lessons from an experiential learning process: The caseof cowpea Farmer Field Schools in Ghana. Journal of Agricultural Education and Extension12:249–271.
Neuenschwander, P. 2001. Control of the Cassava Mealybug in Africa: A review. Biological Con-trol 21:214–229.
Neuenschwander, P. 2004. Harnessing nature in Africa: Biological pest control can benefit thepocket, health, and the environment. Nature 432:801–802.
Nkunika, P.O.Y. 2002. Smallholders farmers’ integration of indigenous technical knowledge (ITK)in maize IPM: a case study in Zambia. Insect Science and Its Application 22:235–240.
Nyambo, B.T., Varela, A.M., Seguni, Z. and Kirenga, G. 2003. Integrated pest management inTanzania. In: Maredia, K.M., Dakouo, D. and Mota-Sanchez, D. (eds), Integrated Pest Man-agement in the Global Arena, CAB International, London, pp. 1145–1155.
Orr, A. 2003. Integrated pest management for resource-poor African farmers: Is the emperornaked? World Development 31:831–845.
Overholt, W.A., Ngi-Song, A.J., Omwega, C.O., Kimani-Njogu, S.W., Mbapila, J., Sallam, M.N.and Ofomata, V. 1997. A review of the introduction and establishment of Cotesia flavipesCameron (Hymenoptera: Braconidae) in East Africa for biological control of cereal stemborers.Insect Science and Its Application 17:79–88.
Oxfam, 2005. Truth or consequences: Why the EU and the USA must reform their subsidies, orpay the price. Oxfam Briefing Paper 82.
PAN, 2001. The Pesticide Syndrome: Pesticide Use by African Smallholders. Pesticide Action Net-work, London.
Perkins, J.H. 1982. Insects, Experts and the Insecticide Crisis: The Quest for New Pest Manage-ment Strategies. Plenum Press, New York.
Prudent, P., Loko, S., Deybe, D. and Vaissayre, M. 2006. Factors limiting the adoption of IPMpractices by cotton farmers in Benin: A participatory approach. Experimental Agriculture 43:113–124.
416 A. van Huis
Reynolds, H.T., Adkisson, P.L., Smith, R.F. and Frisbie, R.E. 1982. Cotton insect pest management.In: Metcalf, R.L. and Luckmann, W.H. (eds), Introduction to Insect Pest Management. Wiley,New York, pp. 375–441.
Schneider, H., Borgemeister, C., Setamou, M., Affognon, H., Bell, A., Zweigert, M.E., Poehling,H.-M. and Schulthess, F. 2004. Impact assessment of Teretrius nigrescens Lewis (Coleoptera:Histeridae), an introduced predator of the larger grain borer Prostephanus truncatus (Horn)(Coleoptera: Bostrichidae) in Togo and Benin. Biological Control 30:241–255.
Schut, M. and Sherwood, S. 2007. FFSs in translation: Scaling up in name, but not in meaning.LEISA Magazine 23:28–29.
Simpson, B.M. and Owens, M. 2002. Farmer Field Schools and the Future of Agricultural Exten-sion in Africa. Sustainable development dimensions’. Rome: FAO, Sustainable DevelopmentDepartment. www.fao.org/sd/2002/KN0702 en.htm
Singh, R.P., Kinyua, M.G., R. Wanyera, R., Njau, P., Jin, Y. and Huerta-Espino, J. 2007. Spread of ahighly virulent race of Puccinia graminis tritici in eastern Africa: Challenges and opportunities.In: Buck, H.T., Nisi, J.E. and Salomon, N. (eds), Wheat Production in Stressed Environments.Developments in Plant Breeding Springer. 12, pp. 51–57.
Sinzogan, A.A.C., Jiggins, J., Vodouhe, S., Kossou, D.K., Totin, E. and van Huis, A. 2007. Ananalysis of the organizational linkages in the cotton industry in Benin. International Journal ofAgricultural Sustainability 5:213–231.
Spittel, M.C. and van Huis, A. 2000. Effect of cassava mosaic disease, soil fertility, plant spacingand their interactions on cassava yields in Zanzibar. International Journal of Pest Management46:187–193.
Stoop, W.A. and Hart, T. 2005. Research and development towards sustainable agriculture byresource-poor farmers in Sub-Saharan Africa: Some strategic and organisational considerationsin linking farmer practical needs with policies and scientific theories. International Journal ofAgricultural Sustainability 3:206–216.
Theiling, K.M. and Croft, B.A. 1989. Toxicity, selectivity and sublethal effects of pesticides onarthropod natural enemies: A database summary. In: Jepson, P.C. (ed), Pesticides and Non-target Invertebrates. Intercept, Wimbourne, United Kingdom, pp. 213–232.
Thompson, J. 2006. The dynamics of changing rural worlds: Balancing income generation andhousehold and community food security in an era of growing risk and uncertainty. DiscussionPaper prepared for the Working Group on Balancing (Income Generation and Household andCommunity Food Security at the Global Forum on Agricultural Research (GFAR), 3rd Trien-nial Conference ‘Reorienting Agricultural Research to Achieve the MDGs’, 8–11 November2006, New Delhi, India.
Toenniessen, G.H., O’Tooley, J.C. and DeVriesz, J. 2003. Advances in plant biotechnology and itsadoption in developing countries. Current Opinion in Plant Biology 6:191–198.
UN 2007. World Population Prospects: the 2006 Revision. Population Division, Department ofEconomic and Social Affairs. Report no.: ST/ESA/SER.A/261/ES. New York: United Nations.
Uvarov, B.P. 1953. International war on locusts. British Agricultural Bulletin 6:85–92.Van Mele, P., Vayssieres, J.-F., van Tellingen, E. and Vrolijks, J. 2007. Effects of an African weaver
ant, Oecophylla longinoda, in controlling mango fruit flies (Diptera: Tephritidae) in Benin.Journal of Economic Entomology 100:695–701.
Van Mele, P. 2008. A historical review of research on the weaver ant Oecophylla in biologicalcontrol. Agricultural and Forest Entomology 10:13–22.
Waage, J.K. 1989. The population ecology of pest – pesticide – natural enemy interactions. In: Jep-son P.C. (ed), Pesticides and Non-target Invertebrates. Intercept, Wimbourne, United Kingdom,pp. 81–93.
Waage, J.K. 1991. Biodiversity as a resource for biological control. In: Hawksworth, D.L. (ed), Thebiodiversity of microorganisms and inverterbrates. Wallingford, CAB. International, UnitedKingdom, pp. 149–163.
Waal, A. de and A. Whiteside (2003). New variant famine: AIDS and food crisis in southern Africa.The Lancet 362(9391):1234–1237.

12 Challenges of Integrated Pest Management in Sub-Saharan Africa 417
Williamson, S. 2005. Breaking the barriers to IPM in Africa: Evidence from Benin, Ethiopia,Ghana and Senegal. In: Pretty, J. (ed), The Pesticide Detox: Towards a Sustainable Agriculture.Earthscan, London, pp. 165–180.
World Bank, 2007. World Development Report 2008: Agriculture for Development. The Interna-tional Bank for Reconstruction and Development & The World Bank, Washington.
Zannou, A., Tossou, R.C., Vodouhe, S., Richards, P., Struik, P.C., Zoundjihekpon, J., Ahanchede,A. and Agbo, V. 2007. Socio-cultural factors influencing and maintaining yam and cowpeadiversity in Benin. International Journal of Agricultural Sustainability 5:140–160.
Zethner, O. 1995. Practice of integrated pest management in tropical and sub-tropical Africa: Anoverview of two decades (1970–1990). In: Mengech, A.N., Saxena, K.N. and Gopalan, H.N.B.(eds), Integrated Pest Management in the Tropics: Current Status and Future Prospects. JohnWiley & Sons, Chichester, pp. 1–67.

Chapter 13Evaluating Dissemination and Impact of IPM:Lessons from Case Studies of Potatoand Sweetpotato IPM in Peru and OtherLatin American Countries
Oscar Ortiz, Jurgen Kroschel, Jesus Alcazar, Ricardo Orregoand Willy Pradel
Abstract Integrated Pest Management (IPM) programs have been implemented inLatin American for several decades. Examples in the case of Peru include the suc-cessful IPM programs for cotton, citrus, olives, sugar cane and potatoes. However,impact assessment of such programs has not been common. Most of the IPM pro-grams, except the potato case, did not include formal impact assessments neitherefforts to document lessons about program implementation and methods used. Thispaper presents a historical analysis of potato IPM implementation in Peru in whichthe International Potato Center took part. The analysis is complemented with IPMcases on potato and sweetpotato from other Latin American countries, which en-abled the extraction of factors that influence implementation and impact of IPM. Theanalysis indicates that IPM to become a reality at field level needs the coexistenceof sound technical knowledge and solutions, inter-institutional cooperation mecha-nisms, collective action of farming communities and an enabling political environ-ment, which is not common in most Latin American countries.
Keywords IPM · impact · potatoes · sweetpotatoes · Peru
13.1 Introduction
Integrated Pest Management (IPM) programs have been implemented in LatinAmerica for several decades. Examples in the case of Peru include the successfulIPM programs for cotton, citrus, olives, sugar cane and potatoes (Palacios et al.,
O. Ortiz (B)International Potato Center (CIP), Integrated Crop Management Division,Apartado 1558, Lima 12, Perue-mail: [email protected]
R. Peshin, A.K. Dhawan (eds.), Integrated Pest Management: Disseminationand Impact, DOI 10.1007/978-1-4020-8990-9 13,C© Springer Science+Business Media B.V. 2009
419

420 O. Ortiz et al.
2003). The content of these programs was based on results of IPM research activ-ities mainly conducted on the entomology and agronomy disciplines, which weredisseminated to farmers through the public extension systems that existed until the1980s. Although, publications describe successful implementation of IPM, therehave not been specific studies for assessing the impact of this technology prior tothe 1980s. It was in the 1980s that other disciplines such as anthropology, economicsand extension sciences began to look at IPM from a different angle, particularly atthe International Potato Center (CIP). Since the mid 1980s, different socioeconomicstudies have been conducted to assess, for example, farmers perceptions about pestcontrol, cost-benefit analysis of pest control methods, and more recently the impactof IPM, which focused mainly on the economic benefits of this technology, butlater focusing on impacts on other aspects of the farmer livelihood systems, such ashuman, social, and natural capitals.
This paper aims at analyzing IPM implementation with a human dimension, byextracting lessons from the socioeconomic and impact oriented studies of IPM, tak-ing Peru, and particularly the potato crop, as a case study, but also using examplesof other crops in other Latin American countries.
13.2 Potato IPM in Peru and Examples from Other LatinAmerican Countries
The evolution of pest control in Peru, taking the example of the potato crop, isdescribed by Ortiz (2006), who identifies some clear stages in the historical evo-lution of pest control; for example, prior to 1532, during the Inca Empire, a wellorganized agricultural system existed and pest populations were regulated mainlyby crop rotation using the “sectorial fallowing system” which consisted of rotat-ing crops on a communal basis, meaning that all farmers in a community agreedto plant one single crop (i.e. potatoes) in a sector of the community, and then allmoved to another sector, in which potatoes had a 7-year rotation period (Hastorf,1993; Zimmerer, 1991). However, during the Colonial era, between 1532 and 1821,the whole agricultural system began to be disrupted; particularly rotational periodswere reduced, which did not allow the fields in the high Andes to recover in termsof fertility and soil health. During the first century of the Republican era, between1821 and 1930s, the disruption of the systems continued and potato pests increased.It was in the 1950s when pesticides were introduced to the potato systems, and theiruse has been growing ever since. As a response, potato IPM programs, particularlyto control the Andean potato weevil (Premnotrypes spp.) and the potato tuber moths(Symmetrischema tangolias and Phthorimaea operculella) began to be tested infarmer fields in the late 1980s, and these programs have been growing through inter-institutional collaboration. Potato IPM was promoted by the International PotatoCenter (CIP) and the National Agricultural Research Institute (INIA) of Peru (CIP,1995). CIP also launched sweetpotato IPM programs in Central America. Alvarez

13 Evaluating Dissemination and Impact of IPM 421
et al. (1996) described the impact of IPM for controlling the sweetpotato wee-vil (Cylas formicarius) in Dominican Republic, which was based on the use ofsex pheromones as attractants and the appropriate use of pesticides. Maza et al.(2000) and Cisneros and Alcazar (2001) described another interesting case of sweet-potato IPM in Cuba, where the program was based on a combination of pheromoneuse, biological control with the fungus Beauveria bassiana and the predatory ants(Pheidole megacephala and Tetramorium guineense) as well as different culturalpractices.
Potato IPM programs were also implemented in Bolivia and Ecuador throughcollaborative agreements between CIP and the National Agricultural Research In-stitute (INIAP) in Ecuador and with the Potato Research Program (PROINPA) inBolivia. In both cases, the national research institutes adapted IPM practices to con-trol the Andean potato weevil and the potato tuber moths developed by CIP in Peruto their local conditions.
Potato IPM has not been the first example of using this technology in the Pe-ruvian agricultural systems. Palacios et al. (2003) presented a comprehensive de-scription of the IPM evolution in Peru indicating that it was in the 1937 whena program of classic biological control in olives was implemented to control theblack scale (Saissetia oleae), which lasted about 17 years. Valdiviezo (1998) evenreported earlier attempts to introduce beneficial insects in 1904 to Peru. Later, inthe 1940s, a successful biocontrol program for the sugar cane borer (Diatraea sac-charalis) was implemented. The introduction of an exotic parasitoid failed but in-undative releases of Paratheresia claripalpis reduced damage by 83% due to highparasitism (88%). This program was significantly impaired because of new poli-cies during the Agrarian Reform in the 1970s. In the 1950s, and in response toproblems caused by the indiscriminate use of pesticides in cotton, which accord-ing to Daily (1997) reached up to 21 sprays per season, a private farmer organi-zation (Farmers’ Association of the Canete Valley, located in the Peruvian Cen-tral Coast) organized an IPM program to reduce the use of highly toxic pesticidesthrough the implementation of improved cultural practices, pheromone, biologicalcontrol applying inundative releases of the egg parasitoid Trichogrammatoidae bac-trae to control the Indian pink bollworm (Pectinophora gossypiella), one of themajor cotton pests and others. The number of sprays dropped to about 2 per sea-son. The control measures have continued since then with some variations, but ingeneral following the same principles. The applied control measures against theIndian pink bollworm reduced by 70% the use of pesticides (Castro et al., 1997),or when focusing on organic production reduced production costs by 50% (VanElzakker, 1999). There was also the case of IPM for citrus, which was implementedin the 1960s, basically focusing on the successful introduction of biological controlagents.
As indicated, biological control agents to control insect pests in several crops,particularly in citrus, cotton, and sugar cane, were introduced to Peru since 1904.Valdiviezo (1998) lists the introduction of a total of 98 beneficial species during

422 O. Ortiz et al.
the period of 1904–1998. Studies indicated that 29 species have established, and13 species controlled completely 11 pests. The economic benefit of 10 beneficialspecies for controlling 9 pests was calculated to amount to US$ 39 millions annuallyfor pesticide savings. Some examples of successful introductions include the speciesAphelinus mali to control aphids in apple (Eriosoma lanigerum), Rodolia cardinalsto control cottony cushion scale Icerya purchasi in fruit trees, wasp species (Scutel-lista cyanea, Metaphycus lounsburyi and Lecaniobius utilis) that were efficientto control black scale Saissetia oleae in olive trees, and wasps of the genus Tri-chogramma to control the sugar cane borer Diatraea sacharalis.
The common feature of these IPM programs was that they were implementedin relatively high value industrial or export crops. In the early 1990s, IPM forpotato pest management was introduced to Andean communities through inter-institutional cooperation. Fano et al. (1996) describe the collaborative activitiesbetween the CIP and extension organizations as an alternative way to facilitatefarmers’ access to information and technologies. Since 1992, CIP has establishedseveral contacts with NGOs in order to disseminate its research results to resource-poor farmers in the Peruvian Andes. For example, a collaborative project was im-plemented between CARE-Peru and CIP in order to train farmers in IPM (Chiriet al., 1996; Ortiz, 1997). However, this effort gave priority to the technical aspectsof IPM, and paid little attention to the use of participatory methods for trainingfarmers.
Between 1995 and 2000, an inter-institutional potato IPM program took placewith the participation of CARE-Peru, Ministry of Agriculture, CIP and the financialsupport of the United States Agency for International Development (USAID). Thisprogram aimed at the dissemination of potato IPM to Andean communities in largescale, taking advantage of the decentralized extension network of the National Pro-gram for Soil Conservation (PRONAMACHS) from the Ministry. Several courses,manuals and farmer training activities were conducted, focusing on a conventionalextension approach. However, there is no evidence about the number of farmers thatwere reached through this program.
In 1998, CIP began to implement integrated disease management against potatolate blight (Phytophthora infestans) using participatory research and training meth-ods, such as the farmer field school (FFS) approach (Nelson et al., 2001; Ortiz et al.,2004). This experience showed that working with knowledge-intensive technolo-gies such as IPM required methods that facilitated farmers’ learning process. In1997, CARE-Peru and CIP initiated the testing and dissemination of participatoryresearch and training approaches based on the FFS experience (Nelson et al., 2001),which put emphasis on adapting a participatory method to help farmers under-standing complex biophysical principles involved in pest control, moving beyondtechnology or information transfer to promoting hands-on learning for improvingdecision-making. FFS was shown to be an effective way to enhance informationexchange, learning, and the adoption of IPM. Farmers learned complex conceptsmore efficiently than with alternative extension approaches, and new knowledgewas associated with increase in productivity (Godtland et al., 2004; Ortiz et al.,2004).

13 Evaluating Dissemination and Impact of IPM 423
In recent years, institutions such as NGOs have been promoting an approachcalled ecological pest management (EPM), which derives from IPM, and empha-sizes the use of botanical insecticides, beneficial insects and entomopathogens incrops such as potato, beans, onions, cotton and vegetables (Arning and Lizarraga,1999). This approach has been promoted actively by the “Red de Accion enAternativas al uso de Agroquımicos – Raaa” (Action Network for Alternativesto the Use of Pesticides) through training, research, promotion and the forma-tion of micro enterprises for the production and marketing of IPM-related in-puts. A combination of different means for information delivery, such as courses,seminars, demonstration plots, publications and radio programs was used reach-ing about 6,000 beneficiaries between 1991 and 1995 (Hollands and Lizarraga,1998). However, there is no evidence in the literature about the impact of theseprograms.
Chavez-Tafur et al. (2003) indicated that there has been a movement towardsecological organic agriculture in Peru, resulting in the formation of a national associ-ation of ecological producers, which included farmer organizations and institutions,providing certifications for this type of agriculture. This factor has resulted in arenewed interest in IPM, particularly when associated to crops for specific organicmarkets.
More recently, FAO coordinated an inter-institutional IPM program using theFFS approach building upon CIP and CARE previous experience (Nelson et al.,2001; Ortiz et al., 2004). This project was implemented between 2001 and 2003with the participation of governmental institutions such as the National Insti-tute of Agricultural Research (INIA), the National Agricultural Sanitation Ser-vice (SENASA), La Molina University, and several NGOs. In an initial phase,the project included potato IPM in the Peruvian Highlands, and cotton IPM inthe coastal region. Later, other crops such as coffee, citrus, peanuts, maize, bean,banana, aromatic herbs, vegetables, and also some cases of integrated manage-ment of livestock pests were included. A total of 200 FFS were implementedin 2002 and 2003 generating benefits for farmers in terms of accessing informa-tion and knowledge about pest biology and ecology and control methods. In ad-dition, farmers learned to experiment with pest control methods on their farms.Some lessons learned indicate that IPM implementation is not only about thetechnical content, but also the appropriate way of delivering information. This re-quires adequate participatory research and training methods that supports farmerunderstanding of complex concepts related to pest control (Groeneweg et al.,2004).
The participation of farmers in adapting IPM has been essential because of thehigh variability of agro-ecosystems existing in the Peruvian territory, particularly inthe Andean region. This is particularly important when dealing with pests, which arehighly influenced by the environment, such as potato late blight that is influenced byrelative humidity and temperature. Therefore, technologies that work for a farmer inone location may be different for other farmers located at higher or lower altitude,and that is why farmer opinion and contribution with their local knowledge abouttheir conditions is essential to adapt IPM.

424 O. Ortiz et al.
13.3 Potato and Sweetpotato IPM Implementationand Dissemination. Cases from Latin America
13.3.1 Technology Transfer Phase: The Pilot Area Approach
CIP in collaboration with INIA initiated the implementation of potato IPM programsin the late 1980s. The approach used by researchers and extension workers in theearly 1990s was called IPM pilot units, which were implemented at communitylevel (Cisneros, 1999). The first pilot unit was located in the Peruvian Southernhighlands, in a community called Chincheros. The idea was to evaluate the effectof different control practices against the Andean potato weevil. About 60 farmerswere involved during 3 years and the records indicated a decrease of the weevildamage to harvested tubers from originally 31% to 11% (Ortiz et al., 1996). Therewere other pilot units within Peru in the Central and Northern highlands, wherefarmers had access to information directly from researchers (Ortiz, 1997). Othercases of pilot units were built up in Ecuador, Bolivia, Dominican Republic andCuba. The main characteristics of the pilot units were that an agronomist trainedon pest control was permanently presented in the communities, who was in chargeof assessing farmer practices, IPM training and gathering farmers’ opinions aboutthe new IPM technologies. Researchers frequently visited pilot units to conductpest-related research. Extension workers received IPM training too, but were nottrained on how to teach IPM to farmers. As a result, extension workers were veryactive trying to develop training approaches using their own creativity (Ortiz, 1997,2006), which included visits to fields to see over wintering places for insects, vi-sual aids to explain insect life cycles, dramas and games to explain insect behavior,which took considerable time. The experience demonstrated that prioritizing thetechnical IPM component was not sufficient. The technology required appropri-ate methods to facilitate learning and dissemination, so that farmers could acquiretimely information and knowledge; finally these were essential elements for theadoption of IPM. At that time a clear demand for IPM-related training methodsbegan to be expressed among participating institutions (Ortiz et al., 1997; Ortiz,2001).
Impact assessment of the pilot unit approach was conducted using an economicapproach consisting on estimating the net benefit of IPM at field level, taking sam-ples of farmers fields and assessing insect damage at harvest time, the rate of adop-tion and comparing costs and benefits of the program using the internal rate of returnand the net present value estimates. At that time, economic impact was the focus ofthe analysis and results showed that farmers could achieve an average benefit ofabout US$ 100/ha because of the adoption of IPM, which compared favorably withother investments in agricultural research and development. Although the pilot unitapproach was replicated in several places of Peru, for example, with the supportof the Inter-American Development Bank (BID), a potato IPM program was im-plemented to control potato insect pests in the Central Highlands and also CentralCoast in Peru, basically to control the Andean potato weevil and the leaf miner fly

13 Evaluating Dissemination and Impact of IPM 425
Liriomyza huidobrensis, respectively. The program was successful in bringing sci-entific information to farmers about innovative pest control methods, using mostlyconventional extension methods such as field days, demonstration plots and individ-ual or group training.
In general terms, there is not an up-dated assessment of the level of adoptionthat potato IPM reached. The review of files indicates that information about potatoIPM reached about 5% of Peruvian potato growers, but there has not been a formalassessment so there is no evidence to estimate real adoption. Because of the lack ofa functional extension service and difficulties for farmer-to-farmer dissemination ofcomplex technologies such as IPM, there is no strong reason to believe that the adop-tion moved beyond that point. An additional aspect in the assessment was related tothe number of IPM practices disseminated, and the difficulty to estimate how manywere needed to consider the technology adopted. Hence, the question at that timewas if IPM adoption consisted in the adoption of a number of pest control practices,or of the decision-making process to select appropriate pest control practices. Theemphasis was on the former.
13.3.2 Participatory Research and Training for IPM:The FFS Experience
The lessons learned during the pilot unit phase have led to start looking at otherexperiences related to IPM training and implementation. Practitioners were inter-ested in methodological innovations that could facilitate farmers’ uptake of IPMbeyond the pilot units. The idea of the FFS approach was introduced to Peru bya CIP scientist who previously gathered experiences in Asia on rice FFS (Nelsonet al., 2001). This method was the best bet for teaching IPM at that time, and aprocess of adaptation began through a collaborative project between CIP and theNGO CARE-Peru. Between 1998 and 2001, the FFS method was adapted to potatorelated IPM, giving emphasis to late blight control. Although, the idea was to de-velop a method that could facilitate farmers’ understanding of complex conceptson the biology, reproduction and dissemination of the microorganism that causeslate blight, the experience soon revealed that there was also the need to evaluatethe efficacy of control technologies in specific locations of different agro-ecologies.Late blight occurrence and incidence depends on the susceptibility of the cultivars,the climate (humidity, rain and temperature) and on farmers’ management practices.Therefore, the FFS that were at the beginning initiated as a learning method forfarmers were used for participatory research, being called participatory researchthrough FFS (PR-FFS). This allowed farmers to assess technologies and scientiststo collect information about the performance of the technologies in a range of so-cioeconomic and agro-ecological situations. The combination of learning and tech-nology assessment seemed to be the right approach to tackle a complex problemsuch as late blight. In this way, new resistant cultivars and clones were introducedand jointly evaluated with farmers and, at the same time, farmers learned about

426 O. Ortiz et al.
how to control this disease. Although, this project was initiated focusing on lateblight, farmers demanded also information on control methods for other pests, suchas the Andean potato weevil and potato tuber moths, resulting in a more integralpotato pest control program. Additionally, potato agronomic cultivation practiceswere included1.
The adapted version of the FFS, which combined participatory research andtraining, generated impact in terms of changes in farmers’ knowledge about potatomanagement, influencing positively the productivity of potatoes. Godtland et al.(2004) reported that knowledge increase significantly because of the participationin FFS and that the input-output rate for potato could be increased by 32% as aresult of additional knowledge. In addition, Zuger (2004) indicated that additionalknowledge gained through FFS and the introduction of resistant cultivars generatedproductivity gains of US$ 236/ha and US$ 350/ha respectively, which showed theprofitability of investing in training combined with participatory research. However,the amount of additional income from potato depended on the size of the potatoplots, which tended to be less than 0.5 ha, which suggested that the impact of IPM,or of any other technology, should be assessed in terms of the contribution to thetotal income of the farm to see the real benefit for farmers.
The adaptation of the FFS method by CIP and CARE initiated the scaling-out ofthe methodology to other contexts and crops. In Ecuador and Bolivia, the nationalagricultural research institutions, the Agrarian National Research Institute (INIAP)and the private research foundation for potato and Andean crops (PROINPA) respec-tively, also adapted the approach to their local conditions. Groeneweg et al. (2004)indicated that with the support of FAO the method was replicated in cotton, tomato,maize, coffee, vegetables as well as in potato. CARE-Peru adapted the method towork on pest control and market aspects of native fruit trees. Anecdotic evidenceindicates that at least ten other institutions have tried the FFS method, and that thereis continued interest to adapt it to new problems and topics, for example, for pestcontrol on livestock.
The FFS experience showed the need to provide training to farmers using ap-propriate methods, and to introduce suitable technologies that could complementfarmers’ knowledge to make appropriate decisions. However, implementing FFSrequires skilled staff, organizational response on the part of communities and farm-ers, and adequate financial support to run the method properly, which still remainsa challenge. The FFS method was introduced to Peru in 1998 and there is evidencethat it has been replicated in more than 10 institutions. However, the spread andreach of this method has not been studied yet.
1 Alternatives to control the Andean potato weevil include elimination of volunteer plants, noc-turnal hand-picking of adult weevils, turn-over of soil in infestation sources, use of sheets to pilepotatoes during harvesting and sorting, harvest on time, use of chickens as larva predators, use ofdiffused light stores, trenches around stores or fields, biological control agents, and vegetative orchemical barriers (Alcazar et al., 1994).

13 Evaluating Dissemination and Impact of IPM 427
13.4 Retrospects and Prospects of IPM: Some Lessons fromImpact Assessment of Potato and Sweetpotato IPM
In the last 15 years, CIP has been engaged in the promotion of potato and sweet-potato IPM in some Latin American countries. For potato, IPM programs were im-plemented in Peru and subsequently in Bolivia, Ecuador, Colombia andDominican Republic. For sweetpotato, the work was focused in Dominican Re-public and Cuba. These IPM cases allow for a comparative analysis by describ-ing the main characteristics of factors that enabled or hindered the adoption oftechnologies and finally the impact achieved of the different IPM interventions(Table 13.1).
Formal assessments were carried out during and immediately after the programsended, using as indicators the rate of adoption, the net benefit of IPM adoptionexpressed in US$ per ha, and the cost of IPM development and implementation ineach program, but no formal follow-ups of adoption were performed further, onlyanecdotic information could be used for this analysis.
In terms of economic impact, in all cases the internal rates of return (IRR) to in-vestment for IPM development and dissemination were between 27% and 49% andcompared very favorable with other types of investments in agricultural research.The IPM adoption at the pilot sites was encouraging, and the achieved additionalnet benefits on potato or sweetpotato ranged from US$ 100 and US$ 536 per ha.Very exceptional in the case of Cuba, the adoption for managing the sweetpotatoweevil (Cylas formicarius) occurred beyond the pilot sites and reached about 50%of the total sweetpotato production area. There is no evidence that something sim-ilar happened in potato IPM in the Andean region. In all IPM programs, there wasthe need of a substantial investment for the introduction, adaptation, developmentand dissemination of IPM practices. Compared to classical biocontrol programs,however, the profitability of these IPM projects is relatively low. Valdiviezo (1998)reports that the naturalization of 10 exotic beneficial insects to control pests in dif-ferent crops in Peru has generated annual pesticide savings of about US$ 39 million.The difference is that classic biocontrol has been introduced to relatively high valuecrops in most cases, which is different to the potato that still tends to be a foodsecurity crop.
The lack of follow-up studies in the IPM cases presented before indicates thatthere has been limited learning from the cases in terms of successes and failures.When learning and documentation do not happen, new IPM projects do not built onthe lessons learned but tend to duplicate efforts or make similar mistakes than inthe past.
The comparative analysis suggests that the main enabling factor for the suc-cess of a program and IPM adoption was the strong collaboration between re-search and development-oriented institutions, and in the case of Dominican Re-public, the participation of the private sector, which facilitated the participatoryadaptation of IPM strategies according to each location. Synergies can be clearlyachieved when an international agricultural research center, national agriculturalresearch institutes, non-governmental organizations, private sector and farming

428 O. Ortiz et al.
Tab
le13
.1M
ain
feat
ures
ofpo
tato
and
swee
tpot
ato
IPM
prog
ram
sin
Peru
,Ecu
ador
,Dom
inic
anR
epub
lic
and
Cub
a
IPM
prog
ram
Feat
ure
APW
Peru
(199
0–19
96)1
LB
Peru
(199
8–20
05)2
APW
Ecu
ador
(199
4–19
98)3
APW
Bol
ivia
(199
5–19
98)4
SPW
,Dom
inic
anR
epub
lic
(199
2–19
94)5
SPW
,Cub
a(1
994–
1998
)6
Ben
efit/
haan
din
tern
alra
teof
retu
rn(I
RR
)
US$
100/
haIR
R:3
0%U
S$53
6/ha
IRR
:31%
US$
270/
haIR
R:3
3%U
S$10
1.8
IRR
:18%
US$
100/
haIR
R:2
7%U
S$12
6/ha
IRR
:49%
Inte
rven
tion
met
hod
Pilo
tsit
es(c
onve
ntio
nal
grou
ptr
aini
ng)
FFS
(han
ds-o
nle
arni
ngac
tivit
ies)
.
Pilo
tsit
es(c
onve
ntio
nal
grou
ptr
aini
ng)
Pilo
tsit
e(c
onve
ntio
nal
grou
ptr
aini
ng).
Pilo
tsit
e(c
onve
ntio
nal
grou
ptr
aini
ng).
Pilo
tsit
esas
part
ofgo
vern
men
tin
terv
enti
ons.
Stat
usof
adop
tion
Lim
ited
beyo
ndth
epi
lots
ites
.L
imit
edbe
yond
the
FFS
inte
rven
tion
area
.
Lim
ited
beyo
ndth
epi
lots
ites
.U
nkno
wn
Lim
ited
beyo
ndth
epi
lots
ites
.E
xcee
ded
expe
ctat
ions
,w
entb
eyon
dpi
lots
ites
.E
nabl
ing
fact
ors
Col
labo
rativ
epr
ojec
tbe
twee
nC
AR
Ean
dC
IP.
Col
labo
rativ
epr
ojec
t.Pa
rtic
ipat
ory
met
hod
faci
lita
ted
farm
ers’
lear
ning
and
adop
tion
.
Col
labo
rativ
epr
ojec
tbe
twee
nC
IPan
dIN
IAP
enab
led
loca
lad
apta
tion
ofIP
M.
Col
labo
rativ
epr
ojec
tbe
twee
nPR
OIN
PAan
dC
IPen
able
dth
ead
apta
tion
ofIP
Mto
loca
lco
ndit
ions
Col
labo
rativ
eef
fort
faci
lita
ted
the
wor
k.Su
ppor
tof
the
priv
ate
sect
or(J
AD
).
Col
labo
rativ
epr
ojec
t.Po
liti
cal
com
mit
men
t,fu
ncti
onal
exte
nsio
nse
rvic
ean
dco
llec
tive
acti
on.N
oco
mpe
titi
onfr
omag
roch
emic
alco
mpa
nies

13 Evaluating Dissemination and Impact of IPM 429
Tab
le13
.1(c
onti
nued
)
IPM
prog
ram
Feat
ure
APW
Peru
(199
0–19
96)1
LB
Peru
(199
8–20
05)2
APW
Ecu
ador
(199
4–19
98)3
APW
Bol
ivia
(199
5–19
98)4
SPW
,Dom
inic
anR
epub
lic
(199
2–19
94)5
SPW
,Cub
a(1
994–
1998
)6
Hin
deri
ngfa
ctor
sL
ack
offu
ncti
onal
exte
nsio
nse
rvic
efo
rsc
alin
g-ou
t.St
rong
com
peti
tion
ofag
roch
emic
alco
mpa
nies
.
Lac
kof
func
tion
alex
tens
ion
serv
ice
for
scal
ing-
out.
Stro
ngco
mpe
titi
onof
agro
chem
ical
com
pani
es.
Lim
ited
exte
nsio
nse
rvic
esfo
rsc
alin
g-ou
t.St
rong
com
peti
tion
ofag
roch
emic
alco
mpa
nies
.
Inex
iste
nce
ofa
gove
rnm
ent
exte
nsio
nse
rvic
e.St
rong
com
peti
tion
ofag
roch
emic
alco
mpa
nies
.
Lim
ited
avai
labi
lity
ofph
erom
ones
afte
rpr
ojec
tcy
cle,
and
lim
ited
supp
orto
fth
ego
vern
men
tfo
rsc
alin
g-up
.
Lim
ited
avai
labi
lity
ofph
erom
ones
afte
rpr
ojec
tcy
cle.
Mai
nle
sson
sW
orki
ngat
com
mun
ity
leve
lis
esse
ntia
lfor
deve
lopi
ngIP
M.
IPM
requ
ires
part
icip
ator
ym
etho
dsto
faci
lita
tele
arni
ngan
dad
opti
on,b
utth
atin
crea
ses
the
cost
.
Ada
ptat
ion
ofIP
Mpr
inci
ples
deve
lope
din
othe
rco
ntex
tis
esse
ntia
l.
IPM
opti
ons
dono
tred
uce
the
need
for
inse
ctic
ides
.T
hepi
lots
ite
appr
oach
isto
osp
ecifi
cfo
rIP
Man
dfa
rmer
sfa
cea
num
ber
ofpr
oble
ms.
Ava
ilab
ilit
yof
IPM
inpu
tsne
eds
tobe
take
nin
toco
nsid
erat
ion
from
the
begi
nnin
g.
Com
mit
men
tof
poli
cy-m
aker
s,an
dco
llec
tive
acti
onfa
cili
tate
dim
-pl
emen
tati
on.
Key
:APW
:And
ean
pota
tow
eevi
l(P
rem
notr
ypes
spp.
),SP
W:S
wee
tpot
ato
wee
vil(
Cyl
asfo
rmic
ariu
s),L
B:l
ate
blig
ht(P
hyto
phth
ora
infe
stan
s).
1O
rtiz
etal
.(19
96),
2Z
uger
2004
,3B
arre
raan
dC
riss
man
(199
9),4
Esp
rell
aet
al.(
2001
),5
Alv
arez
etal
.(19
96),
6M
aza
etal
.(20
00).

430 O. Ortiz et al.
communities work together towards common objectives. In Peru, the partnershipbetween CIP and CARE-Peru was initiated with an IPM program in 1993 andhas lasted 15 years. Initially working with the pilot site approach and the col-laborative effort resulted in the adaptation of FFS as a participatory research andtraining method for IPM (Ortiz et al., 2008a). A similar partnership has hap-pened between PROINPA foundation and CIP in Bolivia. In Ecuador, CIP andthe National Agricultural Research Institute (INIAP) collaborated with local or-ganizations and farming communities for the adaptation of IPM, first through thepilot site approach and later through the FFS method. In Dominican Republic,there was the participation of the “Junta Agroempresarial Dominicana – JAD”(Agro-entrepreneurial Dominican Association). In Cuba, favorable for the pro-gram was the political (by law) and institutional commitment towards IPM de-velopment and implementation, and had its main cause in the limited access ofCuban agricultural sector to agro-chemicals after the end of the Soviet Union.As a result, the government sector (research and extension) and the state co-operatives were organized to facilitate IPM implementation. Cooperatives builtand maintained units for the mass production of the entomopathogen (Beauveriabassiana) to control the sweetpotato weevil. The coexistence of political will, in-stitutional support and collective action made the large-scale implementation ofthe IPM program possible and a full success. In contrast, in all other countries,a lack of political support for IPM implementation was one of the main hin-dering factors for a large scale adoption. The weak government extension ser-vices prevalent in most countries prevented the scaling-out of the IPM experi-ences beyond the pilot sites although some special projects that tried to promotethe spread of the technology. Koli (2003) concluded that adoption of IPM for theAndean potato weevil depends on a relatively well-organized extension or edu-cation service with a stable presence in the communities, which is in line withthe experiences made at IPM pilot units or FFS. Further this author pointed outthat the coordination of a large number of GO and NGO would be needed forscaling-out IPM experiences; the great variability of agro-ecological and economicconditions, farmer perceptions including availability of time and personal atti-tudes calls for a better “IPM product differentiation”, meaning fine tuning IPMstrategies according to different types of farmers. One additional hindering fac-tor has been the strong competition of agrochemical companies, which have ag-gressive selling strategies and well-established selling networks, so that farmershave access to pesticides with relative facility, compared to IPM-related adviceor inputs.
Limited availability of some IPM inputs has turned out being often anotherimportant factor for IPM adoption. In the Dominican Republic and Cuba, the avail-ability of pheromones was reduced substantially after the project cycle. Local pro-duction could not build up and the importation from the Netherlands was too costly;recently it was shown that pheromones produced in China are used. In IPM leafletsand brochures produced by national programs it can be often observed that IPMitems like pheromones are mentioned but which are not available on local mar-kets. In Peru, there were some government and non-governmental organizations

13 Evaluating Dissemination and Impact of IPM 431
that attempted to produce biological control agents such as the fungus Beauveriabassiana to control the Andean potato weevil and the potato tuber moth granulovirus(PoGV) to control potato tuber moths, but results were not encouraging, and theprivate sector has not been part of the efforts so far.
Collective action was clearly present in Cuba but not in the other countries, wherefarmer organizations are weak and no mechanism for promoting collective actionexists. According to the experiences and the lessons learned at the pilot units andFFS, the commitment of farmer organization to IPM is utmost important; where itdoes not exist, the chances of adoption are very low.
IPM is clearly a type of technology that depends on an enabling innovation sys-tem, meaning the existence of relatively strong research and development organi-zations and also strong farmer organizations, which can make collective action forIPM a reality. The technology also requires inter-organizational coordinated efforts,which are not easy to initiate or to sustain over time (Ortiz et al. 2008b)
13.5 Concluding Remarks: Some Lessons for the Future
IPM to become a reality at field level needs the coexistence of sound technicalknowledge and solutions, inter-institutional cooperation mechanisms, collective ac-tion of farming communities and an enabling political environment. The relativelyappropriate combination of these factors existed for the successful implementationof an IPM program only in Cuba. The lack of some or all of these factors has nega-tively influenced the IPM adoption in the other examples presented in this paper.
Unless the availability of IPM-related inputs (i.e. pheromones) is ensured, alsoafter the end of the projects, these IPM inputs should not be promoted as part of anIPM program, because it creates expectations that cannot be fulfilled. Otherwise thereliability of the project and the IPM technology will be negatively affected and theIPM adoption could drop sharply after the project.
Working at the community level is essential for IPM development and imple-mentation, which was the main contribution of the pilot unit approach. Prior, IPMpractices were tested in individual plots only, where no real understanding couldbe achieved for all those factors which might influence IPM implementation. IPMassessment at community level with the participation of many farmers and institu-tional actors is more meaningful and accurate, because it involves different pointsof view. Appropriate participatory research and training methods are important tofacilitate the understanding of IPM by farmers, which was the main contribution ofFFS to the pilot unit approach.
The economic impact of IPM at pilot sites of FFS communities has been en-couraging and is an important parameter to take into consideration. However, alsoimpact on human capital like changes in stakeholder knowledge and skills is impor-tant, which could last even beyond the IPM program or the crop in hand. Impactin social capital can also be achieved when working with IPM programs, whichrequires inter-institutional and collective action. Again, strengthened social capital

432 O. Ortiz et al.
would have benefits beyond the specific IPM programs. However, most of the IPMprograms analyzed in the paper did not assess the importance and changes of socialcapital and its influence on IPM scaling-up and implementation. Some indicatorsof impact at the level of human capital include, for example, proportion of farm-ers recognizing stages of pest life cycles, infestation sources, and ways the insectreaches fields or stores. Also, proportion of farmers who are able to explain how,why and when IPM practices should be used. Examples of indicators of changesin social capital include the existence of farmer organizations, the formalization ofthem, number of sources of information and access to credit related to pest control.
Farmers’ characteristics are changing rapidly in response to market development,globalization, urbanization and threats to human health. In general farmers are diver-sifying their sources of income, meaning that they are engaged in more and differenton and off-farm activities. IPM strategies and program need to take those new condi-tions into consideration by developing strategies and products more target oriented.Product differentiation is a well-known concept in the private sector, which shouldalso be considered in public IPM research and intervention.
References
Alcazar, J., Catalan W., Raman, K.V., Cisneros, F., Torres, H. and Ortiz, O. 1994. Control integradodel gorgojo de los Andes. Lima, Peru: International Potato Center.
Alvarez, P., Escarraman, V., Gomez E., Villar, A., Jimenez, R., Ortiz, O., Alcazar, J. and Palacios,M. 1996. Economic impact of managing sweetpotato weevil (Cylas formicarius) with sexpheromones in the Dominican Republic. In: Walker, T. and Crissman, C. (eds), Case Studiesof the Economic Impact of CIP-related Technology. International Potato Center, Lima, Peru,pp. 83–93.
Arning, I. and Lizarraga, A. 1999. MEP, manejo ecologico de plagas. Una propuesta para laagricultura sostenible. Red de Accion Alternativa al Uso de Agroquımicos Raaa, Lima, Peru.
Barrera, V. and Crissman, C. 1999. Estudios de caso del impacto economico de la tecnologıagenerada por el INIAP en el rubro papa. Instituto Nacional Autonomo de InvestigacionesAgropecuarias. Centro Internacional de la Papa, Quito, Ecuador.
Castro, Z.J., Loayza, C.F., Castro, M.T., Meza, P.M, Pena, V.L. and Molinari, N.E. 1997. Controlintegrado de plagas y produccion de controladores biologicos en el valle de Ica y el Callejonde Huaylas. CEDEP/RAAA, Lima, Peru.
Chafez-Tafur, I., Gianella, C. and Urbina, G. 2003. Agriculture ecologica en el Peru: Situacionactual y perspectivas, ETC Andes, Peru.
Chiri, A., Fano, H., Cama, F. and Dale, W. 1996. Final Evaluation of the Integrated Pest Manage-ment for Andean Communities (MIP-Andes) Project. Internal Report. CARE, Lima, Peru.
CIP 1995. CIP Circular Integrated Pest Management 21(3):23 p.Cisneros, F. and Alcazar, J. 2001. Manejo integrado del gorgojo del camote o tetuan del boniato,
Cylas formicarius (fab.) en Cuba. Centro International de la Papa (CIP), Lima, Peru. 138 p.Cisneros, F. 1999. Las unidades piloto como estrategia para el desarrollo y aplicacion del MIP.
In: Proceedings of the International Workshop on Integrated Pest Management of the MainAndean Crops. 23–26 March 1999. International Potato Center, Inter American Foundation,Cusco, Peru, Arariwa, pp. 30–34.
Esprella, R., Blajos, J., Calderon, R. and Thiele, G. 2001. El impacto economico del manejointegrado del gorgojo en el altiplano central. Manuscript. Cochabamba, Bolivia. FundacionPromocion e Investigacion de Productos Andinos. Centro Internacional de la Papa.

13 Evaluating Dissemination and Impact of IPM 433
Fano, H., Ortiz, O. and Walker, T. 1996. Peru: Inter-institutional cooperation for IPM. In: Thrupp,L.A. (ed), New Partnerships for Sustainable Agriculture. World Resources Institute, Washing-ton DC, pp. 85–98.
Godtland, E., Sadoulet, E., de Janvry, A., Murgai, R. and Ortiz, O. 2004. The impact of farmer-field-schools on knowledge and productivity: A study of potato farmers in the Peruvian Andes.Economic Development and Cultural Change 53(1):63–92.
Groeneweg, K., Versteeg, A. and Chavez-Tafur, J. 2004. Mas nos han ensenado mucho hemosaprendido. El proyecto GCP/PER/036/NET Manejo integrado de plagas en los principales cul-tivos alimenticios en el Peru y el impacto logrado en los agricultures.. FAO-Peru, Lima, Peru.
Hastorf, C.A. 1993. Agriculture and the Onset of Political Inequality Before the Inka. CambridgeUniversity Press. Cambridge, UK.
Hollands, J. and Lizarraga, A. 1998. Experiencias de capacitacion en Manejo Ecologico de Plagas.In: Lizarraga, A. Barreto, V. and Hollands, J. (eds), Nuevos Aportes del Control Biologico enla Agricultura Sostenible. Red de Accion Alternativa al uso de Agroquımicos, Lima, Peru,pp. 357–369.
International Potato Center – CIP. 1995. Annual Report. International Potato Center, Lima, Peru.Koli, L. 2003. Analysis of the diffusion of integrated pest management for the Andean potato weevil
with a marketing perspective. Diploma Thesis. Technical University of Zurich.Maza, N., Morales, A., Ortiz, O., Winters, P., Alcazar, J. and Scott, G. 2000. Impacto del manejo
integrado del tetuan del boniato (Cylas formicarius) en Cuba. Instituto de Investigaciones enViandas Tropicales (INIVIT). Centro Internacional de la Papa (CIP), Lima, Peru.
Nelson, R., Orrego, J.R., Ortiz, O., Mundt, M., Fredrix, M. and Vien, N. 2001. Working withresource-poor farmers to manage plant diseases. Plant Disease 85(7):684–695.
Ortiz, O. 1997. The Information System for IPM in Subsistence Potato Production in Peru: Ex-perience of Introducing Innovative Information in Cajamarca Province. PhD dissertation. De-partment of Agricultural Extension and Rural Development. The University of Reading, Read-ing, UK.
Ortiz, O. 2001. La informacion y el conocimiento como insumos principales para la adopcion delmanejo integrado de plagas. Manejo Integrado de Plagas (Costa Rica) 61:12–22
Ortiz, O. 2006. Evolution of agricultural extension and information dissemination in Peru: Anhistorical perspective focusing on potato-related pest control. Agriculture and Human Values23:477–489.
Ortiz, O., Alcazar, J., Catalan, W., Villano, W., Cerna, V., Fano, H. and Walker, T. 1996. Economicimpact of IPM practices on the Andean potato weevil in Peru. I. In: Walker T. and CrissmanC. (eds), Case Studies of the Economic Impact of CIP-Related Technology. International PotatoCenter, Lima, Peru, pp. 95–110.
Ortiz, O., Garret, K.A., Heath, J.J., Orrego, R. and Nelson, R. 2004. Management of potato lateblight in the Peruvian Highlands: Evaluating the benefits of farmer field schools and farmerparticipatory research. Plant Disease 88(5):565–571.
Ortiz, O., Alcazar, J. and Palacios, M. 1997. La ensenanza del manejo integrado de plagas en elcultivo de la papa: la experiencia del CIP en la Zona Andina del Peru. Revista Latinoamericanade la Papa 9/10:2–22.
Ortiz, O., Frias, G., Ho, R., Cisneros, H., Nelson, R., Castillo, R., Orrego, R., Pradel, W., Alcazar,J. and Bazan, M. 2008. Organizational learning through participatory research: CIP and CAREin Peru. Agriculture and Human Values, in press.
Ortiz, O., Orrego, R., Pradel, W., Gildemacher, P., Castillo, R., Otiniano, R., Gabriel, J., Vallejo, J.,Torres, O., Woldegiorgis, G., Damene, B., Kakuhenzire, R., Kashaija, I. and Kahiu, I. 2008a.Participatory research and potato innovation systems: challenges and prospects. Paper pre-sented in the Conference “Potato Science for the Poor: Challenges for the New Millennium”,Cusco, Peru, 26–29 March 2008.
Ortiz, O., Frıas, G., Ho, R., Cisneros, H., Nelson, R., Castillo, R., Orrego, R., Pradel, W., Alcazar, J.and Bazan, M. 2008b. Organizational learning through participatory research: CIP and CAREin Peru, Agriculture and Human Values 25(3):419–431.

434 O. Ortiz et al.
Palacios, M., Lizarraga, A., Velasquez, R., Carranza, E. and Segovia, I. 2003. Integrated pest man-agement in Peru. In: Maredia, K. Dakouo, D. and Mota-Sanchez, D. (eds), Integrated PestManagement in the Global Arena. Wallingford, UK. CAB International, pp. 301–312.
Valdiviezo, L. 1998. Control biologico en Peru. In: Nuevos Aportes del Control Biologico en laAgricultura Sostenible. Lizarraga, A., Barreto V., and Hollands J. (eds) Red de Accion Alter-nativa al uso de Agroquımicos, Lima, Peru, pp. 202–210.
Van Elzakker, B. 1999. Comparing the costs of organic and conventional cotton. In: Mayers, D.and Stolton, S (eds), Organic Cotton ‘From Field to Final Product’. Intermediate TechnologyPublications. London. pp. 86–110.
Zimmerer, K. 1991. Agricultura de barbecho sectorizado en las Alturas de Paucartambo: luchassobre la ecologıa del espacio productivo durante los siglos XVI y XX (Sectoral fallowing sys-tem in the high Andes of Paucartambo: encounters of ecology and productive space betweenXVI and XX Centuries). Allpanchis 23:189–226.
Zuger, R. 2004. Impact Assessment of Farmer Field Schools in Cajamarca: An Economic Evalua-tion. Social Sciences Working Paper No 2004–1. International Potato Center, Peru.

Chapter 14Integrated Pest Management in Europe –History, Policy, Achievementsand Implementation
Bernd Freier and Ernst F. Boller
Abstract Inspired by the pioneering work in Canada and California in the early1950s, the first European IPM task force – the “Working Group for Integrated PlantProtection in Fruit Orchards” – was established by the International Organisation forBiological and Integrated Control of Noxious Animals and Plants (IOBC) in 1959.From the beginning, the implementation of IPM proved to be a problem because ofits complicated and non-uniform requirements and insufficient economic benefits. Inspite of these obstacles, IPM has become an accepted model for plant protection inall European countries and in the European Union. More than 30 working groups ofthe West and East Palaearctic Regional Sections of the IOBC (IOBC/wprs and eprs)organise research programs and information exchanges and actively promote the im-plementation of IPM into practice. IPM can be well implemented within the scopeof Integrated Production (IP). Respective IP guidelines developed by IOBC/wprsworking groups and local production organisations are currently being used, partic-ularly in pome fruits and grapes. Studies have shown that IPM systems yield greaterbiodiversity and reduce pesticide use by at least 20% compared to conventionalfarming, as assessed using the treatment index. Some countries, such as Denmark,Germany and Switzerland, have developed national pesticide reduction programs.The European Union also supports IPM by issuing regulations and directives andby funding research programs. National action plans shall help to achieve faster andmore consistent implementation of IPM in the Member States.
Keywords IPM · Europe · IOBCwprs · biological control · integrated production
B. Freier (B)Julius Kuehn Institute (JKI), Federal Research Centre for Cultivated Plants, Institute for Strategiesand Technology Assessment in Plant Protection D-14532 Kleinmachnow, Germanye-mail: bernd.freier@jki. bund.de
R. Peshin, A.K. Dhawan (eds.), Integrated Pest Management: Disseminationand Impact, DOI 10.1007/978-1-4020-8990-9 14,C© Springer Science+Business Media B.V. 2009
435

436 B. Freier and E.F. Boller
14.1 Introduction
This chapter describes the specific pattern of development of IPM in Europe. Plantprotection has always been a key component of sustainable agricultural productionsystems. Prevention and control of important pests, diseases, weeds and physiolog-ical disorders followed different patterns in organic and integrated production sys-tems. In both schools of thought, however, plant protection was considered part ofand was ultimately integrated in the entire range of production processes at the farmlevel. Outside organic farming plant protection in Europe evolved from chemicalpest control in the 1940s and 1950s via integrated pest control, integrated pest man-agement (IPM) and integrated plant protection (IPP) to the holistic concept of in-tegrated production (IP). The first investigations, particularly those in fruit-growingin Western Europe, showed that IPM could be used as a model for practical plantprotection in all crops. Based on positive long-term research results and practicalexperience, the IPM concept is now widely accepted as a plant protection strategyfor sustainable farming in all of Europe.
Since its introduction the IPM concept has received political and financial sup-port from the European Union and the governments of all European countries aim-ing to minimise the noxious effects of chemical pesticide usage and to ensure sus-tainable crop production. From the late 1970s on, more and more research andimplementation programs have been established, not only in Western Europe butalso in Eastern Europe. Even before the more recent political changes, the IPMconcept was also welcome in European socialist countries. In these states, chem-ical pesticides were scarce and had to be bought on the international market. The“Integrated Production” (IP) concept and corresponding guidelines were developedas an important result of IPM research in Europe. Anyone wishing to produce cropsunder the “Integrated Production” label had to comply with the requirements speci-fied in these guidelines. European Union Directive 91/2092/EEC (which adopts theprivate IFOAM regulations) defines the requirements of organic agriculture, but noequivalent EU-directive exists for IP although international standards for IP are inplace. Therefore, most governmental regulations in Europe concerning plant protec-tion still address IPM issues only.
European studies have shown that IPM systems increase biodiversity and reducepesticide use by at least approximately 20% compared to conventional farming, asassessed using the treatment index. Nonetheless, overall implementation levels arestill low. In Europe, IPM is considered to be a standard procedure in perennial crops(fruits, grapes etc.), but not in annual/rotational cropping systems. However, unlikeorganic farming, integrated production systems have not yet achieved significantadded value for the products at the farm level. This is one of the main problemsslowing down the implementation of IPM and IP in practice.
It is another particularity in Europe that principles of Good Plant ProtectionPractice (GPP) were introduced as “basic standards”, the requirements of whichare not as strict as the IPM standards, but should ensure proper use of pesticides byfarmers (see Section 14.3.1). National programs for the promotion of IPM, e.g. Pes-ticide Reduction Programs, and indicators used to estimate the status quo of IPM

14 Integrated Pest Management in Europe 437
and the progress made in pesticide use and risk reduction will also be outlined inthis chapter.
14.2 History of IPM and IP in Europe
14.2.1 Corner-Stones
The history of IPM and IP in Europe is well-documented (e.g. Boller et al. 1998,2006; Minks et al. 1998). Not surprisingly, IPM and IP were developed primarilyby orchard entomologists. As soon as the first synthetic insecticides became com-mercially available in the 1940s, they were readily introduced in apple orchards –a perennial agro-ecosystem rich in fauna but highly susceptible to pests. The firstcases of resistance to pesticides (DDT and organo-phosphorous compounds) wereobserved around 1949. Particularly spider mites and pear psylla exhibited a greatability to develop resistance.
The IOBC (International Organization for Biological Control of Noxious An-imals and Plants), established in 1956, is closely linked with the development ofbiological and integrated control strategies for major insect pests in Europe. Thisorganisation celebrated its 50th anniversary in 2006 (Boller et al. 2006). Inspired bythe pioneering practical work of Picket and his team in Nova Scotia, Canada (Picketet al. 1958) and by the conceptual ideas published in California (Stern et al. 1959),the IOBC established a “Commission on Integrated Control” already in 1958 anda Working Group on “Integrated Pest Control in Fruit Orchards” in 1959. At thebeginning this group operated mainly in the Netherlands (e.g. de Fluiter, de Wilde),Germany (e.g. Steiner), Switzerland (e.g. Baggiolini, Mathys) and certain parts ofFrance (Milaire). In many respects, entomologists involved in apple production canbe considered the pioneers of IPM and leaders of the later development of IP inEurope (Steiner 1977; Boller et al. 1998). They were the first to address seriousresistance problems in arthropod pests, a phenomenon encountered 10 years laterby plant pathologists and 20 years later by weed people. IOBC Working Groupsdeveloped IPM in all major crops of Europe (see Section 14.5.1.). Based on theCalifornian term “Integrated Control”, an FAO expert panel elaborated in 1967 afirst definition of “Integrated Pest Control” (F.A.O 1968). However, many IOBCmembers felt that the broader term “IPM” was more appropriate. To emphasise theinterdisciplinary dimension and systems approach in plant protection, the IOBCOrchard Group adopted the term of “Integrated Plant Protection” in 1974, and allother IOBC Working Groups followed suite in 2001.
14.2.2 Integrated Production (IP) Born in Europe
July 11, 1976, is the historic landmark date on which, after reviewing current devel-opments, five IOBC specialists coined the term “Integrated Production” (IP). Thisimportant evolutionary step became known as the “Message of Ovronnaz” (Steiner1977; Boller et al. 1998), widened the dimension of IPM into a holistic approach.

438 B. Freier and E.F. Boller
The new concept postulated that plant protection had to be removed from isolationand integrated into the entire range of production processes at the farm level. In-stead of focusing on linear pest, disease or weed control, emphasis was placed onmanagement of agro-ecosystems and of the entire farm as basic holistic unit. TheIOBC established an IP Commission in 1977, but initial acceptance of IP in fruitand grape crops was slow. Conventional production procedures and sectorial IPMprograms remained the backbone of agricultural policy and market pattern in mostEuropean countries in the late 1970s.
14.2.2.1 New Standards in Plant Protection and AgriculturalProduction in the 1990s
After reviewing the general direction of its activities and the recent developmentsin plant protection concepts in 1989, the IOBC gave its Commission on “IP Guide-lines and Endorsement” the mandate to define a conceptual frame for IP to describethe underlying strategy, to provide technical assistance and services for regional IPorganisations, and to operate on behalf of the IOBC an international endorsementservice. The first basic document “Integrated Production: Principles and TechnicalGuidelines”, which was finalised in 1992, summarised the most recent conceptualand technical developments in Europe (El Titi et al. 1993). It opened the doorfor the establishment of crop-specific IP Guidelines and for an international en-dorsement service for IP organisations operating according to IOBC standards (seeSection 14.5).
14.2.2.2 Food Scandals Generate New Standards for Food Quality
The 1990s and early 2000s were marked by international and local food scandalsand increased consumer criticism of the food sector. Important market players andinternational institutions reacted by discussing and defining international standardsfor food safety and social/ethical aspects of food production and distribution, whichbecame increasingly effective as of 2005. Already in 2001, the IOBC made afirst major step forward by postulating a total quality approach in the pre-harvestsector of agricultural production. The new “IOBC Standard 2004 for IP” (Bolleret al. 2004a) was the first standard to incorporate elements of product, production,ethical and social quality; it became an international benchmark for excellence(see Chapter 3.4). This standard was field-tested with adequate analytical tools in2005–2006 and is now being implemented by IOBC-endorsed farmers’ organisa-tions in France, Spain and Oregon/USA (www.iobc.ch).
14.3 Policy
Increasing revelations about the effects of pesticides and pesticide residues in the en-vironment and in foodstuffs for humans and animals, and the publication of “SilentSpring”, the challenging book by Rachel Carson (1962), strongly influenced the

14 Integrated Pest Management in Europe 439
IPM movement in all European countries and the European Union. European pol-icymakers aimed to minimise the noxious effects of chemical pesticides while, atthe same time, ensuring sustainable crop production. The governments supportedprojects related to international IPM research and implementation and encouragedinter-European political and scientific collaboration on the subject. However, thesocialist countries of Eastern Europe initially cooperated mainly among themselvesin relative isolation until the political situation changed in 1989.
14.3.1 European and Mediterranean Plant ProtectionOrganization (EPPO)
The European and Mediterranean Plant Protection Organization (EPPO) (www.eppo.org) was founded by 15 European countries in 1951. EPPO now has 48 mem-ber states, representing almost all countries of the European and Mediterranean re-gion. Its objectives are to protect plants, to develop international strategies to preventthe introduction and spread of dangerous pests, and to promote safe and effectivepest control methods. One of the EPPO’s main activities is to publish Standardson Good Plant Protection Practice (GPP). Twenty-six standards for different cropsor crop groups have already been published (Anonymous 2002). The GPP stan-dards document rules for good handling and diversity of action in plant protectionwithin the framework of existing regulations; however, they do not comprise bindingrequirements. The “Principles of good plant protection practice” define GPP as abasic strategy for everyone to ensure the proper use of pesticides and explicitly statethat GPP is not the same as IPM, which is a more complex sophisticated concept.It is very important to distinguish between the two policies because some peoplebelieve that GPP includes the elements of IPM and is synonymous with IPM. Thismisconception dilutes the general high standards of IPM.
14.3.2 European Union
The European Union currently consists of 27 Member States. EU Directive91/414/EEC, which regulates pesticide registration and usage, came into force in1991. The Directive, which has 6 annexes, defines IPM as:
“The rational application of a combination of biological, biotechnical, chemical, culturalor plant-breeding measures whereby the use of plant protection products is limited to thestrict minimum necessary to maintain the pest population at levels below those causingeconomically unacceptable damage or loss.”
The system approach and necessary minimum levels of pesticide usage are cen-tral points. Directive 91/414/EEC encourages Member States to take the principlesof IPM into account. However, generally binding IPM principles and rules on howIPM should be implemented still do not exist at the European Union level. TheEU authorities recently published a “Thematic Strategy on the Sustainable Use of

440 B. Freier and E.F. Boller
Pesticides” (Anonymous 2006a) and put forward new draft documents for discus-sion. These include:
a) A new “Regulation Concerning the Placing of Plant Protection Products on theMarket” which shall ultimately replace the Directive 91/414/EEC (Anonymous2006b) and
b) A “Directive Establishing a Framework for Community Action to Achieve aSustainable Use of Pesticides” (Anonymous 2006b). An essential element ofthis directive is the idea that the Member States should develop “National actionplans” during the next years (Article 4). These national action plans should in-clude targets, measures and timetables to reduce pesticide risks and hazards anddependence on pesticides. It also specifies that Member States shall ensure by1 January 2014 at the latest that all professional users implement the principlesof IPM (Article 13). Consequently, it strongly demands that Member States notonly consider, but also implement the IPM principles. The directive also providesthat, based on these principles, the Member States shall be encouraged to develop“crop-specific guidelines for IPM”, the practical implementation of which shallbe voluntary. Besides establishing a legal framework, the European Union sup-ports IPM research and implementation of integrated methods or IPM conceptsand organises platforms for information exchange (see above).
The European Union supports agriculture by providing the following types ofsubsidies:
a) Direct payments contingent upon compliance with the Principles of Good PlantProtection Practice and
b) Subsidies for participating in Rural Development Policy Program 2007–2013which includes incentives for reducing pesticide usage and implementing IPMtechniques. In Germany, for example, farmers can receive approx. C- 60 per ha forusing Trichogramma parasitoids against Ostrinia nubilalis in maize.
Since 1993, the non-EU country Switzerland has also pursued a comprehen-sive direct payments scheme involving some 97% of all Swiss farms (see Sec-tion 14.3.3.3).
14.3.3 IPM in National Legislation and Action Plans
Most national plant protection acts incorporate IPM as a general model and aim.The policymakers generally use IPM as an orientation mark and consider it a strat-egy that should be supported, but not necessarily as a mandatory plant protectionstandard for everyone who uses pesticides. The implementation of IPM is there-fore voluntary in European countries. IPM guidelines and relevant requirements aregenerally used by regional organisations interested in certified labels (such as IP).Figure 14.1 demonstrates the relationship between regulations, GPP and IPM.

14 Integrated Pest Management in Europe 441
Model: Integrated Pest Management (IPM)
Principles Minimum Requirements
IPMwithin certified Integrated Production (IP)
Voluntary advanced strategy inplant protection
Good Plant Protection Practice (GPP)within Good Agricultural Practice (GAP)
Base strategy for all professional usersof pesticides
Regulations of European Union and Member States in Plant Protection
To consider
To implement
§ § §
Fig. 14.1 Relationship between regulations, good plant protection practice (GPP) and integratedpest management (IPM)
The German Plant Protection Act takes into account the IPM concept since 1987(Anonymous 1998). It defines IPM as:
“A combination of methods in which primary attention is paid to biological, biotechnical,plant-breeding and cultivation techniques, and in which the use of chemical pesticides islimited to necessary amount.”(Article 2).
Article 2a states that: “GPP implies that principles of IPM have to be consid-ered.”
To “consider” is an unspecific term meaning that IPM is not obligatory.In Germany, IPM Principles have been published (Burth et al. 2002). Similar
documents were also developed in other European countries. They are integral partsof General Guidelines for IP in most of the countries, e.g. Italy, Germany, Spain andSwitzerland (Boller et al. 1998, Cadahıa Bielza 2003, Wiegand et al. 2004, BLW2005).
Environmental and consumer organisations and political stakeholders criticisethe high level of pesticide use in European agriculture. Figure 14.2 shows the rateof pesticide use per ha in crops (arable crops, fruits and vegetables). The statisticalmethod used by Eurostat (2007) does not present a realistic picture. The collecteddata probably underestimate the actual level of pesticide usage. In addition to legalregulations at the national and EU level, some European countries have thereforepassed action plans to promote the development of IPM and to reduce the risk ofpesticides and pesticide dependency. Almost all European countries presented theirprograms at an EU meeting held in Berlin in 2007 (Anonymous 2007a). The DanishPesticide Plan is an interesting example.

442 B. Freier and E.F. Boller
kg Active Substances per ha
0
1
2
3
4
5
6
PLDK
ES
IT
DE UK
NL
FR
1992 93 030294 95 96 97 98 200099 01
Fig. 14.2 Usage of pesticides in crops (arable crops, fruits and vegetables) in eight Europeancountries (Eurostat 2007) DE: Germany, DK: Denmark, ES: Spain, FR: France, IT: Italy, NL:Netherland, PL: Poland, UK: Great Britain
14.3.3.1 The Danish Pesticide Action Plan
Denmark began its pesticide reduction program over 20 years ago, in 1986. TheDanish government aimed to achieve a more stringent authorisation system and toreduce total pesticide consumption, as assessed using a newly developed indicatorcalled the “Treatment Intensity Index” (TI) (Kudsk 1989). The TI (=Treatment Fre-quency Index, Treatment Index or Frequency of Application) represents the numberof pesticide applications in a defined area per year, provided that a fixed standarddose is used. The average TI value remained at 2.67 from 1981 to 1985 and de-creased to 2.5 within 10 years. When corrected for differences in crop composi-tion compared with the reference period, the reduction was 25% in 1997 (NistrupJorgensen 2003). The sales of active ingredients for pesticides were also reduced by40% in Denmark. The established “Bichel Committee”, which participated in thePesticide Action Plan, concluded that the TI could be reduced to 1.4–1.7 withoutsignificant losses to farmers and society if all available technologies, particularlyIPM, were implemented. However, although the TI decreased until 2002, it sub-sequently rose to 2.32 by 2005. The introduction of incremental pesticide taxationfailed to reduce the actual pesticide use. The subsequent tax levels were:
1986–3%,1996–13% (herbicides and fungicides) and 27% (insecticides) and1999–33% (herbicides and fungicides) and 54% (insecticides).

14 Integrated Pest Management in Europe 443
14.3.3.2 The German Reduction Program Chemical Plant Protection
The German Federal Ministry of Food, Agriculture and Consumer Protection laun-ched the “Reduction Program Chemical Plant Protection” in 2004. Its aimswere:
(1) To reduce the risks associated with pesticide use,(2) To reduce the intensity of plant protection product use to the necessary mini-
mum and(3) To reduce the percentage of domestic products exceeding the existing maximum
residue limits to less than 1%.
A total of 19 actions were proposed, including the introduction of the TreatmentIndex (TI) similar to the Danish Treatment Intensity Index as an indicator of inten-sity of pesticide use. The German TI is defined as the number of pesticide applica-tions at the authorised dosage on a defined area. Surveys started in 2000 have shownremarkable differences in the intensity of pesticide use between crops, landscapesand farms in different German regions (Table 14.1). A second action was the estab-lishment of a network of reference farms for determination of minimal necessarypesticide use levels. A third action was to support the development and implemen-tation of innovations for integrated plant protection. Other actions are aimed to-wards improving compliance with Maximum Residue Limits (MRLs), managementof “hot spots”, improvement of professional knowledge, keeping records of pesti-cide use, improvement of plant protection inspections, provision of more and betterprofessional information, development and introduction of modern plant protectionequipment, use of national and regional support programs for IPM and organicfarming, co-operation with trade organisations and the food processing industry,and improvement of consumer information. Risk indicators were established usingmodels such as SYNOPS (Gutsche and Strassemeyer 2007). Simulations indicatethat the relative risk has decreased since 1987 (baseline), particularly in the case ofinsecticides.
Table 14.1 Intensity of pesticide use (treatment index) in field crops in Germany (2000) [Means(S.D.)] (Rossberg et al. 2002)
Crop Herbicides Fungicides Insecticides Growth regulators(Number of farms)
Winter wheat 1.37 (0.67) 1.39 (0.78) 0.36 (0.59) 0.62 (0.50)(790)Winter barley 1.07 (0.53) 1.10 (0.60) 0.10 (0.35) 0.49 (0.50)(724)Rape 1.18 (0.54) 0.68 (0.61) 1.44 (0.91) 0.12 (0.24)(644)Maize 1.22 (0.48) 0 0.03 (0.17) 0(489)Potatoes 1.55 (0.85) 6.08 (3.26) 0.94 (1.14) 0(130)Sugar beet 2.59 (0.95) 0.15 (0.35) 0.19 (0.55) 0(382)
444 B. Freier and E.F. Boller
14.3.3.3 IPM and Sustainable Agriculture in Switzerland, a Non-EU Country
In 1993 the Swiss government introduced a new system of direct payments basedon defined achievements obtained by individual farms, as measured using targetenvironmental and animal welfare parameters. Today, over 97% of all Swiss farmsparticipate in this voluntary program. Some 10% follow organic guidelines and theothers follow IP or production schemes with near-IP standards. The federal programendeavours to achieve significant nationwide improvement concerning the reductionof pesticide, nitrogen and phosphorous inputs, the conservation of soil fertility, theincrease of biodiversity and the implementation of animal production schemes re-specting animal welfare. Most of the target parameters have an important impact onthe effectiveness of IPM in the context of sustainable production systems, as wasshown by a federal monitoring program (BLW 2005).
14.4 IPM/IP Research and Implementation
IPM and IP research is supported by special projects or research programs sponsoredby European countries and the European Union. These research activities focus onthe development and implementation of single-method and holistic concepts. TheIOBCwprs (West Palaearctic Regional Section) and IOBCeprs (East Palaearctic Re-gional Section) Working Groups have proved to be the most important platforms forcommunication and coordination of IPM research in Europe (see Section 14.4.3.1).
14.4.1 European Union
Besides existing national projects, the European Union supports joint IPM researchprojects within the 6th Framework Program (2002–2006), the theme of which was“Food Quality and Safety Priority”. This priority program for research into foodquality and safety creates a scientific basis for development of environmentallyfriendly production and distribution chains for safer, healthier and more diversefoods for European consumers. The Integrated Projects and Networks of Excel-lence are useful instruments for developing large, multi-partner research projectsthat cover entire food production chains relating to agriculture and fisheries. Detailson the 6th and new developed 7th Framework Program (2007–2014) can be foundon the EU homepage (Anonymous, 2007b). Selected projects are described below.
� MASTER (Integrated pest Management Strategies incorporating biocontrol forEuropean oilseed Rape pests, 2000–2005).
Crop protection in oilseed rape, a major European crop, currently relies onpesticides and lags behind recent scientific advances. As a trans-European collabo-rative experiment, MASTER developed and evaluated economically viable and en-vironmentally less harmful IPM strategies for oilseed rape. These strategies shouldmaximise biological control of pests and minimise pesticide use by enhancing natu-

14 Integrated Pest Management in Europe 445
rally occurring natural enemies of the pests. Indicators of crop performance, pest anddamage incidence and cost-benefit assessments were used in the evaluation. Guide-lines for end-users and a phenological model for decision-making were produced.New information on the pest/natural enemy community in the crop ecosystem andnew insight into the socio-economic processes affecting new technology adoptionby farmers were acquired.
� ENDURE (Diversifying crop protection, European Network for the DURableExploitation of Crop Protection Strategies, 2007–2010).
This project was founded to develop international communication for establish-ing sustainable plant protection strategies in Europe, with a particular focus on IPM.ENDURE was launched by the European Union with a budget of over C- 11.2 mil-lion for a term of four years (2007–2010). Seventeen institutions from 12 Europeancountries are involved into this joint project, which covers the following three fieldsof activities:
(a) Network-buildingENDURE identifies the areas of competence covered by each institution andelaborates scenarios regarding the future of crop protection. Scientific infras-tructure is provided by networking the best facilities and know-how availableamong partners. Information and knowledge are compiled in a database.
(b) Joint research programENDURE aims to optimise plant protection towards more integrated strategiesand to reduce pesticide use. Case studies were used to assess how existing andnew practices, tools and evaluation methods can be better adapted by growers.
(c) Dissemination of results and knowledge.Activities include the organisation of pilot training sessions with farmers, ex-tension services and facilitators involved in crop management and promotionof the transfer of technologies. The project provides doctoral programs in cropprotection research and organises summer school courses for young scientists.Finally, ENDURE aims to promote the dialogue with stakeholder and end-users.
� COST (European COoperation in Science and Technology) projects are low-budget projects aimed at promoting co-operation and communication betweenEuropean research groups. Furthermore the European Union also promotes pol-icy support actions which are also low-budget projects for financing joint expertmeetings. The following project is such an example.
� REBECA (REgulation of Biological Control Agents, 2004–2008).
Invertebrate biological control agents, including nematodes, mites and insects,are safe for users, consumers and the environment. However, since the spread ofthe coccinellid Harmonia axyridis in Central Europe environmentalists have beenconcerned about possible hazards related to the use of exotic beneficials, althoughno evidence exists about a replacement of indigenous coccinellid populations andno major damage due to the use of exotics in Europe has been observed. Out of17 European countries, eight already regulate the use of invertebrate biocontrol

446 B. Freier and E.F. Boller
agents, four are preparing a regulatory system and five have no regulation in place.Biocontrol agents have become an important part of plant protection in Europeanhorticulture with an annual turnover of approx. C- 150 million. Thus, exaggeratedregulatory requirements could significantly impact the future of biological control.The REBECA Action proposes alternative, less bureaucratic and more efficient reg-ulatory procedures that maintain the same level of safety for human health and theenvironment but accelerate market access and lowering registration costs. Stake-holders presented results on how to regulate biocontrol agents according to a hierar-chical system taking into account establishment, dispersal, direct effects and indirecteffects of biocontrol agents. The methodological and financial problems concerningthe assessment of environmental risks were also discussed. For further informationon the progress of this Action, see Anonymous (2007c) and the recent Europeanbook by Bigler et al. (2006).
14.4.2 National Projects
The first Europe-wide, national projects on the implementation of IPM were laun-ched in the 1970s and 1980s. They were first and most frequently performed inpome fruit and grape growing, but also in vegetable growing, glasshouse horticultureand arable cropping. Examples include the Lautenbacher Hof project in Germany(El Titi and Landes 1992) and the Nagele farm experiment in the Netherlands(Wijnands 1997).
In Great Britain, the “Integrated Farming Systems” project was conducted from1992–1997 on six farms situated in the main arable farming areas of the UK. Thework was incorporated in the LINK Program entitled “Technologies for sustainablefarming systems” (Tzilivakis et al., 2004). The aim of the project was to developan arable integrated system of production that included IPM while maintainingprofitability by using a different balance of lower inputs and reduced environmen-tal impact than conventional systems. The overall results show that profitabilitycan be maintained in an integrated system. Savings on pesticide costs averaged£ 32/ha. The greatest percentage savings were achieved with plant growth regu-lators, followed by fungicides, herbicides and insecticides. The number of pesticidetreatments was also reduced by 26% (1.2 treatments). Compared with conventionalmethods, 32% fewer pesticide units with 18% less active ingredient by weight wereused. Populations of earthworms, carabids and spiders hardly ever benefited fromintegrated systems; their densities were more strongly influenced by site, season andcrop (Holland et al., 1998).
The LEAF (Linking Environment And Farming) initiative supports the imple-mentation of IPM in Great Britain. Participants demonstrate integrated farmingprinciples in a nationwide network of volunteer demonstration farms on which theycarry out integrated farming and show other farmers how to adopt it.
INTEX (INTegrated Arable Farming Systems in EXperiment and Practical Ex-perience, 1990–2002). Summarizing the 13-year data from field experiments at twosites near Goettingen (Germany) and from model farms in Central Germany, inte-

14 Integrated Pest Management in Europe 447
grated farming reduced the frequency of pesticide use relative to the frequencies inconventional farming (GPP). With respect to differences in pesticide costs in wheat,the integrated system achieved potential savings of 40–55%, but did not result in adifference in the gross margin for the whole crop rotation. The results from demon-stration farms even showed that the farmers who implemented the complete packageof integrated farming package suffered financial losses (Steinmann, 2003).
Past and current projects show that IPM can be adapted within IP systems invegetable, fruit and grape growing. If “premium quality” product labels are therebyestablished, the market will reward these efforts. In arable cropping, however, thereis still no comprehensive IPM concept being implemented in practice. The currentstandard of plant protection in arable crops is GPP, which does still not completelymeet the requirements of IPM. However, certain IPM methods are widely used.These include the use of different action thresholds, modern computer-based de-cision support, disease-resistant cereal varieties, and situation-related timing anddosage of pesticides. Important obstacles to IPM implementation must still be over-come, particularly in arable cropping. These include:
– The lack of official, uniform Europe-wide general IPM standards (minimal re-quirements) and a uniform label for products produced in accordance with thesestandards,
– The lack of additional profits for using IPM standards,– The difficulty of implementing (handling) IPM in practice, which needs special
user support. But the capacity of national plant protection advisory services isreduced in most European countries.
14.4.3 Non-governmental Organisations (NGO’s)
Non-governmental environmental and consumer protection organisations are alsointerested in the theory and practice of IPM for reduction of pesticide dependencyand minimisation of risks associated with pesticide use. We present here IOBC, IPMEurope and PAN as representatives of NGO’s that act Europe-wide and world-wide.
14.4.3.1 IOBCwprs and eprs Working Units
The IOBC was originally established in Europe in 1956. In 1971, the name waschanged to IOBC Global with six regional sections operating in Western Europe(WPRS), Eastern Europe (EPRS), North America (NRS), South America (NTRS),Pacific and Asian region (APRS) and Africa (ATRS) (www.iobc-global.org). IOBCGlobal has nine working groups that cover various aspects of specific pests andweeds.
The Western European section WPRS (West Palaearctic Regional Section; www.iobc-wprs.org) is not only the oldest, but also has the largest number of workingunits, which are listed below. Those in bold-face are crop oriented “WorkingGroups”, and those in regular type are “service units” providing specific information.

448 B. Freier and E.F. Boller
IOBCwprs working units as of 2005, including year of establishment (inbrackets):
Four IOBCwprs Commissions:
� Commission for determination and identification of entomophagous insects andinsect pathogens (1956),
� Commission for Publications (1956),� Commission for Integrated production guidelines and endorsement (1974/1990),� Commission for harmonized regulation of biological control agents (2003).
Twenty IOBCwprs Working Groups:
� Integrated protection of fruit crops (1959),� Integrated protection of citrus crops (1962),� Integrated protection of olive crops (1965),� Integrated control in protected crops: temperate climate (1968),� Integrated control in protected crops: Mediterranean climate (1968),� Integrated protection in oak forests (1968),� Integrated protection in field vegetables (1970),� Integrated protection in viticulture (1974),� Integrated protection in oilseed crops (1979),� Integrated protection of stored products (1991),� Multitrophic interactions in soil and integrated control (1970),� Pesticides and beneficial organism (1975),� Pheromones and other semio-chemicals in integrated production (1975),� Breeding for plant resistance to pests and diseases (1976),� Insect pathogens and entomoparasitic nematodes (1985),� Integrated control of plant pathogens (1989),� Induced resistance in plants against insects and diseases (1999),� GMOs in integrated plant production (2001),� Landscape management for functional biodiversity (2001),� Integrated control of spider-mites (2005).
Some Eastern European countries are traditionally involved in IOBCeprs (EasternPalaearctic Regional Section), which was established in 1977. To date, six Com-missions and 16 working groups have actively worked within the framework ofIOBCeprs (Sosnowska et al. 2006).
14.4.3.2 IPM Europe
IPM Europe was established in 1993 to promote the implementation of IPM inEurope. Its first Secretariat was located at the University of Greenwich, Kent, UK.The Secretariat has been hosted by the GTZ (Deutsche Gesellschaft fur TechnischeZusammenarbeit) in Eschborn, Germany, since 2002. Activities, results and obsta-cles to IPM implementation were discussed by IPM Europe in a publication entitled“Concerted European Policy on IPM in International Co-operation, a Framework

14 Integrated Pest Management in Europe 449
towards a Strategy” (1998). Its main focal points for changes in European plantprotection policy were:
– Establishing common European IPM guidelines based on a set of agreedprinciples,
– Strengthening partnerships with key stakeholders,– Promoting effective utilisation of European resources and– Establishing of national IPM development committees.
However, this publication has not had much influence on European policy so far.In 2000 the IPM Europe Secretariat published “Guidelines for IPM Planning:
Donors – Harmonisation of European Support to Developing Countries in the Useof IPM to Improve Agricultural Sustainability.” Apart from the European Union, thiskey document addressed European development agencies concerned with researchand development activities with an IPM component. These guidelines are also veryhelpful for preparing, monitoring and evaluating IPM activities in developing coun-tries (Dreyer et al. 2005).
14.4.3.3 PAN
PAN (Pesticide Action Network) is a worldwide network established to replace theuse of hazardous pesticides with ecologically sound alternatives. The very activePAN-Europe group organised a meeting in 2006 to analyse the status quo of IPM inEurope, the effects of reducing pesticide use and obstacles to adapting IPM (Anony-mous 2007d).
14.5 Standards and Guidelines for Food Safety and IntegratedProduction (IP) in Europe
As outlined in Section 14.2.2, new international standards for food safety emergedin the late 1990s. Most of them (e.g. the internationally applied EUREP-GAP/GLOBAL-GAP standard) focus on food safety but also contain rather generalrecommendations concerning Good Agricultural Practice and IPM. Currently, IPguidelines seem to be the best way to implement IPM in practice. In Germany, Italy,Spain, Switzerland and other countries guidelines for IP label programs inspired bythe IOBC standards, particularly in fruit and vegetable growing, have been used formany years (Wiegand et al. 2004).
14.5.1 The IOBC Guidelines for Integrated Production (IP)
The basic IOBC document for the establishment of crop-specific IP guidelinesis the 3rd edition 2004 of “Guidelines for Integrated Production: Principles andTechnical Guidelines” – referred to as “IOBC Standard 2004 for Integrated Pro-

450 B. Freier and E.F. Boller
duction” (Boller et al. 2004a, www.iobc.ch). The first edition in 1993 attempted toprovide a conceptual umbrella for IP considering the concepts established by thehistoric “Message of Ovronnaz” (Steiner, 1977) and the developments in Europeduring the 1980s. IP standard 2004 introduces a total quality approach. Aspectscovered include product quality, production quality, ethical quality and social im-pact, consumer perceptions, food safety, environment, animal welfare and workers’health, safety and welfare. Hence, the IOBC standard 2004 incorporates elementsof other international standards addressing food safety issues (e.g. GLOBAL-GAP)and social aspects (ILO charter) in order to make it compatible with these stan-dards. However, the field of competence of the IOBC is and remains biological pestcontrol, IPM and its incorporation into holistic IP-programs. This basic documentincludes Technical Guidelines I (requirements for organisations and their members)and Technical Guideline II (general agronomic requirements valid for all crops).Crop-specific guidelines (Technical Guidelines III) are established by the IOBCCommission on “IP Guidelines and Endorsement” in close collaboration with therespective crop-oriented IOBC working groups and ad hoc expert panels. They areupdated every 5 years and cover the most important crops of the temperate zones:Pome fruits (1991, 1994, 2002), arable crops (1997), stone fruits (1997, 2003),grapes (1999, 2008), soft fruits (2000), olives (2002), citrus (2004), and field grownvegetables (2005). The guidelines published before 2004 are now being revised andadapted to the new IOBC Standard 2004. All of these documents serve to provide aframework for the formulation of regional or national guidelines according to IOBCstandards and to facilitate their harmonisation.
The chapters of crop-specific guidelines follow the same pattern and cover thefollowing topics: 1. General aspects (e.g. definition and objectives of IP; traceabil-ity; self-evaluation by farmers); 2. Biological diversity and landscape (ecologicalinfrastructures; buffer zones); 3. Site selection; 4. Site management (e.g. crop rota-tion; soil management, soil protection); 5. Cultivars, seeds, and cultivation systems;6. Nutrition; 7. Irrigation; 8. Integrated plant protection (the principles; the choiceof direct control measures; the green and yellow lists of plant protection measures;storage and handling of pesticides); 9. Harvest; 10. Post-harvest procedures; 11.Animal production on mixed farms; 12. Workers’ health, safety and welfare. All ofthese documents can be downloaded in full text from the website of the Commission(www.iobc.ch).
14.5.2 Endorsement Service
The Commission on “IP Guidelines and Endorsement” operates on behalf of theIOBC an international endorsement service for regional IP organisations workingaccording to IOBC standards. Given the worldwide interest in these activities, IOBCGlobal has given the Commission the mandate to extend its endorsement system totemperate zones outside Europe. In 2001, LIVE, the grape growers’ organisation inOregon (USA), was the first extra-European group endorsed by the IOBC. All IOBC
14 Integrated Pest Management in Europe 451
check-lists for the endorsement process are available in full text on the websitewww.iobc.ch.
14.6 Tools for Implementation of IPM and IP
14.6.1 Tools Developed by EU Research and DevelopmentPrograms
IPM, which aims to minimise pesticide usage to the necessary minimum, contributesto reducing the dependency on chemical pesticides and risks associated with pesti-cide usage.
14.6.1.1 Indicators of Pesticide Use Intensity
The intensity of pesticide use can be characterised in different ways:
– kg pesticides (or active substances) sold per country or farm,– kg pesticides (or active substances) per hectare farmland, crop or field,– Treatment frequency in a defined area (region, farm, crop in a farm or field),
Treatment index (= Treatment Intensity Index, Treatment Frequency Index orFrequency of Application) in a defined area (region, farm, crop in farm or field).
The treatment index appears to be a suitable indicator of pesticide use intensity.
Definition
The treatment index represents the number of pesticide treatments in an area con-sidering reduced dosages and treatments in partial areas. Each pesticide in tankmixtures is calculated separately.
Sample calculations:
� One treatment with the authorised dosage in the total area: 1.0,� One treatment with the half dosage in the total area: 0.5,� One treatment with the half dosage in half the total area: 0.25.
Examples for use of treatment index were presented in Section 14.3.5.2(Table 14.1).
14.6.1.2 Environmental Risk Indicators
Environmental risk indicators are useful for demonstrating potential ecological ef-fects of plant protection strategies or for evaluating possible advantages of IPM.In Europe, experts from different countries co-operate to find suitable approaches

452 B. Freier and E.F. Boller
to estimate the ecological risk of practical pesticide use on a regional, farm andfield scale (Reus et al. 2002). Most of the experts are organised within HAIR(HArmonised environmental Indicators for pesticide Risk, 2004–2007), a projectof the European Union. HAIR will deliver a set of indicators to assess pesticideimpacts on agro-ecosystems and human health. As such, the project will:
� Establish a consistent database structure for parameters affecting pesticide risk(e.g. land use, toxicological properties, soil type, climate, etc.),
� Provide a standardised set of indicators for predicting pesticide risk in the ex-panded European Union,
� Validate indicators of risk using existing datasets,� Utilise GIS-based information to provide outputs on different regional and
European scales and� Deliver an integrated and user-friendly software tool for predicting overall pesti-
cide risk.
Outputs of risk model calculations are relative values, not data describing anabsolute risk.
Other risk indicators were used for consumer risk calculations, e.g. the number(rate) of samples with residues and the number (rate) of cases exceeding maximalresidue levels.
14.6.2 The IOBC Toolbox
In 2001, the Commission established an “IOBC-Toolbox” designed to assist IP or-ganisations establish their own IP concepts and programs (www.iobc.ch). Thesetools include the IOBC database on the selectivity of pesticides, examples of thegreen and yellow lists of plant protection measures, the IOBC software programSESAME used for inspecting and analysing IP farms of IOBC-endorsed organisa-tions, and an Ideabook on ecological infrastructures at the farm level (Boller et al.2004b).
References
Anonymous. 1998. Plant protection act. Germany (In German). Bundesgesetzblatt I, 950.Anonymous. 2002. EPPO Standards. Good Plant Protection Practice. PP 2/1–26, Vol. 1 and 2.
EPPO, Paris, France.Anonymous. 2006a. Proposal for a Regulation of the European Parliament and of the Council
concerning the Placing of Plant Protection Products on the Market. COM (2006)388 final,2006/0136 (COD): 1–76.
Anonymous. 2006b. Proposal for a Directive of the European Parliament and of the Council Es-tablishing a Framework for Community Action to Achieve a Sustainable Use of Pesticides.COM(2006) 373 final, 2006/0132 (COD): 1–43.
Anonymous. 2007a. EU Member States Reduction Programmes for Plant Protection Prod-ucts, http://www.bba.bund.de/nn 1150582/EN/Home/Reduction of PlantProtection/Reductionof Plant Protection node.html.

14 Integrated Pest Management in Europe 453
Anonymous. 2007b. EU-AgriNet. European Commission, Research, Agriculture, http://ec.europa.eu/research/agriculture/index en.html.
Anonymous. 2007c. REBECA. Regulation on Biological Control Agents, www.rebeca-net.de.Anonymous. 2007d. 2006 Annual Network Conference: Alternatives to Chemical Crop Pro-
tection for the Reduction of Risks and Pesticides Dependency, Bologna, Italy. http://www.pan-europe.info/conferences/AnnualConf2006.shtm
Bigler, F., Babendreier, D. and Kuhlmann, U. (eds). 2006. Environmental Impact of Inverte-brates for Biological Control of Arthropods: Methods and Risk Assessment. CABI Publishing,Cambridge, MA. ISBN-10: 0-85199-058-4; 299 pp.
BLW. 2005. Bundesamt fur Landwirtschaft, Bern. Evaluation der Oekomassnahmen und Tierhal-tungsprogramme 1994–2005. www.blw.admin.ch
Boller, E.F., Avilla, J., Gendrier, J.P., Joerg, E. and Malavolta, C. (eds). 1998. Integrated pro-duction in Europe: 20 years after the declaration of Ovronnaz. IOBCwprs Bulletin 21(1):41www.iobc.ch.
Boller, E.F., Avilla, J., Joerg, E., Malavolta, C., Wijnands, F.G. and Esbjerg, P. 2004a. Guidelinesfor Integrated Production: Principles and Technical Guidelines. 3rd ed. 2004. IOBCwprs Bul-letin Vol. 27(2), 49pp. ISBN 92-9067-163-5, internet www.iobc.ch.
Boller, E.F., Hani, F. and Poehling, H.-M. 2004b. Ecological Infrastructures – Ideabook on Func-tional Biodiversity at the Farm Level. xiv + 212 pp., ISBN 3-906776-07-7; overview on internetwww.iobc.ch/toolbox.
Boller, E.F., van Lenteren, J.C. and Delucchi, V. (eds). 2006. IOBC – History of the First 50 Years(1956–2006). xi + 275 pp. Ponsen & Looijen Wageningen, ISBN: 92-9067-194-5. See alsoshort version on www.iobc-wprs.org.
Burth, U., Freier, B., Hurle, K., Reschke, M., Schiller, R., Stein, B. and Westphal, D. 2002. Princi-ples of integrated plant protection (Abstract in English). Nachrichtenbl. Deut. Pflanzenschutzd.54:208–211.
Cadahıa Bielza, J.I. 2003. Actuality of integrated production in Spain. Identification of a nationalguarantee. Agricultura, Revista Agropecuaria 72(855):662–665.
Carson, R. 1962. Silent Spring. Mifflin, Boston.Dreyer, H., Fleischer, G., Gassert, W., Stoetzer, H., Deguine, J.-P., La Porta, N. and Kiss, J. 2005.
IPM Europe: The European network for integrated pest management in development coop-eration. Proceedings EFARD 2005 Conf. Agricultural Research for Development: EuropeanResponses to Changing Global Need. pp. 1–6 Zurich, Switzerland.
El Titi, A., Boller, E.F. and Gendrier, J.P. (eds). 1993. Integrated Production: Principles and Tech-nical Guidelines. IOBCwprs Bulletin 16(1): English, French, German, 96pp.
El Titi, A. and Landes, H. 1992. Integrated Farming System of Lautenbach: A practical contribu-tion toward sustainable agriculture in Europe. In: Edwards, L., Madden, M. and House (eds),Sustainable Agricultural Systems. Verlag Soil and Water Conservation Society, pp. 265–287.
Eurostat 2007. The Use of Plant Protection Products in the European Union, Data 1992–2003.Eurostat Statistical Books, European Communities, Luxembourg.
F.A.O. (Food and Agriculture Organization). 1968. Report FAO Panel of Experts on IntegratedPest Control. 1st Meeting, September 18–22, 1967. Rome. Italy. FAO-UN Meeting ReportPL/1967/M/7, 19pp.
Gutsche, V. and J. Strassemeyer 2007: SYNOPS – a model to assess the environmental risk poten-tial of pesticides. Nachrichtenbl. Deut. Pflanzenschutzd 59:197–210.
Holland, J.M., Cook, S.K., Drysdale, A.D., Hewitt, M.V., Spink, J. and Turley, D.B. 1998. Theimpact on non-target arthropods of integrated compared to conventional farming: Results fromthe LINK Integrated Farming Systems project. Proceedings 1998 Brighton Crop Prot. Conf.,Pests & Diseases. Brighton, pp. 625–630.
Kudsk, P. 1989. Experience with reduced herbicide doses in Denmark and the developmentof the concept of factor-adjusted doses. 1989 Brighton Crop Prot. Conf., Weeds., Brighton,pp. 545–554.
Minks, A.K., Blommers, L.H.M., Ramakers, P.M.J. and Theunissen, J. 1998. Fifty years of bi-ological and integrated control in Western Europe: Accomplishments and future prospects.

454 B. Freier and E.F. Boller
Mededelingen Faculteit Landbouwwetenschappen Rijksuniversiteit Gent 63/2a:165–181.Nistrup Jorgensen, L. 2003. Denmark action plans for pesticides – stats and role of research. Pro-
ceedings Workshop on Thematical Reduction of Pesticides, Brussels, Belgium.Picket, A.D., Putman, W.L. and LeRoux, E.S. 1958. Progress in harmonizing biological and chem-
ical control of orchard pests in Eastern Canada. Proceedings 10th Int. Congress of Entomology,Montreal 1956, Vol. 3, pp. 169–174.
Reus, J., Leendertse, P., Bockstaller, M., Fomsgaard, I., Gutsche, V., Kewis, K., Nilson, C., Pusse-meier, L., Trevisan, H., van der Werf, H., Alfarroba, F., Blumel, S., Isart, J., McGrath, D. andSeppala, T. 2002. Comparison and evaluation of eight pesticide environmental risk indicatorsdevelopment in Europe and recommendations for future use. Agriculture, Ecosystems, Environ-ment 90:177–187.
Rossberg, D., Gutsche, V., Enzian, S. and Wick, M. 2002. Neptun 2000 – Survey into Applicationof Chemical Pesticides in Agricultural Practice in Germany. Berichte BBA 98, Braunschweig,Germany.
Sosnowska, D., Lipa, J.J. and van Lenteren, J.C. 2006. History and activities of the East PalearticRegional Section of IOBC. In: Boller, E.F., van Lenteren, J.C. and V. Delucchi (eds). IOBC –History of the first 50 years (1956–2006) Ponsen & Looijen Wageningen, Netherlands.pp. 91–95.
Steiner, H. (ed). 1977. Vers la production agricole integree. IOBCwprs Bulletin 1977/4:153 pp.Steinmann, H.-H. 2003. Integrated arable farming systems in experiment and practical experience –
results of the INTEX project and its demonstration fields. In: Steinmann, H.-H. (ed) Inte-grierte Ackerbausysteme in Versuch und Praxis. Verlag Mecke Druck, Duderstadt, Germany,pp. 145–155.
Stern, V.M., Smith, R.F., van den Bosch, R. and Hagen, K.S. 1959. The integration of biologicaland chemical control of the spotted alfalfa aphid. The integrated control concept. Hilgardia29:81–101.
Tzilivakis, J., Turley, D.B., Lewis, K.A., Ogilvy, S.E. and Lawson, K. 2004. Assessing the envi-ronmental impact of different crop protection strategies. Agronomie 24:67–76.
Wiegand, G., Sessler, B. and Becker, T. 2004. Controlled-integrated production of fruits and veg-etables – a European comparison of cultivation guidelines and control procedures. Schriften-reihe des Bundesministeriums fur Verbraucherschutz, Ernahrung und Landwirtschaft, Reihe A,Angewandte Wissenschaft (505):1–198.
Wijnands, F.G. 1997. Integrated crop protection and environment exposure to pesticides: methodsto reduce use and impact of pesticides in arable farming. European Journal of Agronomy 7:251–260.

Chapter 15IPM Programs in Commonwealthof Independent States and Russia
Eugeny S. Sugonyaev
Abstract Main principles of ecological approach to pest and its enemy managementboth in annual and perennial agro-ecosystem are discussed. The author’s approach tocotton protection is orientated towards an elaboration of pest and its natural enemymanagement strategy. It is based on the usage of environment friendly means forcotton pest management, conservation and augmentation of natural enemy popu-lations in a cotton agro-ecosystem. Correlation between arthropod species diver-sity, numbers of generalist predators, resistance of plant, and cotton pest populationfluctuations laid the foundation of two main parameters for decision making: (a)the minimal zoophage efficiency level, and (b) the dynamic threshold of main pestspecies, particularly bollworm. The full or partial replacement of broad-spectrumchemical pesticides by bacteria compound and other environment friendly meansis a basic demand of the elaborated cotton pest and its enemy programs in Turk-menistan and Tadjikistan. The significant achievements of its implementation inboth the countries during 1970s–1980s demonstrate an effectiveness and benefitsof an ecological approach to cotton protection.
At present in the southern Russia the typical feature of conventional programs ofinsecticide treatment in apple orchards is an arbitrary combination of chemical com-pounds of different characteristics in ecological sense, i.e. use of environment haz-ardous chemicals after environment friendly one and vice versa. Such alternation ofinsecticides of opposite vector will never stabilize an apple orchard agro-ecosystem.In the experimental apple pest and its natural enemy program the alternation ofonly environment friendly compounds have been used, namely, bioinsecticides:LepidocideTM, PhytovermTM, and bioregulators: Insegar, Match, Dimmilin whichall work in the same direction – stabilization of an orchard agro-ecosystem, i.e. theyhave equal vector. Under a trial of the suggested program apple fruit damaged bycodling moth has been 1.2% in the harvest (ET is 5% of damaged fruit).Thus thepossibility of codling moth management without the use of broad-spectrum chemi-cal pesticides in practically possible.
E.S. Sugonyaev (B)Laboratory Experimental Entomology and Bio-Control, Zoological Institute, Russian Academy ofSciences, 199034 St. Petersburg, Russiae-mail: [email protected]
R. Peshin, A.K. Dhawan (eds.), Integrated Pest Management: Disseminationand Impact, DOI 10.1007/978-1-4020-8990-9 15,C© Springer Science+Business Media B.V. 2009
455

456 E.S. Sugonyaev
Keywords Cotton bollworm · codling moth · economic threshold · speciesdiversity · natural enemy · monitoring · ecological stabilization
15.1 Introduction
In 1970s–1980s of the last century in the Union of Soviet Socialist Republics(USSR) a classical biological control occupied a considerable sector in plant protec-tion system in the country covering an area of 20–25 million hectares annually. Thebio-plants network has provided cooperative farms and other agricultural enterpriseswith living natural enemies (Trichogramma spp. mainly) and bacteria compounds invery large quantities.
However, integrated pest management (IPM) program based on mass rearing andrelease of natural enemies and microbiological insecticide application only has beenused in some large–scale greenhouses. As an exception, in the same period of time,the significant progress in development of cotton pest management program wasachieved in some Central Asian republics – the process in which the author wasinvolved for a long time. I suppose my own experiences will be useful for the furtherinterpretation of attained results.
Data obtained in an apple orchard in North-West Caucasus recently will be in-teresting for an understanding of pest and its natural enemy management problemsunder the condition of perennial agro-ecosystem.
15.2 Part I: Cotton pest and Its Natural Enemy Management
Evolution of integrated pest management concept and its derivative ecological ver-sions (Tshernyshev 2001; Sugonyaev and Monastyrskii 1997, and suggested in thischapter) is closely aligned with cotton insect pest problems and the widespread useof pesticides on the crop. Cotton is a real model for development of ecologicalapproach to a solution of crop pest and its natural enemy management tasks inannual crops.
The Cotton Belt in the Commonwealth Independent States (CIS) occupies anarid territory stretching along the border of Iran in Transcaucasica in the west andAfghanistan in Central Asia in the east.Climatic condition for a cotton growing de-termines both the production system and the spectrum of arthropod pests. Springfrosts often destroy cotton seedlings, necessitating resowing. Late-sown cottonfields (in half of May) are common in many areas. In general, the growing season be-gins in early April and ends in late August. Severe winters and short season influencethe range of insect pests. Some subtropical specialized cotton pests [Pectinophoragossypiella, Earias insulana (Lepidoptera), etc] are absent while generalists arecommon. The dominant and regular pests are: sucking species – Tetranichus telar-ius (Tetranichidae), Thrips tabaci (Thripidae), Bemisia tabaci (Aleyrodidae), Aphiscraccivora, A. gossypii, Acyrthosiphon gossypii (Aphididae), Lygus gemellatus

15 IPM Programs in Commonwealth of Independent States and Russia 457
(Miridae), gnawing species – Agrotis segetum, Spodoptera exigua, Helicoverpaarmigera (Noctuidae). The last species is a key pest, which causes highest losses.The dynamic of population density of cotton bollworm is characteristic of twopeaks: the first one is in the middle – late June (the 1st generation), the secondis in the middle of July and the beginning of August (the 2nd generation). The 3rdgeneration takes place in August – September. Moreover, it is known that caterpil-lars of the 2nd generation are most injurious (see below) while caterpillars of the3rd generation do not cause any injury. The numbers of cotton aphids complex andspider mite are most in the beginning – middle of July and in August – Septemberwhile other sucking species (tarnished plant bugs, cicadellids) reach the maximumin middle of August and in the beginning of September, i.e. in the end of the growingseason.
15.2.1 The History of the Cotton Pest and Its Enemy ManagementConception Development
From the 1950s to the 1980s cotton pest management in the USSR passed througha series of phases (Sugonyaev 1977; 1994). During late 1950s and 1960s chemicalcontrol was a single method of the crop protection. A combination of artificiallylow economic threshold (ET) of cotton bollworm – 2 to 3 caterpillars per 100 cottonplants–provoked frequent, universal, broad-spectrum insecticide treatments, gradualselection of resistant strains of the bollworm and other cotton pests, and suppres-sion of natural enemies activity. This created a system of increasing dependence onpesticides that resulted in up to 10–12 applications per season (Sugonyaev 1977;Kovalenkov and Aleshev 1977). As a result, the pesticide load per hectare in cotton-growing areas was 10 times higher (about 30 kg/ha) than the mean index throughoutthe country (Sugonyaev, 1994). But the heavy usage of pesticides did not preventharvest losses caused by pests (Narzikulov and Kovalenkov, 1977). General har-vest losses were estimated at about 30%. In addition, pesticide pollution seriouslythreatened the environment and health of the people.
An unfavourable situation in cotton production prompted Agricultural Ministryof USSR to find causes of such development of events. In 1966 on the initiative ofMr. L.S. Drozdov, Head Department of Outward Plant Quarantine, Dr. M. V. Stol-yarov, entomologist of All-Union Institute of Plant Protection, Leningrad, and theauthor investigated the situation in cotton production in Afghanistan. The objectivewas to find an answer to the question – why cotton bollworm does not damagecotton seriously at the left bank of Amu-Dariya River, in Afghanistan, as it does atthe right bank, in the USSR?
The study of the cotton arthropod community in North Afghanistan (The Na-tional Agriculture Station in Baglan-city, Baglan Province) in 1966–1968, where notreatments with pesticides were done, revealed a great share of insect zoophagousspecies in the cotton field (Sugonyaev et al., 1968, 1971; Sugonyaev, 1969, 1979;Stolyarov et al. 1974a). From approximately 120 dominant and common regular

458 E.S. Sugonyaev
arthropod species inhabiting in cotton field in North Afghanistan, 20% of speciesfall into plant–feeding category (including 2% of injurious species), 49.1% ofspecies are predators and parasites, and 30.9% of species are so called «indifferent»ones. Species of natural enemies form a specific complex characteristic for the givenagro-ecosystem during the whole season. Field surveys showed that initial situationinformation of the cotton arthropod community in a given field during a definite pe-riod of time determines a pattern of species population fluctuation. Total abundanceof arthropods is higher in the early-sown cotton field (middle April) (left part ofdotted curve in Fig. 15.1) than the same in the field with a late sowing time (middleMay) (left part of unbroken curve). As a result, the total number of species (mostlycotton aphid, Aphis gossypii) in the late-sown field was 12 times higher than thesame in the early-sown one i.e. the former may be characterized as an unsteadyfield while the latter is a steady one (Fig. 15.1). More detailed analysis has revealedthe higher population density of potential aphidophagous species in the early-sowncotton fields with their mild microclimate towards middle half of June (Fig. 15.2A)after their migration from the withering wild landscape. The opposite picture isobserved in the late-sown cotton field (Fig. 15.2B). The ratio of natural enemies tothat of aphids in an initial period of growing season in fields of both types determinesthe aphid population fluctuations and absence or presence of injury (Fig. 15.2A, B,the aphid numbers in relation of ET).
Similar course of events was observed regarding the population fluctuationsof the spider mite (Tetranicus telarius) and the big cotton aphid (Acyrthosiphongossypii). Eventually the important role of aphidophages and general predator’s
10
100
1000
10000
100000
June
July
July
Aug
ust
Aug
ust
Sep
tem
ber
Sep
tem
ber
Sep
tem
ber
Oct
ober
Oct
ober
Oct
ober
Nov
embe
r
Nov
embe
r
12
Fig. 15.1 The dynamics of total numbers of harmful and beneficial insects both in early (1) and latesown (2) cotton fields (see in text also). On ordinate axis – numbers, logarithm scale; on abscissaaxis – date

15 IPM Programs in Commonwealth of Independent States and Russia 459
VI VII VIII IX X XI
VI VII VIII IX X XI
54
A
B
1
23
5
4
1
2
3
+4
+3
+2
+1
0
–1
–2
+4
+3
+2
+1
0
–1
–2
–3
Fig. 15.2 The dynamics of cotton aphid (Aphis gossipii) (1) and its natural enemy (2) populationdensity both in the early (A) and late-sown (B) cotton fields, 3 – the ratio aphidophages: aphids,4, 5 – the threatening and operative levels of the ET, respectively. On ordinate axis – logarithm ofpopulation density and ratio aphidophages: aphids; on abscissa axis – date
activity for aphid population regulation were proved by the field check experi-ment when natural enemies in half of the plot were eliminated with DDT treatment(Stolyarov et al. 1974b). Cotton bollworm, during of whole period of investigationin North Afghanistan did not attain the status of potential pest (Table 15.1) as aresult of natural enemies pressure (Stolyarov et al. 1974b).
Thus, in North Afghanistan population density fluctuations in cotton ecosystemwas associated with arthropod species that were determined by factors of naturalcontrol, particularly by general predators activity, where pesticides were not appliedfor cotton protection on a large scale. In general terms, a constant relation of cer-tain natural enemies with a biotope, their polyphagy and considerable numerical

460 E.S. Sugonyaev
Table 15.1 The damage potential of cotton bollworm in the Baglan area, Afghanistan (1966–1968)
Year Plantsexamined
Quantity ofgenerativeorgans
Damaged bycotton bollwormcaterpillars
Number ofcaterpillars
Number %
1966 2000 26650 72 0.27 131967 1300 13030 62 0.52 241968 1350 14300 31 0.21 8
abundance determine their important function as «a biological barrier» preventingpest species reproduction (Sugonyaev, 1969).
The data obtained in North Afghanistan showed that an activity of natural enemypopulations is an important natural resource which must be conserved for futurecotton pest management program. This stimulated a formation of my concept of pestand its enemy management. Pests and its natural enemies are the links of a singlefood chain in a given agro-ecosystem, and there is a necessity of their maintenancein a definite quantitative frame acceptable from the economic point of view. Thus,definite ground for an agro-ecosystem stabilization is created.
At present, conventional IPM programs are successive series of operations basedon an economic threshold (ET) of a given key pest and do not take into account nat-ural enemies activity. As fast as a pest population density reaches ET one perceivesthis event as a signal for the treatment of a given crop with pesticide, i.e. ET worksas a trigger. However, such approach to plant protection contradicts the ecologicalprinciples of the early IPM conception orientated on an use of natural enemy ac-tivity as an important component of IPM (Bartlett, 1956; Huffaker and Messenger,1964; Stehr, 1975; DeBach and Rosen, 1991). That is why emphasis on includingin the definition the concept of the word «enemy» – pest and its enemy manage-ment (PEM).
But in 1968, High Board of Agriculture Ministry of USSR, the official plantprotection circles did not accept my concept of cotton pest and its enemy man-agement on ecosystem basis. Their rejection was motivated by the premise: that aplant protection innovation has been developed under the condition of private smallfarms, thus not suitable for «an industrial socialistic agriculture» (Sugonyaev, 1977).Nevertheless in Zoological Institute of the USSR Academy of Sciences where anintellectual independence and fundamental knowledge development takes place,our data from Afghanistan and my conception found comprehension and furtherdevelopment.
The prerequisites of our ecological approach to a development of cotton pest andits enemy management are: (a) the known data on great extent of natural enemiesactivity that occurs naturally in agro-ecosystem; (b) the circumstance that 98–99%of all potential pests are already under a natural enemies pressure; (c) some socalled «dangerous pests» are a result of destruction of their natural enemies by useof pesticides; (d) the optimization of established natural enemies in a given agro-ecosystem through conservation and augmentation practices which are most real

15 IPM Programs in Commonwealth of Independent States and Russia 461
means of decreasing insecticidal treatments, environment pollution and reducingpest control costs.
The data and information obtained in other areas of Turkmenistan are typicalof all areas of the cotton belt of CIS. It is important that data on the great inten-sive cotton fields in the Murgab Oasis demonstrated a universality of ecologicalregularities which were revealed by us for the first time in Afghanistan on smallfarmer fields. Several years of observation on the cooperative farm «Teze durmush»(about 2000 hectares) showed that when chemical pesticide treatments were reducedby 80% in 1972 and then stopped altogether in 1973, the index of species diversity dand mean population density of general predators per single cotton plant increasednoticeably. On the whole, an increase in both the species diversity of the arthropodcommunity in general (d ranged from 220 in 1971 to 270 in 1975) and number ofpredator complex (densities per single plant ranged from 0.9 in 1971 to 3.6 in 1976)was relatively stable and changed slowly over several observation years (Sugonyaevet al., 1977; Alexeev and Niyazov, 1977).
However, under the condition of Baglan Province in North Afghanistan and in theMurgab Oasis the species diversity can change dramatically during the growing sea-son as a result of arthropod species movement both from neighbourhood localitiesand surrounding fields, particularly from alfalfa fields. Observations in early-sownfields (middle of April) and late-sown ones (middle of May) showed differencesin the cotton arthropod community. The temperature and humidity in rows undercotton canopy in the experimental fields explain this phenomenon as a result ofthe different power of both field types in their attractiveness for a settling with in-sect species, particularly predators. In the early-sown field a fast growth of cottoncreates an optimal microclimate and results in abundant plant exudates secretedby cotton leaves, which attracts adult predators, for example, lacewings (Chrysopacarnea) and coccinellid beetles. As a consequences of which, the cotton arthropodcommunity in the early-sown field develops rapidly during late May, resulting indiversity peak in late June (Fig. 15.3(1)). During the same period in the late–sownfields, because of the weak growth of cotton and an unfavourable microclimate,development of the arthropod community takes place very slowly and is ultimatelyless diverse (Fig. 15.3(2)). Thus, the characters of crop establishment and the abun-dance of natural enemies in the agro-ecosystem determine a steady or unsteadystates of field, which was confirmed by direct surveys (Sugonyaev and Kamalov,1976).
Significant correlation between diversity index values, a number of generalistpredators, and population fluctuation of cotton pests indicate that the diversity in-dex may be used to predict general trends in change of species numbers in a givenfield. These diversity–index data have been the basis for calculations of the minimalzoophage efficiency level (ZEL) required to give acceptable control of pest popula-tions. Narzikulov and Umarov (1977) studied cotton agro-ecosystem in Tadjikistanand concluded that the density of 250–300 natural enemies per 100 cotton plantsis enough in order to suppress all pest populations in a given field. They namedthis density «the entomophage effeciency level». Similar observations were madeby Sugonyaev et al., (1977) in Turkmenistan. The generalist predators, zoophages

462 E.S. Sugonyaev
40
30
20
10
01 1 1 1 12 22 22 3 33 3 3
April May June July August
1
2
Fig. 15.3 The change in the specific diversity index d on cotton fields sown in the half of April(1) (every point on the solid curve represents a mean index value over 5 years) and those sownduring late May (2) (every point on the broken curve represents a mean index value over 2 years).d = S−1
lg N , where S – the total quantity of insect species, N – the total quantity of specimens. On
ordinate axis – significance of the index d; on abscissa axis – date
attack both insect and mite pests. The ZEL has been found empirically during long-term observation of population fluctuations of both beneficial and harmful arthro-pod species in cotton fields in different areas of Turkmenistan and determined asthe average density of 3 ± 0.5 indicative zoophagous species per 1 cotton plant formanagement of pest complex in cotton (Sugonyaev, et al., 1977; Sugonyaev, 1994).
In practice, quality of indicative species of zoophages, the most common andeasily recognized in the field, are general predators and parasites and these includespredaceous bugs Nabis palifer (Nabidae), Deraeocoris punctulatus, Campylommaspp. (Miridae), Orius spp. (Anthocoridae), ledy beetles Adonia variegata, Syn-harmonia conglobata, Stethorus punctillum (Coccinellidae), lacewings Chrysopacarnea (Chrysopidae), predaceous thrips Aeolothrips intermedius (Aeolothripidae),Scolothrips acariphagus (Thripidae), parasitic wasp Habrobracon hebetor (paral-ysed cotton bollworm caterpillans of 2nd–3rd instars) (Braconidae), wasp Polistesgallicus (Vespidae). The population dynamics of predatory species during growingseason plays a significant role. The most diverse predatory bug complex (Oriusspp., Campylomma spp., Deraeocoris punctulatus) reaches the highest level in thefirst half of July and remains in stable state before the beginning of September.The numbers of lacewings (larvae) are not high but it is distinguished with stabilityduring June – August period. Lady beetles reach the peak of their numbers in thefirst half of June and after that stay in a low and stable numbers for rest of the season.On the whole, predator populations density runs to ZEL commonly in middle – last10 days of July (2.8 specimens per 1 cotton plant), and fluctuates at this level uptothe end of August when it reaches the highest value (3.6) (Sugonyaev et al., 1977).

15 IPM Programs in Commonwealth of Independent States and Russia 463
A precise calculation of natural enemies density during twenty four hours indi-cate that at 9 o’clock the number of predatory bugs Orius spp., Campylloma spp.,Deraecoris punctulatus and lady beetls Adonia variegata and other species increasesin cotton plant canopy, noticeably, and increases or remains at the same level at 12o’clock. At 15 o’clock the number of most predatory species decreases, but at 18o’clock it increases again. The exception is the predatory bug, Nabis palifer whichreaches its quantitative maximum in cotton canopy at 3 o’clock and minimum at 15o’clock (Tshernyshev et al., 1992). The correct coefficient suggested by Tsherny-shev et al. (1992) allows getting more exact information on the predator density atdefinite times during the twenty four hours (Table 15.2) that has importance for thedetermination of real ZEL and corresponding decision making.
The effect of the above mentioned indicative zoophagous species on cutworm(Agrotis segetum) is insignificant in contrast with cotton bollworm. But the formeris infested with the complex of specific parasitic wasps mainly Apanteles telengai,Rogas dimidiatus (Braconidae), etc, which parasitized caterpillars at the beginningof summer on a lower scale (on average 8.6%) which is not enough (Eremenko andUlyanova, 1977; Jumanov, 1977).
The economic threshold (ET) of pest species is the second important parame-ter in monitoring and decision making process. Fixed ET for any pest species isunreal value. During the plant growth the capacity of plant for compensation ofpest damage changes considerably. So, during development of caterpillars of 1stcotton bollworm generation (June – the first 10 days of July) a natural fall of cottonflowers and buds in early (optimal) sown field is about 50–60%, but during of 2ndone (July-August) – 10–15% only (Boldyrev and Kovalenkov, 1977; Sugonyaev un-published data). That is why the injury of bollworm caterpillars of 1st generation isminimal. Contrary to that the injury caused with cotton bollworm caterpillars of 2ndgeneration cause maximum losses because the grade of compensation of damagedbolls is low. Clearly a predetermined static ET is not suitable for our case while adynamic one is a necessity. In accordance with the known data the dynamic ET forbollworm are:
(a) 1st generation – 25 caterpillars or 40 injured fruit per 100 plants for mediumstaple varieties, and 12 caterpillars or 20 injured fruit for long staple varieties; (b)2nd generation – 10 caterpillars per 100 plants for medium staple varieties, and 5
Table 15.2 Coefficient for a calculation of real predator population density per 1 cotton plant (inrelation of its density at 9 o’clock taken as an unit)
Predaceous species Time of survey (o’clock)
21 24 3 6 9 12 15 18
Deraeocoris unctulatus 1.5 1.3 1.2 1.2 1 1.1 1.8 1.3Adonia variegate 1.2 1.4 1.2 1.2 1 1.2 1.3 1.5Coccinella 11-punctata 1.2 1.5 1.1 1.1 1 1.4 1 1.7Propylaea 14-punctata 1.7 1.9 1.1 1.1 1 1.7 1.5 1.9Chrysopa carnea (larvae) 1.6 1.1 2.3 2.3 1 1.7 1.4 2.3

464 E.S. Sugonyaev
caterpillars per 100 plants for long staple varieties (Tansky, 1969, 1988; Sugonyaev,1994).
The ET of cutworm (Agrotis segetum) changes and dependes on broad-leaf weeddensity per 1 m2 or a lack of them in cotton field: (a) no broad-leaf weeds present –1 caterpillar per 1 m2; (b) broad-leaf weeds present – 3 caterpillars per 1 m2. Thereare two points explaining of this ET variance: first, presence of broad-leaf weedswhich distract caterpillars from cotton sprouts, and they concentrate and feed underthem; second, in case broadleaf weeds are absent caterpillars attack cotton sprouts.There are economic thresholds for other the major cotton pests but they are staticand tentative (Sugonyaev, 1994).
15.3 Accomplishment of Survey, Monitoringand Decision Making
A field survey is the operative ground of PEM program, observations of sea-sonal changes in species composition and population density of phytophagous andzoophagous species in a given cotton field are made once every week or 10 days.The general sampling scheme includes: a) visual examination of 50 (p < 0.05) or100 (p < 0.01) cotton plants, recording the indicative zoophagous species, maincotton pests, and from the beginning of June – caterpillars of cotton bollworm andinjured fruit at four points around the field margin (5–25 m from the edge), andsampling of 25 plants (five groups with five plants in the row) at each point; b) theuse of pheromone traps attractive for cotton bollworm male moths (1 trap per 2 ha)with the ET an average 3 specimens per 1 trap during a week.
Routinely, only 50 cotton plants are surveyed and simultaneously pheromonetraps are checked. In the course of time the cotton bollworm only maintains itsstatus of a pest while other phytophagous species no longer remain pests of anyconsequences. For example, in Turkmenistan outbreaks of cotton bollworm stilloccur in favorable years even if predator numbers reach ZEL. However, on av-erage such outbreaks occur once every three years. During two years from threeyear cycle, cotton bollworm population is controlled by natural enemies, and itis very important to determine when the pest population indicates a tendency toincrease.
Late-sown cotton fields attributes to the unsteady type and is more subject tooutbreaks of cotton bollworm, cotton aphids and spider mite. More careful surveyis desirable, i.e. examination of 100 cotton plants once every week. At farm level,the demonstration of advantages of cotton pest and its enemy management programin the field is essential i.e. in farmer’s school, for further extension of the innovatedtechnology of the crop protection. Training of scout personnel from the members ofgiven cooperative or state farms has a decisive and significant role for implementa-tion and adoption of the cotton pest and its enemy management methods. In a givenfarm trained scouts (who are provided with motorcycles) inspect about 20 ha daily or∼200 ha during every one 10 days’ cycle. The field (or plot) where the population ofcotton bollworm, for instance, reaches ET marks, the scout puts up a small flag. The

15 IPM Programs in Commonwealth of Independent States and Russia 465
scouts pass all information to the supervisor who decides whether control measuresare needed. Thus, all data on the cotton field type and population of both pest andzoophage populations are available, and one needs to take it into consideration fordecision making. Undoubtedly, a decision making process is most important forimplementation of the cotton pest and its enemy program, and it requires to payattention to some additional question.
The principle of the cotton pest and its enemy management program is the thatany broad-spectrum chemical pesticide treatment in a given agro-ecosystem willresult in ecological catastrophe by destroying natural enemies activity. Moreover, itprovides some positive trends in natural enemies establishment. Balance betweenecological and economic expediency is a starting point, and ET must not work as atrigger. In fact every dynamic ET has its economic value which is variable and esti-mated to cause 5 and 7% yield loss which is acceptable (Tansky, 1988; Sugonyaevand Monastyrskii, 1997). A yield loss compensated should justify the costs, whicheither does not repay the expenses of protection measure or gives insignificant re-turns with respect of probable ecological preferences, for example, preservation ofnatural enemies population density. In other words 5% yield loss is admissible,which is the pay off costs for ecological stability of a cotton agro-ecosystem. Ifan economic threshold consists of two levels – threatening and operative ones (seebelow) then the cost of the former is 5% yield loss and of the latter 7%.
This conclusion laid the foundation of the monitoring system for observation ofboth beneficial and injurious species density on cotton fields with different sowingtimes. Instead of the conventional monitoring system oriented on a fixed number ofcotton bollworm caterpillars per 100 cotton plants for decision making, this innova-tive system emphasizes the priority of ZEL in a decision making process.
It is obvious that concept of pest and its enemy management (PEM) regard allnatural enemy activity in a given agro-ecosystem as a basic and essential compo-nent of decision making process. Either we should take into consideration naturalenemies activities as a natural part of pest control, or we reject their regulative roleas unimportant from practical point of view, and rely on use of broad-spectrumchemical pesticide applications. “Ecologization” and similar unscientific attempts tounite into single IPM program, a natural enemy activity with strong broad-spectrumchemical pesticide application, i.e. use of opposite vectors, when the latter destroysachievement of the former, will never create an ecological stabilization of a givenagro-ecosystem.
Thus, there is an urgency to develop IPM program with alternation of environ-ment friendly compounds/measures working in the same direction, i.e. means ofequal vector and there is considerable probability to develop an effective PEM pro-gram (Sugonyaev, 1994; Sugonyaev and Monastyrskii, 1987) instead of recent inter-pretation of IPM concept which is based on the use of ET as a trigger for pesticideapplication. So, a rational decision is based on experienced estimation. If the ZELis equal 1.0–1.5 indicative species of zoophages per 1 plant then the ET for cottonbollworm, cotton aphids and spider mite remains unchanged. However, if the ZEL isequal to 3 ± 0.5 then the ET for cotton bollworm increases by 50%, e.g. 15 caterpil-lars per 1 plant on medium staple varieties for the 2nd generation. Thus, two levels of
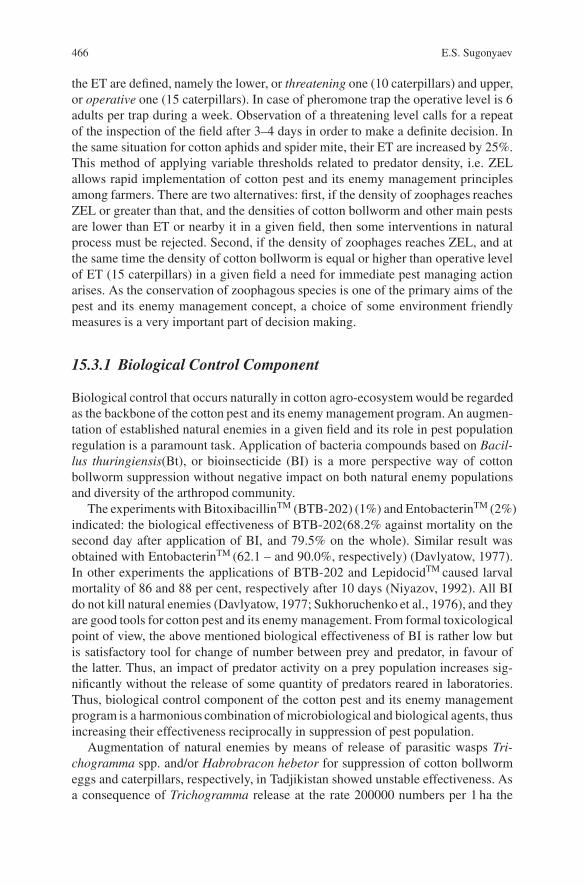
466 E.S. Sugonyaev
the ET are defined, namely the lower, or threatening one (10 caterpillars) and upper,or operative one (15 caterpillars). In case of pheromone trap the operative level is 6adults per trap during a week. Observation of a threatening level calls for a repeatof the inspection of the field after 3–4 days in order to make a definite decision. Inthe same situation for cotton aphids and spider mite, their ET are increased by 25%.This method of applying variable thresholds related to predator density, i.e. ZELallows rapid implementation of cotton pest and its enemy management principlesamong farmers. There are two alternatives: first, if the density of zoophages reachesZEL or greater than that, and the densities of cotton bollworm and other main pestsare lower than ET or nearby it in a given field, then some interventions in naturalprocess must be rejected. Second, if the density of zoophages reaches ZEL, and atthe same time the density of cotton bollworm is equal or higher than operative levelof ET (15 caterpillars) in a given field a need for immediate pest managing actionarises. As the conservation of zoophagous species is one of the primary aims of thepest and its enemy management concept, a choice of some environment friendlymeasures is a very important part of decision making.
15.3.1 Biological Control Component
Biological control that occurs naturally in cotton agro-ecosystem would be regardedas the backbone of the cotton pest and its enemy management program. An augmen-tation of established natural enemies in a given field and its role in pest populationregulation is a paramount task. Application of bacteria compounds based on Bacil-lus thuringiensis(Bt), or bioinsecticide (BI) is a more perspective way of cottonbollworm suppression without negative impact on both natural enemy populationsand diversity of the arthropod community.
The experiments with BitoxibacillinTM (BTB-202) (1%) and EntobacterinTM (2%)indicated: the biological effectiveness of BTB-202(68.2% against mortality on thesecond day after application of BI, and 79.5% on the whole). Similar result wasobtained with EntobacterinTM (62.1 – and 90.0%, respectively) (Davlyatow, 1977).In other experiments the applications of BTB-202 and LepidocidTM caused larvalmortality of 86 and 88 per cent, respectively after 10 days (Niyazov, 1992). All BIdo not kill natural enemies (Davlyatow, 1977; Sukhoruchenko et al., 1976), and theyare good tools for cotton pest and its enemy management. From formal toxicologicalpoint of view, the above mentioned biological effectiveness of BI is rather low butis satisfactory tool for change of number between prey and predator, in favour ofthe latter. Thus, an impact of predator activity on a prey population increases sig-nificantly without the release of some quantity of predators reared in laboratories.Thus, biological control component of the cotton pest and its enemy managementprogram is a harmonious combination of microbiological and biological agents, thusincreasing their effectiveness reciprocally in suppression of pest population.
Augmentation of natural enemies by means of release of parasitic wasps Tri-chogramma spp. and/or Habrobracon hebetor for suppression of cotton bollwormeggs and caterpillars, respectively, in Tadjikistan showed unstable effectiveness. Asa consequence of Trichogramma release at the rate 200000 numbers per 1 ha the

15 IPM Programs in Commonwealth of Independent States and Russia 467
quantity of infested cotton bollworm eggs varied from 0.0 to 12.9% on the fourthday after release. The infestation of cotton bollworm caterpillars with H. hebetorwas 5.3–29.5% (at the rate 200 numbers per 1 ha) (Tashpulatov, 2007). But thesame parasitic wasps used at high rates: 600000 specimens per ha for Trichogrammasp. and 3000 specimens per ha for H. hebetor infested their hosts by 30 and 56%,respectively (Kovalenkov and Aleshev, 1977; Hamraev and Abdel-Kavi, 1977).
15.3.2 Chemical Component
Conventional pesticides are an effective tool for pest population suppression inTadjikistan but its use is limited in Turkmenistan. The desired characteristics ofpesticide based pest management are: (a) selective action on target species, (b) rel-ative harmlessness for natural enemies, and (c) narrow spectrum of action. As arule, the need for chemical pesticide arises under the condition of late-sown cottonfield, an agro-ecosystem of which is more “crumbly”, and it is mainly predisposedfor sucking pests outbreaks. Selective acaricids, such as chlorfensulfide, dinobuton,dicofol, bromopropylate, halektron, propargite, tedion, and cyhexatrin, are toxic tospider mite (LD50 is 0.0006–0.001%) but have minimal impact on natural enemies(Sukhoruchenko et al., 1976; Niyazov, 1992; Sugonyaev, 1994). On the basisof experimental results, phosalone has been chosen for suppression of suckingpest on cotton because its impact on natural enemies is minimal (Table 15.3)(Sukhoruchenko et al., 1976).
Insecticide like carbaryl (carbamate) showed that this compound changes therelation between phytophages and entomophages -: 2.8/1 – before treatment;16.1/1 – 5 days after treatment, and 237.0/1 – 20 days after treatment, respectively(Sukhoruchenko et al. 1976). A negative influence of this kind of insecticide on theinitial ecological situation in the cotton field, i.e. the violation of natural equilibriumbetween phytophagous and zoophagous species, compelled to recommend bacteriacompounds, instead of chemical ones, for example, BTB-202 and LepidocidTM,which cause bollworm caterpillars mortality about 70–80% (in comparation withcarbaryl which has similar effect – 82.2%) without suppression of natural enemiesactivity in a given agro-ecosystem. It is important to note, the high summer tem-perature (more 33 ◦C) may decrease of biological effectiveness of BI that is whythese compounds are more effectively applied during the evening hour (Niyazov,1992). Unavailability of biological means of control is the main reason for chemicalpesticide application. In any case, aerial application of chemical pesticide, and socalled “prophylactic” application of these must be rejected. Local use of insecticidein a damaged plot or spot application of plot is obligatory.
15.3.3 Agronomic Component Including EnvironmentManipulation
Several agronomic factors stimulate the rapid growth and closing of the cotton plantcanopy, which is needed to produce rapid development of beneficial community

468 E.S. Sugonyaev
Tab
le15
.3A
nim
pact
ofph
osal
one
onth
enu
mbe
rof
spid
erm
ite,
cott
onap
hids
and
thei
rna
tura
lene
mie
s
Tim
eof
surv
ey(D
ays
afte
rtr
eatm
ent)
Popu
lati
onpe
rin
fest
edpl
anta
ndP/
PD∗
Phos
alon
eC
ontr
olPh
osal
one
Con
trol
Spid
erm
ite
Aca
riph
age
P/PD
Spid
erm
ite
Aca
riph
age
P/PD
Cot
ton
aphi
dsA
phid
opha
geP/
PDC
otto
nap
hids
Aph
idop
hage
P/PD
011
6.8
1.86
62.7
/119
1.1
1.6
119.
4/1
9.0
1.6
5.7/
14.
41.
82.
49
1.1
2.4
0.4/
113
.03.
63.
7/1
2.1
1.5
1.5/
14.
75.
20.
9/1
206.
52.
52.
6/1
108.
83.
135
.1/1
7.9
1.8
4.5/
212
.22.
35.
4/1
301.
22.
10.
6/1
177.
03.
747
.8/1
32.4
3.14
10.3
/134
.44.
28.
2/1
∗P/
PD–
prey
/pre
dato
r.

15 IPM Programs in Commonwealth of Independent States and Russia 469
and general stabilization of the agro-ecosystem. These factors include: (a) use ofstimulants as seed treatment to accelerate growth of seedlings, (b) optimal sowingseason (∼middle of April), (c) sowing on narrow rows (60 cm between rows), (d)sowing on ridges, and (e) precise irrigation scheduling.
The differences in canopy closure between optimal and late plantings can in-fluence the relative humidity and temperature on the soil surface and in the canopy.These differences can influence the development of the beneficial community, whichgenerally prefers a milder microclimate. The unattractive late-sown field microcli-mate discourages immigration of natural enemies and thereby increases late pestproblems.
The frequent alternation of cotton and alfalfa fields in a rotation is desirable be-cause of the similarity between entomophage communities in the two crops (Jac-card’s index of similarity: 41.3%) during the first and second years after alfalfasowing particularly (Niyazov, 1992).
A weed management in cotton field during seedling growth period is a way fordecreasing cutworm injury because the destruction of broad leaf weeds provokespassage of caterpillars from weeds to cotton plants. Hence, desirable time for cul-tivation is conditioned by beginning of cutworm pupation. Suppression of weedsoutside the fields must be prudent because many zoophagous species are reproducedin wild grasses in spring and at the beginning of summer.
A fertilization scheduling and composition of fertilizer are important matter forincreasing the cotton plant immunity particularly to sucking pest. Periodical useof a balanced NPK compound (without nitrogen surplus) during cotton planting isrecommended.
Selection of cultivars resistant to pest is an important measure in increasing ofgeneral build up and it provides insurance to the crop against pest attack. As it wasascertained in Tadjikistan the long staple varieties: 9883-I, 6249-V are not attractivefor population establishment of cotton bollworm and lygus bug (Lygus pratensis).The medium staple variety Mehrgon does not attract cotton bollworm and cottonwhitefly (Bemisia tabaci) but is highly preferred by lygus bug (Tashpulatov, 2007).
15.4 Impact of Cotton Pest and its Enemy ManagementPrograms
The achievement of cotton pest and its enemy programs development in Turk-menistan and Tadjikistan during the1970s–1980s demonstrates the benefits of anecological approach to cotton protection. The number of chemical pesticide-treatedcotton fields in Turkmenistan in general, and the Murgab Oasis in particular, havedecreased: in Turkmenistan, from a high of 850000 treated ha in 1970 to a low of900 treated ha in 1990, and in the Murgab Oasis, from a high of 120000 treated hain 1980 to a low of 90 treated ha in 1990, i.e. 13 times and many fields were increas-ingly left untreated. This is due to natural control forces, natural enemies activitymainly work in these cotton fields. But it is not a return to subsistence (extensive)

470 E.S. Sugonyaev
phase (Doutt and Smith, 1971) as in Afghanistan in the1960s (Sugonyaev, 1969).It is as a result of decision of two basic problems; (a) stopping of natural ene-mies destruction, (b) finding the methods of their conservation and increasing theirregulative role. As a result, over the same period, the use of biological controlagents (bacteria compounds mainly) on cotton has increased from 54.8% in 1986to 85.3% in 1990. Considerable economic benefits took place also – the mean yieldof raw cotton in the Murgab Oasis increased by 0.26 tons/ha from 1981 to 1990.In addition, introduction of cotton pest and its enemy management principles in the1980s–1990s at most cotton plantations in Turkmenistan produced saving about $4–5 million annually from reduction in pesticide expenses alone (Sugonyaev, 1979,1994; Niyazov, 1992; Sugonyaev and Niyazov, 2004).
The decreased threat of pesticide pollution is a major benefit of cotton pest andits enemy management programs that are based on an ecological approach and is asignificant step in environment preservation. So, upto 1990 the mean load of pes-ticides was 0.2 kg/ha throughout Turkmenistan, and 0.1 kg/ha in the Murgab Oasis(Niyazov, 1992) which is considerably lower than amounts previously recorded forCentral Asian republics on the whole (Narzikulov and Kovalenkov, 1977).
In Tadjikistan, where more conventional scheme of IPM permitting use of uni-versal, broad-spectrum chemical pesticides has been implemented, the decreasing ofthe number pesticide-treated cotton fields has decreased 3.5 times from 1967 to 1976(2000000 hectares in 1967 and 570000 hectares in 1976) (Kovalenkov and Aleshev,1977). This trend was maintained from 1980 to 1989 (Vanyants, 1991). Econom-ically, cotton IPM program has been very effective, and yield of raw cotton hasincreased by about 30%. Ultimately the return of expenditure on cotton protectionhas been 13–14 times higher in the IPM areas, and additional income has equaled$ 1100–1200/ha. Simultaneously, ecological effectiveness of cotton IPM has beensignificantly high because the mean load of pesticides per hectare has decreased 6.8time (from 35.2 kg/ha to 5.2 kg/ha) over 20 years.
The characteristic feature of the cotton IPM program in Tadjikistan during 1970–1990 was the combination of Trichogramma spp. release, DendrobacillinTM andbroad-spectrum pesticide applications, i.e. biological means and chemical com-pounds of opposite vectors that resulted in pest outbreaks locally. The cotton pestand enemy management program in Turkmenistan has been based on alternation ofenvironment friendly compounds only working on conservation of natural enemypopulations and stabilization of the agro-ecosystem, i.e. means of equal vector. As aresult of the number of chemical pesticide-treated cotton fields has decreased moreessentially here, and pest density has fluctuated lower ET during long-term timewhile a high profit of cotton production has been maintained.
General trends in cotton IPM development throughout the world shows that thereare two main directions: (a) IPM program based on mathematical simulation modeland computer-generated expert system oriented on a wide area; (b) pest and its en-emy management (PEM) program based on an empirical data adapted for individualfarmer’s use.
(a) The main aim of the first, area-wise approach is the development of themodel simulated on basic relationships in to the ditrophic system consisting of a

15 IPM Programs in Commonwealth of Independent States and Russia 471
plant and its consumer. The ditrophic system is manageable for assimilation of bothinformation on pest population fluctuation in relation to ET and phases of plantgrowth data necessary for prediction and decision making. However, some attemptsof modeling of multitudinous relationships in the tritrophic system consisted ofplant, phytophage and its natural enemy on an agro-ecosystem level have been foundinoperable. Probably, Thompson (1939) has been the first who showed that “there isno way of developing a method (mathematical, E.S.) that can reduce to manageableform the appalling complexity of natural factors”.
The USA and Australia have been pioneers in developing of simulation modeland computer-generated expert system for cotton and cotton insects (Luttrell et al.,1994). In 1979 in Albany, Department of Biological Control, University ofCalifornia, the author had the opportunity to acquaint himself with the work of theoperative computer – generated expert system based on the ditrophic system model,which was the great achievement in cotton protection at that time. The use of theditrophic system model in relation of ET was responsible for the spreading of usageof ET as a trigger for pesticide treatment, commonly in order to prevent increasingpest population from reaching the economic injury level. As a result of this, IPMconcept has turned gradually into well regulated program of chemical pesticideapplications with all the typical features as the ecological narcotics (DeBach andRosen, 1991). In spite of the significant progress in the philosophy of integratedpest management in the USA, chemical pesticide applications averaged about 6 in1992, and in some localized areas, 15 or more applications. In Australia, cottongrowers apply 10–12 applications of insecticides to cotton; some apply upwards of16–18 applications (Luttrell et al., 1994). Similarity of situation with cotton protec-tion in the USA and Australia show inadequacy of the usage of the ditrophic systemmodel oriented on ET as a trigger operation instead of real cotton pest and its enemymanagement on an ecosystem basis. High number of pesticide treatments will neverallow to create an ecological stabilization of a given agro-ecosystem, but are theprecursor of unsteady ecological situation, and, in future there is every possibility ofthe crop failure (Bottrell and Adkisson, 1977; DeBach and Rosen, 1991). Ehler andBottrell (2000) consider significant difficulties in IPM implementation in the USA as«predicting pest and natural enemy population trends is difficult because of “chaos”in agro-ecosystem». As the above-mentioned authors state, absolute predominanceof chemical pesticides in IPM programs, and often, an ignorance of natural enemypopulations’ activity by many pest consultants are common for contemporary situ-ation in plant protection in the USA (Ehler and Bottrell, 2000).
(b) The second approach in development of cotton protection is based on theFAO principle «a farmer as an expert in his own field», and oriented on elaborationof pest and its enemy management (PEM) program. Apparently, typical features ofPEM are:
First- A maximal simplicity in any recommended management strategy (oncondition that it is based on thorough fundamental research).
Second- The knowledge of cotton grower about the main harmful and usefularthropod species in cotton field.

472 E.S. Sugonyaev
Third-The use the zoophage efficiency level (ZEL) as a basic parameter of thesystems approach to cotton insect management, and decision making pro-cess.
Fourth-The use of the dynamic economic threshold (DET) (different for differ-ent generations of target species, and type of cotton plant) for the key insectpests e.g. cotton bollworm.
Fifth-The use of environment friendly compounds only, e.g. bacteria, virus andselective pesticides.
Sixth- The adoption of agronomical measures for creation of an ecologicallystable field, e.g. optimal sowing (early) time, right weed management, resis-tant variety, etc.
Possible criticism of the PEM concept approach can be leveled at the method ofdecision making process because it is subjective and imperfect. Ehler and Bottrell(2000) mentioned the problems with implementation of IPM in the USA as dis-cussed above. The requirement for precise method results in some additional diffi-culties. “The monitoring schemes developed for pest and natural enemy populationsmay be too sophisticated and expensive to be a practical tool for the pest consultant,”as highlighted by Ehler and Bottrell (2000). Meanwhile the empirical data of 20years in different areas of Turkmenistan and Tadjikistan show the ZEL in relationto ET is the reliable method of monitoring and decision making that is the cause forsignificant decrease of cotton pest injury, and increasing of additional income. Ehler(2000) shared the ZEL concept actually when showed two predatory bugs per plantis enough for beet protection in Northern California.
Any approach to cotton pest and its enemy management must be developed underthe different conditions of developed and developing countries and if they reply toone basic arrangement: work on an utilization of the great natural resource – naturalenemy populations activity, and stabilization of the agro-ecosystem.
15.5 Part II: Apple Pest and its Enemy Managementon an Ecosystem North-West Caucasus, Russia
At present broad-spectrum chemical pesticides cover about 95% of all apple or-chards in the south of Russia, nevertheless harmfulness of apple pests, particularlythe codling moth (Cydia pomonella), remains very high (Storchevaya, 2002). It isknown that the great fauna of beneficial arthropod – about 1000 species of naturalenemies including 100 ones attacking codling moth – is common for orchards inthe south Europe (Zerova et al. 1992). However, this productive natural resourceis destroyed recklessly with broad–spectrum pesticides. An urgent search of alter-native strategies of orchard protection, an elaboration of apple pest and its enemymanagement program in orchards based on conservation of natural enemy popu-lations and stabilization of the agro-ecosystem are our research priorities. The re-search is being conducted in cooperation with All Russian Institute of Biological

15 IPM Programs in Commonwealth of Independent States and Russia 473
Control and Kuban Agriculture University in the Krasnodar area. Two pest species –the codling moth and the green apple aphid (Aphis pomi) are the subjects of ourexamination.
15.5.1 Codling Moth
There is a serious problem with suppression of this key pest which is a real bar-rier to the development of ecological approach in apple orchards protection in thesouth of Russia. The cause of failure is an arbitrary alternation of pesticides withdifferent properties in the conventional IPM programs of orchard protection. Theofficial published recommendations on apple orchard protection are: (a) for theStavropol area (Central Caucasus) in 2003 were alternation of environment friendly(+), and broad–spectrum environment dangerous (−) compounds namely, Insegar(+) → Carhate (−) → Zollon (−) → Phuri (−) → Summiton (−) → Match(+) → Bileton (−); (b) for the Krasnodar area in 2007 – Insegar (+) → Calipso(+−) → Chlorpirhiphos (−) → Match (+) → Zollon (−) → BI58 (−). Typically,the ecological consequences of application of either are ignored. Meanwhile, theuse of biological based compounds, e.g. natural hormone analogist (Insegar, Match,etc) and biopreparation (LepidocidTM, BiotoxibacillinTM, etc), are not harmful fornatural enemy populations and promote the agro-ecosystem stabilization. Contraryto this, broad–spectrum chemical pesticides destroy most of arthropods, and in thefirst turn, natural enemies, thus destabilizing the apple ecosystem.
The conventional pesticide treatment programs are commonly based on com-pounds of opposite trend, or vector (in ecological sense) when the broad spectrumpesticides negate the gains of biological compounds. From this point view, IPMprograms based on alternation of both chemical pesticides and biological basedcompounds with opposite ecological effects will never create an ecological stabiliza-tion of a given agro-ecosystem, and, hence, there is a necessity to develop a programwhich is only based on environment friendly compounds, working in the same direc-tion, i.e. preparations of equal vector. Thus, the question of the possibility of the usebio-compounds only as a mean of codling moth management came up for research.In 2007, two experimental programs with different alternations of compoundsboth in the commercial (No.1) and the experimental (No.2) farms have beentried.
In the first conventional apple pest management program the alternation of com-pounds with different properties, i.e. environment friendly (+) and environmentdangerous (−) ones have been used in the succession: Insegar (+) → Cipi plus(−) → Dimmilin (+) → Phosban (−) → BI58 (−) → Diasol (−) → Cipi plus(−) in combination with Match (+) → LepidocidTM(+) – in all 8 treatments perseason (Fig. 15.4). The average number of moth males trapped in pheromone trapsexceeded ET in all cases. As a consequence the mean damage of apple fruit bycodling moth in all orchards in farm No.1 reaches 18% at the time of harvest (theET is 5% of damaged fruit) (Fig. 15.4).

474 E.S. Sugonyaev
0
1
2
3
4
5
6
7
8
9
10
11
12
13
14
15
16
17
18
19
20
11.5 31.5 20.6 10.7 30.7 19.8
A B C D E F G H
Fig. 15.4 The dynamics of apple fruit damages by codling moth caterpillars in the farm N 1orchards during summer of 2007 (curve). The arrows show the treatments with definite compounds(see in text). Horizon line – the ET. On ordinate axis – quantity of damage fruit, %; on abscissaaxis – date
In the second experiment, apple pest and its enemy management program the al-ternation of environment friendly (+) compounds only have been used in the succes-sion: Insegar (+) in combination with Match (+) → Match (+) → PhytovermTM(+)in combination with LepidocidTM(+) → PhytovermTM(+) in combination withLepidocidTM(+) → Dimmilin (+) – in all 5 treatments per season (Fig. 15.5).During the experiment the monitoring of codling moth population fluctuation car-ried out with pheromone traps (four traps per hectare).The ET is 8 codling mothmale specimens per 1 trap during 1st week. The average number of the hibernatedmoth males of the 1st and the 2nd generations had exceeded ET, and were twice thenumber(16 codling moths).
The mean damage of apple fruit by codling moth in two experimental orchardsin farm No. 2 was 1.2% at the time of harvest (Fig. 15.5). The results indicated that;(a) an alternation of environment dangerous and environment friendly compoundsin the same insecticide treatment program is not effective, besides (or owing to) itsecological incompatibility; (b) an alternation of environment friendly compoundsonly in the same insecticide treatment program is effective, ecologically compati-ble, thus showing the principle possibility of apple pest and its enemy managementprogram as was done in case of cotton crop.
15.5.2 Green Apple Aphid
A high population density of green apple aphid on shoots of apple tree for pro-longed time period (April–July) makes it necessary for repeated organophosphorus

15 IPM Programs in Commonwealth of Independent States and Russia 475
0
1
2
3
4
5
6
28.05 4.06 13.06 18.06 25.06 3.07 9.07 16.07 30.07 6.08 15.08 3.09 7.09
A B C D E
Fig. 15.5 The dynamics of apple fruit damages by codling moth caterpillars in the farm N 2orchards during summer of 2007 (curve). The arrows show the treatments with different com-pounds (see in text). Horizon line – the ET. On ordinate axis – quantity of damage fruit, %; onabscissa axis – date
insecticide treatments. The observations showed a high density of aphid and ants’activity which attended aphid colonies for food and at the same time provided pro-tection against of aphidophages. In this case, the ant species Formica sp. was themost in number and aggressively attacked predaceous bug, lady beetle and otherentomophages both in aphid colony and outside of it. Novogorodova and Gavrilyuk(2007) have found that many species from the genus Formica are most active protec-tors of aphids. In the aphid colonies protected by Formica spp., aphidophages were5–11 times less than in ones protected by ant species from other genera. Hence,a removal of ant from aphid colony will allow in creating situation favourable foraphidophage activity.
In the experiment where the sticky ring has been made of tree trunk the numbersof the predaceous bug, Campylomma verbaci, increased by 4.3 times within fiftydays (Table 15.4) while ants disappeared. Simultaneously, the numbers of otherspecies (aphidophages) also increased significantly (Table 15.4). Later in the season,after appricable decrease of aphid population on experimental trees; C. verbascibegan to migrate from experimental trees and settle on trees infested with aphid.That is peculiar natural insectaries – the phenomenon noted by DeBach and Rosen(1991).
In general, the tree apple system presents a more complicated perennial agro-ecosystem to manage because of its greater persistence than annuals, as formerallows development of a more evolved community of arthropods. Definite obsta-cle for development of an ecological approach to apple orchard protection is based

476 E.S. Sugonyaev
Tab
le15
.4Po
pula
ion
ofgr
een
appl
eap
hid,
Form
ica
anta
ndap
hido
phag
eson
expe
rim
enta
l(w
ith
stic
kyri
ng)
and
cont
rol(
wit
hout
stic
kyri
ng)
appl
etr
ees
Exp
erim
enta
lor
cont
rol
tree
s
Dat
eof
surv
eyPo
pula
tion
ofap
hid
coun
ted
on10
shoo
ts25
cmlo
ng/t
ree,
ingr
ade
ofap
hid
num
ber
per
1sh
oot
Num
ber
ofFo
rmic
aan
tN
umbe
rof
aphi
doph
ages
III
III
IVV
Cam
pylo
mm
abu
gL
ady
beet
leL
ace-
win
gSy
rphy
dfly
Cec
idom
yiid
fly1–
1011
–25
26–5
051
–100
>10
0
Exp
17.0
73
86
819
491
251
––
3C
ont
99
89
–14
330
3–
–2
Exp
22.0
75
32
2–
–10
813
–14
28C
ont
65
54
–12
449
––
211
Exp
30.0
71
––
––
–12
–3
––
Con
t5
32
31
9718
––
–3
Exp
06.0
82
––
––
–14
––
––
Con
t7
43
––
4812
2–
––
Exp
14.0
81
––
––
–16
––
––
Con
t6
2–
––
2815
––
–1

15 IPM Programs in Commonwealth of Independent States and Russia 477
on the concept of direct or indirect injury of insects (Turnbull and Chant, 1961).But the previous assertion that, codling moth population cannot be controlled withnatural enemies because it damages apple fruit directly required reconsideration. Atpresent bio-compounds particularly natural hormone analogs, allow to keep codlingmoth population lower than ET (Fig. 15.5) without suppression of natural enemiesactivity that will increase their useful role step by step. The pest species with indirectinjury are more manageable with biological control as rise of aphidophage activityin suppression of green apple aphid has demonstrated (Table 15.4).
Acknowledgments Many thanks for supporting our development on ecological approach in appleorchard protection in Krasnodar area, North-West Caucasus to Prof. T.N. Doroshenko (Cuban StateAgrarian University) and Dr. V.Ya. Ismailov (All-Russian Institute of Biological Control). Myspecial compliments to my colleagues Dr. V.A. Jakovuk and I.V. Balakhnina (All-Russian Instituteof Biological Control), and to Dr. Radjinder Peshin (Sher-e-Kashmir University of AgriculturalSciences and Technology of Jammu) for editing the chapter text.
References
Alexeev V.I. and Niyazov O.D. 1977. Results of integrated cotton pest management implementa-tion under the condition of the lower of Murgab River, In: Sugonyaev, E.S., and Semyanov, V.P.(eds), An Ecosystem Basis of Integrated Cotton Pest Management. Zoological Institute USSRAcademy of Sciences Press, Leningrad, pp. 58–60 (in Russian).
Bartlett B.R. 1956. Natural predators. Can selective insecticides help to preserve biotic control?Agronomic Chemistry 11:42–44.
Boldyrev E.P. and Kovalenkov V.G. 1977. An importance of the entomophage role in regulationof cotton pest numbers under the condition of the Gissar Valley in Tdjikistan. In: Sugonyaev,E.S. and Semyanov, V.P. (eds), An Ecosystem Basis of Integrated Cotton Pest Management.Zoological Institute USSR Academy of Sciences Press, Leningrad, pp. 61–62 (in Russian).
Bottrell D.G., and Adkisson P.L. 1977. Cotton insect pest management. Annual Review of Ento-mology 22:451–481.
Davlyatow I. 1977. An use of biopreparations in cotton pest management under the condition ofthe Javan Valley in Tdjikistan. In: Sugonyaev, E.S., and Semyanov, V.P. (eds), An EcosystemBasis of Integrated Cotton Pest Management. Zoological Institute USSR Academy of SciencesPress, Leningrad, pp. 68–71 (in Russian).
DeBach P. and Rosen D. 1991. Biological Control by Natural Enemies. Cambridge UniversityPress, Cambridge.
Doutt R.L. and Smith R.F. 1971. The pesticide syndrome. In: Huffaker C.B. (ed), Biological Con-trol, Plenum Press, New York, pp. 3–15.
Ehler L.E. 2000. Natural enemies provide ecosystem service. IOBC Newsletter 71:1–2.Ehler L.E. and Bottrell D.G. 2000. The illusion of integrated pest management. Issues in Science
and Technology 16:61–64.Eremenko T.S. and Ulyanova L.S. 1977. The role hymenopteroid parasites in cutworm numbers
regulation. In: Sugonyaev, E.S., and Semyanov, V.P. (eds), An Ecosystem Basis of IntegratedCotton Pest Management. Zoological Institute USSR Academy of Sciences Press, Leningrad,pp. 80–83 (in Russian).
Hamraev A.Sh. and Abdel-Kavi F. 1977. A study of Trichogramma evanenscens release for cottonbollworm suppression. In: Sugonyaev, E.S., and Semyanov, V.P. (eds), An Ecosystem Basis ofIntegrated Cotton Pest Management. Zoological Institute USSR Academy of Sciences Press,Leningrad, pp. 68–71 (in Russian).

478 E.S. Sugonyaev
Huffaker C.B. and Messenger P.S. 1964. The concept and significance of natural control. In:DeBach, P. (ed), Biological Control of Insect Pests and Weeds. Reinhold Publishing Corpo-ration, New York, pp. 16–67.
Jumanov B.J., 1977. The role of hymenopteroid parasites in suppression of cutworm and cottonbollworm numbers in cotton field in south Tadjikistan. In: Sugonyaev, E.S., and Semyanov, V.P.(eds), An Ecosystem Basis of Integrated Cotton Pest Management. Zoological Institute USSRAcademy of Sciences Press, Leningrad, pp. 83–88 (in Russian).
Kovalenkov B.G. and Aleshev V.A., 1977. Integrated control of cotton pests in Tadjikistan. In:Sugonyaev, E.S., and Semyanov, V.P. (eds) An Ecosystem Basis of Integrated Cotton Pest Man-agement. Zoological Institute USSR Academy of Sciences Press, Leningrad, pp. 41–45 (inRussian).
Luttrell R.G., Fitt G.P., Ramalho F.S. and Sugonyaev E.S. 1994. Cotton pest management: part 1.A worldwide perspective. Annual Review of Entomology 39:517–526.
Narzikulov M.N. and Kovalenkov V.G. (eds). 1977. The Grounds of Cotton Pest and Disease Man-agement in the Middle Asia. Donish Publishers, Dushanbe (in Russian).
Narzikulov M.N. and Umarov Sh.A. 1977. Results of ten-years study of cotton agro-ecosystem,and implemention of integrated cotton pest management in Tadjikistan. In: Sugonyaev, E.S.,and Semyanov, V.P. (eds), An Ecosystem Basis of Integrated Cotton Pest Management. Zoolog-ical Institute USSR Academy of Sciences Press, Leningrad, pp. 12–26 (in Russian).
Niyazov D.D. 1992. Ecological Principles of Cotton Protection in Turkmenistan. Dr. Sc. Thesis,St.Petersburg-Pushkin, 55pp. (in Russian).
Novogorodova T.A. and Gavrilyuk A.K. 2007. Protection of aphids against aphidophagous insectsby different ant species. In: Rastnitsin, A.P., and Gokhman, V.E. (eds), Studies of Hymenopter-ous Insects. KMK Scientific Press, Moskow, pp. 218–228 (in Russian).
Stehr F.W. 1975. Parasitoids and predators in pest management. In: Metcalf, R.C., and Luckmann,W.H. (eds), Introduction to Insect Pest Management. A Wiley-Interscience Publication, NewYork, pp. 147–188.
Stolyarov M.V., Sugonyaev E.S. and Umarov Sh.A. 1994a. A dynamic of arthropod communityin cotton field in North Afghanistan (the ground of integrated cotton) pest management pro-gramme), 1st Entomologicheskoe Obozrenie 53:245–257.
Stolyarov M.V., Sugonyaev E.S. and Umarov Sh.A. 1994b. A dynamic of arthropod communityin cotton field in North Afghanistan (the ground of integrated cotton) pest management pro-gramme), 2nd Entomologicheskoe Obozrenie 53:481–496.
Storchevaya E.M. 2002. A Biological Basis of Orchard Pest Control in South Russia. Dr. Sc. thesis,Krasnodar, 45pp. (in Russian).
Sugonyaev E.S. 1969. A biological barrier against pests. Priroda 11:55–57 (in Russian).Sugonyaev E.S. 1977. Development and problems of integrated cotton pest management in USSR.
In: Sugonyaev, E.S., and Semyanov, V.P. (eds), An Ecosystem Basis of Integrated Cotton PestManagement. Zoological Institute USSR Academy of Sciences Press, Leningrad, pp. 3–12(in Russian).
Sugonyaev E.S. 1979. An experience of the integrated cotton pest management programme elabo-ration on ecosystem basis. Journal Obshej Biologii 40:668–679 (in Russian).
Sugonyaev E.S. 1994. Cotton pest management: part 5. A Commonwealth of Independent Statesperspective. Annual Review of Entomology 39:579–592.
Sugonyaev E.S. and Kamalov K. 1976. A study of food connections into the cotton agro-ecosystemand their influence on the dynamic of harmful and beneficial arthropod species numbers underthe condition of the lower Murgab River. In: Tashliev, A.O. (ed), Ecology and Economic Im-portance of Insects in Turkmenia. Ilym Publishers, Ashkabad, pp. 19–45 (in Russian).
Sugonyaev E.S., Kamalov K., Niyazov O.D. and Alexeev V.I. 1977. On results of several yearsinvestigation of cotton agro-ecosystem with the intension of integrated cotton pest manage-ment programme elaboration in Turkmenia. In: Sugonyaev, E.S., and Semyanov, V.P. (eds), AnEcosystem Basis of Integrated Cotton Pest Management. Zoological Institute USSR Academyof Sciences Press, Leningrad, pp. 26–40 (in Russian).

15 IPM Programs in Commonwealth of Independent States and Russia 479
Sugonyaev E.S. and Monastyrskii, 1997. An Introduction in Ecological Integrated LepidopteroidRice Pest Management in North Vietnam. Russian-Vietnamese Tropical Centre Press, Hanoi (inRussian, English partly)
Sugonyaev E.S. and Niyazov O.D. 2004. The conception of ecological integrated pest managementand its practical implementation. Biological Control as a Basis of Agro-Ecosystem Stabilization2. All-Russian Institute of Biological Control Press, Krasnodar, pp. 72–92 (in Russian).
Sugonyaev E.S., Stolyarov M.V. and Umarov Sh.A. 1968 (1971). The role of natural enemies inregulation of cotton pest number in North Afghanistan. Proceeding of the XIII InternationalEntomological Congress, Moscow, (Nauka Academic Publishers, Leningrad, 1971), 193p.
Sukhoruchenko G.I., Niyazov O.D., Daricheva M.A., Alexeev U.I., Kamalov K. and ZavodchikovaV.V. 1976. An influence of chemical pesticidae treatments on harmful and beneficial fauna incotton field. In: Tashliev, A.O. (ed), Ecology and Economic Importance of Insects in Turkmenia.Ilym Publishers, Ashkabad, pp. 46–61 (in Russian).
Tansky V.I. 1969. The injury of cotton bollworm (Heliothis obsolete F.) in south Tadjikistan. Ento-mologicheskoe Obozrenie 48:44–56 (in Russian).
Tansky V.I. 1988. An Ecological Basis of Insect Injury. Agropromizdat, Moscow (in Russian).Tashpulatov M.M. 2007. A Biological Ground of Cotton Pest Management Programme Optimiza-
tion in Tadjikistan. Dr.Sc. thesis. St. Petersburg-Pushkin, 42 pp. (in Russian).Thompson W.R. 1939. Biological control and the theories of the interaction of population. Para-
sitology 31:299–388.Tshernyshev V.B. 2001. Ecological pest management. Arthropods in Agro-Ecosystem. Moscow
University Press, Moscow (in Russian).Tshernyshev V.B., Myartseva E.A., Afonina V.M., and Niyazov O.D. 1992. Vertical and horizontal
migration of insects in cotton field. Problems of Integrated Cotton Pest Management. IlymPublishers, Ashkabad, pp. 244–248 (in Russian).
Turnbull A.L. and Chant D.A., 1961. The practice and theory of biological control of insects inCanada. Canadian zoological journal 39:697–753.
Vanyants G.M., 1991. Organization and Economic Base of Integrated Cotton Pest Management inTadjikistan. CSc thesis. St. Petersburg-Pushkin, 22pp. (in Russian).
Zerova M.D., Tolkanets V.I., Kotenko A.G., Narolsky N.B., Fursov B.N., Farinets S.I., KononovaS.V., Nikitenko G.M., Melika I.G. and Sviridov S.V. 1992. Entomophages of Pests of Apple-trees in South-West Region of the USSR. Naukova Dumka Publishers, Kiev (in Russian).

Chapter 16Dissemination and Impact of IPM Programsin US Agriculture
Kristopher L. Giles and Nathan R. Walker
Abstract The influence of historical farming practices, successful insect biologi-cal control programs, pest-resistant cultivars, and the benefits/risks associated withpesticide use shaped the development of IPM programs in the US during the 20thcentury. Recently, in several cropping systems, development of pest managementprograms that focus on deployment of transgenic crops have altered those based onpest ecology. Current IPM programs in the US are delivered to stakeholders througha network of private and public organizations, often with federal oversight dictatedby national initiatives and funding programs. The impacts of these IPM programsvary among cropping systems and are often defined by specific management goals.In this chapter we review available information on US corn, wheat and cotton IPMprograms, and discuss dissemination approaches, adoption trends among stakehold-ers, and the impact on production agriculture.
Keywords IPM dissemination · United States Pest Management · transgenic crops ·corn · wheat · cotton
16.1 IPM in the United States
16.1.1 Historical Development and Current Approaches
The progression of Integrated Pest Management (IPM) both theoretical and inpractice continues in the United States as agricultural producers, private indus-try, university personnel, and government agencies evaluate continuously changingagricultural production systems and producers who adopt innovations, incorporateecological findings and attempt to adjust to local and federal requirements (Kogan1998, Koul and Cuperus 2007). Elimination of key pests, invasive species, rapidadoption and widespread planting of transgenic crops, and changes in pesticide use
K.L. Giles (B)Department of Entomology and Plant Pathology, Oklahoma State University,Stillwater, OK 74075, USAe-mail: [email protected]
R. Peshin, A.K. Dhawan (eds.), Integrated Pest Management: Disseminationand Impact, DOI 10.1007/978-1-4020-8990-9 16,C© Springer Science+Business Media B.V. 2009
481

482 K.L. Giles and N.R. Walker
has quickly altered many agro-ecosystems in the US and subsequently the ecologi-cal context of IPM dissemination (Fuchs 2007, Spurgeon 2007). One result of theserapid changes is the continuing intense debate among IPM theoreticians, practition-ers, industry representatives, government personnel and the public on how new IPMsystems will function (Shelton and Bellinder 2007). The debates about utilizationof transgenic crops in IPM systems, however, are similar in context to those thatoccurred during the development of IPM theory and application. Similar to the past,debates revolve around terminology and conflicts between theoretical concepts andavailability of practical proven innovations based on ecological data (Kogan 1998,Royer et al. 1999, Spurgeon 2007).
Relative to insect pests and pathogens, the foundations of IPM can be traced tothe long history of those involved in agriculture who selected crops/commoditiesthat survived or avoided attack or disease, recognized dangers associated with earlypesticides, and incorporated the benefits of natural enemies (Norris et al. 2003).Plant pathologists do not regularly associate themselves with IPM (Jacobsen 1997,Royer et al. 1999), however, many in this discipline have long stressed the ecolog-ical components of IPM including breeding for resistance, deployment of culturalapproaches that reduce inoculum density, exclusion, and utilization of epidemiolog-ical models and disease forecasting (Jacobson 2007). IPM is often identified withand among entomologists (Jacobsen 1997, Royer et al. 1999) because a majority ofentomologists who work with pests identify themselves as IPM practitioners, theywork in areas defined by IPM, and were associated with formalizing the widely rec-ognizable Economic Injury Level (EIL)/Economic Threshold (ET) concepts (Sternet al. 1959, Kogan 1998, Stejskal 2003).
Formalization of IPM in the 20th century required that practitioners and theoreti-cians develop unifying principles as they relate to management of pests (Cate andHinkle 1994, Kogan 1998, Royer et al. 1999, Norris et al. 2003). Based on the dra-matic successes attributed to biological control of insects, and concerns about eco-logical disruptions caused by synthetic insecticides, the Integrated Control Conceptwas developed in the 1950’s (Stern et al. 1959, Cate and Hinkle 1994). Integratedcontrol was based on integrating the impact of natural enemies and pesticides (in thecontext of the whole agro-ecosystem) with potential economic losses, in an effort tojustify curative suppression tactics, preserve available control strategies and reducethe negative impacts of pesticides on agro-ecosystems. As Kogan (1998) pointedout, following the Stern et al. (1959) article, IPM practitioners and theoreticiansgenerally agreed on the ecological principles of IPM, but debated for decades overterminology. As IPM gained in acceptance, it became clear that practitioners dealingwith pests were readily embracing the Economic Threshold concept often with-out justification (Stejskal 2003), while ignoring (1) interactions between the agro-ecosystem and pest ecology, and (2) long-term management strategies (NationalResearch Council 1996, Royer et al. 1999, Koul and Cuperus 2007).
16.1.2 IPM in Practice
The ever changing large body of literature that has been developed by IPM theorists(Stern et al. 1959, National Research Council 1996, Norris et al. 2003, Koul and

16 Dissemination and Impact of IPM Programs in US Agriculture 483
Cuperus 2007) clearly documents a significant focus towards system and landscapebased recommendations for IPM implementation and dissemination. IPM theoristsare often quite willing to cite limited agro-ecological data (ex. pest and beneficialmovement) and recommend system approaches for management of pests, whilepractitioners and producers are left to respond to pest outbreaks in the face of sig-nificant environmental events, increasing input costs and issues related to landlordrequirements (National Research Council 2000, Spurgeon 2007, Koul and Cuperus2007, Gurr et al. 2007, Hoy et al. 2007, Keenan et al. 2007a,b). Keenan et al.(2007a,b) investigated the pest management concerns of wheat producers in the USGreat Plains during a wide-spread drought. Based on either experience or willing-ness as early adopters (Fuchs 2007, Keenan et al. 2007a,b), many of these producersregularly considered and incorporated IPM tactics such as host plant resistance,crop rotations and other cultural controls, conservation of beneficial insects, andfield scouting in a proactive effort to manage pests within their farming systems.However, as alternative crops failed from lack of rain, as fuel costs continued torise, and as landlords continued to demand continuous wheat production to reducerisks of crop loss, these producers were forced to make decisions on whether insectsuppression was justifiable in crops that might not survive the drought.
Producers in most production systems regularly face environmental uncertaintiesand extremes and out of necessity, IPM practitioners who work with producers con-tinue to focus on short-term management strategies (Spurgeon 2007) often centeredaround utilization of ET’s. Short-term management strategies are often necessarybecause of regular changes in crop cultivars each with unique EIL’s, alternativenew crops each with their own EIL’s, and rapid changes in the size of individualfarms (Koul and Cuperus 2007). Fully describing and incorporating ecological rela-tionships among plants, pests and natural enemies are noble endeavors and form aportion of the basis of IPM (Royer et al. 1999, Koul and Cuperus 2007). However,incorporating predictable ecological processes can be difficult because agriculturalsystems change so rapidly (crops/cultivars and tillage practices) often within justa few field seasons. Within ever changing agricultural systems, IPM practitionersand producers are often forced to focus on preventing pests from reaching EIL’sthrough the use of cost effective pesticides (Koul and Cuperus 2007). A majoraccomplishment of this forced approach was the education of the public on alter-natives to scheduled pesticide applications. This movement was quite successfulin many crops as an increasing number of producers considered the cost-benefitsof pesticide application. However, many believe that this EIL centered approachbecame synonymous with IPM to the public (National Research Council 1996).
As Spurgeon (2007) pointed out, relative to the conceptual ideas of IPM, verylittle has actually been accomplished; IPM should not be viewed as an entity, buta conceptual idea that integrates ecological knowledge and the real world con-straints of modern production systems. IPM theorists and practitioners should con-sider a two tiered approach and develop meaningful real-world short-term solu-tions to economic damage caused by pests, and over time work towards integra-tion of long-term management approaches within changing production systems.The ephemeral nature of agricultural systems suggests that IPM must be imple-mented and disseminated within a moving ecological target and that a two tieredapproach is necessary. Indeed, there are many examples of successful dissemina-

484 K.L. Giles and N.R. Walker
tion and implementation of IPM programs for short-term management goals (Harris2001). Holistic EIL’s, disease forcasting models, and sampling approaches that con-sider multiple pests and system impacts must be accurately quantified and easy touse if producers are to move towards long-term approaches that prevent pest in-jury and reduce damage (Spurgeon 2007). The recent loss of many of the broadspectrum pesticides commonly used in production agriculture (due to the FoodQuality Protection Act) may force the hand of IPM practitioners and producersto implement innovative two tiered approaches. Additionally, all involved must beaware that IPM is information based, and that dissemination of information willchange as agricultural systems change and new ecological information becomesavailable.
16.1.3 The Changing Agro-Ecosystem
A change in crops or cultivars can have dramatic effects on pest dynamics anddamage potential within an agro-ecosystem, particularly when plants vary in theirsuitability and/or susceptibility to pest attack (Norris et al. 2003). Developmentof pest resistant plants (Host Plant Resistance: HPR) is a long-term venture thatmust anticipate future markets for commodities and pest issues, while balanc-ing yield and quality goals. For plant pathogens, breeding for resistance or tol-erance has been the dominant management strategy for many field crops (Bell1999, Jeffers 2004, Jacobson 2007). Traditional breeding efforts aimed at reduc-ing or preventing damage by pests have been an integral part of IPM programs(Norris et al. 2003), but examples of immunity are rare and reliance on sam-pling/ET’s has been common. The development of genetically engineered cropplants (GE’s) that are resistant to plant pathogens is gaining momentum (Jacobson2007), and it is expected that a surge in GE plants resistant to pathogens will beavailable to producers in the next 15 years, however this effort has not nearly beenat the rate of GE’s targeted for insect and weed control (Shelton and Bellinder2007).
Agricultural landscapes in the US have changed dramatically during the pastdecade as genetically engineered crops have become readily adopted (Fernandez-Cornejo 2006). Scientists and IPM practitioners are continuing to evaluate long-term economic and environmental impacts (Frisvold et al. 1999, Obrycki 2001,Benbrook 2004, Rice 2004, Hurley et al. 2006), however, since 1996, US producershave continued to plant a larger percentage of their acreage to genetically engi-neered crops (Fernandez-Cornejo 2006, NASS 2007). Adoption of GE’s are highestamong producers who grow soybeans and cotton with herbicide-tolerant (HT) traits,followed by producers who target insect-resistant cotton and corn. Crops with HTtraits were developed to survive broad spectrum or more selective herbicides astargeted weeds are killed. Cotton and corn cultivars containing genes from the soilbacterium Bacillus thuringiensis (Bt) have been planted since 1996 to reduce dam-age caused primarily by lepidopteran pests, and more recently coleopteran pests(Frisvold et al. 1999, Hurley et al. 2006). The most widely grown Bt plants produce

16 Dissemination and Impact of IPM Programs in US Agriculture 485
a protein in their tissue (s) that is toxic to targeted insects and protect plants over anentire growing season (Brown et al. 2007, Illinois IPM 2007, Iowa IPM 2007).
The increase in GE crops grown in US agricultural landscapes has been dramaticand rapid (Fernandez-Cornejo 2006). For example, based on 2006 data, HT soybeanacreage increased from 17 to 89 percent, from 1997 to 2006. Acreage of GE cottonand corn with HT and Bt traits has also steadily increased during this period. The in-creasing percentage of GE soybeans, corn and cotton in the US clearly demonstratea significant ecological shift on production land in the US (Benbrook 2004). Sheltonand Bellinder (2007) are optimistic in their assessment and state that GE crops andother forms biotechnology are more in line with IPM philosophy and will (1) resultin new management tools, (2) allow scientists to explore fundamental processes, and(3) allow for truly integrated programs that are biologically based. For example, theuse of transgenic cotton following Boll weevil eradication was well justified becauseseveral key pests were historically well above EIL’s (Spurgeon 2007). Resulting Btcotton systems are more sustainable with potential for further reductions in pesti-cide use (Benbrook 2004). The widespread use of GE crops means that IPM anddissemination of information will clearly have to adapt and function within thesenew transgenic systems.
16.1.4 Dissemination and Adoption of IPM
The Morrill Act (1862), Hatch Act (1887), and Smith Lever Act (1914) which es-tablished the land grant college system, agricultural experiment stations, and theagricultural extension service, respectively, continue to form the foundations of theresearch implementation paradigm of IPM in the US (Kogan 1998, Fuchs 2007).The Cooperative Extension Service (CES) continues to play the major role in dis-seminating IPM program information, and individual states have IPM coordinatorswho are associated with land grant universities and work with a multidisciplinarygroup of faculty and varying structures of regional and county extension educatorsto deliver IPM to stakeholders. Additionally, USDA Agricultural Research Service(ARS) scientists often cooperate with university personnel to discover, develop andevaluate IPM technologies. Stakeholders are identified primarily as growers, butalso include commodity groups, private businesses with crop advisors and largeragricultural companies who interact with universities and ARS personnel togetherto evaluate and disseminate IPM technologies (Fuchs 2007).
Several studies have clearly indicated that stakeholders directly acquire IPMinformation and recommendations from several sources, but primarily through lo-cal contacts at elevators or fertilizer dealers (Probst and Smolen 2003, Koul andCuperus 2007). However, much of this information can be indirectly traced backto dissemination events/materials organized or developed by extension personnel orprivate companies that include extension meetings, field days, handbooks and factsheets, or newer comprehensive websites. Likely, the future of dissemination liesin delivery of information and recommendations via the internet at centralized IPMwebsites (Fuchs 2007).

486 K.L. Giles and N.R. Walker
Adoption of IPM technologies among stakeholders is a complex process, butoften follows patterns outlined by Copp et al. (1958) and Nowak (1987). Producerswho are aware of a pest management issue gather interest, and attempt managementtrials prior to adopting new technologies (Copp et al. 1958). Nowak (1987) includesin this process interaction with a third party (IPM practitioners and/or all other stake-holders defined earlier) that calls attention to problems unknown to producers. AsFuchs (2007) illustrates, widespread adoption is often a long term process and isusually reliant on innovators and early adopters (Fig. 16.1). However, disseminationand adoption of IPM can be constrained by the complexities associated with newtechnologies (Nowak 1987). This point is easily illustrated when comparing rapidadoption of transgenic corn or cotton, versus reluctance towards newly developedmethods for sampling aphid winter wheat pests in the Southern Plains. Plantingtransgenic corn or cotton adds little complexity (other than refuge requirements) tofarming operations, whereas aphid and parasitoid sampling in winter wheat requiresknowledge of pests and natural enemies, additional time spent sampling, and pre-dictions about future grain values (Elliott et al. 2004, Spurgeon 2007). Mandatoryrefuges are easy to delineate and clearly of little concern to producers, comparedwith scouting procedures in wheat, especially when seed companies assist with In-sect Resistance Management (IRM) technology agreements. Transgenic crops havefewer factors that inhibit dissemination and decrease adoption, therefore they appearto avoid complexity factors that inhibit adoption. Additionally, seed companies oftensponsor field days that decrease peer pressure problems associated with dissemina-tion and adoption (Fuchs 2007).
Dissemination models for IPM often assume that growers are the stakeholderswho make final decisions in regard to implementation of new technologies (Fuchs2007). However, many producers rent land and/or interact with lending institutionsthat dictate farming operations and management approaches based on personal pref-erences and changes in farm legislation (Fuchs 2007, Koul and Cuperus 2007). Forexample, according to the Crop Profile for Corn in Illinois (2000), most farming landis owned by landlords and they have little tolerance for fields that are not properly
Fig. 16.1 Innovation adoption curve adapted from Everett M. Rogers 1995

16 Dissemination and Impact of IPM Programs in US Agriculture 487
managed. Approaches designed to disseminate IPM information to landlords andbankers are not well studied, but clearly needed.
16.1.5 Influence of National Initiatives and Funding Programs
Kogan (1998) summarized the history of IPM progress in the US including severalof the funding initiatives that continue to influence dissemination in production agri-culture today. The USDA Regional IPM Program was initiated in 1985 and contin-ues today administered among four Regional IPM Centers (http://www.ipmcenters.org/) that coordinate grant opportunities and summarize research, extension, educa-tion and policy information. This program and other factors led to the National IPMInitiative developed by the Clinton administration that aimed to increase IPM in theUS. The Food Quality Protection Act of 1996 (FQPA; http://www.epa.gov/pesticides/regulating/laws/fqpa/) was the most comprehensive evaluation of pesticide andfood safety laws in the US by the Environmental Protection Agency (EPA). Themost notable result of the FQPA was that many of the cheap pesticides (primarilyorganophosphates and carbamates) long used in production agriculture are no longerregistered for pest suppression in several crops. The newer regulations also limitedthe total the number of uses for a given pesticide which required the removal of somecrops from pesticide labels. Additionally, in the 1990’s, the USDA-ARS initiatedthe Areawide IPM System program to evaluate multi-year research, demonstrationand dissemination projects aimed at areawide suppression of pests (Kogan 1998).The goals associated with the Regional IPM Program, National IPM Initiative andAreawide IPM System programs influenced the direction of research and exten-sion programs throughout the US and were readily adopted by IPM practitioners.These changes in IPM research and extension had a significant effect on IPM dis-semination, particularly programs that were affected by FQPA. Clearly, the loss ofavailable pesticides to FQPA, coinciding with replacement by more costly selectivepesticides, forced the hand of IPM practitioners and most importantly producers toevaluate alternative approaches based on agro-ecosystem functions (Fuchs 2007).
In 2000, the proceedings from a National Research Council meeting and theCommittee on the Future Role of Pesticides in US Agriculture were published(National Research Council 2000). The committee strongly stated that pesticidesneed to be maintained as management tools, but that alternatives need to be increased.These alternative IPM technologies would only be viable if future funding initia-tives: (1) targeted long-term studies on sustainable Ecologically Based Pest Man-agement systems, (2) provided opportunities for implementation, dissemination andadoption/diffusion research, and (3) promoted evaluation of commercially compat-ible technologies. A perusal through the current IPM grants programs administeredby USDA-CSREES (http://www.csrees.usda.gov/nea/pest/pest.cfm) indicates quiteclearly that this report influenced both short and long-term IPM priorities. TheseIPM grant programs vary significantly, however, incorporation of systems research,a focus on alternative pest management approaches, but most importantly demon-strated accountability to stakeholders and their needs (discovery, dissemination and

488 K.L. Giles and N.R. Walker
impact) appear as common themes. Advancements and promotion in academia andARS are often closely correlated with grant funding success, and predictably IPMtheorists and practitioners have tailored there current and future programs to meetthe priorities associated with IPM grant programs.
16.2 Cropping System Examples: Programs, Disseminationand Impact
16.2.1 Evaluation Criteria
In the following sections, we discuss pest management issues for corn, wheat andcotton, and included our evaluations on the progression of IPM dissemination inthese systems. We based our discussion of corn IPM on activities in Iowa and Illi-nois, our discussion of wheat IPM on activities in Oklahoma and Texas, and ourdiscussion of cotton IPM on activities in Georgia and Texas. We described past andcurrent pest issues including a critical evaluation of how IPM dissemination andadoption of technologies/advancements have changed over time.
16.2.2 Corn in the Midwestern US
Between 20–25 million acres (8−10 million ha) of corn are planted annually inIowa and Illinois (Crop Profile for Corn (Field) in Iowa 1999, Crop Profile forCorn in Illinois 2000, NASS 2007). Corn is grown either as a rotational crop withsoybeans or other crops, or less frequently grown continuously. Several arthropodscan damage corn (Royer et al. 2004), but the principle pests in Iowa and Illinoiscontinue to be the European Corn Borer (ECB, Ostrinia nubialis) and the rootwormcomplex that includes the Western Corn Rootworm (WCR, Diabrotica virgifera)and the Northern Corn Rootworm (NCR, Diabrotica Barberi). Combined averagelosses associated with these pests during non-outbreak years are less than 2%, buttypically up to 15% of corn fields have severe infestations that can reduce yieldsup to 16%; during outbreaks, millions of hectares can be infested with damaginglevels of ECB and/or rootworms. The primary ECB management options that can beimplemented within a growing season include altered cultural approaches, scoutingand curative insecticide applications or use of transgenic Bt cultivars. Managementoptions for WCR and NCR vary among regions and rootworm strain, but those thatcan be easily implemented include crop rotation, fall scouting for adults followed bymanagement or rotation, spring applications of soil insecticides, or use of resistantcultivars primarily those with Bt.
Low levels of disease reduce stands, yields and seed quality each year in Iowaand Illinois and the most commonly diagnosed pathogens are various species asso-ciated root rots, stalk rots, ear rots, leaf blights, and viruses. Jeffers (2004) statesthat pathogens regularly influence corn production in the US and that diseases cause
16 Dissemination and Impact of IPM Programs in US Agriculture 489
between 2–15% in annual losses. Management of plant pathogens is based on (1)vigorous cultivars that are relatively resistant/tolerant to many common diseases,and (2) standard fungicidal seed treatments that help to protect seeds and seedlings,or monitoring overwintering populations of insect vectors of corn pathogens (Jeffers2004, Illinois IPM 2007).
Historically, IPM information and technologies in corn have been disseminatedthrough traditional CES approaches that include presentations at field days, growermeetings, and pesticide certification meetings. In Iowa and Illinois, CES personnelat the state levels interact with individuals within Areas/Regions, and at individ-ual county offices to develop and disseminate IPM information (Fig. 16.2). ClearlyCES personnel continue to be the driving force in IPM dissemination. Published
Fig. 16.2 Illinois cooperative extension map/East Central region offices. http://web.extension.uiuc.edu/state/findoffice.html; http://web.extension.uiuc.edu/state/findoffice EC.html

490 K.L. Giles and N.R. Walker
documents, in the form of ‘Fact Sheets’ or production manuals that incorporateIPM recommendations in the context of crop production goals, are developed andprovided to stakeholders by CES and/or other IPM practitioners. As stated earlier,producers most often acquire IPM information through local contacts at elevatorsand/or fertilizer dealers (Koul and Cuperus 2007). These contacts regularly incor-porate IPM recommendations produced by CES personnel and information providedby seed dealers. IPM information for corn has historically been disseminated by acollection of CES personnel and other stakeholders to producers, who in the endmay need to incorporate the requirements of landlords and bankers prior to makingmanagement decisions.
Currently, the most comprehensive and easy to use organization of IPM informa-tion for arthropods and diseases in Iowa and Illinois was developed by CES person-nel and is available on individual IPM websites (Illinois IPM 2007, Iowa IPM 2007)that are linked to each other. CES IPM practitioners continue to focus heavily onpersonally disseminating information at grower and professional meetings, however,it is clear that websites form the most effective foundation for IPM disseminationbecause of the ability to centralize all pest management recommendations, hot-linktopics, and quickly update information. Certainly, the management approaches onthese websites are based on experimental and demonstration data, but also on thephilosophical approaches of the IPM practitioners who developed management in-formation; IPM recommendations for corn pests are presented relatively holisticallyon these websites. The most striking part of the ECB websites (particularly for Iowa)are the outlines that give equal “billing” and linked details on borer biology and IPMrelated approaches (Iowa IPM: http://www.ent.iastate.edu/pest/cornborer/manage).The outline for the ECB web-site for Iowa (Fig. 16.3) infers a holistic approach tomanagement, whereas the Illinois web-site outline is limited to ecology, scoutingand insecticides, and the use of Bt corn (Fig. 16.4). Centralized websites for root-worm management are not as well organized, but hot-links to current informationin the region, recommendations, and topics of interest create a useful collection ofeasy to access resources.
Interestingly, information available on CES websites reflects a relatively cau-tious approach towards recommendations of Bt corn. Bt corn (several products) ispresented as one of many management tactics for insect suppression that must bepreserved via IRM. IRM information available at seed company websites reflectsa similar philosophy towards Bt corn. For example, the websites developed byMonsanto Corporation for Bt corn market IRM as responsible stewardship and away to preserve the benefits of resistance for the future. Additionally, relative toplant pathogens, both CES and Monsanto websites promote Bt products as a way toreduce ECB and rootworm injury, and secondary entry for pathogens.
Despite the apparent agreement over IRM and benefits of reduced levels ofpathogens, there is a distinct separation in the way seed companies and CESpresent IPM information on there websites. As stated earlier, CES websites presentmulti-tactic outlines for IPM that includes scouting and pesticide recommenda-tions, or links to sites and information that are multi-tactic in approach. Some linksare to discussion articles about independent evaluations of Bt products and their

16 Dissemination and Impact of IPM Programs in US Agriculture 491
Fig. 16.3 Iowa State University European Cornborer Management website. http://www.ent.iastate.edu/pest/cornborer/manage
effectiveness. Monsanto Websites for Bt corn products (Monsanto Company Web-site 2007: http://www.monsanto.com/monsanto/ag products/input traits/corn.asp)do not readily discuss or link to field data trials, but do focus on a few key topics:protection from insects, agronomic benefits of this protection, reduced insecticideinputs, and IRM approaches. Specific points on these topics are dependent upon theBt product, however, there are no recommendations on scouting and/or additionalpesticide use: the Monsanto Bt corn websites have chosen to ignore proceduralspecifics and infer that IPM is in the seed bag.
Which entity (CES or seed companies) has been most effective at disseminatingIPM information? We may be able to answer this question by documenting levelsof adoption relative to recommendations. Seed companies clearly want producers

492 K.L. Giles and N.R. Walker
Fig. 16.4 University of Illinois Extension European Cornborer IPM website. http://www.ipm.uiuc.edu/fieldcrops/insects/european corn borer/index.html
to plant Bt seed and they have succeeded. Bt corn acreage (Bt only or stacked withHT genes) has grown from 8% to 49% in the US, from 1997 to 2007 (Fernandez-Cornejo 2007a). In Iowa and Illinois, 59% of the available corn acres were plantedwith Bt seed in 2007 (Fig. 16.5). Recent increases in acreage are largely due to newBt corn products that help to suppress rootworm damage.
It appears that corn growers are also continuing to follow recommendations forinsecticide use outlined by CES personnel. Although Benbrook (2004) claims only asmall reduction in insecticide use in corn, reductions in total amounts of insecticidesin corn have been significant. In 1997, Illinois corn producers used 4,266,000 lbs(1,939,090 kg) of insecticides (Crop Profile for Corn in Illinois 2000). Data fromIllinois in 2005 (NASS 2007) reveals that 1,202,000 lbs (546,364 kg) of insecticideswere applied to corn acres (Table 16.1). Despite new Bt hybrids, much of the insec-ticide is targeted for rootworm suppression. Interestingly, Monsanto now offers Btcorn products that are pretreated with insecticides, which may ultimately increasethe kilograms of insecticide applied to corn acres in Iowa and Illinois. Recommen-dations to combine Bt corn with additional prophylactic insecticides have, however,caused some concern among IPM practitioners in the US corn belt (Steffey 2007).
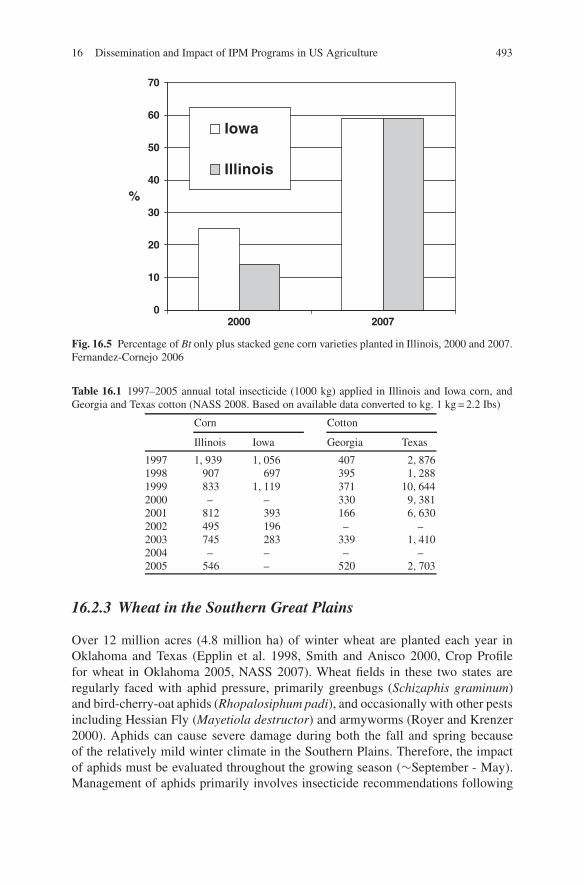
16 Dissemination and Impact of IPM Programs in US Agriculture 493
0
10
20
30
40
50
60
70
2000 2007
Iowa
Illinois
%
Fig. 16.5 Percentage of Bt only plus stacked gene corn varieties planted in Illinois, 2000 and 2007.Fernandez-Cornejo 2006
Table 16.1 1997–2005 annual total insecticide (1000 kg) applied in Illinois and Iowa corn, andGeorgia and Texas cotton (NASS 2008. Based on available data converted to kg. 1 kg = 2.2 Ibs)
Corn Cotton
Illinois Iowa Georgia Texas
1997 1, 939 1, 056 407 2, 8761998 907 697 395 1, 2881999 833 1, 119 371 10, 6442000 – – 330 9, 3812001 812 393 166 6, 6302002 495 196 – –2003 745 283 339 1, 4102004 – – – –2005 546 – 520 2, 703
16.2.3 Wheat in the Southern Great Plains
Over 12 million acres (4.8 million ha) of winter wheat are planted each year inOklahoma and Texas (Epplin et al. 1998, Smith and Anisco 2000, Crop Profilefor wheat in Oklahoma 2005, NASS 2007). Wheat fields in these two states areregularly faced with aphid pressure, primarily greenbugs (Schizaphis graminum)and bird-cherry-oat aphids (Rhopalosiphum padi), and occasionally with other pestsincluding Hessian Fly (Mayetiola destructor) and armyworms (Royer and Krenzer2000). Aphids can cause severe damage during both the fall and spring becauseof the relatively mild winter climate in the Southern Plains. Therefore, the impactof aphids must be evaluated throughout the growing season (∼September - May).Management of aphids primarily involves insecticide recommendations following

494 K.L. Giles and N.R. Walker
scouting procedures for aphids and parasitoids (Lysiphlebus testaceipes) (Giles et al.2000, Giles et al. 2003, Royer et al. 1998, 2004a,b Elliott et al. 2004). Producers inOklahoma and Texas have only a few aphid-resistant cultivars (Porter et al. 1997,Lazar et al. 1998) available: TAM-110 and OKField (with the Gb3 resistance gene)are resistant to greenbug biotypes C, I, and E. TAM 110 was developed for pro-duction limited to the High Plains (dry climates) because it is susceptible to leafrust and stripe rust, whereas OKField grows well in areas with greater rainfall, butis susceptible to wheat soilborne and/or spindle streak mosaic viruses. Leaf rustand stripe rust are the two most important and widespread diseases of wheat inthe Southern Plains (Royer and Krenzer 2000). Producers have options relative todisease management; several wheat cultivars developed for the Southern Plains havesignificant resistance to common diseases (Edwards et al. 2006). Plant pathologistssuggest that cultivar selection is the most important management decision whenconsidering disease management however fungicide applications against rust canbe effective, and when wheat prices are high cost-effective.
The majority of producers in Oklahoma and Texas do not plant resistant wheatcultivars but focus on cultivars with growth/production characteristics that maxi-mize yield and grain quality (Royer and Krenzer 2000). For example, ‘Jagger’ and‘Jaggelene’ are the most commonly grown cultivars in Oklahoma, but both are sus-ceptible to aphids, Hessian Fly, and leaf rust (Edwards et al. 2006).
Similar to Iowa and Illinois, CES personnel at state levels in Oklahoma and Texasinteract with individuals at area/regional and county offices to develop and dissemi-nate IPM information. Organizationally, Oklahoma CES functions similarly to moststates, however in Texas, additional groups of experts (IPM Agents (Fig. 16.6) andpractitioners associated with the Texas Pest Management Association (TPMA) aredistributed throughout the state and function as applied researchers and extensioneducators. In each state, fact sheets and production manuals, developed by CESand/or other practitioners incorporate IPM recommendations that are based on ap-plied research, and/or the experiences of other stakeholders. Prior to publication,this IPM information is presented at traditional venues: field days, grower meet-ings, professional development meetings, and pesticide certification meetings. Asdocumented in other cropping systems in the Southern Plains (Koul and Cuperus2007), this information is readily shared among producers at elevators and fertilizerdealers, however, CES personnel are often the source of this initial IPM informationin wheat.
In Oklahoma and Texas, wheat producers remain concerned about the potentialfor aphid damage. Surveys and focus groups indicate that a majority of producersin this region consider aphids to be a serious to very serious problem (Smolen andCuperus 2000, Kelsey and Mariger 2002, Keenan et al. 2007a,b). Severe infestationsof aphids in this region typically only occur every 5–10 years, however, these severeoutbreaks influence how wheat growers (1) perceive the importance of aphids and(2) implement management programs. Until recently, during non-outbreak years,many hectares of wheat have been treated with pesticide to “protect” fields as aphidpopulations approach or exceed economic thresholds (ET’s). For example, duringthe 1995/1996 growing season over 800,000 acres (320,000 ha) in Oklahoma were
16 Dissemination and Impact of IPM Programs in US Agriculture 495
Fig. 16.6 Texas IPM Agents Map. http://ipm.tamu.edu/agents/
treated to “protect” wheat yields even though most aphid populations were belowEIL’s (Crop Profile for wheat in Oklahoma 2005, NASS 2007). During these appli-cations the parasitic wasp L. testaceipes had begun to decimate aphid populationsand most of the insecticide applications likely provided no economic benefit.
Recent studies indicated that aphids remain below EIL’s when L. testaceipes arepresent at threshold levels (Natural Enemy Threshold = NET) during the growingseason (Jones 2001, Giles et al. 2003). These findings resulted in the developmentof presence/absence sampling plans for aphids and parasitoids in wheat applicableto Oklahoma and Texas (Giles et al. 2000, Elliott et al. 2004, Royer et al. 2004a,b).These novel binomial sampling plans allow for efficient classification of the im-pact of parasitoids and/or greenbug infestations in wheat. These sampling and man-agement plans (Glance n′ Go system) were incorporated into laminated foldablepocket-sized tables for multiple-year use with dry erase markers, and are also

496 K.L. Giles and N.R. Walker
Fig. 16.7 Example of “Glance n’ Go” greenbug+parasitism worksheet
available as the Greenbug Management Decision Support Tool on the web (Royeret al. 2004a,b, www.entoplp.okstate.edu/gbweb/index.htm, Fig. 16.7).
As in corn systems, the most comprehensive and easy to use IPM information forarthropods and diseases infesting wheat is available on centralized individual IPMwebsites for Oklahoma and Texas. Information on these sites can be accessed byarea/regional and county CES personnel, but also by producers and other stakehold-ers. The Oklahoma IPM web-site (Oklahoma IPM 2007) is a central resource area,organized primarily by commodity, which allows access to fact sheets, newsletters,

16 Dissemination and Impact of IPM Programs in US Agriculture 497
computer decision support models, and other projects including IPM for insect pestsin schools. The Greenbug Management Decision Support Tool that incorporatesGlance n′ Go is found within the computer decision support section of the web-siteand allows any user to instantly develop and print sampling and decision plans forgreenbugs in wheat.
The Texas, IPM (2007) web-site describes itself as a central resource:
“This website is designed to provide a window or a one-stop guide to IPM information fromTexas A&M University and its many departments, units and agencies. It also provides a linkto related information from other sources. Much of the information is available because oflinks to departmental sites on campus and at Texas A&M Research and Extension Centerslocated across the state. This is not meant to detract from any other site but rather as acustomer service feature to those seeking IPM information from Texas A&M University.”
This website is also organized primarily by commodity allowing access to print-able fact sheets, newsletters, and computer decision support models. The TexasIPM web-site is quite unique in that the first topic on the outline provides a linkto the Overview of IPM (Fig. 16.8). This overview emphasizes the philosophicalapproach that practitioners in Texas take towards IPM and its dissemination, andincludes detailed discussion on the following topics: What IPM Is Not, History ofIPM, Strategies, Benefits, Role of Pesticides, and About the Texas IPM Program.
Fig. 16.8 Texas IPM Website. http://ipm.tamu.edu/

498 K.L. Giles and N.R. Walker
Clearly, dissemination of IPM information for wheat in Oklahoma and Texas isbased on CES activities, programs, and websites. The newly developed Glance n′
Go sampling and management plans allows for efficient economical managementof aphids in wheat, but are producers aware of and utilizing this resource? In focusgroups, Keenan et al. (2007a) documented the IPM perspectives of wheat grow-ers in the Southern and Central Great Plains. These focus group discussions weredesigned to elicit perspectives without lead-in questions that bias answers towardsIPM concepts. A few growers acknowledged that they were aware of field scoutingprocedures for aphids, but that those methods were too difficult to use and requiredtoo much time. At the time of these focus groups (2002–2003), Glance n’ Go wasnewly developed, therefore these producers were likely describing older more cum-bersome aphid sampling methods (Patrick and Boring 1990, Royer et al. 1999).Indeed, the results of an unpublished survey of producers who attended field-daysand other extension meetings during this time indicated that less than 1% of pro-ducers had heard of Glance n’ Go (T. A. Royer Unpublished Data). It appeared thatwheat growers were not aware of or following new recommendations for aphid man-agement outlined by CES personnel. A large scale extension and evaluation effortfor Glance n’ Go was initiated in 2004 and will continue through 2009, and CESpersonnel are planning to document awareness and adoption of this new samplingapproach.
16.2.4 Cotton in the Southern US
In Georgia and Texas, over 7 million acres (2.8 million hectares) of cotton areplanted each year (Crop Profile for Cotton in Texas 1999, Brown et al. 2007).Cotton is grown throughout the Southern US because it requires a long growingseason for proper maturation. The major insect pests of cotton have historicallyincluded boll weevils (Anthonomus grandis), bollworms (Helicoverpa zea), flea-hoppers (Pseudatomoscelis seriatus), aphids (Aphis gossypii), and thrips (Franklin-iella occidentalis), with occasional secondary pests that include beet armyworms(podoptera exigua) and lygus bugs (Lygus hesperus) and several species of cut-worms, spider mites and stinkbugs (Leonard et al. 1999). Insect pest managementin cotton changed dramatically following (1) the highly successful Boll WeevilEradication Program (BWEP) and (2) the introduction and adoption Bt cotton forsuppression of Lepidopteran pests (Brown et al. 2007, Spurgeon 2007). For exam-ple, following the BWEP in Georgia, the number of insecticide applications peryear decreased from 10–12 to 4–5, and further decreased to 3 per year followingwidespread adoption of Bt Cotton (Crop Profile for Cotton in Georgia 2006, Brownet al. 2007, NASS 2007). In Texas, with the exception of increased Malathion use asa component of the BWEP (Table 16.1), a long history of variety selection, culturalapproaches, scouting and natural enemy conservation have helped to maintain onaverage a low annual number of insecticide applications in cotton (Crop Profile forCotton in Texas 1999, Harris 2001, Muegge et al. 2002). Reduced applications of

16 Dissemination and Impact of IPM Programs in US Agriculture 499
insecticide have conserved the abundance and effects of beneficial predators andparasitoids, but allowed the resurgence of lygus and stink bugs (McAlavy 2005,Crop Profile for Cotton in Georgia 2006). Indeed, increasing stink bug populationsin Georgia may be responsible for increased total amount of insecticide applied tocotton from 1997–2005 (Table 16.1, NASS 2008). CES personnel in Georgia andTexas clearly emphasize that management of insect pests must include scouting inboth non-Bt cotton and Bt cotton, and selective suppression of pests as they occur(Crop Profile for Cotton in Texas 1999, Moore et al. 1997, Crop Profile for Cottonin Georgia 2006, Brown et al. 2007)
In the US, cotton diseases reduce production by over 12% which equates to over1 billion dollars annually (Bell 1999). In Georgia and Texas, several diseases are ofconcern to growers including various seedling fungi (Rhizoctonia solani, Pythiumspp, Thelaviopsis basicola, and Fusarium spp.), nematodes, boll rots, verticilliumwilt and root rots (Crop Profile for Cotton in Texas 1999, Crop Profile for Cottonin Georgia 2006, Brown et al. 2007). The long history of cotton breeding has re-sulted in cultivars that have variable levels of resistance to many common diseases,and newer Bt cottons that are injured less by insects reduce entry opportunities forpathogens. Crop rotation is highly recommended by CES personnel as a culturalstrategy to avoid diseases common in continuous cotton. As with corn, cottonseedling diseases are managed primarily with seeds that are abundantly pre-treatedwith fungicides, and infrequently by in-furrow fungicides. In Georgia particularly,root-knot or reniform nematodes can be an important problem in continuous cot-ton and may require soil sampling and costly soil fumigation or incorporation ofnematicides in the production system program (Brown et al. 2007).
Similar to Iowa, Illinois, and Oklahoma, CES personnel in Georgia at state levelsinteract with district directors and individuals at county offices to develop and dis-seminate IPM information. As mentioned before, in Texas, IPM agents and profes-sionals associated with the TPMA interact with CES personnel at all levels and withother stakeholders. As with other crops, centralized IPM websites (Georgia IPM2007, Texas, IPM 2007, Brown et al. 2007) for Georgia and Texas contain compre-hensive information for management of arthropods and diseases affecting cotton.IPM Information (fact sheets, newsletters, production manuals/handbooks/guides,and computer decision support models etc.) on the cotton web-sites can be accessedby all CES personnel, and also by producers and other stakeholders who have com-puter access.
IPM recommendations for cotton are presented holistically on Georgia and Texaswebsites. Similar to the Texas IPM site, the Georgia IPM site (Georgia IPM 2007)immediately addresses the definition of IPM and is organized primarily by tacticsand commodities which are linked to printable IPM information and recommenda-tions (Fig. 16.9). As with IPM sites for corn in Iowa and Illinois, the cotton websitesgive equal “billing” to all IPM approaches including variety selection and Bt cot-ton, seed treatment recommendations, cultural approaches, conservation of naturalenemies, and scouting/ET information. A holistic approach towards managementof arthropods and diseases in cotton has been quite successful for decades in Texasand Georgia following the BWEP. Likely because of ongoing successful cotton IPM

500 K.L. Giles and N.R. Walker
Fig. 16.9 University of Georgia IPM website. http://ipm.ent.uga.edu/
programs in these states, CES personnel are relatively cautious in their approach toBt cotton which is clearly presented as a component of IPM.
As with Bt corn, Monsanto company websites for Bt cotton focus on protectionfrom insects, agronomic benefits of this protection including reduced secondarypathogen activity, reduced insecticide inputs, and IRM approaches as responsiblestewardship of agricultural land (Monsanto Company Website 2007). Bt cotton hasbeen improved over time to be more effective in a variety of growing locations withdifferent pest pressures. For example, Bollgard II cotton expresses two Bt insectici-dal proteins (versus Bollgard with 1 protein) which prevents damage from a broadrange of lepidopteran pests. In contrast to Bt corn, Bt cotton is purposely marketedby Monsanto as a component of a holistic IPM approach that conserves beneficialinsects and reduces pesticide applications. Specifically, the IRM guidelines for Boll-gard call for careful monitoring of targeted and non-target insects and use of ET’sas appropriate, although no specific recommendations or links to procedures are
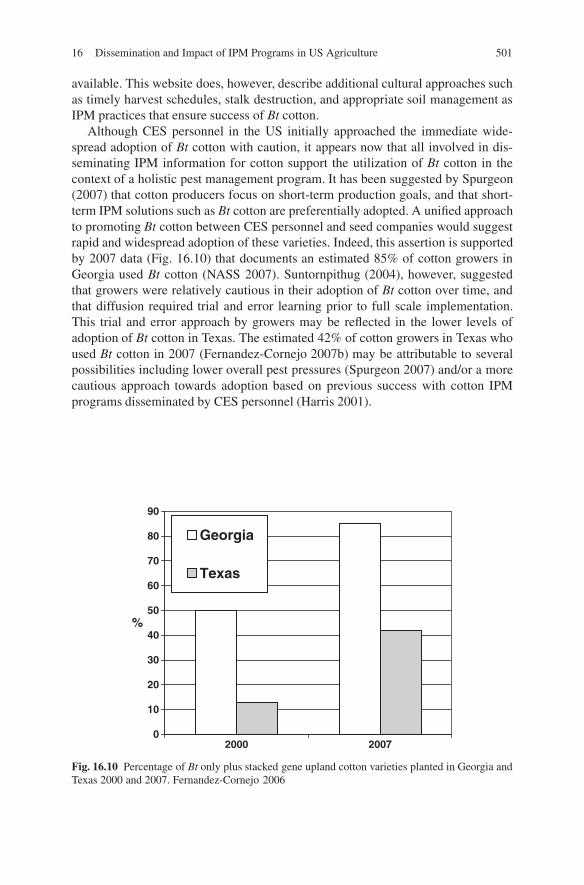
16 Dissemination and Impact of IPM Programs in US Agriculture 501
available. This website does, however, describe additional cultural approaches suchas timely harvest schedules, stalk destruction, and appropriate soil management asIPM practices that ensure success of Bt cotton.
Although CES personnel in the US initially approached the immediate wide-spread adoption of Bt cotton with caution, it appears now that all involved in dis-seminating IPM information for cotton support the utilization of Bt cotton in thecontext of a holistic pest management program. It has been suggested by Spurgeon(2007) that cotton producers focus on short-term production goals, and that short-term IPM solutions such as Bt cotton are preferentially adopted. A unified approachto promoting Bt cotton between CES personnel and seed companies would suggestrapid and widespread adoption of these varieties. Indeed, this assertion is supportedby 2007 data (Fig. 16.10) that documents an estimated 85% of cotton growers inGeorgia used Bt cotton (NASS 2007). Suntornpithug (2004), however, suggestedthat growers were relatively cautious in their adoption of Bt cotton over time, andthat diffusion required trial and error learning prior to full scale implementation.This trial and error approach by growers may be reflected in the lower levels ofadoption of Bt cotton in Texas. The estimated 42% of cotton growers in Texas whoused Bt cotton in 2007 (Fernandez-Cornejo 2007b) may be attributable to severalpossibilities including lower overall pest pressures (Spurgeon 2007) and/or a morecautious approach towards adoption based on previous success with cotton IPMprograms disseminated by CES personnel (Harris 2001).
0
10
20
30
40
50
60
70
80
90
2000 2007
Georgia
Texas
%
Fig. 16.10 Percentage of Bt only plus stacked gene upland cotton varieties planted in Georgia andTexas 2000 and 2007. Fernandez-Cornejo 2006

502 K.L. Giles and N.R. Walker
16.3 Conclusions
Current IPM programs in the US, which are often dictated by national initiatives andfunding programs, are disseminated to stakeholders by a network of public and pri-vate organizations. The Cooperative Extension Service is unique to the US and thoseinvolved in IPM have functioned primarily to disseminate holistic recommendationsfor managing pests in cropping systems. With the development of transgenic crops,primarily those with Bt insecticidal proteins, private industry personnel have becomeincreasingly involved in disseminating IPM recommendations, particularly in cornand cotton systems. Adoption of Bt crops has increased dramatically during the past10 years, however, growers are clearly utilizing information disseminated by bothCES and private industry. Much of the current information for IPM is disseminatedvia centralized CES websites as electronic and print on demand documents. Also, asdocumented by Koul and Cuperus (2007), IPM recommendations and informationcontinue to be disseminated by local private contacts and fellow growers.
Acknowledgments We thank T. A. Royer and N. C. Elliott for their review of this document.This work was approved for publication by the Director of the Oklahoma Agricultural ExperimentStation, and supported in part under projects OKLO2334 and OKLO2420.
References
Bell, A.A. 1999. Diseases of cotton. In: Smith, C. W. and Cothren, J. T. (eds), Cotton: Origin,History, Technology, and Production. John Wiley & Sons, Inc. NY.
Benbrook, C.M. 2004. Genetically Engineered Crops and Pesticide Use in the UnitedStates: The First Nine Years. BioTech InfoNet. Technical Paper Number 7. Available at:http://www.biotech-info.net/Full version first nine.pdf.
Brown, S.M., Culpeper, S., Harris, G., Kemerait, B., Perry, C., Roberts, P., Shurley, D.and Williams, J. 2007. 2007 Georgia Cotton Production Guide. Available at:http://commodities.caes.uga.edu/gieldcrops/cotton/2007cottonguide/2007CottonGuide.htm.
Cate, J. R. and Hinkle, M.K. 1994. Integrated Pest Management: The Path of a Paradigm. NationalAudubon Society, Washinton DC.
Copp, J.H., Sill, M.L., and Brown, E.J. 1958. The function of information sources in the farmpractice adoption process. Rural Sociology 23:146–157.
Crop Profile for Corn in Illinois. 2000. Available at: http://www.ipmcenters.org/cropprofiles/docs/ILcorn.html.
Crop Profile for Corn (Field) in Iowa. 1999. Available at: http://www.ipmcenters.org/cropprofiles/docs/IAcorn-field.html.
Crop Profile for Cotton in Georgia. 2006. Available at: http://www.ipmcenters.org/cropprofiles/docs/GAcotton.html.
Crop Profile for Cotton in Texas. 1999. Available at: http://www.ipmcenters.org/cropprofiles/docs/txcotton.html.
Crop Profile for Wheat in Oklahoma. 2005. http://www.ipmcenters.org/cropprofiles/docs/okwheat.html.
Edwards, J., Hunger, B., Carver, B. and Royer, T. 2006. Wheat Variety ComparisonChart. Production Technology 18:6, rev. 1. Available at: http://www.wheat.okstate.edu/vtr/varietycharacteristics/pt97-17/PT20066rev12007ViretyCompChrt.pdf.

16 Dissemination and Impact of IPM Programs in US Agriculture 503
Elliott, N.C., Royer, T.A, Giles, K.L., Kindler, S.D., Porter, D.R., Elliott, D.T. and Waits, D.A.2004. A web-based management decision support system for greenbugs in winter wheat. CropManagement. http://www.plantmanagementnetwork.org/cm/.
Epplin, F.M., True, R.R. and Krenzer, Jr., E.G. 1998. Practices used by Oklahoma wheat growers byregion. In: Henneberry (ed), Oklahoma: Current Farm Economics. DASNR, Oklahoma StateUniversity, Stillwater.
Fernandez-Cornejo, J. 2006. Adoption of genetically engineered crops in the U. S. Economic Re-search Service – USDA. Available at: http://www.isb.vt.edu/articles/aug0604.htm.
Fernandez-Cornejo, J. 2007a. Adoption of genetically engineered crops in the U.S.: cornvarieties. Economic Research Service – USDA. Available at: http://www.ers.usda.gov/Data/BiotechCrops/ExtentofAdoptionTable1.htm.
Fernandez-Cornejo, J. 2007b. Adoption of genetically engineered crops in the U.S.: cot-ton varieties. Economic Research Service – USDA. Available at: http://www.ers.usda.gov/Data/BiotechCrops/ExtentofAdoptionTable2.htm.
Frisvold, G., Tronstad, R. and Mortenson, J. 1999. Economics of Bt Cotton. Available at:http://ag.arizona.edu/arec/ext/btcotton/display.html.
Fuchs, T.W. 2007. Diffusion of IPM programs in commercial agriculture: concepts and constraints.In: Koul, O. and Cuperus, G. (eds), Ecologically Based Pest Management. CAB International,Oxfordshire, pp. 432–444.
Georgia IPM. 2007. Georgia IPM: integrated pest management. The University of Georgia Collegeof Agricultural and Environmental Sciences. Available at: http://ipm.ent.uga.edu/
Georgia Pest Management Handbook. 2007. Available at: http://www.ent.uga.edu/pmh/.Giles, K.L., Royer, T.A., Elliott, N.C. and Kindler, S.D. 2000. Development and Validation of a
Binomial Sequential Sampling Plan for the Greenbug (Homoptera: Aphididae) Infesting WinterWheat in the Southern Plains. Journal of Economic Entomology 93:1522–1530.
Giles, K.L., Jones, D.B., Royer, T.A., Elliott, N.C. and Kindler, S.D. 2003. Development of a sam-pling plan in winter wheat that estimates cereal aphid parasitism levels and predicts populationsuppression. Journal of Economic Entomology 96:975–982.
Gurr, G.M., Price, P.W., Mauricio U., Wade, M., Wratten, S.D. and Simmons, A.T. 2007. Ecologyof predator-prey and parasitoid-host systems: Its role in integrated pest management. In: Koul,O. and Cuperus, G. (Eds), Ecologically Based Pest Management. CAB International, Oxford-shire, pp. 222–248.
Harris, M.K. 2001. IPM, what has it delivered? A Texas case history emphasizing cotton, sorghum,and pecan. Plant Disease 85:112–121.
Hoy, C.W., McCully, J.E., Laborde, J., Vargas-Lopez, A., Bujanos-Muniz, R. and Rangel, E. 2007.The linkage between integrated pest management and agroecosystem management: a case studyin the Bajio, Mexico. American Entomologist 53:174–183.
Hurley, T.M., Langrock, I. and Ostlie, K. 2006. Estimating the benefits of Bt corn and cost of insectresistance management Ex ante. Journal of Agricultural and Resource Economics. 31:355–375.
Illinois IPM. 2007. Integrated pest management. University of Illinois Extension. Available at:http://www.ipm.uiuc.edu/index.html.
Iowa IPM. 2007. Integrated pest management. Iowa State University Extension. Available at:http://www.ipm.iastate.edu/ipm/.
Jeffers, D.P. 2004. Disease Control. In Smith, C.W. (ed), Corn: Origin, History, Technology, andProduction. John Wiley & Sons, Inc. NY.
Jacobsen, B.J. 1997. Role of plant pathology in integrated pest management. Annual Review ofPhytopathology 35:373–391.
Jacobson, B.J. 2007. Ecologically based management of plant diseases. In: Koul, O. andCuperus, G. (eds), Ecologically Based Pest Management. CAB International, Oxfordshire, UK:18–36.
Jones, D.J. 2001. Natural Enemy Thresholds for Greenbug, Schizaphis Graminum (Rondani), onWinter Wheat. M.S. thesis, Oklahoma State Univ., Stillwater, OK.
Keenan, S.P., Giles, K.L., Elliott, N.C., Royer, T.A., Porter, D.R., Burgener, P.A. andChristian, D.A. 2007a. Grower perspectives on areawide wheat integrated pest management

504 K.L. Giles and N.R. Walker
in the southern US great plains. In: Koul, O. and Cuperus, G. (eds), Ecologically Based PestManagement. CAB International, Oxfordshire, pp. 289–314.
Keenan, S.P., Giles, K.L., Burgener, P.A. and Elliott, N.C. 2007b. Collaborating with wheat grow-ers in demonstrating areawide integrated pest management. Journal of Extension. Available at:http://www.joe.org/joe/2007february/a7.shtml.
Kelsey, K.D. and Mariger, S.C. 2002. A survey-based model for setting research, education, andextension priorities at the land-grant university-A case study of Oklahoma Wheat Producers:Final report. Oklahoma State University, Agricultural Education, Communications, and 4-HYouth Development, 27 p.
Kogan, M. 1998. Integrated pest management: historical perspectives and contemporary develop-ments. Annual Review of Entomology 43:243–270.
Koul, O. and Cuperus, G. W. 2007. Ecologically based integrated pest management: present con-cept and new solutions. In: Koul, O. and Cuperus, G. (eds), Ecologically Based Pest Manage-ment. CAB International, Oxfordshire, pp. 1–17.
Lazar, M.D., Worrall, W.D., Peterson, G.L., Porter, K.B., Rooney, L.W., Tuleen, N.A., Marshall,D.S., McDaniel, M.E. and Nelson, L.R. 1998. Registration of TAM 110 wheat. Crop Science37:1978–1979.
Leonard, B.R., Graves, J.B. and Ellsworth, P.C. 1999. Insect and mite pests of cotton. In: Smith,C.W. and Cothren, J.T. (eds), Cotton: Origin, History, Technology, and Production. John Wiley& Sons, Inc. NY.
McAlavy, T.W. 2005. Lygus get in-depth study at Texas A&M. Southwest Farm Press. Availableat: http://southwestfarmpress.com/mag/farming lygus indepth study/. Penton Media, Inc.
Moore, G.C., Benedict, J.H., Fuchs, T.W. and Friesen, R.D. 1997. Bt cotton technology in Texas:a practical view. grains. Texas Agricultural Extension Service Publication. B-6107, CollegeStation, Texas.
Monsanto Company Website. 2007. Monsanto US ag Products. Available at: http://www.monsanto.com/monsanto/ag products/.
Muegge, M.A., Baugh, B.A., Leser, J.F. and Doederlein, T.A. 2002. Managing cotton insects inthe high plains, rolling plains and Trans-Pecos areas of Texas. Texas Agricultural ExtensionService Publication. E-6, College Station, Texas.
National Agricultural Statistics Survey, USDA. 2007. Available at: http://www.usda.gov/nass/.National Agricultural Statistics Survey, USDA. 2008. Available at: http://www.usda.gov/nass/.National Research Council. 1996. Ecologically Based Pest Management: New Solutions for a New
Century. Natl. Acad. Press. Washington DC.National Research Council. 2000. The Future Role of Pesticides in US Agriculture. Natl. Acad.
Press. Washington DC.Norris, R.F., Caswell-Chen, E.P. and Kogan, M. 2003. Concepts in Integrated Pest Management.
Prentice Hall, Upper Saddle River, NJ.Nowak, P. 1987. The adoption of agricultural conservation technologies: economics and diffusion
explanations. Rural Sociology 52:208–220.Obrycki, J.J. 2001. Transgenic insecticidal corn: The agronomic and ecological rationale for its
use – Response. Bioscience 51:903–905.Oklahoma IPM. 2007. IPM: integrated pest management Oklahoma State University. Oklahoma
State University Cooperative Extension. Available at: http://www.ento.okstate.edu/ipm/.Patrick, C.D. and Boring, E.P. III. 1990. Managing insect and mite pests of Texas small grains.
Texas Agricultural Extension Service Publication. B-1251, College Station, Texas.Porter, D.R., Burd, J.D., Shufran, K.A., Webster, J.A. and Teetes, G.L. 1997. Greenbug (Ho-
moptera: Aphididae) biotypes: selected by resistant cultivars or preadapted opportunists? Jour-nal of Economic Entomology 90:1055–1065.
Probst, T. and Smolen, M. 2003. Salt Fork Watershed Agricultural Producer Survey Results. Avail-able at: http://bioen.okatate.edu/waterquality/projects Programs/Salt Fork/index.htm.
Rice, M.E. 2004. Transgenic rootworm corn: assessing potential agronomic, eco-nomic, and environmental benefits. Plant Health Progress. Available at: http://www.plantmanagementnetwork.org/pub/php/review/2004/rootworm/.

16 Dissemination and Impact of IPM Programs in US Agriculture 505
Royer, T.A., Giles, K.L. and Elliott, N.C. 1998. Small grain aphids in Oklahoma. Oklahoma Co-operative Extension Service, Oklahoma State University Extension Facts, F-7183, Stillwater.
Royer, R.A., Mulder, P.G. and Cuperus, G.W. 1999. Renaming (redefining) integrated pest man-agement: Fumble, pass, or play? American Entomologist. 45:136–139.
Royer, T.A. and Krenzer, E.G. 2000. Wheat Management in Oklahoma: A Handbook for Okla-homa’s Wheat Industry. Publication E-831. Oklahoma Cooperative Extension Service, OK.
Royer, T.A., Sloderbeck, P.E., Troxclair, Jr., N. and Wright, R.J. 2004. In: Smith, C.W. (ed), Corn:Origin, History, Technology, and Production. John Wiley & Sons, Inc. NY.
Royer, T.A., Giles, K.L. and Elliott, N.C. 2004a. Glance ′n go sampling for greenbugs in winterwheat: spring edition. Oklahoma Cooperative Extension Service, Oklahoma State UniversityExtension Facts, L-306, Stillwater.
Royer, T.A., Giles, K.L. and Elliott, N.C. 2004b. Glance ′n go sampling for greenbugs in win-ter wheat: fall edition. Oklahoma Cooperative Extension Service, Oklahoma State UniversityExtension Facts, L-307, Stillwater.
Shelton, A.M. and Bellinder, R.R. 2007. Role of biotechnological advances in shaping the futureof integrated pest management. In: Koul, O. and Cuperus, G. (eds), Ecologically Based PestManagement. CAB International, Oxfordshire, pp. 269–288.
Smith, D. and Anisco, J. 2000. Wheat in Texas: crop brief on production, pests, & pesti-cides. TAES, Texas Cooperative Extension. http://extension-horticulture.tamu.edu/extension/cropbriefs/wheat.html.
Smolen, M. and Cuperus, G. 2000. Salt Fork Watershed: Agricultural Producer Survey Re-sults. Oklahoma Cooperative Extension Service Water Quality Programs. Available at:http://biosystems.okstate.edu/waterquality/publications/project reports/sfork survey.pdf.
Spurgeon, D.W. 2007. Ecologically based integrated pest management in cotton. In: Koul, O.and Cuperus, G. (eds), Ecologically Based Pest Management. CAB International, Oxfordshire,pp. 367–405.
Steffey, K. 2007. Bt Corn + Soil Insecticide: What? The Bulletin. No. 23. Available at:http://ipm.uiuc.edu/bulletin/article.php?id=855.
Stejskal, V. 2003. ‘Economic Injury Level’ and preventive pest control. Journal of Pest Science 76:170–172.
Stern, V.M., Smith, R.F., vanden Bosch, R. and Hagen, K.S. 1959. The integrated control concept.Hilgardia 29:81–101.
Suntornpithug, P. 2004. Adoption and Diffusion of Agrobiotechnologies in the US Cotton Produc-tion. Ph. D. Dissertation, University of Missouri-Columbia, Columbia, MO.
Texas, IPM. 2007. Texas IPM program. Texas Cooperative Extension, Texas A&M University.Available at: http://ipm.tamu.edu/.

Chapter 17Advances with Integrated Pest Managementas a Component of Sustainable Agriculture:The Case of the Australian Cotton Industry
Gary Fitt, Lewis Wilson, David Kelly and Robert Mensah
Abstract Insect pests represent a significant limitation for production of manycrops. Traditional reliance on pesticides brings significant economic costs and en-vironmental liabilities of off-target drift, chemical residues and resistance. IPMhas long been proposed as an alternative. The adoption of IPM in the Australiancotton industry provides a valuable overview of the key components of IPM andthe issues around successful implementation. IPM must be founded on a thoroughunderstanding of the ecology of pest and beneficial species and their interactionwith the crop and will provide a range of tactics which must be integrated by theproducer to achieve economic and environmental sustainability. The emerging eraof insect resistant transgenic cottons offers real prospects to provide a foundationfor more sustainable, economically acceptable IPM with the integration of a rangeof non-chemical tactics and much less reliance on pesticides.
Keywords Cotton · IPM · Integrated Pest Management · Sustainability ·Helicoverpa
17.1 Introduction
Insect pests are a major constraint on production of many crops worldwide throughdirect yield and quality reductions, through damage in storage and through the costsassociated with attempts at control. Pest management using traditional approacheswith pesticides can often be effective but imposes significant economic, environ-mental and social costs and risks of insecticide resistance which must be managed.Integrated pest management has long been proposed as a more sustainable approachfor many situations, however, the adoption of a truly integrated pest managementapproach has been extremely patchy. More often IPM relates to integrated pesticidemanagement.
G. Fitt (B)Commonwealth Scientific and Industrial Research Organization (CSIRO) Entomology,Long Pocket Laboratories, 120 Meiers Rd, Indooroopilly, Qld 4068, Australiae-mail: [email protected]
R. Peshin, A.K. Dhawan (eds.), Integrated Pest Management: Disseminationand Impact, DOI 10.1007/978-1-4020-8990-9 17,C© Springer Science+Business Media B.V. 2009
507

508 G. Fitt et al.
Broadly IPM can be defined as “the careful consideration of all available pestcontrol techniques and subsequent integration of appropriate measures that discour-age the development of pest populations and keep pesticides and other interventionsto levels that are economically justified and reduce or minimize risks to humanhealth and the environment. IPM emphasizes the growth of a healthy crop with theleast possible disruption to agro-ecosystems and encourages natural pest controlmechanisms.” (FAO 2002).
In this paper we will illustrate the progress that has been made in implemen-tation of IPM in field crops by reference to the Australian cotton industry wheremore sustainable IPM systems have been developed and where the challenges ofintegration and implementation are common to many other field crops. IPM in thecotton industry illustrates the key components and processes needed for successfuladoption and impact.
Many aspects of IPM have been applied in the cotton industry since the late1970s when the computer based decision support system, SIRATAC, was released toindustry (Hearn and Bange 2002). The minimal IPM approach involved the simpleuse of sampling systems and thresholds to better time the use of pesticides to cottonfields. However, today IPM represents a more expansive approach which seeks tominimise pesticide use and include a broader range of tactics such as pest resistantvarieties, conservation and augmentation of beneficial insect populations, use ofselective and short residual insecticides, recognition of the compensatory capacityof the plant and various cultural control practices which have long been associatedwith the IPM concept.
17.2 Integrated Pest Management – The Componentsand Principles
The Australian cotton industry faces a number of challenges in pest management(Fitt 1994). These include damage from key pests (the noctuid moths Helicoverpaarmigera Hubner and H. punctigera Wallengren, spider mites (Tetranychus urticaeKoch), aphids (Aphis gossypii Glover), mirids (Creontiades dilutus Stal) and silver-leaf whitefly (Bemisia tabaci (Gennadius))); insecticide resistance in the primarypest (H. armigera) and three secondary pests (mites, aphids and silverleaf whitefly);escalating costs of production and environmental concerns over off-farm movementof insecticides. Control of the primary pest, Helicoverpa spp. with broad spectruminsecticides often results in outbreaks of secondary pests, such as spider mites,aphids and silver leaf whitefly which are often controlled by generalist predatorsand some host specific parasitoids. Although IPM principles of sampling, thresholdsand recognition of beneficial species had been implemented in Australian cotton forseveral years, the industry faced a crisis in pest management in the 1998–99 growingseason, following a winter of high rainfall which generated abundant weed growthon which pest species could build. The subsequent high pest numbers on cotton ledto high control costs and served as a catalyst within the industry to try a broaderIPM based system.

17 Pest Management as a Component of Sustainable Agriculture 509
To address these issues, a major research effort has focused on reducing depen-dence on insecticides through the development and implementation of integratedpest management (IPM) systems (Wilson et al. 2004, Fitt 2000). To be valuable tothe cotton industry an IPM system needed to reduce insecticide use, whilst main-taining yield and early maturity and maintaining the susceptibility of pests to newselective insecticides. At the same time it needed to be practical and workablein the context of the whole farming system, and importantly be relevant to bothconventional cotton and transgenic (Bt) cotton varieties which both form importantcomponents of the current industry.
Additionally growers and consultants needed to understand and accept the basicpremises on which IPM is built. These were:
� the mere presence of a pest species does not justify action for control� IPM is about containment of a pest situation, not eradication� no single control measure can be applied to all pest complexes� some level of damage or loss to the crop should be tolerated� IPM utilizes a diverse array of control options to minimise pest abundance or
damage, with pesticides used as the last resort.� IPM does not seek to eliminate the use of pesticides, but aims to utilise the least
disruptive options and to reduce the use of pesticides for pest control to the lowestpractical levels.
The Australian cotton IPM system addresses these goals through 7 key objectives:
1. Using best practice crop agronomy to grow a healthy crop2. Effective sampling for pests, beneficial insects and plant damage, combined with
thresholds3. Conservation and use of beneficial insects, including preferential use of selective
insecticides;4. Preventing the development of insecticide resistance, including Bt-cotton5. Managing crop and weed hosts6. Using trap crops effectively7. Supporting IPM through communication and training (including area wide man-
agement).
Overriding these objectives is an emphasis on both profitability and sustainabilityas measures of effectiveness, ensuring that both input costs and yield are considered,rather than the traditional emphasis on maximizing yield. Our approach recognizesthat cotton is only one crop in a farming system, and that all the farm managementactivities and crops need to be accommodated into an IPM framework. Further-more IPM relevant activities can occur throughout the annual cycle of production,not just during the cotton growing season. A final consideration is supporting IPMthrough communication and training (including area wide management), which isdiscussed later.
These principles were captured in the ‘Guidelines for Integrated Pest Manage-ment in Australian Cotton’ (Deutscher et al. 2005). This IPM strategy focuses on the7 objectives described above and provides a framework to achieve them by aligning

510 G. Fitt et al.
them with phases of the annual crop cycle. To do this the crop cycle was divided intofive key periods: planting to first flower; first flower to first open boll; first open bollto harvest; a post harvest period; and a pre-planting period. The three first periodsdeal with the growth cycle of the cotton crop. The final two deal with the “off”season or winter period, during which other crops may be grown. Inclusion of thewinter period was essential, since many of the actions taken through this period haveimportant implications for the success of IPM in the following growing season.
For each objective, the activities involved were mapped to the relevant phase(s) ofthe crop cycle. Key non-insecticidal tools that can be used to manage pests or to en-hance abundance of beneficial species were indentified and included a range of agro-nomic, varietal and crop physiological factors that are part of the farming system,but not normally thought of as pest control tools. These include optimising fertilizerrates and irrigation strategies, the timing of the last irrigation, and the time to defo-liate the crop. These factors can all be manipulated to contribute toward the goals ofIPM. They also highlight that IPM requires a long-term ecosystem wide approachwhich must fit within a farming system context and not be perceived as an add-on.
17.3 IPM Objectives in Practice
The crop itself is the template on which a broad range of interactions between pestsand their environment are formed and is thus the starting point for any IPM sys-tem. In the Australian cotton system the advent of transgenic Bt-cotton, firstly theINGARD varieties (containing Cry1Ac) and more recently a suite of Bollgard IIvarieties (containing Cry1Ac and Cry 2Ab) has revolutionized pest management bydramatically reducing the need to control the primary pests. Fitt and Wilson (2000)demonstrate that insect resistant transgenic cottons are a good platform for IPM.They reduce the need to control Helicoverpa punctigera, the primary early-seasoncotton pest in Australia, thereby reducing disruption to beneficial insects caused byinsecticide use, and conserving and maximizing beneficial insect activity. Trans-genic Bt cotton is an important tool for IPM because it provides a very powerfulfoundation which helps growers to realize the benefits of IPM more easily (Fitt2003). In the 2006–07 cotton season, about 85% of the Australian cotton area wasplanted to Bollgard II varieties and the remainder to conventional (non-Bt) cotton.This emphasizes the need for IPM systems that can be applied across a mix of Btand non-Bt cotton.
Below we briefly describe the components of each objective and how they fit intothe crop cycle. Wilson et al. (2004) provide more detail.
17.3.1 Using Best Practice Crop Agronomy to Grow a Healthy Crop
IPM can reduce crop losses to pests but cannot increase the intrinsic yield potentialor fibre quality of the crop, which is largely determined by the interaction betweenvariety, climate and agronomy. Crop agronomy in particular can interact positively

17 Pest Management as a Component of Sustainable Agriculture 511
and negatively with an IPM system and it is possible to manage the crop and pestmanagement approach – so-called Integrated Crop Management (ICM) - to achievethe greatest positive benefit.
17.3.1.1 Optimal Planting Time
Planting outside the optimal time period (early October in most established pro-duction regions) adversely affects yield potential and is counter-productive to IPM.Very early planting (mid September) in cool districts increases the risk of damagedue to frost, severe cold, slow early growth and greater susceptibility to diseases andherbicide and early pest damage, especially from thrips. Late planted cotton resultin a greater variability in yield potential and increases the risk of late infestations ofH. armigera control of which further increases risks of outbreaks of spider mites,aphids and silverleaf whitefly that are difficult and expensive to control.
17.3.1.2 Optimal Water Management
Irrigation decisions should be based on knowledge of the soil water holding capac-ity, moisture status and an objective assessment of crop need. Over-frequent in-cropirrigations and unnecessary late irrigation will result in excessive vegetative growthand extend the period of attractiveness to pests with no enhancement in yield poten-tial. Optimal irrigation management can avoid this problem.
17.3.1.3 Strategic Use of Plant Growth Regulators
Excessive nitrogen fertilizer use and over-irrigation can result in crops with exces-sive vegetative growth, with not only reduced yield potential but remain attractiveto pests and mature late, thereby increasing the need to pest control. The plantgrowth regulator mepiquat chloride helps to reduce the severity of excessive veg-etative growth when used in conjunction with a regular crop monitoring program todetermine timing and quantities of application.
17.3.1.4 Defoliation of the Crop Promptly at Maturity
This can be assessed by cutting bolls and examining the color of the seed coats.Timely defoliation reduces the risk that further pest populations develop, whichcould require control.
17.3.1.5 Optimisation of Fertilizer Strategies to Avoid Excessive Plant Growth
Most nitrogen fertiliser for cotton is applied prior to sowing, often several monthsbeforehand. Nitrogen availability can directly affect pest management as well as po-tential yield and maturity. Too little nitrogen will decrease yield. Excessive nitrogencan create excessive end-of-season plant growth, making the crop more attractiveto Helicoverpa, aphids and silverleaf whitefly. This may require additional inputs of
512 G. Fitt et al.
expensive insecticides for control, potentially delay crop maturity by 1–2 weeks, ex-pose the crop to the risk of honeydew, and make crops harder to defoliate (Rochesteret al. 2001). Growers are advised to manage nitrogen on a field-by-field basis basedon soil tests and in-crop tissue tests (Constable and Rochester 1988) using DSS suchas NutriLOGIC and NUTRIpak to select appropriate fertilizer rates (Deutscher andBange 2003).
17.3.1.6 Matching of Cotton Variety to Region and Pest Complex
Australian growers have access to a wide range of varieties adapted to certain ge-ographical regions or production situations. Selection of the most appropriate va-rieties for the combination of season length, yield potential, fibre quality, diseaseresistance, pest complex and agronomic situation is critical for IPM. Aside from thetransgenic Bt traits, cotton plants have a number of naturally occurring biochemi-cal (tannins, terpenoids) and morphological (leaf shape) defences against arthropod(insects and mites) pests and a high capacity to compensate for pest damage sincethe plant produces many more flowerbuds than it can mature as bolls. Several con-ventional host plant resistance traits have been incorporated into modern varieties.These include resistances to key diseases (bacterial blight, Verticillium, Fusarium,Cotton Bunchy Top) and morphological traits (okra leaf, smoothleaf) which reducethe development of pest populations. However there remains much genetic variabil-ity in insect resistance traits and in the potential of cotton to compensate for damage(Sadras 1995, Sadras and Fitt 1997).
17.3.2 Effective Sampling for Pests, Beneficial Insects and PlantDamage, Combined with Thresholds
17.3.2.1 Rigorous and Regular Crop Sampling
Regular crop sampling for pests, plant damage, crop development and beneficialinsects is critical for effective IPM (Deutscher and Wilson 1999a). Regular sampling(every 3 days during crop development) means that decisions to delay control canbe monitored and action taken if the situation changes while the pest population canstill be effectively controlled with selective insecticides.
17.3.2.2 Use of Combined Pest and Damage Thresholds
Thresholds are an essential tool to ensure that insecticides are only applied if eco-nomic loss is reasonably expected to occur (Deutscher and Wilson 1999b, Farrell2006). However, thresholds based solely on pest numbers alone assume that allcotton crops respond to pest density in a similar way and does not account for theimpact of beneficial insects. Many other factors may ameliorate crop response topests (e.g. vigour, disease, temperature, moisture status and nutrition) such that thecrop compensates for damage. Guidelines have been established for the amount

17 Pest Management as a Component of Sustainable Agriculture 513
of damage that plants can tolerate without loss of yield or delay (Wilson et al.(2003)). By integrating compensatory responses into thresholds it is possible toidentify those situations where pests may have exceeded a threshold but the cropwill recover without loss, or that the crops yield potential is such that insect damageis not the yield limiting factor; as often is the case in raingrown crops. In thesesituations, where insect control in non-economic, insecticide applications may beprevented.
17.3.3 Conservation and Use of Beneficial Insects
Cotton fields typically harbour a rich diversity of arthropods. In Australia, up to 450different species have been recorded in unsprayed fields (L. Wilson unpublished)and a significant proportion of these are beneficials. It is striking that the key bene-ficial groups in cotton are similar in many parts of the world (Hearn and Fitt 1992),but their impacts and value have often proven difficult to demonstrate.
While predators and parasites are important components of IPM systems thereare often severe limitations in the capacity of beneficials to control some pests, par-ticularly the Heliothines. These pests are highly mobile, highly fecund, well adaptedto exploit diverse cropping systems (Fitt, 1989, 1994) and capable of explosiveinfestations of crops. Consequently an important area of research, beyond simplyminimizing the use of disruptive chemicals, has been to identify means to conserve,augment or manipulate beneficial populations. Conservation of natural enemies re-quires considerable ecological understanding of their seasonal phenology, habitatand prey requirements. Extensive research has now defined the key predators andparasitoids and their basic biology. The majority of predators are generalists, ableto sustain populations on a diversity of prey types. Predator abundance can be read-ily monitored and estimates of abundance utilised in decision making through apredator/prey ratio which indicates when predators are sufficiently abundant to haveimpact (Mensah 2002a,b). Mechanisms to encourage beneficial insects during thecotton season include:
17.3.3.1 Preferential Use of Selective Insecticides
New generation insecticides are much more selective than the older suite of organo-phosphate, carbamate and pyrethroid pesticides which characterised Australian cot-ton a decade ago. A number of new compounds and chemical groups (e.g. spinosad,emamectin, indoxacarb, pymetrozine, diafethiuron and methoxyfenozide) togetherwith biologicals (NPV virus and Bt sprays) provide powerful IPM tools as they areless disruptive to beneficial populations. Independent information on the efficacyand non-target effects of all current insecticides has been obtained locally (Wilsonet al. 2002). Understanding the particular characteristics of insecticides is important.For example, spinosad (Tracer R©) has a low impact on predatory Coleoptera andHemiptera, but is very disruptive of micro-Hymenoptera (including Trichogramma),ants and thrips, which eat mite eggs (Wilson et al. 1996).

514 G. Fitt et al.
17.3.3.2 ‘Site-specific’ Pest Management
Historically cotton growers often treated the whole farm as the unit for pest manage-ment. While this practice reduced application costs and provided some streamliningof farm operations it also meant that beneficial populations could be impacted overwide areas, leaving no refuge for beneficials to recolonise sprayed fields. By treatingonly fields that are over threshold with selective insecticides, this disruption can beminimised. ‘Site specific management’ is in a fundamental sense a type of precisionagriculture.
17.3.3.3 Selection of Appropriate Insecticidal Seed Treatments
By definition, the use of ‘at planting’ insecticides, applied in the soil (such as aldi-carb or phorate) or applied directly to the seed as a seed treatment (such as imi-docloprid, thiodicarb and fipronil), is ‘prophylactic’ and may not seem compatiblewith an IPM approach. The main targets of these seed treatments are thrips andsoil insects, (e.g. false wireworm) and the insecticides themselves are reasonablyselective (Wilson et al. 2002) with minimal impact on many beneficial groups. Theirselectivity is based on the fact that they do not contaminate the foliage but are ab-sorbed by the plants. Since beneficial insects do not feed directly on the plant theyare largely unaffected by seed applied insecticide treatments or in furrow applicationof these insecticides. Therefore, in situations where there is a reasonable expectationof an economic benefit from control of thrips or soil insects, the use of ‘at planting’insecticides may be a better choice than the conventional approach of treating at pestthreshold.
17.3.3.4 Effective Use of Nursery Crops
Perennial crops such as lucerne which are attractive to many insects and offer apermanent habitat on-farm can provide an effective buffer against the unpredictabil-ity of natural populations. Beneficial populations can be manipulated by cutting thecrop or with the aid of ‘food’ sprays to enhance their movement into cotton crops(Mensah, 2002 a,b). Establishment of these crops is best done in winter so that cropsare tall enough to serve as a habitat for insects.
17.3.4 Preventing the Development of Insecticide Resistance,Including Bt Cotton
Australia has a long history of problems with the evolution of pesticide resistancein key pest populations, but also a world leading position in effective resistancemanagement (Forrester et al. 1993). The IPM system needs to accommodate theneed to protect new pesticide technologies. All new selective pesticides are in-corporated in the Insecticide Resistance Management Strategy (IRMS) developedunder the auspices of the industry based Transgenic and Insecticide Management

17 Pest Management as a Component of Sustainable Agriculture 515
Strategies (TIMS) committee. A rigorous and pre-emptive resistance managementstrategy is also in place for Bt cotton varieties (discussed later). A key componentof resistance management for H. armigera is the destruction of diapausing pupaethat are a potential reservoir of resistance genes (Fitt and Daly 1990). This is acore non-insecticidal component of both the IRM and IPM strategies. Growers areadvised to sample cotton stubble for overwintering pupae, and by using publishedguidelines, determine and prioritise which fields require control. Fields which havegrown Bt cotton require mandatory cultivation and incorporation of the crop residueto eliminate plant regrowth and destroy pupal stages of potentially resistant pestpopulations.
17.3.5 Managing Crop and Weed Hosts of Key Pests
Some rotation crops provide an over-winter host for pests and some cotton diseases(eg. faba beans (mites, aphids), safflower (mites, mirids), chickpeas (H. armigera)or cereals (H. armigera and thrips). At the same time winter rotations provide aseasonal refuge for beneficial insect populations. Balancing these issues needs tobe taken into account in the choice of rotation crop and its management. Simi-larly, weeds and cotton regrowth following harvest can provide over-winter hostsfor a number of pests including Helicoverpa, mites (Wilson 1994), mirids, aphids,tipworm, cutworm, armyworm and silverleaf whitefly. Poor in-field hygiene is par-ticularly a problem with spider mites, aphids and mirids as these pests can moveoff the weeds and onto seedlings in the following season. Again weeds provide arefuge for beneficial species and the trade-off between pests and beneficials needsto be considered. At the scale of individual fields on farms it is likely that the safestcourse is for strict management of in-field weeds and regrowth.
17.3.6 Using Trap Crops Effectively
Trap crops are by definition attractive to key pests and can be managed to concen-trate the pest population into a defined, preferably small area, where they can bemore easily controlled. One example is the use of spring chickpea crops to captureeggs from H. armigera moths that emerge from over-wintering diapause (Fergusonet al. 2000). These moths are potential carriers of genes for pesticide resistance fromone season to the next (Daly and Fitt 1990). Trap crops are a means to concentrateH. armigera populations into a limited area where they can be destroyed usingbiopesticides or by cultivation of the trap crop thereby reducing the carry-over ofresistance genes and overall population size. This practice has been employed on anarea-wide scale in some districts.
A second example is the use of spring lucerne trap crops to capture adults of thegreen mirid, Creontiades dilutus and avoid infestation of adjoining cotton. Greenmirids are important pests in cotton, often causing plants to shed squares (flowerbuds) or young bolls and damaging maturing bolls, causing yield loss. Green mirids

516 G. Fitt et al.
prefer lucerne (new growths or shoots) to cotton. Lucerne crops adjacent to, or asstrips within, cotton crops act as a sink for green mirids. By alternatively slashinghalf of the lucerne at four weekly intervals, new regrowth of lucerne can be main-tained and the green mirids can be maintained in the lucerne without moving intothe cotton (Mensah and Khan 1997). This strategy is not however, widely utilizedin Australia.
17.4 Transgenic Bt Cottons in IPM
Transgenic cotton varieties expressing the delta-endotoxin genes from Bacillusthuringiensis subsp. kurstaki (Bt) offer great potential to dramatically reduce pesti-cide dependence for control of the major lepidopteran pests and consequently offerreal opportunities as a component of sustainable and environmentally acceptableIPM systems.
Bt cotton varieties expressing the Cry1Ac protein were first registered in Australiain 1996 (INGARD R©) and have since been superseded by the Bollgard II varieties,which express the Cry 1Ac and Cry 2AB proteins, since 2004. Fitt (2003; 2004)provide a comprehensive assessment of the impact of Bt cotton in Australia over thefirst six years of commercial use while a more recent description of the benefits ofBollgard II cotton can be found in Pyke (2007). In comparison to the average usageof insecticides on conventional crops, average usage on Ingard R© crops over the eightseasons 1995/96 to 2003/04 was 44 percent lower. Over the four seasons 2002/03to 2005/06, average insecticide/acaricide usage was 82 percent less on Bollgard R©IIthan on conventional crops. As discussed later there has been a similar trend ofreduced pesticide use on conventional cotton. These reductions in insecticide use onBt cotton have been reflected in other countries as well (Fitt 2008).
The most consistent “winner” from Bt cottons has been the environment, withreduced pesticide loads, while the cotton industry has gained long term sustain-ability through the progressive adoption of more integrated pest management ap-proaches using Bt-cotton as a foundation. With progressive improvement in varietalperformance and experience of growers and consultants in managing the technologyeconomic returns have also been substantial.
17.5 Resistance Management
The major challenge to sustainable use of transgenic Bt cottons is the risk that targetpests, particularly H. armigera, may evolve resistance to the Cry1Ac or Cry2Abproteins. For this reason a pre-emptive resistance management strategy was imple-mented to accompany the commercial release of transgenic varieties (Roush et al.1998). The strategy, based on the use of structured refuges to maintain susceptibleindividuals in the population (Roush et al. 1998), seeks to take advantage of thepolyphagy and local mobility of H. armigera to achieve resistance management

17 Pest Management as a Component of Sustainable Agriculture 517
by utilising gene flow to counter selection in transgenic crops. By contrast, exten-sive natural refuges effectively nullify the resistance risk in H. punctigera. IndeedH. punctigera provides an excellent natural example of the capacity of the refugestrategy to reduce resistance risk
Key elements of the Bollgard II R© cotton resistance management strategy are:
1. effective refuges on each farm growing Bollgard II R© cotton2. defined planting window for Bollgard II R© cotton to avoid late planted crops that
may be exposed to abundant H. armigera late in the growing season3. mandatory cultivation of Bollgard II R© crops and crop residues after harvest to
destroy most overwintering pupae of H. armigera4. removal of volunteer Bollgard II R© plants5. defined spray thresholds for Helicoverpa to ensure any survivors in the crops are
controlled6. monitoring of Bt resistance levels in field populations
Australian growers can currently choose from 5 different refuge options (sprayedconventional cotton, unsprayed cotton, sorghum, maize or pigeon pea) each with adifferent area determined by the relative productivity of the refuge (Fitt and Tann1996, Baker et al. 2008 in press). Refuge crops cannot be treated with Bt sprays,and must be in close proximity to the transgenic crops (within 2 km) to maximisethe chances of random mating among sub-populations (Dillon et al. 1998).
An additional element of the strategy was a phased introduction of INGARD R©
varieties and a cap on the area at 30% of the total cotton area. In their first yearINGARD R© varieties were grown on 30,000 ha representing about 8% of the totalcotton area in that year. After that the area increased in 5% increments each yearup to the 30% cap. Bollgard II R© varieties were approved for use in 2003 and havereplaced Ingard completely. The 30% cap was removed with Bollgard II, due to thegreater protection against resistance afforded by the two genes, and Bollgard II vari-eties now account for about 85% of the planted area. The two gene varieties providemuch better efficacy and hence even greater reduction in pesticide requirement, buttheir main purpose is to provide much greater resilience against the risk of resistance(Roush, 1998).
This necessity of a pre-emptive resistance management strategy has been borneout by resistance monitoring: the estimated R frequency for alleles conferring re-sistance to Cry1Ac in Australia is < 0.0003 with a 95% confidence interval (CI)between 0 and 0.0009. In contrast, the estimated R frequency for alleles confer-ring resistance to Cry2Ab in Australia is 0.0033 with a 95% CI between 0.0017and 0.0055 (Mahon et al. 2007). These frequencies have been unchanged over theten years that Bt cotton has been used in Australia. A benefit of the reduction ininsecticide use on Bt cottons has been a decline in resistance levels to conventionalinsecticides in H. armigera and other pests such as mites and aphids (Herron andWilson, 2006; Rossiter and Kauter, 2006).
Bt cotton varieties are not perceived as “magic bullets” for pest control in Aus-tralia. Instead they are viewed broadly as an opportunity to address environmentaland social concerns about cotton production and more specifically as a foundation

518 G. Fitt et al.
to build IPM systems which incorporate a broad range of biological and culturaltactics (Fitt, 2000; Wilson et al. 2004; Fitt 2008). In the past, the broadspectrumcharacter of most available insecticides and the need for season long control ofHelicoverpa spp. greatly hampered the capacity to implement IPM beyond simpleelements such as sampling and use of thresholds. Research has shown little effectof Bt cottons on non-target species, including non-lepidopterous pests, beneficialinsects, and other canopy dwelling and soil dwelling species (Fitt, 2000; Fitt andWilson, 2002; Whitehouse et al. 2005). Survival of beneficials is markedly higherthan in conventional sprayed cotton, and they provide control for some secondarypests, particularly those that are induced pests in sprayed cotton (eg. mites, aphidsand silverleaf whitefly).
17.6 Extension and Implementation of IPM
Defining and formalising an IPM system is just the first step. Achieving effectiveimplementation requires a consistent and coherent communication and extensioneffort. The cotton industry has been well served by a National Cotton ExtensionTeam resourced largely by the Cotton R&D Corporation and the Australian CottonCRC and by a highly professional core of professional consultants. The extensionteam has representatives in all the main cotton regions, and provides a highly coor-dinated vehicle for consistency and co-operation in providing information.
The extension team used a range of strategies to deliver the IPM system(Christiansen 2002). These included field days to discuss IPM issues, co-ordinatedexperiments and demonstrations across several regions, production of regular new-sletters, the published IPM Guidelines themselves, together with other technicalinformation which forms ENTOpak. This compendium of pest management in-formation includes the IPM guidelines, a pest and beneficial identification guide,and supporting documents providing detailed information on pest thresholds, sam-pling, pupae control, selectivity of insecticides, crop damage monitoring and plan-ning of last irrigation. Importantly these documents are cross-referenced to other‘Paks’ which provide support in implementing IPM, for instance MACHINEpak,NUTRIpak, WATERpak, WEEDpak and DISEASEpak, all of which include issuesor approaches relevant to IPM.
As part of a drive to enhance environmental management of cotton farms,the industry has also implemented a Best Management Practice (BMP) approach(Williams and Williams 2000). This provides a framework for growers to evaluatetheir management performance against the best standards in the industry, for iden-tifying areas of improvement, and documenting this in an auditable fashion. Thecore principles of the IPM guidelines form one module in the ‘Best ManagementPractice’ Manual. This provides growers with a means to assess how they are pro-gressing in adopting IPM principles on their farm.
Effective extension has also fostered the development of regional IPM; or AreaWide Management groups, where groups of growers agree on core goals andcommunicate throughout the season to achieve a local regional approach to pest

17 Pest Management as a Component of Sustainable Agriculture 519
management. In some instances this participatory research approach (Dent 1995)has grown to a truly area-wide management system where pest management ef-forts are co-ordinated across a region by using understanding of the pests’ ecologyand interactions with the farming system to reduce abundance (Ferguson and Miles2002).
The cotton industry has undertaken a significant capacity-building exercisethrough formalized education in IPM under the premise that people who understandthe IPM system will be able to make better IPM decisions. A tertiary level Cot-ton Production Course developed and delivered by the University of New England[NSW, Australia] and the Cotton Cooperative Research Centres has produced 180graduates in 13 years, comprising many of the industry’s field agronomists, exten-sion personnel and growers. At a vocational training level, a short-course in IPMwas developed specifically for cotton growers and delivered by the Cotton CRCsbetween 2001 and 2005 with 221 graduates; mainly cotton growers and their imme-diate staff (Hickman 2006).
Since the inception of the SIRATAC system, computer based decision supportsystems (DSS) have been a feature of the Australian cotton industry. The Cotton-LOGIC suite of DSSs provide support for the key elements of IPM and provides abenchmark against which decisions can be compared (Deutscher and Bange 2003).CottonLOGIC allowed users to input regular pest and plant damage counts andevaluate them against defined pest and damage thresholds to determine if control iseconomically justified. Entomologic included ‘smart’ thresholds such as a combinedsucking pest threshold, to allow for the effect of multiple pests each below threshold,a Helicoverpa spp. development model to forcast abundance over the next threedays based on current populations of eggs and larvae (allowing for mortality) and amite threshold model that predicts yield loss from mites based on the time and rateof increase of populations. CottonLOGIC was also deployed on mobile hand-helddevices [the Palm R© OS] and provided further flexibility with a portable system tosupport objective sampling for pests and beneficials, access to the pest developmentmodels and yield loss predictions (Hearn and Bange 2002) and previous crop historyall available in real time in the field. Data can later be downloaded for more thoroughanalysis of pest and crop performance.
The final critical factor in gaining support for IPM systems has come fromfavourable economic analyses of IPM. Hoque et al. (2000) analysed economic andagronomic performance data from cotton growers and showed that the “soft”, IPMapproach generally had equal or higher gross margins than a more traditional ap-proach using “hard”, more disruptive chemicals. The difference was attributed tohigher beneficial insect populations in the fields managed with more selective insec-ticides. This assertion was supported by (Mansfield et al. 2006) who found higherbeneficial populations in fields with softer spray regimes. Such studies have nowbeen extended to other regions with similar results. These studies and analysis werecritical in providing ‘economic’ credibility for the IPM approach, not just use ofselective insecticides, but tacit recognition of the value of beneficial populationsand the role of other ecosystems factors such as nursery crops, selection of winterrotations, and the role of non-cultivated vegetation in contributing to beneficialpopulations.

520 G. Fitt et al.
17.7 Impacts of IPM
Adoption of an IPM approach, incorporating many of the elements above, has hada dramatic uptake over the past 4 years (Christiansen and Dalton 2002). There hasbeen significant change in grower attitudes over the past 5 years, increased uptakeand use of the CottonLOGIC DSS for its scientific values in IPM decision support aswell as for accurate record keeping (Deutscher and Bange 2003). More importantlythere have been significant reductions in pesticide use (expressed as active ingredi-ent) on both conventional and transgenic crops (Fig. 17.1), achieving environmentalgains and enhancing future sustainability of the industry.
Care must be taken in interpretation of Fig. 17.1 since insecticide use is linked topest abundance and Helicoverpa has been at relatively low densities during the pro-longed drought in many cotton areas. Likewise several newer pesticides are active atmuch lower concentrations than the pesticides they replaced. It also seems unlikelythat the reduction in pesticide use on conventional cotton results from the regionalimpact of Bt cotton on Helicoverpa abundance since over the period from 1996 to2003, the area of Bt cotton was limited to a maximum of 30% of the cotton in aregion. A number of factors are likely involved here, but one important possibilityis that the coincident release of Bt cotton and the industry wide extension efforton IPM, allowed many growers to build confidence in the potential for IPM bymanaging their Bt cotton crops. They were able to become more comfortable withseeing a “living” crop, filled with numerous and mostly innocuous or beneficialinsects, more attuned to the critical importance of managing agronomic inputs, and
0
2
4
6
8
10
12
95/96
96/97
97/98
98/99
99/00
00/01
01/0
2
02/0
3
03/0
4
04/0
5
05/0
6
acti
ve in
gre
die
nt
(kg
per
ha)
Conventional INGARD Bollgard II
Fig. 17.1 Changes in active ingredient of insecticide applied to Bt (Ingard or BGII) cotton cropsin Australia compared to conventional varieties grown in the same seasons
17 Pest Management as a Component of Sustainable Agriculture 521
more willing to work cooperatively with neighbours through the IPM and areawidegroups.
It is interesting however that in the years since the release of Bollgard II in-secticide use on conventional cotton has increased and decreased, probably largelyreflecting pest pressure, but also the effects of drought and low cotton prices whichencourage greater use of the cheaper but broader-spectrum insecticides such asorganophosphates and synthetic pyrethroids that tend to lead to secondary pest out-breaks. Sprays applied to Bollgard II are chiefly for control of green mirids, whichare no longer controlled by sprays applied against Helicoverpa spp. and can nowbuild through the season and cause significant damage to squares and young bolls. Arecent survey shows that many sprays applied against mirids were at below both thepest abundance and plant damage thresholds (Whitehouse 2006). This may reflectlack of confidence in sampling and thresholds for these pests and hence at least forthis pest we face some of the attitudinal challenges formerly faced for Helicoverpain the mid 1990s.
17.8 Conclusions
IPM systems for future production of many broadacre and horticultural crops will, ofnecessity, be more complex than the pesticide based systems currently in place, andwill require greater effort on the part of crop managers whether they be professionalconsultants or farmers themselves. In essence IPM reflects a sound interaction ofscience and pragmatism to achieve productive, viable and sustainable productionsystems. A key ingredient will always be investment in education and extension tobuild on the values of sound science.
An added benefit from the level of communication and awareness of insect pestsengendered by an inclusive IPM approach is that potential biosecurity incursionsmay be more rapidly noticed. Australia’s next big IPM challenges may well comefrom incursions of new pests or plant disorders (e.g. viruses) vectored by new orexisting insects. Australia’s geographic isolation gives it an advantage in this re-spect; however recent incursions of the silverleaf whitefly (Bemisia tabaci BiotypeB) and a range of other pests serve as reminders of the vulnerability of agricul-ture to invasive species. In an effort to manage this risk, the Australian cotton in-dustry, in association with researchers, Federal and State governments and PlantHealth Australia in 2006 developed a National Biosecurity Plan for the cotton indus-try (see http://www.planthealthaustralia.com.au/project documents/); a living docu-ment that identifies key threats and situation-specific strategies to rapidly identifyand manage incursions should they occur. Critical to the early identification of newpests, disorders and diseases are consultants and agronomists, who are regularlymonitoring crops, highlighting how important it is that this practice of regular cropchecking be maintained in Bt crops. The incursion and subsequent spread of silver-leaf whitefly in the 1990s illustrated that successful management relies on a wellco-ordinated IPM approach.

522 G. Fitt et al.
As farming systems change the pest complex will also change. The fundamentalrole of IPM in reducing pest pressure and insecticide use means that it must continueto evolve. This evolution is evident in the changing pest complex in Bollgard IIcrops. The ongoing adoption of IPM remains a significant challenge, even under asystem where a high proportion of area is under Bt cotton. While Bt cotton has pro-vided a good platform for IPM, historically the big driver for IPM adoption was theimmediate and significant threat of insecticide resistant pests. Under a Bt dominatedsystem, the immediacy or urgency of pest threats tend to be fewer, and subsequentlythe level of interest in concepts of Area Wide Management and some of the morenovel IPM tools has waned somewhat. In this scenario we run the risk in time ofpeople forgetting the basics; the hard lessons learned during the period before Btcotton.
References
Baker, G.H., Tann, C.R. and Fitt, G.P. 2008. Production of Helicoverpa spp. (Lepidoptera, Noctu-idae) from different refuge crops to accompany transgenic cotton plantings in eastern Australia.Australian Journal of Agricultural Research 59: 723–732.
Christiansen, I. 2002. Extension and Profitability – Implementation of Profitable and SustainableApproaches. Proceedings 11th Australian Cotton Conference. (Ed). Swallow, D.: 65–74.
Christiansen, I. and Dalton, B. 2002. Understanding IPM - Industry attitudes, practices and educa-tion. Proceedings of the 11th Australian Cotton Research Conference, Brisbane, 13–15 August2002, Queensland, Australia. (Ed). Swallow, D.: 189–196.
Constable, G. and Rochester, I. 1988. Nitrogen application to cotton on clay soil: Timing and soiltesting. Agronomy Journal 80: 498–502.
Daly, J.C. and Fitt, G.P. 1990. Resistance frequencies in overwintering pupae and the spring gen-eration of Helicoverpa armigera (Lepidoptera: Noctuidae): selective mortality and gene flow.Journal of Economic Entomology 83(5): 1682–1688.
Dent, D.A. 1995. Integrated Pest Management. Chapman and Hall, London.Deutscher, S. and Bange, M. 2004. Advancement in computerised decision support systems for
Australian cotton systems. Proceedings of the World Cotton Research Conference 3, 9–13March, 2003, Cape Town, South Africa, 1778 pages. 865–872. Agricultural Research Council –Institute for Industrial Crops, Pretoria, South Africa.
Deutscher, S. and Wilson, L.J. 1999a. Insect and damage sampling for cotton. IPM GuidelinesSupporting Document 1, Australian Cotton Cooperative Research Centre, Narrabri, NSW,Australia: 4pp.
Deutscher, S. and Wilson, L.J. 1999b. Insect thresholds. In: ENTOpak - IPM Guidelines SupportingDocument 8, Australian Cotton Cooperative Research Centre, Narrabri, NSW, Australia.
Deutscher, S.A., Wilson, L.J. and Mensah, R.K. 2005. Integrated pest management guide-lines for cotton production in Australia. Australian Cotton Cooperative Research Centre,Narrabri, NSW, 78 pp, ISBN 1 921025 01 8. http://web.cotton.crc.org.au/content/Industry/Homepage/Publications/PestsandBeneficials/IntegratedPestManagementGuidelines.aspx
Dillon, M.L., Fitt, G.P. and Zalucki, M.P. 1998. How should refugia be placed upon the landscape?A modelling study considering pest movement and behaviour. In: Zalucki, M.P., Drew, R.A.I.and White, G.G. (eds), Pest Management – Future Challenges. University of Qld Press, Bris-bane, pp. 179–189.
FAO Code of Conduct on Pesticides’ definition. 2002. Integrated Pest Management (IPM).Farrell, T. 2006. Cotton Pest Management Guide 2006–07. New South Wales Department of Pri-
mary Industries, 100 pp., ISSN1442-8792.

17 Pest Management as a Component of Sustainable Agriculture 523
Ferguson, J., Miles, M., Murray, D., Dillon, M., Kauter, G., Lloyd, R. and Sequeira, R. 2000.Spring Trap Crop Management Guidelines. Australian Cotton Cooperative Research Centre,Narrabri, NSW, Australia, 12pp.
Ferguson, J. and Miles, M. 2002. Area wide management on the Darling Downs - has it worked?Proceedings of the 11th Australian Cotton Research Conference, Brisbane, 13–15 August 2002,In: Swallow, D. (ed), Queensland, Australia. pp. 711–719.
Fitt, G.P. 1989. The ecology of Heliothis species in relation to agroecosystems. Annual Review ofEntomology, 34: 17–52.
Fitt, G.P. 1994. Cotton pest management: Part 3. An Australian perspective. Annual Review ofEntomology 39: 543–562.
Fitt, G.P. 2000. An Australian approach to IPM in cotton: integrating new technologies to minimiseinsecticide dependence. Crop Protection 19: 793–800.
Fitt, G.P. 2003. Deployment and impact of transgenic Bt cottons in Australia. In: Kalaitzandon-akes, N.G. (ed), The Economic and Environmental Impacts of Agbiotech: A Global Perspective.Kluwer, New York, pp. 141–164.
Fitt, G.P. 2004. Implementation and impact of transgenic Bt cottons in Australia. In: Cotton Pro-duction for the New Millennium. Proceedings of the Third World Cotton Research Conference,9–13 March, 2003, Cape Town, South Africa, 1778 pp. 371–381. Agricultural Research Coun-cil – Institute for Industrial Crops, Pretoria, South Africa.
Fitt, G.P. 2008. Have Bt Crops led to changes in insecticide use patterns and impacted IPM? In:Romeis J., Shelton, A.M. and Kennedy, G.G. (eds), Integration of Insect-Resistant GM CropsWithin IPM Programs. Springer, pp. 303–328.
Fitt, G.P. and Daly, J.C. 1990. Abundance of overwintering pupae and the spring generation of He-licoverpa spp. (Lepidoptera: Noctuidae) in northern New South Wales, Australia: Implicationsfor pest management. Journal of Economic Entomology 83: 1827–1836.
Fitt, G.P. and Tann, C. 1996. Quantifying the value of refuges for resistance management of trans-genic Bt cotton. In: Swallow, D. (ed), Proceedings of the 8th Australian Cotton Conference,Broadbeach, August 1996, Queensland, Australia, pp. 77–83.
Fitt, G.P. and Wilson, L.J. 2000. Genetic engineering in IPM: Bt cotton. In: Kennedy, G.G. and Sut-ton, T.B. (eds), Emerging Technologies for Integrated Pest Management: Concepts, Researchand Implementation. APS Press, pp. 108–125.
Fitt, G.P. and Wilson, L.J. 2002. Non-target effects of Bt-cotton: A case study from Australia. In:Akhurst, R.J., Beard, C.E. and Hughes, P.A. (eds), Biotechnology of Bacillus thuringiensis andIts Environmental Impact: Proceedings of the 4th Pacific Rim Conference, CSIRO, Canberra,pp. 175–182.
Forrester, N.W., Cahill, M., Bird, L.J. and Layland, J.K. 1993. Management of pyrethroid andendosulfan resistance in Helicoverpa armigera (Lepidoptera: Noctuidae) in Australia. Bulletinof Entomological Research Supplement No.1., 132pp.
Hearn, A. and Bange, M. 2002. SIRATAC and CottonLOGIC: persevering with DSSs in the Aus-tralian cotton industry. Agricultural Systems 74: 27–56.
Hearn, A.B. and Fitt, G.P. 1992. Cotton cropping systems. In: Pearson, C. (ed), Field Crop Ecosys-tems of the World. Elsevier Press, Amsterdam: 85–142.
Herron, G., and Wilson, L. 2006. Insecticide resistance in cotton aphid and two-spotted spidermite: Seasons 2004–2005 and 2005–2006. Proceedings of the 13th Australian Cotton ResearchConference, Broadbeach, 8–10 August 2006, Queensland, Australia, pp. 491–495
Hickman, M. 2006. Maximizing your Training Efforts; a New Way Forward for the Cotton Indus-try. Proceedings of the 13th Australian Cotton Research Conference, Broadbeach, 8–10 August2006, Queensland, Australia, pp. 355–365.
Hoque, Z., Farquharson, B., Dillon, M. and Kauter, G. 2000. Soft options can reduce costs andincrease cotton profits. Australian Cottongrower 21: 33–37.
Mahon, R., Olsen K., Downes, S. and Addison, S. 2007. Frequency of alleles conferring resis-tance to the Bt toxins Cry1Ac and Cry2Ab in Australian populations of Helicoverpa armigera(Hubner) (Lepidoptera: Noctuidae). Journal of Economic Entomology 100: 1844–1853.

524 G. Fitt et al.
Mansfield, S., Dillon, M.L. and Whitehouse, M.E.A. 2006. Are arthropod communities in cottonreally disrupted? An assessment of insecticide regimes and evaluation of the beneficial disrup-tion index. Agriculture, Ecosystems and Environment 113: 326–335.
Mensah, R. 2002a. Development of an integrated pest management programme for cotton. Part 1:Establishing and utilising natural enemies. International Journal of Pest Management 48:87–94.
Mensah, R. 2002b. Development of an integrated pest management programme for cotton. Part 2:Integration of a lucerne/cotton interplant system, food supplement sprays with biological andsynthetic insecticides. International Journal of Pest Management 48: 95–105.
Mensah, R.K. and Khan, M. 1997. Use of Medicago sativa interplantings/trap crops in the manage-ment of the green mirid, Creontiades dilutus in commercial cotton in Australia. InternationalJournal of Pest Management 43: 197–202.
Pyke, B.A. 2007. The Impact of High Adoption of Bollgard R©II Cotton on Pest Management inAustralia. In: Proceedings of the World Cotton Research Conference 4, Lubbock, Texas, USA.,August 9–14, 2007.
Rochester, I., Peoples, M. and Constable, G. 2001. Estimation of the N fertiliser requirements ofcotton grown after legume crops. Field Crops Research 70: 43–53.
Rossiter, L. and Kauter, G. 2006. Helicoverpa armigera insecticide resistance management – keyconsiderations for 2006/07. Proceedings of the 13th Australian Cotton Research Conference,Broadbeach, 8–10 August 2006, Queensland, Australia. pp. 521–524.
Roush, R.T. 1998. Two toxin strategies for management of insecticidal transgenic crops: Can pyra-miding succeed where pesticide mixtures have not? Phil. Trans. Royal Soc. London, Series B,Biological Sciences, 353: 1777–1786.
Roush, R.T., Fitt, G.P., Forrester, N.W. and Daly, J.C. 1998. Resistance Management for Insecti-cidal Transgenic Crops: Theory and Practice. In: Zalucki, M.P., Drew, R.A.I. and White, G.G.(eds), Pest Management – Future Challenges. Proceedings of the 6th Australasian AppliedEntomology Conference, Brisbane. University of Qld Press, Brisbane, pp. 247–257.
Sadras, V.O. and Fitt, G.P. 1997. Resistance to insect herbivory of cotton lines: quantification ofrecovery capacity after damage. Field Crops Research, 52: 129–136.
Sadras, V.O. 1995. Compensatory growth in cotton after loss of reproductive organs. Field CropsResearch, 40: 1–18.
Whitehouse, M.E.A., Wilson, L.J. and Fitt, G.P. 2005. A Comparison of arthropod communities intransgenic Bt and conventional cotton in Australia. Environmental Entomology 34: 1224–1241.
Whitehouse, M. 2006. Spraying for mirids – and benchmarking the triggers. Australian Cotton-grower 27(4):17–19.
Williams, A. and Williams, J. 2000. Australian Cotton Industry Best Management Practices Man-ual. Cotton Research and Development Corporation, Narrabri, NSW, Australia.
Wilson, L.J. 1994. Habitats of two-spotted spider mites (Acari:Tetranychidae) during winter andspring in a cotton-producing region of Australia. Environmental Entomology 24: 332–340.
Wilson, L.J., Bauer, L.R. and Walter, G.H. 1996. ‘Phytophagous’ thrips are facultative predatorsof two-spotted spider mites (Acari:Tetranychidae) on cotton in Australia. Bulletin of Entomo-logical Research 86: 297–305.
Wilson, L., Mensah, R., Dillon, M., Wade, M., Scholz, B., Murray, D., Heimoana, V. and Lloyd, R.2002. Impact of insecticides and miticides on predators in cotton, December 2002 update. IPMGuidelines Supporting Document 1, Australian Cotton Cooperative Research Centre, Narrabri,NSW, Australia, 2.
Wilson, L.J., Mensah, R.K. and Fitt, G.P. 2004. Implementing Integrated Pest Management inAustralian Cotton. In: Horowitz, A.R. and Ishaaya, I. (eds.), Insect Pest Management: Fieldand Protected Crops, Springer, Berlin, Heidelberg, New York, pp. 97–118.
Wilson, L.J., Sadras, V.O., Heimoana, S.C. and Gibb, D. 2003. How to succeed by doing nothing:cotton compensation after simulated early season pest damage. Crop Science 43: 2125–2134.
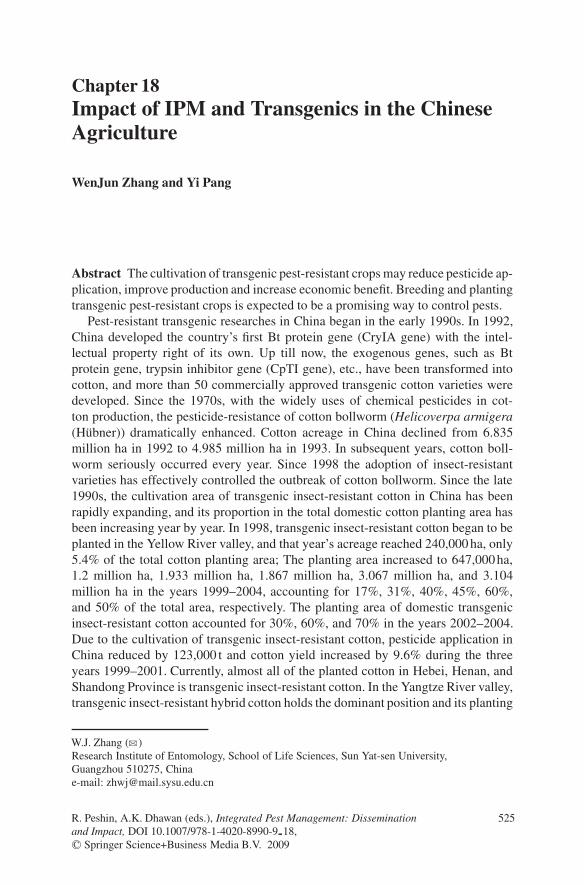
Chapter 18Impact of IPM and Transgenics in the ChineseAgriculture
WenJun Zhang and Yi Pang
Abstract The cultivation of transgenic pest-resistant crops may reduce pesticide ap-plication, improve production and increase economic benefit. Breeding and plantingtransgenic pest-resistant crops is expected to be a promising way to control pests.
Pest-resistant transgenic researches in China began in the early 1990s. In 1992,China developed the country’s first Bt protein gene (CryIA gene) with the intel-lectual property right of its own. Up till now, the exogenous genes, such as Btprotein gene, trypsin inhibitor gene (CpTI gene), etc., have been transformed intocotton, and more than 50 commercially approved transgenic cotton varieties weredeveloped. Since the 1970s, with the widely uses of chemical pesticides in cot-ton production, the pesticide-resistance of cotton bollworm (Helicoverpa armigera(Hubner)) dramatically enhanced. Cotton acreage in China declined from 6.835million ha in 1992 to 4.985 million ha in 1993. In subsequent years, cotton boll-worm seriously occurred every year. Since 1998 the adoption of insect-resistantvarieties has effectively controlled the outbreak of cotton bollworm. Since the late1990s, the cultivation area of transgenic insect-resistant cotton in China has beenrapidly expanding, and its proportion in the total domestic cotton planting area hasbeen increasing year by year. In 1998, transgenic insect-resistant cotton began to beplanted in the Yellow River valley, and that year’s acreage reached 240,000 ha, only5.4% of the total cotton planting area; The planting area increased to 647,000 ha,1.2 million ha, 1.933 million ha, 1.867 million ha, 3.067 million ha, and 3.104million ha in the years 1999–2004, accounting for 17%, 31%, 40%, 45%, 60%,and 50% of the total area, respectively. The planting area of domestic transgenicinsect-resistant cotton accounted for 30%, 60%, and 70% in the years 2002–2004.Due to the cultivation of transgenic insect-resistant cotton, pesticide application inChina reduced by 123,000 t and cotton yield increased by 9.6% during the threeyears 1999–2001. Currently, almost all of the planted cotton in Hebei, Henan, andShandong Province is transgenic insect-resistant cotton. In the Yangtze River valley,transgenic insect-resistant hybrid cotton holds the dominant position and its planting
W.J. Zhang (B)Research Institute of Entomology, School of Life Sciences, Sun Yat-sen University,Guangzhou 510275, Chinae-mail: [email protected]
R. Peshin, A.K. Dhawan (eds.), Integrated Pest Management: Disseminationand Impact, DOI 10.1007/978-1-4020-8990-9 18,C© Springer Science+Business Media B.V. 2009
525

526 W.J. Zhang and Y. Pang
area has been growing in the past years. So far, the total planting area of transgenicinsect-resistant cotton in China has reached 4.667 million ha, with an average in-come of 2,130∼2,400 RMB Yuan/ha. Annual reduction in chemical pesticide appli-cation reaches 20,000∼31,000 t, equivalent to 7.5% of China’s annual total produc-tion of chemical insecticides. Breeding of transgenic insect-resistant rice in Chinadeveloped quickly in the past years. To date, CryI, CpTI, and GNA genes, etc., havebeen transformed into the rice, and some insect-resistant rice varieties (strains) weredeveloped in China. They can be used to suppress rice insect pests such as Chilosuppressalis (Walker), leafrollers, and brown planthopper. Researches showed thatthe adoption of transgenic insect-resistant rice can reduce 70∼80% of insecticideapplication and would not affect the rice biodiversity. From recent years’ field trialsin Hubei and Fujian, indicated that insecticides were seldom used throughout thegrowing season and rice yield can increase by 12%. So far, the safety evaluationsand experiments on the commercial production of transgenic insect-resistant ricehave not yet showed any significant security issues. However, as rice is the mainfood crop in China, the application for commercialization of transgenic rice hasnever been approved. In addition to cotton and rice, the insect-resistant transgenicsfor wheat, soybean, maize, and other crops have being made in China. China hasimported some of the transgenic crops and resulted in certain impacts. For example,due to the low production cost and better quality, the transgenic soybean of theUnited States exhibits the obvious economic advantages. The import of transgenicsoybean of the United States resulted in the serious stock of domestic soybean pro-duction, and undermined the economic interests of Chinese farmers.
So far, the most significant negative impacts for planting transgenic insect-resistant crops, in particular cotton, are the outbreak of secondary pests and theimpairment of arthropod community, etc. Due to the problems of planting transgenicinsect-resistant crops, such as the narrow insect-resistance spectrum, the increasedresistance of insect pests to transgenic crops, the possible outbreak of secondaryinsect pests, and the potential environment and biodiversity risks, it is necessary tofollow IPM principles and combine the other control measures. Chinese scientistshave summarized the practical problems in planting transgenic insect-resistant cropsand explored various IPM measures, such as resistance management, intercropping,seed purifying, protection of natural enemies, etc., to address these problems. TheIPM measures have being implemented in China.
Keywords Transgenics · IPM · insect pests · resistance · agriculture · China
18.1 Introduction
A major way to achieve greater crop yields is to minimize the pest associated losses,which are estimated at 14% of the total agricultural production: 84% in cotton, 83%in rice, 74% in potato, 59% in maize, 58% in soybean, and 52% in wheat (Oerkeet al. 1994; Sharma et al., 2000). Transgenic pest-resistant crops are strongly lethal

18 Impact of IPM and Transgenics in the Chinese Agriculture 527
to pests. Transgenic pest-resistant crops are the plants carrying exogenous pest-resistant genes that artificially separated, constructed, and introduced into plant,which can be efficiently expressed in vivo and can maintain the genetic stability,and through which plants may synthesize not less than one kind of substance thatare toxic to specific pests (Gu et al., 2005; Xiong et al., 2006). Breeding and plantingtransgenic pest-resistant crops is a promising way to control pests. Cultivating trans-genic pest-resistant crops provides a new way to reduce pesticide application, im-prove production and increase economic benefit (Qiu et al., 2005; Wang et al., 2006).
Transforming pest-resistant gene and constructing transgenic pest-resistant cropsmust be conducted through such techniques as gene gun, Agrobacterium-mediatedtransformation, PEG, electroporation, and other methods (Zhang et al., 2001). Thereare currently three kinds of the most studied insect-resistant genes (Gu et al., 2005):(1) Bacillus thuringiensis (Berliner) (Bt) toxic protein gene. The Bt gene has manydifferent strains and the �-endotoxin gene within different strains is specific to dif-ferent insects. Bt has been discovered to have more than 60 sub-species, and theirgenes are in general classified as six major categories in accordance with their in-secticidal spectrum, of which CryI is only toxic to lepidopterans, CryII is toxicto lepidopterans and coleopterans, CryIII is only toxic to coleopterans, CryIV isonly toxic to dipterans, CryV and CryVI are specifically toxic to nematodes. Theinsecticidal crystal protein that resists hymenopterans and nematodes has also beendiscovered (Hu et al., 2006). At present transgenic Bt crops account for the largestproportion of transgenic insect-resistant crops. In the United States alone, there aredozens of crops for field experiments. As early as in 1997, Bt cotton, Bt maizeand Bt potato were commercially produced in the United States, Australia, Japan,Canada, South Africa, Argentina and some of the European countries (Sun et al.,2002). The Bt crystal protein is toxic to insects. It will be hydrolyzed into toxicpeptides in the alkaline intestinal environment after it was fed by insect, and thusthe intestinal epithelial cells and organs can be damaged. (2) Protease inhibitor (PI)gene. Plant protease inhibitors are the most abundant proteins in the nature. Theyare abundant in the seeds and tubers of plants. Currently used genes of plant pro-tease inhibitors in breeding of transgenic insect-resistant cotton, which have beentransformed into plants, include soybean trypsin inhibitor gene (SKTI), cowpeatrypsin inhibitor protein gene (CpTI), and Arrowhead trypsin inhibitor protein gene(API). Compared with Bt gene, they exhibit certain advantages, such as the broaderspectrum of insect-resistance, no side effects on human, and the lower insect toler-ance, of which CpTI was studied in-depth and widely used at present. CpTI geneexhibits a broader spectrum of insect-resistance. It is resistant to spodopterans, theChrysomelidae insects, the Sphingidae insects, and cereal insects. It can kill cottonbollworm (Helicoverpa armigera (Hubner)), the Curculionidae insects, and cornborers, and is toxic to locusts. Once the insect feeds on protease inhibitor, the latercan affect the normal digestion of food protein. Meanwhile, EI composite formedby protease inhibitor and digestive enzymes stimulates the excessive secretion ofdigestive enzymes, and through feedback from the nervous system the insect yieldsanorexia reaction, ultimately causing the abnormal development and death of theinsect. (3) Exogenous lectin gene. Exogenous lectin is a protein widely existed in

528 W.J. Zhang and Y. Pang
the plant tissue. It is particularly rich in storage organs and reproductive organs.Once it is fed by insect it will be released from the digestive tract and will becombined with the glycoprotein on gastrointestinal membrane, and thus retard thenormal absorption of food nutrients. Meanwhile, it will likely induce disease lesionsin the digestive tract, promote the proliferation of digestive bacteria, and thus killthe insect. In addition to the above three types of genes, there are several additionalgenes, like the amylase inhibitor gene, insect neural hormone gene, chitinase gene,ribosomal protein inactivation gene, lipoxygenase gene, disease infection gene ofcotton bollworm, synthesis gene of toosendanin, and peroxidase gene, are available.
The first transgenic crop born in 1983. In 1986, Abel and his colleagues firstly ob-tained a CP gene transgenic TMV-resistant tobacco plant. In 1987 the Belgian scien-tists firstly reported the transformation of exogenous insect-resistant gene to tobacco(Vaeck et al., 1987), followed by Barton (Barton et al., 1987) and the Monsanto’sFischhoff (Fischoff et al., 1987), who reported their transgenic insect-resistant to-bacco and tomato plants. Transgenic rice plants also came out in 1988. All of theseachievements created a new area for plant pest-resistance breeding (Zhang et al.,2001; Sun et al., 2002). In 1993 the transgenic tomato featured by fresh preserva-tion and ripening delay, developed by Cagene, was licensed for marketing in theUnited States, which initiated the commercial application of transgenic crops in theworld. Up till now a variety of insect-resistant genes have been transformed intotobacco, rice, maize, cotton, potato and other crops, and insect-resistant transgenicplants were obtained. Some transgenic insect-resistant plants have been licensed forcommercial production or for field releases (Hu et al., 2006).
So far, the global transgenic crops for commercial cultivation include soybean,maize, cotton, rapeseed, potato, tobacco, tomato, pumpkin, and papaya, etc. Mostof them carry insect-resistant genes; about 18% of transgenic maize varieties (lines)carry insect-resistant genes, while the other varieties contain both herbicide-tolerantand insect-resistant genes; 73% of the transgenic soybeans, maizes and rapeseedshave herbicide-tolerant genes. In 2002, transgenic soybeans and rapeseeds wereall herbicide-tolerant; and 32% of transgenic cottons were herbicide-tolerant. Themajor transgenic crops that resist both herbicides and insects are maize and cot-ton. Transgenic crops with both herbicide-tolerant and insect-resistant traits in theworld account for about 8% of total planting area (Yang et al., 2005). Accordingto the statistics, in 2004 there were 14 countries with planting area of transgeniccrops larger than 50,000 ha. From the largest to the smallest acreage, they werethe United States, Argentina, Canada, Brazil, China, Paraguay, India, South Africa,Uruguay, Australia, Romania, Mexico, Spain, and the Philippines. In 1996 trans-genic plants began to be commercially produced, and the planting area in that yearwas 1.7 million ha. After about 10 years’ development, it reached more than 81million ha in 2004 (Zhu and Ni, 2006), and reached 114.3 million ha in 2007(ISAAA, 2007).
In China, as early as the 1950s, the insect-resistant wheat varieties “Xinong6028” and “Nanda 2419” were cultivated to control wheat midges (Wang et al.,2006). In 1987, the transgenic insect-resistant Bt tobacco and tomato were obtainedfor the first time. In 1991, China’s “863” high-tech development plan initiated

18 Impact of IPM and Transgenics in the Chinese Agriculture 529
a project on transgenic insect-resistant crops, and then the state transgenic plantprojects, the special fund for cotton production from the Ministry of Agriculture,Chinese agricultural science and education fund, and the industrialization projectsof National Planning Commission were sequentially implemented in China. In 1992the CryIA insect-resistant gene with independent intellectual property right wasartificially synthesized in China, which made China the second country after theUnited States for independently constructing the insect-resistant gene with intellec-tual property right (Qing and Zhao, 2004; Xia et al., 2004).
At present, nearly 50 transgenic plant species, involved about 100 genes, arebeing studied in China. Many of the pest-resistant genes and the genes related toresilience, yield, quality and fresh preservation have been cloned, seven BYDV-resistance, powdery mildew-resistant, and wheat scab-resistant wheat varieties havebeen validated, and the accumulated planting area has reached 100 × 104 ha (Yanget al., 2005). More than 100 genes, involved about 50 transgenic plant species likerice, wheat, maize, soybean, potato, peanut, poplar, papaya, tobacco, sweet melon,and pepper, etc., are being at different stages of development (Yang et al., 2005). Theplants such as cotton, tomato, sweet pepper, and Petunia hybrida (Vilm), etc., ge-netic engineering vaccines, and some microorganisms for forage uses, were licensedfor commercial production. Cotton, soybean, tobacco, tomato, pepper, potato, rice,cucumber, poplar, maize, and several microorganisms have been approved for envi-ronmental release. In February 2004, the Ministry of Agriculture of China issuedthe notice No. 349 for safety certificates of the first batch of imported agricul-tural transgenic organisms, including the transgenic Kangnonda soybean applied byMonsanto, the transgenic insect-resistant and herbicide-tolerant maize, transgenicinsect-resistant cotton, and herbicide-tolerant cotton (Wang et al., 2005). Currently,the development of transgenic insect-resistant cotton and rice in China has been atthe advanced level in the world (Zhang et al., 2004).
18.2 Pest-resistant Transgenics and Its Impact
18.2.1 Transgenic Insect-Resistant Cotton
18.2.1.1 Breeding of Transgenic Insect-Resistant Cotton
China is a major country of cotton production in the world. Since the 1920s, Chinahas started to collect cotton germplasm resources. China’s cotton germplasm re-sources were further expanded and enriched through numerous surveys, collection,and exchanges on international cotton germplasm (Gu et al., 2005). In order tofind ways to control cotton bollworm, China’s “863” high-tech development planapproved the “transgenic insect-resistant cotton” research in 1991. In 1992, the Chi-nese Academy of Agricultural Sciences (CAAS) synthesized an insect-resistant Btgene, i.e., CryIA gene, which was different from the one of Monsanto in the UnitedStates, and obtained China’s own intellectual property right. Collaborating withShanxi Academy of Agricultural Sciences and Jiangsu Academy of Agricultural

530 W.J. Zhang and Y. Pang
Sciences, CAAS transformed the modified CryIA gene into cotton and obtained theengineering plants with high resistance to cotton bollworm. Moreover, the whole se-quence of Bt insect-resistant gene was artificially synthesized and a high efficient ex-pression vector was successfully constructed based on Bt protein active site and theprinciple of codon preference (Kong et al., 2004; Gu et al., 2005). In 1993, by usingAgrobacterium-mediated transformation and a new invented method, the pollen tubechannel technique, the insect-resistant gene constructed earlier were successfullytransformed into the major cotton varieties in China, Zhongmian 12, Simian 3, etc.,and yielded a positive response in the molecular detection. Their insect-resistancesurpassed 90% in the biological test on pesticide. Meanwhile, the transgenic cottonstrain with higher insect-resistance was obtained, which made China become thesecond country to artificially synthesize insect-resistant gene and transform it intocotton in the world. Since 1995, the construction of the insect-resistant gene hasdeveloped to bivalent gene from monovalent gene. Cotton researches on bivalentinsect-resistant gene were conducted. CryIA + CpTI genes were transformed into anumber of dominant cultivars and produced some bivalent transgenic cotton lines,and were approved for commercial production (Qing and Zhao, 2004). At the sametime, China began to construct genes for improved quality and yield. The promotersfor the expression of green top tissue and phloem tissue, genital-specific expression,fiber and boll skin specific gene expression, etc., were successfully developed. Allof these works laid a solid foundation for the correct expression of functional genes,the improvement of growth and traits of cotton development, and the improvementof cotton yield and quality. Besides common used Agrobacterium-mediated trans-formation and gene gun methods, Chinese scientists invented the method of pollentube transformation. The transformation rates for three methods reached 5%, 8%and 5%, respectively; transformation efficiencies increased by 4%, 3%, and 1%; andtransformation cycle was shortened to 4.5–7 months; more than 10,000 transgenicplants were constructed. The pipeline operation for plant genetic transformation wasinitially realized (Xia et al., 2004).
Until 2006, China has bred 52 cotton varieties (lines), of which 21 varietiespassed safety evaluation, and 12 varieties passed validation. In these varieties(lines), another 7 insect-resistant hybrid cotton varieties and 3 bivalent transgenicinsect-resistant cotton varieties were included. Moreover, Hebei Province and An-hui Province have also founded joint ventures with the Delta Cotton Company of theUnited States and imported seven transgenic insect-resistant cotton varieties (Xionget al., 2006).
18.2.1.2 Insect-Resistant Effect of Transgenic Cotton
An on-site investigation and field survey in China indicated that the number of eggsof cotton bollworm on Bt cotton and conventional cotton had not significant differ-ence (Wang et al., 1999; Xu et al., 2004), but there was a significant difference in theresidual number of larvae; the number of larvae on Bt Cotton was significantly lowerthan that on conventional cotton. Bt cotton would not yield any significant impacton the occurrence of cotton aphid, Aphis gossipi (Glover) (Wang et al., 1999).

18 Impact of IPM and Transgenics in the Chinese Agriculture 531
Different tissues and organs of the insect-resistant cotton exihibit different resis-tance capacity to cotton bollworm. Insect-resistance of vegetative organs is strongerthan that of reproductive organs. The general orders of the resistance to larvae ofcotton bollworm is: mature leaves>young leaves>boll>young boll>flower (Zhanget al., 2001; Pei et al., 2005). Bt cotton has a strong resistance to younger larva,particularly the 1st instar larva, and the resistance capacity tends to be weak as theincrease of instars.
According to the surveys, the resistance capacity of transgenic Bt cotton to cottonbollworm declined steadily as the growth and development of cotton plant (Chaiet al., 2000). The resistance of transgenic Bt cotton plant to the larva of cottonbollworm was 97%, 72%, 48% on June, July, August, and September, respectively(Zhang et al., 2001). Resistant effects of bivalent cotton (CryIA+CpTI) to sensitiveand resistant strains of cotton bollworm may remain on “very strong resistance” and“strong resistance” levels respectively, and resistance level of the boll of bivalentcotton was significantly higher than Bt cotton, which demonstrated the obviousadvantages of bivalent cotton over Bt cotton (Fan et al., 2001; Xu et al., 2004).Application value of bivalent cotton in IPM is not only maintaining a certain levelof control effect on the target insects with certain resistance to bivalent cotton, butalso slowing down the development of insect’s resistance to bivalent cotton, becausebivalent cotton can simultaneously express two distinct genes with different resis-tance mechanisms.
Most of the transgenic insect-resistant cottons contain Bt gene only. Bt cottonsshow a narrow insect-resistance spectrum and mainly control a few lepidopterans ascotton bollworm, pink bollworm (Pectinophora gossypiella (Saunders)), etc. Theyhave only weak resistance to the larvae of Spodoptera exigua (Hubner), and Agrotisypsilon (Rottemberg) (Dong et al., 1996; Xia et al., 2000). Bt cottons are not effec-tive to most of the insect pests fed on cotton (Kong et al., 2004; Miao et al., 2004;Gu et al., 2005; Xiong et al., 2006; Huang et al., 2007).
Even to target lepidopterans such as Spodoptera litura (Fabricius), the bivalentcotton varieties like Zhongmiansuo 45 and 41, etc., show a weak resistance only(Huang et al., 2006). Transgenic insect-resistant cotton could mildly inhibit cottonaphid, whitefly (Bemisia tabaci (Gennadius)), Lygocoris lucorum (Meyer-Dur), Em-poasca flavescens (Fabricius), and other non-target insects while preserving a strongresistance to cotton bollworm (Zhang et al., 2001; Zhou et al., 2004). However, itwas also reported that transgenic insect-resistant cotton was not effective on suchsucking insect pests as cotton aphid, red mite (Tetranychus cinnabarinus (Boisdu-val)), the Miridae insects, and their occurrence tended to be more serious (Wanget al., 1999; Chen, 2006).
The gene expression of transgenic insect-resistant cotton is unstable with timeand space, i.e., Bt crystal protein can be synthesized in all of the newborn cells but,newborn cells will decrease and the resistance will weaken with the growth andaging of cotton plant. Thus, the insect-resistance of transgenic cotton will declineas the growth of cotton, i.e., the resistance capacity will be mainly released in thefirst and second generations of cotton bollworm, and it will significantly decline inthe third and fourth generations (Zhang et al., 2001; Wang et al., 2002; Xiong et al.,2006). As a consequence, IPM is still needed in the late phase of cotton growth.

532 W.J. Zhang and Y. Pang
18.2.1.3 Impacts of Transgenic Insect-Resistant Cotton on CommunityStructure and Arthropod Diversity
Biodiversity is an important natural control mechanism on insect pests in cottonfield. There are many kinds of natural enemies in the cotton fields of China. Chinascientists have conducted a number of surveys and trials to understand the impactsof transgenic insect-resistant cotton on community structure and arthropod diversityin cotton fields (Pei et al., 2005).
According to a field survey, the evenness index of insect community in Bt cottonfield was higher than conventional cotton field and insecticide treated cotton field;the diversity index on Bt cotton was the highest, seconded by that on bivalent cot-ton, conventional cotton, and insecticide treated cotton; the cultivation of bivalentcotton would not reduce the stability of insect community, and the stability of in-sect community, pest sub-community, and natural enemy sub-community would beimproved; the populations of insect pests and natural enemies tended to be stable(Cui et al., 2006a). Due to the reduction of insecticide application in transgenicinsect-resistant cotton field, the diversity of arthropod community in the middle andlate phases of cotton growth were significantly improved, which is conducive to thestability of cotton ecosystem and IPM (Li et al., 2003a, b). It was also found that thestructure of arthropod community was more stable in wheat-cotton intercroppingsystem than in cotton system, the former demonstrated a stronger buffering capacityto environmental changes and population fluctuations (Xia et al., 1998).
A field investigation demonstrated that on average there were 15 insect families,19 species in Bt cotton, 14 families, 17.5 species in conventional cotton field, and13.5 families, 17.5 species in insecticide treated cotton field, were found respec-tively; The number of individuals of major insects in Bt cotton field was greaterthan that in conventional cotton field and insecticide treated cotton field. These re-sults indicated that Bt cotton was conducive to the protection of biodiversity andecosystem management in cotton field (Wang et al., 1999; Li et al., 2003). Anothersurvey showed that there was no significant difference between transgenic cottonand conventional cotton in dominant natural enemies (Zhang et al., 2001). Bivalentcotton would not exert an obvious impact on predators; the individual number ofsome natural enemies, such as Propylaea japonica (Thunberg), Chrysoperla sinica(Tjeder), increased and became the dominant species in Bt cotton field (Cui andXia, 1999; Zhou et al., 2004; Cui et al., 2006b). Bt cotton was also proved to exerta positive impact on Harmonia axyridis (Pallas) and Erigonidium graminicolum(Sundevall) (Cui et al., 2006b). Compared with the conventional cotton, plantingtransgenic Bt cotton would further proliferate predators by 24.0% (Xia et al., 1999).However, the number of some major natural enemies would be reduced (Zhou et al.,2004).
According to another field survey, the species richness of insect community in Btcotton (110 species) was slightly higher than conventional cotton (109 species), andthe relative abundance of insect pests (71.5%) in Bt cotton was lower than conven-tional cotton (73.1%); the species and abundances changed in Bt cotton field, thechewing insect pests such as cotton bollworm were effectively controlled, and the

18 Impact of IPM and Transgenics in the Chinese Agriculture 533
sucking pests such as red mite, the Miridae insects, cotton aphid and other secondaryinsect pests became the dominant pests (Xia et al., 1998).
To date most of the studies tended to demonstrate that the structure and com-position of arthropod community could not be substantially changed in transgenicinsect-resistant cotton field.
18.2.1.4 Impacts of Planting Transgenic Insect-Resistant Cotton on IPMand Economic Benefits
Based on a two years’ questionnaire survey on 245 farmers in 6 counties, HebeiProvince, Wu et al. (2005) conducted a comprehensive comparison on benefit-costand IPM effects between transgenic Bt cotton and conventional cotton. The resultsshowed that in 2002 and 2003, the cotton yield, pesticide cost, total cost and revenueof the transgenic Bt cotton variety were higher than conventional cotton. Accordingto a report, during 1994–1998, the results achieved in the indoor, cages, field plotsand field experiments demonstrated that planting transgenic Bt cotton and adoptingsome control measures in earlier, middle, and late phases of cotton growth wouldsave insecticide application by 60∼80% as compared to conventional cotton (Xiaet al., 1999). Transgenic Bt cotton varieties showed a better insect resistance in theseriously occurred area of cotton bollworm; resistance capacity was greater than80%; Bt cotton demonstrated a good performance in yield; chemical insecticideapplication declined by 50∼80%, and there was not an obvious yield differencebetween Bt cotton and conventional cotton (Kong et al., 2004; Hu et al., 2006).In China, the insecticide application on transgenic insect-resistant cotton may bereduced by 24∼63 kg/ha compare to conventional cotton (Zhu and Ni, 2006). Ac-cording to the statistics in China (Huang et al., 2002), during 1999–2001, about12∼29% of the farmers planting conventional cotton varieties were poisoned bypesticide because they have exposed to a higher dosage of pesticides. However,only 5∼8% of the farmers planting Bt cotton varieties were poisoned by pesti-cides. Insecticide application was obviously lower on Bt cotton than on conven-tional cotton, and the insecticide application would be reduced by 70∼80% in someareas.
In the 20th century, cotton bollworm was the major pest to affect China’s cottonproduction. Since the 1970s, with the widely uses of chemical pesticides in cottonproduction, the pesticide-resistance of cotton bollworm dramatically enhanced. In1992, cotton bollworm seriously occurred in the Yellow River valley, which resultedin a direct economic loss of over 8 billion RMB Yuan and posed a serious threaton the steady development of China’s cotton production. Cotton acreage in Chinadeclined from 6.835 million ha in 1992 to 4.985 million ha in 1993, a 27% sharpreduction. In subsequent years, cotton bollworm seriously occurred every year, andcotton production stagnated. A new insect-resistant Bt cotton variety, 33B, devel-oped by Delta Cotton Company in the United States, and domestic insect-resistantvarieties were used in cotton production in 1996 and 1998, and have effectivelycontrolled the outbreak of cotton bollworm. China’s cotton production thus startedto be stabilized (Xia et al., 2004).

534 W.J. Zhang and Y. Pang
In 1997 the Ministry of Agriculture of China approved transgenic insect-resistantcotton varieties for environmental releases in five provinces Hebei, Henan, Jiangsu,Liaoning, and Xinjiang, and for commercial production in Shandong, Shanxi, Anhuiand Hubei Province (Qing and Zhao, 2004). Since the late 1990s, the cultivationarea of transgenic insect-resistant cotton in China has been rapidly expanding, andits proportion in the total domestic cotton planting area has been increasing year byyear. In 1998, transgenic insect-resistant cotton began to be planted in the YellowRiver valley, and that year’s acreage reached 240,000 ha, only 5.4% of the totalcotton planting area; The planting area increased to 647,000 ha, 1.2 million ha,1.933 million ha, 1.867 million ha, and 3.067 million ha in the years 1999 to 2003,accounting for 17%, 31%, 40%, 45% and 60% of the total area, respectively, anaverage annual rate of over 10% (Xia et al., 2004; Fig. 18.1). The planting area ofdomestic transgenic insect-resistant cotton accounted for 30%, 60%, and 70% inthe years 2002–2004. Due to the cultivation of transgenic insect-resistant cotton,pesticide application in China reduced by 123,000 t and cotton yield increased by9.6% during the three years 1999–2001 (Zhang et al., 2004). Currently, almost allof the planted cotton in Hebei, Henan, and Shandong Province is transgenic insect-resistant cotton. In the Yangtze River valley, transgenic insect-resistant hybrid cot-ton holds the dominant position and its planting area is growing year by year (Zhu
Fig. 18.1 Production situation of transgenic insect-resistant cotton in China. The forecasts for theyears 2008–2010 were given by polynomial function (Mathworks, 2002). The 95% confidenceintervals of the forecasts for the years 2008–2010 were also indicated

18 Impact of IPM and Transgenics in the Chinese Agriculture 535
and Ni, 2006). So far, the total planting area of transgenic insect-resistant cotton inChina has reached 4.667 million ha, with an average income of 2,130∼2,400 RMBYuan/ha (Xiong et al., 2006). Annual reduction in chemical pesticide applicationreaches 20,000∼31,000 t, equivalent to 7.5% of China’s annual total production ofchemical insecticides. Cotton bollworm problem has become a history in China.
According to an estimate, the cultivation of transgenic insect-resistant cotton willannually yield the welfare of one billion US dollars for China (Yang and Li, 2006).
18.2.2 Transgenic Insect-Resistant Rice
18.2.2.1 Breeding of Transgenic Insect-Resistant Rice
Rice is the staple food crop in China. Rice stem borers (Chilo suppressalis (Walker),Tryporyza incertulas (Walker), Cnaphalocrocis medinalis (Guenee)) and rice plan-thoppers (Nilaparvata lugens (Stal), Sogatella furcifera (Horvath), Laodelphaxstriatellus (Fallen)) are the most important insect pests in rice fields of China.Insect-resistant resources are poor in rice. Therefore the breeding of transgenicinsect-resistant rice varieties provides a new way for rice pest control (Feng et al.,2000; Wang et al., 2005).
As early as in 1989, Yang Hong, a Chinese scholar and colleagues transformedBt gene into the protoplast of rice varieties Taigeng 209, Taipei 309, and Zhonghua8 using protoplast fusion technology, and obtained the regenerated transgenic plants(Wang et al., 2004). So far, the countries that have been reported to successfullyobtain transgenic rice plants include China, United States, Philippines, United King-dom, Japan, and India, etc. The transformation technology goes to mature and trans-formation frequency increases gradually (Zhang et al., 2001). Currently, the majortechniques for rice resistant gene transformation include gene gun method, followedby Agrobacterium-mediated transformation, PEG method, electroporation method;the most widely used genes are Bt toxin gene, pin, CpTI, and GNA gene, etc. (Wanget al., 2004).
In China, the scientists in Zhejiang University have transformated Bt gene CryIA(b), in which the codon had been optimized, into rice variety Xiushui 11 usingAgrobacterium-mediated transformation. The Bt toxic protein expression of theresistant strain obtained accounted for 0.5∼0.3% of the total soluble protein, andcan kill 100% of the 1st to 5th instar larvae of C. suppressalis, C. medinalis, andNaranga aenescens (Moore); it was also highly resistant to eight lepidopterans.The resistant strain has been formally named as “Kemingdao”. A batch of insect-sensitive rice cultivars such as early indica rice Zhefu 504, Zhefu 123, Jiazao 935,late japonica rice Daoxiushui 63, Bing 9402, Bing 9311, and some of the indica-preserving strains and restoring strains, were transformed and some transformedplants were obtained. The transformed plants shared the similar agronomic traitswith the original cultivars (Xiang et al., 1999; Cui et al., 2001). Zhu (2001) fusedCpTI gene, signal peptide, and coding sequence on endoplasmic reticulum that lo-calizes signal KDEL, and obtained the fusion gene signal-cpti-KDEL (SCK). Usingthe gene, some transgenic rice plants highly resistant to lepidopterans such as C.suppressalis, etc., including Minghui 81 and Minghui 86, were obtained. Hybrid

536 W.J. Zhang and Y. Pang
combinations prepared from these plants have put into field trial. Tang et al. (2001)have transformed GNA (Galanthus nivalis (L. Agglutinin)) into japonica rice va-rieties Eryi 105 and Erwan 5 using gene gun method and obtained a batch oftransgenic strains which could significantly reduce the survivorship, fecundity, andfeeding amount, and retard the development of brown planthopper, N. lugens. Usinggene gun technique, Feng et al. (2001) transformed alkaline chitinase genes RC24,RCH10, rice acidic chitinase genes RAC22 and alfalfa �-1,3-glucose enzyme gene(�-1, 2Glu) to indica rice varieties Qisiruanzhan, Teqing, Qimiaoxiang, Jiuliuling,and japonica rice variety Zhonghua 8, and obtained a batch of transgenic lines thatwere highly resistant to rice blast disease and rice sheath blight disease, such asZhuzhuan 68 and 70, etc. Zhai et al. (2000) transformed Xa21 gene into China’sfive rice varieties using Agrobacterium-mediated method, and obtained preservingstrains and restoring strains of the white blight disease resistant rice, Minghui 63,Yanhui 559, and Zhengshan 97B. Transgenic hybrid indica rice varieties Shanyou63 and 559 were developed using these strains. The results demonstrated that thetwo transgenic hybrid rice varieties exhibited a broad-spectrum resistance, and theirresistance spectrum was similar to IRBB, the XA21 gene source. Currently thesehybrid combinations have been put into field trial. In addition to the above, there aremany other examples for introducing insect-resistant genes into rice and obtaininginsect-resistant plants (Wang et al., 2004). In recent years, the transgenic researcheson Bt gene have been increasing. Transgenics has been successfully used in indicarice, fragrant rice, Java rice, hybrid rice, and deep-water rice. Bt rice has gone to thephase of environmental release. Some insect-resistant rice varieties that can be usedin the rice production were expected (Wang et al., 2005).
Up till now, transgenic insect-resistant rice varieties (strains) are mainly effectiveto a few of lepidopterans like C. suppressalis, C. medinalis, and some homopteransas brown planthopper (Wang et al., 2005). Some transgenic rice varieties are resis-tant to rice blast, sheath blight, and bacterial blight, etc.
18.2.2.2 Impacts of Transgenic Insect-Resistant Rice on Community Structureand Arthropod Diversity
There are many arthropod species, including insect pests, natural enemies, and neu-tral species in and around the conventional rice field (Zhang et al., 2004; Zhangand Barrion, 2006; Zhang, 2007a,b,c; Fig. 18.2). A study made by Chinese scientistshowed that Bt rice exhibited a stronger resistance to major target insect pests suchas C. suppressalis, T. incertulas, and C. medinali (Han et al., 2006). Chen et al.(2004) tested the feeding and ovipostion behaviors of brown planthopper (BPH)on CryIA(b) transgenic indica rice, SCK transgenic rice restoring lines, and theirrespective parent controls. The results showed that three tested transgenic insect-resistant rice materials were unfavorable to BPH feeding, but no significant impacton oviposition of BPH. After two years of extensive field research, it was demon-strated that bivalent (CryIA(c) + SCK) rice would unlikely trigger the catastrophicoutbreak of non-target BPH (Fu et al., 2003; Liu, 2004). Liu et al. (2005) investi-gated the impacts of bivalent rice and its hybrid offspring on insect pest community

18 Impact of IPM and Transgenics in the Chinese Agriculture 537
Fig. 18.2 Conventional rice fields in Qinxing County, a famous scenic spot in GuangdongProvince, China. Guangdong Province, adjacent to Hong Kong and Macau, is one of the mostdeveloped provinces in China. Agricultural intensification and excessive pesticide application hasbeen threatening the food security and farmers’ health in some areas of the province. Biodiversityin and around rice fields is always a stabilization mechanism for sustainable natural control of ricepests. Biodiversity conservation, biological control and pesticide use reduction are being imple-mented in Qinxing County and some other areas of Guangdong Province (Photo by W.J. Zhang,August 2007)
and found that bivalent rice was extremely resistant to rice leafroller, C. medinali;the hybrid offspring also exhibited the stronger resistance to the rice leafroller.
Transgenic insect-resistant rice yielded no significant impacts on developmentand growth of non-target insects, planthoppers, leafhoppers, predatory natural ene-mies, and on the stability of arthropod community in rice field (Jia et al., 2005; Hanet al., 2006); it could increase the number of predatory arthropod individuals, and in-crease species richness in predatory arthropod sub-community (Fu et al., 2003; Liu,2004). Liu et al. (2006) found that at the community level, bivalent insect-resistantrice had no significant negative impacts on species richness, diversity index, even-ness index, predominant index, the temporal dynamics of these indices, and totalnumber of individuals of parasitic wasps. However, transgenic rice could reduceindividual number of parasitic wasps during mid-term of cotton growth. The numberof individuals of parasitic wasps that parasitize the target pest, rice leafroller, but notother parasitic wasps, was significantly lower in transgenic rice field. Throughoutthe growing season there was no significant difference between Bt rice and con-ventional rice in both species and individual number of spiders (Cui et al., 2002;Liu et al., 2002; Qiu et al., 2005). Bt rice yielded no significant impacts on species

538 W.J. Zhang and Y. Pang
composition and individual number of aquatic organisms (Chen et al., 2003b). Thecomposition of major insect pests on bivalent rice were found to be similar to that onconventional rice; the reduction of target pest population had not obvious impactson rice pest community and had not resulted in any changes of predominant insects(Liu et al., 2005).
18.2.2.3 Impacts of Transgenic Insect-Resistant Rice on IPMand Economic Benefits
The research showed that planting transgenic insect-resistant rice can reduce pes-ticide application by 70∼80% in China. Recent years’ experiments conducted inHubei, Fujian, and other provinces demonstrated that throughout the growing seasonthe pesticide could basically not be used in transgenic insect-resistant rice field, andrice yield may rise by 12%. The effectiveness of insect-resistance of Bt rice has beenevaluated under greenhouse conditions worldwide, despite the Bt rice is not licensedfor planting in practice (Jia et al., 2005). In China, Bt rice has been put into fieldtrials and environmental releases. So far, no obvious safety risks were found in thesafety evaluation and experiments for commercial production of transgenic insect-resistant rice (Zhang et al., 2004; Wang et al., 2005). However, because rice is thestaple food crop in China, genetically modified rice products have been cautiouslytreating in China (Wang et al., 2005). Since 2004, the application for commercialproduction of transgenic rice was annually submitted to the Biosafety Committeeof Agricultural Transgenic Organisms for discussion, but they have never been ap-proved due to serious disputes among various members.
According to an estimate, the cultivation of transgenic insect-resistant rice wouldannually bring China with three billion US dollars of welfare. If the planting per-centage of transgenic rice increases from 50% to 80%, the national welfare wouldrise from 2.65 to 3.11 billion US dollars (Yang and Li, 2006).
18.2.3 Other Transgenic Pest-Resistant Crops
Transgenic maize holds an important position in the world. There are more than20 lines for transgenic maize. The majority of them are herbicide-resistant maize;about 50% of them are both insect- and weed-resistant (Liu and Chen, 2005). In totalof 17 transgenic maize varieties (lines) have been licensed for commercialization,and have achieved significant economic benefits. But transgenic maize meet somelimitations and the successful cases for gene transformation are not common, due tothe lower transformation frequency, poor repeatability, higher randomness, the de-pendence of regeneration capacity on genotypes, etc. (Li and Hu, 2006). Transgenicmaize researches in China are still backward compared to the advanced internationallevel, and there are not any commercial varieties up till now.
There are currently more than 10 commercial lines of transgenic soybean, ofwhich the herbicide-resistant transgenic soybean is the main transgenic crop forcommercial production. In 2000, the acreage of transgenic soybean accounted for

18 Impact of IPM and Transgenics in the Chinese Agriculture 539
59% of all transgenic crops. As early as in 1994, Monsanto developed a transgenicsoybean: glyphosate-resistant soybean, and has been licensed in the United Statesfor human consumption.
Since mankind obtained the first transgenic wheat plant in 1992, the researcheson transgenic wheat have achieved many significant advances. Approximately 200cases on transgenic wheat have been reported at home and abroad, of whichabout 80 cases are transgenic herbicide-resistance wheat, about 50 cases are trans-genic insect- or disease-resistant wheat, about 30 cases are transgenic quality-improvement wheat, about 20 cases are transgenic salt-tolerant and drought-resistantwheat, and other cases (Zhao et al., 2006; Table 18.1). For example, transformingaphid-resistant gene into wheat plants and thus inducing the differentiation of trans-genic cells, finally obtaining the insect-resistant transgenic wheat plants, which areresistant to homopterans such as aphids, brown planthopper, and leafhoppers.
There are currently about 20 transgenic rapeseed strains for commercial produc-tion, and some of them are herbicide-resistant (Liu and Chen, 2005).
At present, transgenic soybean holds the largest growing area (58.60 million ha)in all of transgenic crops worldwide, seconded by maize (35.20 million ha), cotton(15.00 million ha), and rapeseed (5.50 million ha) (ISAAA, 2007). A growing pro-portion of transgenic maize and soybean are being used to manufacture bio-fuels.
In respect to the insect-resistant transgenic potato breeding in China, Bu et al.(2005) constructed an expression vector of diploid potato protease inhibitor II gene.Jiang (2001) constructed CryIB(a) plant expression vector, and transformed it intopotato variety Desiree, which showed a high insect-resistance (Wu et al., 2006).CAAS has constructed CryIB (a3)+CryIIIA(a7) plant expression vector and ob-tained transgenic potato line. The results indicated that the insect-resistance of trans-genic potato was improved significantly (Wu et al., 2006).
The pollen of transgenic CryIA gene maize was reported to yield no adverseeffect on the survival of three species of predators, Coleomegina acucatum, Oriusinsidious (spp.), Chrysoperla carnea (Stephens) (Plicher et al., 1997; Duan et al.,2002; Wu et al., 2007). However, the Swiss scientists studied the impacts of Bt maizeon C. carnea, and found that compared with the control, C. carnea feeding Euro-pean corn borer that fed on Bt maize, showed a high mortality rate, and a sluggishdevelopment (Hibeck, 1998).
Table 18.1 Breeding status of some transgenic crops
Reported cases Proportion oftotal varieties(lines)
Transgenic Crops Wheat Maize Soybean Rapeseeda + b (50 cases) a (18%) c (100%) c (100%)
Pest-resistant types c (80 cases) a + c (82%)Main references Zhao et al., 2006 Yang et al., 2005
Note: The symbols a, b, and c mean insect-resistant, disease-resistant, and herbicide resistant,respectively. a+b means both insect- and disease-resistant. a+c means both insect- and herbicide-resistant Some data were derived from the authors.

540 W.J. Zhang and Y. Pang
18.3 Prospects and Risks of Transgenic Pest-Resistant Crops
18.3.1 Prospects on the Impacts of TransgenicPest-Resistant Crops
The most direct impact of foreign transgenic crops on the plantation industry inChina is the planting of transgenic soybean (Xiao, 2003). Due to the low productioncost and better quality, the transgenic soybean of the United States exhibits the obvi-ous economic advantages compare to China’s soybean. The imports of China’s soy-bean jumped to the 10.4191 million t in 2000 from 801 t in 1991, occupying a 21.4%of import volume in the world. The export fell to 211,000 t in 2000 from 1.109million t in 1991. The import of transgenic soybean of the United States resultedin the serious stock of domestic soybean production, and undermined the economicinterests of Chinese farmers (Xiao, 2003). In exception of wheat, the crops maize,wheat, cotton and oil will also face the impact of foreign transgenic products in thefuture, and the majority of them are expected to be transgenic varieties. Impacts oftransgenic insect-resistant crops on IPM and economy of China should be frequentlyevaluated.
The main rice producing areas are distributed in the developing countries of Asia,and the major part of rice production is for local consumption. In 2000, China’s riceproduction reached 0.188 billion t while rice import reached 458,900 t and exportreached t 5.6801 million t. Annual trade volume of rice of China accounted for only3.27% of total production. Thus the import and export of rice is expected to yield asmall impact on rice production and IPM in China (Xiao, 2003).
18.3.2 Potential Negative Impacts of Planting TransgenicPest-Resistant Crops
While transgenic pest-resistant crops, especially cotton, have been extensivelyplanted in China, and have produced the significant economic and social impacts,however, there are also potential risks and negative impacts for planting transgenicpest-resistant crops and some have begun to exhibit the adverse consequences.
18.3.2.1 Impacts on Yield and Quality of Crops
Compared to conventional varieties, the yield and quality of transgenic insect-resistant cotton bred by China are not ideal, which further affect the economic gainof farmers. According to a survey in Jiangsu Province (Xu et al., 2004), despite thecultivation of Bt cotton may reduce the pesticide application in cotton fields andsave labor costs, but the yield of Bt cotton was significantly lower than conventionalcotton, along with the high cost of Bt cotton seeds, the direct economic benefit ofBt cotton farmers declined, and the biggest decline was recorded as 10.36% of yieldand 1,710 RMB Yuan/ha of income in Lianyungang City. In another experiment

18 Impact of IPM and Transgenics in the Chinese Agriculture 541
conducted in Anhui Province, in four transgenic Bt cotton varieties the weight ofsingle boll of three varieties was between 4.26 g and 4.81 g. The average yieldof transgenic insect-resistant cotton, with mildly occurred cotton bollworm, was1,178.4 kg/ha, a reduction of 8.95% relative to the conventional cotton. The yield oftransgenic insect-resistant cottons was overall similar to or lower than conventionalcottons (Chai et al., 2000). These situations may partially explain the decreasingproportion (of the increment) of transgenic insect-resistant cotton forecast for theyears 2008 to 2010 in Fig. 18.1.
A reason for the low yield of transgenic insect-resistant cotton is that the repro-ductive traits and morphological features have been changed based on conventionalcotton. If the conventional measures for cultivation are still used, the yield potentialof transgenic insect-resistant cotton cannot be normally exhibited, and the yield evendecreased significantly in different ecological areas of cotton cultivation. For exam-ple, in the higher fertilized fields of the Yangtze River valley, Zhongmiansuo 41showed an excessive reproductive and vegetative growth, while in the Yellow Rivervalley it exhibited the early weak symptom. Transgenic cotton, GK22, exhibited theexcessive vegetative growth, falling of many bolls, and declined yield in the YangtzeRiver valley.
Thus, the cultivation and management technologies in transgenic cotton fieldscannot follow the conventional varieties. They must be conducted based on theirown laws of growth and development, and the corresponding high quality culti-vation techniques must be matched in transgenic cotton fields. By doing so, thereproductive advantage, insect-resistance advantage, and yield advantage may berealized (Gu et al., 2005).
Anyway, improving yield and quality by breeding new varieties will still be themajor focus in the future. Field management and cultivation techniques should al-ways match the improved traits of new crop variety.
18.3.2.2 Problems on Pest Resistance to Crop
The insect-resistance of transgenic crop is unstable (Gu et al., 2005; Wang et al.,2006). Gene silence and deactivation seriously affects the application of transgenicinsect-resistant crops in agricultural production. It is also the reason why manytransgenic insect-resistant crops have not stepped to commercial production. There-fore, how to improve the expression of exogenous insect-resistant genes in the plantis an important research topic in insect-resistant genetic engineering (Sun et al.,2002).
Bt gene is expressed continuously in plant cell, the insect pest by surviving on Btinsecticidal protein across the whole season of plant growth promotes the resistanceof insect to transgenic plant. It is known that at least 10 species of moths, two speciesof beetles and four species of flies have generated the resistance to Bt toxin (Wanget al., 2006). According to a survey, successive planting of transgenic cotton resultedin heavy occurrence of cotton bollworm, due to the increased resistance of cottonbollworm to Bt toxin and degradation of toxin protein after multiple generations ofplanting of Bt cotton (Gould, 1994; Wang et al., 2006). Transgenic insect-resistant

542 W.J. Zhang and Y. Pang
cotton has been in the earlier years planted in Hebei Province, but the residue indi-vidual number of the second and third generations of cotton bollworm in 1999 weregreater than that in 1998 although the overall occurrence in 1999 was still lowerthan that in 1998. In Shandong Province, the cultivation of transgenic cotton beganin 1997. However the third generation of cotton bollworm in some areas was moreseriously occurred in 1999 than in 1998 (Wang et al., 2005).
The survey in a main cotton-producing region, Zaoyang, Hubei Province, demon-strated that with the popularization of transgenic insect-resistant cotton, a lot ofproblems arose, such as too many varieties, varying quality of cotton seeds, a largerdifference between insect-resistances of different varieties. All of these have re-sulted in the declining trend of cotton yield (Chen et al., 2005). Therefore, it isnecessary to standardize the cotton breeding and seed market, and maintain seedpurity and stable traits.
Presumably, the effectiveness of monovalent transgenic insect-resistant cottoncould preserve 8 to 10 years, and for bivalent cotton the resistance would persist for20 to 30 years (Gu et al., 2005).
18.3.2.3 Problems on Narrow Insect-Resistance Spectrumand Secondary Pest Outbreaks
Transgenic insect-resistant crop has the narrow insect-resistance spectrum (Gu et al.,2005; Wang et al., 2006). According to the statistics, there are currently dozensof major insect pests damaging cotton in China, including cotton bollworm, pinkbollworm, cotton aphid, and red mite, etc. (Xiong et al., 2006). The transgenicinsect-resistant cottons used in China’s cotton production are effective to some lep-idopterans such as cotton bollworm and pink bollworm. However, the species andcommunity of insect pests will likely change after a period of the planting of trans-genic insect-resistant cotton; some secondary sucking insects and the lepidopteransthat occurred slightly in the early period tend to heavily occur. The research showedthat the individual number of red mite and the cotton aphid in the seedling stagewere significantly higher than the control. The scientists in Chinese Academy ofSciences have conducted a tracing investigation on the production of Bt cotton inNorth China from the beginning of 1999, and found that the pesticide applicationused against secondary insect pests, in particular the Miridae insects, appeared to in-crease since 2004 (Huang et al., 2007). Currently, the insect pests seriously occurredin transgenic cotton fields, include mainly cotton aphid, red mite, beet armyworm(S. exigua), the Miridae insects, thrips, and vegetable leafminer (Liriomyza sativae(Blanchard)). In particular, the Miridae insects have become the predominant cottoninsect pests in northern China.
The serious outbreak of secondary insect pests may significantly reduce the ad-vantages of transgenic insect-resistant crop, or even lead to more serious insect pestproblems. Huge resurgence risk of secondary insect pests is expected to be the mostsignificant problem in planting transgenic insect-resistant crop. This would also par-tially result in the decreasing trend (of the increment) of proportion of transgenicinsect-resistant cotton forecast for the years 2008–2010 (Fig. 18.1).

18 Impact of IPM and Transgenics in the Chinese Agriculture 543
18.3.2.4 Potential Impacts on Biodiversity and the Environment
As a “foreign factor” released into the ecosystem, whether transgenic crops willdestroy the original relative balance of ecosystem and produce the other adverse bio-logical impacts on human health or even cause damages (Klig, 1996; Thacker, 1998;Wei and Yang, 2006), is the world focus (Asako, 1998, 1999). It was reported theresults of a study, in which the pollen of Bt maize was fed by a non-harmful butterflylarva and resulted in the death of the later (John et al., 1999). The report attracteda widespread concern on the ecological safety of transgenic crops (Ehsan, 1999).Some study abroad showed that the genetically engineered herbicide-resistant maizegene bleached to the surrounding areas of wild millet plants; the genetically engi-neered herbicide-resistant rapeseed gene bleached to the nearby wild plants (Xiaet al., 2001). In summary, the ecological risks of transgenic insect-resistant cropsinclude genetic pollution of the surrounding plants resulted from gene drift (Hanet al., 2006; Wang et al., 2006), the toxic accumulation effects resulted from biolog-ical toxic protein, and the injury of ecological balance.
The genes of transgenic crops drift and genetically pollute the surrounding plantsby, such as generating a new type of weed after being released. There are fourpossibilities of becoming weeds (Chen and Zhang, 2000; Zhang et al., 2005): (1)transgenic plants themselves become weeds. The introduction of new genes wouldresult in a plant that exhibits the better survival and competitiveness than its parentsor wild plant species; (2) genetic plants are extremely vital, which would destroy thenatural diversity of plants and become weeds; (3) the resistant genes of transgenicplants are transferred to the wild flora and transform the wild plants into weeds; (4)transgenic plants invade into new ecological regions and thus undermine the ecolog-ical balance. For rice, once the exogenous genes escape and are fused into the wildrice species (including weedy rice) and expressed normally, it may proliferate or ex-pand in wild rice population through sexual and asexual reproduction. If exogenoustransgenic genes do not affect the ecological fitness of wild rice, such as high-proteincontent, improved genes, special vitamins, and the natural selection pressure forwild rice survivor are not related to these genes, then the gene drift of transgeniccrops generally do not lead to any significant ecological risk. If some of the exoge-nous genes from transgenic crops are related to the ecological adaptability of wildrice, such as pest-resistance, and various resistant genes are accumulated in wildrice, then these exogenous genes will likely improve the ecological adaptation ofwild rice, and the wild rice will rapidly grow and expand its distribution to becomethe weeds. On the other hand, the hybrids and their offspring of wild rice carryingthe exogenous genes will spread further and may lead to the pollution on originaltypes of wild rice species, or even result in the disappearance of the endangeredwild rice in the local area (Zhang et al., 2005; Han et al., 2006). Cotton is a highlydomesticated crop. It is not affinitive to the weeds reported. So cotton is unlikely tobecome weeds. However, the pollen drift of transgenic cotton would yield geneticpollution between different cotton varieties and lines (Liu and Chen, 2005).
Accumulated toxic effects of biological toxin proteins include poisonous effecton natural enemies, and on other neutral organisms. It was reported that after Bt

544 W.J. Zhang and Y. Pang
cotton have been extensively cultivated the population of natural enemies reducedor even disappeared due to natural enemies’ feeding on the cotton bollworm thatcarries Bt toxin protein (Gould, 1994). Studies have found that (John et al., 1999;Cui, 2001), the aphids sucked Bt toxin protein on transgenic Bt crop were preyedby predatory bettles and the Bt toxin protein was thus transferred to the beetles, andultimately affects the reproduction of beetles; Bt insect-resistant crops could killhymenopterous natural enemies; the pollen of Bt insect-resistant maize would alsopoison a beautiful butterfly in America. The toxin protein of Bt insect-resistant cropscould also leak into soil from the root or reach soil through leaves, thus damage theinvertebrates in the soil and water. After Bt toxin protein has leaked into the soil,it would lead to a certain changes in species and quantity of soil microorganismsand changes in activity of soil enzymes (Wang, 2005; Chen and Su, 2006). Toxinprotein was also reported to generate certain toxicity to human. A British surveyshowed that the consumption of transgenic food has resulted in the human allergiesof 1.4∼1.8% (Jiang and Yin, 2002).
Planting transgenic insect-resistant crop would negatively affect the compositionand structure of arthropod community, and impair the ecological balance. Someresearch demonstrated that the diversity index of pest-natural enemy communitydirectly depended on that of pest sub- community; the diversity indices of insectcommunity, pest sub-community, and natural enemy sub-community in transgenicBt cotton field were lower than that in conventional cotton and IPM cotton fields;and the ecological stability of insect community was lower in transgenic Bt cottonfield than in conventional cotton and IPM cotton fields (Cui and Xia, 2000).
A popular argument is that planting transgenic crops will save much of theinsecticide application. However, a good IPM plan and biodiversity conservationstrategy will also largely reduce the insecticide application and, in particular re-duce the impairment of beneficial organisms (Andow, 1991; Pimental et al., 1992;Kremen et al., 1993; Way and Heong, 1994; Zhang et al., 2004; Zhang, 2007a,b,c;Fig. 18.3). Our focus is not Yes-or-No on impacts of transgenic crops, but what kindof the impacts and, in what extent will transgenic crops exert impacts on biodiversityand the environment. Risks and impacts of transgenic crops on biodiversity and theenvironment should be studied extensively in the future.
18.4 IPM and Transgenic Pest-Resistant Crops
Due to the problems of planting transgenic insect-resistant crops discussed above,such as the narrow insect-resistance spectrum, the increased resistance of insectpests to transgenic crops, the possible outbreak of secondary insect pests, and thepotential environment and biodiversity risks, it is necessary to follow IPM principlesand combine the other control measures, in order to control insect pests effectively,and maintain the natural ecological balance (Kong et al., 2004; Huang et al., 2007).Chinese scientists have summarized the practical problems in planting transgenicinsect-resistant crops, and explored various IPM measures to address these problems

18 Impact of IPM and Transgenics in the Chinese Agriculture 545
Fig
.18.
3T
hene
twor
kof
dire
ctor
indi
rect
ecol
ogic
alin
tera
ctio
nsof
inve
rteb
rate
fam
ilie
sin
ari
cefie
ld(Z
hang
,200
7a)

546 W.J. Zhang and Y. Pang
(Wang et al., 1999; Chai et al., 2000; Cui and Xia, 2000; Miao et al., 2004; Son andGao, 2006). The IPM measures have being implemented at certain extent in China.
About the unsatisfactory performances for the insect-resistance and yield oftransgenic crops, scientists have conducted a number of surveys to find some rea-sons. In Shandong Province, cotton farmers had been yearly reflecting the weakinsect-resistance of transgenic cotton. After the field survey, it was confirmed thatthe reasons were summarized as follows (Miao et al., 2004): (1) a larger weed popu-lation in transgenic insect-resistant cotton field. Not weeding cotton timely, the weedpopulation created a better growth habitat for cotton bollworm; (2) transgenic cottonwas intercropped by another crop. If control measures had not been adopted forpests on another crop, then pests would seriously damage cotton plants; (3) a higherhazard for corn borer occurrence. If there was not any crop, including maize, aroundtransgenic cotton field, then corn borers would seriously occur in cotton field; (4) notimely control; (5) the low purity of cotton varieties. In Jiucheng prefecture, AnhuiProvince, a popular survey indicated that transgenic insect-resistant cotton exhibitedsome drawbacks as compare to the conventional cottons although the former couldyield certain economic benefits (Chai et al., 2000): (1) insect-resistance was unsta-ble. The resistance of Bt cotton to cotton bollworm, pink bollworm, etc., decreasedgradually with the development and growth of cotton. In 1998, cotton bollwormoutbreak in Jiucheng prefecture; in total 4,167 hectares of less controlled cotton fieldwas found to have 0.27 cotton bollworm per hundred plants and 1.52% of boll injuryon July 25, they separately increased to 13.33 and 11.14% on August 25; (2) a weakgrowth vitality and early-exhaustion of transgenic insect-resistant cotton. In 1999,according to the survey on the transgenic cotton, Zhongkang 29, and a conventionalcotton, Wanza 40F1, it was found that the vegetative growth of Bt transgenic cottonwas slow and its vitality was weak; but its reproductive growth came earlier, andthere was a higher rate for bolls’ generation; therefore the early-exhaustion occurredeasily in the late phase of cotton development due to the poor cooperation betweenvegetative growth and reproductive growth; (3) small bolls and low fiber content.There was not high-yield advantage for transgenic Bt cotton. Of four transgenic Btcotton varieties, the single boll weight of three varieties was only between 4.26 gto 4.81 g. The yield of Bt cottons was generally similar to or slightly lower thanconventional cottons. In 1999, the cotton bollworm occurred mildly, however theaverage yield of transgenic insect-resistant cotton tested was 1,178.4 kg/ha only, areduction by 8.95% against the conventional cotton (Chai et al., 2000).
For the problems discussed above, Chinese scientists proposed some IPM mea-sures (Table 18.2). Cui and Xia (2000) argued that because there are fewer naturalenemies in the transgenic insect-resistant cotton field, the application of chemicalpesticides should therefore be avoided. Moreover, measures should also be taken toprotect the natural enemies, such as planting maize or sorghum for lure use, usingthe selective pesticides that are safe to natural enemies to control pests, such as redmite, etc. In Xinxiang City of Henan Province, the larva population of the secondgeneration of cotton bollworm in the transgenic Bt cotton field is always below thecontrol index and thus no control is needed. However, the third and fourth gener-ations of cotton bollworm should be controlled according to the population size.

18 Impact of IPM and Transgenics in the Chinese Agriculture 547
Table 18.2 Suggested principles for IPM of transgenic insect-resistant cotton in China
Cotton GrowthPhase
ChemicalControl
Biological Control Fertilization Others
Preparation ofseeds oftransgenicinsect-resistantcotton
Pesticidetreatment ofseeds tocontrol plantdiseases andunderearthinsect pests
Sowing cotton Provide enoughbasalfertilizers
Weeding
Beforemid-phase ofcotton growth
Less insecticideapplication tocontrol cottonaphid, redmite, etc.
Conservation of naturalenemies; Releases ofpredatory or Parasiticnatural enemies;Releases of microbialagent to control insectpests
Appropriatefertilizing
Intercrop bymaize,sorghum, etc.Weeding
Late phase ofcotton growth
Reasonableinsecticideapplication tocontrol cottonbollworm,cotton aphid,etc.
Conservation of naturalenemies
Provide enoughbollingfertilizers
Weeding
The control index of cotton bollworm in the United States is 20 larvae per hundredplants. However, this control index has not yet been established in China (Wanget al., 1999). IPM of Bt cotton should also consider the control of the seedling cottonaphid, red mite, and the summer cotton aphid in the bolling stage of cotton. Miaoet al. (2004) suggested some IPM measures in Shandong Province: (1) adoptinghigh pure cotton varieties; (2) intercropping cotton with maize but not other crops(Fig. 18.4). Maize is used to attract corn borers for oviposition, and the corn borersshould be eliminated; (3) weeding cotton timely. Using herbicides, such as ace-tochlor, to eliminate weeds after sowing of transgenic cotton; (4) strengthening theforecast and prevention of insect pests, especially the second and third generationsof cotton bollworm. When the number of 1st∼2nd instars larvae of the third gener-ation of cotton bollworm reaches 15 per hundred plants, 1,000 folds of pyrethroidinsecticide may be sprayed for the control. When the injury rate of plants from redmite reaches 20%, 1,000 folds of mitecide, Saomanjing, can be sprayed for the con-trol. Chai et al. (2000) argued that the fertilizer application on transgenic Bt cottonshould in general be increased by 10–30%. Of total nitrogen fertilizer, 60∼70% isfor basal and bolling fertilizer (Chai et al., 2000). In Xingjiang Province, the majorcotton pests from seedling phase to mid-July are cotton aphid, red mite, and the sec-ond generation of cotton bollworm. During this period the biological or ecologicalcontrol should be the first choice, supplemented by chemical control in which the

548 W.J. Zhang and Y. Pang
Fig. 18.4 A cotton-maize intercropping field in Fuping County, Shaanxi Province, China. TheChinese agriculture was initially originated in Shaanxi Province, and some other provinces, asearly as 2000 B.C.∼4000 B.C. With its splendid ancient civilization, Shaanxi Province is now alsoa major area for cotton production in China. The cotton-maize system will increase the biodiversity,improve the ecological stability, and enhance the effect of IPM, as discussed in the context (Photoby W.J. Zhang, July 2004)
first application of pesticide should be postponed and the dosage should be reducedas soon as possible to avoid producing a direct impact on natural enemies (Sonand Gao, 2006). After mid-July, cotton aphid, red mite, and the 3rd∼5th generationsof cotton bollworm are major pests of cotton. The abundance of natural enemiesdecline significantly due to the increasing air temperature, and insect-resistance oftransgenic Bt cotton decreased also. The chemical control should be the first choiceduring this period, supplemented by the biological or ecological control measures,however, the natural enemies should be maximally protected (Son and Gao, 2006).
In the theory of IPM, resistance management is an important consideration. Somemanagement strategies against resistance of pests to transgenic Bt crops, includinghigh/low dose expression, refuges, specific/indicible expression and other tactics tosupplement them were proposed (Ouyang et al., 2001). Of these strategies, refugestrategy is a major method for pest resistance management. The principle is plantingnon-Bt crops, i.e., the refuges of sensitive pests, around Bt crop, in order to let thesensitive individuals mate with resistant individuals randomly. The heterozygousoffspring are not able to survive on Bt plants. There are two types of refuges: (1)planting the mixed seeds of Bt crop and conventional crop; the individuals of differ-ent crops will be randomly distributed; conventional crops are treated as the refugeof sensitive pest source; (2) planting non-Bt crops in specific area around Bt crop

18 Impact of IPM and Transgenics in the Chinese Agriculture 549
(Han et al., 2006). The combination of “high-dose” and “refuges” strategies, easilyaccepted by farmers, was considered to be the best way for Bt resistance manage-ment (Zhao and Huang, 2001; Han et al., 2006). Some scientists suggested for usingrefuges, as done in the United States and Australia, to delay the resistance of cottonbollworm. The 80% of the transgenic Bt cotton and 20% of conventional cottonare intercropped, no chemical control or less control for insect pests on transgenicBt cotton but normal control for insect pests on conventional cotton; or 96% ofthe transgenic Bt cotton and 4% of conventional cotton are intercropped or mixed,no chemical control for insect pests on both Bt cotton and conventional cotton. InChina, apart from the Xinjiang cotton region and the large farms where refugesneeded to be artificially established, the refuges have been naturally provided inother areas due to the intercropping system of multiple crops. However, measuresshould be adopted to protect these natural refuges; particularly, transgenic Bt cottonand Bt maize should not be cultivated in the same area, and the biological productsof Bt should not be used on the host crops of cotton bollworm (Chen et al., 2003a).
Acknowledgments This research was supported by “National Basic Research Program of China”(973 Program)(No. 2006CB102005), and 948 program of China (2006-G32). We thank Dr. RajinderPeshin and Prof. A.K. Dhawan for their beneficial comments and suggestions on the draft.
References
Andow, D.A. 1991. Vegetational diversity and arthropod population response. Annual Review ofEntomolology 36: 561–586.
Asako, S. 1998. Japan may require labels on genetic food. Nature 395: 628.Asako, S. 1999. Japan tightens rules on GM crops to protect the environment. Nature 399: 719.Barton, K.A., Whitely, H. and Yang, N.S. 1987. Bacillus thuringiensis �-endotoxin expressed in
transgenic Nicobana tabacum provides resistance to Lepidopteran insects. Plant Physiology85: 1103–1109.
Bu, Q.Y., Wu, L., Yang, S.H. and Wan, J.M. 2005. Cloning, characterization and expression vec-tor construction of potato protease-inhibitor II gene (PIN II-2x) from diploid potato (Solanumphurejia). Hereditas 27(3): 417–422.
Chai, X.R., Wang, S.X. and Jiang, L.B. 2000. Shortcomings of transgenic insect-resistant cottonand cultivation strategies. Jiangxi Cottons 22(1): 33–34.
Chen, B., He, M. and Mu, H.S. 2005. Problems and strategies on production of transgenic insect-resistant cottons. Crops 5: 62–63.
Chen, F.R., Han, H.C., He, T.J., Liu, F.Z. and Han, W.B. 2003a. Impacts of transgenic cotton onthe occurrence of insect pests and control strategies. Jiangxi Cottons 25(3): 6–9.
Chen, J.J. 2006. An analysis on influential factors for economic benefit in planting transgenicinsect-resistant cotton. Zhejiang Agricultural Sciences 1: 61–62.
Chen, M., Ye, G.Y., Yao, H.W., Hu, C. and Shu, Q.Y. 2004. Evaluation of the impact of insect-resistant transgenic rice on the feeding and oviposition behavior of its non-target insect, thebrown planthopper, Nilaparvata lugens (Homptera: Delphacidae). Scientia Agricultura Sinica37(2): 222–226.
Chen, R. and Su, J. 2006. Advances on environmental safety of transgenic rice. Fujian Journal ofAgricultural Sciences 21(4): 384–388.
Chen, X.J., He, S.L., Cheng, K.L. and Ren, G.J. 2003b. Effect of Bt transgenic rice on organismcommunity in paddy-field. Journal of Sichuan Agricultural University 21(2): 185–186.

550 W.J. Zhang and Y. Pang
Chen, Y. and Zhang, S.Q. 2000. Agricultural genetic engineering and ecological environment.Ecological Economy 6: 31–32.
Cui, F.S. 2001. Aspects of genetic pollution. Huanjing Daobao 4: 45–46.Cui, H.R., Wang, Z.H., Shu, Q.Y., Wu, D.X., Xia, Y.W. and Gao M.W. 2001. Agronomic traits of
hybrid progenies between Bt transgenic rice and conventional rice varieties. Chinese Journalof Rice Science 15(2): 101–106.
Cui, J.J., Luo, J.Y., Wang, C.Y., Li, S.H. and Li, C.H. 2006a. Studies on the stability of arthropodcommunity in transgenic Cry 1Ac plus CpTI cotton fields. Journal of Southwest AgriculturalUniversity 28(1): 8–11.
Cui, J.J., Luo, J.Y., Wang, C.Y., Li, S.H. and Li, C.H. 2006b. Effect of transgenic Cry 1Ac plusCpTI cotton on growth and development of major predatory natural enemies. Agricultural Ex-periment and Industralization 5: 162–163.
Cui, J.J. and Xia, J.Y. 1999. Effects of transgenic Bt cotton on the population dynamic of naturalenemies. Acta Gossypii Sinica 11(2): 84–91.
Cui, J.J. and Xia, J.Y. 2000. Studies on the components of diversity of the community in trandgenicBt cotton. Acta Ecologica Sinica 20(5): 824–829.
Cui, X.H., Jiao, X.G., Zhang, G.A., Tu, J.M. and Xu, C.G. 2002. Effect of Bt transgenic rice toleafhoppers and spiders in field. Journal of Huazhong Agricultural University 21(4): 356–358.
Dong, S.L., Ma, L.H. and Li, C.H. 1996. The resistance of transgenic Bt cotton to cotton bollworm,corn borers, and Agrotis ypsilon. China Cotton 23(12): 15–17.
Duan, J.J., Head, G. and Mckee, M.J., et al. 2002. Evaluation of dietary effectsof transgenic cornpollen expressing Cry 3Bb1 protein on a nontarget ladybird beetle Coleomegilla Maculate.Entomologia Experimentalis et Applicata 104: 271–280.
Ehsan, M. 1999. G8 leaders seek study on effects of bioteck. Nature 399: 717.Fan, X.L., Rui, C.H., Xu, C.R., Meng, X.Q., Guo, S.D. and Zhao, J.Z. 2001. Resistance of trans-
genic cottons expressing Bt and CpTI insecticidal protein genes to Helicoverpa armigera. ActaEntomologica Sinica 44(4): 582–585.
Feng, D.R., Xu, X.P., Fan, Q., Li, B.J., Lei, C.L. and Ling, Z.Z. 2001. Rice plants of multipletransgenes for resistance to rice blast and sheath blight diseases. Acta Agronomica Sinica 27(3):293–300.
Feng, D.R., Xu, X.P., Qiu, G.H. and Li, B.J. 2000. Heridity and expression of several disease- andinsect-resistant genes in rice. Chinese Science Bulletin 45(15): 1593–1599.
Fischoff, D.A., Bowdish, K.S., Perlak, F.J., Marrone, P.G., McCormick, S.M., Niedermeyer, J.G.and Dean, D.A. 1987. Insect tolerant transgenic tomato plants. Biotechnology 5: 807–813
Fu, Q., Wang, F., Li, D.H., Yao, Q., Lai, F.X. and Zhang, Z.T. 2003. Effects of insect-resistanttransgenic rice lines MSA and MSB on non-target pests Nilaparvata lugens and Sogatellafucifera. Acta Entomologica Sinica 46(6): 697–704.
Gould, F. 1994. Potential and problems with high dose strategies for pesticidal engineered crops.Biocontrol Science and Technology 4: 451–461.
Han, L.Z., Wu, K.M., Peng, Y.F. and Guo, Y.Y. 2006.Research advances in ecological safetyof insect-resistant transgenic rice. Chinese Journal of Applied Environmental Biology 12(3):431–436.
Hibeck, A. 1998. Effect of transgenic Bacillus thuringiensis corn fed prey on mortality and de-velopment time of immature Chrysoperla carnea (Naeuroptera:Chrysopidae). EnvironmentalEntomology 27(2): 480–487.
Hu, H.G., Wang, H. and Zhang, F.Q. 2006. A review on several insect-resistance genes in plants.Tropical Agricultural Science and Technology 29(4): 18–21, 34.
Huang, D.L., Liu, H.Q. and Jiang, S.X. 2006. Effects of Zhong mian suo 45 and Zhong mian suo41 on experimental population of Spodoptera litura. Acta Phytophylacica Sinica 33(1): 1–5.
Huang, J.K., Lin, H., Hu, R.F., Rozelle, S. and Pray, C.E. 2007. An analysis on impacts of popular-izing transgenic insect-resistant cottons on insecticide application over secondary insect pests.Journal of Agrotechnical Economics 1: 3–12.
Huang, J.K., Hu, R., Fan, C., Pray, C.E. and Rozelle, S. 2002. Bt cotton benefits, costs, and impactsin China. AgbioForum 5(4): 153–166.

18 Impact of IPM and Transgenics in the Chinese Agriculture 551
International Service for the Acquisition of Agri-biotech Applications (ISAAA). Global Status ofCommercialized Biotech/GM Crops: 2007. Manila, Philippines, 2007.
Jia, Q.T., Shi, S.B., Yang, C.J., Peng, Y.F., Cai, W.L. and Wang, F.R. 2005. Advances on the safetyresearches of transgenic Bt rice. Hubai Agricultural Sciences 1: 103–107.
Jiang, H.L. 2001. Construction of transgenic plants expressing Bt and CpTI insecticidal proteingenes and achievement of insect-resistant potatos. Beijing: Chinese Academy of AgriculturalSciences 28: 53.
Jiang, P. and Yin, Z.K. 2002. Problems of genetic modification food safety. Studies in Science ofScience 20(1): 62–66.
John, E.L., Linda, S.R. and Maureen, E.C. 1999. Transgenic pollen harms monarch larvae. Nature399: 214.
Klig, J. 1996. Could transgenic supercrops one day breed superweeds. Nature 274: 180–181.Kong, X.H., Wang, H.X., Yu, H.X. and Hou, F. 2004. Role and ecological risk of Bt trans-
genic insect-resistant cotton in cotton IPM. Journal of Xinjiang Agricultural University27(Suppl.): 51–53.
Kremen, C., Colwell, R.K., Erwin, T.L. and Murphy, D.D. 1993. Invertebrate assemblges: their useas indicators in conservation planning. Conservation Biology 7: 796–808.
Li, Y.L. and Hu, J.G. 2006. Research advance of transgenic maize. Chinese Agricultural ScienceBulletin 22(2): 71–75.
Li, W.D., Wu, K.M., Chen, X.X., Feng, H.Q., Xu, G. and Guo, Y.Y. 2003a. Effects of transgeniccotton carrying Cry1A + CpTI and Cry1Ac genes on the diversity of arthropod communityin cotton fields in northern area of north China. Journal of Agricultural Biotechnology 11(4):383–387.
Li, W.D., Wu, K.M., Chen, X.X., Feng, H.Q., Xu, G. and Guo, Y.Y. 2003b. Effects of transgeniccottons carrying Cry1A + CpTI and Cry1A genes on the structures and composition of pestand beneficial arthropod communities in cotton field in north China. Journal of AgriculturalBiotechnology 11(5): 494–499.
Liu, S.M. and Chen, J.X. 2005. Progress of transgene crop gene floating and itps gene pollution.Jiangxi Cottons 27(6): 3–7.
Liu, Y.F. 2004. Advances on transgenic Bt rice and ecological safety evaluation. Life Science Re-search 8 (4): 294–299.
Liu, Y.F., He, L., Wang, Q., Hu, S.Q., Liu, W.H., Chen, K.G. and You, M.S. 2006. Evaluation of theeffects of insect-resistant cry1Ac/sck transgenic rice on the parasitoid communities in paddyfields. Acta Entomologica Sinica 49(6): 955–962.
Liu, Y.F., Su, J., You, M.S., Wang, Q., Hu, S.Q., Liu, W.H., Zhao, S.X. and Wang, F. 2005. Effectof transgenic pest-resistant rice on pest insect communities in paddy fields. Acta EntomologicaSinica 48(4): 544–553.
Liu, Z.C., Ye, G.Y., Hu, C. and Datta, S.K. 2002. Effects of Bt transgenic rice on populationdynamics of main non-target insect pests and dominant spider species in rice paddies. Journalof Plant Protection 29(2): 138–144.
Mathworks. Neural Network Toolbox, MATLAB 6.5, 2002.Miao, X.W., Wang, D.G., Su, Z.G. and Sun, S.H. 2004. Reasons and strategies for serious occur-
rence of insect pests in some transgenic insect-resistant fields. China Cotton 1: 44Oerke, E.C., Dehne, H.W., Schonbeck, F. and Weber, A. 1994. Crop Production and Crop Protec-
tion: Estimated Losses in Major Food and Cash Crops. Elsevier, Amsterdam.Ouyang, L.M., Wu, H.W. and Yu, Z.N. 2001. The management strategies against resistance of pests
to Bt-transgenic plant. Acta Phytophylacica Sinica 28(2): 183–188.Pei, J.Z., Fang, H.Y., Ma, H.Q., Zheng, B.Z. and Li, Z.H. 2005. Research advances in influences of
insect-resistant cottons on cotton bollworm and its natural enemies. China Cotton 32(8): 9–11.Pimental, D., Stachow, U., Takacs, D.A., Brubakeret, H.W., Dumas, A.R., Meaney, J.J., O’Neil,
J.A.S., Onsi, D.E. and Cozilius, D.B. 1992. Conserving biological diversity in agricul-tural/forestry systems. Bioscience 42(5): 354–362.
Plicher, C.D., Obrvcki, J.J., Rice, M.E. and Lewis, L.C. 1997. Preimaginal development, survialand field abundance of insect predators on transgenic Bacillus thuringiensis corn. BiologicalControl 26(2): 446–454.

552 W.J. Zhang and Y. Pang
Qing, Y.J. and Zhao, J. 2004. Advances and problems in researches and applications of Chinesetransgenic insect-resistant cottons. Journal of Anhui Agricultural Sciences 32(2): 363–364,382.
Qiu, H.M., Dong, B., Wu, J.C., Wang, F., Fu, Q. and Zhang, Z.T. 2005. Effect of transgenic rice onthe growth, fecundity and predation of spiders. Journal of Yangzhou University (Agriculturaland Life Science Edition) 26(3): 79–82.
Sharma, H.C., Sharma, K.K., Seetharama, N. and Ortiz, R. 2000. Prospects for using transgenicresistance to insects in crop improvement. Journal of Biotechnology 3(2): 76–95.
Son, Q.P. and Gao, Z.J. 2006. Occurrence characteristics and control measures of major insectpests in transgenic insect-resistant cotton fields of Xingjiang. China Cotton 9: 45–46.
Sun, Z.T., Zhong, G.H. and Hu, M.Y. 2002. Recent advance of research on anti-insect geneticallymodified crops. Journal of Northwest Sci-Tech University of Agriculture and Forestry (NaturalScience Edition) 30(Suppl.): 148–152.
Tang, K.X., Wan, B.L., Sun, X.F., Qi, H.X. and Lu, X.G. 2001. GNA confers resistance to ricebrown planthopper in transgenic rice pure lines by both bioassay and feeding tests. Journal ofFudan University (Nature Science Edition) 40(1): 108–116.
Thacker, J.R. 1998. Transgenic crop plants and pest control. Science Progress 77: 207–219.Vaeck, M., Reynaerts, A., Hofte, H., Jansens, S., De Beuckeleer, M. and Dean, C. 1987. Transgenic
plants protected from insect attack. Nature 328: 33–37.Wang, C.F., An, Y.P., Han, G.M., Zhang, W.Y. and Ma, J. 2005. Advances in transgenic breeding
of rice in China. Ningxia Science and Technology of Agriculture and Forestry 6: 55–57.Wang, H.L., Wang, B.L. and Li, Z.W. 2006. Advance in research on integrated pest management.
Journal of Henan Institute of Science and Technology 34(3): 40–42.Wang, R.L., Zhang, G.J., Liu, D.Z., Ye, Z.C. and Su, R.H. 2002. Planting performance of transgenic
insect-resistant cottons without insecticide spraying. Jiangxi Cottons 24(2): 23–24Wang, W.G., Wu, K.M., Liang, G.M. and Li, X.L. 1999. Occurrence of cotton pests in the Bt cotton
fields and its control strategy. Plant Protection 1: 3–5.Wang, Z.C., Yi, Z.L. and Pi, C.H. 2004.Progresses problems and strategies of rice breeding : resis-
tant to insect & disease via transgenic technique. Biotechnology Bulletin 3: 30–35.Wang, Z.H. 2005. Potential effects of Bt transgenic rice on soil micro-ecosystem. Chinese Journal
of Applied Ecology 16(12): 2469–2472.Wang, W.G., Wu, K.M., Liang, G.M. and Li, X.L. 1999. Occurrence of cotton pests in the Bt cotton
fields and its control strategy. Plant Protection 1: 3–5.Way, M.J. and Heong, K.L. 1994. The role of biodiversity in the dynamics and management of
insect pests of tropical irrigated rice-a review. Bulletin of Entomological Research 84: 567–587.Wei, Y.J. and Yang, K.D. 2006. Advances in the studies for influences of transgenic insect-resistant
crops on insect natural enemies. Anhui Agricultural Science Bulletin 12(11): 82–83.Wu, Y., Wang, Z.Y., Zhao, C.S. and He, K.L. 2007. Effects of insect resistant transgenic plants on
natural enemies. Journal of Northeast Agricultural University 38(1): 107–112.Wu, Y.H., Wang, G.Y., Zhang, J.H., Liang, W.L. and Fok, M. 2005. Analysis on the benefits from
using genetically modified Bt cotton varieties by small farming households. Chinese Agricul-tural Science Bulletin 21(5): 344–347.
Wu, Z.K., Luo, C.H. and Con, P.L. 2006. Research advances in insect-resistant genetic engineeringof potatos. China Potato 20(1): 35–38.
Xia, J.Y., Cui, J.J. and Chang, R.Q. 2000. The resistance of transgenic insect-resistant cotton toSpodoptera exigua. China Cotton 27(9): 10–11.
Xia, J.Y., Cui, J.J., Ma, L.H., Dong, S.L. and Cui, X.F. 1999. The role of transgenic Bt cotton inintegrated insect pest management. Acta Gossypii Sinica 11(2): 57–64.
Xia, J.Y., Ma, Z.Q. and Tian, M.J. 2004. Developmental achievements and roles of Chinese trans-genic insect-resistant cottons. China Agro-technology Extension 6: 4–6.
Xia, J.Y., Wang, C.Y., Ma, Y. and Wang, Y.H.1998. Arthropod community structures in differentcotton cropping systems. Acta Gossypii Sinica 10(1): 26–32.
Xia, Y.F., Xue, D.Y. and Shen, H.M. 2001. Biological safety protocol and its influence to interna-tional trade. International Trade 1(4): 15–18.

18 Impact of IPM and Transgenics in the Chinese Agriculture 553
Xiang, Y.B., Liang, Z.Q., Gao, M.W., Shu, Q.Y., Ye, G.Y. and Cheng, X.Y. 1999. Agrobacteriummediated transformation of insecticidal Bacillus thuringiensis cry IA(b) and cry IA(c) genesand their expression in rice. Chinese Journal of Biotechnology 15(4): 494–500.
Xiao, G.Y. 2003. Biosafety evaluation of transgenic crops and the effect on traditional agricultureof China. Hybrid Rice 18(3): 1–5.
Xiong, G.S., Tang, H.M. and Chen, J.X. 2006. Study on the status and development of the Chinesetransgenic insect-resistant cotton. Chinese Agricultural Science Bulletin 22(5): 193–197.
Xu, J.X., You, Z.B., Wang, W.Q. and Yang, Y.Z. 2004. Economic analysis of Bt cotton planting inJiangsu. Journal of Yangzhou University (Agricultural and Life Science Edition) 25(3): 65–69.
Xu, Y., Wu, K.M., Li, H.B., Wang, F., Sun, S.L. and Li, X.Y. 2004. Effects of transgenic Bt cot-ton on main pests and community of natural enemies in cotton fields. Xinjiang AgriculturalSciences 41(5): 345–347.
Yang, C.L., Lu, X.B. and Zhang, J. 2005. Agricultural transgenetic organisms, product develop-ment, and safety management in the world II: Researches and commercialization of agriculturaltransgenetic organisms. Shandong Agricultural Sciences 2: 66–68.
Yang, L.X. and Li, G.S. 2006. Achievement of major project-economic impacts and developmentstrategy of transgenic crop. China Science Foundation 2: 101–103.
Zhai, W.X., Li, X.B., Tian, W.Z., Zhou, Y.L., Pan, X.B., Cao, S.Y., Zhao, X.F., Zhao, B., Zhang, Q.and Zhu, L.H. 2000. Introduction of a rice blight resistance gene, Xa21, into five Chinese ricevarieties through an Agrobacterium-mediated system. Science in China Ser. C 43(4): 361–368.
Zhang, D.F., Chen, J.X., Zhang, P., Chen, F.R. and Tang, Q.S. 2001. Effects of transgenic Bt cot-ton on the insect community of cotton fields in Changjiang River region. Journal of AnhuiAgricultural Sciences 29(6): 744–745.
Zhang, Q.F., Li, Z.S., Shi, Y.C., et al. 2004. Suggestions on researches and developmental strategiesof transgenic crops in China. Proceedings of Academy of Science of China 19(5): 330–331.
Zhang, W.J. and Barrion, A. 2006. Function approximation and documentation of sampling datausing artificial neural networks. Environmental Monitoring and Assessment 122: 185–201.
Zhang, W.J. 2007a. Computer inference of network of ecological interactions from sampling data.Environmental Monitoring and Assessment 124: 253–261.
Zhang, W.J. 2007b. Pattern classification and recognition of invertebrate functional groups usingself-organizing neural networks. Environmental Monitoring and Assessment 130: 415–422.
Zhang, W.J. 2007c. Supervised neural network recognition of habitat zones of rice invertebrates.Stochastic Environmental Research and Risk Assessment 21: 729–735.
Zhang, W.J., Feng, Y.J., Schoenly, K.G. 2004. Lumping and correlation analyses of invertebratetaxa in tropical irrigated rice field. International Rice Research Notes 29(1): 41–43.
Zhang, X.X., Hua, Z.H., Chen, G.Y. and Huang, D.N. 2001. Research progress of rice resistancetransgenic. Advances in Biological Engineering 21(2): 15–19.
Zhao, H., Zhang, Z.B. and Xu, P. 2006.Catalog of transgenic wheat. Journal of Triticeae Crops25(4): 116–126.
Zhao, Y. and Huang, D.N. 2001. Strategies of resistance management of transgenic insect-resistantBt rice: “dose/refuges”. China Rice 4: 38–39.
Zhou, H.X., Guo, J.Y. and Wan, F.H. 2004. Effect of transgenic Cry1Ac + CpTI cotton (SGK321)on population dynamics of pests and their natural enemies. Acta Entomologica Sinica 47(4):538–542.
Zhu, S.J. and Ni, W.C. 2006. Impact of transgenic plants on agriculture, farmers and agri-ecology.Chinese Agricultural Science Bulletin 22(7): 594–597.
Zhu, Z. 2001. Research and development of insect-resistance transgenic rice. Bulletin of ChineseAcademy of Science 16(5): 353–357.

Chapter 19Can Transgenic Crops and IPM Be Compatible?
George B. Frisvold
Abstract Drawing on the lessons from Bt cotton, this chapter considers how andto what extent transgenic crop varieties can become a useful component of broaderIPM strategies. In the United States, Bt cotton has been successfully incorporatedinto IPM programs to control pink bollworm because several pre-conditions havebeen met. These have included science-based regulatory oversight of new varietyintroduction, active collaboration between university scientists and both regulatoryagencies and agricultural producers, and significant cooperation and self-regulationamong producers themselves. Bt cotton also possesses unique characteristics com-patible with IPM strategies. The U.S. experience of Bt cotton suggests transgenicscan be part of IPM strategies. But, this is no guarantee that transgenic varieties withdifferent characteristics, deployed in countries with different institutional capacitieswill be compatible with IPM. Emerging challenges are longer-term integrated resis-tance management (IRM), the need for cross-commodity IPM, and maintaining theflow of information between scientific, regulatory and agricultural communities.
Keywords IPM · cotton · transgenic · genetically modified · biotechnology ·resistance · Arizona · California · China · refuge · insecticides
19.1 Introduction
There is no single definition of integrated pest management (IPM). Bajwa andKogan’s (2004) compendium lists 67 definitions of integrated pest management(IPM). IPM relies on an understanding of factors that influence pest populationssuch as pest predators, host plant resistance, and choice and timing of cultural prac-tices. Applied IPM usually involve scouting fields, application of insecticides based
G.B. Frisvold (B)Department of Agricultural and Resource Economics, 319 Cesar Chavez Building, University ofArizona, Tucson, AZ 85721, USAe-mail: [email protected]
R. Peshin, A.K. Dhawan (eds.), Integrated Pest Management: Disseminationand Impact, DOI 10.1007/978-1-4020-8990-9 19,C© Springer Science+Business Media B.V. 2009
555

556 G.B. Frisvold
on scouting and established thresholds, use of crop rotations, rotating chemicalsby mode of action, and timing planting, irrigation and harvesting to reduced pestdamage.
If there is one over-arching theme to IPM, it may be the substitution of knowledgeand information for insecticides. What must be integrated is knowledge of agron-omy, plant genetics, economics, pest population dynamics, and ecology. IPM is notonly an intensive user of scientific knowledge, but also requires multi-disciplinaryknowledge. IPM also requires a two-way flow of information between the scien-tific/university community and agricultural producers.
There are several potential benefits of adopting IPM. First, there are the directeconomic benefits of reduced expenditures on insecticides, more efficient use ofinsecticides that are applied, or both. Second, there are non-pecuniary benefits fromreduced negative impacts on beneficial insects, pest predators, non-target species,water quality, and human health.
Third, in the longer-run, IPM may conserve the efficacy of insecticides by lim-iting their use and delaying development of pest resistance to them. Farmers maythus avoid a pesticide treadmill. In response to widespread use of one pesticide, pestsevolve to become resistant, rendering the pesticide ineffective. Farmers then resortto new (and often more expensive) pesticides that are then widely used, repeatingthe cycle of resistance and replacement.
This chapter poses the question, are genetically modified, transgenic crops com-patible with IPM systems? Making use of pest-resistant cultivars has been a tradi-tional part of IPM for many years (Council on Environmental Quality, 1972; Bajwa,1984; NCIPM, 1987; Flint et al., 1991; USDA-ARS, 1993; CPM Crop ProtectionManager, 1997; University of California State-wide IPM, 1997; Bajwa and Kogan,2004). Now, however, advances in recombinant DNA techniques have made it pos-sible to transfer genes from different species into plants. Are new transgenic plantsthat possess pest-resistant traits from other species, simply a newer, better way ofdeveloping pest-resistant cultivars? If so, could they not enhance IPM systems? Or,does their widespread adoption thwart IPM by encouraging over-reliance on toonarrow a set of pest control strategies?
To address these questions, this chapter considers the relationship between Btcotton and IPM. Bt stands for Bacillus thuringiensis, a soil bacterium. The Bt cellsproduce crystal-like proteins during the bacterium’s spore-forming stage. The pro-teins bind to and disrupt midgut membranes, killing particular insect pests. Theproteins are activated (and become toxic) only by stomach enzymes of only cer-tain caterpillar pests. Normally the proteins are not active against humans, othervertebrates, and most beneficial insects. Spray applications of Bt are one of themost important insect management tools in certified organic production of fruit andvegetable crops in the United States (Walz, 1999; Hutcheson, 2003). Bt sprays havebeen registered as insecticides by the U.S. EPA since 1961. Because of the low tox-icity of Bt insecticides, they are the only registered insecticides without U.S. federalfood residue tolerances. Also because of low toxicity, Bt sprays are approved for

19 Can Transgenic Crops and IPM Be Compatible? 557
organic agriculture because Bt is non-pathogenic and naturally occurring.1 Throughgenetic engineering, the Bt gene can be “inserted” into cotton, so that the plantproduces its own Bt toxin. Cotton plants expressing these modified genes providecontrol of tobacco budworm, pink bollworm, and cotton bollworm, three major cot-ton pests.
The adoption rate for Bt cotton has been rapid. Bt cotton first became commer-cially available in the United States in 1996. In that year, 0.75 million hectareswere planted. By 2005, 8.5 million hectares were planted in 8 countries, Argentina,Australia, China, Colombia, India, Mexico, South Africa, and the United States(James, 2005).
Numerous studies have reported significant economic benefits from Bt cot-ton throughout the world (CRDC, 2002; Doyle et al., 2002; Falck-Zepeda et al.,2000a,b; Frisvold and Tronstad, 2002; Frisvold et al., 2006; Gianessi et al., 2002;Huang et al., 2002a,b,c; Hudson et al. 2003; Ismael et al., 2002; Marra, 2001; Prayet al., 2001, 2002; Price et al., 2003; Qaim et al., 2003; Qaim and Zilberman, 2003;Traxler et al., 2002). Benefits may come from reduced pest damage (enhancingyields) reductions in insecticide sprays, or both. In addition to pecuniary benefits,Huang et al. (2002a; 2002d) found evidence that adoption of Bt cotton contributedto a reduction in pesticide poisonings suffered by Chinese farmers.
This chapter is organized as follows. It begins with a short history of pesticidetreadmills in U.S. cotton production followed by discussion of general cotton IPMprinciples. Next, it presents a history of IPM strategies to control pink bollworm inthe southwestern United States. Impacts of Bt cotton on yield, insecticide use, andprofits are then discussed along with estimates of the distribution of economic gainsand losses from Bt cotton adoption. It then illustrates how Bt cotton has been suc-cessfully incorporated in an overall IPM strategy. A crucial part of this strategy hasbeen successful integrated resistance management (IRM) to preserve the efficacy ofBt cotton against pink bollworm (Pectinophora gossypiella).
The chapter concludes by discussing crucial features of Bt technology and thepre-existing IPM programs in the southwestern United States that made a success-ful combination of a transgenic crop and IPM possible. Bt cotton has been suc-cessfully incorporated into IPM programs to control pink bollworm because severalpre-conditions have been met. These have included science-based regulatory over-sight of new variety introduction, active collaboration between university scientistsand both regulatory agencies and agricultural producers, and significant cooperationand self-regulation among producers themselves. Bt cotton also possesses uniquecharacteristics compatible with IPM strategies.
1 Under U.S. federal standards, crops using low-toxicity insecticides can be certified as organic.Such insecticides include botanicals, such as neem, pyrethrum, sabadilla, insecticidal soaps, suchas diatomaceous earth (D.E.), and Bt sprays.

558 G.B. Frisvold
The main lesson is this. The U.S. experience of Bt cotton shows that trans-genics can be part of IPM strategies. But, this is not necessarily so. There is noguarantee that transgenic varieties with different characteristics, deployed in coun-tries with different institutional capacities will be compatible with IPM. Emergingchallenges are longer-term integrated resistance management (IRM), the need forcross-commodity IPM, and maintaining the flow of information between scientific,regulatory and agricultural communities.
19.2 Trends in Cotton Yield Losses and Insecticide Use
Bt cotton controls the tobacco budworm, Heliothis virescens the pink bollworm,Pectinophora gossypiella, and to a lesser extent, cotton bollworm, Helicoverpa zea.2
These have been major cotton pests in the United States, accounting for a dominantshare of cotton yield damage and pesticide applications. In 1995, the year prior toBt introduction in the United States, these three pests lowered U.S. cotton yields byover 4%, more than a quarter billion dollars worth of cotton.
When insects are highly mobile, their regional susceptibility to insecticides de-pend on the collective behavior of individual farmers. Tobacco budworm, cottonbollworm, and pink bollworm are all highly mobile (Rabb and Kennedy, 1979;Kennedy and Storer, 2000; Henneberry, 2007). The more insects are exposed to aninsecticide, the faster the species evolves resistance to that insecticide. Individualfarmers usually do not account for the evolution of resistance when controllingpests on their own fields. But the more a farmer sprays a particular insecticide inone year, the less effective that insecticide will be on his (and neighboring) fieldsin the future. Pest susceptibility is a depletable, common-pool resource, just likegroundwater resources, which may suffer from over-drafting. Similarly, farmersmay overuse insecticides, depleting their effectiveness prematurely because eachfarmer fails to account for the contribution of individual applications to resistanceevolution (Carlson and Castle, 1972).
The history of pesticide use in the United States has been one of pesticide tread-mills (Carlson and Wetzstein, 1993). The cycle begins with the introduction of com-pounds with a particular mode of action, followed by overuse. The overuse leadsto resistance (lowering benefits) and greater scrutiny of environmental and humanhealth costs. This in turn leads to regulatory restrictions and outright bans of insec-ticides. The cycle repeats with introduction of new compounds. Organochlorines,such as DDT, were widely used on U.S. cotton and other crops in the 1960s. Resis-tance and environmental problems led to their replacement by organophosphatesandcarbamates. Resistance to these compounds began in the late 1970s and syntheticpyrethroids were introduced (Livingston et al., 2004; Carlson and Wetzstein, 1993).In the U.S. mid-south, however, budworms evolved to be resistant to pyrethroids,
2 A second generation of cotton varieties with two Bt toxins instead of one has demonstratedgreater effectiveness against cotton bollworm as well as other Lepidoptera.

19 Can Transgenic Crops and IPM Be Compatible? 559
0
2
4
6
8
10
12
1979 1981 1983 1985 1987 1989 1991 1993 1995 1997 1999 2001 2003 2005 2007
% Yield Loss
% Yield Loss 3-year Average
Fig. 19.1 Percent yield loss from all cotton pests in the United States (Williams, 1979–2001)
rendering them ineffective (Bagwell et al., 2000). In 1995, Alabama cotton growersfaced the severest resistance problems. Budworm damage reduced Alabama cottonyields by 29% despite growers averaging 6.7 insecticide applications to control them(Williams, 1995).
Over the last 10 years, however, cotton insecticide applications and yield losseshave declined in the United States. From 1979 to 1995, cotton growers faced yieldlosses ranging from about 6 percent to as high as 11 percent (Fig. 19.1). Since 1997,however, the three-year moving average of yield losses has trended downward. Priorto 1996, yield losses were never lower than 5 percent. Since 2001, however, yieldlosses have never been greater than 5 percent.
U.S. cotton insecticide applications averaged 5.5 per hectare the decade priorto Bt cotton’s commercialization, with application rates ranging from 4 to 7 perhectare (Fig. 19.2). Since 1996, growers have made an average of 3.2 applicationsper hectare, with rates below this average since 2001.
5.5
3.2
0
1
2
3
4
5
6
7
1986 1988 1990 1992 1994 1996 1998 2000 2002 2004 2006
(ap
plic
atio
ns
per
hec
tare
)
Applications / Ha.
1986–95 Average
1996–2007 Average
Fig. 19.2 U.S. Cotton Insecticide Applications per Hectare (Williams, 1986–2001)
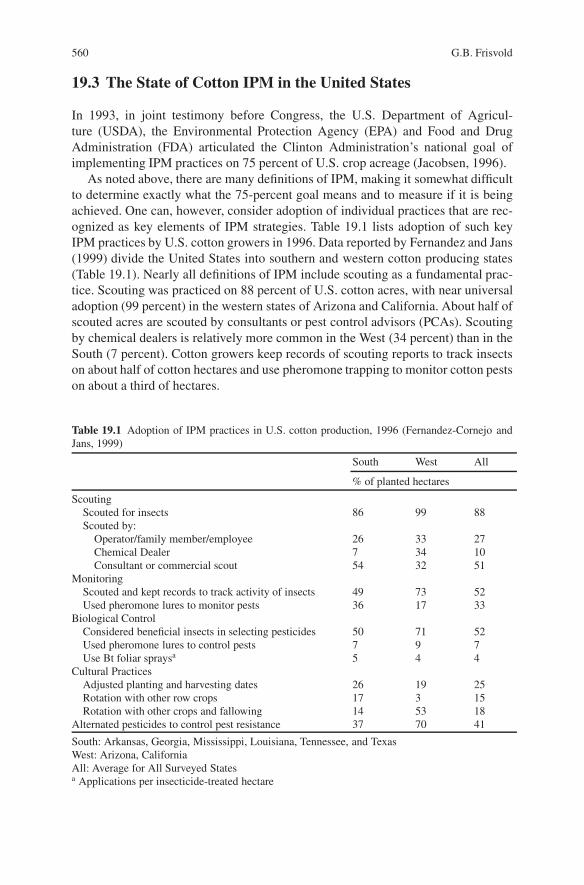
560 G.B. Frisvold
19.3 The State of Cotton IPM in the United States
In 1993, in joint testimony before Congress, the U.S. Department of Agricul-ture (USDA), the Environmental Protection Agency (EPA) and Food and DrugAdministration (FDA) articulated the Clinton Administration’s national goal ofimplementing IPM practices on 75 percent of U.S. crop acreage (Jacobsen, 1996).
As noted above, there are many definitions of IPM, making it somewhat difficultto determine exactly what the 75-percent goal means and to measure if it is beingachieved. One can, however, consider adoption of individual practices that are rec-ognized as key elements of IPM strategies. Table 19.1 lists adoption of such keyIPM practices by U.S. cotton growers in 1996. Data reported by Fernandez and Jans(1999) divide the United States into southern and western cotton producing states(Table 19.1). Nearly all definitions of IPM include scouting as a fundamental prac-tice. Scouting was practiced on 88 percent of U.S. cotton acres, with near universaladoption (99 percent) in the western states of Arizona and California. About half ofscouted acres are scouted by consultants or pest control advisors (PCAs). Scoutingby chemical dealers is relatively more common in the West (34 percent) than in theSouth (7 percent). Cotton growers keep records of scouting reports to track insectson about half of cotton hectares and use pheromone trapping to monitor cotton pestson about a third of hectares.
Table 19.1 Adoption of IPM practices in U.S. cotton production, 1996 (Fernandez-Cornejo andJans, 1999)
South West All
% of planted hectares
ScoutingScouted for insects 86 99 88Scouted by:
Operator/family member/employee 26 33 27Chemical Dealer 7 34 10Consultant or commercial scout 54 32 51
MonitoringScouted and kept records to track activity of insects 49 73 52Used pheromone lures to monitor pests 36 17 33
Biological ControlConsidered beneficial insects in selecting pesticides 50 71 52Used pheromone lures to control pests 7 9 7Use Bt foliar spraysa 5 4 4
Cultural PracticesAdjusted planting and harvesting dates 26 19 25Rotation with other row crops 17 3 15Rotation with other crops and fallowing 14 53 18
Alternated pesticides to control pest resistance 37 70 41
South: Arkansas, Georgia, Mississippi, Louisiana, Tennessee, and TexasWest: Arizona, CaliforniaAll: Average for All Surveyed Statesa Applications per insecticide-treated hectare

19 Can Transgenic Crops and IPM Be Compatible? 561
Growers considered impacts on beneficial insects when selecting pesticides onhalf of cotton acres in the South and 71 percent of hectares in the West. Cul-tural practices such as adjusting planting dates and crop rotations can also offernon-chemical means of pest control. Adjusting dates to control pests was prac-ticed on a quarter of U.S. surveyed cotton hectares. Western growers were morelikely to rotate cotton with either non-field crops or to fallow land. Western grow-ers were also more likely rotate pesticides, using compounds with different modesof action. This practice is intended to discourage evolution of pest resistance toinsecticides.
19.4 From Pesticide Treadmills to Genetic Treadmills?
Several field-plot studies have found Bt cotton reduced target insect damage, theneed for insect sprays, or both (Marra (2001) presents an excellent review and sum-mary of these studies). In a national U.S. study using regional data, Frisvold (2004)estimated the impact of Bt cotton on insecticide use, controlling for differences inpest infestations and for the fact that Bt cotton would have higher adoption ratesin areas with greater prior insecticide use. He found Bt cotton significantly reducedinsecticide applications per infested hectare with reductions ranging from 0.67 in1996 to 2.3 in 2003.
It would appear that adoption of Bt cotton has furthered an IPM goal of limitingchemical insecticide sprays, at least for the target pests. Bt cotton also appears to ex-hibit little activity against natural cotton predators and non-target species, especiallycompared to cotton sprayed with insecticides (Head et al., 2005; Naranjo, 2005;Torres and Ruberson, 2005). Reducing impacts on natural predators is another keyelement of an IPM strategy.
However, some have raised the question of whether transgenic crops are merelysubstituting a pesticide treadmill with a genetic treadmill (Altieri, 1998; Altieri andRosset, 1999; Stone, 2004; Levidow and Carr, 2000). Because the Bt toxin is em-bedded in the cotton plant itself, pests are exposed to it on a continuous basis. Thereis thus great selection pressure and, given the extensive adoption of Bt cotton, thepotential for rapid resistance development to the Bt toxin. Initially, many entomol-ogists feared pests would quickly evolve resistance to Bt crops. This was based onexperience with other pesticides, laboratory selected resistance to Bt toxins in in-sects, and the development of in-field resistance to Bt sprays by diamondback moth(Plutella xylostella) (Gould, 1998; Heckel et al., 1997; Tabashnik et al., 2003).
The possibility of insect resistance to the Bt toxin is a concern to organic agri-cultural producers that use Bt foliar sprays (Hutcheson, 2003). Foliar Bt sprays arealso an important component of vegetable IPM. Because Bt sprays degrade quicklyand only work during specific times of pest life cycles, they require scouting andcareful timing to be effective. They also show little activity to pest predators. Btsprays fit well with IPM strategies of monitoring, timing, application of thresholds,and protection of natural pest predators. There is concern then, that overuse of Bt
562 G.B. Frisvold
cotton could lead to resistance, affecting not only cotton producers, but destroyingits usefulness in vegetable IPM and organic agriculture. Economic theory suggeststhat individual cotton growers would not consider these potential long-term externalcosts to vegetable and organic producers.
In response to – though not completely allaying – these concerns the U.S.Environmental Protection Agency (EPA) has instituted refuge requirements to guardagainst development of resistance to Bt cotton (Matten and Reynolds, 2003; Frisvoldand Reeves, 2008). To delay resistance, EPA requires growers who plant Bt cottonto also plant non-Bt cotton on a minimum percentage of their total cotton acreage.These non-Bt acres serve as a refuge for susceptible pests, allowing them to surviveand mate with adults that have become resistant to the Bt toxin and thereby delay thedevelopment of resistance in the pest population. Experimental evidence and resultsfrom entomological simulation models suggest that refuges can significantly delaythe onset of resistance (Carriere and Tabashnik, 2001; Gould, 1998; Heckel et al.,1997; Tabashnik et al., 2003).
Another concern is that farmers will over-rely on a single gene for pest control,just as they have over-relied on single chemical compounds in the past (Altieriand Rosset, 1999). Cannon (2000) argues that Bt crops remove the need for fieldscouting, monitoring and careful timing of insecticide applications, at least for peststhat Bt varieties target. So, will Bt crops be seen by growers as a substitute forIPM rather than a complement to it? Some authors suggest that multi-faceted, IPMapproaches are essential to delaying resistance to Bt crops (Hoy, 1998; Peferoen,1997; Riebe, 1999). This suggests that the efficacy of Bt crops will not be sustainablewithout IPM.
19.5 Cotton IPM in the U.S. Southwest
W.W. Saunders described pink bollworm as a cotton pest in 1842 based on speci-mens in India (Henneberry and Naranjo, 1998; Henneberry, 2007). Pink bollwormis believed to have reached Egypt in 1906–07 via cotton from India and the NewWorld via cotton from Egypt some time from 1911–13. Pink bollworm reachedTexas in 1917 via cotton shipments from Mexico. Pink bollworm infestations oc-curred intermittently throughout the U.S. Southwest, pink bollworm did not becomea major pest until cooperative, federal, state and private control efforts were discon-tinued in the early 1960s. By the late 1960s, pink bollworm became a major cottonpest in Southern California, contributing to a sharp decline in cotton acreage there(Burrows et al., 1984). The pink bollworm has become a well-established pest inthe U.S.-Mexico border area stretching from Texas and Chihuahua in the east toSouthern California and the Mexicali Valley in the west of the border region.
Because adult pink bollworms are highly mobile, a strategy relying heavily onchemical applications with control focusing on farm-level infestations has provenrelatively ineffective at controlling the pest (Henneberry, 2007). Localized, farm-level strategies often miss most of the population and there has been growing recog-nition that area-wide control measures are required.

19 Can Transgenic Crops and IPM Be Compatible? 563
19.5.1 Avoidance, Behavioral, Biological, and Cultural Control
IPM strategies to control pink bollworm begin with avoidance, i.e. actions takento keep the pest population below chemical treatment thresholds (Ellsworth andMartinez-Carrillo, 2001). Several cultural practices can limit pink bollwormpopulations. By having delayed, uniform cotton planting dates, growers can encour-age suicidal emergence – moth emergence before host material is available. Late–season pest damage can be avoided by shortening the growing season by terminatingirrigation early, applying plant growth regulators, and planting short-season cottoncultivars. Post-harvest, over-wintering of pink bollworm can be discouraged by (a)shredding stalks, disking and plowing-down of crop residue after harvest, (b) winterirrigation, and (c) using crop rotations instead of planting cotton one year to the nexton the same field.
In addition to cultural practices, Southwestern growers have also successfullyapplied biological control methods (Staten et al., 1988). One method is the use ofsex pheromone, gossyplure, to disrupt mating. The pheromone is the scent emittedby females to attract males. Release of gossyplure into cotton fields disrupts mothcommunication, reducing and preventing mating. A slow-release pheromone for-mulation (Rope R©) has proven highly effective at reducing pink bollworm damage.Gossyplure has been determined to have no significant impact on humans, wildlife,and other insect species. Another biological control method is release of sterilemoths. Evidence suggests that this method can cost-effectively prevent pest inva-sions in areas free (or nearly free) of pink bollworm, but works less well in areas withwell established populations. As will be discussed below, sterile moth release is animportant component of pink bollworm eradication efforts. Sterile moth release alsoneeds to be of sufficient scale to be effective. This calls for area-wide coordinationand implementation.
While cultural practices and biological control methods can reduce the need forchemical control, they do not completely eliminate grower demand for insecticideapplications. However, the more growers use avoidance and biological control, theless they need to rely on insecticides. Avoiding early-season insecticide applicationscan preserve natural pink bollworm predators and limit secondary pest outbreaks.In the early 1970s, demonstration projects in Arizona showed that pest scoutingcould significantly reduce grower pest control costs relative to calendar scheduling(Carruth and Moore, 1973; Olmstead 1976). Arizona cotton growers now have oneof the highest rates of pest scouting in the United States (Williams, various years,USDA-ERS).
19.5.2 Area-Wide Control Programs
Grower collective action, facilitated by university research and extension has led tosuccessful area-wide control of cotton pests. In the 1980s cotton bollworm man-agement communities were established among growers in Arkansas. Comparedto non-participating communities, participants applied fewer kilograms of active

564 G.B. Frisvold
insecticide ingredients, lowered insect control costs, increase yields and increasedprofits (Cochran et al., 1985; Parvin et al., 1984).
In 1968, a pink bollworm eradication program was initiated in California’s SanJoaquin Valley that involved cooperation between local grower groups, universi-ties, cooperative extension, county and state agencies and the U.S. Department ofAgriculture (USDA). The goal of the program was to keep pink bollworms out of theSan Joaquin Valley (one of the largest cotton-producing regions in the United States)by keeping moths migrating from Southern California from becoming establishedthere. The program does not use pesticides. Rather, key elements of this ongoingprogram are (a) use of pheromone traps to monitor and detect infestations (b) re-lease of sterile insects to disrupt mating, (c) occasional use of gossyplure for matingdisruption, and (d) cultural controls through the enforcement of plough-down regu-lations (Henneberry, 1994).
Most of the program’s funding comes from cotton growers themselves, whopay assessments to finance program operations.3 Other government agencies alsoactively participate. Plough-down regulations are enforced by county agriculturalcommissioners. The California Department of Food and Agriculture (CDFA) and theUSDA jointly operate a rearing facility that supplies the sterile moths. USDA pro-vides about eight percent of the program’s budget. The CDFA has estimated that, in2000 alone, the program reduced pesticide applications by over six million pounds(2.73 million kg) of active ingredient, saving growers over $80 million dollars.
In California’s Imperial Valley, a short-season cotton program was institutedin 1989 to control pink bollworm. The program called for an earliest plantingdate of March 1 and a latest date of September 1 for defoliant application and ofNovember 1 for plough-down. The program succeeded in reducing larvae per boll,reducing insecticide applications, raising lint yields, and raising lint quality (Chuet al., 1996). In Arizona, a six-year program from 1989–1995 relied on gossyplurefor mating disruption (Antilla et al., 1996). Larval infestations in cotton bolls fellfrom 23% in 1989 to < 1% by 1995. Hectares chemically treated to control pinkbollworm fell dramatically and costs of pink bollworm control fell to $70/ha., wellbelow historic highs of more than $170/ha. (Antilla et al., 1996; Henneberry, 2007).Similar gossyplure-based programs were implemented in Southern California andthe Mexicali Valley of Mexico (Staten et al., 1987).
The Southwest has successfully implemented an area-wide pest eradication pro-gram – the Southwest Boll Weevil Eradication Program. Arizona suffered intermit-tent infestations of boll weevil (Anthonomus grandis) in the 1960s and 1970s. By1978, infestations became more regular in Arizona. By 1982, more than 17,800hectares of Arizona cotton were treated one or more times for boll weevil. Also in1982, boll weevils spread to southern California. In 1983, California initiated aneradication program. Officials there threatened to quarantine Arizona farm products
3 Cotton growers assessment are about $2 per bale of cotton produced and $5 per acre of cottonplanted. Given yields in California this about $20–$25 per hectare of cotton planted. Cotton farmshave planted an average of about 184 hectares of cotton per farm.

19 Can Transgenic Crops and IPM Be Compatible? 565
if Arizona did not begin eradication as well. In response, the Arizona Cotton Re-search and Protection Council (ACRPC) was formed in 1984 as an institutionalmechanism to fund and coordinate boll weevil eradication in the state. The South-west Boll Weevil Eradication Program was established in 1985, covering south-ern California, western Arizona and northwest Mexico. Participants included theACRPC, USDA’s Animal and Plant Health Inspection Service (APHIS,) the Ari-zona Commission of Agriculture and Horticulture, the California Department ofFood and Agriculture, and Sanidad Vegetal, Mexico. Although assisted by state andfederal agencies, the program was largely financed by growers themselves, via per-bale assessments. The program proved successful and by 1991 the boll weevil hadbeen eradicated from Arizona, California and Mexico’s Mexicali Valley. On-goingmonitoring and trapping are still financed via bale assessments.
These area-wide programs have succeeded in both increasing grower returns andreducing insecticide applications. They succeeded in areas where previous controlbased on individual, uncoordinated pest control, relying heavily on insecticide ap-plications had not. There were several keys to program success. First, the programsrelied on different combinations of trapping, monitoring, avoidance, behavioral, andbiological control methods as first steps in control. Second, they also involved effec-tive extension and education programs and active cooperation among grower groupsand among federal, state and local entities. Third, grower groups were actively in-volved in self-organization, financing, and implementation of programs. Fourth, insome cases, cooperation reached not only across state lines, but involved interna-tional cooperation between the United States and Mexico.
19.6 Enter Bt Cotton
Bt cotton was first approved for commercial sale in the United States in 1996. In thatyear, about 14 percent of the U.S. Cotton crop was planted to Bt cotton (Williams,1996). Since 2000, the USDA has begun regularly reporting national estimates ofBt cotton adoption (Fig. 19.3). Adoption rates have risen from 35 percent in 2000 to59 percent by 2007.
19.6.1 Impacts on Yield, Insecticide Use, and Profits
In a survey of Bt cotton adoption impact studies (primarily in the United States),Marra (2001) found that mean reductions in insecticide sprays ranged from 1.3to 3.4 sprays per hectare, with reductions varying by region. Using state and sub-state panel data, Frisvold (2004) estimated Bt cotton adoption reduced insecticideapplications for target pests 0.67 sprays per infested hectare in 1996 and 2.3 spraysper infested hectare in 2003. Marra (2001) also reports mean yield changes rangingfrom a 90 kg/ha decrease to a 370 kg/ha increase, with most studies finding yieldgains. Mean changes in profits ranged from increases of $42/ha to $427/ha.

566 G.B. Frisvold
0
10
20
30
40
50
60
70
2000 2001 2002 2003 2004 2005 2006 2007
Fig. 19.3 Percent of U.S. cotton hectares planted to Bt Cotton
19.6.2 Distribution of Gains and Losses from Bt Adoption
A few studies have employed multi-market models to estimate the distributionof gains (and losses) from Bt cotton adoption. Falck-Zepeda et al. (1999, 2000a,2000b) estimated impacts of U.S. Bt cotton adoption from 1996 to 1998. Overalleconomic gains ranged from $134–$240 million, with U.S. producers capturing43–59 percent of gains and seed suppliers capturing 26–47 percent. Consumers cap-tured only about 10 percent of the gain from Bt cotton via lower prices. Price et al.(2003) estimated overall benefits of $212.5–$300.7 million for Bt cotton adoptionin 1997. Producers, seed suppliers, and consumers each captured about a third ofoverall gains. Frisvold et al. (2006) estimated the global impacts of Bt cotton adop-tion in the United States and China, using a three-region model of the world cottonmarket. They estimated that, in 2001, adoption of Bt cotton in China and the UnitedStates increased world cotton production by 0.7% and reduced the world cottonprice by 1.4 cents per pound. Global benefits were $836 million. China captured71% of this benefit, the United States captured 21%, and the rest of the world (ROW)captured 8%. The fall in world price reduced ROW producer returns, but net ROWbenefits were positive because purchaser gains from lower prices outweighed pro-ducer losses. In the United States, producers captured $179 million and consumers$48 million, but U.S. taxpayers had to pay an additional $198 million in U.S. pricesupport payments (a loss). Seed supplier profits increased by $143 million.4
Using a 9-region computable general equilibrium (CGE) model, Frisvold andReeves (2007) examined impacts of Bt cotton adoption among seven countries(the United States, China, India, Australia, Argentina, Mexico, and South Africa)in 2005. Two non-adopting regions (the EU and the ROW) were also included.
4 Price et al. (2003) provide an excellent discussion of how different modeling assumptions affectthe size and distribution of gains (and losses) from Bt cotton adoption.

19 Can Transgenic Crops and IPM Be Compatible? 567
Benefits of international Bt cotton adoption were about $1.4 billion, with Chinacapturing 46 percent of the benefit, the United States and India each capturing 15percent. Non-adopting regions capture benefits via reductions in cotton prices (fromincreased supplies). The ROW captures 11 percent and the EU 5 percent of globalbenefits. Employment, production and trade balances in apparel and textile sectorsincrease in China and India, but decline elsewhere.
19.6.3 Bt Cotton in the U.S. Southwest
When Bt cotton became part of cotton production in the U.S. southwest it was in-troduced into an area with well-established IPM institutions, past success in carry-ing out area-wide programs, and well-established lines of communication betweenproducers, scientists and extension experts, and government regulatory agencies.As I argue below, these have been important factors contributing to the successfulintegration of Bt cotton into area-wide IPM strategies in the region.
Bt cotton adoption was rapid in Arizona. In 1996 – the first year Bt cottonwas commercially available – Arizona cotton growers planted 23% of their cot-ton hectares to Bt cotton. Growers planted two-thirds of their cotton hectares toBt cotton by 2001 and more than three-quarters to Bt cotton by 2004 (Williams,1996–2004).
In the decade prior to Bt cotton introduction, applications per hectare to controlpink bollworm and cotton bollworm seldom fell below two applications per year andsometimes exceeded six per year (Fig. 19.4). Data for Arizona cotton insect lossesand insecticide applications are available from the Arizona Crop Information Site(ACIS) maintained by the University of Arizona College of Agriculture and Life
0
1
2
3
4
5
6
7
8
1986 1988 1990 1992 1994 1996 1998 2000 2002 2004 2006
PBW Bollworms
Fig. 19.4 Per hectare applications to control pink bollworm and cotton bollworm on Arizona cot-ton (ACIS)

568 G.B. Frisvold
Sciences. Since introduction of Bt cotton, applications to control these pests haveaveraged less than one per hectare per year.
Bt cotton represents a switch from use of broad-spectrum insecticides to thenarrow-spectrum Bt toxin to control pink bollworm. Cannon (2000) raised concernsthat because Bt cotton would be working continually, it might discourage scoutingand monitoring. The shift to narrow-spectrum control, however, meant that growershad to consider pest population dynamics more, not less carefully. Rather thanspraying broad-spectrum insecticides for pink bollworm and counting on a certainamount of collateral control of other insects, growers now had to monitor non-targetpests more closely. Insect scouting and monitoring has consistently been appliedto 95–99% of Arizona cotton hectares with little or no difference between Bt andnon-Bt Hectares (Williams, various years; USDA-ERS).
Introduction of Bt cotton in Arizona was coupled with changes in extension IPMrecommendations. For example, extension seminars, workshops, bulletins, and fielddemonstrations sought to educate growers and Pest Control Advisors about the factthat the Bt toxin does not kill small pink bollworm larvae until they enter the cot-ton boll. Extension programs altered IPM scouting recommendations to emphasizedetection of large rather than small larvae (Ellsworth and Jones, 2001).
Reliance on the narrower-spectrum Bt toxin also raises the possibility of greatersecondary pest outbreaks. Wang et al. (2006) found such evidence in China. Re-ductions in broad-spectrum sprays on cotton to control bollworm lead to greateroutbreaks of mirids (Lygus lucorum and Adelphocoris spp. (Hemiptera: Miridae)) assecondary pests. While Bt cotton provided growers with higher net returns in earlieryears of adoption, in later years the situation was reversed – Bt cotton providedlower net returns – because of the high level of insecticides used to control mirids.Wang et al. developed a bio-economic model to examine more complex pest inter-actions. Their results suggest that planting refuges would preserve the profitabilityof Bt cotton because insecticide sprays to control bollworms on the refuges wouldalso control mirid populations.
Three important lessons can be drawn from this research. First, it highlightsthe importance of educating growers about more complex agro-ecological relation-ships. Simply providing transgenic seed varieties to growers is not enough to sustaingrower gains.5 Second, the efficacy of Bt seed varieties is an exhaustible resourcethat can be conserved via use of refuges. Third, this requires that growers considerinter-temporal trade-offs when deploying transgenic seed varieties. Refuges involvegiving up some short-term gain from the Bt technology in order to preserve that tech-nology farther into the future. Fourth, sustaining transgenic technology will requireactive collaboration between the scientific community and growers and betweengrowers themselves. Individual growers have a short-run (if near-sighted) incentiveto disregard refuges. Collective action (or regulation) may be needed to enforcecompliance with refuge strategies.
5 Pemsl and Waibel (2007) and Pemsl et al. (2008) also discuss results from China illustrating theneed to consider more complex ecological relationships to appropriately evaluate Bt cotton.

19 Can Transgenic Crops and IPM Be Compatible? 569
In Arizona, Cattaneo et al. (2006) carried out an empirical analysis of 81 com-mercial cotton fields to assess the impact of Bt varieties on insecticide use, yields,and biodiversity. They found Bt cotton had higher yields than non-transgenic cot-ton for any given number of insecticide applications, but Bt and non-Bt cottonhad similar yields overall. What accounted for this result? Growers applied fewerbroad-spectrum insecticides on Bt cotton (about 3 fewer sprays in 2002 and 1.5fewer in 2003). The authors suggest that Bt and non-Bt cotton yields were similarbecause the extra sprays on non-Bt cotton, significantly reduced damage caused bypests – such as Lygus (Lygus hesperus Knight, Lygus elisus Van Duzee, and Lyguslineolaris Palisot de Beauvois) and whitefly (Bemisia tabaci) – that Bt cotton doesnot kill. The results from these 81 fields suggest that the main advantage of Bt cottonis lower insecticide costs, but not higher yields.
Over the last 20 years, however, insecticide applications for all cotton pests inArizona as a whole have declined. The need for insecticide applications to controlboll weevils ceased by 1990 as a result of the successful eradication program. Theyear 1996 saw not only the introduction of Bt cotton to control pink bollworm, butthe introduction of bio-rational insect growth regulators (IGRs) to control whitefly.Effective integration of Bt cotton and IGRs into overall cotton IPM strategies has ledto significant reduction in insecticide sprays to control pink and cotton bollwormsand whitefly since 1995 (Fig. 19.5).6 Lygus has remained a significant cotton pestin Arizona, however.
Looking at the data in a slightly different way, Fig. 19.6 shows the 10-year mov-ing average of insecticide applications to control pink and cotton bollworm and tocontrol all cotton pests in Arizona. The 10-year moving average has fallen from 9applications per year for all cotton pests, down to 3–4 applications. For pink and
0
2
4
6
8
10
12
14
1986 1988 1990 1992 1994 1996 1998 2000 2002 2004 2006
Other
Boll Weevil
Lygus
Whitefly
Bollworms
PBW
Fig. 19.5 Per acre (1 acre = 0.4 ha) insecticide applications to Arizona cotton (ACIS)
6 For more discussion of IPM strategies to control whitefly in Arizona see Ellsworth, and MartinezCarrillo (2001) and Ellsworth and Jones (2001).
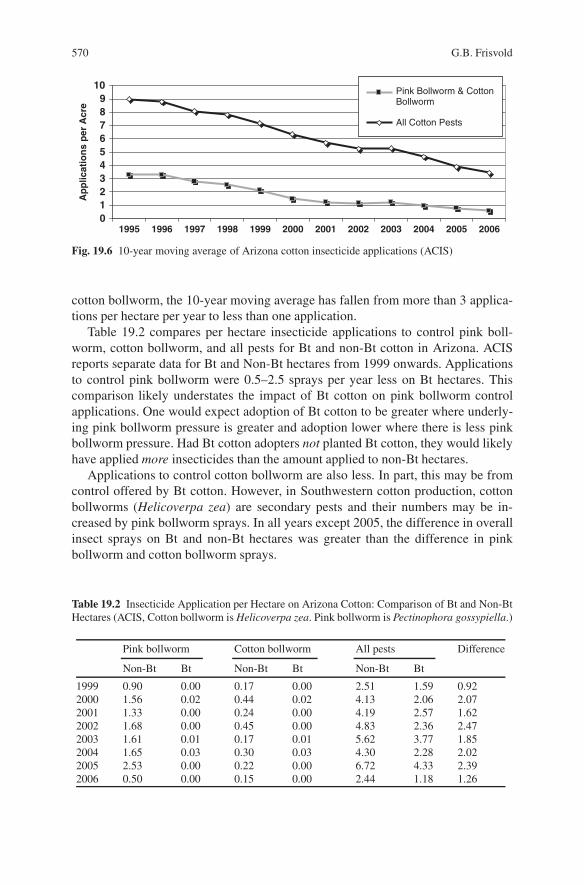
570 G.B. Frisvold
0123456789
10
1995 1996 1997 1998 1999 2000 2001 2002 2003 2004 2005 2006
Ap
plic
atio
ns
per
Acr
ePink Bollworm & CottonBollworm
All Cotton Pests
Fig. 19.6 10-year moving average of Arizona cotton insecticide applications (ACIS)
cotton bollworm, the 10-year moving average has fallen from more than 3 applica-tions per hectare per year to less than one application.
Table 19.2 compares per hectare insecticide applications to control pink boll-worm, cotton bollworm, and all pests for Bt and non-Bt cotton in Arizona. ACISreports separate data for Bt and Non-Bt hectares from 1999 onwards. Applicationsto control pink bollworm were 0.5–2.5 sprays per year less on Bt hectares. Thiscomparison likely understates the impact of Bt cotton on pink bollworm controlapplications. One would expect adoption of Bt cotton to be greater where underly-ing pink bollworm pressure is greater and adoption lower where there is less pinkbollworm pressure. Had Bt cotton adopters not planted Bt cotton, they would likelyhave applied more insecticides than the amount applied to non-Bt hectares.
Applications to control cotton bollworm are also less. In part, this may be fromcontrol offered by Bt cotton. However, in Southwestern cotton production, cottonbollworms (Helicoverpa zea) are secondary pests and their numbers may be in-creased by pink bollworm sprays. In all years except 2005, the difference in overallinsect sprays on Bt and non-Bt hectares was greater than the difference in pinkbollworm and cotton bollworm sprays.
Table 19.2 Insecticide Application per Hectare on Arizona Cotton: Comparison of Bt and Non-BtHectares (ACIS, Cotton bollworm is Helicoverpa zea. Pink bollworm is Pectinophora gossypiella.)
Pink bollworm Cotton bollworm All pests Difference
Non-Bt Bt Non-Bt Bt Non-Bt Bt
1999 0.90 0.00 0.17 0.00 2.51 1.59 0.922000 1.56 0.02 0.44 0.02 4.13 2.06 2.072001 1.33 0.00 0.24 0.00 4.19 2.57 1.622002 1.68 0.00 0.45 0.00 4.83 2.36 2.472003 1.61 0.01 0.17 0.01 5.62 3.77 1.852004 1.65 0.03 0.30 0.03 4.30 2.28 2.022005 2.53 0.00 0.22 0.00 6.72 4.33 2.392006 0.50 0.00 0.15 0.00 2.44 1.18 1.26

19 Can Transgenic Crops and IPM Be Compatible? 571
Table 19.3 Insecticide Applications and Yield Losses for Arizona Bt and Non-Bt Cotton (ACIS)
Applications per hectare Percent Yield Loss
Non-Bt Bt Non-Bt Bt
Mean 4.34 2.52 7.55 4.70Standard Deviation 1.44 1.05 2.13 1.80Wilcoxon Two SampleTest Statistic, W 45 45Null Hypothesis of
Equal MeansRejected at 1% level
(one-tailed test)Rejected at 1% level
(one-tailed test)
The difference in mean insecticide applications and mean percent yield lossesto all cotton pests between Bt and Non-Bt cotton appear to be significantly differ-ent (Table 19.3). From 1999 to 2006 mean applications were 2.52 on Bt hectaresand 4.34 on non-Bt hectares. Mean yield losses were 4.70% in Bt hectares, but7.55% on non-Bt hectares. Using a non-parametric Wilcoxon test (to account forthe small number of observations) the hypothesis that mean insecticide applicationswere equal on Bt and non-Bt hectares was rejected at the one-percent level (usinga one-tailed test). The hypothesis that yield losses were equal on Bt and non-Bthectares was also rejected at the one-percent level.
These results underscore those from China that it is important to consider keyinteractions between transgenic seed varieties, insecticide applications and impactson non-target species. The efficacy of Bt cotton in Arizona has been maintainedthrough intensive extension and education efforts to help growers understand suchcomplex interactions. U.S cotton production also operates with refuge requirements.In Arizona, compliance with these requirements was estimated to be above 88% infive of six years from 1998 to 2003 (Carriere et al., 2005).
19.7 Importance of Integrated Resistance Management (IRM)
The U.S. EPA requires integrated resistance management (IRM) programs for Btcotton to delay resistance and maintain its efficacy. IRM strategies have been de-veloped in consultation with federal environmental and agricultural agency staff,university, public interest groups, grower groups, and Monsanto Company (the de-veloper of Bt cotton) (Matten and Reynolds, 2003). The EPA regularly convenesScientific Advisory Panels to review underlying science and evidence regarding pestresistance and to revise IRM regulations (US. EPA, 2001, 2006a, 2006b). For IRM,EPA requires
(1) mandatory refuge requirements7
(2) resistance monitoring
7 This has involved requirements that cotton growers either plant non-Bt cotton as refuges or (re-cently) to make use of natural refuges (from non-cotton host plants) when planting Bt cotton withtwo Bt toxins.

572 G.B. Frisvold
(3) remedial action plan(4) IRM compliance monitoring(5) grower education(6) grower agreements, and(7) annual reports.
At the outset of Bt cotton introduction in 1996, there was significant concernamong entomologists about the possibility of resistance problems in Arizona cot-ton. This concern was warranted because it has been possible – in the laboratory –to rapidly select for strains of pink bollworm that were resistant to Cry1Ac, thefirst Bt toxin commercially available in seed (Bartlett 1995, Simmons et al., 1998;Patin et al., 1999; Liu et al., 1999; Tabashnik et al., 2000; Sims et al., 2001). Inresponse to this concern, a Bt Cotton Working Group was established in Arizonaspecifically to carry out IRM. Members and collaborators with the group includedgrower-funded cotton organizations (the ACRPC and the Arizona Cotton GrowersAssociation), research and extension faculty at the University of Arizona, the Ari-zona Department of Agriculture, and Monsanto corporation.
The University of Arizona’s Extension Arthropod resistance monitoring labo-ratory (EARML) monitored and tested the susceptibility of pink bollworms to Btcotton both in the laboratory and in the field. EARML has been supported by USDA-ARS Western Cotton Research Laboratory, the Arizona Cotton Growers Associa-tion, and Cotton Incorporated (a national U.S. cotton grower group). Pink bollwormsamples were collected state-wide and bio-assayed. To date, there has been no evi-dence of an increase of pink bollworm resistance to Bt cotton in the field.
The ACRPC has collaborated with the University of Arizona in geo-coding cot-ton hectares in the state. This has made it possible to monitor grower compliancewith EPA refuge requirements (Carriere et al., 2001; Carriere et al., 2005). Geo-coded cotton data has been combined with detailed geo-coded pesticide use datacollected by the Arizona Department of Agriculture. The University of Arizona’sPesticide Information Office has combined this data to monitor trends in cotton pes-ticide use since the introduction of Bt cotton and insect growth regulators (Agnewet al., 2000; Agnew and Baker, 2001).
The Bt Cotton Working Group has also examined the efficacy of refuge sizeand configuration requirements and, based on research, developed recommendedchanges. For example, in 2000, the Group recommended that “at least one edge ofeach Bt cotton field be no more than a mile from a non-Bt cotton refuge” (Carriereet al., 2001). This was to help insure that moths with resistant alleles could find andmate with susceptible pink bollworm moths. The Working Groups recommendedexceptions to the distance requirements in rare cases where they state seed produc-tion regulations.8 In 2001, the EPA largely adopted these recommendations.
8 Arizona is a major producer of crop seeds. To maintain seed product quality, the state main-tains field location requirements so that seeds produced are not contaminated from production inneighboring fields.
19 Can Transgenic Crops and IPM Be Compatible? 573
The Working Group’s distance recommendations may seem curious at first, inthat they represent a call from grower groups for stricter regulation. Why did thishappen? First, through extension and education efforts, growers appreciated thevalue of taking steps to delay resistance. Second, because the recommendationscame from “the bottom up,” growers already expected the change in regulationsand had time to adjust voluntarily before they became binding. Third, the WorkingGroup’s science-based recommendations also included calls for regulatory flexibil-ity that benefited growers. New EPA rules allowed for the strict distance require-ment to be waived to comply with Arizona state seed production regulations as longas refuges were planted as close to Bt cotton as state regulations allowed. Also,Arizona growers were permitted to plant embedded and in-field refuges. Frisvoldand Reeves (2008) estimated that the added flexibility reduced the costs of refugesover 1996–2004 up to 38%. EPA has been willing to increase the flexibility of regu-lations if this flexibility is scientifically defensible and does not undercut their basicIRM goals.
Through the Working Group, Arizona was also the first state to develop a com-prehensive remedial action plan to (a) develop and early-warning system to detect ifresistance had developed in the field, (b) take immediate steps to isolate and containresistant pink bollworm populations and (c) take longer term measures (such as Btcotton planting restrictions and extra pest control measures) to eradicate locally re-sistant populations. To date resistant strains have not been found, but pink bollwormpopulations are continually monitored in the state.
19.8 Importance of Multi-Agent Participation
A number of actors have made the integration of Bt cotton into Southwest cottonIPM strategies possible and to develop IRM strategies to maintain the efficacy of Btcotton. The EPA has provided regulatory oversight over IRM policies, with refugesplaying a major role. Refuges reduce grower benefits from Bt cotton in the short-runbut can provide longer-term benefits by preventing secondary pest outbreaks (Wanget al., 2006) or delaying resistance (Frisvold and Reeves, 2008). It is possible thatlong-run grower profits could be higher under compliance to refuge regulations thanif no such regulations were in place.
University research and extension programs have played an important role in sev-eral ways. First, they have made growers aware of the public goods aspect of area-wide pest control and delaying resistance. Scientists have been actively engaged indeveloping and demonstrating IPM and IRM strategies both before transgenics andafter they became available. They have also contributed data and analysis to informregulatory decisions.
Collective action by producer groups has also been instrumental. These groupshave financed data collection, education efforts and made data available for researchand also for regulatory decisions. Extension education has not been unidirectionalfrom the university to growers. Rather, growers have helped educate scientists andregulators about Bt cotton performance in the field. Grower organizations have alsobeen instrumental in funding and self-enforcement of area-wide IPM practices (such

574 G.B. Frisvold
as plough – down requirements and short-season cotton production). The role ofgrowers in providing needed data, funding, and self-regulation presents a challengeto scientists and regulators. If grower assistance is only used to ratchet up regulation,then it will be less forthcoming in the future (Frisvold, 2000). Arizona’s experience,however, suggests that grower collective action can fit well into IRM regulatoryframeworks.
19.9 Can Transgenic Crops Be Compatible with IPM?
I return to the original question of this chapter. The experience of Bt cotton inthe U.S. southwest shows that transgenics can be compatible with IPM strategies.Through collaboration between multiple public and private entities, Bt cotton hasbeen successfully included in overall cotton IPM strategies. To date, IRM strategieshave successfully prevented pink bollworms from evolving resistance to Bt cotton.
But how far can Arizona’s or Bt cotton’s experience be generalized? In the UnitedStates, there are no other host plants for the pink bollworm, making IPM consid-erably simpler. For other transgenic cultivars in other situations, cross-commoditycoordination of IPM will likely be required. The example of the Southwest UnitedStates shows that significant investments in IPM institutional capacity were madewell before the arrival of transgenics. Regulatory agencies also had significant sci-entific capacity to formulate IRM policies.
Other countries now rapidly adopting transgenics have nowhere near the institu-tional history or capacity developed in the Southwest. Studies of Bt cotton in Chinaby Wang et al. (2006), Pemsl and Waibel (2007) and Pemsl et al. (2008) suggest thatintroduction in developing countries with less institutional capacity and understand-ing of pest population dynamics can limit the long-term benefits of transgenics.
Can transgenics be compatible with IPM? Arizona’s experience suggests that fortransgenics to provide sustainable benefits they will have to be compatible with IPM.
References
Agnew, G.K. and Baker, P.B. 2001. Pest And Pesticide Usage Patterns in Arizona Cotton: Final2000 Data. 2001 Arizona Cotton Report, The University of Arizona College of Agriculture andLife Sciences, Tucson, AZ.
Agnew, G.K. Baker, P. and Frisvold, G. 2000. Arizona Cotton Pesticide Use Data: Opportunitiesand Pitfalls. Proceedings of the Beltwide Cotton Conferences. San Antonio, TX, January 6–9,pp. 361–363.
Altieri, M.A. 1998. The environmental risks of transgenic crops: an agroecological assessment.Pesticides and You 18(1): 10–15.
Altieri, M.A. and Rosset, P. 1999. Ten reasons why biotechnology will not ensure food security,protect the environment and reduce poverty in the developing world. AgBioForum, 2(3&4),155–162.
Antilla, L., Whitlow, M., Staten R.T., El-Lissy O. and Myers F. 1996. An integrated approach toareawide pink bollworm management in Arizona. Proceedings of the Beltwide Cotton Confer-ences. Nashville, TN. January 9–12, pp. 1083–1085.

19 Can Transgenic Crops and IPM Be Compatible? 575
Bagwell, R., Cook, D., Adamczyk, J., Leonard, B. and Micinski, S. 2000. Status of InsecticideResistance in Tobacco Budworm and Bollworm in Louisiana During 1999. Proceedings of theBeltwide Cotton Conferences. San Antonio, TX, January 6–9, pp. 914–18.
Bajwa, M.I., 1984. Integrated Pest Management in AJK. Govt. Press, MZD.Bajwa, W.I. and Kogan, M. 2004. Compendium of IPM Definitions (CID): A Collection of IPM
Definitions and their Citations in Worldwide IPM Literature. Integrated Plant Protection Center(IPPC) Oregon State University, Corvallis Publication Number 998.
Bartlett, A.C. 1995. Resistance of the pink bollworm to B.t. transgenic cotton. Proceedings of theBeltwide Cotton Conferences. San Antonio, TX, January 4–7, pp. 766–768.
Burrows, T.M., Sevacherian, V., Moffit, L.J. and Baritelle, J. 1984. Economics of pest controlalternatives for Imperial Valley cotton. California Agriculture, May–June, 15–16.
California Department of Food and Agriculture. 2008. Pink Bollworm Sterile Release http://www.cdfa.ca.gov/phpps/ipc/pinkbollworm/pbw sterilerelease.htm, Accessed April 1, 2008.
Cannon, R.J.C. 2000. Bt transgenic crops: Risks and benefits, Integrated Pest Management Reviews5(3), 151–173.
Carlson, G.A. and Castle, E. 1972. Economics of pest control. In: Control Strategies for the Future.National Academy of Science, Washington DC, pp. 79–99.
Carlson, G.A. and Wetzstein, M.E. 1993. Pesticides and pest management. In Carlson, G.,Zilberman, D., Miranowski, J. (eds.), Agricultural and Environmental Resource Economics.Oxford University Press, Oxford, pp. 268–318.
Carriere, Y. and Tabashnik, B.E. 2001. Reversing insect adaptations to transgenic insecticidalplants. Proceedings of the Royal Society of London. Series B 268(1475): 1475–1480.
Carriere, Y. Dennehy, T.J., Pedersen, B., Haller, S., Ellers-Kirk, C., Antilla, L., Liu, Y., Willott, E.and Tabashnik, B.E. 2001. Large-scale management of insect resistance to transgenic cottonin Arizona: can transgenic insecticidal crops be sustained? Journal of Economic Entomology94(2): 315–325.
Carriere, Y., Ellers-Kirk, C., Kumar, K., Heuberger, S., Whitlow, M., Antilla, L., Dennehy, T.J. andTabashnik, B.E. 2005. Long-term Evaluation of Compliance with Refuge Requirements for BtCotton. Pest Management Science 61(4): 327–330.
Carruth, L.A. and Moore, L. 1973. Cotton scouting and pesticide use in eastern Arizona. Journalof Economic Entomology 66(1): 187–90.
Cattaneo, M., Yafuso, C., Schmidt, C., Huang, C., Rahman, M., Olson, C., Ellers-Kirk, C., Orr,B., Marsh, S., Antilla, L., Dutilleul, P. and Carriere, Y. 2006. Farm-scale evaluation of the im-pacts of transgenic cotton on biodiversity, pesticide use, and yield, Proceedings of the NationalAcademy of Science 103(20): 7571–7576.
Chu, C.C., Henneberry, T.J., Weddle, R.C., Natwick, E.T., Carson, J.R., Valenzuela, C., Birdsall,S.L. and Staten, R.T. 1996. Reduction of pink bollworm (Lepidoptera: Gelechiidae) populationsin Imperial Valley, California following mandating shortseason cotton management systems.Journal of Economic Entomology 89(1): 175–12.
Cochran, M.J., Nicholson, W.F., Parvin, D.W. and Phillips, J.R. 1985. An assessment of theArkansas experience with bollworm management communities: evaluated from three per-spectives. Proceedings of the Beltwide Cotton Conferences. New Orleans, LA. January 6–11,pp. 160–2.
Cotton Research and Development Corporation (CRDC). 2002. Annual Report 2001–2. NarrabriNew South Wales, Australia.
Council on Environmental Quality (CEQ). 1972. Integrated Pest Management, U. S. Govt. PrintingOffice, Washington, DC.
CPM Crop Protection Manager. 1997. In Insect Management-Insecticides Do Have a Role in IPM.pp. 21–22.
Dennehy, T.J., Unnithan, G.C., Brink, S. and Wood, B. 2005. Preliminary Report onSusceptibility of Southwestern Pink Bollworm to Bt Toxins Cry1AC and Cry2AB2 in2005. University of Arizona, Extension Arthropod Resistance Management Laboratory,Tucson, AZ.
576 G.B. Frisvold
Doyle, B., Reeve, I. and Barclay, E. 2002. The Performance of Ingard Cotton in Australia Duringthe 2000/2001 Season. Institute for Rural Futures. University of New England, Armidale, NewSouth Wales, Australia.
Ellsworth, P.C. and Jones, J.S. 2001. Cotton IPM in Arizona: a decade of research, implemen-tation & education. Proceedings Beltwide Cotton Conferences. Anaheim, CA. January 9–13,pp. 1088–1096.
Ellsworth, P.C. and Martinez-Carrillo, J.L. 2001. IPM for Bemisia tabaci: a case study from NorthAmerica. Crop Protection 20(9): 853–869.
Falck-Zepeda, J.B., Traxler, G. and Nelson, R.G. 1999. Rent creation and distribution from the firstthree years of planting Bt cotton. ISAAA Briefs No. 14. International Service for the Acquisitionof Agri-biotech Applications: Ithaca, NY.
Falck-Zepeda, J.B., Traxler, G. and Nelson, R.G. 2000a. Rent creation and distribution frombiotechnology innovations: the case of Bt cotton and herbicide-tolerant soybeans in 1997.Agribusiness 16(1): 21–32.
Falck-Zepeda, J.B., Traxler, G. and Nelson, R.G. 2000b. Surplus distribution from the intro-duction of a biotechnology introduction. American Journal of Agricultural Economics 82(2):360–369.
Fernandez-Cornejo, J. and Jans, S. 1999. Pest management in U.S. agriculture. Agricul-tural Handbook No. AH717. U.S. Department of Agriculture, Economic Research Service:Washington, DC.
Flint, M.L., Daar, S. and Molinar, R. 1991. Establishing integrated pest management polices andprograms: a guide for public agencies. University of California IPM Publication 12.
Frisvold, G. 2000. Data, information, and rural environmental policy: What will the next ten yearsbring? Review of Agricultural Economics 22(1): 237–244.
Frisvold, G. 2004. Diffusion of Bt cotton and insecticide use, Selected Paper of the 2004 AnnualMeeting of the American Agricultural Economics Association, June 30-July 2, 2004, Honolulu,Hawaii.
Frisvold, G. and Tronstad, R. 2002. Economic impacts of Bt cotton adoption in the United States.In: Kalaitzandonakes, N. (Ed.), The Economic and Environmental Impacts of Agbiotech: AGlobal Perspective. Kluwer-Plenam, Norwell, MA, pp. 261–286.
Frisvold, G.B., Tronstad, R. and Reeves, J.M. 2006. International impacts of Bt cotton adoption.In: Evenson, R.E. and Santaniello, V. (eds.), International Trade and Policies for GeneticallyModified Products. CABI Publishing, Wallingsford, Oxfordshire, pp. 191–200.
Frisvold, G. and Reeves, J. 2007. Economy-wide impacts of Bt cotton adoption. ProceedingsBeltwide Cotton Conferences. New Orleans, LA, January 9–13, 2007.
Frisvold, G.B. and Reeves, J.M. 2008. The costs and benefits of refuge requirements: The case ofBt cotton. Ecological Economics 65(1): 87–97.
Gianessi, L.P., Silvers, C.S., Sankula, S. and Carpenter, J.E. 2002. Plant Biotechnology: Currentand Potential Impact for Improving Pest Management in U.S. Agriculture. An Analysis of 40Case Studies. National Center for Food and Agricultural Policy, Washington, DC. June.
Gould, F. 1998. Sustainability of transgenic insecticidal cultivars: integrating pest genetics andecology. Annual Review of Entomology 43(1): 701–726.
Head, G.E, Moar, W., Eubanks, E.M., Freeman, E.B., Ruberson, E.J., Hagerty E.A. andTurnipseed, S. 2005. A multiyear, large-scale comparison of arthropod populations on com-mercially managed Bt and non-Bt cotton fields. Environmental Entomology 34(5): 1257–1266.
Heckel, D.G., Gahan, L.C., Gould, F., Daly, J.C. and Trowell, S. 1997. Genetics of Heliothis andHelicoverpa resistance to chemical insecticides and to Bacillus thuringiensis, Pesticide Science51(3): 251–258.
Henneberry, T.J. 1994. Pink bollworm sterile moth releases: suppression of established infesta-tions and exclusion from noninfested areas. In: Calkins, C.O., Klassen W. and Liede P. (eds),Fruitflies and Sterile Insect Techniques. CRC Press, Inc., Boca Raton, FL, pp. 181–207.
Henneberry, T.J. 2007. Integrated systems for control of the pink bollworm pectinophoragossypiella in Cotton. In: Vreysen, M.J.B., Robinson, A.S. and Hendrichs J. (eds.),

19 Can Transgenic Crops and IPM Be Compatible? 577
Area-Wide Control of Insect Pests: From Research to Field Implementation. Springer, Dor-drecht, pp. 567–579.
Henneberry, T.J. and Naranjo, S.E. 1998. Integrated management approaches for pink bollworm inthe southwestern United States. Integrated Pest Management Reviews 3(1): 31–52.
Hoy, M.A. 1998. Myths, models and mitigation of resistance to pesticides. Philospohical Transac-tions of the Royal Society London B 353(1376): 1787–1795.
Huang, J., Hu, R., Fan, C., Pray C.E. and Rozelle, S. 2002a. Bt cotton benefits, costs, and impactsin China. AgBioForum, 5(4): 153–166.
Huang, J., Hu, R., Rozelle, S., Qiao, F. and Pray, C.E. 2002b. Transgenic varieties and productiv-ity of smallholder cotton farmers in China. Australian Journal of Agricultural and ResourceEconomics 46(3): 367–387.
Huang, J.R., Hu, H. and van Tongeren, F. 2002c. Biotechnology boosts to crop productivity inChina and its impact on global trade. Chinese Center for Agricultural Policy. Working Paper,vol. 02–E7.
Huang, J., Rozelle, S., Pray, C. and Wang, Q. 2002d. Plant biotechnology in China. Science295(5555): 674–677.
Hudson, J., Mullins, W. and Mills, J.M. 2003. Eight years of economic comparisons of bollgard R©cotton. Proceedings of the Beltwide Cotton Conferences. Nashville, TN. January 7–9,pp. 1042–1049.
Hutcheson, T. 2003. EPA: Bt Cotton Harmful to Organic. Organic Trade Association, Green-field, MA.
Ismael, Y., Bennett, R. and Morse, S. 2002. Benefits from Bt cotton use by smallholder farmers inSouth Africa. Agbioforum 5(1): 1–5.
Jacobsen, B. 1996. USDA Integrated Pest Management Initiative. Electronic IPM Textbook, Rad-cliffe E.B. and Hutchison W.D. (eds). University of Minnesota and the Consortium for Interna-tional Crop Protection.
James, C. 2005. Global Status of Commercialized Biotech/GM Crops: 2005. ISAAA Brief 34.International Service for the Acquisition of Agri-biotech Applications (ISAAA). Ithaca, NY.
Kennedy, G.G., and Storer, N.P. 2000. Life Systems of Polyphagous Arthropod Pests in TemporallyUnstable Cropping Systems. Annual Review of Entomology 45(1), 467–93.
Levidow, L. and Carr, S. 2000. Unsound science? Transatlantic regulatory disputes over GM crops.International Journal of Biotechnology 2(1–3): 257–273.
Liu, Y.-B., Tabashnik, B.E., Dennehy, T.J., Patin, A.L. and Bartlett, A.C. 1999. Development timeand resistance to Bt crops. Nature 400(6744): 519.
Livingston, M., Carlson, G.A. and Fackler, P.A. 2004. Managing resistance evolution in two peststo two toxins with refugia. American Journal of Agricultural Economics 86(1): 1–13.
Marra, M.C. 2001.The farm level impacts of transgenic crops: a critical review of the evidence.In: Pardey, P.G. (ed.). The Future of Food: Biotechnology Markets in an International Setting.Johns Hopkins Press and International Food Policy Research Institute Baltimore, 155–184.
Matten, S.R. and Reynolds, A.H., 2003. Current resistance management requirements for Bt cottonin the United States. Journal of New Seeds 5(2&3), 137–178.
Naranjo, S.E. 2005. Long-term assessment of the effects of transgenic Bt cotton on the abundanceof nontarget arthropod natural enemies, Environmental Entomology 34(5): 1193–1210.
National Coalition on Integrated Pest Management (NCIPM). 1987. Integrated pest management.Austin, TX. 60 pp.
Olmstead, S.D. 1976. An evaluation of cotton pest management practices in Pinal County, Arizona.Master’s thesis, University of Arizona, Tucson, AZ.
Patin, A.L., Dennehy, T.J., Sims, M.A., Tabashnik, B.E., Liu, Y.-B., Antilla, L., Gouge, D.,Henneberry, T.J. and Staten, R., 1999. Status of pink bollworm susceptibility to Bt in Arizona.Proceedings Beltwide Cotton Conferences. Orlando, FL, Jan. 3–7, pp. 991–996.
Parvin, D., Cochran, M., Nicholson, W.F. and Phillips, J.R. 1984. An Economic Evaluation ofCommunity Pest Management Programs on Cotton in Arkansas. Department of AgriculturalEconomic and Rural Sociology, University of Arkansas, Fayetteville, AR.
578 G.B. Frisvold
Peferoen, M. 1997. Progress and prospects for field use of Bt genes in crops. Trends inBiotechnology 15(5): 173–177.
Pemsl, D., Gutierrez, A.P. and Waibel, H. 2008. The economics of biotechnology under ecosystemdisruption, Ecological Economics (In Press).
Pemsl, D. and Waibel, H. 2007. Assessing the profitability of different crop protection strategiesin cotton: Case study results from Shandong Province, China, Agricultural Systems 95(1–3):28–36.
Pray, C., Ma, D., Huang, J. and Qiao, F. 2001. The impact of Bt cotton in China. World Develop-ment 29(5): 813–825.
Pray, C., Huang, J., Hu, R. and Rozelle, S. 2002. Five years of Bt cotton in China—the benefitscontinue. The Plant Journal 34(4): 423–430.
Price, G.K., Lin, W., Falck-Zepeda, J. and Fernandez-Cornejo, J. 2003. Size and distribution ofmarket benefits from adopting biotech crops. U.S. Department of Agriculture, Economic Re-search Service Technical Bulletin, TB1906.
Qaim, M. and Zilberman, D. 2003. Yield effects of genetically modified crops in developing coun-tries. Science 299(5608): 900–902.
Qaim, M., Cap, E. and de Janvry, A. 2003. Agronomics and sustainability of transgenic cotton inArgentina. Agbioforum 6(1&2): 41–47.
Price, G.K., Lin, W., Falck-Zepeda, J.B. and Fernandez-Cornejo, J. 2003. Size and Distribution ofMarket Benefits From Adopting Biotech Crops. Technical Bulletin No. TB1906. U.S. Depart-ment of Agriculture, Economic Research Service: Washington, DC.
Rabb, R.L. and Kennedy, G.G. (eds.) 1979. Movement of Highly Mobile Insects: Concepts andMethodology in Research. University Graphics, North Carolina State University, Raleigh NC.
Riebe, J.F. 1999. The development and implementation of strategies to prevent resistance toBt-expressing crops: an industry perspective. Canadian Journal of Plant Pathology 21(2):101–105.
Simmons, A.L., Dennehy, T.J., Tabashnik, B.E., Antilla, L., Bartlett, A., Gouge, D. and Staten,R. 1998. Evaluation of B.t. cotton deployment strategies and efficacy against pink bollwormin Arizona. Proceedings of the Beltwide Cotton Conferences. San Diego, CA. January 5–9,pp. 1025–1030.
Sims, M.A., Dennehy, T.J., Patin, A., Carriere. Y., Liu, Y.-B., Tabashnik, B.E., Antilla, L. andWhitlow, M. 2001. Arizona’s multi-agency resistance management program for Bt cotton: sus-taining the susceptibility of pink bollworm. Proceedings of the Beltwide Cotton Conferences.Anaheim, CA. January 9–13, pp. 1175–1179.
Staten, R.T., Flint, H.M., Weddle, R.C., Quintero, E., Zariti, R.E., Finnel, C.M., Hernandez, M. andYamamoto, A. 1987. Pink bollworm (Lepidoptera: Gelechiidae): Large scale field tests with ahigh rate gossyplure formulation. Journal of Economic Entomology 80(6): 1267–1271.
Staten, R.T., Miller, E., Grunnet, M. and Andress, E. 1988. The use of pheromones for pink boll-worm management in western cotton. Proceedings of the Beltwide Cotton Conferences. NewOrleans, LA. January 3–8, pp. 206–209.
Stone, G.D. 2004. Social constraints on crop biotechnology in developing countries. AgBioForum7(1&2): 76–79.
Tabashnik, B.E., Carriere, Y., Dennehy, T.J., Morin, S., Sisterton, M., Roush, R., Shelton, A. andZhao, J. 2003. Insect resistance to transgenic Bt crops: lessons from the laboratory and field.Journal of Economic Entomology 96(4): 1031–1038.
Tabashnik, B.E., Patin, A.L., Dennehy, T.J., Liu, Y., Carriere, Y., Sims, M.A. and Antilla, L. 2000.Frequency of resistance to Bacillus thuringiensis in field populations of pink bollworm. Pro-ceedings of the National Academy of Sciences 97(24): 2980–12984.
Torres, J.B. and Ruberson, J.R. 2005. Canopy- and ground-dwelling predatory arthropods in com-mercial Bt and non-Bt cotton fields: patterns and mechanisms. Environmental Entomology34(5): 1242–1256.
Traxler, G., Godoy-Avila, S., Falck-Zepeda, J. and Espinoza-Arellano, J. 2002. Transgenic cot-ton in Mexico: economic and environmental impacts. In: Kalaitzandonakes, N. (ed.), The

19 Can Transgenic Crops and IPM Be Compatible? 579
Economic and Environmental Impacts of Agbiotech: A Global Perspective. Kluwer–Plenam,Norwell, MA.
United States Department of Agriculture, Agricultural Research Service (USDA-ARS). 1993.USDA programs related to integrated pest management. USDA Program Aid 1506.
United States Department of Agriculture, Economic Research Service (USDA-ERS) Agri-cultural Resource Management Survey (ARMS): Farm Business and Household Sur-vey Data: Customized Data Summaries from ARMS – Crop Production Practices.http://www.ers.usda.gov/Data/ARMS/CropOverview.htm. Accessed March 2008.
U.S. Dept. of Agriculture, National Agricultural Statistics Service (USDA-NASS). 2001–2007.Acreage. June, 2001–7.
U.S. Environmental Protection Agency (U.S. EPA). 2001. Bt Plant-Incorporated Protectants:Biopesticides Registration Action Document. EPA Biopesticides and Pollution Prevention Di-vision, Crystal City, VA. October.
U.S. Environmental Protection Agency (U.S. EPA). 2006a. Biopesticides and Pollution PreventionDivision (BPPD). BPPD Review of Data and Support Materials Submitted by Monsanto toAmend the Insect Resistance Management Requirements for Bollgard II Bt cotton. EPA Reg.No. 524–522. A. Reynolds and S. Matten memorandum to L. Cole, May 16 2006a. EPA-HQ-OPP-2006-0217-0007.
U.S. Environmental Protection Agency FIFRA Science Advisory Panel (U.S. EPA, SAP). 2006b.Meeting Minutes of the FIFRA Scientific Advisory Panel Meeting, June 13–15, 2006. Analysisof a Natural Refuge of Non-Cotton Hosts for Monsanto’s Bollgard II Cotton. United StatesEnvironmental Protection Agency, Washington, DC.
University of California State-wide Integrated Pest Management Project. 1997. Annual Report,University of California State-wide Integrated Pest Management Project, California, USA.
Walz, E. 1999. Final Results of the Third Biennial National Organic Farmers Survey. Santa Cruz:Organic Farming Research Foundation. p. 80.
Wang, S., Just, D.R. and Pinstrup-Andersen, P. 2006. Damage from secondary pests and the needfor refuge in China. In: Just, R.E., Alston J.M. and Zilberman D. (eds.) Regulating AgriculturalBiotechnology: Economics and Policy. Springer
Williams, M.R. 1979–2006. Beltwide Cotton Crop Loss Data Archive. CooperativeExtension Service, Mississippi State University, Starkville, MS. http://www.msstate.edu/Entomology/Cotton.html.

Chapter 20Integrated Pest Management, Biofuels,and a New Green Revolution: A CaseStudy of the American Midwest
John H. Perkins
Abstract Agricultural pest control scientists in the American Midwest currentlywork in a context created by the intersection of three distinct threads of innovation:(1) practices that increased the yields of corn (also called maize, Zea mays L.),(2) new ways of controlling pests, and (3) the use of corn grain and other biomassto produce fuel ethanol. Public policies beginning in the 1970s and strengthening in2005 promoted the markets for fuel ethanol and thus generated higher average pricesfor corn producers. The higher prices combined with new insecticidal tools willencourage, under current circumstances, continued reliance on the chemical controlstrategy for insects attacking corn. Higher prices for corn will also encourage lessrotation of corn with soybean (Glycine max (L.) Merr.), which in turn will exac-erbate problems with corn rootworms. If production of ethanol from cellulose be-comes commercially feasible, Midwestern farmers will probably convert land fromcorn, soybean, conservation, and pasture to switchgrass (Panicaum virgatum L.)and Miscanthus, thus altering the biological landscape and producing pest controleffects that are hard to predict. Farmers currently have a minimal embrace of inte-grated pest management (IPM), and little suggests that embrace is likely to increasein the near future. As a result, Midwestern corn production remains vulnerable tolong-recognized problems with pesticides: resistance, induction of population shiftsof various species, and environmental risks. Pest control scientists working withinthe IPM strategy continue to have stimulating challenges in producing successfulIPM practices.
Keywords IPM · integrated pest management · ethanol · biofuels · switchgrass ·Panicum virgatum · Miscanthus · corn · Zea mays · maize · green revolution ·American midwest · midwest · cellulosic ethanol · Iowa · northern cornrootworm · western corn rootworm · European corn borer · Diabrotica virgiferavirgifera · Diabrotica barberi · Ostrinia nubilalis · corn stover
J.H. Perkins (B)The Evergreen State College, Olympia, WA 98505, USAe-mail: [email protected]
R. Peshin, A.K. Dhawan (eds.), Integrated Pest Management: Disseminationand Impact, DOI 10.1007/978-1-4020-8990-9 20,C© Springer Science+Business Media B.V. 2009
581

582 J.H. Perkins
20.1 Introduction
New technology and industry alter the landscape, sometimes profoundly. Interactingmultiple innovations can create even more startling changes. As an example, withinthe past decade three distinct areas of innovation have started to commingle theirrespective effects: (1) practices that increase the yields of corn (also called maize,Zea mays L.), (2) new ways of controlling pests, and (3) the use of corn grain andother biomass to produce ethanol as a fuel. The confluence of these three technolog-ical threads now stands poised to generate a multitude of changes in the patterns ofagriculture and pest control in the Midwestern section of the United States.
This chapter reviews the intersections of these three innovative threads and sug-gests the scope of potential problems. In the American Midwest, the confluence ofpest control issues, high yielding agriculture, and biofuels will bring new challengesfor IPM specialists.
20.2 Connecting IPM, Green Revolution, and Biomass Fuels
Fuels derived from biomass, known as “biofuels,” have sparked high interest amongmany people in the last 30–40 years. Generally four fundamental factors motivatethis enthusiasm:
� the need to reduce carbon emissions from fossil fuels to protect climate;� the desire to improve energy security by substituting locally produced fuels for
imports of oil and natural gas from politically volatile areas;� the fear that production rates of oil and gas have or soon will reach their respec-
tive maxima, thus triggering debilitating price increases; and� the desire of farmers and political leaders to expand economic demand for farm
products in order to improve farm income.
Yields of plant biomass (per hectare per year), however, constrain the potentialof biomass to serve as a replacement for fossil fuels. Yields in turn depend uponsolar radiation, genetic makeup of the plants, inputs such as fertilizer and water, andthe ability to control pests (insects and other animals, weeds, and diseases). Eagerinterest in biomass for fuel thus calls for research to maximize yields, minimizeinputs, and reduce pest damages.
As plant scientists succeed in raising yields of biomass crops, farmers will askpest control scientists to protect that yield with practical, economical, and environ-mentally acceptable methods of pest control. Integrated Pest Management (IPM) isthe pest control strategy most likely to yield successful methods.
Each of these three areas of science and technology originated in particularcircumstances and later changed to fit new situations. Understanding their respec-tive origins illuminates their confluence and the resulting new challenges in pestcontrol.

20 Integrated Pest Management, Biofuels, and a New Green Revolution 583
20.2.1 Integrated Pest Management
Integrated Pest Management (IPM) originated in California in the 1950s and 1960sas a strategy for controlling insect pests in agriculture. In its first form, IPM wascalled simply “integrated control,” and it sought synergistic suppression of pest in-sects with both biological control and insecticides (Perkins, 1982).
Subsequently entomologists outlined a more formal strategy based firmly on eco-logical theory and the study of population dynamics of pest and predatory/parasiticinsects. Even later, the concept of IPM moved into new pests (weeds, diseases),new geography (global), and new situations (forestry, urban pest control, animalhusbandry, and others).
The science of ecology supplied the theoretical underpinnings of IPM in its first,fully articulated form (Stern, et al., 1959). Three points defined the key elements ofthe strategy.
First, the pest control decision maker had to see a pest problem within an eco-logical framework. A pest species was one species among many on the landscape,and the interactions among different species and the physical environment governedthe growth of a pest’s population. People, too, had to be seen as one of the interact-ing species, because humans powerfully disrupted ecosystems and thus promotedgrowth of pest populations.
Second, the mere presence of a pest species did not in and of itself constitute a“pest problem.” A pest problem existed only when the pest species reached popu-lation levels sufficient to cause economic harm larger than the costs to control it.This population level was the economic injury level, and a somewhat lower levelwas the economic threshold, i.e. the level at which it became economically rationalto initiate control actions.
Third, Stern, et al. (1959) believed that experts, who understood the populationdynamics of pest species and their natural enemies, should guide decision making.IPM, in other words, was a strategy based on deep expertise, and only a skilledperson could know enough to identify the economic threshold and the proper action.Actions taken could involve many tactics, including biological control and insecti-cides, but the key was that together the strategies must lower the pest populationbelow the economic threshold.
Significantly, the original framers disavowed goals of eradicating pest popula-tions, i.e. taking the level to zero in an area so that the offending organism wouldnever have to be treated again (Perkins, 1982). Most had no moral objections toeradication, but they believed that in almost all situations eradication was simplyimpossible as a practical matter. Management, not eradication, was the defining goalfor IPM.
After its origins in the 1950s, the definition of IPM came to focus as much ormore on prevention of economic damage to farmers as it did on the respective popu-lations of insect pests and their natural enemies. In the United States, the Center forIntegrated Pest Management, funded jointly by the US National Science Foundationand a variety of allied agricultural industries, provides this current definition of IPM:

584 J.H. Perkins
Integrated Pest Management is the coordinated use of pest and environmental informationalong with available pest control methods, including cultural, biological, genetic and chem-ical methods, to prevent unacceptable levels of pest damage by the most economical means,and with the least possible hazard to people, property, and the environment (NSF Center forIntegrated Pest Management et al., 2008).
Hammond, et al. (2006) acknowledged the fluidity of the definition of IPM. Theynoted that it is immersed in a variety of ideological contexts: sometimes intended tomaximize grower profits, sometimes to reduce pesticide use and protect the environ-ment, and sometimes to place pest control on a firm scientific foundation (biologyof the pest and its populations). As a result of these shifting definitions and variedideologies, advocacy for “IPM” must always be accompanied by an explanation ofthe meaning of “IPM.”
At a minimum, development of IPM methods of pest control will focus on therespective population dynamics of the crop plant producing biomass and the variousother organisms that suppress its yields. At the same time, the economic aspects ofIPM and the potential for environmental contamination by pesticides will be impor-tant for the acceptability of IPM-based practices. In addition, IPM specialists willgenerally not seek eradication but instead focus on management.
20.2.2 Green Revolutions
“Green revolution” originally identified the creation of wheat and rice varieties thatresponded significantly to fertilizer and water, particularly in Asia. With time thewords symbolized more generally the ability to increase agricultural yields in manycrops in many areas (Evenson and Gollin, 2003). The prospect of using biomass toproduce biofuels thus immediately leads to questions about the feasibility of a greenrevolution in yields of biomass crops.
The original green revolution rested upon plant breeding and other sciences, buta careful examination of the history of high yielding wheat varieties indicates thatgreen revolution was simultaneously a political economic as well as scientific event(Perkins, 1997). Understanding the potential for green revolution in biomass forbiofuels likewise will involve grasping both the scientific and political economiccomponents.
The scientific component emerged as plant breeding in 1900 from GregorMendel’s particulate theory of inheritance. With Mendelism, scientists rapidly pro-duced new, stable varieties with desirable traits such as disease resistance and higheryields. By the 1940s, genetically improved food crops had started to replace tradi-tional varieties in some cases. Prominent examples include maize in parts of theUnited States and wheat in India and the United Kingdom (Perkins, 1997).
Until the 1940s, plant breeders worked on local problems in their own areas.World War II, the subsequent dissolution of the British Empire, and the Cold Warstimulated the United States government and American philanthropists to interna-tionalize plant breeding. Governments around the world embraced plant breeding asa science that promoted the strength and stability of nation states (Perkins, 1997).

20 Integrated Pest Management, Biofuels, and a New Green Revolution 585
Both scientists and germ plasm began to flow across national borders on a scalenever before seen (Evenson and Gollin, 2003).
Corn is not typically included among the crop plants participating in the greenrevolution, because traditionally the term referred only to wheat and rice. Neverthe-less, plant breeders had some of their first successes with corn. Starting in 1900, theylearned how to mate parents of different desirable traits and, in the offspring, findnew plants that carried the traits of both parents. Breeders sought increased yieldsand to make the crop more uniform for increasingly mechanized production. Hybridcorn was a major advance.
Plant breeders now routinely collaborate on a global scale in the improvementof plant varieties and the preservation of genetic diversity, the raw materials forbreeding projects. After 1980, Mendelian-based plant breeding linked with newmethods of molecular genetics, genetic engineering, and genomics to vastly expandits powers.
Proponents of biomass production for biofuels call upon science and the supportof governments to increase the yield potentials of biomass crops. Consider for ex-ample, Norman Borlaug’s plea for a continuation and expansion of government andprivate support of this scientific work (Borlaug, 2007). He sees the need for biofuelsas well as larger amounts of food and fiber. Borlaug’s call resonates with the originalgreen revolution, because he was the plant pathologist turned plant breeder whowon the Nobel Peace Prize in 1970 for developing high yielding varieties of wheatin Mexico, facilitating their transfer to India and Pakistan, and promoting the greenrevolution globally in wheat and rice (Perkins, 1997).
A successful green revolution in biomass for biofuels will call for pestmanagement measures to protect these yields. Pest control scientists must play anessential supportive role in maximizing the acceptability of such biomass productionschemes. Either loss of yield or disastrous overuse of pesticides will diminish or endthe acceptability of any such biomass production schemes. IPM in turn promises tobe the best strategy for creating successful, acceptable pest control methods.
20.2.3 Biofuels
Extensive use of biofuels may date to an early event in human evolution. Wrangham(2008) speculates that the emergence of Homo erectus from Homo habilis about 1.6million years ago was dependent upon the ability of H. erectus to control fire forcooking and protection from predatory animals.
Significantly, Wrangham argues that H. erectus was recognizably human butH. habilis was still an ape-like primate that did not eat cooked food. If this specula-tion gains acceptance in the scientific community, it suggests that use of wood andother plant materials as biofuels is an intrinsic and ancient defining human character.
Wood and other plant-derived biofuels continued for millennia to be the mostimportant fuel until the 18th century when it started to lose ground to, successively,coal, oil, and natural gas, the fossil fuels now supplying the vast majority of global

586 J.H. Perkins
energy supplies. Biofuels, however, continue to supply the majority of energy tosome pre-industrial peoples.
New proposals for replacing fossil fuels with biomass, however, require signifi-cant innovation. Most center not on simple reversions to wood and other plant ma-terials for fire, even though direct combustion provides one route for tapping theenergy in biofuels. Instead they envision transforming massive amounts of biomassinto liquid and gaseous fuels on a scale never envisioned by H. erectus or pre-industrial H. sapiens.
Proponents visualize industrial production systems to grow a variety of plantspecies in high volumes, elaborate thermochemical and/or biological processing fac-tories to transform them to biofuels and other valuable byproducts, and transmissionsystems to carry the energy potential to widely dispersed consumers.
20.2.4 IPM, Green Revolution, and Biofuels Connectin the American Midwest
The American Midwest—generally considered as the states of Illinois, Indiana,Iowa, Kansas, Michigan, Minnesota, Missouri, Nebraska, North Dakota, Ohio,South Dakota, and Wisconsin (Fig. 20.1)—forms one of the world’s largest, un-interrupted swaths of land containing rich agricultural soils and adequate rainfall.Originally occupied by a number of Native American nations, the land fell undercontrol of the United States in the 19th century. Its agricultural productivity in turn
Fig. 20.1 Midwestern States of the United StatesSource: Iowa Public Television, accessed at http://www.iptv.org/bestofthemidwest/mappopupmidwest.cfm on 4 May 2008. Used by permission.

20 Integrated Pest Management, Biofuels, and a New Green Revolution 587
became a foundation for American prosperity and food security, a condition thatcontinues to this day.
American settlement of the area was rapid after 1865, and the new arrivalschanged the landscape profoundly. The original biogeography was forests andmixed forests-grasslands in the eastern sections and primarily grassland savannahsin the western region. Almost all of this native vegetation was removed by the 1920s,and corn occupied more land than any other single grain crop. In the first half of the20th century, corn was rotated with wheat, oats, and other crops, but by the last halfof the century the dominant rotation was corn with soybean.
High yielding production methods interacted with new pest control methods.Yields increased steadily after 1925 as farmers increasingly used ever cheaper ni-trogen fertilizer and new corn varieties, including hybrids. New synthetic pesticidesprovided a vast new tool box of pest suppression techniques after 1945. IPM startedto make inroads in the 1970s. Plant breeders and pest control scientists grew ac-customed to interacting with each other and with their farmer clients, and until1978 these two tracks of innovation generated the major changes in Midwesternagriculture.
Declines in imports of oil from the Middle East in the 1970s ultimately generateda third thread of innovation that today stands poised to dramatically alter the agri-cultural landscape of the Midwest. In response to shortages of oil supplies, the USCongress exempted gasoline containing ethanol from the federal fuel excise tax in1978. This new policy fulfilled its intended purpose of stimulating the developmentof a new biofuel industry: production of ethanol from corn to substitute for gasoline.
Corn-based ethanol production, however, remained a slow-growing, minor in-dustry without much affect on the agricultural industries until about 2002. Use ofethanol as an additive to make gasoline burn with less formation of carbon monox-ide stimulated higher levels of production after that year. Further jitters about thesecurity of imported oil supplies increased after the American invasion of Iraq in2003, and ethanol’s popularity expanded dramatically.
In 2005, Congress mandated that Americans use 7.5 billion gallons (28.4 billionliters) of ethanol by 2012. President Bush noted in his 2006 State of the Unionaddress that America was addicted to oil; in 2007 he increased the target for ethanolconsumption substantially: “. . . we must increase the supply of alternative fuels, bysetting a mandatory fuels standard to require 35 billion gallons (133 billion liters)of renewable and alternative fuels in 2017” (Bush, 2007).
Identification of ethanol as a strategic resource opened the floodgates for newinnovation. Ethanol from corn grain was already a commercial industry, and thegrowth of distilleries after 2006 steadily generated higher prices for corn grain. Atthe same time, mandates for mixing ethanol with gasoline stimulated a vast increasein efforts to make ethanol from the cellulose of corn residues, wheat and barleyresidues, wood residues, and municipal solid waste. “Cellulosic ethanol” promisedever more plentiful supplies that could eclipse grain-based ethanol. For the Mid-west, proposals suggested that high yielding grasses such as switchgrass (Panicumvirgatum L.) and Miscanthus could become new crops feeding cellulosic ethanolproduction.
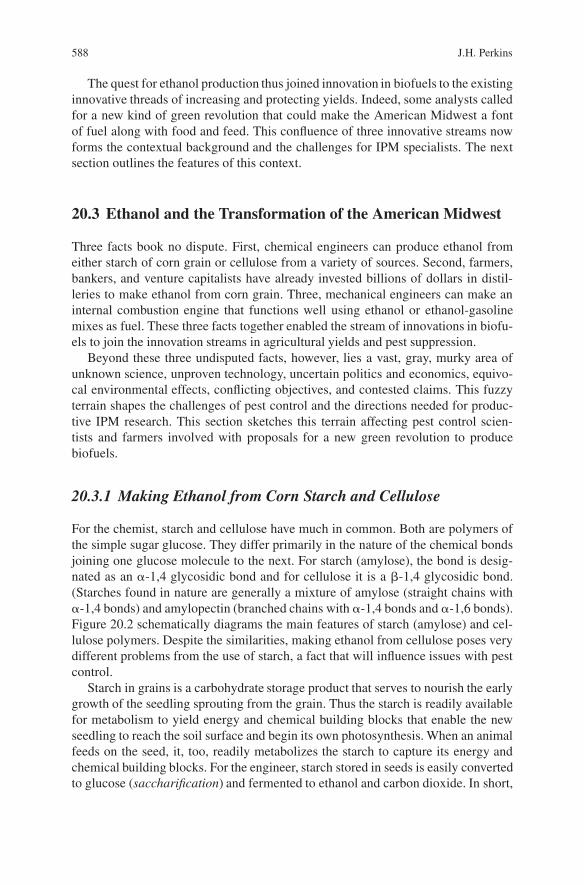
588 J.H. Perkins
The quest for ethanol production thus joined innovation in biofuels to the existinginnovative threads of increasing and protecting yields. Indeed, some analysts calledfor a new kind of green revolution that could make the American Midwest a fontof fuel along with food and feed. This confluence of three innovative streams nowforms the contextual background and the challenges for IPM specialists. The nextsection outlines the features of this context.
20.3 Ethanol and the Transformation of the American Midwest
Three facts book no dispute. First, chemical engineers can produce ethanol fromeither starch of corn grain or cellulose from a variety of sources. Second, farmers,bankers, and venture capitalists have already invested billions of dollars in distil-leries to make ethanol from corn grain. Three, mechanical engineers can make aninternal combustion engine that functions well using ethanol or ethanol-gasolinemixes as fuel. These three facts together enabled the stream of innovations in biofu-els to join the innovation streams in agricultural yields and pest suppression.
Beyond these three undisputed facts, however, lies a vast, gray, murky area ofunknown science, unproven technology, uncertain politics and economics, equivo-cal environmental effects, conflicting objectives, and contested claims. This fuzzyterrain shapes the challenges of pest control and the directions needed for produc-tive IPM research. This section sketches this terrain affecting pest control scien-tists and farmers involved with proposals for a new green revolution to producebiofuels.
20.3.1 Making Ethanol from Corn Starch and Cellulose
For the chemist, starch and cellulose have much in common. Both are polymers ofthe simple sugar glucose. They differ primarily in the nature of the chemical bondsjoining one glucose molecule to the next. For starch (amylose), the bond is desig-nated as an �-1,4 glycosidic bond and for cellulose it is a �-1,4 glycosidic bond.(Starches found in nature are generally a mixture of amylose (straight chains with�-1,4 bonds) and amylopectin (branched chains with �-1,4 bonds and �-1,6 bonds).Figure 20.2 schematically diagrams the main features of starch (amylose) and cel-lulose polymers. Despite the similarities, making ethanol from cellulose poses verydifferent problems from the use of starch, a fact that will influence issues with pestcontrol.
Starch in grains is a carbohydrate storage product that serves to nourish the earlygrowth of the seedling sprouting from the grain. Thus the starch is readily availablefor metabolism to yield energy and chemical building blocks that enable the newseedling to reach the soil surface and begin its own photosynthesis. When an animalfeeds on the seed, it, too, readily metabolizes the starch to capture its energy andchemical building blocks. For the engineer, starch stored in seeds is easily convertedto glucose (saccharification) and fermented to ethanol and carbon dioxide. In short,

20 Integrated Pest Management, Biofuels, and a New Green Revolution 589
Starch: a polymer of glucose with α-1,4 glycosidic bonds
Cellulose: a polymer of glucose with β-1,4 glycosidic bonds
Fig. 20.2 Sketches of the molecular structure of starch and cellulose, two polymers of glucoseSource: New Zealand Electronic Text Centre (http://www.nzetc.org/tm/scholarly/Bio14Tuat01-fig-Bio14Tuat01 036c.html, and http://www.nzetc.org/etexts/Bio14Tuat01/Bio14Tuat01 036b.jpg,accessed 1 May 2008.
making ethanol fuel from starch is almost as easy as making beer, something peoplehave known how to do for a very long time.
Cellulose, in contrast to starch, poses many more challenges. First, cellulose,found in cell walls, does not appear in a readily available form. Typically it ap-pears with two other classes of polymers: hemicelluloses and lignins. In its rawform, the material appears as “lignocellulose,” a complex interweaving of cellu-lose, hemicellulose, and lignin. To make ethanol, therefore, the trick is to obtain thecellulose freed of lignin. Hemicellulose can in theory also be turned into alcohol,but the saccharification and fermentation of the five-carbon sugars of hemicelluloserequires different steps from the saccharification and fermentation of the mixture ofsix-carbon glucose of cellulose. The durability of wood, one of the most plentifullignocelluloses on earth, attests to the challenges engineers face in making cellulosicethanol.
For pest control, distinctions between making ethanol from starch and from cel-lulose will affect pest management primarily through two means: alteration of theharvested material and changing prices. IPM development must recognize these po-tential changes.
20.3.2 Ethanol from Corn Starch has Already Alteredthe Midwestern Corn-Soybean Belt
Corn (known also as maize or Zea mays L.) probably originated in the tropics ofCentral America and Mexico, and it does not tolerate freezing temperatures. Tax-onomists place it in the Family Gramineae (Poaceae), the grasses. Farmers plantcorn on an annual basis in the Spring, and harvest follows about 5–6 months later.
Native Americans successfully selected useful varieties and spread them fromsouthern Canada to southern South America and the Caribbean basin. They reliedheavily on the food production capacity of corn, and the European and African

590 J.H. Perkins
newcomers after 1492 quickly adopted this New World crop. European expansionsubsequently spread the plant globally.
One of the reasons for corn’s economic importance stems from its C4 photo-synthesis. The C4 pathway is one of three known biochemical pathways by whichplants can reduce atmospheric carbon dioxide to sugars. C4 was the latest pathwayto evolve, and it occurs in 7000–8000 species, about 3 percent of all plant species.Nevertheless the C4 plants produce 20–25 percent of the global primary productiv-ity. Corn as a C4 plant is highly efficient at photosynthesizing when temperaturesare warm (> 25 ◦C), especially in drier climates (Sage, 2005).
Along with wheat and rice, corn now occupies a central place in the agriculturalbounty that sustains human life. In the United States, corn occupies about 80 millionacres (32.4 million ha), more than 25 percent of the arable land and more than anyother single crop plant. US farmers derive more than 10 percent of total farm incomefrom it as they haul about eleven billion bushels (279 million metric tons) of cornfrom their fields each year. In 2005 it brought in $21 billion to US farmers.
Soybean (Glycine max (L.) Merr.) from East Asia joined with corn in the 20thcentury to create the modern Midwest (Smith, H., 1906; Piper, 1919; Smith, W.,1920). By 1939 farmers were planting 9 million acres (3.6 million ha) in soybean(U.S. Department of Agriculture, 1940), a 180-fold increase in thirty years. Thisacreage continued to grow to today’s levels of over 70 million acres (28 millionha). Soybean is the number two crop in earnings, about $17 billion per year (U.S.Department of Agriculture, 2006a). They became the companion crop to corn after1950, and what was formerly called the “Corn Belt” more accurately should now becalled the “Corn-Soybean Belt.”
Over most of the Midwest corn follows soybean in an annual rotation. Bothcrops yield better after the other compared to after themselves (Hoeft, et al., 2000;Lowenberg-DeBoer and Erickson,. 2005). The cornucopia of Midwestern cornand soybean powers the livestock industries of the United States, Japan, and theEuropean Union, and increasingly some see it as a producer of fuel: ethanol fromcorn and biodiesel from soybean oil. Three developments between 1900 and 1950industrialized the Corn-Soybean Belt as the most prolific agricultural area of theentire world.
First, hybrid corn increased yields substantially. Double-cross hybrids first ap-peared in the 1920s, and by 1950 these varieties dominated the Midwest. After thelate 1960s, single-cross hybrids replaced the double-cross varieties, a situation thatcontinues to this day (Troyer and Good, 2005). The American corn crop progres-sively increased its yields every year, a process continuing even today at about 3.4more bushels per acre (211 kg/ha) each year. In 1920, the average yield of Americancorn was 29.9 bushels per acre (1854 kg/ha). This rose to 54.7 bushels per acre(3391 kg/ha) in 1960 and in 2005, the average yield was 148 bushels (9176 kg/ha).It was 151.1 bushels per acre (9368 kg/ha) in 2007 (U.S. Department of Agriculture,National Agricultural Statistics Service, 2008). Some growers think that 300 bushelsper acre (18,600 kg/ha) are likely in some areas in the not too distant future (Couser,2006).
Second, nitrogen fertilizer feeds the plant and enables very high yields. Before1908, virtually all nitrogen came from nitrogen-fixing bacteria living in the soil or

20 Integrated Pest Management, Biofuels, and a New Green Revolution 591
in combination with legumes like peas, beans, and clover. In that year, two Germanchemists, Fritz Haber and Carl Bosch, learned how to make ammonia from hydrogenand nitrogen. Cheap nitrogen fertilizer moved into agriculture in increasingly largeamounts (Smil, 1999).
American farmers used a total of about 2.7 million tons of fertilizer in 1900,but this amount doubled by about 1922, doubled again by 1942, doubled again by1951, and yet again by 1970 (U.S. Bureau of the Census, 1976). Fertilizer, soybeanrotations, and hybrid seed enabled yields of corn to rise steadily.
Third, full industrialization came in with the tractor after 1920. Mules and horses,valuable as they were, could never match the speed and power of motorized tractorsand combines. With mechanization, a very few people could produce enormousyields. Farmers became fewer in number, worked increasingly larger farms, andsought specialization as cash grain producers in order to survive economically.
Even with large foreign markets for their grain, American corn farmers producedincreasing amounts of grain and prices stagnated. As a result, they were alwaysinterested in any idea for new uses of corn. In the 1970s, war and turmoil in theMiddle East, plus other factors, triggered a cascade of events and made ethanol anidea hard to ignore.
Currently (2008), the United States has 134 distilleries with a total capacityof 7.2 billion gallons (27.3 billion liters) per year of fuel-grade ethanol. In 2007,US producers made 6.5 billion gallons (24.6 billion liters) of ethanol, up from4.9 billion gallons (18.5 billion liters) in 2006. These massive installations, ownedby farmer-led investors and by non-farm entrepreneurs and corn-processing firms,have an average capacity of 54 million gallons per year. Farmers own 49 (37 per-cent) of these plants and 28 percent of the total capacity. Corn processors andother investors own the rest (Renewable Fuels Association, 2008 (some figurescalculated)).
The U.S. Department of Agriculture estimates that ethanol production used about20 percent of the US corn crop in 2005–2006, or approximately 2.2 billion bushels(56 million metric tons). The Department projects that ethanol will take approx-imately 5.4 billion bushels (137 million metric tons) or 37 percent of the cornproduction in 2016 (U.S. Department of Agriculture, Economic Research Service,2007; Westcott, 2008, has estimates that are slightly lower).
Current methods of distilling corn-based ethanol—according to most but not allanalysts—produces energy somewhat in excess of the fossil fuel energy used toproduce the corn and run the distillery; some argue that the ethanol has even lessenergy than is used in its production (Shapouri, et al., 2002; Pimentel and Patzek,2005; Farrell, et al., 2006; Hill, et al., 2006; Hammerschlag, 2006). Similarly someanalysts have concluded that use of corn-based ethanol compared to gasoline pro-vides a slight reduction in emissions of carbon dioxide (Farrell, et al., 2006).
More recent work, however, argues that land use changes needed to producebiofuels is very likely to result in more greenhouse gas emissions than simply us-ing gasoline. Switching cropland used to grow food and feed to producing biofuelsstimulates conversion of land elsewhere from forest or permanent grassland with aconsequent loss of carbon storage. The net effect is an increase in release of carbondioxide (Searchinger, et al., 2008).

592 J.H. Perkins
20.3.3 Cellulosic Ethanol: The Potential for Corn Stover,Switchgrass, and Miscanthus
Ethanol fuel today (2008) comes primarily from the starch in corn grain, but the realprize if ethanol is to be a major substitute for gasoline lies in a technology not yetproven for large-scale, commercial production. In early 2007, the U.S. Departmentof Energy awarded up to $385 million to six different companies. Each seeks todemonstrate production of cellulosic ethanol on a significant scale, and each willuse a different production system (U.S. Department of Energy, 2007). Based onconstruction schedules, most of these new plants may be in operation by 2009–2010.At that time, the future of cellulosic ethanol may become much clearer than itis now.
Despite the uncertainty of cellulosic ethanol’s economic practicality, chemicalengineers and agronomists have already invested considerable effort in studyingpotential sources of lignocellulose as feedstock for presumptive cellulosic ethanolproduction plants. Wood residues, municipal solid waste, and agricultural residuescan each potentially yield the raw materials needed.
Various global estimates suggest that agricultural biomass residues provide highlysignificant sources of lignocellulose, ranging from <50 EJ per year to >300 EJper year. Currently about 365 EJ per year come from oil, gas, coal, nuclear, andhydropower (Berndes, et al., 2003). Lal (2005) estimates that in 2001 the U.S. pro-duced 488 Mg per year of crop residues with an energy value of 9.1 EJ per year, andglobal crop residues of 3758 Mg per year have an energy value of 69.9 EJ per year. Astudy at the Oak Ridge National Laboratory (U.S. Department of Agriculture, 2005)estimated that agricultural lands could produce 998 Mg of removable biomass peryear while forest lands could produce an additional 368 Mg per year.
Corn stover (above-ground residues of corn after the grain is harvested), switch-grass (Panicum virgatum L.) and Miscanthus currently occupy the center of re-search attention as Midwestern sources of biomass. For pest control, increasedhigh-intensity production of one or more may alter the living landscape in waysthat scientists cannot yet predict. This section outlines the main features of biomassproduction potential and likely agronomic and pest control consequences of inten-sive production of these three crops.
20.3.3.1 Corn Stover
“Field corn,” i.e. corn grown for grain that will be used as feed for livestock, dom-inates the Midwest. Small amounts of field corn move into the direct human foodsupply as flour for corn bread, tortillas, and other processed products. Similarly,farmers produce small amounts of popcorn and sweet corn. Some farmers, particu-larly in states like Wisconsin, produce corn for dairy animals, and in this case virtu-ally the entire above-ground plant is chopped and fermented as silage (Massey andHorner, 2003). In all cases except corn grown for silage, the above-ground residueleft after harvest of the grain is stover and potentially available as a lignocellulosefeedstock for ethanol production.

20 Integrated Pest Management, Biofuels, and a New Green Revolution 593
Soils in the Midwest are naturally deep, fertile, and well watered by rain. Naturalfertility notwithstanding, American farmers in 2005 typically added 138 pounds peracre (155 kg/ha) of nitrogen, 58 pounds per acre (65 kg/ha) of phosphate, and 84pounds per acre (94 kg/ha) of potash (U.S. Department of Agriculture, 2006b; fig-ures are for corn in all surveyed States; application rates vary from State to State). Insome areas, additional micronutrients and limestone to adjust pH complete the soilamendments. In the drier, westerly parts of the Midwest, farmers may also irrigateto supplement the scarcer rainfall.
Grain yields, the only yield of interest up to now, reached 160.4 bushels peracre (9945 kg/ha), the highest average ever achieved in the U.S., in 2004 (U.S.Department of Agriculture, National Agricultural Statistics Service, 2008). As notedabove, the average yield in 2007 was 151.1 bushels per acre (9368 kg/ha). With thenew potential for cellulosic ethanol production, however, yield consists of two parts:grain and the above-ground stover. Modern field corn varieties typically apportiontheir photosynthetic product so that the ratio of stover to grain may range from0.55 to 1.50. Several authors estimate that grain and stover occur in equal amounts,i.e. the stover/grain ratio = 1 (Lal, 2005). When grain is the only objective, thestover is “waste.”
Cellulosic ethanol production proposes to remove some, most, or all stover asfeedstock, thus turning a “waste” product into a valuable part of production. Lal(2005) estimates that stover residues amount to 241.5 Mg per year, or 49 percentof the U.S. total supply of lignocellulose (2001 crop year). Conversion of lig-nocellulose to ethanol may yield 330–380 liters per metric ton (Morrow, et al.,2006).
Production of ethanol from stover, however, may pose challenges for both soilscientists and pest control scientists. Maintenance of soil fertility and control oferosion both depend upon the plant residues left after the harvest. Sloping fieldsespecially may suffer unsustainable rates of soil erosion from wind and water iftoo much stover leaves the field for the ethanol plant. Similarly, the carbon-residuesin stover and the root systems strongly affect the fertility of the soil, its microbialpopulations, its water-holding capacity, and its ability to support the succeeding cropas a population of strong, healthy plants (McLaughlin and Walsh, 1998). Removal ofstover may thus alter conditions in ways that change populations of pest organisms.In a word, plant residues are not simply “waste” in an agronomic and ecologicalframework.
20.3.3.2 Switchgrass
Switchgrass (Panicum virgatum L.) is a native prairie grass of North America. Itsrange stretches from 55◦ North in Canada southward into central Mexico, east ofthe Rocky Mountains. Classified in the Family Gramineae (Poaceae), SubfamilyPanicoideae, switchgrass has variable tolerance to cold. With gradual cold harden-ing, strains adapted to northerly latitudes can tolerate −18 ◦C, but more southerlyvarieties cannot. Tolerance of different levels of soil moisture (lowland and upland)distinguishes other varieties (Lewandowski, et al., 2003).

594 J.H. Perkins
A native plant to the tall grass prairies, agronomists and range scientists inte-grated switchgrass into commercial agriculture in the mid-20th century. Farmersin central and eastern states appreciate its continued productivity as a forage cropduring hot summer months. Once planted, farmers allow one year for the stand toestablish, and harvest can commence in the second year. Three varieties alreadyappear to be particularly suitable for biomass production for energy: ‘Alamo’ inthe south, ‘Kanlow’ in the central latitudes, and ‘Cave-in-rock’ for the north. Onceestablished, the stand will be productive for a decade or longer (Lewandowski, et al.,2003).
Switchgrass, like corn, is a C4 plant, which makes it comparatively efficient inwarm, dry conditions. In contrast to corn, however, switchgrass produces well onlower quality soils. Stand establishment requires care and precision in soil prepara-tion, seed preparation to break dormancy, seed placement, and weed control. Onceestablished, the plant produces above-ground leaves and tillers higher than 3 meters;below-ground roots extend to 3.5 meters, and the grass also produces rhizomes.
The plant produces maximum yields after 3 years of growth, and those max-ima are reached by 1 September each year. Farmers can harvest one time or twiceper year, but most experiments on biomass production emphasize one time. If thefarmer delays harvest, the yield decreases partly as a result of in-field drying andpartly as a result of leaf loss. Delayed harvest, however, also generally allows theplant time to move mineral nutrients from the above-ground parts of the plant tothe below-ground organs. This translocation of minerals improves the quality of thebiomass sent for energy processing and saves on the need for fertilizer applications(Lewandowski, et al., 2003; Heaton, et al., 2004).
An analysis of peer-reviewed literature on switchgrass showed that switchgrasscan produce an average of 10.3(±0.7) Mg per hectare per year (1 Mg = 1 met-ric ton) (Heaton, et al., 2004). Variability, however, was high and ranged fromover 34 Mg with ‘Alamo’ in Alabama to about 5 Mg with ‘Cave-in-rock’ in Texas(Lewandowski, et al., 2003). Switchgrass requires 50–100 kg per hectare per year ofnitrogen for good yields, but on most sites it produces little extra yield above 70 kgper hectare per year (Lewandowski, et al., 2003). Water supply (rain) and degreegrowing days seem to have little influence on switchgrass yields (Heaton, et al.,2004).
The above studies were primarily small scale and not performed by farmersoperating under commercial conditions. More recently, researchers from Nebraskareported yields, production costs, and net energy yields for switchgrass grown un-der quasi-commercial conditions for biomass fuel by farmers located from northernNorth Dakota to southern Nebraska. They concluded that average yields of 5 Mg perhectare were easily achievable at a cost of about $50 per Mg. Assuming a conversionto ethanol at 380 liters per Mg, this biomass had an average cost of about $0.13 perliter. Average net energy yields were 60 GJ per hectare per year (Perrin, et al., 2008;Schmer, et al., 2008).
Cultivated switchgrass has some vulnerability to pests. Propagation is by seeding,and weeds can severely interfere. The year before planting, fields need plowing,and several herbicides can control broadleaf weeds. During the first year’s growth,mowing at 6–9 cm can help the switchgrass outgrow the weeds. Even with extensive
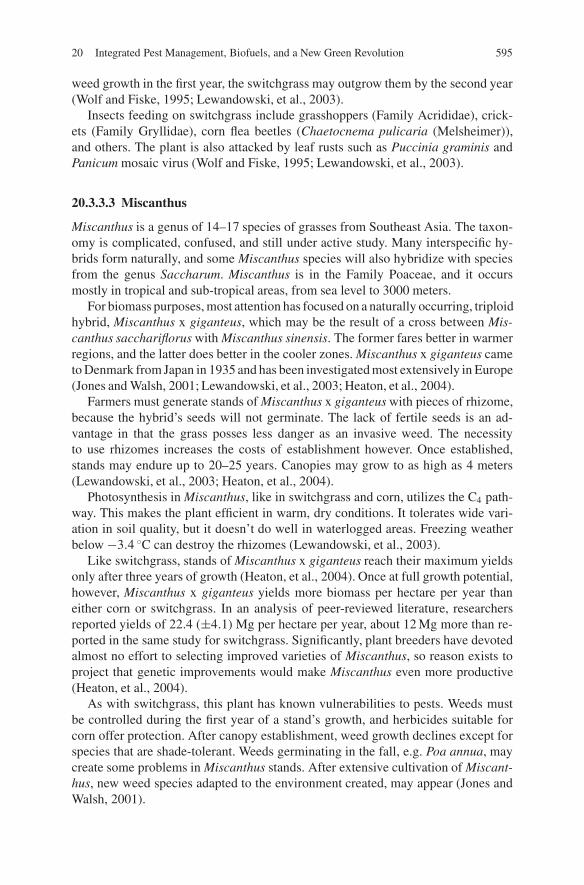
20 Integrated Pest Management, Biofuels, and a New Green Revolution 595
weed growth in the first year, the switchgrass may outgrow them by the second year(Wolf and Fiske, 1995; Lewandowski, et al., 2003).
Insects feeding on switchgrass include grasshoppers (Family Acrididae), crick-ets (Family Gryllidae), corn flea beetles (Chaetocnema pulicaria (Melsheimer)),and others. The plant is also attacked by leaf rusts such as Puccinia graminis andPanicum mosaic virus (Wolf and Fiske, 1995; Lewandowski, et al., 2003).
20.3.3.3 Miscanthus
Miscanthus is a genus of 14–17 species of grasses from Southeast Asia. The taxon-omy is complicated, confused, and still under active study. Many interspecific hy-brids form naturally, and some Miscanthus species will also hybridize with speciesfrom the genus Saccharum. Miscanthus is in the Family Poaceae, and it occursmostly in tropical and sub-tropical areas, from sea level to 3000 meters.
For biomass purposes, most attention has focused on a naturally occurring, triploidhybrid, Miscanthus x giganteus, which may be the result of a cross between Mis-canthus sacchariflorus with Miscanthus sinensis. The former fares better in warmerregions, and the latter does better in the cooler zones. Miscanthus x giganteus cameto Denmark from Japan in 1935 and has been investigated most extensively in Europe(Jones and Walsh, 2001; Lewandowski, et al., 2003; Heaton, et al., 2004).
Farmers must generate stands of Miscanthus x giganteus with pieces of rhizome,because the hybrid’s seeds will not germinate. The lack of fertile seeds is an ad-vantage in that the grass posses less danger as an invasive weed. The necessityto use rhizomes increases the costs of establishment however. Once established,stands may endure up to 20–25 years. Canopies may grow to as high as 4 meters(Lewandowski, et al., 2003; Heaton, et al., 2004).
Photosynthesis in Miscanthus, like in switchgrass and corn, utilizes the C4 path-way. This makes the plant efficient in warm, dry conditions. It tolerates wide vari-ation in soil quality, but it doesn’t do well in waterlogged areas. Freezing weatherbelow −3.4 ◦C can destroy the rhizomes (Lewandowski, et al., 2003).
Like switchgrass, stands of Miscanthus x giganteus reach their maximum yieldsonly after three years of growth (Heaton, et al., 2004). Once at full growth potential,however, Miscanthus x giganteus yields more biomass per hectare per year thaneither corn or switchgrass. In an analysis of peer-reviewed literature, researchersreported yields of 22.4 (±4.1) Mg per hectare per year, about 12 Mg more than re-ported in the same study for switchgrass. Significantly, plant breeders have devotedalmost no effort to selecting improved varieties of Miscanthus, so reason exists toproject that genetic improvements would make Miscanthus even more productive(Heaton, et al., 2004).
As with switchgrass, this plant has known vulnerabilities to pests. Weeds mustbe controlled during the first year of a stand’s growth, and herbicides suitable forcorn offer protection. After canopy establishment, weed growth declines except forspecies that are shade-tolerant. Weeds germinating in the fall, e.g. Poa annua, maycreate some problems in Miscanthus stands. After extensive cultivation of Miscant-hus, new weed species adapted to the environment created, may appear (Jones andWalsh, 2001).

596 J.H. Perkins
Current literature indicates no significant diseases, but Miscanthus is susceptibleto Fusarium (noted in Ireland), Barley Yellow Dwarf virus (noted in the United King-dom), streak virus (noted in Japan), and Miscanthus blight (noted in the USA) (Jonesand Walsh, 2001). The most thorough monograph on Miscanthus has no informationon insects attacking the grass, nor does the book even list “insect” as a term in theindex (Jones and Walsh, 2001). Thus current evidence suggests that, at least for now,insects will not be a serious problem in the suppression of Miscanthus yields.
20.3.4 Harvesting, Processing, and the Socio-Cultural Context
For the last half of the 20th century, the American Midwest was primarily a corn-soybean belt based on its two dominant crops. Other crops such as alfalfa, wheat,and oats occupied some land, but most was given to corn and soybean grown inannual rotation. Pest control problems, accordingly, consisted mostly of controllingthe insects, weeds, and plant pathogens that attacked corn and/or soybean. As ex-plained in more detail below, most pesticides used were for controlling weeds andinsects attacking these two crops.
Ethanol, particularly the promise of cellulosic ethanol, may lead to major shiftsin the biology, economics, and politics of pest control in the Midwest. Instead ofbeing the “Corn-Soybean Belt” of America, it may need to be thought of as the“Corn-Soybean-Switchgrass-Miscanthus Belt.” Both the land use of the Midwestand the economic value of crops may shift. With shifts in land use and the adventof new crops like switchgrass and Miscanthus will potentially come new populationdynamics of insect, weed, and plant pathogen pests.
Use of corn stover as a feedstock for cellulosic ethanol will add a clearly definedeconomic value to plant residues that currently don’t have monetary value, even ifthey have agronomic and ecological value. With alteration of the value of the cornplant will come a different calculus of the economic threshold for taking controlactions. In addition, if ethanol production in general drives prices of all biomass up,a new calculus of the economic threshold will appear.
In short, the prospect of increasing ethanol production from biomass raised in theMidwest is not just a matter for farmers and economists to sort through. Pest controlscientists, too, will find that the challenges they face in protecting biomass havechanged. The next section provides a brief overview of how IPM may be affected.
20.4 Pest Control, IPM, and Ethanolin the New American Midwest
20.4.1 Current Profile of Pest Control Practices and IPM
Two factors will be most important in shaping the agricultural landscape of theAmerican Midwest. First, public policies that promote ethanol as a substitute forgasoline will encourage production of corn and, possibly, of cellulosic biomass.

20 Integrated Pest Management, Biofuels, and a New Green Revolution 597
Second, new technology for making cellulosic ethanol, currently under develop-ment, may promote production of corn stover, switchgrass, and Miscanthus, evenif public policies no longer subsidize and mandate the use of ethanol as a gasolinesubstitute. IPM specialists must follow the course of these two factors in order tounderstand the challenges they will face in controlling pests on corn, switchgrass,and Miscanthus.
The preceding sections demonstrated that changes in technology and public pol-icy have already altered the agricultural landscape of the American Midwest. Evenwithout the advent of ethanol, yield enhancing practices have increased and willcontinue to increase yields, particularly of corn. With corn-derived ethanol, evenhigher price incentives encourage farmers to increase yields of corn per hectare andto plant more hectares of corn.
If cellulosic ethanol becomes economically and technologically practical, farm-ers will have incentives to harvest corn stover and to plant and harvest switchgrassand Miscanthus. Land for more corn and for the latter two crops may come fromland currently devoted to soybean or to the Conservation Reserve Program or topastures (Perrin, et al., 2008). Land coming from soybean to corn will diminish thecurrent practice of rotating corn with soybean on an annual basis.
Thus the broad features of the new landscape in the American Midwest willinclude less land devoted to soybean and to conservation and more land devoted tocorn, switchgrass, and Miscanthus. Figure 20.3 summarizes the possible changesinduced by new yield enhancing practices and by changes in biofuels. Changes willalmost certainly alter pest pressures and the need for new pest control and IPMpractices. While it is impossible to predict all of the consequences for pest control, itis possible to examine current pest control practices and suggest the likely directionsof change.
Unfortunately, the current status of IPM in the American Midwest does not augerwell for the vitality of IPM in a “new Midwest” that has been transformed by a greenrevolution for biofuels production. Pest control scientists working on corn embracedIPM by the mid-1970s (National Research Council, 1975). Despite over 30 years ofadditional research on IPM practices, however, scientists still lament that adoption
Public policies
promote ethanol
Current agricultural
practices&
pest-control situation
More corn-on-corn;less soybean
Pest control moreeconomically
important
Pasture and ConservationReserve Program
land to switchgrassand Miscanthus
New kinds of pest control
situations
Corn stover, switchgrass, & Miscanthus harvest
increases
“Normal” new yield
enhancing technology
Cellulosic ethanol
becomes cost competitive
Fig. 20.3 Flow chart for possible developments in a new Midwestern landscape stimulated by newproduction practices and by developments in biofuels (Figure prepared by Brendan Lazarus)

598 J.H. Perkins
of IPM by corn growers “. . . has been weak at best, which leads to the question:‘why?”’ (Hammond, et al., 2006). A survey of Wisconsin farmers suggested thatthe answers depended upon the size of operation and the kind of farm. Large farms(compared to small) and cash-grain farms (compared to dairy) had higher adoptionrates of IPM practices (Hammond, et al., 2006).
As Hammond, et al., (2006) note, IPM has clearly not dislodged heavy depen-dence upon pesticides. Thus the problems initially stimulating the development ofIPM (resistance to pesticides and pest population resurgence) (Perkins, 1982) stillhave an opportunity to once again cause problems. A case-study examines the situ-ation with insects attacking corn.
20.4.2 Case Study: Shifting Insect Problems on Corn
Shifting insect-control practices on corn demonstrate the complexities of IPM devel-opment now, and the advent of more ethanol production will increase the challengesfaced by pest control scientists. The case study emphasizes Iowa from the period ofthe mid-1990s to the present.
In 1997, Iowa farmers planted about 15 percent of the US corn acres, and theydid about the same proportion in 2007. Total corn planted in Iowa in 1997 was about12 million acres (4.9 million ha). Corn rose in 2007 to about 14 million acres (5.7million ha); in 2008 the planted acreage of corn in Iowa dropped to about 13 millionacres (5.3 million ha), still substantially above 1997 levels (US Department of Agri-culture, National Agricultural Statistical Service, 2008; some figures calculated).The earlier time (1997) was before significant effects resulted from production ofcorn-based ethanol (Abendroth and Elmore, 2007; Wisner, 2007).
A substantial amount of the increased land in corn in Iowa came, in 2007, fromland formerly devoted to soybean. For example, from 1997 through 2006, soybeanland in Iowa was over 10 million acres (4.4 million ha) per year. In 2007, how-ever, the Iowa land in soybean declined to 8.6 million acres (3.5 million ha). Thisdrop of approximately 1.6 million acres (640,000 ha) from 2006 was almost exactlymatched by an approximate rise in Iowa corn area of 1.6 million acres (640,000 ha)(U.S. Department of Agriculture, National Agricultural Statistics Service, 2008).Indiana reported a similar drop in soybean land in favor of corn (Nielsen, et al.,2007).
Under intensive cultivation, Western corn rootworm (Diabrotica virgifera vir-gifera LeConte), northern corn rootworm (Diabrotica barberi Smith and Lawrence),and European corn borer (Ostrinia nubilalis (Hubner)) have constituted the mostsignificant insect problems on corn in the Midwest in terms of economic damageand insecticide usage (Wilson, et al., 2005; U.S Department of Agriculture, 1999).This lineup of the three primary pests of corn has remained the same for at least 40years (National Research Council, 1975; Wilson, et al., 2005).
Control practices for the three species have changed and shifted at different timessince the mid-1990s. In the period 1997–2007, important changes, outlined below,reduced insecticides applied to soil and foliage. Despite these changes, however, a
20 Integrated Pest Management, Biofuels, and a New Green Revolution 599
profile of insect problems in Iowa corn in 1997 indicated heavy reliance on chemicalmethods of suppression. Later findings of Hammond, et al. (2006) suggested thatreliance on chemicals rather than IPM still predominated in the Midwest.
20.4.2.1 Patterns and Changes Through the 1990s
One part of the significant new technology noted above started in 1996 with theintroduction of transgenic corn that produced the toxin of Bacillus thuringiensis (“Btcorn”) for controlling European corn borer. Wide adoption in Iowa and elsewhereled to declines in the use of insecticides against this insect (Wilson, et al., 2005). In2002, a survey indicated that 32 percent of farms growing corn used at least someBt corn against European corn borer. Iowa was a leader in these early uses of Btcorn as 45 percent of its corn-growing farms made some use of Bt corn in that year(U.S. Department of Agriculture, National Agricultural Statistics Service, 2003).Wilson, et al., (2005) reported that by 1998 a decreasing percentage of corn growersperceived European corn borer as a problem.
In contrast with the European corn borer, the situation with Western and North-ern corn rootworm developed differently, and these two species still rank as majorpests with farmers. Rotating corn with soybean to control these two species was keyuntil 2003, but crop rotation had a convoluted history emblematic of the ambiva-lence to IPM practices. Before the 1950s, crop rotation was standard for controllingrootworm, and after the 1930s rotation increasingly meant “rotation of corn withsoybean.”
In the 1950s, new insecticides such as aldrin and heptachlor opened the door tocontrol rootworm without rotating corn with soybean (Lauer and Stanger, 2008).Thus the practice of crop rotations to control rootworms became an option not a ne-cessity. By the mid-1970s, however, problems associated with chemicals promptedpest management scientists to recommend crop rotation instead of reliance onchemicals (National Research Council, 1975). By 1997, Iowa scientists still rec-ommended corn-soybean rotation as “the most effective management tool availablefor farmers” (U.S. Department of Agriculture, 1999).
The role of crop rotation has been important, but not always used, for manydecades, but relatively recent developments in the two rootworm species began tothwart rotation as a successful control practice. By the late 1980s, strains of northerncorn rootworm—now present in Iowa, Minnesota, and Nebraska—evolved extendeddiapause. Eggs laid in late summer and fall survived for two or more winters beforehatching, by which time the farmer had rotated corn back to the field. Analogouslyin the mid-1990s strains of the western corn rootworm—now in Illinois, Indiana,and Wisconsin—evolved the ability to lay eggs in soybean fields. These eggs suc-cessfully overwintered and hatched the following spring to find corn rotated into thefield. In both cases, the insect was “resistant” to crop rotation as a control scheme(Wilson, et al., 2005; Onstad, et al., 2003; 2006; Tollefson, et al., 2007; Boerboom,2008).
Partly because of rotation resistance, insecticides continued to have popularityamong growers, albeit at a diminishing rate of use from 1997–2007. A 1997 profile

600 J.H. Perkins
of Iowa corn production still listed insecticides as the “standard practice” for cornrootworm, especially for corn following corn (U.S. Department of Agriculture,1999). Recommendations targeted both soil insecticide treatments for larvae andfoliar applications for adults. Despite the prominence of insecticides in the 1997profile, it noted that “some producers scout for significant populations of adults inmid to late summer” as a way of reducing insecticide treatments during the follow-ing spring (U.S. Department of Agriculture, 1999). Scouting is a major componentof IPM.
Surveys of insecticide use corroborated the notion that in the mid-1990s corngrowers used substantial amounts of insecticide. In a survey representing 90 per-cent of the US corn acreage, farmers applied insecticide to 30 percent of the cornacres. Iowa corn farmers applied insecticide to only 17 percent of their corn acreage,less than the national survey. Their usage was 13 percent of the total mass, whichsuggested a slightly lower than average rate of application on the acres treated.Chlorpyrifos, terbufos, carbofuran, and fonofos were the materials used in highestamounts in Iowa (U.S. Department of Agriculture, 1997).
20.4.2.2 Patterns and Changes in the 2000s
By 2005, however, new insecticidal tools had dropped the mass of chemicals ap-plied significantly. Nationally 23 percent of the acres were treated (down from 30percent a decade earlier), and the total amount of chemical used had dropped to4.8 million pounds (2.2 million kg) (down from 14.2 million pounds (6.4 millionkg) in the earlier survey). Iowa growers treated 11 percent of their acres, still lowerthan the national average, and they used 187,000 pounds (84,823 kg), down from1.8 million pounds (826,000 kg) in 1996. Cyfluthrin, tebupirimphos, and tefluthrinwere the materials used in Iowa in 2005 (U.S. Department of Agriculture, 1997;U.S. Department of Agriculture, 2006b).
Interpreting the significance of the drop in total amounts of insecticide used,however, requires one further piece of information: application rates per hectare ofthe new chemicals are drastically reduced from the application rates of the chemicalsused in the 1990s. The insecticides used in the largest amounts in Iowa in the mid-1990s (chlorpyrifos, terbufos, carbofuran, and fonofos) were each applied at about1 pound per acre (1.1 kg/ha). In contrast, the insecticides used in 2005 (cyfluthrin,tebupirimphos, and tefluthrin) were each applied at much lower rates: approximately0.1 pounds per acre (0.11 kg/ha) for tebupirimphos and tefluthrin, and 0.006 poundsper acre (0.0066 kg/ha) for cyfluthrin.
Thus the drop in amounts of insecticide used on corn in Iowa between the mid-1990s and the mid-2000s stemmed largely from the lower application rates of thenew chemical tools. In addition, the proportion of acres treated with soil and foliarinsecticides also dropped, from 17 percent to 11 percent.
Beyond the drop in application rates and the drop in proportion of acres treated,a new type of Bt corn was also marketed. As noted above, Bt corn for Europeancorn borer appeared in 1996 and began to lower insecticides applied for that in-sect. In 2003, seed producers released a new type of Bt corn aimed at controlling

20 Integrated Pest Management, Biofuels, and a New Green Revolution 601
both the western and northern corn rootworm. Varieties containing both toxin genessoon followed and thus provided protection against European corn borer and bothrootworm species.
New chemicals applied at lower rates per hectare plus new developments withBt corn probably account entirely for both the lower total amounts of insecticideused in Iowa and the lower proportion of hectares treated with soil and foliar in-secticides. It’s not that insect control in Iowa was moving away from a chemicalcontrol strategy. Instead the patterns of insecticide usage in the mid-2000s reflectednew chemicals applied in small amounts and Bt corn substituting for chemicalspreviously applied to soil or foliage. These figures on the uses of insecticides thusdo not seem to contradict the conclusions of Hammond, et al., (2006), noted above,that adoption of IPM by corn growers has been weak.
Yield data strongly suggest that the new technology for insect control success-fully protected Iowa corn. Total corn production in Iowa was 1.7 billion bushels(43.2 million metric tons) in 1996 and 2.2 billion bushels (55.9 million metrictons) in 2005. Iowa’s average yields per acre increased from 138 bushels per acre(8662 kg/ha) to 173 bushels per acre (10,859 kg/ha) in that period (U.S. Departmentof Agriculture, National Agricultural Statistics Service, 2008).
Crowder et al., (2005) noted that Bt corn would likely simplify control of cornrootworm and reduce the importance of insecticides and crop rotations as the majormanagement practices for these insects. In turn, Bt corn could reduce the problemsassociated with direct use of chemicals, particularly development of resistance andenvironmental contamination. The seed companies, however, under mandate fromthe U.S. Environmental Protection Agency, required growers to plant 20 percent oftheir corn as non-Bt corn. The area given to non-Bt corn provided a “refuge” thatallowed continued survival of strains of all three species that succumb to Bt toxin.This strategy intended to forestall development of resistance to the Bt toxins.
20.4.2.3 The Current Status of IPM for Corn in the Midwest
IPM, as noted earlier, has undergone an evolution of definitions. Bt corn is a newtechnology that once again will force reconsideration of the definition of IPM. In amajor way, Bt corn is simply a new method of delivering an insecticidal chemical.Use of Bt corn thus puts the farmer in the position of relying, sometimes exclusively,on the insecticidal Bt toxin. In this sense Bt corn is a form of “chemical control,”not “integrated control” or IPM.
Bt corn thus raises two of the objections that have long bedeviled reliance onchemicals: loss of effectiveness due to resistance and environmental damage to non-target species and human health. The environmental damage claims have been hotlycontested by advocates of Bt corn, and in any case the dangers of Bt should insome way be compared to the situation before transgenic corn, which was heavyreliance on insecticides for control of European corn borer, western corn rootworm,and northern corn rootworm.
The alternative way of looking at Bt corn is to see active management againstresistance—by the requirement of refuges—as a practice that may bring Bt into

602 J.H. Perkins
the IPM arena, although perhaps its inclusion requires another expansion of thedefinition of IPM. In this light, Bt corn has reduced conventional insecticide use,used concepts from population biology, and enabled continued, profitable growth inthe yields of corn. These consequences satisfy some of the aims of IPM, especiallyin its more recent forms.
This case study has focused on the shifting patterns of insect control in corn. Itcorroborates the general notion that—nearly 50 years after IPM for insect controlwas first fully conceived—corn insect control in the Midwest remains lodged mostlyin the chemical control strategy (Park and Tollefson, 2005). Farmers also used Btcorn, scouting, tillage practices, and weather monitoring, all of which demonstratedsome influence of the IPM strategy. As discussed above, however, Bt corn looks alot like chemical control in its theoretical foundation.
Weed control in corn likewise remains embedded in the chemical control strategy(U.S. Department of Agriculture, 1999; U.S. Department of Agriculture, 2006b;Owen, 2007), but that analysis is beyond the scope of this chapter. Disease controlin corn, in contrast to control of insects and weeds, has a mixed appearance of IPMstrategies. Plant resistance plus crop rotation provide the best foundation for diseaseprevention and control, but corn seed is routinely treated with pesticides. Robert-son and Munkvold (2007) consider such routine uses part of an “integrated diseasemanagement strategy.” Foliar fungicides for disease control, in contrast, are not nec-essarily profitable even though they can increase yields (Robertson, et al., 2007).Recent price increases of corn may be stimulating more foliar fungicide use but notwithin the IPM strategy (Boerboom, 2008). Reducing crop rotations and increasingthe practice of conservation tillage may increase disease incidence, and herbicidesand insecticides may make corn more susceptible to disease (Nyvall and Martin-son, 1997).
20.5 Conclusions
The interweaving of new technologies always produces a cascade of consequenceswith convoluted pathways of influence. As described in this chapter, the meshingof the biofuels technology with ongoing development of plant breeding and pestcontrol seems virtually certain to alter the pest control challenges in the Midwest.At least eight separate impacts show up at this time.
First, regardless of ethanol, plant breeders and pest control scientists continuethe quest they have mounted for the past century to constantly enable farmers toobtain higher yields at a profit. The vast majority of these new practices have em-braced pesticides and a chemical control strategy, not IPM. Disease control may bean exception, but recent increases in foliar fungicide use may indicate a change inprogress. If such uses continue to increase, disease control would also move into thechemical control strategy.
Second, public policies beginning in 1978 succeeded after 2002 in promotingethanol production and markets. The Midwest has accordingly already changed,

20 Integrated Pest Management, Biofuels, and a New Green Revolution 603
and the ethanol economy is shifting prices of biomass, which may increasinglyaffect pest management. Current trends in public policy will lead to an even strongerembrace of ethanol in the future, which means that effects currently impinging onpest control will become stronger.
Third, markets for ethanol have already increased the price of corn grain. Whenthe price of the harvested crop rises, the economic threshold drops. i.e. the popula-tion level of a pest needed to trigger control actions becomes lower. If the controlaction is use of a pesticide, more pesticide use will be economically rational (evenif self-defeating in the long run).
Fourth, increased prices of corn grain may reduce the use of crop rotation withsoybean. Concurrent rises in soybean prices may, however, continue to encouragecrop rotation. To the extent rotation diminishes, it is hard to see this consequence asanything but a blow against embrace of IPM.
Fifth, if corn stover is successfully converted to ethanol in the near future, thedollar value of the corn plant in the field will go up. As with increases in the pricesof corn grain, such a rise will lower the economic threshold and may encouragehigher uses of pesticides. Whether the lower economic threshold actually encour-ages higher pesticide use will depend upon (a) whether current pest populations arealready at or above the threshold and (b) whether farmers use economic thresholdas a tool in decision making. A lower economic threshold, however, is likely only toincrease pesticide use, not decrease it.
Sixth, transgenic crops (Bt corn as discussed above and also Roundup Ready cornfor use in glyphosate-based weed control) will continue to play a role in pest controlin the Midwest. Rising commodity prices may stimulate more use of transgeniccrops. Bt corn may have helped lower the amount of insecticide used, but at thesame time Bt corn is a kind of chemical control in itself. Growers using Bt cornmay therefore be dropping their uses of insecticides but simultaneously continuingtheir embrace of a new chemical control strategy.
Seventh, switchgrass and Miscanthus may replace soybean and corn, reduce croprotation, and eliminate land in the Conservation Reserve Program and pasture. All ofthese will alter the biological landscape and may create new pest species or alter theseverity—up or down—of existing problems. Effects on the use of IPM are difficultto predict.
And finally eighth, removal of stover, switchgrass, and Miscanthus may altersoils and lead to more soil erosion and altered soil moisture profiles. It’s also possi-ble that turning to the perennials of switchgrass and Miscanthus will increase carbonstorage in soils and reduce soil erosion. Either way, the effects on pest control andIPM are hard to predict in advance.
The net result of the above intersecting pathways may not yet be clear, but at leastsome (events that raise the value of crop plants and events that reduce crop rotation)are likely to constrain further embrace of IPM by growers. Nevertheless these arethe challenges that lie before pest control scientists.
As the old Chinese proverb notes, challenges pose both dangers and opportu-nities. The need for alternative energy strategies is great and enduring, and pest

604 J.H. Perkins
control scientists have a chance to play an important role in contributing to practicalsolutions. Farmers, the public, and political leaders will all cheer successful strate-gies that enable biomass to be used as fuel, especially if those strategies are basedon IPM.
Acknowledgments This research was supported in part by the Professional Leave program of TheEvergreen State College. Part of the research was done while I was a Visiting Scientist at the JointGlobal Change Research Institute of the Pacific Northwest Laboratory and the University of Mary-land. I’m very grateful for the assistance of both Evergreen and the Institute. Brendan Lazarus,an undergraduate at The Evergreen State College, generously prepared Fig. 20.3. I’m grateful toRajinder Peshin, editor of this volume, for asking me to contribute and for his useful suggestions toimprove the manuscript. Lori Abendroth (Iowa State University). Chris M. Boerboom (Universityof Wisconsin), Robert C. Brown (Iowa State University), and Jim Lynch (biodiversity managementconsultant) also provided useful suggestions for changes in the manuscript. All errors of fact andinterpretation, of course, remain my responsibility.
References
Abendroth, L. and Elmore, R. 2007. Introduction: Corn following corn. Integrated Crop Man-agement, IC-498, February 12. Found at http://www.ipm.iastate.edu/ipm/icm/ipm/icm/2007/2-12/intro.html, accessed 17 March 2008.
Berndes, G., Hoogwijk, M. and van den Broek, R. 2003. The contribution of biomass in the futureglobal energy supply: a review of 17 studies. Biomass & Bioenergy 25:1–28.
Boerboom, C.M. (Department of Agronomy, University of Wisconsin). 2008. Personal communi-cation, June.
Borlaug, N.E. 2007. Continuing the green revolution. Originally published in Wall Street Jour-nal, July 18. Republished with permission at http://www.cartercenter.org/news/documents/op ed borlaug wsj07grnrev2.html?printerFriendly=true, accessed 27 February 2008.
Bush, G.W. 2007. State of the Union Address, Washington Post, January 24, p. A16.Couser, B. (Iowa corn and ethanol producer). 2006. Personal communication, September.Crowder, D.W., Onstad, D.W., Gray, M.E., Mitchell, P.D., Spencer, J.L. and Brazee, R.J. 2005.
Economic analysis of dynamic management strategies utilizing transgenic corn for controlof Western Corn Rootworm (Coleoptera: Chrysomelidae). Journal of Economic Entomology98(3):961–975.
Evenson, R.E. and Gollin, D. 2003. Assessing the impact of the green revolution, 1960 to 2000.Science 300:758–762.
Farrell, A.E., Plevin, R.J., Turner, B.T., Jones, A.D., O’Hare, M. and Kammen, D.M. 2006. Ethanolcan contribute to energy and environmental goals. Science 311:506–508.
Hammerschlag, R. 2006. Ethanol’s energy return on investment: a survey of the literature 1990—present. Environmental Science and Technology 40:1744–1750.
Hammond, C.M., Luschei, E.C., Boerboom, C.M. and Nowak, P.J. 2006. Adoption of integratedpet management tactics by Wisconsin farmers. Weed Technology 20:756–767.
Heaton, E., Voigt, T. and Long, S.P. 2004. A quantitative review comparing the yields of twocandidate C4 perennial biomass crops in relation to nitrogen, temperature and water. Biomass& Bioenergy 27:21–30.
Hill, J., Nelson, E., Tilman, D., Polasky, S. and Tiffany, D. 2006. Environmental, economic, andenergetic costs and benefits of biodiesel and ethanol biofuels. Proceedings of the NationalAcademy of Sciences 103:11206–11210.
Hoeft, R.G., Nafziger, E.D., Johnson, R.R. and Aldrich, S.R. 2000. Modern corn and soybeanproduction. 1st edition. MCSP Publications, Champaign, Illinois.
20 Integrated Pest Management, Biofuels, and a New Green Revolution 605
Jones, M.B. and Walsh, M. (eds), 2001. Miscanthus, for Energy and Fibre. James & James (SciencePublishers) Ltd., London, United Kingdom.
Lal, R. 2005. World crop residues production and implications of its use as a biofuel. EnvironmentInternational 31:575–584.
Lauer, J. and Stanger, T. 2008. Crop rotation or continuous corn? Agronomic Considera-tions. Found at http://www.soils.wisc.edu/extension/wfapmc/2008/pap/Lauer.pdf, accessed 4March 2008.
Lewandowski, I., Scurlock, J.M.O., Lindvall, E. and Christou, M. 2003. The development andcurrent status of perennial rhizomatous grasses as energy crops in the US and Europe. Biomass& Bioenergy 25:335–361.
Lowenberg-DeBoer, J. and Erickson, B. 2005. Weighing the returns of rotated vs. contin-uous corn, Top Farmer Crop Workshop Newsletter. Purdue University, February. Avail-able at http://www.agecon.purdue.edu/topfarmer/newsletter/TFCW2 05.pdf. Accessed 31December 2006.
Massey, R. and Horner, J. 2003. Estimating Silage Value to the Crop Producer. Uni-versity of Missouri, Outreach and Extension, G4591, Columbia, MO, USA. Found athttp://extension.missouri.edu/explorepdf/agguides/crops/g04591.pdf, accessed 4 May 2008.
McLaughlin, S.B. and Walsh, M.E. 1998. Evaluating environmental consequences of producingherbaceous crops for bioenergy. Biomass and Bioenergy 14(4):317–324.
Morrow, W.R., Griffin, W.M. and Matthews, H.S. 2006. Modeling switchgrass derived cellulosicethanol distribution in the United States. Environmental Science & Technology 40:2877–2886.
National Research Council. 1975. Study on Problems of Pest Control, Corn/Soybeans Study Team.The Report of the Corn/Soybeans Study Team. National Academy of Sciences, Washington.
Nielsen, R.L., Johnson, B., Krupke, C. and Shaner, G. 2007. Mitigate the downside risks ofcorn following corn. Corny News Network, 11 November. Available at http://www.kingcorn.org/news/timeless/CornCorn.html, accessed 17 March 2008.
NSF Center for Integrated Pest Management. 2008. Welcome. Found at http://cipm.ncsu.edu/,accessed 3 March 2008.
Nyvall, R.F. and Martinson, C.A. 1997. Controlling Corn Diseases in Conservation Tillage, Pm-1096, originally published in 1983, electronic version in 1997. Iowa Stat University, UniversityExtension, Ames, IA.
Onstad, D.W., Crowder, D.W., Mitchell, P.D., Guse, C.A., Spencer, J.L., Levine, E. and Gray, M.E.2003. Economics versus alleles: balancing integrated pest management and insect resistancemanagement for rotation-resistant Western Corn Rootworm (Coleoptera: Chrysomelidae).Journal of Economic Entomology 96(6):1872–1885.
Onstad, David W., Hibbard, B.E., Clark, T.L., Crowder, D.W. and Carter, K.G. 2006. Analysis ofdensity-dependent survival of Diabrotica (Coleoptera: Chrysomelidae) in cornfields. Environ-mental Entomology 35(5):1272–1278.
Owen, Micheal D.K. 2007. 2008 Herbicide Guide for Iowa Corn and Soybean Production, WC-94.Iowa State University, Agribusiness Education Program, Ames, IA.
Park, Y-L. and Tollefson, J. J. 2005. Spatial prediction of corn rootworm (Coleoptera:Chrysomelidae) adult emergence in Iowa cornfields. Journal of Economic Entomology 98(1):121–128.
Perkins, J.H. 1982. Insects, Experts, and the Insecticide Crisis: The Quest for New Pest Manage-ment Strategies. Plenum Press, New York.
Perkins, J.H. 1997. Geopolitics and the Green Revolution: Wheat, Genes, and the Cold War. Ox-ford University Press, New York.
Perrin, R., Vogel, K., Schmer, M. and Mitchell, R. 2008. Farm-scale production cost of switchgrassfor biomass. BioEnergy Research 1:91–97.
Pimentel, D. and Patzek, T.W. 2005. Ethanol production using corn, switchgrass, and wood;biodiesel production using soybean and sunflower. Natural Resources Research 14:65–76.
Piper, C.V. 1919. Forage Plants and their Culture. The Macmillan Company, New York,pp. 513–538.

606 J.H. Perkins
Renewable Fuels Association. 2008. Industry Statistics. Found at http://www.ethanolrfa.org/industry/statistics/#C, accessed 3 May 2008.
Robertson, A. and Munkvold, G. 2007. Disease management in corn-following-corn fields. In-tegrated Crop Management, IC-498, February 12. Found at http://www.ipm.iastate.edu/ipm/icm//ipm/icm/2007/2–12/manage.html, accessed 17 March 2008.
Robertson, A., Abendroth, L. and Elmore, R. 2007. Yield responsiveness of corn to foliar fungi-cide application in Iowa. Integrated Crop Management, IC-498(26), December 10. Found athttp://www.ipm.iastate.edu/ipm/icm/2007/12–10/foliarfun.html, accessed 29 August 2008.
Sage, R.F. 2005. Atmospheric CO2, environmental stress, and the evolution of C4 photosynthesis.In: James R. Ehleringer, Thure E. Cerling and M. Denise Dearing (eds), A History of Atmo-spheric C O2 and Its Effects on Plants, Animals, and Ecosystems. Springer Science + BusinessMedia, New York, pp. 185–213.
Schmer, M.R., Vogel, K.P., Mitchell, R.B. and Perrin, R.K. 2008. Net energy of cellulosic ethanolfrom switchgrass. Proceedings of the National Academy of Sciences 105:464–469.
Searchinger, T., Heimlich, R., Houghton, R.A., Dong, F., Elobeid, A., Fabiosa, J., Tokgoz, S.,Hayes, D. and Yu, T.-H. 2008. Use of U.S. croplands for biofuels increases greenhouse gasesthrough emissions from land-use change. Science 319:1238–1240.
Shapouri, H., Duffield, J.A. and Wang, M. 2002. The Energy Balance of Corn Ethanol: AnUpdate. Washington, D.C., U.S. Department of Agriculture, Agricultural Economic ReportNo. 814.
Smil, V. 1999. Detonator of the population explosion, Nature 400:415, accessed at http://www.nature.com/nature/journal/v400/n6743/full/400415a0.html, accessed 1 January 2007.
Smith, H.R. 1906. Profitable Stock Feeding. The Author, Lincoln, Nebraska, pp. 77, 283.Smith, W.W. 1920. Pork-Production. The Macmillan Company, New York, pp. 178–180.Stern, V.M., Smith, R.F., van den B.R. and Hagen, K.S. 1959. The integrated control concept.
Hilgardia 29:81–101.Tollefson, Jon J., Prasifka, P.L. and Kaeb, B.C. 2007. The monster in Iowa corn
fields. Integrated Crop Management, IC-498, February 12. Found at http://www.ipm.iastate.edu/ipm/icm//ipm/icm/2007/2–12/rootworms.html, accessed 17 March 2008.
Troyer, A.F. and Good, D. 2005. At last, another record corn crop, in Kang, Manjit, ed.,Genetic and Production Innovations in Field Crop Technology: New Developments in Theoryand Practice. Food Products Press, Binghamton, pp. 175–196.
U.S. Bureau of the Census. 1976. Historical Statistical Abstract of the United States, Table K192–194. U.S. Government Printing Office, Washington, D.C., p. 469.
U.S. Department of Agriculture. 1940. Technology on the Farm, A Special Report by an Interbu-reau Committee and the Bureau of Agricultural Economics of the United States Department ofAgriculture. U.S. Government Printing Office, Washington, D.C., USA, pp. 24–25.
U.S. Department of Agriculture. 1997. Agricultural Chemical Usage, 1996 Field Crops Sum-mary. Ag Ch 1 (97). Found at http://usda.mannlib.cornell.edu/usda/nass/AgriChemUsFC//1990s/1997/AgriChemUsFC-09-03-1997.txt, accessed 21 April 2008.
U.S. Department of Agriculture. 1999. Crop Profile for Corn (Field) in Iowa, general pro-duction information. NSF Center for Integrated Pest Management. Found at http://www.ipmcenters.org/cropprofiles/docs/IAcorn-field.html, accessed 16 April 2008.
U.S. Department of Agriculture. 2005. Biomass as Feedstock for a Bioenergy and BioproductsIndustry. Oak Ridge National Laboratory, Oak Ridge, TN. ORNL/TM-2005/66.
U.S. Department of Agriculture. 2006a. Data from http://www.nass.usda.gov/QuickStats/PullData US.jsp, accessed 30 December.
U.S. Department of Agriculture. 2006b. Agricultural Chemical Usage, 2005 Field Crops Summary,Ag Ch 1 (06), May. U.S. Department of Agriculture, National Agricultural Statistics Service,Washington, D.C.
U.S. Department of Agriculture, Economic Research Service. 2007. An Analysis of the Ef-fects of an Expansion in Biofuel Demand on U.S. Agriculture. Available at http://www.ers.usda.gov/Briefing/Bioenergy/, accessed 3 May 2008.
20 Integrated Pest Management, Biofuels, and a New Green Revolution 607
U.S. Department of Agriculture, National Agricultural Statistics Service. 2003. Corn and Biotech-nology Special Analysis. July 11, Cr Pr 2–3 (7–03).
U.S. Department of Agriculture, National Agricultural Statistics Service. 2008. U.S. and All StatesData, Corn for Grain. Found at http://www.nass.usda.gov/QuickStats/PullData US.jsp, ac-cessed 20 May 2008.
U.S. Department of Energy. 2007. DOE Selects Six Cellulosic Ethanol Plants for up to $385Million in Federal Funding. Press release, February 28, 2007. Found at http://www.energy.gov/print/4827.htm, accessed 3 March 2007.
Westcott, P.C. 2007. U.S. ethanol expansion driving changes throughout the agricultural sec-tor. Amber Waves, September, pp. 10–15. Available at http://www.ers.usda.gov/AmberWaves/September07/Features/Ethanol.htm, accessed 3 May 2008.
Wilson, T.A., Rice, M.E., Tollefson, J.J. and Pilcher, C.D. 2005. Transgenic corn for control ofthe European Corn Borer and corn rootworms: A survey of Midwestern farmers’ practices andperceptions. Journal of Economic Entomology 98(2):237–247.
Wisner, R. 2007. Ethanol demand: Growth and implications for grain producers. IntegratedCrop Management, IC-498, February 12. Found at http://www.ipm.iastate.edu/ipm/icm//ipm/icm/2007/2–12/ethanol.html, accessed 17 March 2008.
Wolf, D.D., and Fiske, D.A. 1995. Planting and Managing Switchgrass for Forage, Wildlife, andConservation. Virginia Polytechnic Institute and State University, Virginia Cooperative Exten-sion, Publication, pp. 418–013.
Wrangham, R. 2008. The Human Recipe. Found at http://www.edge.org/q2008/q08 9.html#wrangham, accessed 27 February 2008.

Index
Note: ‘n’ following page number refers to foot notes.
AAccuracy standards, in program evaluation, 37Action research design, 1, 22Active rejection, 12Adaptability, 22, 70n4Adoptability, 17–19, 24, 43, 49, 65–66
adoptability index, 22–23, 65–66definition, 67n2, 70n3See also Adoption of IPM
Adopter categories, 1–26Adoption of IPM, 8–22
adoption stage, 10awareness stage, 9decision process, 23evaluation stage, 9innovation attributes influencing, 17–19
compatibility, 18, 21complexity, 17–18, 20–21less observability, 18, 20non-communicability, 18, 21–22perceived risk, 18relative advantage, 18, 19time consuming and laborious, 18
innovation-decision process, 10–13confirmation stage, 12decision stage, 12discontinuance, 13implementation stage, 12knowledge stage, 10persuasion stage, 11
interest stage, 9Lionberger definition, 8levels of
high, 15low, 14medium, 15
measuring IPM adoption, 14–15predictive model of, 22–24
process stages, 24action, 24awareness, 24evaluation decision, 24exploratory interest, 24
Shoemaker definition, 8six point continuum, 15trial stage, 10
AESA, see Agro-Ecosystem AnalysisAfrica
IPM programs history in, 397–398cotton, 398FFS approach, 398
push-pull strategies in East Africa, 317–319See also Sub-saharan Africa
Aggregate level economic evaluation, 110–112Agoo, 165Agrarian crisis, India, 320–321Agriculture
agricultural extension, 1–2, 119, 124,276, 485
Agricultural Research Service (ARS), 485Asian agriculture, IPM programs impact
of, 347–356Australian cotton industry, in sustainable
agriculture, 507–521Chinese agriculture, transgenics and IPM
impact of, 525–549Switzerland, 444US agriculture, IPM programs impact of,
481–501Agrobacterium-mediated transformation, 530Agroecosystem
Agro-Ecosystem Analysis (AESA), 15–16,20, 69–70, 322
Indonesia, 363–364Agro-input usage, 239–241Aleurodicus dispersus, 400
609

610 Index
American Midwest, case studies, 581–602biofuels, 585–586corn-based ethanol production, 587corn stover, 592–593current status of IPM for corn in, 601–602green revolutions, 584–585IPM-strategy, 583–584miscanthus, 595–596patterns and changes
in 2000s, 600–601through 1990s, 599–600
pest control, IPM, and ethanol in, 596–602shifting insect-control practices on corn,
598–602switchgrass, 593–595See also Ethanol
Anthropologists role in eliciting information,135–137
free listing, 136pile sorting, 136triad testing, 136
Aphis gossipii, 458–459Apple PEM, Russia, 472–477
codling moth, 473–474conventional programs, 473green apple aphid, 474–477
Area-specific IPM, 321Arizona, 564–565, 567–574, 572n8
Arizona Cotton Research and ProtectionCouncil (ACRPC), 565
Bt cotton in, 568–570Armyworm, 152Arthropod diversity, China
transgenic insect-resistant cotton impacton, 532–533
Arthropod pests, KAP of, 146–156abundance, 151armyworm, 152arthropod natural enemies, 158–160dryland rice pests, 148–149familiarity due to control efforts, 153–154grosser category insects, 148importance in terms of damage caused, 151metamorphosis, 152–153mobility, 150ranking by importance, 154–156
questionnaires, 154–155target pests for insecticide applications,
155–156recognition criteria, 149size, 150species recognition through language and
observation, 147–156
grouping many species under one name,147–149
stemborers, 152Asia/Asian agriculture, IPM programs impact
in, 347–356Asian Green Revolution, 349cotton case study, 349, 352–356
See also individual entryempowering farmers within IPM programs,
351–352farmer KAP, eliciting, 119–264
See also Rice in AsiaInter-Country Rice Program, 349IPM program evaluation indicators, 42natural enemies, 350pesticide subsidies in Indonesia, 350policy within IPM programs, 350–351RiceCheck seminars, 351science within IPM programs, 348–349vegetables, 349
Attitudes and practices, 119–264in chemical control, 183–184
Australia, 471cotton IPM system, 509
Awareness stage of adoption, 9
BBacillus thuringiensis (Berliner) (Bt) toxic
protein gene, 527Bacteria compound application, 391Bactrocera invadens, 400Baglan Province, cotton pest and its natural
enemy management in, 461Bangladesh, 340
smallholder farmersIPM extension impact, 335–339, 343picture songs use, 339using videos, 339
Baseline survey, 79, 81, 140, 145, 181Behavioral decision model, 108Belgium, farmer education in, 311Benin, 407Bennett’s model of program evaluation,
39–41Best management practice (BMP)
approach, 518Biofuels, 581–604
yields of plant biomass, 582See also American Midwest
Biological control, 174, 290, 367, 399,404–405, 471, 547, 560
in CIS and Russia, 466–467evaluation, 174

Index 611
sub-saharan Africa, 404–405classical biological approach, 404
Biotechnology, 322, 485, 555Bird control methods in Philippines, 237BitoxibacillinTM (BTB-202), 466BMP, see Best management practiceBolivia, 340–343Boll Weevil Eradication Program (BWEP),
498–499, 564–565Bollgard II R©cotton resistance management
strategy, 517Breeding, 165Brinkerhoff’s Six Stage Model, 35Broad-spectrum chemical insecticides
application, 392in CIS and Russia, 465
Brown planthopper (BPH) control,360–361, 536
Bt cotton adoption, 561–562, 565–571in Arizona, 568–570computable general equilibrium (CGE)
model, 566gains and losses distribution from, 566–567insecticide use, 565–566and IPM, compatability, 555–574profits, 565–566in U.S. Southwest, 567–571yield, 565–566
Bt cotton, transgenic, 531–533, 541, 547–548Budgeting technique, 109BWEP, see Boll Weevil Eradication Program
CCabbage IPM programs, 286–287
DBM control, 286field tests, 287
Cabbage looper equivalent (CLE) perplant, 278
Calauan, 165KAP of weeds, 225
Calendar based applications, 183California, cotton IPM in, 564Cambodia
IPM implementation in, 281traditional pest control practice, 175
Campylomma verbaci, 475Carbamates, 205, 208Carbaryl (carbamate) insecticide, 467Case studies, in evaluating IPM programs, 59Cellulosic ethanol, 581, 587, 589, 592–597Chemical control, 181–220
application technique, 210–220cumulative frequency distributions, 212
days after transplanting (DAT), 212frequency, 211–214timing, 211–214weeks after transplanting (WAT), 212
calendar based applications, 183change in attitude, 183–184complexity for farmers, 202–206
many brands of insecticides, 202–204crop monitoring technique, 195–198decision making, 184
researchers’, 185–186See also Farmers’ decision methods
dosage, 215–217cumulative frequency distribution,
215–216dosage-mortality relationship, 215sublethal dosages, 215
early warning, 195expected benefits, 182–183farmers’ crop monitoring methods,
194–195land ownership, 210negative effects on environment, 220pest density and damage assessment,
199–200safe use practices, 218–220sampling units, 198–199sprayables, 205
farmers’ use of, 217–218Sub-saharan Africa, 402–403See also Insecticides; Sprayers
Chhattisgarh, 144, 153KAP of plant diseases, 232research-extension-farmer dialogue,
facilitating, 259traditional pest control practice, 176
Chilies, 291–292farmer participatory research to test IPM
strategies, 292Chilo partellus (Swinhoe), 399China/Chinese agriculture, IPM impact, 252,
525–549IPM program evaluation indicators, 42–43See also Transgenic insect-resistant plants
CIALs, see Local agricultural researchcommittees
CIPP, see Context, Input, Process and Productevaluation
Claveria, 148, 168, 178–179superstitious practice in, 178–179traditional pest control practice,
171–172, 175C. Luzon farmers, 159, 161, 193, 207, 215

612 Index
Codling moth, 455–456, 472–475, 477Collard, IPM adoption, in developed countries,
278–281cabbage looper equivalent (CLE) per
plant, 278communication challenge, 280DBM/collard pest/crop system, 278diamondback moth (DBM) control, 278fixed-number scheme (FNS), 278sequential sampling scheme (SSS),
279–280streamlining field scouting techniques, 278
Commonwealth Agriculture BureauxInternational (CABI), 319
Commonwealth Independent States (CIS) andRussia, IPM programs in, 455–477
agronomic component includingenvironment manipulation, 467–469
biological control component, 466–467broad-spectrum chemical pesticide
treatment, 465chemical component, 467decision making, 464–469monitoring, 464–469survey, 464–469See also under Cotton PEM
Communication channels, 3, 4–5cosmopolite channels, 5interpersonal channels, 5localite channels, 5mass media channels, 5types of, 5
Community structure, Chinatransgenic insect-resistant cotton impact
on, 532–533Compatibility, influencing adoption of IPM,
18, 21Complexity for farmers, in chemical control,
202–206dapog transplanted crops, 203direct seeded crops, 203many brands of insecticides, 202–204wetbed transplanted crops, 203
Complexity, influencing adoption of IPM,17–18, 20–21
Computable general equilibrium (CGE)model, 566
Conducting evaluation, 47–64See also Planning and conducting
evaluationConfirmation stage, of innovation-decision
process, 12
Context, Input, Process and Product evaluation(CIPP) model, 32
Contingent valuation (CV), 87Control efforts for rice pests in Asia, 153–154Control practices, evaluation, 160–180,
233–234biological control, 174cultural controls, 171–174genetic resistance, 161–169in irrigated rice, 222–231physical or mechanical control, 169–171superstitious practices, 177–180traditional practices, 175–177See also Chemical control
Cooperative Extension Service (CES), 485Corn
corn starch and cellulose, ethanol from,588–591
corn stover, 592–593corn-soybean belt, development, 590insect problems on, 598–602in Midwestern US, 488–493, 601–602
Illinois, 489–493Iowa, 489–493
shifting insect-control practices oncorn, 598
Cotton IPM in US, 560–561IPM practices adoption, 560Southwest, 562–565
area-wide control programs, 563–565avoidance, 563behavioral control, 563biological control, 563cultural control, 563pink bollworm, 562
Cosmopolite communication channels, 5COST, see European Cooperation in Science
and TechnologyCost-benefit analysis, 44, 50, 110–111, 420Cotesia flavipes (Cameron), 399Cotton bollworm, 456–457, 460, 547, 558n2,
567, 570Cotton case study, Asian agriculture,
352–356educating farmers in, impact of, 354–356genesis of cotton IPM project headed by
FAO, 352Cotton in Southern US, 498–501
Boll Weevil Eradication Program(BWEP), 498
Bt cotton, 500–501Georgia, 499–500Texas, 499–501

Index 613
Cotton PEMin CIS and Russia, 456–464
area-wise approach, 470–471Baglan Province, 461big cotton aphid, 458–459cotton bollworm, 460–463ecological approach, 460economic threshold (ET), 463FAO principle, 471history of, 457–464impact of, 469–472spider mite, 458–459Tadjikistan, 470Turkmenistan, 461zoophage efficiency level (ZEL), 461
Cotton pest, 456–464, 559, 570impact of, 469–472
Cotton, transgenic insect-resistant, 529–535,541, 546–547
Agrobacterium-mediatedtransformation, 530
breeding, 529–530economic benefits, 533–535impact on arthropod diversity, 532–533impact on community structure, 532–533insect-resistant effect of, 530–531
Bt cotton, 531cotton bollworm, 531
Cotton yield losses and insecticide use,558–559
Crop and weed hosts of key pests,managing, 515
Crop monitoring methods, 194–195Crop protection, Indonesia, 364Cropping system examples, 488–501Crossing pattern, 196Cuba, potato and sweetpotato IPM programs
in, 428–429Cultural control methods, 234, 249
evaluation, 171–174sub-saharan Africa, 405
Cylas formicarius control, 421Cyperus rotundus, 125
DDamage assessment, 199–200Dangaw, 152Danish Pesticide Action Plan, 442Data collection, in evaluating IPM programs,
56–59analyzing data, 63–64qualitative methods, 57–59
case studies, 59
focus group interviews, 57observations, 58
quantitative methods, 56–57mail surveys, 56online surveys, 57personal interviews, 56
tool template for overall programevaluation, 62–63
amount of agrochemical usage, 63community information, 63cost of production, 63current agronomic practices, 62current pest control methods, 63farm production, 63farmers’ attitudes and values toward, 63major pests, 62
tool template for training sessionevaluation, 60–62
collecting necessary data for trainingimprovement, 62
recording potential practice changes(aspirations), 61
recording skill changes, 61testing attitudes, 60testing knowledge, 60
tools for data collection, development,59–63
Decision making process, 1–26, 184economic models, 105–108
behavioral decision model, 108decision theory model, 106–107economic threshold model, 105marginal analysis, 106
innovation-adoption, 23monitoring for, 390–391researchers’ methods, 185–186
Decision stage, of innovation-decisionprocess, 12
active rejection, 12passive rejection, 12rejection decisions, 12
Defoliating armyworms, 155Denmark, farmer education in, 312–313Desert locust, see Schistocerca gregariaDeveloped countries, IPM implementation in,
275–302collard, 278–281
See also under Collarddeveloped country models, drawbacks, 276economic threshold (ET) idea, 277plant protection systems, 277sampling programs, 277

614 Index
socioeconomic and environmental impacts,297–301
See also Developing countries;United States
Developing countries, IPM implementation in,281–297
cabbage, 286–287Cambodia, 281Chilies, 291–292citrus, 294–295cotton, 295–297eggplant, 293–294farmer field schools (FFS), 282Indonesia, 283
See also Soybeanrice, 282–283S. E. Asian countries, 281
cabbage, 284chilli, 284citrus, 284eggplant, 284onions, 284soybean, 284tomato, 284yardlong beans, 284
shallots/onions, 287–291beet armyworm (BAW), 288
socioeconomic and environmental impacts,297–301
tomato, 294yardlong beans, 292–293See also Developed countries
Development purpose of evaluation, 36Diabrotica barberi, 488, 581, 598Diabrotica virgifera virgifera, 581, 598Diagnostic surveys, 140–141Diamondback moth (DBM) control, 278Difference of difference (DD) model, 114Diffusion curve, 7–8Diffusion of innovation theory, 1–26
elements of, 3–7communication channels, 3, 4–5innovation, 3, 4social system, 3, 6–7time, 3, 56
IPM innovation system, 24Discontinuance, 13
disenchantment, 13replacement, 13
Discontinuous innovation, 16Disenchantment discontinuance, 13Dissemination of IPM, 13–22Dominican Republic
IPM program evaluation indicators, 44potato and sweetpotato IPM programs in,
428–429
EEarly warning, 195Ecological pest management (EPM), 423Ecological stabilization, 456, 465, 471, 473Econometric approach, 110, 112Economic evaluation of IPM Programs, 79–93,
103–116defining IPM measures, 80–91market level effects, assessing, 82–86
benefit cost analysis, 82–83changes in economic surplus,
calculating, 82–83net present value (NPV) of discounted
benefits and costs, calculation, 84methodology, 108–112
at aggregate level, 110–112at farm level, 108–110econometric approach, 110, 112economic surplus approach, 110–112
micro level evidence of farm level impacts,113–115
non-market effects, valuing, 86–90contingent valuation (CV), 87environmental impact quotient (EIQ),
86–87indexing method, 86
pesticide impact scoring system, 88–89poverty impacts, assessing, 90–91user level effects, assessing, 81–82See also Decision making process
Economic impact evaluation, 79–93, 110Economic Research Service (ERS), 14, 563,
568, 591Economic surplus analysis, 90, 110–112
cost-benefit analysis, 110economic surplus model, 111
Economic threshold (ET) idea, 105, 277,279, 383–384, 387–389, 460,463–464, 482
India, 321–322in North Vietnam, 387–390of pest species
in CIS and Russia, 463Economic threshold level (ETL), 14–15, 23,
67, 69–70, 321–323Ecuador, potato and sweetpotato IPM programs
in, 428–429Edge effects in monitoring, 196Educational evaluation, 33, 37

Index 615
Eggplant IPM programs, 293–294EIQ, see Environmental impact quotientElementary and Secondary Education Act
(ESEA), 33Eliciting information, on rice in Asia
diagnostic surveys, 140–141farm record keeping, 146formal survey methods, 141–146general information elicitation pointers,
132–134accuracy of information, 132–134interviews, 133–134learning from farmers, 133questionnaires, 133stratification of surveys, 132
group interviews, 139informal survey methods, 134–139
See also individual entrykey informants, 139Participatory Rural Appraisal (PRA),
142–144pest ecology, knowledge of, 157–160reconnaissance surveys, 140–141surveys using questionnaires, 144–146
loop survey, 145technological package approach, 128useful purposes for, 126–131
discovering indigenous technologies,126–127
facilitate extension process, 129farmer-led research, 127–129farmers’ practice comparison to
national recommendations, 129–131training needs assessments, 131undertaking projects to improve
IPM, 131Empowering farmers within IPM programs,
351–352Empowerment evaluation approach, 46Endorsement service, in Europe, 450ENDURE, see European Network for the
Durable Exploitation of CropProtection Strategies
EntobacterinTM (2%), 466Environmental education, 347Environmental impact quotient (EIQ), 86–87Environmental impacts, IPM implementation,
297–301Environmental Protection Agency (EPA), of
US, 487EPM, see Ecological pest managementERS, see Economic Research Service
ESEA, see Elementary and SecondaryEducation Act
ET, see Economic thresholdEthanol, 587, 588–596
cellulosic ethanol, 592from corn starch and cellulose, 588–591and transformation of American Midwest,
588–596Ethnicity, 181Ethnoscience, 119, 122–123ETL, see Economic threshold levelEurope, IPM and IP in, 435–452
Danish Pesticide Action Plan, 442European initiatives, in farmer education,
309–317Food Safety and Integrated Production (IP)
in Europe, 449–451German Reduction Program Chemical
Plant Protection, 443good plant protection practice (GPP), 441history, 437–438
corner-stones, 437implementation tools in, 451–452
environmental risk indicators, 451–452EU research and development
programs, 451–452pesticide use intensity, 451
IPM/IP research and implementation,444–449
COST (COoperation in Science andTechnology) projects, 445
Dissemination of results andknowledge, 445
ENDURE, 445European Union, 444–446INTEX (INTegrated Arable Farming
Systems in EXperiment andin national legislation and action plans,
440–444NGO’s role, 447–449policy, 438–444
European and MediterraneanPlant Protection Organization(EPPO), 439
European Union (EU), 439–440practical experience, 446
Joint research program, 445LEAF (Linking Environment And
Farming), 446MASTER, 444national projects, 446–447Network-building, 445
616 Index
REBECA (REgulation of BiologicalControl Agents, 2004–2008), 445
sustainable agriculture in Switzerland, 444European Cooperation in Science and
Technology (COST), 445European corn borer, 488, 539, 581, 598–601European Network for the Durable
Exploitation of Crop Protec-tion Strategies, 2007-2010(ENDURE), 445
Evaluability assessment, 48–50Evaluation indicators, 32, 42, 48, 50–52, 65,
67, 69Evaluation models, 32, 35Evaluation objectives, 31, 47–48, 50, 64Evaluation research, 31–74, 375
data collection schedules, 66future, 68–73historical view, 33–34impact assessment
household, 72and indicators, 71national level, 72phases, 71village, 72
sample studies, 65–68techniques of, 33theoretical/conceptual foundation, 34–41See also Economic evaluation; Practical
aspects; Theory-driven evaluationEvaluation stage of adoption, 9Ex post facto design, for evaluating IPM
programs, 1, 54Exogenous lectin gene, 527
FFace-to-face methods, 338–340FAO code of conduct, 309FAO-EU IPM program, 295, 300, 354–356Farm level economic evaluation, 108–110
budgeting technique, 109household’s profit function, 109micro level evidence of, 113–115
Farm record keeping, 146Farmer education, 307–330, 347,
353–354, 412assorted European initiatives, 309–317
Belgium, 311Denmark, 312–313Italy, 315–316Netherlands, 313–315Switzerland, 313United Kingdom, 316–317
innovations in, 309–320mobile plant health clinics, 319–320push-pull strategies in East Africa, 317–319See also under India
Farmer Field School (FFS)in cotton IPM, Asian agriculture, 352–354in Indonesia, as extension and training
process, 367–371model of extension, 41potato and sweet potato IPM in Latin
American countries, 425–426potato IPM in Peru, 422for smallholder farmers in tropics,
evaluation, 334–336Farmer KAP in Asia, eliciting, 119–264
See also Rice in AsiaFarmer participatory research, 128, 275, 283,
285–295, 297, 339to test IPM strategies in Soybean, 285–286
Farmer survey methods, 119Farmers’ crop monitoring methods, 194–195Farmers’ decision methods, 186–194
farmers’ rules of thumb to spray, 191–194monitoring, 191motivation to use insecticide, 191three decision modes, 186–190
amount of damage, 186pest population density, 186prophylactic or based on crop growth
stage, 186Farmers’ KAP, 123–124, 131, 135Farmers’ pest knowledge, 119Farming systems of rice in Asia, 124–126
See also under Rice in AsiaFeasibility standards, in program
evaluation, 37FFS, see Farmer Field SchoolField schools, 335–336, 338, 352Filipino farmers, 148Fixed-number scheme (FNS), in developed
countries, 278Fluid supplemental fertilizers effect, 376Focus group interviews, in evaluating IPM
programs, 57Food and Agriculture Organisation (FAO), 352
farmer field school in cotton IPM, 352–354genesis of cotton IPM project headed
by, 352Food safety and integrated production (IP) in
Europe, 449–451endorsement service, 450IOBC guidelines for IP, 449–450

Index 617
Formal survey methods, in elicitinginformation, 141–146
Formative evaluation, 31, 36–38, 48, 57Fruit and shoot borer (FSB), 293
GGender roles
in socioeconomic impacts of IPMdetermination, 300
Philippines, 300Southeast Asia, 300
Generalist predator, 383, 385, 455, 461, 508Genetic resistance, 161–169Genetically engineered crop plants (GE’s),
206, 296, 333, 336, 538, 555–556in US, 484
Genetically modifiedGeorgia, cotton in, 499German Plant Protection Act, 441German Reduction Program Chemical Plant
Protection, 443Ghana, 407Glance n’ Go greenbug+parasitism
worksheet, 496Gleaning-plus-clean harvest ”Re-Re.”, 337Global Plant Clinic (GPC), 319, 319n10,
340, 343GMOs, see Varietal controlGood Plant Protection Practice (GPP), 441GPC, see Global plant clinicGranules, 205, 208Great society programs, 34Green apple aphid PEM, Russia, 474–477Green revolution, 120, 210, 249, 251, 309,
349–350, 360, 377, 379, 581–604See also American Midwest
Group interviews, 139Guimba, 193, 211, 252
KAP of plant diseases, 235KAP of weeds, 225, 230
HHatch Act (1887), 485Hazardous substances, 310, 310n4Helicoverpa zea, 20–21, 283–285, 323, 402,
457, 498, 507–508, 510–522, 525,527, 558, 570
Heliothis virescens, 558Herbicide-tolerant (HT) traits, development in
US, 484High input farming systems, of rice in
Asia, 126High yielding varieties (HYVs), 19, 103, 113,
276, 282, 396, 585
HIV/AIDS, 397, 399, 410Holton’s HRD evaluation research and
measurement model, 35Homo erectus, 585Homo habilis, 585Honduras, 153, 159
KAP of plant diseases, 232research-extension-farmer dialogue,
facilitating, 259Host plant resistance, 165Household-level data analysis, 90Hunan, 252HYVs, see High yielding varieties
IIBTA-Chapare, 343IFM, see Integrated farm managementIGRs, see Insect growth regulatorsIllinois, 489–494Impact, 51–53, 69, 72, 488–501, 520–521
of cotton pest, 469–472economic impact of IPM, 79–93environmental impact, 297–301of IPM, evaluating dissemination, 419–432of IPM extension, smallholder farmers in
tropics, 333–344of IPM programs in Asia, 347–356of IPM, transgenics of Chinese agriculture,
525–549Implementation stage, of innovation-decision
process, 12Index, adoptability, 22–23Indexing method, 86–87India
cotton IPM program, 295–297farmer eductaion, 320–329
agrarian crisis, 320–321Agro-Ecosystem Analysis (AESA), 322cotton ecosystem analysis, 323current and future concerns, 322–325Economic Threshold Level (ETL),
321–323IPM farmers’ potential role in risk
estimation, 325–326IPPM contribution to food security,
326–329National Policy for Farmers, 321–322
Indian Council for Agricultural Research(ICAR), 321
IPM program evaluation indicators,42–43
KAP of weeds, 223media sources use in, 342

618 Index
Indicators, evaluation, 50–52farmers’ participation and reactions, 51–52impact indicator, 51inputs, 50–52outcome, 52outputs, 50–52
Indigenous technical knowledge, 251–252Indonesia, IPM implementation and
dissemination in, 283–287, 359–379cabbage, 286–287
DBM control, 286farmer participatory research to
test, 287chilies, 291–292citrus, 294–295disseminating concept and practices,
363–367agroecosystem understanding, 363–364crop protection, 364farmers empowerment, 366field monitoring, 366healthy plant culture, 365–366IPM concept socialization, 366–367pests and natural enemies, balance
maintenance, 365plant tolerance to damage, 364–365
disseminating farming technology tofarmers, 361–363
Siaran Pedesaan (Rural Programs), 363experiences as best learning motivation,
374–379empowerment, 377–378first phase of implementation
(1983–1993), 375fluid supplemental fertilizers effect, 376second phase of implementation
(1993–1998), 375farmers as IPM experts in their fields,
371–374agroecosystem study, 372bottom up planning, 373land/field as main learning site, 372learning from experiences, 372participant evaluation test, 373participants selection, 373practical and functional and
methods, 372skill-based curriculum, 372training to be trainers, 373
FFS as extension and training process,367–371
composition, 369–370follow-ups, 374
healthy plant culture maintenance,368–370
natural enemies’ manipulation andconservation, 371
structure, 369–370, 374weekly field monitoring, 371
IPM program evaluation indicators, 42–44north Sumatra, 299rice cultivation, 360–361
brown planthopper (BPH) control,360–361
IR 5, 360IR 8, 360
shallots/onions, 288–291soybean, 283–286
farmer participatory research to test,285–286
pod boring insects, 283tomato, 294yardlong beans, 292–293
Informal survey elicitation methods, 134–139anthropologists role, 135–137
free listing, 136pile sorting, 136triad testing, 136
para-anthropologists role, 137–138participant observation, 134photos, exihibiting, 135psychological methods in, 138–139specimens, using, 135
Innovation/Innovation theory, 1–26characteristics of, 4
communicability, 4, 21–22compatibility, 4complexity, 4observability, 4relative advantage, 4trialability, 4
decision process, stages, 10–13See also Diffusion of innovation theory
Input-process-output impact (IPOI) model, 68Inputs, 39Insect growth regulators (IGRs), 569, 572Insect pests, 62, 170, 222, 283, 291–292, 507,
526, 547Insecticide resistant management (IRM)
program, 65–67, 113, 486, 490,514, 555, 557–558, 571–573
Insecticides, 182, 200–2002applications, target pests for, 155–156factors influencing, 206–209farmers competency with, 204–206funds source for purchase, 209–210
Index 619
Insect Resistance Management (IRM)technology, in US, 486
insecticidal seed treatments, 514as medicines, 184purchase, 207–209resistance development prevention,
514–515resistant genes, Chinese agriculture, 527
See also Transgenic insect-resistantplants
seedbed insecticide usage, 201selection, 207–209sprayables, 183, 205, 208usage, 200–202
Institutional development, 395, 411Integrated Arable Farming Systems in
Experiment and PracticalExperience, 1990-2002(INTEX), 446
Integrated farm management (IFM), 316Integrated production (IP) in Europe, 436–452
history, 437–4381990s, new standards in plant protection
and agricultural production, 438food scandals, 438
Integrated Production (IP), 311, 313, 435–438,441, 444–449, 451–452
standards for, 311, 436Integrated Resistance Management (IRM),
571–573Interest stage of adoption, 9International Rice Research Institute
(IRRI), 349Interpersonal communication channels, 5INTEX, see Integrated Arable Farming
Systems in Experiment andPractical Experience
Invasive insect species, 395Invasive pests, in Sub-saharan Africa, IPM
challenges, 399–400IOBC toolbox, 452IOBCwprs, 435, 444, 447–448Iowa, 491, 493, 581, 598–599IP, see Integrated ProductionIPM adoption, see under Adoption of IPMIPM dissemination, 16, 24, 26, 74, 110, 363,
481–482, 487–490IPM evaluation, see entries under EvaluationIPM extension, 258, 333–344, 363–367IPM in developed countries, see under
Developed countriesIPM in developing countries, see under
Developing countries
IPM innovation system, see Innova-tion/Innovation theory
IPM levels, 80high, 15low, 14medium, 15
IPM measures, 79–91, 93, 526, 544, 546–547IPM national program, 359, 375IPM packages, 281IPM policy, 347, 352, 361, 378IPM programs
in Africa, 397–399Asian agriculture impact of, 347–356in commonwealth independent state &
Russia, 455–477economic impact evaluation of, 79–93evaluation indicators of, 32, 42evaluation, methodologies of, 31–74,
108–112in US agriculture, 481–502See also Program evaluation
IPM strategy, 82, 251, 285, 321, 509, 557, 561,581, 602
IPM tactics/techniques, 1, 15, 17, 24, 26, 72,80–81, 92, 119, 121, 131, 247, 259,275, 284, 297, 440, 483
IPOI, see Input-process-output impactIRM, see Insecticide resistant managementIRMS, see Insecticide resistance management
strategyIrrigated rice, 135, 145–146, 152, 156–157,
160, 172, 176–177, 222–231,242, 257
Italy, farmer education in, 315–316
JJava, shallots/onions IPM programs, 288–289
KKalimantan, 173–174
KAP of plant diseases, 232KAP of vertebrate pests, 236KAP of weeds, 223
KAP of plant diseases, 231–236control practices, evaluation, 233–234cultural and other control methods, 234damage caused, 231–235identification, 231–235superstitious practices, 233–234traditional methods, 233–234
KAP of vertebrate pests, 235–237control practices, evaluation, 236–237damage caused, 235–236identification, 235–236

620 Index
KAP of weeds, 220–231Chhattisgarh farmers, 221control practices in irrigated rice,
evaluation, 222–231damage caused, 220–222Filipino farmers, 221–222in Guatemala, 221Guimba, 222herbicide usage, 224–226identification, 220–222India, 223in Ivory Coast, 221Philippines, 223rainfed rice production systems, 231
KASA, see Knowledge, attitudes, skills andaspirations
Kenya, 341Key stakeholders, 48–49, 64, 449Knowledge, attitudes, skills and aspirations
(KASA), 39, 51, 53, 60Knowledge stage, of innovation-decision
process, 10Koronadal, 152
KAP of weeds, 225
LLadybeetles, 159Laguna farmers, 159Language, species recognition through,
147–156Laotia, traditional pest control practice, 176Latin American countries, 125, 307, 309, 337,
356, 419–432impact assessment, 427–43
Bolivia, 427Colombia, 427Dominican Republic, 427Ecuador, 427internal rates of return (IRR), 427
potato and sweet potato IPM in, 420–423Bolivia, 426Ecuador, 426FFS experience, 425–426impact assessment of pilot area
approach, 424participatory research and training,
425–426technology transfer phase, 424–425
See also PeruLeaf Folder (LF), ET of, 387LEAF, see Linking environment and farmingLEISA, see Low external input sustainable
agriculture
Lepidopteroid rice pest, 383–384Linking Environment And Farming
(LEAF), 446Local agricultural research committees, 338Localite communication channels, 5Locust, 238, 395, 400–402Logic model of program evaluation, 34–35,
39–40, 68–69theory based logic model, 69
system approach for, 69Loop survey, 145Low external input sustainable agriculture
(LEISA), 377
MMaize, 234, 360, 443, 539, 547–548,
581–582, 589transgenic insect-resistant, 538–539
Malaysia, KAP of plant diseases, 235Mali, 407Marginal analysis, 106Market level effects, assessment in IPM
programs, 82–86Mass media communication channels, 5Measures, defining IPM measures, 80–91Mechanical control, sub-saharan Africa, 405Media use in IPM implementation, 338–342Medicines, insecticides as, 184Meta-evaluation for evaluation practice
improvement, 65Metamorphosis, 152–153Micro level evidence of farm level IPM
program impacts, 113–115analytical procedure, 114impact assessment, 114–115sampling details, 113
Midwest, 581–604corn in Midwest US, 488–493
Migratory pests, 397, 400–403, 408in Sub-saharan Africa, IPM challenges,
400–402Miscanthus, 581, 587, 592–597, 603Mobile plant health clinics, 319–320Monitoring technique, 195–198, 383, 456,
464–469, 560crop technique, 195–198crossing pattern, 196for decision making, 390–392farmer’s crop methods, 194–195farmers’ entry to fields, 196–197field monitoring, 366weekly field monitoring, 371zigzag pattern, 196

Index 621
Morrill Act (1862), 485Mud wasps, 159Multi-agent participation, 573–574Multi-attribute toxicity index, 86
NNanda 2419 wheat variety, 528Narrow insect-resistance spectrum
problem, 542National Policy for Farmers, India, 321–322Natural enemies, 158–160, 264, 350, 383, 455,
456–464, 495arthropod, 158–160identification in North Vietnam, 385Indonesia
manipulation and conservation, 371pests and, balance maintenance, 365sustaining and maintaining, 365
Nepal, superstitious practices, 179Netherlands, farmer education in, 313–315New green revolution, 581–604Nicaragua, 340Nitrogen fertilizers, 193–194Nitrogen usage, 241, 245Non-communicability, influencing adoption of
IPM, 18, 21–22Nonequivalent control-group design, for
evaluating IPM programs, 54Non-governmental Organisations (NGO’s) in
Europe IPM, 447–449IOBC WPRS and EPRS working units,
447–448PAN (Pesticide Action Network), 449WPRS (West Palaearctic Regional
Section), 447Non-market effects, valuing, 86–90Northern corn rootworm, 488, 581,
598–599, 601Nucleopolyhedrovirus (SeNPV), 288–290Nursery crops, use of, 514
OObservation
in evaluating IPM programs, 58influencing adoption of IPM, 18, 20species recognition through, 147–156
Oklahoma, 494–499One-group before and after comparison design,
for evaluating IPM programs, 54One-group time-series design, for evaluating
IPM programs, 54Optimization model, 106Organochlorines, 205, 208Organophosphates, 205, 208
Ostrinia nubilalis, 440, 581, 598Outcomes, 39Overall program evaluation, tool template for,
62–63See also under Data collection
PPaddy agro-ecosystem, 383–390, 392–393
North Vietnam, 383–393Pakistan
IPM programcotton, 295–297evaluation indicators, 42
PAN, see Pesticide action networkPanicum virgatum, 581, 587, 592–593PAPs, see Pesticide action plansPara-anthropologists role in eliciting
information, 137–138Participatory evaluation approach, 47Participatory research through FFS (PR-FFS)
potato and sweet potato IPM in LatinAmerican countries, 425–426
Participatory research, 43, 119, 128, 275,285–291, 293–295, 425–426, 519
Participatory Rural Appraisal (PRA)71,142–144, 169
Passive rejection, 12Pectinophora gossypiella, 558PEM, see Pest and its enemy managementPemba, 407Perceived risk, influencing adoption of
IPM, 18Persuasion stage, of innovation-decision
process, 11Peru, 44, 335, 419–432
IPM implementation, potato andsweetpotato case studies, 419–432
CIP and CARE-Peru, partnershipbetween, 430
See also Latin American countries;Potato IPM in Peru
IPM program evaluation indicators, 44Pest and its enemy management (PEM)
program, 383–393, 460, 464–465,470–472
See also under Cotton PEM; VietnamPest control practices trends over time,
239–246agro-input usage, 239–241individual farmer’s practices over time,
241–243linking herbicide usage, 239nitrogen usage, 241
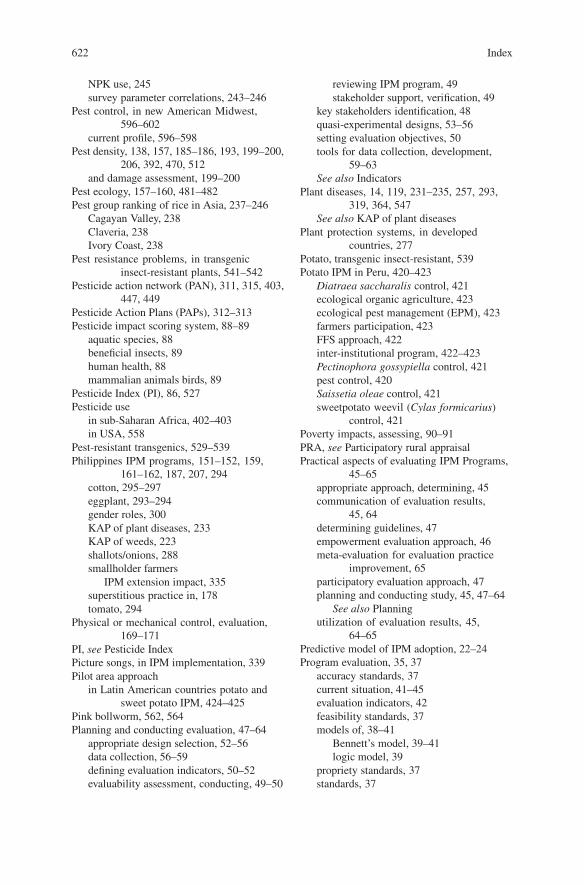
622 Index
NPK use, 245survey parameter correlations, 243–246
Pest control, in new American Midwest,596–602
current profile, 596–598Pest density, 138, 157, 185–186, 193, 199–200,
206, 392, 470, 512and damage assessment, 199–200
Pest ecology, 157–160, 481–482Pest group ranking of rice in Asia, 237–246
Cagayan Valley, 238Claveria, 238Ivory Coast, 238
Pest resistance problems, in transgenicinsect-resistant plants, 541–542
Pesticide action network (PAN), 311, 315, 403,447, 449
Pesticide Action Plans (PAPs), 312–313Pesticide impact scoring system, 88–89
aquatic species, 88beneficial insects, 89human health, 88mammalian animals birds, 89
Pesticide Index (PI), 86, 527Pesticide use
in sub-Saharan Africa, 402–403in USA, 558
Pest-resistant transgenics, 529–539Philippines IPM programs, 151–152, 159,
161–162, 187, 207, 294cotton, 295–297eggplant, 293–294gender roles, 300KAP of plant diseases, 233KAP of weeds, 223shallots/onions, 288smallholder farmers
IPM extension impact, 335superstitious practice in, 178tomato, 294
Physical or mechanical control, evaluation,169–171
PI, see Pesticide IndexPicture songs, in IPM implementation, 339Pilot area approach
in Latin American countries potato andsweet potato IPM, 424–425
Pink bollworm, 562, 564Planning and conducting evaluation, 47–64
appropriate design selection, 52–56data collection, 56–59defining evaluation indicators, 50–52evaluability assessment, conducting, 49–50
reviewing IPM program, 49stakeholder support, verification, 49
key stakeholders identification, 48quasi-experimental designs, 53–56setting evaluation objectives, 50tools for data collection, development,
59–63See also Indicators
Plant diseases, 14, 119, 231–235, 257, 293,319, 364, 547
See also KAP of plant diseasesPlant protection systems, in developed
countries, 277Potato, transgenic insect-resistant, 539Potato IPM in Peru, 420–423
Diatraea saccharalis control, 421ecological organic agriculture, 423ecological pest management (EPM), 423farmers participation, 423FFS approach, 422inter-institutional program, 422–423Pectinophora gossypiella control, 421pest control, 420Saissetia oleae control, 421sweetpotato weevil (Cylas formicarius)
control, 421Poverty impacts, assessing, 90–91PRA, see Participatory rural appraisalPractical aspects of evaluating IPM Programs,
45–65appropriate approach, determining, 45communication of evaluation results,
45, 64determining guidelines, 47empowerment evaluation approach, 46meta-evaluation for evaluation practice
improvement, 65participatory evaluation approach, 47planning and conducting study, 45, 47–64
See also Planningutilization of evaluation results, 45,
64–65Predictive model of IPM adoption, 22–24Program evaluation, 35, 37
accuracy standards, 37current situation, 41–45evaluation indicators, 42feasibility standards, 37models of, 38–41
Bennett’s model, 39–41logic model, 39
propriety standards, 37standards, 37

Index 623
types of, 37–38formative, 37–38summative, 37–38
utility standards, 37Prophylaxis, 187Propriety standards, in program evaluation, 37Prostephanus truncates (Horn), 399Protease inhibitor (PI) gene, 527Psychological methods in eliciting information,
138–139campaigns against overuse of
insecticides, 138Push-pull strategies in East Africa, 317–319Pyrethroids, 205
QQualitative methods, 38, 56–59, 72Quantitative data collection method, in
evaluating IPM programs, 56–57mail surveys, 56online surveys, 57personal interviews, 56
Quantitative methods, 56–57, 72, 141Quasi-experimental designs, for evaluating
IPM programs, 45, 53–56, 70n5ex post facto design, 54nonequivalent control-group design, 54,
55–56one-group before and after comparison
design, 54attrition, 55history, 54seasonality, 55testing, 55
one-group time-series design, 54, 55Questionnaires, 154–155
surveys using, 144–146
RRainfed rice production systems, 231Rapid rural appraisal (RRA), 140REBECA, see Regulation of biological control
agentsReconnaissance surveys, 137, 140–141Refuge, 517, 548–549, 555, 562, 568,
571–573, 571n7, 601REgulation of Biological Control Agents,
2004-2008 (REBECA),445–446, 448
Rejection decisions, 12active rejection, 12passive rejection, 12
Relative advantage, influencing adoption ofIPM, 18, 19
Religious beliefs, 178Replacement discontinuance, 13Resistance management, 516–518Ri10, 165Rice in Asia, 119–264
Cyperus rotundus weed in, 125farmer KAP, eliciting, 119–264
ethno-science, 122–123need for, 123–124pest recognition, 121See also Arthropod pests; Eliciting
information; KAP of plant diseases;KAP of vertebrate pests; KAP ofweeds
farming systems, types, 124–126traditional low input systems, 124–126
feedback to extension, 257–264effective extension program, making,
260–264farmers’ sources of information,
257–258institutional constraints, 258research-extension-farmer dialogue,
facilitating, 258–260feedback to research, 246–257
alternative methods to pesticides,249–250
farmer-led research, 254–255farmers’ knowledge, 251–257indigenous technical knowledge,
251–252IPM Inputs, validation, 250multiple pests and stresses, 250–251usable technology, 246–248
high input farming systems, 126rice lepidopteroid pest and its enemy
management (PEM) program,383–393
See also under Vietnamyield loss estimation, 156–157See also Indonesia; Pest control practices;
Pest group rankingRice IPM programs, in developing countries,
282–283farmer field schools (FFS), 282pesticide overuse, 282
Rice, transgenic insect-resistant, 535–538breeding, 535–536brown planthopper (BPH), 536direct or indirect ecological interactions
of invertebrate families networkin, 545
economic benefits, 538

624 Index
impact on arthropod diversity, 536–538impact on community structure, 536–538Xiushui 11, 535Zhonghua 8, 536
Rituals, 178–179in adoption, 177
Rodent ontrol methods in Philippines, 237Russia, IPM programs in, 455–477
See also under Apple PEM; Common-wealth Independent
SStates; Cotton PEMSampling units, 198–199Schistocerca gregaria
in Sub-saharan Africa, IPM challenges,400–402
control, 401economic dimensions, 401
Science within IPM programs, in Asianagriculture, 348–349
Scouting methods, 195Secondary pest outbreaks problem, 542Selective exposure, 11Semi-continuous innovation, 16Sequential sampling scheme (SSS), in
developed countries, 279–280Shallots/onions IPM programs, 287–291
beet armyworm (BAW), 288farmer participatory research to test,
288–291fungicides use, 290weeding, 288
Shandong Province, 546–547Short-term management strategies, US
agriculture, 483Site specific pest management, 514Six point continuum, in IPM adoption, 15
at continuum 4, 15conventional pest management, 15graduation to level 1 IPM, 15level 2, 15level 3, 15transition to level 1 IPM, 15
Smallholder farmers in tropics, IPM extensionimpact for, 333–344
farmer field schools, evaluation, 334–336Bangladesh, 335, 337, 343California, 336message, 336–338Philippines, 335Sri Lanka, 336
reaching largest audience possible,338–342
face-to-face methods, 338–340written material, 342
Smith Lever Act (1914), 485Social system element in diffusion process, 3,
6–7communication structure, 6informal interpersonal links, 6
Socioeconomic and environmental impacts,IPM implementation, 297–301
gender roles, 300Soybean IPM programs
Indonesia, 283–286farmer participatory research to test,
285–286pod boring insects, 283
transgenic insect-resistant, 538–539Species diversity, 42, 385, 455–456, 461Spiders, 159Spodoptera litura (Fabricius), 531Sprayers/Spraying/Sprayables, 183, 205, 208
farmers’ rules of thumb, 191–194neighbors’ spraying activity, 192–193when inorganic nitrogen fertilizer
added, 193–194farmers’ use of, 217–218
spray volume, 218spray mixtures, 205, 208
Sri Lanka, 173KAP of plant diseases, 232monitoring technique, 197
SSF, see Standard survey formsStakeholders identification, in evaluation, 48Standard survey forms (SSF), 383, 390,
392–393Stemborers, 152, 155Streamlining field scouting techniques, in
developed countries, 278Sub-saharan Africa, IPM challenges in,
395–412institutional constraints and challenges,
405–410Benin, 407exploitive networks, 410FFS abused, 408–409Ghana, 407government interference, 407–408HIV/AIDS, 410impact FFS questioned, 409insects and diseases not considered a
pest, 409land tenure, 409Mali, 407markets, 406–407

Index 625
Pemba, 407pest management, 408Zanzibar, 407
invasive pests, 399–400Chilo partellus (Swinhoe), 399Cotesia flavipes (Cameron), 399mango fruit fly, 400red spider mite, 400spiralling whitefly, 400
IPM components, 402–405biological control, 404–405chemical control, 402–403cultural control practices, 405mechanical control practices, 405varietal control (GMOs), 403–404
migratory pests, 400–402Schistocerca gregaria, 400–402
Summative evaluation, 31–32, 36–38, 48,56, 68
Superstitious practices, 177–180, 233–234Claveria, 178Nepal, 179Philippines, 178religious beliefs, 178Uttar Pradesh, India, 177
Sustainability, 40, 74, 322, 449, 507Sustainable agriculture, IPM as a component
of, 507–522Australian cotton IPM system, 509components, 508–510extension and implementation, 518–519
decision support systems (DSS), 519IPM objectives in practice, 510–516
beneficial insects, conservation and useof, 513–514
combined pest and damage thresholdsuse, 512–513
cotton variety matching to region andpest complex, 512
crop and weed hosts of key pests,managing, 515
defoliation of crop promptly atmaturity, 511
effective sampling, 512–513fertilizer strategies optimisation,
511–512insecticidal seed treatments, 514insecticide resistance development
prevention, 514–515nursery crops, use of, 514optimal planting time, 511optimal water management, 511plant growth regulators use, 511
rigorous and regular cropsampling, 512
selective insecticides, preferential useof, 513
site-specific pest management, 514trap crops use, 515–516using best practice crop agronomy,
510–512principles, 508–510resistance management, 516–518
Bollgard II R© strategy, 517INGARD R©, 517
transgenic Bt cottons, 516Sweetpotatoes, 419Switchgrass (Panicum virgatum L.), 581,
592–597, 603Switzerland
farmer education in, 313sustainable agriculture in, 444
Synchronized planting, 173, 195Synthetic Pyrethroids, 208
TT&V, see Training & VisitTadjikistan, 470Technology cluster, 1–26Teretrius nigrescens, 399Tetranychus evansi, 400Texas, 494–498
cotton in, 499Thailand, KAP of weeds, 223Tharu, 159Theory-driven evaluation, 34–41, 68
experiments, 35purpose of evaluation, 35–36
to create greater understanding, 36for development, 36knowledge addition, 36theory building, 36to influence decision making, 36to influence policy formulation, 36in response to social inquiry, 36
quasi-experiments, 35summative evaluation, 36See also Program evaluation
Thresholds, 14–15, 185–186, 206, 277–278,512–513
economic threshold, model, 105,191–192
TI, see Treatment Intensity IndexTime, 3, 5–6, 369–370Time consuming and laborious, influencing
adoption of IPM, 18

626 Index
Time element in diffusion process, 3, 5–6innovation-decision process, 5innovativeness of individual or other unit
of adoption, 5rate of adoption, 6
TNA, see Training Need AssessmentToF, see Training of FacilitatorsTomato IPM programs, 294Toxicity databases, 87Traditional low input systems, of rice forming
in Asia, 124–126cultural practices, 125
Traditional pest control practices, 176Traditional practices, evaluation, 175–177Training & Visit (T&V) system, 13,
362–363Training Need Assessment (TNA), 373Training of Facilitators (ToF) program, 353Training session evaluation, tool template for,
60–62See also under Data collection
Transgenic Bt cottons, 516Transgenic crops and IPM, compatibility,
555–574cotton IPM in USA, 560–561cotton yield losses and insecticide use,
558–559integrated resistance management (IRM),
571–573multi-agent participation, 573–574from pesticide treadmills to genetic
treadmills, 561–562Transgenic insect-resistant plants in China,
525–549Bacillus thuringiensis (Berliner) (Bt) toxic
protein gene, 527China’s ”863” high-tech development plan,
528–529cotton, 529–535
See also Cottonexogenous lectin gene, 527maize, 538–539Nanda 2419 wheat variety, 528negative impacts of, 540–544
biodiversity, 543–544environment, 543–544narrow insect-resistance spectrum
problem, 542pest resistance problems, 541–542poisonous effect on natural enemies,
543–544quality of crops, 540–541secondary pest outbreaks problem, 542
transgenic plants as weeds, 543yield, 540–541
potato, 539prospects of, 540–544Protease inhibitor (PI) gene, 527rice, 535–538
See also Ricerisks of, 540–544soybean, 538–539wheat, 539Xinong 6028 wheat variety, 528See also Chinese agriculture
Transgenic pest-resistant crops, 525–527,538–549
Transgenics, in Chinese agriculture, 525–549Trap crops use, 515–516Treatment Intensity Index (TI), 442–443Trial stage of adoption, 10Turkmenistan, cotton pest and its natural
enemy management in, 461
UUganda, 340United Kingdom, farmer education in, 316–317
Co-op, 316United States agriculture, IPM impact, 277,
471, 481–502Adkisson Project, 277adoption of IPM, 485–487changing agro-ecosystem, 484–485corn in midwestern US, 488–493cotton in the Southern US, 498–501current approaches, 481–482dissemination of IPM, 485–502Environmental Protection Agency
(EPA), 487evaluation criteria, 488evaluation indicators, 44genetically engineered crop plants
(GE’s), 484herbicide-tolerant (HT) traits,
development, 484historical development, 481–482Huffaker Project, 277Illinois, 489–490impact, 488–502insect resistance management (IRM)
technology, 486Iowa, 489–490IPM technologies among stakeholders, 486national initiatives and funding programs,
487–488pest management, 481

Index 627
pest resistant plants, development, 484in practice, 482–484programs, 488–502short-term management strategies, 483Southeastern USA, 277U.S. Department of Agriculture
(USDA), 564wheat in Southern Great Plains, 493–498See also Cotton IPM
User level effects, assessment in IPMprograms, 81–82
Utility standards, in program evaluation, 37Uttar Pradesh, India, superstitious practice
in, 177
VVarietal control (GMOs), 403–404, 448Vertebrate pests, 119, 166, 235–237, 257
See also KAP of vertebrate pestsVideos, in IPM implementation, 339Vietnam, North Vietnam
rice lepidopteroid pest and its enemymanagement (PEM) program in,383–393
bacteria compound application, 391broad-spectrum chemical insecticides,
application, 392economic threshold (ET), 387–390effectiveness of PEM, 393ET of leaf folder (LF), 387ET of Yellow Stem-Borer (YSB),
388–389IPM tools, 391–392manipulation of transplanting time, 391monitoring for decision making,
390–392natural enemies, identification, 385paddy agro-ecosystem, 383–393PEM Program implementations,
tactics, 392
zoophage efficiency level (ZEL),389–390
zoophagous species in, 386
WWeeds, 62, 119, 221–222, 543, 595
KAP of, see KAP of weedstransgenic plants as, 543
Weekly field monitoring, 371Weevils, 153, 159Western corn rootworm, 325, 488, 581,
598–599, 601Western European section WPRS (West
Palaearctic Regional Section),447–448
Wheat, 143, 443, 481, 493–498, 539in Southern Great Plains, US, 493–498
Glance n’ Go greenbug+parasitismworksheet, 496
Oklahoma, 494Texas, 494
transgenic insect-resistant, 539
XXinong 6028 wheat variety, 528
YYardlong beans IPM programs, 292–293Yellow Stem-Borer (YSB), ET of, 388–389Yield loss, 156–157, 202, 250, 465, 559, 571
estimation, rice in Asia, 156–157
ZZanzibar, 407Zaragoza, 165, 211
KAP of weeds, 225pest control practice in, 245
Zea mays, 581–582, 589Zigzag pattern, 196Zoophage efficiency level (ZEL), 389–390,
461–463