Evaluations of Integrated Pest Management control techniques
Upload
khangminh22Category
view
1download
0
Edited by
Integrated Pest Management of Field Crops
Renata BažokPrinted Edition of the Special Issue Published in Agriculture
www.mdpi.com/journal/agriculture

Integrated Pest Management ofField Crops

Integrated Pest Management ofField Crops
Editor
Renata Bazok
MDPI • Basel • Beijing • Wuhan • Barcelona • Belgrade • Manchester • Tokyo • Cluj • Tianjin
Editor
Renata Bazok
Department for Agricultural Zoology,
Faculty of Agriculture,
University of Zagreb
Croatia
Editorial Office
MDPI
St. Alban-Anlage 66
4052 Basel, Switzerland
This is a reprint of articles from the Special Issue published online in the open access journal
Agriculture (ISSN 2077-0472) (available at: https://www.mdpi.com/journal/agriculture/special
issues/IPM field crops).
For citation purposes, cite each article independently as indicated on the article page online and as
indicated below:
LastName, A.A.; LastName, B.B.; LastName, C.C. Article Title. Journal Name Year, Volume Number,
Page Range.
ISBN 978-3-0365-3761-0 (Hbk)
ISBN 978-3-0365-3762-7 (PDF)
© 2022 by the authors. Articles in this book are Open Access and distributed under the Creative
Commons Attribution (CC BY) license, which allows users to download, copy and build upon
published articles, as long as the author and publisher are properly credited, which ensures maximum
dissemination and a wider impact of our publications.
The book as a whole is distributed by MDPI under the terms and conditions of the Creative Commons
license CC BY-NC-ND.

Contents
About the Editor . . . . . . . . . . . . . . . . . . . . . . . . . . . . . . . . . . . . . . . . . . . . . . ix
Renata Bazok
Integrated Pest Management of Field CropsReprinted from: Agriculture 2022, 12, 425, doi:10.3390/agriculture12030425 . . . . . . . . . . . . . 1
Sidol Houngbo, Afio Zannou, Augustin Aoudji, Herve C. Sossou, Antonio Sinzogan,
Rachidatou Sikirou, Esperance Zossou, Henri S. Totin Vodounon, Aristide Adomou and
Adam Ahanchede
Farmers’ Knowledge and Management Practices of Fall Armyworm, Spodoptera frugiperda (J.E.Smith) in Benin, West AfricaReprinted from: Agriculture 2020, 10, 430, doi:10.3390/agriculture10100430 . . . . . . . . . . . . . 7
Helena Viric Gasparic, Mirela Grubelic, Verica Dragovic Uzelac, Renata Bazok, Maja Cacija,
Zrinka Drmic and Darija Lemic
Neonicotinoid Residues in Sugar Beet Plants and Soil under Different Agro-Climatic ConditionsReprinted from: Agriculture 2020, 10, 484, doi:10.3390/agriculture10100484 . . . . . . . . . . . . . 23
Petros Vahamidis, Angeliki Stefopoulou, Christina S. Lagogianni, Garyfalia Economou,
Nicholas Dercas, Vassilis Kotoulas, Dionissios Kalivas and Dimitrios I. Tsitsigiannis
Pyrenophora teres and Rhynchosporium secalis Establishment in a Mediterranean Malt BarleyField: Assessing Spatial, Temporal and Management EffectsReprinted from: Agriculture 2020, 10, 553, doi:10.3390/agriculture10110553 . . . . . . . . . . . . . 39
Bastian Goldel, Darija Lemic and Renata Bazok
Alternatives to Synthetic Insecticides in the Control of the Colorado Potato Beetle(Leptinotarsa decemlineata Say) and Their Environmental BenefitsReprinted from: Agriculture 2020, 10, 611, doi:10.3390/agriculture10120611 . . . . . . . . . . . . . 63
Luis Cruces, Eduardo de la Pena and Patrick De Clercq
Seasonal Phenology of the Major Insect Pests of Quinoa (Chenopodium quinoa Willd.) and TheirNatural Enemies in a Traditional Zone and Two New Production Zones of PeruReprinted from: Agriculture 2020, 10, 644, doi:10.3390/agriculture10120644 . . . . . . . . . . . . . 91
Zienab Raeyat, Jabraiel Razmjou, Bahram Naseri, Asgar Ebadollahi and Patcharin
Krutmuang
Evaluation of the Susceptibility of Some Eggplant Cultivars to Green Peach Aphid, Myzuspersicae (Sulzer) (Hemiptera: Aphididae)Reprinted from: Agriculture 2021, 11, 31, doi:10.3390/agriculture11010031 . . . . . . . . . . . . . 109
Stefano Sacchi, Giulia Torrini, Leonardo Marianelli, Giuseppe Mazza, Annachiara
Fumagalli, Beniamino Cavagna, Mariangela Ciampitti and Pio Federico Roversi
Control of Meloidogyne graminicola a Root-Knot Nematode Using Rice Plants as Trap Crops:Preliminary ResultsReprinted from: Agriculture 2021, 11, 37, doi:10.3390/agriculture11010037 . . . . . . . . . . . . . 119
Sylvain Poggi, Ronan Le Cointe, Jorn Lehmhus, Manuel Plantegenest and Lorenzo Furlan
Alternative Strategies for Controlling Wireworms in Field Crops: A ReviewReprinted from: Agriculture 2021, 11, 436, doi:10.3390/agriculture11050436 . . . . . . . . . . . . . 129
vi
Darija Lemic, Ivana Pajac Zivkovic, Marija Posaric and Renata Bazok
Influence of Pre-Sowing Operations on Soil-Dwelling Fauna in Soybean CultivationReprinted from: Agriculture 2021, 11, 474, doi:10.3390/agriculture11060474 . . . . . . . . . . . . . 159
Martina Kadoic Balasko, Katarina M. Mikac, Hugo A. Benıtez, Renata Bazok and Darija
Lemic
Genetic and Morphological Approach for Western Corn Rootworm Resistance ManagementReprinted from: Agriculture 2021, 11, 585, doi:10.3390/agriculture11070585 . . . . . . . . . . . . . 177
vii


About the Editor
Renata Bazok at the University of Zagreb as a member of the Faculty of Agriculture. Renata is a
full professor and has been working in higher education for 29 years. Her main research interests are
applied entomology, integrated pest management, plant protection and phytopharmacy. Under her
mentorship, five students have completed their dissertations and she currently supervises five PhD
students. Since 1993, she has conducted research on integrated control of Colorado potato beetle,
wireworms, sugar beet pests, oilseed rape pests, western corn rootworm, and other maize pests.
She has published 130 journal articles and over 100 miscellaneous articles. Her current research
interests include integrated pest management (IPM) in field crops (corn, sugar beets, potatoes)
and insect resistance development. The general research focus is on the development of safe,
effective and economical methods of IPM and the biological/ecological interactions between insect
species and their environment. She coordinated undergraduate and graduate programmes in crop
protection. She was awarded three fellowships, including Cochran, and Fulbright fellowship. She
actively participated in international scientific and educational projects funded by the European
Executive Agency for Education and Culture (EACEA), the United States Department of Agriculture
(USDA), and the Food and Agriculture Organisation of the United Nations (FAO). She has been
principal investigator in four national scientific projects and one FAO project, as well as in two
structural projects jointly funded by the EU and Croatia. She is currently coordinating an Erasmus
capacity building project aimed at developing joint PhD study programmes in plant health between
12 participating partners.
ix


Citation: Bažok, R. Integrated Pest
Management of Field Crops.
Agriculture 2022, 12, 425.
https://doi.org/10.3390/
agriculture12030425
Received: 9 March 2022
Accepted: 15 March 2022
Published: 18 March 2022
Publisher’s Note: MDPI stays neutral
with regard to jurisdictional claims in
published maps and institutional affil-
iations.
Copyright: © 2022 by the author.
Licensee MDPI, Basel, Switzerland.
This article is an open access article
distributed under the terms and
conditions of the Creative Commons
Attribution (CC BY) license (https://
creativecommons.org/licenses/by/
4.0/).
agriculture
Editorial
Integrated Pest Management of Field Crops
Renata Bažok
Department of Agricultural Zoology, Faculty of Agriculture, University of Zagreb, Svetošimunska 25,10000 Zagreb, Croatia; [email protected]; Tel.: +355-1-239-3969
1. Introduction
The Special Issue “Integrated Pest Management of Field Crops” contains eight originalresearch articles and two review articles dealing with different aspects of IPM in some of themajor field crops, including Potato [1,2], Maize [2,3], Soybean [4], Sugar Beet [5], Barley [6],Rice [7], Eggplant [8] and Quinoa [9] as well as farmer education issues on IPM [10]. Thepapers published in the Special Issue address all eight principles of IPM, as proposed byBarzman et al. [11].
2. Principle 1: Prevention and Suppression
The first principle of IPM is the prevention and suppression of pests. The goal of IPMis not to eliminate pests completely, but to prevent a single pest from becoming dominantor causing damage in a cropping system [11]. This principle combines three differentsub-principles [11]: combinations of tactics and multi-pest approach, crop rotation andcrop management, and ecology. Each of these principles is discussed in the papers in thisSpecial Issue.
A good example of the combination of tactics and multi-pest approach is the workof Poggi et al. [2], who discussed strategies to control wireworms in field crops. Newagroecological strategies should start with a risk assessment based on the production context(e.g., crop, climate, soil characteristics and landscape) and monitoring of adult and/or larvalpopulations. Suggested prophylactic measures to reduce wireworm infestation (e.g., low-riskcrop rotations, tillage, and irrigation) should be applied when the risk of damage appearssignificant. They also suggested cures based on natural enemies and naturally derivedinsecticides, which are either under development or already practiced in some countries.It is interesting to note the suggestion that wireworm control practices do not necessarilyneed to target the pest population, but rather to reduce crop damage via the use of selectedcropping practices (e.g., resistant varieties, planting and harvest timing) or by influencingwireworm behavior (e.g., companion plants).
Host plant resistance is an important strategy to prevent pest emergence and it issuggested for use in the control of several pests [11]. In a study by Raeyat et al. [8],the susceptibility of fourteen eggplant cultivars to green peach aphid (Myzus persicaeSchultz) was investigated. The degree of antixenosis and anthibiosis was determined usingdifferent parameters. The authors identified three eggplant cultivars resistant to M. persicae.Susceptible cultivars were also identified. The authors proposed a plant resistance index(PRI) as a simplified method to evaluate all resistance mechanisms. It provides a certainvalue to determine the correct resistant cultivar.
Many cropping practices have a significant impact on pest incidence and susceptibilityof cropping systems to pests. The ability of a crop to resist or tolerate pests and diseasesis often related to optimal physical, chemical, and especially biological properties of thesoil. In the work of Vahamidis et al. [6], different aspects of the epidemiology of netblotch disease (NFNB) caused by Pyrenophora teres f. teres and barley leaf scorch caused byRhynchosporium secalis were investigated in an area free of barley diseases when the initialinoculation of the field occurred with the use of infected seeds. The study determined
Agriculture 2022, 12, 425. https://doi.org/10.3390/agriculture12030425 https://www.mdpi.com/journal/agriculture
1

Agriculture 2022, 12, 425
the spatial dynamics of disease spread under the interaction of the nitrogen rate andgenotype in the presence of limited sources of infected host residue in the soil and therelationship between nitrogen rate, grain yield, quality variables (i.e., grain protein contentand grain size), and disease severity. It was confirmed that both NFNB and leaf scorchcan be transmitted from one season to the next in infected seed under Mediterraneanconditions. However, disease severity was more pronounced after the barley tillering stagewhen the soil had been successfully inoculated, supporting the hypothesis that the majorsource of primary inoculum for NFNB is from infected host residues. An increase in thenitrogen application rate when malt barley was grown in the same field for the secondconsecutive year resulted in a nonsignificant increase in disease severity for both pathogensfrom anthesis. However, hotspot and commonality analyses indicated that spatial andgenotypic effects were mainly responsible for hiding this effect. In addition, the effects ofdisease infection on yield, grain size, and grain protein content were found to vary withgenotype, pathogen, and plant developmental stage. The importance of crop residues inthe development of both diseases was also highlighted.
Biological balance refers to the interactions between organisms, including the struc-ture of food webs and the ability of ecological systems to sustain themselves over time.Improper and inappropriate tillage can lead to increased soil compaction or disruptionof the continuity of larger soil pores as well as corridors of soil organisms, and can affectthe abundance, as well as the diversity of the biological component of the soil [12]. Lemicet al. [4] investigated the effects of different pre-sowing measures on the abundance andcomposition of total soil fauna in soybean cultivation, with special attention to carabids asbiological indicators of agroecosystem quality. During the study, 7836 individuals of soilfauna were collected, out of which 84% were beneficial insects (insects or spiders). Thenumber of fauna collected was influenced by the interaction between pre-sowing inter-vention and sampling date. Pre-sowing interventions that did not involve soil activities(such as cover crops, glyphosate application and mulching) did not affect the numberand composition of soil fauna at the beginning of vegetation. Mechanical interventionin the soil and warmer and drier weather had a negative effect on soil fauna numbersand composition. As the season progresses, the influence of pre-sowing activities on soilfauna in soybean crops decreased. It appears that a reduction in mechanical activities inthe shallow seed layer of the soil has a positive effect on species richness and diversity.The results of this study contributed significantly to a better understanding of the baselinesituation of soil fauna in an intensive agricultural landscape and could be a good startingpoint for future studies and conservation programs.
3. Principle 2 and 3: Monitoring and Decision Based on Monitoring and Thresholds
Principle 2 (monitoring) and Principle 3 (decision making) come into play once thecropping system is established [11]. They are based on the idea that in-season controlmeasures are the result of a sound decision-making process that takes into account actualor predicted pest occurrence. Weather and agronomic conditions in different areas cansignificantly affect the abundance of pests and their potential to cause damage to the samecrop. Therefore, the life cycle of a species and its occurrence in newly developed areasmay differ from those in areas where the crop has been grown for a long time. Studieson the biology and ecology of major pest species and their natural enemies are necessaryto develop appropriate pest-management strategies for the crop. The study by Cruceset al. [9] investigated the incidence of insect pests and the natural enemies of quinoa in atraditional cultivation area, San Lorenzo (in the Andes), and in two new areas at loweraltitudes, La Molina (on the coast) and Majes (in the Maritime Yunga ecoregion). Their dataindicated that pest pressure in quinoa is higher at lower elevations than in the highlands.Non-traditional quinoa-growing areas have better conditions to produce higher yieldsthan the Andean region. Pests are likely to become an important constraint to successfulquinoa production, and the situation may worsen if pesticides are misapplied. The pest
2

Agriculture 2022, 12, 425
management strategies used in the three regions differ. The results suggest that agriculturalextension programmes are still needed to improve the use of agrochemicals.
4. Principle 4: Non-Chemical Methods
Combining control measures in management strategies leads to more effective andsustainable results in the implementation of IPM [11]. The preference for non-chemicalover chemical methods when they provide satisfactory pest control is defined as the fourthprinciple of IPM [11]. A wide range of non-chemical but direct measures are availablefor pest control. Some examples are soil solarization, trap cultivation, mechanical control,biological control or various biotechnical methods. However, their availability, effectivenessor usefulness varies greatly.
For example, Goldel et al. [1] list a wide range of alternative control methods usedto date to control the Colorado potato beetle (Leptinotarsa decemlineata Say), the world’slargest potato pest. In addition, they categorize the advantages and disadvantages of eachmethod and compare them to conventional insecticides. They also discuss the positive andnegative impacts of using alternative control methods and illustrate how alternative controlmethods, farmer activities, and environmental factors (e.g., biodiversity and ecosystemhealth) are closely linked in a cycle of self-reinforcing effects. Specifically, the higher thefarmer adoption of alternative control methods, the healthier the ecosystem, includingthe biodiversity of pest enemies. The subsequent decrease in pest density potentially in-creases yield, profit, and farmer acceptance in using less conventional and more alternativemethods.
Even though several non-chemical control methods are available for the most impor-tant pests, research and extension need to continuously develop more methods and tools.Once developed, they need to be integrated into pest-control strategies. Trap cropping asa method of controlling the new invasive nematode Meloidogyne graminicola (Golden andBirchfield) was studied by Sacchi et al. [7]. This is one of the most damaging organisms inrice crops worldwide and was first detected in mainland Europe (northern Italy) in 2016.Preliminary research results showed that nematode density and root gall index were lowerin plots where rice was grown in three separate cycles and plants were destroyed at thesecond leaf stage each time compared to the other two management approaches. In addi-tion, plant population density and rice plant growth were higher than in the unmanagedand control plots. Based on the studies, the use of the trap crop technique to control M.graminicola could be advocated for as a new pest management measure to control this pestin rice growing areas.
5. Principle 5 and 6: Pesticide Selection and Reduced Pesticide Use
Two principles of IPM directly target pesticides and suggest that the pesticides usedshould be as specific as possible to the target pests and have the least side effects on humanhealth, non-target organisms and the environment. In addition, reducing the dosage,frequency of application, and resorting to the partial application of pesticides contributesto the goal of IPM to reduce or minimize risks to human health and the environment.Therefore, seed treatment has been considered as an ecologically acceptable method. Due totheir negative effect on the environment (especially on bees, other pollinators and possiblyon other non-target organisms), the use of neonicotinoid seed treatment insecticides isrestricted. The studies conducted by Viric et al. [5] aimed to determine the residue levelsof imidacloprid and thiamethoxam used for the seed treatment of sugar beet plants indifferent agroclimatic regions to assess the environmental risk and possible transfer toother crops. The study shows that imidacloprid and thiamethoxam used for seed treatmentof sugar beet during sugar beet vegetation degraded below the maximum residue levelallowed. Residue levels were highly dependent on weather conditions, especially rainfall.The results of this study show that seed treatment of sugar beet leads to a minimal tracein the plants as it is completely degraded by the end of the growing season, while higherresidue concentrations in the soil show that there is a risk in dry climates or after a dry period.
3
Agriculture 2022, 12, 425
Dry conditions, the inability to leach, or irregular flushing may result in higher concentrationsin the soil, which may pose a potential risk to subsequent crops. This study provides additionalarguments for a possible risk assessment in the seed treatment of sugar beet.
6. Principle 7: Anti-Resistance Strategies
Cases of pest resistance have been reported ever since man began using chemicalsto protect plants. When a pest becomes resistant, the insecticide is used more frequentlyand eventually must be replaced as its effectiveness wanes. In their work, Kadoic Balaškoet al. [3] attempted to find a reliable pattern of differences in resistance type in western cornrootworm (Diabrotica virgifera virgifera LeConte) using population genetic and geometricmorphometric approaches. Their results confirmed that the hindwings of WCR containvaluable genetic information. This study highlights the ability of geometric morphomet-rics to detect genetic patterns and provides a reliable and cost-effective alternative for apreliminary estimation of population structure. The combined use of SNPs and geometricmorphometrics to detect resistant variants is a novel approach in which morphologicaltraits can provide additional information about underlying population genetics and mor-phology can contain useful information about genetic structure. The study provides newinsights into an important and topical area of pest management, namely, of how to preventor delay the evolution of pests into resistant populations to minimize the negative effectsof resistance.
7. Principle 8: Evaluation
Principle 8 encourages farmers to evaluate the soundness of the crop protectionmeasures they adopt [11]. This is a very important aspect of sound management. However,farmers’ knowledge of pests and their understanding of pest management solutions is oftenvery limited. Therefore, many researchers highlight the need for the continuous professionaldevelopment of farmers, not only to provide administrative support, but also to provideadvice on sustainable practices [13]. This is very important as climate change and theacceleration of global trade will increase uncertainties and the frequency of the occurrence ofexisting and new pests. The study by Houngbo et al. [10] investigated farmers’ knowledgeof Spodoptera frugiperda (J.E. Smith), their perceptions and their management practices inBenin. Their results showed that farmers’ management practices were significantly relatedto their knowledge of the pest and their socio-economic characteristics such as membershipof a farmers’ organization and contact with research or extension services. Since farmerorganizations and extension services have the potential to improve farmers’ knowledge andbring about behavioral changes in their pest management strategies, they can influence thepest management decisions made by farmers. Therefore, extension services should considerdisseminating relevant information in local languages and conducting demonstrationsdirectly in fields to improve farmers’ pest management knowledge and skills and theirability to assess the soundness of the pest management measures they adopt.
8. Conclusions
Field crops occupy about 1.7 billion hectares. They are at great risk of infestation byinsects and diseases, so the amount of pesticides used in production is very high. Onesolution to reduce the use of pesticides is to implement IPM as a dynamic and flexibleapproach that takes into account the diversity of agricultural situations and the complexityof agroecosystems, which can improve the resilience of cropping systems and a farmer’sability to adapt crop protection to local conditions. The studies published in this SpecialIssue refer to all the basic principles of IPM as systemized by Barzman et al. [11] and provideexamples of their implementation in different crops and cropping systems. Research onvarious aspects of the implementation of IPM in crop production is a continuous need. Theresearch presented helps to provide a mosaic picture with examples of how crop-specific,site-specific and knowledge-intensive IPM practices should be considered and translatedinto workable practices.
4
Agriculture 2022, 12, 425
Conflicts of Interest: The author declares no conflict of interest.
References
1. Göldel, B.; Lemic, D.; Bažok, R. Alternatives to Synthetic Insecticides in the Control of the Colorado Potato Beetle (Leptinotarsadecemlineata Say) and Their Environmental Benefits. Agriculture 2020, 10, 611. [CrossRef]
2. Poggi, S.; Le Cointe, R.; Lehmhus, J.; Plantegenest, M.; Furlan, L. Alternative Strategies for Controlling Wireworms in Field Crops:A Review. Agriculture 2021, 11, 436. [CrossRef]
3. Kadoic Balaško, M.; Mikac, K.M.; Benítez, H.A.; Bažok, R.; Lemic, D. Genetic and Morphological Approach for Western CornRootworm Resistance Management. Agriculture 2021, 11, 585. [CrossRef]
4. Lemic, D.; Pajac Živkovic, I.; Posaric, M.; Bažok, R. Influence of Pre-Sowing Operations on Soil-Dwelling Fauna in SoybeanCultivation. Agriculture 2021, 11, 474. [CrossRef]
5. Viric Gasparic, H.; Grubelic, M.; Dragovic Uzelac, V.; Bazok, R.; Cacija, M.; Drmic, Z.; Lemic, D. Neonicotinoid Residues in SugarBeet Plants and Soil under Different Agro-Climatic Conditions. Agriculture 2020, 10, 484. [CrossRef]
6. Vahamidis, P.; Stefopoulou, A.; Lagogianni, C.S.; Economou, G.; Dercas, N.; Kotoulas, V.; Kalivas, D.; Tsitsigiannis, D.I. Pyrenophorateres and Rhynchosporium secalis Establishment in a Mediterranean Malt Barley Field: Assessing Spatial, Temporal and ManagementEffects. Agriculture 2020, 10, 553. [CrossRef]
7. Sacchi, S.; Torrini, G.; Marianelli, L.; Mazza, G.; Fumagalli, A.; Cavagna, B.; Ciampitti, M.; Roversi, P.F. Control of Meloidogynegraminicola a Root-Knot Nematode Using Rice Plants as Trap Crops: Preliminary Results. Agriculture 2021, 11, 37. [CrossRef]
8. Raeyat, Z.; Razmjou, J.; Naseri, B.; Ebadollahi, A.; Krutmuang, P. Evaluation of the Susceptibility of Some Eggplant Cultivars toGreen Peach Aphid, Myzus persicae (Sulzer) (Hemiptera: Aphididae). Agriculture 2021, 11, 31. [CrossRef]
9. Cruces, L.; Peña, E.d.l.; De Clercq, P. Seasonal Phenology of the Major Insect Pests of Quinoa (Chenopodium quinoa Willd.) andTheir Natural Enemies in a Traditional Zone and Two New Production Zones of Peru. Agriculture 2020, 10, 644. [CrossRef]
10. Houngbo, S.; Zannou, A.; Aoudji, A.; Sossou, H.C.; Sinzogan, A.; Sikirou, R.; Zossou, E.; Vodounon, H.S.T.; Adomou, A.;Ahanchédé, A. Farmers’ Knowledge and Management Practices of Fall Armyworm, Spodoptera frugiperda (J.E. Smith) in Benin,West Africa. Agriculture 2020, 10, 430. [CrossRef]
11. Barzman, M.; Bàrberi, P.; Birch, A.N.; Boonekamp, P.; Dachbrodt-Saaydeh, S.; Graf, B.; Hommel, B.; Jensen, J.E.; Kiss, J.; Kudsk, P.;et al. Eight principles of integrated pest management. Agron. Sustain. Dev. 2015, 35, 1199–1215. [CrossRef]
12. van Capelle, C.; Schrader, S.; Brunotte, J. Tillage-induced changes in the functional diversity of soil biota: A review with a focuson German data. Eur. J. Soil Biol. 2012, 50, 165–181. [CrossRef]
13. Kuramoto, J.; Sagasti, F. Integrating Local and Global Knowledge, Technology and Production Systems: Challenges for TechnicalCooperation. Sci. Technol. Soc. 2002, 7, 215–247. [CrossRef]
5


agriculture
Article
Farmers’ Knowledge and Management Practices ofFall Armyworm, Spodoptera frugiperda (J.E. Smith)in Benin, West Africa
Sidol Houngbo 1, Afio Zannou 1,*, Augustin Aoudji 1, Hervé C. Sossou 2, Antonio Sinzogan 1,
Rachidatou Sikirou 2, Espérance Zossou 1, Henri S. Totin Vodounon 3, Aristide Adomou 4 and
Adam Ahanchédé 1
1 Faculté des Sciences Agronomiques (FSA), Université d’Abomey-Calavi, 01 BP 526 Cotonou, Benin;[email protected] (S.H.); [email protected] (A.A.); [email protected] (A.S.);[email protected] (E.Z.); [email protected] (A.A.)
2 Institut National des Recherches Agricoles du Bénin (INRAB), 01 BP 884 Cotonou, Benin;[email protected] (H.C.S.); [email protected] (R.S.)
3 Institut de Géographie, de l’Aménagement du Territoire et de l’Environnement (IGATE), Universitéd’Abomey-Calavi, 01 BP 526 Cotonou, Benin; [email protected]
4 Faculté des Sciences et Techniques (FAST), Université d’Abomey-Calavi, 01 BP 526 Cotonou, Benin;[email protected]
* Correspondence: [email protected]; Tel.: +229-97449255
Received: 29 August 2020; Accepted: 21 September 2020; Published: 25 September 2020
Abstract: Spodoptera frugiperda has caused significant losses of farmer income in sub-Saharan countriessince 2016. This study assessed farmers’ knowledge of S. frugiperda, their perceptions and managementpractices in Benin. Data were collected through a national survey of 1237 maize farmers. Ninety-onepoint eight percent of farmers recognized S. frugiperda damage, 78.9% of them were able to identify itslarvae, and 93.9% of the maize fields were infested. According to farmers, the perceived yield lossesamounted to 797.2 kg/ha of maize, representing 49% of the average maize yield commonly obtainedby farmers. Chi-square tests revealed that the severity of the pest attacks was significantly associatedwith cropping practices and types of grown maize varieties. About 16% of farmers identified francolin(Francolinus bicalcaratus), village weaver (Ploceus cucullatus), and common wasp (Vespula vulgaris)as natural enemies and 5% of them identified yellow nutsedge, chan, shea tree, neem, tamarind,and soybean as repellent plants of S. frugiperda. Most farmers (91.4%) used synthetic pesticides and1.9% of them used botanical pesticides, which they found more effective than synthetic pesticides.Significant relationships exist between farmers’ management practices, their knowledge, organizationmembership, and contact with research and extension services. More research is required to furtherunderstand the effectiveness of botanical pesticides made by farmers against S. frugiperda and torefine them for scaling-up.
Keywords: Spodoptera frugiperda; farmers’ knowledge; perception; pest management practices; maizeyield losses; damage severity; fall armyworm
1. Introduction
The fall armyworm, Spodoptera frugiperda (J.E. Smith) (Lepidoptera: Noctuidae), once consideredendemic to North and South America, has become an invasive pest in Africa [1]. It was detected forthe first time in Sao Tome and Principe, Nigeria, Benin, and Togo in 2016 [2]. To date, the presence ofS. frugiperda has been reported in more than 30 sub-Saharan countries [3,4]. It has been documented tofeed on 353 host plants belonging to 76 plant families, mainly Poaceae, Asteraceae, and Fabaceae [5].
Agriculture 2020, 10, 430; doi:10.3390/agriculture10100430 www.mdpi.com/journal/agriculture7
Agriculture 2020, 10, 430
In the absence of proper management methods, S. frugiperda has the potential to cause maize yieldlosses of 8.3 to 20.6 million metric tons per year in 12 of Africa’s maize producing countries, whichrepresents a range of 21 to 53% of the annual production of maize [4]. The value of these losses rangedfrom US$ 2.48 billion and US$ 6.19 billion [4]. In Benin, S. frugiperda attacks mainly maize crops [6].Surveys carried out in 2016 by the Ministry of Agriculture, Livestock, and Fisheries of Benin revealedthat over 395,000 ha of maize were damaged, resulting in a loss of 415,000 tons, or 30% of nationalproduction [6]. Therefore, it represents a threat to the country’s food security and economy.
The main management methods used in America against S. frugiperda are synthetic pesticides andgenetically modified crop varieties [7]. Several studies have indicated that S. frugiperda is resistant toseveral insecticides such as pyrethroids, organophosphorus, and carbamates [8,9]. In addition, recentstudies have shown resistance of S. frugiperda to several genetically modified varieties of maize such asMON89034, TC1507, and NK603 [10–13]. Therefore, alternative methods that reduce the applicationof synthetic pesticides and that use botanicals and natural enemies are recommended in Africa [1,4].Information on farmers’ knowledge and management practices are essential for developing appropriatemanagement methods suited to farmers’ need [14–16]. Farmers develop knowledge and managementpractices and have their own ideas on how to solve a given problem in the practical and economicalways [17]. One of the main barriers to implementing a pest management program has been shown tobe the lack of information about farmers’ knowledge, perceptions, and management practices [18].
In the literature, two complementary approaches to the development and extension of technologiesare known: conventional and participatory approaches. Some critics to conventional approach viewedit as a linear process of practical application of scientific knowledge [19], where farmers’ knowledgecould be overlooked in the development of technologies [20]. African farmers are well-known asinnovators and experimenters [21]. The participatory approach addresses the limits of the conventionalapproach by considering farmers’ knowledge and involving farmers in the process of developmentand extension of technologies [22,23].
In this study, knowledge refers to what farmers know about the biology and ecology of S. frugiperda.Perception refers to how farmers perceive S. frugiperda attacks, the damage caused by this pest, and theeffectiveness of the management practices they use. The identification of pests and the quantificationof their damage by farmers could be quite different and less accurate than that of a trained expert.Nevertheless, they provide crucial information, as farmers make decisions based on what they think isthe problem [24]. Management practices used by farmers are the cumulative result of their knowledgeand perceptions of the pest and depend on access to pesticides. These knowledge and perceptionsare often specific to each region [25] and influenced by many socio-economic factors, for examplemembership in a farmer organization [26,27].
Farmers’ knowledge and management strategies for S. frugiperda have been poorly documentedsince its appearance in Africa. Thus far, the only study specifically focusing on farmers’ knowledge ofS. frugiperda has been carried out by Kumela et al. [28] in Kenya and Ethiopia. Their results revealedfarmers’ knowledge on S. frugiperda infestation, damage, and development stages. The managementpractices of farmers, such as the use of synthetic pesticides, plant extracts, handpicking of larvae, andapplication of soil to maize whorls were also reported by the same study. However, specific informationregarding natural enemies, host, and repellent plants known by farmers has not been reported,though these are important for developing sustainable pest management methods. Additionally,the effectiveness of the different management practices adopted by farmers has not been addressed.The objective of the current study was to improve the understanding of the behaviour of maize farmersregarding the invasion of S. frugiperda in Benin. A national survey was carried out to assess farmers’knowledge of the pest, their perceptions, and management practices. We hypothesize that farmerscould develop effective management strategies against S. frugiperda based on their knowledge andperceptions. This study will be useful to define the actions required for the sustainable management ofS. frugiperda.
8

Agriculture 2020, 10, 430
2. Materials and Methods
2.1. Study Area
The study was conducted in 19 districts distributed in the three climatic zones of Benin: theSudanian zone, the Sudano-Guinean zone, and the Guinean zone. Each of these zones has specificclimatic characteristics (Table 1) [29].
Table 1. Characteristics of Benin’s climatic zones.
Parameters Sudanian Zone Sudano-Guinean Zone Guinean Zone
Annual rainfall range (mm) 1200 900–1110 <1000
Temperature range (◦C) 25–29 25–29 24–31
Relative humidity range (%) 69–97 31–98 18–99
The choice of districts was made considering the statistics on the quantity of maize produceddistrict published by CountrySTAT and the diagnosis of the Agricultural Development Poles carriedout by the National Agricultural Research Institute of Benin (INRAB) in 2018. The location of thesedistricts is shown in Figure 1.
Figure 1. Map of Benin showing the location of the surveyed districts.
9
Agriculture 2020, 10, 430
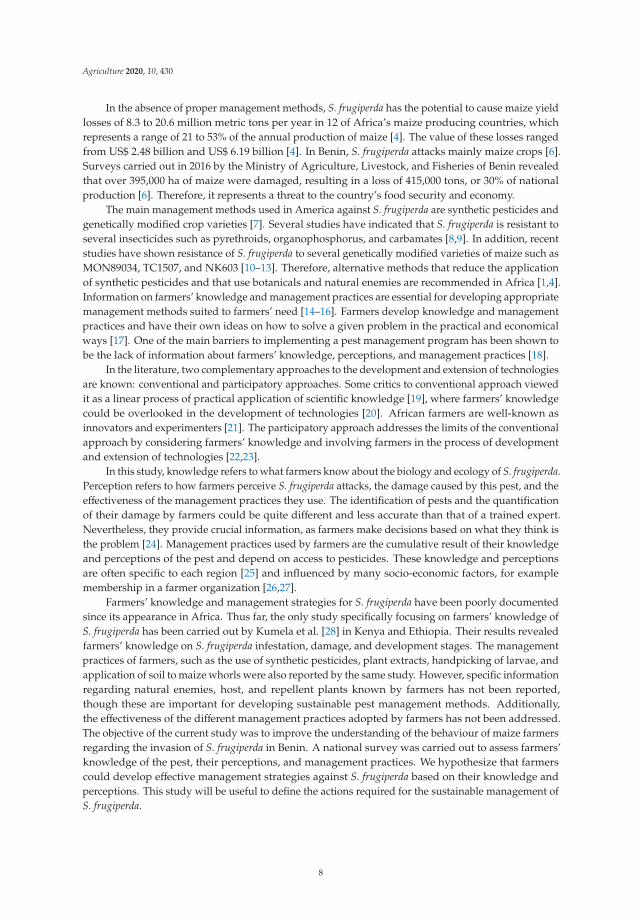
2.2. Data Collection
In each district, two maize producing villages were randomly selected. About 33 maize farmerswere face-to-face interviewed per village by surveyors using a standardized questionnaire. The finalsample consisted of 1237 maize farmers. The surveys were conducted from October to December2018. The data collected included the socio-economic profile of farmers (Table 2). In addition, datawere collected on farm characteristics, knowledge, and perceptions of S. frugiperda, periods of attack,severity of damage, yield losses, trends in the spread of S. frugiperda attacks, farmer managementpractices, and their effectiveness.
Table 2. Descriptive statistics on the socio-economic profiles of the surveyed farmers.
Quantitative Variables MeansStandard
Deviations
Age 41.9 12.3
Farm experience (year) 19.5 11.8
Household size 9.2 6.7
Qualitative Variables Numbers Frequency (%)
Education levels
None 757 61.2
Primary 266 21.5
Secondary 198 16.0
Tertiary 15 1.2
Main activity
Crop production 1144 92.6
Livestock production 14 1.1
Food processing 2 0.2
Trade 23 1.9
Employee (public or private) 9 0.7
Crafts (e.g., sewing, hairdressing) 22 1.8
Other activities (car drivers andmotorbike-taxi riders) 22 1.8
Secondaryactivities
Crop production 92 8.9
Livestock production 378 36.5
Food processing 157 15.2
Trade 165 15.9
Employee (public or private) 16 1.5
Crafts (e.g., sewing, hairdressing) 78 7.5
Other activities (car drivers andmotorbike-taxi riders) 150 14.5
Gender (Female) 208 16.8
Member of a farmer organization (yes) 433 35.0
Contact with research or extension services (yes) 432 35.1
Participation in pest management training (yes) 80 6.5
Yield losses in this study were estimated by farmers. They compared maize yield before andafter the invasion of S. frugiperda. To prevent farmers from confusing attacks of S. frugiperda withthose of other maize pests, colour photographic images showing the condition of a field attackedby S. frugiperda, the stages of S. frugiperda development, the severity of attack and other maize pestsfrequently encountered in Benin were included in the questionnaire.
10

Agriculture 2020, 10, 430
The Likert scale techniques [30] have been used to collect data on the management practiceseffectiveness among farmers who have applied at least one management practice. The Likert scaleused has been labelled as follows: 1—totally ineffective, 2—ineffective, 3—relatively ineffective,4—indifferent, 5—relatively effective, 6—effective, and 7—totally effective.
2.3. Data Analysis
The collected data were analysed using descriptive statistics (frequencies, means, and standarddeviations). Chi-square tests were also applied to analyse the relationships between knowledge ofS. frugiperda, perception of damage and socio-economic characteristics of farmers; between croppingpractices (cropping systems, application of mineral fertilizers, and types of grown varieties) andseverity of S. frugiperda attack; and between farmer protection practices and knowledge of S. frugiperda.Chi-square tests are valid when the values of the cells in the contingency table are greater than 1and at least 80% of these values are greater than 5 [31]. Mean scores were calculated on the effectivedata collected.
3. Results
3.1. Socio-Economic Profile of Farmers
The surveyed farmers were mostly men (83.2%), and their household had an average of ninepeople. The number of years of experience in maize production averaged 19.5 years. About 61.2% offarmers were illiterate. They practised agriculture as their main activity (92.6%). Livestock production(e.g., poultry, goat, sheep, cattle, or pigs), food processing, and trade were their secondary activities.About 35% of them belonged to a farmer organization and had contacts with research or extensionservices. Six-point five percent of farmers had received training in crop pest management (Table 2).
3.2. Farmers’ Knowledge and Perceptions of S. frugiperda Attacks
Most farmers (91.8%) recognized the damage of S. frugiperda on maize crop. The majority (78.9%)of them were able to identify the pest during its larval stage (Table 3). Farmers (88.6%) observed theactivities of S. frugiperda in their maize fields (Table 3). They recorded the first attacks of S. frugiperdain 2015 and 2016. They perceived S. frugiperda as a new pest. Currently, there is no name in locallanguages to specifically refer to S. frugiperda.
Table 3. Farmers’ knowledge and perceptions of S. frugiperda.
Variables Numbers Frequency (%)
Knowledge of S. frugiperda damage (Yes) 1136 91.8
Knowledge ofS. frugiperda
development stages
Egg (yes) 96 7.8
Larva (yes) 975 78.9
Pupa (yes) 392 31.7
Adult (yes) 297 24.0
Farmer informationsources on S. frugiperda
Own observation in the field (yes) 1095 88.6
Village residents (yes) 86 7.0
Extension agents (yes) 36 2.9
Medias (radio/television) (yes) 69 5.6
Residents of neighbouring localities(yes) 51 4.1
11
Agriculture 2020, 10, 430
Table 3. Cont.
Variables Numbers Frequency (%)
Perception of thevulnerability of maize
plants according to theirdevelopment stages
Emergence (yes) 70 5.7
1 WAP 1 (yes) 312 25.2
2 WAP (yes) 508 41.1
4 WAP (yes) 436 35.3
6 WAP (yes) 307 24.8
8 WAP (yes) 158 12.8
10 WAP (yes) 79 6.4
Severe attack periods
Period of light rain 1035 88.2
Period of heavy rain 132 11.2
Period of light and heavy rain 6 0.5
Trend in the spread ofS. frugiperda attacks
Decrease 161 13.3
Stable 85 7.0
Increase 963 79.71 Weeks After Planting (WAP). (n = 1237).
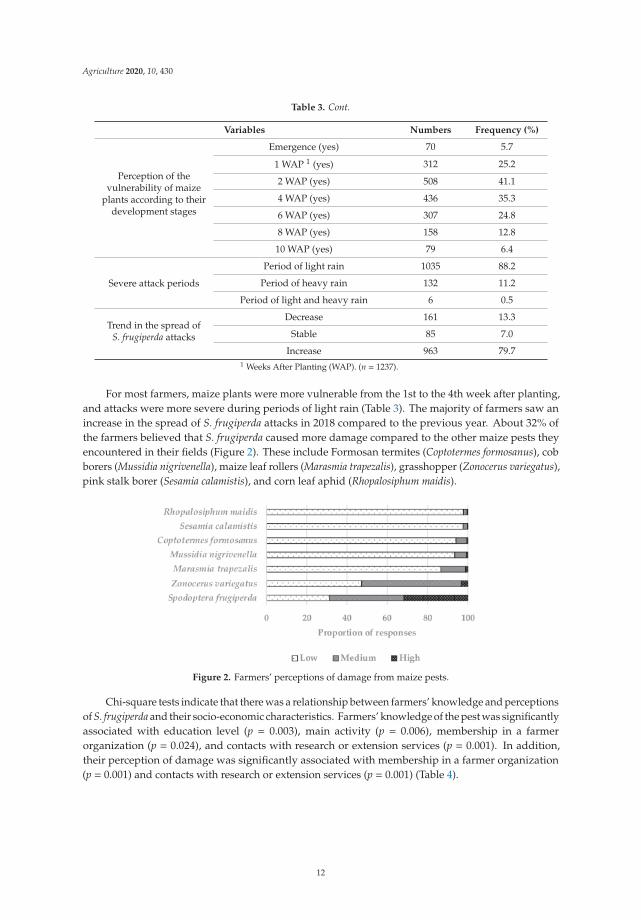
For most farmers, maize plants were more vulnerable from the 1st to the 4th week after planting,and attacks were more severe during periods of light rain (Table 3). The majority of farmers saw anincrease in the spread of S. frugiperda attacks in 2018 compared to the previous year. About 32% ofthe farmers believed that S. frugiperda caused more damage compared to the other maize pests theyencountered in their fields (Figure 2). These include Formosan termites (Coptotermes formosanus), cobborers (Mussidia nigrivenella), maize leaf rollers (Marasmia trapezalis), grasshopper (Zonocerus variegatus),pink stalk borer (Sesamia calamistis), and corn leaf aphid (Rhopalosiphum maidis).
Figure 2. Farmers’ perceptions of damage from maize pests.
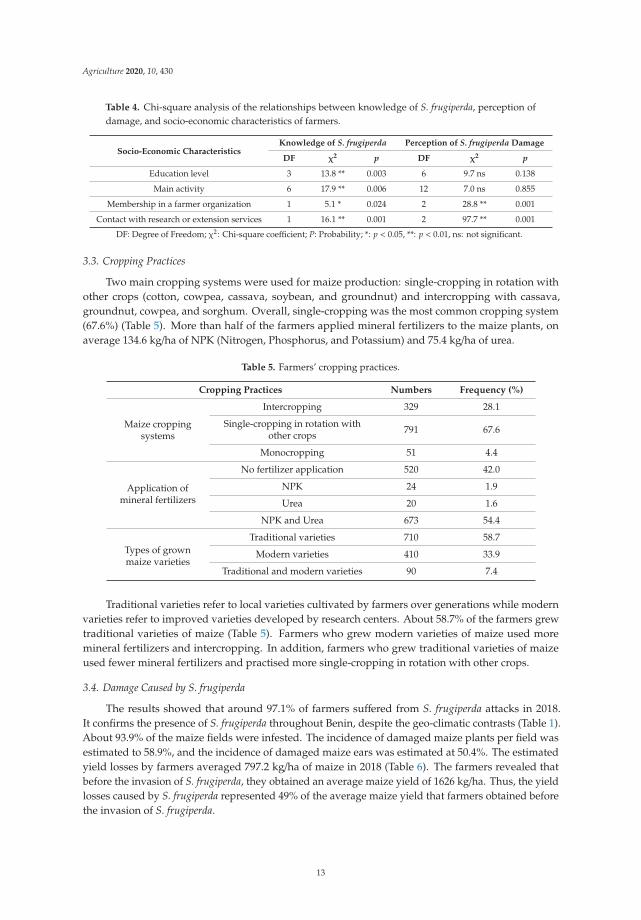
Chi-square tests indicate that there was a relationship between farmers’ knowledge and perceptionsof S. frugiperda and their socio-economic characteristics. Farmers’ knowledge of the pest was significantlyassociated with education level (p = 0.003), main activity (p = 0.006), membership in a farmerorganization (p = 0.024), and contacts with research or extension services (p = 0.001). In addition,their perception of damage was significantly associated with membership in a farmer organization(p = 0.001) and contacts with research or extension services (p = 0.001) (Table 4).
12
Agriculture 2020, 10, 430
Table 4. Chi-square analysis of the relationships between knowledge of S. frugiperda, perception ofdamage, and socio-economic characteristics of farmers.
Socio-Economic CharacteristicsKnowledge of S. frugiperda Perception of S. frugiperda Damage
DF χ2 p DF χ2 p
Education level 3 13.8 ** 0.003 6 9.7 ns 0.138
Main activity 6 17.9 ** 0.006 12 7.0 ns 0.855
Membership in a farmer organization 1 5.1 * 0.024 2 28.8 ** 0.001
Contact with research or extension services 1 16.1 ** 0.001 2 97.7 ** 0.001
DF: Degree of Freedom; χ2: Chi-square coefficient; P: Probability; *: p < 0.05, **: p < 0.01, ns: not significant.
3.3. Cropping Practices
Two main cropping systems were used for maize production: single-cropping in rotation withother crops (cotton, cowpea, cassava, soybean, and groundnut) and intercropping with cassava,groundnut, cowpea, and sorghum. Overall, single-cropping was the most common cropping system(67.6%) (Table 5). More than half of the farmers applied mineral fertilizers to the maize plants, onaverage 134.6 kg/ha of NPK (Nitrogen, Phosphorus, and Potassium) and 75.4 kg/ha of urea.
Table 5. Farmers’ cropping practices.
Cropping Practices Numbers Frequency (%)
Maize croppingsystems
Intercropping 329 28.1
Single-cropping in rotation withother crops 791 67.6
Monocropping 51 4.4
Application ofmineral fertilizers
No fertilizer application 520 42.0
NPK 24 1.9
Urea 20 1.6
NPK and Urea 673 54.4
Types of grownmaize varieties
Traditional varieties 710 58.7
Modern varieties 410 33.9
Traditional and modern varieties 90 7.4
Traditional varieties refer to local varieties cultivated by farmers over generations while modernvarieties refer to improved varieties developed by research centers. About 58.7% of the farmers grewtraditional varieties of maize (Table 5). Farmers who grew modern varieties of maize used moremineral fertilizers and intercropping. In addition, farmers who grew traditional varieties of maizeused fewer mineral fertilizers and practised more single-cropping in rotation with other crops.
3.4. Damage Caused by S. frugiperda
The results showed that around 97.1% of farmers suffered from S. frugiperda attacks in 2018.It confirms the presence of S. frugiperda throughout Benin, despite the geo-climatic contrasts (Table 1).About 93.9% of the maize fields were infested. The incidence of damaged maize plants per field wasestimated to 58.9%, and the incidence of damaged maize ears was estimated at 50.4%. The estimatedyield losses by farmers averaged 797.2 kg/ha of maize in 2018 (Table 6). The farmers revealed thatbefore the invasion of S. frugiperda, they obtained an average maize yield of 1626 kg/ha. Thus, the yieldlosses caused by S. frugiperda represented 49% of the average maize yield that farmers obtained beforethe invasion of S. frugiperda.
13

Agriculture 2020, 10, 430
Table 6. Indicators of damage caused by S. frugiperda according to farmers.
Incidence and Maize Yield Losses Means Standard Deviations
Incidence of infested maize fields 93.9 18.1
Incidence of damaged plants per infested field 58.9 22.6
Incidence of damaged ears 50.4 20.7
Maize yield losses (kg/ha) 797.2 613.6
Damage severity for farmers who suffered fromS. frugiperda attacks (n = 1198)
Numbers Frequency (%)
Severity of S. frugiperdaattack on maize leaves
Low 130 10.6
Medium 1003 81.7
High 95 7.7
Severity of S. frugiperdaattack on maize ears
Low 324 26.6
Medium 819 67.1
High 77 6.3
The analysis of the severity of S. frugiperda attacks was carried out by distinguishing the differentparts of the attacked maize plants, in particular the leaves and ears. The majority of farmers reportedthat S. frugiperda attacks were moderately severe on the leaves and ears (Table 6). At the time of theattack, they found large elongated perforations on the leaves, whorl attack and damage ranging from15 to 25% of maize grains.
Chi-square tests showed that there was a relationship between the severity of S. frugiperda attackand the types of grown maize varieties. The severity of S. frugiperda attack on the leaves and ears wassignificantly associated with types of grown maize varieties (p = 0.001). S. frugiperda attacks were moresevere for modern varieties of maize. There was no significant relationship between the croppingsystems, application of mineral fertilizers, and attack severity (Table 7).
Table 7. Chi-square test analysis of the relationship between cropping practices and the severity ofS. frugiperda damage.
Cropping PracticesSeverity of S. frugiperda Attack on the Leaves Severity of S. frugiperda Attack on the Ears
DF χ2 p DF χ2 p
Maize cropping systems 4 8.1 ns 0.088 4 6.3 ns 0.176
Types of grown maize varieties 4 165.0 ** 0.001 4 173.7 ** 0.001
Application of mineral fertilizers 6 7.5 ns 0.275 6 10.4 ns 0.110
DF: Degree of Freedom; χ2: Chi-square value; p: Probability; **: p < 0.01, ns: not significant.
3.5. Knowledge of Natural Enemies, Host and Repellent Plants of S. frugiperda
About 16% of farmers stated knowing insects and birds that feed on S. frugiperda larvae.They identified the francolin (Francolinus bicalcaratus), the village weaver (Ploceus cucullatus), and thecommon wasp (Vespula vulgaris) as natural enemies of S. frugiperda. For 14% of farmers, S. frugiperdacould destroy other crops besides maize. They said the pest could damage sorghum, cotton, cowpea,and tomato crops.
In addition, about 5% of farmers stated knowing plants that repel S. frugiperda. They identifiedyellow nutsedge (Cyperus esculentus), chan (Hyptis suaveolens), shea tree (Vitellaria paradoxa), neem(Azadirachta indica), tamarind (Tamarindus indica), and soybean (Glycine max) as repellent plants ofS. frugiperda.
14
Agriculture 2020, 10, 430
3.6. Farmers’ Management Practices
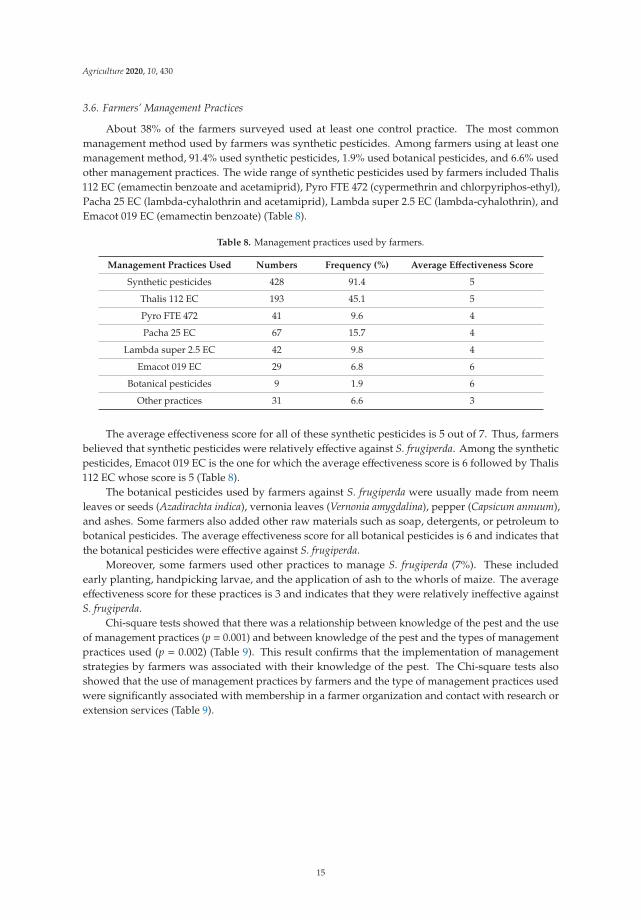
About 38% of the farmers surveyed used at least one control practice. The most commonmanagement method used by farmers was synthetic pesticides. Among farmers using at least onemanagement method, 91.4% used synthetic pesticides, 1.9% used botanical pesticides, and 6.6% usedother management practices. The wide range of synthetic pesticides used by farmers included Thalis112 EC (emamectin benzoate and acetamiprid), Pyro FTE 472 (cypermethrin and chlorpyriphos-ethyl),Pacha 25 EC (lambda-cyhalothrin and acetamiprid), Lambda super 2.5 EC (lambda-cyhalothrin), andEmacot 019 EC (emamectin benzoate) (Table 8).
Table 8. Management practices used by farmers.
Management Practices Used Numbers Frequency (%) Average Effectiveness Score
Synthetic pesticides 428 91.4 5
Thalis 112 EC 193 45.1 5
Pyro FTE 472 41 9.6 4
Pacha 25 EC 67 15.7 4
Lambda super 2.5 EC 42 9.8 4
Emacot 019 EC 29 6.8 6
Botanical pesticides 9 1.9 6
Other practices 31 6.6 3
The average effectiveness score for all of these synthetic pesticides is 5 out of 7. Thus, farmersbelieved that synthetic pesticides were relatively effective against S. frugiperda. Among the syntheticpesticides, Emacot 019 EC is the one for which the average effectiveness score is 6 followed by Thalis112 EC whose score is 5 (Table 8).
The botanical pesticides used by farmers against S. frugiperda were usually made from neemleaves or seeds (Azadirachta indica), vernonia leaves (Vernonia amygdalina), pepper (Capsicum annuum),and ashes. Some farmers also added other raw materials such as soap, detergents, or petroleum tobotanical pesticides. The average effectiveness score for all botanical pesticides is 6 and indicates thatthe botanical pesticides were effective against S. frugiperda.
Moreover, some farmers used other practices to manage S. frugiperda (7%). These includedearly planting, handpicking larvae, and the application of ash to the whorls of maize. The averageeffectiveness score for these practices is 3 and indicates that they were relatively ineffective againstS. frugiperda.
Chi-square tests showed that there was a relationship between knowledge of the pest and the useof management practices (p = 0.001) and between knowledge of the pest and the types of managementpractices used (p = 0.002) (Table 9). This result confirms that the implementation of managementstrategies by farmers was associated with their knowledge of the pest. The Chi-square tests alsoshowed that the use of management practices by farmers and the type of management practices usedwere significantly associated with membership in a farmer organization and contact with research orextension services (Table 9).
15

Agriculture 2020, 10, 430
Table 9. Chi-square test analysis of the relationships between farmers’ management practices,knowledge, perceptions, and socio-economic characteristics.
Socio-Economic CharacteristicsUse of Management Practices Type of Management Practices
DF χ2 p DF χ2 p
Knowledge of S. frugiperda 1 24.7 ** 0.001 2 12.3 ** 0.002
Perception of S. frugiperda damage 2 67.3 ** 0.001 4 5.6 ns 0.234
Education levels 3 4.4 ns 0.218 6 2.2 ns 0.903
Main activity 6 7.1 ns 0.312 10 9.8 ns 0.457
Membership in a farmer organization 1 41.1 ** 0.001 2 6.1 * 0.047
Contact with research or extensionservices 1 41.9 ** 0.001 2 7.2 * 0.027
DF: Degree of Freedom; χ2: Chi-square coefficient; p: Probability; *: p < 0.05, **: p < 0.01, ns: not significant.
4. Discussion
4.1. Farmers’ Knowledge and Perceptions of S. frugiperda Attacks
In this study, most maize farmers recognized the damage of S. frugiperda and were able to identifyit at its larval stage. Some farmers (7.8 to 31.7%) were able to identify other development stages ofS. frugiperda, including eggs, pupae, and adults. The identification of these development stages requiresa better knowledge of the biology of the pest [4].
The first attack of S. frugiperda was recorded in 2015 by some farmers. According to Goergen et al. [2],the attacks of S. frugiperda were first reported in West and Central Africa in early 2016. From farmers’perception, it could be inferred that S. frugiperda was present in Benin before 2016, but its damagebecame significant from 2016.
As well, the study showed that farmers’ knowledge and perceptions of S. frugiperda wereassociated with their membership in a farmer organization and their contact with research or extensionservices. Therefore, the institutional environment of farmers could play a crucial role in the sustainablemanagement of S. frugiperda.
4.2. Damage Caused by S. frugiperda
S. frugiperda was present throughout Benin despite the geo-climatic contrasts. The life cycle of thepest lasts, on average, 30 days and the optimal temperatures for adults and larvae are 25 ◦C and 30 ◦Crespectively [32]. In Benin, the temperature varies between 24 and 31 ◦C depending on the climaticzones [29]. Thus, the country offers favourable climatic conditions for the permanent reproduction ofthis pest.
Yield losses caused by S. frugiperda averaged 797 kg of maize per hectare, or 49% of the averagemaize yield obtained by farmers before the invasion of S. frugiperda. This result corroborates forecastsby the Centre for Agriculture and Bioscience International (CABI), indicating that S. frugiperda couldcause a loss of 40% of the average annual maize production in Benin [33]. In Kenya and Ethiopia,yield losses were greater. They ranged from 0.8 to 1 ton of maize per ha [28]. The differences in yieldlosses between countries could be explained by the levels of infestation which may depend on climaticfactors, management practices used by farmers and insecticide availabilities. In Nicaragua, Hruskaand Gould [34] demonstrated a positive relationship between yield losses and levels of S. frugiperdainfestation. For them, infestations of 55 to 100% of maize plants could cause yield losses ranging from15 to 73%.
The severity of the pest attacks was not significantly associated with cropping systems.Andrews [35] showed that intercropping was less severely attacked by S. frugiperda than monocroppingand that intercropping could reduce damage by up to 30%. Furthermore, Baudron et al. [36]demonstrated that frequent weeding and no-till sowing reduced the damage of S. frugiperda. As well,yield losses due to S. frugiperda attacks have been shown to vary with planting dates. Some farmers
16

Agriculture 2020, 10, 430
in Kenya reported significant yield losses on late-planted maize plots compared to plots plantedearlier [3].
Moreover, the severity of S. frugiperda attack was associated with the types of grown maizevarieties. The attacks were more severe for modern varieties than traditional varieties. This means thatthe modern varieties used in Benin were not resistant to S. frugiperda attacks. Some papers reportedthat yield loss of modern varieties due to S. frugiperda was not significant when they received adequatefertilizers or when they were planted on rich soils [36,37]. Certainly in this research, farmers lackedin supplying enough fertilizers that may reinforce modern varieties defense against S. frugiperda.The perception of farmers about the resistance of traditional varieties to S. frugiperda suggests thatthese varieties may contain resistant genes that need to be investigated. In terms of managementstrategies, increasing the diversification of varieties could be one of the means of effective managementof S. frugiperda, in addition to identify the resistance traits of traditional varieties and breed them intomodern varieties.
4.3. Farmers’ Knowledge of Natural Enemies and Host Plants of S. frugiperda
Some farmers identified the francolin, the village weaver, and the common wasp as naturalenemies of S. frugiperda. The francolin and the village weaver are known in the literature as birdspecies that feed on a wide variety of plants and insects. Thus, they could truly be natural enemies ofS. frugiperda. However, they are classified as the main grain-eating birds in maize field [38]. In general,insectivorous birds play an important role in reducing pest abundance in various agro-ecologicalsystems. Some bird species may be able to extract S. frugiperda larvae from whorls and husks [39].These birds are able to cause significant additional damage to plants [38]. Regarding the natural enemyfunction of the common wasp, studies confirm the perception of farmers. In a study in Brazil, waspspicked an average of 1.54 larvae per colony per hour and predated 77% of S. frugiperda present in maizeplots (1 colony per 25 m2), providing effective control [39].
Other natural enemies of S. frugiperda have been recorded in West Africa. In Benin and Ghana, tenspecies were found parasitizing S. frugiperda among which two egg parasitoids (Telenomus remus Dixonand Trichogramma sp.), one egg–larval (Chelonus bifoveolatus Szépligeti), five larval (Coccygidium luteum(Brullé), Cotesia icipe Fernandez-Triana and Fiaboe, Charops sp., Pristomerus pallidus (Kriechbaumer) andDrino quadrizonula (Thomson)), and two larval–pupal parasitoids (Meteoridea cf. testacea (Granger) andMetopius discolor Tosquinet) [40]. Three predator species, namely Pheidole megacephala (F.), Haematocharesobscuripennis Stål and Peprius nodulipes (Signoret), were recorded in Ghana [41].
As well, some farmers reported pest attacks in the sorghum, cotton, cowpea, and tomato fields.All these crops are among the 353 host plants of S. frugiperda larvae inventoried in Brazil [5].
4.4. Farmers’ Knowledge of Repellent Plants of S. frugiperda
Farmers identified yellow nutsedge, chan, shea tree, neem, tamarind, and soybean as repellentplants of S. frugiperda through their experiments. They considered that the presence of these plants nearor in the maize fields coincided with the low infestations of S. frugiperda. Some of these plants may actas a trap plant as a push pull system [4]. Peruca et al. [42] studied the harmful effects of soybean plantson S. frugiperda. They confirm that soybean plants could activate chemical defence mechanisms thatalter the developmental cycle of S. frugiperda, suggesting effective cultural control options. Several otherstudies showed the effectiveness of neem extracts against S. frugiperda. Magrini et al. [43] concludedthat neem derivatives had potent and adverse antifeedant effects on all stages of larval developmentof S. frugiperda. Tavares et al. [44] recommended neem oil to manage S. frugiperda due to its hightoxicity. Zuleta-Castro et al. [45] formulated a botanical product active against S. frugiperda using neemextracts. Adeye et al. [46] found that neem oil at 4.5 l.ha−1 reduced the incidence of pest attacks, theseverity of damage and the loss of maize yield by 42.8% and 57.0%. Regarding the other repellentplants identified by farmers (yellow nutsedge, chan, shea, and tamarind), future studies should becarried out to evaluate the accuracy of farmers’ perception.
17
Agriculture 2020, 10, 430
4.5. Farmers’ Management Practices
Most farmers in Benin used synthetic pesticides to manage S. frugiperda. The same was observedin other African countries such as Ghana, Zambia, Nigeria, Kenya, and Ethiopia [7,28,47]. Syntheticpesticides are indeed easily accessible for farmers. Institutions like USAID and other organizationssuch as FAO advocate low use of synthetic pesticides. However, there is no evidence that farmerscomply with the recommendations of these organizations which advocate the rational and thresholduse of synthetic pesticides. This implies that an effort remains to be deployed by the extension servicesconcerning the use of synthetic pesticides against S. frugiperda.
In Benin, farmers found that chemical control was relatively effective. Farmers’ perceptions of theeffectiveness of chemical control differ from country to country. For example, in Kenya about 60% offarmers found synthetic pesticides ineffective, while Ethiopian farmers claimed that chemical controlwas effective against S. frugiperda [28].
Some farmers who used botanical pesticides thought they were more effective than syntheticpesticides against S. frugiperda. However, these botanical pesticides were little used. This could beexplained by the lack of knowledge on the raw materials and the manufacturing process. The botanicalpesticides used by farmers against S. frugiperda were usually made from neem leaves or seeds, vernonialeaves, pepper, and ash. Some of the farmers also added soaps, detergents, or petroleum to botanicalpesticides. Vernonia is one of the African pesticidal plants selected to improve botanical-based pestmanagement in smallholder agriculture in Africa [48]. However, its effectiveness against S. frugiperdahas not yet been studied. It is the same with pepper, ashes, soaps, detergents, and petroleum. It is upto agricultural research institutions and scientists to refine and standardize botanical pesticides madeby farmers for their scaling up.
The results showed that farmers’ management practices were significantly associated with theirknowledge of the pest and their socio-economic characteristics such as membership of a farmerorganization and contact with research or extension services. It is inferred that farmers’ managementpractices are the result of their knowledge of the pest. Farmer organizations and extension serviceshave the potential to improve farmers’ knowledge and induce behavioural changes in their pestmanagement strategies [49], and thus influence their pest management decisions. As more than half ofthe farmers surveyed were uneducated, extension services should consider disseminating relevantinformation in the local language and doing demonstrations directly in the fields to improve farmers’knowledge and pest management skills.
5. Conclusions
This paper reported on farmers’ knowledge, their perceptions, and management practices theyuse against Spodoptera frugiperda. The majority of farmers use synthetic pesticides which do notalways satisfy them in the management of S. frugiperda. A minority use local practices which seemmore effective according to their perceptions. These essentially ecological local practices deserve tobe studied and scaled up. The study showed that there was a relationship between knowledge ofS. frugiperda and the use of management practices. There was also a relationship between knowledgeof the pest and types of management practices. Therefore, the study confirms that farmers’ knowledgeof the pest is an important factor that influences their decision to manage the pest. Further research isrequired to refine and standardize management practices deemed effective by farmers and to analysefarmers’ willingness to pay for improved management practices.
Author Contributions: Conceptualization, S.H., A.Z., A.A. (Augustin Aoudji), H.C.S., A.S., R.S., E.Z., H.S.T.V.,A.A. (Aristide Adomou) and A.A.(Adam Ahanchédé); methodology, S.H., A.Z., A.A. (Augustin Aoudji) andH.C.S.; formal analysis, S.H. and A.Z.; investigation, S.H.; writing—original draft preparation, S.H. and A.Z.;writing—review and editing, A.Z., A.A. (Augustin Aoudji), H.C.S., A.S., R.S., E.Z., H.S.T.V., A.A. (AristideAdomou) and A.A. (Adam Ahanchédé); supervision, A.Z., A.A. (Augustin Aoudji), H.C.S., A.S., R.S., E.Z., H.S.T.V.,A.A. (Aristide Adomou) and A.A. (Adam Ahanchédé); funding acquisition, UAC and INRAB. All authors readand agreed to the published version of the manuscript.
18

Agriculture 2020, 10, 430
Funding: This research was funded by the SPODOBEN Project under grant PFCR III 2018–2020 of the Universityof Abomey-Calavi (UAC), Benin and the National Institute of Agricultural Research of Benin (INRAB) undergrant SE06–2018.
Acknowledgments: The authors thank the farmers for providing useful information.
Conflicts of Interest: The authors declare no conflict of interest.
References
1. Food and Agriculture Organization of the United Nations. Note d’information de la FAO sur la ChenilleLégionnaire d’automne en Afrique; FAO: Rome, Italy, 2017; pp. 1–2. (In French)
2. Goergen, G.; Kumar, P.L.; Sankung, S.B.; Togola, A.; Tamò, M. First report of outbreaks of the fall armywormSpodoptera frugiperda (J E Smith) (Lepidoptera, Noctuidae), a new alien invasive pest in West and CentralAfrica. PLoS ONE 2016, 11, e0165632. [CrossRef]
3. Food and Agriculture Organization of the United Nations. Integrated Management of the Fall Armyworm onMaize: A Guide for Farmer Field Schools in Africa; FAO: Rome, Italy, 2018; ISBN 978-92-5-130493-8.
4. Prasanna, B.M.; Huesing, J.E.; Eddy, R.; Peschke, V.M. Fall Armyworm in Africa: A Guide for Integrated PestManagement, 3rd ed.; CIMMYT: Mexico City, Mexico, 2018; pp. 11–106.
5. Montezano, D.G.; Specht, A.; Gómez, D.R.S.; Roque-Specht, V.F.; Sousa-Silva, J.; Paula-Moraes, S.;Peterson, J.A.; Hunt, T. Host Plants of Spodoptera frugiperda (Lepidoptera: Noctuidae) in the Americas.Afr. Èntomol. 2018, 26, 286–300. [CrossRef]
6. Ministère de l’Agriculture, de l’Elevage et de la Pêche. Visites des Zones Maïsicoles de la Vallée de Ouémé: Etatdes Lieux des Attaques de la Chenille Légionnaire Spodoptera frugiperda et Mesures Prises par les Producteurs; MAEP:Cotonou, Bénin, 2016; pp. 1–32. (In French)
7. Abrahams, P.; Beale, T.; Cock, M.; Corniani, N.; Day, R.; Godwin, J.; Murphy, S.; Richards, G.; Vos, J. Impactsand control options in Africa: Preliminary Evidence Note; University of Exeter: Exeter, England, 2017; pp. 1–18.
8. Pitre, N.H. Chemical control of the fall armyworm (Lepidoptera: Noctuidae): An update. Fla. Entomol. 1986,69, 570–578. [CrossRef]
9. Yu, S.J. Insecticide resistance in the fall armyworm, Spodoptera frugiperda (J. E. Smith). Pestic. Biochem. Physiol.1991, 39, 84–91. [CrossRef]
10. Farias, J.R.; Andow, D.A.; Horikoshi, R.J.; Sorgatto, R.J.; Fresia, P.; dos Santos, A.C.; Omoto, C. Field-evolvedresistance to Cry1F maize by Spodoptera frugiperda (Lepidoptera: Noctuidae) in Brazil. Crop. Prot. 2014, 64,150–158. [CrossRef]
11. Bernardi, D.; Salmeron, E.; Horikoshi, R.J.; Bernardi, O.; Dourado, P.M.; Carvalho, R.A.; Martinelli, S.;Head, G.P.; Omoto, C. Cross-Resistance between Cry1 Proteins in Fall Armyworm (Spodoptera frugiperda)May Affect the Durability of Current Pyramided Bt Maize Hybrids in Brazil. PLoS ONE 2015, 10, e0140130.[CrossRef]
12. Miraldo, L.L.; Bernardi, O.; Horikoshi, R.J.; e Amaral, F.S.A.; Bernardi, D.; Omoto, C. Functional dominanceof different aged larvae of Bt-resistant Spodoptera frugiperda (Lepidoptera: Noctuidae) on transgenic maizeexpressing Vip3Aa20 protein. Crop. Prot. 2016, 88, 65–71. [CrossRef]
13. Bernardi, D.; Bernardi, O.; Horikoshi, R.J.; Salmeron, E.; Okuma, D.M.; Farias, J.R.; do Nascimento, A.R.B.;Omoto, C. Selection and characterization of Spodoptera frugiperda (Lepidoptera: Noctuidae) resistance toMON 89034 × TC1507 × NK603 maize technology. Crop. Prot. 2017, 94, 64–68. [CrossRef]
14. Joshi, R.C.; Matchoc, O.R.O.; Bahatan, R.G.; Pena, F.A.D. Farmers’ knowledge, attitudes and practices ofrice crop and pest management at Ifugao Rice Terraces, Philippines. Int. J. Pest. Manag. 2000, 46, 43–48.[CrossRef]
15. Obopile, M.; Munthali, D.C.; Matilo, B. Farmers’ knowledge, perceptions and management of vegetablepests and diseases in Botswana. Crop. Prot. 2008, 27, 1220–1224. [CrossRef]
16. Mendesil, E.; Shumeta, Z.; Anderson, P.; Rämert, B. Smallholder farmers’ knowledge, perceptions andmanagement of pea weevil in north and north-western Ethiopia. Crop. Prot. 2016, 81, 30–37. [CrossRef]
17. Allahyari, M.S.; Damalas, C.A.; Ebadattalab, M. Farmers’ Technical Knowledge about Integrated PestManagement (IPM) in Olive Production. Agriculture 2017, 7, 101. [CrossRef]
18. Van Mele, P.V.; Cuc, N.T.T.; Huis, A.V. Farmers’ knowledge, perceptions and practices in mango pestmanagement in the Mekong Delta, Vietnam. Int. J. Pest. Manag. 2001, 47, 7–16. [CrossRef]
19
Agriculture 2020, 10, 430
19. Vissoh, P.V. Participatory Development of Weed Management Technologies in Benin; Tropical resource ManagementPapers; Wageningen University: Wageningen, The Netherlands, 2006; ISBN 978-90-8585-100-4.
20. Yang, P.; Iles, M.; Yan, S.; Jolliffe, F. Farmers’ knowledge, perceptions and practices in transgenic Bt cotton insmall producer systems in Northern China. Crop. Prot. 2005, 24, 229–239. [CrossRef]
21. Zannou, A. Socio-Economic, Agronomic and Molecular Analysis of Yam and Cowpea Diversity inthe Guinea-Sudan Transition Zone of Benin. Ph.D. Thesis, Wageningen University, Wageningen,The Netherlands, 2006.
22. Kuramoto, J.; Sagasti, F. Integrating Local and Global Knowledge, Technology and Production Systems:Challenges for Technical Cooperation. Sci. Technol. Soc. 2002, 7, 215–247. [CrossRef]
23. Chiffoleau, Y.; Desclaux, D. Participatory plant breeding: The best way to breed for sustainable agriculture?Int. J. Agric. Sustain. 2006, 4, 119–130. [CrossRef]
24. Schreinemachers, P.; Balasubramaniam, S.; Boopathi, N.M.; Ha, C.V.; Kenyon, L.; Praneetvatakul, S.;Sirijinda, A.; Le, N.T.; Srinivasan, R.; Wu, M.-H. Farmers’ perceptions and management of plant viruses invegetables and legumes in tropical and subtropical Asia. Crop. Prot. 2015, 75, 115–123. [CrossRef]
25. Trutmann, P.; Voss, J.; Fairhead, J. Local knowledge and farmer perceptions of bean diseases in the centralAfrican highlands. Agric. Hum. Values 1996, 13, 64–70. [CrossRef]
26. Midega, C.A.O.; Nyang’au, I.M.; Pittchar, J.; Birkett, M.A.; Pickett, J.A.; Borges, M.; Khan, Z.R. Farmers’perceptions of cotton pests and their management in western Kenya. Crop. Prot. 2012, 42, 193–201. [CrossRef]
27. Khan, Z.R.; Midega, C.A.O.; Nyang’au, I.M.; Murage, A.; Pittchar, J.; Agutu, L.O.; Amudavi, D.M.; Pickett, J.A.Farmers’ knowledge and perceptions of the stunting disease of Napier grass in Western Kenya. Plant. Pathol.2014, 63, 1426–1435. [CrossRef]
28. Kumela, T.; Simiyu, J.; Sisay, B.; Likhayo, P.; Mendesil, E.; Gohole, L.; Tefera, T. Farmers’ knowledge,perceptions, and management practices of the new invasive pest, fall armyworm (Spodoptera frugiperda) inEthiopia and Kenya. Int. J. Pest. Manag. 2019, 65, 1–9. [CrossRef]
29. Mensah, S.; Houehanou, T.D.; Sogbohossou, E.A.; Assogbadjo, A.E.; Glèlè Kakaï, R. Effect of human disturbanceand climatic variability on the population structure of Afzelia africana Sm. ex pers. (Fabaceae–Caesalpinioideae)at country broad-scale (Bénin, West Africa). S. Afr. J. Bot. 2014, 95, 165–173. [CrossRef]
30. Rutsaert, P.; Pieniak, Z.; Regan, Á.; McConnon, Á.; Verbeke, W. Consumer interest in receiving informationthrough social media about the risks of pesticide residues. Food Control. 2013, 34, 386–392. [CrossRef]
31. Glèlè Kakaï, R.; Lykke, A.M. Aperçu sur les méthodes statistiques univariées utilisées dans les études devégétation. Ann. Sci. Agron. 2016, 20, 113–138. (In French)
32. Capinera, J.L. Fall Armyworm, Spodoptera frugiperda (J.E. Smith) (Insecta: Lepidoptera: Noctuidae); UF/IFASExtension: Gainesville, FL, USA, 2017; pp. 1–6.
33. Day, R.; Abrahams, P.; Bateman, M.; Beale, T.; Clottey, V.; Cock, M.; Colmenarez, Y.; Corniani, N.; Early, R.;Godwin, J.; et al. Fall Armyworm: Impacts and Implications for Africa. Outlooks Pest. Manag. 2017, 28,196–201. [CrossRef]
34. Hruska, A.J.; Gould, F. Fall Armyworm (Lepidoptera: Noctuidae) and Diatraea lineolata (Lepidoptera:Pyralidae): Impact of larval population level and temporal occurrence on maize yield in Nicaragua.J. Econ. Entomol. 1997, 90, 611–622. [CrossRef]
35. Andrews, K.L. Latin American Research on Spodoptera frugiperda (Lepidoptera: Noctuidae). Fla. Entomol.1988, 71, 630–653. [CrossRef]
36. Baudron, F.; Zaman-Allah, M.A.; Chaipa, I.; Chari, N.; Chinwada, P. Understanding the factors influencingfall armyworm (Spodoptera frugiperda J.E. Smith) damage in African smallholder maize fields and quantifyingits impact on yield. A case study in Eastern Zimbabwe. Crop. Prot. 2019, 120, 141–150. [CrossRef]
37. Kansiime, K.M.; Mugambi, I.; Rwomushana, I.; Nunda, W.; Lamontagne-Godwin, J.; Rware, H.; Phiri, A.N.;Chipabika, G.; Ndlovud, M.; Daya, R. Farmer perception of fall armyworm (Spodoptera frugiperda J.E. Smith)and farm-level management practices in Zambia. Pest. Manag. Sci. 2019, 75, 2840–2850. [CrossRef]
38. Sikirou, R.; Nakouzi, S.; Adanguidi, J.; Bahama, J. Reconnaissance des Ravageurs du maïs en Culture au Bénin etMéthodes de lute—Fiche Technique; FAO: Cotonou, Benin, 2018; pp. 7–28.
39. Harrison, R.D.; Thierfelder, C.; Baudron, F.; Chinwada, P.; Midega, C.; Schaffner, U.; van den Berg, J.Agro-ecological options for fall armyworm (Spodoptera frugiperda JE Smith) management: Providing low-cost,smallholder friendly solutions to an invasive pest. J. Environ. Manag. 2019, 243, 318–330. [CrossRef]
20

Agriculture 2020, 10, 430
40. Agboyi, K.L.; Goergen, G.; Beseh, P.; Mensah, A.S.; Clottey, A.V.; Glikpo, R.; Buddie, A.; Cafà, G.; Offord, L.;Day, R.; et al. Parasitoid Complex of Fall Armyworm, Spodoptera frugiperda, in Ghana and Benin. Insects 2020,11, 68. [CrossRef] [PubMed]
41. Koffi, D.; Kyerematen, R.; Eziah, Y.V.; Agboka, K.; Adom, M.; Goergen, G.; Meagher, L.R., Jr. Natural enemiesof the fall armyworm, Spodoptera frugiperda (J.E. Smith) (Lepidoptera: Noctuidae) in Ghana. Fla. Entomol.2020, 103, 85–90. [CrossRef]
42. Peruca, R.D.; Coelho, R.G.; da Silva, G.G.; Pistori, H.; Ravaglia, L.M.; Roel, A.R.; Alcantara, G.B. Impacts ofsoybean-induced defenses on Spodoptera frugiperda (Lepidoptera: Noctuidae) development. Arthropod-PlantInteract. 2018, 12, 257–266. [CrossRef]
43. Magrini, F.E.; Specht, A.; Gaio, J.; Girelli, C.P.; Migues, I.; Heinzen, H.; Saldaña, J.; Sartori, V.C.; Cesio, V.Antifeedant activity and effects of fruits and seeds extracts of Cabralea canjerana canjerana (Vell.) Mart.(Meliaceae) on the immature stages of the fall armyworm Spodoptera frugiperda (JE Smith) (Lepidoptera:Noctuidae). Ind. Crops Prod. 2015, 65, 150–158. [CrossRef]
44. Tavares, W.S.; Costa, M.A.; Cruz, I.; Silveira, R.D.; Serrão, J.E.; Zanuncio, J.C. Selective effects of natural andsynthetic insecticides on mortality of Spodoptera frugiperda (Lepidoptera: Noctuidae) and its predator Eriopisconnexa (Coleoptera: Coccinellidae). J. Environ. Sci. Health B 2010, 45, 557–561. [CrossRef] [PubMed]
45. Zuleta-Castro, C.; Rios, D.; Hoyos, R.; Orozco-Sánchez, F. First formulation of a botanical active substanceextracted from neem cell culture for controlling the armyworm. Agron. Sustain. Dev. 2017, 37, 40. [CrossRef]
46. Adeye, A.T.; Sikirou, R.; Boukari, S.; Aboudou, M.; Amagnide, G.Y.G.A.; Idrissou, B.S.; Drissou-Toure, M.;Zocli, B. Protection de la culture de maïs contre Spodoptera frugiperda avec les insecticides plantneem, lambdace25 EC et viper 46 EC et reduction de pertes de rendement au Benin. J. Rech. Sci. Univ. Lomé 2018, 20, 53–65.[CrossRef]
47. Togola, A.; Meseka, S.; Menkir, A.; Badu-Apraku, B.; Boukar, O.; Tamò, M.; Djouaka, R. Measurement ofPesticide Residues from Chemical Control of the Invasive Spodoptera frugiperda (Lepidoptera: Noctuidae) ina Maize Experimental Field in Mokwa, Nigeria. Int. J. Environ. Res. Public Health 2018, 15, 849. [CrossRef]
48. Stevenson, P.C.; Isman, M.B.; Belmain, S.R. Pesticidal plants in Africa: A global vision of new biologicalcontrol products from local uses. Ind. Crops Prod. 2017, 110, 2–9. [CrossRef]
49. Tambo, J.A.; Aliamo, C.; Davis, T.; Mugambi, I.; Romney, D.; Onyango, D.O.; Kansiime, M.; Alokit, C.;Byantwale, S.T. The impact of ICT-enabled extension campaign on farmers’ knowledge and management offall armyworm in Uganda. PLoS ONE 2019, 14, e0220844. [CrossRef]
© 2020 by the authors. Licensee MDPI, Basel, Switzerland. This article is an open accessarticle distributed under the terms and conditions of the Creative Commons Attribution(CC BY) license (http://creativecommons.org/licenses/by/4.0/).
21


agriculture
Article
Neonicotinoid Residues in Sugar Beet Plants and Soilunder Different Agro-Climatic Conditions
Helena Viric Gasparic 1,*, Mirela Grubelic 2, Verica Dragovic Uzelac 3, Renata Bazok 1,
Maja Cacija 1, Zrinka Drmic 1,4 and Darija Lemic 1
1 Department of Agricultural Zoology, Faculty of Agriculture, University of Zagreb, Svetosimunska Street 25,10000 Zagreb, Croatia; [email protected] (R.B.); [email protected] (M.C.); [email protected] (Z.D.);[email protected] (D.L.)
2 Euroinspekt Croatiakontrola Ltd. for Control of Goods and Engineering, Karlovacka 4 L, 10000 Zagreb,Croatia; [email protected]
3 Department of Food Engineering, Faculty of Food Technology and Biotechnology, University of Zagreb,Pierottijeva Street 6, 10000 Zagreb, Croatia; [email protected]
4 Croatian Agency for Agriculture and Food, Vinkovacka Street 63c, 31000 Osijek, Croatia* Correspondence: [email protected]; Tel.: +385-12393804
Received: 28 September 2020; Accepted: 15 October 2020; Published: 19 October 2020
Abstract: European sugar beet was mostly grown from seeds treated by neonicotinoids which providedefficient control of some important sugar beet pests (aphids and flea beetles). The EU commissionregulation from 2018 to ultimately restrict the outdoor application of imidacloprid, thiamethoxam,and clothianidin could significantly affect European sugar beet production. Although alternativeinsecticides (spinosad, chlorantraniliprole, neem) are shown to have certain effects on particular pestswhen applied as seed treatment, it is not likely that in near future any insecticide will be identifiedas a good candidate for neonicotinoids’ substitution. The aim of this research is to evaluate residuelevels (LC-MS/MS method) of imidacloprid and thiamethoxam applied as seed dressing in sugarbeet plants during two growing seasons in fields located in different agro-climatic regions and ingreenhouse trials. In 2015, 25 to 27 days post planting (PP) maximum of 0.028% of imidacloprid and0.077% of thiamethoxam were recovered from the emerged plants, respectively. In 2016, the recoveryrate from the emerged plants 40 days PP was 0.003% for imidacloprid and 50 days PP was up to0.022% for thiamethoxam. There were no neonicotinoid residues above the maximum residue level inroots at the time of harvesting, except in case of samples from thiamethoxam variant collected fromgreenhouse trials in 2016 (0.053 mg/kg). The results of this research lead to the conclusion that theseed treatment of sugar beet leaves minimal trace in plants because of the complete degradation whiledifferent behavior has been observed in the two fields and a glasshouse trial regarding the residues insoil. Dry conditions, leaching incapacity, or irregular flushing can result in higher concentrations insoil which can present potential risk for the succeeding crops. The results of our study could provideadditional arguments about possible risk assessment for seed treatment in sugar beet.
Keywords: sugar beet; degradation; residues; neonicotinoids; imidacloprid; thiamethoxam
1. Introduction
Sugar beet (Beta vulgaris var. saccharifera L.) is an economically viable crop produced mainly forwhite sugar. The world’s leading sugar beet producers (France, Germany and Poland) account foralmost 50% of total world production (111.7 million tons in 2016). However, only 20% of the world’ssugar comes from sugar beet; 80% is produced from sugar cane [1]. Given the production technologyand the length of the growing season of almost 180 days, sugar beet is considered the most intensiveagricultural crop [2].
Agriculture 2020, 10, 484; doi:10.3390/agriculture10100484 www.mdpi.com/journal/agriculture23

Agriculture 2020, 10, 484
The economically important pests of South East Europe sugar beet include wireworms,pigmy mangold beetle, sugar beet and corn weevil, black beet weevil, alfalfa snout beetle, several speciesof noctuid moths, sugar beet flea beetle, aphids, and beet cyst nematode [3–11]. Their appearancedepends on the region and the year.
Since the introduction of neonicotinoid seed treatment in the 1990s, there has been a strongdecrease in insecticide use in Croatia [12]. Wireworms, aphids, and flea beetles were successfullycontrolled by neonicotinoid seed treatments [7,13–15] so additional treatment was only required in thecase of severe infestation of some foliar pests that cannot be successfully controlled with neonicotinoids(e.g., sugar beet weevil) [16]. In north-western Europe, only aphids require occasional control withfoliar insecticides [17].
Seed treatment is a method that has brought many advantages to modern agriculture [18–24],although there are some negative effects as well. In heavy infestations the efficacy against wirewormsand sugar beet weevil is weak, so additional protection measures are necessary [7]. It is often appliedat higher rates [24] or when control is not even necessary.
The use of neonicotinoids has become a major controversy because of their negative effects onbees, other pollinators, and possibly other non-target organisms [25–27]. According to the availableevidence and a risk assessment carried out by EFSA, the use of neonicotinoid pesticides (clothianidin,imidacloprid, and thiamethoxam) was severely restricted by European Commission (EC) in 2013 bythe implementation of Directive 485/2013 [28]. The restriction applied to bee-friendly crops such asmaize, oilseed rape, and sunflower, with the exception of greenhouse crops and the post-floweringtreatment of certain crops, and to winter cereals. Based on the EFSA peer review of the pesticide riskassessment carried out for clothianidin [25], imidacloprid [26], and thiamethoxam [27], the Commissionadopted on 30 May 2018, regulations banning completely the outdoor use of imidacloprid, clothianidin,and thiamethoxam to protect domestic honey bees and wild pollinators [29]. The only risk identifiedby EFSA for the treatment of sugar beet seeds with neonicotinoids was the risk of succeeding cropscenario [25–27].
In the succeeding crop scenario, the residues of neonicotinoids are expected to remain in thesoil and be absorbed by the succeeding crop or weeds in the same field. Thus, if the significantconcentrations of neonicotinoids were to remain in the soil after the growing season, they could beadsorbed by the succeeding crop (or weeds) from the soil and then the neonicotinoids could be foundin pollen or excreted in guttation fluid.
The Commission has not considered the possibility of proposing further options in addition to thetotal ban on the treatment of sugar beet seed with neonicotinoids. This decision could endanger sugarbeet production. The ban was justified by the fact that some ecologically more acceptable substitutechemicals (diamides) are effective in controlling the most serious pests and that tools to control mostpests are available under integrated pest management (IPM). However, the arguments do not fullyapply to all economically important pests that damage sugar beet production in all production areas inthe EU.
Hauer et al. [17] discussed neonicotinoid seed treatments in European sugar beet cultivation withregard to their effectiveness against target pests and their impact on the environment. They proposed todevelop monitoring systems and models to identify regions (and years) with a higher risk of occurrenceof pests and to allow the use of insecticide seed treatments only when high pest pressure is likely.In their analysis, Hauer et al. [17] only looked at sugar beet production in northwestern Europeancountries and did not consider the different climatic conditions and the occurrence of pests in easternand southeastern Europe, where problems in production are mainly caused by flea beetles and sugarbeet weevils. This fact makes their proposal even more important.
The aim of this research was to determine the residue levels of imidacloprid and thiamethoxamused as a seed treatment in sugar beet plants in different agroclimatic regions in order to estimateenvironmental risk and possible transfer to other crops. Greenhouse trials have been established inorder to provide insight to neonicotinoid behavior in controlled conditions.
24
Agriculture 2020, 10, 484
2. Materials and Methods
2.1. Field Site and Experimental Design
2.1.1. Field Site
The two-year study was conducted in 2015 and 2016 on three different locations. Field trialswere located in two distinct counties of Croatia, Virovitica-Podravina County in Lukac (45◦52′26” N17◦25′09” E) and Vukovar-Sirmium County in Tovarnik (45◦09′54” N 19◦09′08” E), while greenhousetrial was set up in Zagreb at the Faculty of Agriculture, Department of Agricultural Zoology(45◦82′77′′ N, 16◦03′09′′ E).
2.1.2. Characteristics of the Soil
To determine the physical and chemical soil properties in Lukac and Tovarnik, soil samples weretaken in 2016 according to an internal protocol for annual crops provided by the Department of PlantNutrition (University of Zagreb Faculty of Agriculture). At each site, 15 individual soil samples weretaken on the same date from a depth of 0–30 cm, evenly distributed over the entire plot. A homogenizedsample was prepared and 1.000 g were extracted for analysis. Chemical soil properties and textureanalyses were carried out according to standard methods (ISO 11277 2004) in the pedological laboratoryof the Department of Soil Science University of Zagreb Faculty of Agriculture.
2.1.3. Climatic Data
The data on climatic conditions were collected by Croatian Meteorological and HydrologicalService. The climatic conditions were monitored by the nearest climate stations (Virovitica for Lukacand Gradište for Tovarnik). The distance between the meteorological stations and the experimentalsites was not more than 20 km. For the period from April to September, data on mean air and soiltemperatures and total precipitation were collected and analyzed for Virovitica and Gradište in bothyears under investigation.
2.1.4. Design of Experiments
At each site, sugar beet seed was sown in three treatments, one of which was untreated seed(0 mg a.i./seed), the second treatment was sugar beet seed treated with imidacloprid (0.91 mg a.i./seed)and the third treatment was seed treated with thiamethoxam and teflutrin (0.36 + 0.036 mg a.i./seed).In both years sowing was done in regular spring terms (2015: 9 April—Lukac, 10 April—Zagreb,11 April—Tovarnik; 2016: 26 March—Tovarnik, 1 April—Lukac, 7 April—Zagreb). In field trials,each treatment was sown on 1.000 m2 in three repetitions. Each repetition was 123 m long and wassown with a six-row sowing harrow (i.e., 333 m2) at a depth of 3 cm, the distance between rows was45 cm and the distance in one row was 18 cm (i.e., 123,321 seeds/ha). In the greenhouse research thesowing conditions in the arable layer (30 cm) were simulated. The same treatments were sown in plasticcontainers of 90 cm × 50 cm × 38 cm (length × width × height) filled with 100 L Klasmann-DeilmannGmbH Supstrat 1 (EN Standard). The substrate used was a mixture of white peat (H2–H5) and blackpeat (H6–H8) with a pH value (H2O) of 5.5–6.5 and 14:10:18 NPK fertilizer. The amount of heavy metalwas significantly below the maximum permissible concentration. The sowing was done by hand ata depth of 3 cm and the distance between the seeds was 5 cm with an approximate quantity of 45 seedsper container. A total of six containers were sown per treatment (2 per repetition).
2.2. Sampling
2.2.1. Sampling of Sugar Beet Plants
Starting four weeks after sowing, sugar beet plant samples were collected every two weeks at allthree locations during the two growing seasons (2015 and 2016). In the first four sampling periods,
25
Agriculture 2020, 10, 484
whole plants were collected. From the fifth sampling until the end of the experiment, the collectedplants were divided into leaves and roots, which were analyzed separately. The last sampling concernedonly the roots. Three samples were taken for each treatment. A total of 432 sugar beet samples werecollected and analyzed for neonicotinoid residues. Each sample contained five plants with a minimumweight of 20 g. The collected samples were carefully labeled and transported in portable coolers to anaccredited laboratory for analysis.
2.2.2. Sampling of Soil
In order to determine neonicotinoid residues in the soil, two samples were taken once at each sitefrom the depth of a plow layer (30 cm). In 2016, 15 sub-samples (each weighing 1.000 g, depending onfield size) were taken, pooled and homogenized at each site, and a subset of the pooled soil samples(20 g) from each treatment area was taken and stored in a freezer until analyzed.
2.3. Sample Analysis
2.3.1. Neonicotinoid Residues Analysis in Sugar Beet Plants and Soil
The determination of neonicotinoid residues in sugar beet plants and soil was performedby an accredited laboratory by liquid chromatography/tandem mass spectrometry (LC -MS/MS)using acetonitrile extraction and the QuEChERS method (EN 15662: 2008). The limit of quantification(LOQ) for this method is 0.01 mg/kg. The neonicotinoids were extracted from the homogenized samplewith acetonitrile. Neonicotinoids, imidacloprid, thiamethoxam, and clothianidin were determinedusing the LC -MS/MS technique applied to the filtered extract with the Agilent Technologies 6460 TripleQuad LC/MS apparatus. Thiamethoxam is converted to clothianidin in soil and plant tissues,therefore the thiamethoxam residues were determined as the sum of thiamethoxam and clothianidin [30].
2.3.2. Statistical Analysis
The data on neonicotinoid residues were analyzed by analysis of variance (ANOVA) using theAOV factorial method with two or three factors [31]. The first factor was location which was consideredas a fixed factor because of a limited production area of sugar beet and characteristic weather conditions.The second factor was insecticide treatment and the third factor was the plant part. This factor wasanalyzed for sampling during the growing season, where leaves and roots were sampled separately.A Tukey post-hoc test was used to determine which mean values of the variants were significantlydifferent after a significant test result (p < 0.05).
3. Results
3.1. Climatic and Edaphic Conditions
Our analyses confirmed earlier data published by other authors [32–35] that the average annualtemperatures in Tovarnik (Table 1) are higher than in Lukac. Precipitation varied from place to placein one of the two years of investigation and confirmed earlier published data [32–35] that whencomparing Lukac (west) and Tovarnik (east), temperatures increased while precipitation decreased inthe eastern part.
In both years the mean air and soil temperatures in the area of Lukac were significantly lowercompared to Tovarnik, and the precipitation was significantly higher in 2015 in the same place, while in2016 the differences were not significant. Between the years studied (2015 vs. 2016) there were nosignificant differences between the climatic conditions at both locations.
26
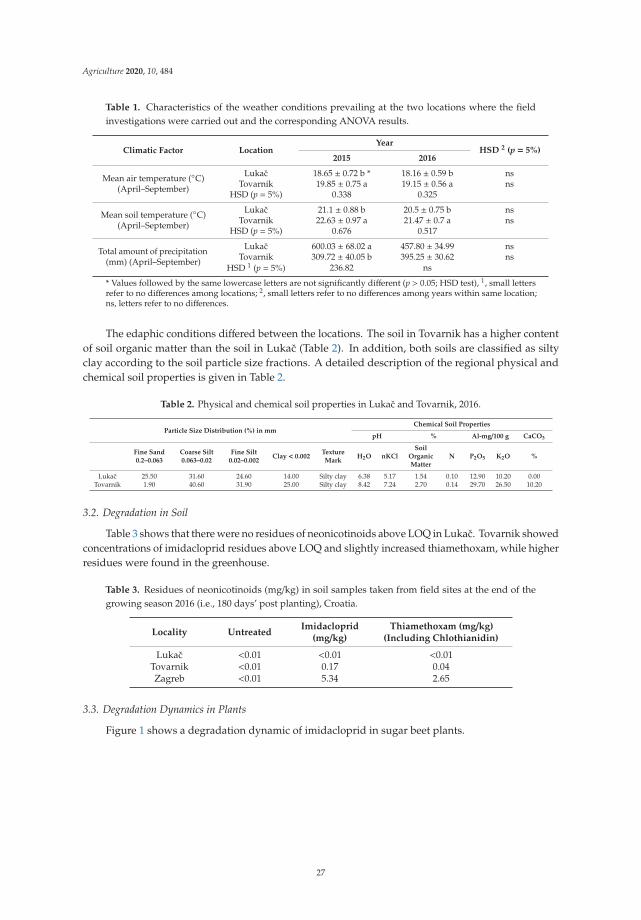
Agriculture 2020, 10, 484
Table 1. Characteristics of the weather conditions prevailing at the two locations where the fieldinvestigations were carried out and the corresponding ANOVA results.
Climatic Factor LocationYear
HSD 2 (p = 5%)2015 2016
Mean air temperature (◦C)(April–September)
Lukac 18.65 ± 0.72 b * 18.16 ± 0.59 b nsTovarnik 19.85 ± 0.75 a 19.15 ± 0.56 a ns
HSD (p = 5%) 0.338 0.325
Mean soil temperature (◦C)(April–September)
Lukac 21.1 ± 0.88 b 20.5 ± 0.75 b nsTovarnik 22.63 ± 0.97 a 21.47 ± 0.7 a ns
HSD (p = 5%) 0.676 0.517
Total amount of precipitation(mm) (April–September)
Lukac 600.03 ± 68.02 a 457.80 ± 34.99 nsTovarnik 309.72 ± 40.05 b 395.25 ± 30.62 ns
HSD 1 (p = 5%) 236.82 ns
* Values followed by the same lowercase letters are not significantly different (p > 0.05; HSD test), 1, small lettersrefer to no differences among locations; 2, small letters refer to no differences among years within same location;ns, letters refer to no differences.
The edaphic conditions differed between the locations. The soil in Tovarnik has a higher contentof soil organic matter than the soil in Lukac (Table 2). In addition, both soils are classified as siltyclay according to the soil particle size fractions. A detailed description of the regional physical andchemical soil properties is given in Table 2.
Table 2. Physical and chemical soil properties in Lukac and Tovarnik, 2016.
Particle Size Distribution (%) in mmChemical Soil Properties
pH % Al-mg/100 g CaCO3
Fine Sand0.2–0.063
Coarse Silt0.063–0.02
Fine Silt0.02–0.002
Clay < 0.002TextureMark
H2O nKClSoil
OrganicMatter
N P2O5 K2O %
Lukac 25.50 31.60 24.60 14.00 Silty clay 6.38 5.17 1.54 0.10 12.90 10.20 0.00Tovarnik 1.90 40.60 31.90 25.00 Silty clay 8.42 7.24 2.70 0.14 29.70 26.50 10.20
3.2. Degradation in Soil
Table 3 shows that there were no residues of neonicotinoids above LOQ in Lukac. Tovarnik showedconcentrations of imidacloprid residues above LOQ and slightly increased thiamethoxam, while higherresidues were found in the greenhouse.
Table 3. Residues of neonicotinoids (mg/kg) in soil samples taken from field sites at the end of thegrowing season 2016 (i.e., 180 days’ post planting), Croatia.
Locality UntreatedImidacloprid
(mg/kg)Thiamethoxam (mg/kg)
(Including Chlothianidin)
Lukac <0.01 <0.01 <0.01Tovarnik <0.01 0.17 0.04Zagreb <0.01 5.34 2.65
3.3. Degradation Dynamics in Plants
Figure 1 shows a degradation dynamic of imidacloprid in sugar beet plants.
27
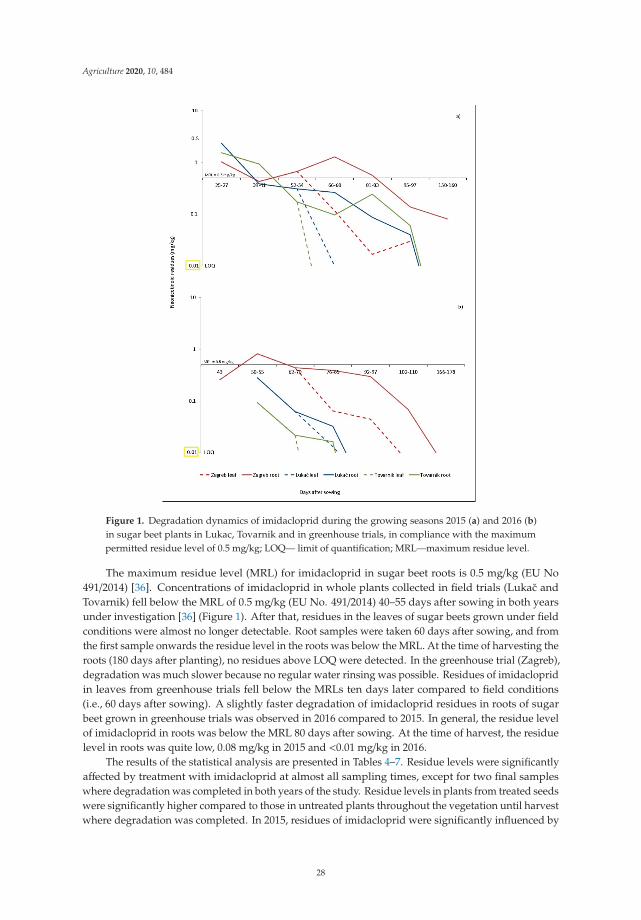
Agriculture 2020, 10, 484
Figure 1. Degradation dynamics of imidacloprid during the growing seasons 2015 (a) and 2016 (b)in sugar beet plants in Lukac, Tovarnik and in greenhouse trials, in compliance with the maximumpermitted residue level of 0.5 mg/kg; LOQ— limit of quantification; MRL—maximum residue level.
The maximum residue level (MRL) for imidacloprid in sugar beet roots is 0.5 mg/kg (EU No491/2014) [36]. Concentrations of imidacloprid in whole plants collected in field trials (Lukac andTovarnik) fell below the MRL of 0.5 mg/kg (EU No. 491/2014) 40–55 days after sowing in both yearsunder investigation [36] (Figure 1). After that, residues in the leaves of sugar beets grown under fieldconditions were almost no longer detectable. Root samples were taken 60 days after sowing, and fromthe first sample onwards the residue level in the roots was below the MRL. At the time of harvesting theroots (180 days after planting), no residues above LOQ were detected. In the greenhouse trial (Zagreb),degradation was much slower because no regular water rinsing was possible. Residues of imidaclopridin leaves from greenhouse trials fell below the MRLs ten days later compared to field conditions(i.e., 60 days after sowing). A slightly faster degradation of imidacloprid residues in roots of sugarbeet grown in greenhouse trials was observed in 2016 compared to 2015. In general, the residue levelof imidacloprid in roots was below the MRL 80 days after sowing. At the time of harvest, the residuelevel in roots was quite low, 0.08 mg/kg in 2015 and <0.01 mg/kg in 2016.
The results of the statistical analysis are presented in Tables 4–7. Residue levels were significantlyaffected by treatment with imidacloprid at almost all sampling times, except for two final sampleswhere degradation was completed in both years of the study. Residue levels in plants from treated seedswere significantly higher compared to those in untreated plants throughout the vegetation until harvestwhere degradation was completed. In 2015, residues of imidacloprid were significantly influenced by
28
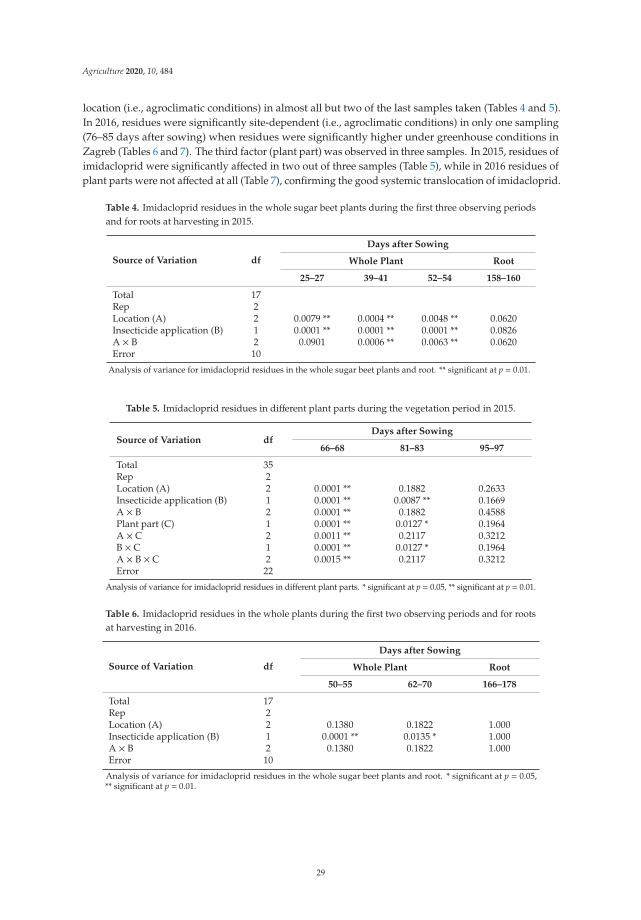
Agriculture 2020, 10, 484
location (i.e., agroclimatic conditions) in almost all but two of the last samples taken (Tables 4 and 5).In 2016, residues were significantly site-dependent (i.e., agroclimatic conditions) in only one sampling(76–85 days after sowing) when residues were significantly higher under greenhouse conditions inZagreb (Tables 6 and 7). The third factor (plant part) was observed in three samples. In 2015, residues ofimidacloprid were significantly affected in two out of three samples (Table 5), while in 2016 residues ofplant parts were not affected at all (Table 7), confirming the good systemic translocation of imidacloprid.
Table 4. Imidacloprid residues in the whole sugar beet plants during the first three observing periodsand for roots at harvesting in 2015.
Source of Variation df
Days after Sowing
Whole Plant Root
25–27 39–41 52–54 158–160
Total 17Rep 2Location (A) 2 0.0079 ** 0.0004 ** 0.0048 ** 0.0620Insecticide application (B) 1 0.0001 ** 0.0001 ** 0.0001 ** 0.0826A × B 2 0.0901 0.0006 ** 0.0063 ** 0.0620Error 10
Analysis of variance for imidacloprid residues in the whole sugar beet plants and root. ** significant at p = 0.01.
Table 5. Imidacloprid residues in different plant parts during the vegetation period in 2015.
Source of Variation dfDays after Sowing
66–68 81–83 95–97
Total 35Rep 2Location (A) 2 0.0001 ** 0.1882 0.2633Insecticide application (B) 1 0.0001 ** 0.0087 ** 0.1669A × B 2 0.0001 ** 0.1882 0.4588Plant part (C) 1 0.0001 ** 0.0127 * 0.1964A × C 2 0.0011 ** 0.2117 0.3212B × C 1 0.0001 ** 0.0127 * 0.1964A × B × C 2 0.0015 ** 0.2117 0.3212Error 22
Analysis of variance for imidacloprid residues in different plant parts. * significant at p = 0.05, ** significant at p = 0.01.
Table 6. Imidacloprid residues in the whole plants during the first two observing periods and for rootsat harvesting in 2016.
Source of Variation df
Days after Sowing
Whole Plant Root
50–55 62–70 166–178
Total 17Rep 2Location (A) 2 0.1380 0.1822 1.000Insecticide application (B) 1 0.0001 ** 0.0135 * 1.000A × B 2 0.1380 0.1822 1.000Error 10
Analysis of variance for imidacloprid residues in the whole sugar beet plants and root. * significant at p = 0.05,** significant at p = 0.01.
29

Agriculture 2020, 10, 484
Table 7. Imidacloprid residues in the different plant parts during the vegetation period in 2016.
Source of Variation dfDays after Sowing
76–85 92–97 102–110
Total 35Rep 2Location (A) 2 0.0001 ** 0.1041 0.1346Insecticide application (B) 1 0.0001 ** 0.0106 * 0.0087 **A × B 2 0.0001 ** 0.1041 0.1346Plant part (C) 1 0.7046 0.1628 0.0517A × C 2 0.0234 * 0.5097 0.3246B × C 1 0.7046 0.1628 0.0517A × B × C 2 0.0234 * 0.5097 0.3246Error 22
Analysis of variance for imidacloprid residues in different plant parts. * significant at p = 0.05, ** significant at p = 0.01.
The significant interaction between all three factors (location × insecticide treatment × plant part)for the imidacloprid residue level was present at the first sampling when plant parts were sampledseparately (i.e., 66–68 days after sowing in 2015 and 76–85 days after sowing in 2016). A significantinsecticide “treatment × location” interaction for imidacloprid residues was not observed in the firstand the last two samples in 2015 (Tables 4 and 5), while in 2016 the significant interaction was onlyobserved when samples were taken 76 to 85 days after sowing (Tables 6 and 7). For all other samplingdata, the significant interaction “insecticide treatment × location” did not exist for imidaclopridresidues. Significant interactions between “location × plant part” and “insecticide application × plantpart” for imidacloprid residues existed only occasionally in both years of the study.
Figure 2 shows a degradation dynamic of thiamethoxam (expressed as sum of thiamethoxam andclothianidin) in sugar beet plants.
The maximum residue level (MRL) for thiamethoxam and clothianidin has been reduced in Europefrom 0.05 mg/kg to 0.02 mg/kg in 2017 (EU 2017/671) [37]. For sugar beets grown under field conditions,the residue content of thiamethoxam in the leaves and roots of sugar beets dropped below the MRLbetween 70 and 80 days after sowing, depending on the year and location (Figure 2). No residues werefound in sugar beet roots in open field cultivation at the time of harvest.
Similar to imidacloprid, the degradation of thiamethoxam was much slower in greenhouse trials.The residues of thiamethoxam in sugar beet roots in greenhouse cultivation were above the MRL(i.e., 0.053 mg/kg) at harvest time in 2015 (Figure 2), while in 2016, 100 days after sowing, the residuesfell below the MRL of 0.02 mg/kg in 2016.
The results of the statistical analysis are presented in Tables 8–11. Residue levels were significantlyaffected by thiamethoxam treatment at all sampling dates including the last sampling in 2015,indicating that degradation at harvest is not complete in all trials. At the time of harvest in 2015,residues (0.053 mg/kg) were confirmed in beet roots grown in greenhouses (see Figure 2).
30
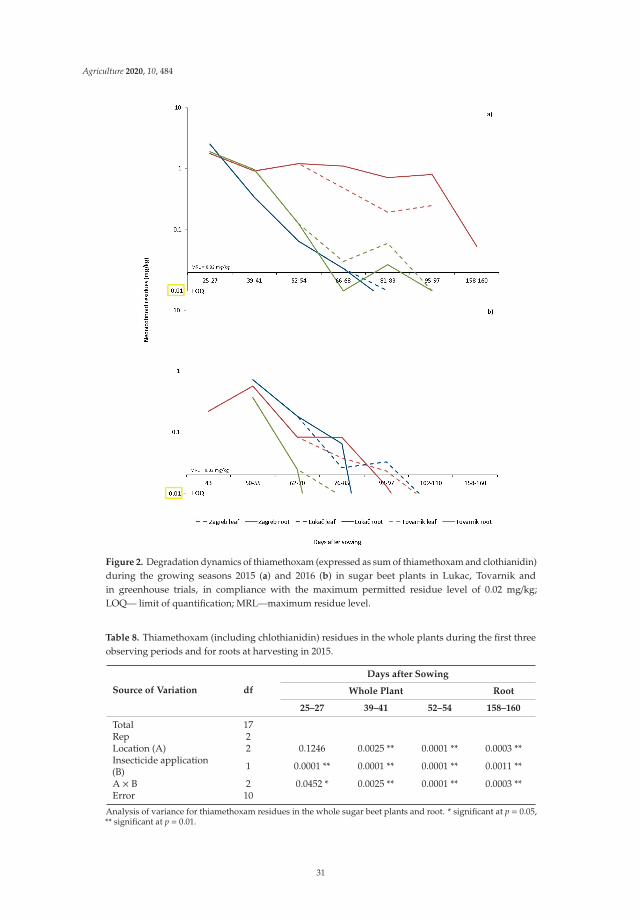
Agriculture 2020, 10, 484
Figure 2. Degradation dynamics of thiamethoxam (expressed as sum of thiamethoxam and clothianidin)during the growing seasons 2015 (a) and 2016 (b) in sugar beet plants in Lukac, Tovarnik andin greenhouse trials, in compliance with the maximum permitted residue level of 0.02 mg/kg;LOQ— limit of quantification; MRL—maximum residue level.
Table 8. Thiamethoxam (including chlothianidin) residues in the whole plants during the first threeobserving periods and for roots at harvesting in 2015.
Source of Variation df
Days after Sowing
Whole Plant Root
25–27 39–41 52–54 158–160
Total 17Rep 2Location (A) 2 0.1246 0.0025 ** 0.0001 ** 0.0003 **Insecticide application(B) 1 0.0001 ** 0.0001 ** 0.0001 ** 0.0011 **
A × B 2 0.0452 * 0.0025 ** 0.0001 ** 0.0003 **Error 10
Analysis of variance for thiamethoxam residues in the whole sugar beet plants and root. * significant at p = 0.05,** significant at p = 0.01.
31

Agriculture 2020, 10, 484
Table 9. Thiamethoxam (including chlothianidin) residues in different plant parts during the vegetationperiod in 2015.
Source of Variation dfDays after Sowing
66–68 81–83 95–97
Total 35Rep 2Location (A) 2 0.0001 ** 0.0001 ** 0.0001 **Insecticide application (B) 1 0.0001 ** 0.0001 ** 0.0001 **A × B 2 0.0001 ** 0.0001 ** 0.0001 **Plant part (C) 1 0.0049 ** 0.0262 * 0.0263 *A × C 2 0.0006 ** 0.0002 ** 0.0103 *B × C 1 0.0062 ** 0.0262 * 0.0263 *A × B × C 2 0.0006 ** 0.0002 ** 0.0103 *Error 22
Analysis of variance for thiamethoxam residues in different plant parts * significant at p = 0.05, ** significant at p = 0.01.
Table 10. Thiamethoxam (including chlothianidin) residues in the whole plants during the first threeobserving periods and for roots at harvesting in 2016.
Source of Variation df
Days after Sowing
Whole Plant Root
50–55 62–70 166–178
Total 17Rep 2Location (A) 2 0.1380 0.1822 1.0000Insecticide application (B) 1 0.0001 ** 0.0135 * 1.0000A × B 2 0.1380 0.1822 1.0000Error 10
Analysis of variance for thiamethoxam residues in the whole sugar beet plants and root. * significant at p = 0.05,** significant at p = 0.01.
Table 11. Thiamethoxam (including chlothianidin) residues in the different plant parts during thevegetation period in 2016.
Source of Variation dfDays after Sowing
76–85 92–97 102–110
Total 35Rep 2Location (A) 2 0.0001 ** 0.0255 * 0.1346Insecticide application (B) 1 0.0001 ** 0.0007 ** 0.0087 **A × B 2 0.0001 ** 0.0255 * 0.1346Plant part (C) 1 0.7046 0.0672 0.0517A × C 2 0.0234 * 0.1438 0.3246B × C 1 0.7046 0.0672 0.0517A × B × C 2 0.0234 * 0.1438 0.3246Error 22
Analysis of variance for thiamethoxam residues in different plant parts. * significant at p = 0.05, ** significant at p = 0.01.
In 2016, residue levels were significantly affected by thiamethoxam treatment on all but the lastsampling dates, indicating that degradation at harvest was complete under all conditions studied,including greenhouse trials. In 2015, residues of thiamethoxam were significantly influenced bylocation (i.e., agroclimatic conditions) at almost all sampling dates except the first sampling (Table 8).In 2016, residues were significantly influenced by the location (Tables 10 and 11) on only two samples(76–85 and 92–97 days after sowing), when residues were significantly higher under greenhouseconditions in Zagreb (Figure 2). The third factor (plant part) was observed in three samples. In 2015
32
Agriculture 2020, 10, 484
the residues of thiacloprid were significantly influenced by plant parts in three samples (Table 9),whereas in 2016 the residues were not influenced by plant parts at all (Table 11). A significant insecticide“treatment × location” interaction for thiamethoxam residues was observed in 2015 in all samples(Tables 8 and 9), while in 2016 the significant interaction was observed in only two samples taken after76–85 days and 92–97 days after sowing (Table 11). Significant interactions between “location × plantpart” and “insecticide application × plant part” for thiacloprid residues were complete in 2015. In 2016,these interactions only existed on a single sampling date for the “location × plant part” interaction.The significant interaction between all three factors (location × insecticide treatment × plant part)for thiacloprid residue level existed in 2015 for all three samples and in 2016 for only one sample whenplant parts were sampled separately (i.e., 76–85 days after sowing in 2016).
4. Discussion
When the neonicotinoids were introduced to the market, they were considered safe to usebecause they are stable in soil and have low toxicity to mammals [38]. However, recent studieshave shown that neonicotinoids have adverse effects on bees, other pollinators, and possibly othernon-target organisms [25–27]. A complete EU Commission Regulation ban on the outdoor use ofimidacloprid, thiamethoxam, and clothianidin could have a significant impact on the practice ofsugar beet production in Europe, as 100% of all commercial sugar beet seeds have been treated withneonicotinoids. According to Ester et al. and Lanka et al. [39,40] spinosad and chlorantraniliproleapplied as seed treatment were ineffective at controlling flea beetles and cabbage aphid [39] as wellas adult stages of rice water weevil [40]. It is unlikely that they will become a good substitute ofneonicotinoid seed treatment. Hauer et al. [17] have pointed out the lack of effective alternatives for thecontrol of M. persicae on sugar beet in Central and North Europe. Moreover, Bažok et al. [16] achievedthe same conclusions for substituting control of sugar beet flea beetle in South and Eastern Europe.Therefore, the problems related to the control of the above mentioned pests could become a seriousproblem in the future if no alternatives are developed.
In our study, at the end of sugar beet cultivation (180 days after planting), imidacloprid residues ata concentration of 0.17 mg/kg and thiamethoxam residues at a concentration of 0.04 mg/kg were foundin the soil of Tovarnik, while in Lukac all residues were below LOQ levels (Table 4). Such a result ispartially consistent with that of [41] who randomly sampled 74 soils after the cultivation of maize,wheat, and barley grown from treated seeds. Imidacloprid was found in all samples, so the authorsconcluded that imidacloprid is always present in the soils after cultivation and is easily detectable ifsampling is carried out in the year of treatment.
Alford and Krupke [42] concluded that high water solubility of neonicotinoid seed treatmentapplications makes it unlikely that they will remain near the relatively confined rhizosphere of the targetplant long enough to be absorbed by the plant when not on the seed. The loss of neonicotinoids fromagricultural soils is thought to occur through degradation or leaching in soil water [43]. EFSA’s riskassessment [25–27] did not take into account the results of [42] on the low probability of residuesof neonicotinoids remaining in soil for a longer period of time. Their findings, together with thoseof [44] on the recycling of neonicotinoid insecticides from contaminated groundwater back to crops,point to the possible risk scenario of irrigation, which will be further investigated. In our laboratorystudy, the sugar beet plants were sown at five times higher density than in the field, which means thatthe concentration of neonicotinoids is also significantly higher (40.95 mg imidacloprid and 32.76 +1.62 mg thiamethoxam + teflutrin per container 100 l soil). Soil from greenhouse trials treated withimidacloprid contained the average value of 5.34 mg/kg a.i., while the thiamethoxam-treated variantof the sample form contained 2.65 mg/kg a.i. (Table 4). This is much higher if we consider that inopen field the application rate as seed coating is 112.2 g imidacloprid or 44.4 + 4.44 g thiamethoxam +tefluthrin to one ha, while one ha contains on average three million liters of soil (calculation of theaverage soil layer of 30 cm). This is the average concentration of 0.04 mg/kg a.i. imidacloprid or0.015 + 0.0015 mg/kg thiamethoxam + tefluthrin. Our result confirms that high concentrations of
33
Agriculture 2020, 10, 484
neonicotinoids in soil are to be expected in case of dry conditions, leaching incapacity, or irregularflushing (bottom of the container) into ground water meaning that they can present potential risk forthe succeeding crops. Concerning field trials, there is no systematic monitoring of the presence ofpesticides in water in Croatia and no data on concentrations of neonicotinoids in the area of our studyare available.
Studies on the degradation of neonicotinoids in soil depend on temperature, moisture, and soiltype, in particular on texture and organic matter content, pH and UV radiation [41]. According toBonmatin [41], persistence is highest under cool, dry conditions and in soils with high organic mattercontent. On average, Lukac has more precipitation (more humid soil), lower soil and air temperatures,while Tovarnik is drier with low precipitation and slightly higher air and soil temperatures (Table 2).Table 3 shows that in our investigations the pH of the soil at both locations was between 5 and 7,which means that the soils are slightly acidic to neutral and do not allow degradation in the moistsoil or water. Guzsvány et al. [45] found that imidacloprid and thiamethoxam degrade faster at23 ◦C in alkaline media, while they remain relatively stable at pH 7 and 4. Regarding residues ofneonicotinoids in soil after the vegetation period, Table 3 shows that all residues were lower than LOQin Lukac while in Tovarnik 0.17 mg/kg imidacloprid and 0.04 mg/kg thiamethoxam were detected.Such results can be explained by the dry conditions, low precipitation, and slightly higher air andsoil temperatures prevailing in Tovarnik. The soils of Tovarnik also contain a large amount of soilorganic matter as well as available phosphorus and potassium (Table 3), which prevents the leaching ofresidues and allows higher sorption in soils with high organic matter content, which is also in line withthe results of [46]. Even though the results of the residues in soil are not statistically assessed, we mayconclude that the faster reduction of residues in Lukac is most likely due to higher precipitation whichis confirmed with the analyses of the residues in plants. The presence of a significant “treatment ×location” (i.e., agroclimatic conditions) interaction for thiamethoxam in 2015 (when locations differin temperature and precipitation) and the absence of a significant interaction for the same factors in2016 (when locations differ only in temperature) implies that precipitation is an important factor inthiamethoxam leaching. The same logic could not be followed for the degradation of imidaclopridbecause there was a significant “treatment × location” (i.e., agroclimatic conditions) interaction forimidacloprid residues only in three out of seven samples in 2015 and in one out of six samples in 2016.
According to Bonmatin et al. [41], the half-life of imidacloprid for seed treatment in France wasabout 270 days, while [47] reported 83 to 124 days under field conditions and 174 days on bare soil.Under field conditions, thiamethoxam showed a moderate to fast degradation rate [48]. The calculatedhalf-life in soil was between 7 and 335 days for thiamethoxam [49].
Uptake by the roots ranged from 1.6 to 20% for imidacloprid in aubergines and maize [50].Krupke et al. [50] pointed out that the uptake of clothianidin by maize plants was relatively low andthat plant-bound clothianidin concentrations followed an exponential decay pattern with initially highvalues, followed by a rapid decrease within the first ~20 days after planting. A maximum of 1.34% ofthe initial seed treatment rate (calculated as mg a.i./kg of seed) was successfully obtained from planttissues (calculated as mg a.i./kg of plant tissue) and a maximum of 0.26% from root samples. Our studyshowed that 25 days to 27 days after planting in 2015, a maximum of 0.028% imidacloprid and 0.077%thiamethoxam was obtained from the raised plants (Figures 1 and 2). In 2016, the recovery rate fromthe raised plants 40 days after planting was 0.003% for imidacloprid and 50 days after planting upto 0.022% for thiamethoxam. These data confirm that the degradation scenario of imidacloprid andthiamethoxam in sugar beet crops is similar to the scenario established for clothianidin by [50].
Westwood et al. [51] found that the concentration of imidacloprid in the leaves of sugar beetgrown from treated seed was 15.2 mg/kg 21 days after planting and degradation to 0.5 mg/kg 97 daysafter planting (25-leaf stage). Bažok et al. [52] found twice as high a concentration of 0.95 mg/kgimidacloprid in sugar beet leaves 42 days after planting using the HPLC method. Compared to HPLC,the LC -MS/MS method has a lower limit of determination (LOQ) and offers the possibility of a clearidentification of the analyte [53]. Therefore, our results show more precise results confirming that there
34

Agriculture 2020, 10, 484
are no residues of neonicotinoids in the roots of sugar beet during harvest time. Nevertheless, the riskis not negligible in dry climates or after a dry period since results showed higher soil concentrations ofimidacloprid than expected in Tovarnik. Results have shown [47] that field trials in Europe and theUnited States on the degradation of imidacloprid show that it does not accumulate in soil after repeatedannual applications. Although sugar beet in Croatia is grown in crop rotation where neonicotinoids arealready prohibited (maize, oilseed rape, wheat, etc.,), there should be a limited risk of bioaccumulationand transfer to other crops but the risk for succeeding crops needs to be further assessed.
Neonicotinoid seed treatment of sugar beet is still allowed in many other regions of the world(except the EU). Increase in the wide use of insecticides, in particular pyrethroid insecticides,against aphids and flea beetles (depending on the growing area) is expected in areas whereneonicotinoids are banned. The status of neonicotinoids for sugar beet seed treatment will possibly befurther investigated by various regulatory authorities around the world.
5. Conclusions
The residue levels of imidacloprid and thiamethoxam used for seed treatment of sugar beet plantswere below the maximum permitted residue level at the time of harvest and were highly dependent onweather conditions, in particular rainfall. The results of this research show that the seed treatment ofsugar beet leaves minimal trace in plants because of the complete degradation by the end of the growingseason while higher residue concentration in the soil shows that there is risk in dry climates or aftera dry period. The results of our study provide additional arguments for a possible risk assessment forsugar beet seed treatment in the succeeding crop and irrigation scenarios and provide further guidancefor the assessment and/or reassessment of the use of neonicotinoids in sugar beet production. However,further investigation is needed to assess the possible neonicotinoids uptake by succeeding crops.
Author Contributions: Conceptualization, R.B.; data curation, H.V.G. and Z.D.; formal analysis, M.G. andR.B.; funding acquisition, R.B.; investigation, H.V.G., M.C., Z.D., and D.L.; methodology, M.G. and R.B.;project administration, H.V.G.; supervision, V.D.U. and R.B.; visualization, H.V.G. and Z.D.; writing—original draft,H.V.G.; writing—review and editing, V.D.U., R.B., and D.L. All authors have read and agreed to the publishedversion of the manuscript.
Funding: This research was supported by the European Social Fund within the project “Improving HumanCapital by Professional Development through the Research Program in Plant Medicine” [HR.3.2.01-0071].
Acknowledgments: We thank Detlef Schenke and Martina Hoffman from the JKI Institute in Berlin for collaborationand support regarding residue analyses.
Conflicts of Interest: The authors declare no conflict of interest.
References
1. Eurostat. Available online: http://ec.europa.eu/eurostat/statistics-explained/index.php/Agricultural_production_-_crops#Potatoes_and_sugar_beet (accessed on 13 July 2018).
2. Pospišil, M. Ratarstvo II. dio–Industrijsko Bilje; Zrinski: Cakovec, Croatia, 2013; pp. 222–227.3. Camprag, D. Najvažnije Štetocine Šecerne Repe u Jugoslaviji, Madarskoj, Rumuniji i Bugarskoj, sa Posebnim osvrtom
na Važnije Štetne Vrste; Poljoprivredni Fakultet, Institut za Zaštitu Bilja Novi Sad: Novi Sad, Serbia, 1973;pp. 343–352.
4. Drmic, Z. Repin buhac. In Šecerna Repa: Zaštita od Štetnih Organizama u Sustavu Integrirane Biljne Proizvodnje;Bažok, R., Ed.; Sveucilište u Zagrebu Agronomski Fakultet: Zagreb, Croatia, 2015; pp. 42–44.
5. Culjak, T.G. Lisne uši. In Šecerna Repa: Zaštita od Štetnih Organizama u Sustavu Integrirane Biljne Proizvodnje;Bažok, R., Ed.; Sveucilište u Zagrebu Agronomski Fakultet: Zagreb, Croatia, 2015; pp. 44–49.
6. Grubišic, D. Repina nematoda. In Šecerna Repa: Zaštita od Štetnih Organizama u Sustavu Integrirane BiljneProizvodnje; Bažok, R., Ed.; Sveucilište u Zagrebu Agronomski Fakultet: Zagreb, Croatia, 2015; pp. 55–58.
7. Igrc Barcic, J.; Dobrincic, R.; Šarec, V.; Kristek, A. Investigation of the Insecticide Seed Dressing on the SugarBeet. Agric. Conspec. Sci. 2000, 65, 89–97.
8. Lemic, D. Sovice pozemljuše. In Šecerna Repa: Zaštita od Štetnih Organizama u Sustavu Integrirane BiljneProizvodnje; Bažok, R., Ed.; Sveucilište u Zagrebu Agronomski Fakultet: Zagreb, Croatia, 2015; p. 35.
35

Agriculture 2020, 10, 484
9. Lemic, D. Lisne sovice. In Šecerna repa: Zaštita od Štetnih Organizama u sustavu Integrirane Biljne Proizvodnje;Bažok, R., Ed.; Sveucilište u Zagrebu Agronomski Fakultet: Zagreb, Croatia, 2015; pp. 49–50.
10. Lemic, D. Repin moljac. In Šecerna Repa: Zaštita od Štetnih Organizama u Sustavu Integrirane Biljne Proizvodnje;Bažok, R., Ed.; Sveucilište u Zagrebu Agronomski Fakultet: Zagreb, Croatia, 2015; pp. 50–55.
11. Sekulic, R.; Kereši, T. Da li Treba Hemijski Suzbijati Repinog Moljca? Naucni Institut za ratarStvo i Povrtlarstvo:Novi Sad, Serbia, 2003; p. 38.
12. Bažok, R.; Buketa, M.; Lopatko, D.; Ljikar, K. Suzbijanje štetnika šecerne repe nekad i danas. Glas. Biljn. Zašt.2012, 12, 414–428.
13. Altmann, R. Gaucho, a new insecticide for controlling beet pests. Pflanzenshutz Nachr. Bayer 1991, 44, 159–174.14. Elbert, A.; Nauen, R.; Cahill, M.; Devonshire, A.L.; Scarr, A.W.; Sone, S.F. Resistance management with
chloronicotinyl insecticides using imidacloprid as an example. Pflanzenschutz-Nachr. Bayer (English ed.) 1996,49, 5–54.
15. Dobrincic, R. Prednosti i nedostaci tretiranja sjemena ratarskih kultura insekticidima. Glas. Biljn. Zašt. 2002,1, 37–41.
16. Bažok, R.; Šatvar, M.; Radoš, I.; Drmic, Z.; Lemic, D.; Cacija, M.; Gašparic, H.V. Comparative efficacy ofclassical and biorational insecticides on sugar beet weevil Bothynoderes punctiventris Germar (Coleoptera:Curculionidae). Plant Protect. Sci. 2016, 52, 134–141. [CrossRef]
17. Hauer, M.; Hansen, A.L.; Manderyck, B.; Olsson, Å.; Raaijmakers, E.; Hanse, B.; Stockfisch, N.; Märländer, B.Neonicotinoids in sugar beet cultivation in Central and Northern Europe: Efficacy and environmental impactof neonicotinoid seed treatments and alternative measures. Crop Prot. 2017, 1, 132–142. [CrossRef]
18. Epperlein, K.; Schmidt, H.W. Effects of pelleting sugarbeet seed with Gaucho® (imidacloprid) on associatedfauna in the agricultural ecosystem. Pflanzenschutz-Nachr. Bayer 2001, 54, 369–398.
19. Zhang, L.P.; Greenberg, S.M.; Zhang, Y.M.; Liu, T.X. Effectiveness of thiamethoxam and imidaclopridseed treatments against Bemisia tabaci (Hemiptera: Aleyrodidae) on cotton. Pest Manag. Sci. 2011,67, 226–232. [CrossRef]
20. Nuyttens, D.; Devarrewaere, W.; Verbovenb, P.; Foqu’ea, D. Pesticide-laden dust emission and drift fromtreated seeds during seed drilling: A review. Pest Manag. Sci. 2013, 69, 564–575. [CrossRef]
21. Gray, S.M.; Bergstrom, G.C.; Vaughan, R.; Smith, D.M.; Kalb, D.W. Insecticidal control of cereal aphids and itsimpact on the epidemiology of the barley yellow dwarf luteoviruses. Crop Prot. 1996, 15, 687–697. [CrossRef]
22. Nault, B.A.; Taylor, A.G.; Urwiler, M.; Rabaey, T.; Hutchison, W.D. Neonicotinoid seed treatments formanaging potato leafhopper infestations in snap bean. Crop Prot. 2004, 23, 147–154. [CrossRef]
23. Alix, A.; Chauzat, M.P.; Clement, H.; Lewis, G.; Maus, C.; Miles, M.J. Guidance for the assessment of risks tobees from the use of plant protection products applied as seed coating and soil applications—Conclusions ofthe ICPBR dedicated working group. Julius-Kuhn-Arch. 2009, 423, 15–27.
24. Paulsrud, B.E.; Martin, D.; Babadoost, M.; Malvick, D.; Weinzierl, R.; Lindholm, D.C.; Steffey, K.; Pederson, W.;Reed, M.; Maynard, R. Oregon Pesticide Applicator Training Manual. Seed Treatment; University of Illinois Boardof Trustees: Urbana, IL, USA, 2001.
25. EFSA (European Food Safety Authority). Conclusion on the peer review of the pesticide risk assessment forbees for the active substance clothianidin considering the uses as seed treatments and granules. EFSA J.2018, 16, 5177. [CrossRef]
26. EFSA (European Food Safety Authority). Conclusion on the peer review of the pesticide risk assessment forbees for the active substance imidacloprid considering the uses as seed treatments and granules. EFSA J.2018, 16, 5178. [CrossRef]
27. EFSA (European Food Safety Authority). Conclusion on the peer review of the pesticide risk assessment for bees forthe active substance thiamethoxam EFSA J. 2018, 16, 5179. [CrossRef]
28. European Commission. Commission Implementing Regulation (EU) No 485/2013. Official Journal ofthe European Union 2013, L 139/12. Available online: https://eur-lex.europa.eu/eli/reg_impl/2013/485/oj(accessed on 10 November 2017).
29. European Commission, Neonicotinoids. Available online: https://ec.europa.eu/food/plant/pesticides/approval_active_substances/approval_renewal/neonicotinoids_en (accessed on 7 November 2017).
30. Simon-Delso, N.; Amaral-Rogers, V.; Belzunces, L.P.; Bonmatin, J.M.; Chagnon, M.; Downs, C.; Furlan, L.;Gibbons, D.W.; Giorio, C.; Girolami, V.; et al. Systemic insecticides (neonicotinoids and fipronil): Trends,uses, mode of action and metabolites. Environ. Sci. Pollut. Res. 2015, 22, 5–34. [CrossRef]
36

Agriculture 2020, 10, 484
31. Gylling Data Management Inc. ARM 9®GDM Software, Revision 2018.3; (B= 15650); Gylling Data ManagementInc.: Brookings, SD, USA, 25 May 2018.
32. Kozina, A.; Cacija, M.; Barcic, J.I.; Bažok, R. Influence of climatic conditions on the distribution,abundance and activity of Agriotes lineatus L. adults in sex pheromone traps in Croatia. Int. J. Biometeorol. 2012,57, 509–519. [CrossRef]
33. Kozina, A.; Lemic, D.; Bažok, R.; Mikac, K.M.; Mclean, C.M.; Ivezic, M.; Igrc Barcic, J. Climatic, EdaphicFactors and Cropping History Help Predict Click Beetle (Agriotes spp.) Abundance. J. Insect Sci. 2015,15, 100–101. [CrossRef]
34. Cacija, M. Žicnjaci. In Šecerna Repa: Zaštita od Štetnih Organizama u Sustavu Integrirane Biljne Proizvodnje;Bažok, R., Ed.; Sveucilište u Zagrebu Agronomski Fakultet: Zagreb, Croatia, 2015; pp. 31–35.
35. Cacija, M.; Kozina, A.; Barcic, J.I.; Bažok, R. Linking climate change and insect pest distribution: An exampleusing Agriotes ustulatus Shall. (Coleoptera: Elateridae). Agric. For. Entomol. 2018, 20, 288–297. [CrossRef]
36. European Commission. Commission Regulation (EU) No 491/2014 of 5 May 2014 amending Annexes II and IIIto Regulation (EC) No 396/2005 of the European Parliament and of the Council as regards maximum residuelevels for ametoctradin, azoxystrobin, cycloxydim, cyfluthrin, dinotefuran, fenbuconazole, fenvalerate,fludioxonil, fluopyram, flutriafol, fluxapyroxad, glufosinate-ammonium, imidacloprid, indoxacarb, MCPA,methoxyfenozide, penthiopyrad, spinetoram and trifloxystrobin in or on certain products (1). Official Journalof the European Union 2014, L 146. Available online: https://eur-lex.europa.eu/legal-content/EN/TXT/?uri=OJ:L:2014:146:TOC (accessed on 7 November 2017).
37. European Commission. Commission Regulation (EU) 2017/671 of 7 April 2017 amending Annex II toRegulation (EC) No 396/2005 of the European Parliament and of the Council as regards maximum residuelevels for clothianidin and thiamethoxam in or on certain products. Official Journal of the European Union2017, L 97/9. Available online: https://eur-lex.europa.eu/legal-content/EN/TXT/?uri=uriserv:OJ.L_.2017.097.01.0009.01.ENG&toc=OJ:L:2017:097:TOC (accessed on 7 November 2017).
38. Wollweber, D.; Tietjen, K. Chloronicotinyl Insecticides: A Success of the New Chemistry. In NicotinoidInsecticides and the Nicotinic Acetylcholine Receptor; Yamamoto, I., Casida, J.E., Eds.; Springer: Tokyo, Japan,1999; pp. 109–125. [CrossRef]
39. Ester, A.; De Putter, H.; Van Bilsen, J.G. Filmcoating the seed of cabbage (Brassica oleracea L. convar. capitataL.) and cauliflower (Brassica oleracea L. var. botrytis L.) with imidacloprid and spinosad to control insectpests. Crop Protect. 2003, 22, 761–768. [CrossRef]
40. Lanka, S.K.; Stout, M.J.; Beuzelin, J.M.; Ottea, J.A. Activity of chlorantraniliprole and thiamethoxam seedtreatments on life stages of the rice water weevil as affected by the distribution of insecticides in rice plants.Pest Manag. Sci. 2014, 20, 338–344. [CrossRef] [PubMed]
41. Bonmatin, J.M.; Moineau, I.; Charvet, R.; Collin, M.E.; Fleche, C.; Bengsch, E.R. Behavior of imidacloprid infields. Toxicity for honey bees. In Environmental Chemistry; Lichtfouse, E., Schwarzbauer, J., Robert, D., Eds.;Springer: Berlin/Heidelberg, Germany, 2005; pp. 483–494. [CrossRef]
42. Alford, A.; Krupke, C.H. Translocation of the neonicotinoid seed treatment clothianidin in maize. PLoS ONE2017, 12, e0186527. [CrossRef]
43. Gupta, S.; Gajbhiye, V.T.; Gupta, R.K. Soil dissipation and leaching behavior of a neonicotinoid insecticidethiamethoxam. Bull. Environ. Contam. Toxicol. 2008, 80, 431–437. [CrossRef] [PubMed]
44. Huseth, A.S.; Groves, R.L. Environmental Fate of Soil Applied Neonicotinoid Insecticides in an IrrigatedPotato Agroecosystem. PLoS ONE 2014, 9, e97081. [CrossRef]
45. Guzsvány, V.; Csanádi, J.; Gaál, F. NMR study of the influence of pH on the persistence of some neonicotinoidsin water. Acta Chim. Slov. 2006, 53, 52–57.
46. Cox, W.J.; Shields, E.; Cherney, J.H. Planting date and seed treatment effects on soybean in the NortheasternUnited States. Agron. J. 2008, 100, 1662–1665. [CrossRef]
47. Krohn, J.; Hellpointer, E. Environmental fate of imidacloprid. Pflanzenschutz-Nachr. Bayer (Spec. Ed.) 2002, 55, 1–26.48. Maienfisch, P.; Brandl, F.; Kobel, W.; Rindlisbacher, A.; Senn, R. CGA 293,343: A novel, broad-spectrum
neonicotinoid insecticide. In Neonicotinoid Insecticides and the Nicotinic Acetylcholine Receptor; Yamamoto, I.,Casida, J.E., Eds.; Springer: New York, NY, USA, 1999; pp. 177–209.
49. Goulson, D. An overview of the environmental risks posed by neonicotinoid insecticides. J. Appl. Ecol. 2013,50, 977–987. [CrossRef]
37
Agriculture 2020, 10, 484
50. Krupke, C.H.; Holland, J.D.; Long, E.Y.; Eitzer, B.D. Planting of neonicotinoid-treated maize poses risksfor honey bees and other non-target organisms over a wide area without consistent crop yield benefit.J. Appl. Ecol. 2017, 54, 1449–1458. [CrossRef]
51. Westwood, F.; Bean, K.M.; Dewar, A.M.; Bromilow, R.H.; Chamberlain, K. Movement and persistence of(14C)imidacloprid in sugar-beet plants following application to pelleted sugar-beet seed. Pestic. Sci. 1999,52, 97–103. [CrossRef]
52. Bažok, R.; Barcic, J.I.; Dragovic-Uzelac, V.; Kos, T.; Drmic, Z.; Zoric, Z.; Pedisic, S.; Cathleen, J.; Hapeman, C.J.Sugar beet seed treatments with neonicotinoids: Do they pose a risk for bees? In Proceedings of the 13thIUPAC International Congress Of Pesticide Chemistry Crop, Environment and Public Health ProtectionTechnologies for a Changing Word, San Francisco, CA, USA, 10–14 August 2014.
53. Armbruster, D.A.; Pry, T. Limit of Blank, Limit of Detection and Limit of Quantitation. Clin. Biochem. Rev.2008, 29 (Suppl. 1), 49–52.
Publisher’s Note: MDPI stays neutral with regard to jurisdictional claims in published maps and institutionalaffiliations.
© 2020 by the authors. Licensee MDPI, Basel, Switzerland. This article is an open accessarticle distributed under the terms and conditions of the Creative Commons Attribution(CC BY) license (http://creativecommons.org/licenses/by/4.0/).
38

agriculture
Article
Pyrenophora teres and Rhynchosporium secalisEstablishment in a Mediterranean Malt Barley Field:Assessing Spatial, Temporal and Management Effects
Petros Vahamidis 1, Angeliki Stefopoulou 2, Christina S. Lagogianni 3, Garyfalia Economou 1,
Nicholas Dercas 2, Vassilis Kotoulas 4, Dionissios Kalivas 5 and Dimitrios I. Tsitsigiannis 3,*
1 Laboratory of Agronomy, Department of Crop Science, Agricultural University of Athens, 75 Iera Odos,11855 Athens, Greece; [email protected] (P.V.); [email protected] (G.E.)
2 Laboratory of Agricultural Hydraulics, Department of Natural Resources Management & AgriculturalEngineering, Agricultural University of Athens, 75 Iera Odos, 11855 Athens, Greece;[email protected] (A.S.); [email protected] (N.D.)
3 Laboratory of Plant Pathology, Department of Crop Science, Agricultural University of Athens, 75 Iera Odos,11855 Athens, Greece; [email protected]
4 Athenian Brewery S.A, 102 Kifissos Avenue, Aegaleo, 12241 Athens, Greece; [email protected] Laboratory of Soil Science and Agricultural Chemistry, Department of Natural Resources Management &
Agricultural Engineering, Agricultural University of Athens, 75 Iera Odos, 11855 Athens, Greece;[email protected]
* Correspondence: [email protected]; Tel.: +30-210-529-4513
Received: 7 October 2020; Accepted: 16 November 2020; Published: 18 November 2020
Abstract: Malt barley is one of the promising crops in Greece, mainly due to high yields and contractfarming, which have led to an increase in malt barley acreage. Net form net blotch (NFNB), caused byPyrenophora teres f. teres, and barley leaf scald, caused by Rhynchosporium secalis, are among the mostimportant barley diseases worldwide and particularly in Greece. Their occurrence in malt barleycan exert a significant negative effect on malt barley grain yield and quality. An experimental trialacross two growing seasons was implemented in Greece in order (i) to estimate the epidemiologyof NFNB and leaf scald in a barley disease-free area when the initial inoculation of the field occursthrough infected seeds, (ii) to explore the spatial dynamics of disease spread under the interaction ofthe nitrogen rate and genotype when there are limited sources of infected host residues in the soiland (iii) to assess the relationship among the nitrogen rate, grain yield, quality variables (i.e., grainprotein content and grain size) and disease severity. It was confirmed that both NFNB and leaf scaldcan be carried over from one season to the next on infected seed under Mediterranean conditions.However, the disease severity was more pronounced after the barley tillering phase when the soilhad been successfully inoculated, which supports the hypothesis that the most important sourceof primary inoculum for NFNB comes from infected host residue. Increasing the rate of nitrogenapplication, when malt barley was cultivated in the same field for a second year in a row, caused anon-significant increase in disease severity for both pathogens from anthesis onwards. However,hotspot and commonality analyses revealed that spatial and genotypic effects were mainly responsiblefor hiding this effect. In addition, it was found that the effect of disease infections on yield, grain sizeand grain protein content varied in relation to the genotype, pathogen and stage of crop development.The importance of crop residues in the evolution of both diseases was also highlighted.
Keywords: malt barley; barley net blotch; barley leaf scald; nitrogen rate; genotype; crop residues
Agriculture 2020, 10, 553; doi:10.3390/agriculture10110553 www.mdpi.com/journal/agriculture39
Agriculture 2020, 10, 553
1. Introduction
Barley (Hordeum vulgare L.) is one of the leading cereal crops of the world, and it is clearly numbertwo in Europe in terms of cultivated acreage, next to bread wheat (Triticum aestivum L.) [1]. According toMeussdoerffer and Zarnkow [2], barley is a major source of brewing malts and constitute the singlemost important raw material for beer production. Pyrenophora teres f. teres, an ascomycete that causesthe foliar disease net form net blotch (NFNB), and Rhynchosporium secalis, the causal agent of barleyleaf scald, are among the most important barley diseases worldwide [3–5]. It is estimated that boththese diseases can decrease barley grain yield by up to 30–40% [5–11]. In addition, there are indicationsthat these diseases can also have a negative effect on malt barley quality [5].
Understanding the temporal and spatial dynamics of disease epidemics is crucial for the developmentof more efficient, integrated disease-management systems [12]. For example, Gibson [13,14] developeda novel approach involving the spatio-temporal analysis of spatially referenced diseased plantswhen a sequence of disease maps is available. Recently, several authors addressed the spatial andspatiotemporal structures of epidemics [15,16]. According to Luo et al. [17], geostatistics have beenproposed in plant pathology to analyze the spatial patterns of epidemics. However, although theyhave several advantages in characterizing the disease pattern, they do not explicitly account for theepidemiological mechanisms that determine disease spread. Despite the increasing importance ofNFNB and leaf scald in Greece, only a few epidemiological studies have been conducted worldwideand, especially, under similar climatic conditions [18].
Compared to other cultural practice factors (e.g., the seeding rate, tillage practice, etc.), nitrogenmanagement presents the highest variability in the Greek cropping belt of malt barley. The nitrogenfertilizer rate plays a major role in malt barley by affecting to a great extent the final yields and grainprotein content (which has to be maintained below a threshold of 11.5–12.0% depending on the brewingindustry), as well as the susceptibility to leaf diseases. More nitrogen can increase the yield of maltbarley [19–22] but can also exert an adverse effect on quality by increasing grain protein content [23–26].In addition, high nitrogen rates can also increase the susceptibility of barley to leaf diseases [27–30].Therefore, understanding the degree of the relationship among the nitrogen rate, grain yield, qualityvariables and leaf disease infections can be very useful for further raising yield and maintaining thequality at a level that meets the requirements of the malt industry.
As far as we are aware, only a few studies have addressed, to date, the impact of NFNB andleaf scald on malt barley quality [30,31], and their results have been restricted to northern climates.However, there is a lack of evidence of what really happens under Mediterranean conditions, where theoccurrence of malt barley diseases coincides with terminal drought. Malt barley has to meet certainspecific quality requirements according to malt industry demands. The grain size and grain proteincontent are among the most important quality factors for malting barley [24]. Although the averagegrain weight and size is primarily determined during the post-anthesis period [32,33], the grain proteincontent can also be affected during the pre-anthesis period. For example, pre-anthesis drought stresscan cause a low nitrogen uptake during the vegetative period, thus reducing the yield potential.Then, more nitrogen is available during grain filling due to the low number of seeds, and the grainprotein content is increased [34].
In this study we aimed (i) to estimate the epidemiology of NFNB and leaf scald in a barleydisease-free area when the initial inoculation of the field occurred through infected seeds, (ii) to explorethe spatial dynamics of disease spread under the interaction of the nitrogen rate and genotype whenthere were limited sources of infected host residues in the soil and (iii) to assess the relationshipamong the nitrogen rate, grain yield, quality variables (i.e., grain protein content and grain size) anddisease severity.
40
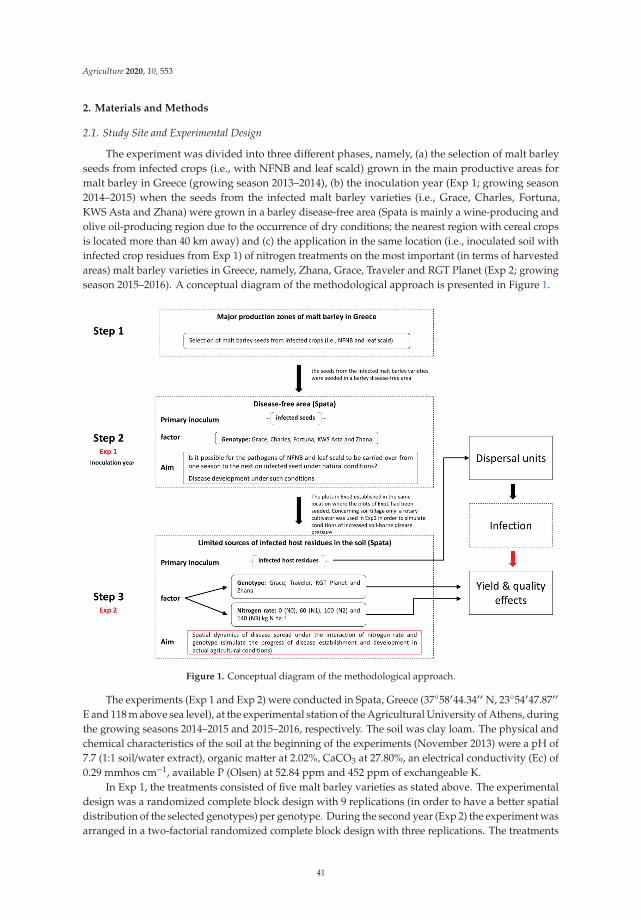
Agriculture 2020, 10, 553
2. Materials and Methods
2.1. Study Site and Experimental Design
The experiment was divided into three different phases, namely, (a) the selection of malt barleyseeds from infected crops (i.e., with NFNB and leaf scald) grown in the main productive areas formalt barley in Greece (growing season 2013–2014), (b) the inoculation year (Exp 1; growing season2014–2015) when the seeds from the infected malt barley varieties (i.e., Grace, Charles, Fortuna,KWS Asta and Zhana) were grown in a barley disease-free area (Spata is mainly a wine-producing andolive oil-producing region due to the occurrence of dry conditions; the nearest region with cereal cropsis located more than 40 km away) and (c) the application in the same location (i.e., inoculated soil withinfected crop residues from Exp 1) of nitrogen treatments on the most important (in terms of harvestedareas) malt barley varieties in Greece, namely, Zhana, Grace, Traveler and RGT Planet (Exp 2; growingseason 2015–2016). A conceptual diagram of the methodological approach is presented in Figure 1.
Figure 1. Conceptual diagram of the methodological approach.
The experiments (Exp 1 and Exp 2) were conducted in Spata, Greece (37◦58′44.34′′ N, 23◦54′47.87′′E and 118 m above sea level), at the experimental station of the Agricultural University of Athens, duringthe growing seasons 2014–2015 and 2015–2016, respectively. The soil was clay loam. The physical andchemical characteristics of the soil at the beginning of the experiments (November 2013) were a pH of7.7 (1:1 soil/water extract), organic matter at 2.02%, CaCO3 at 27.80%, an electrical conductivity (Ec) of0.29 mmhos cm−1, available P (Olsen) at 52.84 ppm and 452 ppm of exchangeable K.
In Exp 1, the treatments consisted of five malt barley varieties as stated above. The experimentaldesign was a randomized complete block design with 9 replications (in order to have a better spatialdistribution of the selected genotypes) per genotype. During the second year (Exp 2) the experiment wasarranged in a two-factorial randomized complete block design with three replications. The treatments
41
Agriculture 2020, 10, 553
were completely randomized within each block and included four two-rowed malt barley (H. vulgareL.) varieties (i.e., Zhana, Grace, Traveler and RGT Planet) and four nitrogen fertilization rates. The fourN application rates were 0 (N0), 60 (N1), 100 (N2) and 140 (N3) kg N ha−1. In order to achieve amore efficient use of the N, half of its application was applied to the experimental plots at the onset oftillering phase (stages 20–22 according to Zadoks et al.’s [35] scale), and the remaining, at the end ofthe tillering phase (stages 25–29 according to Zadoks et al.’s [35] scale), as ammonium nitrate.
In both experimental years, the plot size was 9 m2, including 15 rows with a row space of 20 cm,and the crops were planted at a seed rate of approximately 350 seeds m−2. The plots in Exp 2 wereestablished in the same location where the plots of Exp 1 had been seeded. In Exp 1, sowing wascarried out following conventional soil tillage (i.e., ploughing and then disc cultivation), whereas onlya rotary cultivator was used in Exp 2 in order to simulate the conditions of increased soil-borne diseasepressure. Only certified malt barley seeds were used in Exp 2; therefore, the only source for diseasedispersal was the crop residues from Exp 1.
The soil water content was frequently determined during each cultivation season. EC-5 sensors ofDecagon Devices, Inc. were installed at a 25 cm depth in four different plots for the monitoring of thesoil water content (SWC).
2.2. Disease Assessment
A slight modification (i.e., we integrated the percentage of diseased plants in each plot; D1) of thewidely used [36–38] equation proposed by Saari and Prescott [39] was adopted to estimate diseaseseverity (DS) during the phenological stages of tillering, stem elongation and milk development:
DS (%) = (D1/100) × (D2/9) × (D3/9) × 100 (1)
where D1 is the percentage of diseased plants in each plot, D2 is the height of infection (i.e., 1 = thelowest leaf; 2 = the second leaf from base; 3–4 = the second leaf up to below the middle of the plant;5 = up to the middle of the plant; 6–8 = from the center of the plant to below the flag leaf; and 9 = up to theflag leaf) and D3 is the extent of leaf area affected by disease (i.e., 1 = 10% coverage to 9 = 90% coverage).
The area under disease progress curve (AUDPC) was calculated by following the formula givenby Shaner and Finney [40]:
AUDPC =n−1∑
i = 1
[{(Yi + Y(i+1))/2} ×(t(i+1) − ti
)] (2)
where Yi = the disease level at time ti, (t(i+1) – ti) is the interval between two consecutive assessmentsand n is the total number of assessments.
Barley varieties were naturally infected by both diseases. The pathogens were further identifiedin the lab [4].
2.3. Yield and Malt Character Measurements
At maturity, grain yield estimation was based on an area of 1 m2 per plot. The grain size wasdetermined by size fractionation using a Sortimat (Pfeuffer GmbH, Kitzingen, Germany) machine,according to the 3.11.1 Analytica EBC “Sieving Test for Barley” method (Analytica EBC, 1998).The nitrogen content was determined by the Kjeldhal method, and the protein content was calculatedby multiplying the N content by a factor of 6.25, as described by Vahamidis et al. [41].
2.4. Spatial Statistical Analysis
Using the geographical coordinates of the experimental plots, ArcGIS 10 was used to explore thespatial associations, based on autocorrelation indices, of the disease severity among the experimentalplots during the different developmental stages. Global autocorrelation indices, such as Moran’s I,
42
Agriculture 2020, 10, 553
assess the overall pattern of the data and sometimes fail to examine patterns at a more local scale [42].Thus, aiming at deepening our knowledge on spatial associations, local autocorrelation indices wereused to compare local to global conditions. In this framework, hotspot analysis was used to identifystatistically significant clusters of high values (hotspots) and low values (cold spots) using the Getis–OrdGi statistic. Anselin Local Moran’s I was used to identify spatial clusters with attribute values similarin magnitude and specify spatial outliers.
In order to further explore the relationship between crop residues and disease severity, the distancefrom the crop residues of the previous season (2014/2015) to the location of the experimental plots of theinvestigated growing season (2015/2016) were calculated (concerning Zhana, it was the only cultivarthat was infected by Rhynchosporium secalis, and Grace was the cultivar with the highest infection byPyrenophora teres f. teres).
2.4.1. Hotspot Analysis
Moran’s I is a popular index for globally assessing spatial autocorrelation; however, it doesnot efficiently recognize the grouping of spatial patterns [43]. Hotspot analysis was used to assesswhether experimental plots with either high or low values clustered spatially. Hotspot analysis usesthe Getis–Ord local statistic, given as:
G∗i =∑n
j = 1 wi, jxj −X∑n
j =1 wi, j
S
√[n∑n
j =1 w2i, j−(∑n
j=1 wi, j)2]
n−1
(3)
where xj is the disease severity value for an experimental plot j, wi,j is the spatial weight between theexperimental plot i and j, n is the total number of experimental plots and
X =
∑nj=1 xj
n(4)
S =
√∑nj=1 x2
j
n−(X)2
(5)
The Getis–Ord Gi statistic assesses whether the neighborhood of each experimental plot issignificantly different from the study area and can distinguish high-value clusters (hotspots) andlow-value clusters (cold spots).
The Gi* statistic returns a z-score, which is a standard deviation. For statistically significantlypositive z-scores, higher values of the z-score indicate the clustering of high values (hotspot). For statisticallysignificantly negative z-scores, lower values indicate the clustering of low values (cold spot).
2.4.2. Cluster and Outlier Analysis
Anselin Local Moran’s I was used to identify clusters and spatial outliers. The index identifiesstatistically significant (95%, p < 0.05) clusters of high or low disease severity and outliers. A highpositive local Moran’s I value implies that the experimental plot under study has values similarly highor low to its neighbors’; thus, the locations are spatial clusters. The spatial clusters include high–highclusters (high values in a high-value neighborhood) and low–low clusters (low values in a low-valueneighborhood). A high negative local Moran’s I value means that the experimental plot under study isa spatial outlier [44]. Spatial outliers are those values that are obviously different from the values oftheir surrounding locations [45]. Anselin Local Moran’s I enables us to distinguish outliers withinhotspots, because it excludes the value of the experimental plot under study, contrary to the hotspotanalysis, which takes it into account.
43
Agriculture 2020, 10, 553
The local Moran’s I is given as:
Ii =xi −X
S2i
n∑j=1, j�i
wi, j(xi −X
)(6)
where xi is an attribute for feature I, X is the mean of the corresponding attribute, wi,j is the spatialweight between feature I and j, and:
S2i =
∑nj=1, j�i wij
n− 1−X
2(7)
2.5. Statistical Analysis
Analyses of variance were performed using the Statgraphics Centurion ver. XVI software package(Statpoint Technologies, Inc., Warrenton, VA, USA). Prior to ANOVA, the residuals (standardized)of the data were visually tested with qq-plots, as well as with Shapiro–Wilk tests, using SPSS (IBMSPSS Statistics for Windows, Version 22.0, IBM Corp. Armonk, New York, NY, USA). Percentagevalues concerning disease severity were arcsine transformed prior to ANOVA. Significant differencesbetween treatment means were compared by the protected least significant difference (LSD) procedureat p < 0.05. Commonality analysis was performed in the R environment (version 3.4.3) using the “yhat”package (version 2.0–0) as described by Nimon et al. [46]. For a number k of predictors, CA returnsa table of (2k-1) commonality coefficients (or commonalities), including both unique and commoneffects [47]. In the case where the dependent variable y is explained by two predictors i and j, the uniqueeffects are:
U(i) = R2y.i j − R2
y. jU( j) = R2
y.i j − R2y.i
(8)
and the common contribution I is:
C(i j) = R2y.i j − U(i) −U( j) (9)
3. Results
3.1. Weather Conditions
The weather regime, in terms of the maximum (Tmax) and minimum air temperature (Tmin) andrainfall, during both experiments, is presented in Figure 2. The maximum and minimum temperaturesincreased from February to May, as typically occurs in Mediterranean environments. The environmentalconditions differed between the two experimental years, with differences in the amount and distributionof precipitation during the growing season, as well as differences in temperature. In general, 2015–2016(Exp 2) was considered to be a drier growing season compared to 2014–2015 (Exp 1).
44
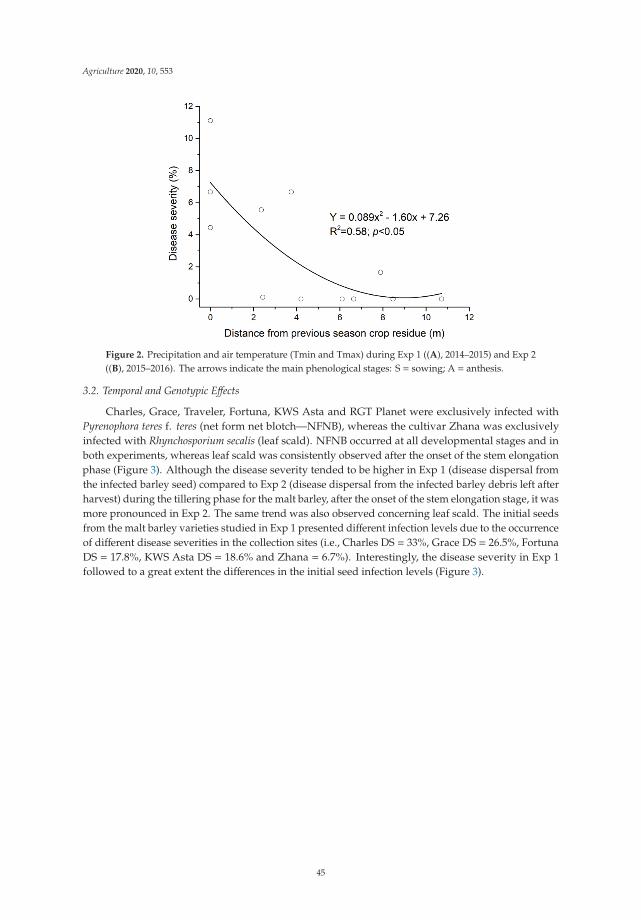
Agriculture 2020, 10, 553
Figure 2. Precipitation and air temperature (Tmin and Tmax) during Exp 1 ((A), 2014–2015) and Exp 2((B), 2015–2016). The arrows indicate the main phenological stages: S = sowing; A = anthesis.
3.2. Temporal and Genotypic Effects
Charles, Grace, Traveler, Fortuna, KWS Asta and RGT Planet were exclusively infected withPyrenophora teres f. teres (net form net blotch—NFNB), whereas the cultivar Zhana was exclusivelyinfected with Rhynchosporium secalis (leaf scald). NFNB occurred at all developmental stages and inboth experiments, whereas leaf scald was consistently observed after the onset of the stem elongationphase (Figure 3). Although the disease severity tended to be higher in Exp 1 (disease dispersal fromthe infected barley seed) compared to Exp 2 (disease dispersal from the infected barley debris left afterharvest) during the tillering phase for the malt barley, after the onset of the stem elongation stage, it wasmore pronounced in Exp 2. The same trend was also observed concerning leaf scald. The initial seedsfrom the malt barley varieties studied in Exp 1 presented different infection levels due to the occurrenceof different disease severities in the collection sites (i.e., Charles DS = 33%, Grace DS = 26.5%, FortunaDS = 17.8%, KWS Asta DS = 18.6% and Zhana = 6.7%). Interestingly, the disease severity in Exp 1followed to a great extent the differences in the initial seed infection levels (Figure 3).
45

Agriculture 2020, 10, 553
Figure 3. Malt barley cultivars’ susceptibility to Pyrenophora teres f. teres (net form net blotch—NFNB) andRhynchosporium secalis (leaf blotch and scald) at different developmental phases during both experiments.The numbers in the brackets refer to the Zadoks scale. Broad lines are medians, square open dots aremeans, boxes show the interquartile ranges, and whiskers extend to the last data points within 1.5 timesthe interquartile ranges. p-values of ANOVA and permutation tests are given. Groups not sharing thesame letter are significantly different according to least significant difference (LSD) test (p < 0.05).
In general, infections by NFNB were more severe compared to leaf scald during all the testeddevelopmental phases for the malt barley (Figure 3).
3.3. The Area under Disease Progress Curve (AUDPC)
The area under disease progress curve (AUDPC) in Exp 2 was not significantly affected either bythe nitrogen rate or the interaction cultivar x nitrogen (Table 1). However, the analysis of variancefor AUDPC indicated that a significant degree of genotypic variation existed among the studied maltbarley cultivars in both experiments. The AUDPC values were lower in Exp 1 compared to Exp 2.Charles and Grace presented the highest values in Exp 1 and Exp 2, respectively (Figure 4).
Table 1. ANOVA summary for grain yield (GY), grain protein content (GPC), maltable (% grains> 2.2 mm),AUDPC and disease severity during the onset of stem elongation (DSSE) and grain filling (DSGF) phases.
Source of Variation GY GPC Maltable AUDPC a DSSE DSGF
Cultivar ** ns *** ** * *Nitrogen ns *** ns ns ns nsCultivar x Nitrogen * ns ns ns ns ns
*, ** and ***: F values significant at the p < 0.05, p < 0.01 and p < 0.001 probability levels, respectively. ns stands fornon-significant effect. a AUDPC: Area under disease progress curve.
46
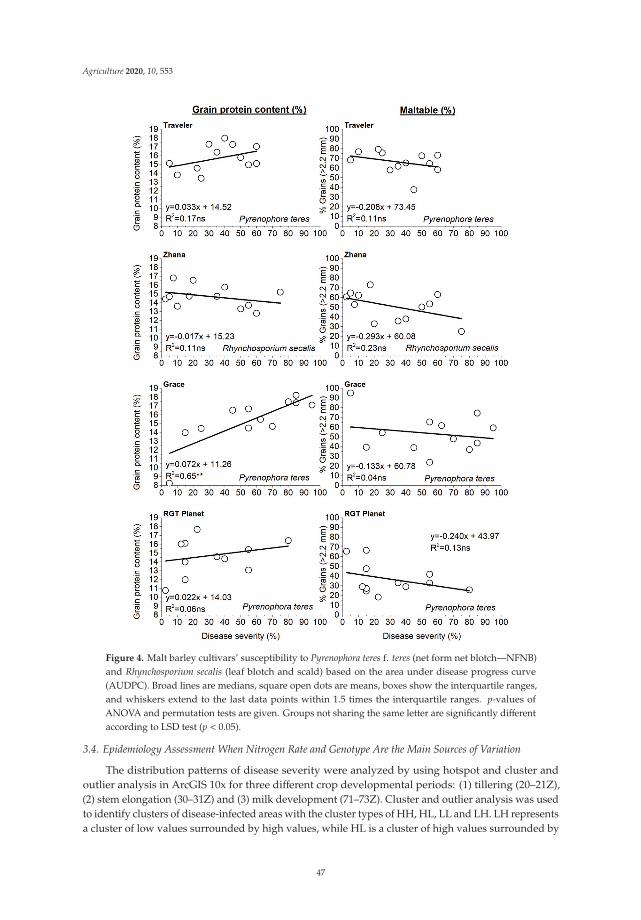
Agriculture 2020, 10, 553
Figure 4. Malt barley cultivars’ susceptibility to Pyrenophora teres f. teres (net form net blotch—NFNB)and Rhynchosporium secalis (leaf blotch and scald) based on the area under disease progress curve(AUDPC). Broad lines are medians, square open dots are means, boxes show the interquartile ranges,and whiskers extend to the last data points within 1.5 times the interquartile ranges. p-values ofANOVA and permutation tests are given. Groups not sharing the same letter are significantly differentaccording to LSD test (p < 0.05).
3.4. Epidemiology Assessment When Nitrogen Rate and Genotype Are the Main Sources of Variation
The distribution patterns of disease severity were analyzed by using hotspot and cluster andoutlier analysis in ArcGIS 10x for three different crop developmental periods: (1) tillering (20–21Z),(2) stem elongation (30–31Z) and (3) milk development (71–73Z). Cluster and outlier analysis was usedto identify clusters of disease-infected areas with the cluster types of HH, HL, LL and LH. LH representsa cluster of low values surrounded by high values, while HL is a cluster of high values surrounded by
47
Agriculture 2020, 10, 553
low values. In addition, LL and HH were statistically significant (p < 0.05) clusters of low and highdisease severity values, respectively.
During the onset of the tillering phase, two experimental plots presented significant positivez scores, demonstrating significant clusters of intense disease severity. They were located on thewestern part of the field, and both of them included Traveler with nitrogen rates of 100 and 140 kg/ha,respectively (Figure 5). RGT Planet with a nitrogen rate of 100 kg/ha was also marked as a hotspotbut less intense, though presenting a lower z-score (Figure 5). Note that lower z-scores indicate lessintense clustering. The local Moran’s I spatial analysis indicated only one High–Low outlier in thewestern part of the field. Indeed, Traveler with a rate of 100 kg N/ha was considered as an outlier sinceit presented high values of disease severity surrounded by lower surrounding values.
48

Agriculture 2020, 10, 553
Figure 5. Composite hotspot analysis (Gi z-score) and cluster pattern analysis (local Moran’s I) ofdisease severity (caused by Pyrenophora teres f. teres and Rhynchosporium secalis) assessed at differentdevelopmental stages of malt barley. A georeferenced arrangement of the experimental area showingthe distribution of the cultivar and N-fertilizer treatments is also presented. The abbreviations standfor Gr = Grace, Zh = Zhana, Tr = Traveler and Pl = Planet.
During the stem elongation phase, hotspots increased in number and continued to be present inthe western part of the field. The analysis identified three hotspots with very high z-scores (Grace with
49

Agriculture 2020, 10, 553
60 kg N/ha; Traveler with 100 kg N/ha; and Traveler with 140 kg N/ha, one with a high (RGT Planetwith 0 kg N/ha) and one with a moderate z-score (Grace with 60 kg N/ha). Although Zhana with 60 and100 kg N/ha was surrounded by hotspots, it presented low values of disease severity. The local Moran’sI spatial analysis confirmed the abovementioned results by characterizing these plots as Low–High outliers,indicating low values of disease severity compared to the surrounding plots. The analysis also identifieda statistically significant (p < 0.05) cluster of increased disease severity, which coincided with two of thehotspots (Traveler and Planet in the western side) determined with the Getis–Ord G* statistic (Figure 4).
Two Grace plots with 140 kg of N/ha were identified as hotspots of the highest z-scores duringmilk development and were followed by RGT Planet without nitrogen application. The local Moran’s Ispatial analysis again identified two Zhana plots (i.e., with nitrogen rates of 0 and 100 kg/ha) as spatialoutliers, since they presented low disease severity in a neighborhood of high values (Figure 5).
3.5. Quantifying the Effects of the Rate of Nitrogen Application and the Distance from the Nearest Hotspot onCrop Disease Severity
Commonality analysis (CA) served to quantify the relative contributions of the rate of nitrogenapplication (kg/ha) and the distance from the nearest hotspot to crop disease severity. It is a method ofpartitioning variance that can discriminate the synergistic or antagonistic processes operating amongpredictors. Commonalities represent the percentage of variance in the dependent variable that isuniquely explained by each predictor (unique effect) or by all possible combinations of predictors(common effect), and their sum is always equal to the R2 of the multiple linear regression. The distancefrom the nearest hotspot (m) and the quantity of applied nitrogen (kg/ha) explained 10 to 74% of thevariance in disease severity (Table 2).
Table 2. Commonality coefficients including both unique and common effects, along with % totalcontribution of each predictor variable or sets of predictor variables to the regression effect.
Cultivar Unique and Common EffectsOnset of Stem Elongation
Onset of Grain Filling(Milk Development)
Coefficient % Total Coefficient % Total
Traveler Unique to Distance a 0.4547 72.51 0.0008 0.22Unique to Nitrogen b 0.0004 0.07 0.3493 93.17
Common to Distance and Nitrogen 0.1720 27.42 0.0248 6.61Total 0.6271 100.00 0.3748 100.00
Zhana Unique to Distance 0.1678 67.81 0.0819 79.91Unique to Nitrogen 0.0089 3.59 0.0241 23.51
Common to Distance and Nitrogen 0.0708 28.61 −0.0035 −3.42Total 0.2475 100.00 0.1025 100.00
Grace Unique to Distance 0.3837 97.65 0.1641 22.26Unique to Nitrogen 0.0105 2.66 0.2850 38.66
Common to Distance and Nitrogen −0.0012 −0.31 0.2881 39.08Total 0.3930 100.00 0.7373 100.00
RGT Planet Unique to Distance 0.1912 38.76 0.3672 83.26Unique to Nitrogen 0.0925 18.75 0.0020 0.46
Common to Distance and Nitrogen 0.2096 42.49 0.0718 16.29Total 0.4933 100.00 0.4411 100.00
a Refers to the distance from the nearest hotspot (m); b Refers to the rate of nitrogen application (kg/ha).
Examining the unique effects, it was found that for the period of the stem elongation phase,the distance from the nearest hotspot (m) was the best predictor of disease severity for all the studycultivars, uniquely explaining 16.8 to 45.5% of its variation. This amount of variance represented 38.76to 97.65% of the R2 effect (Table 2). On the contrary, during the onset of the grain filling phase thevariation in disease severity was best explained by either the nitrogen rate (i.e., Traveler and Grace) orthe distance from the nearest hotspot (m) (i.e., RGT Planet and Zhana) (Table 2).
50

Agriculture 2020, 10, 553
3.6. Effect of N and Genotype on Grain Yield and Quality Characters
Disease severity was clearly not influenced by the N rate during the vegetative phase (i.e., stemelongation phase) of the malt barley. On the contrary, during the grain filling phase, the experimentaldata demonstrated a tendency for a positive relationship between the disease severity and the rate ofnitrogen application (Figure 6); however, this tendency was not expressed in a statistically significantway according to ANOVA (Table 1).
Figure 6. The effect of nitrogen rate on disease severity (caused by Pyrenophora teres f. teres andRhynchosporium secalis) assessed at different developmental stages of the studied malt barley varieties(Zhana, Grace, Traveler and RGT Planet). Broad lines are medians, square open dots are means,boxes show the interquartile ranges, and whiskers extend to the last data points within 1.5 times theinterquartile ranges. p-values of ANOVA and permutation tests are given.
The grain yield was significantly affected by the cultivar and by the interaction cultivar x nitrogen(Table 1), and varied from 0.84 to 4.26 t ha−1. Grace and Traveler were the only cultivars that presentedsignificant relationships between the grain yield and disease severity (Figure 7). In particular, Travelershowed a marginal, statistically significant negative relationship between the grain yield and diseaseseverity, only for the period of tillering (Figure 7). Concerning Grace, the grain yield showed a negative,significant direct relationship with disease severity for the period of grain filling (milk development)and, on the contrary, presented a moderate, positive association with disease severity for the period ofthe tillering phase (Figure 7).
51
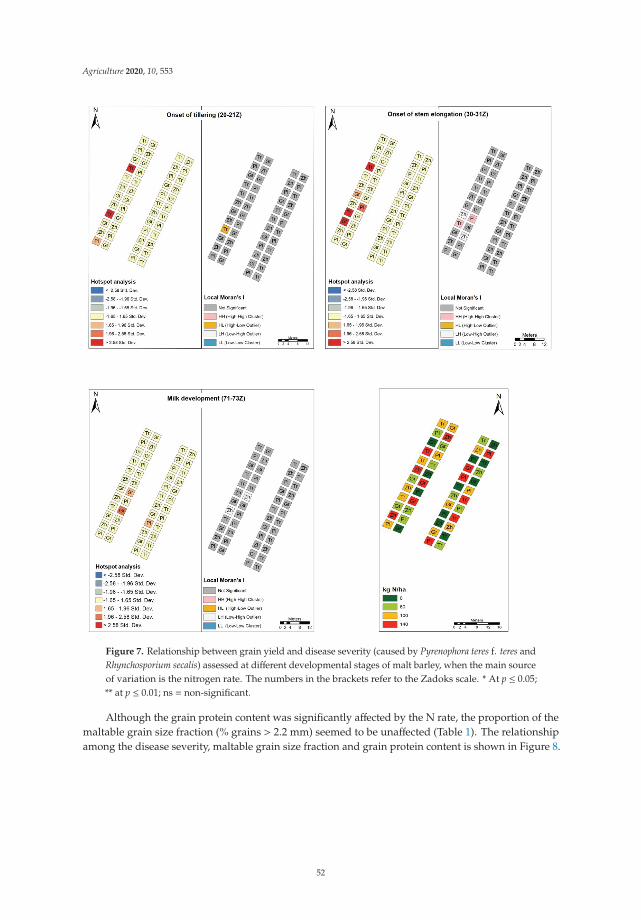
Agriculture 2020, 10, 553
Figure 7. Relationship between grain yield and disease severity (caused by Pyrenophora teres f. teres andRhynchosporium secalis) assessed at different developmental stages of malt barley, when the main sourceof variation is the nitrogen rate. The numbers in the brackets refer to the Zadoks scale. * At p ≤ 0.05;** at p ≤ 0.01; ns = non-significant.
Although the grain protein content was significantly affected by the N rate, the proportion of themaltable grain size fraction (% grains > 2.2 mm) seemed to be unaffected (Table 1). The relationshipamong the disease severity, maltable grain size fraction and grain protein content is shown in Figure 8.
52
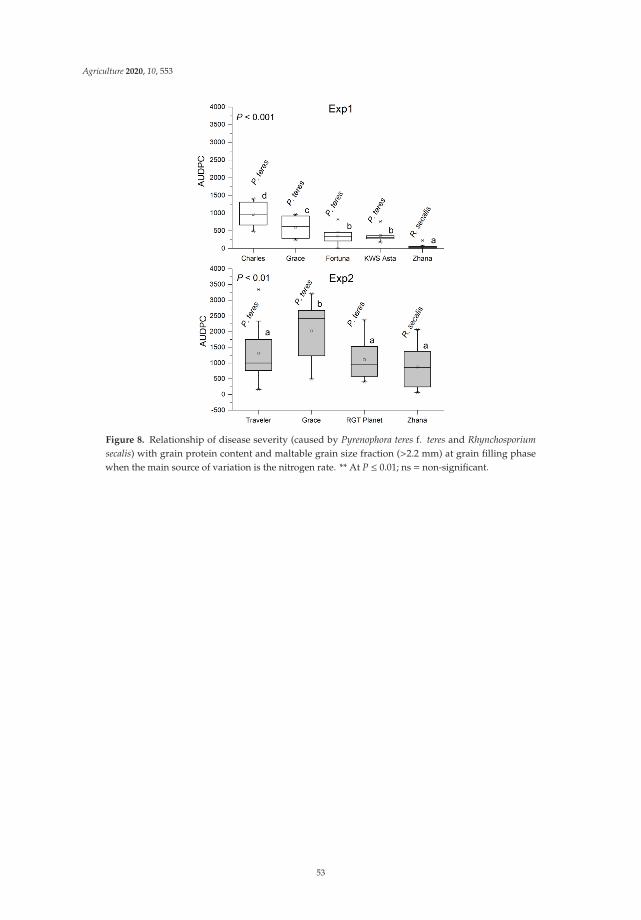
Agriculture 2020, 10, 553
Figure 8. Relationship of disease severity (caused by Pyrenophora teres f. teres and Rhynchosporiumsecalis) with grain protein content and maltable grain size fraction (>2.2 mm) at grain filling phasewhen the main source of variation is the nitrogen rate. ** At P ≤ 0.01; ns = non-significant.
53

Agriculture 2020, 10, 553
4. Discussion
Although our approach provides a further insight into the factors (i.e., Integrated PestManagement-IPM, spatial and temporal) determining disease severity and crop performance, it couldbe argued that our experimentation was not adequate to provide solid evidence about the effect ofthe nitrogen rate. Indeed, we intentionally tested the nitrogen rate effect for only one year. Our mainobjective was to explore the introduction and spread of net form net blotch and barley leaf scald underthe combined effect of nitrogen fertilization and genotype in a field with limited sources of infectedhost residues in the soil. Therefore, repeating Exp 2 for a second year, which means 3 years of barleycultivation in the same field, would inevitably lead to a wide spread of infected host residues and,in turn, to a poor estimation of the spatial dynamics of disease epidemics. Furthermore, it is quiteclear that both experiments (Exp 1 and Exp 2) are interrelated, and this was essential for exploring acontinuous process such as the entry, establishment and spread of a disease in a new area.
Despite the possible constraints and also by taking into consideration the fact that the testedexperimental field was inside a disease-free area (cereals are not cultivated in this region), this studysupports the hypothesis [3,18,48,49] that both NFNB and leaf scald could be carried over from oneseason to the next on infected seed. Furthermore, it was shown that the disease severity, concerningboth diseases, differed between the two experimental years (Figure 3). However, the question is whetherthis difference can be attributed to the initial source of the inoculum or just to the meteorologicalconditions that occurred during the tested years. On the one hand, our results revealed a higherdisease severity in Exp 1 during the early development of the barley, and on the other hand, there wasa higher disease severity in Exp 2 from the onset of stem elongation onwards (Figure 3). What weactually know is that rain episodes and moist conditions are essential for the dissemination and theinfections of conidia concerning both pathogens [5,50,51]. Therefore, the higher disease severity inExp 2 could not be explained by favorable meteorological conditions due to the occurrence of drierconditions in Exp 2 compared to Exp 1 (Figure 2). In addition, it is widely accepted that the mostimportant source of primary inoculum for NFNB comes from infected host residue [5], an argumentthat supports the hypothesis that the higher disease severity in Exp 2 could presumably be attributedto a greater quantity of infected host residue during Exp 2.
As far as we are aware, our study, for the first time, demonstrates a spatial epidemiologyassessment of both diseases under a Mediterranean environment and also sheds more light on the roleof crop residues concerning their establishment in a new barley field. The epidemiology assessmentof both diseases, when the nitrogen rate and genotype were the main sources of variation (Exp 2),was implemented with hotspot and Anselin Local Moran’s I analysis. We found that the locationof the hotspots changed during the growing season (Figure 5). This can be explained either by soilheterogeneity or by the spatial presence of the pathogens in the soil (i.e., as infected host residue) andgenotype susceptibility. Soil heterogeneity was considered negligible because (i) the acreage of theexperimental field was small (approximately 0.1 ha), (ii) there was no land inclination and (iii) thedifferentiation of the field soil moisture was rather small (Figure 9). Commonality analysis duringExp 2 revealed that the most important factor concerning NFNB disease severity was the distance ofthe plots from the hotspots, concerning the period of the onset of stem elongation (Table 2). Accordingto Liu et al. [4], NFNB is classified as stubble-borne disease because the fungus usually producesthe ascocarp as an over-seasoning structure on infected barley debris left after harvest. The primaryinoculum early in the growing season is made by mature ascospores, which are dispersed by the wind.After initial colonization, the pathogen produces a large number of conidia, which serve as secondaryinocula. These asexually produced spores can be dispersed by either the wind or rain to cause newinfections on plants locally or at longer distances [4]. On the other hand, Zhana was the only cultivarthat was not infected in both seasons by NFNB (i.e., it was infected only by Rhynchosporium secalis).However, it was found that the distance of the Zhana experimental plots from the previous season cropresidues (i.e., the sites with Zhana) explained 58% of the variation in the disease severity (Figure 10).This result is also supported by the Anselin Local Moran’s I spatial statistical analysis. Zhana was
54

Agriculture 2020, 10, 553
considered an outlier due to having lower disease severity values while being surrounded by plotswith high values from stem elongation onwards (Figure 5).
Figure 9. The variation in soil water content from anthesis until the end of grain filling (during Exp 2).Broad lines are medians, square open dots are means, boxes show the interquartile ranges, and whiskersextend to the last data points within 1.5 times the interquartile ranges.
55

Agriculture 2020, 10, 553
Figure 10. Relationship between disease severity and the distance of the Zhana plots from the previousseason’s Zhana crop.
The late occurrence of Rhynchosporium secalis symptoms on Zhana compared to NFNB (Figure 3)during both experiments could possibly be attributed to its specific life cycle. According to Zhanet al. [3], R. secalis grows symptomlessly under the cuticle, especially where the walls of adjacentcells are joined before producing new conidia and, finally, visual symptoms. Further investigationsconcerning the infection process of R. secalis in barley were conducted by Linsell et al. [52]. In general,NFNB was more prevalent compared to leaf scald during all the tested developmental phases of maltbarley (Figures 3 and 4). According to Robinson and Jalli [53], this could be a result of net blotchbeing comparatively less demanding of environmental conditions (mostly wind dispersed) than scald(mostly splash dispersed) for effective spore dispersal and epidemic development.
The effect of N on plant disease severity is quite variable in the literature [29]. Both increases [27,30]and decreases [28] in disease severity are reported from increasing N in plants. In addition, Turkingtonet al. [31] found that the total leaf disease severity caused by NFNB in barley was not significantlyaffected by the N rate. Our results showed that the disease severity for both pathogens during thesecond year for the malt barley in the same field (Exp 2) tended to increase from anthesis onwards uponincreasing the rate of nitrogen application (Figure 6). The lack of a significant relationship between thedisease severity and N rate could presumably be hidden behind spatial and genotypic effects. Indeed,according to commonality analysis, the effect of the distance from the locations with the highest diseaseinfections was a better predictor of disease severity (for both diseases) compared to the nitrogen rate
56
Agriculture 2020, 10, 553
during the pre-anthesis period. However, after anthesis, the disease severity was best explained by thenitrogen rate, concerning only the cultivars most susceptible to NFNB (Table 2).
The typical yield losses due to NFNB (Pyrenophora teres f. teres) and leaf scald (Rhynchosporiumsecalis) outbreaks can be up to 30–40% [3,6,8–11]. However, we did not detect any consistent relationshipbetween the disease severity and grain yield when the main source of variation was the nitrogen rate(Figure 7). Jalakas et al. [54] also found a weak relationship between malt barley grain yield and netblotch (Pyrenophora teres) disease severity. This can be attributed to the time of disease occurrence andto the extent of the disease severity in relation to the barley developmental stage. It is widely acceptedthat grain yield determination in barley is mainly explained by the variation in the grain numberper unit of land area [21,41,55,56]. According to Bingham et al. [57], the grain number in barley isa function of the production and survival of tillers and spikelets and the success of the fertilizationof florets. Tiller production and spikelet initiation occur before the stem elongation phase, whilethe survival and further growth of tillers and spikelets are largely determined from stem elongationonwards. Accordingly, our results showed that the highest disease severity, which was recorded inTraveler during the tillering phase (Figure 3), exerted a more pronounced negative effect on the grainyield (Figure 7). In line with this, Jordan [48] demonstrated that the inoculation of spring barley beforetillering can cause 30–40% yield loss, whereas inoculation from tillering to flowering decreased thegrain yield by only 10%.
The higher disease severity in Grace compared to the rest of the studied cultivars during theonset of the grain filling phase (Figure 3) led to a significant reduction in grain yield, mainly through adecrease in the mean grain weight. Indeed, an increase in disease severity by 32.5% during the grainfilling phase caused a reduction in the thousand grain weight by 18.3% in Grace. In line with this,Agostinetto et al. [58] demonstrated that the strongest relationship between grain yield reduction andbarley spot blotch severity occurred after the booting stage of barley. Furthermore, Khan [9] observeda reduction in barley grain yield by 25–35% from net blotch, mainly due to a significant decrease inthousand grain weight.
The grain protein content is one of the most important factors in marketing malting barley.The primary objective, particularly in Mediterranean environments, is to maintain the grain proteincontent below a threshold of 11.5–12.0% depending on the brewing industry [41]. Although there issome evidence from northern climates suggesting that NFNB infections are not exerting any significanteffect on grain protein content [30,31], our results revealed for the first time a positive relationshipbetween NFNB disease severity and the grain protein content under Mediterranean conditions.Additionally, it was shown that the magnitude of this relationship was genotype dependent (Figure 8).It seems that the effect of NFNB disease severity on the grain protein content increases under terminaldrought stress conditions in April–May (Figure 2A,B). According to Bertholdsson [34], drought stressduring late grain filling limits carbohydrate incorporation in the grain and causes the pre-maturationand less dilution of the protein in the grain.
57
Agriculture 2020, 10, 553
5. Conclusions
Despite possible constraints, the results of the present study provide further insight into theepidemiology of the most important foliar diseases of malt barley in Greece and can help farmersto improve their IPM practices in order to create higher profits while improving the environment’ssustainability. It was shown that both NFNB and leaf scald can be carried over from one seasonto the next on infected seed under Mediterranean conditions. However, the disease severity wasmore pronounced after the barley tillering phase when the soil had been successfully inoculated first,which supports the hypothesis that the most important source of primary inoculum for NFNB comesfrom infected host residue.
Our results show that the disease severity for both pathogens, when the malt barley was cultivatedin the same field for a second year, presented a non-significant increase from anthesis onwards uponincreasing the rate of nitrogen application. However, it was demonstrated that the lack of a significanteffect of the N rate on disease severity was mainly hidden behind spatial and genotypic effects.In addition, it was revealed that the effect of disease infections on the yield, grain size and grain proteincontent varied in relation to the genotype, pathogen and stage of crop development. These data canhelp in the development of long-term strategies for the minimization of net form net blotch and barleyleaf scald occurrence.
Author Contributions: Conceptualization, P.V., A.S. and D.I.T.; methodology, P.V. and D.I.T.; software, P.V. and A.S.;formal analysis, P.V.; investigation, P.V. and V.K.; resources, N.D. and G.E.; data curation, P.V.; writing—originaldraft preparation, P.V., A.S., C.S.L. and D.I.T.; writing—review and editing, P.V., D.I.T., N.D. and D.K.; visualization,P.V. and A.S.; supervision, N.D., G.E. and D.I.T.; project administration, V.K.; funding acquisition, N.D. and G.E.All authors have read and agreed to the published version of the manuscript.
Funding: This research was funded by Athenian Brewery S.A.
Conflicts of Interest: The authors declare no conflict of interest.
References
1. Friedt, W. Barley breeding history, progress, objectives, and technology. In Barley Production, Improvement,and Uses, 1st ed.; Ullrich, S.E., Ed.; Wiley: Hoboken, NJ, USA, 2011; pp. 160–220.
2. Meussdoerffer, F.; Zarnkow, M. Starchy Raw Materials. In Handbook of Brewing: Processes, Technology, Markets,1st ed; Eßlinger, H.M., Ed.; Wiley: Weinheim, Germany, 2009; pp. 43–83.
3. Zhan, J.; Fitt, B.D.L.; Pinnschmidt, H.O.; Oxley, S.J.P.; Newton, A.C. Resistance, epidemiology and sustainablemanagement of Rhynchosporium secalis populations on barley. Plant Pathol. 2008, 57, 1–14. [CrossRef]
4. Liu, Z.; Ellwood, S.R.; Oliver, R.P.; Friesen, T.L. Pyrenophora teres: Profile of an increasingly damaging barleypathogen. Mol. Plant Pathol. 2011, 12, 1–19. [CrossRef] [PubMed]
5. Paulitz, T.C.; Steffenson, B.J. Biotic stress in barley: Disease problems and solutions. In Barley Production,Improvement, and Uses, 1st ed.; Ullrich, S.E., Ed.; Wiley: Hoboken, NJ, USA, 2011; pp. 307–354.
6. Shipton, W.A. Effect of net blotch infection of barley on grain yield and quality. Aust. J. Exp. Agric. Anim. Husb.1966, 6, 437–440. [CrossRef]
7. Shipton, W.A.; Boyd, W.J.R.; Ali, S.M. Scald of barley. Rev. Plant. Pathol. 1974, 53, 839–861.8. Martin, R.A. Disease progression and yield loss in barley associated with net blotch, as influenced by
fungicide seed treatment. Can. J. Plant Pathol. 1985, 7, 83–90. [CrossRef]9. Khan, T.N. Relationship between net blotch (Drechslera teres) and losses in grain yield of barley in Western
Australia. Aust. J. Agric. Res. 1987, 38, 671–679. [CrossRef]10. El Yousfi, B.; Ezzahiri, B. Net blotch in semi-arid regions of Marocco II: Yield and yield-loss modeling.
Field Crops Res. 2002, 73, 81–93. [CrossRef]11. Murray, G.M.; Brennan, J.P. Estimating disease losses to the Australian barley industry. Australas. Plant Pathol.
2010, 39, 85–96. [CrossRef]12. McCartney, H.A.; Fitt, B.D.L. Dispersal of foliar fungal plant pathogens: Mechanisms, gradients and spatial
patterns. In The Epidemiology of Plant Diseases, 1st ed.; Jones, D.G., Ed.; Springer: Dordrecht, The Netherlands,1998; pp. 138–160.
58
Agriculture 2020, 10, 553
13. Gibson, G.J. Investigating mechanisms of spatiotemporal epidemic spread using stochastic models.Phytopathology 1997, 87, 139–146. [CrossRef]
14. Gibson, G.J. Markov chain Monte Carlo methods for fitting spatiotemporal epidemic stochastic models inplant epidemiology. J. R. Stat. Soc. Ser. C 1997, 46, 215–233. [CrossRef]
15. Madden, L.V. Botanical epidemiology: Some key advances and its continuing role in disease management.Eur. J. Plant Pathol. 2006, 115, 3–23. [CrossRef]
16. Scherm, H.; Ngugi, H.K.; Ojiambo, P.S. Trends in theoretical plant epidemiology. Eur. J. Plant Pathol. 2006,115, 61–73. [CrossRef]
17. Luo, W.; Pietravalle, S.; Parnell, S.; van den Bosch, F.; Gottwald, T.R.; Irey, M.S.; Parke, S.R. An improvedregulatory sampling method for mapping and representing plant disease from a limited number of samples.Epidemics 2012, 4, 68–77. [CrossRef]
18. El Yousfi, B.; Ezzahiri, B. Net blotch in semi arid regions of Morocco. I Epidemiology. Field Crops Res. 2001,73, 35–46. [CrossRef]
19. Baethgen, W.E.; Christianson, C.B.; Lamothe, A.G. Nitrogen fertilizer effects on growth, grain yield, and yieldcomponents of malting barley. Field Crops Res. 1995, 43, 87–99. [CrossRef]
20. Abeledo, L.G.; Calderini, D.F.; Slafer, G.A. Nitrogen economy in old and modern malting barleys. Field Crops Res.2008, 106, 171–178. [CrossRef]
21. Albrizio, R.; Todorovic, M.; Matic, T.; Stellacci, A.M. Comparing the interactive effects of water and nitrogenon durum wheat and barley grown in a Mediterranean environment. Field Crops Res. 2010, 115, 179–190.[CrossRef]
22. Dordas, C. Variation in dry matter and nitrogen accumulation and remobilization in barley as affected byfertilization, cultivar, and source–sink relations. Eur. J. Agron. 2012, 37, 31–42. [CrossRef]
23. Grant, C.A.; Gauer, L.E.; Gehl, D.T.; Bailey, L.D. Protein production and nitrogen utilization by barleycultivars in response to nitrogen fertilizer under varying moisture conditions. Can. J. Plant Sci. 1991,7l, 997–1009. [CrossRef]
24. Grashoff, C.; D’Antuono, L.F. Effect of shading and nitrogen application on yield, grain size distribution andconcentrations of nitrogen and water soluble carbohydrates in malting spring barley (Hordeum vulgare L.).Eur. J. Agron. 1997, 6, 275–293. [CrossRef]
25. Boonchoo, S.; Fukai, S.; Hetherington, S.E. Barley yield and grain protein concentration as affected byassimilate and nitrogen availability. Aust. J. Agric. Res. 1998, 49, 695–706. [CrossRef]
26. Agegnehu, G.; Nelson, P.N.; Bird, M.I. The effects of biochar, compost and their mixture and nitrogenfertilizer on yield and nitrogen use efficiency of barley grown on a Nitisol in the highlands of Ethiopia.Sci. Total Environ. 2016, 569–570, 869–879. [CrossRef] [PubMed]
27. Jenkyn, J.F.; Griffiths, E. Relationships between the severity of leaf blotch (Rhynchosporium secalis) andthe water-soluble carbohydrate and nitrogen contents of barley plants. Ann. Appl. Biol. 1978, 90, 35–44.[CrossRef]
28. Krupinsky, J.M.; Halvorson, A.D.; Tanaka, D.L.; Merrill, S.D. Nitrogen and tillage effects on wheat leaf spotdiseases in the northern great plains. Agron. J. 2007, 99, 562–569. [CrossRef]
29. Dordas, C. Role of nutrients in controlling plant diseases in sustainable agriculture. A review. Agron. Sustain. Dev.2008, 28, 33–46. [CrossRef]
30. Kangor, T.; Sooväli, P.; Tamm, Y.; Tamm, I.; Koppel, M. Malting barley diseases, yield and quality—Responsesto using various agro-technology regimes. Proc. Latv. Acad. Sci. Sect. B 2017, 71, 57–62. [CrossRef]
31. Turkington, T.K.; O’Donovan, J.T.; Edney, M.J.; Juskiw, P.E.; McKenzie, R.H.; Harker, K.N.; Clayton, G.W.;Xi, K.; Lafond, G.P.; Irvine, R.B.; et al. Effect of crop residue, nitrogen rate and fungicide application onmalting barley productivity, quality, and foliar disease severity. Can. J. Plant Sci. 2012, 92, 577–588. [CrossRef]
32. Bingham, I.J.; Blake, J.; Foulkes, M.J.; Spink, J. Is barley yield in the UK sink limited? II. Factors affectingpotential grain size. Field Crops Res. 2007, 101, 212–220. [CrossRef]
33. Ugarte, C.; Calderini, D.F.; Slafer, G.A. Grain weight and grain number responsiveness to pre-anthesistemperature in wheat barley and triticale. Field Crops Res. 2007, 100, 240–248. [CrossRef]
34. Bertholdsson, N.O. Characterization of malting barley cultivars with more or less stable grain protein contentunder varying environmental conditions. Eur. J. Agron. 1999, 10, 1–8. [CrossRef]
59
Agriculture 2020, 10, 553
35. Zadoks, J.C.; Chang, T.T.; Konzak, C.F. A decimal code for the growth stages of cereals. Weed Res. 1974,14, 415–421. [CrossRef]
36. Eyal, Z.; Scharen, A.L.; Prescott, J.M.; van Ginkel, M. The Septoria Disease of Wheat: Concepts and Methods ofDisease Management; CIMMYT: Mexico City, Mexico, 1987; Available online: https://repository.cimmyt.org/xmlui/bitstream/handle/10883/1113/13508.pdf?sequence=1&isAllowed=y (accessed on 17 November 2020).
37. Sharma, P.; Duveiller, E.; Sharma, R.C. Effect of mineral nutrient on spot blotch severity in wheat andassociated increases in grain yield. Field Crops Res. 2006, 95, 426–430. [CrossRef]
38. Saxesena, R.R.; Mishra, V.K.; Chand, R.; Chowdhury, A.K.; Bhattacharya, P.M.; Joshi, A.K. Pooling togetherspot blotch resistance, high yield with earliness in wheat for eastern Gangetic plains of south Asia.Field Crop. Res. 2017, 214, 291–300. [CrossRef]
39. Saari, E.E.; Prescott, J.M. Scale for appraising the foliar intensity of wheat diseases. Plant Dis. Rep. 1975,59, 377–380.
40. Shaner, G.; Finney, R. The effect of nitrogen fertilization on the expression of slow-mildewing resistance inknox wheat. Phytopathology 1977, 67, 1051–1056. [CrossRef]
41. Vahamidis, P.; Stefopoulou, A.; Kotoulas, V.; Lyra, D.; Dercas, N.; Economou, G. Yield, grain size, proteincontent and water use efficiency of null-LOX malt barley in a semiarid Mediterranean agroecosystem.Field Crops Res. 2017, 206, 115–127. [CrossRef]
42. Getis, A.; Ord, J.K. The analysis of spatial association by use of distance statistics. Geogr. Anal. 1992,24, 189–206. [CrossRef]
43. Zhang, H.; Tripathi, N.K. Geospatial hotspot analysis of lung cancer patients correlated to fine particulatematter (PM2.5) and industrial wind in Eastern Thailand. J. Clean. Prod. 2018, 170, 407–424. [CrossRef]
44. Zhang, C.; Luo, L.; Xu, W.; Ledwith, V. Use of local Moran’s I and GIS to identify pollution hotspots of Pb inurban soils of Galway, Ireland. Sci. Total Environ. 2008, 398, 212–221. [CrossRef]
45. Lalor, G.C.; Zhang, C. Multivariate outlier detection and remediation in geochemical databases.Sci. Total Environ. 2001, 281, 99–109. [CrossRef]
46. Nimon, K.; Lewis, M.; Kane, R.; Haynes, R.M. An R package to compute commonality coefficients in themultiple regression case: An introduction to the package and a practical example. Behav. Res. Methods 2008,40, 457–466. [CrossRef] [PubMed]
47. Ray-Mukherjee, J.; Nimon, K.; Mukherjee, S.; Morris, D.W.; Slotow, R.; Hamer, M. Using commonalityanalysis in multiple regressions: A tool to decompose regression effects in the face of multicollinearity.Methods Ecol. Evol. 2014, 5, 320–328. [CrossRef]
48. Jordan, V.W.L. Aetiology of barley net blotch caused by Pyrenophora teres and some effects on yield.Plant. Pathol. 1981, 30, 77–87. [CrossRef]
49. McLean, M.S.; Howlett, B.J.; Hollaway, G.J. Epidemiology and control of spot form of net blotch (Pyrenophorateres f. maculata) of barley: A review. Crop. Pasture Sci. 2009, 60, 303–315. [CrossRef]
50. Fitt, B.D.L.; Creighton, N.F.; Lacey, M.E.; McCartney, H.A. Effects of rainfall intensity and duration ondispersal of Rhynchosporium secalis conidia from infected barley leaves. Trans. Br. Mycol. Soc. 1986,86, 611–618. [CrossRef]
51. Shjerve, R.A.; Faris, J.D.; Brueggeman, R.S.; Yan, C.; Zhu, Y.; Koladia, V.; Friesen, T.L. Evaluation of aPyrenophora teres f. teres mapping population reveals multiple independent interactions with the barley 6Hchromosome region. Fungal Genet. Biol. 2014, 70, 104–112. [CrossRef] [PubMed]
52. Linsell, K.J.; Keiper, F.J.; Forgan, A.; Oldach, K.H. New insights into the infection process of Rhynchosporiumsecalis in barley using GFP. Fungal Genet. Biol. 2011, 48, 124–131. [CrossRef] [PubMed]
53. Robinson, J.; Jalli, M. Grain yield, net blotch and scald of barley in Finnish official variety trials. Agric. Food Sci.1997, 6, 399–408. [CrossRef]
54. Jalakas, P.; Tulva, I.; Kangor, T.; Sooväli, P.; Rasulov, B.; Tamm, Ü.; Koppel, M.; Kollist, H.; Merilo, E. Gasexchange-yield relationships of malting barley genotypes treated with fungicides and biostimulants. Eur. J. Agron.2018, 99, 129–137. [CrossRef]
55. Cossani, C.M.; Savin, R.; Slafer, G.A. Contrasting performance of barley and wheat in a wide range ofconditions in Mediterranean Catalonia (Spain). Ann. Appl. Biol. 2007, 151, 167–173. [CrossRef]
56. Cossani, C.M.; Slafer, G.A.; Savin, R. Yield and biomass in wheat and barley under a range of conditions in aMediterranean site. Field Crops Res. 2009, 112, 205–213. [CrossRef]
60
Agriculture 2020, 10, 553
57. Bingham, I.J.; Hoad, S.P.; Thomas, W.T.B.; Newton, A.C. Yield response to fungicide of spring barleygenotypes differing in disease susceptibility and canopy structure. Field Crops Res. 2012, 139, 9–19. [CrossRef]
58. Agostinetto, L.; Casa, R.T.; Bogo, A.; Sachs, C.; Souza, C.A.; Reis, E.M.; da Cunha, I.C. Barley spot blotchintensity, damage, and control response to foliar fungicide application in southern Brazil. Crop. Prot. 2015,67, 7–12. [CrossRef]
Publisher’s Note: MDPI stays neutral with regard to jurisdictional claims in published maps and institutionalaffiliations.
© 2020 by the authors. Licensee MDPI, Basel, Switzerland. This article is an open accessarticle distributed under the terms and conditions of the Creative Commons Attribution(CC BY) license (http://creativecommons.org/licenses/by/4.0/).
61

agriculture
Review
Alternatives to Synthetic Insecticides in theControl of the Colorado Potato Beetle(Leptinotarsa decemlineata Say) and TheirEnvironmental Benefits
Bastian Göldel *, Darija Lemic and Renata Bažok
Department of Agricultural Zoology, Faculty of Agriculture, University of Zagreb, Svetošimunska 25,10000 Zagreb, Croatia; [email protected] (D.L.); [email protected] (R.B.)* Correspondence: [email protected]
Received: 3 November 2020; Accepted: 5 December 2020; Published: 8 December 2020
Abstract: In this study, we review the wide range of alternative control methods used to this day tocontrol the Colorado potato beetle (Leptinotarsa decemlineata Say), the biggest potato pest globally.We further categorize and highlight the advantages and disadvantages of each method by comparingthem to conventional insecticides. In a second step, we point out the current knowledge aboutpositive and negative impacts of using alternative control methods. By this, we illustrate howalternative control methods, farmers’ activities, and environmental factors (e.g., biodiversity andecosystem health) are heavily linked in a cycle with self-reinforcing effects. In detail, the higherthe acceptance of farmers to use alternative control methods, the healthier the ecosystem includingthe pest’s enemy biodiversity. The following decrease in pest abundance possibly increases the yield,profit, and acceptance of farmers to use less conventional and more alternative methods. Overall,we try to balance the positive and negative sides of alternative control methods and combine themwith current knowledge about environmental effects. In our view, this is a fundamental task forthe future, especially in times of high species loss and increasing demand for environmentally friendlyagriculture and environmentally friendly products.
Keywords: biodiversity; biopesticides; conventional insecticides; crop farming; ecosystem health;environmental protection; insect ecology; natural enemies; pest control; sustainable agriculture
1. Introduction
Nowadays, we are witnessing the rapid introduction of organic farming all over the world andespecially in Europe. Furthermore, the European Commission of the European Parliament aims toachieve a sustainable use of pesticides in the EU [1]. The intention of all member states is to reducethe risks and impacts of the excessive use of pesticides on human health and the environment and topromote the use of alternative approaches or techniques, such as non-chemical alternatives to pesticidesand compliance with the principles of integrated pest management (IPM) [1]. The Biodiversity Strategyadopted in 2020, as well as the “Farm to Fork Strategy”, includes the adoption of reduction targetsfor pesticides. Therefore, the wider implementation of alternative methods that can replace or reducepesticide use is necessary for both organic and integrated farming methods.
The Colorado potato beetle (CPB), Leptinotarsa decemlineata Say (Coleoptera: Chrysomelidae),is native to North America with origin in central Mexico and was primarily known to only feed onfew wild host plants [2,3]. In the US for a long time, its range was restricted to the eastern part ofthe Rocky Mountains, where it fed, for instance, on the buffalo bur, Solanum rostratum Dunal, a plant ofno economic importance for farmers. As soon as the potato (Solanum tuberosum L.) was established
Agriculture 2020, 10, 611; doi:10.3390/agriculture10120611 www.mdpi.com/journal/agriculture63
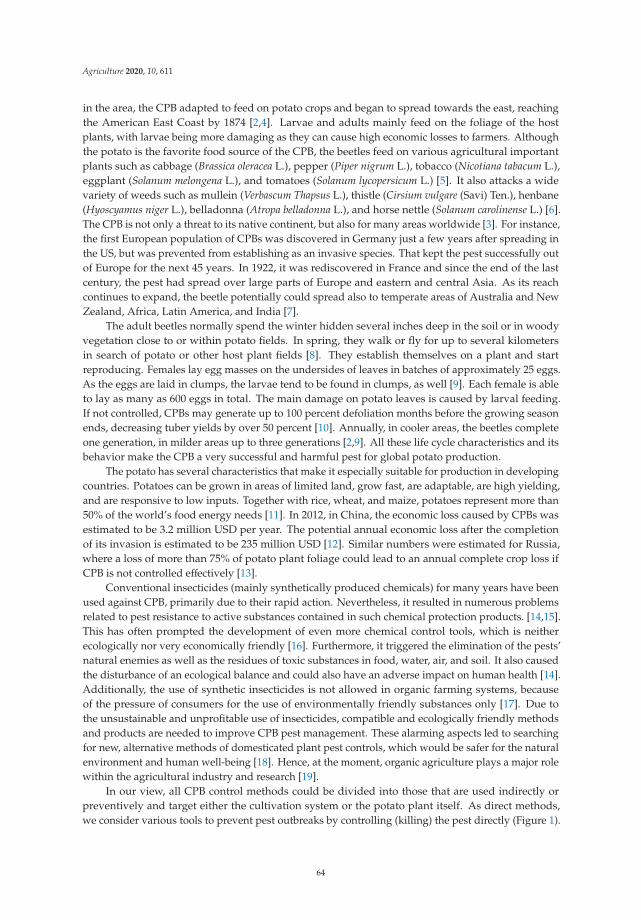
Agriculture 2020, 10, 611
in the area, the CPB adapted to feed on potato crops and began to spread towards the east, reachingthe American East Coast by 1874 [2,4]. Larvae and adults mainly feed on the foliage of the hostplants, with larvae being more damaging as they can cause high economic losses to farmers. Althoughthe potato is the favorite food source of the CPB, the beetles feed on various agricultural importantplants such as cabbage (Brassica oleracea L.), pepper (Piper nigrum L.), tobacco (Nicotiana tabacum L.),eggplant (Solanum melongena L.), and tomatoes (Solanum lycopersicum L.) [5]. It also attacks a widevariety of weeds such as mullein (Verbascum Thapsus L.), thistle (Cirsium vulgare (Savi) Ten.), henbane(Hyoscyamus niger L.), belladonna (Atropa belladonna L.), and horse nettle (Solanum carolinense L.) [6].The CPB is not only a threat to its native continent, but also for many areas worldwide [3]. For instance,the first European population of CPBs was discovered in Germany just a few years after spreading inthe US, but was prevented from establishing as an invasive species. That kept the pest successfully outof Europe for the next 45 years. In 1922, it was rediscovered in France and since the end of the lastcentury, the pest had spread over large parts of Europe and eastern and central Asia. As its reachcontinues to expand, the beetle potentially could spread also to temperate areas of Australia and NewZealand, Africa, Latin America, and India [7].
The adult beetles normally spend the winter hidden several inches deep in the soil or in woodyvegetation close to or within potato fields. In spring, they walk or fly for up to several kilometersin search of potato or other host plant fields [8]. They establish themselves on a plant and startreproducing. Females lay egg masses on the undersides of leaves in batches of approximately 25 eggs.As the eggs are laid in clumps, the larvae tend to be found in clumps, as well [9]. Each female is ableto lay as many as 600 eggs in total. The main damage on potato leaves is caused by larval feeding.If not controlled, CPBs may generate up to 100 percent defoliation months before the growing seasonends, decreasing tuber yields by over 50 percent [10]. Annually, in cooler areas, the beetles completeone generation, in milder areas up to three generations [2,9]. All these life cycle characteristics and itsbehavior make the CPB a very successful and harmful pest for global potato production.
The potato has several characteristics that make it especially suitable for production in developingcountries. Potatoes can be grown in areas of limited land, grow fast, are adaptable, are high yielding,and are responsive to low inputs. Together with rice, wheat, and maize, potatoes represent more than50% of the world’s food energy needs [11]. In 2012, in China, the economic loss caused by CPBs wasestimated to be 3.2 million USD per year. The potential annual economic loss after the completionof its invasion is estimated to be 235 million USD [12]. Similar numbers were estimated for Russia,where a loss of more than 75% of potato plant foliage could lead to an annual complete crop loss ifCPB is not controlled effectively [13].
Conventional insecticides (mainly synthetically produced chemicals) for many years have beenused against CPB, primarily due to their rapid action. Nevertheless, it resulted in numerous problemsrelated to pest resistance to active substances contained in such chemical protection products. [14,15].This has often prompted the development of even more chemical control tools, which is neitherecologically nor very economically friendly [16]. Furthermore, it triggered the elimination of the pests’natural enemies as well as the residues of toxic substances in food, water, air, and soil. It also causedthe disturbance of an ecological balance and could also have an adverse impact on human health [14].Additionally, the use of synthetic insecticides is not allowed in organic farming systems, becauseof the pressure of consumers for the use of environmentally friendly substances only [17]. Due tothe unsustainable and unprofitable use of insecticides, compatible and ecologically friendly methodsand products are needed to improve CPB pest management. These alarming aspects led to searchingfor new, alternative methods of domesticated plant pest controls, which would be safer for the naturalenvironment and human well-being [18]. Hence, at the moment, organic agriculture plays a major rolewithin the agricultural industry and research [19].
In our view, all CPB control methods could be divided into those that are used indirectly orpreventively and target either the cultivation system or the potato plant itself. As direct methods,we consider various tools to prevent pest outbreaks by controlling (killing) the pest directly (Figure 1).
64
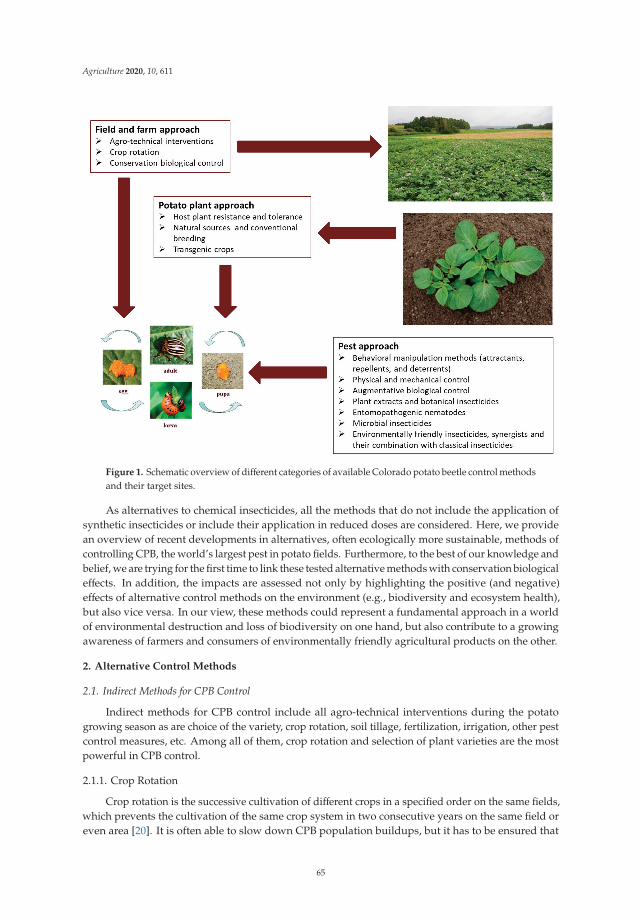
Agriculture 2020, 10, 611
Figure 1. Schematic overview of different categories of available Colorado potato beetle control methodsand their target sites.
As alternatives to chemical insecticides, all the methods that do not include the application ofsynthetic insecticides or include their application in reduced doses are considered. Here, we providean overview of recent developments in alternatives, often ecologically more sustainable, methods ofcontrolling CPB, the world’s largest pest in potato fields. Furthermore, to the best of our knowledge andbelief, we are trying for the first time to link these tested alternative methods with conservation biologicaleffects. In addition, the impacts are assessed not only by highlighting the positive (and negative)effects of alternative control methods on the environment (e.g., biodiversity and ecosystem health),but also vice versa. In our view, these methods could represent a fundamental approach in a worldof environmental destruction and loss of biodiversity on one hand, but also contribute to a growingawareness of farmers and consumers of environmentally friendly agricultural products on the other.
2. Alternative Control Methods
2.1. Indirect Methods for CPB Control
Indirect methods for CPB control include all agro-technical interventions during the potatogrowing season as are choice of the variety, crop rotation, soil tillage, fertilization, irrigation, other pestcontrol measures, etc. Among all of them, crop rotation and selection of plant varieties are the mostpowerful in CPB control.
2.1.1. Crop Rotation
Crop rotation is the successive cultivation of different crops in a specified order on the same fields,which prevents the cultivation of the same crop system in two consecutive years on the same field oreven area [20]. It is often able to slow down CPB population buildups, but it has to be ensured that
65

Agriculture 2020, 10, 611
fields are properly isolated to avoid easy infestations [20,21]. The impacts of crop rotation and distancesbetween fields on pest populations were first investigated in research from the 1990s [22]. Scientistsobserved that the distances between rotated fields and the closest potato fields of the previous yearwere highly related to pest outbreaks on current fields. The further the potato field of the current seasonwas away from the previous season’s field, the fewer pest problems the farmers had [9,21]. However,not many studies suggest that crop rotation alone is a suitable method of controlling strong pestssuch as CPB, but that it could be integrated into a management plan together with other alternativemethods [20].
2.1.2. Host Plant Resistance
Host plant resistance and tolerance can either occur naturally through evolution and selectionor artificially through human, transgenic input [9]. Some are believed to be more successful againstCPB infestations than others. However, there is no potato variety which is considered to be fullyCPB resistant [23], although several potato plant varieties have shown effects in laboratory studieson CPB development time and mortality (e.g., Agria, Pasinler, Marfona, Granola, Caspar) oftendue to mortality of eggs and immature CPB stages and decrease of fecundity and reproductiverate [24]. Sablon et al. [10] summarized several studies indicating that genetic manipulation, the directmanipulation of an organism’s genes using biotechnological methods, of potato plants can be usedto intensify the expression of deterrent blends. The incorporation of genes that express leptin andother glycoalkaloids in conventional and wild potato varieties resulted in improved tuber yields anda protecting effect against CPB in field and laboratory trials [25].
The transgenic approach describes the strategy for the genetic modification of the pest’s hostplant. As a result, the plant produces certain substances that are avoided when parts of the plantare consumed or that cause severe damage to the pest [9,20,23]. As transgenic potato varieties arenot approved for organic cultivation, basically all varieties that are currently open to the agriculturalmarket are unusable. Furthermore, genetically modified plants that are resistant to insect pests areoften not considered a suitable approach in IPM, at least in the case of potato farming. As IPM ismandatory in agricultural production, transgenic plants are not allowed to be used in EU countries,although some of the events (mainly maize varieties) have been registered in some countries. In thesecountries, farmers can use the seeds from GM plants but they are not eligible to receive state subsidies.Irrespective of their success, the use of genetically modified crops often represents a suitable controlmethod, but also contemporarily inadequate to a majority of consumers, especially in Europe [9].
RNA interference (RNAi) is one additional biotechnology to preserve crops from being infestedby pests which has gained a lot of attention within recent years. RNAi might successfully triggerthe silencing of certain target genes causing mortality or at least reducing pest fertility and health [26,27].Using plant protease proregions as regulators, directly induced through bacteria Escherichia coli ofcysteine proteinases, is another possible alternative. In certain biotechnological systems, the ability topreserve the integrity of companion defense-related proteins from the action of insensitive proteases intarget pests has been demonstrated [28]. Many more transgenic approaches to pest control by bacteria,fungi, and other microbes are now available on the market and could be used as an alternative tocontrol pests such as CPB, especially outside of Europe in North and South American countries [9,29].
Overall, host plant resistance was proven to be an effective control mechanism against CPBthrough various studies tested in the field. The potato varieties showing full CPB resistance are thosecreated by the transgenic approach. Even though these methods are not accepted by farmers andconsumers who favor pure organic or ecological farming [20] and are not allowed in IPM, the adoptionof GM plants resistant to pests and diseases can reduce pesticide use and ensure potato production.There is an open debate on the value of genetically modified food, its potential to solve many ofthe worlds’ hunger and malnutrition problems, and its impact on the environment by increasing yieldand reducing reliance upon chemical pesticides [10,23].
66

Agriculture 2020, 10, 611
2.2. Direct Methods for CPB Control
2.2.1. Behavioral Interference Methods for CPB
Chemical signals that regulate the behavior of insects usually consist of a mixture of odor substancesemitted by plants, insects, and other animals. One type of signal is the aggregation pheromones [30].For instance, the male-insect-produced unique pheromone (S)-3,7-dimethyl-2-oxo-oct-6-ene-1,3-diolwas identified for CPB, and both male and female were found to be attracted to the pheromone inlaboratory bioassays [31]. The potential for the use of aggregation pheromone in CPB management wasobserved in the early 2000s in field trials where the pitfall traps baited with the aggregation pheromonewere used to capture the colonizing CPB adults coming to the newly planted field. Even though overfive times as many CPBs were captured in pheromone traps in comparison to controls, the efficacydecreased after only five days. Nevertheless, the potential for the use of the aggregation pheromone inCPB management was observed [32]. This method could only be effective at the beginning of the beetleemergence and colonization of newly planted potato fields, when mean daytime temperatures arebelow 20 ◦C and adults are not able to fly.
In field experiments, synthetic blends of (R)-and (S)-enantiomers of the same pheromone weretested. Mixtures with as much as 87% or higher optical purity of the second enantiomer attracted CPBsmost effectively [33]. The compound was also tested as a combination with various other potato volatiles(e.g., 2-phenylethanol and nonanal) in field and laboratory tests. A mixture with a three-componentplant attractant was detected to be most successful. In another experiment, scientists treated potatoplants with (Z)-3-hexenyl acetate (þ/–)-linalool and methyl salicylate, a synthetic host volatile mixture,to test the attraction to few days old adult CPBs. For the plant treatment, they used four differentdoses and compared them to potato plants treated with azadirachtin-based antifeedant as well asuntreated plants as control. All the experiments were conducted in greenhouses. The researchersfigured out that the beetles favored plants nursed with the attractants over the ones with antifeedant,while only the highest antifeedant dose showed better results than the control. This shows the potentialof synthetic attractants as components of a “stimulo-deterrent strategy”, rather than antifeedants(at low doses) alone [34].
Behavioral responses of CPB were investigated through bioassays in the laboratory. The scientiststested a variety of 13 different compounds all emitted naturally from potato plants. In addition,they used compounds from tomatoes and soybeans [35]. Beetles were attracted by potato volatiles ofdamaged foliage, but not by tomato plants. Among the 16 odor components, six blends were attractive,two repellents, and eight without preferences. Even at low concentrations, (Z)-3-hexenyl acetate(+/−)-linalool and methyl salicylate were most attractive, while blends with rather high quantitiesof volatiles from leaves indicated opposite effects. In general, it was revealed that there are certainblends, even within the compound portfolio of potato (and tomato) host plants, that should be furtherinvestigated and considered for CPB management [35].
The efficacy of limestone dust as a deterrent at two different concentrations was tested as well.It was successful in decreasing the number of CPBs (eggs and larvae) during the individual stages ofdevelopment, such as against eggs and from first to fourth instar larval stages [36].
Sablon et al. [10] also summarized several chemical compounds categorizing them into maskingodors, trap crops including attractants and aggregation pheromones, and antifeedants [10]. In additionto some of the above-described extracts, they listed a multitude of antifeedants including hydroxides,alcohol extracts of the leaves and bark of Quercus alba L., limonin, α-mangostin, sesquiterpenes,terpenoids, lactones, and extracts from various plants including wild species of potatoes. Most ofthese compounds led to a successful decrease in beetle feeding behavior, but also could potentiallyprevent female oviposition. This was detected for citrus limonoids, but also some other blends [10].Therefore, behavioral interference methods can be an efficient and environmentally friendly way ofCPB management. They represent a strongly increasing application in potato management through
67
Agriculture 2020, 10, 611
laboratory and field studies, while the most widely used methods such as chemical treatmentsdecrease [10].
2.2.2. Physical and Mechanical Control
One approach that aroused bigger attention in the 1980s and 1990s was the bug vacuum [37].With this method, insects were sucked from the plants into a large machine combined with a tractorpulling it and killed. However, the machine was never a great success as it came with too manyagricultural and environmental disadvantages. It also killed useful and beneficial insects and otheranimals, but also caused heavy soil compaction due to its weight. The biggest problem was the lowsuccess against pests which were found deeper within the crop canopy that could not be reached, soa wide application of this method was never an option [37].
Assays in laboratories identified the usage of wood ash as a possible compound for CPBmanagement due to its toxicity against adults and larval stages [38]. When exposing beetles permanentlyto wood ash for up to 10 days, all beetles of all stages were killed. The decreasing efficacy after repeatedusage as well as the decreasing activity in the field within moist environments were the main detectedproblems. Nevertheless, the author of the study suggested that thick layers of ash applied as stripsaround the base of potato plants could act as a physical barrier like a fence, limiting big colonization ofbeetles as CPBs avoid crossing it [38].
Another alternative possibility to decrease CPB populations is physical control. Pneumatic andthermal pest controls can be used to control various stages within the development of the plant andbeetle [39]. Here, scientists use the fact that in the early season, when potato plants start to grow out ofthe soil, plants are supposed to be less vulnerable to heat than adult beetles and eggs. Propane burnersare directed towards the crop rows and eliminate most beetles while plants remain rather healthy [40].Therefore, to control overwintering CPBs, the efficacy of flame technology was demonstrated for plantsizes of around eight inches in height [41]. The highest control efficacy was reached during sunny,warm days as CPBs are more active and often feed on the top of potato plants. Compared to mostcommon insecticides which achieve a control rate of normally 25–50% of overwintering adults, flamingcan be very efficient. In field tests, burning of beetles obtained up to a 90% fatality rate as well as a 30%reduction in the number of eggs to hatch [41]. Under laboratory and field conditions, a single-rowinsect scorcher for CPB control was tested accordingly. By controlling the temperature of the gassesand contact time in adult beetles, 60% of individuals were injured while the potato plants were notdamaged [42].
Laboratory and field investigations illustrated that a combination of steam and air left morethan 50% of adult CPBs incapacitated while barely damaged the potato plants. In detail, steam oflow pressure was injected into a plant-covering hood [39,43]. It is also known that the CPB answersto disturbances by undergoing a defense strategy defined as thanatosis. By that, the beetles releasehold from their host plants and just fall to the ground. Thanatosis can be initiated by using hotair and blowing it on CPBs feeding on the plant [40]. In some studies, researchers found out thatthe main causes of falling were related to certain exposure time, temperatures, and air velocity [39,40].Afterward, the apparatus collected the air blown insects with its equipped collection device. Around65% of fallen beetles could be collected this way [44]. For removed beetles that fall to the groundbetween crop rows, shielded propane burners were applied to kill them. Here, the effectiveness was atleast as efficient as chemical insecticides [39,40].
Another way to hinder pest insects to enter crop fields is the usage of plastic-lined trenches androw covers which can function as physical barriers [45]. For that, synthetic fabric is used to avoidCPBs entering the potato fields. The material can be improved by fine soil particles and arrangedin an angle wider than 46◦ to make it impossible for most beetles to have a firm hold on the surface.Even though small numbers of beetles may be able to escape during rain showers when washedaway, the material regains its protection as soon as it is dried afterward [45]. A portable variant was
68

Agriculture 2020, 10, 611
developed by Canadian scientists. With this version placed at field-edges, CPBs are able to walk upthe sides of the trap, but from there get captured when falling into the inside [24].
The CPB is mainly diurnal, but can also be active at night. In one experiment, it was tested howstrong the positive phototactic behavior of the beetle was in darkness, when stimulated with differentwavelengths of light [46], respectively if low-intensity yellow light was favored over pheromones [47].In both experiments, continuous yellow light (and in the first experiment also green light) was the mostsuccessful wavelength source to affect, capture, and control CPB individuals [46,47]. Physical andmechanical methods are promising alternatives to not only control pest populations efficiently, but alsocontribute to clean air and water by eliminating insecticide spraying completely.
2.2.3. Augmentative Control
The natural enemy complex for each pest, as well as for the CPB, is geographically specific. The CPBis attacked by different generalist predators, but their presence depends on the geographic area andcrop field type. They are subject to conservation biological control. Contrary to that, specific predatorsare not widely distributed and are used as augmentative control and parasitoids. The augmentativebiological control uses insect predators [48] as well as parasitoids. The CPB has several natural enemies,but they can be hardly found in most potato fields, especially with heavy usage of conventionalinsecticides [20]. Within alternative and organic farming systems, the abundance and richness ofnatural enemies are higher, but are unlikely to fully control the CPB, even though some generalistpredators provide good control [20,49].
The objective of several studies to diminish CPB populations focuses on insects of the orderHemiptera, including the Nearctic stink bug Perillus bioculatus (F.) [4,50]. The use of this predatorto control the CPB has been successful in laboratory and microplot consumption tests. This bug isobviously not naturally abundant in all areas with CPB occurrences, especially not outside of its naturalterritories in North America [49]. P. bioculatus is a natural enemy of CPB in and could potentially alsohelp to diminish CPB populations outside of North America [51]. To solve this problem, predatorswould have to be released in very high numbers using, for instance, mechanical distributors [49].However, the production of huge amounts of predators could be difficult as for the suitable control ofeggs and early larval stages of CPB, certain temperatures and storage times of the predator nymphsare necessary to be an efficient pest control [50]. The main problem of newly introduced species is theirunknown effect on the ecosystem and, therefore, they often not represent a safe and suitable option.
Finally, it was suggested and shown that the combination of sub-lethal effects of P. bioculatus withproducts based on Bacillus thuringiensis Berliner var. tenebrionis (Btt) could significantly increase CPBlarval mortality in field experiments [52].
The spined soldier bug Podisus maculiventris Say is another Hemiptera species that can diminishpopulations of CPB. In 1997, O’Neill demonstrated in laboratory and field experiments predationbehaviors of this predator towards the CPB. Due to higher prey–predator ratios in laboratoriesthan in the wild, the experiments revealed a strong decrease in beetle populations [53]. Moreover,just as P. bioculatus, under natural conditions none of the investigated predators obtain large enoughpopulations, or are even completely absent when the CPB starts into the new feeding season. This way,CPB outbreaks cannot be avoided [3]. Due to this and the fact that the distribution of P. maculiventris isrelatively scarce in North America, one plausible strategy could be to collect and transfer the bugs frompheromone traps to nursery traps in the potato fields from where they start the suppression of CPBpopulations [4]. Hough-Goldstein and McPherson (1996) tested both P. bioculatus and P. maculiventris inexperiments [49]. Although the latter showed less strong significant prey rates comparatively, older lifestages were concentrated on larger CPB larval stages. So, the overall success rate between the two CPBpredators could even be related to the predator’s life stage and used accordingly.
In addition to Hemiptera, several other natural enemies of the Coleoptera order had beeninvestigated to be successful CPB pest controls. Already in field experiments of the late 80s, Hazzardet al. illustrated significant effects of control in both early and late generations of the CPB using
69
Agriculture 2020, 10, 611
the 12-spotted ladybeetle Coleomegilla maculate Lengi in western Massachusetts [54]. For the samespecies during a bigger field experiment, Mallampalli et al. detected the impact of C. maculata ona composition of possible prey species [55]. They figured out through computer models that when(beside CPB) eggs of the European corn borer (Ostrinia nubilalis Hübner, Lepidoptera) were foundin the area, predation on beetle eggs highly became positively density dependent. When larvae andadults of the green peach aphid Myzus persicae Sulzer (Homoptera) were present, similar results wereobtained accompanying a significant decrease of CPB individuals. These results witnessed that presentcontrol, as well as resistance management strategies, should also consider the composition of preyspecies when developing management strategies, but more research is needed especially through fieldexperiments [55].
The carabid beetle Lebia grandis Say is one of many natural enemies native to North America.The larvae of these beetles are obligate parasitoids, while also the adults feed on CPB eggs andlarvae [16]. This predator represents one of the most important natural control species of CPBs in NorthAmerica. As the activity of this predator peaks at night and it rarely appearance in pitfall trap studies,an insufficient amount of research about this species was conducted so far [16,50]. Other field studiesfrom Idaho indicated that the introduced generalist ground beetle P. melanarius might be a usefulbiocontrol within CPB pest management. Large numbers of eggs and larvae were consumed by adultpredators. Hence, the pest population decreased more in untreated than in insecticide-treated fields,because a higher abundance of predator individuals fed on pest individuals [56].
Larval stages of the lacewing (Chrysoperla carnea (Stephens)), a Neuroptera species, might representanother good alternative to control CPB populations. Even if field assays are still needed, laboratorystudies highlighted a valuable ability to control beetle larvae, with greatest efficacy on the youngeststages [57].
Within the Hymenoptera order, the parasitic wasp Edovum puttleri Grissell seems to be an effectiveweapon against CPB damage in potato fields. First, a computer model was built to calculate the possibleparasitism of CPB eggs. This algorithm incorporated the specific attack behavior of E. puttleri, and thedevelopment time for parasitized egg masses [58].
The use of natural enemies may be another option to control CPB populations, but many of thoseare not abundant in nature and manual release in large areas is not very practical [59]. One promisingsolution could be the mechanical (physical) distribution of predators. In a test study, huge amounts ofpredators were mixed in containers with a carrier material. In the field, the containers were openedmechanically at various spots and all predators released at once [60]. Obtained results indicated thatthe mechanical release of predators ended in a better control of beetle populations and egg massesthan manual release [2,60].
Augmentative control could be a valuable approach due to its low negative impact on ecosystemhealth and biodiversity. We focused on some of the most investigated arthropod parasites andparasitoids in research studies. Species of mites, phalangids, spiders, and parasitic flies (Tachinidae)were discovered to be able to control CPB populations [49]. Still, it has to be mentioned that many(described) experiments were conducted in the laboratory and only have a theoretical value if not alsotested in the fields and large geographical scales.
2.2.4. Use of the Plant Extracts and Botanical Insecticides
Since 1990, biopesticides are slowly but steadily replacing synthetic, conventional pesticides and areeven used commercially [61–64]. They are often (besides hydrolytic compounds or primary metabolites)generated from compounds that are produced by plants in secondary metabolites, often after pestinfestation or in harsh environmental situations [65]. They appear as repellents or antifeedants and helpto resist against a broad range of pest species by increasing their mortality or decreasing the reproductionability [66]. Although biopesticides seem to be a promising way to replace conventional, chemicalinsecticides, they are still underexplored and the practical application is still limited [67].
70
Agriculture 2020, 10, 611
Plant extracts and botanical insecticides represent two different types of products: homemadeproducts as well as commercially available botanical insecticides. Even if they originate from nature,their properties are not always acceptable for plant protection [10,23]. However, commercially availablebotanical insecticides have been subject to the same registration procedure as chemical pesticides.If they are approved, they are, therefore, considered safe for use with all restrictions as stated onthe label. A comprehensive review of 48 different plant extracts and botanical insecticides testedagainst the CPB (including only a few widely used commercial products) shows that some of the plantextracts have a high potential for CPB control and should be investigated further [10].
A small number of commercial and widely used botanical products are on the market for useagainst CPB. Rotenone is a biopesticide that is one root extract from several species within the Fabaceaefamily [68]. Since it kills pests rather slowly, it can be associated with pyrethrum for a more rapideffect, lasting for up to two days [69]. It should be used carefully as it is also poisonous to non-targetinsects as well as to domestic and farm animal species. The European Union (EU) began a phase-out ofrotenone in 2008 [70]. The final authorization was withdrawn on 31 October 2011. Therefore, rotenoneis not approved for use in the EU or any EU member state [71].
The effects of Origanum vulgare L. extracts have been discussed in several papers [14,72].Experiments demonstrated that extracts gained from the dry and fresh matter at the highestconcentrations contributed to the greatest reduction of females and males feeding on potato plants.Similar results were observed after the application of lower concentrations, but only in females [14].Moreover, the morbidity of the essential oil of Iranian lemongrass, Cymbopogon citrates Stapf,was positively assessed against adults and third instar larvae of CPBs. The higher the concentration,the stronger the effect against the pest [73].
In additional studies conducted in Turkey, potato leaves were prepared with three different extractsolutions of five different plant species (Arctium lappa L., Bifora radians (M.Bieb), Humulus lupulus L.,Xanthium strumarium L., Verbascum songaricum Schrenk) and then exposed to the larvae of CPB.Observations of larval behavior during one day of exposure revealed that the plant blends significantlyinfluenced the interaction between beetles and leaf tissue. This was not the case for very lowconcentrations—only the medium (except V. songaricum) and high extract (all species) concentrations [74].In another similar experiment, extracts of Acanthus dioscoridis L., Achillea millefolium L., Bifora radians,Heracleum platytaenium Boiss, H. lupulus, and Phlomoides tuberosa L. were tested against different larvalstages for two days. For second to fourth instar larval stages, H. lupulus and H. platytenium reachedthe highest CPB mortality rate while the first larval stage was more susceptible [75].
Different essential oils of Eugenia caryophyllus (Sprengel), Mentha spicata L., Myrtus communis L.,Ocimum basilicum L., Satureja khuzistanica Jamzad, and Thymus daenensis Celak were tested for theirnutritional indices and mortal efficacy against adults and fourth instar larvae of CPB. All essential oilsshowed a deterrent effect, with the most efficient oil coming from S. khuzistanica [18]. Several authorsexamined the effects of ethanolic extracts obtained from various parts of Liquidambar orientalis L.,Buxus sempervirens L., Alnus glutinosa (L.) Gaertn., Artemisia absinthium L., Aesculus hippocastanum L.,and Rhus coriaria L. on the egg-laying behavior of CPBs in the laboratory. Afterward, the antifeedant andtoxic effects of the two most effective extracts leading to the smallest number of egg-laying, L. orientalisand B. sempervirens, were tested in a field study. Both extracts indicated significant decreases in eggnumbers of CPBs and seemed to be potentially successful in the field as an alternative to chemicalpesticides [76].
In the laboratory, first-generation CPB adults were treated with Artemisia vulgaris L.and Satureja hortensis L. The extracts of both plants had no lethal effect on adult mortality. Nevertheless,in both cases, the aqueous extract solutions induced a higher percentage of sterility of eggs comparedto the alcoholic extract, while the effect on eggs treated with Artemisia variants was higher than thatwith Satureja [77]. Furthermore, the effects of compounds from two Piperaceae species, Piper nigrum L.and Piper tuberculatum Jacq., against adults and larval CPBs were assessed with several different plantextract concentrations [78]. It was found that early larval stages of few days were most vulnerable
71
Agriculture 2020, 10, 611
in both plant species. Additionally, the activity of P. nigrum indicated that contact toxicity was mosteffective when early instar larvae were targeted. Late instar larvae could be knocked down with higherconcentrations and 50% of the adults could be killed with a high application. P. nigrum lost much of itsrepellent function under pure sunlight. Nevertheless, pepper species could be suitable biopesticidessince they are among the most traded species, they are relatively safe to use and store, and seed andleaf material are universally available [78,79].
In an experiment with many different plant species, the contact and residual toxicity of 30 plantextracts was investigated on third instar CPB larvae. The insects were sprayed and the effectiveness wasmeasured every 24 h for one week. After a 24-h incubation, blends of Artemisia vulgaris L., Hedera helix L.,H. lupulus, Lolium temulentum L., Rubia tinctoria L., Salvia officinalis L., Sambucus nigra L., Urtica dioica L.,V. songaricum, and X. strumarium killed significantly more beetles than the control. In general, a longerincubation time than 24 h did not show higher values. The H. lupulus extract was the most toxic of allproducts, causing 99% beetle mortality [4]. Fresh and dry matter of wild thyme (Thymus serpyllum L.)in different concentrations was tested on the feeding behavior of CPB adults and larvae. For efficientcontrol of adults, a dry matter extract with the highest tested concentration (10%) should be used,while larvae at the fourth instar appeared to be significantly more vulnerable [80].
Stilbenes are phenolic compounds that are produced in several vines in large quantities andfunction as plant defenses. Oligomeric forms were proven to be very efficient against a broad range ofpests. The aim of a study conducted by Gabaston et al. was to explore the activity of a grapevine rootextract containing a stilbene oligomer pool [81]. In the laboratory, the extracts showed toxic effects onlarvae and slowed down their development and food intake, while in field experiments, high CPBmortality could be observed. In addition, the extract also killed non-targeted organisms, such asearthworms (Eisenia fetida Savigny). The authors emphasized that grapevine roots still representpromising sources of bioactive compounds to create alternative insecticides [81].
In the study by Trdan et al., refined rapeseed oil (Brassica napus L.) and slaked lime were tested underlaboratory conditions for their efficacy against CPB larvae and adults at three different temperatures [82].Heat or cold did not play a specific role as the tested substances caused significant damage to beetlesat each temperature. Adults were the most sensitive developmental stage and revealed the highestmortality rate, while refined oil was discovered to be the stronger beetle repellent [82].
Various products of azadirachtin, which is produced from neem tree seeds, showed effects againstthe CPB. In one study, neem (along with several other bio-insecticides) was suggested as an effectivecontrol agent against CPB larvae and adults [82]. On the plants treated with azadirachtin, between 8%and 32% of eggs were left unhatched. This effect was reported even 7–8 days after the end of hatchingon the untreated control [83]. However, neem concentrations of more than 1% can potentially lead tophytotoxicity in potato plants. Although once considered benign to beneficial insects and effectiveagainst the CPB, neem products have also demonstrated some adverse effects as it was found to bepoisonous to ladybirds, particularly in early larval stages [84]. Neem has also been found less effectivethan Btt [85].
A two seasons field experiment in Canada evaluated the use of spraying plant blends as analternative control of the CPB. The herbs evaluated as companions to potato plants were bush beans,flax (Linum usitatissimum L.), French marigold (Tagetes patula L.), horseradish (Armoracia rusticana Gaertn.,C.A.Mey. & Scherb.), and tansy (Tanacetum vulgare L.). A capsaicin extract, a garlic extract, a neem seedextract, a Btt product, and a pine extract were tested as controls [19]. This showed that plant individualssprayed with neem extract experienced higher yields, lower beetle density, and less defoliation thaneach of the other treatments and the control. Btt controlled all, but mainly larval stages (less the adults)of CPBs, but in total less than neem. On the other hand, garlic and capsaicin extracts, as well ascompanion planting, did not diminish CPB densities in potatoes. This raised concerns about the use ofcompanion plants without first testing their efficacy, but also demonstrated the potential success ofthis approach [19].
72
Agriculture 2020, 10, 611
The best known and oldest botanical insecticide is a powder obtained by grinding the dried flowersof the Dalmatian pyrethrum plant, Chrysanthemum cinerariaefolium Trev. and related species C. coccineumWild. It is a wide spectrum insecticide effective against many different pests. Laboratory and fieldinvestigations demonstrated that the efficacy of pyrethrin was between 83% and 86% in the laboratoryand between 86% and 88.0% in field trials [86]. In the same trials, the efficacy of neem extract wasbetween 62% and 63% in laboratory trials and between 55% and 88% in field trials. The efficacy ofboth insecticides was significantly lower than the efficacy of the standard insecticide spinosad and atthe same level as the efficacy of Btt [86]. The main field advantage is that it dissolves quickly in directsunlight without spreading widely in the crop plants [15].
Finally, pyola is a natural compound that contains canola oil and pyrethrins. It is applied not onlyagainst the CPB, but also against several other insect pests. Since a large part of rapeseed oil availablecommercially used comes from genetically modified plants, this product may not be in line with rulesof organic farming despite its success in pest management [23].
2.2.5. Entomopathogenic Nematodes
Several species of entomopathogenic nematodes were proven to be very effective againstthe CPB [87,88]. For a laboratory experiment, the effects of native isolates of entomopathogenic nematodes,Heterorhabditis bacteriophora Poinar, Steinernema carpocapsae Weiser, and Steinerma feltiae Filipjev, againstlate larval stages of CPBs were evaluated at different temperatures. All nematode species achieved highermortality rates than the control, including elevated success rates under increasing temperatures [89].In an additional laboratory experiment by Toba et al., fourth instar CPBs were placed in cups containingsoil treated with a Mexican strain of S. feltiae, and in another with S. glaseri Steiner [88]. They found thatboth nematode species were equally effective against CPB larvae, although different soil and nematodedensities could influence the effect. The most common damaging effects against CPB larvae were wingdeformation and detained development, which both can affect CPB fitness of adult individuals [90].Furthermore, Trdan et al. also detected a higher mortality rate of CPB larvae and adults with risingnematode concentrations and temperatures during laboratory bioassays for H. bacteriophora, H. megidisPoinar, S. carpocapsae, and S. feltiae [91].
Introduced nematode species from areas elsewhere could be sometimes a more effective alternativesolution for some areas than naturally occurring nematodes. Their introduction could be necessary asCPB populations may be able to develop tolerances to naturally occurring species as the CPB is alsoincreasingly able to develop tolerances against commercial insecticides [92]. In laboratory experiments,exotic Heterorhabditis species, H. marelatus Lui & Berry, H. bacteriophora, and H. indica Poinar, Karunakar& David, were more pathogenic for the CPB than the endemic Heterorhabditis strains from Oregon,while the other exotic Steinernema oregonense Liu & Berry and S. riobrave Cabanillas, Poinar & Raulstonspecies were in the middle of both in terms of efficacy [92]. Nevertheless, most experiments were onlyconducted in laboratories. The successful use in the field still has to be proven and would depend oncheap mass production of nematodes as host infection would have to be most likely applied throughspraying machines.
2.2.6. Microbial Insecticides
Microbial insecticides are based on microorganisms that cause different pathological reactions(sometimes death) of target insects. They may be based on viruses, protozoa, bacteria, and fungi.There are many microbial biopesticides on the market. Here, we focus on bacteria and fungi asthey are used to produce two of the probably most widespread and popular biopesticides, also forthe usage against the CPB. One evolved from the bacterium Bacillus thuringiensis var. tenebrionis (Btt),which has become increasingly accessible within the last years. Btt is basically only effective if it isingested. Sprayed, it is most successful against newly hatched CPB larvae, so it should be used inthe fields around this time [2,93]. Another bio-compound is derived from the entomopathogenicfungus Beauveria bassiana (Bals.-Criv.) Vuill. (1912). Unlike Btt, B. bassiana represents an efficient
73
Agriculture 2020, 10, 611
control against adults and all larval stages of the CPB and it is able to continue propagating afterthe application. This presents a very high degree of control during the entire potato growing season.Most notable limitations of B. bassiana seem to be its vulnerability to high temperatures and drought.Therefore, B. bassiana might not be of high importance for growers in warm, dry regions [94]. Otheroptions could be specific bacteria such as Bacillus popillae Dutky 1941 and Bacillus lentimorbus Dutky1940 which have been positively tested against several pests in laboratory experiments, as well ascertain species of protozoa [95]. However, to our knowledge, most of these species have not yet beenefficiently tested against the CPB in field trials.
2.2.7. Environmentally Friendly Insecticides, Synergists and Their Combinations withClassical Insecticides
Synthetic pesticides are not allowed in organic farming. The use of insecticides in IPM is onlypermitted if the pest population reaches an economic threshold. Among the registered insecticides,there are some that are less dangerous for the environment and humans than others. We considerthese insecticides as environmentally friendly ones. The group of insecticides that are more suitablefor CPB control (i.e., environmentally friendly) in the IPM program is represented by four activeingredients of different origins: Btt, neem extract, natural pyrethrin, and spinosad. All of them arealso approved for organic farming approaches [23,32]. Compared to classical insecticides, their usereduces environmental pollution and the impact on beneficial entomofauna. The addition of sub-lethaldoses of chemical insecticides to biological insecticides to improve their efficacy was investigated byKovacevic (1960) and later discussed by Benz (1971) [96]. Barcic et al. [96] found that combinations ofenvironmentally friendly insecticides with classical insecticides can lead to different benefits at lowerdoses: (i) ecological, because the use of lower doses decrease pollution, and (ii) biological, becausethe use of combinations might slow down the development of resistance. In addition, the combinedaction of the insecticides used could lead to a synergistic effect (iii) economically, because the cost pertreatment is lower.
Commercial formulations of spinosad applied at three different concentrations (0.2%, 0.1%,and 0.05%) and temperatures (15, 20, and 25 ◦C) were tested against the CPB in the laboratory.Spinosad intoxicated beetles both by contact and ingestion. Experiments revealed that a temperatureof 15 ◦C with a concentration of 0.2% in combination caused significantly higher mortality of adultinsects than other temperatures and concentrations [17]. Similar positive effects were experiencedin other laboratory and field experiments for spinosad and combinations with other ecologicalinsecticides [96–98]. In addition to spinosad, the mixture of avermectin B1 (80%) and avermectinB1b (29%), and avermectin C also reached strong efficacy against third instar larvae and adults [96].Concerning combinations with spinosad, mixtures with Btt, azadirachtinand pyrethrin proved to bevery active in both laboratory and field studies (Barcic et al., 2006). Furthermore, the efficacy of lowdoses of spinosad, Btt, and azadirachtin has been detected and the effect of combinations for thesethree alternative insecticides has been proposed [97].
In addition, the efficacy of neem and karanja oil in binary mixtures against CPB larvae wasinvestigated [99]. The experiment demonstrated a synergistic effect in laboratory trials. The mosteffective blend with ratio 1:1 was similar or more effective than neem oil alone and increased withexposure time. It was also demonstrated that doses can be lowered but still achieve an improvedmortality effect against larval stages of the CPB [99]. Moreover, neem is a potential insect growthregulator, especially in combination with Btt [100].
Further research evaluated the relevance of synergistic effects between capsaicin andorganophosphate insecticides against the CPB [20]. The addition of capsaicin to the compound atvarious temperatures led to an increase in insect mortality by almost one quarter at higher, and threequarters at lower temperatures, compared to organophosphate alone. [101]. There are also several othercombinations of environmentally friendly and conventional insecticides that are being tested constantly;some are more and some are less effective against the CPB.
74

Agriculture 2020, 10, 611
2.2.8. Conservation Biological Control
Conservation biological control is the implementation of practices that maintain and enhancethe efficacy of natural enemies. As it was mentioned earlier, there are just a few specific natural enemiesthat attack the CPB, but often are only spread at a limited geographic range. Therefore, the complexof generalist predators that attack different developmental stages of the CPB is location-specific andnot well investigated [10,102]. Not many papers are dealing with the complex of natural enemiesfor potato plants, but generally, authors agree that CPB populations are commonly preyed upon bya variety of generalist arthropod predators, including predatory bugs of the genera Orius and Geocoris,as well as in general Carabidae, Cantharidae, and Opiliones [102–104].
Plant diversity in the vicinity of or on potato fields, e.g., through margins, improves the habitats fornatural enemies of the CPB near, outside, or directly inside the fields [7]. Refuge strips often contain bothgrasses and herbs that provide shelter and resources for predatory arthropods, and flowering plantswhich are inviting to generalist predators and parasitoids feeding on organic material. This can havea positive effect on crop growth [105,106]. Stripes can also help to minimize the use of synthetic chemicalsin potato farming as they reduce the likelihood that action thresholds are reached. Encouragingthe increases in enemy abundances and diversity can strengthen pest management and help to conserveand improve agroecosystems [107]. Increasing the habitat of natural enemies by providing food sourcessuch as leaves, pollen, and nectar within the field or along field boundaries can, therefore, improvethe overall efficacy of conservation biological controls [105].
Focusing directly on the CPB, research showed that increased biodiversity can provide betterecosystem services for effective pest control, as alternative methods can lead to increased speciesrichness, evenness, and even larger potato plants [108]. This knowledge is supported by findingsthat also predators are more abundant in communities with high evenness as they have to competeless with others than with individuals of their species. That is direct proof that a higher diversity ofnatural enemies leads to improved ecosystem services and functional diversity [108,109]. It was alsoproposed that companion planting, also labeled “agronomic pendant of plant biodiversity”, diminishesthe successive colonization of the CPB into potato fields, particularly on organic farms due to increasedbotanical background noise. That makes host-finding for the pest more difficult [20]. In a study byJohnson and colleagues, they found no significant differences in the number of CPB adults, but morelarval individuals in control than in straw plots—possibly again due to different predation rates ofnatural enemies [110].
Finally, mulch generates microenvironments that benefit CPB predators. In the first half ofthe season, soil predators—mainly ground beetles—climb on potato plants to feed on second andthird instar larvae of CPBs. In the second half of the season, ladybirds and lacewings are the mainpredators, feeding on eggs and younger larval stages of CPBs. On mulch, there were more predatorsthan on non-mulched plots, following in significantly less damage of potato plants by the beetles [20].Interestingly, it can often be an advantageous solution to use a healthy ecosystem with improvedliving conditions for a species-rich environment (including natural enemies of the pest) instead ofconventional insecticides to protect crop yields from high pest populations.
In general, there are still many open questions and knowledge is very vague. In most cases, it isnot known how single alternative approaches influence specific ecology factors, such as biodiversity,ecosystem services, functional diversity, or pollination success. This shows that a lot more researchis needed here to disentangle specific methods and their exact impacts, negative and positive.All conservation biological methods (beside all other alternative ones) are listed in Table 1.
75

Agriculture 2020, 10, 611
Ta
ble
1.
Alt
erna
tive
met
hod
sw
ith
exam
ples
:the
tabl
esh
ows
the
diff
eren
tcat
egor
ies
ofal
tern
ativ
eco
ntro
lmet
hod
sto
cont
rolt
heC
olor
ado
pota
tobe
etle
(CP
B).
Wit
hin
each
cate
gory
,the
ind
ivid
ualm
etho
ds
are
liste
din
mor
ed
etai
l,in
clud
ing
the
stud
ies
and
pape
rsin
whi
chth
ese
met
hod
sw
ere
pres
ente
d.T
henu
mbe
rin
brac
kets
indi
cate
sth
eco
rres
pond
ing
stud
yin
the
refe
renc
elis
t.
Alt
ern
ati
ve
Meth
od
Tre
atm
en
tE
xam
ple
[an
dL
itera
ture
Refe
ren
ceN
um
ber]
Co
mm
en
tso
nT
reatm
en
tD
eta
ils
nd/o
rF
utu
reP
rosp
ect
s
Cro
pro
tati
onR
otat
ion
and
field
dist
ance
[10,
20,2
2]eff
ecti
vew
hen
larg
efie
lddi
stan
ces
Hos
tpla
ntre
sist
ance
RN
Ain
terf
eren
ce[2
6,27
]ap
plie
din
crea
sing
ly,p
ower
fult
ool,
butn
otfo
ror
gani
cfa
rmin
g
Res
ista
ntpo
tato
vari
etie
s[2
8,29
]va
riou
sre
sult
s,no
100%
prot
ecti
on
Tran
sgen
ic[1
0,20
,23]
ofte
nus
edsu
cces
sful
ly,b
utno
tfor
orga
nic
farm
ing
Beha
vior
alin
terf
eren
cem
etho
ds
3,7-
dim
ethy
l-2-
oxo-
oct-
6-en
e-1,
3-di
ol[3
1,32
]go
odpo
tent
ial,
also
infie
ldst
udie
s
(Z)-
3-he
xeny
lace
tate
(þ/–
)-lin
aloo
l[33
,34]
good
pote
ntia
l,al
soin
field
stud
ies
α-m
ango
stin
[10]
effici
ent,
also
agai
nstC
PBov
ipos
itio
n
Lact
ones
[10]
effici
ent,
agai
nsto
vipo
siti
onan
dla
rvae
Lim
esto
nedu
st[3
4]st
rong
,esp
ecia
llyag
ains
tlar
vals
tage
s
Lim
onin
[10]
effici
ent,
also
agai
nstC
PBov
ipos
itio
n
Met
hyls
alic
ylat
e[3
4,35
]go
odpo
tent
ial,
also
infie
ldst
udie
s
Que
rcus
alba
L.[1
0]effi
cien
t,al
soag
ains
tCPB
ovip
osit
ion
Pher
omon
eco
mbi
nati
ons
[30]
very
effici
ent,
espe
cial
lyin
the
field
Sesq
uite
rpen
es[1
0]re
duce
sC
PBfe
edin
gan
dov
ipos
itio
n
Terp
enoi
ds[1
0]effi
cien
t,ag
ains
tovi
posi
tion
and
larv
ae
Phys
ical
and
mec
hani
calc
ontr
ol
Fire
and
burn
er[4
0–42
]hi
gher
mor
talit
yth
anm
osti
nsec
tici
des
Net
san
dtr
ench
es[4
5]go
odbu
tnot
very
high
effici
ency
infie
ld
Mec
hani
calp
reda
tor
dist
ribu
tor
[3,4
9]effi
cien
t,bu
tdep
ends
onpr
edat
orsp
ecie
s
Pneu
mat
ic[3
7,39
,43,
44]
very
effici
ent,
butc
ompl
icat
edin
field
Trap
s[4
6,47
]ve
ryhi
gheffi
cien
cyin
field
test
s
Woo
das
h[3
8]hi
ghly
effici
ent,
butr
educ
edw
ith
moi
stur
e
Aug
men
tati
veco
ntro
l
Chr
ysop
erla
carn
ea(S
teph
ens)
[58]
effici
entv
s.ea
rly
larv
ae,fi
eld
stud
ies
need
ed
Col
eom
egill
am
acul
ate
Leng
i[54
,55]
effici
enti
nm
any
field
stud
ies
sinc
e19
80s
Edov
umpu
ttle
riG
riss
ell[
58]
succ
essf
ulco
ntro
l,m
ore
field
stud
ies
need
ed
Lebi
agr
andi
sSa
y[1
6,50
]st
rong
inla
bora
tory
,mor
efie
ldst
udie
sne
eded
Peri
llus
bioc
ulat
us(F
.)[4
,48–
51]
effici
entc
ontr
olin
labo
rato
ryan
dfie
ldst
udie
s
P.bi
ocul
atus+
Baci
llus
thur
ingi
ense
sBe
rlin
er(B
t)[5
2]ve
rysu
cces
sful
Podi
sus
mac
uliv
entr
isSa
y[4
,49,
53]
succ
essf
ul,n
otlo
wer
infie
ldth
anla
bora
tory
Pter
ostic
hus
mel
anar
ius
(Illi
ger)
[56]
very
effici
entv
s.eg
gsan
dla
rvae
76
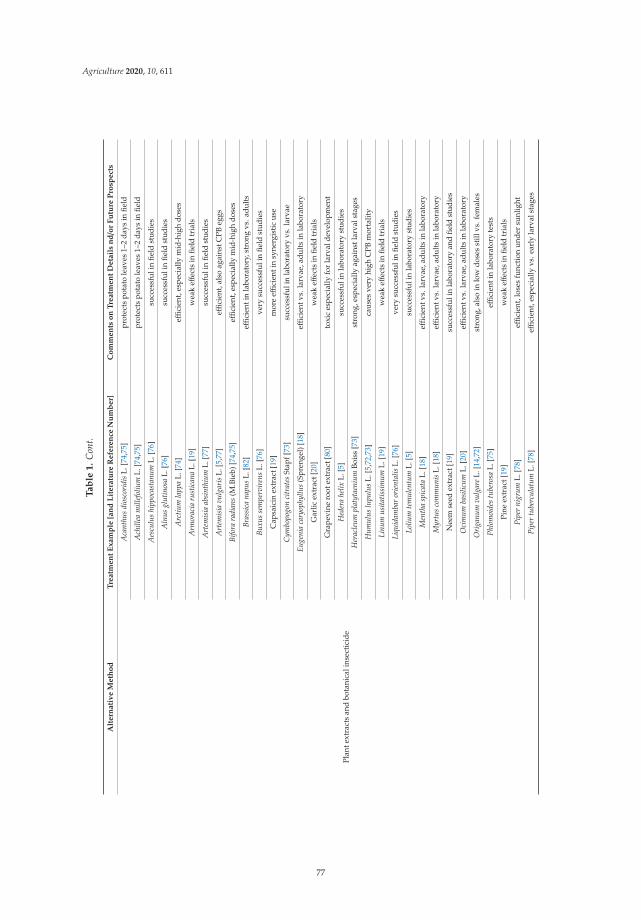
Agriculture 2020, 10, 611
Ta
ble
1.
Con
t.
Alt
ern
ati
ve
Meth
od
Tre
atm
en
tE
xam
ple
[an
dL
itera
ture
Refe
ren
ceN
um
ber]
Co
mm
en
tso
nT
reatm
en
tD
eta
ils
nd/o
rF
utu
reP
rosp
ect
s
Plan
text
ract
san
dbo
tani
cali
nsec
tici
de
Aca
nthu
sdi
osco
ridi
sL.
[74,
75]
prot
ects
pota
tole
aves
1–2
days
infie
ld
Ach
illea
mill
efol
ium
L.[7
4,75
]pr
otec
tspo
tato
leav
es1–
2da
ysin
field
Aes
culu
shi
ppoc
asta
num
L.[7
6]su
cces
sful
infie
ldst
udie
s
Aln
usgl
utin
osa
L.[7
6]su
cces
sful
infie
ldst
udie
s
Arc
tium
lapp
aL.
[74]
effici
ent,
espe
cial
lym
id-h
igh
dose
s
Arm
orac
iaru
stic
ana
L.[1
9]w
eak
effec
tsin
field
tria
ls
Art
emis
iaab
sint
hium
L.[7
7]su
cces
sful
infie
ldst
udie
s
Art
emis
iavu
lgar
isL.
[5,7
7]effi
cien
t,al
soag
ains
tCPB
eggs
Bifo
rara
dian
s(M
.Bie
b)[7
4,75
]effi
cien
t,es
peci
ally
mid
-hig
hdo
ses
Bras
sica
napu
sL.
[82]
effici
enti
nla
bora
tory
,str
ong
vs.a
dult
s
Buxu
sse
mpe
rvir
ens
L.[7
6]ve
rysu
cces
sful
infie
ldst
udie
s
Cap
saic
inex
trac
t[19
]m
ore
effici
enti
nsy
nerg
isti
cus
e
Cym
bopo
gon
citr
ates
Stap
f[73
]su
cces
sful
inla
bora
tory
vs.l
arva
e
Euge
nia
cary
ophy
llus
(Spr
enge
l)[1
8]effi
cien
tvs.
larv
ae,a
dult
sin
labo
rato
ry
Gar
licex
trac
t[20
]w
eak
effec
tsin
field
tria
ls
Gra
pevi
nero
otex
trac
t[80
]to
xic
espe
cial
lyfo
rla
rval
deve
lopm
ent
Hed
era
helix
L.[5
]su
cces
sful
inla
bora
tory
stud
ies
Her
acle
umpl
atyt
aeni
umBo
iss
[73]
stro
ng,e
spec
ially
agai
nstl
arva
lsta
ges
Hum
ulus
lupu
lus
L.[5
,72,
73]
caus
esve
ryhi
ghC
PBm
orta
lity
Linu
mus
itatis
sim
umL.
[19]
wea
keff
ects
infie
ldtr
ials
Liqu
idam
bar
orie
ntal
isL.
[76]
very
succ
essf
ulin
field
stud
ies
Loliu
mte
mul
entu
mL.
[5]
succ
essf
ulin
labo
rato
ryst
udie
s
Men
tha
spic
ata
L.[1
8]effi
cien
tvs.
larv
ae,a
dult
sin
labo
rato
ry
Myr
tus
com
mun
isL.
[18]
effici
entv
s.la
rvae
,adu
lts
inla
bora
tory
Nee
mse
edex
trac
t[19
]su
cces
sful
inla
bora
tory
and
field
stud
ies
Oci
mum
basi
licum
L.[2
0]effi
cien
tvs.
larv
ae,a
dult
sin
labo
rato
ry
Ori
ganu
mvu
lgar
eL.
[14,
72]
stro
ng,a
lso
inlo
wdo
ses
still
vs.f
emal
es
Phlo
moi
des
tube
rosa
L.[7
5]effi
cien
tin
labo
rato
ryte
sts
Pine
extr
act[
19]
wea
keff
ects
infie
ldtr
ials
Pipe
rni
grum
L.[7
8]effi
cien
t,lo
ses
func
tion
unde
rsu
nlig
ht
Pipe
rtu
berc
ulat
umL.
[78]
effici
ent,
espe
cial
lyvs
.ear
lyla
rval
stag
es
77
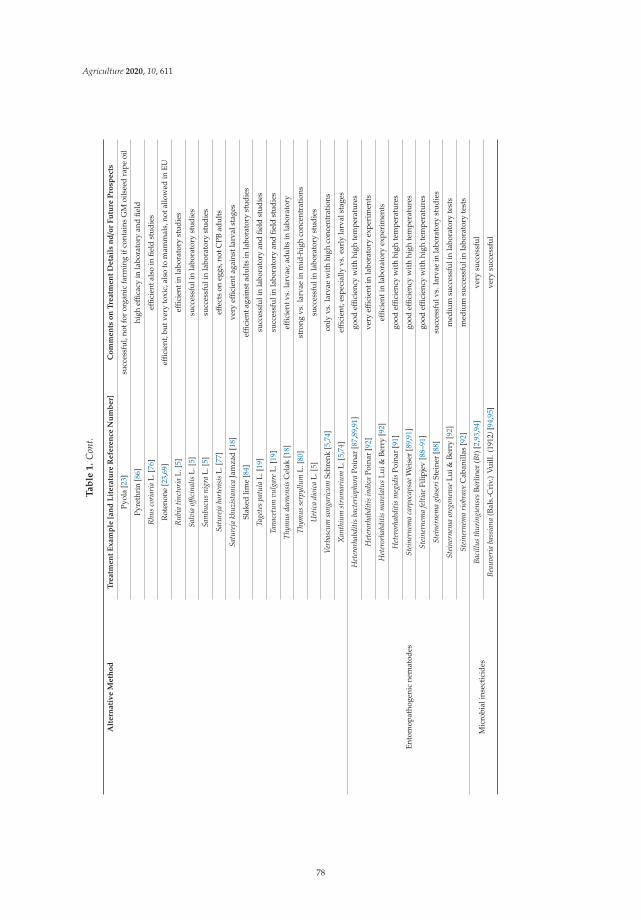
Agriculture 2020, 10, 611
Ta
ble
1.
Con
t.
Alt
ern
ati
ve
Meth
od
Tre
atm
en
tE
xam
ple
[an
dL
itera
ture
Refe
ren
ceN
um
ber]
Co
mm
en
tso
nT
reatm
en
tD
eta
ils
nd/o
rF
utu
reP
rosp
ect
s
Pyol
a[2
3]su
cces
sful
,not
for
orga
nic
farm
ing
ifco
ntai
nsG
Moi
lsee
dra
peoi
l
Pyre
thri
n[8
6]hi
gheffi
cacy
inla
bora
tory
and
field
Rhu
sco
riar
iaL.
[76]
effici
enta
lso
infie
ldst
udie
s
Rot
enon
e[2
3,69
]effi
cien
t,bu
tver
yto
xic,
also
tom
amm
als,
nota
llow
edin
EU
Rub
iatin
ctor
iaL.
[5]
effici
enti
nla
bora
tory
stud
ies
Salv
iaoffi
cina
lisL.
[5]
succ
essf
ulin
labo
rato
ryst
udie
s
Sam
bucu
sni
gra
L.[5
]su
cces
sful
inla
bora
tory
stud
ies
Satu
reja
hort
ensi
sL.
[77]
effec
tson
eggs
,not
CPB
adul
ts
Satu
reja
khuz
ista
nica
Jam
zad
[18]
very
effici
enta
gain
stla
rval
stag
es
Slak
edlim
e[8
4]effi
cien
taga
inst
adul
tsin
labo
rato
ryst
udie
s
Tage
tes
patu
laL.
[19]
succ
essf
ulin
labo
rato
ryan
dfie
ldst
udie
s
Tana
cetu
mvu
lgar
eL.
[19]
succ
essf
ulin
labo
rato
ryan
dfie
ldst
udie
s
Thym
usda
enen
sis
Cel
ak[1
8]effi
cien
tvs.
larv
ae,a
dult
sin
labo
rato
ry
Thym
usse
rpyl
lum
L.[8
0]st
rong
vs.l
arva
ein
mid
-hig
hco
ncen
trat
ions
Urt
ica
dioi
caL.
[5]
succ
essf
ulin
labo
rato
ryst
udie
s
Ver
basc
umso
ngar
icum
Schr
enk
[5,7
4]on
lyvs
.lar
vae
wit
hhi
ghco
ncen
trat
ions
Xan
thiu
mst
rum
ariu
mL.
[5,7
4]effi
cien
t,es
peci
ally
vs.e
arly
larv
alst
ages
Ento
mop
atho
geni
cne
mat
odes
Het
eror
habd
itis
bact
erio
phor
aPo
inar
[87,
89,9
1]go
odeffi
cien
cyw
ith
high
tem
pera
ture
s
Het
eror
habd
itis
indi
caPo
inar
[92]
very
effici
enti
nla
bora
tory
expe
rim
ents
Het
eror
habd
itis
mar
elat
usLu
i&Be
rry
[92]
effici
enti
nla
bora
tory
expe
rim
ents
Het
eror
habd
itis
meg
idis
Poin
ar[9
1]go
odeffi
cien
cyw
ith
high
tem
pera
ture
s
Stei
nern
ema
carp
ocap
sae
Wei
ser
[89,
91]
good
effici
ency
wit
hhi
ghte
mpe
ratu
res
Stei
nern
ema
felti
aeFi
lipje
v[8
8–91
]go
odeffi
cien
cyw
ith
high
tem
pera
ture
s
Stei
nern
ema
glas
eriS
tein
er[8
8]su
cces
sful
vs.l
arva
ein
labo
rato
ryst
udie
s
Stei
nern
ema
oreg
onen
seLu
i&Be
rry
[92]
med
ium
succ
essf
ulin
labo
rato
ryte
sts
Stei
nern
ema
riob
rave
Cab
anill
as[9
2]m
ediu
msu
cces
sful
inla
bora
tory
test
s
Mic
robi
alin
sect
icid
esBa
cillu
sth
urin
gien
ses
Berl
iner
(Bt)
[2,9
3,94
]ve
rysu
cces
sful
Beau
veri
aba
ssia
na(B
als.
-Cri
v.)
Vui
ll.(1
912)
[94,
95]
very
succ
essf
ul
78

Agriculture 2020, 10, 611
Ta
ble
1.
Con
t.
Alt
ern
ati
ve
Meth
od
Tre
atm
en
tE
xam
ple
[an
dL
itera
ture
Refe
ren
ceN
um
ber]
Co
mm
en
tso
nT
reatm
en
tD
eta
ils
nd/o
rF
utu
reP
rosp
ect
s
Envi
ronm
enta
llyfr
iend
lyin
sect
icid
es,s
yner
gist
san
dth
eir
com
bina
tion
sw
ith
synt
heti
cin
sect
icid
es
Aza
dira
chti
n[8
2,84
]le
thal
,but
impr
ovem
entn
eede
d
Cap
saic
in+
Org
anop
hosp
hate
[101
]w
idel
yus
ed,s
ucce
ssfu
lcom
bina
tion
Ave
rmec
tin
C[9
6]es
peci
ally
succ
essf
ulvs
.CPB
adul
ts
Kar
anja
oil+
Aza
dira
chti
n[9
9]pr
omis
ing,
field
stud
ies
need
ed
Ave
rmec
tin
B1+
B1b
[96]
stro
ng,b
utle
ssth
anac
tara
,spi
nosa
d
Aza
dira
chti
n+
Bt[1
00]
succ
essf
ul,b
utno
tfor
orga
nic
farm
ing
Spin
osad
and
com
bina
tion
s[1
7,96
–98]
very
succ
essf
ulsy
nerg
isti
ceff
ects
Con
serv
atio
nbi
olog
ical
cont
rol
Mul
chin
g(w
heat
orry
est
raw
)[11
1]w
eak,
bett
erco
mbi
ned
wit
hot
her
met
hods
Nat
ural
enem
ydi
vers
ity
[52,
106–
109,
112,
113]
very
effici
ent,
butc
ompl
exsy
stem
79
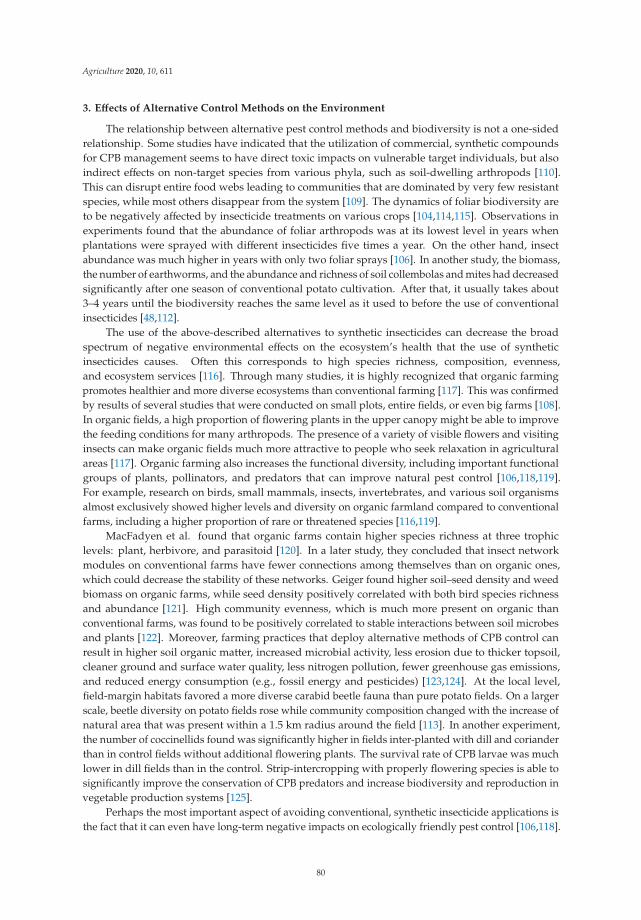
Agriculture 2020, 10, 611
3. Effects of Alternative Control Methods on the Environment
The relationship between alternative pest control methods and biodiversity is not a one-sidedrelationship. Some studies have indicated that the utilization of commercial, synthetic compoundsfor CPB management seems to have direct toxic impacts on vulnerable target individuals, but alsoindirect effects on non-target species from various phyla, such as soil-dwelling arthropods [110].This can disrupt entire food webs leading to communities that are dominated by very few resistantspecies, while most others disappear from the system [109]. The dynamics of foliar biodiversity areto be negatively affected by insecticide treatments on various crops [104,114,115]. Observations inexperiments found that the abundance of foliar arthropods was at its lowest level in years whenplantations were sprayed with different insecticides five times a year. On the other hand, insectabundance was much higher in years with only two foliar sprays [106]. In another study, the biomass,the number of earthworms, and the abundance and richness of soil collembolas and mites had decreasedsignificantly after one season of conventional potato cultivation. After that, it usually takes about3–4 years until the biodiversity reaches the same level as it used to before the use of conventionalinsecticides [48,112].
The use of the above-described alternatives to synthetic insecticides can decrease the broadspectrum of negative environmental effects on the ecosystem’s health that the use of syntheticinsecticides causes. Often this corresponds to high species richness, composition, evenness,and ecosystem services [116]. Through many studies, it is highly recognized that organic farmingpromotes healthier and more diverse ecosystems than conventional farming [117]. This was confirmedby results of several studies that were conducted on small plots, entire fields, or even big farms [108].In organic fields, a high proportion of flowering plants in the upper canopy might be able to improvethe feeding conditions for many arthropods. The presence of a variety of visible flowers and visitinginsects can make organic fields much more attractive to people who seek relaxation in agriculturalareas [117]. Organic farming also increases the functional diversity, including important functionalgroups of plants, pollinators, and predators that can improve natural pest control [106,118,119].For example, research on birds, small mammals, insects, invertebrates, and various soil organismsalmost exclusively showed higher levels and diversity on organic farmland compared to conventionalfarms, including a higher proportion of rare or threatened species [116,119].
MacFadyen et al. found that organic farms contain higher species richness at three trophiclevels: plant, herbivore, and parasitoid [120]. In a later study, they concluded that insect networkmodules on conventional farms have fewer connections among themselves than on organic ones,which could decrease the stability of these networks. Geiger found higher soil–seed density and weedbiomass on organic farms, while seed density positively correlated with both bird species richnessand abundance [121]. High community evenness, which is much more present on organic thanconventional farms, was found to be positively correlated to stable interactions between soil microbesand plants [122]. Moreover, farming practices that deploy alternative methods of CPB control canresult in higher soil organic matter, increased microbial activity, less erosion due to thicker topsoil,cleaner ground and surface water quality, less nitrogen pollution, fewer greenhouse gas emissions,and reduced energy consumption (e.g., fossil energy and pesticides) [123,124]. At the local level,field-margin habitats favored a more diverse carabid beetle fauna than pure potato fields. On a largerscale, beetle diversity on potato fields rose while community composition changed with the increase ofnatural area that was present within a 1.5 km radius around the field [113]. In another experiment,the number of coccinellids found was significantly higher in fields inter-planted with dill and corianderthan in control fields without additional flowering plants. The survival rate of CPB larvae was muchlower in dill fields than in the control. Strip-intercropping with properly flowering species is able tosignificantly improve the conservation of CPB predators and increase biodiversity and reproduction invegetable production systems [125].
Perhaps the most important aspect of avoiding conventional, synthetic insecticide applications isthe fact that it can even have long-term negative impacts on ecologically friendly pest control [106,118].
80

Agriculture 2020, 10, 611
Conventional broad-spectrum synthetic insecticides can disrupt the communities of natural enemies ofpests—resulting in less efficient control results. For example, the former use of carbofuran to controlthe European corn borer and the CPB has suppressed or even eliminated predator communities,including ground beetles, in eastern North Carolina with negative effects on CPB control and potatoplants [116]. Crowder et al. carried out a study of biological pest control in agricultural systemsand investigated whether organic farming promotes pest control by increasing the biodiversity ofthe natural enemy community in potato fields in Washington [108]. They found a higher speciesevenness in organic fields where natural enemies were relatively evenly distributed, compared toconventional fields dominated by one enemy species that accounted for up to 80% of individuals.In line with this discovery is that a higher evenness of natural enemies particularly decreased CPBabundance through direct attacks either against adults by various insect predators or against the larvaeby entomopathogenic nematodes in the soil. Alyokhin and Atlihan, and Alyokhin et al. partiallysupported the findings on potato plants by demonstrating that CPB populations on manure-amendedplots were not only lower but also took longer to develop than on chemically fertilized ones [8,126].Natural enemy populations increased in further research with rising overall insect diversity andsuppressed the pest population [127]. Due to mulching, carabids were found to be more abundant anddiverse compared to un-mulched fields, especially in potato fields. Mulching increased the total amountof captured beetles with 17% more on hay mulched and 14% on leaf litter mulched plots [111]. Higherabundances of natural enemies on mulched than on non-mulched plots were very likely responsible foran expansion in yield due to a reduction of CPB leaf feeding [128,129]. Therefore, an increase in overallbiodiversity in a healthy ecosystem is often accompanied by an increase in the number of naturalenemies of the pest. Ideally, this can lead to a self-reinforcing effect, i.e., a subsequent decrease in pestnumbers increases the yield and profit of farmers, improves acceptance of natural control methods,and slowly eliminates synthetic insecticides [108].
In conventional potato farming, the main interest is to evaluate under which circumstancesa high benefit (yield) could be achieved most efficiently including minimum negative effects onthe farm business [48]. For several years already, synthetic chemical insecticides have continued tobe marked as bad or even evil in public opinion; thus, they have a bad reputation. The ability ofinsect pests to develop resistances against many insecticides as one major aspect forces continualrenewal of the existing insecticide inventory which noticeably reduces the overall absolute benefit ofconventional production [48,106]. Turnbull and Hector illustrated that escalating resistance can lead toincreased insecticide spraying including an increasing, ever-wider variety of chemicals, and spiralingcosts for farmers [109]. It was further suggested that alternative and ecologically friendly methodswhich increased natural enemy diversity and evenness of CPBs lead to an increase in potato yieldthrough fewer pests and larger plants as well as the option for farmers to use less cost-intensiveinsecticides [108,130]. In a review about several crop types planted under various conventional andalternative control conditions, it was detected slightly, often not significant, lower yields in sustainableproduction. The authors explain the low advantage of conventional methods by the fact that the bestconditions for sustainable farming often lack suitable know-how for best application procedures,showing high potential for improvement. In addition, most data from conventional farming wasfound in developed areas with high-input farming and, thus, over-average yields [131]. Sustainableand ecologically based agriculture can improve the quality of the environmental and natural resourcebases upon which the agriculture depends. This can also maintain the (economic) sustainability offarms, and considerably improve the well-being of farmers and the whole society [48]. The higherthe acceptance by farmers to use more alternative and ecologically friendly methods, the healthierthe ecosystem, as well as the biodiversity of the pest enemies, could be expected. This can potentiallyreduce pest abundance, further increase yields and profits, and increase farmers’ acceptance of usingfewer conventional and more alternative control methods (Figure 2).
81
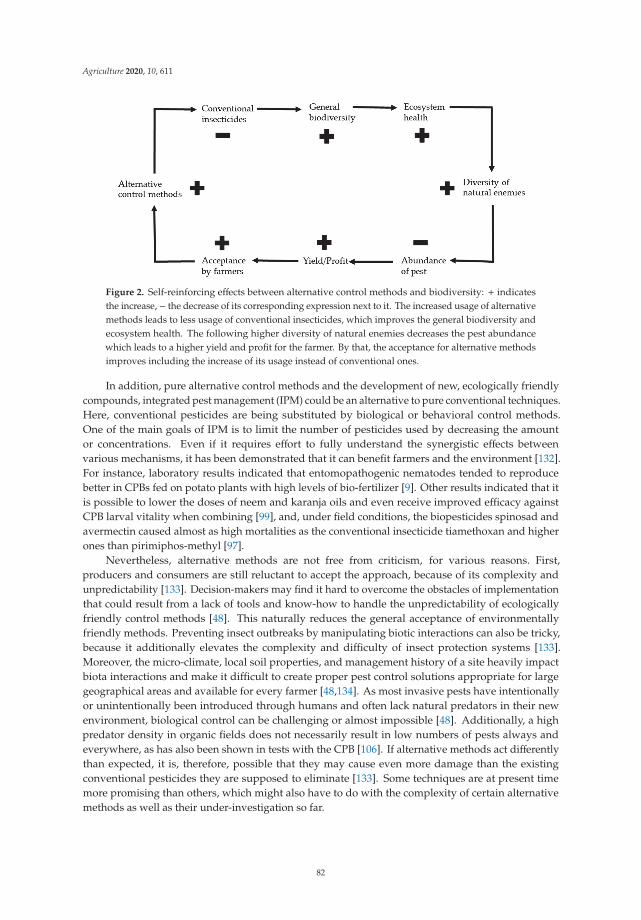
Agriculture 2020, 10, 611
Figure 2. Self-reinforcing effects between alternative control methods and biodiversity: + indicatesthe increase, − the decrease of its corresponding expression next to it. The increased usage of alternativemethods leads to less usage of conventional insecticides, which improves the general biodiversity andecosystem health. The following higher diversity of natural enemies decreases the pest abundancewhich leads to a higher yield and profit for the farmer. By that, the acceptance for alternative methodsimproves including the increase of its usage instead of conventional ones.
In addition, pure alternative control methods and the development of new, ecologically friendlycompounds, integrated pest management (IPM) could be an alternative to pure conventional techniques.Here, conventional pesticides are being substituted by biological or behavioral control methods.One of the main goals of IPM is to limit the number of pesticides used by decreasing the amountor concentrations. Even if it requires effort to fully understand the synergistic effects betweenvarious mechanisms, it has been demonstrated that it can benefit farmers and the environment [132].For instance, laboratory results indicated that entomopathogenic nematodes tended to reproducebetter in CPBs fed on potato plants with high levels of bio-fertilizer [9]. Other results indicated that itis possible to lower the doses of neem and karanja oils and even receive improved efficacy againstCPB larval vitality when combining [99], and, under field conditions, the biopesticides spinosad andavermectin caused almost as high mortalities as the conventional insecticide tiamethoxan and higherones than pirimiphos-methyl [97].
Nevertheless, alternative methods are not free from criticism, for various reasons. First,producers and consumers are still reluctant to accept the approach, because of its complexity andunpredictability [133]. Decision-makers may find it hard to overcome the obstacles of implementationthat could result from a lack of tools and know-how to handle the unpredictability of ecologicallyfriendly control methods [48]. This naturally reduces the general acceptance of environmentallyfriendly methods. Preventing insect outbreaks by manipulating biotic interactions can also be tricky,because it additionally elevates the complexity and difficulty of insect protection systems [133].Moreover, the micro-climate, local soil properties, and management history of a site heavily impactbiota interactions and make it difficult to create proper pest control solutions appropriate for largegeographical areas and available for every farmer [48,134]. As most invasive pests have intentionallyor unintentionally been introduced through humans and often lack natural predators in their newenvironment, biological control can be challenging or almost impossible [48]. Additionally, a highpredator density in organic fields does not necessarily result in low numbers of pests always andeverywhere, as has also been shown in tests with the CPB [106]. If alternative methods act differentlythan expected, it is, therefore, possible that they may cause even more damage than the existingconventional pesticides they are supposed to eliminate [133]. Some techniques are at present timemore promising than others, which might also have to do with the complexity of certain alternativemethods as well as their under-investigation so far.
82

Agriculture 2020, 10, 611
Overall, the focus on pure profit is slowly decreasing while the focus on health and the environmentis growing for various reasons and due to public opinion [48]. High costs for new conventionalinsecticides, pest resistance, and loss of biodiversity in a world of constant species loss under the threatof global warming are just some of the reasons to gradually shifting the focus to alternative pest controlmethods, such as for CPBs. Further research is needed to improve farming and pest control conditions,so that farmers and nature benefit equally by switching from conventional to alternative pest controlmethods worldwide.
4. Conclusions
We reviewed a wide range of alternative methods used to control the CPB. We listed, categorized,and highlighted the advantages and disadvantages of the methods, including in comparison toconventional insecticides. Next, we presented the current knowledge about the positive and negativeeffects of using alternative control methods and IPM of various control approaches. We also illustratedhow alternative control methods, farmers, and environmental factors (e.g., biodiversity and ecosystemhealth) are strongly linked in a self-reinforcing cycle. The higher the acceptance of farmers forthe use of alternative control methods, the healthier the ecosystem including pest’s enemy biodiversity.The following decrease of pest abundance may increase the yield, profit, and acceptance of farmers touse less conventional and more alternative methods. There are still few studies that compare the actualyield and profit between fields controlled by using synthetic insecticides and some of the alternativesdescribed here under the same environmental and anthropogenic conditions. The existing studiessuggest that implementing IPM methods and using alternatives to synthetic insecticides can producenearly as high or even higher yields than conventional farming, especially regarding the high potential ofimproving sustainable methods over time and experience. Overall, we are trying to balance the positiveand negative sides of alternative control methods and combine them with current knowledge aboutenvironmental impacts. In our view, this is a fundamental task for the future, especially in times ofhigh global species loss and increasing demand for environmentally friendly agriculture and products.Many alternative methods that already exist are often at least as good or even more efficient than theirconventional counterparts. Moreover, the effectiveness and reputation of the latter ones are constantlydeclining, so the only logical conclusion is to improve alternative control methods. Those are still farfrom being perfect alternatives, so more research is needed, also to improve the efficacy, yield, profit,and understandability of methods for farmers. Some methods are already widely accepted and in use,such as certain IPMs with ecologically friendly insecticides or physical or augmentative control, whilethe pure utilization of conservation biological methods did not convince many farmers yet, althoughall of these methods show potential. Much more research is needed as alternative methods and theirsuccess is much less investigated and much more complex than most conventional ones. Still, it isbroadly acknowledged that alternative control methods contribute greatly to a healthier environmentfrom which everybody can profit. This leads us to believe that alternative control methods already playan appropriate role in agriculture and hopefully, in the long-term, can completely replace or at leastdiminish as much as possible pest control methods based on conventional and often environmentallyharmful synthetic insecticides.
Author Contributions: The authors contributed as followed to the specific parts of the work: Idea of the topic,B.G. and R.B.; Investigation (literature research), B.G.; Conceptualization, B.G. and R.B.; Validation, B.G., D.L.and R.B.; Writing, B.G., Review and editing, B.G., D.L., and R.B.; Visualization, B.G. and R.B.; Supervision, R.B.All authors have read and agreed to the published version of the manuscript.
Funding: This research was supported by the Croatian Science Foundation through the project MONPERES(2016-06-7458) “Monitoring of Insect Pest Resistance: Novel Approach for Detection, and Effective ResistanceManagement Strategies”.
Conflicts of Interest: The authors declare no conflict of interest. The funders had no role in the design of the study;in the collection, analyses, or interpretation of data; in the writing of the manuscript; or in the decision to publishthe results.
83
Agriculture 2020, 10, 611
References
1. European Commission. Sustainable Use of Pesticides. 2020. Available online: https://ec.europa.eu/food/plant/pesticides/sustainable_use_pesticides_en (accessed on 25 November 2020).
2. Cingel, A.; Savic, J.; Lazarevic, J.; Cosic, T.; Raspor, M.; Smigocki, A.; Ninkovic, S. Extraordinary adaptiveplasticity of colorado potato beetle: “Ten-Striped Spearman” in the era of biotechnological warfare. Int. J.Mol. Sci. 2016, 17, 1538. [CrossRef] [PubMed]
3. Almady, S.; Khelifi, M.; Beaudoin, M.P. Control of the Colorado Potato Beetle, Leptinotarsa decemlineata (Say),Using Predator Insects Released by a Mechanical Prototype. J. Environ. Eng. Sci. 2012, 1, 1279–1287.
4. Aldrich, J.R.; Cantelo, W.W. Suppression of Colorado potato beetle infestation by pheromone-mediatedaugmentation of the predatory spined soldier bug, Podisus maculiventris (Say) (Heteroptera: Pentatomidae).Agric. Forest Entomol. 1999, 1, 209–217. [CrossRef]
5. Gökçe, A.; Whalon, M.E.; Çam, H.I.T.; Yanar, Y.; Demirtas, I.I.M.; Goren, N. Contact and residual toxicitiesof 30 plant extracts to Colorado potato beetle larvae. Arch. Phytopathol. Pflanzenschutz 2007, 40, 441–450.[CrossRef]
6. Luckmann, W.H.; Metcalf, R.L. The Pest Management Concept. Introduction to Insect Pest Management, 1st ed.;Wiley: New York, NY, USA, 1994; pp. 1–31.
7. Alyokhin, A. Colorado potato beetle management on potatoes: Current challenges and future prospects.Fruit Veg. Cereal Sci. Biotechnol. 2009, 3, 10–19.
8. Alyokhin, A.; Atlihan, R. Reduced fitness of the Colorado potato beetle (Coleoptera: Chrysomelidae)on potato plants grown in manure-amended soil. Environ. Entomol. 2005, 34, 963–968. [CrossRef]
9. Armer, C.A.; Berry, R.E.; Reed, G.L.; Jepsen, S.J. Colorado potato beetle control by applicationof the entomopathogenic nematode Heterorhabditis marelata and potato plant alkaloid manipulation.Entomol. Exp. Appl. 2004, 111, 47–58. [CrossRef]
10. Sablon, L.; Dickens, J.C.; Haubruge, É.; Verheggen, F.J. Chemical ecology of the Colorado potato beetle,Leptinotarsa decemlineata (Say) (Coleoptera: Chrysomelidae), and potential for alternative control methods.Insects 2013, 4, 31–54. [CrossRef]
11. Wijesinha-Bettoni, R.; Mouillé, B. The Contribution of Potatoes to Global Food Security, Nutrition andHealthy Diets. Am. Potato J. 2019, 96, 139–149. [CrossRef]
12. Liu, N.; Li, Y.; Zhang, R. Invasion of Colorado potato beetle, Leptinotarsa decemlineata, in China: Dispersal,occurrence, and economic impact. Entomol. Exp. Appl. 2012, 143, 207–217. [CrossRef]
13. Maharijaya, A.; Vosman, B. Managing the Colorado potato beetle; the need for resistance breeding. Euphytica2015, 204, 487–501. [CrossRef]
14. Rusin, M.; Gospodarek, J. The effect of water extracts from Origanum vulgare L. on feeding ofLeptinotarsa decemlineata Say. J. Agric. Eng. 2018, 63, 122–127.
15. Liu, S.Q.; Scott, I.M.; Pelletier, Y.; Kramp, K.; Durst, T.; Sims, S.R.; Arnason, J.T. Dillapiol: A pyrethrumsynergist for control of the Colorado potato beetle. J. Econ. Entomol. 2014, 107, 797–805. [CrossRef] [PubMed]
16. Weber, D.C.; Rowley, D.L.; Greenstone, M.H.; Athanas, M.M. Prey preference and host suitability ofthe predatory and parasitoid carabid beetle, Lebia grandis, for several species of Leptinotarsa beetles. J. Insect Sci.2006, 6, 14–27. [CrossRef]
17. Kowalska, J. Spinosad effectively controls Colorado potato beetle, Leptinotarsa decemlineata (Coleoptera:Chrysomelidae) in organic potato. Acta Agric. Scand. B 2010, 60, 283–286. [CrossRef]
18. Saroukolai, A.T.; Nouri-Ganbalani, G.; Hadian, J.; Rafiee-Dastjerdi, H. Antifeedant activity and toxicity ofsome plant essential oils to Colorado potato beetle, Leptinotarsa decemlineata Say (Coleoptera: Chrysomelidae).Plant Protect. Sci. 2014, 50, 207–216. [CrossRef]
19. Moreau, T.L.; Warman, P.R.; Hoyle, J. An evaluation of companion planting and botanical extracts asalternative pest controls for the Colorado potato beetle. Biol. Agric. Hortic. 2006, 23, 351–370. [CrossRef]
20. Giordanengo, P.; Vincent, C.; Alyokhin, A. Insect Pests of Potato. Global Perspectives on Biology and Management,1st ed.; Elsevier Inc.: Waltham, MA, USA, 2013.
21. Huseth, A.S.; Frost, K.E.; Knuteson, D.L.; Wyman, J.A.; Groves, R.L. Effects of landscape composition androtation distance on Leptinotarsa decemlineata (Coleoptera: Chrysomelidae) abundance in cultivated potato.Environ. Entomol. 2012, 41, 1553–1564. [CrossRef] [PubMed]
84
Agriculture 2020, 10, 611
22. Weisz, R.; Smilowitz, Z.; Christ, B. Distance, rotation, and border crops affect Colorado potato beetle(Coleoptera: Chrysomelidae) colonization and population density and early blight (Alternaria solani) severityin rotated potato fields. J. Econ. Entomol. 1994, 87, 723–729. [CrossRef]
23. Kuepper, G. Colorado Potato Beetle: Organic Control Options; NCAT Program Specialist Tiffany Nitschke.HTML Production CT, 107, Slot 114; ATTRA: Fayetteville, NC, USA, 2003.
24. Yasar, B.; Güngör, M.A. Determination of life table and biology of Colorado potato beetle, Leptinotarsadecemlineata Say (Coleoptera: Chrysomelidae), feeding on five different potato varieties in Turkey.Appl. Entomol. Zool. 2005, 40, 589–596. [CrossRef]
25. Sinden, S.L.; Sanford, L.L.; Cantelo, W.W.; Deahl, K.L. Bioassays of segregating plants. J. Chem. Ecol. 1988,14, 1941–1950. [CrossRef] [PubMed]
26. Cappelle, K.; de Oliveira, C.F.R.; Van Eynde, B.; Christiaens, O.; Smagghe, G. The involvement ofclathrin-mediated endocytosis and two Sid-1-like transmembrane proteins in double-stranded RNA uptakein the Colorado potato beetle midgut. Insect Mol. Biol. 2016, 25, 315–323. [CrossRef] [PubMed]
27. Zhu, F.; Xu, J.; Palli, R.; Ferguson, J.; Palli, S.R. Ingested RNA interference for managing the populations ofthe Colorado potato beetle, Leptinotarsa decemlineata. Pest Manag. Sci. 2011, 67, 175–182. [CrossRef]
28. Visal, S.; Taylor, M.A.; Michaud, D. The proregion of papaya proteinase IV inhibits Colorado potato beetledigestive cysteine proteinases. FEBS Lett. 1998, 434, 401–405. [CrossRef]
29. Panevska, A.; Hodnik, V.; Skocaj, M.; Novak, M.; Modic, Š.; Pavlic, I.; Podržaj, S.; Zaric, M.; Resnik, N.;Macek, P.; et al. Pore-forming protein complexes from Pleurotus mushrooms kill western corn rootworm andColorado potato beetle through targeting membrane ceramide phosphoethanolamine. Sci. Rep. 2019, 9, 1–14.[CrossRef]
30. Dickens, J.C. Plant volatiles moderate response to aggregation pheromone in Colorado potato beetle.J. Appl. Entomol. 2006, 130, 26–31. [CrossRef]
31. Dickens, J.C.; Oliver, J.E.; Hollister, B.; Davis, J.C.; Klun, J.A. Breaking a paradigm: Male-produced aggregationpheromone for the Colorado potato beetle. J. Exp. Biol. 2002, 205, 1925–1933.
32. Kuhar, T.P.; Mori, K.; Dickens, J.C. Potential of a synthetic aggregation pheromone for integrated pestmanagement of Colorado potato beetle. Agric. Forest Entomol. 2006, 8, 77–81. [CrossRef]
33. Kuhar, T.P.; Hitchner, E.M.; Youngman, R.R.; Mori, K.; Dickens, J.C. Field response of Colorado potato beetleto enantiomeric blends of CPB I aggregation pheromone. Int. J. Agric. Sci. 2012, 3, 896–899. [CrossRef]
34. Martel, J.W.; Alford, A.R.; Dickens, J.C. Laboratory and greenhouse evaluation of a synthetic host volatileattractant for Colorado potato beetle, Leptinotarsa decemlineata (Say). Agric. Forest Entomol. 2005, 7, 71–78.[CrossRef]
35. Dickens, J.C. Orientation of Colorado potato beetle to natural and synthetic blends of volatiles emitted bypotato plants. Agric. Forest Entomol. 2000, 2, 167–172. [CrossRef]
36. Gontariu, I.; Enea, I.-C. Protection against the proliferation of the Colorado beetle (Leptinotarsa decemlineata Say)in the concept of organic culture at the potato. Food Environ. Saf. J. 2017, 11, 91–96.
37. Moore, J. Sweeping fields controls some pests. Am. Veg. Grow. 1990, 1, 10–11.38. Boiteau, G.; Singh, R.P.; McCarthy, P.C.; MacKinley, P.D. Wood ash potential for Colorado potato beetle
control. Am. Potato J. 2012, 89, 129–135. [CrossRef]39. Laguë, C.; Khelifi, M.; Gill, J.; Lacasse, B. Pneumatic and thermal control of Colorado potato beetle.
Can. Agric. Eng. 1999, 41, 53–58.40. Laguë, C.; Khelif, M.; Lacasse, B. Evaluation of a four-row prototype machine for pneumatic control of
Colorado potato beetle. Can. Agric. Eng. 1999, 41, 47–52.41. Moyer, D.D.; Derksen, R.C.; McLeod, M.J. Development of a propane flamer for Colorado potato beetle
control. Am. Potato J. 1992, 69, 599–600.42. Hicks, J.; Couturier, M.; Pelletier, Y. Insect scorcher for the control of the Colorado potato beetle. Can. Agric. Eng.
1999, 41, 227–232.43. Pelletier, Y.; Misener, G.C.; McMillan, L.P. Steam as an alternative control method for the management of
Colorado potato beetles. Can. Agric. Eng. 1998, 40, 17–22.44. Couturier, M.; Hicks, J.B.; Rouison, D.; Pelletier, Y. Thermal initiation of thanatosis to improve the pneumatic
removal of the Colorado potato beetle. Can. Biosyst. Eng. 2005, 47, 2.5–2.12.
85

Agriculture 2020, 10, 611
45. Boiteau, G.; Pelletier, Y.; Misener, G.C.; Bernard, G. Development and evaluation of a plastic trenchbarrier for protection of potato from walking adult Colorado potato beetles (Coleoptera: Chrysomelidae).J. Econ. Entomol. 1994, 87, 1325–1331. [CrossRef]
46. Otálora-Luna, F.; Dickens, J.C. Spectral preference and temporal modulation of photic orientation by Coloradopotato beetle on a servosphere. Entomol. Exp. Appl. 2011, 138, 93–103. [CrossRef]
47. Otálora-Luna, F.; Dickens, J.C. Multimodal stimulation of Colorado potato beetle reveals modulation ofpheromone response by yellow light. PLoS ONE 2011, 6, e20990. [CrossRef]
48. De Ladurantaye, Y.; Khelifi, M.; Cloutier, C.; Coudron, T.A. Short-term storage conditions for transport andfarm delivery of the stink bug Perillus bioculatus for the biological control of the Colorado potato beetle.Can. Biosyst. Eng. 2010, 52, 1–4.
49. Hough-Goldstein, J.; McPherson, D. Comparison of Perillus bioculatus and Podisus maculiventris (Hemiptera:Pentatomidae) as potential control agents of the Colorado potato beetle (Coleoptera: Chrysomelidae).J. Econ. Entomol. 1996, 89, 1116–1123. [CrossRef]
50. Greenstone, M.H.; Szendrei, Z.; Payton, M.E.; Rowley, D.L.; Coudron, T.C.; Weber, D.C. Choosing naturalenemies for conservation biological control: Use of the prey detectability half-life to rank key predators ofColorado potato beetle. Entomol. Exp. Appl. 2010, 136, 97–107. [CrossRef]
51. Tarla, S.; Tarla, G. Detection of Perillus bioculatus (F.) (Heteroplera: Pentatomidae) on a New Host in Anatolia.Can. Entomol. 2018, 127, 195–212.
52. Cloutier, C.; Jean, C. Synergism between natural enemies and biopesticides: A test case using the stinkbugPerillus bioculatus (Hemiptera: Pentatomidae) and Bacillus thuringiensis tenebrionis against Colorado potatobeetle (Coleoptera: Chrysomelidae). J. Econ. Entomol. 1998, 91, 1096–1108. [CrossRef]
53. O’Neil, R. Functional response search strategy of Podisus maculiventris (Heteroptera: Pentatomidae) attackingColorado potato beetle (Coleoptera: Chrysomelidae). Environ. Entomol. 1997, 26, 1183–1190. [CrossRef]
54. Hazzard, R.V.; Ferro, D.N.; Van Driesche, R.G.; Tuttle, A.F. Mortality of eggs of Colorado potatobeetle (Coleoptera: Chrysomelidae) from predation by Coleomegilla maculata (Coleoptera: Coccinellidae).Environ. Entomol. 1991, 20, 841–848. [CrossRef]
55. Mallampalli, N.; Gould, F.; Barbosa, P. Predation of Colorado potato beetle eggs by a polyphagous ladybeetlein the presence of alternate prey: Potential impact on resistance evolution. Entomol. Exp. Appl. 2005, 114,47–54. [CrossRef]
56. Alvarez, J.M.; Srinivasan, R.; Cervantes, F.A. Occurrence of the carabid beetle, Pterostichus melanarius(Illiger), in potato ecosystems of Idaho and its predatory potential on the Colorado potato beetle and aphids.Am. Potato J. 2013, 90, 83–92. [CrossRef]
57. Sablon, L.; Haubruge, E.; Verheggen, F.J. Consumption of immature stages of Colorado potato beetleby Chrysoperla carnea (Neuroptera: Chrysopidae) larvae in the laboratory. Am. Potato J. 2013, 90, 51–57.[CrossRef]
58. Groden, E.; Drummond, F.A.; Casagrande, R.A.; Lashomb, J.H. Estimating parasitism of Colorado potatobeetle eggs, Leptinotarsa decemlineata (Coleoptera: Chrysomelidae), by Edovum puttleri (Hymenoptera:Eulophidae). Great Lakes Entomol. 1989, 22, 47–54.
59. Boiteau, G. Insect pest control on potato: Harmonization of alternative and conventional control methods.Am. Potato J. 2010, 87, 412–419. [CrossRef]
60. De Ladurantaye, Y.; Khelifi, M. Design of a mechanical release system of Perillus bioculatus to controlthe Colorado potato beetle, Leptinotarsa decemlineata (Say). In Proceedings of the 17th World Congress ofthe International Commission of Agricultural and Biosystems Engineering (CIGR), Québec City, QC, Canada,13–17 June 2010.
61. Chiasson, H.; Vincent, C.; Bostanian, N.J. Insecticidal properties of a Chenopodium-based botanical.J. Econ. Entomol. 2004, 97, 1378–1383. [CrossRef]
62. Thacker, J.R. An Introduction to Arthropod Pest Control, 1st ed.; Cambridge University Press: Cambridge, MA,USA, 2002.
63. Pascual-Villalobos, M.J.; Robledo, A. Anti-insect activity of plant extracts from the wild flora in southeasternSpain. Biochem. Syst. Ecol. 1999, 27, 1–10. [CrossRef]
64. Nitao, J.K. Test for toxicity of coniine to a polyphagous herbivore, Heliothis zea (Lepidoptera: Noctuidae).Environ. Entomol. 1987, 16, 656–659. [CrossRef]
86

Agriculture 2020, 10, 611
65. Bourgaud, F.; Gravot, A.; Milesi, S.; Gontier, E. Production of plant secondary metabolites: A historicalperspective. Plant Sci. J. 2001, 161, 839–851. [CrossRef]
66. Mordue, A.J.; Nisbet, A.J. Azadirachtin from the Neem tree Azadirachta indica: Its actions against insects.An. Soc. Entomol. Brasil 2000, 29, 615–632.
67. Hassan, E.; Gökçe, A. Production and consumption of biopesticides. In Advances in Plant Biopesticides, 1st ed.;Springer: New Delhi, India, 2014; pp. 361–379.
68. Roahk, R.C. Present status of rotenone and rotenoids. J. Econ. Entomol. 1941, 34, 684–692. [CrossRef]69. Zehnder, G.W. Timing of insecticides for control of Colorado potato beetle (Coleoptera: Chrysomelidae)
in eastern Virginia based on differential susceptibility of life stages. J. Econ. Entomol. 1986, 79, 851–856.[CrossRef]
70. EC (European Commission). Concerning the Non-Inclusion of Rotenone, Extract from Equisetum andChinin-Hydrochlorid in Annex I to Council Directive 91/414/EEC and the Withdrawal of Authorisationsfor Plant Protection Products Containing These Substances. EC 2008/317, Published 10 April 2008.Available online: https://eur-lex.europa.eu/LexUriServ/LexUriServ.do?uri=OJ:L:2008:108:0030:0032:EN:PDF(accessed on 28 October 2020).
71. DG SanCo (European Union Director General for Health and Consumers). Available online: https://ec.europa.eu/info/departments/health-and-food-safety_en (accessed on 28 October 2020).
72. Kesdek, M.; Kordali, S.; Usanmaz, A.; Ercisli, S. The toxicity of essential oils of some plant species againstadults of colorado potato beetle, Leptinotarsa decemlineata Say (Coleoptera: Chrysomelidae). Tome 2015,68, 127–136.
73. Ebadollahi, A.; Geranmayeh, J.; Kamrani, M. Colorado potato beetle (Leptinotarsa decemlineata Say) controlpotential of essential oil isolated from iranian Cymbopogon citratus Stapf. Nat. Prod. 2017, 23, 235–238.[CrossRef]
74. Gökçe, A.; Isaacs, R.; Whalon, M.E. Behavioural response of Colorado potato beetle (Leptinotarsa decemlineata)larvae to selected plant extracts. Pest Manag. Sci. 2006, 62, 1052–1057. [CrossRef] [PubMed]
75. Alkan, M.; Gökçe, A.; Kara, K. Contact Toxicity of Six Plant Extracts to Different Larval Stages of ColoradoPotato Beetle (Leptinotarsa decemlineata Say (Col: Chrysomelidae)). J. Agric. Sci. 2017, 23, 309–316.
76. Ertürk, Ö.; Sarıkaya, A. Effects of Various Plant Extracts on the Development of the Potato Beetle underLaboratory and Field Conditions: A Combined Study. J. Entomol. Res. Soc. 2017, 19, 101–112.
77. Bădeanu, M.; Suteu, D.; Chiorescu, E.; Filipov, F. The use of medicinal and aromatic plant extracts againstColorado beetle species-Leptinotarsa decemlineata (Coleoptera-Chrysomelidae). Rev. Bot. 2017, 14, 101–104.
78. Scott, I.M.; Jensen, H.; Scott, J.G.; Isman, M.B.; Arnason, J.T.; Philogene, B.J.R. Botanical insecticides forcontrolling agricultural pests: Piperamides and the Colorado potato beetle Leptinotarsa decemlineata Say(Coleoptera: Chrysomelidae). Arch. Insect Biochem. 2003, 54, 212–225. [CrossRef]
79. Scott, I.M.; Jensen, H.R.; Philogène, B.J.; Arnason, J.T. A review of Piper spp.(Piperaceae) phytochemistry,insecticidal activity and mode of action. Phytochem. Rev. 2008, 7, 65. [CrossRef]
80. Rusin, M.; Gospodarek, J.; Binias, B. The effect of water extract from wild thyme on Colorado potato beetlefeeding. Ecol. Eng. 2016, 17, 197–202. [CrossRef]
81. Gabaston, J.; El Khawand, T.; Waffo-Teguo, P.; Decendit, A.; Richard, T.; Mérillon, J.M.; Pavela, R. Stilbenesfrom grapevine root: A promising natural insecticide against Leptinotarsa decemlineata. J. Pest Sci. 2018,91, 897–906. [CrossRef]
82. Trdan, S.; Cirar, A.; Bergant, K.; Andjus, L.; Kac, M.; Vidrih, M.; Rozman, L. Effect of temperature on efficacyof three natural substances to Colorado potato beetle, Leptinotarsa decemlineata (Coleoptera: Chrysomelidae).Acta Agric. Scand. B 2007, 57, 293–296. [CrossRef]
83. Bohinc, T.; Vucajnk, F.; Trdan, S. The efficacy of environmentally acceptable products for the control of majorpotato pests and diseases. Zemdirbyste 2019, 106, 135–142. [CrossRef]
84. Banken, J.A.; Stark, J.D. Multiple routes of pesticide exposure and the risk of pesticides to biological controls:A study of neem and the sevenspotted lady beetle (Coleoptera: Coccinellidae). J. Econ. Entomol. 1998, 91, 1–6.[CrossRef]
85. Murray, K. Utilization of a neem product in a reduced synthetic chemical insecticidal management programfor Colorado potato beetle. Sustain. Agric. Netw. 1997, 24, 1275–1283.
86. Bezjak, S.; Igrc Barcic, J.; Bažok, R. Efficacy of botanical insecticides in Colorado potato beetle(Leptinotarsa decemlineata, Say., Coleoptera:Chrysomelidae) control. Fragm. Phytomed. Herbol. 2006, 29, 13–24.
87
Agriculture 2020, 10, 611
87. Ebrahimi, L.; Niknam, G.; Lewis, E.E. Lethal and sublethal effects of Iranian isolates of Steinernema feltiaeand Heterorhabditis bacteriophora on the Colorado potato beetle, Leptinotarsa decemlineata. BioControl 2011,56, 781–788. [CrossRef]
88. Toba, H.H.; Lindegren, J.E.; Turner, J.E.; Vail, P.V. Susceptibility of the Colorado potato beetle and the sugarbeetwireworm to Steinernema feltiae and S. glaseri. J. Nematol. 1983, 15, 597.
89. Kepenekci, I. Infectivity of Native Entomopathogenic Nematodes Applied as Infected-Host Cadavers againstthe Colorado Potato Beetle, Leptinotarsa decemlineata (Say) (Coleoptera: Chrysomelidae). Egypt. J. Biol.Pest Control 2016, 26, 173.
90. Laznik, Ž.; Tóth, T.; Lakatos, T.; Vidrih, M.; Trdan, S. Control of the Colorado potato beetle (Leptinotarsadecemlineata [Say]) on potato under field conditions: A comparison of the efficacy of foliar application of twostrains of Steinernema feltiae (Filipjev) and spraying with thiametoxam. J. Plant Dis. Protect 2010, 117, 129–135.[CrossRef]
91. Trdan, S.; Vidrih, M.; Andjus, L.; Laznik, Ž. Activity of four entomopathogenic nematode speciesagainst different developmental stages of Colorado potato beetle, Leptinotarsa decemlineata (Coleoptera,Chrysomelidae). Helminthologia 2009, 46, 14–20. [CrossRef]
92. Trdan, R.E.; Liu, J.; Reed, G. Comparison of endemic and exotic entomopathogenic nematode species forcontrol of Colorado potato beetle (Coleoptera: Chrysomelidae). J. Econ. Entomol. 1997, 90, 1528–1533.
93. Ghassemi-Kahrizeh, A.; Aramideh, S. Sub-lethal effects of Bacillus thuringiensis Berliner on larvae of Coloradopotato beetle, Leptinotarsa decemlineata (say) (Coleoptera: Chrysomelidae). Arch. Phytopathol. Pflanzenschutz2015, 48, 259–267. [CrossRef]
94. Wraight, S.P.; Ramos, M.E. Synergistic interaction between Beauveria bassiana-and Bacillus thuringiensistenebrionis-based biopesticides applied against field populations of Colorado potato beetle larvae. J. Invertebr.Pathol. 2005, 90, 139–150. [CrossRef]
95. Weinzierl, R.; Henn, T.; Koehler, P.G.; Tucker, C.L. Microbial Insecticides, Cooperative Extension Service; Universityof Illinois: Gainesville, FL, USA, 1998; Volume 1295, pp. 11–23.
96. Barcic, J.I.; Bažok, R.; Bezjak, S.; Culjak, T.G.; Barcic, J. Combinations of several insecticides used for integratedcontrol of Colorado potato beetle (Leptinotarsa decemlineata, Say., Coleoptera: Chrysomelidae). J. Pest Sci.2006, 79, 223–232. [CrossRef]
97. Osman, M.A.M. Biological efficacy of some biorational and conventional insecticides in the control ofdifferent stages of the Colorado potato beetle, Leptinotarsa decemlineata (Say) (Coleoptera: Chrysomelidae).Plant Protect. Sci. 2010, 46, 123–134. [CrossRef]
98. Bažok, R.; Ðurek, I.; Barcic, J.I.; Culjak, T.G. Joint action of ecologically acceptable insecticides for the ColoradoPotato Beetle (Leptinotarsa decemlineata Say, Coleoptera: Chrysomelidae) control. Fragm. Phytomed. Herbol.2008, 30, 47–63.
99. Kovaríková, K.; Pavela, R. United Forces of Botanical Oils: Efficacy of Neem and Karanja Oil against ColoradoPotato Beetle under Laboratory Conditions. Plants 2019, 8, 608. [CrossRef]
100. Trisyono, A.; Whalon, M.E. Toxicity of neem applied alone and in combinations with Bacillus thuringiensis toColorado potato beetle (Coleoptera: Chrysomelidae). J. Econ. Entomol. 1999, 92, 1281–1288. [CrossRef]
101. Maliszewska, J.; Tegowska, E. Capsaicin as an organophosphate synergist against Colorado potato beetle(Leptinotarsa decemlineata Say). J. Plant Prot. Res. 2012, 52, 28–34. [CrossRef]
102. Heimpel, G.E.; Hough-Goldstein, J.A. A survey of arthropod predators of Leptinotarsa decemlineata (Say)in Delaware potato fields. J. Agric. Entom. 1992, 9, 137–142.
103. Ferro, D.N. Biological control of the Colorado potato beetle. APS 1994, 11, 357–375.104. Hilbeck, A.; Kennedy, G.G. Predators feeding on the Colorado potato beetle insecticide-free plots and
insecticide-treated commercial potato fields in eastern North Carolina. Biol. Control. 1996, 6, 273–282.[CrossRef]
105. Snyder, W.E. Give predators a complement: Conserving natural enemy biodiversity to improve biocontrol.Biol. Control 2019, 135, 73–82. [CrossRef]
106. Radkova, M.; Kalushkov, P.; Chehlarov, E.; Gueorguiev, B.; Naumova, M.; Ljubomirov, T.; Stoichev, S.;Slavov, S.; Djilianov, D. Beneficial arthropod communities in commercial potato fields. Compt. Rend. Acad.Bulg. Sci. 2017, 70, 309–316.
88

Agriculture 2020, 10, 611
107. Tschumi, M.; Albrecht, M.; Collatz, J.; Dubsky, V.; Entling, M.H.; Najar-Rodriguez, A.J.; Jacot, K. Tailoredflower strips promote natural enemy biodiversity and pest control in potato crops. J. Appl. Ecol. 2016,53, 1169–1176. [CrossRef]
108. Crowder, D.W.; Northfield, T.D.; Strand, M.R.; Snyder, W.E. Organic agriculture promotes evenness andnatural pest control. Nature 2010, 466, 109–112. [CrossRef]
109. Turnbull, L.A.; Hector, A. How to get even with pests. Nature 2010, 466, 36–37. [CrossRef]110. Johnson, J.M.; Hough-Goldstein, J.A.; Vangessel, M.J. Effects of straw mulch on pest insects, predators,
and weeds in watermelons and potatoes. Environ. Entomol. 2004, 33, 1632–1643. [CrossRef]111. Dudás, P.; Gedeon, C.; Menyhárt, L.; Ambrus, G.; Tóth, F. The effect of mulching on the abundance and
diversity of ground beetle assemblages in two hungarian potato fields. J. Environ. Agric. Sci. 2016, 3, 45–53.[CrossRef]
112. Nelson, K.L.; Lynch, D.H.; Boiteau, G. Assessment of changes in soil health throughout organic potatorotation sequences. Agric. Ecosyst. Environ. 2009, 131, 220–228. [CrossRef]
113. Werling, B.P.; Gratton, C. Influence of field margins and landscape context on ground beetle diversity inWisconsin (USA) potato fields. Agric. Ecosyst. Environ. 2008, 128, 104–108. [CrossRef]
114. Duan, J.J.; Head, G.; Jensen, A.; Reed, G. Effects of transgenic Bacillus thuringiensis potato and conventionalinsecticides for Colorado potato beetle (Coleoptera: Chrysomelidae) management on the abundance ofground-dwelling arthropods in Oregon potato ecosystems. Environ. Entomol. 2004, 33, 275–281. [CrossRef]
115. Meissle, M.; Lang, A. Comparing methods to evaluate the effects of Bt maize and insecticide on spiderassemblages. Agric. Ecosyst. Environ. 2005, 107, 359–370. [CrossRef]
116. Smith, J.; Wolfe, M.; Woodward, L.; Pearce, B.; Lampkin, N.; Marshall, H. Organic Farming and Biodiversity:A Review of the Literature; Organic Center Wales: Aberystwyth, Wales, 2011.
117. Hald, A.B. Weed vegetation (wild flora) of long established organic versus conventional cereal fields inDenmark. Ann. Appl. Biol. 1999, 134, 307–314. [CrossRef]
118. Krauss, J.; Gallenberger, I.; Steffan-Dewenter, I. Decreased functional diversity and biological pest control inconventional compared to organic crop fields. PLoS ONE 2011, 6, e19502. [CrossRef]
119. Fuller, R.J.; Norton, L.R.; Feber, R.E.; Johnson, P.J.; Chamberlain, D.E.; Joys, A.C.; Mathews, F.; Stuart, R.C.;Townsend, M.C.; Manley, W.J.; et al. Benefits of organic farming to biodiversity vary among taxa. Biol. Lett.2005, 1, 431–434. [CrossRef]
120. Macfadyen, S.; Gibson, R.; Polaszek, A.; Morris, R.J.; Craze, P.G.; Planqué, R.; Symondson, W.O.; Memmott, J.Do differences in food web structure between organic and conventional farms affect the ecosystem service ofpest control? Ecol. Lett. 2009, 12, 229–238. [CrossRef]
121. Geiger, F.; Hegemann, A.; Gleichman, M.; Flinks, H.; de Snoo, G.R.; Prinz, S.; Tieleman, B.I.; Berendse, F.Habitat use and diet of Skylarks (Alauda arvensis) wintering in an intensive agricultural landscape ofthe Netherlands. J. Ornithol. 2014, 155, 507–518. [CrossRef]
122. Sugiyama, A.; Vivanco, J.M.; Jayanty, S.S.; Manter, D.K. Pyrosequencing assessment of soil microbialcommunities in organic and conventional potato farms. Plant Dis. 2010, 94, 1329–1335. [CrossRef] [PubMed]
123. Rusch, A.; Bommarco, R.; Ekbom, B. Conservation biological control in agricultural landscapes. In Advancesin Botanical Research, 1st ed.; Academic Press: Cambridge, MA, USA, 2017; Volume 81, pp. 333–360.
124. Alfoeldi, T.; Fliessbach, A.; Geier, U.; Kilcher, L.; Niggli, U.; Pfiffner, L.; Stolze, M.; Willer, H. Organicagriculture and the environment. In Organic Agriculture, Environment and Food Security; El-Hage Scialabba, N.,Hattam, C., Eds.; Environment and Natural Resources Series 4; Food and Agriculture Organisation ofthe United Nations (FAO): Rome, Italy, 2002.
125. Patt, J.M.; Hamilton, G.C.; Lashomb, J.H. Impact of strip-insectary intercropping with flowers on conservationbiological control of the Colorado potato beetle. Adv. Hortic. Sci. 1997, 175–181.
126. Alyokhin, A.; Porter, G.; Groden, E.; Drummond, F. Colorado potato beetle response to soil amendments:A case in support of the mineral balance hypothesis? Agric. Ecosyst. Environ. 2005, 109, 234–244. [CrossRef]
127. Sidauruk, L.; Sipayung, P. Cropping management on potato field, a strategy to suppress pest by increasinginsect diversity and natural enemies. In Proceedings of the International Conference on Agribussines, Food andAgro-Technology, Medan, Indonesia, 19–21 September 2018; IOP Publishing: Bristol, UK, 2018; Volume 205,p. 012026.
128. Dvorák, P.; Kuchtová, P.; Tomásek, J. Response of surface mulching of potato (Solanum tuberosum) on SPADvalue, Colorado potato beetle and tuber yield. Int. J. Agric. Biol. 2013, 15, 798–800.
89

Agriculture 2020, 10, 611
129. Brust, G.E. Natural enemies in straw-mulch reduce Colorado potato beetle populations and damage inpotato. Biol. Control 1994, 4, 163–169. [CrossRef]
130. Suja, G.; Sundaresan, S.; John, K.S.; Sreekumar, J.; Misra, R.S. Higher yield, profit and soil quality fromorganic farming of elephant foot yam. Agron 2012, 32, 755–764. [CrossRef]
131. Murphy, K.M.; Campbell, K.G.; Lyon, S.R.; Jones, S.S. Evidence of varietal adaptation to organic farmingsystems. Field Crops Res. 2007, 102, 172–177. [CrossRef]
132. Alyokhin, A.; Mota-Sanchez, D.; Baker, M.; Snyder, W.E.; Menasha, S.; Whalon, M.; Dively, G.; Moarsi, W.F.The Red Queen in a potato field: Integrated pest management versus chemical dependency in Coloradopotato beetle control. Pest Manag. Sci. 2015, 71, 343–356. [CrossRef]
133. Azfar, S.; Nadeem, A.; Basit, A. Pest detection and control techniques using wireless sensor network: A review.J. Entomol. 2015, 3, 92–99.
134. Shennan, C. Biotic interactions, ecological knowledge and agriculture. Philos. Trans. R. Soc. B 2008, 363, 717–739.[CrossRef]
Publisher’s Note: MDPI stays neutral with regard to jurisdictional claims in published maps and institutionalaffiliations.
© 2020 by the authors. Licensee MDPI, Basel, Switzerland. This article is an open accessarticle distributed under the terms and conditions of the Creative Commons Attribution(CC BY) license (http://creativecommons.org/licenses/by/4.0/).
90

agriculture
Article
Seasonal Phenology of the Major Insect Pests ofQuinoa (Chenopodium quinoa Willd.) and TheirNatural Enemies in a Traditional Zone and Two NewProduction Zones of Peru
Luis Cruces 1,2,*, Eduardo de la Peña 3 and Patrick De Clercq 2
1 Department of Entomology, Faculty of Agronomy, Universidad Nacional Agraria La Molina, Lima 12-056, Peru2 Department of Plants & Crops, Faculty of Bioscience Engineering, Ghent University, B-9000 Ghent, Belgium;
[email protected] Department of Biology, Faculty of Science, Ghent University, B-9000 Ghent, Belgium;
[email protected]* Correspondence: [email protected]; Tel.: +051-999-448427
Received: 30 November 2020; Accepted: 14 December 2020; Published: 18 December 2020
Abstract: Over the last decade, the sown area of quinoa (Chenopodium quinoa Willd.) has beenincreasingly expanding in Peru, and new production fields have emerged, stretching from the Andesto coastal areas. The fields at low altitudes have the potential to produce higher yields than thosein the highlands. This study investigated the occurrence of insect pests and the natural enemiesof quinoa in a traditional production zone, San Lorenzo (in the Andes), and in two new zones atlower altitudes, La Molina (on the coast) and Majes (in the “Maritime Yunga” ecoregion), by plantsampling and pitfall trapping. Our data indicated that the pest pressure in quinoa was higher atlower elevations than in the highlands. The major insect pest infesting quinoa at high densitiesin San Lorenzo was Eurysacca melanocampta; in La Molina, the major pests were E. melanocampta,Macrosiphum euphorbiae and Liriomyza huidobrensis; and in Majes, Frankliniella occidentalis was the mostabundant pest. The natural enemy complex played an important role in controlling M. euphorbiae andL. huidobrensis by preventing pest resurgence. The findings of this study may assist quinoa producers(from the Andes and from regions at lower altitudes) in establishing better farming practices in theframework of integrated pest management.
Keywords: quinoa; Eurysacca melanocampta; Macrosiphum euphorbiae; Liriomyza huidobrensis;Frankliniella occidentalis; natural enemies; IPM; Peru
1. Introduction
In the Andes of Peru, quinoa has mostly been cultivated as a staple crop by smallholders,with limited resources that do not allow them to use advanced agricultural technology. In thisecoregion, small-scale farming has largely been practiced, characterized by low inputs, the restricteduse of machinery and rain-fed irrigation [1,2]. However, in the last years, as a consequence of theincreasing demand for quinoa on the international markets and the resulting export boom and cropexpansion, farmer associations have been created. In turn, this has led to improvements in cropmanagement by the incorporation of agricultural machinery and technical assistance [3]. The productionof this Andean grain in the highlands is mostly organic, with a relatively low yield level that is partiallycompensated by the higher market price as compared with conventional quinoa [4,5].
This revalorization of quinoa motivated many farmers in the Andes to shift from staple crops(such as potato, corn and legumes) to quinoa but also gained attention of growers from regions at loweraltitudes (i.e., from the “Maritime Yunga” to the coastal areas) [2,5,6]. In these newly exploited areas,
Agriculture 2020, 10, 644; doi:10.3390/agriculture10120644 www.mdpi.com/journal/agriculture91
Agriculture 2020, 10, 644
small-, medium- and large-scale cultivation is practiced, characterized by the implementation ofrelatively advanced farming techniques including technified irrigation (especially in areas belongingto local irrigation projects such as “Majes-Siguas” and “Olmos” in the Arequipa and Lambayequedepartments, respectively) and the use of machinery, pesticides, fertilizers and, in some cases, modernequipment for spraying [4,7,8]. Therefore, the production of quinoa in these areas is mainly conventional,with higher yield levels than in the highlands [1,4,5].
A relatively long list of phytophagous insects has been reported to infest quinoa in the Andeanareas [7,9]. However, only the quinoa moths Eurysacca melanocampta (Meyrick) and Eurysaccaquinoae Povolný (Lepidoptera: Gelechiidae) are considered of major importance, while otherherbivorous species, including thrips and aphids, are generally considered of minor relevance [10,11].For the non-traditional areas of quinoa production, pest communities infesting the crop also includeE. melanocampta, as well as polyphagous insects such as the aphid Macrosiphum euphorbiae (Thomas)(Hemiptera: Aphididae), the thrips Frankliniella occidentalis Pergande (Thysanoptera: Thripidae),the leafminer fly Liriomyza huidobrensis (Blanchard) (Diptera: Agromyzidae) and the hemipteranpests Nysius simulans Stål (Hemiptera: Lygaeidae) and Liorhyssus hyalinus (Fabricius) (Hemiptera:Rhopalidae) [9]. Knowledge about the economic impact of the latter pests on quinoa production in thenewly exploited areas is, however, still scarce.
In this context, the present study aimed to explore the seasonal occurrence of the relevant insectpests on quinoa in two new production zones as compared to a traditional production area, by analysingtheir incidence in the crop, as a function of the presence of their natural enemies, environmental factorsand the farming practices specific to each region. The findings of this study should be of interestfor local quinoa growers for improving their pest management practices and also for other farmerswho intend to explore new areas for quinoa production in Peru and other countries that share similarpest complexes.
2. Materials and Methods
2.1. Field Sites
The study was carried out in three areas of Peru: a traditional quinoa production zone (San Lorenzo;11◦50′33” S, 75◦22′45” W, 3322 m above sea level [m a.s.l.]) located in the Andean region, and twonon-traditional quinoa production areas, one located on the coast (La Molina; 12◦06′ S, 76◦57′ W,244 m a.s.l.) and the other in the “Maritime Yunga” region (Majes; 16◦21′31” S, 72◦17′16” W, 1410 m a.s.l.)(Figure S1).
The monitored fields were cultivated under conventional farming practices. The field sites inthe localities of La Molina and San Lorenzo belong to the experimental and production fields ofthe National Agrarian University La Molina, whereas the field site assessed in Majes belongs toa private farmer. The characteristics of each field site and the cultivation and pest managementspecifications are given in Table 1. Meteorological data for the three localities can be found inSupplementary Figure S2.
92
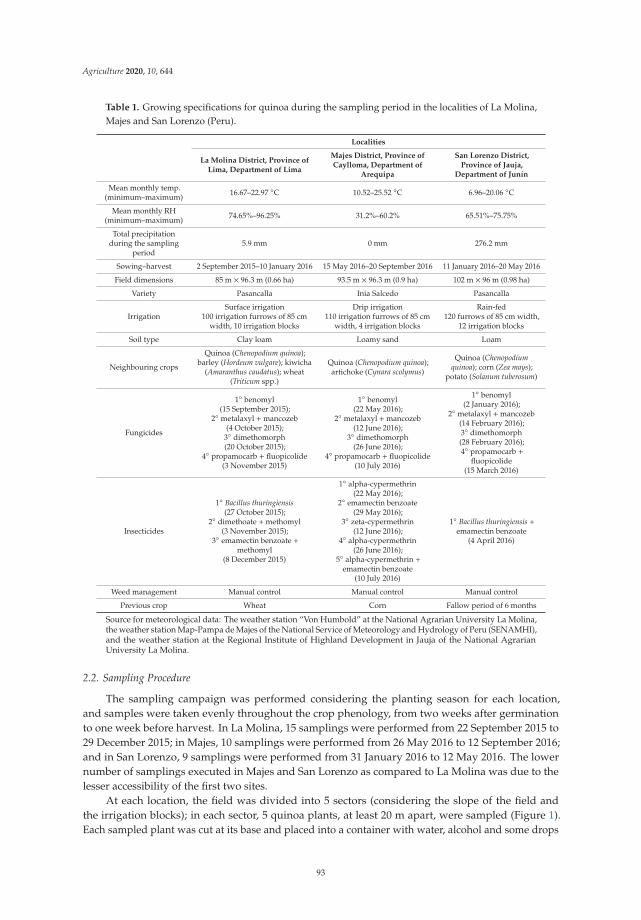
Agriculture 2020, 10, 644
Table 1. Growing specifications for quinoa during the sampling period in the localities of La Molina,Majes and San Lorenzo (Peru).
Localities
La Molina District, Province ofLima, Department of Lima
Majes District, Province ofCaylloma, Department of
Arequipa
San Lorenzo District,Province of Jauja,
Department of Junín
Mean monthly temp.(minimum–maximum) 16.67–22.97 ◦C 10.52–25.52 ◦C 6.96–20.06 ◦C
Mean monthly RH(minimum–maximum) 74.65%–96.25% 31.2%–60.2% 65.51%–75.75%
Total precipitationduring the sampling
period5.9 mm 0 mm 276.2 mm
Sowing–harvest 2 September 2015–10 January 2016 15 May 2016–20 September 2016 11 January 2016–20 May 2016
Field dimensions 85 m × 96.3 m (0.66 ha) 93.5 m × 96.3 m (0.9 ha) 102 m × 96 m (0.98 ha)
Variety Pasancalla Inia Salcedo Pasancalla
IrrigationSurface irrigation
100 irrigation furrows of 85 cmwidth, 10 irrigation blocks
Drip irrigation110 irrigation furrows of 85 cm
width, 4 irrigation blocks
Rain-fed120 furrows of 85 cm width,
12 irrigation blocks
Soil type Clay loam Loamy sand Loam
Neighbouring crops
Quinoa (Chenopodium quinoa);barley (Hordeum vulgare); kiwicha
(Amaranthus caudatus); wheat(Triticum spp.)
Quinoa (Chenopodium quinoa);artichoke (Cynara scolymus)
Quinoa (Chenopodiumquinoa); corn (Zea mays);
potato (Solanum tuberosum)
Fungicides
1◦ benomyl(15 September 2015);
2◦ metalaxyl +mancozeb(4 October 2015);
3◦ dimethomorph(20 October 2015);
4◦ propamocarb + fluopicolide(3 November 2015)
1◦ benomyl(22 May 2016);
2◦ metalaxyl +mancozeb(12 June 2016);
3◦ dimethomorph(26 June 2016);
4◦ propamocarb + fluopicolide(10 July 2016)
1◦ benomyl(2 January 2016);
2◦ metalaxyl +mancozeb(14 February 2016);3◦ dimethomorph(28 February 2016);4◦ propamocarb +
fluopicolide(15 March 2016)
Insecticides
1◦ Bacillus thuringiensis(27 October 2015);
2◦ dimethoate +methomyl(3 November 2015);
3◦ emamectin benzoate +methomyl
(8 December 2015)
1◦ alpha-cypermethrin(22 May 2016);
2◦ emamectin benzoate(29 May 2016);
3◦ zeta-cypermethrin(12 June 2016);
4◦ alpha-cypermethrin(26 June 2016);
5◦ alpha-cypermethrin +emamectin benzoate
(10 July 2016)
1◦ Bacillus thuringiensis +emamectin benzoate
(4 April 2016)
Weed management Manual control Manual control Manual control
Previous crop Wheat Corn Fallow period of 6 months
Source for meteorological data: The weather station “Von Humbold” at the National Agrarian University La Molina,the weather station Map-Pampa de Majes of the National Service of Meteorology and Hydrology of Peru (SENAMHI),and the weather station at the Regional Institute of Highland Development in Jauja of the National AgrarianUniversity La Molina.
2.2. Sampling Procedure
The sampling campaign was performed considering the planting season for each location,and samples were taken evenly throughout the crop phenology, from two weeks after germinationto one week before harvest. In La Molina, 15 samplings were performed from 22 September 2015 to29 December 2015; in Majes, 10 samplings were performed from 26 May 2016 to 12 September 2016;and in San Lorenzo, 9 samplings were performed from 31 January 2016 to 12 May 2016. The lowernumber of samplings executed in Majes and San Lorenzo as compared to La Molina was due to thelesser accessibility of the first two sites.
At each location, the field was divided into 5 sectors (considering the slope of the field andthe irrigation blocks); in each sector, 5 quinoa plants, at least 20 m apart, were sampled (Figure 1).Each sampled plant was cut at its base and placed into a container with water, alcohol and some drops
93

Agriculture 2020, 10, 644
of liquid detergent. After taking five plants per sector, they were carefully chopped into small pieces,and the whole sample (including the liquid content) was transferred to a labelled, airtight container tobe transported to the laboratory for further processing. Plants from borders were always avoided forsampling. During collection, care was taken to minimize the disturbance of any insects present onthe plant.
Figure 1. Sectorization and sampling scheme applied to the monitored fields. Transversal lines representthe direction of the furrows.
To complement the analysis, the epigeous insects were examined throughout the crop phenologywith ten pitfall traps (transparent, � 10 cm, 10% ethylene glycol, water and detergent) and 2 traps persector (Figure 1), which were left during the whole crop phenology (from one week after germinationto one week before harvest). The pitfall trap content was periodically collected on the same day whenthe quinoa plants were sampled.
2.3. Sample Processing and Identification
All samples were processed at the laboratories of the Museum of Entomology “Klaus Raven Büller”of the National Agrarian University La Molina, in Lima, Peru, where the collected specimenswere deposited.
The recipients containing the sampled plants and pitfall trap samples were poured onto a1 mm mesh sieve and carefully washed with water, removing larger materials, except for the leaveswith mines; these were later examined under a binocular stereoscope (Carl Zeiss, Stemi 508 LAB,Zeiss, Jena, Germany) to remove the leafminer larvae and/or their parasitoids. The remaining samples(i.e., the collected insect specimens) were transferred to labelled glass vials containing 75% v/v ethanolfor conservation and further processing (i.e., identification).
The specimens were sorted on the basis of morphological characteristics as morphospecies. For thehemimetabolous insects, adults and nymphs were taken into account, but for holometabolous insects,only the harmful stages (larvae and/or adults) were considered in the study. For the aphids, mummifiedspecimens were also considered, to calculate the parasitism level based on the number of parasitizedaphids and the total number of aphids collected. For the leafminers, the parasitism level was calculatedbased on the number of parasitoids and leafminer larvae extracted from the mines.
When feasible, the most relevant morphospecies (taking into account abundance and functionalbehaviour) were identified at the genus and species levels, with the help of taxonomic keysand morphological descriptions provided in the literature as follows: for Aphididae spp. [12,13],
94
Agriculture 2020, 10, 644
Aphidiinae spp. [14–17], Allograpta exotica (Wiedemann) [18], Blennidus peruvianus (Dejean) [19–22],Diabrotica sicuanica Bechyne [23], Epitrix spp. [24], Eulophidae genera [25], E. melanocampta [26],Geocoris spp. [27], Halticoptera sp. [28], Heterotrioza chenopodii (Reuter) [29], L. hyalinus [30,31],L. huidobrensis [32,33], Nabis capsiformis Germar [34], N. simulans [35] and Russelliana solanicolaTuthill [36,37].
Molecular tools were applied for identifying and/or confirming the species Lysiphlebus testaceipes(Cresson), Aphidius matricariae Haliday, Aphidius colemani Viereck, Aphidius rosae Haliday, Aphidiusavenae Haliday, Aphidius ervi Haliday, F. occidentalis, L. huidobrensis, L. hyalinus, M. euphorbiae andRhopalosiphum rufoabdominale (Sasaki). DNA extraction and PCR procedures were performed in theLaboratory of Agrozoology, Department of Plants and Crops at Ghent University, Belgium, followingspecific protocols provided in the literature [38–42]. Specimens of Epitrix sp., Macrosiphum sp., Myzus sp.,Therioaphis sp., Geocoris sp., Chrysocharis sp., Halticoptera sp., Diglyphus sp. and Closterocerus sp. couldnot reliably be identified at the species level, either morphologically (since this is only confirmed by aspecialist of the corresponding taxa) or based on molecular methods.
Expert taxonomists assisted by identifying and/or confirming certain species: H. chenopodiiand R. solanicola were identified by Daniel Burckhardt from the the Naturhistorisches Museum ofSwitzerland; the dolichopodids were identified by Daniel Bickel from the Australian Museum; Astylussubannulatus Pic was identified by Robert Constantin from the Entomological Society of France;N. simulans was identified by Pablo Dellapé from the Museo de La Plata in Argentina.
2.4. Data Analysis
For the most relevant species (major pests and their natural enemies), curves of seasonal occurrencewere built to analyse the pest–natural enemy interactions, which were interpreted in the context ofeach scenario (i.e., the environmental factors and the agricultural practices at each field site).
The statistical analyses were performed using the R software, version 3.4.2 [43] (packages: vegan,agricolae, and MASS) [44–46].
For the population comparisons, a one-way ANOVA was applied to the data after having testedthe normality and homoscedasticity through Shapiro–Wilk and Bartlett tests, respectively. When thedata did not meet the assumption of the homogeneity of variances, the Box–Cox transformation methodwas used to stabilize the variances. When the ANOVA was significant, Tukey’s honestly significantdifference test was used to compare the groups. All the tests were analysed at the significance level ofα = 0.05.
3. Results
3.1. Abundance and Diversity of Phytophagous Insects
The plant samplings throughout the crop phenology at the field site in La Molina yielded 24morphospecies of phytophagous species, among which M. euphorbiae, E. melanocampta, F. occidentalis,L. huidobrensis and H. chenopodii encompassed 99.1% of the total abundance of herbivorous insects. Atthe field site in Majes, 12 morphospecies of phytophagous insects were found, including F. occidentalis,Myzus sp. and Macrosiphum sp., encompassing 99.2% of the total abundance of herbivorous insects.The hemipteran pests L. hyalinus and N. simulans, which were recently reported to be causing severedamage in newly exploited areas for quinoa production [7,8], were found at low densities at thesetwo localities. Finally, in San Lorenzo, 16 morphospecies of phytophagous insects were found,with F. occidentalis, E. melanocampta, Myzus sp., Macrosiphum sp. and H. chenopodii accounting forup to 97.3% of the total abundance of herbivores. At this locality, A. subannulatus, D. sicuanica andEpitrix sp., which are mentioned in the literature as minor pests of quinoa [7,10,23], were collected invery small numbers.
Rank–abundance curves of phytophagous insects were built as a function of their abundance in thesamplings at each field site (Figure 2). Comparatively, the curve for the San Lorenzo field site (SL) has a
95

Agriculture 2020, 10, 644
less pronounced slope than the curves for the other sites. This suggests that the phytophagous speciesare more evenly distributed at this locality or there was a lower dominance of the most abundant pestsas compared to at the La Molina and Majes field sites, which were characterized by a higher dominanceof certain taxa.
Figure 2. Rank–abundance curve of the phytophagous insects that infested the quinoa crop inSan Lorenzo, Majes and La Molina (log series distribution).
3.2. Phenology of Phytophagous Insects of Economic Importance
3.2.1. Quinoa Moth
At the field site in La Molina, the seasonal occurrence curve of E. melanocampta (Figure 3A),based on the number of larvae per plant, had two peaks throughout the crop phenology. The first peakoccurred on 3 November 2015, with an average of 7.9 individuals per plant; this was controlled with theinsecticide treatment dimethoate +methomyl (Table 1), from which the pest later resurged. The secondpeak occurred on 8 December 2015, with up to 65.6 specimens per plant on average; this infestationwas managed with emamectin benzoate +methomyl, leading to a marked suppression of this pest.The first spraying with Bacillus thuringiensis var. kurstaki performed on 27 October 2015 against a lowpopulation of this moth had little effect.
96

Agriculture 2020, 10, 644
Fig
ure
3.
Seas
onal
inci
denc
eof
the
mai
nin
sect
pest
s(m
ean
num
ber
per
plan
tor
pitf
allt
rap±S
D)a
ndth
eir
asso
ciat
edna
tura
lene
mie
s(m
ean
num
ber
per
plan
tor
perc
entp
aras
itism
)sam
pled
onqu
inoa
atth
efie
ldsi
tes
in(A
)La
Mol
ina,
Lim
a(f
rom
22Se
ptem
ber2
015
to29
Dec
embe
r201
5);(
B)M
ajes
,Are
quip
a(f
rom
15M
ay20
16to
12Se
ptem
ber
2016
);an
d( C
)San
Lore
nzo,
Juní
n(f
rom
31Ja
nuar
y20
16to
12M
ay20
16).
Arr
ows
onth
etim
eax
isin
dica
teth
etim
ing
ofth
ein
sect
icid
eap
plic
atio
ns.
97
Agriculture 2020, 10, 644
Caterpillars of this species were scarcely observed in Majes, likely due to the constant treatmentswith broad-spectrum insecticides during the first 60 days of the cropping season.
At the field site in the traditional quinoa production locality, San Lorenzo, the occurrence ofE. melanocampta larvae had its maximum number on 4 April 2016 (Figure 3C). The caterpillars startedto infest the plants 43 days after sowing (24 February 2016) and progressively increased in number upto 15.1 larvae per plant, on average. At this point, they were controlled with emamectin benzoate + B.thuringiensis var. kurstaki, which efficiently reduced the larval incidence thereafter.
With regard to the environmental variables (Figure S2), in San Lorenzo, the rain had a notoriouseffect on the establishment of this moth in the field, since the infestation began only after the rainingperiod had finished (at the end of February). Minimum temperatures that mostly ranged between 0 and10 ◦C likely also had an effect on the moth, slowing down its incidence. Contrarily, precipitation at thelocality of La Molina was scarce, and the temperature was quite stable throughout the cropping season,with small differences between the maximum and minimum; thus, the interaction between theseenvironmental factors and E. melanocampta incidence was not evident. Additionally, no specializednatural enemies of E. melanocampta, such as parasitoids, were observed during the sampling campaign,either at La Molina or at San Lorenzo.
The mean density of E. melanocampta larvae sampled on the plants at La Molina and San Lorenzoover the total sampling period was compared. After applying the Box–Cox transformation method(γ = −0.5) to the data, the ANOVA indicated that the overall larval density was significantly higher inLa Molina than in San Lorenzo (F1,8 = 31.46, p < 0.001).
3.2.2. Aphid–Natural Enemy Complex
The infestation by aphids at the field sites was related to more than one species: At the locality ofLa Molina, a high incidence of M. euphorbiae (99.2%) and scarcely any R. rufiabdominale (0.2%) were found;in Majes, Myzus sp. (77.3%) and Macrosiphum sp. (22.7%) were observed; and in San Lorenzo, the aphidcomplex consisted of Myzus sp. (55.7%), Macrosiphum sp. (42.8%) and Therioaphis sp. (1.5%).
The seasonal occurrence curve of M. euphorbiae, based on the number of aphids per plant, had twopeaks in La Molina (Figure 3A). The first occurred on 3 November 2015, with the highest recordedpopulation (162.3 individuals per plant on average), promoting the development of sooty mould onthe leaves as a consequence of their honeydew secretion; this infestation was controlled efficiently withmethomyl + dimethoate. The second peak occurred on 24 November 2015 (with 44.8 specimens perplant on average), but at this point, no insecticide was used, so the corresponding reduction of theaphid population in the following days may, in part, be explained by the action of the natural enemies,especially chrysopid larvae, the population of which increased in this period.
According to seasonal changes in the aphid abundance in La Molina, a temporal succession in thenumerical response of the aphidophagous guilds was observed (Figure 3A). Larvae of the predatorysyrphid A. exotica first appeared, with peak numbers in the early developmental period of the aphidpopulation, followed by aphidiine wasps but with a maximum parasitism level of only 2.5%; at the laterphases of the crop, chrysopid larvae were found again. Wasps of the Aphidiinae complex collected inthe pitfall traps consisted of L. testaceipes (Cresson), A. matricariae and A. colemani.
In Majes, the incidence of Aphididae was very low during the first 60 days after sowing(15 September 2016–14 July 2016), probably due to the intensive insecticide treatments applied inthe early stages of the crop. From then onwards, the infestation continuously grew, reaching up to22.5 individuals per plant on average (on 31 August 2016), followed by a decrease that may, in part,be explained by the action of predators such as chrysopid and coccinellid larvae, and parasitism byAphidiinae wasps (Figure 3B). When examining the specimens belonging to this group collected in thepitfall traps at Majes, the complex was formed by A. colemani, A. ervi, A. avenae and A. rosae.
Contrarily to the field site in La Molina, syrphids were absent in Majes, and the most abundantaphidophagous group was the Aphidiinae wasp complex. These appeared in the early stages ofthe crop, but their establishment became more significant after the period of insecticide treatments,
98
Agriculture 2020, 10, 644
during the grain formation and maturation, with a maximum parasitism level of 13.5%. Coccinellidand chrysopid larvae appeared in small numbers, also at the end of the crop phenology (Figure 3B).
At the field site in San Lorenzo, the incidence of the Aphididae was considerably lower thanin La Molina, amounting to only 7.1 specimens per plant, on average (Figure 3C). Given this lowinfestation, no pesticide treatment was applied against the aphids and the spraying with emamectinbenzoate + B. thuringiensis targeted against E. melanocampta larvae had no visible effects on theAphididae. Based on the number of aphid specimens sampled per plant, there was a quite stablepopulation density until 84 days after sowing (4 April 2016), followed by a slight increase.
When juxtaposing the environmental variables (Figure S2) and the aphid occurrence, only in SanLorenzo can a certain interaction be observed: for example, the aphid establishment at the beginningof the crop phenology only prospered when the rains subsided; also, the large differences between themaximum and minimum temperatures and chilling conditions in the period from 28 April 2016 to4 May 2016 coincided with a decrease in the aphid population. These factors may also have affected theabundance of the natural enemies since only a single larva of Syrphidae and six larvae of Chrysopidaewere collected throughout the crop phenology, and the maximum parasitism level reached no morethan 7.2% during the cropping season (Figure 3C). In this locality, A. colemani and Aphidius sp. wererecorded in the pitfall traps.
The mean overall densities of Aphididae at the three localities were compared. After applying theBox–Cox transformation method (γ = 0.1) to the data, the ANOVA indicated that there were highlysignificant differences between the localities (F2,12 = 146.4, p < 0.001). Tukey’s HSD test indicated thatthe aphid density in La Molina was significantly higher than in San Lorenzo (p < 0.001) and Majes(p < 0.001), the latter locality having a significantly higher aphid incidence than San Lorenzo (p = 0.033).
3.2.3. Leafminer Flies and Natural Enemy Complex
Adults and larvae of L. huidobrensis were found in considerable abundance only in La Molina,and therefore, the seasonal occurrence of this species was analysed in detail only for this locality.Since the adults of leafminer flies are very active and easily disturbed, they could not be efficientlysampled by way of the plant sampling, and therefore, the collected adult data were excludedfrom analysis.
The seasonal occurrence of L. huidobrensis had a maximum number of 3.3 larvae per plant(Figure 3A). This infestation level was reduced by the treatment with methomyl + dimethoate targetedagainst aphids on 3 November 2015. Later, the parasitoid complex, formed mainly by eulophidsand pteromalids [47], had an important role in decreasing the leafminer population, with parasitismreaching up to 100% (Figure 3A).
When examining the specimens collected in the pitfall trap sampling, the following leafminerfly parasitoids were recorded: two species of Pteromalidae (Halticoptera sp.1 and Halticoptera sp.2)and seven of Eulophidae (Chrysocharis sp.1, Chrysocharis sp.2, Diglyphus sp.1, Closterocerus sp.1,Cirrospilus sp.1 and two non-identified taxa). From this complex, Halticoptera sp.1 and Chrysocharis sp.2were present in markedly larger numbers than the others.
3.2.4. Hemipteran Pests
The rhopalid L. hyalinus was only collected in the non-traditional quinoa production localitiesLa Molina and Majes, but in small numbers. In the first locality, only six specimens of this specieswere found, in the last plant sampling. In Majes, the population size was greater and focused in thegrain filling stage (Figure 3B), although the mean density of this bug on the plants never surpassed0.68 specimens per plant, with a large standard deviation, suggesting that the spatial distribution ofthis species in the crop is not uniform but clumped.
The lygaeid N. simulans was also collected only at the localities of La Molina and Majes. Since thisspecies has a primarily soil-surface-dwelling behaviour, the seasonal occurrence was analysed,contrasting the population found on the plants with the specimens collected in the pitfall traps.
99

Agriculture 2020, 10, 644
In La Molina, the population of N. simulans at ground level was characterized by a considerableincrease from the grain filling stage onwards, and the insect started to inhabit the plants around thephysiological maturation stage (Figure 3A). The field eventually had a strong outbreak of this bugfrom the harvest cut to the day of threshing; unfortunately, the population size at that time could notbe recorded because the last sampling was performed one week before cutting. Since the cut plantswere lying on the soil surface during 10 days for drying, this greatly favoured the infestation of quinoaby N. simulans.
In Majes, the occurrence of N. simulans at the soil level remained low until the grain filling stage,when the bugs also started to infest the plant; from then onwards, the population constantly increased,reaching up to 4.9 individuals per pitfall trap, on average, in the last sampling. On the plant,the population size remained small, reaching only 0.32 individuals per plant, on average, in the lastsampling (Figure 3B).
3.2.5. Western Flower Thrips
The seasonal occurrence curve of F. occidentalis in La Molina was characterized by two peaks(Figure 3A). The first occurred on 3 November 2015, reaching only 4.5 individuals per plant on average,but the infestation was likely reduced by the insecticide treatment (methomyl + dimethoate) targetedagainst the aphids and E. melanocampta. The second peak occurred on 8 December 2015, reaching 5.2individuals per plant on average, whereafter the thrips incidence was likely reduced by the insecticidetreatment (methomyl + emamectin benzoate) applied to control E. melanocampta. These pesticidesprayings may have obscured the interactions between the thrips and certain generalist natural enemiessuch as N. capsiformis and chrysopids found in the samplings.
The seasonal occurrence curve of F. occidentalis in Majes had an exponential shape, reaching up to198 thrips per plant on average, in the last sampling. The population at the early stage of the cropphenology was small, probably due to the intensive use of insecticide during this phase. Thereafter,the infestation had a continuous increase, suggesting that there were few restrictive factors for thepopulation growth during the monitored period; thus, natural enemies such as chrysopid larvaeappeared to have had little effect on the thrip infestation (Figure 3B).
The seasonal occurrence of F. occidentalis in San Lorenzo had a maximum number of up to41.7 thrips per plant on average (Figure 3C). It is likely that the minimum temperatures between28 April 2016 and 4 May 2016, with values going down to 0 ◦C, had a detrimental effect on this pest(Figure S2).
The mean densities of the F. occidentalis per plant sampling at the three field sites were compared.After applying the Box–Cox transformation method (γ = 0.1) to the data, the ANOVA indicatedthat there were highly significant differences between the localities (F2,12 = 226.8, p < 0.001). Tukey’sHSD test showed that the thrips density in Majes was overall significantly higher than in La Molina(p < 0.001) and San Lorenzo (p < 0.001); the density at the latter site was significantly greater than at LaMolina (p < 0.001).
4. Discussion
The survey at the field in San Lorenzo confirmed the relevance of E. melanocampta for quinoa inthe Andes of Peru, which is deemed, in the literature, to be the crop’s key pest [10,48,49]. Likewise,the findings in La Molina shed light on the importance of this moth at the coastal level, a newlyexploited region for quinoa production [7], and revealed that polyphagous insects such as M. euphorbiaeand L. huidobrensis may infest quinoa plants in high densities. Nonetheless, similar observationscould not be made in Majes, where pest insects were scarcely collected in the early stages of the crop,likely due to the pest management scheme (Table 1), and only the population of the cosmopolitan pestF. occidentalis prospered in high densities when the insecticide sprayings stopped.
In the highlands of Peru, most of the cultivated quinoa is rain-fed irrigated. For this reason,farmers only cultivate the crop during the raining season, being forced to have a fallow period [1].
100

Agriculture 2020, 10, 644
In this context, E. melanocampta may have two generations in the Andean region [50]; the first occursbetween November and December in early sowings, and the second is between March and Aprilfor late sowings, the latter coinciding with the period during which this moth infested the crop inSan Lorenzo. In Majes and La Molina (like other coastal areas), farmers do not depend on the rain forirrigation, and they can sow quinoa at almost any time, so several generations of this moth may developthroughout the year in these valleys. Under this pattern of E. melanocampta incidence, designing pestmanagement strategies for quinoa in the Andes is more feasible than in the non-traditional quinoaproduction zones, such as Majes and La Molina, unless farmers of the latter valleys take into accountthe organization of their sowing periods when setting up integrated pest management (IPM) schemes.
To better understand the impact of the incidence of E. melanocampta at the studied field sites, we referto the economic threshold level of 3 to 15 larvae per plant, as suggested in previous studies [51,52].Whereas in San Lorenzo, the infestation by this pest reached levels of up to 15 larvae per plant in40 days (from 24 January 2016 to 4 April 2016), in La Molina, by only 21 days (from 17 November 2015to 8 December 2016), even higher levels were attained (with up to 65 larvae per plant on average),exceeding, by far, the said threshold. According to Villanueva [52], the occurrence of 30 larvae perquinoa plant may cause a 58.8% yield loss, whereas 70 larvae per plant could lead to an 85% loss.
One environmental factor that likely played a key role for E. melanocampta infestation is temperature.Previous observations pointed out that the pest’s biological cycle is shortened from 75 to 28 days as thetemperature increases from 20 to 24 ◦C [50]. In San Lorenzo, the mean monthly temperature oscillatedbetween 14.4 and 15.3 ◦C, with large differences between the maximum and the minimum (up to 18 ◦Con average), which may have slowed down the development of the moth. Conversely, in La Molina,where the mean monthly temperature ranged from 19.4 to 21.6 ◦C (with maxima of up to 29.4 ◦C),the differences between the maximum and minimum temperatures did not exceed 7 ◦C, meeting theconditions for this pest to develop more generations throughout the cropping season; this may explain,in part, the higher incidence at this location as compared to San Lorenzo.
Aphids are considered secondary or occasional pests of quinoa in the Andes of Peru and Bolivia [49],probably because their damage has been hard to pin down in terms of yield reduction or economiclosses due to their overall low population density in the fields [53]. The environmental variables in thehighlands are often unfavourable for their population build up (i.e., rains, chilling temperatures andlarge differences between the minimum and maximum temperatures). For example, in San Lorenzo,the minimum temperature during the cropping season dropped to 0.1 ◦C, which is detrimental toaphid populations, which are considered in the chill-susceptible group, with “pre-freeze mortality”being the dominant cause of death at low temperatures [54]. Contrariwise, the field site in La Molinahad favourable conditions of temperature and relative humidity for the aphids to thrive (with upto 162 specimens per plant on average) [55]. With respect to Majes, the intensive use of insecticidesduring the first stages of the crop phenology and low incidence of the aphids at later stages did notallow revealing any such relation between climate and aphid populations.
Quinoa harbours an important diversity of natural enemies [9], including aphidophagousinsects [11]. However, this beneficial fauna is likely also affected by the unfavourable climate inSan Lorenzo or the intensive insecticide treatments in Majes. These conditions appeared to haveimpaired the predatory group to a somewhat higher degree than the parasitoids, given that Aphidiinaewasps were collected in these two localities with parasitism levels of up to 13.5% in the first locality and6.1% in the second, whereas the aphidophagous predators in San Lorenzo were scarce, and in Majes,they only developed once the pesticide spraying had finished. These observations could be explained,in part, due to the fact that the developed larvae of parasitoids inside the host integument are, to somedegree, protected from pesticide sprays, and part of the population inside the aphid mummy stagemay experience a functional refuge [56].
In La Molina, more aphidophagous insects (in terms of abundance) were found than in the othertwo localities. A temporal succession in their occurrence was observed, which is related to theirdegree of feeding specialization: the aphid specialists (Aphidiinae wasps and predatory syrphid
101
Agriculture 2020, 10, 644
larvae) appeared in the early stages of infestation by M. euphorbiae, whereas the more generalistChrysopidae larvae appeared at later stages [57–59]. The effectiveness of these natural enemies,however, was likely perturbed by the insecticide applications. For example, the first spraying at55 days after sowing with B. thuringiensis to control E. melanocampta may have had detrimentaleffects on A. exotica larvae, given that after this treatment, the increasing trajectory of their seasonaloccurrence curve shifted to a decreasing trend, with a population reduction of around 42%. AlthoughHorn [60] found, on collards, that aphidophagous Syrphidae were reduced by a treatment withB. thuringiensis var. kurstaki, more studies are needed to clarify the potential risks of the use ofB. thuringiensis for syrphid larvae.
The second treatment at the field site in La Molina with the insecticides dimethoate and methomylwas also detrimental to the syrphid larval population, likely due to both direct toxicity [61] anda reduction in its aphid prey populations. Larval populations of chrysopids appeared after thisinsecticide treatment; being the predominant aphid predators at the later stages of the crop, they mayhave played an important role in keeping the aphids at a low density for some time after this spraying.
Thrips are also considered to be a secondary pest of quinoa, and there are no substantiated reportsof significant yield reductions [53,62]. However, the seasonal occurrence patterns of F. occidentalisobserved in Majes suggested that under favourable conditions, the thrips may infest the crop in anexponential way, reaching high levels of up to 191 thrips per plant on average. Considering thatF. occidentalis possesses the basic characteristics for the fast development of pesticide resistance (a shortgeneration time, high fecundity and haplodiploid breeding system) [63], and pyrethroid insecticidesare being widely used in Majes [8], it is warranted to monitor the development of resistance in localpopulations of F. occidentalis to insecticides belonging to this chemical group. This would allow theimplementation of proper insecticide resistance management by local farmers.
L. huidobrensis is another polyphagous pest that infested quinoa at relatively high densities (up to3.36 larvae per plant) at the La Molina field site at mid stage of the crop phenology. The insecticidetreatment on 9 November 2015 with dimethoate + methomyl markedly reduced the leafminerinfestation. In the later stages of the crop, the temperature may have become less favourable (reachingup to 29 ◦C), preventing the pest from resurging. Previous studies indicate that high temperatures(25–30 ◦C) negatively influence the oviposition capacity of L. huidobrensis [64]. Conversely, the parasitoidcomplex of L. huidobrensis appears to be favoured by this range of temperatures [65–67]. Consequently,the seasonal occurrence of the parasitoids might have led to an effective control of the leafminerpopulations, with up to 100% parasitism (as the season became warmer), preventing L. huidobrensisfrom resurging. The occurrence of the parasitoid species in the field followed a similar pattern as inprevious observations in potatoes in La Molina, where Halticoptera and Chrysocharis were the mostabundant genera and, sporadically, Diglyphus, Closterocerus and Ganaspidium species were collected [65].
L. hyalinus and N. simulans have been reported as infesting quinoa in large numbers in thedepartments of Lambayeque and Lima at the coastal level and in Arequipa in the “Maritime Yunga”region of Peru [7,8]. These hemipteran pests were observed causing severe damage to quinoa in thelast months of 2013, throughout 2014 and in the first semester of 2015, during which some farmersadmitted the overuse of pesticides even during the grain maturation stage [8]. Although no high levelof infestation was registered in the present study, vigilance should be maintained, particularly whenconsidering that the nymphs and adults of these true bugs cause direct damage to the grains by theirpiercing–sucking feeding habit during the grain filling and maturation stages, when management byapplying insecticides increases the risk of residues on the harvested grains.
Producers may not be aware of N. simulans during the first stages of the crop because of itsterrestrial behaviour, cryptic appearance and minute size. Moreover, the traditional way of harvestingquinoa, which involves leaving the cut plants on the ground for drying before threshing, favoursN. simulans infestation. Another factor that promotes the pest’s incidence is its numerous host plants,encompassing a variety of crops and weeds, that allow them to find food in a wide variety of habitats [7].
102

Agriculture 2020, 10, 644
The strategy of pest control applied by the farmer at the field site in Majes followed a fixedschedule of treatments rather than a system based on the infestation level (the two first sprayingsbeing performed every 7 days after sowing and the remaining three treatments, every 14 days).These insecticide applications occurred only during the first 60 days of the crop phenology, in orderto reduce the risks of harvests being contaminated with chemical residues (E. Falconi, personalcommunication, May 2016, Majes). This management scheme appears to be used by most of the localquinoa growers, including also the recurrent use of pyrethroids [8]. This practice may be positivein terms of obtaining grains without residues, but the continuous use of active ingredients with thesame mode of action (i.e., alpha-cypermethrin and zeta-cypermethrin) may eventually lead to thedevelopment of pesticide resistance in some of the key pests [68,69]. Besides, the excessive use ofbroad-spectrum pesticides such as pyrethroids could cause harm to the environment [70] and have anegative impact on the natural enemy complex in quinoa [71].
Conversely, the insecticide use in San Lorenzo was more appropriate, given that the treatmentswere performed once the pest reached a certain threshold. Besides, selective insecticides (B. thuringiensis+ emamectin benzoate) were applied in a single treatment to control E. melanocampta. Nonetheless,this scheme does not reflect the general use of chemicals by farmers in the highlands growingconventional quinoa, who mainly use pesticides of the synthetic pyrethroid and organophosphatetypes [4,8,49]. Likewise, at the field site in La Molina, the pesticide treatments were also based on theinfestation level of the pests; here, however, a mix of selective and non-selective insecticides wereapplied at a very high level of infestation. The pest management strategies deployed in the threelocalities suggest the continued need for agricultural extension programmes in order to improve theuse of agrochemicals.
5. Conclusions
The present study examined the occurrence of the major insect pests of quinoa and their naturalenemies in a traditional production zone in the Andean region (San Lorenzo), and two non-traditionalareas for quinoa production in Peru at lower elevations (La Molina, on the Coast, and Majes, in the“Maritime Yunga” ecoregion). The data gathered by on-plant and pitfall sampling show that the pestpressure in quinoa is higher at the lower altitudes than in the highlands of Peru. Although there arebetter conditions in the non-traditional quinoa production zones for attaining higher yields than inthe Andean region, pests are likely to become an important barrier for successful quinoa production,a situation that may worsen if pesticides are incorrectly used. These are issues that farmers from Peru,and other South American countries, will eventually face when exploiting new production areas.Studies on the biology and ecology of the key species of pests and their natural enemies will aid inimplementing suitable pest control strategies for the crop. Particularly, additional studies are neededto clarify the potential risks of aphids and F. occidentalis for quinoa production, especially in thenon-traditional zones.
Supplementary Materials: The following are available online at http://www.mdpi.com/2077-0472/10/12/644/s1.Figure S1: Localities of La Molina, San Lorenzo and Majes in the map of Peru, Figure S2: Fluctuation of thedaily mean temperature (maximum and minimum) and daily precipitation during the sampling period inLa Molina–Lima, San Lorenzo–Junín and Majes–Arequipa.
Author Contributions: Conceptualization, L.C., E.d.l.P. and P.D.C.; methodology, L.C. and P.D.C.; investigation,L.C., E.d.l.P. and P.D.C.; formal analysis, L.C., E.d.l.P. and P.D.C.; data curation, L.C.; writing—original draftpreparation, L.C.; writing—review and editing, L.C., E.d.l.P. and P.D.C.; supervision, E.d.l.P. and P.D.C. All authorshave read and agreed to the published version of the manuscript.
Funding: This research was funded by THE PROJECT 2: “Development of Value Chains for BiodiversityConservation and Improvement of Rural Livelihoods”—Sub Project: Native Grains, VLIR-UOS IUC/UNALM.
Acknowledgments: We thank Daniel Burckardt from the Naturhistorisches Museum of Switzerland for confirmingthe identity of the psylloids and Pablo Dellapé from the Museum of La Plata in Argentina for confirming theidentity of Nysius simulans. We also thank the professors from the National Agrarian University La Molina inPeru; Luz Gómez, chief of the Cereals and Native Grain programme; and Clorinda Vergara, chief of the Museum
103
Agriculture 2020, 10, 644
of Entomology “Klaus Raven Büller” for the facilities and permits. Finally, we acknowledge VLIR-UOS/UNALMfor funding this study.
Conflicts of Interest: The authors declare no conflict of interest.
References
1. Gómez-Pando, L.; Mujica, A.; Chura, E.; Canahua, A.; Pérez, A.; Tejada, T.; Villantoy, A.; Pocco, M.;Gonzáles, V.; Ccoñas, W. Perú: Capítulo número 5.2. In Estado del Arte de la Quinua en el Mundo en 2013;Bazile, D., Bertero, D., Nieto, C., Eds.; FAO (Santiago de Chile) y CIRAD: Montpellier, France, 2014;pp. 450–461.
2. Gamboa, C.; Van den Broeck, G.; Maertens, M. Smallholders’ preferences for improved quinoa varieties inthe Peruvian Andes. Sustainability 2018, 10, 3735. [CrossRef]
3. Mercado, W.; Ubillus, K. Characterization of producers and quinoa supply chains in the Peruvian regions ofPuno and Junín. Sci. Agrope. 2017, 8, 251–265. [CrossRef]
4. Ministerio de Agricultura y Riego. Available online: file:///C:/Users/User/Downloads/boletin-quinua%20.pdf(accessed on 1 May 2020).
5. Bedoya-Perales, N.; Pumi, G.; Mujica, A.; Talamini, E.; Domingos Padula, A. Quinoa expansion in Peru andits implications for land use management. Sustainability 2018, 10, 532. [CrossRef]
6. Bedoya-Perales, N.; Pumi, G.; Talamini, E.; Domingos Padula, A. The quinoa boom in Peru: Will landcompetition threaten sustainability in one of the cradles of agriculture? Land Use Policy 2018, 79, 475–480.[CrossRef]
7. Cruces, L.; Callohuari, Y.; Carrera, C. Quinua: Manejo Integrado de Plagas. Estrategias en el Cultivo de QuinuaPara Fortalecer el Sistema Agroalimentario en la Zona Andina; Organización de las Naciones Unidas para laAlimentación y la Agricultura: Santiago, Chile, 2016; pp. 2–71.
8. Latorre, J. Is Quinoa Cultivation on the Coastal Desert of Peru Sustainable? A Case Study from Majes, Arequipa.Master’s Thesis, Aarhus University, Aarhus, Denmark, 2017.
9. Cruces, L.; de la Peña, E.; De Clercq, P. Insect diversity associated with quinoa (Chenopodium quinoa Willd.) inthree altitudinal production zones of Peru. Int. J. Trop. Insect Sci. 2020, 40, 955–968. [CrossRef]
10. Saravia, R.; Plata, G.; Gandarillas, A. Plagas y Enfermedades del Cultivo de Quinua; Fundación PROINPA:Cochabamba, Bolivia, 2014; pp. 9–76.
11. Valoy, M.; Reguilón, C.; Podazza, G. The potential of using natural enemies and chemical compounds inquinoa for biological control of insect pests. In Quinoa: Improvement and Sustainable Production; Murphy, K.S.,Matanguihan, J., Eds.; John Wiley & Sons, Inc.: Hoboken, NJ, USA, 2015; pp. 63–86.
12. Blackman, R.; Eastop, V. Aphids on the World’s Crops: An Identification and Information Guide, 2nd ed.; John Wiley& Sons Ltd.: Hoboken, NJ, USA, 2000; pp. 1–466.
13. Blackman, R.; Eastop, V. Aphids on the World’s Herbaceous Plants and Shrubs; John Wiley & Sons: Hoboken,NJ, USA, 2006; Volume 1, pp. 1–1020.
14. Stary, P. A review of the Aphidius species (Hymenoptera: Aphidiidae) of Europe. Annot. Zool. Bot. Bratisl.1973, 85, 1–85.
15. Carver, M.; Franzmann, B. Lysiphlebus Foerster (Hymenoptera: Braconidae: Aphidiinae) in Australia.Aust. J. Entomol. 2001, 40, 198–201. [CrossRef]
16. Kavallieratos, N.; Tomanovic, N.; Starý, P.; Nikic, V.; Petrovic-Obradovic, O. Parasitoids (Hymenoptera:Braconidae: Aphidiinae) attacking aphids feeding on Solanaceae and Cucurbitaceae crops in SoutheasternEurope: Aphidiine-aphid-plant associations and key. Ann. Entomol. Soc. Am. 2010, 103, 153–164. [CrossRef]
17. Kavallieratos, N.; Tomanovic, Ž.; Petrovic, A.; Jankovic, M.; Starý, P.; Yovkova, M.; Athanassiou, C.Review and key for the identification of parasitoids (Hymenoptera: Braconidae: Aphidiinae) of aphidsinfesting herbaceous and shrubby ornamental plants in Southeastern Europe. Ann. Entomol. Soc. Am.2013, 106, 294–309. [CrossRef]
18. Castro, V.; Araya, J. Clave de identificación de huevos, larvas y pupas de Allograpta (Diptera: Syrphidae)comunes en la zona central de Chile. Bol. Sanid. Veg. Plagas 2012, 38, 83–94.
19. Bousquet, Y. Illustrated Identification Guide to Adults and Larvae of Northeastern North American Ground Beetles(Coleoptera, Carabidae); Pensoft: Sofia, Bulgaria, 2010; pp. 58–306.
104
Agriculture 2020, 10, 644
20. Moret, P. Contribution à la connaissance du genre néotropical Blennidus Motschulsky, 1865. Bull. SociétéEntomol. Fr. 1995, 100, 489–500.
21. Moret, P. Clave de identificación para los géneros de Carabidae (Coleoptera) presentes en los páramos delEcuador y del sur de Colombia. Rev. Colomb. Entomol. 2003, 29, 185–190.
22. Straneo, S. Sul genere Blennidus Motschulsky 1865 (Col. Carabidae, Pterostichini). Boll. Mus. Reg. Sci. Nat. Torino1986, 4, 369–393.
23. Krysan, J.; Branson, T.; Schroeder, R.; Steiner, W., Jr. Elevation of Diabrotica sicuanica (Coleoptera:Chrysomelidae) to the species level with notes on the altitudinal distribution of Diabrotica species inthe Cuzco department of Peru. Entomol. News 1984, 95, 91–98.
24. Biondi, M.; D’Alessandro, P. Afrotropical flea beetle genera: A key to their identification, updated catalogueand biogeographical analysis (Coleoptera, Chrysomelidae, Galerucinae, Alticini). Zookeys 2012, 1–158.[CrossRef]
25. Key to the World Genera of Eulophidae Parasitoids (Hymenoptera) of Leafmining Agromyzidae (Diptera).Available online: https://keys.lucidcentral.org/keys/v3/eulophidae_parasitoids/ (accessed on 10 October 2018).
26. Povolny, D. Gnorimoschemini of Southern South America. II the genus Eurysacca (Lepidoptera Gelechiidae).Steenstrupia 1986, 12, 1–47.
27. Henry, T.; Dellapé, P.; de Paula, A. The big-eyed bugs, chinch bugs, and seed bugs (Lygaeoidea). In TrueBugs (Heteroptera) of the Neotropics; Panizzi, A., Grazia, J., Eds.; Springer: Dordrecht, The Netherlands, 2015;pp. 459–514.
28. Boucek, Z.; Rasplus, J. Illustrated Key to West-Palearctic Genera of Pteromalidae (Hymenoptera: Chalcidoidea);Institut National de la Recherche Agronomique (INRA): Versailles, Paris, France, 1991; pp. 22–113.
29. Horton, D.; Miliczky, E.; Lewis, T.; Cooper, W.; Waters, T.; Wohleb, C.; Zack, R.; Johnson, D.; Jensen, A.New North American records for the old world psyllid Heterotrioza chenopodii (Reuter) (Hemiptera: Psylloidea:Triozidae) with biological observations. Proc. Entomol. Soc. Wash. 2018, 120, 134–152. [CrossRef]
30. Göllner-Scheiding, U. Revision der gattung Liorhyssus Stål, 1870 (Heteroptera, Rhopalidae). Dtsch. Entomol. Z.1976, 23, 181–206. [CrossRef]
31. Cornelis, M.; Quiran, E.; Coscaron, M. The scentless plant bug, Liorhyssus hyalinus (Fabricius) (Hemiptera:Heteroptera: Rhopalidae): Description of immature stages and notes on its life history. Zootaxa 2012, 3525, 83–88.[CrossRef]
32. Spencer, K. Agromyzidae (Diptera) of Economic Importance; Springer Science & Business Media: Dordrecht,The Netherlands, 1973; Volume 9, pp. 215–219.
33. Korytkowski, C. Contribución al conocimiento de los Agromyzidae (Diptera: Muscomorpha) en el Perú.Rev. Peru. Entomol. 2014, 49, 1–106.
34. Cornelis, M.; Coscarón, M. The Nabidae (Insecta, Hemiptera, Heteroptera) of Argentina. ZooKeys 2013, 333, 1–30.[CrossRef] [PubMed]
35. Pall, J.; Kihn, R.; Diez, F. A review of genus Nysius Dallas in Argentina (Hemiptera: Heteroptera: Orsillidae).Zootaxa 2016, 4132, 221–234. [CrossRef] [PubMed]
36. Burckhardt, D. Jumping plant lice (Homoptera: Psylloidea) of the temperate neotropical region. Part 1:Psyllidae (Subfamilies Aphalarinae, Rhinocolinae and Aphalaroidinae). Zool. J. Linn. Soc. 1987, 89, 299–392.[CrossRef]
37. Hodkinson, I.; White, I. Handbooks for the Identification of British Insects: Homoptera: Psylloidea; Royal EntomologicalSociety of London: Queen’s Gate, London, UK, 1979; Volume 2, pp. 1–76.
38. Derocles, S.; Le Ralec, A.; Plantegenest, M.; Chaubet, B.; Cruaud, C.; Cruaud, A.; Rasplus, J. Identificationof molecular markers for DNA barcoding in the Aphidiinae (Hym. Braconidae). Mol. Ecol. Resour.2012, 12, 197–208. [CrossRef] [PubMed]
39. Nakamura, S.; Masuda, T.; Mochizuki, A.; Konishi, K.; Tokumaru, S.; Ueno, K.; Yamaguchi, T. Primerdesign for identifying economically important Liriomyza species (Diptera: Agromyzidae) by multiplex PCR.Mol. Ecol. Resour. 2013, 13, 96–102. [CrossRef] [PubMed]
40. Shufran, K.; Puterka, G. DNA barcoding to identify all life stages of holocyclic cereal aphids (Hemiptera:Aphididae) on wheat and other Poaceae. Ann. Entomol. Soc. Am. 2011, 104, 39–42. [CrossRef]
41. Harbhajan, K.; Kaur, S. DNA barcoding of six species of family Rhopalidae (Insecta: Hemiptera: Heteroptera)from India. Int. J. Life Sci. 2017, 5, 517–526.
105
Agriculture 2020, 10, 644
42. Ding, T.; Chi, H.; Gökçe, A.; Gao, Y.; Zhang, B. Demographic analysis of arrhenotokous parthenogenesisand bisexual reproduction of Frankliniella occidentalis (Pergande) (Thysanoptera: Thripidae). Sci. Rep.2018, 3346, 1–10. [CrossRef]
43. R Core Team. R: A Language and Environment for Statistical Computing. R Foundation for Statistical Computing;R Core Team: Vienna, Austria, 2017. Available online: https://www.r-project.org/ (accessed on 30 June 2019).
44. Oksanen, J.; Blanchet, F.; Michael, F.; Kindt, R.; Legendre, P.; Dan McGlinn, P.; Minchin, P.; O’hara, R.; Simpson, G.;Solymos, P.; et al. Package ‘Vegan’. Community Ecology Package, Version 2.5. 2019. Available online:https://cran.r-project.org/web/packages/vegan/vegan.pdf (accessed on 10 May 2020).
45. De Mendiburu, F. Agricolae: Statistical Procedures for Agricultural Research. R Package Version, 1.3. 2020.Available online: https://cran.r-project.org/web/packages/agricolae/agricolae.pdf (accessed on 20 July 2020).
46. Ripley, B.; Venables, B.; Bates, D.; Hornik, K.; Gebhardt, A.; Firth, D.; Ripley, M. Package ‘Mass’.CRAN Repos. Httpcran R-Proj. 2020. Available online: https://cran.r-project.org/web/packages/MASS/MASS.pdf (accessed on 10 October 2020).
47. Mujica, N.; Kroschel, J. Leafminer fly (Diptera: Agromyzidae) occurrence, distribution, and parasitoidassociations in field and vegetable crops along the Peruvian Coast. Environ. Entomol. 2011, 40, 217–230.[CrossRef]
48. Yábar, E.; Gianoli, E.; Echegaray, E. Insect pests and natural enemies in two varieties of quinua (ChenopodiumQuinoa) at Cusco, Peru. J. Appl. Entomol. 2002, 126, 275–280. [CrossRef]
49. Rasmussen, C.; Lagnaoui, A.; Esbjerg, P. Advances in the knowledge of quinoa pests. Food Rev. Int.2003, 19, 61–75. [CrossRef]
50. Quispe, R.; Saravia, R.; Villca, M.; Lino, V. Complejo polilla. In Plagas y Enfermedades del Cultivo de Quinua;Saravia, R., Plata, G., Gandarillas, G., Eds.; Fundación PROINPA: Cochabamba, Bolivia, 2014; pp. 49–62.
51. Blanco, A. Umbral Económico de Kcona Kcona, Eurysacca melanocampta (Lepidoptera Gelechiidae) en Quinua(Chenopodium quinoa Willd). Licentiate Thesis, Universidad Nacional del Altiplano, Puno, Perú, 1994.
52. Villanueva, S. Determinación del “Umbral Económico” y “Nivel Crítico” de “Kcona Kcona” (Scrobipalpula sp.)en Quinua (Chenopodium quinoa Willd). Licentiate Thesis, Universidad Nacional del Altiplano, Puno, Peru, 1978.
53. Crespo, L.; Saravia, R. Insectos plaga ocasionales en el cultivo de quinua. In Plagas y Enfermedades del Cultivode Quinua; Saravia, R., Plata, G., Gandarillas, G., Eds.; Fundación PROINPA: Cochabamba, Bolivia, 2014;pp. 63–81.
54. Bale, J.; Harrington, R.; Clough, M. Low temperature mortality of the peach-potato aphid Myzus persicae.Ecol. Entomol. 1988, 13, 121–129. [CrossRef]
55. De Conti, B.; Bueno, V.; Sampaio, M.; Van Lenteren, J. Development and survival of Aulacorthum solani,Macrosiphum euphorbiae and Uroleucon ambrosiae at six temperatures. Bull. Insectol. 2011, 64, 63–68.
56. Sabahi, Q.; Rasekh, A.; Michaud, J. Toxicity of three insecticides to Lysiphlebus Fabarum, a parasitoid of theblack bean aphid, Aphis Fabae. J. Insect Sci. 2011, 11, 1–8. [CrossRef]
57. Thompson, F.; Rotheray, G.; Zumbado, M. Syrphidae (Flower flies). In Manual of Central American Diptera;Brown, B., Borkent, A., Cumming, J., Wood, D., Woodley, N., Zumbado, M., Eds.; NRC Research Press:Ottawa, ON, Canada, 2010; Volume 2, pp. 7637–7690.
58. Campos, D.; Sharkey, M. Familia Braconidae. In Introducción a Los Hymenoptera de La Región Neotropical;Fernández, F., Sharkey, M., Eds.; Sociedad Colombiana de Entomología y Universidad Nacional de Colombia:Bogotá, DC, USA, 2006; pp. 3313–3365.
59. Heckman, C. Neuroptera (Including Megaloptera); Springer: Cham, Switzerland; Zug, Switzerland, 2017; pp. 2–72.60. Horn, D. Selective mortality of parasitoids and predators of Myzus persicae on collards treated with malathion,
carbaryl, or Bacillus thuringiensis. Entomol. Exp. Appl. 1983, 34, 208–211. [CrossRef]61. Drescher, W.; Geusen-Pfister, H. Comparative testing of the oral toxicity of acephate, dimethoate and
methomyl to honeybees, bumblebees and Syrphidae. Acta Hortic. 1991, 288, 133–138. [CrossRef]62. Cranshaw, W.; Kondratieff, B.; Qian, T. Insects associated with quinoa, Chenopodium quinoa, in Colorado.
J. Kans. Entomol. Soc. 1990, 63, 195–199.63. Jensen, S. Insecticide resistance in the Western Flower Thrips, Frankliniella occidentalis. Integr. Pest Manag. Rev.
2000, 5, 131–146. [CrossRef]64. Mujica, N.; Sporleder, M.; Carhuapoma, P.; Kroschel, J. A Temperature-dependent phenology model for
Liriomyza huidobrensis (Diptera: Agromyzidae). J. Econ. Entomol. 2017, 110, 1333–1344. [CrossRef]
106
Agriculture 2020, 10, 644
65. Sánchez, G.; Redolfi de Huiza, I. Liriomyza huidobrensis y sus parasitoides en papa cultivada en Rímac yCañete, 1986. Rev. Peru. Entomol. 1988, 31, 110–112.
66. Burgos, A. Efecto de La Temperature en la Biología y Comportamiento de Diglyphus websteri (Crawford)(Hymenoptera: Eulophidae). Master’s Thesis, Universidad Nacional Agraria La Molina, Lima, Peru, 2013.
67. Mujica, N.; Valencia, C.; Ramirez, L.; Prudencio, C.; Kroschel, J. Temperature-Dependent Developmentof Three Parasitoids of the Leafminer Fly Liriomyza huidobrensis. Tropical roots and tubers in a changingclimate: A convenient opportunity for the world. In Proceedings of the Fifteenth Triennial Symposium ofthe International Society for Tropical Root Crops, Lima, Peru, 2–6 November 2009; pp. 1711–1777.
68. Cisneros, F. Control Químico de Las Plagas Agrícolas; Sociedad Entomológica del Perú: Lima, Peru, 2012; pp. 7–82.69. Sparks, T.; Nauen, R. IRAC: Mode of action classification and insecticide resistance management.
Pestic. Biochem. Physiol. 2015, 121, 122–128. [CrossRef] [PubMed]70. Hénault-Ethier, L. Health and Environmental Impacts of Pyrethroid Insecticides: What We Know, What
We Don’t Know and What We Should Do about It. Executive Summary and Scientific Literature Review.Prepared for Équiterre. Montreal, 2015. Available online: https://www.equiterre.org/sites/fichiers/health_and_environmental_impacts_of_pyrethroid_insecticides_full_report_en.pdf (accessed on 20 May 2020).
71. Croft, B.; Whalon, M. Selective toxicity of pyrethroid insecticides to arthropod natural enemies and pests ofagricultural crops. Entomophaga 1982, 27, 3–21. [CrossRef]
Publisher’s Note: MDPI stays neutral with regard to jurisdictional claims in published maps and institutionalaffiliations.
© 2020 by the authors. Licensee MDPI, Basel, Switzerland. This article is an open accessarticle distributed under the terms and conditions of the Creative Commons Attribution(CC BY) license (http://creativecommons.org/licenses/by/4.0/).
107


agriculture
Article
Evaluation of the Susceptibility of Some Eggplant Cultivars toGreen Peach Aphid, Myzus persicae (Sulzer)(Hemiptera: Aphididae)
Zienab Raeyat 1, Jabraiel Razmjou 1,*, Bahram Naseri 1, Asgar Ebadollahi 2 and Patcharin Krutmuang 3,4,*
Citation: Raeyat, Z.; Razmjou, J.;
Naseri, B.; Ebadollahi, A.;
Krutmuang, P. Evaluation of the
Susceptibility of Some Eggplant
Cultivars to Green Peach Aphid,
Myzus persicae (Sulzer) (Hemiptera:
Aphididae). Agriculture 2021, 11, 31.
https://doi.org/10.3390/
agriculture11010031
Received: 23 November 2020
Accepted: 21 December 2020
Published: 4 January 2021
Publisher’s Note: MDPI stays neutral
with regard to jurisdictional claims in
published maps and institutional affil-
iations.
Copyright: © 2021 by the authors.
Licensee MDPI, Basel, Switzerland.
This article is an open access article
distributed under the terms and
conditions of the Creative Commons
Attribution (CC BY) license (https://
creativecommons.org/licenses/by/
4.0/).
1 Department of Plant Protection, Faculty of Agriculture and Natural Resources, University of Mohaghegh Ardabili,Ardabil 5697194781, Iran; [email protected] (Z.R.); [email protected] (B.N.)
2 Department of Plant Sciences, Moghan College of Agriculture and Natural Resources,University of Mohaghegh Ardabili, Ardabil 5697194781, Iran; [email protected]
3 Department of Entomology and Plant Pathology, Faculty of Agriculture, Chiang Mai University,Chiang Mai 50200, Thailand
4 Innovative Agriculture Research Center, Faculty of Agriculture, Chiang Mai University,Chiang Mai 50200, Thailand
* Correspondence: [email protected] (J.R.); [email protected] (P.K.)
Abstract: Due to the detrimental side-effects of synthetic pesticides, the use of nonchemical strategiesin the management of insect pests is necessary. In the present study, the susceptibility of fourteeneggplant cultivars to green peach aphid (M. persicae) were investigated. According to preliminaryscreening tests, ‘Long-Green’, ‘Ravaya’ and ‘Red-Round’ as relatively resistant, and ‘White-Casper’and ‘Pearl-Round’ as susceptible cultivars were recognized. In the antixenosis tests, the highesthosting preference was documented for ‘White-Casper’. Population growth parameters were usedfor evaluation of antibiosis. The highest and lowest developmental time (d) was observed on‘Long-Green’ (4.33 d) and ‘White-Casper’ (3.26 d), respectively. The highest and lowest intrinsicrates of population increase (rm) were on ‘White-Casper’ (0.384 d−1) and ‘Long-Green’ (0.265 d−1),respectively. Significant differences were observed in the height and fresh and dry weight of infestedand noninfected plants. Plant resistance index (PRI), as a simplified way to assess all resistancemechanisms, provides a particular value to determine the proper resistant cultivar. The greatestPRI value was observed on ‘Long-Green’. In general, the ‘Long-Green’ showed the least, and the‘White-Casper’ displayed the most susceptibility among tested cultivars infested by M. persicae,which might be useful in integrated management of this pest.
Keywords: antibiosis; antixenosis; tolerance; eggplant cultivars; green peach aphid
1. Introduction
Green peach aphid, Myzus persicae (Sulzer) (Hemiptera: Aphididae), is one of the mostdamaging insect pests throughout the world, with more than 800 host plant species [1].Its feeding on the sap leads to chlorosis and necrosis spots, honeydew production, and a dra-matic reduction in the marketability of crops [2]. Along with direct losses due to nutritionalactivities, M. persicae can indirectly impair the host plants by the transmission of pathogenicviruses as an efficient vector [3,4]. As a holocyclic species, M. persicae can produce both thesexual population with the ability of genetic adaptation against environmental pressuresand asexual generations to create large populations [5]. These characteristics have madeM. persicae a very harmful pest on a wide range of crops, orchards, and greenhouses [6].
Although the chemical control is the main method in the management of aphids,overuse of synthetic insecticides has led to various side effects, including insecticide resis-tance, the outbreak of secondary pests, negative effects on beneficial organisms, and dan-gerous residues on foods [7–9]. Therefore, the application of chemical insecticides must bereplaced by eco-friendly and efficient methods, such as resistant host plants [10].
Agriculture 2021, 11, 31. https://doi.org/10.3390/agriculture11010031 https://www.mdpi.com/journal/agriculture
109
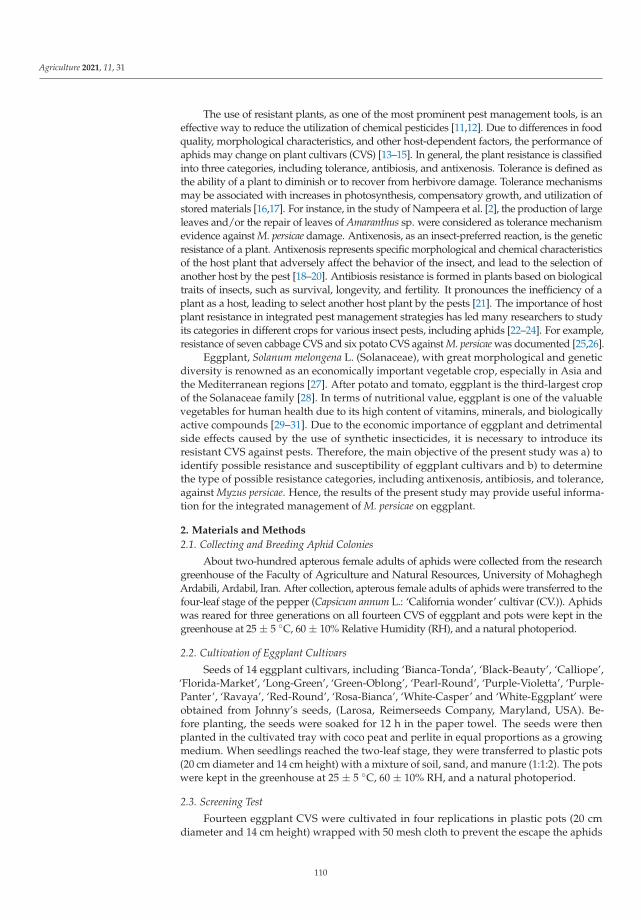
Agriculture 2021, 11, 31
The use of resistant plants, as one of the most prominent pest management tools, is aneffective way to reduce the utilization of chemical pesticides [11,12]. Due to differences in foodquality, morphological characteristics, and other host-dependent factors, the performance ofaphids may change on plant cultivars (CVS) [13–15]. In general, the plant resistance is classifiedinto three categories, including tolerance, antibiosis, and antixenosis. Tolerance is defined asthe ability of a plant to diminish or to recover from herbivore damage. Tolerance mechanismsmay be associated with increases in photosynthesis, compensatory growth, and utilization ofstored materials [16,17]. For instance, in the study of Nampeera et al. [2], the production of largeleaves and/or the repair of leaves of Amaranthus sp. were considered as tolerance mechanismevidence against M. persicae damage. Antixenosis, as an insect-preferred reaction, is the geneticresistance of a plant. Antixenosis represents specific morphological and chemical characteristicsof the host plant that adversely affect the behavior of the insect, and lead to the selection ofanother host by the pest [18–20]. Antibiosis resistance is formed in plants based on biologicaltraits of insects, such as survival, longevity, and fertility. It pronounces the inefficiency of aplant as a host, leading to select another host plant by the pests [21]. The importance of hostplant resistance in integrated pest management strategies has led many researchers to studyits categories in different crops for various insect pests, including aphids [22–24]. For example,resistance of seven cabbage CVS and six potato CVS against M. persicae was documented [25,26].
Eggplant, Solanum melongena L. (Solanaceae), with great morphological and geneticdiversity is renowned as an economically important vegetable crop, especially in Asia andthe Mediterranean regions [27]. After potato and tomato, eggplant is the third-largest cropof the Solanaceae family [28]. In terms of nutritional value, eggplant is one of the valuablevegetables for human health due to its high content of vitamins, minerals, and biologicallyactive compounds [29–31]. Due to the economic importance of eggplant and detrimentalside effects caused by the use of synthetic insecticides, it is necessary to introduce itsresistant CVS against pests. Therefore, the main objective of the present study was a) toidentify possible resistance and susceptibility of eggplant cultivars and b) to determinethe type of possible resistance categories, including antixenosis, antibiosis, and tolerance,against Myzus persicae. Hence, the results of the present study may provide useful informa-tion for the integrated management of M. persicae on eggplant.
2. Materials and Methods
2.1. Collecting and Breeding Aphid Colonies
About two-hundred apterous female adults of aphids were collected from the researchgreenhouse of the Faculty of Agriculture and Natural Resources, University of MohagheghArdabili, Ardabil, Iran. After collection, apterous female adults of aphids were transferred to thefour-leaf stage of the pepper (Capsicum annum L.: ‘California wonder’ cultivar (CV.)). Aphidswas reared for three generations on all fourteen CVS of eggplant and pots were kept in thegreenhouse at 25 ± 5 ◦C, 60 ± 10% Relative Humidity (RH), and a natural photoperiod.
2.2. Cultivation of Eggplant Cultivars
Seeds of 14 eggplant cultivars, including ‘Bianca-Tonda’, ‘Black-Beauty’, ‘Calliope’,‘Florida-Market’, ‘Long-Green’, ‘Green-Oblong’, ‘Pearl-Round’, ‘Purple-Violetta’, ‘Purple-Panter’, ‘Ravaya’, ‘Red-Round’, ‘Rosa-Bianca’, ‘White-Casper’ and ‘White-Eggplant’ wereobtained from Johnny’s seeds, (Larosa, Reimerseeds Company, Maryland, USA). Be-fore planting, the seeds were soaked for 12 h in the paper towel. The seeds were thenplanted in the cultivated tray with coco peat and perlite in equal proportions as a growingmedium. When seedlings reached the two-leaf stage, they were transferred to plastic pots(20 cm diameter and 14 cm height) with a mixture of soil, sand, and manure (1:1:2). The potswere kept in the greenhouse at 25 ± 5 ◦C, 60 ± 10% RH, and a natural photoperiod.
2.3. Screening Test
Fourteen eggplant CVS were cultivated in four replications in plastic pots (20 cmdiameter and 14 cm height) wrapped with 50 mesh cloth to prevent the escape the aphids
110
Agriculture 2021, 11, 31
and contamination with other pests. After germination of seeds, only one seedling waskept in each pot, and the others were removed. Each plant in the five to six leaf growthstage was infested with four aphids and the number of aphids on each plant was recordedafter 14 days. Finally, two CVS with the highest (‘Pearl-Round’ and ‘White-Casper’) andthree CVS with the lowest (‘Long-Green’, ‘Ravaya’ and ‘Red-Round’) mean number ofaphids were selected for antixenosis, antibiosis, and tolerance experiments.
2.4. Antixenosis Test
Three eggplant CVS, including ‘Long-Green’, ‘Ravaya’ and ‘Red-Round’ as relativelyresistant, and two relatively susceptible CVS, including ‘White-Casper’ and ‘Pearl-Round’,were selected for the antixenosis experiment based on the screening test results. Antixeno-sis test or host preference experiment was performed based on Webster’s method [32].Same height eggplants in the four-leaf stage were randomly selected and arranged in acircle. A circular paper was adjusted to fit the pot and located in its middle so that eachplant was out of the paper from the stem. Then, 50 aphids were placed in the centerof the paper, and the number of aphids on each CV. was counted after 24, 48, and 72 h.The experiment was conducted in a completely randomized design with five replicationsfor each cultivar in the growth chamber at 25 ± 5 ◦C, 60 ± 10% RH, and 16: 8 Light: Dark(L:D) photoperiod. Therefore, in total we used 25 plants in the experiments.
2.5. Antibiosis Test
Female adults of aphids were randomly selected from the colony and placed on theleaves of above mentioned CVS. Each aphid was placed inside the leaf cage (5 cm diam-eter and 1 cm height) to prevent escape or injury by other insects. After 24 h, the adultaphids and all nymphs were removed from the leaf cage, excluding a first-instar nymph.These nymphs were monitored daily to evaluate the survival and developmental timeon each CV. After determining developmental time (d), the number of nymphs producedby each female adult was daily recorded and removed from the plant. This experimentperformed with 30 aphids for each cultivar in a growth chamber at 25 ± 2 ◦C, 60 ± 5% RH,and 16:8 (L:D) photoperiod. In total, 150 aphids were used in the experiment. This experi-ment continued as long as developmental time (d), and mortality was also recorded duringthis period [23]. The intrinsic rate of population increase (rm) for aphids in different CVSwere calculated using the following Equation (1) [33]:
rm = 0.738lnMd
d(1)
In the formula, d is the developmental time (from the nymph’ first-stage to thebeginning of adult reproduction), Md is nymphs produced per female during the periodequal with d, and 0.738 is the correction factor.
2.6. Tolerance Test
The eggplant CVS studied in the antixenosis and antibiosis tests were also used forthe tolerance test. The seeds were planted in a cultivated tray again, and after germinationin the two-leaf stage, the seedlings were transferred to plastic pots (20 cm diameter and14 cm height). When the seedlings reached the four-leaf stage, 10 female adults werepositioned on each CV. surrounded with 50 mesh cloths to prevent the entrance of otherpests. The nymphs produced on each plant were removed every 24 h. When the number offemale adults of aphids was decreased, more aphids were added so their number reachedten again. The experiment was performed with six replications for each cultivar along withthe control groups without aphids’ contamination. The experiment lasted 14 days underthe same conditions [32]. To calculate the dry weight, the seedlings were dried in an oven
111

Agriculture 2021, 11, 31
at 60 ◦C for three days. The plant height from the soil surface and fresh and dry weight ofeach CV. were measured according to the following Formulas (2)–(4) [34].
Reduction in the height of the infested plant (%) = the height of the controlplant − height of the infested plant/height of the control plant × 100
(2)
Reduction in the fresh weight of the infested plant (%) = fresh weight of thecontrol plant − the fresh weight of the infested plant/fresh weight of the
control plant × 100(3)
Reduction in the dry weight of the infested plant (%) = dry weight of thecontrol plant − the dry weight of the infested plant/dry weight of the
control plant × 100(4)
2.7. Resistance Index Calculation
A plant resistance index (PRI) was used to compare different tested eggplant CVS [35]. ThePRI for each CV. was calculated by dividing the value of any categories (antixenosis, antibiosis,and tolerance) by its highest mean in all studied CVS at a replication. The number one representsthe lowest value for the considered mechanism in a CV. The mean number of aphids attractedwithin 5 days for antixenosis (X), the mean intrinsic rate of population increase (rm) of aphidson each CV. for antibiosis (Y), and the reduction rate in each CV. compared to the control groupsfor tolerance mechanism (Z) were calculated. Therefore, normalized indices for X, Y, and Zvalues were used to estimate PRI in the following Formula (5):
PRI = 1/XYZ (5)
2.8. Statistical Analysis
All obtained data from above-mentioned tests were analyzed using one-way ANOVAby Minitab 18 software (Minitab Inc. 1994, Philadelphia, PA, USA), and the comparison ofmeans was performed using Tukey’s test at p < 0.05.
3. Results
3.1. Screening Test
Significant differences were observed for the number of adult aphids grown on the 14eggplant CVS examined (F (Fisher: F-distribution) = 3.22; df (degrees of freedom) = 13, 34; p <0.05). The order of eggplant CVS, based on the number of grown aphids, was ‘White-Casper’,‘Pearl-Round’, ‘Florida-Market’, ‘Purple-Violetta’, ‘Rosa-Bianca’, ‘Black-Beauty’, ‘Bianca-Tonda’,‘Calliope’, ‘Purple-Panter’, ‘White-Eggplant’, ‘Green-Oblong’, ‘Ravaya’, ‘Red-Round’ and ‘Long-Green’ CVS, respectively (Table 1).
Table 1. Mean number (±Standard Error (SE)) of Myzus persicae on fourteen eggplant cultivars forscreening the test in the greenhouse conditions.
Eggplant Cultivars Adult Aphids
‘White-Casper’ 1006 ± 25.90 a
‘Pearl-Round’ 987 ± 17.77 a
‘Florida-Market’ 855 ± 71.54 a,b
‘Purple-Violetta’ 788.3 ± 11.60 b
‘Rosa-Bianca’ 746.7 ± 8.42 b
‘Black-Beauty’ 741 ± 20.19 b
‘Bianca-Tonda’ 460 ± 13.60 b
112

Agriculture 2021, 11, 31
Table 1. Cont.
Eggplant Cultivars Adult Aphids
‘Calliope’ 404.5 ± 9.69 b
‘Purple-Panter’ 404 ± 15.87 b
‘White-Eggplant’ 357 ± 20.42 c,b
‘Green-Oblong’ 320.5 ± 11.66 c,b
‘Ravaya’ 299 ± 10.73 c,b
‘Red-Round’ 283.5 ± 10.60 c,b
‘Long-Green’ 138.3 ± 30.42 c
Different letters in column indicate significant differences between eggplant cultivars (Tukey’s test, p < 0.05).
3.2. Antixenosis Test
Antixenosis data analysis revealed that the number of aphids was significantly affectedby tested eggplant CVS within 24, 48, and 72 h (F = 1.21; df = 4, 20; p < 0.05), (F = 4.78; df = 4,20; p < 0.05), (F = 6.21; df = 4, 20; p < 0.05). After 72 h, the highest number of aphids wasrecorded on CV. ‘White-Casper’, while the lowest was on CVS ‘Long-Green’ and ‘Ravaya’(Table 2).
Table 2. Mean number (± SE) of Myzus persicae on five eggplant cultivars for antixenosis test after 24,48, and 72 h.
Eggplant CultivarsAphid Numbers
after 24 hAphid Numbersafter
48 hAphid Numbers
after 72 h
‘Ravaya’ 8.00 ± 2.58 a 4.60 ± 1.02 b 3.40 ± 0.60 b
‘Long-Green’ 6.20 ± 2.26 a 1.80 ± 0.79 b 1.00 ± 0.59 b
‘White-Casper’ 11.40 ± 1.12 a 22.20 ± 6.44 a 30.60 ± 2.03 a
‘Pearl-Round’ 9.60 ± 1.28 a 13.80 ± 4.46 a,b 17.00 ± 1.38 a,b
‘Red-Round’ 10.80 ± 1.95 a 14.20 ± 2.65 a,b 17.20 ± 1.16 a,b
Different letters in each column indicate a significant difference between eggplant cultivars (Tukey’s test,p < 0.05).
3.3. Antibiosis Test
The intrinsic rate of M. persicae population increase (rm) values were affected byeggplant CVS (F = 11.07, df = 4,140, p < 0.05). The highest rm value was observed on CV.‘White-Casper’ (0.384 d−1), while the lowest value was on CV. ‘Long-Green’ (0.265 d−1)(Table 3).
Table 3. Mean (± SE) of intrinsic rate of population increase (rm) and developmental time (d) ofMyzus persicae on five eggplant cultivars in the greenhouse conditions.
Eggplant Cultivars rm (d−1) d (d)
‘Ravaya’ 0.3060 ± 0.09 b,c 3.92 ± 0.94 a,b
‘Long-Green’ 0.2650 ± 0.07 c 4.33 ± 0.78 a
‘White-Casper’ 0.3836 ± 0.06 a 3.26 ± 0.44 c
‘Pearl-Round’ 0.3593 ± 0.05 a,b 3.56 ± 0.77b c
‘Red-Round’ 0.3413 ± 0.07 a,b 3.50 ± 0.77b c
Different letters in each column indicate a significant difference between eggplant cultivars (Tukey’s test,p < 0.05).
The cultivars also significantly changed the developmental time (d) of the aphid(F = 8.54; df = 4, 140; p < 0.05). The lowest and highest amount of developmental time wereobserved on CVS ‘White-Casper’ (3.26 d) and ‘Long-Green’ (4.33 d), respectively (Table 3).
113

Agriculture 2021, 11, 31
3.4. Tolerance Test
M. persicae had significant effects on the decreases in plant height (F = 7.92; df = 4, 20;p < 0.05), the fresh weight (F = 3.42; df = 4, 20; p < 0.05), and the dry weight (F = 6.52, df = 4,20; p < 0.05) of the aphid-infested CVS examined. The largest reduction percentages in theheight and dry weight occurred on CVS ‘White-Casper’ and ‘Pearl-Round’, while the lowestreduction percentages for both parameters were seen on CV. ‘Long-Green’. Meanwhile,the highest and the lowest reduction percentages were observed on CVS ‘White-Casper’and ‘Long-Green’, respectively (Table 4).
Table 4. Mean (± SE) reduction percentage of the growth parameters of five eggplant cultivarsagainst Myzus persicae in the greenhouse conditions.
Eggplant CultivarsHeight Reduction
(%)Weight Loss (%) Dry Weight Loss (%)
‘Ravaya’ 17.26 ± 6.59 b,c 31.74 ± 6.76 a,b 34.33 ± 5.08 a,b
‘Long-Green’ 12.00 ± 2.28 c 22.19 ± 6.89 b 7.48 ± 4.65 b
‘White-Casper’ 39.76 ± 3.29 a 61.61 ± 8.17 a 57.51 ± 3.77 a
‘Red Round’ 32.74 ± 3.77 a,b 32.27 ± 9.01 a,b 37.40 ± 11.89 a,b
‘Pearl-Round’ 37.57 ± 4.84 a 41.59 ± 9.20 a,b 29.74 ± 6.50 a
Different letters in each column indicate a significant difference between eggplant cultivars (Tukey’s test,p < 0.05).
3.5. Plant Resistance Index (PRI)
The plant resistance index (PRI) of tested eggplant CVS against aphids are shownin Table 5. The greatest PRI value was observed on cv. ‘Long-Green’ (7.75), followed by‘Ravaya’ (3.32). On the contrary, ‘White-Casper’ was highlighted with the lowest PRI value(1.00) (Table 5).
Table 5. Plant Resistance Indices (PRI) related to five eggplant cultivars infested by Myzus persicae.
EggplantCultivars
AntixenosisIndex
(X)
AntibiosisIndex
(Y)
ToleranceIndex
(Z)XYZ PRI
‘White-Casper’ 1.00 1.00 1.00 1.00 1.00
‘Pearl-Round’ 1.00 0.89 1.00 0.89 1.12
‘Red-Round’ 1.00 0.92 0.86 0.791 1.26‘Ravaya’ 0.42 0.78 0.92 0.301 3.32
‘Long-Green’ 0.19 0.68 1.00 0.129 7.75
4. Discussion
The quantity and type of the resistance of common eggplant CVS with three resistancecategories, including antixenosis, antibiosis, and tolerance, were investigated to Myzus persicaein the present study. Experiments originated with fourteen eggplant CVS in the screeningtest to arrange resistant categories. Screening tests save time and increase the accuracy inthe main experiments. Based on the obtained results from the screening test, three relativelyresistant (‘Long-Green’, ‘Ravaya’ and ‘Red-Round’) and two susceptible CVS (‘White-Casper’and ‘Pearl-Round’) were selected. Singh et al. [36] found that seven eggplant CVS had diverseresistance and susceptibility to Tetranychus urticae (Koch). Also, according to the screening tests,23 CVS of eggplant were classified into four resistant, relatively resistant, relatively susceptible,and susceptible groups against Leucinodes orbonalis Guenee [37].
Our results also showed, in general, there was a significant difference in the perfor-mance of M. persicae among the five tested eggplant CVS. Based on our findings fromthe screening test, ‘Long-Green’ was the most resistant cv. to the M. persicae, which was
114

Agriculture 2021, 11, 31
confirmed in all antixenosis, antibiosis, and tolerance experiments. Although there wasnot significant difference in the antixenosis test between tested CVS after 24 h, M. persicaepreferred CV. ‘White-Casper’ and had less host preference over ‘Long-Green’ and ‘Ravaya’CVS after 24 and 48 h. The host preference of M. persicae, like other insect pests, varies ac-cording to different plant species [38]. The antixenosis resistance of eight potato [38] andseven cabbage CVS [39] were reported to M. persicae. Ahmed et al. [39] declared that chem-ical and olfactory compounds of CVS caused the attraction of aphids to the preferred hosts.Therefore, differences in host preference of insect pests for the plant species CVS could bedue to variations in their chemical and morphological parameters. Although our experi-ments did not investigate the mechanisms of antixenosis and antibiosis, these compoundsmay be the main factors in susceptible eggplant CVS for attracting M. persicae.
The antibiosis resistance of eggplant CVS, measured as significant effects on thegrowth, survival, and reproduction of M. persicae, was also obtained in the present study.It was used to assess variations in the resistance of different CVS of a plant and to predictthe population of pests [40–42]. In the present study, the developmental time (d) ofM. persicae on the cv. ‘Long-Green’ with a mean of 4.33 d was significantly longer thanother CVS. Furthermore, the highest and lowest intrinsic rates of population increase(rm) were seen on the most susceptible CV. ‘White-Casper’ (0.383 d−1 for) and the mostresistant CV. ‘Long-Green’ (0.265 d−1), respectively. In the study of Ahmed et al. [25],the intrinsic rate of population increase (rm) and the developmental time (d) of M. persicaehad a significant difference for seven cabbage CVS. Along with antixenosis resistance,the significantly different rm value of M. persicae was also documented on six commonlyproduced potato cultivars by Mottaghinia et al. [43]. In general, the quality of the hostplant can be the main reason to prefer different CVS by aphids and an important factor inthe antibiosis resistance [44,45].
In the evaluation of the tolerance category, tested eggplant CVS showed significantlydifferent reactions, based on plant growth parameters containing height and fresh anddry weight, after twenty-one days of infestation by M. persicae. Some of them, such as‘Long-Green’, indicated significant tolerance, whereas some others, such as ‘White-Casper’,had less ability to compensate for aphid damage. During the genetic-based phenomenatolerance, plants can continue to grow despite the presence of a specific population anddamage of the pest [12,21]. The tolerance existed in some eggplant CVS based on significantdifferences in their growth parameters. The eggplant tolerance was also investigated byKhan and Singh [46], in which 38 genotypes from 192 tested genotypes were tolerantagainst L. orbonalis.
In the present study, significant differences were supposed between resistant mech-anisms of fourteen eggplant CVS against M. persicae. According to our observations, CV.‘Long-Green’, which presented high resistance against M. persicae, had a smaller leaf areathan others. Several morphological traits, including plant surface trichrome or epidermaltissue stiffness, may influence host acceptance by aphids [47]. For example, morphologi-cal characteristics of eight eggplant CVS had significant effects on the preference of silverwhitefly, Bemisia tabaci (Gennadius) [48]. Therefore, such characteristics may be the reasonwhy M. persicae did not prefer CV. ‘Long-Green’.
5. Conclusions
According to the plant resistance index (PRI), eggplant CV. ‘White-Casper’ with lowestPRI value (1.00) had higher susceptibility to M. persicae than the other tested CVS. The ‘Red-Round’ and ‘Pearl-Round’ CVS with PRI values of 1.12 and 1.26, respectively, were alsomore susceptible than ‘Ravaya’, which is an early maturing, high yielding, and popularvariety for the fresh export market [49], with a PRI value of 3.32. Finally, the ‘Long-Green’,with the highest PRI value compared to other CVS (7.75), can be introduced as the mostresistant CV. for application in integrated management of M. persicae. In general, the greeneggplant CVS that are early maturing, with high tolerance to bacterial wilt and attractivefruit shape and color had high consumer preference [50]. However, these CVS should
115
Agriculture 2021, 11, 31
be tested in the field conditions to determine the yield of the infested plant in naturalconditions. Furthermore, it is necessary to conduct additional research on the mechanismsof resistance or susceptibility of the CVS.
Author Contributions: Conceptualization, Z.R., J.R., B.N. and A.E.; methodology, Z.R. and J.R.;formal analysis, Z.R., J.R. and A.E.; investigation, Z.R.; writing—original draft preparation, Z.R., J.R.,B.N., A.E. and P.K.; writing—review and editing, Z.R., J.R., B.N., A.E. and P.K.; supervision, J.R., B.N.and A.E.; funding acquisition, P.K. All authors have read and agreed to the published version ofthe manuscript.
Funding: This research received no external funding.
Institutional Review Board Statement: Not applicable.
Informed Consent Statement: Not applicable.
Data Availability Statement: The data that support the findings of this study are available uponrequest from the authors.
Acknowledgments: This research was financially supported by the University of Mohaghegh Ard-abili, Ardabil, Iran, and was partially supported by Chiang Mai University, Thailand, which isgreatly appreciated.
Conflicts of Interest: The authors declare no conflict of interest.
References
1. Van Emden, H.F.; Harrington, R. Aphids as Crop Pests, 1st ed.; CABI: Oxford, UK, 2017; p. 717.2. Nampeera, E.L.; Blodgett, S.; O’Neal, M.E.; Nonnecke, G.R.; Murungi, L.K.; Abukutsa-Onyango, M.O.; Wesonga, J.M. Resistance
of Amaranthus spp. to the green peach aphid (Hemiptera: Aphididae). J. Econ. Entomol. 2020, 113, 1299–1306. [CrossRef][PubMed]
3. Torres-Quintero, M.C.; Arenas-Sosa, I.; Peña-Chora, G.; Hernández-Velázquez, V.M. Feeding chamber for Myzus persicae culture(Hemiptera: Aphididae). Fla. Entomol. 2013, 96, 1600–1602. [CrossRef]
4. Bosquee, E.; Boullis, A.; Bertaux, M.; Francis, F.; Verheggen, F.J. Dispersion of Myzus persicae and transmission of potato virus Yunder elevated CO2 atmosphere. Entomol. Exp. Appl. 2018, 166, 380–385. [CrossRef]
5. Javed, K.; Qiu, D. Protein elicitor PeBL1 of Brevibacillus laterosporus enhances resistance against Myzus persicae in tomato. Pathogens2020, 9, 57. [CrossRef]
6. Blackman, R.L.; Eastop, V.F. Taxonomic issues. In Aphids as Crop Pests; Van Emden, H.F., Harrington, R., Eds.; CABI: Wallingford,UK, 2007; pp. 1–29.
7. Bass, C.; Puinean, A.M.; Zimmer, C.T.; Denholm, I.; Field, L.M.; Foster, S.P.; Gutbrod, O.; Nauen, R.; Slater, R.; Williamson,M.S. The evolution of insecticide resistance in the peach potato aphid, Myzus persicae. Insect Biochem. Mol. Biol. 2014, 51, 41–51.[CrossRef] [PubMed]
8. Blair, A.; Ritz, B.; Wesseling, C.; Freeman, L.B. Pesticides and human health. Occup. Environ. Med. 2015, 72, 81–82. [CrossRef]9. Jordan, M.O.; Sauge, M.H.; Vercambre, G. Chemical and growth traits of the peach tree may induce higher infestation rates of the
green peach aphid, Myzus persicae (Sulzer). Pest Manag. Sci. 2020, 76, 797–806. [CrossRef]10. Ghorbanian, M.; Fathipour, Y.; Talebi, A.A.; Gadi, V.P.R. Different pepper cultivars affect performance of second (Myzus persicae)
and third (Diaeretiella rapae) trophic levels. J. Asia Pac. Entomol. 2019, 22, 194–202. [CrossRef]11. Broekgaarden, C.T.; Snoeren, A.L.; Dicke, M.; Vosman, B. Exploiting natural variation to identify insect-resistance genes.
Plant Biotechnol. J. 2011, 9, 819–825. [CrossRef]12. Smith, C.M.; Clement, S.L. Molecular bases of plant resistance to arthropods. Annu. Rev. Entomol. 2012, 57, 309–328. [CrossRef]
[PubMed]13. Karley, A.J.; Douglas, A.E.; Parker, W.E. Amino acid composition and nutritional quality of potato leaf phloem sap for aphids.
J. Exp. Biol. 2002, 205, 3009–3018. [PubMed]14. Kuhlmann, F.; Müller, C. UV-B impact on aphid performance mediated by plant quality and plant changes induced by aphids.
Plant Biol. 2010, 12, 676–684. [CrossRef] [PubMed]15. Alvarez, A.E.; Broglia, V.G.; Alberti D’Amato, A.M.; Wouters, D.; van der Vossen, E.; Garzo, E.; Tjallingii, W.F.; Dicke, M.; Vosman,
B. Comparative analysis of Solanum stoloniferum responses to probing by the green peach aphid Myzus persicae and the potatoaphid Macrosiphum euphorbiae. Insect Sci. 2012, 20, 207–227. [CrossRef]
16. Scott, R.A.; Worrall, W.D.; Frank, W.A. Screening for resistance to Russian wheat aphid in triticale. Crop Sci. 1991, 31, 32–36.[CrossRef]
17. Tiffin, P. Mechanisms of tolerance to herbivore damage: What do we know? Evol. Ecol. 2000, 14, 523–536. [CrossRef]18. Eigenbrode, S.D.; Ding, H.; Shiel, P.; Berger, P.H. Volatiles from potato plants infected with potato leaf roll virus attract and arrest
the virus vector, Myzus persicae (Homoptera: Aphididae). Proc. R. Soc. B 2002, 269, 455–460. [CrossRef]
116
Agriculture 2021, 11, 31
19. Werner, B.J.; Mowry, T.M.; Bosque-Pérez, N.A.; Ding, H.; Eigenbrode, S.D. Changes in green peach aphid responses to potatoleafroll virus-induced volatiles emitted during disease progression. Environ. Entomol. 2009, 38, 1429–1438. [CrossRef]
20. Rajabaskar, D.; Ding, H.; Wu, Y.; Eigenbrode, S.D. Behavioural responses of green peach aphids, Myzus persicae (Sulzer), to thevolatile organic compound emissions from four potato varieties. Am. J. Potato Res. 2013, 90, 171–178. [CrossRef]
21. Smith, C.M. Plant Resistance to Arthropods: Molecular and Conventional Approaches; Springer: Dordrecht, The Netherlands, 2005; p. 423.22. Hesler, L.S. Resistance to Rhopalosiphum padi (Homoptera: Aphididae) in three triticale accessions. J. Econ. Entomol. 2005, 98,
603–610. [CrossRef]23. Akhtar, N.; Haq, E.; Masood, M.A. Categories of resistance in national uniform wheat yield trials against Schizaphis graminum
(Rondani) (Homoptera: Aphididae). Pakistan J. Zool. 2006, 38, 167–171.24. Razmjou, J.; Mohamadi, P.; Golizadeh, A.; Hasanpour, M.; Naseri, B. Resistance of wheat lines to Rhopalosiphum padi (Hemiptera:
Aphididae) under laboratory conditions. J. Econ. Entomol. 2012, 105, 592–597. [CrossRef] [PubMed]25. Ahmed, N.; Darshanee, C.H.L.; Fu, W.Y.; Hu, X.S.; Fan, Y.; Liu, T.X. Resistance of seven cabbage cultivars to green peach aphid
(Hemiptera: Aphididae). J. Econ. Entomol. 2018, 111, 909–916. [CrossRef] [PubMed]26. Khan, I.; Saljoqi, A.R.; Maula, F.; Ahmad, B.; Khan, J. Evaluation of different potato varieties against potato aphid, Myzus persicae
(Sulzer). Int. J. Bot. Stud. 2019, 4, 8–13.27. Chapman, M.A. Eggplant breeding and improvement for future climates. In Genomic Designing of Climate-Smart Vegetable Crops;
Kole, C., Ed.; Springer: Cham, Switzerland, 2020; pp. 257–276.28. Chapman, M.A. Introduction: The importance of eggplant. In The Eggplant Genome; Chapman, M., Ed.; Springer: Cham,
Switzerland, 2019; pp. 1–10.29. Raigón, M.D.; Prohens, J.; Muñoz-Falcón, J.E.; Nuez, F. Comparison of eggplant landraces and commercial varieties for fruit
content of phenolics, minerals, dry matter and protein. J. Food Compos. Anal. 2008, 21, 370–376. [CrossRef]30. Plazas, M.; Prohens, J.; Cuñat, A.N.; Vilanova, S.; Gramazio, P.; Herraiz, F.J. Reducing capacity, chlorogenic acid content and
biological activity in a collection of scarlet (Solanum aethiopicum) and gboma (S. macrocarpon) eggplants. Int. J. Mol. Sci. 2014, 15,17221–17241. [CrossRef] [PubMed]
31. Docimo, T.; Francese, G.; Ruggiero, A.; Batelli, G.; De Palma, M.; Bassolino, L. Phenylpropanoids accumulation in eggplant fruit:Characterization of biosynthetic genes and regulation by a MYB transcription factor. Front. Plant. Sci. 2016, 6, 1233. [CrossRef]
32. Webster, J.A. Resistance in triticale to the Russian wheat aphid. J. Econ. Entomol. 1990, 83, 1091–1095. [CrossRef]33. Wyatt, I.J.; White, P.F. Simple estimation of intrinsic increase rates for aphids and Tetranychid mites. J. Appl. Ecol. 1977, 14, 757–766.
[CrossRef]34. Reese, J.C.; Schwenke, J.R.; Lamont, P.S.; Zehr, D.D. Importance of quantification of plant tolerance in crop pest management
programs for aphids: Green bug resistance in sorghum. J. Agric. Urban Entomol. 1994, 11, 255–270.35. Inayatullah, C.; Webster, J.A.; Fargo, W.S. Index for measuring plant resistance to insects. Entomologist 1990, 109, 146–152.36. Singh, W.G.; Brar, B.M.; Kaur, P. Screening of brinjal (Solanum melongena) varieties/hybrids against two-spotted spider mite
(Tetranychus urticae). Indian J. Agr. Sci. 2012, 82, 1003–1005.37. Shigwan, P.S.; Narangalkar, A.L.; Desai, V.S.; Shinde, B.D.; Golvankar, G.M. Screening of different cultivars of brinjal against
shoot and fruit borer, Leucinodes orbonalis Guenee. J. Exp. Zool. 2020, 23, 541–544.38. Frei, A.; Gu, H.; Bueno, J.M.; Cardona, C.; Dorn, S. Antixenosis and antibiosis of common beans to Thrips palmi Karny
(Thysanoptera: Thripidae). J. Econ. Entomol. 2003, 96, 1577–1584. [CrossRef] [PubMed]39. Ahmed, N.; Darshanee, C.H.L.; Khan, I.A.; Zhang, Z.F.; Liu, T.X. Host selection behavior of the green peach aphid, Myzus persicae,
in response to volatile organic compounds and nitrogen contents of cabbage cultivars. Front. Plant Sci. 2019, 10. [CrossRef]40. Chen, Q.; Wang-Li, N.X.; Ma, L.; Huang, J.B.; Huang, G.H. Age-stage, two-sex life table of Parapoynx crisonalis (Lepidoptera:
Pyralidae) at different temperatures. PLoS ONE 2017, 12, e0173380. [CrossRef]41. Ning, S.; Zhang, W.; Sun, Y.; Feng, J. Development of insect life tables: Comparison of two demographic methods of Delia antiqua
(Diptera: Anthomyiidae) on different hosts. Sci. Rep. 2017, 7, 4821. [CrossRef]42. Polat Akköprü, E. The effect of some cucumber cultivars on the biology of Aphis gossypii Glover (Hemiptera: Aphididae).
Phytoparasitica 2018, 46, 511–520. [CrossRef]43. Mottaghinia, L.; Razmjou, J.; Nouri-Ganbalani, G.; Rafiee-Dastjerdi, H. Antibiosis and antixenosis of six commonly produced
potato cultivars to the green peach aphid, Myzus persicae Sulzer (Hemiptera: Aphididae). Neotrop. Entomol. 2010, 40, 380–386.44. Parajulee, M.N.; Shrestha, R.B.; Slosser, J.E.; Bordovsky, D.G. Effects of skip-row planting pattern and planting date on dryland
cotton Insect pest abundance and selected plant parameters. Southwest Entomol. 2011, 36, 21–39. [CrossRef]45. Cisneros, J.J.; Godfrey, L.D. Midseason pest status of the cotton aphid (Homoptera: Aphididae) in California cotton: Is nitrogen a
key factor? Environ. Entomol. 2001, 30, 501–510. [CrossRef]46. Khan, R.; Singh, Y.V. Screening for shoot and fruit (Leucinodes orbonalis Guenee) resistance in brinjal (Solanum Melongena L.)
genotypes. Ecoscan 2014, 8, 41–45.47. Alvarez, A.E.; Garzo, E.; Verbek, M.; Vosman, B.; Dicke, M.; Tjallingii, W.F. Infection of potato plants with potato leaf roll virus
change attraction and feeding behavior of Myzus persicae. Entomol. Exp. Appl. 2007, 125, 135–144. [CrossRef]48. Hasanuzzaman, A.T.M.; Islam, M.N.; Liu, F.H.; Cao, H.H.; Liu, T.X. Leaf Chemical compositions of different eggplant varieties
affect performance of Bemisia tabaci (Hemiptera: Aleyrodidae) nymphs and adults. J. Econ. Entomol. 2017, 111, 445–453. [CrossRef][PubMed]
117

Agriculture 2021, 11, 31
49. Infonet: Eggplant. Available online: https://infonet-biovision.org/PlantHealth/Crops/Eggplant (accessed on 8 July 2019).50. Quamruzzaman, A.; Islam, F.; Uddin, M.N.; Chowdhury, M.A.Z. Evaluation of green eggplant hybrids for yield and tolerance to
biotic stress in Bangladesh. Adv. Agric. Environ. Sci. 2019, 2, 37–40.
118

agriculture
Article
Control of Meloidogyne graminicola a Root-Knot NematodeUsing Rice Plants as Trap Crops: Preliminary Results
Stefano Sacchi 1,†, Giulia Torrini 2,*,†, Leonardo Marianelli 2, Giuseppe Mazza 2, Annachiara Fumagalli 3,
Beniamino Cavagna 4, Mariangela Ciampitti 3 and Pio Federico Roversi 2
Citation: Sacchi, S.; Torrini, G.;
Marianelli, L.; Mazza, G.; Fumagalli,
A.; Cavagna, B.; Ciampitti, M.;
Roversi, P.F. Control of Meloidogyne
graminicola a Root-Knot Nematode
Using Rice Plants as Trap Crops:
Preliminary Results. Agriculture 2021,
11, 37. https://doi.org/10.3390/
agriculture11010037
Received: 25 November 2020
Accepted: 6 January 2021
Published: 8 January 2021
Publisher’s Note: MDPI stays neutral
with regard to jurisdictional claims in
published maps and institutional affil-
iations.
Copyright: © 2021 by the authors.
Licensee MDPI, Basel, Switzerland.
This article is an open access article
distributed under the terms and
conditions of the Creative Commons
Attribution (CC BY) license (https://
creativecommons.org/licenses/by/
4.0/).
1 Lombardy Region Plant Health Service Laboratory in Fondazione Minoprio, Vertemate Con Minoprio,22070 Como, Italy; [email protected]
2 CREA Research Centre for Plant Protection and Certification, 50125 Florence, Italy;[email protected] (L.M.); [email protected] (G.M.);[email protected] (P.F.R.)
3 ERSAF Lombardy—Phytosanitary Service, 20124 Milan, Italy;[email protected] (A.F.); [email protected] (M.C.)
4 Lombardy Region—DG Agricoltura Servizio Fitosanitario Regionale, 20124 Milan, Italy;[email protected]
* Correspondence: [email protected]† These authors contributed equally to this work.
Abstract: Meloidogyne graminicola is one of the most harmful organisms in rice cultivation throughoutthe world. This pest was detected for the first time in mainland Europe (Northern Italy) in 2016 andwas subsequently added to the EPPO Alert List. To date, few methods are available for the controlof M. graminicola and new solutions are required. In 2019, field trials using rice plants as trap cropswere performed in a Lombardy region rice field where five plots for three different managementapproaches were staked out: (i) Uncultivated; (ii) Treated: three separate cycles of rice productionwhere plants were sown and destroyed each time at the second leaf stage; (iii) Control: rice wassown and left to grow until the end of the three cycles in treated plots. The results showed that inthe treated plots, the nematode density and the root gall index were lower than for the other twomanagement approaches. Moreover, the plant population density and rice plant growth were higherthan the uncultivated and control plots. In conclusion, the use of the trap crop technique for thecontrol of M. graminicola gave good results and thus it could be a new phytosanitary measure tocontrol this pest in rice crop areas.
Keywords: alien pest; Italy; Oryza sativa; phytosanitary measures; rice root-knot nematode; trap croptechnique; upland rice cultivation
1. Introduction
Root-knot nematodes (RKN), Meloidogyne spp., are obligate plant-parasitic nematodesthat cause serious damage and yield losses in a wide range of crops [1]. This group ofnematodes presents a wide range of herbaceous and woody host plants, including mono-cotyledons and dicotyledons [2]. Due to the importance of their economic impact, differentmanagement strategies have been developing to control these plant-parasitic nematodes,such as application of live microbes (e.g., bacteria, fungi) and/or their secondary metabo-lites, essential oils, plant extracts, ozonated water, silicon, steaming, and solarization. Theseenvironmentally benign strategies can be considered for replacing the chemicals commonlyused in agriculture [3].
Meloidogyne graminicola (which was first discovered by Golden and Birchfield in 1965(Nematoda: Meloidogynidae)), commonly named as the rice RKN, is considered as oneof the most important damaging parasites for upland, lowland, and deep-water rice cul-tivation throughout the world, particularly in South and Southeast Asia [4]. The second
Agriculture 2021, 11, 37. https://doi.org/10.3390/agriculture11010037 https://www.mdpi.com/journal/agriculture
119

Agriculture 2021, 11, 37
juvenile stage (J2) is the infective stage that hatches from the egg under favorable environ-mental conditions, finds the root, enters the meristematic zone, and induces the formationof giant galls by continuous feeding.
Rice is the most important host for rice RKN, but this nematode has a wide rangeof alternative hosts, including many weeds commonly found in rice fields that may offerrefuge to these nematodes [5,6].
Italy is the main rice-growing country in Europe, with 217,195 ha of rice in 2018 [7].The most important rice-growing area is the section of the Po River Valley straddling theregions of Lombardy and Piedmont (more than 202,000 hectares, 93% of the Italian ricesurface [7]). Meloidogyne graminicola was detected for the first time in mainland Europe (inthe Piedmont region, Northern Italy) in 2016 and was subsequently added to the EPPOAlert List [8,9]. To preserve the national rice production, the Italian National Plant Protec-tion Organization (NPPO) quickly issued phytosanitary measures to limit M. graminicoladamage and avoid its spread to new areas. The options to control M. graminicola are stilllimited and for many years, the use of nematicides has been the most efficient way tomanage this pest. Due to their negative impact on the environment and the implementationof new directives and regulations to reduce chemical applications [10], alternative strategiesare now needed to reduce RKN populations. Among the phytosanitary measures adoptedby the Italian NPPO (reported in the Ministerial Decree of 6 July 2017), rice field floodingseems to be one of the most efficient techniques to control the size of the M. graminicolapopulation, but in some areas of the Lombardy region, this practice is not applicable dueto the soil structure characterized by a low water retention capacity [11]. For this reason,some field trials using rice plants as trap crops were conducted to identify new controlstrategies against this pest.
Trap cropping is a practice for pest nematode control that has been used since the late1800s [12]. A susceptible host species is planted and nematode juveniles of a sedentaryparasitic nematode such as root-knot nematodes are stimulated to hatch and invade theroots and establish a feeding site on the plant. Once this colonization has occurred, and thefemales begin to mature, they are unable to leave the plant root. Before the nematodescomplete their life cycle, the crop is destroyed, avoiding a new soil infestation and thusreducing the nematode population.
In this study, among the various trap cropping techniques available, sequential trapcropping was chosen for the management of the rice RKN, since this technique involvesplants that are highly attractive to the pest and that are sown earlier than the main crop [13].
This study aimed to conduct a first-time evaluation of rice plant use in trap croptechniques for the management of this nematode pest, in areas where the rice field floodingis not applicable.
2. Materials and Methods
2.1. Study Area
The study was carried out in 2019 in a rice-cultivated area at the Cascina Scalinafarm, located in Garlasco (Pavia, Lombardy region, Italy) (45◦19′ N, 08◦89′ E, altitudeca. 43 m a.s.l.) within the rice crop district of Lomellina. The farm property consists of227 hectares, distributed in 127 ha for maize and 100 ha for rice cultivation. This area ischaracterized by a high level of field fragmentation (55 rice field of variable surfaces) andan extensive network of canals for irrigation.
The local climate is humid subtropical (Cfa) according to the Köppen climate clas-sification [14], with an average temperature of 21 ◦C and a cumulative rainfall depthof approximately 298 mm during the agricultural season (Data for April-September of2014–2019, ARPA Lombardy—http://www.arpalombardia.it). The study area was classi-fied as the Luvisol-Cambisol Region with Gleysols, developed on Alpine sediments thathave been deposited north of the Po river [15]. The soils are coarsely textured (sand > 80%),with a pH from sub-acidic to neutral and a low retention capacity [11].
120
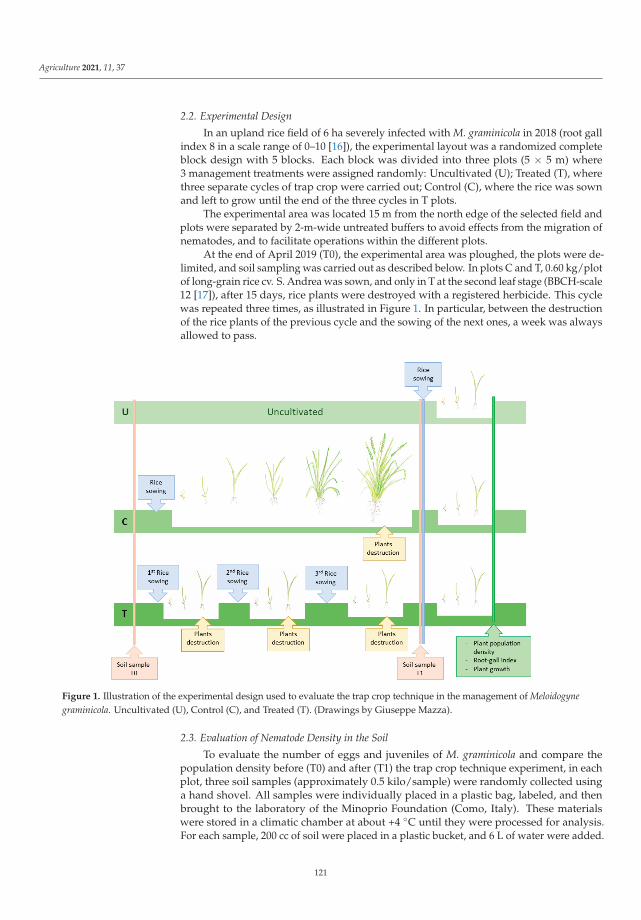
Agriculture 2021, 11, 37
2.2. Experimental Design
In an upland rice field of 6 ha severely infected with M. graminicola in 2018 (root gallindex 8 in a scale range of 0–10 [16]), the experimental layout was a randomized completeblock design with 5 blocks. Each block was divided into three plots (5 × 5 m) where3 management treatments were assigned randomly: Uncultivated (U); Treated (T), wherethree separate cycles of trap crop were carried out; Control (C), where the rice was sownand left to grow until the end of the three cycles in T plots.
The experimental area was located 15 m from the north edge of the selected field andplots were separated by 2-m-wide untreated buffers to avoid effects from the migration ofnematodes, and to facilitate operations within the different plots.
At the end of April 2019 (T0), the experimental area was ploughed, the plots were de-limited, and soil sampling was carried out as described below. In plots C and T, 0.60 kg/plotof long-grain rice cv. S. Andrea was sown, and only in T at the second leaf stage (BBCH-scale12 [17]), after 15 days, rice plants were destroyed with a registered herbicide. This cyclewas repeated three times, as illustrated in Figure 1. In particular, between the destructionof the rice plants of the previous cycle and the sowing of the next ones, a week was alwaysallowed to pass.
Figure 1. Illustration of the experimental design used to evaluate the trap crop technique in the management of Meloidogynegraminicola. Uncultivated (U), Control (C), and Treated (T). (Drawings by Giuseppe Mazza).
2.3. Evaluation of Nematode Density in the Soil
To evaluate the number of eggs and juveniles of M. graminicola and compare thepopulation density before (T0) and after (T1) the trap crop technique experiment, in eachplot, three soil samples (approximately 0.5 kilo/sample) were randomly collected usinga hand shovel. All samples were individually placed in a plastic bag, labeled, and thenbrought to the laboratory of the Minoprio Foundation (Como, Italy). These materialswere stored in a climatic chamber at about +4 ◦C until they were processed for analysis.For each sample, 200 cc of soil were placed in a plastic bucket, and 6 L of water were added.
121
Agriculture 2021, 11, 37
The resulting slurry was vigorously swirled for about 30 s, and after 45 s of sedimentationtime, the supernatant suspension was decanted through a 40 μm sieve. Water was againadded to the soil in the bucket and the process was repeated twice.
To dissolve the gelatinous matrices of the egg masses and obtain the suspension withnematodes, the sodium hypochlorite (5% NaOCI) technique described in Byrd et al. [18]and the centrifugal flotation method [19] were carried out. Nematodes were collected in aglass dish for examination and counted under an optical microscope LEICA MZ12 (LeicaMicrosystems, Heerbrugg, Switzerland).
2.4. Evaluation of the Plant Population Density
After the third cycle of trap crop, all experimental areas were mechanically worked todestroy rice plants and weeds, taking care not to transport soil from one plot to anotherwith the machines. Subsequently, each plot was sown with the same amount of rice (seeabove) at the same time. At the second leaf stage of the plants, in order to record the numberof rice plants per unit area, a circle frame (0.3 m2) quadrant was used. It was randomlylaunched five times in each plot and all plants rooted inside the circle were counted.
2.5. Evaluation of Root-Gall Index and Plant Growth
To evaluate the damages on plants, the gall index was assessed on the rooting systemand the plant growth was measured on the aerial part of the same plants.
At the same time of the evaluation of the plant population density, a representativesample (20–23 rice plants/plot) was collected with the whole root system. Plants of eachplot were placed in a labeled plastic bag and analyzed in the lab within 24 h of collection.
The roots were rinsed with tap water, placed on paper towels to eliminate excesswater, and observed to assess the severity of root damage caused by the amount of galling.The evaluation of root gall indices was studied visually using the root evaluation chartdeveloped by Bridge and Page [16].
The same plants were individually photographed (Canon PowerShot G3—Ota, Tokyo,Japan) with a bare scale, and the plant length (distance from the coleoptilar node to thetallest leaf) was recorded using ImageJ program (Image Processing and Analysis in Java)Version 1.53a (Wayne Rasband, National Institute of Health, Washington, DC, USA).
2.6. Statistical Analysis
To assess the influence of the managements (U, C, and T, see above) and the time(T0 and T1) on the total number of M. graminicola (eggs and juveniles) a generalizedmixed model (statistic: F), with a negative binomial probability distribution and a log linkfunction was run. The total number of nematodes was the dependent variable, while themanagement and the time was the fixed effect. Moreover, we considered the interactionmanagement x time.
To assess the influence of management on plant population density, a generalizedmixed model (statistic: F), with a negative binomial distribution and a log link functionwas run. The density of each case (each group of plants) was the dependent variable, whilemanagement (U, C, and T) was the fixed effect. The block id (5 different plots, each with5 groups of plants measured for each management) was included as a random effect.
The root-gall index in the soil among managements (U, C, and T) was compared withthe Kruskal-Wallis test (statistic: H) and post hoc Mann-Whitney pairwise (statistic: U; rawp values, sequential Bonferroni significance).
To assess the influence of management on plant growth, a generalized mixed model(statistic: F), with a normal probability distribution and an identity link function was run.The growth of each plant was the dependent variable, while the management (U, C, and T)was the fixed effect. The block id (5 different plots, each with a range of 17 to 23 plantsmeasured for each management) was included as a random effect.
To calculate the effect size, Cohen’s d as: d = (ma − mb)/s.d. was computed, where maand mb are the estimated marginal means of each category within the pairwise comparison,
122
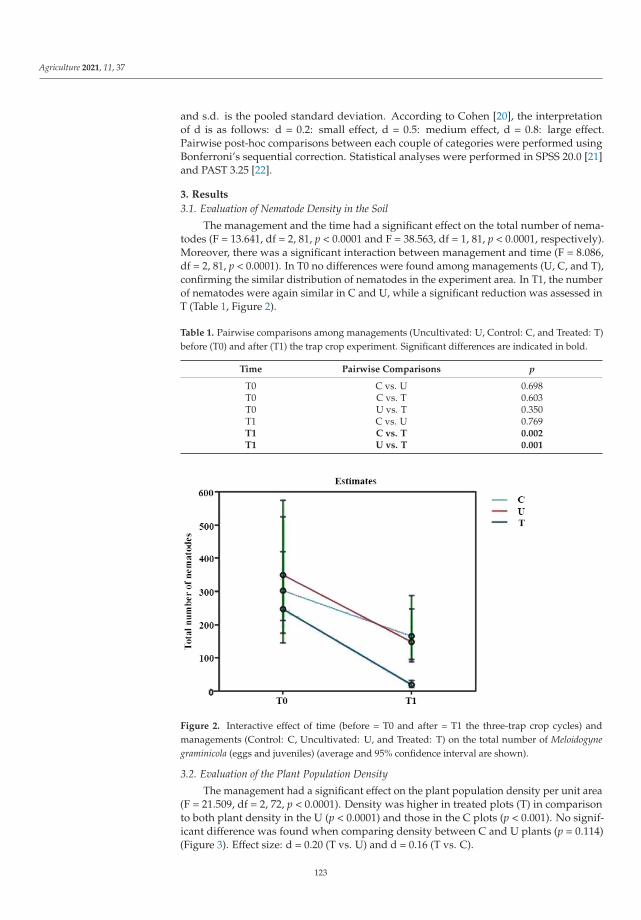
Agriculture 2021, 11, 37
and s.d. is the pooled standard deviation. According to Cohen [20], the interpretationof d is as follows: d = 0.2: small effect, d = 0.5: medium effect, d = 0.8: large effect.Pairwise post-hoc comparisons between each couple of categories were performed usingBonferroni’s sequential correction. Statistical analyses were performed in SPSS 20.0 [21]and PAST 3.25 [22].
3. Results
3.1. Evaluation of Nematode Density in the Soil
The management and the time had a significant effect on the total number of nema-todes (F = 13.641, df = 2, 81, p < 0.0001 and F = 38.563, df = 1, 81, p < 0.0001, respectively).Moreover, there was a significant interaction between management and time (F = 8.086,df = 2, 81, p < 0.0001). In T0 no differences were found among managements (U, C, and T),confirming the similar distribution of nematodes in the experiment area. In T1, the numberof nematodes were again similar in C and U, while a significant reduction was assessed inT (Table 1, Figure 2).
Table 1. Pairwise comparisons among managements (Uncultivated: U, Control: C, and Treated: T)before (T0) and after (T1) the trap crop experiment. Significant differences are indicated in bold.
Time Pairwise Comparisons p
T0 C vs. U 0.698T0 C vs. T 0.603T0 U vs. T 0.350T1 C vs. U 0.769T1 C vs. T 0.002T1 U vs. T 0.001
Figure 2. Interactive effect of time (before = T0 and after = T1 the three-trap crop cycles) andmanagements (Control: C, Uncultivated: U, and Treated: T) on the total number of Meloidogynegraminicola (eggs and juveniles) (average and 95% confidence interval are shown).
3.2. Evaluation of the Plant Population Density
The management had a significant effect on the plant population density per unit area(F = 21.509, df = 2, 72, p < 0.0001). Density was higher in treated plots (T) in comparisonto both plant density in the U (p < 0.0001) and those in the C plots (p < 0.001). No signif-icant difference was found when comparing density between C and U plants (p = 0.114)(Figure 3). Effect size: d = 0.20 (T vs. U) and d = 0.16 (T vs. C).
123
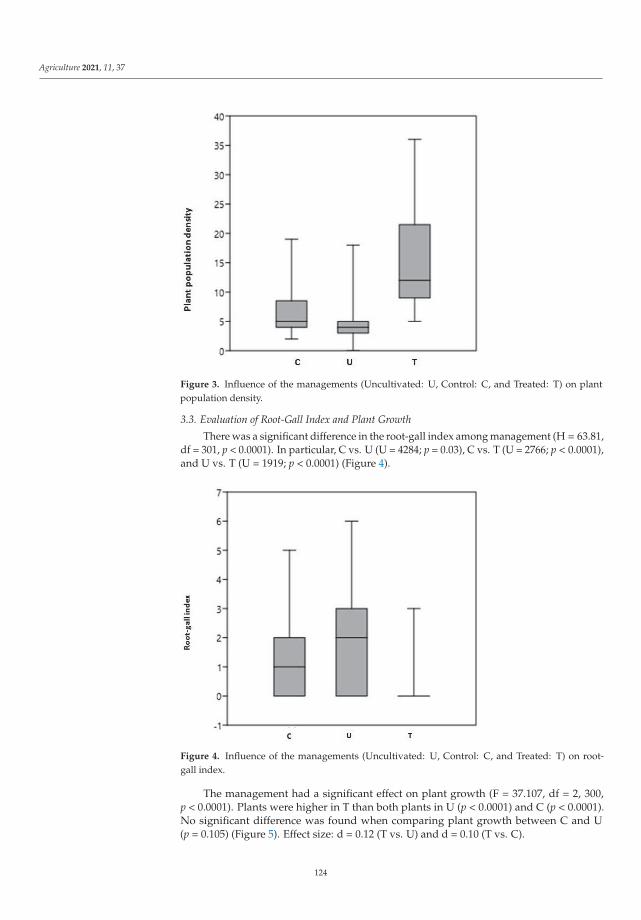
Agriculture 2021, 11, 37
Figure 3. Influence of the managements (Uncultivated: U, Control: C, and Treated: T) on plantpopulation density.
3.3. Evaluation of Root-Gall Index and Plant Growth
There was a significant difference in the root-gall index among management (H = 63.81,df = 301, p < 0.0001). In particular, C vs. U (U = 4284; p = 0.03), C vs. T (U = 2766; p < 0.0001),and U vs. T (U = 1919; p < 0.0001) (Figure 4).
Figure 4. Influence of the managements (Uncultivated: U, Control: C, and Treated: T) on root-gall index.
The management had a significant effect on plant growth (F = 37.107, df = 2, 300,p < 0.0001). Plants were higher in T than both plants in U (p < 0.0001) and C (p < 0.0001).No significant difference was found when comparing plant growth between C and U(p = 0.105) (Figure 5). Effect size: d = 0.12 (T vs. U) and d = 0.10 (T vs. C).
124

Agriculture 2021, 11, 37
Figure 5. Influence of the managements (Uncultivated: U, Control: C, and Treated: T) on plantgrowth. Bars indicate mean ± standard error.
4. Discussion
Trap cropping is a technique used in both ecological and agronomic fields and it isbased on the use of plant species, particularly attractants and species susceptible towardscertain pests, insects, or nematodes [23]. According to the characteristics of the plantused and the time or space of deploying, different modalities of trap cropping (perimeter,sequential, multiple, and push-pull) are reported for the management of different pests [13].Although trap cropping has usually been employed to control insect pests, few studieswere previously performed on nematodes, such as cyst nematodes [24–26], and root-knotnematodes [27–29].
In the present research, the trap crop technique was evaluated to reduce the populationdensity of Meloidogyne graminicola in upland rice field experiments where continuousflooding cannot be applied as a management practice to control this pest.
To select the most successful trap cropping method, the host range, biology, develop-ment, and multiplication, spread and survival strategies of the pest are pivotal informationfor the correct management [30].
Among the numerous host plants reported, Oryza sativa has been recorded to bethe most attractive and susceptible one to M. graminicola [6,31]. For this reason, it wasselected in this study as the trap crop plant. Concerning the time prior to the destruction,a sufficient period is required for the host plants to attract free-living second-stage juveniles(J2) and permit the root colonization to occur before nematode reproduction. In thiswork, the choice to destruct the rice plant at the second leaf stage (about 16–17 daysfrom sowing to the trap crop destruction) was based on bibliographic information [32,33],M. graminicola cycle observations in the field, and analysis in the laboratory during the 2019mandatory monitoring of this pest in the Lombardy region (Sacchi S, pers. obs.). In fact,Dabur et al. [32] observed that J2 of M. graminicola in the soil can enter the roots of hostplants from the 5th day of sprouted rice seed sowing, increasing their number in the rootsup to the 12th day of sowing. Moreover, from our observations, at the second/beginningthird leaf stage, only J2 were found inside the roots, while at the end third/beginningfourth leaf stage, mostly J3, J4, and males were present. The female presence was observedfrom the fourth leaf unfolded stage.
At the end of the experiment, a reduction of the total number of M. graminicolawas recorded only in the treated plots. Uncultivated and control managements gavesimilar results and are perhaps related to the several weeds present in the uncultivatedplots. Some of them, such as Echinocloa spp. and Cyperus spp. are known as host plantsof M. graminicola [6], and therefore the nematode can survive and reproduce in thesealternative hosts. This result confirms and encourages efficient weed management as animportant tool to maintain a low nematode population in infested fields [29].
125

Agriculture 2021, 11, 37
Concerning the reduction of the rice RKN number in the soil, the results also high-lighted positive consequences directly on the plant health status, and plant populationdensity per unit area, due to the lower stress. Indeed, the rice plants grown after the threetrap crop cycles showed a significantly lower infestation index in treated plots than bothcontrol and uncultivated ones, notwithstanding the low root-gall index in all the plots dueto the second leaf stage of the plants. Also, the rice plants grown in the treated plots weretaller by about 12% than both plants in the control and uncultivated plots at this stage ofplant development. Moreover, in the treated plots the plant population density increasedby 25% and 34% compared to the control and uncultivated ones, respectively.
5. Conclusions
In conclusion, these results show the efficacy of trap cropping for the management ofthe rice RKN phytosanitary problem in most rice-growing areas, especially those with watershortages. In climatic and pedological areas similar to the Lombardy region, the duration ofthe three trap crop cycles could be just over two months. This technique of decreasing thenematode population density in the soil, therefore, has a much shorter time of action thanflooding method (as indicated among the phytosanitary measures reported in MinisterialDecree of 6 July 2017). However, future studies are necessary to establish the most effectivenumber of trap crop cycles that are useful to reduce the presence of M. graminicola in theinfested soils, maintaining its density below the level that allows the optimal growth ofrice plants. Moreover, this technique could be also inserted in integrated pest managementprograms as a low environmental impact agronomic practice, compared to the floodingmethod, to control this damaging rice pest.
Author Contributions: Conceptualization, S.S., G.T., L.M., G.M., B.C., and M.C.; Methodology, G.T.,L.M., and G.M.; Software, G.M.; Validation, G.T., G.M., and L.M.; Formal Analysis, G.M. and G.T.;Investigation, S.S., G.T., L.M., A.F., G.M., B.C., and M.C.; Writing—Original Draft Preparation, G.T.,L.M., and G.M.; Writing—Review & Editing, G.T., L.M., G.M., M.C., and S.S.; Supervision, M.C.,B.C., and P.F.R.; Funding Acquisition, M.C., B.C., and P.F.R. All authors have read and agreed to thepublished version of the manuscript.
Funding: This research received no external funding.
Informed Consent Statement: Informed consent was obtained from all subjects involved in the study.
Data Availability Statement: The data presented in this study are available on request from thecorresponding author.
Acknowledgments: The authors thank Piersandro and Caterina Rossi, the owners of the CascinaScalina farm for their kind cooperation and Alessandro Cini for helpful statistical analysis. The au-thors also wish to thank Kathleen Collins Tostanoski for the English revision.
Conflicts of Interest: The authors declare no conflict of interest.
References
1. Perry, R.N.; Moens, M.; Starr, J.L. Root-Knot Nematodes; CABI Publishing: Wallingford, UK, 2009; p. 520.2. Eisenback, J.D.; Triantaphyllou, H.H. Root-knot nematodes: Meloidogyne species and races. In Manual of Agricultural Nematology;
Nickle, W.R., Ed.; Marcell Dekker: New York, NY, USA, 1991; pp. 191–274.3. Forghani, F.; Hajihassani, A. Recent advances in the development of environmentally benign treatments to control Root-Knot
Nematodes. Front. Plant Sci. 2020, 11, 1125. [CrossRef]4. Jain, R.K.; Khan, M.R.; Kumar, V. Rice root-knot nematode (Meloidogyne graminicola) infestation in rice. Arch. Phytopathol.
Plant Protect. 2012, 45, 635–645. [CrossRef]5. Rich, J.R.; Brito, J.A.; Kaur, R.; Ferrell, J.A. Weed specie s as hosts of Meloidogyne: A review. Nematropica 2009, 39, 157–185.6. Torrini, G.; Roversi, P.F.; Cesaroni, C.F.; Marianelli, L. Pest risk analysis of rice root-knot nematode (Meloidogyne graminicola) for
the Italian territory. EPPO Bull. 2020, 50, 330–339. [CrossRef]7. Ente Nazionale Risi. Riso—Evoluzione di Mercato e Sue Prospettive; MIPAAFT: Roma, Italy, 12 December 2018; pp. 1–48.8. EPPO. Reporting Service (2016/211); First Report of Meloidogyne Graminicola in Italy; EPPO: Roma, Italy, 2016.9. Fanelli, E.; Cotroneo, A.; Carisio, L.; Troccoli, A.; Grosso, S.; Boero, C.; Capriglia, F.; De Luca, F. Detection and molecular
characterization of the rice root-knot nematode Meloidogyne graminicola in Italy. Eur. J. Plant Pathol. 2017, 149, 467–476. [CrossRef]
126
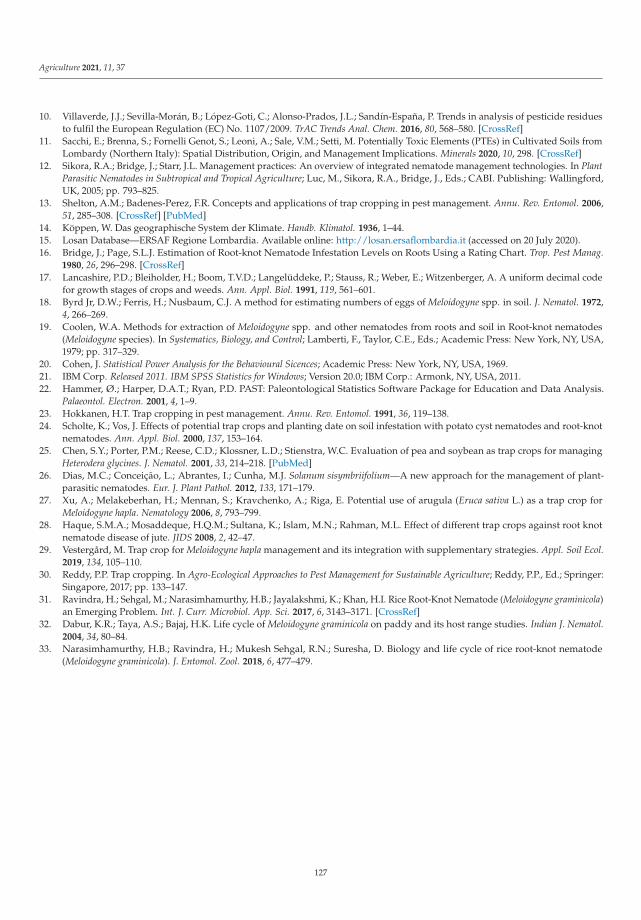
Agriculture 2021, 11, 37
10. Villaverde, J.J.; Sevilla-Morán, B.; López-Goti, C.; Alonso-Prados, J.L.; Sandín-España, P. Trends in analysis of pesticide residuesto fulfil the European Regulation (EC) No. 1107/2009. TrAC Trends Anal. Chem. 2016, 80, 568–580. [CrossRef]
11. Sacchi, E.; Brenna, S.; Fornelli Genot, S.; Leoni, A.; Sale, V.M.; Setti, M. Potentially Toxic Elements (PTEs) in Cultivated Soils fromLombardy (Northern Italy): Spatial Distribution, Origin, and Management Implications. Minerals 2020, 10, 298. [CrossRef]
12. Sikora, R.A.; Bridge, J.; Starr, J.L. Management practices: An overview of integrated nematode management technologies. In PlantParasitic Nematodes in Subtropical and Tropical Agriculture; Luc, M., Sikora, R.A., Bridge, J., Eds.; CABI. Publishing: Wallingford,UK, 2005; pp. 793–825.
13. Shelton, A.M.; Badenes-Perez, F.R. Concepts and applications of trap cropping in pest management. Annu. Rev. Entomol. 2006,51, 285–308. [CrossRef] [PubMed]
14. Köppen, W. Das geographische System der Klimate. Handb. Klimatol. 1936, 1–44.15. Losan Database—ERSAF Regione Lombardia. Available online: http://losan.ersaflombardia.it (accessed on 20 July 2020).16. Bridge, J.; Page, S.L.J. Estimation of Root-knot Nematode Infestation Levels on Roots Using a Rating Chart. Trop. Pest Manag.
1980, 26, 296–298. [CrossRef]17. Lancashire, P.D.; Bleiholder, H.; Boom, T.V.D.; Langelüddeke, P.; Stauss, R.; Weber, E.; Witzenberger, A. A uniform decimal code
for growth stages of crops and weeds. Ann. Appl. Biol. 1991, 119, 561–601.18. Byrd Jr, D.W.; Ferris, H.; Nusbaum, C.J. A method for estimating numbers of eggs of Meloidogyne spp. in soil. J. Nematol. 1972,
4, 266–269.19. Coolen, W.A. Methods for extraction of Meloidogyne spp. and other nematodes from roots and soil in Root-knot nematodes
(Meloidogyne species). In Systematics, Biology, and Control; Lamberti, F., Taylor, C.E., Eds.; Academic Press: New York, NY, USA,1979; pp. 317–329.
20. Cohen, J. Statistical Power Analysis for the Behavioural Sicences; Academic Press: New York, NY, USA, 1969.21. IBM Corp. Released 2011. IBM SPSS Statistics for Windows; Version 20.0; IBM Corp.: Armonk, NY, USA, 2011.22. Hammer, Ø.; Harper, D.A.T.; Ryan, P.D. PAST: Paleontological Statistics Software Package for Education and Data Analysis.
Palaeontol. Electron. 2001, 4, 1–9.23. Hokkanen, H.T. Trap cropping in pest management. Annu. Rev. Entomol. 1991, 36, 119–138.24. Scholte, K.; Vos, J. Effects of potential trap crops and planting date on soil infestation with potato cyst nematodes and root-knot
nematodes. Ann. Appl. Biol. 2000, 137, 153–164.25. Chen, S.Y.; Porter, P.M.; Reese, C.D.; Klossner, L.D.; Stienstra, W.C. Evaluation of pea and soybean as trap crops for managing
Heterodera glycines. J. Nematol. 2001, 33, 214–218. [PubMed]26. Dias, M.C.; Conceição, L.; Abrantes, I.; Cunha, M.J. Solanum sisymbriifolium—A new approach for the management of plant-
parasitic nematodes. Eur. J. Plant Pathol. 2012, 133, 171–179.27. Xu, A.; Melakeberhan, H.; Mennan, S.; Kravchenko, A.; Riga, E. Potential use of arugula (Eruca sativa L.) as a trap crop for
Meloidogyne hapla. Nematology 2006, 8, 793–799.28. Haque, S.M.A.; Mosaddeque, H.Q.M.; Sultana, K.; Islam, M.N.; Rahman, M.L. Effect of different trap crops against root knot
nematode disease of jute. JIDS 2008, 2, 42–47.29. Vestergård, M. Trap crop for Meloidogyne hapla management and its integration with supplementary strategies. Appl. Soil Ecol.
2019, 134, 105–110.30. Reddy, P.P. Trap cropping. In Agro-Ecological Approaches to Pest Management for Sustainable Agriculture; Reddy, P.P., Ed.; Springer:
Singapore, 2017; pp. 133–147.31. Ravindra, H.; Sehgal, M.; Narasimhamurthy, H.B.; Jayalakshmi, K.; Khan, H.I. Rice Root-Knot Nematode (Meloidogyne graminicola)
an Emerging Problem. Int. J. Curr. Microbiol. App. Sci. 2017, 6, 3143–3171. [CrossRef]32. Dabur, K.R.; Taya, A.S.; Bajaj, H.K. Life cycle of Meloidogyne graminicola on paddy and its host range studies. Indian J. Nematol.
2004, 34, 80–84.33. Narasimhamurthy, H.B.; Ravindra, H.; Mukesh Sehgal, R.N.; Suresha, D. Biology and life cycle of rice root-knot nematode
(Meloidogyne graminicola). J. Entomol. Zool. 2018, 6, 477–479.
127


agriculture
Review
Alternative Strategies for Controlling Wireworms in FieldCrops: A Review
Sylvain Poggi 1,*, Ronan Le Cointe 1, Jörn Lehmhus 2, Manuel Plantegenest 1 and Lorenzo Furlan 3
Citation: Poggi, S.; Le Cointe, R.;
Lehmhus, J.; Plantegenest, M.; Furlan,
L. Alternative Strategies for
Controlling Wireworms in Field
Crops: A Review. Agriculture 2021, 11,
436. https://doi.org/10.3390/
agriculture11050436
Academic Editor: Eric Blanchart
Received: 3 April 2021
Accepted: 7 May 2021
Published: 11 May 2021
Publisher’s Note: MDPI stays neutral
with regard to jurisdictional claims in
published maps and institutional affil-
iations.
Copyright: © 2021 by the authors.
Licensee MDPI, Basel, Switzerland.
This article is an open access article
distributed under the terms and
conditions of the Creative Commons
Attribution (CC BY) license (https://
creativecommons.org/licenses/by/
4.0/).
1 INRAE, Institute for Genetics, Environment and Plant Protection (IGEPP), Agrocampus Ouest,Université de Rennes, 35650 Le Rheu, France; [email protected] (R.L.C.);[email protected] (M.P.)
2 Institute for Plant Protection in Field Crops and Grassland, Julius Kühn-Institute,38104 Braunschweig, Germany; [email protected]
3 Veneto Agricoltura, 35020 Legnaro, Italy; [email protected]* Correspondence: [email protected]
Abstract: Wireworms, the soil-dwelling larvae of click beetles (Coleoptera: Elateridae), comprisemajor pests of several crops worldwide, including maize and potatoes. The current trend towardsthe reduction in pesticides use has resulted in strong demand for alternative methods to controlwireworm populations. This review provides a state-of-the-art of current theory and practice in orderto develop new agroecological strategies. The first step should be to conduct a risk assessment basedon the production context (e.g., crop, climate, soil characteristics, and landscape) and on adult and/orlarval population monitoring. When damage risk appears significant, prophylactic practices can beapplied to reduce wireworm abundance (e.g., low risk rotations, tilling, and irrigation). Additionally,curative methods based on natural enemies and on naturally derived insecticides are, respectively,under development or in practice in some countries. Alternatively, practices may target a reductionin crop damage instead of pest abundance through the adoption of selected cultural practices (e.g.,resistant varieties, planting and harvesting time) or through the manipulation of wireworm behavior(e.g., companion plants). Practices can be combined in a global Integrated Pest Management (IPM)framework to provide the desired level of crop protection.
Keywords: click beetle; crop damage; integrated pest management; risk assessment; pest monitoring;biocontrol; landscape feature; habitat manipulation; companion plant; mutual fund
1. Introduction
Agriculture is facing major challenges, i.e., global change and societal pressure topreserve the environment. Climate change may progressively alter the spatial distributionof species or their life cycle (e.g., voltinism), raising new concerns about crop protectionagainst pests and pathogens. Societal awareness of the deleterious effects of chemicalpesticides and fertilizers for both environmental and human health has increased with thepublication and dissemination of studies reporting dramatic declines in animal populationsand biodiversity (regarding entomofauna, see for example [1–3]), with change being calledfor in the agricultural production system, notably toward more environmentally friendlycrop-management practices. Such a demand sometimes spreads in the government bodies.In this respect, the European Union introduced Directive 128/2009/EC, which made theimplementation of Integrated Pest Management (IPM) principles compulsory, as describedby the European network ENDURE (www.endure-network.eu, accessed on 9th of May2021), and progressively banned various chemical products for which undesirable effectshad been evidenced (e.g., neonicotinoids for their severe impact on pollinators [4,5]). Newthreats to crops concomitantly with a reduced availability of pesticides have put farmersin a difficult situation, and calls have come for alternative strategies to control pests anddiseases, both preventative and curative.
Agriculture 2021, 11, 436. https://doi.org/10.3390/agriculture11050436 https://www.mdpi.com/journal/agriculture
129

Agriculture 2021, 11, 436
The control of wireworms, the soil-dwelling larvae of click beetles (Coleoptera: Elateri-dae), is a remarkable illustration of this issue, and is the focus of this review. Wireworms,of which there are thousands of species but only a few harmful to agricultural crops, havebeen notorious as major pests worldwide for a long time. At the beginning of the 20th cen-tury, when chemicals were much less used, wireworms were considered the most harmfulpests to arable crops [6]. Indeed, they can inflict severe economic damage on several majorarable crops (e.g., potato, maize, and cereals) across Europe and North America [7], and theresearch effort into controlling these pests has risen considerably over the last few decades(Figure 1). Wireworms are extremely polyphagous pests and feed on nearly all cultivated(all cereals; all kinds of vegetables including onions, leek, and garlic; maize; potatoes; sweetpotatoes; ornamentals, sugar beet and more) and wild plant species, including weeds.Additionally, most species relevant to agriculture are not only herbivorous but feed also onanimal preys available in the soil (insect larvae and pupae or earthworms). Some crops areless susceptible to wireworm damage in terms of stand and yields because of agronomiccharacteristics (plant growth rate and density, tissues susceptibility, sowing date). Thisleads to the perception that some crops are specifically attacked while this is in generalnot the case. Elaterids exhibit a prolonged larval stage in the soil before pupation. Basedon their life cycle, they fall into two groups: species overwintering as adults, and speciesnot overwintering as adults [8]. The life cycles lasts 1–5 years [6,9–12], with only the adultstage dwelling outside the soil: a few days for species non-overwintering at the adult stage,and several months for species overwintering at the adult stage. Incidentally, the spatialdistribution of species is changing probably due to climate change (e.g., A. sordidus is be-coming a major pest in parts of Germany [13]). Meanwhile, moratoriums imposed by manycountries on neonicotinoid seed treatments, as well as restrictions and deregistration ofseveral active substances, have fostered the search for alternative environmentally friendlysolutions for wireworm pest control.
Figure 1. Number of articles published annually from 1960 to 2020 (barplot) and their distributionacross countries (world map), according to the Web of Science request formulated on 30 March 2021as follows: (wireworm* OR (click AND beetle*) OR agriotes) AND (IPM OR biocontrol OR controlOR management OR regulation OR “risk assessment” OR “decision support” OR DSS). A total of386 articles were published over the period under study, with a sharp rise around 2005.
130

Agriculture 2021, 11, 436
Damage inflicted on crops results from the interaction between wireworm field abun-dance and host susceptibility under abiotic constraints. Alternative crop-protection strate-gies to the systematic use of chemicals should target one or both of these two componentsin order to contain damage under the economic threshold. Achieving this requires anin-depth understanding of pest biology and ecology and of host plant phenology, as wellas of the main processes at stake in their interactions. While the sensitive phenologicalstages of the host crop are often well-known, knowledge of the biology and ecology ofwireworms is still incomplete. As an example, while the duration of the feeding phasevaries according to larval instar [9,10,14], the entire life cycle of some species still needs tobe described (e.g., A. lineatus, A. sputator).
Strategies aiming at reducing wireworm densities below the economic threshold(when available) should integrate more than one practice with a partial impact and can beachieved through long-term management along the crop rotation and at different spatialscales. Preventive practices include applying crop rotations unfavorable to ovipositionand wireworm survival, tilling when edaphic conditions are conducive to destroying soil-dwelling life stages, incorporating plants or extracts with biofumigant and allelochemicalproperties into soil, the use of natural enemies for pest control, and the manipulation inspace and time of favorable areas (e.g., managing grassland regimes). Practices targetingthe containment of crop damage below an economic threshold (limitation of harmfulness)despite substantial larval densities rely on identifying optimal planting and harvest condi-tions, protecting the sensitive crop with attractive companion plants, increasing seedingrates, and planting more tolerant cultivars. Reaching a satisfactory level of crop protectionrequires a combination of agronomic practices, thereby designing an Integrated Pest Man-agement strategy (IPM) whose foundations are stated in Barzman et al. [15]. IPM facesthe challenge of assessing which protection methods are compatible and how to set theircombination so that the resulting crop protection has sufficient efficacy.
Our aim in this paper is to provide a comprehensive state-of-the-art of alternativewireworm management practices to insecticide use and suggest a holistic approach toexploiting them as IPM packages that include two or more alternative practices as re-placements for insecticides. First, considering that any relevant management strategyrequires accurate risk assessment, we address the question of risk assessment in terms ofwireworm infestation or crop damage and of wireworm population monitoring. Indeed, abasic efficient alternative to the preventive use of insecticides can be doing nothing whenrisk is low or waiving the planting of a susceptible crop where and when the risk is high.Then, we present the main pesticide-free methods for controlling wireworms and elaborateon their putative combinations within an IPM framework. Finally, we outline a futureresearch avenue that will lead to reduced use of insecticides for controlling wireworms infield crops.
2. Risk Assessment
Assessing the risk of wireworm infestation or crop damage is the first and mostefficient alternative to the preventive use of insecticides, as it provides guidance on theselection of fields with low risk of economic damage. Risk assessment relies on theevaluation of factors that favor field infestation or crop damage and is a preventive tool. Inits most advanced form, it consists of a decision-support system. It can also stem from themonitoring of pest populations, at different development stages, mainly at plot scale, andtrigger the adoption of corrective tactics or the adaptation of preventive strategies.
2.1. Evaluation of Risk Factors2.1.1. Risk Factors
Farmers’ expertise, studies and reviews dealing with wireworm biology and ecology,and control methods highlight different categories of the factors that drive wireworminfestation and result in crop damage (Table 1).
131
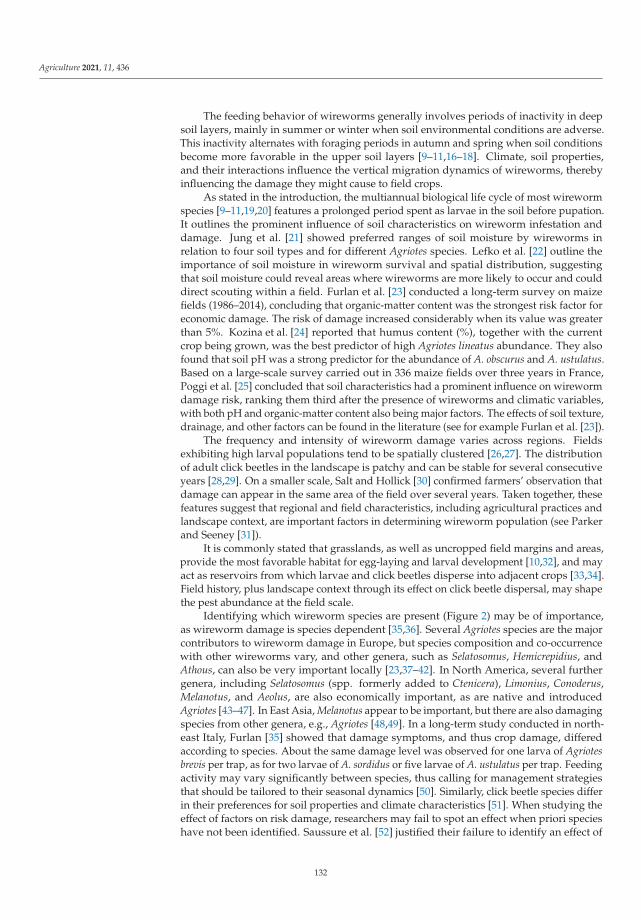
Agriculture 2021, 11, 436
The feeding behavior of wireworms generally involves periods of inactivity in deepsoil layers, mainly in summer or winter when soil environmental conditions are adverse.This inactivity alternates with foraging periods in autumn and spring when soil conditionsbecome more favorable in the upper soil layers [9–11,16–18]. Climate, soil properties,and their interactions influence the vertical migration dynamics of wireworms, therebyinfluencing the damage they might cause to field crops.
As stated in the introduction, the multiannual biological life cycle of most wirewormspecies [9–11,19,20] features a prolonged period spent as larvae in the soil before pupation.It outlines the prominent influence of soil characteristics on wireworm infestation anddamage. Jung et al. [21] showed preferred ranges of soil moisture by wireworms inrelation to four soil types and for different Agriotes species. Lefko et al. [22] outline theimportance of soil moisture in wireworm survival and spatial distribution, suggestingthat soil moisture could reveal areas where wireworms are more likely to occur and coulddirect scouting within a field. Furlan et al. [23] conducted a long-term survey on maizefields (1986–2014), concluding that organic-matter content was the strongest risk factor foreconomic damage. The risk of damage increased considerably when its value was greaterthan 5%. Kozina et al. [24] reported that humus content (%), together with the currentcrop being grown, was the best predictor of high Agriotes lineatus abundance. They alsofound that soil pH was a strong predictor for the abundance of A. obscurus and A. ustulatus.Based on a large-scale survey carried out in 336 maize fields over three years in France,Poggi et al. [25] concluded that soil characteristics had a prominent influence on wirewormdamage risk, ranking them third after the presence of wireworms and climatic variables,with both pH and organic-matter content also being major factors. The effects of soil texture,drainage, and other factors can be found in the literature (see for example Furlan et al. [23]).
The frequency and intensity of wireworm damage varies across regions. Fieldsexhibiting high larval populations tend to be spatially clustered [26,27]. The distributionof adult click beetles in the landscape is patchy and can be stable for several consecutiveyears [28,29]. On a smaller scale, Salt and Hollick [30] confirmed farmers’ observation thatdamage can appear in the same area of the field over several years. Taken together, thesefeatures suggest that regional and field characteristics, including agricultural practices andlandscape context, are important factors in determining wireworm population (see Parkerand Seeney [31]).
It is commonly stated that grasslands, as well as uncropped field margins and areas,provide the most favorable habitat for egg-laying and larval development [10,32], and mayact as reservoirs from which larvae and click beetles disperse into adjacent crops [33,34].Field history, plus landscape context through its effect on click beetle dispersal, may shapethe pest abundance at the field scale.
Identifying which wireworm species are present (Figure 2) may be of importance,as wireworm damage is species dependent [35,36]. Several Agriotes species are the majorcontributors to wireworm damage in Europe, but species composition and co-occurrencewith other wireworms vary, and other genera, such as Selatosomus, Hemicrepidius, andAthous, can also be very important locally [23,37–42]. In North America, several furthergenera, including Selatosomus (spp. formerly added to Ctenicera), Limonius, Conoderus,Melanotus, and Aeolus, are also economically important, as are native and introducedAgriotes [43–47]. In East Asia, Melanotus appear to be important, but there are also damagingspecies from other genera, e.g., Agriotes [48,49]. In a long-term study conducted in north-east Italy, Furlan [35] showed that damage symptoms, and thus crop damage, differedaccording to species. About the same damage level was observed for one larva of Agriotesbrevis per trap, as for two larvae of A. sordidus or five larvae of A. ustulatus per trap. Feedingactivity may vary significantly between species, thus calling for management strategiesthat should be tailored to their seasonal dynamics [50]. Similarly, click beetle species differin their preferences for soil properties and climate characteristics [51]. When studying theeffect of factors on risk damage, researchers may fail to spot an effect when priori specieshave not been identified. Saussure et al. [52] justified their failure to identify an effect of
132

Agriculture 2021, 11, 436
soil properties by the fact that they did not distinguish between the wireworm speciespresent in the surveyed fields.
Eventually, agricultural practices alter the pest population and crop damage, therebyproviding the components of putative prevention strategies (§3). For example, whenappropriately applied, tillage reduces populations of eggs and young larvae by damagingthem mechanically. Furthermore, delaying the sowing date may help reduce damage bydesynchronizing the period of wireworm presence in the upper soil layers and the periodduring which the field crop is sensitive to wireworm attacks.
Table 1. List of risk factors driving wireworm infestation and resulting in crop damage. Cited references provide examplesof studies evaluating the risk factor, without any claim for exhaustiveness. A considerable effort would be required toachieve an overview of all situations in terms of species × crop × location.
Risk FactorPotential forIncreasing
Damage RiskFactor Effect Reference
Climate
Soil temperature Medium–High
↑ T ◦C before seeding ⇒ ↓ damage riskand ~12 ◦C threshold (Agriotes spp. in maize)
↑ T ◦C ⇒ ↑ total abundance of wireworm communityin cereals, Northern USA
↑ T ◦C ⇒ ↓ abundance of S. pruininus in cereals
[21,22,24,25,53]
Rainfall Medium Depends on the species and the period under consideration [22–25]
Soil properties
Organic mattercontent Medium–High ↑ OM ⇒ ↑ risk
High risk when OM>5% (Agriotes spp.) [23–25,52]
Soil moisture Medium–High↑mean frequency of days above a moisture threshold ⇒
↓ wireworm occurrence (IA, USA)Soil-dependent
[21,22]
pH Medium Low pH ⇒ ↑ damage risk in maize (Agriotes spp.)Increased abundance in L. californicus with higher soil pH [24,25,53]
Texture Low Loam soil ⇒ ↓ damage risk [22–25,52,53]
Drainage Medium Bad drainage ⇒ ↓ damage risk [23,25]
Current agricultural practices
Sowing date Medium Late sowing (maize) ⇒ ↑ risk [23,25,52]
Tillage Medium–High Ploughing during summer ⇒ ↓ damage risk in sweet potato [54]
Fertilizer application Low Slight decrease in damage caused by Agriotes spp. in maize iffertilization compared to none [25]
Past agricultural practices
Tillage Medium–High Intense tillage decreases damage risk compared toreduced tillage [55]
Field configuration
Topography Low No significant effect [25,32]
Exposition Low Very weak difference in damage caused by Agriotes spp.in maize [25,32]
133
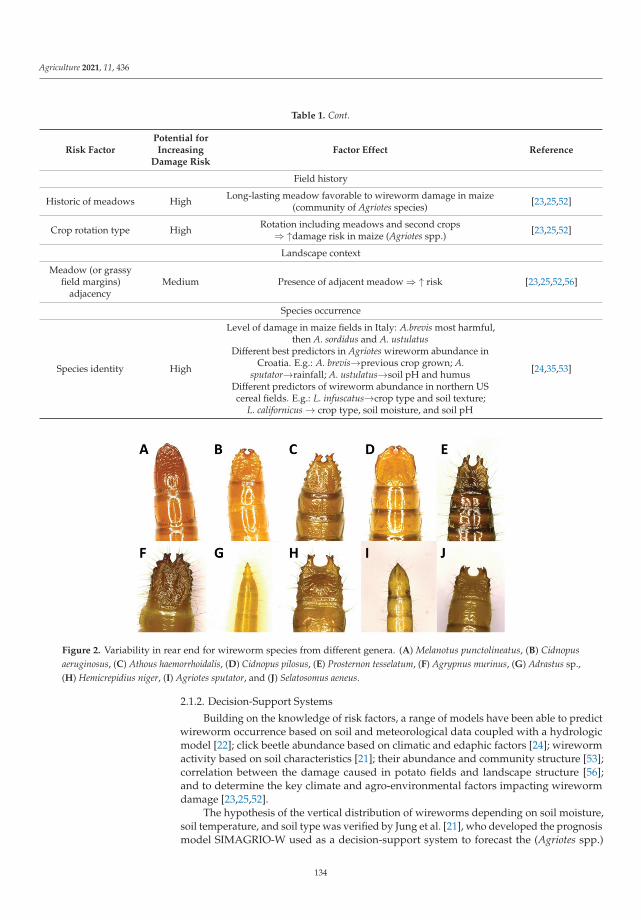
Agriculture 2021, 11, 436
Table 1. Cont.
Risk FactorPotential forIncreasing
Damage RiskFactor Effect Reference
Field history
Historic of meadows High Long-lasting meadow favorable to wireworm damage in maize(community of Agriotes species) [23,25,52]
Crop rotation type High Rotation including meadows and second crops⇒ ↑damage risk in maize (Agriotes spp.) [23,25,52]
Landscape context
Meadow (or grassyfield margins)
adjacencyMedium Presence of adjacent meadow ⇒ ↑ risk [23,25,52,56]
Species occurrence
Species identity High
Level of damage in maize fields in Italy: A.brevis most harmful,then A. sordidus and A. ustulatus
Different best predictors in Agriotes wireworm abundance inCroatia. E.g.: A. brevis→previous crop grown; A.
sputator→rainfall; A. ustulatus→soil pH and humusDifferent predictors of wireworm abundance in northern UScereal fields. E.g.: L. infuscatus→crop type and soil texture;
L. californicus → crop type, soil moisture, and soil pH
[24,35,53]
Figure 2. Variability in rear end for wireworm species from different genera. (A) Melanotus punctolineatus, (B) Cidnopusaeruginosus, (C) Athous haemorrhoidalis, (D) Cidnopus pilosus, (E) Prosternon tesselatum, (F) Agrypnus murinus, (G) Adrastus sp.,(H) Hemicrepidius niger, (I) Agriotes sputator, and (J) Selatosomus aeneus.
2.1.2. Decision-Support Systems
Building on the knowledge of risk factors, a range of models have been able to predictwireworm occurrence based on soil and meteorological data coupled with a hydrologicmodel [22]; click beetle abundance based on climatic and edaphic factors [24]; wirewormactivity based on soil characteristics [21]; their abundance and community structure [53];correlation between the damage caused in potato fields and landscape structure [56];and to determine the key climate and agro-environmental factors impacting wirewormdamage [23,25,52].
The hypothesis of the vertical distribution of wireworms depending on soil moisture,soil temperature, and soil type was verified by Jung et al. [21], who developed the prognosismodel SIMAGRIO-W used as a decision-support system to forecast the (Agriotes spp.)
134
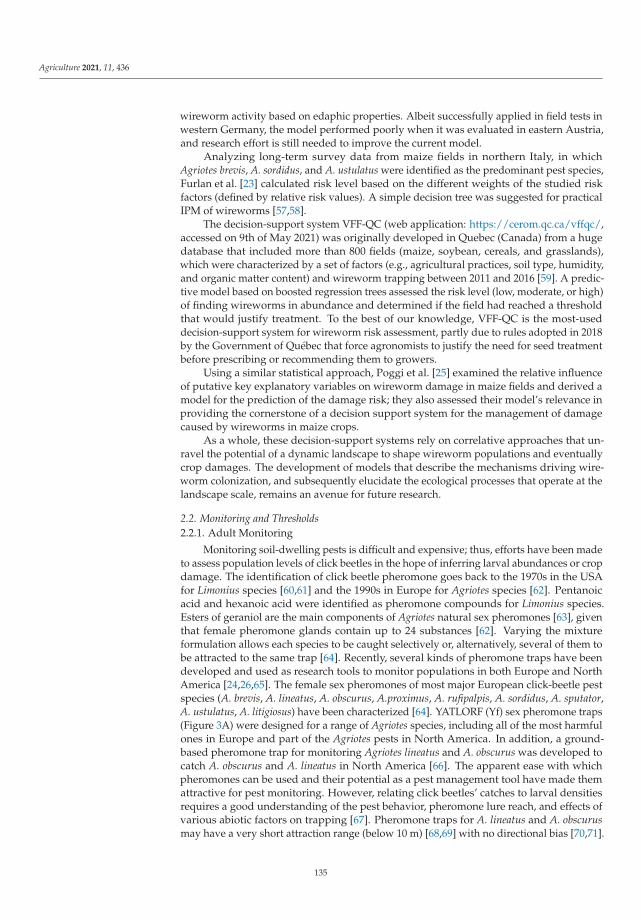
Agriculture 2021, 11, 436
wireworm activity based on edaphic properties. Albeit successfully applied in field tests inwestern Germany, the model performed poorly when it was evaluated in eastern Austria,and research effort is still needed to improve the current model.
Analyzing long-term survey data from maize fields in northern Italy, in whichAgriotes brevis, A. sordidus, and A. ustulatus were identified as the predominant pest species,Furlan et al. [23] calculated risk level based on the different weights of the studied riskfactors (defined by relative risk values). A simple decision tree was suggested for practicalIPM of wireworms [57,58].
The decision-support system VFF-QC (web application: https://cerom.qc.ca/vffqc/,accessed on 9th of May 2021) was originally developed in Quebec (Canada) from a hugedatabase that included more than 800 fields (maize, soybean, cereals, and grasslands),which were characterized by a set of factors (e.g., agricultural practices, soil type, humidity,and organic matter content) and wireworm trapping between 2011 and 2016 [59]. A predic-tive model based on boosted regression trees assessed the risk level (low, moderate, or high)of finding wireworms in abundance and determined if the field had reached a thresholdthat would justify treatment. To the best of our knowledge, VFF-QC is the most-useddecision-support system for wireworm risk assessment, partly due to rules adopted in 2018by the Government of Québec that force agronomists to justify the need for seed treatmentbefore prescribing or recommending them to growers.
Using a similar statistical approach, Poggi et al. [25] examined the relative influenceof putative key explanatory variables on wireworm damage in maize fields and derived amodel for the prediction of the damage risk; they also assessed their model’s relevance inproviding the cornerstone of a decision support system for the management of damagecaused by wireworms in maize crops.
As a whole, these decision-support systems rely on correlative approaches that un-ravel the potential of a dynamic landscape to shape wireworm populations and eventuallycrop damages. The development of models that describe the mechanisms driving wire-worm colonization, and subsequently elucidate the ecological processes that operate at thelandscape scale, remains an avenue for future research.
2.2. Monitoring and Thresholds2.2.1. Adult Monitoring
Monitoring soil-dwelling pests is difficult and expensive; thus, efforts have been madeto assess population levels of click beetles in the hope of inferring larval abundances or cropdamage. The identification of click beetle pheromone goes back to the 1970s in the USAfor Limonius species [60,61] and the 1990s in Europe for Agriotes species [62]. Pentanoicacid and hexanoic acid were identified as pheromone compounds for Limonius species.Esters of geraniol are the main components of Agriotes natural sex pheromones [63], giventhat female pheromone glands contain up to 24 substances [62]. Varying the mixtureformulation allows each species to be caught selectively or, alternatively, several of them tobe attracted to the same trap [64]. Recently, several kinds of pheromone traps have beendeveloped and used as research tools to monitor populations in both Europe and NorthAmerica [24,26,65]. The female sex pheromones of most major European click-beetle pestspecies (A. brevis, A. lineatus, A. obscurus, A.proximus, A. rufipalpis, A. sordidus, A. sputator,A. ustulatus, A. litigiosus) have been characterized [64]. YATLORF (Yf) sex pheromone traps(Figure 3A) were designed for a range of Agriotes species, including all of the most harmfulones in Europe and part of the Agriotes pests in North America. In addition, a ground-based pheromone trap for monitoring Agriotes lineatus and A. obscurus was developed tocatch A. obscurus and A. lineatus in North America [66]. The apparent ease with whichpheromones can be used and their potential as a pest management tool have made themattractive for pest monitoring. However, relating click beetles’ catches to larval densitiesrequires a good understanding of the pest behavior, pheromone lure reach, and effects ofvarious abiotic factors on trapping [67]. Pheromone traps for A. lineatus and A. obscurusmay have a very short attraction range (below 10 m) [68,69] with no directional bias [70,71].
135
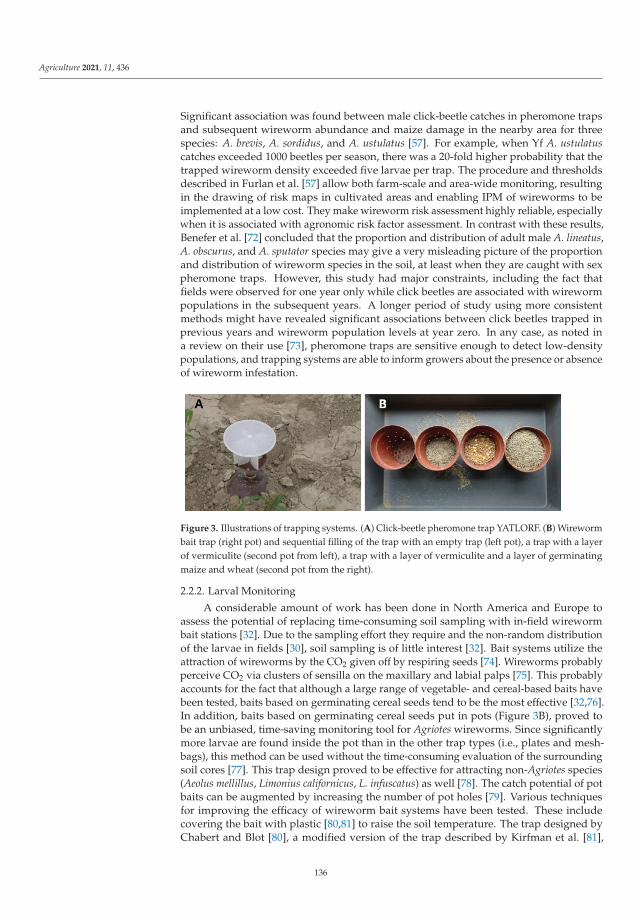
Agriculture 2021, 11, 436
Significant association was found between male click-beetle catches in pheromone trapsand subsequent wireworm abundance and maize damage in the nearby area for threespecies: A. brevis, A. sordidus, and A. ustulatus [57]. For example, when Yf A. ustulatuscatches exceeded 1000 beetles per season, there was a 20-fold higher probability that thetrapped wireworm density exceeded five larvae per trap. The procedure and thresholdsdescribed in Furlan et al. [57] allow both farm-scale and area-wide monitoring, resultingin the drawing of risk maps in cultivated areas and enabling IPM of wireworms to beimplemented at a low cost. They make wireworm risk assessment highly reliable, especiallywhen it is associated with agronomic risk factor assessment. In contrast with these results,Benefer et al. [72] concluded that the proportion and distribution of adult male A. lineatus,A. obscurus, and A. sputator species may give a very misleading picture of the proportionand distribution of wireworm species in the soil, at least when they are caught with sexpheromone traps. However, this study had major constraints, including the fact thatfields were observed for one year only while click beetles are associated with wirewormpopulations in the subsequent years. A longer period of study using more consistentmethods might have revealed significant associations between click beetles trapped inprevious years and wireworm population levels at year zero. In any case, as noted ina review on their use [73], pheromone traps are sensitive enough to detect low-densitypopulations, and trapping systems are able to inform growers about the presence or absenceof wireworm infestation.
Figure 3. Illustrations of trapping systems. (A) Click-beetle pheromone trap YATLORF. (B) Wirewormbait trap (right pot) and sequential filling of the trap with an empty trap (left pot), a trap with a layerof vermiculite (second pot from left), a trap with a layer of vermiculite and a layer of germinatingmaize and wheat (second pot from the right).
2.2.2. Larval Monitoring
A considerable amount of work has been done in North America and Europe toassess the potential of replacing time-consuming soil sampling with in-field wirewormbait stations [32]. Due to the sampling effort they require and the non-random distributionof the larvae in fields [30], soil sampling is of little interest [32]. Bait systems utilize theattraction of wireworms by the CO2 given off by respiring seeds [74]. Wireworms probablyperceive CO2 via clusters of sensilla on the maxillary and labial palps [75]. This probablyaccounts for the fact that although a large range of vegetable- and cereal-based baits havebeen tested, baits based on germinating cereal seeds tend to be the most effective [32,76].In addition, baits based on germinating cereal seeds put in pots (Figure 3B), proved tobe an unbiased, time-saving monitoring tool for Agriotes wireworms. Since significantlymore larvae are found inside the pot than in the other trap types (i.e., plates and mesh-bags), this method can be used without the time-consuming evaluation of the surroundingsoil cores [77]. This trap design proved to be effective for attracting non-Agriotes species(Aeolus mellillus, Limonius californicus, L. infuscatus) as well [78]. The catch potential of potbaits can be augmented by increasing the number of pot holes [79]. Various techniquesfor improving the efficacy of wireworm bait systems have been tested. These includecovering the bait with plastic [80,81] to raise the soil temperature. The trap designed byChabert and Blot [80], a modified version of the trap described by Kirfman et al. [81],
136

Agriculture 2021, 11, 436
comprises a 650 mL plastic pot (10 cm in diameter) with holes (the ordinary number ofthose used for tree nursery) in the bottom. The pots are filled with vermiculite, 30 mLof wheat seeds, and 30 mL of maize seeds; they are then moistened before being placedinto the soil 4–5 cm below the soil surface, after which they are covered with an 18 cmdiameter plastic lid placed 1–2 cm above the pot rim. These traps have been used long termfollowing a standardized procedure by Furlan [35]: traps were hand-sorted after 10 dayswhen the average temperature 10 cm beneath the surface was above 8 ◦C [9,10] to ensurethat the bait traps stayed in the soil for an equal period of wireworm activity. The finalnumber of larvae was assessed under the aforementioned conditions, regardless of larvaebehavior on individual days. Population levels should be assessed only when humidityis close to field water capacity. Indeed, dry top-soil forces larvae to burrow deep beneaththe surface, away from the bait traps [9], and high humidity (flooding in extreme cases)prevents larval activity since all the soil pores are full of water and contain no oxygen.
2.2.3. IPM Thresholds
IPM implementation needs a standardized monitoring method combined with reliabledamage thresholds. The aforementioned bait-trap monitoring method has given reliableresults over sites and years and might be considered as a standard both for ordinarywireworm IPM implementation and for the assessment of damage thresholds for otherwireworm species/crop combinations.
Although increasing literature about wireworms has been published over the lastfew years (Figure 1), to our knowledge, only four papers report practical IPM damagethresholds, with them being restricted to five species and two crops: Melanotus communisthresholds in sugarcane crops [82], Agriotes brevis, A. sordidus, A. ustulatus [35,57], andA. lineatus [80] in maize crops. Published thresholds are summarized in Table 2. Otherpapers supply information about crop susceptibility to wireworms that allows an indirectestimation of damage thresholds. Furlan et al. [20] carried out pot trials that introduced thesame number of wireworms per pot for different crops. Results showed a large variation incrop susceptibility. A number (6/pot) of wireworms (A. ustulatus, A. sordidus) causing a 50%maize and sunflower plant loss, had a negligible effect on soybean but killed most of thesugar-beet seedlings. Likewise, Griffith [83] demonstrated differences in plant susceptibilityto wireworm attacks in laboratory tests. Larvae of Agriotes spp. were presented with achoice between the seedlings of test plants and of wheat, which is known to be susceptible.Some plants, e.g., onion, were as susceptible as wheat to wireworm attacks, whilst others(mustard, cabbage, French marigold, clover, and flax) were attacked less often. All peaand bean plants exposed to wireworms were attacked, but most tolerated the attacksand continued to grow. Old generic thresholds based on larval density assessed by soilsampling have low scientific reliability and little practical potential [32], one reason beingthat none of the wireworm species studied were specified.
Table 2. Published damage thresholds according to click-beetle species, crop, and monitoring method.
Elateridae Species Crop Tool Threshold (Larvae/Trap)Threshold
(Beetles/Season)Threshold Reference
Agriotes brevis Maize Bait trap 1 [35,57]
Agriotes sordidus Maize Bait trap 2 [35,57]
Agriotes ustulatus Maize Bait trap 5 [35,57]
Agriotes lineatus Maize Bait trap 1–2 (seeding before 1st May) [80] *
Agriotes brevis Maize Yf pheromone trap 210/450 [57]
Agriotes sordidus Maize Yf pheromone trap 1100 [57]
Agriotes ustulatus Maize Yf pheromone trap 1000 [57]
Melanotus communis Sugarcane Soil samples takenin sequence to 25
8 wireworms foundin total samples [82]
* Derived data published in the cited paper; plant damage was lower than 15% with 1–2 wireworms per trap. Wireworm plant damagelower than 15% in maize should not result in yield reduction [23].
137
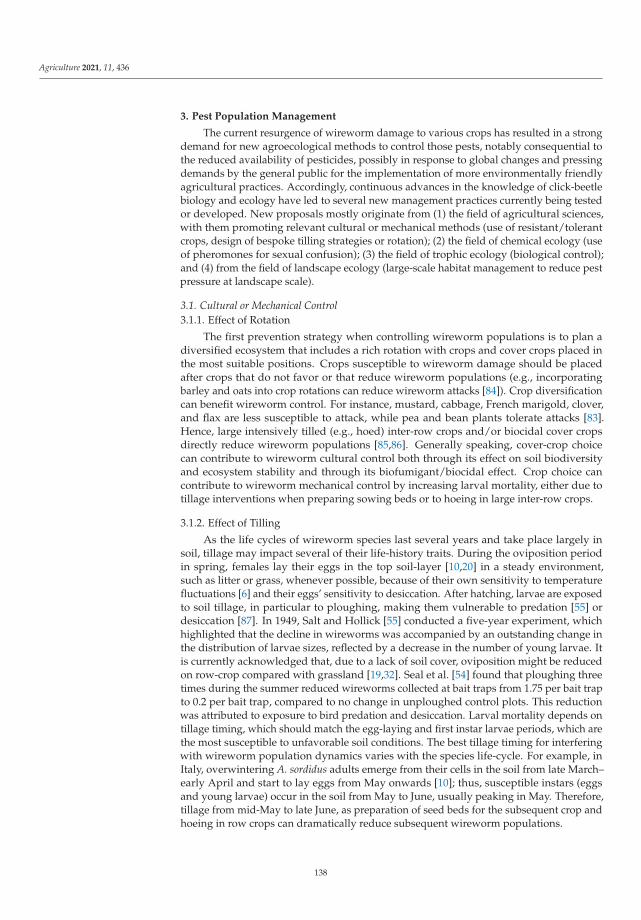
Agriculture 2021, 11, 436
3. Pest Population Management
The current resurgence of wireworm damage to various crops has resulted in a strongdemand for new agroecological methods to control those pests, notably consequential tothe reduced availability of pesticides, possibly in response to global changes and pressingdemands by the general public for the implementation of more environmentally friendlyagricultural practices. Accordingly, continuous advances in the knowledge of click-beetlebiology and ecology have led to several new management practices currently being testedor developed. New proposals mostly originate from (1) the field of agricultural sciences,with them promoting relevant cultural or mechanical methods (use of resistant/tolerantcrops, design of bespoke tilling strategies or rotation); (2) the field of chemical ecology (useof pheromones for sexual confusion); (3) the field of trophic ecology (biological control);and (4) from the field of landscape ecology (large-scale habitat management to reduce pestpressure at landscape scale).
3.1. Cultural or Mechanical Control3.1.1. Effect of Rotation
The first prevention strategy when controlling wireworm populations is to plan adiversified ecosystem that includes a rich rotation with crops and cover crops placed inthe most suitable positions. Crops susceptible to wireworm damage should be placedafter crops that do not favor or that reduce wireworm populations (e.g., incorporatingbarley and oats into crop rotations can reduce wireworm attacks [84]). Crop diversificationcan benefit wireworm control. For instance, mustard, cabbage, French marigold, clover,and flax are less susceptible to attack, while pea and bean plants tolerate attacks [83].Hence, large intensively tilled (e.g., hoed) inter-row crops and/or biocidal cover cropsdirectly reduce wireworm populations [85,86]. Generally speaking, cover-crop choicecan contribute to wireworm cultural control both through its effect on soil biodiversityand ecosystem stability and through its biofumigant/biocidal effect. Crop choice cancontribute to wireworm mechanical control by increasing larval mortality, either due totillage interventions when preparing sowing beds or to hoeing in large inter-row crops.
3.1.2. Effect of Tilling
As the life cycles of wireworm species last several years and take place largely insoil, tillage may impact several of their life-history traits. During the oviposition periodin spring, females lay their eggs in the top soil-layer [10,20] in a steady environment,such as litter or grass, whenever possible, because of their own sensitivity to temperaturefluctuations [6] and their eggs’ sensitivity to desiccation. After hatching, larvae are exposedto soil tillage, in particular to ploughing, making them vulnerable to predation [55] ordesiccation [87]. In 1949, Salt and Hollick [55] conducted a five-year experiment, whichhighlighted that the decline in wireworms was accompanied by an outstanding change inthe distribution of larvae sizes, reflected by a decrease in the number of young larvae. Itis currently acknowledged that, due to a lack of soil cover, oviposition might be reducedon row-crop compared with grassland [19,32]. Seal et al. [54] found that ploughing threetimes during the summer reduced wireworms collected at bait traps from 1.75 per bait trapto 0.2 per bait trap, compared to no change in unploughed control plots. This reductionwas attributed to exposure to bird predation and desiccation. Larval mortality depends ontillage timing, which should match the egg-laying and first instar larvae periods, which arethe most susceptible to unfavorable soil conditions. The best tillage timing for interferingwith wireworm population dynamics varies with the species life-cycle. For example, inItaly, overwintering A. sordidus adults emerge from their cells in the soil from late March–early April and start to lay eggs from May onwards [10]; thus, susceptible instars (eggsand young larvae) occur in the soil from May to June, usually peaking in May. Therefore,tillage from mid-May to late June, as preparation of seed beds for the subsequent crop andhoeing in row crops can dramatically reduce subsequent wireworm populations.
138
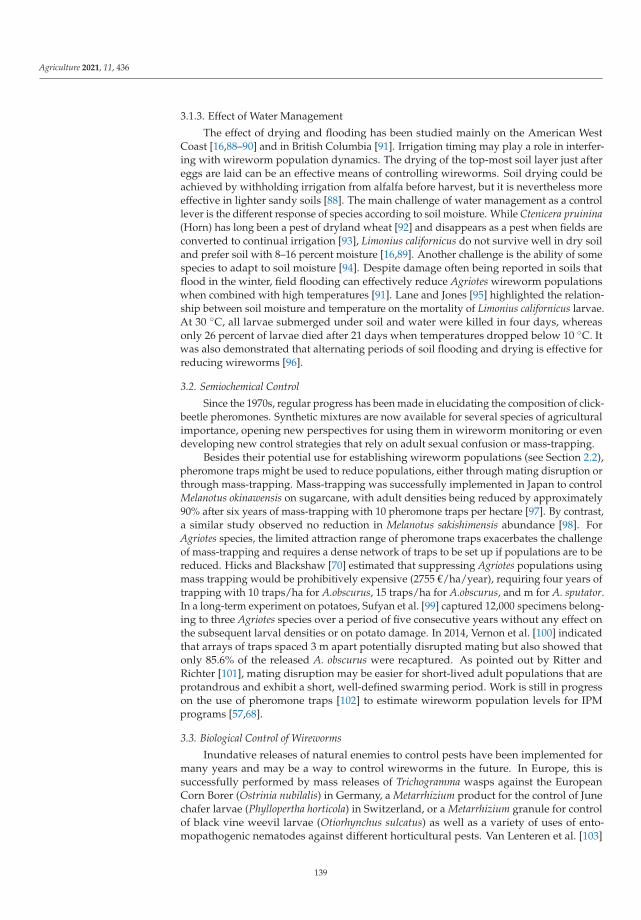
Agriculture 2021, 11, 436
3.1.3. Effect of Water Management
The effect of drying and flooding has been studied mainly on the American WestCoast [16,88–90] and in British Columbia [91]. Irrigation timing may play a role in interfer-ing with wireworm population dynamics. The drying of the top-most soil layer just aftereggs are laid can be an effective means of controlling wireworms. Soil drying could beachieved by withholding irrigation from alfalfa before harvest, but it is nevertheless moreeffective in lighter sandy soils [88]. The main challenge of water management as a controllever is the different response of species according to soil moisture. While Ctenicera pruinina(Horn) has long been a pest of dryland wheat [92] and disappears as a pest when fields areconverted to continual irrigation [93], Limonius californicus do not survive well in dry soiland prefer soil with 8–16 percent moisture [16,89]. Another challenge is the ability of somespecies to adapt to soil moisture [94]. Despite damage often being reported in soils thatflood in the winter, field flooding can effectively reduce Agriotes wireworm populationswhen combined with high temperatures [91]. Lane and Jones [95] highlighted the relation-ship between soil moisture and temperature on the mortality of Limonius californicus larvae.At 30 ◦C, all larvae submerged under soil and water were killed in four days, whereasonly 26 percent of larvae died after 21 days when temperatures dropped below 10 ◦C. Itwas also demonstrated that alternating periods of soil flooding and drying is effective forreducing wireworms [96].
3.2. Semiochemical Control
Since the 1970s, regular progress has been made in elucidating the composition of click-beetle pheromones. Synthetic mixtures are now available for several species of agriculturalimportance, opening new perspectives for using them in wireworm monitoring or evendeveloping new control strategies that rely on adult sexual confusion or mass-trapping.
Besides their potential use for establishing wireworm populations (see Section 2.2),pheromone traps might be used to reduce populations, either through mating disruption orthrough mass-trapping. Mass-trapping was successfully implemented in Japan to controlMelanotus okinawensis on sugarcane, with adult densities being reduced by approximately90% after six years of mass-trapping with 10 pheromone traps per hectare [97]. By contrast,a similar study observed no reduction in Melanotus sakishimensis abundance [98]. ForAgriotes species, the limited attraction range of pheromone traps exacerbates the challengeof mass-trapping and requires a dense network of traps to be set up if populations are to bereduced. Hicks and Blackshaw [70] estimated that suppressing Agriotes populations usingmass trapping would be prohibitively expensive (2755 €/ha/year), requiring four years oftrapping with 10 traps/ha for A.obscurus, 15 traps/ha for A.obscurus, and m for A. sputator.In a long-term experiment on potatoes, Sufyan et al. [99] captured 12,000 specimens belong-ing to three Agriotes species over a period of five consecutive years without any effect onthe subsequent larval densities or on potato damage. In 2014, Vernon et al. [100] indicatedthat arrays of traps spaced 3 m apart potentially disrupted mating but also showed thatonly 85.6% of the released A. obscurus were recaptured. As pointed out by Ritter andRichter [101], mating disruption may be easier for short-lived adult populations that areprotandrous and exhibit a short, well-defined swarming period. Work is still in progresson the use of pheromone traps [102] to estimate wireworm population levels for IPMprograms [57,68].
3.3. Biological Control of Wireworms
Inundative releases of natural enemies to control pests have been implemented formany years and may be a way to control wireworms in the future. In Europe, this issuccessfully performed by mass releases of Trichogramma wasps against the EuropeanCorn Borer (Ostrinia nubilalis) in Germany, a Metarrhizium product for the control of Junechafer larvae (Phyllopertha horticola) in Switzerland, or a Metarrhizium granule for controlof black vine weevil larvae (Otiorhynchus sulcatus) as well as a variety of uses of ento-mopathogenic nematodes against different horticultural pests. Van Lenteren et al. [103]
139
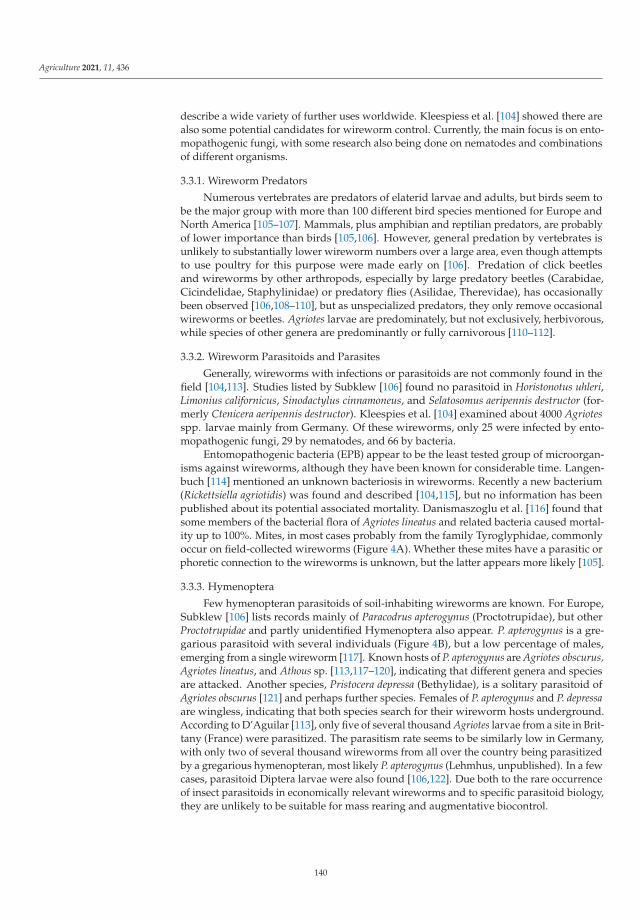
Agriculture 2021, 11, 436
describe a wide variety of further uses worldwide. Kleespiess et al. [104] showed there arealso some potential candidates for wireworm control. Currently, the main focus is on ento-mopathogenic fungi, with some research also being done on nematodes and combinationsof different organisms.
3.3.1. Wireworm Predators
Numerous vertebrates are predators of elaterid larvae and adults, but birds seem tobe the major group with more than 100 different bird species mentioned for Europe andNorth America [105–107]. Mammals, plus amphibian and reptilian predators, are probablyof lower importance than birds [105,106]. However, general predation by vertebrates isunlikely to substantially lower wireworm numbers over a large area, even though attemptsto use poultry for this purpose were made early on [106]. Predation of click beetlesand wireworms by other arthropods, especially by large predatory beetles (Carabidae,Cicindelidae, Staphylinidae) or predatory flies (Asilidae, Therevidae), has occasionallybeen observed [106,108–110], but as unspecialized predators, they only remove occasionalwireworms or beetles. Agriotes larvae are predominately, but not exclusively, herbivorous,while species of other genera are predominantly or fully carnivorous [110–112].
3.3.2. Wireworm Parasitoids and Parasites
Generally, wireworms with infections or parasitoids are not commonly found in thefield [104,113]. Studies listed by Subklew [106] found no parasitoid in Horistonotus uhleri,Limonius californicus, Sinodactylus cinnamoneus, and Selatosomus aeripennis destructor (for-merly Ctenicera aeripennis destructor). Kleespies et al. [104] examined about 4000 Agriotesspp. larvae mainly from Germany. Of these wireworms, only 25 were infected by ento-mopathogenic fungi, 29 by nematodes, and 66 by bacteria.
Entomopathogenic bacteria (EPB) appear to be the least tested group of microorgan-isms against wireworms, although they have been known for considerable time. Langen-buch [114] mentioned an unknown bacteriosis in wireworms. Recently a new bacterium(Rickettsiella agriotidis) was found and described [104,115], but no information has beenpublished about its potential associated mortality. Danismaszoglu et al. [116] found thatsome members of the bacterial flora of Agriotes lineatus and related bacteria caused mortal-ity up to 100%. Mites, in most cases probably from the family Tyroglyphidae, commonlyoccur on field-collected wireworms (Figure 4A). Whether these mites have a parasitic orphoretic connection to the wireworms is unknown, but the latter appears more likely [105].
3.3.3. Hymenoptera
Few hymenopteran parasitoids of soil-inhabiting wireworms are known. For Europe,Subklew [106] lists records mainly of Paracodrus apterogynus (Proctotrupidae), but otherProctotrupidae and partly unidentified Hymenoptera also appear. P. apterogynus is a gre-garious parasitoid with several individuals (Figure 4B), but a low percentage of males,emerging from a single wireworm [117]. Known hosts of P. apterogynus are Agriotes obscurus,Agriotes lineatus, and Athous sp. [113,117–120], indicating that different genera and speciesare attacked. Another species, Pristocera depressa (Bethylidae), is a solitary parasitoid ofAgriotes obscurus [121] and perhaps further species. Females of P. apterogynus and P. depressaare wingless, indicating that both species search for their wireworm hosts underground.According to D’Aguilar [113], only five of several thousand Agriotes larvae from a site in Brit-tany (France) were parasitized. The parasitism rate seems to be similarly low in Germany,with only two of several thousand wireworms from all over the country being parasitizedby a gregarious hymenopteran, most likely P. apterogynus (Lehmhus, unpublished). In a fewcases, parasitoid Diptera larvae were also found [106,122]. Due both to the rare occurrenceof insect parasitoids in economically relevant wireworms and to specific parasitoid biology,they are unlikely to be suitable for mass rearing and augmentative biocontrol.
140
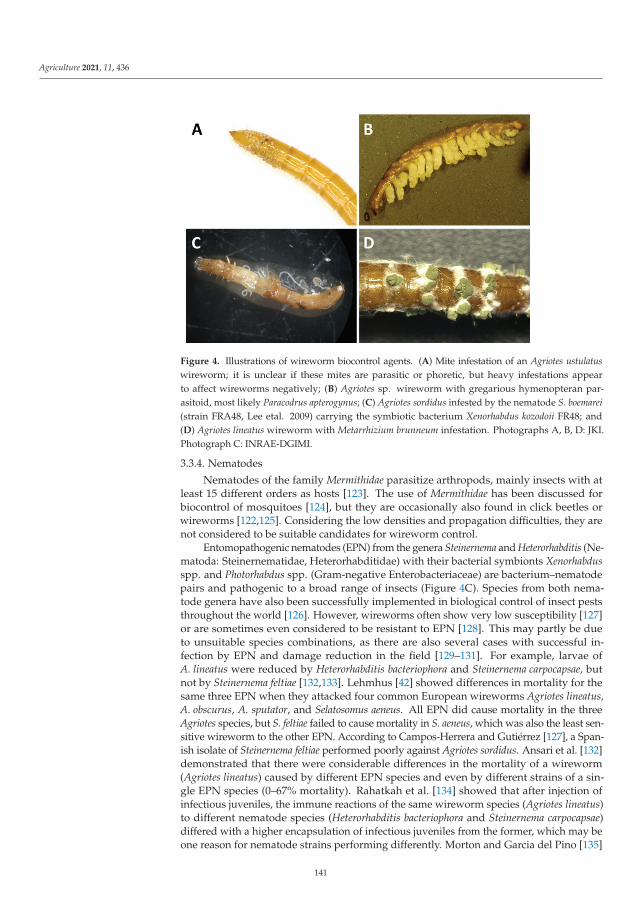
Agriculture 2021, 11, 436
Figure 4. Illustrations of wireworm biocontrol agents. (A) Mite infestation of an Agriotes ustulatuswireworm; it is unclear if these mites are parasitic or phoretic, but heavy infestations appearto affect wireworms negatively; (B) Agriotes sp. wireworm with gregarious hymenopteran par-asitoid, most likely Paracodrus apterogynus; (C) Agriotes sordidus infested by the nematode S. boemarei(strain FRA48, Lee etal. 2009) carrying the symbiotic bacterium Xenorhabdus kozodoii FR48; and(D) Agriotes lineatus wireworm with Metarrhizium brunneum infestation. Photographs A, B, D: JKI.Photograph C: INRAE-DGIMI.
3.3.4. Nematodes
Nematodes of the family Mermithidae parasitize arthropods, mainly insects with atleast 15 different orders as hosts [123]. The use of Mermithidae has been discussed forbiocontrol of mosquitoes [124], but they are occasionally also found in click beetles orwireworms [122,125]. Considering the low densities and propagation difficulties, they arenot considered to be suitable candidates for wireworm control.
Entomopathogenic nematodes (EPN) from the genera Steinernema and Heterorhabditis (Ne-matoda: Steinernematidae, Heterorhabditidae) with their bacterial symbionts Xenorhabdusspp. and Photorhabdus spp. (Gram-negative Enterobacteriaceae) are bacterium–nematodepairs and pathogenic to a broad range of insects (Figure 4C). Species from both nema-tode genera have also been successfully implemented in biological control of insect peststhroughout the world [126]. However, wireworms often show very low susceptibility [127]or are sometimes even considered to be resistant to EPN [128]. This may partly be dueto unsuitable species combinations, as there are also several cases with successful in-fection by EPN and damage reduction in the field [129–131]. For example, larvae ofA. lineatus were reduced by Heterorhabditis bacteriophora and Steinernema carpocapsae, butnot by Steinernema feltiae [132,133]. Lehmhus [42] showed differences in mortality for thesame three EPN when they attacked four common European wireworms Agriotes lineatus,A. obscurus, A. sputator, and Selatosomus aeneus. All EPN did cause mortality in the threeAgriotes species, but S. feltiae failed to cause mortality in S. aeneus, which was also the least sen-sitive wireworm to the other EPN. According to Campos-Herrera and Gutiérrez [127], a Span-ish isolate of Steinernema feltiae performed poorly against Agriotes sordidus. Ansari et al. [132]demonstrated that there were considerable differences in the mortality of a wireworm(Agriotes lineatus) caused by different EPN species and even by different strains of a sin-gle EPN species (0–67% mortality). Rahatkah et al. [134] showed that after injection ofinfectious juveniles, the immune reactions of the same wireworm species (Agriotes lineatus)to different nematode species (Heterorhabditis bacteriophora and Steinernema carpocapsae)differed with a higher encapsulation of infectious juveniles from the former, which may beone reason for nematode strains performing differently. Morton and Garcia del Pino [135]
141
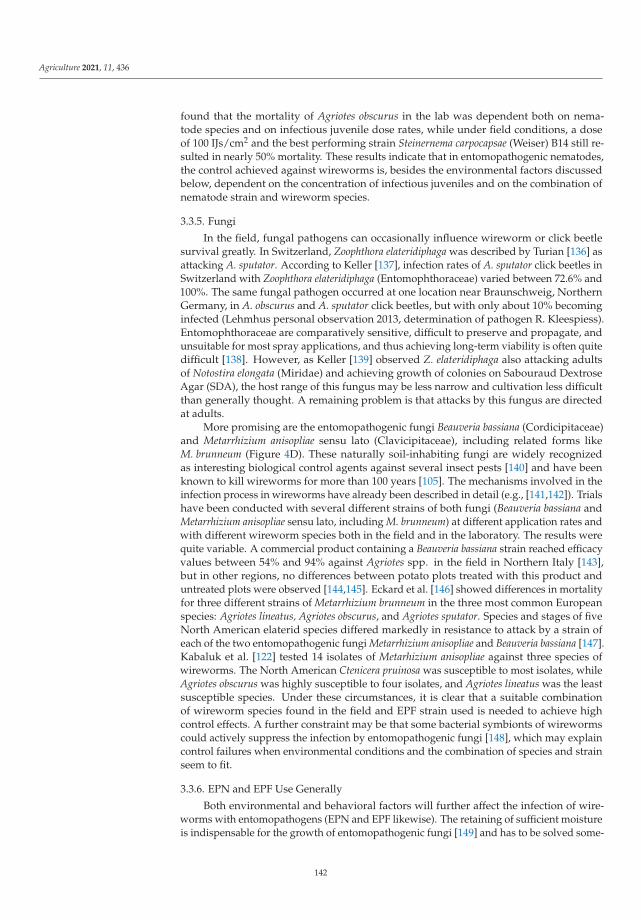
Agriculture 2021, 11, 436
found that the mortality of Agriotes obscurus in the lab was dependent both on nema-tode species and on infectious juvenile dose rates, while under field conditions, a doseof 100 IJs/cm2 and the best performing strain Steinernema carpocapsae (Weiser) B14 still re-sulted in nearly 50% mortality. These results indicate that in entomopathogenic nematodes,the control achieved against wireworms is, besides the environmental factors discussedbelow, dependent on the concentration of infectious juveniles and on the combination ofnematode strain and wireworm species.
3.3.5. Fungi
In the field, fungal pathogens can occasionally influence wireworm or click beetlesurvival greatly. In Switzerland, Zoophthora elateridiphaga was described by Turian [136] asattacking A. sputator. According to Keller [137], infection rates of A. sputator click beetles inSwitzerland with Zoophthora elateridiphaga (Entomophthoraceae) varied between 72.6% and100%. The same fungal pathogen occurred at one location near Braunschweig, NorthernGermany, in A. obscurus and A. sputator click beetles, but with only about 10% becominginfected (Lehmhus personal observation 2013, determination of pathogen R. Kleespiess).Entomophthoraceae are comparatively sensitive, difficult to preserve and propagate, andunsuitable for most spray applications, and thus achieving long-term viability is often quitedifficult [138]. However, as Keller [139] observed Z. elateridiphaga also attacking adultsof Notostira elongata (Miridae) and achieving growth of colonies on Sabouraud DextroseAgar (SDA), the host range of this fungus may be less narrow and cultivation less difficultthan generally thought. A remaining problem is that attacks by this fungus are directedat adults.
More promising are the entomopathogenic fungi Beauveria bassiana (Cordicipitaceae)and Metarrhizium anisopliae sensu lato (Clavicipitaceae), including related forms likeM. brunneum (Figure 4D). These naturally soil-inhabiting fungi are widely recognizedas interesting biological control agents against several insect pests [140] and have beenknown to kill wireworms for more than 100 years [105]. The mechanisms involved in theinfection process in wireworms have already been described in detail (e.g., [141,142]). Trialshave been conducted with several different strains of both fungi (Beauveria bassiana andMetarrhizium anisopliae sensu lato, including M. brunneum) at different application rates andwith different wireworm species both in the field and in the laboratory. The results werequite variable. A commercial product containing a Beauveria bassiana strain reached efficacyvalues between 54% and 94% against Agriotes spp. in the field in Northern Italy [143],but in other regions, no differences between potato plots treated with this product anduntreated plots were observed [144,145]. Eckard et al. [146] showed differences in mortalityfor three different strains of Metarrhizium brunneum in the three most common Europeanspecies: Agriotes lineatus, Agriotes obscurus, and Agriotes sputator. Species and stages of fiveNorth American elaterid species differed markedly in resistance to attack by a strain ofeach of the two entomopathogenic fungi Metarrhizium anisopliae and Beauveria bassiana [147].Kabaluk et al. [122] tested 14 isolates of Metarhizium anisopliae against three species ofwireworms. The North American Ctenicera pruinosa was susceptible to most isolates, whileAgriotes obscurus was highly susceptible to four isolates, and Agriotes lineatus was the leastsusceptible species. Under these circumstances, it is clear that a suitable combinationof wireworm species found in the field and EPF strain used is needed to achieve highcontrol effects. A further constraint may be that some bacterial symbionts of wirewormscould actively suppress the infection by entomopathogenic fungi [148], which may explaincontrol failures when environmental conditions and the combination of species and strainseem to fit.
3.3.6. EPN and EPF Use Generally
Both environmental and behavioral factors will further affect the infection of wire-worms with entomopathogens (EPN and EPF likewise). The retaining of sufficient moistureis indispensable for the growth of entomopathogenic fungi [149] and has to be solved some-
142

Agriculture 2021, 11, 436
how for reliable control. According to Kabaluk et al. [122], Rogge et al. [150], and Kabalukand Ericcson (2007), additional factors such as temperature, exposure time, conidia soilconcentration, and food availability also affect mortality rates of wireworms when ex-posed to Metarrhizium anisopliae. However, while lower temperatures slow down thespread of wireworm infection [151], the desiccation commonly experienced under sum-mer conditions might affect the viability of EPF in soil. Additionally, wireworms canperform seasonal movements to forage in favorable conditions and to avoid unfavorableones [9,32,50,114,152–155], meaning that wireworms may escape a biocontrol agent usedwhen the lethal potential of an entomopathogen is not reached shortly after application.For example, infection late in the potato-growing season would probably not prevent dam-age to daughter tubers. Therefore, the temperature conditions under which the infectioncycle of an isolate has its optimum must be considered. For early season applications, amore northern fungal isolate adapted to lower temperatures [156] might even enable cropprotection early in the year for such crops that need to be protected as young plants. Atemperature effect on the pathogenicity of EPN is also known [157,158], albeit not docu-mented for pathogenicity against wireworms. A further constraint is that the soil typecan also influence the effectiveness of biological wireworm control [159]. This has alsobeen described for other insects, partly with contradicting results of higher EPN efficacy insandy soil than in clay soil, or vice versa [160–162].
In contrast, the origin of inoculum had no significant effect on the virulence of aMetarrhizium brunneum strain. The mortality of wireworms treated with spores from hostcadavers was similar to the mortality of wireworms treated with spores from a modifiedSabouraud Dextrose Agar (SDA) after ten sub-cultivations [146]. Therefore, in general,virulence should not be affected by the conidia production method.
According to Ericsson et al. [163], the biological insecticide Spinosad interacted syner-gistically with Metarhizium anisopliae against Agriotes lineatus and A. obscurus, indicatingthat combinations with a second stressor (insecticide, EPN, or EPF) might enhance biologi-cal control. <the synergistic or additive effects of combined use of EPN, EPF, and EPB havebeen shown for several other pests [164–167].
Several studies [168–172] show that the application pattern is another important pointto consider, with banded or spot application being particularly useful.
Nevertheless, in many cases, results achieved by biological control are not yet sat-isfactory compared to an effectiveness between 50–90% achieved by plant protectionproducts based on the insecticides carbosulfan, fonofos, findane, fipronil, imidacloprid,thiamethoxam, or bifenthrin used in the past [143,173,174]. However, even an array ofinsecticides tested on five different wireworm species in three elaterid genera demon-strates that there are clear differences in mechanisms, symptoms, and mortality, with evenchemical insecticides failing to remove all wireworms [175].
3.3.7. Attract and Kill—A Possible Solution?
The key issue is how the effect of an entomopathogen could be further enhanced forreliable control. One idea is the development of an attract-and-kill strategy that exploitsthe foraging behavior of herbivorous insects. This means the combination of a compoundattracting the wireworms directly to the product and a killing compound that disposes ofthem effectively. Such attract-and-kill formulations could be used to enhance the effect ofboth EPN and EPF, as the wireworms are lured directly to the entomopathogen.
CO2 is a known attractant for wireworms [74,176] and other soil insects [177,178].Barsics et al. [179] summarized earlier research that demonstrated the existence of CO2perception and research on a shorter range working chemosensory sensillae in wireworms.Brandl et al. [172] developed an attract-and-kill system with an alginate capsule withyeast and starch producing CO2 as an attractant, with a Metarrhizium brunneum strain askill component; as a result, they were able to reduce tuber damage significantly whencompared to the control in three out of seven field trials in potato. In four out of seven trials,the potato tuber damage appeared lower in the attract-and-kill when compared to kill
143
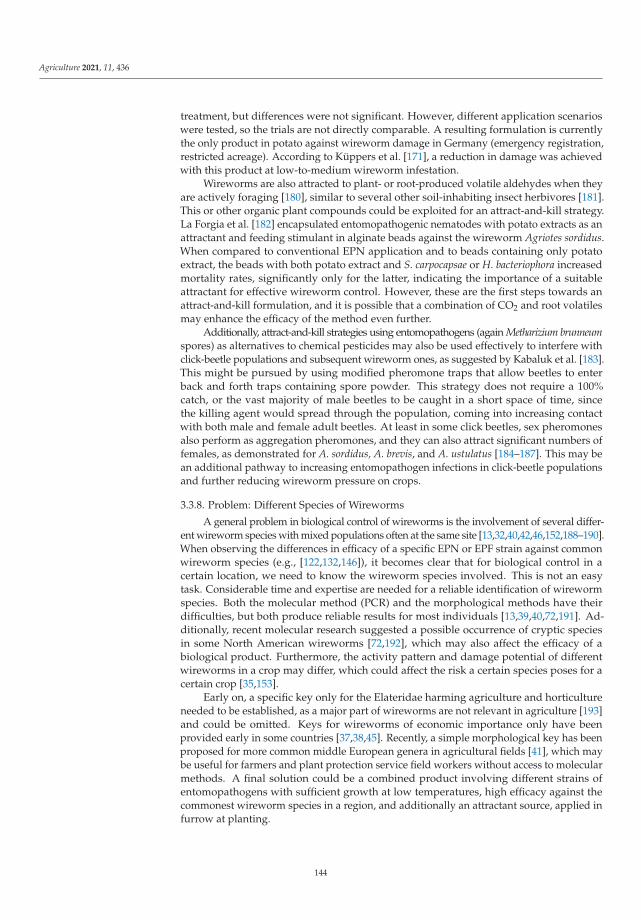
Agriculture 2021, 11, 436
treatment, but differences were not significant. However, different application scenarioswere tested, so the trials are not directly comparable. A resulting formulation is currentlythe only product in potato against wireworm damage in Germany (emergency registration,restricted acreage). According to Küppers et al. [171], a reduction in damage was achievedwith this product at low-to-medium wireworm infestation.
Wireworms are also attracted to plant- or root-produced volatile aldehydes when theyare actively foraging [180], similar to several other soil-inhabiting insect herbivores [181].This or other organic plant compounds could be exploited for an attract-and-kill strategy.La Forgia et al. [182] encapsulated entomopathogenic nematodes with potato extracts as anattractant and feeding stimulant in alginate beads against the wireworm Agriotes sordidus.When compared to conventional EPN application and to beads containing only potatoextract, the beads with both potato extract and S. carpocapsae or H. bacteriophora increasedmortality rates, significantly only for the latter, indicating the importance of a suitableattractant for effective wireworm control. However, these are the first steps towards anattract-and-kill formulation, and it is possible that a combination of CO2 and root volatilesmay enhance the efficacy of the method even further.
Additionally, attract-and-kill strategies using entomopathogens (again Metharizium brunneumspores) as alternatives to chemical pesticides may also be used effectively to interfere withclick-beetle populations and subsequent wireworm ones, as suggested by Kabaluk et al. [183].This might be pursued by using modified pheromone traps that allow beetles to enterback and forth traps containing spore powder. This strategy does not require a 100%catch, or the vast majority of male beetles to be caught in a short space of time, sincethe killing agent would spread through the population, coming into increasing contactwith both male and female adult beetles. At least in some click beetles, sex pheromonesalso perform as aggregation pheromones, and they can also attract significant numbers offemales, as demonstrated for A. sordidus, A. brevis, and A. ustulatus [184–187]. This may bean additional pathway to increasing entomopathogen infections in click-beetle populationsand further reducing wireworm pressure on crops.
3.3.8. Problem: Different Species of Wireworms
A general problem in biological control of wireworms is the involvement of several differ-ent wireworm species with mixed populations often at the same site [13,32,40,42,46,152,188–190].When observing the differences in efficacy of a specific EPN or EPF strain against commonwireworm species (e.g., [122,132,146]), it becomes clear that for biological control in acertain location, we need to know the wireworm species involved. This is not an easytask. Considerable time and expertise are needed for a reliable identification of wirewormspecies. Both the molecular method (PCR) and the morphological methods have theirdifficulties, but both produce reliable results for most individuals [13,39,40,72,191]. Ad-ditionally, recent molecular research suggested a possible occurrence of cryptic speciesin some North American wireworms [72,192], which may also affect the efficacy of abiological product. Furthermore, the activity pattern and damage potential of differentwireworms in a crop may differ, which could affect the risk a certain species poses for acertain crop [35,153].
Early on, a specific key only for the Elateridae harming agriculture and horticultureneeded to be established, as a major part of wireworms are not relevant in agriculture [193]and could be omitted. Keys for wireworms of economic importance only have beenprovided early in some countries [37,38,45]. Recently, a simple morphological key has beenproposed for more common middle European genera in agricultural fields [41], which maybe useful for farmers and plant protection service field workers without access to molecularmethods. A final solution could be a combined product involving different strains ofentomopathogens with sufficient growth at low temperatures, high efficacy against thecommonest wireworm species in a region, and additionally an attractant source, applied infurrow at planting.
144

Agriculture 2021, 11, 436
3.4. Naturally Derived Insecticides
Biocidal meals are practical options for controlling wireworm populations, both asprevention structural measures (wireworm population reduction at a suitable rotationperiod) and as rescue treatments just before the sowing of susceptible crop; after that,the occurrence of a wireworm density exceeding the threshold has been assessed [85].They contain the same glusosinolate–myrosinase system described for biocidal covercrops (Section 3.1.1). Their potential can be considered comparable to that of chemicalinsecticides [85]. In laboratory [10] and pot trials [85], Brassica carinata seed meals caused alarval mortality higher than 80% and complete maize seedling protection. At large-fieldscale, both potato and maize crops have been effectively protected. In order to obtainsuccessful practical results in the field, the same conditions described for biofumigantcover crops (Section 3.1.1) need to be fulfilled concurrently. Biocidal meals have becomecommercial products available for farmers, and practical implementation has alreadytaken place.
3.5. Habitat Manipulation
Elaterid species are capable of exploiting both cultivated and uncultivated areas inthe agricultural landscape [53]. Their movement from suitable habitats where populationsthrive, i.e., source habitats such as grasslands, to vulnerable crops determines the colo-nization process and eventually crop damage. Thus, habitat connectivity in space andtime [194,195] is a key driver of pest dispersal success in dynamic agricultural landscapes.Indeed, numerous studies have demonstrated that the spatial and temporal arrangement ofland uses can provide a lever for action to control species abundances with regard to land-scape compositional constraints (see for example [196–198]). Nevertheless, implementingsuch pest control strategies demands an extensive knowledge of pest biology and ecology,notably species-specific life traits such as life-cycle duration and dispersal ability.
The presence of uncultivated area in the field history or in the field vicinity [22–24,56,199]is clearly identified as a risk source in terms of wireworm infestation and/or crop damage;hence, it is often considered by farmers (e.g., managing the crop rotation within a field).More generally, while landscape context has been identified as a risk factor (Section 2.1),habitat manipulation remains underused. In their theoretical study, Poggi et al. [34]addressed the role of grassland in the field history, field neighborhood, and both. Theyhave shown that species with a short life cycle are highly responsive to changes in land use,and that the neighborhood effect strongly relies on assumed dispersal mechanisms (randomvs, directed movements). They also illustrated how the arrangement of grassy landscapeelements in space and time can mitigate crop infestation by soil-dwelling pests, therebyemphasizing the relevance of managing grassland regimes. Thus, habitat manipulationmay provide another component within an IPM approach.
4. Crop Damage Management
Wireworms are among the most destructive soil insect pests on potatoes and othercrops, including corn and cereals (see Figure 5). Practices targeting limitation of damagedespite substantial larval densities rely on identifying optimal planting and harvest condi-tions, protecting the sensitive crop with attractive companion plants, increasing seedingrates, and planting more tolerant cultivars.
145
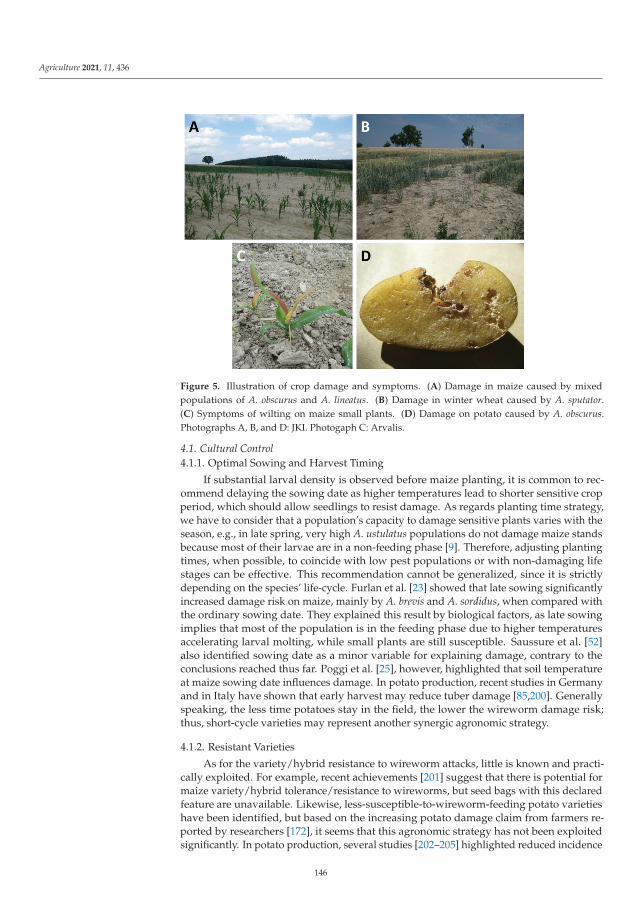
Agriculture 2021, 11, 436
Figure 5. Illustration of crop damage and symptoms. (A) Damage in maize caused by mixedpopulations of A. obscurus and A. lineatus. (B) Damage in winter wheat caused by A. sputator.(C) Symptoms of wilting on maize small plants. (D) Damage on potato caused by A. obscurus.Photographs A, B, and D: JKI. Photogaph C: Arvalis.
4.1. Cultural Control4.1.1. Optimal Sowing and Harvest Timing
If substantial larval density is observed before maize planting, it is common to rec-ommend delaying the sowing date as higher temperatures lead to shorter sensitive cropperiod, which should allow seedlings to resist damage. As regards planting time strategy,we have to consider that a population’s capacity to damage sensitive plants varies with theseason, e.g., in late spring, very high A. ustulatus populations do not damage maize standsbecause most of their larvae are in a non-feeding phase [9]. Therefore, adjusting plantingtimes, when possible, to coincide with low pest populations or with non-damaging lifestages can be effective. This recommendation cannot be generalized, since it is strictlydepending on the species’ life-cycle. Furlan et al. [23] showed that late sowing significantlyincreased damage risk on maize, mainly by A. brevis and A. sordidus, when compared withthe ordinary sowing date. They explained this result by biological factors, as late sowingimplies that most of the population is in the feeding phase due to higher temperaturesaccelerating larval molting, while small plants are still susceptible. Saussure et al. [52]also identified sowing date as a minor variable for explaining damage, contrary to theconclusions reached thus far. Poggi et al. [25], however, highlighted that soil temperatureat maize sowing date influences damage. In potato production, recent studies in Germanyand in Italy have shown that early harvest may reduce tuber damage [85,200]. Generallyspeaking, the less time potatoes stay in the field, the lower the wireworm damage risk;thus, short-cycle varieties may represent another synergic agronomic strategy.
4.1.2. Resistant Varieties
As for the variety/hybrid resistance to wireworm attacks, little is known and practi-cally exploited. For example, recent achievements [201] suggest that there is potential formaize variety/hybrid tolerance/resistance to wireworms, but seed bags with this declaredfeature are unavailable. Likewise, less-susceptible-to-wireworm-feeding potato varietieshave been identified, but based on the increasing potato damage claim from farmers re-ported by researchers [172], it seems that this agronomic strategy has not been exploitedsignificantly. In potato production, several studies [202–205] highlighted reduced incidence
146

Agriculture 2021, 11, 436
and severity of wireworm damage according to varieties. For example, Kwon et al. [205]tested 50 potato cultivars for resistance to several wireworm species. Injury rates variedbetween 80% and 96% in susceptible cultivars, and several varieties were found to behighly resistant.
4.2. Pest Behavior Manipulation: Feeding Pest as an IPM Strategy
Soil-dwelling wireworms are usually generalist herbivores, feeding on a wide range ofspecies and usually feeding on most abundant species in their habitat [206]. They may alsofeed on animal prey [112] and be cannibalistic when larval density is too high for food re-sources [9,94]. The orientation of wireworms towards host plants is described as a three-stepprocess [75,179]. First, wireworms orient towards carbon dioxide by klinotaxis. The nextforaging step involves plant–root volatiles that allow host-specific recognition [207,208];one example is aldehyde compounds influencing the ability of A. sordidus to locate barleyroots [180]. The last step consists in the biting and the retention in the root systems contain-ing asparagine, to which wireworms are sensitive, with the wireworms then remaining inthe vicinity of the roots [209]. As their feeding phase only lasts 20% to 30% of their entiredevelopment [9,10,19], a promising and inexpensive pest management strategy could lie infeeding wireworms, thereby luring them away from the crop during the host susceptibilityperiod [210]. Previous highly effective management strategies have tested pest behaviormanipulation using trap cropping or companion plants.
4.2.1. Trap Crops
Trap crops are plants grown alongside the main crop in order to manipulate insectbehavior to prevent pests from reaching the target crop [211]. If a trap crop can be foundthat lures pests, at least during sensitive growth periods of the main crop, sustainableand long-term management solutions can result. Hokkanen [211] describes approximatelyforty successful cases of trap crop strategies on several crops. As wireworms are verypolyphagous [32], a wide range of trap crops are readily available. Despite limited larvalmobility, wireworms have been found to be attracted and concentrated in trap crops placedaround main crops [212,213]. In 2000, Vernon et al. [213] showed that trap crops of wheat,planted as trap crops a week before strawberry planting, can effectively reduce wirewormfeeding and plant mortality. Landl and Glauninger [214] demonstrated the influenceof peas as a trap crop on potatoes, and several studies have demonstrated that wheatintercropped with pea and lentil showed significantly less wireworm damage [215,216].The attractiveness of trap crops, the timing of planting, and the space they occupy aremajor factors to consider before selecting and using a trap crop.
4.2.2. Companion Plants: Feeding Pests as an IPM Strategy
Companion planting is an agronomic strategy that sees the growing together of twoplant species that are known to synergistically improve each other’s growth. Companionplants can control insect pests either directly, by discouraging pest establishment, orindirectly, by attracting natural enemies that kill the pest. The ideal companion plant can beharvested, providing a direct economic return to the farmer in addition to the indirect valueof protecting the target crop. In maize fields, it has been demonstrated that companionplants lure wireworms away from the crop and lead to a significant reduction (up to 50%) indamage, which is as effective as common chemical products (Belem 13kg/ha) [210,217,218].Furthermore, meadow incorporation timing, just before crop seeding (e.g., maize), mayprotect crops from wireworm damage without any further intervention. This effect is dueto the fact that soil-incorporated fresh meadow turf is a more attractive wireworm foodsource than seeds, emerging seedlings, and young plants [219].
5. Conclusions
Although many key aspects are still to be made available—the number of missingdamage thresholds is astonishing—the bulk of available information allows us to immedi-
147
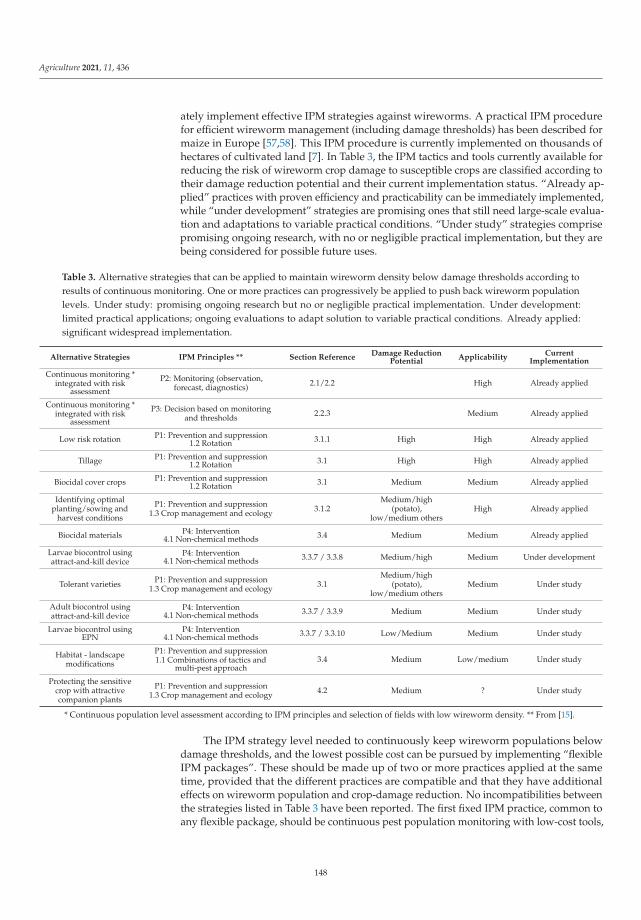
Agriculture 2021, 11, 436
ately implement effective IPM strategies against wireworms. A practical IPM procedurefor efficient wireworm management (including damage thresholds) has been described formaize in Europe [57,58]. This IPM procedure is currently implemented on thousands ofhectares of cultivated land [7]. In Table 3, the IPM tactics and tools currently available forreducing the risk of wireworm crop damage to susceptible crops are classified according totheir damage reduction potential and their current implementation status. “Already ap-plied” practices with proven efficiency and practicability can be immediately implemented,while “under development” strategies are promising ones that still need large-scale evalua-tion and adaptations to variable practical conditions. “Under study” strategies comprisepromising ongoing research, with no or negligible practical implementation, but they arebeing considered for possible future uses.
Table 3. Alternative strategies that can be applied to maintain wireworm density below damage thresholds according toresults of continuous monitoring. One or more practices can progressively be applied to push back wireworm populationlevels. Under study: promising ongoing research but no or negligible practical implementation. Under development:limited practical applications; ongoing evaluations to adapt solution to variable practical conditions. Already applied:significant widespread implementation.
Alternative Strategies IPM Principles ** Section ReferenceDamage Reduction
PotentialApplicability
CurrentImplementation
Continuous monitoring *integrated with risk
assessment
P2: Monitoring (observation,forecast, diagnostics) 2.1/2.2 High Already applied
Continuous monitoring *integrated with risk
assessment
P3: Decision based on monitoringand thresholds 2.2.3 Medium Already applied
Low risk rotation P1: Prevention and suppression1.2 Rotation 3.1.1 High High Already applied
Tillage P1: Prevention and suppression1.2 Rotation 3.1 High High Already applied
Biocidal cover crops P1: Prevention and suppression1.2 Rotation 3.1 Medium Medium Already applied
Identifying optimalplanting/sowing and
harvest conditions
P1: Prevention and suppression1.3 Crop management and ecology 3.1.2
Medium/high(potato),
low/medium othersHigh Already applied
Biocidal materials P4: Intervention4.1 Non-chemical methods 3.4 Medium Medium Already applied
Larvae biocontrol usingattract-and-kill device
P4: Intervention4.1 Non-chemical methods 3.3.7 / 3.3.8 Medium/high Medium Under development
Tolerant varieties P1: Prevention and suppression1.3 Crop management and ecology 3.1
Medium/high(potato),
low/medium othersMedium Under study
Adult biocontrol usingattract-and-kill device
P4: Intervention4.1 Non-chemical methods 3.3.7 / 3.3.9 Medium Medium Under study
Larvae biocontrol usingEPN
P4: Intervention4.1 Non-chemical methods 3.3.7 / 3.3.10 Low/Medium Medium Under study
Habitat - landscapemodifications
P1: Prevention and suppression1.1 Combinations of tactics and
multi-pest approach3.4 Medium Low/medium Under study
Protecting the sensitivecrop with attractivecompanion plants
P1: Prevention and suppression1.3 Crop management and ecology 4.2 Medium ? Under study
* Continuous population level assessment according to IPM principles and selection of fields with low wireworm density. ** From [15].
The IPM strategy level needed to continuously keep wireworm populations belowdamage thresholds, and the lowest possible cost can be pursued by implementing “flexibleIPM packages”. These should be made up of two or more practices applied at the sametime, provided that the different practices are compatible and that they have additionaleffects on wireworm population and crop-damage reduction. No incompatibilities betweenthe strategies listed in Table 3 have been reported. The first fixed IPM practice, common toany flexible package, should be continuous pest population monitoring with low-cost tools,
148
Agriculture 2021, 11, 436
such as pheromone traps (see Section 2.2.1), with complementary local bait trap wirewormmonitoring before a susceptible crop seeding when needed (see Section 2.2.2).
IPM flexible packages may vary according to population levels assessed with continu-ous monitoring. Low-risk rotation should be implemented (see Section 3.1), in accordancewith the prevalent wireworm species, including non-favoring crops and tillage when sus-ceptible pest instars (eggs and young larvae) occur in the soil. If monitoring still assessesrisky population levels and/or significant wireworm crop damage has been observed,other strategies should be added. These include the incorporation of biofumigant defattedseed meals (pellets) or biocidal plants. Farmers should find the package most suitable totheir specific conditions and modulate package strategies as per wireworm populationdynamics monitored by YATLORf traps (Table 3). Therefore, a general flexible IPM ofwireworms should comprise two main phases: (1) a risk assessment that considers allthe relevant agronomic and climatic characteristics that can be typically achieved by con-tinuous monitoring of click-beetle populations with pheromone traps. Complementarywireworm field monitoring is advisable when risk assessment has identified the presenceof risk factors and/or high beetle populations and/or previous wireworm crop damage;(2) the implementation of one or more of the practices listed in Table 3 in order to maintainor to restore wireworm populations below levels that cause significant damage to the sus-ceptible crops in the planned rotation. Regardless of whether specific damage thresholdsare available, farmers might find the IPM flexible package best suited to each homogeneouscultivated area on their farm by modulating preventative and rescue strategies (Table 3) sothat susceptible crop damage is negligible. This should also require costs and the overalleconomic sustainability of alternative strategy implementation to be considered.
In order to make farmers comfortable with IPM implementation risks, insurance toolscovering these risks may be particularly useful and supported by legislation (mutual funds).Mutual fund compensation is commensurate with the financial resources of the fund. Thefund stock is increased by savings in forecast costs and covers risks that private insurancecompanies currently do not, e.g., climatic adversities such as flooding and damage bywild animals and pests, just before and after the emergence of arable crops. The firstimplementations are underway in Italy and the results are promising [220].
While important advances have been recently made, many gaps remain in the settingup of a complete and efficient IPM framework to deal with wireworm issue in crops. Indeed,significant progress is still needed on many aspects of our knowledge. The associationbetween wireworm density and harmfulness to various crops in different conditions is stillmissing for several species. This impedes the establishment of precise, verifiable thresholdsfor each crop × wireworm species in the various cultivated contexts and areas. Knowledgeon behavioral ecology of adults remains highly fragmentary, notably concerning theirdispersal (distance, orientation) or their choice of egg-laying site. Progress would be usefulif we are to better understand colonization processes and to address wireworm risk atlandscape scale. Abiotic and biotic soil parameters (e.g., organic matter content) that favorthe survival and development of larvae should be specified in order to identify suppressivesoils (i.e., soils that maintain wireworm populations at low levels naturally). This wouldmainly require assessing the main natural causes of larval mortality, including parasitismand predation, and a better understanding of larval trophic ecology and life-cycle. Interms of agricultural sciences, studies on various promising practices, including tilling,use of biofumigants, or setting up companion plants, should be fostered. In addition,despite some promising preliminary results, varietal tolerance/resistance has, to date,received little attention. Finally, holistic decision-support tools for the implementation ofIPM should be rendered available to farmers. Eventually, precise and verifiable targets forIPM implementation for each crop × wireworm species in the various cultivated areas [7]should be identified, with any relevant socio-economic aspects also being considered.
149

Agriculture 2021, 11, 436
Author Contributions: Conceptualization, S.P., R.L.C., J.L., M.P. and L.F.; writing—original draftpreparation, S.P., R.L.C., J.L., M.P. and L.F.; writing—review and editing, S.P., R.L.C., J.L., M.P.and L.F.; project administration, S.P. All authors have read and agreed to the published version ofthe manuscript.
Funding: This research was supported by the French Office for Biodiversity (STARTAUP project);the “Groupement National Interprofessionnel des Semences et plants” (TAUPIN LAND project);and the French Ministry for Agriculture and Food for funding the TAUPIC project (CASDARn◦20ART1568739). The APC was funded by the Institute for Genetics, Environment and PlantProtection (IGEPP).
Institutional Review Board Statement: Not applicable.
Informed Consent Statement: Not applicable.
Acknowledgments: S.P., R.L.C. and M.P. acknowledge the French Office for Biodiversity for fundingthe STARTAUP project (“Design of alternative strategies for controlling wireworm damage in maizecrops”); the “Groupement National Interprofessionnel des Semences et plants” (GNIS) for fundingthe TAUPIN LAND project; and the French Ministry for Agriculture and Food for funding theTAUPIC project (CASDAR n◦20ART1568739). S.P. thanks Julien Saguez (CEROM, Quebec, Canada)for providing useful information about the web application VFF-QC and Leyli Borner (INRAE) forher assistance in producing Figure 1. R.L.C. and S.P. are grateful to Philippe Larroudé (Arvalis) andJean-Claude Ogier (INRAE) for providing photographs.
Conflicts of Interest: The authors declare no conflict of interest.
References
1. Hallmann, C.A.; Sorg, M.; Jongejans, E.; Siepel, H.; Hofland, N.; Schwan, H.; Stenmans, W.; Müller, A.; Sumser, H.; Hörren, T.; et al.More than 75 Percent Decline over 27 Years in Total Flying Insect Biomass in Protected Areas. PLoS ONE 2017, 12, e0185809.[CrossRef] [PubMed]
2. Seibold, S.; Gossner, M.M.; Simons, N.K.; Blüthgen, N.; Müller, J.; Ambarlı, D.; Ammer, C.; Bauhus, J.; Fischer, M.; Habel, J.C.; et al.Arthropod Decline in Grasslands and Forests Is Associated with Landscape-Level Drivers. Nature 2019, 574, 671–674. [CrossRef][PubMed]
3. Vogel, G. Where Have All the Insects Gone? Science 2017, 356, 576–579. [CrossRef] [PubMed]4. Pisa, L.; Goulson, D.; Yang, E.-C.; Gibbons, D.; Sánchez-Bayo, F.; Mitchell, E.; Aebi, A.; van der Sluijs, J.; MacQuarrie, C.J.K.; Giorio,
C.; et al. An Update of the Worldwide Integrated Assessment (WIA) on Systemic Insecticides. Part 2: Impacts on Organisms andEcosystems. Environ. Sci. Pollut. Res. 2017. [CrossRef]
5. Labrie, G.; Gagnon, A.-È.; Vanasse, A.; Latraverse, A.; Tremblay, G. Impacts of Neonicotinoid Seed Treatments on Soil-DwellingPest Populations and Agronomic Parameters in Corn and Soybean in Quebec (Canada). PLoS ONE 2020, 15, e0229136. [CrossRef]
6. Balachowsky, A.; Mesnil, L. Les taupins. In Les Insectes Nuisibles aux Plantes Cultivées; Balachowsky, A., Ed.; Presses éts Busson:Paris, France, 1935; pp. 754–787.
7. Veres, A.; Wyckhuys, K.A.G.; Kiss, J.; Tóth, F.; Burgio, G.; Pons, X.; Avilla, C.; Vidal, S.; Razinger, J.; Bazok, R.; et al. An Update ofthe Worldwide Integrated Assessment (WIA) on Systemic Pesticides. Part 4: Alternatives in Major Cropping Systems. Environ.Sci. Pollut. Res. 2020. [CrossRef]
8. Furlan, L. An IPM Approach Targeted against Wireworms: What Has Been Done and What Has to Be Done. IOBC/WPRS Bull.2005, 28, 91–100.
9. Furlan, L. The Biology of Agriotes Ustulatus Schaller (Col., Elateridae). II. Larval Development, Pupation, Whole Cycle Descriptionand Practical Implications. J. Appl. Entomol. 1998, 122, 71–78. [CrossRef]
10. Furlan, L. The Biology of Agriotes Sordidus Illiger (Col., Elateridae). J. Appl. Entomol. 2004, 128, 696–706. [CrossRef]11. Miles, H.W. Wireworms and Agriculture, with Special Reference to Agriotes Obscurus L. Ann. Appl. Biol. 1942, 29, 176–180.
[CrossRef]12. Sufyan, M.; Neuhoff, D.; Furlan, L. Larval Development of Agriotes Obscurus under Laboratory and Semi-Natural Conditions.
Bull. Insectol. 2014, 67, 227–235.13. Lehmhus, J.; Niepold, F. Identification of Agriotes Wireworms—Are They Always What They Appear to Be? J. Cultiv. Plants 2015,
67, 129–138.14. Zacharuk, R.Y. Seasonal Behavior of Larvae of Ctenicera Spp. and Other Wireworms (Coleoptera:Elateridae), in Relation to
Temperature, Moisture, Food, and Gravity. Can. J. Zool. 1962, 40, 697–718. [CrossRef]15. Barzman, M.; Bàrberi, P.; Birch, A.N.E.; Boonekamp, P.; Dachbrodt-Saaydeh, S.; Graf, B.; Hommel, B.; Jensen, J.E.; Kiss, J.;
Kudsk, P.; et al. Eight Principles of Integrated Pest Management. Agron. Sustain. Dev. 2015, 35, 1199–1215. [CrossRef]16. Campbell, R.E. Temperature and Moisture Preferences of Wireworms. Ecology 1937, 18, 479–489. [CrossRef]
150
Agriculture 2021, 11, 436
17. Lafrance, J. The Seasonal Movements of Wireworms (Coleoptera: Elateridae) in Relation to Soil Moisture and Temperature in theOrganic Soils of Southwestern Quebec. Can. Entomol. 1968, 100, 801–807. [CrossRef]
18. Kovacs, T.; Kuroli, G.; Pomsar, P.; Német, L.; Pali, O.; Kuroli, M. Localisation and Seasonal Positions of Wireworms in Soils.Commun. Agric. Appl. Biol. Sci. 2006, 71, 357–367.
19. Evans, A.C.; Gough, H.C. Observations on Some Factors Influencing Growth in Wireworms of the Genus Agriotes Esch. Ann.Appl. Biol. 1942, 29, 168–175. [CrossRef]
20. Furlan, L. The Biology of Agriotes Ustulatus Schäller (Col., Elateridae). I. Adults and Oviposition. J. Appl. Entomol. 1996, 120,269–274. [CrossRef]
21. Jung, J.; Racca, P.; Schmitt, J.; Kleinhenz, B. SIMAGRIO-W: Development of a Prediction Model for Wireworms in Relation to SoilMoisture, Temperature and Type. J. Appl. Entomol. 2014, 138, 183–194. [CrossRef]
22. Lefko, S.A.; Pedigo, L.P.; Batchelor, W.D.; Rice, M.E. Spatial Modeling of Preferred Wireworm (Coleoptera: Elateridae) Habitat.Environ. Entomol. 1998, 27, 184–190. [CrossRef]
23. Furlan, L.; Contiero, B.; Chiarini, F.; Colauzzi, M.; Sartori, E.; Benvegnù, I.; Fracasso, F.; Giandon, P. Risk Assessment of MaizeDamage by Wireworms (Coleoptera: Elateridae) as the First Step in Implementing IPM and in Reducing the EnvironmentalImpact of Soil Insecticides. Environ. Sci. Pollut. Res. 2017, 24, 236–251. [CrossRef]
24. Kozina, A.; Lemic, D.; Bazok, R.; Mikac, K.M.; Mclean, C.M.; Ivezic, M.; Igrc Barcic, J. Climatic, Edaphic Factors and CroppingHistory Help Predict Click Beetle (Coleoptera: Elateridae) (Agriotes Spp.) Abundance. J. Insect Sci. 2015, 15, 100. [CrossRef]
25. Poggi, S.; Le Cointe, R.; Riou, J.-B.; Larroudé, P.; Thibord, J.-B.; Plantegenest, M. Relative Influence of Climate and Agroenviron-mental Factors on Wireworm Damage Risk in Maize Crops. J. Pest. Sci. 2018, 91, 585–599. [CrossRef]
26. Blackshaw, R.P.; Vernon, R.S. Spatial Relationships between Two Agriotes Click-Beetle Species and Wireworms in AgriculturalFields. Agric. For. Entomol. 2008, 10, 1–11. [CrossRef]
27. Rawlins, R. Biology and Control of the Wheat Wireworm, Agriotes Mancus Say. Cornell Univ. Agric. Exp. Stn. Bull. 1940, 783,1–34.
28. Blackshaw, R.P.; Hicks, H. Distribution of Adult Stages of Soil Insect Pests across an Agricultural Landscape. J. Pest. Sci. 2013, 86,53–62. [CrossRef]
29. Blackshaw, R.P.; Vernon, R.S. Spatiotemporal Stability of Two Beetle Populations in Non-Farmed Habitats in an AgriculturalLandscape: Agriotes Distribution in an Agricultural Landscape. J. Appl. Ecol. 2006, 43, 680–689. [CrossRef]
30. Salt, G.; Hollick, F.S.J. Studies of Wireworm Populations: II. Spatial Distribution. J. Exp. Biol. 1946, 23, 1–46. [CrossRef]31. Parker, W.E.; Seeney, F.M. An Investigation into the Use of Multiple Site Characteristics to Predict the Presence and Infestation
Level of Wireworms (Agriotes Sup., Coleoptera: Elateridae) in Individual Grass Fields. Ann. Appl. Biol. 1997, 130, 409–425.[CrossRef]
32. Parker, W.E.; Howard, J.J. The Biology and Management of Wireworms (Agriotes Spp.) on Potato with Particular Reference to theU.K. Agric. For. Entomol. 2001, 3, 85–98. [CrossRef]
33. Blackshaw, R.P.; Vernon, R.S.; Thiebaud, F. Large Scale Agriotes Spp. Click Beetle (Coleoptera: Elateridae) Invasion of Crop Landfrom Field Margin Reservoirs: Click Beetle Dispersal. Agric. For. Entomol. 2017. [CrossRef]
34. Poggi, S.; Sergent, M.; Mammeri, Y.; Plantegenest, M.; Le Cointe, R.; Bourhis, Y. Dynamic Role of Grasslands as Sources ofSoil-Dwelling Insect Pests: New Insights from in Silico Experiments for Pest Management Strategies. Ecol. Model. 2021, 440,109378. [CrossRef]
35. Furlan, L. IPM Thresholds for Agriotes Wireworm Species in Maize in Southern Europe. J. Pest. Sci. 2014, 87. [CrossRef]36. Esser, A.D.; Milosavljevic, I.; Crowder, D.W. Effects of Neonicotinoids and Crop Rotation for Managing Wireworms in Wheat
Crops. J. Econ. Entomol. 2015, 108, 1786–1794. [CrossRef]37. Rambousek, F. Über Die Felddrahtwürmer. I. Systematischer Teil. Z. Zuckerind. Cechoslov. Repub. 1928, 52, 393–402.38. Schaerffenberg, B. Bestimmungsschlüssel der landwirtschaftlich wichtigsten Drahtwürmer. Anz. Für Schädlingskunde 1940, 16,
90–96. [CrossRef]39. Pic, M.; Pierre, E.; Martinez, M.; Genson, G.; Rasplus, J.-Y.; Albert, H. Wireworms of genus Agriotes uncovered from their
genetic prints. In Proceedings of the 9th Conférence Internationale sur les Ravageurs en Agriculture, Montpellier, France,22 October 2008.
40. Staudacher, K.; Pitterl, P.; Furlan, L.; Cate, P.C.; Traugott, M. PCR-Based Species Identification of Agriotes Larvae. Bull. Entomol.Res. 2011, 101, 201–210. [CrossRef]
41. Heimbach, U.; Lehmhus, J.; Zamani-Noor, N. Clarification of Efficacy Data Requirements for the Authorization of an Insecticideappliedas Seed Treatment for the Control of Wireworms Incrops Such Asmaize, Sunflowers, Millet and Sugar Beet in the EU; European andMediterranean Plant Protection Organization (EPPO): Paris, France, 2020.
42. Lehmhus, J. Wireworm Biology in Middle Europe—What Are We Facing? Microbial and Nematode Control of Invertebrate Pests.IOBC-WPRS Bull. 2020, 150, 96–99.
43. Eidt, D.C. A Description of the Larva of Agriotes Mancus (Say), with a Key Separating the Larvae of A. Lineatus (L.), A. Mancus,A. Obscurus (L.), and A. Sputator (L.) from Nova Scotia. Can. Entomol 1954, 86, 481–494. [CrossRef]
44. Benefer, C.M.; van Herk, W.G.; Ellis, J.S.; Blackshaw, R.P.; Vernon, R.S.; Knight, M.E. The Molecular Identification and GeneticDiversity of Economically Important Wireworm Species (Coleoptera: Elateridae) in Canada. J. Pest. Sci. 2013, 86, 19–27. [CrossRef]
151

Agriculture 2021, 11, 436
45. Glen, R.; King, K.M.; Arnason, A.P. The Identification of Wireworms of Economic Importance in Canada. Can. J. Res. 1943, 21d,358–387. [CrossRef]
46. Riley, T.J.; Keaster, A.J. Wireworms Associated with Corn: Identification of Larvae of Nine Species of Melanotus1 from the NorthCentral States2. Ann. Entomol. Soc. Am. 1979, 72, 408–414. [CrossRef]
47. Etzler, F.E.; Wanner, K.W.; Morales-Rodriguez, A.; Ivie, M.A. DNA Barcoding to Improve the Species-Level Management ofWireworms (Coleoptera: Elateridae). J. Econ. Entomol 2014, 107, 1476–1485. [CrossRef]
48. Oba, Y.; Ôhira, H.; Murase, Y.; Moriyama, A.; Kumazawa, Y. DNA Barcoding of Japanese Click Beetles (Coleoptera, Elateridae).PLoS ONE 2015, 10, e0116612. [CrossRef]
49. Zhang, S.; Liu, Y.; Shu, J.; Zhang, W.; Zhang, Y.; Wang, H. DNA Barcoding Identification and Genetic Diversity of Bamboo ShootWireworms (Coleoptera: Elateridae) in South China. J. Asia Pac. Entomol. 2019, 22, 140–150. [CrossRef]
50. Milosavljevic, I.; Esser, A.D.; Crowder, D.W. Seasonal Population Dynamics of Wireworms in Wheat Crops in the PacificNorthwestern United States. J. Pest. Sci. 2017, 90, 77–86. [CrossRef]
51. Staudacher, K.; Schallhart, N.; Pitterl, P.; Wallinger, C.; Brunner, N.; Landl, M.; Kromp, B.; Glauninger, J.; Traugott, M. Occurrenceof Agriotes Wireworms in Austrian Agricultural Land. J. Pest. Sci. 2013, 86, 33–39. [CrossRef]
52. Saussure, S.; Plantegenest, M.; Thibord, J.-B.; Larroudé, P.; Poggi, S. Management of Wireworm Damage in Maize Fields UsingNew, Landscape-Scale Strategies. Agron. Sustain. Dev. 2015, 35, 793–802. [CrossRef]
53. Milosavljevic, I.; Esser, A.D.; Crowder, D.W. Effects of Environmental and Agronomic Factors on Soil-Dwelling Pest Communitiesin Cereal Crops. Agric. Ecosyst. Environ. 2016, 225, 192–198. [CrossRef]
54. Seal, D.R.; Chalfant, R.B.; Hall, M.R. Effects of Cultural Practices and Rotational Crops on Abundance of Wireworms (Coleoptera:Elateridae) Affecting Sweet potato in Georgia. Environ. Entomol. 1992, 21, 969–974. [CrossRef]
55. Salt, G.; Hollick, F.S.J. Studies of Wireworm Population: III. Some Effects of Cultivation. Ann. Appl. Biol. 1949, 36, 169–186.[CrossRef]
56. Hermann, A.; Brunner, N.; Hann, P.; Wrbka, T.; Kromp, B. Correlations between Wireworm Damages in Potato Fields andLandscape Structure at Different Scales. J. Pest. Sci. 2013, 86, 41–51. [CrossRef]
57. Furlan, L.; Contiero, B.; Chiarini, F.; Benvegnù, I.; Tóth, M. The Use of Click Beetle Pheromone Traps to Optimize the RiskAssessment of Wireworm (Coleoptera: Elateridae) Maize Damage. Sci. Rep. 2020, 10, 8780. [CrossRef]
58. Furlan, L.; Vasileiadis, V.P.; Chiarini, F.; Huiting, H.; Leskovšek, R.; Razinger, J.; Holb, I.J.; Sartori, E.; Urek, G.; Verschwele, A.; et al.Risk Assessment of Soil-Pest Damage to Grain Maize in Europe within the Framework of Integrated Pest Management. Crop.Prot. 2017, 97, 52–59. [CrossRef]
59. Saguez, J.; Latraverse, A.; De Almeida, J.; van Herk, W.G.; Vernon, R.S.; Légaré, J.-P.; Moisan-De Serres, J.; Fréchette, M.; Labrie, G.Wireworm in Quebec Field Crops: Specific Community Composition in North America. Environ. Entomol. 2017, 46, 814–825.[CrossRef]
60. Butler, L.I.; McDonough, L.M.; Onsager, J.A.; Landis, B.J. Sex Pheromones of the Pacific Coast Wireworm, Limonius Canus 12.Environ. Entomol. 1975, 4, 229–230. [CrossRef]
61. Jacobson, M.; Lilly, C.E.; Harding, C. Sex Attractant of Sugar Beet Wireworm: Identification and Biological Activity. Science 1968,159, 208–210. [CrossRef]
62. Yatsynin, V.G.; Rubanova, E.V.; Okhrimenko, N.V. Identification of Female-Produced Sex Pheromones and Their GeographicalDifferences in Pheromone Gland Extract Composition from Click Beetles (Col., Elateridae). J. Appl. Entomol. 1996, 120, 463–466.[CrossRef]
63. Borg-Karlson, A.-K.; Ågren, L.; Dobson, H.; Bergström, G. Identification and Electroantennographic Activity of Sex-SpecificGeranyl Esters in an Abdominal Gland of FemaleAgriotes Obscurus (L.) AndA. Lineatus (L.) (Coleoptera, Elateridae). Experientia1988, 44, 531–534. [CrossRef]
64. Tóth, M.; Furlan, L.; Yatsynin, V.G.; Ujváry, I.; Szarukán, I.; Imrei, Z.; Tolasch, T.; Francke, W.; Jossi, W. Identification ofPheromones and Optimization of Bait Composition for Click Beetle Pests (Coleoptera: Elateridae) in Central and Western Europe:Pheromones and Optimization of Bait Composition for Click Beetles. Pest. Manag. Sci. 2003, 59, 417–425. [CrossRef]
65. Burgio, G.; Ragaglini, G.; Petacchi, R.; Ferrari, R.; Pozzati, M.; Furlan, L. Optimization of Agriotes Sordidus Monitoring in NorthernItaly Rural Landscape, Using a Spatial Approach. Bull. Insectol. 2012, 65, 123–131.
66. Vernon, R.S. A Ground-Based Pheromone Trap for Monitoring Agriotes Lineatus and A. Obscurus (Coleoptera: Elateridae). J.Entomol. Soc. Br. Columbia 2004, 101, 141–142.
67. Witzgall, P.; Kirsch, P.; Cork, A. Sex Pheromones and Their Impact on Pest Management. J. Chem. Ecol. 2010, 36, 80–100. [CrossRef][PubMed]
68. Blackshaw, R.P.; van Herk, W.G.; Vernon, R.S. Determination of Agriotes Obscurus (Coleoptera: Elateridae) Sex PheromoneAttraction Range Using Target Male Behavioural Responses: Pheromone Attraction Range of Agriotes Obscurus. Agr For. Entomol.2018, 20, 228–233. [CrossRef]
69. Sufyan, M.; Neuhoff, D.; Furlan, L. Assessment of the Range of Attraction of Pheromone Traps to Agriotes Lineatus and AgriotesObscurus. Agric. For. Entomol. 2011, 13, 313–319. [CrossRef]
70. Hicks, H.; Blackshaw, R.P. Differential Responses of Three Agriotes Click Beetle Species to Pheromone Traps. Agric. For. Entomol.2008, 10, 443–448. [CrossRef]
152

Agriculture 2021, 11, 436
71. Kishita, M.; Arakaki, N.; Kawamura, F.; Sadoyama, Y.; Yamamura, K. Estimation of Population Density and Dispersal Parametersof the Adult Sugarcane Wireworm, Melanotus Okinawensis Ohira (Coleoptera: Elateridae), on Ikei Island, Okinawa, by Mark-Recapture Experiments. Appl. Entomol. Zool. 2003, 38, 233–240. [CrossRef]
72. Benefer, C.M.; Knight, M.E.; Ellis, J.S.; Hicks, H.; Blackshaw, R.P. Understanding the Relationship between Adult and LarvalAgriotes Distributions: The Effect of Sampling Method, Species Identification and Abiotic Variables. Appl. Soil Ecol. 2012, 53,39–48. [CrossRef]
73. Reddy, G.V.P.; Tangtrakulwanich, K. Potential Application of Pheromones in Monitoring, Mating Disruption, and Control ofClick Beetles (Coleoptera: Elateridae). ISRN Entomol. 2014, 2014, 1–8. [CrossRef]
74. Doane, J.F.; Lee, Y.W.; Klingler, J.; Westcott, N.D. The Orientation Response of Ctemcera Destructor and Other Wireworms(Coleoptera: Elateridae) to Germinating Grain and to Carbon Dioxide. Can. Entomol 1975, 107, 1233–1252. [CrossRef]
75. Doane, J.F.; Klingler, J. Location of Co2-Receptive Sensilla on Larvae of the Wireworms Agriotes Lineatus-Obscurus and LimoniusCalifornicus1. Ann. Entomol. Soc. Am. 1978, 71, 357–363. [CrossRef]
76. Parker, W.E. Evaluation of the Use of Food Baits for Detecting Wireworms (Agriotes Spp., Coleoptera: Elateridae) in FieldsIntended for Arable Crop Production. Crop. Prot. 1994, 13, 271–276. [CrossRef]
77. Brunner, N.; Grünbacher, E.M.; Kromp, B. Comparison of Three Different Bait Trap Types for Wireworms (Coleoptera: Elateridae)in Arable Crops. IOBS/WPRS Bull. 2007, 30, 47–52.
78. Morales-Rodriguez, A.; Ospina, A.; Wanner, K.W. Evaluation of Four Bait Traps for Sampling Wireworm (Coleoptera: Elateridae)Infesting Cereal Crops in Montana. Int. J. Insect Sci. 2017, 9, 1–11. [CrossRef]
79. Landl, M.; Furlan, L.; Glauninger, J. Seasonal Fluctuations in Agriotes Spp. (Coleoptera: Elateridae) at Two Sites in Austria andthe Efficiency of Bait Trap Designs for Monitoring Wireworm Populations in the Soil. J. Plant. Dis. Prot. 2010, 117, 268–272.[CrossRef]
80. Chabert, A.; Blot, Y. Estimation Des Populations Larvaires de Taupins Par Un Piège Attractif. Phytoma 1992, 436, 26–30.81. Kirfman, G.W.; Keaster, A.J.; Story, R.N. An Improved Wireworm (Coleoptera: Elateridae) Sampling Technique for Midwest
Cornfields. J. Kans. Entomol Soc. 1986, 59, 37–41.82. Cherry, R.; Grose, P.; Barbieri, E. Validation of a Sequential Sampling Plan for Wireworms (Coleoptera: Elateridae) at Sugarcane
Planting. J. Pest. Sci. 2013, 86, 29–32. [CrossRef]83. Griffiths, D.C. Susceptibility of Plants to Attack by Wireworms (Agriotes Spp.). Ann. Appl. Biol. 1974, 78, 7–13. [CrossRef]84. Milosavljevic, I.; Esser, A.D.; Murphy, K.M.; Crowder, D.W. Effects of Imidacloprid Seed Treatments on Crop Yields and Economic
Returns of Cereal Crops. Crop. Prot. 2019, 119, 166–171. [CrossRef]85. Furlan, L.; Bonetto, C.; Finotto, A.; Lazzeri, L.; Malaguti, L.; Patalano, G.; Parker, W. The Efficacy of Biofumigant Meals and Plants
to Control Wireworm Populations. Ind. Crop. Prod. 2010, 31, 245–254. [CrossRef]86. Furlan, L.; Bonetto, C.; Costa, B.; Finotto, A.; Lazzeri, L. Observations on Natural Mortality Factors in Wireworm Populations and
Evaluation of Management Options. IOBC/WPRS Bull. 2009, 45, 436–439.87. Lees, A.D. On the Behaviour of Wireworms of the Genus Agriotes Esch. (Coleoptera, Elateridae). J. Exp. Biol. 1943, 20, 54–60.
[CrossRef]88. Landis, B.J.; Onsager, J.A. Wireworms on Irrigated Lands in the West: How to Control Them. In Farmer’s Bulletin; U.S. Department
of Agriculture: Washington, DC, USA, 1966.89. Shirck, F.H. Crop Rotations and Cultural Practices as Related to Wireworm Control in Idaho12. J. Econ. Entomol. 1945, 38, 627–633.
[CrossRef]90. Hall, D.G.; Cherry, R.H. Effect of Temperature in Flooding to Control the Wireworm Melanotus Communis (Coleoptera:
Elateridae). Fla. Entomol. 1993, 76, 155. [CrossRef]91. Van Herk, W.G.; Vernon, R.S. Effect of Temperature and Soil on the Control of a Wireworm, Agriotes Obscurus L. (Coleoptera:
Elateridae) by Flooding. Crop. Prot. 2006, 25, 1057–1061. [CrossRef]92. Onsager, J.A.; Foiles, L.L. Chemical Control of the Great Basin Wireworm on Potatoes. J. Econ. Entomol. 1969, 62, 1506–1507.
[CrossRef]93. Andrews, N.; Ambrosino, M.; Fisher, G.; Rondon, S.I. Wireworm Biology and Nonchemical Management in Potatoes in the Pacific
Northwest; A Pacific Northwest Extension Publication, Oregon State University: Corvallis, OR, USA, 2008.94. Samoylova, E.S.; Tiunov, A.V. Flexible Trophic Position of Polyphagous Wireworms (Coleoptera, Elateridae): A Stable Isotope
Study in the Steppe Belt of Russia. Appl. Soil Ecol. 2017, 121, 74–81. [CrossRef]95. Lane, M.C.; Jones, E.W. Flooding As A Means of Reducing Wireworm Infestations. J. Econ. Entomol. 1936, 29, 842–850. [CrossRef]96. Genung, W.G. Flooding Experiments for Control of Wireworms Attacking Vegetable Crops in the Everglades. Fla. Entomol. 1970,
53, 55. [CrossRef]97. Arakaki, N.; Nagayama, A.; Kobayashi, A.; Kishita, M.; Sadoyama, Y.; Mougi, N.; Kawamura, F.; Wakamura, S.; Yamamura, K.
Control of the Sugarcane Click Beetle Melanotus Okinawensis Ohira (Coleoptera: Elateridae) by Mass Trapping Using SyntheticSex Pheromone on Ikei Island, Okinawa, Japan. Appl. Entomol. Zool. 2008, 43, 37–47. [CrossRef]
98. Arakaki, N.; Nagayama, A.; Kobayashi, A.; Tarora, K.; Kishita, M.; Sadoyama, Y.; Mougi, N.; Kijima, K.; Suzuki, Y.; Akino, T.; et al.Estimation of Abundance and Dispersal Distance of the Sugarcane Click Beetle Melanotus Sakishimensis Ohira (Coleoptera:Elateridae) on Kurima Island, Okinawa, by Mark-Recapture Experiments. Appl. Entomol. Zool. 2008, 43, 409–419. [CrossRef]
153

Agriculture 2021, 11, 436
99. Sufyan, M.; Neuhoff, D.; Furlan, L. Effect of Male Mass Trapping of Agriotes Species on Wireworm Abundance and Potato TuberDamage. Bull. Insectol. 2013, 66, 135–142.
100. Vernon, R.S.; Blackshaw, R.P.; van Herk, W.G.; Clodius, M. Mass Trapping Wild Agriotes Obscurus and Agriotes Lineatus Maleswith Pheromone Traps in a Permanent Grassland Population Reservoir: Pheromone Trapping of Agriotes Beetles. Agr For. Entomol.2014, 16, 227–239. [CrossRef]
101. Ritter, C.; Richter, E. Control Methods and Monitoring of Agriotes Wireworms (Coleoptera: Elateridae). J. Plant. Dis. Prot. 2013,120, 4–15. [CrossRef]
102. Van Herk, W.G.; Vernon, R.S. Local Depletion of Click Beetle Populations by Pheromone Traps Is Weather and Species Dependent.Environ. Entomol. 2020, 49, 449–460. [CrossRef]
103. Van Lenteren, J.C.; Bolckmans, K.; Köhl, J.; Ravensberg, W.J.; Urbaneja, A. Biological Control Using Invertebrates and Microor-ganisms: Plenty of New Opportunities. BioControl 2018, 63, 39–59. [CrossRef]
104. Kleespies, R.G.; Ritter, C.; Zimmermann, G.; Burghause, F.; Feiertag, S.; Leclerque, A. A Survey of Microbial Antagonists ofAgriotes Wireworms from Germany and Italy. J. Pest. Sci 2013, 86, 99–106. [CrossRef]
105. Hyslop, J.A. Wireworms Attacking Cereal and Forage Crops; U.S. Dept. of Agriculture: Washington, DC, USA, 1915.106. Subklew, W. Die Bekämpfung Der Elateriden: Eine Übersicht Über Die Literatur. Z. Für Angew. Entomol. 1938, 24, 511–581.
[CrossRef]107. Kirk, D.A.; Evenden, M.D.; Mineau, P. Past and Current Attempts to Evaluate the Role of Birds as Predators of Insect Pests in
Temperate Agriculture. In Current Ornithology; Nolan, V., Ketterson, E.D., Eds.; Springer: Boston, MA, USA, 1996; pp. 175–269.ISBN 978-1-4613-7697-2.
108. Fox, C.J.S.; MacLellan, C.R. Some Carabidae and Staphylinidae Shown to Feed on a Wireworm, Agriotes Sputator (L.), by thePrecipitin Test. Can. Entomol 1956, 88, 228–231. [CrossRef]
109. Van Herk, W.G.; Vernon, R.S.; Cronin, E.M.L.; Gaimari, S.D. Predation of Thereva Nobilitata (Fabricius) (Diptera: Therevidae) onAgriotes Obscurus L. (Coleoptera: Elateridae). J. Appl. Entomol. 2015, 139, 154–157. [CrossRef]
110. Rabb, R.L. Biology of Conoderus Vespertinus in the Piedmont Section of North Carolina (Coleoptera: Elateridae). Ann. Entomol.Soc. Am. 1963, 56, 669–676. [CrossRef]
111. Rizzo, C.; Lehmhus, J. Wireworm Food Choice: Steack or Salad? Jul. Kühn Arch. 2014, 447, 543–544.112. Traugott, M.; Schallhart, N.; Kaufmann, R.; Juen, A. The Feeding Ecology of Elaterid Larvae in Central European Arable Land:
New Perspectives Based on Naturally Occurring Stable Isotopes. Soil Biol. Biochem. 2008, 40, 342–349. [CrossRef]113. D’Aguilar, J. Sur Paracodrus Apterogynus Hal. (Hym. Proctotrupidae), Parasite Des Larves d’Agriotes En France. Bull. Soc.
Entomol. Fr. 1948, 53, 154–155.114. Langenbuch, R. Beiträge Zur Kenntnis Der Biologie von Agriotes Lineatus L. Und Agriotes Obscurus L. Z. Für Angew. Entomol.
1932, 19, 278–300. [CrossRef]115. Leclerque, A.; Kleespies, R.G.; Ritter, C.; Schuster, C.; Feiertag, S. Genetic and Electron-Microscopic Characterization of ‘Rick-
ettsiella Agriotidis’, a New Rickettsiella Pathotype Associated with Wireworm, Agriotes Sp. (Coleoptera: Elateridae). Curr.Microbiol. 2011, 63, 158–163. [CrossRef]
116. Danismazoglu, M.; Demir, I.; Sevim, A.; Demirbag, Z.; Nalcacioglu, R. An Investigation on the Bacterial Flora of Agriotes Lineatus(Coleoptera: Elateridae) and Pathogenicity of the Flora Members. Crop. Prot. 2012, 40, 1–7. [CrossRef]
117. Subklew, W. Agriotes Lineatus L. Und Agriotes Obscurus L: (Ein Beitrag Zu Ihrer Morphologie Und Biologie.). Z. Für Angew.Entomol. 1935, 21, 96–122. [CrossRef]
118. Zolk, K. Paracodrus Apterogynus Halid. Kui tumeda viljanaksuri (Agriotes Obscurus L.) toukude uus parasiit. Tartu ÜlikooliEntomoloogia Katsejaama Teadaanded 1924, 3, 10.
119. Blunck, H. Parasiten Der Elateridenlarven. Z. Für Angew. Entomol. 1925, 11, 148–149. [CrossRef]120. Nixon, G.E.J. A Preliminary Revision of the British Proctotrupinae (Hym., Proctotrupoidea). Trans. R. Entomol. Soc. Lond. 1938, 87,
431–465. [CrossRef]121. Bognar, S. Pristocera Depressa a Paralysing and Destructive Parasite of the Wireworm, A. Obscurus. Novenytermeles 1955, 4,
241–252.122. Kabaluk, J.T.; Goettel, M.; Erlandson, M.; Ericsson, J.; Duke, G.M.; Vernon, R.S. Metarhizium Anisopliae as a Biological Control
for Wireworms and a Report of Some Other Naturally-Occurring Parasites. IOBC/WPRS Bull. 2005, 28, 109–115.123. Nickle, W.R. A Contribution to Our Knowledge of the Mermithidae (Nematoda). J. Nematol. 1972, 4, 113–146.124. Platzer, E.G. Biological Control of Mosquitoes with Mermithids. J. Nematol. 1981, 13, 257–262. [PubMed]125. Doane, J.F.; Klingler, J.; Welch, H.E. Parasitism of Agriotes Obscurus Linnaeus (Coleoptera: Elateridae) by Hexamermis Sp.
(Nematoda: Mermithidae. B. Soc. Entomol. Suisse 1973, 45, 299–300.126. Stock, S.P.; Blair, H.G. Entomopathogenic Nematodes and Their Bacterial Symbionts: The inside out of a Mutualistic Association.
Symbiosis 2008, 46, 65–75.127. Campos-Herrera, R.; Gutiérrez, C. Screening Spanish Isolates of Steinernematid Nematodes for Use as Biological Control Agents
through Laboratory and Greenhouse Microcosm Studies. J. Invertebr. Pathol. 2009, 100, 100–105. [CrossRef]128. Eidt, D.C.; Thurston, G.S. Physical Deterrents to Infection by Entomopathogenic Nematodes in Wireworms (Coleoptera: Elateri-
dae) and Other Soil Insects. Can. Entomol. 1995, 127, 423–429. [CrossRef]
154

Agriculture 2021, 11, 436
129. Toba, H.H.; Lindegren, J.E.; Turner, J.E.; Vail, P.V. Susceptibility of the Colorado Potato Beetle and the Sugarbeet Wireworm toSteinernema Feltiae and S. Glaseri. J. Nematol. 1983, 15, 597–601.
130. Schalk, J.M.; Bohac, J.R.; Dukes, P.D.; Martin, W.R. Potential of Non-Chemical Control Strategies for Reduction of Soil InsectDamage in Sweetpotato. JASHS 1993, 118, 605–608. [CrossRef]
131. Kovacs, A.; Deseo, K.V.; Poinar, J.G.O.; De Leoardis, A. Prove Di Lotta Contro Insetti Con Applicazione Di Nematode Entomogeni.ATTI G Fitopatol. 1980, 1, 499–546.
132. Ansari, M.A.; Evans, M.; Butt, T.M. Identification of Pathogenic Strains of Entomopathogenic Nematodes and Fungi for WirewormControl. Crop. Prot. 2009, 28, 269–272. [CrossRef]
133. Ester, A.; Huiting, H. Controlling Wireworms (Agriotes Spp.) in a Potato Crop with Biologicals. IOBC/WPRS Bull. 2007, 30,189–196.
134. Rahatkhah, Z.; Karimi, J.; Ghadamyari, M.; Brivio, M.F. Immune Defenses of Agriotes Lineatus Larvae against EntomopathogenicNematodes. BioControl 2015, 60, 641–653. [CrossRef]
135. Morton, A.; Garcia-del-Pino, F. Laboratory and Field Evaluation of Entomopathogenic Nematodes for Control of Agriotes Obscurus(L.) (Coleoptera: Elateridae). J. Appl. Entomol. 2017, 141, 241–246. [CrossRef]
136. Turian, G. Entomophthora Elateridiphaga n.Sp. Sur Imagos d’Agriotes Sputator L. Bull. Soc. Entomol. Suisse 1978, 51, 395–398.137. Keller, S. The Fungus Zoophthora Elateridiphaga as an Important Mortality Factor of the Click Beetle Agriotes Sputator. J.
Invertebr. Pathol. 1994, 63, 90–91. [CrossRef]138. Dara, S.K.; Humber, R.A. Entomophthoran. In Beneficial Microbes in Agro-Ecology; Elsevier: Amsterdam, The Netherlands, 2020;
pp. 757–775. ISBN 978-0-12-823414-3.139. Keller, S. Zoophthora Elateridiphaga (Zygomycetes, Entomophthoraceae) Causing Epizootics in Populations of Notostira Elongata
(Heteroptera, Miridae). Bull. Soc. Entomol. Suisse 1982, 55, 289–296.140. McCoy, C.W. Entomogenous Fungi as Microbial Pesticides. In Proceedings of the New Directions in Biological Control. Alternatives for
Suppressing Agricultural Pests and Diseases; Baker, R.R., Dunn, P.E., Eds.; Wiley: New York, NY, USA, 1990.141. Zacharuk, R.Y. Penetration of the Cuticular Layers of Elaterid Larvae (Coleoptera) by the Fungus Metarrhizium Anisopliae, and
Notes on a Bacterial Invasion. J. Invertebr. Pathol. 1973, 21, 101–106. [CrossRef]142. Leger, R.J.S.; Goettel, M.; Roberts, D.W.; Staples, R.C. Prepenetration Events during Infection of Host Cuticle by Metarhizium
Anisopliae. J. Invertebr. Pathol. 1991, 58, 168–179. [CrossRef]143. Ladurner, E.; Quentin, U.; Franceschini, S.; Benuzzi, M. Efficacy Evaluation of the Entomopathogenic Fungus Beauveria Bassiana
Strain ATCC 74040 against Wireworms (Agriotes Spp.) on Potato. IOBC/WPRS Bull. 2009, 45, 445–448.144. Schepl, U.; Paffrath, A.; Kempkens, K. Regulierungskonzepte Zur Reduktion von Drahtwurmschäden; Landwirtschaftskammer
Nordrhein-Westfalen: Münster, Germany, 2010; 55p.145. Kölliker-Ott, U.; Biasio, L.; Jossi, W. Potential Control of Swiss Wireworms with Entomopathogenic Fungi. IOBC/WPRS BULL.
2011, 66, 517–520.146. Eckard, S.; Ansari, M.A.; Bacher, S.; Butt, T.M.; Enkerli, J.; Grabenweger, G. Virulence of in Vivo and in Vitro Produced Conidia of
Metarhizium Brunneum Strains for Control of Wireworms. Crop. Prot. 2014, 64, 137–142. [CrossRef]147. Zacharuk, R.Y.; Tinline, R.D. Pathogenicity of Metarrhizium Anisopliae, and Other Fungi, for Five Elaterids (Coleoptera) in
Saskatchewan. J. Invertebr. Pathol. 1968, 12, 294–309. [CrossRef]148. Kabaluk, T.; Li-Leger, E.; Nam, S. Metarhizium Brunneum—An Enzootic Wireworm Disease and Evidence for Its Suppression by
Bacterial Symbionts. J. Invertebr. Pathol. 2017, 150, 82–87. [CrossRef]149. Gillespie, A.T.; Claydon, N. The Use of Entomogenous Fungi for Pest Control and the Role of Toxins in Pathogenesis. Pestic. Sci.
1989, 27, 203–215. [CrossRef]150. Rogge, S.A.; Mayerhofer, J.; Enkerli, J.; Bacher, S.; Grabenweger, G. Preventive Application of an Entomopathogenic Fungus in
Cover Crops for Wireworm Control. BioControl 2017, 62, 613–623. [CrossRef]151. Kabaluk, J.T.; Ericsson, J.D. Environmental and Behavioral Constraints on the Infection of Wireworms by Metarhizium Anisopliae.
Environ. Entomol. 2007, 36, 1415–1420. [CrossRef]152. Brian, M.V. On the Ecology of Beetles of the Genus Agriotes with Special Reference to A. Obscurus. J. Anim. Ecol. 1947, 16, 210.
[CrossRef]153. Burrage, R.H. Seasonal Feeding of Larvae of Ctenicera Destructor and Hypolithus Bicolor (Coleoptera: Elateridae) on Potatoes
Placed in the Field at Weekly Intervals. Ann. Entomol. Soc. Am. 1963, 56, 306–313. [CrossRef]154. Sonnemann, I.; Grunz, S.; Wurst, S. Horizontal Migration of Click Beetle (Agriotes Spp.) Larvae Depends on Food Availability.
Entomol. Exp. Appl. 2014, 150, 174–178. [CrossRef]155. Staley, J.T.; Hodgson, C.J.; Mortimer, S.R.; Morecroft, M.D.; Masters, G.J.; Brown, V.K.; Taylor, M.E. Effects of Summer Rainfall
Manipulations on the Abundance and Vertical Distribution of Herbivorous Soil Macro-Invertebrates. Eur. J. Soil Biol. 2007, 43,189–198. [CrossRef]
156. Vänninen, I. Distribution and Occurrence of Four Entomopathogenic Fungi in Finland: Effect of Geographical Location, HabitatType and Soil Type. Mycol. Res. 1996, 100, 93–101. [CrossRef]
157. Rohde, C.; Moino, A., Jr.; da Silva, M.A.T.; Carvalho, F.D.; Ferreira, C.S. Influence of Soil Temperature and Moisture on theInfectivity of Entomopathogenic Nematodes (Rhabditida: Heterorhabditidae, Steinernematidae) against Larvae of CeratitisCapitata (Wiedemann) (Diptera: Tephritidae). Neotrop. Entomol. 2010, 39, 608–611. [CrossRef] [PubMed]
155

Agriculture 2021, 11, 436
158. El Khoury, Y.; Oreste, M.; Noujeim, E.; Nemer, N.; Tarasco, E. Effect of Temperature on the Pathogenecity of MediterraneanNative Entomopathogenic Nematodes (Steinernematidae and Heterorhabditidae) from Natural Ecosystems. Redia 2018, 123–127.[CrossRef]
159. Ensafi, P.; Crowder, D.W.; Esser, A.D.; Zhao, Z.; Marshall, J.M.; Rashed, A. Soil Type Mediates the Effectiveness of BiologicalControl Against Limonius Californicus (Coleoptera: Elateridae). J. Econ. Entomol. 2018, 111, 2053–2058. [CrossRef]
160. El-Borai, F.E.; Stuart, R.J.; Campos-Herrera, R.; Pathak, E.; Duncan, L.W. Entomopathogenic Nematodes, Root Weevil Larvae,and Dynamic Interactions among Soil Texture, Plant Growth, Herbivory, and Predation. J. Invertebr. Pathol. 2012, 109, 134–142.[CrossRef]
161. Toledo, J.; Williams, T.; Pérez, C.; Liedo, P.; Valle, J.F.; Ibarra, J.E. Abiotic Factors Affecting the Infectivity of Steinernema Carpocapsae(Rhabditida: Steinernematidae) on Larvae of Anastrepha Obliqua (Diptera: Tephritidae). Biocontrol. Sci. Technol. 2009, 19, 887–898.[CrossRef]
162. Toepfer, S.; Kurtz, B.; Kuhlmann, U. Influence of Soil on the Efficacy of Entomopathogenic Nematodes in Reducing DiabroticaVirgifera Virgifera in Maize. J. Pest. Sci. 2010, 83, 257–264. [CrossRef]
163. Ericsson, J.D.; Kabaluk, J.T.; Goettel, M.S.; Myers, J.H. Spinosad Interacts Synergistically with the Insect Pathogen MetarhiziumAnisopliae Against the Exotic Wireworms Agriotes Lineatus and Agriotes Obscurus (Coleoptera: Elateridae). J. Econ. Entomol. 2007,100, 31–38. [CrossRef]
164. Glare, T.R. Stage-dependent Synergism Using Metarhizium Anisopliae and Serratia Entomophila against Costelytra Zealandica.Biocontrol. Sci. Technol. 1994, 4, 321–329. [CrossRef]
165. Ansari, M.A.; Shah, F.A.; Butt, T.M. Combined Use of Entomopathogenic Nematodes and Metarhizium Anisopliae as a NewApproach for Black Vine Weevil, Otiorhynchus Sulcatus, Control. Entomol. Exp. Appl. 2008, 129, 340–347. [CrossRef]
166. Dlamini, B.E.; Malan, A.P.; Addison, P. Combined Effect of Entomopathogenic Fungi and Steinernema Yirgalemense against theBanded Fruit Weevil, Phlyctinus Callosus (Coleoptera: Curculionidae). Biocontrol. Sci. Technol. 2020, 30, 1169–1179. [CrossRef]
167. Usman, M.; Gulzar, S.; Wakil, W.; Wu, S.; Piñero, J.C.; Leskey, T.C.; Nixon, L.J.; Oliveira-Hofman, C.; Toews, M.D.; Shapiro-Ilan, D.Virulence of Entomopathogenic Fungi to Rhagoletis Pomonella (Diptera: Tephritidae) and Interactions With EntomopathogenicNematodes. J. Econ. Entomol. 2020, 113, 2627–2633. [CrossRef]
168. Jaronski, S.T. Ecological Factors in the Inundative Use of Fungal Entomopathogens. BioControl 2010, 55, 159–185. [CrossRef]169. Jaronski, S.T.; Jackson, M.A. Efficacy of Metarhizium Anisopliae Microsclerotial Granules. Biocontrol Sci. Technol. 2008, 18, 849–863.
[CrossRef]170. Reddy, G.V.P.; Tangtrakulwanich, K.; Wu, S.; Miller, J.H.; Ophus, V.L.; Prewett, J.; Jaronski, S.T. Evaluation of the Effectiveness of
Entomopathogens for the Management of Wireworms (Coleoptera: Elateridae) on Spring Wheat. J. Invertebr. Pathol. 2014, 120,43–49. [CrossRef]
171. Küppers, R.; Neuhoff, D.; Stumm, C. Einfluss Des Biologischen Insektizids ATTRACAP®Auf Den Drahtwurmbefall vonSpeisekartoffeln. In Leitbetriebe Ökologischer Landbau Nordrhein-Westfalen; Agrarökologie & Organischer Landbau, UniversitätBonn: Bonn, Germany, 2017; pp. 114–128.
172. Brandl, M.A.; Schumann, M.; Przyklenk, M.; Patel, A.; Vidal, S. Wireworm Damage Reduction in Potatoes with an Attract-and-KillStrategy Using Metarhizium Brunneum. J. Pest. Sci. 2017, 90, 479–493. [CrossRef]
173. Toba, H.H.; Pike, K.S.; O’Keeffe, F.E. Carbosulfan, Fonofos, and Lindane Wheat Seed Treatments for Control of SugarbeetWireworm. J. Agric. Entomol. 1988, 5, 35–43.
174. Kuhar, T.P.; Alvarez, J.M. Timing of Injury and Efficacy of Soil-Applied Insecticides against Wireworms on Potato in Virginia.Crop. Prot. 2008, 27, 792–798. [CrossRef]
175. Vernon, R.S.; Van Herk, W.; Tolman, J.; Ortiz Saavedra, H.; Clodius, M.; Gage, B. Transitional Sublethal and Lethal Effects ofInsecticides after Dermal Exposures to Five Economic Species of Wireworms (Coleoptera: Elateridae). J. Econ. Entomol. 2008, 101,365–374. [CrossRef] [PubMed]
176. Klingler, J. Über Die Bedeutung Des Kohlendioxyds Für Die Orientierung Der Larven von Otiorrhynchus Sulcatus F., MelolonthaUnd Agriotes (Col.) Im Boden (Vorläufige Mitteilung). Bull. Soc. Entomol. Suisse 1957, 30, 317–322.
177. Schumann, M.; Patel, A.; Vidal, S. Soil Application of an Encapsulated CO2 Source and Its Potential for Management of WesternCorn Rootworm Larvae. J. Econ. Entomol. 2014, 107, 230–239. [CrossRef]
178. Guerenstein, P.G.; Hildebrand, J.G. Roles and Effects of Environmental Carbon Dioxide in Insect Life. Ann. Rev. Entomol. 2008, 53,161–178. [CrossRef]
179. Barsics, F.; Haubruge, E.; Francis, F.; Verheggen, F. The Role of Olfaction in Wireworms: A Review on Their Foraging Behaviorand Sensory Apparatus. Biotechnol. Agron. Soc. Environ. 2014, 18, 524–535.
180. Barsics, F.; Delory, B.M.; Delaplace, P.; Francis, F.; Fauconnier, M.-L.; Haubruge, É.; Verheggen, F.J. Foraging Wireworms AreAttracted to Root-Produced Volatile Aldehydes. J. Pest. Sci 2017, 90, 69–76. [CrossRef]
181. Johnson, S.N.; Nielsen, U.N. Foraging in the Dark—Chemically Mediated Host Plant Location by Belowground Insect Herbivores.J. Chem. Ecol. 2012, 38, 604–614. [CrossRef]
182. La Forgia, D.; Jaffuel, G.; Campos-Herrera, R.; Verheggen, F.; Turlings, T. Efficiency of an Attract-and-Kill System with Ento-mopathogenic Nematodes against Wireworms (Coleoptera: Elateridae). IOBC/WPRS Bull. 2020, 150, 91–95.
183. Kabaluk, J.T.; Lafontaine, J.P.; Borden, J.H. An Attract and Kill Tactic for Click Beetles Based on Metarhizium Brunneum and aNew Formulation of Sex Pheromone. J. Pest. Sci. 2015, 88, 707–716. [CrossRef]
156

Agriculture 2021, 11, 436
184. Vuts, J.; Furlan, L.; Csonka, É.B.; Woodcock, C.M.; Caulfield, J.C.; Mayon, P.; Pickett, J.A.; Birkett, M.A.; Tóth, M. Development ofa Female Attractant for the Click Beetle Pest Agriotes Brevis: Plant Attractants for Female Click Beetles. Pest. Manag. Sci. 2014, 70,610–614. [CrossRef]
185. Vuts, J.; Furlan, L.; Tóth, M. Female Responses to Synthetic Pheromone and Plant Compounds in Agriotes Brevis Candeze(Coleoptera: Elateridae). J. Insect Behav. 2018, 31, 106–117. [CrossRef]
186. Tóth, M.; Furlan, L.; Vuts, J.; Szarukán, I.; Ujváry, I.; Yatsynin, V.G.; Tolasch, T.; Francke, W. Geranyl Hexanoate, the Female-Produced Pheromone of Agriotes Sordidus Illiger (Coleoptera: Elateridae) and Its Activity on Both Sexes. Chemoecology 2015, 25,1–10. [CrossRef]
187. Tóth, M.; Furlan, L.; Szarukán, I.; Nagy, A.; Vuts, J.; Toshova, T.; Velchev, D.; Lohonyai, Z.; Imrei, Z. The Addition of a Pheromoneto a Floral Lure Increases Catches of Females of the Click Beetle Agriotes Ustulatus (Schaller) (Coleoptera: Elateridae). J. Chem.Ecol. 2019, 45, 667–672. [CrossRef]
188. Doane, J.F. The Flat Wireworm, Aeolus Mellillus: Studies on Seasonal Occurrence of Adults and Incidence of the Larvae in theWireworm Complex Attacking Wheat in Saskatchewan1. Environ. Entomol. 1977, 6, 818–820. [CrossRef]
189. Jansson, R.K.; Seal, D.R. Biology and Management of Wireworms on Potato. In Proceedings of the International Conference on‘Advances in Potato Pest Biology and Management’, Jackson Hole, WY, USA, 12–17 October 1991; pp. 31–53.
190. Vernon, B.; Pats, P. Distribution of Two European Wireworms, Agriotes Lineatus and A. Obscurus in British Columbia. J. Entomol.Soc. Br. Columbia 1997, 94, 59–62.
191. Mahéo, F.; Lehmhus, J.; Larroudé, P.; Le Cointe, R. Un Outil Moléculaire Simple et Abordable Pour Identifier Les Larves deTaupins Du Genre Agriotes. Cah. Tech. Inra 2020, 102, 1–8.
192. Andrews, K.R.; Gerritsen, A.; Rashed, A.; Crowder, D.W.; Rondon, S.I.; van Herk, W.G.; Vernon, R.; Wanner, K.W.; Wilson, C.M.;New, D.D.; et al. Wireworm (Coleoptera: Elateridae) Genomic Analysis Reveals Putative Cryptic Species, Population Structure,and Adaptation to Pest Control. Commun. Biol. 2020, 3, 489. [CrossRef]
193. Klausnitzer, B. Familie Elateridae. In Die Larven der Käfer Mitteleuropas; Gustav Fischer: Jena, Germany, 1994; pp. 118–189.194. Martensen, A.C.; Saura, S.; Fortin, M.-J. Spatio-Temporal Connectivity: Assessing the Amount of Reachable Habitat in Dynamic
Landscapes. Methods Ecol. Evol. 2017, 8, 1253–1264. [CrossRef]195. Taylor, P.D.; Fahrig, L.; Henein, K.; Merriam, G. Connectivity Is a Vital Element of Landscape Structure. Oikos 1993, 68, 571.
[CrossRef]196. Jonsson, M.; Wratten, S.D.; Landis, D.A.; Tompkins, J.-M.L.; Cullen, R. Habitat Manipulation to Mitigate the Impacts of Invasive
Arthropod Pests. Biol. Invasions 2010, 12, 2933–2945. [CrossRef]197. Parisey, N.; Bourhis, Y.; Roques, L.; Soubeyrand, S.; Ricci, B.; Poggi, S. Rearranging Agricultural Landscapes towards Habitat
Quality Optimisation: In Silico Application to Pest Regulation. Ecol. Complex. 2016, 113–122. [CrossRef]198. Polasky, S.; Nelson, E.; Camm, J.; Csuti, B.; Fackler, P.; Lonsdorf, E.; Montgomery, C.; White, D.; Arthur, J.; Garber-Yonts, B.; et al.
Where to Put Things? Spatial Land Management to Sustain Biodiversity and Economic Returns. Biol. Conserv. 2008, 141,1505–1524. [CrossRef]
199. Jedlicka, P.; Frouz, J. Population Dynamics of Wireworms (Coleoptera, Elateridae) in Arable Land after Abandonment. Biologia2007, 62. [CrossRef]
200. Neuhoff, D.; Christen, C.; Paffrath, A.; Schepl, U. Approaches to Wireworm Control in Organic Potato Production. IOBC/WPRSBull. 2007, 30, 65–68.
201. La Forgia, D.; Thibord, J.-B.; Larroudé, P.; Francis, F.; Lognay, G.; Verheggen, F. Linking Variety-Dependent Root Volatile OrganicCompounds in Maize with Differential Infestation by Wireworms. J. Pest. Sci. 2020, 93, 605–614. [CrossRef]
202. Rawlins, W.A. Some Varietal Differences in Wireworm Injury to Potatoes. Am. Potato J. 1943, 20, 156–158. [CrossRef]203. Parker, W.E.; Howard, J.J. Assessment of the Relative Susceptibility of Potato Cultivars to Damage by Wireworms (Agriotes Spp.).
Tests Agrochem. Cultiv. 2000, 21, 15–16.204. Langdon, K.W.; Abney, M.R. Relative Susceptibility of Selected Potato Cultivars to Feeding by Two Wireworm Species at Two
Soil Moisture Levels. Crop. Prot. 2017, 101, 24–28. [CrossRef]205. Kwon, M.; Hahm, Y.I.; Shin, K.Y.; Ahn, Y.J. Evaluation of Various Potato Cultivars for Resistance to Wireworms (Coleoptera:
Elateridae). Am. J. Pot Res. 1999, 76, 317–319. [CrossRef]206. Sonnemann, I.; Baumhaker, H.; Wurst, S. Species Specific Responses of Common Grassland Plants to a Generalist Root Herbivore
(Agriotes Spp. Larvae). Basic Appl. Ecol. 2012, 13, 579–586. [CrossRef]207. Johnson, S.N.; Gregory, P.J. Chemically-Mediated Host-Plant Location and Selection by Root-Feeding Insects. Physiol. Entomol.
2006, 31, 1–13. [CrossRef]208. La Forgia, D.; Verheggen, F. The Law of Attraction: Identification of Volatiles Organic Compounds Emitted by Potatoes as
Wireworms Attractant. Commun. Agric. Appl. Biol. Sci. 2017, 82, 167–169.209. Thorpe, W.H.; Crombie, A.C.; Hill, R.; Darrah, J.H. The Behaviour of Wireworms in Response to Chemical Stimulation. J. Exp.
Biol. 1947, 23, 234. [CrossRef]210. Le Cointe, R.; Girault, Y.; Morvan, T.; Thibord, J.-B.; Larroudé, P.; Lecuyer, G.; Plantegenest, M.; Bouillé, D.; Poggi, S. Feeding Pests
as an {IPM} Strategy: Wireworms in Conservation Agriculture as Case Study. In Proceedings of the 3rd Annual InternationalBranch Virtual Symposium of the Entomological Society of America, 27–29 April 2020.
211. Hokkanen, H.M.T. Trap Cropping in Pest Management. Ann. Rev. Entomol. 1991, 36, 119–138. [CrossRef]
157
Agriculture 2021, 11, 436
212. Miles, H.W.; Petherbridge, F.R. Investigations on the Control of Wireworms. Ann. Appl. Biol. 1927, 14, 359–387. [CrossRef]213. Vernon, R.S.; Kabaluk, T.; Behringer, A. Movement of Agriotes Obscurus (Coleoptera: Elateridae) in Strawberry (Rosaceae)
Plantings with Wheat (Gramineae) as a Trap Crop. Can. Entomol. 2000, 132, 231–241. [CrossRef]214. Landl, M.; Glauninger, J. Preliminary Investigations into the Use of Trap Crops to Control Agriotes Spp. (Coleoptera: Elateridae)
in Potato Crops. J. Pest. Sci. 2013, 86, 85–90. [CrossRef]215. Adhikari, A.; Reddy, G.V.P. Evaluation of Trap Crops for the Management of Wireworms in Spring Wheat in Montana. Arthropod
Plant. Interact. 2017, 11, 755–766. [CrossRef]216. Sharma, A.; Sandhi, R.K.; Briar, S.S.; Miller, J.H.; Reddy, G.V.P. Assessing the Performance of Pea and Lentil at Different Seeding
Densities as Trap Crops for the Management of Wireworms in Spring Wheat. J. Appl. Entomol. 2019, 143, 460–469. [CrossRef]217. Staudacher, K.; Schallhart, N.; Thalinger, B.; Wallinger, C.; Juen, A.; Traugott, M. Plant Diversity Affects Behavior of Generalist
Root Herbivores, Reduces Crop Damage, and Enhances Crop Yield. Ecol. Appl. 2013, 23, 1135–1145. [CrossRef] [PubMed]218. Thibord, J.-B.; Larroudé, P.; Tour, M.; Ogier, J.C.; Barsics, F. Le Dossier Taupins: Nouvelles Stratégies—Les Solutions à Venir
s’inspirent de La Nature. Perspect. Agric. 2015, 427, 58–62.219. Furlan, L.; Benvegnù, I.; Chiarini, F.; Loddo, D.; Morari, F. Meadow-Ploughing Timing as an Integrated Pest Management Tactic
to Prevent Soil-Pest Damage to Maize. Eur. J. Agron. 2020, 112, 125950. [CrossRef]220. Furlan, L.; Pozzebon, A.; Duso, C.; Simon-Delso, N.; Sánchez-Bayo, F.; Marchand, P.A.; Codato, F.; Bijleveld van Lexmond, M.;
Bonmatin, J.-M. An Update of the Worldwide Integrated Assessment (WIA) on Systemic Insecticides. Part 3: Alternatives toSystemic Insecticides. Environ. Sci. Pollut. Res. 2018. [CrossRef]
158
agriculture
Article
Influence of Pre-Sowing Operations on Soil-Dwelling Fauna inSoybean Cultivation
Darija Lemic *, Ivana Pajac Živkovic, Marija Posaric and Renata Bažok
Citation: Lemic, D.; Pajac Živkovic,
I.; Posaric, M.; Bažok, R. Influence of
Pre-Sowing Operations on
Soil-Dwelling Fauna in Soybean
Cultivation. Agriculture 2021, 11, 474.
https://doi.org/10.3390/
agriculture11060474
Academic Editor: Eric Blanchart
Received: 10 April 2021
Accepted: 18 May 2021
Published: 21 May 2021
Publisher’s Note: MDPI stays neutral
with regard to jurisdictional claims in
published maps and institutional affil-
iations.
Copyright: © 2021 by the authors.
Licensee MDPI, Basel, Switzerland.
This article is an open access article
distributed under the terms and
conditions of the Creative Commons
Attribution (CC BY) license (https://
creativecommons.org/licenses/by/
4.0/).
Department for Agricultural Zoology, Faculty of Agriculture, University of Zagreb, Svetosimunska 25,100000 Zagreb, Croatia; [email protected] (I.P.Ž.); [email protected] (M.P.); [email protected] (R.B.)* Correspondence: [email protected]; Tel.: +385-123-9649
Abstract: The aim of this study was to determine the effects of different pre-sowing operations onthe abundance and composition of total soil fauna in soybean cultivation, with special attention tocarabids as biological indicators of agroecosystem quality. The study was conducted in central Croatiawith six different pre-sowing activities (cover crop, mulching, ploughing, glyphosate, fertiliser re-moval, conventional tillage). Pitfall traps were used to collect soil fauna in April, June and September.After determining the abundance and composition of the fauna, their coenological characteristicswere calculated and statistical analysis was performed. During the study, 7836 individuals of soilfauna were collected. The composition consisted of 84% beneficial, 8% harmful and 8% indifferentfauna. Class Insecta was the most numerous with a proportion of 56%, with most members ofthe family Carabidae (1622 individuals), followed by the class Arachnida (40%). The number offauna collected was influenced by the interaction between pre-seeding intervention and samplingdate. Pre-seeding interventions that did not involve soil activities did not affect the number andcomposition of soil fauna at the beginning of vegetation. Mechanical interventions in the soil andwarmer and drier weather have a negative effect on the number and composition of soil fauna. Asthe season progresses, the influence of pre-sowing activities on soil fauna in soybean crops decreases.It seems that a reduction in mechanical activities in the shallow seed layer of the soil has a positiveeffect on species richness or diversity. Of particular note is the large proportion of beneficial insectsthat currently colonise the study area, characterising soil richness and stable natural equilibrium.
Keywords: soybean; pre-sowing soil activities; soil fauna; ground beetles; dominance; frequency
1. Introduction
Soybean (Glycine max L. Merril) is one of the oldest crops with high oil and proteincontent in the grain [1,2]. The protein and oil content depends on the variety and growingconditions and can vary between 35–50% protein and 18–24% soybean oil [3]. This oilseed isused in oil production, food production and animal nutrition. In the food industry, it is usedin the form of soybean, oil, flour and milk, while grain, stalk or bread is used as livestockfeed. However, the main reason for its cultivation is still livestock [3]. Besides its importantrole in human and livestock nutrition, it is also desirable in crop rotation. Through itssymbiosis with nodule bacteria, it enriches the soil with nitrogen [4,5]. Soybean is ademanding crop that differs from other crops in complexity and cultivation requirements,especially in tillage and soil preparation for sowing. Basic ploughing is carried out to adepth of 30 cm, and in heavier soils levelling must be carried out in the autumn. In earlyspring, the soil must be closed as early as possible to retain all accumulated moisture [6].
Frequent and intensive tillage of any crop, including soybean cultivation, results ingreater soil compaction or disruption of the continuity of larger pores and corridors oforganisms in the soil. Such soil affects both the abundance and diversity of soil fauna ascompaction creates unfavourable living conditions, especially anaerobic conditions [7,8].One of the most important components of soil, apart from its chemical and physical
Agriculture 2021, 11, 474. https://doi.org/10.3390/agriculture11060474 https://www.mdpi.com/journal/agriculture
159

Agriculture 2021, 11, 474
properties, is its biological component or soil organisms. The biological component orsoil biodiversity is a very important but at the same time insufficiently known componentof the soil ecosystem [9,10]. Biodiversity consists of soil organisms that spend all or partof their life cycle either in the soil or on its surface (including crop residues or mulch)and are responsible for processes that are very important for soil health and fertility [8].Tillage is one of the most aggressive activities affecting soil biological balance. Biologicalbalance refers to the interactions among organisms, including the structure of food websand the ability of ecological systems to sustain themselves over time. In general, deeperand more frequent tillage increases negative impacts on soil organisms, while no-till, striptillage and compatible tillage systems maintain biodiversity and soil organism richness incrop production. Improper and inappropriate tillage results in greater soil compaction ordisruption of the continuity of larger soil pores as well as the corridors of soil organisms.This mainly affects the abundance, but also the diversity of the biological component of thesoil [11], as greater soil compaction creates less favourable living and especially anaerobicconditions, which are only suitable for a smaller number of soil organisms [8].
The organisms in the soil are divided into three categories according to their influenceon agriculture: Beneficial, Indifferent and Pests, and according to their size into four basicgroups: Microfauna, Mesofauna, Macrofauna and Megafauna [12]. The abundance ofbeneficial organisms is extremely important as it is often used as an indicator to assess theviability of the agroecosystem. Higher numbers of beneficial soil organisms indicate bettersustainability and positive impact on the crops grown [13]. Beneficial fauna has a positiveimpact on increasing soil fertility (decomposition and mineralisation of organic matter;mixing, transport and combination of organic and mineral soil components; transport ofmicroorganisms...) and regulating the water–air ratio (creation and maintenance of soilpores) [14].
In the cultivation of soybeans, the occurrence of pests affects the quality and quantityof the grain. To prevent such damage, all available control measures are used, includingchemical measures. Pesticides can be used in soybean production to control insects, mites,weeds and pathogens [15]. The use of pesticides has negative effects and destroys beneficialsoil organisms [8,16,17]. Nietupski [18] states that of all pesticides used, only herbicideshave negative effects on beneficial Carabidae.
The most numerous beneficial insects in soil fauna are species from the orders Collem-bola and Coleoptera, which are often referred to as bio-indicators [19]. These organismshave different feeding strategies and functional roles within soil processes. Collembola com-munities influence nutrient availability through their interactions with soil organisms [20],such as rates of bacterial and fungal consumption and spore transport. The relationshipsof soil collembolan fauna to their ecological niches and the stability of community com-position at a given site provide good starting points for bioindication of changes in soilproperties and impacts of human activities [21]. Carabids are often used as indicatorsof habitat change. They have been used in grasslands and boreal forests where speciesnumbers and/or abundance have been found to change along a habitat disturbance gradi-ent [22]. Their numbers are influenced by many factors, one of which is the pre-seedingprocedure.
Glyphosate has been the subject of controversy for several years, ever since the WorldHealth Organization (WHO) warned of possible carcinogenic and genotoxic effects onhumans. Glyphosate is the active ingredient in many commercial herbicides, of whichthe best-known commercial product in the world is called Roundup, while in Croatiait is better known as Cidokor [23]. The use of glyphosate is extremely widespread inagriculture and horticulture [24]. Vandenberg et al. [25] noted that more than 1500 studieshave been conducted on the safety of glyphosate in the last decade, potentially changingthe regulatory view. More intensive research on the effects of glyphosate on beneficial (andharmful) soil fauna has not been conducted. Currently, there are no studies on the impactof pre-sowing intervention or glyphosate application on overall soil fauna and particularlyon beneficial insects in soybean production.
160
Agriculture 2021, 11, 474
Based on all the above, the hypothesis of this study is as follows: in soybean cultivation,more intensive tillage before sowing and glyphosate application have a negative impact onthe whole soil fauna and especially on the members of the beneficial fauna. Based on thehypothesis, the objective of the study was to determine the total soybean soil fauna andthe effects of different pre-sowing interventions on the abundance and composition of soilfauna in soybean cultivation.
2. Materials and Methods
2.1. The Locality of the Experiment
In 2019, a survey was conducted in six localities in the area of Šašinovec (45◦51′00” N16◦10′01” E), a village near Zagreb in the central part of Croatia. Six soybean fields weresown in each of these six localities (36 soybean fields in total). In each field, differentsoil treatments were applied before sowing. Cover crops were sown in field 1. Field 2was mulched, while field 3 was ploughed. Glyphosate was applied to field 4 for weedcontrol. Field 5 was ploughed under, and field 6 had standard tillage (stubble ploughingat 10 cm, deep fall ploughing at 25 cm in 2018, and winter furrow closure and standardsoil preparation for seeding in 2019). Mulching, cover plants and glyphosate applicationsdo not involve soil activities, while ploughing, undermining and standard tillage repre-sent interventions in shallower and/or deeper soil layers. More detailed data on tillageoperations can be found in Table 1.
Table 1. Pre-sowing interventions and implementation dates.
Variants
Activity Cover Plants Mulching Ploughing Glyphosate Undermining Standard *
Sowing 2 August 2018 - - - -Plowing stubbleDeep ploughingFurrow closingPre-sowing soil
preparation
Mulching - 18 October 2018 - - -
Ploughing - - 12 December2018 - -
Glyphosate - - - 3 September2018 -
Undermining 1 August 2018Soybeansowing 5 June 2019 5 June 2019 5 June 2019 5 June 2019 5 June 2019 5 June 2019
* Usual interventions of the field owner = conventional tillage in soybean cultivation.
2.2. Soil Fauna Sampling
Soil fauna sampling was conducted on three dates, April, June, and September, fromthe beginning to the end of soybean cultivation. Traps were active for two weeks in eachspecified sampling period. Soil fauna was collected using epigeic covered pitfall traps.Polythene pots (Ø = 12 cm, h = 18 cm) were incorporated 18 cm into the soil and coveredwith PVC roofs (Ø = 16 cm) approximately 4 cm above ground level. Each trap was halffilled with salted water (20% solution) for captures conservation. Four pitfall traps wereplaced in each field, two at the edge and two in the middle of the plot. All collected sampleswere stored in plastic containers with appropriate labelling prior to determination.
2.3. Data Analysis
After collecting samples of fauna, further research was carried out in the laboratory ofthe Department Agricultural Zoology of the Faculty of Agriculture in Zagreb. The collectedsoil fauna from each sample was separated from the contaminants and transferred into con-tainers with 96% alcohol. This was followed by sample identification. The determinationwas carried out with the help of light microscope and standard keys [26–31]. All organ-isms found were classified into the appropriate classes (Insecta, Arachnida, Malacostraca,Diplopoda, Chilopoda and Gastropoda). Members of the class Insecta are identified byfamily, genus or species.
161
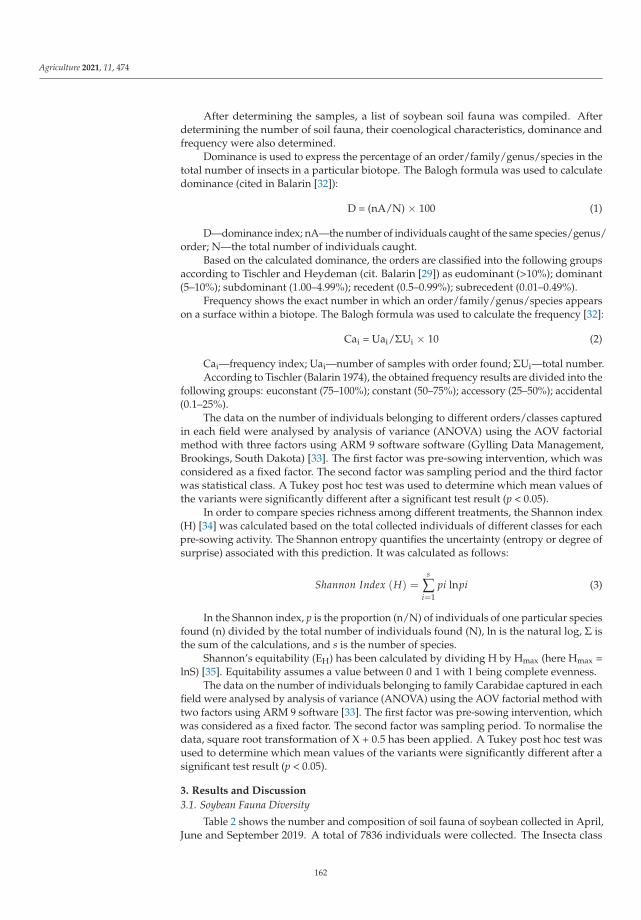
Agriculture 2021, 11, 474
After determining the samples, a list of soybean soil fauna was compiled. Afterdetermining the number of soil fauna, their coenological characteristics, dominance andfrequency were also determined.
Dominance is used to express the percentage of an order/family/genus/species in thetotal number of insects in a particular biotope. The Balogh formula was used to calculatedominance (cited in Balarin [32]):
D = (nA/N) × 100 (1)
D—dominance index; nA—the number of individuals caught of the same species/genus/order; N—the total number of individuals caught.
Based on the calculated dominance, the orders are classified into the following groupsaccording to Tischler and Heydeman (cit. Balarin [29]) as eudominant (>10%); dominant(5–10%); subdominant (1.00–4.99%); recedent (0.5–0.99%); subrecedent (0.01–0.49%).
Frequency shows the exact number in which an order/family/genus/species appearson a surface within a biotope. The Balogh formula was used to calculate the frequency [32]:
Cai = Uai/ΣUi × 10 (2)
Cai—frequency index; Uai—number of samples with order found; ΣUi—total number.According to Tischler (Balarin 1974), the obtained frequency results are divided into the
following groups: euconstant (75–100%); constant (50–75%); accessory (25–50%); accidental(0.1–25%).
The data on the number of individuals belonging to different orders/classes capturedin each field were analysed by analysis of variance (ANOVA) using the AOV factorialmethod with three factors using ARM 9 software software (Gylling Data Management,Brookings, South Dakota) [33]. The first factor was pre-sowing intervention, which wasconsidered as a fixed factor. The second factor was sampling period and the third factorwas statistical class. A Tukey post hoc test was used to determine which mean values ofthe variants were significantly different after a significant test result (p < 0.05).
In order to compare species richness among different treatments, the Shannon index(H) [34] was calculated based on the total collected individuals of different classes for eachpre-sowing activity. The Shannon entropy quantifies the uncertainty (entropy or degree ofsurprise) associated with this prediction. It was calculated as follows:
Shannon Index (H) =s
∑i=1
pi lnpi (3)
In the Shannon index, p is the proportion (n/N) of individuals of one particular speciesfound (n) divided by the total number of individuals found (N), ln is the natural log, Σ isthe sum of the calculations, and s is the number of species.
Shannon’s equitability (EH) has been calculated by dividing H by Hmax (here Hmax =lnS) [35]. Equitability assumes a value between 0 and 1 with 1 being complete evenness.
The data on the number of individuals belonging to family Carabidae captured in eachfield were analysed by analysis of variance (ANOVA) using the AOV factorial method withtwo factors using ARM 9 software [33]. The first factor was pre-sowing intervention, whichwas considered as a fixed factor. The second factor was sampling period. To normalise thedata, square root transformation of X + 0.5 has been applied. A Tukey post hoc test wasused to determine which mean values of the variants were significantly different after asignificant test result (p < 0.05).
3. Results and Discussion
3.1. Soybean Fauna Diversity
Table 2 shows the number and composition of soil fauna of soybean collected in April,June and September 2019. A total of 7836 individuals were collected. The Insecta class
162
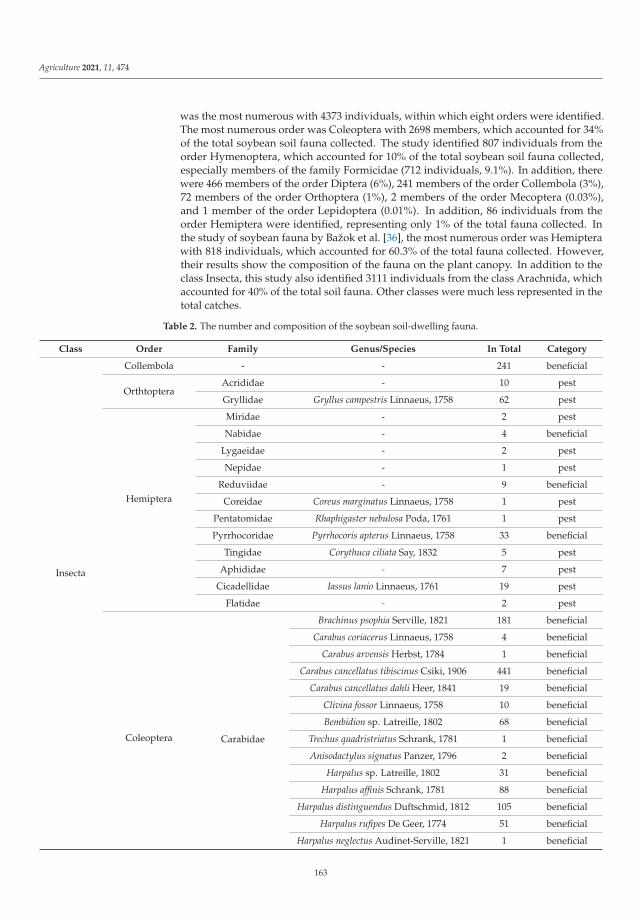
Agriculture 2021, 11, 474
was the most numerous with 4373 individuals, within which eight orders were identified.The most numerous order was Coleoptera with 2698 members, which accounted for 34%of the total soybean soil fauna collected. The study identified 807 individuals from theorder Hymenoptera, which accounted for 10% of the total soybean soil fauna collected,especially members of the family Formicidae (712 individuals, 9.1%). In addition, therewere 466 members of the order Diptera (6%), 241 members of the order Collembola (3%),72 members of the order Orthoptera (1%), 2 members of the order Mecoptera (0.03%),and 1 member of the order Lepidoptera (0.01%). In addition, 86 individuals from theorder Hemiptera were identified, representing only 1% of the total fauna collected. Inthe study of soybean fauna by Bažok et al. [36], the most numerous order was Hemipterawith 818 individuals, which accounted for 60.3% of the total fauna collected. However,their results show the composition of the fauna on the plant canopy. In addition to theclass Insecta, this study also identified 3111 individuals from the class Arachnida, whichaccounted for 40% of the total soil fauna. Other classes were much less represented in thetotal catches.
Table 2. The number and composition of the soybean soil-dwelling fauna.
Class Order Family Genus/Species In Total Category
Insecta
Collembola - - 241 beneficial
OrthtopteraAcrididae - 10 pest
Gryllidae Gryllus campestris Linnaeus, 1758 62 pest
Hemiptera
Miridae - 2 pest
Nabidae - 4 beneficial
Lygaeidae - 2 pest
Nepidae - 1 pest
Reduviidae - 9 beneficial
Coreidae Coreus marginatus Linnaeus, 1758 1 pest
Pentatomidae Rhaphigaster nebulosa Poda, 1761 1 pest
Pyrrhocoridae Pyrrhocoris apterus Linnaeus, 1758 33 beneficial
Tingidae Corythuca ciliata Say, 1832 5 pest
Aphididae - 7 pest
Cicadellidae Iassus lanio Linnaeus, 1761 19 pest
Flatidae - 2 pest
Coleoptera Carabidae
Brachinus psophia Serville, 1821 181 beneficial
Carabus coriacerus Linnaeus, 1758 4 beneficial
Carabus arvensis Herbst, 1784 1 beneficial
Carabus cancellatus tibiscinus Csiki, 1906 441 beneficial
Carabus cancellatus dahli Heer, 1841 19 beneficial
Clivina fossor Linnaeus, 1758 10 beneficial
Bembidion sp. Latreille, 1802 68 beneficial
Trechus quadristriatus Schrank, 1781 1 beneficial
Anisodactylus signatus Panzer, 1796 2 beneficial
Harpalus sp. Latreille, 1802 31 beneficial
Harpalus affinis Schrank, 1781 88 beneficial
Harpalus distinguendus Duftschmid, 1812 105 beneficial
Harpalus rufipes De Geer, 1774 51 beneficial
Harpalus neglectus Audinet-Serville, 1821 1 beneficial
163
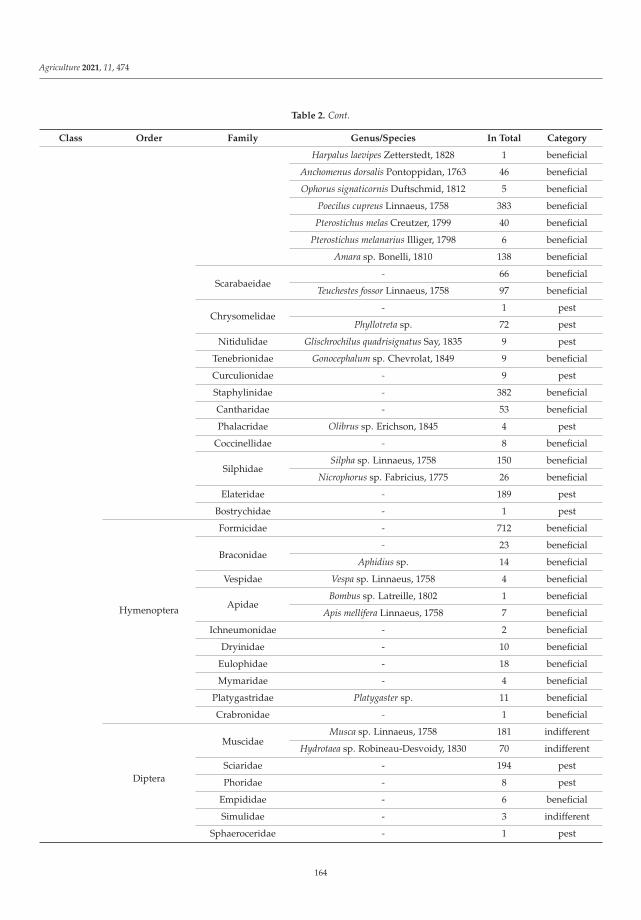
Agriculture 2021, 11, 474
Table 2. Cont.
Class Order Family Genus/Species In Total Category
Harpalus laevipes Zetterstedt, 1828 1 beneficial
Anchomenus dorsalis Pontoppidan, 1763 46 beneficial
Ophorus signaticornis Duftschmid, 1812 5 beneficial
Poecilus cupreus Linnaeus, 1758 383 beneficial
Pterostichus melas Creutzer, 1799 40 beneficial
Pterostichus melanarius Illiger, 1798 6 beneficial
Amara sp. Bonelli, 1810 138 beneficial
Scarabaeidae- 66 beneficial
Teuchestes fossor Linnaeus, 1758 97 beneficial
Chrysomelidae- 1 pest
Phyllotreta sp. 72 pest
Nitidulidae Glischrochilus quadrisignatus Say, 1835 9 pest
Tenebrionidae Gonocephalum sp. Chevrolat, 1849 9 beneficial
Curculionidae - 9 pest
Staphylinidae - 382 beneficial
Cantharidae - 53 beneficial
Phalacridae Olibrus sp. Erichson, 1845 4 pest
Coccinellidae - 8 beneficial
SilphidaeSilpha sp. Linnaeus, 1758 150 beneficial
Nicrophorus sp. Fabricius, 1775 26 beneficial
Elateridae - 189 pest
Bostrychidae - 1 pest
Hymenoptera
Formicidae - 712 beneficial
Braconidae- 23 beneficial
Aphidius sp. 14 beneficial
Vespidae Vespa sp. Linnaeus, 1758 4 beneficial
ApidaeBombus sp. Latreille, 1802 1 beneficial
Apis mellifera Linnaeus, 1758 7 beneficial
Ichneumonidae - 2 beneficial
Dryinidae - 10 beneficial
Eulophidae - 18 beneficial
Mymaridae - 4 beneficial
Platygastridae Platygaster sp. 11 beneficial
Crabronidae - 1 beneficial
Diptera
MuscidaeMusca sp. Linnaeus, 1758 181 indifferent
Hydrotaea sp. Robineau-Desvoidy, 1830 70 indifferent
Sciaridae - 194 pest
Phoridae - 8 pest
Empididae - 6 beneficial
Simulidae - 3 indifferent
Sphaeroceridae - 1 pest
164
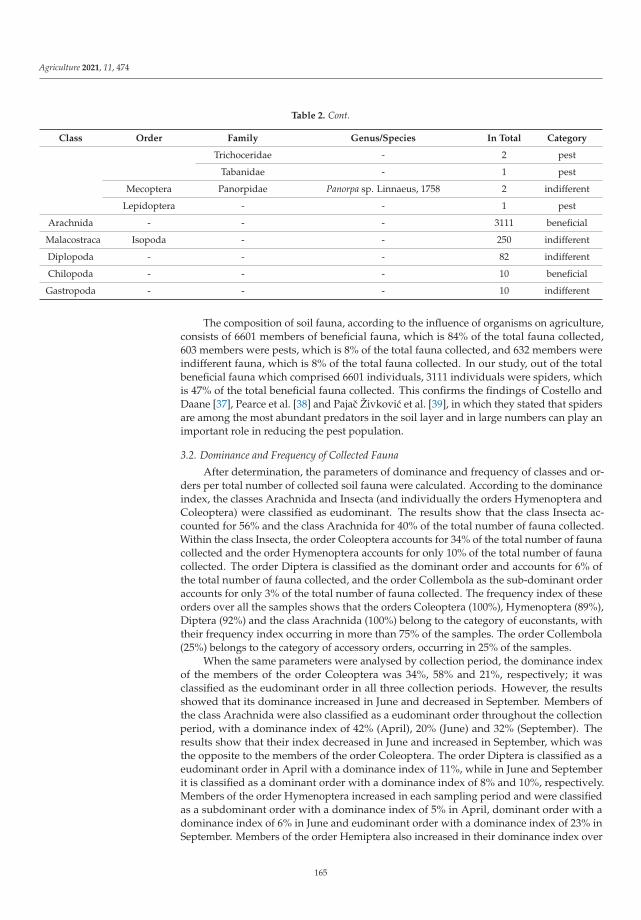
Agriculture 2021, 11, 474
Table 2. Cont.
Class Order Family Genus/Species In Total Category
Trichoceridae - 2 pest
Tabanidae - 1 pest
Mecoptera Panorpidae Panorpa sp. Linnaeus, 1758 2 indifferent
Lepidoptera - - 1 pest
Arachnida - - - 3111 beneficial
Malacostraca Isopoda - - 250 indifferent
Diplopoda - - - 82 indifferent
Chilopoda - - - 10 beneficial
Gastropoda - - - 10 indifferent
The composition of soil fauna, according to the influence of organisms on agriculture,consists of 6601 members of beneficial fauna, which is 84% of the total fauna collected,603 members were pests, which is 8% of the total fauna collected, and 632 members wereindifferent fauna, which is 8% of the total fauna collected. In our study, out of the totalbeneficial fauna which comprised 6601 individuals, 3111 individuals were spiders, whichis 47% of the total beneficial fauna collected. This confirms the findings of Costello andDaane [37], Pearce et al. [38] and Pajac Živkovic et al. [39], in which they stated that spidersare among the most abundant predators in the soil layer and in large numbers can play animportant role in reducing the pest population.
3.2. Dominance and Frequency of Collected Fauna
After determination, the parameters of dominance and frequency of classes and or-ders per total number of collected soil fauna were calculated. According to the dominanceindex, the classes Arachnida and Insecta (and individually the orders Hymenoptera andColeoptera) were classified as eudominant. The results show that the class Insecta ac-counted for 56% and the class Arachnida for 40% of the total number of fauna collected.Within the class Insecta, the order Coleoptera accounts for 34% of the total number of faunacollected and the order Hymenoptera accounts for only 10% of the total number of faunacollected. The order Diptera is classified as the dominant order and accounts for 6% ofthe total number of fauna collected, and the order Collembola as the sub-dominant orderaccounts for only 3% of the total number of fauna collected. The frequency index of theseorders over all the samples shows that the orders Coleoptera (100%), Hymenoptera (89%),Diptera (92%) and the class Arachnida (100%) belong to the category of euconstants, withtheir frequency index occurring in more than 75% of the samples. The order Collembola(25%) belongs to the category of accessory orders, occurring in 25% of the samples.
When the same parameters were analysed by collection period, the dominance indexof the members of the order Coleoptera was 34%, 58% and 21%, respectively; it wasclassified as the eudominant order in all three collection periods. However, the resultsshowed that its dominance increased in June and decreased in September. Members ofthe class Arachnida were also classified as a eudominant order throughout the collectionperiod, with a dominance index of 42% (April), 20% (June) and 32% (September). Theresults show that their index decreased in June and increased in September, which wasthe opposite to the members of the order Coleoptera. The order Diptera is classified as aeudominant order in April with a dominance index of 11%, while in June and Septemberit is classified as a dominant order with a dominance index of 8% and 10%, respectively.Members of the order Hymenoptera increased in each sampling period and were classifiedas a subdominant order with a dominance index of 5% in April, dominant order with adominance index of 6% in June and eudominant order with a dominance index of 23% inSeptember. Members of the order Hemiptera also increased in their dominance index over
165

Agriculture 2021, 11, 474
the study period. In April, it was classified as a recurrent order with a dominance index of1%, and in June and September it was classified as a subdominant order with dominanceindices of 1% and 4%, respectively. The order Isopoda was subdominant in April with adominance index of 3%, then fell to a recedent order in June with a dominance index of 1%,and rose to a dominant order in September with a dominance index of 5%.
The class Arachnida (100%) and, within the class Insecta, the order Coleoptera (100%)are classified as euconstant throughout the sampling period and occur in all samplescollected. The order Diptera is also classified as euconstant throughout April and Septemberand was found in every sample collected, while in June it occurs in 75% of the samples.The order Hymenoptera is found in all the collected samples in April and September andis classified as a euconstant order, while in June it is found in 67% and is classified as aconstant order. Members of the order Hemiptera were present in all collected samples inApril and classified as a euconstant order, in June they were classified as an accessory orderand were present in 33% of collected samples, while in September they were again classifiedas a euconstant order and were present in 83% of collected samples. The order Isopodawas found in 67% of the collected samples in April, in 50% of the collected samples inSeptember and was classified as a constant order, and in June it was found as an accessoryorder in only 17% of the collected samples.
3.3. Influence of Pre-Sowing Tillage on Soil Fauna Abundance
The total number of catches from the same pre-seeding measures was tested mutuallyand the p values ranged from 0.158978 to 0.687678, which means that the same pre-seedingmeasure had no influence on the abundance of fauna on the tested sites in the Šašinovecarea. Therefore, in the further results, we present summarised data on collected soybeanfauna per measure before sowing.
Table 3 shows the results of ANOVA between the total number of catches of all soil-dwelling fauna on the studied variants throughout the survey period. The results showthat catches were extremely high in April and that they decreased during the summer andautumn months. In April, significantly more members of the fauna were found in fieldswith glyphosate and in fields where mulching was carried out. The lowest abundance offauna was found in fields with cover crops prior to seeding. In June, up to 10 times lowercatches of fauna were found, and significantly the highest catches were found in fieldswhere ploughing was carried out before sowing, and the lowest catches were found infields with mulching, glyphosate and standard tillage. In September, catches were evenlower and no differences were found between the studied variants.
Table 3. Total catches of soil fauna (±standard error: SE) on all variants throughout the research period.
Pre-Sowing ActivityResearch Period
April June September
Cover plants 199.5 ± 10.8 c,* 27.8 ± 3.5 b,c 21.5 ± 7.1 ns
Mulching 453.0 ± 33.8 a 25.3 ± 2.8 c 19.5 ± 7.2 ns
Ploughing 287.5 ± 51.5 b,c 49.8 ± 2.7 a 10.0 ± 1.1 ns
Glyphosate 460.8 ± 24.2 a 21.5 ± 2.7 c 28.0 ± 4.8 ns
Undermining 249.0 ± 24.8 c 42.8 ± 4.5 a,b 16.0 ± 2.6 ns
Standard 404.0 ± 32.0 a,b 18.3 ± 1.6 c 28.5 ± 7.2 ns
Tukey’s HSD p = 0.05 ** 147.75 15.26 ns
Standard Deviation 64.3 6.6 11.0
Levene’s F1.8 0.6 23.5
0.156 0.702 0.001 ** values marked with the same letter (a–c) do not differ significantly (p > 0.05; HSD test); ns—non significant;** HSD was determined by comparing the total abundance of fauna between different methods of pre-sowingtillage in all periods of research. Equality of variances was tested with Levene’s test and reaches with equalvariances (p > 0.05); ‘t = Mean descriptions are reported in transformed data units and are not de-transformed(data were log (x + 1) transformed and arcsin trans-formed
√x).
166
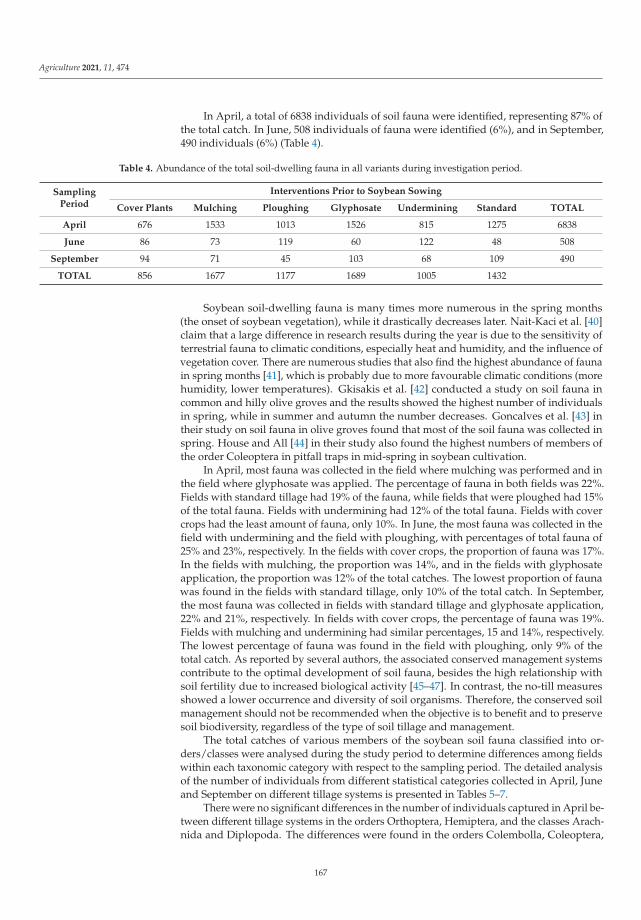
Agriculture 2021, 11, 474
In April, a total of 6838 individuals of soil fauna were identified, representing 87% ofthe total catch. In June, 508 individuals of fauna were identified (6%), and in September,490 individuals (6%) (Table 4).
Table 4. Abundance of the total soil-dwelling fauna in all variants during investigation period.
SamplingPeriod
Interventions Prior to Soybean Sowing
Cover Plants Mulching Ploughing Glyphosate Undermining Standard TOTAL
April 676 1533 1013 1526 815 1275 6838
June 86 73 119 60 122 48 508
September 94 71 45 103 68 109 490
TOTAL 856 1677 1177 1689 1005 1432
Soybean soil-dwelling fauna is many times more numerous in the spring months(the onset of soybean vegetation), while it drastically decreases later. Nait-Kaci et al. [40]claim that a large difference in research results during the year is due to the sensitivity ofterrestrial fauna to climatic conditions, especially heat and humidity, and the influence ofvegetation cover. There are numerous studies that also find the highest abundance of faunain spring months [41], which is probably due to more favourable climatic conditions (morehumidity, lower temperatures). Gkisakis et al. [42] conducted a study on soil fauna incommon and hilly olive groves and the results showed the highest number of individualsin spring, while in summer and autumn the number decreases. Goncalves et al. [43] intheir study on soil fauna in olive groves found that most of the soil fauna was collected inspring. House and All [44] in their study also found the highest numbers of members ofthe order Coleoptera in pitfall traps in mid-spring in soybean cultivation.
In April, most fauna was collected in the field where mulching was performed and inthe field where glyphosate was applied. The percentage of fauna in both fields was 22%.Fields with standard tillage had 19% of the fauna, while fields that were ploughed had 15%of the total fauna. Fields with undermining had 12% of the total fauna. Fields with covercrops had the least amount of fauna, only 10%. In June, the most fauna was collected in thefield with undermining and the field with ploughing, with percentages of total fauna of25% and 23%, respectively. In the fields with cover crops, the proportion of fauna was 17%.In the fields with mulching, the proportion was 14%, and in the fields with glyphosateapplication, the proportion was 12% of the total catches. The lowest proportion of faunawas found in the fields with standard tillage, only 10% of the total catch. In September,the most fauna was collected in fields with standard tillage and glyphosate application,22% and 21%, respectively. In fields with cover crops, the percentage of fauna was 19%.Fields with mulching and undermining had similar percentages, 15 and 14%, respectively.The lowest percentage of fauna was found in the field with ploughing, only 9% of thetotal catch. As reported by several authors, the associated conserved management systemscontribute to the optimal development of soil fauna, besides the high relationship withsoil fertility due to increased biological activity [45–47]. In contrast, the no-till measuresshowed a lower occurrence and diversity of soil organisms. Therefore, the conserved soilmanagement should not be recommended when the objective is to benefit and to preservesoil biodiversity, regardless of the type of soil tillage and management.
The total catches of various members of the soybean soil fauna classified into or-ders/classes were analysed during the study period to determine differences among fieldswithin each taxonomic category with respect to the sampling period. The detailed analysisof the number of individuals from different statistical categories collected in April, Juneand September on different tillage systems is presented in Tables 5–7.
There were no significant differences in the number of individuals captured in April be-tween different tillage systems in the orders Orthoptera, Hemiptera, and the classes Arach-nida and Diplopoda. The differences were found in the orders Colembolla, Coleoptera,
167
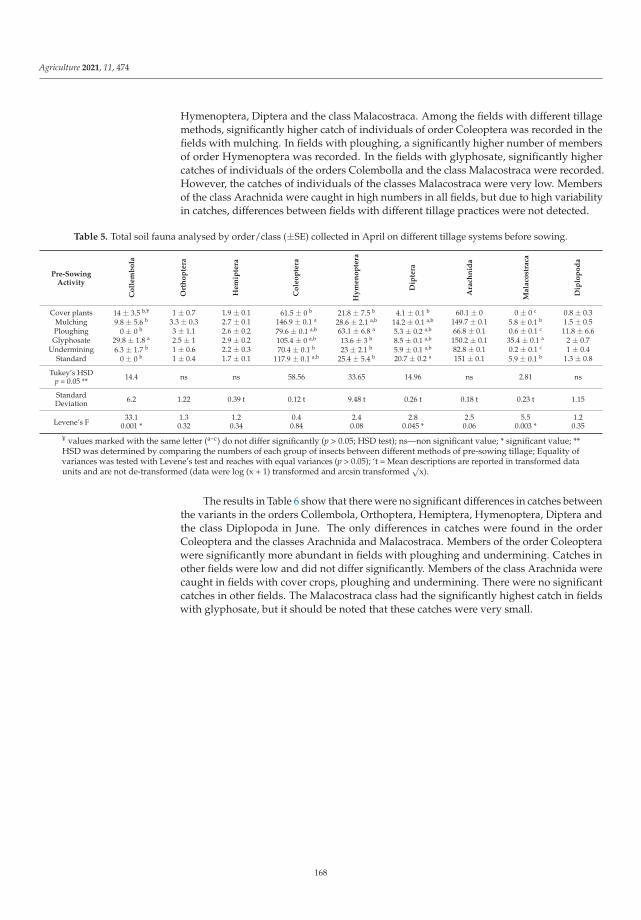
Agriculture 2021, 11, 474
Hymenoptera, Diptera and the class Malacostraca. Among the fields with different tillagemethods, significantly higher catch of individuals of order Coleoptera was recorded in thefields with mulching. In fields with ploughing, a significantly higher number of membersof order Hymenoptera was recorded. In the fields with glyphosate, significantly highercatches of individuals of the orders Colembolla and the class Malacostraca were recorded.However, the catches of individuals of the classes Malacostraca were very low. Membersof the class Arachnida were caught in high numbers in all fields, but due to high variabilityin catches, differences between fields with different tillage practices were not detected.
Table 5. Total soil fauna analysed by order/class (±SE) collected in April on different tillage systems before sowing.
Pre-SowingActivity
Co
lle
mb
ola
Ort
ho
pte
ra
He
mip
tera
Co
leo
pte
ra
Hy
me
no
pte
ra
Dip
tera
Ara
chn
ida
Ma
laco
stra
ca
Dip
lop
od
a
Cover plants 14 ± 3.5 b,¥ 1 ± 0.7 1.9 ± 0.1 61.5 ± 0 b 21.8 ± 7.5 b 4.1 ± 0.1 b 60.1 ± 0 0 ± 0 c 0.8 ± 0.3Mulching 9.8 ± 5.6 b 3.3 ± 0.3 2.7 ± 0.1 146.9 ± 0.1 a 28.6 ± 2.1 a,b 14.2 ± 0.1 a,b 149.7 ± 0.1 5.8 ± 0.1 b 1.5 ± 0.5Ploughing 0 ± 0 b 3 ± 1.1 2.6 ± 0.2 79.6 ± 0.1 a,b 63.1 ± 6.8 a 5.3 ± 0.2 a,b 66.8 ± 0.1 0.6 ± 0.1 c 11.8 ± 6.6Glyphosate 29.8 ± 1.8 a 2.5 ± 1 2.9 ± 0.2 105.4 ± 0 a,b 13.6 ± 3 b 8.5 ± 0.1 a,b 150.2 ± 0.1 35.4 ± 0.1 a 2 ± 0.7
Undermining 6.3 ± 1.7 b 1 ± 0.6 2.2 ± 0.3 70.4 ± 0.1 b 23 ± 2.1 b 5.9 ± 0.1 a,b 82.8 ± 0.1 0.2 ± 0.1 c 1 ± 0.4Standard 0 ± 0 b 1 ± 0.4 1.7 ± 0.1 117.9 ± 0.1 a,b 25.4 ± 5.4 b 20.7 ± 0.2 a 151 ± 0.1 5.9 ± 0.1 b 1.3 ± 0.8
Tukey’s HSDp = 0.05 ** 14.4 ns ns 58.56 33.65 14.96 ns 2.81 ns
StandardDeviation 6.2 1.22 0.39 t 0.12 t 9.48 t 0.26 t 0.18 t 0.23 t 1.15
Levene’s F33.1 1.3 1.2 0.4 2.4 2.8 2.5 5.5 1.2
0.001 * 0.32 0.34 0.84 0.08 0.045 * 0.06 0.003 * 0.35
¥ values marked with the same letter (a–c) do not differ significantly (p > 0.05; HSD test); ns—non significant value; * significant value; **HSD was determined by comparing the numbers of each group of insects between different methods of pre-sowing tillage; Equality ofvariances was tested with Levene’s test and reaches with equal variances (p > 0.05); ‘t = Mean descriptions are reported in transformed dataunits and are not de-transformed (data were log (x + 1) transformed and arcsin transformed
√x).
The results in Table 6 show that there were no significant differences in catches betweenthe variants in the orders Collembola, Orthoptera, Hemiptera, Hymenoptera, Diptera andthe class Diplopoda in June. The only differences in catches were found in the orderColeoptera and the classes Arachnida and Malacostraca. Members of the order Coleopterawere significantly more abundant in fields with ploughing and undermining. Catches inother fields were low and did not differ significantly. Members of the class Arachnida werecaught in fields with cover crops, ploughing and undermining. There were no significantcatches in other fields. The Malacostraca class had the significantly highest catch in fieldswith glyphosate, but it should be noted that these catches were very small.
168
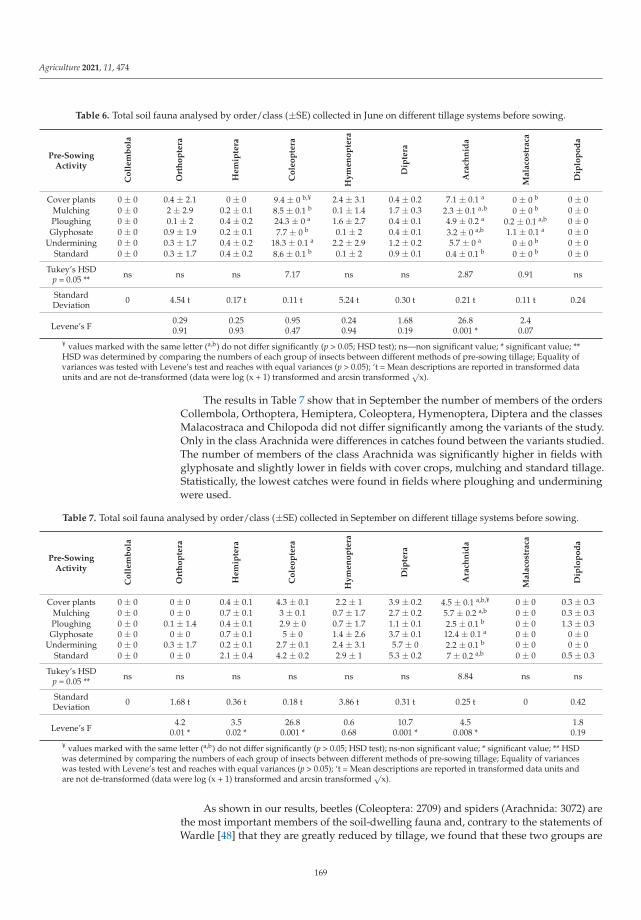
Agriculture 2021, 11, 474
Table 6. Total soil fauna analysed by order/class (±SE) collected in June on different tillage systems before sowing.
Pre-SowingActivity
Co
lle
mb
ola
Ort
ho
pte
ra
He
mip
tera
Co
leo
pte
ra
Hy
me
no
pte
ra
Dip
tera
Ara
chn
ida
Ma
laco
stra
ca
Dip
lop
od
a
Cover plants 0 ± 0 0.4 ± 2.1 0 ± 0 9.4 ± 0 b,¥ 2.4 ± 3.1 0.4 ± 0.2 7.1 ± 0.1 a 0 ± 0 b 0 ± 0Mulching 0 ± 0 2 ± 2.9 0.2 ± 0.1 8.5 ± 0.1 b 0.1 ± 1.4 1.7 ± 0.3 2.3 ± 0.1 a,b 0 ± 0 b 0 ± 0Ploughing 0 ± 0 0.1 ± 2 0.4 ± 0.2 24.3 ± 0 a 1.6 ± 2.7 0.4 ± 0.1 4.9 ± 0.2 a 0.2 ± 0.1 a,b 0 ± 0Glyphosate 0 ± 0 0.9 ± 1.9 0.2 ± 0.1 7.7 ± 0 b 0.1 ± 2 0.4 ± 0.1 3.2 ± 0 a,b 1.1 ± 0.1 a 0 ± 0
Undermining 0 ± 0 0.3 ± 1.7 0.4 ± 0.2 18.3 ± 0.1 a 2.2 ± 2.9 1.2 ± 0.2 5.7 ± 0 a 0 ± 0 b 0 ± 0Standard 0 ± 0 0.3 ± 1.7 0.4 ± 0.2 8.6 ± 0.1 b 0.1 ± 2 0.9 ± 0.1 0.4 ± 0.1 b 0 ± 0 b 0 ± 0
Tukey’s HSDp = 0.05 ** ns ns ns 7.17 ns ns 2.87 0.91 ns
StandardDeviation 0 4.54 t 0.17 t 0.11 t 5.24 t 0.30 t 0.21 t 0.11 t 0.24
Levene’s F0.29 0.25 0.95 0.24 1.68 26.8 2.40.91 0.93 0.47 0.94 0.19 0.001 * 0.07
¥ values marked with the same letter (a,b) do not differ significantly (p > 0.05; HSD test); ns—non significant value; * significant value; **HSD was determined by comparing the numbers of each group of insects between different methods of pre-sowing tillage; Equality ofvariances was tested with Levene’s test and reaches with equal variances (p > 0.05); ‘t = Mean descriptions are reported in transformed dataunits and are not de-transformed (data were log (x + 1) transformed and arcsin transformed
√x).
The results in Table 7 show that in September the number of members of the ordersCollembola, Orthoptera, Hemiptera, Coleoptera, Hymenoptera, Diptera and the classesMalacostraca and Chilopoda did not differ significantly among the variants of the study.Only in the class Arachnida were differences in catches found between the variants studied.The number of members of the class Arachnida was significantly higher in fields withglyphosate and slightly lower in fields with cover crops, mulching and standard tillage.Statistically, the lowest catches were found in fields where ploughing and underminingwere used.
Table 7. Total soil fauna analysed by order/class (±SE) collected in September on different tillage systems before sowing.
Pre-SowingActivity
Co
lle
mb
ola
Ort
ho
pte
ra
He
mip
tera
Co
leo
pte
ra
Hy
me
no
pte
ra
Dip
tera
Ara
chn
ida
Ma
laco
stra
ca
Dip
lop
od
a
Cover plants 0 ± 0 0 ± 0 0.4 ± 0.1 4.3 ± 0.1 2.2 ± 1 3.9 ± 0.2 4.5 ± 0.1 a,b,¥ 0 ± 0 0.3 ± 0.3Mulching 0 ± 0 0 ± 0 0.7 ± 0.1 3 ± 0.1 0.7 ± 1.7 2.7 ± 0.2 5.7 ± 0.2 a,b 0 ± 0 0.3 ± 0.3Ploughing 0 ± 0 0.1 ± 1.4 0.4 ± 0.1 2.9 ± 0 0.7 ± 1.7 1.1 ± 0.1 2.5 ± 0.1 b 0 ± 0 1.3 ± 0.3Glyphosate 0 ± 0 0 ± 0 0.7 ± 0.1 5 ± 0 1.4 ± 2.6 3.7 ± 0.1 12.4 ± 0.1 a 0 ± 0 0 ± 0
Undermining 0 ± 0 0.3 ± 1.7 0.2 ± 0.1 2.7 ± 0.1 2.4 ± 3.1 5.7 ± 0 2.2 ± 0.1 b 0 ± 0 0 ± 0Standard 0 ± 0 0 ± 0 2.1 ± 0.4 4.2 ± 0.2 2.9 ± 1 5.3 ± 0.2 7 ± 0.2 a,b 0 ± 0 0.5 ± 0.3
Tukey’s HSDp = 0.05 ** ns ns ns ns ns ns 8.84 ns ns
StandardDeviation 0 1.68 t 0.36 t 0.18 t 3.86 t 0.31 t 0.25 t 0 0.42
Levene’s F4.2 3.5 26.8 0.6 10.7 4.5 1.8
0.01 * 0.02 * 0.001 * 0.68 0.001 * 0.008 * 0.19¥ values marked with the same letter (a,b) do not differ significantly (p > 0.05; HSD test); ns-non significant value; * significant value; ** HSDwas determined by comparing the numbers of each group of insects between different methods of pre-sowing tillage; Equality of varianceswas tested with Levene’s test and reaches with equal variances (p > 0.05); ‘t = Mean descriptions are reported in transformed data units andare not de-transformed (data were log (x + 1) transformed and arcsin transformed
√x).
As shown in our results, beetles (Coleoptera: 2709) and spiders (Arachnida: 3072) arethe most important members of the soil-dwelling fauna and, contrary to the statements ofWardle [48] that they are greatly reduced by tillage, we found that these two groups are
169

Agriculture 2021, 11, 474
much more influenced by weather conditions (high abundance in spring, low in autumn)than by tillage. The results of the factorial analysis (Table 8) provide additional supportfor our conclusions. The number of individuals collected was significantly (p > 0.05%)influenced by the pre-sowing treatment (HSD = 1.28) and by the period of sampling(HSD = 0.74), as well as by the order/class of individuals recorded (HSD = 1.71), provingthat the pre-sowing treatment (i.e., the type of tillage) is responsible for the number ofdifferent orders/classes of soil-dwelling fauna in soybean. The sampling period alsoinfluences the captures as well as the interaction between pre-sowing intervention andsampling date. The significant interaction (p > 0.05%) was present between all the threefactors (pre-sowing intervention, sampling period and order/class of individuals recorded)for the number of individuals recorded.
Table 8. Factorial analysis of the total capture of different orders/classes of soil fauna.
Source of Variation df p HSD
Total 971Rep 5
Pre-sowing intervention (A) 5 0.0001 1.28Sampling period (B) 2 0.0001 0.74
A × B 10 0.0001 2.72Order/Class (C) 8 0.0001 1.71
A × C 40 0.0001 5.44B × C 16 0.0001 3.53
A × B × C 80 0.0001 10.56Error 805
df—degrees of freedom; p—probability value; HSD—honestly significant difference.
3.4. Influence of Pre-Sowing Tillage on Soil Fauna Species Richness
The diversity in six different pre-sowing treatments, calculated according to theShannon diversity index (H) and according to Shannon’s equitability (EH), is shown inTable 9. We can see from our results that the diversity and evenness in the fields fromthe standard pre-sowing treatment are much lower than in the fields from the treatmentsthat disturb the soil less, such as cover crops, ploughing, undermining and mulching. Atthe same time, the difference in diversity and evenness between the standard treatmentand the treatment with glyphosate is somewhat smaller. In the fields where the activitiesare less intensive, not only is there a greater number of species, but the individuals in thecommunity are more evenly distributed among these species. In the fields with standardpre-sowing activities, there are 50 species, but the class Arachnidae accounts for 46% of thecommunity and Staphylinidae, Carabus tibiscianus and Formicidae account for the other22% of the community.
Table 9. Shannon diversity index (H) and Shannon’s equitability (EH) of collected fauna in different pre-sowing treatments.
Pre-Sowing Activity
Cover Plants Mulching Ploughing Glyphosate Undermining Standard
Shannon diversityindex (H) 2.583 2.619 2.575 2.319 2.538 2.202
Number of species 44 57 48 42 49 50Shannon’s
equitability (EH) 0.683 0.648 0.665 0.620 0.652 0.563
Our results confirm an earlier study by Baretta et al. [49], in which it was shownthat the members of Collembola, Araneae, Hymenoptera, Orthoptera, Grylloblattodea,Lepidoptera and the total abundance of soil fauna were related not only to specific tillagesystems but also to weather conditions at the time of sampling. The same authors noted thatno-till has a higher amount of organic matter in the surface layers and a higher moisture
170

Agriculture 2021, 11, 474
status of the soil, which promotes the formation of a suitable environment for a greaterabundance and diversity of edaphic groups, especially Coleoptera and Isopoda [49]. Thiswas partially confirmed in our study, especially in the spring sampling, where the greatestfaunal diversity was found in variants with mulching and glyphosate treatments, whichare without intervention in the soil layers.
3.5. Influence of Pre-Sowing Treatments on the Carabid Population
Of all the fauna recorded, the family Carabidae has received special attention becauseof its importance as predators of numerous pest species [50–52] and as indicators ofanthropogenic impacts and agroecosystem quality [22,52–58]. Members of the familyCarabidae accounted for 34% of the total fauna collected. A total of 21 species of carabidswere identified in this study, with Carabus cancellatus tibiscinus (441 individuals), Poeciluscupreus (383 individuals), Brachinus psophia (181 individuals) and Harpalus distinguindes(105 individuals) standing out in numbers. Lemic et al. [57] reported a similar carabidcommunity (26 species with 15 genera) in an intensively managed agricultural production.Carabids are considered as one of the most important natural enemies in soil and subsoillayers [59]. They are also used in numerous studies as bioindicators of climate change andthe effects of agrochemicals on their habitats, and their abundance can indicate the level ofpollution in an area [12,60–68].
Depending on the pre-sowing interventions (Figure 1), the abundance of carabids inApril was the highest in fields where mulching was carried out (363 individuals: 22%),followed by fields with glyphosate application (317 individuals: 20%); fields with standardtillage (241 individuals: 15%); fields with undermining (183 individuals: 11%); ploughing(161 individuals: 10%); and the lowest abundance was observed in fields with cover crops(121 individuals: 8%). In June, the total number of catches was much lower and the highestnumber of carabids was observed in the fields with ploughing (only 56 individuals, 4%),while the number was even lower in the other variants. In September, the abundance ofcarabids was very low, with a maximum catch of 10 individuals identified in the fieldwhere glyphosate was applied.
Figure 1. Number of members of the family Carabidae captured on fields with different pre-sowing interventions inthe fields with different pre-sowing activities (values marked with the same letter do not differ significantly (p > 0.05;HSD = 2.01)).
171
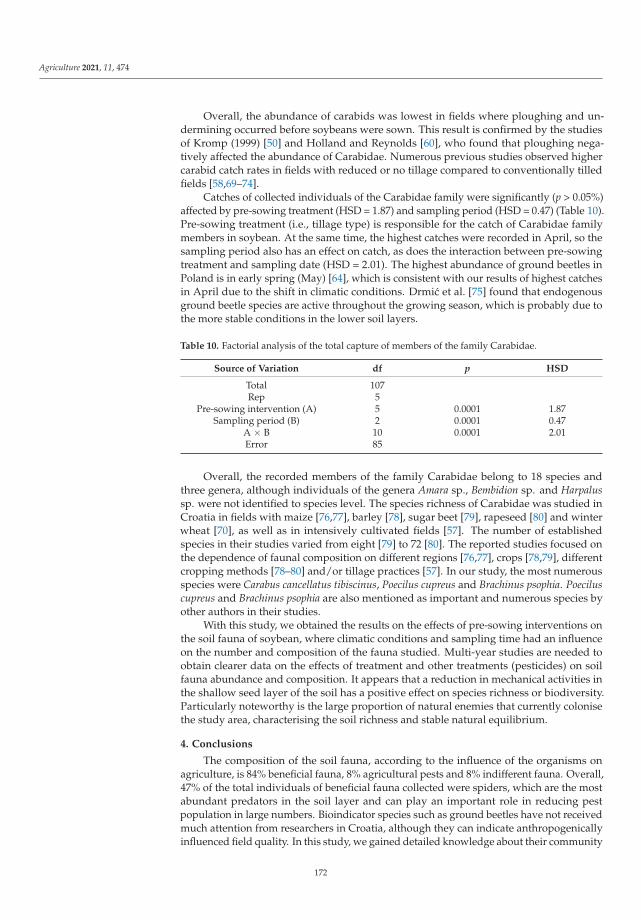
Agriculture 2021, 11, 474
Overall, the abundance of carabids was lowest in fields where ploughing and un-dermining occurred before soybeans were sown. This result is confirmed by the studiesof Kromp (1999) [50] and Holland and Reynolds [60], who found that ploughing nega-tively affected the abundance of Carabidae. Numerous previous studies observed highercarabid catch rates in fields with reduced or no tillage compared to conventionally tilledfields [58,69–74].
Catches of collected individuals of the Carabidae family were significantly (p > 0.05%)affected by pre-sowing treatment (HSD = 1.87) and sampling period (HSD = 0.47) (Table 10).Pre-sowing treatment (i.e., tillage type) is responsible for the catch of Carabidae familymembers in soybean. At the same time, the highest catches were recorded in April, so thesampling period also has an effect on catch, as does the interaction between pre-sowingtreatment and sampling date (HSD = 2.01). The highest abundance of ground beetles inPoland is in early spring (May) [64], which is consistent with our results of highest catchesin April due to the shift in climatic conditions. Drmic et al. [75] found that endogenousground beetle species are active throughout the growing season, which is probably due tothe more stable conditions in the lower soil layers.
Table 10. Factorial analysis of the total capture of members of the family Carabidae.
Source of Variation df p HSD
Total 107Rep 5
Pre-sowing intervention (A) 5 0.0001 1.87Sampling period (B) 2 0.0001 0.47
A × B 10 0.0001 2.01Error 85
Overall, the recorded members of the family Carabidae belong to 18 species andthree genera, although individuals of the genera Amara sp., Bembidion sp. and Harpalussp. were not identified to species level. The species richness of Carabidae was studied inCroatia in fields with maize [76,77], barley [78], sugar beet [79], rapeseed [80] and winterwheat [70], as well as in intensively cultivated fields [57]. The number of establishedspecies in their studies varied from eight [79] to 72 [80]. The reported studies focused onthe dependence of faunal composition on different regions [76,77], crops [78,79], differentcropping methods [78–80] and/or tillage practices [57]. In our study, the most numerousspecies were Carabus cancellatus tibiscinus, Poecilus cupreus and Brachinus psophia. Poeciluscupreus and Brachinus psophia are also mentioned as important and numerous species byother authors in their studies.
With this study, we obtained the results on the effects of pre-sowing interventions onthe soil fauna of soybean, where climatic conditions and sampling time had an influenceon the number and composition of the fauna studied. Multi-year studies are needed toobtain clearer data on the effects of treatment and other treatments (pesticides) on soilfauna abundance and composition. It appears that a reduction in mechanical activities inthe shallow seed layer of the soil has a positive effect on species richness or biodiversity.Particularly noteworthy is the large proportion of natural enemies that currently colonisethe study area, characterising the soil richness and stable natural equilibrium.
4. Conclusions
The composition of the soil fauna, according to the influence of the organisms onagriculture, is 84% beneficial fauna, 8% agricultural pests and 8% indifferent fauna. Overall,47% of the total individuals of beneficial fauna collected were spiders, which are the mostabundant predators in the soil layer and can play an important role in reducing pestpopulation in large numbers. Bioindicator species such as ground beetles have not receivedmuch attention from researchers in Croatia, although they can indicate anthropogenicallyinfluenced field quality. In this study, we gained detailed knowledge about their community
172
Agriculture 2021, 11, 474
in a specific agricultural landscape in central Croatia. In modern agriculture, conservationprograms are promoted to preserve useful species and biodiversity as a means to ensuresustainability.
The number of total fauna collected was influenced by the interaction between pre-sowing intervention and sampling date. Pre-seeding interventions (such as cover crops,glyphosate application, and mulching) that did not involve soil activities did not affectthe number and composition of soil fauna in the beginning of the vegetation. Mechanicalintervention in the soil and warmer and drier weather (summer/fall) have a negative effecton the number and composition of soil fauna. As the season progresses, the influence ofpre-sowing activities on soil fauna in soybean production decreases.
There are two main reasons for the difficulty in relating soil fauna activities to ecosys-tem and agricultural services: first, the top-down effects of management, especially inagricultural systems; second, the specificity of soil processes. In highly diverse communi-ties, the abundance of specific soil fauna members’ effects is masked by the other bioticevents that contribute to the same properties and processes in soil (e.g., weather conditions.Many processes created by soil fauna (predation, symbiosis, mutualism, etc.) have dynam-ics that can nullify the signal of the soil intervention effects studied during one soybeanseason.
However, the results of this study contributed significantly to a better understandingof the baseline situation about soil fauna communities in an intensive agricultural landscapeand will be a good starting point for future studies and conservation programs.
Author Contributions: Conceptualization, D.L. and M.P.; methodology, D.L. and R.B.; software, D.L.;validation, I.P.Ž., and R.B.; formal analysis, D.L. and M.P.; investigation, M.P.; resources, R.B.; datacuration, M.P.; writing—original draft preparation, D.L., M.P. and I.P.Ž.; writing—review and editing,D.L. and I.P.Ž.; visualization, D.L. and I.P.Ž.; supervision, D.L. and R.B. All authors have read andagreed to the published version of the manuscript.
Funding: This research received no external funding.
Institutional Review Board Statement: Not applicable.
Informed Consent Statement: Not applicable.
Data Availability Statement: The datasets used and/or analysed during the current study areavailable from the corresponding author on reasonable request.
Acknowledgments: We thank Iva Dobrincic, Matej Oreškovic, Marija Andrijana Galešic, SandraSkendžic, Kristina Žganec and Maja Šupljika for help in the collection and determination of soilfauna. Special thanks to Josip Lakic for providing us soybean fields for this survey.
Conflicts of Interest: The authors declare no conflict of interest.
References
1. Filho, M.M.; Destro, D.; Miranda, A.L.; Spinosa, A.W.; Carrão-Panizzi, M.C.; Montalván, R. Relationships Among Oil Content,Protein Content and Seed Size in Soybeans. Braz. Arch. Biol. Technol. 2001, 44, 23–32. [CrossRef]
2. Alduk, H. Soybean Cultivation (Glycine max L. Merr.) on the Family Farm Alduk. Bachelor’s Thesis, University Josip JurajStrossmayer of Osijek, Osijek, Croatia, 27 September 2018.
3. Jurišic, M. AgBase—AgBase Handbook for Cropping I. Cropping System of More Important in Arable Crops; Gradska tiskara d.d. Osijek:Osijek, Croatia, 2008; p. 192.
4. Salaic, M. Soybean Cultivation on the Surfaces of “AGRO-TOVARNIK d.o.o” in the Period from 2010 to 2014. Bachelor’s Thesis,University Josip Juraj Strossmayer of Osijek, Osijek, Croatia, 2015.
5. Iannetta, P.P.M.; Young, M.; Bachinger, J.; Bergkvist, G.; Doltra, J.; Lopez-Bellido, R.J.; Monti, M.; Pappa, V.A.; Reckling, M.; Topp,C.F.E.; et al. A Comparative Nitrogen Balance and Productivity Analysis of Legume and Non-legume Supported CroppingSystems: The Potential Role of Biological Nitrogen Fixation. Front. Plant Sci. 2016, 7, 1700. [CrossRef]
6. Hrgovic, S. Soybeans and Agrotechnics. Agrobiz/Agrosavjeti. 2021. Available online: https://www.agrobiz.hr/agrosavjeti/soja-i-agrotehnika-939 (accessed on 3 August 2020).
7. Tsiafouli, M.A.; Thébault, E.; Sgardelis, S.P.; De Ruiter, P.C.; Van Der Putten, W.H.; Birkhofer, K.; Hemerik, L.; De Vries, F.T.;Bardgett, R.D.; Brady, M.V.; et al. Intensive agriculture reduces soil biodiversity across Europe. Glob. Chang. Biol. 2014, 21,973–985. [CrossRef]
173
Agriculture 2021, 11, 474
8. Tillage, J.D. Selected teaching Material for Graduate Students—Plant Breeding. Osijek: Agricultural University. 2020. Availableonline: http://www.fazos.unios.hr/upload/documents/01_Odabrani%20tekstovi%20iz%20obrade%20tla.pdf (accessed on 12June 2020).
9. Cameron, E.K.; Martins, I.S.; Lavelle, P.; Mathieu, J.; Tedersoo, L.; Gottschall, F.; Guerra, C.A.; Hines, J.; Patoine, G.; Siebert, J.;et al. Global gaps in soil biodiversity data. Nat. Ecol. Evol. 2018, 2, 1042–1043. [CrossRef]
10. Delgado-Baquerizo, M.; Reich, P.B.; Trivedi, C.; Eldridge, D.J.; Abades, S.; Alfaro, F.D.; Bastida, F.; Berhe, A.A.; Cutler, N.A.;Gallardo, A.; et al. Multiple elements of soil biodiversity drive ecosystem functions across biomes. Nat. Ecol. Evol. 2020, 4,210–220. [CrossRef]
11. van Capelle, C.; Schrader, S.; Brunotte, J. Tillage-induced changes in the functional diversity of soil biota: A review with a focuson German data. Eur. J. Soil Biol. 2012, 50, 165–181. [CrossRef]
12. Maceljski, M. Agricultural Entomology; Zrinski d.o.o.: Cakovec, Croatia, 2002; p. 17.13. Lemic, D.; Gašparic, H.V.; Petrak, I.; Graša, Ž.; Bažok, R. Four-year arable crop rotation impact on beneficial soil surface arthropod
fauna restoration. J. Cent. Eur. Agric. 2016, 17, 1346–1359. [CrossRef]14. Duvnjak, L. Importance of Living Organisms in Soil, Ministry of Agriculture, Directorate for Professional Support of Agriculture
and Fisheries Development. 2020. Available online: https://www.savjetodavna.hr/2019/05/08/vaznost-zivih-organizama-u-tlu/ (accessed on 20 August 2020).
15. Heinrichs, E.A.; Muniappan, R. Integrated pest management for tropical crops: Soyabeans. CAB Rev. 2018, 13, 1–44. [CrossRef]16. Edwards, C.A.; Thompson, A.R. Pesticides and the soil fauna. In Residue Reviews; Gunther, F.A., Gunther, J.D., Eds.; Springer:
New York, NY, USA, 1973; Volume 45, pp. 1–79.17. Casabé, N.; Piola, L.; Fuchs, J.; Oneto, M.L.; Pamparato, L.; Basack, S.; Giménez, R.; Massaro, R.; Papa, J.C.; Kesten, E. Eco-
toxicological Assessment of the Effects of Glyphosate and Chlorpyrifos in an Argentine Soya Field. J. Soil. Sediments 2007, 7,232–239. [CrossRef]
18. Nietupski, M. Ground beetles (Coleoptera: Carabidae) occurring in apple orchards under different production systems. Prog.Plant. Prot. 2012, 52, 360–365.
19. Bažok, R.; Kos, T.; Drmic, Z. Importance of ground beetles (Coleoptera: Carabidae) for biological stability of agricultural habitatfocus on cultivation of sugar beet. Glas. Biljn. Zašt. 2015, 15, 264–276.
20. Cassagne, N.; Bal-Serin, M.-C.; Gers, C.; Gauquelin, T. Changes in humus properties and collembolan communities following thereplanting of beech forests with spruce. Pedobiology 2004, 48, 267–276. [CrossRef]
21. Fiera, C. Biodiversity of Collembola in urban soils and their use as bioindicators for pollution. Pesqui. Agropecu. Bras. 2009, 44,868–873. [CrossRef]
22. Rainio, J.; Niemelä, J. Ground beetles (Coleoptera: Carabidae) as bioindicators. Biodivers. Conserv. 2003, 12, 487–506. [CrossRef]23. Kovacic, M. Glyphosate-related spear fracture—Desirable or undesirable? Tehnol. Zabilješke Kem. Ind. 2019, 68, 557–558.24. Ostojic, Z.; Brzoja, D.; Baric, K. Status, purpose and consumption of glyphosate in Croatia and the world. Glas. Biljn. Zašt. 2018,
18, 531–541.25. Vandenberg, L.N.; Blumberg, B.; Antoniou, M.N.; Benbrook, C.M.; Carroll, L.; Colborn, T.; Everett, L.G.; Hansen, M.; Landrigan,
P.J.; Lanphear, B.P.; et al. Is it time to reassess current safety standards for glyphosate-based herbicides? J. Epidemiol. CommunityHealth 2017, 71, 613–618. [CrossRef] [PubMed]
26. Auber, L. Atlas des Coléoptères de France, Belgique, Suisse; TOM 1, Boubée: Paris, France, 1965; p. 249.27. Schmidt, L. Insect Determination Tables. Handbook for Agronomists, Foresters and Biologists; Agricultural University, Home printing
house of the University of Zagreb: Zagreb, Croatia, 1970; p. 258.28. Bechyne, J. Welcher Käfer ist Das? Kosmos-Natürfuhrer: Stuttgart, Germany, 1974; p. 134.29. Harde, K.W.; Severa, F. Der Kosmos Käferführer; Kosmos-Natürfuhrer: Stuttgart, Germany, 1984; p. 334.30. Booth, R.G.; Cox, M.L.; Madge, R.B. IIE Guides to Insects of Importance to Man. 3. Coleoptera; CAB International Wallingford:
London, UK, 1990; p. 384.31. Freude, H.; Harde, K.W.; Lohse, G.A.; Klausnitzer, B. Die Käfer Mitteleuropas. II Band. Adephaga 1; Elsevier GmbH: München,
Germany, 2006; p. 506.32. Balarin, I. Fauna Heteroptere na Krmnim Leguminozama i Prirodnim Livadama u SR Hrvatskoj. Ph.D. Thesis, University of
Zagreb, Zagreb, Croatia, 1974.33. Gylling Data Management Inc. ARM 2019®GDM Software, Revision 2019.4, August 5, 2019 (B = 25105); Gylling Data Management
Inc.: Brookings, SD, USA, 2019.34. Spellerberg, I.F.; Fedor, P.J. A tribute to Claude Shannon (1916–2001) and a plea for more rigorous use of species richness, species
diversity and the ‘Shannon-Wiener’ Index. Glob. Ecol. Biogeogr. 2003, 12, 177–179. [CrossRef]35. TIEM. Diversity Indices: Shannon’s H and E. 2021. Available online: http://www.tiem.utk.edu/~gross/bioed/bealsmodules/
shannonDI.html (accessed on 20 August 2020).36. Bažok, R.; Cacija, M.; Gajger, A.; Kos, T. Arthropod Fauna Associated to Soybean in Croatia. In Soybean: Pest Resistance; El-Shemy,
H., Ed.; InTech: London, UK, 2013.37. Costello, M.J.; Daane, K.M. Abundance of spiders and insect predators on grapes in central California. J. Arachnol. 1999, 27,
531–538.
174

Agriculture 2021, 11, 474
38. Pearce, S.; Hebron, W.M.; Raven, R.J.; Zalucki, M.P.; Hassan, E. Spider fauna of soybean crops in south-east Queensland and theirpotential as predators of Helicoverpa spp. (Lepidoptera: Noctuidae). Aust. J. Entomol. 2004, 43, 57–65. [CrossRef]
39. Živkovic, I.P.; Lemic, D.; Samu, F.; Kos, T.; Baric, B. Spider communities affected by exclusion nets. Appl. Ecol. Environ. Res. 2019,17, 879–887. [CrossRef]
40. Nait-Kaci, M.B.; Hedde, M.; Bourbia, S.M.; Derridj, A. Hierarchization of factors driving soil macrofauna in North Algeria groves.Biotechnol. Agron. Soc. Envir. 2014, 18, 11–18.
41. Mouhoubi, D.; Djenidi, R.; Bounechada, M. Contribution to the Study of Diversity, Distribution, and Abundance of Insect Faunain Salt Wetlands of Setif Region, Algeria. Int. J. Zoöl. 2019, 2019, 1–11. [CrossRef]
42. Gkisakis, V.D.; Kollaros, D.; Kabourakis, E.M. Soil arthopod biodiversity in plain and hilly olive orchard agroecosystem, in Crete,Greece. Entomol. Hell. 2014, 23, 18–28. [CrossRef]
43. Gonçalves, M.F.; Pereira, J.A. Abundance and Diversity of Soil Arthropods in the Olive Grove Ecosystem. J. Insect Sci. 2012, 12,1–14. [CrossRef]
44. House, G.J.; All, J.N. Carabid Beetles in Soybean Agroecosystems. Environ. Èntomol. 1981, 10, 194–196. [CrossRef]45. Alves, M.; Vicente, S.; Pires, J.C.; Deisi Tatiani de, G.; Veronezi, J.A.; Baretta, D. Macrofauna do solo influenciada pelo uso de
fertilizantes químicos e dejetos de suínos no Oeste do Estado de Santa Catarina. Rev. Bras. Ciênc. Solo 2008, 32, 589–598. [CrossRef]46. Baretta, D.; Santos, C.P.J.; Mafra, L.A.; do Prado Wildner, L.; Miquelluti, J.D. Fauna edáfica avaliada por armadilhas de catação
manual afetada pelo manejo do solo na região oeste catarinense. Rev. Ciênc. Agrovet. 2003, 2, 97–106.47. Silva, R.F.; Aquino, A.M.; Mercante, F.M.; Guimares, M.F. Macrofauna invertebrada do solo sob diferentes sistemas de produção
em latossolo da região do Cerrado. Pesqui. Agropecu. Bras. 2006, 41, 697–704. [CrossRef]48. Wardle, D.A. Impacts of disturbance on detritus food web sin agro-ecosystems of contrasting tillage and weed management
practices. In Advances in Ecological Research; Begon, M., Fitter, A.H., Eds.; Academic Press: New York, NY, USA, 1995; Volume 26,pp. 105–185.
49. Baretta, D.; Bartz, M.L.C.; Fachini, I.; Anselmi, R.; Zortéa, T.; Baretta, C.R.D.M. Soil fauna and its relation with environmentalvariables in soil management systems. Rev. Ciênc. Agrovet. 2014, 45, 871–879. [CrossRef]
50. Kromp, B. Carabid beetles in sustainable agriculture: A review on pest control efficacy, cultivation impacts and enhancement.Agric. Ecosyst. Environ. 1999, 74, 187–228. [CrossRef]
51. Lee, J.C.; Menalled, F.D.; Landis, D.A. Refuge habitats modify impact of insecticide disturbance on carabid beetle communities. J.Appl. Ecol. 2001, 38, 472–483. [CrossRef]
52. Da Matta, D.H.; Cividanes, F.J.; Da Silva, R.J.; Batista, M.N.; Otuka, A.K.; Correia, E.T.; De Matos, S.T.S. Feeding habits ofCarabidae (Coleoptera) associated with herbaceous plants and the phenology of coloured cotton. Acta Sci. Agron. 2017, 39, 135.[CrossRef]
53. Cole, L.J.; I McCracken, D.; Dennis, P.; Downie, I.S.; Griffin, A.L.; Foster, G.N.; Murphy, K.J.; Waterhouse, A. Relationshipsbetween agricultural management and ecological groups of ground beetles (Coleoptera: Carabidae) on Scottish farmland. Agric.Ecosyst. Environ. 2002, 93, 323–336. [CrossRef]
54. O´Rourke, M.E.; Liebman, M.; Rice, M.E. Ground beetle (Coleoptera: Carabidae) assemblage in conventional and diversifiedcrop rotation systems. Environ. Entomol. 2008, 37, 121–130. [CrossRef]
55. Avgın, S.S.; Luff, M.L. Ground beetles (Coleoptera: Carabidae) as bioindicators of human impact. Mun. Ent. Zool. 2010, 5,209–215.
56. Baranová, B.; Fazekašová, D.; Jászay, T.; Manko, P. Ground beetle (Coleoptera: Carabidae) community of arable land withdifferent crops. Folia Faun. Slov. 2013, 18, 21–29.
57. Lemic, D.; Cacija, M.; Gašparic, V.H.; Drmic, Z.; Bažok, R.; Živkovic, P.I. The ground beetle (Coleoptera: Carabidae) communityin an intensively managed agricultural landscape. Appl. Ecol. Environ. Res. 2017, 15, 661–674. [CrossRef]
58. Gašparic, V.H.; Drmic, Z.; Cacija, M.; Graša, Ž.; Petrak, I.; Bažok, R.; Lemic, D. Impact of environmental conditions andagrotechnical factors on ground beetle populations in arable crops. Appl. Ecol. Environ. Res. 2017, 15, 697–711. [CrossRef]
59. Holland, J.; Reynolds, C.J. The impact of soil cultivation on arthropod (Coleoptera and Araneae) emergence on arable land.Pedobiology 2003, 47, 181–191. [CrossRef]
60. Thiele, H.U. Carabid Beetles in Their Environment: A Study on Habitat Selection by Adaptations in Physiology and Behaviour; Springer:Berlin, Germany, 1977; p. 372.
61. Maelfait, J.P.; Desender, K. Possibilities of Short-term Carabid Sampling for Site Assessment Studies. In The Role of Ground Beetlesin Ecological and Environmental Studies; Stork, N.E., Ed.; Intercept: Andower, UK, 1990; pp. 217–225.
62. Asteraki, E.J.; Hanks, C.B.; Clements, R.O. The impact of two insecticides on predatory ground beetles (Carabidae) in newlysown grass. Ann. Appl. Biol. 1992, 120, 25–39. [CrossRef]
63. Asteraki, E.J.; Hanks, C.B.; Clements, R.O. The influence of different types of grassland field margin on carabid beetle (Coleoptera:Carabidae) communities. Agric. Ecosyst. Environ. 1995, 54, 125–128. [CrossRef]
64. Blake, S.; Foster, G.N.; Fischer, G.E.J.; Ligertwood, G.L. Effects of management practices on the ground beetle faunas of newlyestablished wildflower meadows in southern Scotland. Ann. Zool. Fenn. 1996, 33, 139–147.
65. Jeschke, P.; Nauen, R.; Schindler, M.; Elbert, A. Overview of the Status and Global Strategy for Neonicotinoids. J. Agric. FoodChem. 2011, 59, 2897–2908. [CrossRef]
175

Agriculture 2021, 11, 474
66. Szczepaniec, A.; Creary, S.F.; Laskowski, K.L.; Nyrop, J.P.; Raupp, M.J. Neonicotinoid insecticide imidacloprid causes out-breaksof spider mites on elm trees in urban landscapes. PLoS ONE 2011, 6, e20018. [CrossRef]
67. Varvara, M.; Chimisliu, C.; Šustek, Z. Distribution and abundance of Calosoma uropunctatum Herbst 1784. (Coleoptera: Carabidae)in some agricultural crops in Romania, 1977–2010. Olten. Stud. Comun. Stiint. Nat. 2012, 28, 79–90.
68. Douglas, M.R.; Rohr, J.R.; Tooker, J.F. Neonicotinoid insecticide travels through a soil food chain, disrupting biological control ofnon-target pests and decreasing soya bean yield. J. Appl. Ecol. 2014, 52, 250–260. [CrossRef]
69. House, G.J.; Parmalee, R.W. Comparison of soil arthropods and earthworms from conventional and no-tillage agroecosystems.Soil Till. Res. 1985, 5, 351–360. [CrossRef]
70. Ferguson, H.J.; McPherson, R.M. Abundance and diversity of adult carabidae in four soybean cropping systems in Virginia. J.Èntomol. Sci. 1985, 20, 163–171. [CrossRef]
71. Stinner, B.R.; McCartney, D.A.; Van Doren, D.M., Jr. Soil and foliage arthropod communities in conventional, reduced andno-tillage corn (maize, Zea mays, L.) systems: A comparison after 20 years of continuous cropping. Soil Till. Res. 1988, 11, 147–158.[CrossRef]
72. Tonhasca, A. Carabid beetle assemblage under diversified agroecosystems. Entomol. Exp. Appl. 1993, 68, 279–285.73. Vician, V.; Svitok, M.; Kocik, K.; Stašiov, S. The influence of agricultural management on the structure of ground beetle (Coleoptera:
Carabidae) assemblages. Biologia 2015, 70, 240–251. [CrossRef]74. Kosewska, A. Conventional and non-inversion tillage systems as a factor causing changes in ground beetle (Col. Carabidae)
assemblages in oilseed rape (Brassica napus) fields. Period. Biol. 2016, 118, 231–239. [CrossRef]75. Drmic, Z.; Cacija, M.; Lemic, D. Endogaeic ground beetles fauna in oilseed rape field in Croatia. J. Central Eur. Agric. 2016, 17,
675–684. [CrossRef]76. Bažok, R.; Kos, T.; Barcic, I.J.; Kolak, V.; Lazarevic, B.; Catic, A. Abundance and distribution of the ground beetles Pterostichus
melanarius (Illiger, 1798) and Pseudoophonus rufipes (DeGeer, 1774) in corn fields in Croatia. Entomol. Croat. 2007, 11, 39–51.77. Kos, T.; Bažok, R.; Barcic, I.J. Abundance and frequency of ground beetles in three maize fields in Croatia. J. Environ. Prot. Ecol.
2011, 12, 894–902.78. Kos, T.; Bažok, R.; Kozina, A.; Šipraga, J.; Dragic, S.; Ticinovic, A. Ground beetle (Carabidae) fauna at untreated and treated barley
fields in Croatia. Pestic. Benef. Org. IOBC/wprs Bull. 2010, 55, 79–84.79. Kos, T.; Bažok, R.; Drmic, Z.; Graša, Ž. Ground beetles (Coleoptera: Carabidae) in sugar beet fields as the base for conservation
biological control. Insect Pathogens and Entomoparasitic Nematodes Biological Control: Its unique role in integrated and organicproduction. IOBC-WPRS Bull. 2013, 90, 353–357.
80. Culjak, G.T.; Büchs, W.; Prescher, S.; Schmidt, L.; Sivcev, I.; Juran, I. Ground Beetle Diversity (Coleoptera: Carabidae) in WinterOilseed Rape and Winter Wheat Fields in North-Western Croatia. Agric. Conspec. Sci. 2016, 81, 21–26.
176

agriculture
Article
Genetic and Morphological Approach for Western CornRootworm Resistance Management
Martina Kadoic Balaško 1,*, Katarina M. Mikac 2, Hugo A. Benítez 3, Renata Bažok 1 and Darija Lemic 1
Citation: Kadoic Balaško, M.; Mikac,
K.M.; Benítez, H.A.; Bažok, R.; Lemic, D.
Genetic and Morphological Approach
for Western Corn Rootworm Resistance
Management. Agriculture 2021, 11,
585. https://doi.org/10.3390/
agriculture11070585
Academic Editor: Stanislav Trdan
Received: 13 May 2021
Accepted: 22 June 2021
Published: 24 June 2021
Publisher’s Note: MDPI stays neutral
with regard to jurisdictional claims in
published maps and institutional affil-
iations.
Copyright: © 2021 by the authors.
Licensee MDPI, Basel, Switzerland.
This article is an open access article
distributed under the terms and
conditions of the Creative Commons
Attribution (CC BY) license (https://
creativecommons.org/licenses/by/
4.0/).
1 Department of Agricultural Zoology, Faculty of Agriculture, University of Zagreb, Svetošimunska 25,10000 Zagreb, Croatia; [email protected] (R.B.); [email protected] (D.L.)
2 Centre for Sustainable Ecosystem Solutions, Faculty of Science, Medicine and Health, School of Biology,University of Wollongong, Wollongong, NSW 2522, Australia; [email protected]
3 Centro de Investigación de Estudios Avanzados del Maule, Laboratorio de Ecología y Morfometría Evolutiva,Universidad Católica del Maule, Talca 3466706, Chile; [email protected]
* Correspondence: [email protected]; Tel.: +385-1239-3670
Abstract: The western corn rootworm (WCR), is one of the most serious pests of maize in the UnitedStates. In this study, we aimed to find a reliable pattern of difference related to resistance type usingpopulation genetic and geometric morphometric approaches. To perform a detailed populationgenetic analysis of the whole genome, we used single nucleotide polymorphisms (SNPs) markers.For the morphometric analyses, hindwings of the resistant and non-resistant WCR populations fromthe US were used. Genetic results showed that there were some differences among the resistant USpopulations. The low value of pairwise FST = 0.0181 estimated suggests a lack of genetic differentia-tion and structuring among the putative populations genotyped. However, STRUCTURE analysisrevealed three genetic clusters. Heterozygosity estimates (HO and HE) over all loci and populationswere very similar. There was no exact pattern, and resistance could be found throughout the wholegenome. The geometric morphometric results confirmed the genetic results, with the different geneticpopulations showing similar wing shape. Our results also confirmed that the hindwings of WCRcarry valuable genetic information. This study highlights the ability of geometric morphometrics tocapture genetic patterns and provides a reliable and low-cost alternative for preliminary estimationof population structure. The combined use of SNPs and geometric morphometrics to detect resistantvariants is a novel approach where morphological traits can provide additional information aboutunderlying population genetics, and morphology can retain useful information about genetic struc-ture. Additionally, it offers new insights into an important and ongoing area of pest managementon how to prevent or delay pest evolution towards resistant populations, minimizing the negativeimpacts of resistance.
Keywords: Diabrotica virgifera virgifera; Bt toxins; resistance; geometric morphometrics; SNPs
1. Introduction
Maize (Zea mays L.) is one of the most important crops worldwide. About 200 millionhectares is planted, with an average yield of 22 tons/hectare, resulting in 1150 million tonsof maize harvested worldwide [1]. The western corn rootworm (WCR) Diabrotica virgiferavirgifera is the worst pest in the United States and a major alien invasive pest in Europe [2,3].The main damage caused by WCR to maize plants is by its larval stage that feeds on cornroots, which affects important physiological processes of the plant. The resulting damageleads to stalk lodging and yield losses, which in turn leads to economic damage to crops [4].
Suppression with chemical insecticides is an important management tool for thispest [5], but WCR has rapidly developed resistance to the insecticides used for control [6].The first noted case of resistance to insecticides was to cyclodiene insecticides (aldrin andheptachlor) in 1959 in Nebraska [7,8]. So far, WCR has evolved resistance to organophos-phates (methyl parathion), carbamates (carbaryl) [6,9], and pyrethroids (bifenthrin and
Agriculture 2021, 11, 585. https://doi.org/10.3390/agriculture11070585 https://www.mdpi.com/journal/agriculture
177
Agriculture 2021, 11, 585
tefluthrin) [10,11]. In addition to insecticides, WCR has developed resistance to crop rota-tion [12–14] and to the Bt toxin in genetically modified maize [15]. Crop rotation remainsthe most effective control tactic against WCR. However, resistance to crop rotation has beendocumented in Illinois and other neighboring states [12]. Spencer et al. [16] observed thatsome of the WCR populations in northern Indiana and east central Illinois feed on soyabean foliage and flowers, as well as lay eggs in soya bean fields. This behavioral changein the WCR populations in the eastern Corn Belt has eliminated the effectiveness of croprotation as a rootworm management option. As a consequence, the use of soil and foliar in-secticides for WCR has increased to protect corn following soya bean. It was estimated thateach year WCR costs US farmers at least USD 1 billion through yield losses and treatmentcosts [17], but after adaptation to crop rotation, these losses are estimated to be higher [18].Transgenic maize expressing Bacillus thuringiensis (Bt) was introduced in 2003 in the UnitedStates [15]. However, resistance to maize expressing Cry3Bb1 was reported in Iowa in2009 [19]. Afterwards, resistance to Cry3Bb1 was detected in fields throughout Iowa [20,21]but also in WCR populations found in Illinois, Nebraska, and Minnesota [22–24]. Selectedrootworm populations developed resistance to the toxins Cry34/Cry35Ab1, Cry3Bb1, andmCry3A under laboratory and greenhouse conditions [25–28]. Cross-resistance was foundin WCR field populations between the Cry3Bb1, mCry3A, and eCry3.1Ab toxins [21–23,29].WCR populations evolved resistance to all four currently available Bt toxins (Cry3Bb1,mCry3A, eCry3.1Ab, and Cry34/35Ab1) [19,23,29–31], and consequently, the challenge ofmanaging has become more difficult.
Resistance is a dynamic phenomenon, meaning that mechanisms already known canchange over time. Ongoing monitoring is essential to determine whether managementrecommendations remain valid or need to be revised in light of changing circumstances ornewly acquired knowledge [32]. WCR resistance to insecticides and management strategiesis a serious and growing problem in maize production, and before it becomes an even morewidespread and major problem, there is a need to explore and implement novel methods(such as single nucleotide polymorphisms and geometric morphometrics) for the earlydetection of resistance or adaptation that causes WCR resistance.
Population genetic markers can be used to provide genetic data for WCR that is usefulwhen investigating changes in genetic structure and differentiation [3,33,34]. Differenttypes of molecular markers (allozymes, mtDNA sequencing, AFLPs, microsatellites, andSNPs) have already been used in North American WCR populations. The result showedhigh genetic diversity and a general lack of population structure across the US CornBelt [35–37].
Several studies on WCR resistance mechanisms have been performed [38–40].Coates et al. [41] attempted the use of SNPs as population genetic markers in WCRin the US and showed that both markers (microsatellites and SNPs) gave similar results.This does not suggest that SNPs are less effective at separating genetic variation in thespecies, but it is likely a result of low numbers of SNPs and low genome coverage becausethe authors used 12 biallelic loci among 190 individuals. Wang et al. [40] found that cylco-diene resistance is correlated with SNPs in the gamma-aminobutyric acid (GABA) receptor.Flagel et al. [42] used SNPs to identify candidate gene families for insecticide resistance andto understand how population processes have shaped variation in WCR populations. TheirWCR transcriptome assembly included several gene families that have been implicated ininsecticide resistance in other species and that have provided a foundation for future re-search. Flagel et al. [43] discovered and validated genetic markers in WCR associated withresistance to the Bt toxin Cry3Bb1. They found that the inheritance of Cry3Bb1 resistanceis associated with a single autosomal linkage group and is almost completely recessive.Niu et al. [44] found that SNP markers identified in a single autosomal linkage group(LG8, 115–135 cm) were correlated with resistance to Cry3Bb1 in field populations of WCR.Although the linkage of these genes to Cry3Bb1 resistance was strong, the causal gene forCry3Bb1 resistance was not confirmed and remains to be reported.
178
Agriculture 2021, 11, 585
Geometric morphometrics (GM) (i.e., phenotype size and shape analysis) is a tech-nique that can be used to show hindwing shape and size differences among rootwormpopulations [45]. By analyzing wing size and shape, it is possible to reveal the invasiveadaptation of the adults’ traits to different environmental influences. Numerous stud-ies have been performed on the WCR hindwings using geometric morphometry [46–49].Mikac et al. [46] provided preliminary evidence of wing shape and size differences inWCR from rotated versus continuous maize. Most recently, Mikac et al. [45] determinedmorphological differences in wing shape in populations adapted to crop rotation and Btmaize compared with a non-resistant WCR population. This study showed evidence ofdifferential wing shape in relation to resistance development and highlights the importanceof wing size and shape as a reliable, inexpensive, yet effective biomarker for resistancedetection in corn rootworm. The research of Mikac et al. [45] looked at the Bt-resistantindividuals as a whole, so it is necessary to extend their research to each Bt toxin separately.A deeper understanding of maize rootworm wing shape and flight morphology, winggeometry, aspect ratio, and flight efficiencies will help identify which resistant phenotypesare most likely to invade geographic areas where they are not yet present.
According to Bouyer et al. [50], changes in an organism’s genotype takes muchlonger to manifest than in its phenotype, thus making geometric morphometrics a muchmore useful tool than genetics for detecting changes in populations in the short term.That suggests morphology can retain useful information on genetic structure and hasthe benefit over molecular methods of being inexpensive, easy to use, and able to yielda lot of information quickly. However, resistance cannot be fully understood withoutgenetic data. Genetic studies are an important tool for developing improved methods fordetecting resistance, for studying resistance mechanisms, and for choosing approaches toresistance management [51]. Several studies suggest that results are more accurate whenboth methods are combined. Morphological traits can provide additional informationabout underlying population genetics, and morphology can retain useful informationabout genetic structure [52–56].
This is the first study that combines both genetic and geometric morphometric tech-niques on the same WCR populations and same individuals. The aim of this study was todefine genetic variables between known phenotypes and to explore phenotypic markersrelated to changes in the genome. We hypothesized that by combining genetic and mor-phological markers, it would be possible to determine and predict resistance to Bt toxinsand crop rotation in the field.
2. Materials and Methods
2.1. Sample Collection
All WCR individuals used in this research were populations from the US. The sameindividuals were used both for the genetic and morphometric analysis. WCR individualswere collected from South Dakota in the fields containing transgenic corn. Individualsadapted to crop rotation from Illinois were collected in fields with documented resistance.Non-resistant (susceptible) adults were obtained from the NCARL laboratory. The non-resistant laboratory population was originally collected in 1987 near the town of Trent,South Dakota, in Moody County. It has been in continuous rearing since that time withoutmixing with other collections. It is approximately one generation per year. The originalbeetles were selected in cornfields or on the edge of cornfields and the adult beetles werereturned to the laboratory. The non-resistant colony is reared in soil on maize roots andthe adult beetles are fed on an artificial diet. Attempts are being made to keep the rearingprotocol “field-like” to keep it “wild” (Chad Nielson personal communication). Accordingto Mikac et al. [45], there are minimal differences between rotation-resistant laboratory andfield-collected populations, suggesting that the rearing system was not the main reasonfor the differences observed in their study. Therefore, we excluded the possibility thatdifferent conditions (field, laboratory rearing) may contribute to differences in wing shapesand sizes.
179

Agriculture 2021, 11, 585
Individuals were placed in 95% ethanol pending genetic and morphometric analysis.WCR individuals used in this research were adapted to crop rotation, were non-resistant,and were collected from Bt corn expressing different toxins (Cry3Bb1, Cry34/35Ab1,Cry3Bb1, and Cry34/35Ab1) (Table 1).
Table 1. Number of WCR individuals used for geometric morphometric and SNPs analyses. n = sample size.
Western Corn RootwormPopulations
Geometric MorphometricWings (n)
Males/Females
Adults Single NucleotidePolymorphisms Genotyped (n)
Males/Females
Cry3Bb1 433 184/252 7 2/5Cry3Bb1_Cry34/35Ab1 86 27/59 5 3/2
Cry34/35Ab1 91 32/59 6 3/3Adapted to crop rotation 31 14/17 4 1/3
Non-resistant 134 66/68 7 4/3
2.2. DNA Extraction and SNPs Genotyping
Before DNA extraction, hindwings from all individuals were removed for morphome-tric analysis. DNA was then extracted from the whole-body tissue of 29 adult WCR. DNAextractions were performed using the Qiagen DNeasy Blood and Tissue Kit (QIAGEN,Hilden, Germany) following the manufacturer’s protocol.
The DNA concentration for all samples was measured using spectrophotometer(BioSpec-nano Micro-volume) and adjusted to 50 ng/μL prior to SNPs genotyping byDiversity Arrays Technology (DArT) [57,58]. After quality control, 29 samples were sent forgenotyping. Genotyping was undertaken by Diversity Array Technology Pty Ltd. (DArT,Canberra, Australia) using the extracted WCR DNA. This method is based on methylfiltration and next-generation sequencing platforms [58]. The data we received werefiltered for minor allele frequency (MAF) lower than 0.1 and also for missing data higherthan 10%. Quality of SNP markers was determined by the parameters “reproducibility”and “call rate” [59]. Remaining SNPs were used for further analysis of genetic diversityand population structure.
2.3. Geometric Morphometric Sample Preparation
The adult WCRs (see Table 1) were investigated using geometric morphometric pro-cedures and analyses based on hindwing venation undertaken. In total, 775 hindwingsof WCR were analyzed. Left and right hindwings were removed from each individualand slide-mounted using the fixing agent Euparal (Carl Roth GmbH + Co. KG, Karlsruhe,Germany) based on standard methods [60]. Slide-mounted wings were photographedusing a Canon PowerShot A640 digital camera (10-megapixel) on a trinocular mount of aZeiss Stemi 2000-C Leica stereo-microscope and saved in JPEG format using the Carl ZeissAxioVision Rel. 4.6. (Carl Zeiss Microscopy GmbH, München, Germany). Fourteen type1 landmarks defined by vein junctions or vein terminations were used (Figure 1.) [47–49,61].
Figure 1. Representation of the 14 morphological landmarks identified on the hindwings of westerncorn rootworm [61].
180
Agriculture 2021, 11, 585
2.4. Data Analysis2.4.1. Genetic Data
All population genetic data analyses were undertaken using the coding environmentin R using the R packages adegenet v2.1.3 [62] and dartR v1.1.11 [63]. In the first instance,the SNP dataset was subject to a filtering process using dartR to remove potentially erro-neous SNPs. Monomorphic SNPs were excluded followed by the removal of SNPs with areproducibility of <95%, a call rate of <90% (i.e., SNPs which have 10% missing genotypesor greater), and secondaries.
Pairwise FST, estimated as θ [64], was calculated between the five putative populations(Cry3Bb1, Cry34/35Ab1Ab1, Cry3B1_Cry34/35Ab1Ab1, adapted to crop rotation, andnon-resistant), along with observed (Ho) and expected (He) heterozygosity. Departure fromHardy–Weinberg equilibrium (HWE) was tested for each population using the functiongl.report.hwe as implemented in the R package dartR [63], which includes Bonferroni correc-tion for multiple testing. Using the function gl.basic.stats in dartR, overall basic populationgenetics statistics per locus, such as the observed (HO) heterozygosity, (FIS) inbreedingco-efficient per locus, and FST corrected for the number of individuals, was undertaken. Tosummarize genetic similarity among populations, gl.tree.nj in dartR was used.
The Bayesian model-based clustering algorithm implemented in the STRUCTUREv 2.3.4 [65] Evanno method was employed to determine the genetic structure of the WCRpopulations investigated. Genetic clusters (K-values) ranged between 1 and 6 (1 morepopulation than the total number of populations for the complete data set), and a series of10 replicate runs for each prior value of K were analyzed. The parameter set for each runconsisted of a burn-in of 10,000 iterations followed by 100,000 Markov chain Monte Carloiterations based on the admixture model of ancestry with the correlated allele frequencymodel and the default parameters in STRUCTURE. The most suitable value of K wascalculated using the ΔK method as used in Structure Harvester web version 0.6.94 [66],where the highest ΔK value was indicative of the number of genetic clusters.
The marker-based kinship matrix (K) was calculated with the same genotypes usingthe VanRaden method [67] and then used to create a clustering heat map of the associationmapping panel in the GAPIT [68].
2.4.2. Geometric Morphometrics
Each of fourteen previously established landmarks [48] for the WCR were digitizedusing the software program tpsDIG v.2.16 [69], for which x, y coordinates were generatedto investigate hindwing shape. Statistical analyses were performed using MorphoJ version1.06d [70]. Landmark coordinates were determined, and shape information was extractedusing a full Procrustes fit [70]. Principal component analysis (PCA) was used to visualizehindwing shape variation in relation to the development of resistance [71]. PCA wasbased on the covariance matrix of individual hindwing shape. To visualize the averagechange in Bt-resistant strains, a covariance matrix of the average data (for all specimens,regardless of sex) was created. A PCA of the averaged data was used to better visualizeshape morphology [72]. To compare morphological relationships between Bt-resistant andnon-resistant populations, a canonical analysis of variance (CVA) was performed in orderto calculate the morphological relationship between groups using the Mahalanobis andProcrustes distances. Mahalanobis and Procrustes morphological distances were calculatedand reported with their respective p-values after a permutation test (10,000 runs). Finally, amultivariate regression of shape versus centroid size was performed to confirm whethersize had an allometric effect [73].
3. Results
3.1. Genetic Data3.1.1. Population Diversity Metrics
From the 29 WCR genotyped, 25,304 SNPs were detected. The 90% call rate fil-ter then removed 13,852 SNPs from the data set. Following this, the minor allele fre-
181
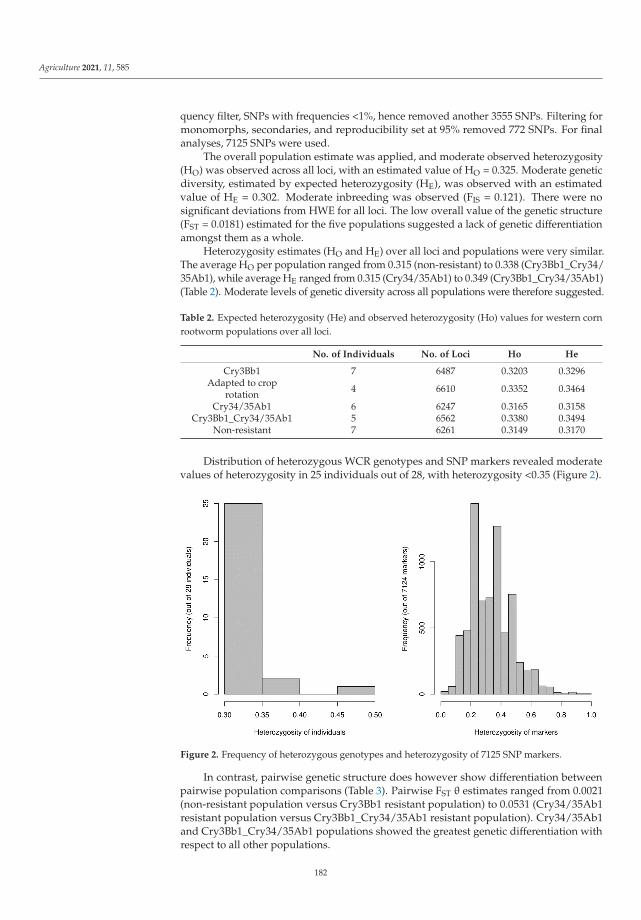
Agriculture 2021, 11, 585
quency filter, SNPs with frequencies <1%, hence removed another 3555 SNPs. Filtering formonomorphs, secondaries, and reproducibility set at 95% removed 772 SNPs. For finalanalyses, 7125 SNPs were used.
The overall population estimate was applied, and moderate observed heterozygosity(HO) was observed across all loci, with an estimated value of HO = 0.325. Moderate geneticdiversity, estimated by expected heterozygosity (HE), was observed with an estimatedvalue of HE = 0.302. Moderate inbreeding was observed (FIS = 0.121). There were nosignificant deviations from HWE for all loci. The low overall value of the genetic structure(FST = 0.0181) estimated for the five populations suggested a lack of genetic differentiationamongst them as a whole.
Heterozygosity estimates (HO and HE) over all loci and populations were very similar.The average HO per population ranged from 0.315 (non-resistant) to 0.338 (Cry3Bb1_Cry34/35Ab1), while average HE ranged from 0.315 (Cry34/35Ab1) to 0.349 (Cry3Bb1_Cry34/35Ab1)(Table 2). Moderate levels of genetic diversity across all populations were therefore suggested.
Table 2. Expected heterozygosity (He) and observed heterozygosity (Ho) values for western cornrootworm populations over all loci.
No. of Individuals No. of Loci Ho He
Cry3Bb1 7 6487 0.3203 0.3296Adapted to crop
rotation 4 6610 0.3352 0.3464
Cry34/35Ab1 6 6247 0.3165 0.3158Cry3Bb1_Cry34/35Ab1 5 6562 0.3380 0.3494
Non-resistant 7 6261 0.3149 0.3170
Distribution of heterozygous WCR genotypes and SNP markers revealed moderatevalues of heterozygosity in 25 individuals out of 28, with heterozygosity <0.35 (Figure 2).
Figure 2. Frequency of heterozygous genotypes and heterozygosity of 7125 SNP markers.
In contrast, pairwise genetic structure does however show differentiation betweenpairwise population comparisons (Table 3). Pairwise FST θ estimates ranged from 0.0021(non-resistant population versus Cry3Bb1 resistant population) to 0.0531 (Cry34/35Ab1resistant population versus Cry3Bb1_Cry34/35Ab1 resistant population). Cry34/35Ab1and Cry3Bb1_Cry34/35Ab1 populations showed the greatest genetic differentiation withrespect to all other populations.
182
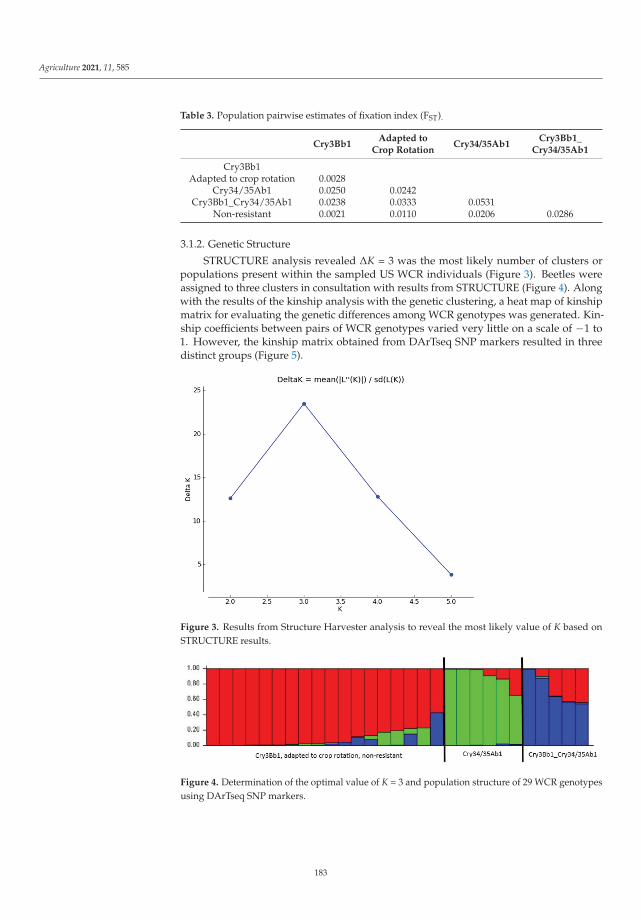
Agriculture 2021, 11, 585
Table 3. Population pairwise estimates of fixation index (FST).
Cry3Bb1Adapted to
Crop RotationCry34/35Ab1
Cry3Bb1_Cry34/35Ab1
Cry3Bb1Adapted to crop rotation 0.0028
Cry34/35Ab1 0.0250 0.0242Cry3Bb1_Cry34/35Ab1 0.0238 0.0333 0.0531
Non-resistant 0.0021 0.0110 0.0206 0.0286
3.1.2. Genetic Structure
STRUCTURE analysis revealed ΔK = 3 was the most likely number of clusters orpopulations present within the sampled US WCR individuals (Figure 3). Beetles wereassigned to three clusters in consultation with results from STRUCTURE (Figure 4). Alongwith the results of the kinship analysis with the genetic clustering, a heat map of kinshipmatrix for evaluating the genetic differences among WCR genotypes was generated. Kin-ship coefficients between pairs of WCR genotypes varied very little on a scale of −1 to1. However, the kinship matrix obtained from DArTseq SNP markers resulted in threedistinct groups (Figure 5).
Figure 3. Results from Structure Harvester analysis to reveal the most likely value of K based onSTRUCTURE results.
Figure 4. Determination of the optimal value of K = 3 and population structure of 29 WCR genotypesusing DArTseq SNP markers.
183

Agriculture 2021, 11, 585
Figure 5. Heat map plot of kinship matrix using average linkage clustering based on SNP markersdepicts the existence of three different groups among WCR genotype.
Further analysis of genetic structure using neighbor-joining (NJ) cluster analysisdifferentiated WCR genotypes into tree clusters (Figure 6). Cluster I was the largest, and itcomprised 18 genotypes that included non-resistant individuals, Cry34/35 and Cry3Bb1resistant. Cluster II contained individuals with combined Bt toxins Cry3Bb1 and Cry34/35toxin, and Cluster III contained individuals adapted to crop rotation.
Figure 6. The neighbor-joining cluster analysis using DArTseq SNP markers for grouping 29 WCRgenotypes.
184
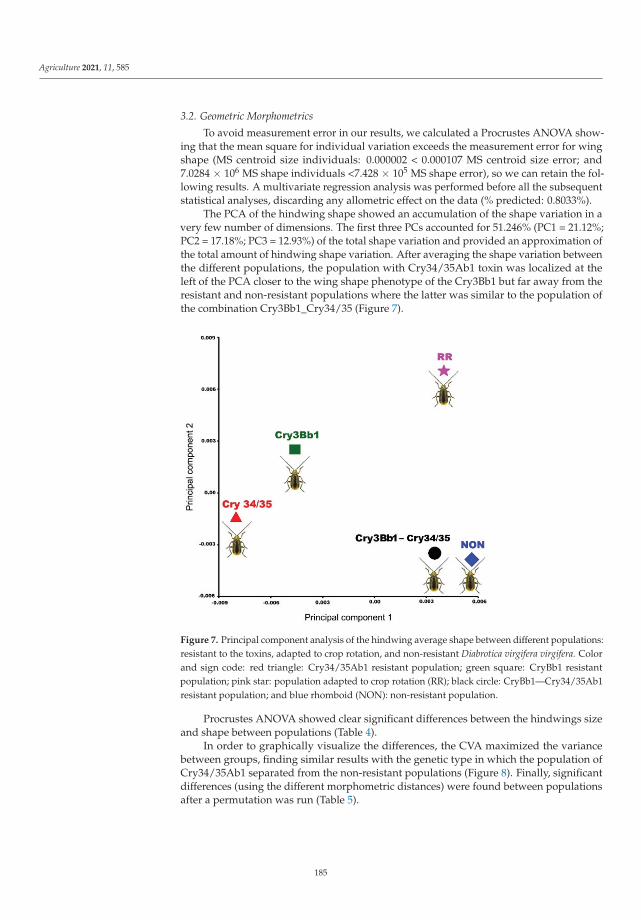
Agriculture 2021, 11, 585
3.2. Geometric Morphometrics
To avoid measurement error in our results, we calculated a Procrustes ANOVA show-ing that the mean square for individual variation exceeds the measurement error for wingshape (MS centroid size individuals: 0.000002 < 0.000107 MS centroid size error; and7.0284 × 106 MS shape individuals <7.428 × 10⁵ MS shape error), so we can retain the fol-lowing results. A multivariate regression analysis was performed before all the subsequentstatistical analyses, discarding any allometric effect on the data (% predicted: 0.8033%).
The PCA of the hindwing shape showed an accumulation of the shape variation in avery few number of dimensions. The first three PCs accounted for 51.246% (PC1 = 21.12%;PC2 = 17.18%; PC3 = 12.93%) of the total shape variation and provided an approximation ofthe total amount of hindwing shape variation. After averaging the shape variation betweenthe different populations, the population with Cry34/35Ab1 toxin was localized at theleft of the PCA closer to the wing shape phenotype of the Cry3Bb1 but far away from theresistant and non-resistant populations where the latter was similar to the population ofthe combination Cry3Bb1_Cry34/35 (Figure 7).
Figure 7. Principal component analysis of the hindwing average shape between different populations:resistant to the toxins, adapted to crop rotation, and non-resistant Diabrotica virgifera virgifera. Colorand sign code: red triangle: Cry34/35Ab1 resistant population; green square: CryBb1 resistantpopulation; pink star: population adapted to crop rotation (RR); black circle: CryBb1—Cry34/35Ab1resistant population; and blue rhomboid (NON): non-resistant population.
Procrustes ANOVA showed clear significant differences between the hindwings sizeand shape between populations (Table 4).
In order to graphically visualize the differences, the CVA maximized the variancebetween groups, finding similar results with the genetic type in which the population ofCry34/35Ab1 separated from the non-resistant populations (Figure 8). Finally, significantdifferences (using the different morphometric distances) were found between populationsafter a permutation was run (Table 5).
185
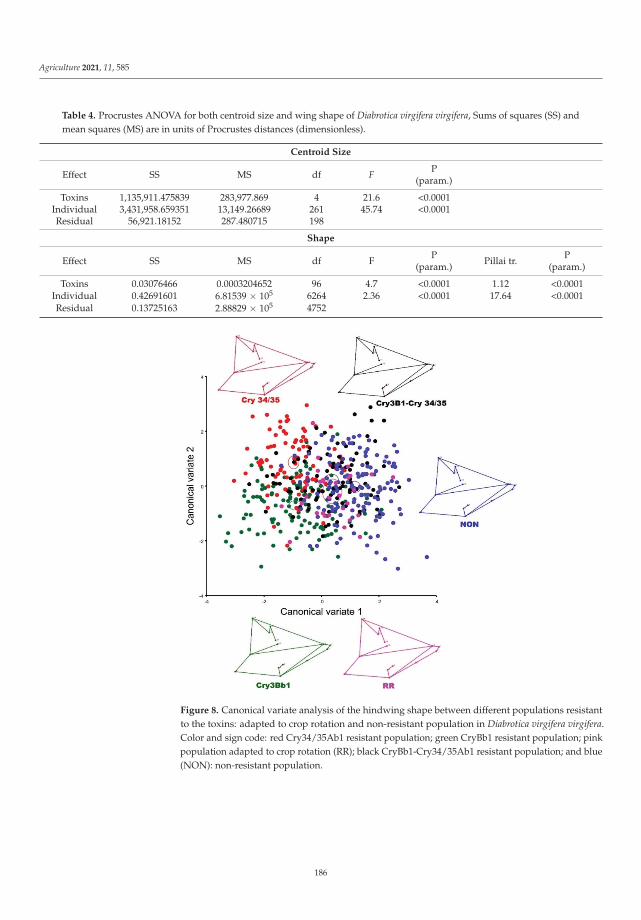
Agriculture 2021, 11, 585
Table 4. Procrustes ANOVA for both centroid size and wing shape of Diabrotica virgifera virgifera, Sums of squares (SS) andmean squares (MS) are in units of Procrustes distances (dimensionless).
Centroid Size
Effect SS MS df F P(param.)
Toxins 1,135,911.475839 283,977.869 4 21.6 <0.0001Individual 3,431,958.659351 13,149.26689 261 45.74 <0.0001Residual 56,921.18152 287.480715 198
Shape
Effect SS MS df F P(param.) Pillai tr. P
(param.)
Toxins 0.03076466 0.0003204652 96 4.7 <0.0001 1.12 <0.0001Individual 0.42691601 6.81539 × 10⁵ 6264 2.36 <0.0001 17.64 <0.0001Residual 0.13725163 2.88829 × 10⁵ 4752
Figure 8. Canonical variate analysis of the hindwing shape between different populations resistantto the toxins: adapted to crop rotation and non-resistant population in Diabrotica virgifera virgifera.Color and sign code: red Cry34/35Ab1 resistant population; green CryBb1 resistant population; pinkpopulation adapted to crop rotation (RR); black CryBb1-Cry34/35Ab1 resistant population; and blue(NON): non-resistant population.
186
Agriculture 2021, 11, 585
Table 5. Mahalanobis and Procrustes distances between groups obtained from canonical variateanalysis. *: p < 0.05; **: p < 0.001.
Mahalanobis Distances
Cry34/35 Cry3Bb1 NON
Cry3B1_Cry34/35 1.8022 **Cry3Bb1 1.5633 ** 1.7142 **
NON 2.3832 ** 1.3276 ** 2.2068 **RR 2.305 ** 1.6339 ** 1.9881 **
Procrustes Distances
Cry34/35 Cry3Bb1 NON
Cry3B1_Cry34/35 0.0135 **Cry3Bb1 0.0107 ** 0.0124 **
NON 0.0155 ** 0.0069 * 0.013 **RR 0.0154 ** 0.0118 * 0.0132 **
4. Discussion
In this research we aimed to find a reliable pattern of differences related to resistancetype using genetic and geometric morphometric analyses. For population structure analysis,we used DArTseq SNP markers. One of the questions we were interested in was whetherresistant WCR populations differ at the genetic level. We found no significant evidenceof high genetic diversity in any of the assumed populations. However, the estimatedvalues were congruent with moderate genetic diversity across the genotyped beetles. TheSTRUCTURE revealed three genetic clusters. This classification was also supported by theVanRaden kinship algorithm, where Cry3Bb1_Cry34/35Ab1 individuals and Cry34/35Ab1were separated from Cry3Bb1 adapted to crop rotation and non-resistant individuals,although some non-resistant individuals mixed between Cry34/35Ab1, which could bedue to the normal evolutionary process. The fact that Cry3Bb1 non-resistant and adaptedto crop rotation populations are mixed suggests that they are genetically similar (Figure 4).The neighbor-joining tree separated the individuals adapted to crop rotation, which isto be expected given that the first evolved resistance (not including insecticides) was tocrop rotation [12]. Afterwards, all other resistance evolved, and we can see that clearly inthis result. The fact that the non-resistant population is not separated could be due to anevolutionary process, as we mentioned earlier.
High-throughput sequencing has provided deeper insight into the molecular mech-anisms of resistance [74]. It allowed us to find that many point mutations are found indifferent genes, suggesting that these mechanisms can occur simultaneously, making itmore difficult to understand which one is really responsible for the resistance pheno-type [75,76]. In our research, we focused on resistant populations, and we determined thatthere was some variability between them, but there was no exact pattern. Recent molecularstudies show us that different sets of genes are involved in resistance [76–79], which makesit unlikely that universal markers of resistance can be developed to accurately determinethe likelihood of a population becoming resistant to a particular compound [75,77,79]. Adifferent number of genes may be involved in resistance, and individuals within a popula-tion exhibit different evolutionary patterns of resistance evolution. Therefore, resistancecan be found throughout the whole genome, but it is not conditioned by the differences.However, certain shifts could be a warning that some changes in the genome have occurred.Through estimates of genetic diversity, population structuring, and genetic relatednessbetween individuals, information on the effectiveness of control strategies can be obtained,and recommendations to improve the efficacy of control programs may be possible.
The actual sample size of each site does not need to be large when using SNPs. SNPmarkers provide the power, not the sample size, as SNPs have genome-wide coverageand there end up being many thousands of SNPs by the time genotyping is complete [80].The paper by Trask et al. [81] states, “Given that each SNP marker has an individual
187

Agriculture 2021, 11, 585
evolutionary history, we calculated that the most complete and unbiased representationof genetic diversity present in the individual can be achieved by including at least 10 in-dividuals in the discovery sample set to ensure the discovery of both common and rarepolymorphisms.” The second paper by Li et al. [82], who also worked with beetles fromthe order Coleoptera, found that “a minimum sample size of 3–8 individuals is sufficient todissect the population architecture of the harlequin ladybird, Harmonia axyridis, a biologicalcontrol agent and invasive alien species.” They also estimated the optimal sample sizefor accurately estimating genetic diversity within and between populations of Harmoniaaxyridis. They determined that six individuals are the minimum sample size required.
Wing morphology (size and shape) is the most important trait of an insect’s dispersalcapacity. For this reason, the integration of different techniques to understand the plasticityand variation of this trait is vital to understanding how they adapt to new environmentsand to coordinating strategic planning ahead of possible new invasions [3]. Different typesof wing morphotypes have been studied to determine the dispersal capabilities of flyinginsects [83–85]. Le et al. [86] found that narrowed wings in beetles are more efficient forflapping low-level flights. Additionally, for D. v. virgifera, wing shape has been identifiedas a very good trait to measure in different agronomic studies, including studies of lifehistory (sexual dimorphism) and interspecific and intraspecific shape variation [47–49],and wing shape has also been a useful variable when combined with other monitoringtools (genetics (e.g., microsatellites) and traditional traps (e.g., pheromones)) [3].
Mikac et al. [46] showed that beetles adapted to crop rotation had broader wings (cf.susceptible beetle). Mikac et al. [45] expanded the use of differences in hindwing sizeand shape to examine changes in WCR associated with the development of resistance,specifically to examine potential differences between (Bt)-resistant, non-resistant (or sus-ceptible), and adapted to crop rotation populations in the US. In general, the hindwings ofnon-resistant beetles were significantly more elongated in shape and narrower in width(chord length) compared with beetles resistant to Bt maize or crop rotation. This result wasconfirmed by our study. Mikac et al. (2019) did not separate the Bt-resistant populations intheir study, but considered them as one population. Therefore, in our study, we separatedall Bt-resistant populations to see the differences between them. Cry3Bb1_Cry34/35Ab1individuals had the broader shape and a more robust wing with an expansion of landmark14 and a contraction of landmark 9. Cry3Bb1 individuals had the narrower wings, whileindividuals resistant to Cry34/35Ab1 had similar but smaller wings, distinguished by theexpansion of landmarks 3 and 4. The more stable and elongated wing shape was that ofthe population adapted to crop rotation, in which there was an extension to landmarks 1and 2 to the left and an elongation to landmark 9 to the right. The non-resistant populationis also slightly wider than the population of Cry3Bb1-Cry34/35Ab1, with the movement oflandmarks 14 and 2 also slightly to the right and the wider shape that is also produced bythe movement of landmark 7 to the upper left. Elongated wings are more aerodynamic andare considered to be involved in migratory movement [46]. Mikac et al. [46] also suggestedthat this could be a useful invasive dispersal strategy for mated females. In our research,individuals adapted to crop rotation had more stable and elongated wings, suggestingthat these individuals could fly long distances. Such differences may impact upon thedispersal or long-distance movement of resistant and non-resistant beetles. Understandingwhich beetle morphotype is the superior flyer and spreader has implications for managingWCR through integrated resistance strategies. These findings confirmed GM as a reliabletechnique for resistance detection. In this study, we aimed to confirm the results fromSNPs markers with GM. We found that geometric morphometric tools could provide im-portant clues to differentiate resistant and non-resistant populations. One of the principalresults was the similarity of the hindwing shape variation between the population afterthe STRUCTURE analysis, where using both monitoring techniques showed that the moredifferentiated population was the resistant Cry34/35Ab1.
Here we describe a possibility that combining genetic and geometric morphometricscould be a reliable technique that can be used to reveal differences among WCR populations.
188
Agriculture 2021, 11, 585
Hence, geometric morphometrics can be used as a biomarker for resistance detection aspart of a larger integrated resistance management strategy for western corn rootworm.
In Croatia, WCR have been investigated in detail (traditional monitoring, geneticmonitoring, and GM monitoring), and knowledge about dispersal and adaptive abilities ofthese invasive insects is well known [3,47,87,88]. Our future work will focus on popula-tions collected in intensive maize-growing areas in Croatia, where WCR populations havebecome established since their introduction 30 years ago. We will use the comparative tech-niques presented in this paper to determine whether Croatian populations are potentiallyresistant and which US WCR population was the source population for Croatia and Europe.This knowledge would help to detect resistant individuals that might invade geographicalareas where they are not yet present (e.g., beetles adapted to crop rotation invading Europewhere such variants are not present). Such information is very important for biosecuritymeasures, resistance management, and future control strategies for this pest worldwide.
Author Contributions: Conceptualization, M.K.B. and D.L.; data curation, M.K.B., K.M.M., H.A.B.and R.B.; formal analysis, M.K.B., H.A.B. and D.L.; funding acquisition, R.B.; investigation, M.K.B.,K.M.M., H.A.B., R.B. and D.L.; methodology, M.K.B., K.M.M., H.A.B., R.B. and D.L.; project admin-istration, R.B.; resources, R.B.; software, M.K.B. and H.A.B.; supervision, K.M.M., R.B. and D.L.;validation, R.B. and D.L.; visualization, M.K.B. and H.A.B.; writing—original draft, M.K.B. andH.A.B.; writing—review and editing, K.M.M., R.B. and D.L. All authors have read and agreed to thepublished version of the manuscript.
Funding: This study was supported by the Croatian Science Foundation through the project Monitor-ing of Insect Pest Resistance: Novel Approach for Detection, and Effective Resistance ManagementStrategies (MONPERES) (IP-2016-06-7458) and the young researchers’ career development projecttraining of new doctoral students (DOK-01-2018).
Institutional Review Board Statement: Not applicable. Western corn rootworm is an establishedpest of maize in the USA and Southern Europe. No special permission was needed for its collectionin this study.
Acknowledgments: The authors thank Wade French and Chad Nielson for Bt-maize-resistant root-worm colonies from South Dakota and Joseph Spencer for providing field-collected beetles adaptedto crop rotation from Illinois. The authors are very grateful to Reza Talebi and João Paulo GomesViana for their help and advice with data analysis. The authors also thank colleague Zrinka Drmicand student Patricija Majcenic for help in preparing the WCR wings.
Conflicts of Interest: The authors declare no conflict of interest.
References
1. Food and Agriculture Organization of the United Nations FAO STAT. Available online: http://www.fao.org/faostat/en/#data/QC/visualize (accessed on 31 January 2021).
2. Hemerik, L.; Busstra, C.; Mols, P. Predicting the temperature-dependent natural population expansion of the western cornrootworm, Diabrotica virgifera. Entomol. Exp. Appl. 2004, 111, 59–69. [CrossRef]
3. Lemic, D.; Mikac, K.M.; Ivkosic, S.A.; Bažok, R. The temporal and spatial invasion genetics of the western corn rootworm(Coleoptera: Chrysomelidae) in southern Europe. PLoS ONE 2015, 10, e0138796. [CrossRef]
4. Dobrincic, R.; Igrc-Barcic, J.; Edwards, R.C. Determining of the injuriousness of the larvae of western corn rootworm (Diabroticavirgifera virgifera LeConte) in Croatian conditions. Agric. Conspec. Sci. 2002, 67, 1–9.
5. Coates, B.S.; Alves, A.P.; Wang, H.; Zhou, X.; Nowatzki, T.; Chen, H.; Rangasamy, M.; Robertson, H.M.; Whitfield, C.W.; Walden,K.K.; et al. Quantitative trait locus mapping and functional genomics of an organophosphate resistance trait in the western cornrootworm, Diabrotica virgifera virgifera. Insect Mol. Biol. 2016, 25, 1–15. [CrossRef] [PubMed]
6. Meinke, L.J.; Siegfried, B.D.; Wright, R.J.; Chandler, L.D. Adult susceptibility of Nebraska western corn rootworm (Coleoptera:Chrysomelidae) populations to selected insecticides. J. Econ. Entomol. 1998, 91, 594–600. [CrossRef]
7. Ball, H.J.; Weekman, G.T. Insecticide resistance in the adult western corn rootworm in Nebraska. J. Econ. Entomol. 1962, 55,439–441. [CrossRef]
8. Ball, H.J.; Weekman, G.T. Differential resistance of corn rootworms to insecticides in Nebraska and adjoining states. J. Econ.Entomol. 1963, 56, 553–555. [CrossRef]
9. Wright, R.J.; Scharf, M.E.; Meinke, L.J.; Zhou, X.; Siegfried, B.D.; Chandler, L.D. Larval susceptibility of an insecticide-resistantwestern corn rootworm (Coleoptera: Chrysomelidae) population to soil insecticides: Laboratory bioassays, assays of detoxificationenzymes, and field performance. J. Econ. Entomol. 2000, 93, 7–13. [CrossRef] [PubMed]
189

Agriculture 2021, 11, 585
10. Pereira, A.E.; Wang, H.; Zukoff, S.N.; Meinke, L.J.; French, B.W.; Siegfried, B.D. Evidence of field-evolved resistance to bifenthrinin western corn rootworm (Diabrotica virgifera virgifera LeConte) populations in Western Nebraska and Kansas. PLoS ONE 2015,10, e0142299. [CrossRef] [PubMed]
11. Pereira, A.E.; Souza, D.; Zukoff, S.N.; Meinke, L.J.; Siegfried, B.D. Cross-resistance and synergism bioassays suggest multiplemechanisms of pyrethroid resistance in western corn rootworm populations. PLoS ONE 2017, 12, e0179311. [CrossRef]
12. Levine, E.; Oloumi-Sadeghi, H. Western corn rootworm (Coleoptera: Chrysomelidae) larval injury to corn grown for seedproduction following soybeans grown for seed production. J. Econ. Entomol. 1996, 89, 1010–1016. [CrossRef]
13. Sammons, A.E.; Edwards, C.R.; Bledsoe, L.W.; Boeve, P.J.; Stuart, J.J. Behavioral and feeding assays reveal a western cornrootworm (Coleoptera: Chrysomelidae) variant that is attracted to soybean. Environ. Entomol. 1997, 26, 1336–1342. [CrossRef]
14. Levine, E.; Spencer, J.L.; Isard, S.A.; Onstad, D.W.; Gray, M.E. Adaptation of the western corn rootworm to crop rotation: Evolutionof a new strain in response to a management practice. Am. Entomol. 2002, 48, 94–107. [CrossRef]
15. Gassmann, A.J. Resistance to Bt Maize by Western Corn Rootworm: Effects of Pest Biology, the Pest–Crop Interaction and theAgricultural Landscape on Resistance. Insects 2021, 12, 136. [CrossRef] [PubMed]
16. Spencer, J.L.; Levine, E.; Isard, S.A. Corn rootworm injury to first-year corn: New research findings. In Proceedings of theIllinois Agricultural Pesticides Conference, University of Illinois at Urbana-Champaign, Champaign, IL, USA, 8–9 January 1998;pp. 73–81.
17. Wechsler, S.; Smith, D. Has resistance taken root in US corn fields? Demand for insect control. Am. J. Agric. Econ. 2018, 100,1136–1150. [CrossRef]
18. Gray, M.E.; Sappington, T.W.; Miller, N.J.; Moeser, J.; Bohn, M.O. Adaptation and invasiveness of western corn rootworm:Intensifying research on a worsening pest. Annu. Rev. Entomol. 2009, 54, 303–321. [CrossRef] [PubMed]
19. Gassmann, A.J.; Petzold-Maxwell, J.L.; Keweshan, R.S.; Dunbar, M.W. Field-evolved resistance to Bt maize by western cornrootworm. PLoS ONE 2011, 6, e22629. [CrossRef]
20. Gassmann, A.J. Field-evolved resistance to Bt maize by western corn rootworm: Predictions from the laboratory and effects in thefield. J. Invertebr. Pathol. 2012, 110, 287–293. [CrossRef]
21. Gassmann, A.J.; Petzold-Maxwell, J.L.; Clifton, E.H.; Dunbar, M.W.; Hoffmann, A.M.; Ingber, D.A.; Keweshan, R.S. Field-evolvedresistance by western corn rootworm to multiple Bacillus thuringiensis toxins in transgenic maize. Proc. Natl. Acad. Sci. USA2014, 111, 5141–5146. [CrossRef]
22. Wangila, D.S.; Gassmann, A.J.; Petzold-Maxwell, J.L.; French, B.W.; Meinke, L.J. Susceptibility of Nebraska western corn rootwormpopulations (Coleoptera: Chrysomelidae) populations to Bt corn events. J. Econ. Entomol. 2015, 108, 742–751. [CrossRef]
23. Zukoff, S.N.; Ostlie, K.R.; Potter, B.; Meihls, L.N.; Zukoff, A.L.; French, L.; Ellersieck, M.R.; French, B.W.; Hibbard, B.E. MultipleAssays indicate varying levels of cross resistance in Cry3Bb1-selected field populations of the western corn rootworm to mCry3A,eCry3.1Ab, and Cry34/35Ab1Ab1. J. Econ. Entomol. 2016, 109, 1387–1398. [CrossRef]
24. Schrader, P.M.; Estes, R.E.; Tinsley, N.A.; Gassmann, A.J.; Gray, M.E. Evaluation of adult emergence and larval root injury forCry3Bb1-resistant populations of the western corn rootworm. J. Appl. Entomol. 2016, 141, 41–52. [CrossRef]
25. Lefko, S.A.; Nowatzki, T.M.; Thompson, S.D.; Binning, R.R.; Pascual, M.A.; Peters, M.L.; Simbro, E.J.; Stanley, B.H. Characterizinglaboratory colonies of western corn rootworm (Coleoptera: Chrysomelidae) selected for survival on maize containing eventDAS-59122-7. J. Appl. Entomol. 2008, 132, 189–204. [CrossRef]
26. Meihls, L.N.; Higdon, M.L.; Siegfried, B.D.; Miller, N.J.; Sappington, T.W.; Ellersieck, M.R.; Spencer, T.A.; Hibbard, B.E. Increasedsurvival of western corn rootworm on transgenic corn within three generations of on-plant greenhouse selection. Proc. Natl. Acad.Sci. USA 2008, 105, 19177–19182. [CrossRef] [PubMed]
27. Meihls, L.N.; Higdon, M.L.; Ellersieck, M.; Hibbard, B.E. Selection for resistance to mCry3A-expressing transgenic corn in westerncorn rootworm. J. Econ. Entomol. 2011, 104, 1045–1054. [CrossRef]
28. Oswald, K.J.; Wade French, B.; Nielson, C.; Bagley, M. Selection for Cry3Bb1 resistance in a genetically diverse populationof nondiapausing western corn rootworm (Coleoptera: Chrysomelidae). J. Econ. Entomol. 2011, 104, 1038–1044. [CrossRef][PubMed]
29. Jakka, S.R.K.; Shrestha, R.B.; Gassmann, A.J. Broad-spectrum resistance to Bacillus thuringiensis toxins by western corn rootworm(Diabrotica virgifera virgifera). Sci. Rep. 2016, 6, 27860. [CrossRef]
30. Gassmann, A.J.; Shrestha, R.B.; Jakka, S.R.K.; Dunbar, M.W.; Clifton, E.H.; Paolino, A.R.; Ingber, D.A.; French, B.W.; Masloski, K.E.;Doudna, J.W.; et al. Evidence of resistance to Cry34/35Ab1Ab1 corn by western corn rootworm (Coleoptera: Chrysomelidae):Root injury in the field and larval survival in plant-based bioassays. J. Econ. Entomol. 2016, 109, 1872–1880. [CrossRef]
31. Ludwick, D.C.; Meihls, L.N.; Ostlie, K.R.; Potter, B.D.; French, L.; Hibbard, B.E. Minnesota field population of western cornrootworm (Coleoptera: Chrysomelidae) shows incomplete resistance to Cry34Ab1/Cry35Ab1 and Cry3Bb1. J. Appl. Entomol.2017, 141, 28–40. [CrossRef]
32. Denholm, I.; Devine, G. Insecticide Resistance. In Encyclopedia of Biodiversity, 2nd ed.; Levin, S.A., Ed.; Academic Press: Cambridge,MA, USA, 2013; pp. 298–307.
33. Lemic, D.; Mikac, K.M.; Bažok, R. Historical and contemporary population genetics of the invasive western corn rootworm(Coleoptera: Chrysomelidae) in Croatia. Environ. Entomol. 2013, 42, 811–819. [CrossRef]
190

Agriculture 2021, 11, 585
34. Ivkosic, S.A.; Gorman, J.; Lemic, D.; Mikac, K.M. Genetic monitoring of western corn rootworm (Coleoptera: Chrysomelidae)populations on a microgeographic scale. Environ. Entomol. 2014, 43, 804–818. [CrossRef]
35. Szalanski, A.; Roehrdanz, R.; Taylor, D.; Chandler, L. Genetic variation in geographical populations of western and Mexican cornrootworm. Insect Mol. Biol. 1999, 8, 519–525. [CrossRef] [PubMed]
36. Kim, K.S.; Sappington, T.W. Genetic structuring of Western Corn Rootworm (Coleoptera: Chrysomelidae) populations in theUnited States based on microsatellite loci analysis. Environ. Entomol. 2005, 34, 494–503. [CrossRef]
37. Kim, K.S.; French, B.W.; Sumerford, D.V.; Sappington, T.W. Genetic diversity in laboratory colonies of western corn rootworm(Coleoptera: Chrysomelidae), including a nondiapause colony. Environ. Entomol. 2007, 36, 637–645. [CrossRef]
38. Curzi, M.J.; Zavala, J.A.; Spencer, J.L.; Seufferheld, M.J. Abnormally high digestive enzyme activity and gene expression explainthe contemporary evolution of a Diabrotica biotype able to feed on soybeans. Ecol. Evol. 2012, 2, 2005–2017. [CrossRef] [PubMed]
39. Chu, C.C.; Spencer, J.L.; Curzi, M.J.; Zavala, J.A.; Seufferheld, M.J. Gut bacteria facilitate adaptation to crop rotation in the westerncorn rootworm. Proc. Natl. Acad. Sci. USA 2013, 110, 11917–11922. [CrossRef] [PubMed]
40. Wang, H.; Coates, B.S.; Chen, H.; Sappington, T.W.; Guillemaud, T.; Siegfried, B.D. Role of a gamma-aminobutryic acid (GABA)receptor mutation in the evolution and spread of Diabrotica virgifera virgifera resistance to cyclodiene insecticides. Insect Mol. Biol.2013, 22, 473–484. [CrossRef] [PubMed]
41. Coates, B.S.; Sumerford, D.V.; Miller, N.J.; Kim, K.S.; Sappington, T.W.; Siegfried, B.D.; Lewis, L.C. Comparative performanceof single nucleotide polymorphism and microsatellite markers for population genetic analysis. J. Hered. 2009, 100, 556–564.[CrossRef]
42. Flagel, L.E.; Bansal, R.; Kerstetter, R.A.; Chen, M.; Carroll, M.; Flannagan, R.; Clark, T.; Goldman, B.S.; Michel, A.P. Western cornrootworm (Diabrotica virgifera virgifera) transcriptome assembly and genomic analysis of population structure. BMC Genom. 2014,15, 195. [CrossRef]
43. Flagel, L.E.; Swarup, S.; Chen, M.; Bauer, C.; Wanjugi, H.; Carroll, M.; Hill, P.; Tuscan, M.; Bansal, R.; Flannagan, R.; et al. Geneticmarkers for western corn rootworm resistance to Bt toxin. G3 Genes Genomes Genet. 2015, 5, 399–405. [CrossRef]
44. Niu, X.; Kassa, A.; Hasler, J.; Griffin, S.; Perez-Ortega, C.; Procyk, L.; Zhang, J.; Kapka-Kitzman, D.M.; Lu, A. Functional validationof DvABCB1 as a receptor of Cry3 toxins in western corn rootworm, Diabrotica virgifera virgifera. Sci. Rep. 2020, 10, 15830.[CrossRef]
45. Mikac, K.M.; Lemic, D.; Benítez, H.A.; Bažok, R. Changes in corn rootworm wing morphology are related to resistancedevelopment. J. Pest Sci. 2019, 92, 443–451. [CrossRef]
46. Mikac, K.M.; Douglas, J.; Spencer, J.L. Wing shape and size of the western corn rootworm (Coleoptera: Chrysomelidae) is relatedto sex and resistance to soybean-maize crop rotation. J. Econ. Entomol. 2013, 106, 1517–1524. [CrossRef] [PubMed]
47. Lemic, D.; Benítez, H.A.; Bažok, R. Intercontinental effect on sexual shape dimorphism and allometric relationships in the beetlepest Diabrotica virgifera virgifera LeConte (Coleoptera: Chrysomelidae). Zool. Anz. 2014, 253, 203–206. [CrossRef]
48. Benítez, H.A.; Lemic, D.; Bažok, R.; Bravi, R.; Buketa, M.; Püschel, T. Morphological integration and modularity in Diabroticavirgifera virgifera LeConte (Coleoptera: Chrysomelidae) hind wings. Zool. Anz. 2014, 253, 461–468. [CrossRef]
49. Mikac, K.M.; Lemic, D.; Bažok, R.; Benítez, H.A. Wing shape changes: A morphological view of the Diabrotica virgifera virgiferaEuropean invasion. Boil. Invasions 2016, 18, 3401–3407. [CrossRef]
50. Bouyer, J.; Ravel, S.; Dujardin, J.P.; De Meeus, T.; Via, L.; Thevenon, S.; Guerrini, L.; Sidibé, I.; Solano, P. Population structuring ofGlossina palpalis gambiensis (Diptera: Glossinidae) according to landscape fragmentation in the Mouhoun river, Burkina Faso.J. Med. Entomol. 2007, 44, 788–795. [CrossRef]
51. Roush, R.T.; Daly, J.C. The Role of Population Genetics in Resistance Research and Management. In Pesticide Resistance inArthropods, 1st ed.; Roush, R.T., Tabashnik, B.E., Eds.; Springer: Boston, MA, USA, 1990; pp. 97–152.
52. Garnier, S.; Magniez-Jannin, F.; Rasplus, J.Y.; Alibert, P. When morphometry meets genetics: Inferring the phylogeography ofCarabus solieri using Fourier analyses of pronotum and male genitalia. J. Evol. Biol. 2005, 18, 269–280. [CrossRef]
53. Camara, M.; Caro-Riano, H.; Ravel, S.; Dujardin, J.P.; Hervouet, J.P.; De MeEüs, T.; Bouyer, J.; Solano, P. Genetic and morphometricevidence for population isolation of Glossina palpalis gambiensis (Diptera: Glossinidae) on the Loos islands, Guinea. J. Med. Entomol.2006, 43, 853–860. [CrossRef]
54. Henriques, D.; Chávez-Galarza, J.; Teixeira, J.S.; Ferreira, H.; Neves, C.J.; Francoy, T.M.; Pinto, M.A. Wing geometric morphomet-rics of workers and drones and single nucleotide polymorphisms provide similar genetic structure in the Iberian honey bee (Apismellifera iberiensis). Insects 2020, 11, 89. [CrossRef] [PubMed]
55. Ortego, J.; Aguirre, M.P.; Cordero, P.J. Fine-scale spatial genetic structure and within population male-biased gene-flow in thegrasshopper Mioscirtus wagneri. Evol. Ecol. 2011, 25, 1127–1144. [CrossRef]
56. Francuski, L.; Milankov, V.; Ludoški, J.; Krtinic, B.; Lundström, J.O.; Kemenesi, G.; Ferenc, J. Genetic and phenotypic variation incentral and northern European populations of Aedes (Aedimorphus) vexans (Meigen, 1830) (Diptera, Culicidae). J. Vector Ecol. 2016,41, 160–171. [CrossRef]
57. Kilian, A.; Wenzl, P.; Huttner, E.; Carling, J.; Xia, L.; Blois, H.; Caig, V.; Heller-Uszynska, K.; Jaccoud, D.; Hopper, C.; et al.Diversity arrays technology: A generic genome profiling technology on open platforms. Methods Mol. Biol. 2012, 888, 67–89.
58. Von Mark, V.C.; Kilian, A.; Dierig, D.A. Development of DArT marker platforms and genetic diversity assessment of the UScollection of the new oilseed crop lesquerella and related species. PLoS ONE 2013, 8, e64062.
191

Agriculture 2021, 11, 585
59. Wenzl, P.; Carling, J.; Kudrna, D.; Jaccoud, D.; Huttner, E.; Kleinhofs, A.; Kilian, A. Diversity arrays technology (DArT) forwhole-genome profiling of barley. Proc. Natl. Acad. Sci. USA 2004, 101, 9915–9920. [CrossRef] [PubMed]
60. Upton, M.F.S.; Mantel, B.L. Methods for Collecting, Preserving and Studying Insects and Other Terrestrial Arthropods; The AustralianEntomological Society Miscellaneous Pub: Sydney, Australia, 2010.
61. Lemic, D.; Mikac, K.M.; Kozina, A.; Benitez, H.A.; McLean, C.M.; Bažok, R. Monitoring techniques of the western corn rootwormare the precursor to effective IPM strategies. Pest Manag. Sci. 2016, 72, 405–417. [CrossRef] [PubMed]
62. Jombart, T.; Ahmed, I. Adegenet 1.3-1: New tools for the analysis of genome-wide SNP data. Bioinformatics 2011, 27, 3070–3071.[CrossRef]
63. Gruber, B.; Unmack, P.J.; Berry, O.F.; Georges, A. dartr: An r package to facilitate analysis of SNP data generated from reducedrepresentation genome sequencing. Mol. Ecol. Resour. 2018, 18, 691–699. [CrossRef]
64. Weir, B.S.; Cockerham, C.C. Estimating F-statistics for the analysis of population structure. Evolution 1984, 38, 1358–1370.[PubMed]
65. Evanno, G.; Regnaut, S.; Jrm, G. Detecting the number of clusters of individuals using the software STRUCTURE: A simulationstudy. Mol. Ecol. 2005, 14, 2611–2620. [CrossRef] [PubMed]
66. Earl, D.A.; Vonholdt, B.M. STRUCTURE Harvester: A website and program for visualizing STRUCTURE output and implement-ing the Evanno method. Conserv. Genet. Resour. 2012, 4, 359–361. [CrossRef]
67. Tang, Y.; Liu, X.L.; Wang, J.; Li, M.; Wang, Q.; Tian, F.; Su, Z.; Pan, Y.; Liu, D.; Lipka, A.E.; et al. GAPIT version 2: An enhancedintegrated tool for genomic association and prediction. Plant Genome 2016, 9. [CrossRef]
68. Lipka, A.E.; Tian, F.; Wang, Q.; Pei_er, J.; Li, M.; Bradbury, P.J.; Gore, M.A.; Buckler, E.; Zhang, Z. GAPIT: Genome association andprediction integrated tool. Bioinformatics 2012, 28, 2397–2399. [CrossRef] [PubMed]
69. Rohlf, F.J. TpsDig2, Digitize Landmarks and Outlines, Version 2.17 (Program). 2016. Available online: http://life.bio.sunysb.edu/morph (accessed on 10 April 2021).
70. Klingenberg, C.P. MorphoJ: An integrated software package for geometric morphometrics. Mol. Ecol. Resour. 2011, 11, 353–357.[CrossRef] [PubMed]
71. Jolliffe, I.T. Choosing a subset of principal components or variables. Princ. Compon. Anal. 2002, 111–149. [CrossRef]72. Klingenberg, C.P. Visualizations in geometric morphometrics: How to read and how to make graphs showing shape changes.
Hystrix 2013, 24, 15–24.73. Monteiro, L.R. Multivariate regression models and geometric morphometrics: The search for causal factors in the analysis of
shape. Syst. Biol. 1999, 48, 192–199. [CrossRef]74. Torres, A.Q.; Valle, D.; Mesquita, R.D.; Schama, R. Gene Family Evolution and the Problem of a Functional Classification of Insect
Carboxylesterases. Ref. Modul. Life Sci. 2018. [CrossRef]75. Saavedra-Rodriguez, K.; Suarez, A.F.; Salas, I.F.; Strode, C.; Ranson, H.; Hemingway, J.; Black IV, W.C. Transcription of
detoxification genes after permethrin selection in the mosquito Aedes aegypti. Insect Mol. Biol. 2012, 21, 61–77. [CrossRef]76. Faucon, F.; Dusfour, I.; Gaude, T.; Navratil, V.; Boyer, F.; Chandre, F.; Sirisopa, P.; Thanispong, K.; Juntarajumnong, W.; Poupardin, R.; et al.
Identifying genomic changes associated with insecticide resistance in the dengue mosquito Aedes aegypti by deep targetedsequencing. Genome Res. 2015, 25, 1347–1359. [CrossRef]
77. Faucon, F.; Gaude, T.; Dusfour, I.; Navratil, V.; Corbel, V.; Juntarajumnong, W.; Girod, J.; Poupardin, R.; Boyer, F.; Reynaud, S.; et al. Inthe hunt for genomic markers of metabolic resistance to pyrethroids in the mosquito Aedes aegypti: An integrated next-generationsequencing approach. PLoS Negl. Trop. Dis. 2017, 11, e0005526. [CrossRef]
78. Grigoraki, L.; Pipini, D.; Labbe, P.; Chaskopoulou, A.; Weill, M.; Vontas, J. Carboxylesterase gene amplifications associatedwith insecticide resistance in Aedes albopictus: Geographical distribution and evolutionary origin. PLoS Negl. Trop. Dis. 2017,11, e0005533. [CrossRef] [PubMed]
79. Saavedra-Rodriguez, K.; Strode, C.; Flores Suarez, A.; Fernandez Salas, I.; Ranson, H.; Hemingway, J.; Black IV, W.C. Quantitativetrait loci mapping of genome regions controlling permethrin resistance in the mosquito Aedes Aegypti. Genet. 2008, 180, 1137–1152.[CrossRef] [PubMed]
80. Xing, C.; Schumacher, F.R.; Xing, G.; Lu, Q.; Wang, T.; Elston, R.C. Comparison of microsatellites, single-nucleotide polymorphisms(SNPs) and composite markers derived from SNPs in linkage analysis. BMC Genet. 2005, 6, S29. [CrossRef] [PubMed]
81. Trask, J.A.S.; Malhi, R.S.; Kanthaswamy, S.; Johnson, J.; Garnica, W.T.; Malladi, V.S.; Smith, D.G. The effect of SNP discoverymethod and sample size on estimation of population genetic data for Chinese and Indian rhesus macaques (Macaca mulatta).Primates 2011, 52, 129–138. [CrossRef]
82. Li, H.; Qu, W.; Obrycki, J.J.; Meng, L.; Zhou, X.; Chu, D.; Li, B. Optimizing Sample Size for Population Genomic Study in a GlobalInvasive Lady Beetle, Harmonia Axyridis. Insects 2020, 11, 290. [CrossRef]
83. Denno, R.F.; Hawthorne, D.J.; Thorne, B.L.; Gratton, C. Reduced flight capability in British Virgin Island populations of awing-dimorphic insect: The role of habitat isolation, persistence, and structure. Ecol. Entomol. 2001, 26, 25–36. [CrossRef]
84. Guerra, P.A. Evaluating the life-history trade-off between dispersal capability and reproduction in wing dimorphic insects:A meta-analysis. Biol. Rev. 2011, 86, 813–835. [CrossRef]
85. Sanzana, M.J.; Parra, L.E.; Sepúlveda-Zúñiga, E.; Benítez, H.A. Latitudinal gradient effect on the wing geometry of Auca coctei(Guérin) (Lepidoptera, Nymphalidae). Rev. Bras. Entomol. 2013, 57, 411–416. [CrossRef]
192

Agriculture 2021, 11, 585
86. Le, T.Q.; Truong, T.V.; Park, S.H.; Quang Truong, T.; Ko, J.H.; Park, H.C.; Byun, D. Improvement of the aerodynamic performanceby wing flexibility and elytra–hind wing interaction of a beetle during forward flight. J. R. Soc. Interface 2013, 10, 20130312.[CrossRef]
87. Benítez, H.A.; Lemic, D.; Bažok, R.; Gallardo-Araya, C.M.; Mikac, K.M. Evolutionary directional asymmetry and shape variationin Diabrotica virgifera virgifera (Coleoptera: Chrysomelidae): An example using hind wings. Biol. J. Linn. Soc. 2014, 111, 110–118.[CrossRef]
88. Mrganic, M.; Bažok, R.; Mikac, K.M.; Benítez, H.A.; Lemic, D. Two decades of invasive western corn rootworm populationmonitoring in Croatia. Insects 2018, 9, 160. [CrossRef] [PubMed]
193


MDPISt. Alban-Anlage 66
4052 BaselSwitzerland
Tel. +41 61 683 77 34Fax +41 61 302 89 18
www.mdpi.com
Agriculture Editorial OfficeE-mail: [email protected]
www.mdpi.com/journal/agriculture


MDPI
St. Alban-Anlage 66
4052 Basel
Switzerland
Tel: +41 61 683 77 34
Fax: +41 61 302 89 18
www.mdpi.com ISBN 978-3-0365-3762-7
Copyright © 2022 FDOKUMEN