factors influencing intensity of adoption of integrated pest
109
FACTORS INFLUENCING INTENSITY OF ADOPTION OF INTEGRATED PEST MANAGEMENT PACKAGE AND PESTICIDE MISUSE IN THE CONTROL OF MANGO FRUIT FLY IN EMBU EAST SUB-COUNTY, KENYA BY JOSPHAT KIPLANG’AT KORIR A56/69702/2011 A Thesis Submitted to the Department of Agricultural Economics in Partial Fulfilment of the requirements for the award of a Master of Science Degree in Agricultural and Applied Economics, University of Nairobi July, 2016
-
Upload
khangminh22 -
Category
Documents
-
view
1 -
download
0
Transcript of factors influencing intensity of adoption of integrated pest

FACTORS INFLUENCING INTENSITY OF ADOPTION OF INTEGR ATED PEST
MANAGEMENT PACKAGE AND PESTICIDE MISUSE IN THE CONT ROL OF
MANGO FRUIT FLY IN EMBU EAST SUB-COUNTY, KENYA
BY
JOSPHAT KIPLANG’AT KORIR
A56/69702/2011
A Thesis Submitted to the Department of Agricultural Economics in Partial Fulfilment of the
requirements for the award of a Master of Science Degree in Agricultural and Applied
Economics, University of Nairobi
July, 2016
i
DECLARATION
Ideclare that this thesis is my original work and has not been submitted for the award of a
degree in any other university.
Josphat Kiplang’at Korir
Signature: ----------------------------- Date: ------------------------
This thesis has been submitted with our approval as University supervisors:
Dr. Cecilia Ritho
Department of Agricultural Economics University of Nairobi
Signed………………. Date…………………
Dr. Patrick Irungu
Department of Agricultural Economics University of Nairobi
Signed………………. Date…………………
Dr. Hippolyte Affognon ICIPE
Signed………………. Date…………………

ii
DEDICATION
This thesis is dedicated to my family whose sincere love and support has continually inspired
my academic life.
iii
ACKNOWLEDGEMENTS
This study was a component of a project within the African Fruit Fly Research
Programme initiated and implemented by International Centre for Insect Physiology and
Ecology (ICIPE) that develops IPM strategies for control of fruit fly infestation. With
gratitude, I hereby thank those who contributed to the success of this research and writing this
thesis. I am particularly indebted to my supervisors Dr. Cecilia Ritho, Dr. Patrick Irunguand
Dr. Hippolyte Affognon for their invaluable guidance, advice, constructive criticism and
encouragement.
My heartfelt and exceptional appreciation also goes to the African Economic Research
Consortium (AERC) for facilitating my third semester studies at the University of Pretoria
and ICIPE for funding this research. I am also gratefully for the CMAAE program which
equipped me with important skills which contributed immensely to the success of this
research. I would also like to record my gratitude and appreciation for the mango farmers
who took part in the focus group discussion and actual survey for their time and patience. The
enumerators involved in data collection deserve exceptional thanks for their committed
efforts to collect reliable data during fieldwork. The cooperation granted by the Divisional
Agricultural Officer (DAO) in Runyenjes and Kigumo Divisions cannot go unmentioned.
Finally, I extend my sincere appreciation to my colleagues whose moral and material support
during course work was timely. All these efforts bore fruit through God’s abundant love,
grace and mercy.

iv
ABSTRACT
Mango (Mangifera indica) has been recognized as a fruit of economic and nutritional
importance to Kenyan large and small scalefarmers. Production and marketing of this fruit is
however, severely hampered by fruit fly infestation which causes enormous fruit losses and
reduces access to export market due to quarantine restrictions imposed by importing
countries.Control of this pest has been primarily dependent on chemical pesticide application,
a strategy that has been shown to be ineffective due to the biological nature of the pest. This
has led mango farmers to misusepesticides through overdosing pesticide concentration, use of
unrecommended pesticides brands andfrequent spraying, all with the objective of increasing
fruit fly control effectiveness.To respond to this pesticide ineffectiveness and overuse, the
International Centre for Insect Physiology and Ecology (ICIPE) has developed and
disseminatedan integrated pest management package to reduce fruit fly infestation as well as
minimize chemical pesticide application on mangoes. Mango farmers who participated in the
trials of the mango fruit fly IPM package recorded lower fruit damage of less than 14 percent
compared to non-participating farmers who recorded fruit damage of between 24-60 percent.
Despite the success of the fruit fly IPM package during trials and its potential demand as
evidenced by farmer’s willingness to pay for the technology, its intensity of adoption in
Kenya has not been studied. There also exists a dearth in knowledge on factors influencing
pesticide misuse among mango farmers in Embu East Sub-County.The study area (Embu
East Sub-County)was chosen because it is a major mango producing area which hosted the
mango fruit fly IPM package trials project. Using a sample of 805 mango farmers selected
using multistage and proportionate to size random sampling procedure, the study sought to
assess the intensity of adoption of the mango fruit fly IPM package and the factors
influencing its intensity of adoption using thePoisson regression model. A logistic regression
modelwas also estimated to examine the determinants ofpesticides misuse.The results of the
v
study revealed that 58.54 percent of the sampled farmers adopted at least one component of
the mango fruit fly IPM package. It was also found thatgender of the household head,
education of the household head, number of mature mango trees planted, use of spraying
protective clothing, distance to nearest mango input market and access to extension services
had a significant positive influence on the intensity of adoption of the IPM package.
However, obtaining pest management information from pesticides dealers and traders had a
significant negative influence on the intensity of adoption of the IPM package.The results of
the study further revealed that 67.45 percent of the sampled farmersmisused pesticides while
controlling mango infesting fruit flies.The factors which had a significant positive influence
on pesticide misuse were;number of years of formal education completed, use of spraying
protective gear, adoption of at least one IPM component and obtaining pest management
information from pesticide dealers and traders. However, the dependency ratio had a
significant negative influence on pesticides misuse. These results of the study support the
recommendation that;agricultural extension service should be made more accessible to
farmers in order to enhance IPM adoption,farmers should be encouraged to seek pest
management information from independent sources such as agricultural extension officers,
farmers should be trained on both health and environmental hazards associated with pesticide
use andIPM promotional campaigns should be tailored to suit the needs of large mango
orchard operators.

vi
TABLE OF CONTENTS
DECLARATION.......................................................................................................................... i
DEDICATION............................................................................................................................. ii
ACKNOWLEDGEMENTS ...................................................................................................... iii
ABSTRACT ................................................................................................................................ iv
TABLE OF CONTENTS .......................................................................................................... vi
LIST OF TABLES ................................................................................................................... viii
LIST OF PLATES ................................................................................................................... viii
ACRONYMS AND ABBREVIATIONS .................................................................................. ix
CHAPTER 1: INTRODUCTION .............................................................................................. 1
1.1: Background .......................................................................................................................... 1
1.1.1: Overview ......................................................................................................................... 1
1.1.2: Importance of Horticulture in Kenya’s Economy........................................................... 4
1.1.3: Mango Production in Kenya ........................................................................................... 5
1.2: Problem Statement ................................................................................................................. 6
1.3: Objectives of the Study .......................................................................................................... 8
1.3.1: Overall Objective ...................................................................................................... 8
1.3.2: Specific Objectives .................................................................................................... 8
1.4: Hypotheses ............................................................................................................................. 8
1.5: Justification of the Study ....................................................................................................... 9
1.6: Organization of the Thesis ..................................................................................................... 9
CHAPTER 2: LITERATURE REVIEW ............................................................................... 10
Introduction ................................................................................................................................. 10
2.1: Integrated Pest Management (IPM) ..................................................................................... 10
2.2: Benefits of IPM .................................................................................................................... 11
2.3: Mango Fruit Fly IPM Package............................................................................................. 12
2.3.1: Male Annihilation Technique (MAT) ..................................................................... 12
2.3.2: Baiting Application Technique (BAT) .................................................................... 13
2.3.3: Biological Control Agents ....................................................................................... 13
2.3.4: Orchard Sanitation ................................................................................................... 13
2.4: Theories on Technology Adoption ...................................................................................... 14
2.4.1: Innovation Diffusion Theory ................................................................................... 15
2.4.2: Economic Constraint Theory................................................................................... 17
2.4.3: Technology Acceptance Theory .............................................................................. 17
2.5: Approaches for Assessing Intensity of Technology Adoption ............................................ 18
2.6: Adoption of IPM .................................................................................................................. 20

vii
2.7: Environmental and Health Effects of Pesticide Use in Agriculture .................................... 23
2.8: Pesticide Misuse .................................................................................................................. 24
CHAPTER 3: METHODOLOGY .......................................................................................... 29
3.1: Conceptual Framework ........................................................................................................ 29
3.2: Theoretical Framework ........................................................................................................ 31
3.3: Empirical Methods ............................................................................................................... 32
3.3.1: Determinants of Intensity of Adoption of the Mango Fruit Fly IPM Package........ 32
3.3.2: Application of Poisson Regression in Agricultural Technology Adoption Studies 34
3.3.3: Limitations of the Poisson Regression Model ......................................................... 35
3.3.4: Test for Over Dispersion and Under Dispersion ..................................................... 36
3.3.5: Negative Binomial Regression ................................................................................ 36
3.3.6: Factors Influencing Pesticide Misuse among Mango Farmers in Embu East Sub- County ...................................................................................................................... 37
3.3.7: Description of Independent Variables Hypothesized to Influence the Intensity of Adoption of Mango Fruit Fly IPM Package and Pesticides Misuse. ....................... 38
3.4: Sampling Design and Data Collection ................................................................................. 45
3.4.1: Sampling Design ..................................................................................................... 45
3.4.2: Data Analysis .......................................................................................................... 47
3.4.3: Econometric Models Diagnostic Tests .................................................................... 47
3.5: Study Area ........................................................................................................................... 50
CHAPTER 4: RESULTS AND DISCUSSION ...................................................................... 52
4.1: Socio-Economic and Demographic Characteristics of Sampled Mango Farmers. .............. 52
4.1.1: Socio-Economic Characteristics of Mango Fruit Fly IPM Package Adopters and Non-Adopters ................................................................................................................ 56
4.2: Adoption of the Mango Fruit Fly IPM Package in Embu East Sub-County ....................... 59
4.2.1: Components of the Mango Fruit Fly IPM Package Adopted .................................. 59
4.2.2: Comparison of IPM Adoption between ICIPE Trials Project Participants and Non-Participants....................................................................................................... 60
4.2.3: Intensity of Adoption and Determinants of Intensity of Adoption of the Mango Fruit Fly IPM Package ............................................................................................. 61
4.3: Pesticide Misuse among Mango Farmers in Embu East Sub-County ................................. 65
4.3.1: Pesticide Misuse ...................................................................................................... 65
4.3.2: Factors Influencing Pesticide Misuse among Mango Farmers in Embu East Sub-County ...................................................................................................................... 67
CHAPTER 5: SUMMARY, CONCLUSION AND RECOMMENDATIONS ................... 72
5.1: Summary .............................................................................................................................. 72
5.2: Conclusion and Recommendations ...................................................................................... 73

viii
6.0: REFERENCES .................................................................................................................. 77
7.0: APPENDICES .................................................................................................................... 90
Appendix1: Survey questionnaire used for data collection .................................................. 90
Appendix 2: Intensity of adoption of the mango fruit fly IPM package .............................. 99
LIST OF TABLES
Table 3.1:Variables hypothesized to influence the intensity of adoption of the mango fruit fly
IPM package ............................................................................................................... 44
Table 3.2: Variables hypothesized to influence pesticide misuse among sampled mango
farmers ...................................................................................................................... 44
Table 3.3: Variance inflation factors for explanatory variables used in the intensity of
adoption of IPM model ............................................................................................... 49
Table 3.4: Variance inflation factors for explanatory variables used in the pesticide misuse
model: ....................................................................................................................... 49
Table 4.1: Frequency distribution of socio-economic and demographic characteristics of
sampled mango farmers ............................................................................................ 53
Table 4.2: Socio-economic and demographic characteristics of sampled mango farmers ......... 54
Table 4.3: Comparison of socio-economic characteristics of adopters and Non-adopters ........ 57
Table 4.4: Mango fruit fly IPM components adopted by sampled mango farmers .................... 59
Table 4.5: Comparison of proportions of adopters of IPM components between ICIPE trials
project participants and Non-participants ................................................................... 60
Table 4.6: Poisson regression results for factors influencing intensity of adoption of the
mango fruit fly IPM .................................................................................................... 62
Table 4.7: Pesticide misuse among sampled mango farmers. ................................................... 66
LIST OF PLATES
Figure 2.1: Male attractant trap with flies trapped inside ........................................................... 12
Figure 2.2: Augmentorium.......................................................................................................... 14
Figure3.1: Conceptual framework .............................................................................................. 30

ix
ACRONYMS AND ABBREVIATIONS
AFFP African Fruit Fly Program BAT Bait Application Technique BMPs Best Management Practices DAO District Agricultural Office EIQ Environmental Impact Quotient EU European Union FAO Food and Agricultural Organization FPEAK Fresh Produce Exporters Association of Kenya GLOBALGAP Global Good Agricultural Practices
GoK Government of Kenya HCDA Horticultural Crops Development Authority ICIPE International Centre of Insect Physiology and Ecology IPM Integrated Pest Management IWM Integrated weed management KGs Kilograms KHC Kenya Horticultural Council KHDP Kenya Horticultural Development Program KRA Kenya Revenue Authority KShs Kenya Shillings MAT Male Annihilation Technique
MDG Millennium Development Goals MM Millimetres MoA Ministry of Agriculture MT Metric tons OLS Ordinary Least Squares STDF Standards and Trade Development Facility USA United States of America
USDA-APHIS United States Department of Agriculture- Animal Plant Health Inspectorate Services
Z$ Zimbabwe dollar US$ United states of America Dollars

1
CHAPTER 1: INTRODUCTION
1.1: Background
1.1.1:Overview
Pest infestation is a major obstacle to sustained growth in global agricultural
production. It is estimated that 50 percent of potential crop output is lost to pests
globally(FAO, 2009). In addition, Yudelman et al. (1998) reported that global crop pre-
harvest losses due to pest infestation are estimated at 42 percent while post harvest pest losses
are estimated at 10 percent. Kenya’s horticultural sub-sector loses approximately 25-35
percent of potential crop output to pest infestation (Nyakundi et al.,2010). These pests do not
only threaten the production of crops by reducing their quantity and quality but they also
reduce their marketability. This hinders the expansion of domestic and international trade in
these crops and deprives the farmers of incomes.
Insect pests cause approximately 15 percent of total pre-harvest pest crop losses
followed by pathogens at 13 percent and weeds at 13 percent(Yudelman et al.,1998). Among
these insect pests, fruit fly (Diptera tephritidae) isof particular economic importance due to
its destructive nature and its ability to spread fast to other regions. The fruit fly affects high
value horticultural crops such as mango, avocado, guava, cucumber, pumpkin, melon,
tomato, pepper, and cucurbit (Ekesi, 2010). In East Africa, indigenous mango fruit fly species
such as Cerititis sppcauses yield losses of approximately 30-70 percent depending on the
season, mango variety and locality (FAO, 2011). Additionally, the invader fruit
fly(Bactrocrea invadens)of Asian origin causes even higher mango yield losses of between
40-80 percent (Ekesiet al., 2010).Itinfests more than 44 host fruit crops in Kenya withMango
being the most infested host crop (Ekesi, 2010).

2
In addition to direct fruit damage, fruit fly also causes indirect losses arising from
quarantine restrictions that are imposed by importing countries on fruit fly host crops to
prevent entry and establishment of unwanted fruit fly species (STDF, 2009). Indeed, trade of
several fruit and vegetable crops between Africa and the US has been severely hampered due
to the federal order by the US government banning importation of several fruit fly host crops
from African countries where Bactrocera invadens has been reported (USDA-APHIS,
2008).This consequently hurts the livelihoods of fruit farmers and traders as a result of output
and revenue losses. Notably, Kenya’s fruit industry loses up to KShs477.6 million annually
from ban of fruits exports to South Africa due to fruit fly infestation (Horticultural News,
2010). Other markets such as Seychelles and Mauritius have also increased entry checks for
Kenyan fruit exports as a result of fruit fly infestation (Ekesi, 2010).
Globally, management of pests,includingthe mango fruit flyis largely dependent on use
of chemical pesticides (Yudelman et al., 1998). Chemical pesticides applicationhas been
widely adopted as the primary pest management strategy due to its effectiveness in reducing
pest infestation and increasing agricultural production and productivity (Wilson and Tisdell,
2000). In Kenya, pesticide use has increased over time with the rapid growth in agricultural
subsectors such ascash crops andhorticulture (Ohayo-Mitoko and Partow, 1997). Kenya
imports approximately 7,000 metric tons (MT) of chemical pesticides worth US$ 50 million
annually, majorityare used in the horticultural sector (Nyakundiet al., 2010).
It has been reported that chemical pesticide use in fruits and vegetables production is
seven times higher than in other crops (Fernandez-Conerjo et al., 1994). High pesticide use in
horticultural crops is accelerated by demand for aesthetic fresh produce attributes such as
spotlessness (free of pest injury) and good colour by consumers, especially in export markets
(Okello, 2005). In addition, policy incentives such as subsidies have enhanced pesticides use
in developing countries (Ajayi, 2000).

3
Despite the popularity of chemical pesticides in produce and quality loss mitigation
among farmers, concerns have arisen on their adverse effect on health, trade and the
environment particularly related to overuse and misuse (Nyakundiet al., 2010; Okello, 2005).
Pingali(1993) warns that pesticide use in developing countries may seriously compromise
farmers’ health due to unsafe application procedures brought about by high illiteracy levels.
Moreover, fresh fruits and vegetables are usually consumed with little postharvest processing
(Govindasamy et al., 2001). Overuse of pesticides on fresh producetherefore poses serious
health risks to consumers.
Kenya Agricultural Organic Network (2006) reported that fresh produce (particularly
tomatoes)sold in Kenya’s capital, Nairobi, contained high levels of pesticides such
asDiazinon (at 0.93Mg/Kg) which is 47 times higher than what is acceptable under the
European Union’s (EU) maximum residue levels (MRLs) guidelines. Similarly, Macharia et
al. (2013) reported that vegetable farmers in Kenya overdose pesticide concentration at an
average overuse rate of 0.42 Kg per application. Overuse of pesticides has been associated
with development of resistance by target pests and killing of natural enemies that would
otherwise check pest population (Wilson andTisdel, 2000). Pesticides literature(Yudelman et
al., 1998) shows that pest resistance increases with increasing use and toxicity of pesticides.
These concerns put into question the sustainability of pesticide application as a pest control
strategy in agriculture.
Concerns about rising target pest resistance to pesticides and adverse effects of
pesticide use on health, trade and environment have led agricultural sector stakeholders to
consider and to developalternative cost effective and less environmentallydisruptive methods
to control pests without heavily relying on chemical pesticides (Farah, 1994). Suchpest
management methods include Integrated Pest Management (IPM) which refers to a diverse
mix of approaches to manage pests and keep them below damaging levels, using control
4
options that range from cultural practices to chemical pesticides (Sorbyet al., 2003). IPM is a
pest management strategy combining several pest control techniques such as; the use of
natural predators, biological pesticides, adapted cultural practices and application ofchemical
pesticides once the pest economic injury levels is reached (Biovision, 2013).
Previous studies have established that adoption of IPM is beneficial to farmers in terms
of reduction in pesticide expenditure, minimization of pest damage and improvement of farm
enterprise profitability (Fernandez-Cornejo, 1996; Cuyno et al., 2001; Isoto et al.,2008;
Dasgupta et al., 2004; Baral et al., 2006; Jankowski, et al., 2007; Ndiaye et al., 2008).
However, African smallholder farmers have proved less willing to adopt IPM
strategies(especial forannual staple food crops)due to constraints such as weak extension
systems, high cost of farmer training, aggressive advertising by pesticides dealers coupled
with African governments’ subsidies on pesticides and inadequate farmer participation in the
design of IPM strategies (Orr, 2003).
1.1.2: Importance of Horticulture in Kenya’s Economy
The horticulture sector comprising vegetable, fruits and cut-flower production plays
important economic and nutritional roles in Kenya. Over 80 percent of horticultural
production in Kenya is practiced by smallholder farmers, many of whom are not involved in
the export business but produce for the domestic market (Muchiri, 2012). Horticulture is the
fastest growing subsector within Kenya’s agricultural sector, recording annual growth rates of
15-20 percent (GOK, 2010).It is the second most important foreign exchange earner after tea.
Kenya’s horticultural production in 2012 amounted to 12.6 million MT valued at KShs. 217
billion (HCDA, 2013). This produce came from 662,835 hectares of land (HCDA, 2013). Of
this output, 380,000 MT worth KShs. 87 billion was exported.
The horticulture sector employs approximately 4.5 million people directly in
production, processing, and marketing, while another 3.5 million people benefit indirectly

5
through trade and other activities (GoK, 2010 andKDLC, 2010). It is therefore a key
contributor towards attainment of one of Vision 2030’s goals of transforming agriculture into
an innovative, commercial-oriented and competitive sector as well as achieving the first
Millennium Development Goal (MDG) of halving the number of poor people by 2015 (GOK,
2007). Fruit production is an important sub-sector in Kenya’s horticultural sector. For
instance, in 2012 it contributed KShs.65.1 billion or 22 percent of the gross domestic value of
Kenya’s horticultural produce (HCDA, 2013).
Among the fruits produced in Kenya, Mango (Mangifera indica) is one of the most
important, ranking third after bananas and pineapples in terms of area and production (FAO,
2009). The mango is increasingly becoming an important fruit in the diet of Kenyans as
exemplified by high per capita consumption of 12.7 Kgs in 2012 (GoK, 2012). It is also the
second most internationally traded fruit after pineapple in terms of value and its annual
exports from Africa are estimated at between 35,000-40,000 MTworth US$ 42 million (Lux
et al., 2003).
1.1.3: Mango Production in Kenya
Two types of mangoes are grown in Kenya, the local and the exotic or improved
varieties, with higher percentage of improved mango varieties being grown in the sub-
countiesof Thika, Embu, Mbeere North and South, Meru Central, Makueni, Machakos and
Meru South (Msabeni et al., 2010). Local mango varieties include; Ngowe, Dodo, Boribo and
Batawi while the exotic varieties include; Apple, Kent, Keit, Tommy Atkins, Van Dyke,
Haden, Sensation, Sabre and Sabine (Griesbach, 2003). Majority of mangoes are grown in the
former Eastern Province, which accounts for 54 percent of national output (Msabeni et al.,
2010).It is followed by Coast (22 percent), Nyanza (4.5 percent) and Central (3.5 percent)
and the rest from other parts of the country (Msabeni et al., 2010). Out of the total quantity of
mangoes reaching wholesale markets in Nairobi; 63 percent are from Machakos, 11 percent

6
from Kitui, 8 percent from Makueni, 6 percent from Embu and 3 percent from Meru counties
all in the former Eastern Province (Tschirley andAyieko, 2008).
Kenya’s mango production has increased steadily over the last decade with yields rising
to 10 MT per hectare (Horticultural News, 2011). However, potential yield of 25 MT per
hectare or more can be achieved from improved varieties (Griesbach, 2003). In 2012,
Kenya’s average mango production rose to 2.8 million MT worth KShs 13 billion from
593,499 MT worth KShs 10.4 billion in 2010 (HCDA, 2013). Similarly, the area under
mango cultivation increased by 21.12 percent from 47,051 hectares in 2010 to 57,021
hectares in 2013 (HCDA, 2013). Out of the total mangoes produced, approximately 98
percent is consumed locally while two percent are exported (Ministry of Agriculture, 2010).
The main export market is the Middle East and smaller volumes are exported to Holland,
United Kingdom, Belgium, Germany and France (FAO, 2009).
Mango production is however adversely affected by challenges such as pest and disease
infestation, lack of quality planting materials, poor postharvest handling technologies, poor
road infrastructure, limited knowledge about improved technologies and high freight costs
(GoK, 2012). Among these challenges, diseases and pest infestation are the most constraining
to mango production and marketing since they adversely affect the quality and quantity of the
fruits (Muchiri, 2012). The major pests that infest mangoes are the fruit fly (Diptera
Tephritidae) and mango seed weevil (Sternochetus mangiferae) while the major diseases
include anthracnose and powdery mildew (Griesbach, 2003).
1.2: Problem Statement
Mango fruit fly has become one of the most significant insect pests posing serious
threat to sustainability of Kenya’s fruit industry (Ekesi et al., 2006).For example, the value of
fruit fly related mango rejections by buyers per season in Embu East sub-County alone is
estimated at KShs 3.2 million (Muchiri, 2012). Efforts to control this pest in Kenya have been

7
largely dependent on toxic chemical pesticides (ICIPE, 2011). However, this control strategy
is not fully effective because pesticides applied on fruit surface cannot reach thelarvae of the
pest (the destructive stage) held inside the fruit tissue (Muchiri, 2012). Consequently, mango
farmers have sought to improve fruit fly control effectiveness by adopting pesticide misuse
practices such asoverdosing ofpesticides concentration, increasing frequency of spraying,
using unrecommended pesticides brands and mixing pesticides brands (Muchiri, 2012). In
addition to being ineffective, these pesticide misuse practiceshave adverse health,
environmental and economic consequences (Williamson et al., 2000;Nyakundi et al.,2010).
To respond to this pesticide ineffectiveness and overuse, ICIPE has developed and
disseminateda mango fruit fly IPM packagebetween 2009 and 2012 mango production
seasons. The IPM package was designed to improve fruit fly control effectiveness and
minimize pesticide use. The package consists of five components namely, male attractant
traps (Methyl Eugenol), food baits (Merzoferm), fungal bio-pesticides (Metarhizium), a
biological control agent (parasitoid wasps) and orchard sanitation. Yearly trials on the
package were conducted in Embu East Sub-County between 2009 and 2012 mango
production seasons through a project in whichfarmers were enrolled and trained on use of the
mango fruit fly IPM packagecomponents at designated lead mango orchards. After each
training session, participants were issued with starter kits of the IPM components for trial in
their orchards. At the end of the trials project, all mango farmerswere expected to purchase
the IPM components in subsequent seasons.
The mango fruit fly IPM trialorchards recorded less than 14 percent fruit fly damage on
total harvested mangoes compared to 24-60 percent in non-participating orchards (ICIPE,
2011). It has also been demonstrated that the use of any 2–3 components of the mango fruit
fly IPM package within the context of IPM increases net income of smallholder farmers by
22.4 percentand reduces insecticide use and mango rejection by 46.4percent and 54.5percent

8
respectively (Kibira, 2015). Despite the success of thisIPM packageand its potential demand
evidenced by farmers’ willingness to pay for it (Muchiri, 2012),thefactors influencing the
intensity of adoption of the fruit fly IPM package remains unknown.In addition, there is
limited knowledge on the factors influencing pesticide misuse in the control of the mango
fruit fly. This study sought to address these gaps in knowledge by focusing on mango farmers
in Embu East sub-County.
1.3:Objectives of the Study
1.3.1: Overall Objective
The overall objective of this study was to assess the factors influencing the intensity of
adoption of mango fruit fly IPM package and pesticide misuse among mango farmers in
Embu East sub-County.
1.3.2: Specific Objectives
The specific objectives were to:
1. Assess the socio-economic characteristics of mango farmers in Embu East sub-County.
2. Determine the factors influencing the intensity of adoption of the mango fruit fly IPM
package in Embu East sub-County.
3. Examine the factors influencing pesticide misuse among mango farmers in Embu East sub-
County.
1.4:Hypotheses
This study hypothesizes that: 1. Farm, socio-economic, institutional and market factors taken individually do not
influence the intensity of adoption of mango fruit fly IPM package.
2. Farm, socio-economic, institutional and market factors taken individuallydo not
influence pesticide misuse among mango farmers.

9
1.5: Justification of the Study
This study provides empirical evidence on the intensity of adoption of the fruit fly IPM
package as well as pesticide misuse among mango farmers in Embu East Sub-County. The
results of this study provide important information to different agricultural stakeholders.
Firstly, knowledge about factors influencingthe intensity of adoption of the mango fruit fly
IPM package points out areas of policy interventionthat need to be emphasized in order
toachieve higher levels of adoption among mango farmers. Secondly, information regarding
determinants of pesticide misuse highlightsissues that policy makers, pesticides dealers and
farmers should addressin order toreduce reliance on pesticides in mango fruit fly control.This
study also contributes to the growing literature on sustainable agricultural technologies by
addressing adoption of IPM as well as pesticide misuse simultaneously.
1.6: Organization of the Thesis
The rest of the thesis is organized as follows: Chapter 2 reviewsa wide range of past
studies with the aim of discussing the literature on IPM adoption and pesticide use by
farmers. Chapter 3 presents the methodology which includes the conceptual framework,
empirical methods, the study area, data collection procedures, research design, data needs and
sources. Chapter 4 presents the results and discussion while chapter 5 presents the conclusion
and recommendations of the study.

10
CHAPTER 2: LITERATURE REVIEW
Introduction
This chapter starts by discussing the concept of IPM. Thereafter past studies on benefits
of IPM, adoption of IPM, health and environmental effects of pesticide as well as pesticide
misuse in agriculture are critiqued.
2.1: Integrated Pest Management (IPM)
There are several definitions of IPM inthe literature. According to Kogan (1998), “IPM
is a decision support system for the selection and use of pest control tactics, singly or
harmoniously coordinated into management strategy based on cost/benefit analyses that takes
into account the interest of and impacts on producers, society and the environment ” (pp
249).Unlike single item innovations such as high yielding varieties, IPM relies on multiple
pest management strategies used singly or in combination as a package to keep pest
population at low levels as well as minimize pesticides use (Orr, 2003). The primary goals of
IPM are;to increasing the incomesof IPM users and society as a whole through increased
productivity as well as enhancing environmental quality and health through reduced use of
hazardous chemicals (Norton andMullen, 1993).Alston (2011) also definesIPM as; “A
comprehensive approach to pest control that uses a combination of means to reduce the status
of pests to tolerable levels while maintaining a quality environment” (pp 1).
From the definitions highlighted above, it is clear that IPM approach integrates both
preventive and corrective measures to manage pest populations to minimize economic
damage, risk hazards to human and harmful environmental side-effects by minimizing
pesticides use. In 1995, a pilot IPM training project was initiated in most rural areas by the
government of Kenya in partnership with the International Institute of Biological Control
(IIBC), Kenya Institute of Organic Farming (KIOF), Coffee Research Foundation (CRF) and
theKenya Agricultural and livestock Research organization (KALRO). The aim of the project

11
was to introduce a sustainable pest management strategy to farmers so that they could save
massive crops losses to pests and avoid the hazards posed by chemical pesticides to their own
health (Leovinsohetal., 1998).
2.2:Benefits of IPM
IPM has been identified as a viable alternative to conventional pest management
programs that rely heavily on scheduled applications of pesticides (Ridgley andBrush, 1992).
Ndiaye et al.(2008) reported that an IPM package consisting of male annihilation technique,
bait sprays and orchard sanitation reducedmango fruit fly infestation by 83 percent in
Senegal.Similarly, Vayssieres et al.(2009) found that use of GF-120 bait sprays reduced
mango fruit fly infestation by 81percent to 89percent in Benin. In the Pacific region,Varga et
al.,(2015) found that use of various IPM components in combination led to reduction of fruit
fly infestation by between 77percent and 100percent.
It has also been demonstrated that adoption of IPM reduces amount and cost of
pesticides used compared to conventional pesticides spraying. For instance, Jankwowski et
al.(2007) found that adoption of a biological control agent by cabbage farmers in Kenya and
Tanzania reduced pesticides usage by 34 percent while Baral et al.(2006)observed that
adoption of IPM practices by egg plant farmers in India reduced insecticide expenditure by
52.6 percent.Adoption of IPM also improves incomes of farmers. For example,Isotoet
al.(2008) found that adoption of IPM increasedUgandan coffee farmers’ revenues by 118
percent compared to farmers that used conventional pest control methods. In the Philippines,
Cuyno et al.(2001) found that adoption of IPM improved the incomes of onion farmers by
between 231 to 305 pesos per person per cropping season. It has also been established that
adoption of IPM reduces use of pesticides from 2.33kg/acre to 0.77kgs/acre in Bangladesh on
average thereby improving the profitability of the enterprise (Dasgupta et al., 2004).

12
The studies discussed above suggest that IPM is a viable alternative pest management
strategy that is not only effective but also minimizes pesticide usage and improves enterprise
profitability.
2.3: Mango Fruit Fly IPM Package
The mango fruit fly IPM package mainly consists of four components namely, the
baiting application technique (BAT), the male annihilation technique (MAT), orchard
sanitation and the use of biological control agents. Each component in the package plays an
important role when integrated with the others. The components of the mango fruit fly IPM
package are described below.
2.3.1: Male Annihilation Technique (MAT)
The male annihilation technique (MAT) uses a male lure which traps male flies in
masses to reduce their populations to very low levels or to completely eliminate them such
that mating does not occur. Cotton wicks soaked in Methyl Eugenol attractant poisoned with
an insecticide are placed in traps (usually made of plastic containers of bright colors to mimic
ripe mangoes) hanged on trees in the orchard. The male fruit flies are attracted into the traps
where they inhale the poisoned methyl Eugenol and die.
Figure 2.1: Male attractant trap with flies trapped inside Source: Photographs taken from the field

13
2.3.2: Baiting Application Technique (BAT)
This method of fruit fly suppression is mainly based on the use of food baits
(hydrolyzed proteins or their ammonium mimics) combined with a killing agent, and applied
in localized spots on the mango tree (Ekesi et al., 2010). The bait attracts the fruit flies from a
distance (usually one square kilometre) to the spot of application, where the flies feed on the
protein bait, ingest the pesticide and die (Ekesi et al., 2010). The protein bait mixed with
spinosad insecticide is normally applied to a small spot on the mango canopy (usually 1
square meter away from the fruit) or on the trunk of each tree in the orchard on a weekly
basis starting when the fruits are about 1.25 centimetres in size and continues till the end of
the harvest.
2.3.3: Biological Control Agents
Several biological control agents are important in suppressing the fruit fly population in
mango orchards. These agents include; red ants, parasitoid wasps and fungal pathogens
(Metarhizium) which reduce infestation through: predation of adult fruit flies, predation of
third-stage larvae, destruction of pupa in the soil and the repulsive effect of “pheromones”
left by the ants on fruits so that flies are discouraged from laying eggs in them (Adandonon et
al.,2009). Parasitoids in particular decimate the population of the fruit fly by laying their
eggs at the same spot where the pests lay theirs in the fruit. The parasitoids larvae then feed
on the developing larvae of the fruit fly, killing them (Biovision, 2013). Fungal pathogens
attack pupa of the fruit fly developing in the soil.
2.3.4:Orchard Sanitation
These are cultural methods that reduce fruit fly damage although they do not suppress
pest populations directly. Field sanitation is necessary because poorly managed or
unmanaged orchardsresult in build up of fruit fly populations. It entails regular collection and
destruction of all fallen fruits throughout the entire mango season. Population dynamics

14
studies undertaken by Rwomushana (2008) found that the density of fruit flies in fruits lying
on the ground is directly proportional to the density of those in fruits on the tree. The fallen
fruits are collected and disposed by burying them in a deep hole, burning them, feeding to
livestock or disposing in an augmentorium. An augmentorium is a tent-like structure that
traps fruit flies emerging from the collected rotten fruits but allow the parasitoid wasps (a
biological control agent) to escape from the structure through a fine mesh at the top of the
tent.
Figure 2.2: Augmentorium Source: Kibira, 2015
2.4: Theories onTechnology Adoption
Adoption is defined as the decision to make full use of an innovation as the best course
of action available (Rogers, 1983). A technology is defined as a means by which resources
15
are combined to produce the desired output. Innovation is defined as a new idea practice or
object perceived as new by the recipient (Rogers and Shoemaker, 1971). According to Feder
et al. (1985), intensity of adoption is the level of adoption of a given technology, for example
the number of hectares planted with improved seed or the amount of fertilizer applied per
hectare.
The choice to adopt an innovation is regarded as an outcome of a series of influences
exerted by forces of change on the behaviour of the decision maker through time (Lionberger,
1968). It therefore implies that the choice to adopt an innovation is made over time. The
forces of change influencing adoption decision of an individual (farmer) can be classified into
incentives (reasons for) and disincentives (reasons against) adoption (Bonabana-Wabbi,
2002). In order to facilitate the adoption process, the incentives should be enhanced and
disincentives discouraged. There is therefore need for identification and assessment of both
incentives and disincentives of technology adoption among the recipients (farmers). This will
point out areas of policy intervention that need to be addressed to enhance adoption of new
technologies.There are three main theories used to explain adoption decisions in the literature
that is the innovation-diffusion, economic constraint and adopter acceptance theories.
2.4.1: Innovation Diffusion Theory
Diffusion is the process by which an innovation is communicated through certain
channels over time among the members of a social system (Rogers, 2003). The innovation
diffusion theory has four elements namely; innovation, communication, time and social
system.An innovation is an idea, practice, or object that is perceived as new by an individual
or an improvement over the existing one by the members of a social system (Peshin and
Dhawan, 2009)., The characteristics of innovations which determines their rate of diffusion
are;

16
a) Relative advantage:the ratio of the expected benefits derived from adoption to the
costs of adoption of an innovation.
b) Compatibility: The degree to which an innovation is consistent with past experiences
and needs of farmers.
c) Complexity: The degree to which an innovation is difficult to comprehend and use.
d) Trialability: The degree to which an innovation can be experimented with, either on
limited basis or in instalments.
e) Observability: The degree to which the results of an innovation are visible to others.
Communication channels are the means by which information about an innovation or
technology is shared among two or more individuals. These communication channels could
be interpersonal or mass media (Peshin andDhawan., 2009). Time is an element of the
innovation diffusion process comprising three dimensions namely, innovation-decision
process, innovativeness of an individual or other unit of adoption and rate of adoption of an
innovation.
a) Innovation-decision process is the process through which an individual passes from
getting information about an innovation to its final adoption or rejection. These
phases are awareness of the availability of an innovation, conviction of its usefulness,
acceptance or willingness to try the innovation and finally complete adoption.
b) Innovativeness of an individual is the earliness or lateness with which an individual
adopts a technology compared to other members of the society. This leads to
classification of farmers into innovators, early adopters, early majority, late majority
and laggards based on their earliness or lateness of adopting an innovation.
c) Rate of adoption is the relative speed with which farmers adopt an innovation. The
rate of adoption is measured by the length of time taken by a certain percentage of
farmersin a given area to adopt an innovation.

17
A social system is a set of individuals, groups or organizations that are engaged in
solving a common problem or in accomplishing a common goal such as pest control.
2.4.2: Economic Constraint Theory
This theory contends that constraints associated with resource distribution and
endowment is the major determinants of technology adoption behaviour of farmers. Lack of
access to factors of production; land, labour and capital could significantly constrain farmers’
technology adoption (Marra and Carlson, 1987; Nowak, 1987). Due to these resource
constraints, farmers chose technologies from which they would derive maximum benefits
(utility). Utility is explained in terms of the returns or profit derived from farm production or
leisure derived from avoiding work. Furthermore, the economic constraint theory indicates
that households obtain different levels of profit from different technologies, implying that the
choice of production technology is influenced by profit prospects derived from those
technologies (Mbaga-Semgalawe and Folmer, 2000). A farmer will therefore adopt a new
technology if the expected utility of adopting (profits or benefits derived from new
technology) exceeds that of the current technology.
2.4.3:Technology Acceptance Theory
This theory proposes that the perceived attributes of an innovation influence adoption
behaviour of the farmer. The technology acceptance model identifies two predictors for
successful adoption: the perceived ease of use (EU) and perceived usefulness (PU) of the
technology (Crann et al., 2015). Perceived ease of use is the degree to which an individual
believes using a particular technology would be free of effort. On the contrary, perceived
usefulness refers to the extent to which individuals believe the technology will help them
perform their job (Crann et al,. 2015). Therefore, potential adopters who believe that a new
technology will be useful to them and is easy to learn are more likely to adopt it (Barrette,
2015). Adezina and Baidu-Forson (1995) assessed the role of farmers’ perceptions on

18
adoption of new agricultural technologies in Burkina Faso and Guinea and found that
sorghum varieties perceived by farmers as having superior yield performance (perceived
usefulness) over local varieties had a higher likelihood of being adopted.
This study used the economic constraint theory to assess the determinants of adoption
of the mango fruit fly IPM package in Embu East sub-County. This theory was chosen
because mango farmers, the consumers of the IPM technology, were assumed to be rational
with the objective of maximizing their expected utilityderived from either adopting the IPM
package or continuing with the conventional pesticide cover spraying. The mango farmers
will therefore adopt IPM if their expected returns of adopting exceed those of conventional
pesticide cover spraying.
2.5: Approaches for Assessing Intensity of Technology Adoption
Technology adoption literature provides a variety of approaches to analysis of
agricultural technology adoption decisions. The most common approach is the binary choice
(logit and probit) models where farmers are categorized as being either adopters or non
adopters (Bett, 2004). In such cases,the dependent variable takes a value of one for adopters
and zero for non-adopters (Fernandez-Cornejo et al., 1994; Burrows 1983; D’Souza et al.,
2003 and Harper et al., 1990). The logit and probit models differ in the type of distribution
followed by the error term. If the cumulative distribution of is logistic, we have the logit
model but if it is normally distributed we have the probit model. The logit and probit models
yield almost similar results, but the logit model is computationally easier than the probit
model.
Some agricultural technologies are designed as packagesconsisting of several
technology components. Such technologies should be adopted partially or wholly for the
farmer to resolve a particular issue such as soil conservation, pest management and
environmental conservation (Ridgeley and Brush, 1992). For instance, IPM consists of
19
several component technologies which are designed to work together but each component can
be utilized individually to ensure effective pest control with the least use of harmful
pesticides. Therefore, assessing adoption of such technologies using the logit or probit
models leads the researcher to lump farmers into two categories (1 = full adoption, O = no
adoption at all).This introduces statistically undesirable measurement errors since a stepwise
or partial adoption process cannot be measured by a dichotomous dependent variable
(Ramirez and Shultz 2000; Isginet al., 2008).
In situations where the dependent variable is discrete or continuous, it is desirable to
quantify intensity of adoption either as a count of the number of components
adopted(Ramirez and Shultz 2000) or the area of land allocated to the technology under
study. One of the models used for assessing intensity of technology adoption, when the
dependent variable is continuous,is the tobitmodel. However, where the intensity of adoption
of a technology is measured as a count of technology components used by a farmer, the
dependent variable takes discrete non-negative integer values. It is therefore desirable to use
the count data regression models to assess the factors influencing intensity of adoption of
such technologies (Greene, 2007). The commonly used count data regression modelis the
Poisson regression model.There are several studies in literature which have quantified the
intensity of adoption of IPM as a count and consequently used the count data models for
analysis (Sighn et al., 2008; Maumbeand Swinton, 2000; Raghu et al., 2014; Ramirez and
Shults; 2000; Eburgh et al., 2010; Lohr and park 2002; Frisvold et al., 2010). The count data
model assumes that, provided a farming household derives a greater utility from the last
adopted technology, there is no limit to the number of practices or technologies adopted
(Lohr and Park, 2002). This means that farmers will adopt the maximum number of mango
IPM components as long as they derive maximum utility from that combination.

20
The fruit fly IPM package consists of eightcomponents that are supposed to be
integrated together with a view to improving fruit fly control effectiveness and minimizing
pesticide use. These componentsare complementary and use of each component in isolation
may produce poor pest control results. Based on the aforementioned reasons, this study is
conveniently modelled as a multiple technology adoption decision. In this study, the intensity
of adoption of the mango fruit fly IPM package was taken as a count variable given by the
number of IPM components adopted by the specificmango farmer.
The pesticide misuse practices assessedwere overdosing pesticides concentration,
increasing frequency of spraying and use of unrecommended pesticides brands. A farmer
who used any of these three practices was coded 1 and those who did not use were coded 0.
The binary logit model was therefore estimated to assess the determinants of pesticide misuse
among sampled mango farmers.
2.6:Adoption of IPM
Several studies have been done adoption of integrated pest management. For example
(Fernandez-Cornejo et al. 1994; Fernandez-Cornejo) used the binary choice (logit and probit)
models respectively to assess adoption of IPM in the USA and found that availability of
operator labour time, size of land planted to the crop of interest and access to extension
services had a significant positive influence on adoption of IPM. The findings of the study
under review suggest that IPM is a knowledgeand labour intensive technology because access
to extension services and availability of owner labour time had a positive influence on the
IPM adoption decision. It also suggests that IPM benefits are more visible in large
agricultural operations since farmers who operated larger vegetable orchards were more
likely to adopt IPM.
It has also been established that perception about the likely economic benefits accrued
from IPM adoption has a positive influence on IPM adoption decision (Baral et al. 2006;

21
Fernandez-Cornejo, 1996). The finding suggests that dissemination of accurate information
about economic benefits (such as increased incomes and low pesticides expenditure) of IPM
enhances the adoption decision. Using the probit model, Dasgupta et al. (2004) studied
adoption of IPM in Bangladesh and found that the magnitude of crop losses incurred due to
pest information and education of the household had a positive influence on adoption of IPM.
The finding suggeststhat IPM is a knowledge intensive technology and dissemination of
accurate information, to create awareness among farmers, about IPM enhances adoption.
The size of land under planted to the crop of interest has been shown to be an important
variable explaining adoption of IPM (Maumbe and Swinton 2000; Erbaugh et al., 2010).
These studies used the count data model (Poisson regression) and found that farmers who
allocate larger land sizes to particular crops rank those crop enterprises more important than
others, and therefore adopt effective pest management technologies such as IPM in order to
minimize pest losses in those crops. Singh et al. (2008)also used the Poisson regression
model to study adoption of rice and paddy IPM in India, but concluded that land size had a
negative influence on adoption of IPM. Key among the results of Erbaugh et al, (2010) was
that distance to nearest input market had a positive influence on adoption of cow pea IPM in
Uganda. The relevance of this finding is that farmers are likely to adopt pesticides substitutes
such as orchards sanitation when they do not have easy access to pesticides.
Lohr and Park (2002) also assessed choice of insect management practices in the USA
using the negative binomial model and found that education, access to diverse source of pest
management information and farming experience had significant positive influence on
adoption of more pest management practices. The study results emphasize the need for access
to accurate IPM information in order to increase the intensity of adoption of IPM. Frisvold et
al. (2010) also used the Poisson and probit regression models to assess adoption frequency of
use of best management practices respectively, to control herbicides weed resistance by corn,
22
cotton and soya beans farmers in the USA. The reviewed study found that education of the
farmer and expectation of higher yields relative to county average had a positive influence on
intensity of adoption. These findings imply that IPM is a knowledge intensive technology and
farmers should be well trained on use of various IPM components in order to enhance the
intensity of adoption.
The probit regression results of Frisvold et al. (2010) study indicate that the ratio of
farmers’ expected yield to county average yield had positive influence on frequent use of best
management practices. This finding imply that farmers with higher crop yields tend to adopt
more best management practices frequently because gains from damage reduction due to
adoption will be greater for farmers with high yields than those with lower yields. Ramirez
and Shultz (2000) also used the Poisson regression model to assess adoption of IPM in Brazil
and found that membership in community organization, access to credit, availability of hired
labour, age of household head, farming experience, education of household head and
cropping system had a positive influence on adoption. The finding on membership in
community organization suggests that IPM information can be disseminated effectively
through groups which enhance social networking among farmers.
While studying adoption of precision farming in Ohio, USA, Isgin et al. (2008) used
the Poisson regression and the negative binomial regression models and found that age of the
household head, size of land operated, soil quality and proximity to urban area had a positive
influence on intensity of adoption. However, farmer’s indebtedness had a negative influence
on intensity of adoption. The finding on a farmer’s indebtedness implies that IPM is not a
capital intensive technology and thus farmers who seek credit have a lower likelihood of
adopting more IPM components.
Raghu et al. (2014) studied the intensity of adoption of farm management (nutrient
management, pest management and soil conservation) practices in India using the negative

23
binomial regression model and found that farm size and access to extension services had a
positive influence on adoption of the three technologies. The findings of this study imply that
IPM have a positive scale effect and farmers who operate larger crop enterprises are likely to
benefit more from IPM than those operating smaller crop enterprises. The finding on access
to extension services reinforces the importance of agricultural extension as a source of
information and knowledge about knowledge intensive technologies such as IPM.
In a study to assess adoption of IPM and pesticide use among vegetable farmers in
Nicaragua, Garming et al. (2007) used the poisson regression model and found that,
education of household head, paying extra benefits to farm workers for spraying and
participation in the IPM training had a positive influence on adoption. These finding suggests
that IPM is a knowledge intensive technology and farmers who received training had a higher
likelihood of adopting more components. The results of the pesticide use model revealed that
adoption of IPM reduced the quantity of pesticides used in vegetable orchards.
From the discussions above it is evident that few studies on sustainable agricultural
technologies, especially adoption of IPM, have been done in the East African region.
Majority of the studies reviewed were done in the USA, India, Brazil, Nicaragua, Zimbabwe
and Bangladesh. The current study will therefore contribute to growing literature on adoption
of IPM and identify areas of policy interventions that need to be emphasized in order to
achieve higher intensity of adoption of IPM in Kenya.
2.7:Environmental and Health Effects of Pesticide Use in Agriculture
Although pesticide use has improved productivity in the global agricultural sector, it
has significantly increased concentration of hazardous chemical on the food and the
environment.The result of this phenomenon is dozens of millions cases of people in the world
experiencing pesticides poisoning annually (Richter, 2002). Moreover, it has been shown that
direct and indirect pesticides exposure cause a myriad of diseases such as cancer, diabetes,

24
respiratory disease and genetic disorders. Notably, it has been established that a significant
proportion of pesticides are carcinogenic, with 18 percent and 90 percent of all insecticides
and fungicides respectively being carcinogenic (Andersson et al., 2014). For example, Lynch
et al.(2003)found that direct exposure to pesticides cause cancer, while (Cox et al. 2007) have
linked diabetes disease topesticide exposure.
Direct pesticides exposure has also been found to increase the risk of respiratory
diseases such as bronchitis, (Hoppins et al. 2007), asthma and wheezing (Hoppin et al, 2009).
In addition to direct pesticide exposure, indirect exposure through means such as
environmental pollution and prenatal exposure increases the risk of childhood leukaemia
(Ferreira et al, 2013). The risk of pesticide exposure and poisoning in developing countries is
increased by ignorance of the farmers on the dangers of exposure to toxic pesticides and
therefore use and store pesticides in ways that expose them and others to health hazards
(Okello and Swinton, 2007).
Maumbe and Swinton (2003)found that Zimbabwean cotton farmers lost a mean of Z$
180 and Z$ 316 in Sinyati and Chipinge districts respectively to pesticides related illnesses in
addition to spending between two and four days recovering from these illnesses. Antle and
Pingali (1994) also concluded that pesticide use has a negative effect on the health of farmers,
and health of farmers has an influence on agricultural productivity. It has also been shown
that continued pesticides use reduces soil fertility which adversely affects productivity and
increases the need to apply larger quantities of chemical fertilizers to maintain productivity.
(Wilson and Tisdell 2001).
2.8: Pesticide Misuse
Kenya imports approximately 7,000 metric tons of pesticides annually, majority of
which finds its use in the horticulture industry (Nyakundi et al., 2010). Ironically, Kenya is
the leading producer of a natural pesticide, pyrethrin, which is a broad-spectrum insecticide
25
made from dried flowers of pyrethrum. However, 95percent of the crude pyrethrin is
exported to more environmentally conscious developed countries, where it earns a premium
price, leaving Kenya to import the cheaper toxic synthetic pesticides (Macharia et al., 2009).
The growth in the horticulture industry in Kenya has led to a sharp increase in
pesticides demand. Increased pesticides application has also been accelerated by the demand
for pest-free horticultural produce in the European export markets (Okello, 2005). This has
led to overuse of pesticides with a view to minimizing pest infestation. Pesticide overuse and
misuse pose serious health and environmental challenges especially among smallholder
farmers. These negative effects from indiscriminate use of highly toxic pesticides have been
observed by both farmers and policy makers in developing countries. For instance, Okello
(2005) observed that green bean farmersin Kenya who do not adhere to international food
safety standards are more prone to pesticides related health hazards than those who are
compliant due to heavy and careless use of toxic chemicals.
Macharia et al. (2009) used the environmental impact quotient (EIQ) of pesticides to
assess the potential environmental impacts of pesticide use in the vegetable sub-sector in
Kenya.The study found that pesticide use in production of vegetables was quite high with 62
pesticide formulations containing 36 active ingredients. The results of the study further
indicated that most of the pesticides used inKenya were extremely harmful even when used at
low rates. Furthermore, the study concluded that the environment was most adversely
affected by pesticide use followed by farm workers and vegetable consumers. These results
suggest that pesticide use in the vegetable sub-sector has negative environmentalimpacts.
Macharia et al. (2013) assessedvegetable famers’ pesticides handling practices and
perceptions in Kenya using the poisson regression model. The study found thatmore than half
of the sampled farmers (65percent) did not understand the pesticides labels even though they
claimed to read them. In addition, 27 percent overdosed pesticides concentration with an
26
overuse rate of 0.42 Kg per application and 35 percent sufferedat least one symptom of acute
pesticides poisoning. The results of the study indicated that having GLOBALGAP
certification, being a male headed household, obtaining pesticides use advice from
neighbouring farmers and producing specifically for the domestic market increased the
probability ofperceiving negative effects of pesticides.The study further found that the
probability of inappropriate pesticide handlingincreased with obtaining pesticides use advice
from traders, number of pesticides handled and handling of very hazardous chemical
pesticides. On the other hand, record keeping reduced theprobability of inappropriate
handling of pesticides.
While assessing the control strategies used by Kenyan snow pea farmers against the
leaf miner pest Gitonga et al.(2009) usedthe negative binomial regression model and found
that higher household incomes increased the probability of using more pest control strategies.
On the other hand, possession of a GLOBALGAP certificate and producing under contractual
arrangement with an exporter reduced the probability of using more leaf miner control
strategies by snow pea farmers. The reviewed studyalso revealed that more than half of the
sampled snow pea farmers (63percent) considered pesticide use as an ineffective control
strategy. Consequently, they used stronger concentrations of pesticides, increased frequency
of pesticides applications and increasingly mixed pesticides brands all targeting at improving
pest control effectiveness. The current study goes beyond Gitonga et al., (2009) study by
assessing adoption of the mango fruit fly IPM in addition to determinants of pesticides
misuse.
Jankwowski et al.(2007) studied economics of a biological control agent against
diamond black moth infestation in cabbages in Kenya and Tanzania using a two-stage
damage control production function and pesticide use function. Results from the study
revealed that, although there was no net income benefits associated with thebiological control

27
agent, there were inherent positive health and environmental benefits. The study further
found that use of the biological control agent led to a reduction in amount of pesticide used
by 34 percent. However, increase in pest pressure due to killing of biological control agent by
pesticides led farmers to increase their pesticide expenditure by approximately 23 percent per
hectare. These results suggest that pesticide application kills the biological control
agentwhich would have otherwise checked pest population. The study also contends that
Kenyan cabbage farmers use significantly more pesticides compared to their Tanzanian
counterparts. The current study sought to assess the intensity of adoption of the mango fruit
fly IPM package.
Asfaw et al. (2008)assessed the impact of EU private food safety standards on pesticide
use and farm-level productivity among smallholder export vegetable producers in Kenya
using a three stage damage control production function. They found that even though farmers
producing for export market used less toxic pesticides, they used same quantity of pesticides
as those producing for the local market.It was also concluded that export wholesale and retail
markets encouragedfarmers to use more pesticides on their crops because they gave much
emphasis on physical appearance of the produce such as spotlessness, good shape and
colour.Furthermore, pest pressure and access to credit had apositiveinfluence on pesticide
expenditure. The finding implies that farmers’ pesticide expenditure depends on capital
availability and the prevalence of pests. On the other hand, farmer’s level of training, distance
to nearest extension service provider, household size and age of household head had a
negative influence on pesticides expenditure.Unlike the reviewed study, the current study
sought to assess adoption of IPM and pesticide misuse simultaneously.
Rashid et al. (2003) assessed pesticide misuse among eggplant farmers in Bangladesh
using the logit model. Pesticide misuse was defined as application of insecticides in lower or
higher than recommended dose and frequency, spraying mixture of two or more pesticides
28
brands per application, or using unregistered, banned or highly toxic chemicals. The results of
the studied revealed that age of the household head, education level of the household head,
access to credit and IPM training had a negative influence on pesticides misuse. The study
further found that obtaining pest management information from pesticides dealers,
membership in a farmer association and extension contact had a positive influence on
pesticide misuse among egg plant farmers. Although the study under review is similar to the
current study in terms of methodology used to assess determinants of pesticides misuse, the
current studyfocused on control of mango fruit fly as opposed to egg plant considered in the
reviewed study.
Tjornhom et al.(1996) studied pesticide misuse (inappropriate timing of pesticide
application) in vegetable production in Philippinesusing a logit model. The results of the
study revealed that obtaining pest management information from pesticides dealers and visit
by state department technician (access to extension services) had a positive influence on
pesticide misuse. On the other hand, education level of the household head, age of the
household head, access to cooperative credit and pest management training had a negative
influence on pesticide misuse among onion farmers. Unlike the reviewed study which
assessed one pesticide misuse practice, the current study extended the definition of pesticides
misuse to include overdosing pesticide concentration, increasing frequency of spraying and
use of un-recommended pesticides brands.
From the reviewed studies, it is clear that pesticide overuse leads to increase in pest
pressure since pesticides application kills beneficial organisms which would have otherwise
checked the pest population. It is therefore important to assess farmers’ pesticides use
behaviour with a view to identifying areas of policy recommendations that need to be
addressed in order to reduce pesticide overuse.

29
CHAPTER 3: METHODOLOGY
Introduction
This chapter starts with explanation of the conceptual framework of how the study
sought to address the problem identified. There after a theoretical framework under which the
study is grounded is discussed. The next part of the chapter presents the empirical methods
used in the study, measurement of variables and statistical tests done on the data. The
sampling procedure, sample size determination, data collection and description of the study
area are also discussed in this section.
3.1: Conceptual Framework
TheFruit fly pest causes both direct and indirect losses in mango production and
marketing processes. Farmers respond to this pestprimarily by applying pesticideto minimize
losses. However, pesticides are not fully effective against the pest because their larva, the
destructive stage, isheld in the fruit tissue therefore it cannot be reached by pesticides sprayed
on fruit surface.Consequently, mango farmers resorted to overuse of pesticides to improve
pest control effectiveness. However, overuse of pesticides has adverse cost, health and
environmentalimplications therefore more effective, sustainable and environmentally friendly
fruit fly control approaches, such as IPM need to be considered.
As can be seen in figure 3.1, abundance of fruit flies and pesticides ineffectiveness lead
to high fruit losses, lack of market due to quarantine restrictions, pesticides overuse which
have adverse health and environmental implications. This situation can however be reversed
by use of IPM which is effective against the fruit fly and emphasizes on minimal pesticide
application. Adoption of the mango fruit fly IPM package is expected to bring about
economic benefits such as; improved mango yields, pesticide residue-free fruits, wider
market access, improved incomes for mango farmers and reduction in pesticide use.

30
Figure3.1: Conceptual framework
F. Factors influencing adoption of IPM
1. Access to extension service 5. Age of household head
2. Education of household head 6. Gender of household head
3. Source of pest management information 7. Distance to mango market
4. Use of spraying protective clothing 8. Occupation of household head
A. Problem
1. Abundance of fruit fly pest infestation.
2. Pesticides ineffective against fruit fly hence encourage growers to overuse them.
D. Intervention
1. Adoption of IPM
2. Reduced
pesticide use.
E. Economic output
1. Mango yields
2. Mango incomes
3. Pesticide use
4. Pesticide health hazards.
C. Fruit fly IPM package
1. Attractant trap
2. Biological control
agent
3. Bait sprays
4. Orchard
sanitation
5. Soil fungal
pathogens
B. Consequences
1. High fruit losses,
2. Quarantine export market restrictions
3. Overuse of pesticides
4. Health and environmental hazards and high cost of production.

31
Literature review revealed that adoption of IPM is influenced by factors such as size of
land allocated to crop of interest, education level of the household head, age of household
head, membership in agricultural group, source of pest management information and access
to extension services.
3.2: Theoretical Framework
This study is based on the random utility theory. The adoption decision is a behaviour
response by an individual towards a new innovation or technology. This decision is
influenced by expected utility from adoption or non-adoption of the technology. Mango
farmers, the consumers of the fruit fly IPM package, are assumed to be rational with the
objective of maximizing expected utility from the fruit fly control strategies they adopt. A
farmer will therefore adopt the mango fruit fly IPM package or part of its components if the
expected utility of adoption is greater than that of non-adoption (Llewellyn et al., 2007).Since
the utility derived from the technologies is neither observable nor known to the analyst with
certainty, it is considered to be random (Fernandez-Cornejo, 1996). The utility associated
with adoption of the IPM package or conventional pesticides application is a function of the
possible outcome from adopting the specific technology, thus;
U0=f (b/x0) (3.1)
U1=f (b/x1) (3.2)
Where;
U0 and U1are utilities derived from not adopting IPM and adopting IPM respectively, X0 and
X1 are socio-economic, farm and institutional characteristics of the farmer respectively while
bsare the parameters that explain the effect of farmers’ characteristics on the utility.
Therefore a mango farmerwill adopt the fruit fly IPM package or part of its components
if (U1> U0), if the expected utility of adoption exceeds that of non-adoption. The utility
derived from choosing a given alternative, adoption or non-adoption, is not observable. What
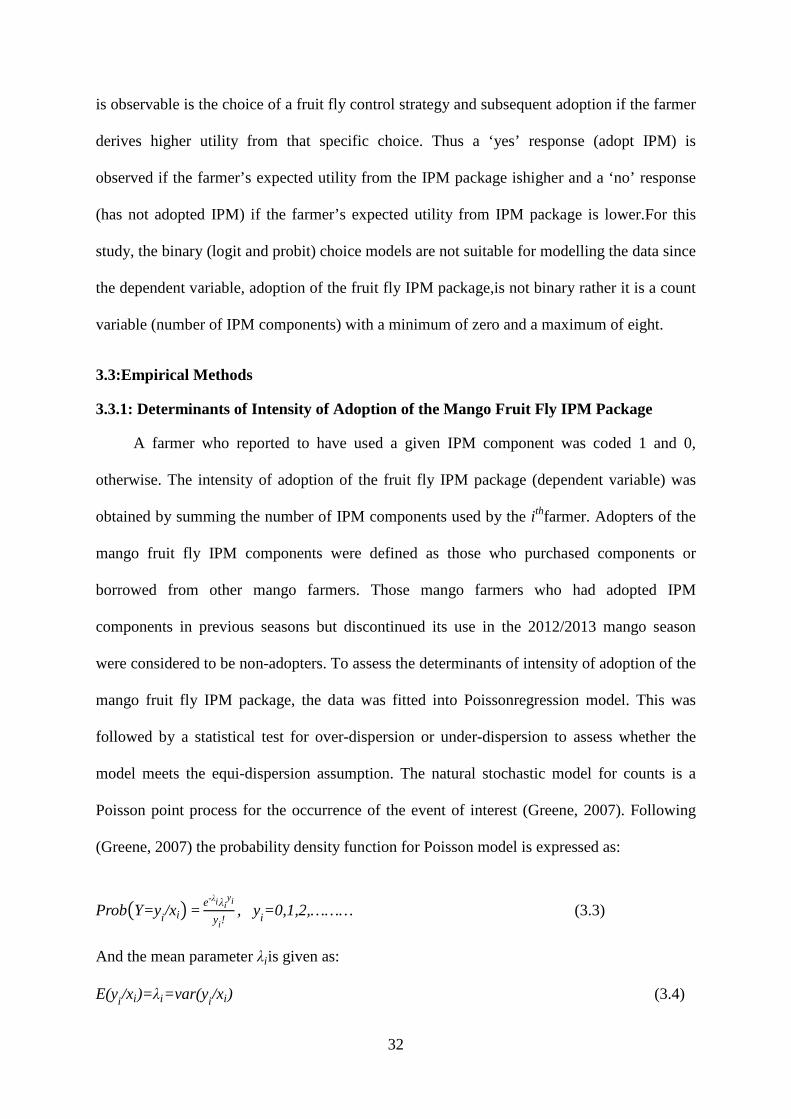
32
is observable is the choice of a fruit fly control strategy and subsequent adoption if the farmer
derives higher utility from that specific choice. Thus a ‘yes’ response (adopt IPM) is
observed if the farmer’s expected utility from the IPM package ishigher and a ‘no’ response
(has not adopted IPM) if the farmer’s expected utility from IPM package is lower.For this
study, the binary (logit and probit) choice models are not suitable for modelling the data since
the dependent variable, adoption of the fruit fly IPM package,is not binary rather it is a count
variable (number of IPM components) with a minimum of zero and a maximum of eight.
3.3:Empirical Methods
3.3.1: Determinants of Intensity of Adoption of the Mango Fruit Fly IPM Package
A farmer who reported to have used a given IPM component was coded 1 and 0,
otherwise. The intensity of adoption of the fruit fly IPM package (dependent variable) was
obtained by summing the number of IPM components used by the i thfarmer. Adopters of the
mango fruit fly IPM components were defined as those who purchased components or
borrowed from other mango farmers. Those mango farmers who had adopted IPM
components in previous seasons but discontinued its use in the 2012/2013 mango season
were considered to be non-adopters. To assess the determinants of intensity of adoption of the
mango fruit fly IPM package, the data was fitted into Poissonregression model. This was
followed by a statistical test for over-dispersion or under-dispersion to assess whether the
model meets the equi-dispersion assumption. The natural stochastic model for counts is a
Poisson point process for the occurrence of the event of interest (Greene, 2007). Following
(Greene, 2007) the probability density function for Poisson model is expressed as:
Prob�Y=yi/xi� =e-λiλi
yi
yi !, yi=0,1,2,……… (3.3)
And the mean parameter λi is given as:
E(yi /xi)=λi=var(yi/xi) (3.4)
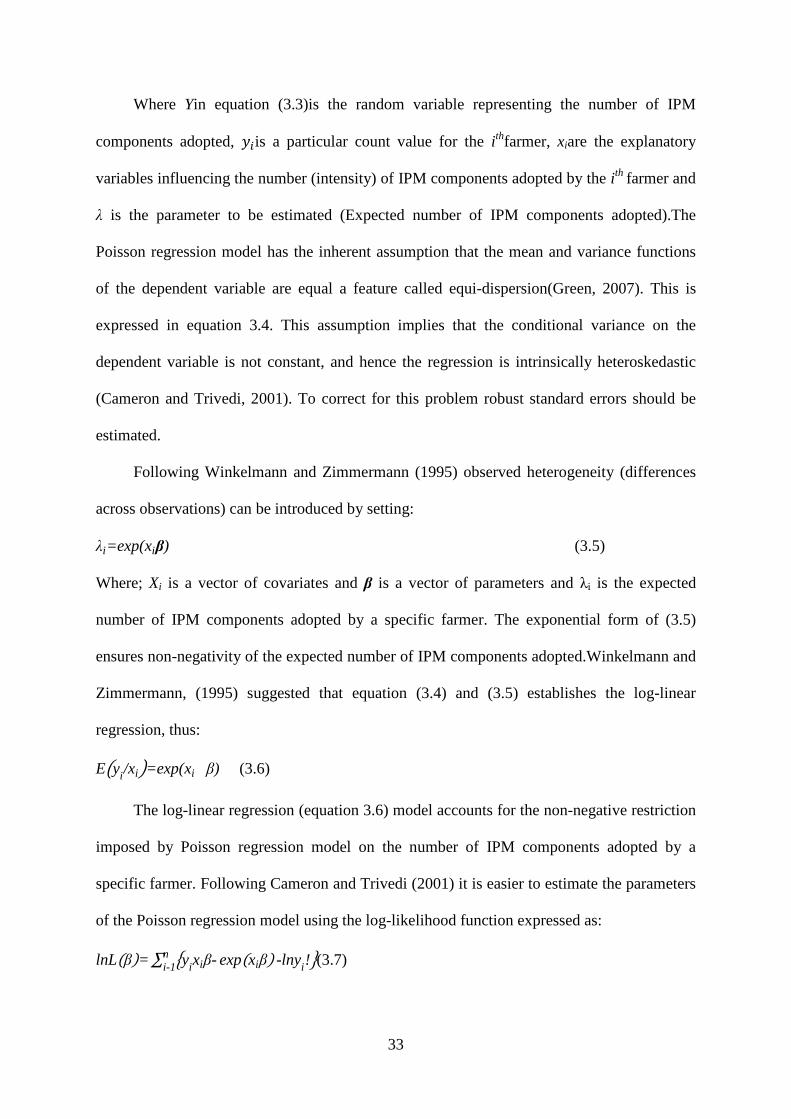
33
Where Yin equation (3.3)is the random variable representing the number of IPM
components adopted, ��is a particular count value for the i thfarmer, xiare the explanatory
variables influencing the number (intensity) of IPM components adopted by the i th farmer and
λ is the parameter to be estimated (Expected number of IPM components adopted).The
Poisson regression model has the inherent assumption that the mean and variance functions
of the dependent variable are equal a feature called equi-dispersion(Green, 2007). This is
expressed in equation 3.4. This assumption implies that the conditional variance on the
dependent variable is not constant, and hence the regression is intrinsically heteroskedastic
(Cameron and Trivedi, 2001). To correct for this problem robust standard errors should be
estimated.
Following Winkelmann and Zimmermann (1995) observed heterogeneity (differences
across observations) can be introduced by setting:
λi=exp(xiβ) (3.5)
Where; Xi is a vector of covariates and β is a vector of parameters and λi is the expected
number of IPM components adopted by a specific farmer. The exponential form of (3.5)
ensures non-negativity of the expected number of IPM components adopted.Winkelmann and
Zimmermann, (1995) suggested that equation (3.4) and (3.5) establishes the log-linear
regression, thus:
E�yi/xi�=exp(xi β) (3.6)
The log-linear regression (equation 3.6) model accounts for the non-negative restriction
imposed by Poisson regression model on the number of IPM components adopted by a
specific farmer. Following Cameron and Trivedi (2001) it is easier to estimate the parameters
of the Poisson regression model using the log-likelihood function expressed as:
lnL�β�= ∑ �yixiβ- exp�xiβ� -lnyi !ni-1 (3.7)

34
Where ��is a particular count value of the number of IPM components adopted by a particular
farmer, xiare the explanatory variables influencing the number (intensity) of IPM components
adopted by the particularfarmer, β is a vector of parameters, λ is the expected number of IPM
components adopted and n are the number of observations. The Poisson maximum likelihood
estimates (MLE) are given by the first order condition of equation (3.7), thus:
∑ �yi-exp(x'iβ)�xi=0ni=1 (3.8)
Since the Poisson regression model has exponential conditional mean, the marginal effects of
the estimated coefficients are given by:
δE(yi /xi)
δxj=βj exp(x'iβ) (3.9)
Where; the scalar xjdenotes the jth regressor, βj measures the relative change in E(yi/xi) given
a unit change in xj. Equation 3.9 is the estimating equation to identify the determinants of
intensity of adoption of the mango fruit fly IPM package.
3.3.2: Application of Poisson Regression in Agricultural Technology Adoption Studies
The Poisson regression model has been used in assessment of agricultural technology
adoption decisions. Ramirez and Shultz (2000) used the model to assess adoption of
agricultural and natural resource management technologies by farmers in Central American
countries. Similarly, Erbaugh et al.(2010) used the model to assess the impact of farmer field
school participation on IPM adoption in Uganda. Singhet al.(2008) also used the Poisson
regression to model adoption of IPM by cotton and paddy farmers in Punjab and Haryana
regions of India, respectively. The Poisson regression model was also used by Maumbe and
Swinton (2000) to assess the role of health risks and technology awareness on adoption of
IPM technologies by cotton farmers in Zimbabwe.

35
3.3.3: Limitations of the Poisson Regression Model
The Poisson regression model has been criticized for its assumption of equality of the
mean and variance functions of the number of IPM components adopted by a particular
farmer(Green, 2007). This implies that the conditional mean and the variance functions of the
regression are assumed to be equal (as expressed in equation 3.4). However, this restriction
does not always hold since for count data the variance usually exceeds the mean, a feature
called over dispersion (Cameron and Trivedi, 2001). Over-dispersion has qualitatively similar
consequences to the failure of the assumption of homoscedasticity in the linear regression
model; estimators are still unbiased but they are inefficient because they have inflated t-
statistics and standard errors get small (Cameron and Trivedi, 2001).
Presence of over-dispersion is also brought about by the Poisson regression model
assumption which states that occurrence of each event, such as adoption of one IPM
component, is independent from that of other events (Wilkelmann and Zimmermann,
1995).However, in reality past occurrences may influence future decisions or occurrences.
For example, a farmer’s decision to adopt a particular mango fruit fly IPM component may
be influenced by other components used in the past. Secondly, Poisson regression model
assumes that the Poisson process is a deterministic function of the predictor variables hence
does not allow for the unobserved heterogeneity (Wilkelmann and Zimmermann, 1995).
A count data model with over-dispersion specifies the over-dispersion to be of the form
(Cameron and Trivedi, 2001):
V(yi/xi)= µ i +αg(µi). (3.10)
Where g (·) is a known function, most commonly g (µ) =µ2 or g (µ) =µ and � is the
dispersion parameter, ��is a particular count value of the number of IPM components adopted
by a particular farmer and xiare the explanatory variables influencing the number (intensity)
of IPM components adopted by the particularfarmer. The null hypothesis H0:states that α=0
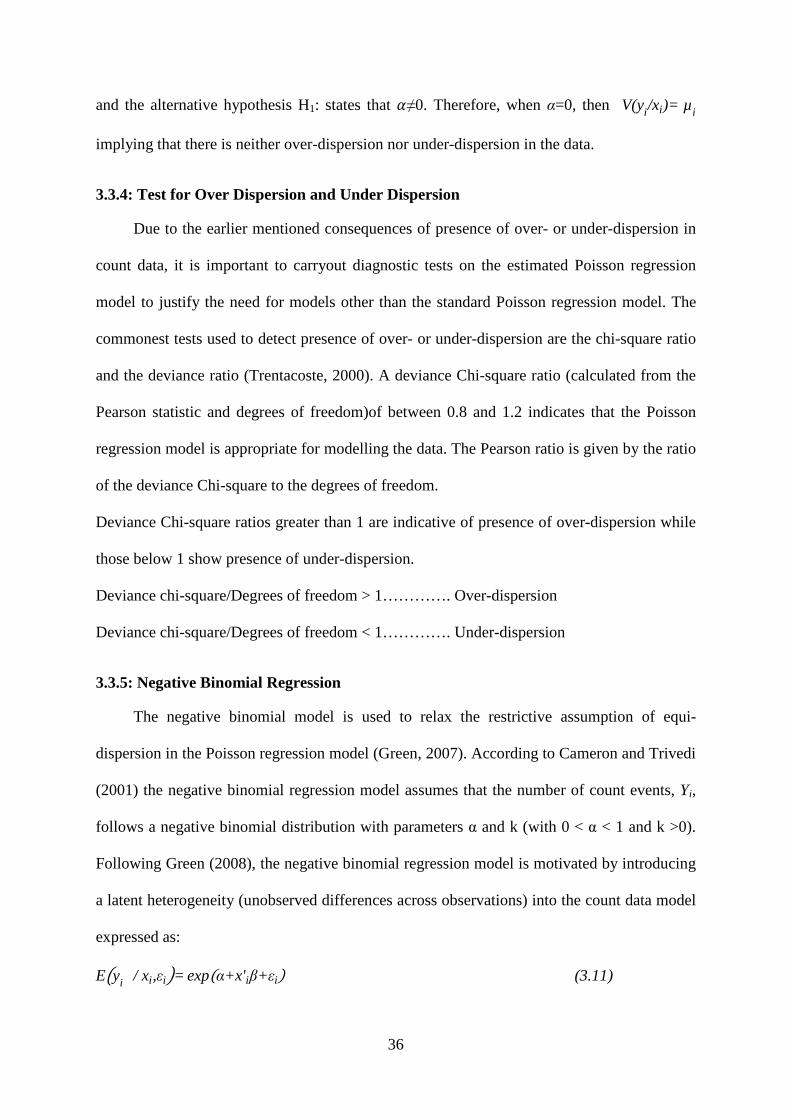
36
and the alternative hypothesis H1: states that �≠0. Therefore, when α=0, then V(yi/xi)= µ i
implying that there is neither over-dispersion nor under-dispersion in the data.
3.3.4: Test for Over Dispersion and Under Dispersion
Due to the earlier mentioned consequences of presence of over- or under-dispersion in
count data, it is important to carryout diagnostic tests on the estimated Poisson regression
model to justify the need for models other than the standard Poisson regression model. The
commonest tests used to detect presence of over- or under-dispersion are the chi-square ratio
and the deviance ratio (Trentacoste, 2000). A deviance Chi-square ratio (calculated from the
Pearson statistic and degrees of freedom)of between 0.8 and 1.2 indicates that the Poisson
regression model is appropriate for modelling the data. The Pearson ratio is given by the ratio
of the deviance Chi-square to the degrees of freedom.
Deviance Chi-square ratios greater than 1 are indicative of presence of over-dispersion while
those below 1 show presence of under-dispersion.
Deviance chi-square/Degrees of freedom > 1…………. Over-dispersion
Deviance chi-square/Degrees of freedom < 1…………. Under-dispersion
3.3.5: Negative Binomial Regression
The negative binomial model is used to relax the restrictive assumption of equi-
dispersion in the Poisson regression model (Green, 2007). According to Cameron and Trivedi
(2001) the negative binomial regression model assumes that the number of count events, Yi,
follows a negative binomial distribution with parameters α and k (with 0 < α < 1 and k >0).
Following Green (2008), the negative binomial regression model is motivated by introducing
a latent heterogeneity (unobserved differences across observations) into the count data model
expressed as:
E�yi / xi,εi�= exp�α+x' iβ+εi� (3.11)

37
Where; εi represent the specification error or cross-sectional heterogeneity that normally
characterizes micro economic data,� is the dispersion parameter,�i is the disturbance, ��is a
particular count value for a particular farmer and xiare the explanatory variables influencing
the number (intensity) of IPM components adopted by the particularfarmer.
3.3.6: Factors Influencing Pesticide Misuse among Mango Farmers in Embu East Sub-County
The pesticide misuse assessed in this study were; increasing frequency of
pesticidespraying, overdosing pesticideconcentration, and use of unrecommended or banned
pesticide brands (Muchiri, 2012andRashid et al.,2003). A mango farmer who used any one or
a combination of these pesticides application practices was coded 1 and those who did not
use were coded 0. Analysis of such dichotomous choices where the dependent variable takes
on a binary response is usually done using logit or probit models (Odendo et al., 2009).
Although the probit and logit models yield almost similar results, the probit model assumes
normally distributed error term while the logit model assumes a logistic distribution of the
error term. The logit model is often preferred due to its comparative mathematical simplicity
(Gujarati, 2003).
Following (Greene, 2007) the general logit model and the probability of pesticide
misuse by sampled mango farmerare expressed as:
pr(Yi=1/Xi )=expX
'β
1+ exp�X'β�=Ʌ(X'β) (3.16)
Where Ʌ denotes the cumulative logistic distribution function, β’ is a vector of
parameter and X’ is a vector of explanatory variables influencing pesticides misuse. The logit
model (3.16) is estimated using maximum likelihood (MLE) which gives unbiased and
efficient estimates of the probability that the dependent variable will take on the dichotomous
values (Gujarati, 2003). Generally, MLE finds the function that maximizes the ability to
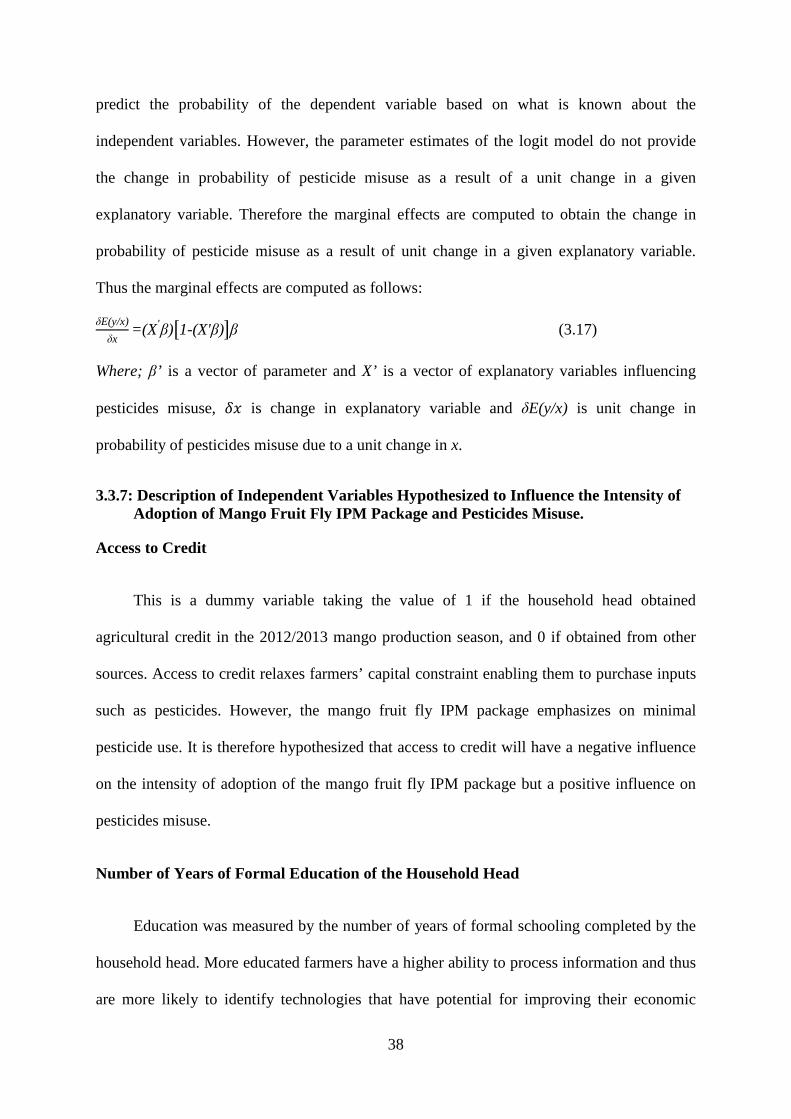
38
predict the probability of the dependent variable based on what is known about the
independent variables. However, the parameter estimates of the logit model do not provide
the change in probability of pesticide misuse as a result of a unit change in a given
explanatory variable. Therefore the marginal effects are computed to obtain the change in
probability of pesticide misuse as a result of unit change in a given explanatory variable.
Thus the marginal effects are computed as follows:
δE(y/x)
δx=(X'β) 1-(X'β)�β (3.17)
Where; β’ is a vector of parameter and X’ is a vector of explanatory variables influencing
pesticides misuse, �� is change in explanatory variable and δE(y/x) is unit change in
probability of pesticides misuse due to a unit change in x.
3.3.7: Description of Independent Variables Hypothesized to Influence the Intensity of Adoption of Mango Fruit Fly IPM Package and Pesticides Misuse.
Access to Credit
This is a dummy variable taking the value of 1 if the household head obtained
agricultural credit in the 2012/2013 mango production season, and 0 if obtained from other
sources. Access to credit relaxes farmers’ capital constraint enabling them to purchase inputs
such as pesticides. However, the mango fruit fly IPM package emphasizes on minimal
pesticide use. It is therefore hypothesized that access to credit will have a negative influence
on the intensity of adoption of the mango fruit fly IPM package but a positive influence on
pesticides misuse.
Number of Years of Formal Education of the Household Head
Education was measured by the number of years of formal schooling completed by the
household head. More educated farmers have a higher ability to process information and thus
are more likely to identify technologies that have potential for improving their economic

39
gains (Abdulai and Huffman, 2005). Furthermore, IPM is a complex, knowledge and
information intensive technology which requires skill to implement and to integrate the
various components that constitute the IPM package (Fernandez-Cornejo and Ferraioli,
1999). The variable is therefore hypothesized to have a positive influence on the intensity of
adoption of the mango fruit fly IPM package. Similarly, more educated farmers are more
likely to understand the health hazards caused by pesticide application and consequently are
less likely to engage in pesticides overuse. Therefore, education is hypothesized to have a
negative influence on pesticides misuse.
Age of the Household Head
Ageis a discrete variable. Older farmers are more experienced andare more likely to
have greater access to capital (Lapar and Pandey, 1999; Abdulai and Huffman 2005).
However, younger farmers are more innovative and consequently may easily try innovative
technologies such as the mango fruit fly IPM package (Adesina and Baidu-Forson, 1995).
The variable can thus have a positive or a negative effect on the intensity of adoption of the
mango fruit fly IPM package. Older mango farmers are more susceptible to health hazards
associated with pesticides spraying compared to younger farmers. Therefore it is expected
that age of the household head will have a negative influence on pesticides misuse.
Gender of the Household Head
Gender of the household head is a dummy variable taking 1 if the household is a man
headed and 0 if a woman. Men have more access to and own more resources such as, land
and financial production resources than women (Kaliba et al., 2000). It is therefore
hypothesized that gender of the household head will have a positive influence on the intensity
of adoption of the mango fruit fly IPM package. Women are more prone to health hazards

40
associated with pesticides spraying compared to men. It is therefore hypothesized that gender
will have a negative influence on pesticides misuse.
Membership in Agricultural Group
The dummy variable took the value of 1 if the respondent is a member of an
agricultural group and 0 if not a member. Agricultural groups provide social network
platforms within which participants share new information and experiences such as IPM
strategies and proper pesticides use. It is thus hypothesised that the membership will have a
positive influence on the intensity of adoption of the mango fruit fly IPM package but a
negative influence on pesticides misuse.
Number of Mature Mango Trees Planted
This is a discrete variable used as a measure of the scale of mango production. Farmers
who allocate more land to a givencrop enterprises are presumed to be commercial oriented
and rank that enterprise higher in importance than farmerswho allocate smaller pieces of land
(Erbaugh et al., 2010 and Isgin et al., 2008). Consequently, mango farmers who have larger
orchards are more likely to adopt more effective pest control practices such as the IPM
package to improving fruit fly control effectiveness. This variable is therefore expected to
have a positive influence on the intensity of adoption of the mango fruit fly IPM package.
Similarly, farmers operating larger mango orchards are likely to incur high pesticide
application labour cost compared to those with fewer mango trees. Therefore it is
hypothesized that the number of mature mango trees planted will have a negative influence
on pesticides misuse.
41
Occupation of the Household Head
The dummy variable took the value of 1 if the respondent is a full time famer and 0 if
the respondent engages in off-farm activities. Off farm activities such as salaried employment
earn the farmers extra income which enables them to purchase pest control inputs such as
pesticides. However, farmers who engage in these off farm activities devote less time to their
farms yet IPM is a knowledge and information intensive technology (Raghu et al., 2014 and
Isgin et al., 2008). This variable is therefore expected to have a positive influence on the
intensity of adoption of the mango fruit fly IPM package.
Full time farmers are most likely to undertake all orchard management practices such as
pesticide spraying without hiring other people compared to those who have off-farm
employment. Therefore, such farmers are directly exposed to health hazards of pesticides
spraying and are less likely to overuse pesticides compared to those who engage in off-farm
activities and hire other people to spray their mangoes. It is therefore hypothesized that
occupation of the household head will have a negative influence on pesticides misuse.
Access to Agricultural Extension Services
The dummy variable took the value of one if the farmer had accessed formal
agricultural extension services and zero if they did not. Extension workers transfer
knowledge from researchers to farmers andadvice farmers on new technologies (Raghu et al.,
2014).Access to agricultural extension service enhances dissemination of information about
the mango fruit fly IPM package. This study therefore hypothesizes that access to extension
services will have a positive influence on intensity of adoption of the mango fruit fly IPM
package. However, this variable is hypothesized to have a negative influence on pesticide
misuse since farmers who interact with extension officers are likely to obtain information on
proper pesticides use practices.
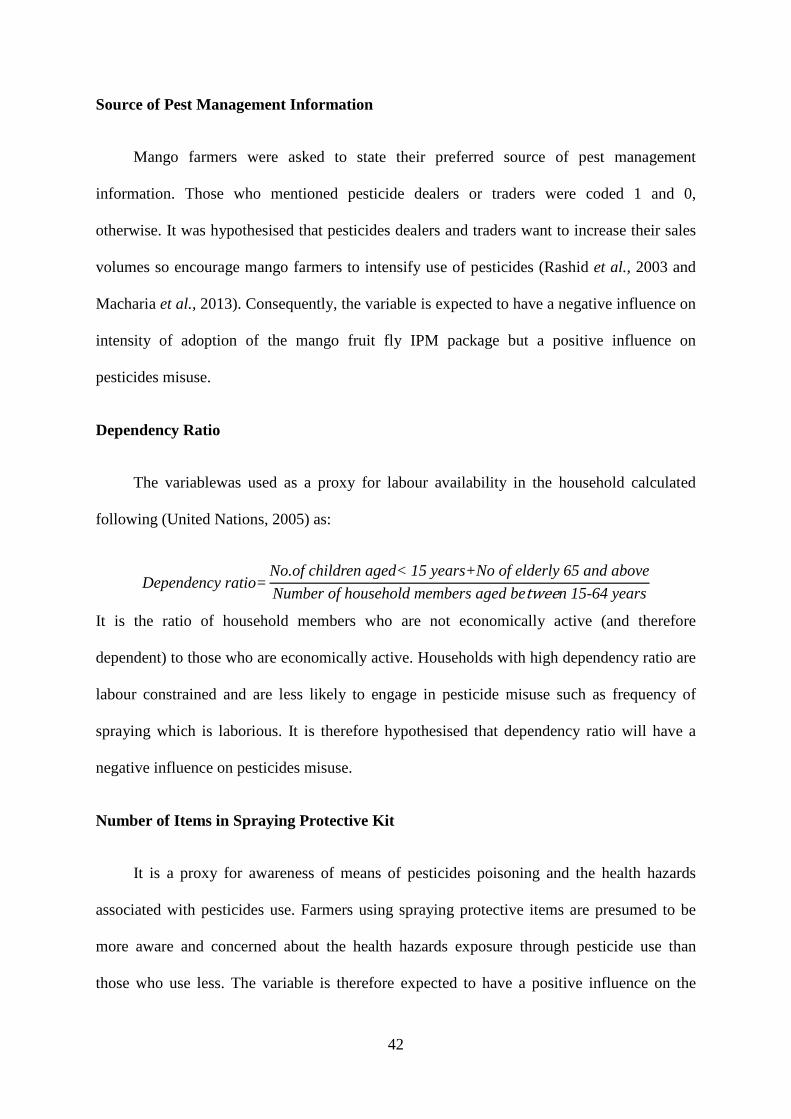
42
Source of Pest Management Information
Mango farmers were asked to state their preferred source of pest management
information. Those who mentioned pesticide dealers or traders were coded 1 and 0,
otherwise. It was hypothesised that pesticides dealers and traders want to increase their sales
volumes so encourage mango farmers to intensify use of pesticides (Rashid et al., 2003 and
Macharia et al., 2013). Consequently, the variable is expected to have a negative influence on
intensity of adoption of the mango fruit fly IPM package but a positive influence on
pesticides misuse.
Dependency Ratio
The variablewas used as a proxy for labour availability in the household calculated
following (United Nations, 2005) as:
Dependency ratio=No.of children aged< 15 years+No of elderly 65 and above
Number of household members aged between 15-64 years
It is the ratio of household members who are not economically active (and therefore
dependent) to those who are economically active. Households with high dependency ratio are
labour constrained and are less likely to engage in pesticide misuse such as frequency of
spraying which is laborious. It is therefore hypothesised that dependency ratio will have a
negative influence on pesticides misuse.
Number of Items in Spraying Protective Kit
It is a proxy for awareness of means of pesticides poisoning and the health hazards
associated with pesticides use. Farmers using spraying protective items are presumed to be
more aware and concerned about the health hazards exposure through pesticide use than
those who use less. The variable is therefore expected to have a positive influence on the

43
intensity of adoption of the mango fruit fly IPM strategies since farmers who are aware about
pesticides health hazards are more likely to seek alternative pest management practices such
as IPM. It is also hypothesized to have a positive influence on pesticide misuse since farmers
who use this gear feel protected from exposure to pesticides hazards hence may engage in
pesticides overuse with reduced fear of poisoning.
Distance to Mango Input Market
The variable was measured in kilometres(KM) between the respondent’s farm and the
nearest mango inputs market. It is used as a proxy for ease of access to information and to
purchased farm inputs such as pesticides. This study hypothesizes that farmers situated
farther away from input markets are more likely to adopt the mango fruit fly IPM
components such as orchard sanitation to substitute for pesticides which they cannot readily
access. The variable is expected to have a positive influence on the intensity of adoption of
the mango fruit fly IPM package. On the contrary, distance to the nearest input market is
hypothesized to have a negative influence on pesticide misuse since longer distances
increases the transaction costs of accessing pesticides which consequently discourage
pesticide overuse. In addition, mango farmers whose orchards are situated far away from
input markets have less access to information on proper pesticides use and are more likely to
engage inpesticides misuse.
Empirical model for intensity of adoption of the mango fruit fly IPM package
Y = βᴑ + β1GENDR + β2AGE + β3EDUC + β4LNTREES + β5MRKTDIST + β6CLOTHNG +
β7CRDT + β8EXTN+ β9OCCPN + β10GROUP+β11 PSTINFOSRCE +µ.

44
The factors hypothesized to influence the intensity of adoption of the mango fruit fly IPM are
described in table 3.1 below.
Table 3.1:Variables hypothesized to influence the intensity of adoption of the mango fruit fly IPM package
Variable Definition and measurement Expected sign
Dependent Variable: Number of mango fruit IPM strategies used
GNDR Gender (1 = male, 0 = Female) + AGE Age of household head in years (in years) ± EDUC Education (Years of formal schooling completed) + TREES Number of mature mango trees planted ± MRKTDST Distance to nearest IPM trial orchard (KMs) + CLOTHNG Number of spraying protective clothing used (Discrete) +
CRDT Agricultural Credit received in 2012/2013 season. (Dummy, 1= Yes, 0= No) -
OCCPN Occupation (Dummy, 1=Fulltime farmer, 0=Otherwise) + EXTN Access to extension service (Dummy, 1= Yes, 0= No) +
GRUP Agricultural group membership (dummy, 1=Member, 0= Non-member) +
PSTINFOSRCE
Source of pest management information (Dummy, 1= Pesticide dealer, 0= other source) -
Table 3.2: Variables hypothesized to influence pesticide misuse among sampled mango farmers
Variable Definition and measurement Expected sign
Dependent Variable: pesticide misuse (1=Yes, 0=No) GNDR Gender (1 = Male, 0 = Female) + AGE Age of household head (Years) ± DEPERTIO Dependency ratio (continuous) - EDUC Education (Years of formal schooling completed) + TREES Number of mature mango trees planted (Discrete) ± MRKTDST Distance to nearest market (KMs) + ADPTIPM Adopt mango fruit fly IPM (Dummy, 1=Yes, 0= No) - CRDT Access agricultural credit (Dummy, 1=Yes, 0=No) +
INFO Source of information on pesticide use (1 = Pesticide dealer, 0= otherwise) +
CLOTHNG Number of spraying protective clothing. (Discrete) + EXTN Extension (Dummy, 1=Yes, 0=No) +
GRUP Agricultural group Membership (Dummy, 1=member, 0 = Non-member) +

45
Empirical model for pesticide misuse
Y=β0+β1GNDER+β2AGE+β3DEPERTIO+β4EDUC+β5TREES+β6MRKTDIT+β7GRUP
+β8ADPTIPM+β9CRDT+β10PSTINFOSRCE+β11CLOTHNG+β12EXTN+µ
3.4: Sampling Design and Data Collection
3.4.1: Sampling Design
A combination of purposive and multi-stage random sampling procedure was used to
select a sample of mango farmers to be interviewed. In the first stage, Runyenjes and Kyeni
divisions in Embu East sub-County were purposively selected since they are the major mango
producing areas in the County. In the second stage, three locations, Kyeni South, Kyeni East
and Kagaari South, were also purposively selected since they are also the main mango
producing locations in the two divisions. In the third stage, 10 sub-locations in the three
locations were also purposively selected based on their level of mango production. These
sub-locations were; Karurumo, Kasafari and Kathanjuri in Kyeni South location, Kigumo and
Mukuria in Kyeni East location and Nthagaiya, Gichera, Kiringa, Kanduri and Kigaa in
Kagaari south location.
The sample size was determined using the Cochran approach as shown below
(Cochran, 1963).
�� = ����
�� (3.18)
Where; n is the desired sample size, z isthe standard normal deviate at the selected confidence
level; in this case 1.96 for 95percent confidence interval, p is the proportion of mango
farmers in the population (taken as 0.5 when the exact proportion of the farmers is not
known), q isthe proportion of mangoes who did not grow mangoes (1-p) and e is the desired
level of precision (5percent). The calculated minimum sample size was;
� =1.96 ∗ 0.5 ∗ 0.5
0.05 = 384
46
Although the calculated sample size was 384, a sample of 805farmers was used since
funds allowed the researcher to contact such a high number of farmers. In addition, the large
sample size was necessary since the IPM package was newly introduced in the study area and
findings from focus group discussion indicated that some components of the package were
not readily available in the local farm input stores. The large sample would therefore give a
better measure of the intensity of adoption of the mango fruit fly IPM package in the study
area. A sampling frame of 1000 names of farmers was compiled with the assistance of ICIPE
staff, divisional agricultural officer based in Kyeni and Runyenjes divisions and village elders
consisting of 600 participants in the ICIPE mango fruit fly IPM package trials project and
400 non-participants.
Using research randomizer, a sample size of 450 respondents was randomly drawn
from the trials project participants sampling frame and 360 from non-participants sampling
frame. However, during the survey three farmers in the participants list and two non-
participants declined to participate in the survey and were dropped leaving a sample of 447
participants and 358 non-participants. Other studies on adoption of IPM have used smaller
sample sizes such as; Erbaugh et al.,(2010) used 180 respondents; Blake et al.,(2007) used
243 respondents; Singhet al.,(2008) used 178 respondents. However, Frisvold et al., (2010)
used a slightly higher sample size of 1,205 respondents to study adoption of best management
practices for weed control in corn.
3.4.2 Data collection
Interview based survey was conducted using a semi-structured questionnaire to collect
data pertaining to the 2012/2013 mango season. The survey was conducted between
November and December, 2013 to obtain primary data on farmers’ demographics, socio-
economic characteristics, their mango production and marketing constraints, mango output
47
and sales, fruit fly control strategies adopted, mango production costs as well as source of
information on mango pest and disease control.
3.4.2: Data Analysis
The data collected from 805 mango farmers was cleaned before analysis to ensure
validity. Descriptivestatistics such as percentages and means were computed for different
variables. In addition, t-test, negative binomial and logistic regressionmodels were used to
assess the statistical difference in continuous variables between adopters and non-adopters,
intensity of adoption of mango fruit fly IPM package and pesticide misuse among mango.
Software used for data analyses were Excel for descriptive analysis and STATA version 12
for quantitative analysis.
3.4.3: Econometric Models Diagnostic Tests
In addition to the test for presence of over or under-dispersion, other model diagnostic
tests were performed to test the degree of correlation among variables (multicollinearity) and
therelationship between random terms across observations (Heteroscedasticity).
Heteroskedasticity
One of the assumptions of ordinary least square model is that the variance of the error
term is constant or homogenous across observations (Greene, 2007). However, when this
assumption is violated the error terms are said to be (Heteroscedastic). Presence of
heteroscedasticity leads to large standard errors which in turn lead to small t-value leading to
the researcher to fail to reject the null hypothesis erroneously. Test for the presence of
heteroscedasticity was done using the Breusch-Pagan and Cook-Weisberg test. The
specification tests the null hypothesis that, the error term variances of the error terms are all
constant against the alternative that the error terms variances are not constant across the
observations. The test was implemented using the hettest command in STATA version 12.
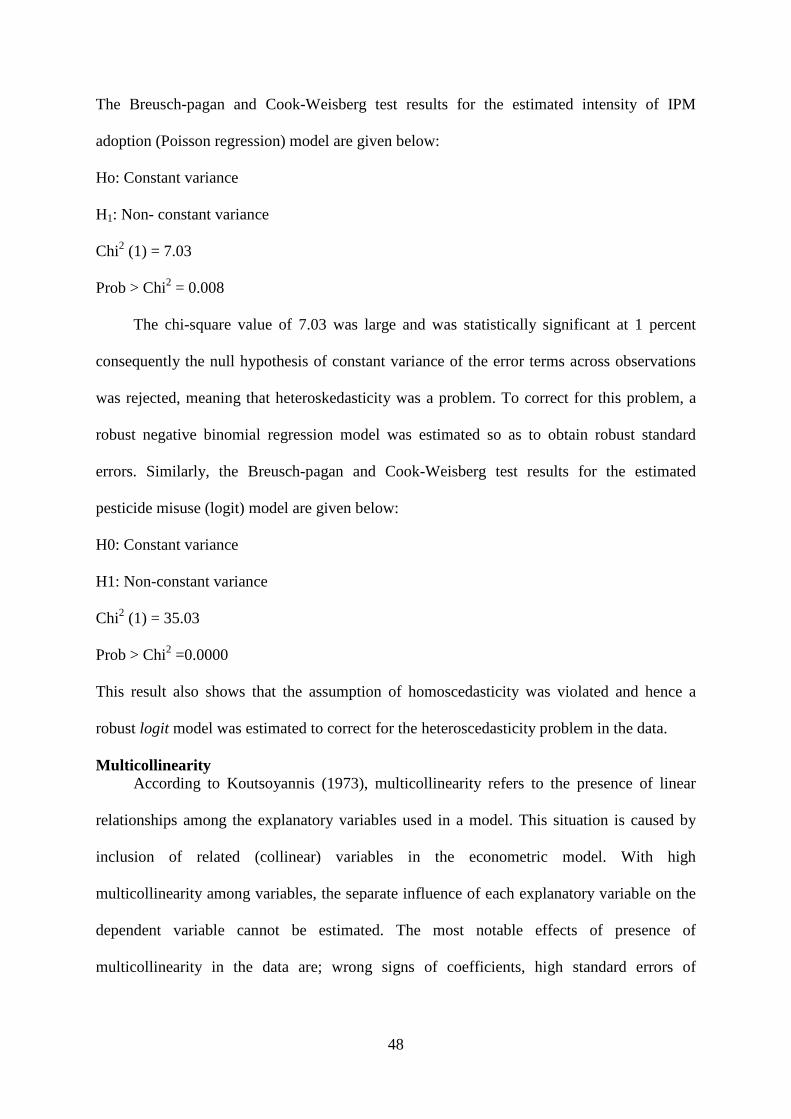
48
The Breusch-pagan and Cook-Weisberg test results for the estimated intensity of IPM
adoption (Poisson regression) model are given below:
Ho: Constant variance
H1: Non- constant variance
Chi2 (1) = 7.03
Prob > Chi2 = 0.008
The chi-square value of 7.03 was large and was statistically significant at 1 percent
consequently the null hypothesis of constant variance of the error terms across observations
was rejected, meaning that heteroskedasticity was a problem. To correct for this problem, a
robust negative binomial regression model was estimated so as to obtain robust standard
errors. Similarly, the Breusch-pagan and Cook-Weisberg test results for the estimated
pesticide misuse (logit) model are given below:
H0: Constant variance
H1: Non-constant variance
Chi2 (1) = 35.03
Prob > Chi2 =0.0000
This result also shows that the assumption of homoscedasticity was violated and hence a
robust logit model was estimated to correct for the heteroscedasticity problem in the data.
Multicollinearity According to Koutsoyannis (1973), multicollinearity refers to the presence of linear
relationships among the explanatory variables used in a model. This situation is caused by
inclusion of related (collinear) variables in the econometric model. With high
multicollinearity among variables, the separate influence of each explanatory variable on the
dependent variable cannot be estimated. The most notable effects of presence of
multicollinearity in the data are; wrong signs of coefficients, high standard errors of

49
coefficients, and high R-squarevalue even when individual parameter estimates are not
significant (Gujarati, 2003).
To check for presence of multicollinearity, the variance inflation factor (VIF) for each
variable was assessed. Following Gujarati(2003), if the variance inflation factor (VIF) of a
variable exceeds 10, that variable is said to be highly collinear and can be excluded from the
model.
Table 3.3: Variance inflation factors for explanatory variables used in the intensity of adoption of IPM model
Variable VIF Gender of the household head 1.05 Age of the household head 1.13 Years of formal schooling completed 1.19 Number of mature mango trees planted 1.17 Distance to the nearest inputs market 1.02 No of spraying protective clothing 1.18 Access to credit 1.02 Access to agricultural extension services 1.15 Occupation of the household head 1.08 Membership to agricultural group 1.08 Source of pest management information 1.14 Mean VIF 1.11 Source: Author's computation Table 3.4: Variance inflation factors for explanatory variables used in the pesticide
misuse model: Variable VIF Number of mature mango trees planted 1.19 Years of formal schooling completed 1.18 Number of spraying protective clothing used 1.20 Age of the household head 1.16 Distance to the market 1.02 Access to credit 1.02 Adopt at least one IPM component 1.13 Access to agricultural extension services 1.16 Dependency ratio 1.08 Gender of the household head 1.06 Membership to agricultural group 1.07 Source of pest management information 1.13 Mean VIF 1.12 Source: Author's computation

50
The variance inflation factor, VIF is calculated as;
'()*+= ,
�,-./��
(3.19)
Where; ki is the kthexplanatory variable regressed on the other explanatory variables. 0* is
equal to the R2of the auxiliary regression (obtained when the kthregressor is regressed on the
remaining variables). None of the variables had a VIF greater than 10 and the mean VIF was
1.11 (Table 3.4) indicating that there was no serious problem of multicollinearity among the
explanatory variables. Similarly, in the pesticide misuse model none of the variables had a
variance inflation factor greater than 10 and the mean VIF was 1.12.
3.5: Study Area
This study was conducted in Embu East Sub-County (formerly Embu East district)
comprising of two divisions namely; Runyenjes and Kyeni divisions. The sub-County lies
between 1000 – 2070 meters above sea level and has a total area of 253.4 square kilometres
of which 177.3 square kilometres is arable land. According to 2009 national population and
housing census, the study area had a total population of 115,128 persons and average family
size of six persons, which is comparable to that of similar areas.
The agro-ecology of the study is heavily influenced by Mount Kenya and Nyandarua
Ranges with fertile and well drained soils well suited for tea and coffee growing. Rainfall in
the area is bimodal with long rains season in March to June and short rains in October to
December, ranging between 800mm – 1500mm annually. The soils are generally fertile, well
drained, deep, dark reddish brown to dark brown friable clay with humic top soils mainly
humic nitisols and andosols (Jaetzold et al., 2006).
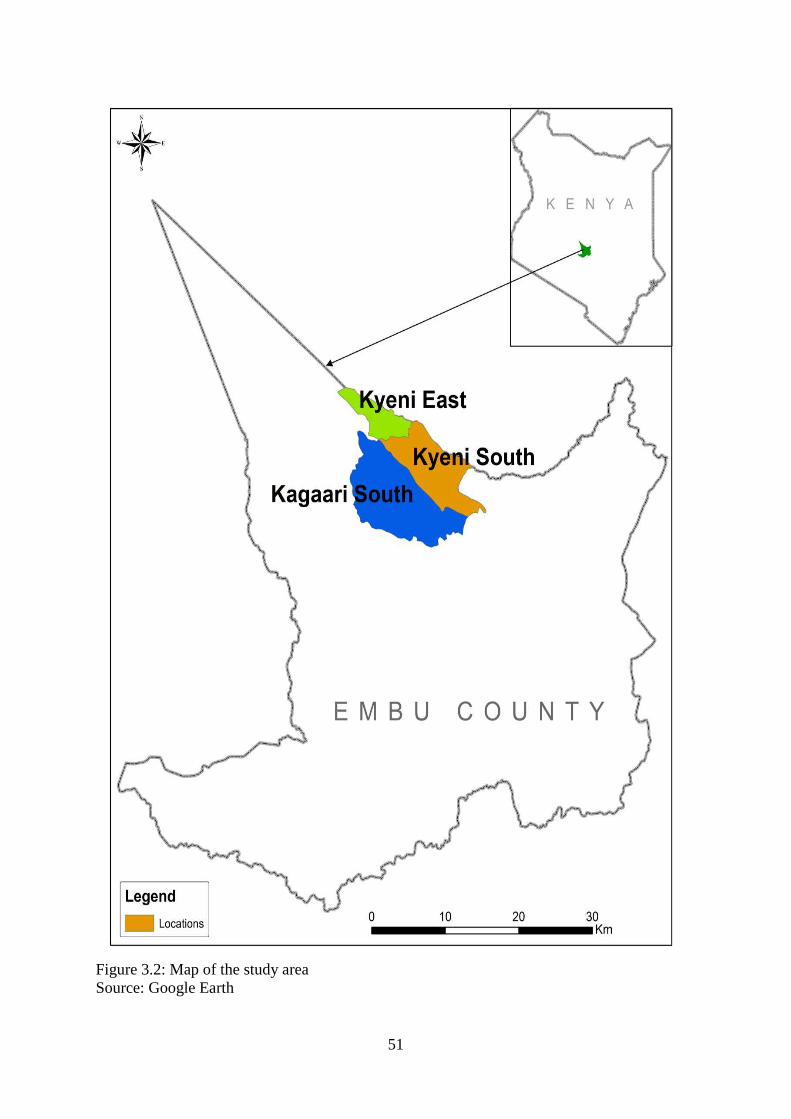
51
Figure 3.2: Map of the study area Source: Google Earth

52
CHAPTER 4: RESULTS AND DISCUSSION
Introduction
The chapter starts by discussing the socio-economic characteristics of mango farmers as
well as their mango fruit fly IPM adoption patterns. Subsequently, the results of thePoisson
regression and logit models are presented to assess the determinants of intensity of adoption
of the mango fruit fly IPM package and pesticide misuse respectively.
4.1: Socio-Economic and Demographic Characteristics of Sampled Mango Farmers.
Majority of the households were headed by men (88 percent) while about 12 percent
were headed by women (Table 4.1). The average household size was 5 persons with an
average dependency ratio of 45.52 percent implying that level of dependency was almost
half. The age of the household head ranged from 19 to 91 years with an average of about 54
years, an indication of aging mango farmers who are faced with labour constraint for
managing mango orchards.However, the average number of years of growing mangoes (taken
as a proxy for experience) was 14.3. The implication of this result is that farmers have grown
mangoes long enough to appreciate the difficulty of controlling mango fruit fly using
pesticides alone. The average number of years of formal education completed among the
sampled farmers was 9.24, indicating a fairly good level of literacy.
The average land size per household was 3.9 acres in which they kept livestock and
produced subsistence crops. The average number of farm enterprises practiced by the
sampled mango farmers was 7. On average, sampled farmers allocated 1.13 acres (28
percent) of their total land holdings to mango orchards with an average of 128 mature mango
trees, suggesting that mango farming is an important enterprise in the study area. Only about
30 percent of these farmers operated pure stand mango orchard while the rest intercropped
mangoes with annual crops particularly maize, beans and millet. Only 15 percent of the
sampled farmers were members of any agricultural group(s) while the mean frequency of
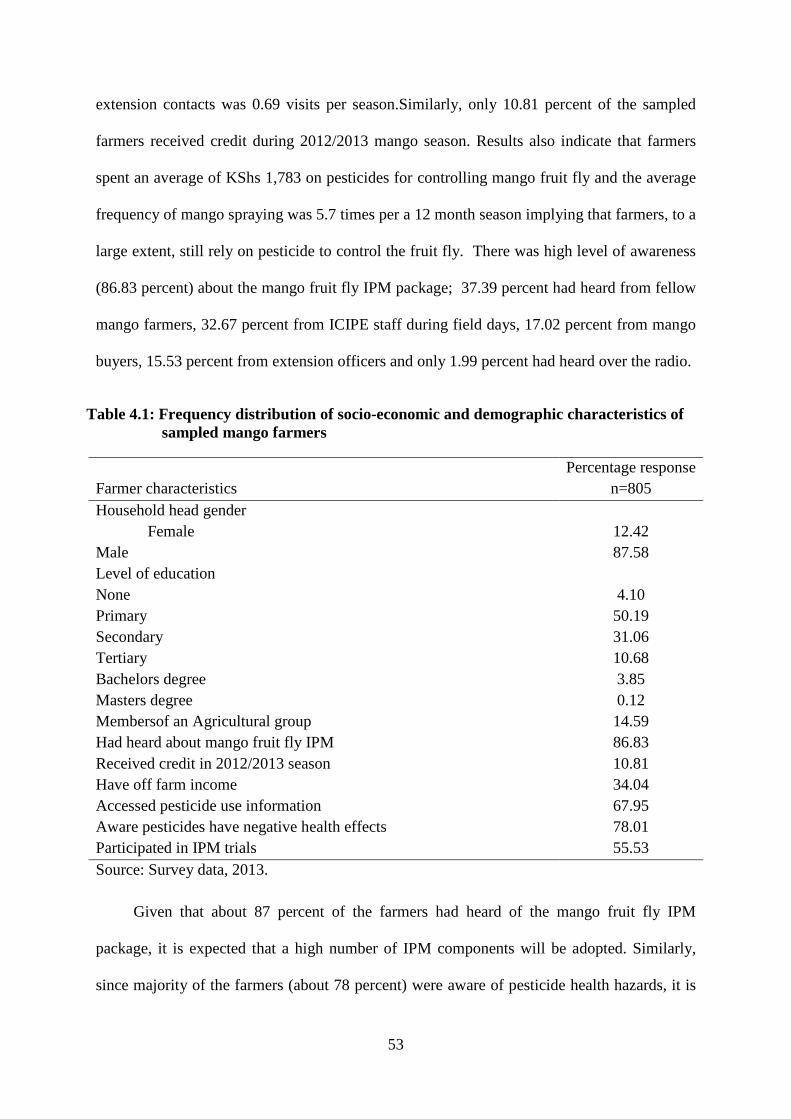
53
extension contacts was 0.69 visits per season.Similarly, only 10.81 percent of the sampled
farmers received credit during 2012/2013 mango season. Results also indicate that farmers
spent an average of KShs 1,783 on pesticides for controlling mango fruit fly and the average
frequency of mango spraying was 5.7 times per a 12 month season implying that farmers, to a
large extent, still rely on pesticide to control the fruit fly. There was high level of awareness
(86.83 percent) about the mango fruit fly IPM package; 37.39 percent had heard from fellow
mango farmers, 32.67 percent from ICIPE staff during field days, 17.02 percent from mango
buyers, 15.53 percent from extension officers and only 1.99 percent had heard over the radio.
Table 4.1: Frequency distribution of socio-economic and demographic characteristics of sampled mango farmers
Farmer characteristics Percentage response
n=805 Household head gender Female 12.42 Male 87.58 Level of education None 4.10 Primary 50.19 Secondary 31.06 Tertiary 10.68 Bachelors degree 3.85 Masters degree 0.12 Membersof an Agricultural group 14.59 Had heard about mango fruit fly IPM 86.83 Received credit in 2012/2013 season 10.81 Have off farm income 34.04 Accessed pesticide use information 67.95 Aware pesticides have negative health effects 78.01 Participated in IPM trials 55.53 Source: Survey data, 2013.
Given that about 87 percent of the farmers had heard of the mango fruit fly IPM
package, it is expected that a high number of IPM components will be adopted. Similarly,
since majority of the farmers (about 78 percent) were aware of pesticide health hazards, it is

54
expected that a high number of IPM components will be adopted since IPM emphasize on
minimal pesticide use.
Table 4.2: Socio-economic and demographic characteristics of sampled mango farmers
Mean Std deviation
Farmers’ characteristics
Age of household head 54 12.33
Years of formal education completed 9.2 4.24
Dependency ratio 45.52 52.69
Experience in mango farming (years) 14.3 6.54
Farmers’ farming characteristics
Number of mango trees planted 128 469.86
Mango gross margin in 2012/2013 mango season 25,379 47866
Mango gross margin per tree in 2012/2013 season 287 452.25
Distance to the nearest mango inputs market (KMs) 3.8 4.66
No. of fruit fly IPM components adopted, out of 8. 0.80.78
Mango spraying frequency 5.04 4.24
Number of spraying protective clothing used. 1.69 1.77
Total Number of farm enterprises practiced 6.64 2.13
Total value of household assets (KShs) 65,684 309299
Household size 5.3 2.21
Total land size in acres 3.86 4.21
Extension contact frequency 0.69 2.55
Pesticides expenditure in 2012/2013 mango season. 1,783 2814.04
Source: Survey data, 2013
The mean years of formal education completed by the household head of 9 years is an
indication of fairly good literacy levels and hence high intensity of adoption of the package is
expected among the sampled farmers. Formal education enables farmers to obtain and

55
critically assess information under uncertainty and hence improve their trust on information
intensive technologies such as IPM developed through research.
The mean mango farming experience of 14.3 years implies that majority of sampled
farmers have grown mangoes long enough to appreciate the difficulty of controlling the fruit
fly using conventional pesticides only and hence high intensity of IPM adoption is likely to
be recorded. Discussion with key informants and lead mango farmers, who have grown
mangoes for a long time, revealed that farmers were of the opinion that pesticides use by
itself was ineffective against the fruit fly. The mean household dependency ratio of 45.52
percent indicates that approximately half of the sampled farmers are of working-age (between
15 to 64 years) and supporting the other half of the dependent population, who are either
children (aged below 15 years) or elderly (65 and years above). Low intensity of adoption of
the IPM package is therefore expected because some IPM components such as burying fallen
fruit and burning fallen fruits arelabourintensive components.
The low average number of spraying gear (1.69) is indicative of low level of awareness
of pesticides related health hazards and therefore low intensity of adoption is expected.
Human pesticides poisoning occurs via four main avenues namely; ingestion, inhalation,
dermal absorption and absorption through the eyes (Okello, 2005). Farmers who are aware of
pesticides hazards and means of exposure are more likely to use more pesticides spraying
protective clothing such as; gloves, goggles, gumboots, overall jackets and spraying masks.
In addition, mango farmers who use more of these spraying protective clothing (aware of
pesticides health hazards and means of pesticides poisoning) are likely to adopt more IPM
components because IPM emphasizes on minimal pesticides use.
The average frequency of mango spraying of 5.04 is likely toimply high reliance on
pesticides to control fruit fly and consequently low intensity of IPM adoption is expected.
However, it could also indicate high intensity of IPM adoption since bait sprays, one of the

56
fruit fly IPM components, requires farmers to spray mangoes frequently but on small spots
usually one meter square on the tree canopy. The results further revealed that mango farmers
had a mean extension contact frequency of 0.7. Farmer groups were also not popular among
sampled mango farmers given that only 15 percent of them were members of such groups.
This implies low level of social networking among mango farmers hence low intensity of
adoption is expected.
4.1.1:Socio-Economic Characteristics of Mango Fruit Fly IPM Package Adopters and Non-Adopters
The results of the study indicate that IPM adopters and non-adopters had equal mean
age of 54 years. The IPM adopters and non-adopters had equal mean age of 54 years.
Adopters had an average of 9.8 years of formal schooling compared to non-adopters who had
an average of 8.4 years of formal schooling. The difference in mean number of formal years
of schooling was significant at the 1 percent level. The high mean years of formal education
among adopters implies that they were more likely to assess and objectively evaluate the
benefits of the mango fruit fly IPM Package compared to non-adopters.
On average, IPM adopters had higher mango farming experience of 15 years compared
to non-adopters whose mean experience was 13.5 years and the difference in the mean was
statistically significant at 1 percent level. Discussion with key informants revealed that,
farmers were of the opinion that pesticide application by itself was ineffective against the
fruit fly. Consequently, more experienced farmers (who overtime had experienced difficulty
of controlling fruit fly using pesticides alone) were more likely to try alternative methods of
fruit fly control such as the IPM package in order to improve fruit fly control effectiveness.
The average household dependency ratio (proxy for labour availability) among IPM
adopters (40.86 percent) was lower and statistically different at 1 percent level from that of
non-adopters whose average dependency ratio was 52 percent. This implies that adopters had
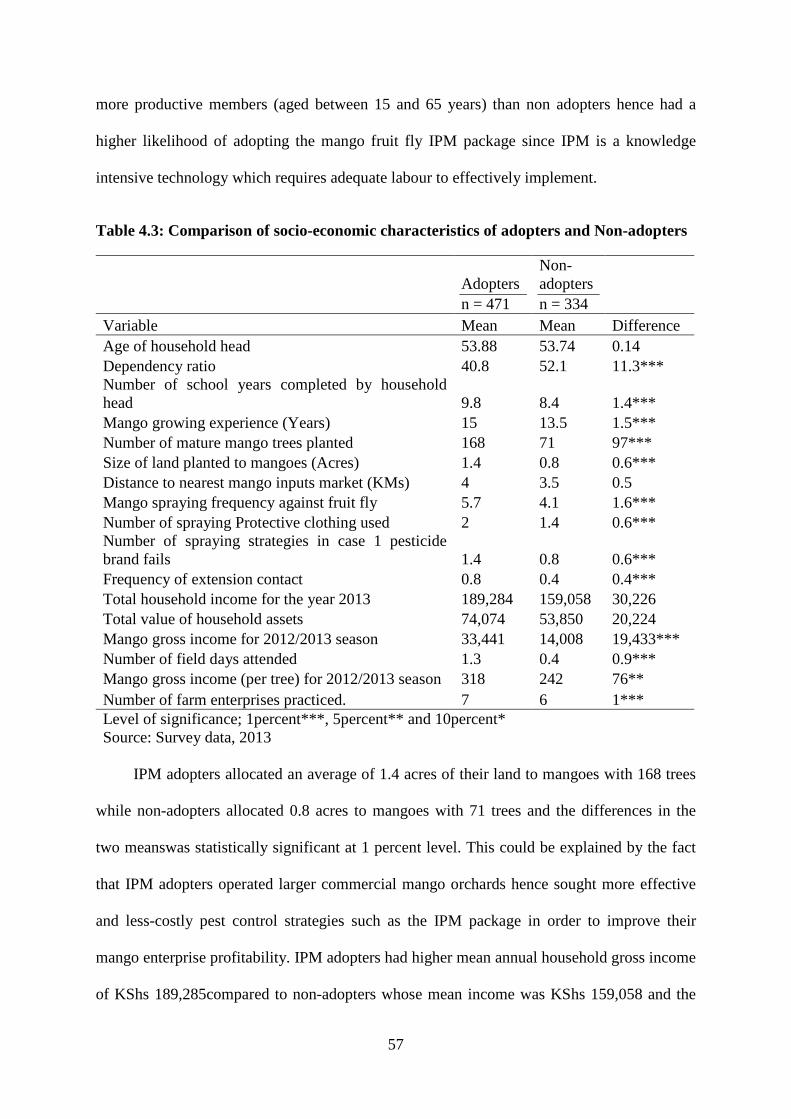
57
more productive members (aged between 15 and 65 years) than non adopters hence had a
higher likelihood of adopting the mango fruit fly IPM package since IPM is a knowledge
intensive technology which requires adequate labour to effectively implement.
Table 4.3: Comparison of socio-economic characteristics of adopters and Non-adopters
Adopters n = 471
Non-adopters n = 334
Variable Mean Mean Difference Age of household head 53.88 53.74 0.14 Dependency ratio 40.8 52.1 11.3*** Number of school years completed by household head 9.8 8.4 1.4*** Mango growing experience (Years) 15 13.5 1.5*** Number of mature mango trees planted 168 71 97*** Size of land planted to mangoes (Acres) 1.4 0.8 0.6*** Distance to nearest mango inputs market (KMs) 4 3.5 0.5 Mango spraying frequency against fruit fly 5.7 4.1 1.6*** Number of spraying Protective clothing used 2 1.4 0.6*** Number of spraying strategies in case 1 pesticide brand fails 1.4 0.8 0.6*** Frequency of extension contact 0.8 0.4 0.4*** Total household income for the year 2013 189,284 159,058 30,226 Total value of household assets 74,074 53,850 20,224 Mango gross income for 2012/2013 season 33,441 14,008 19,433*** Number of field days attended 1.3 0.4 0.9*** Mango gross income (per tree) for 2012/2013 season 318 242 76** Number of farm enterprises practiced. 7 6 1*** Level of significance; 1percent***, 5percent** and 10percent* Source: Survey data, 2013
IPM adopters allocated an average of 1.4 acres of their land to mangoes with 168 trees
while non-adopters allocated 0.8 acres to mangoes with 71 trees and the differences in the
two meanswas statistically significant at 1 percent level. This could be explained by the fact
that IPM adopters operated larger commercial mango orchards hence sought more effective
and less-costly pest control strategies such as the IPM package in order to improve their
mango enterprise profitability. IPM adopters had higher mean annual household gross income
of KShs 189,285compared to non-adopters whose mean income was KShs 159,058 and the

58
difference in these means was statistically insignificant suggesting that adopters and non-
adopters earned almost equal household gross incomes. Similarly, the difference in mean
distance to the nearest mango input market was not statistically significant.
IPM adopters had a mean annual mango gross income of about KShs 318 per tree
compared to non-adopters whose mean gross income wasKShs242per tree and the difference
between the two means was statistically significant at the 5 percent level. This difference
could be explained by the fact that IPM adopters by virtue of using more effective fruit fly
IPM components incurred minimal fruit fly damage hence realized higher mango yields
which translated to higher gross margins compared to non-adopters. On average, mango fruit
fly IPM adopters sprayed their mangoes more frequently, with an average of 5.7 times of
spraying compared to non-adopters who sprayed 4.1 times per season and the difference
between the two groups was statistically significant at the 1 percent level. The high spraying
frequency among IPM adopters could be explained by the use of food bait sprays, a
component of the IPM package, which requires farmers to spray more often but on small
spots (1 meter square) on the mango tree canopy.
IPM adopters used a statistically higher number items in the spraying protective kit
compared to non-adopters. Results indicate that on average, IPM adopters used about 2 items
in spraying protective gear compared to non-adopters who used one (Table 4.3). This implies
that IPM adopters had a better understanding of health hazards associated with pesticide use
than non-adopters and therefore used more spraying protective clothing to minimize exposure
to these hazards.On average, mango fruit fly IPM adopters had more farm enterprises (7
enterprises) compared to non adopters who had 6 enterprises. The number of farm enterprises
practiced was used as a proxy for risk attitude (diversification). This result thus implies that
mango fruit fly IPM adopters were more risk averse in comparison to the non-adopters (Table
4.3).

59
4.2: Adoption of the Mango Fruit Fly IPM Package in Embu East Sub-County
4.2.1:Components of the Mango Fruit Fly IPM Package Adopted
The most commonly adopted IPM componentswere burying fallen fruitsand attractant
trap adopted by 46.96 percentand 18.76 percent of the respondents respectively (Table 4.4).
This was followed by bait sprays adopted by 3.73 percent of the respondents. The least
adopted IPM component was the Augmentorium (a tent like structure)and soil inoculation
with fungal pathogens which wereboth adopted by 0.37 percent of the respondents.
Discussion with key informants revealed that majority of the mango farmers adopted burying
fallen fruits because it mostly relies on family labour hence was cheaper. In addition, the
attractant trap component was also adopted by about 20 percent of farmers because the fruit
flies are attracted by Methyl Eugynol attractant into the trap where they inhale insecticides
and die hence farmers are able to inspect the dead fruit flies in the traps (visible results).
The low adoption level of the food bait component was attributed to its unavailability
since it was withdrawn from the market by the manufacturer (Corn Product International,
Kenya) shortly after its introduction (Korir et al., 2015). Similarly, the Augmentorium (a tent
like structure) component was not widely adopted due to the high cost of construction while
the fungal pathogens component was not readily available in the market.
Table 4.4: Mango fruit fly IPM components adopted by sampled mango farmers
Components Percentage response
n=805 Attractant traps 18.76
Bait sprays 3.73
Use of Augmentorium 0.373
Burying fallen fruits 46.96
Burning fallen fruits 1.99
Smoking flies out using repellent herbs 3.48
Spray traditional concoction (Neem extracts) 1.12
Soil inoculation with fungal pathogens 0.373
Source: survey data, 2013

60
4.2.2: Comparison of IPM Adoption between ICIPE Trials Project Participants and Non-Participants
A higher percentage of mango farmers who participated in the trials (23.04percent)
adopted the attractant trap component compared to 13.41 percent among non-participants
(Table 4.5). A two sample test of proportionsof adopters of this component among the two
groups revealed that the difference was statistically significant at 1 percent level. Among the
participants, 6.26 percent adopted the bait sprays IPM component compared to 0.56 percent
among the non-participants and the difference between these proportions was significant at 1
percent level. This finding can be explained by the fact that most of the IPM package
components are knowledge intensive hence more mango farmers who participated in the
trials project (trained on the IPM components) had a higher likelihood of adopting them
compared to non-participants.
Table 4.5: Comparison of proportions of adopters of IPMcomponents between ICIPE trials project participants and Non-participants
Mean percentage of adopters. Difference
IPM components Trials participants (n=447) Trials non-participant (n=358)
1. Attractant trap 0.2304 0.1341 0.0963***
2. Bait sprays 0.0626 0.0056 0.0570***
3. Burying fallen fruits 0.5839 0.3268 0.2570***
4. Burning fallen fruits 0.0246 0.014 0.0198
Level of significance: 1 percent***, 5percent**, 10percent*, Source: Survey data, 2013.
A higher percentage of trials participants (58.39 percent) adopted burying fallen fruits
component compared to 33.68 percent among non-participant and the difference was also
significant at 1 percent level. Discussion with lead mango farmers and key informants
revealed that majority of the mango farmers did not appreciate the importance of proper
disposal of rotting fruits to minimize fruit fly population. Therefore those who participated in

61
the trials (trained on orchard sanitation) had a higher likelihood of burying their fallen fruits
compared to non-participants.
4.2.3: Intensity of Adoption and Determinants of Intensity of Adoption of the Mango Fruit Fly IPM Package
To address specific objective two, the proportion of farmers who had adopted at least
one IPM component was computed and the total number (intensity) of IPM components
adopted by each farmer was computed. In addition, a regression model was estimated to
assess the determinants of intensity of adoption of the IPM package. The results of the study
indicated that 58.51 percent had adopted at least one of the mango fruit fly IPM components
and the mean number (intensity) of IPM components adopted was 0.8. The Poisson
regression model was estimated to assess the intensity of adoption of the mango fruit fly IPM
package components. The model hada chi-square value significant at 1 per cent level. This
implies that the independent variables taken together influence the intensity of adoption of
the mango fruit fly IPM package. The mean deviance ratio (the Deviance chi-square value
divided by its degrees of freedom) was used to assess the goodness of fit of the poison
regression model. It was used to check whether the model meets the equi-dispersion
assumption (mean of the dependent variable is equals to its variance). Generally, a deviance
chi-square ratio of between 0.8-1.2 indicates that the Poisson regression model is appropriate
for modelling the data (Trentecoste, 2000). The calculated Pearson chi-square ratio was 0.88
indicating that the model met the equidispersion assumption and is therefore appropriate
model for the data.
The results of the Poisson regression model (table 4.6) indicated that seven variables
namely: gender of the household head, education of the household head, number of mature
mango trees planted, distance to nearest mango input market, use of spraying protective
clothing and access to extension services had a significant positive influence on the intensity

62
of adoption of IPM. On the other hand, source of pest management information had a
significant negative influence on intensity of IPM adoption.
Table 4.6: Poisson regression results for factors influencing intensity of adoption of the
mango fruit fly IPM
Dependent variable: Number of IPM components adopted Marginal effects
Explanatory variables Coefficient Robust Std errors
Gender of household head (Dummy) 0.142* 0.079
Age of household head (Years) - 0.025 0.113
Number of schooling years (Years completed) 0.015*** 0.006
Number of mature mango trees planted (Discrete) 0.118*** 0.024
Kilometres to nearest mango input market (Continuous) 0.070** 0.028
No of spraying protective gear used (Discrete) 0.039*** 0.014
Access to credit (Dummy) -0.001 0.089
Access to extension services (Dummy) 0.122** 0.054
Occupation of household head (Dummy) 0.077 0.058
Membership in agricultural group (Dummy) 0.049 0.065
Source of pest management information (Dummy) -0.111* 0.057
Constant -1.478** 0.623
Number of observations 805
Wald chi2(15) 106.31
Prob > chi2 0.0000
Pseudo R2 0.038
Mean deviance ratio (test for over or under-dispersion) 0.88
Level of significance; *** (1percent), ** (5percent) and *(10percent)
Source: Survey data, 2013.
A one year increase in the number of years of formal education of the household head
increased the likelihood of adopting more IPM components by 1.5 percent. The likely
interpretation of this result is that IPM is a knowledge intensive technology hence more
educated mango farmers, who are more receptive to new ideas, had a higher likelihood of
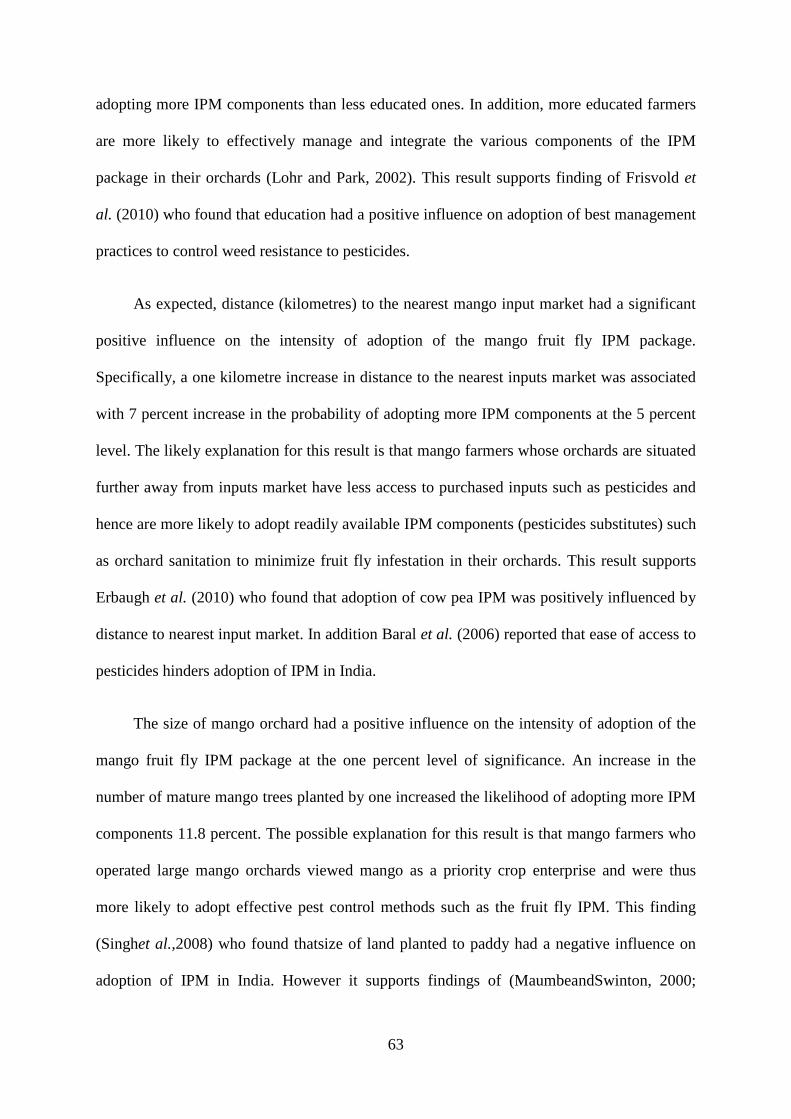
63
adopting more IPM components than less educated ones. In addition, more educated farmers
are more likely to effectively manage and integrate the various components of the IPM
package in their orchards (Lohr and Park, 2002). This result supports finding of Frisvold et
al. (2010) who found that education had a positive influence on adoption of best management
practices to control weed resistance to pesticides.
As expected, distance (kilometres) to the nearest mango input market had a significant
positive influence on the intensity of adoption of the mango fruit fly IPM package.
Specifically, a one kilometre increase in distance to the nearest inputs market was associated
with 7 percent increase in the probability of adopting more IPM components at the 5 percent
level. The likely explanation for this result is that mango farmers whose orchards are situated
further away from inputs market have less access to purchased inputs such as pesticides and
hence are more likely to adopt readily available IPM components (pesticides substitutes) such
as orchard sanitation to minimize fruit fly infestation in their orchards. This result supports
Erbaugh et al. (2010) who found that adoption of cow pea IPM was positively influenced by
distance to nearest input market. In addition Baral et al. (2006) reported that ease of access to
pesticides hinders adoption of IPM in India.
The size of mango orchard had a positive influence on the intensity of adoption of the
mango fruit fly IPM package at the one percent level of significance. An increase in the
number of mature mango trees planted by one increased the likelihood of adopting more IPM
components 11.8 percent. The possible explanation for this result is that mango farmers who
operated large mango orchards viewed mango as a priority crop enterprise and were thus
more likely to adopt effective pest control methods such as the fruit fly IPM. This finding
(Singhet al.,2008) who found thatsize of land planted to paddy had a negative influence on
adoption of IPM in India. However it supports findings of (MaumbeandSwinton, 2000;

64
Erbaugh et al.,2010) who identified farm size as an important variable positively influencing
IPM adoption in Zimbabwe and Uganda respectively.
Use of spraying protective gear (proxy for awareness of means of exposure to
pesticides poisoning) increased the likelihood of adopting more fruit fly IPM components by
3.9 percent at 1 percent level of significance. Sampled farmers were asked to state the
spraying protective gear they used when spraying pesticides on mangoes. The likely
interpretation of this result is that mango farmers who used more of these protective clothing
were aware of pesticides hazards and means of pesticide poisoning, thus were more likely to
adopt more IPM components which are effective against the fruit fly and minimize pesticide
use. In another study, awareness of pesticides related health hazard was found to have no
influence on adoption of cotton IPM in Zimbabwe (Muembe andSwinton 2000).
Source of pesticides use information (Dummy, 1=pesticides dealers, 0=otherwise) had a
negative influence on intensity of adoption of the mango fruit fly IPM package and was
significant at the 10 percent level. Seeking pest management information from pesticides
dealers or traders reduced the probability of adopting more IPM components by 11.1 percent,
all other factors held constant. The likely interpretation of this result is that pesticides dealers
seek to maximize their sales volumes by promoting sale of pesticide products (Rashid et al.,
2003).Therefore,farmers who rely on such dealerships for pest management information are
likely to adopt fewer IPM components (which emphasize minimal pesticide use) than those
who seek information from other independent sources of pest management information.
Access to extension services increased the likelihood of adopting more IPM
components by 12.2 percent at 5 percent level of significance. Access to formal agricultural
extension services enhance delivery of information on wide range of mango fruit fly control
strategies, thus farmers who accessed these services had a higher likelihood of adopting more
IPM components than those who did not.Gender of the household head also had a positive

65
influence on the intensity of adoption of mango fruit fly IPM package. Being a male headed
household increased the likelihood of adopting more IPM components by 14.2 percentat 10
percent level of significance.The likely explanation to this finding is that men have more
access to and own more resources such as, land and financial production resources than
women (Kaliba et al., 2000) and are therefore more likely to adopt more IPM components
compared to women.
4.3: Pesticide Misuseamong Mango Farmers in Embu East Sub-County
4.3.1:Pesticide Misuse
Majority of the sampled mango farmers (84.6 percent) used pesticides to control the
mango fruit fly. However, only 29.07 percent reported that pesticide spraying alone was an
effective fruit fly control strategy while the rest reported that it was ineffective. In
circumstances where farmerslack non-pesticide pest management strategies they resort to
pesticide misuse practices such as overdosing pesticide concentration, increasing frequency
of spraying and using unrecommended pesticides brands (Muchiri, 2012). Pesticidemisuse
means ‘application of insecticides in a higher or lower than recommended dose and
frequency, spraying a mixture of two or more insecticides per application, or using
unregistered, banned, or highly toxic chemicals’ (Rashid et al.,2003). It has been established
that improper pesticides selection, unrecommended spraying frequency and improper dosage
contribute to pest resistance since they place selective evolutionary pressure on pests
(Horticultural News, 2014).
The results of the study indicated that 67.45 percent of the mango farmers used at least
one or a combination of the three pesticide misuse described in table 4.7. Slightly more than
half of the respondents (56.77 percent) reported that they used pesticide brands which are not
recommended for fruit fly control and the most commonly misused pesticide brand was
Dimethoate meant for coffee. In fact, Dimethoate insecticide has been banned for use in fruits
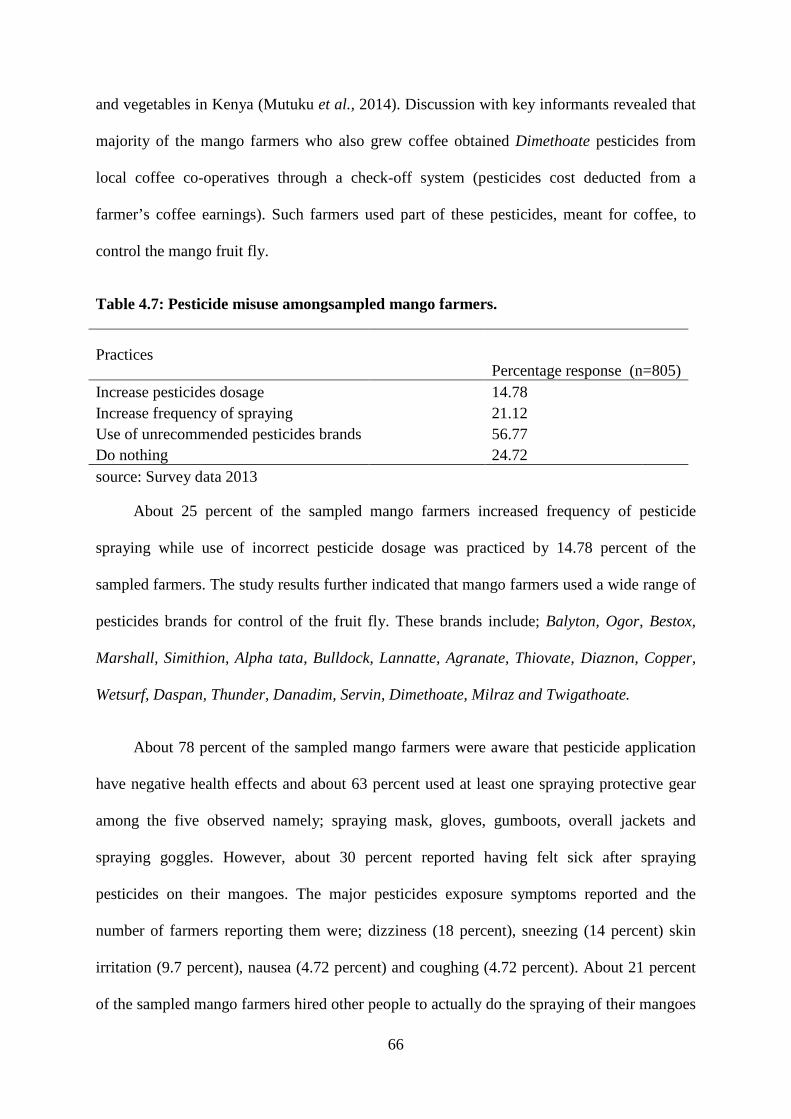
66
and vegetables in Kenya (Mutuku et al., 2014). Discussion with key informants revealed that
majority of the mango farmers who also grew coffee obtained Dimethoate pesticides from
local coffee co-operatives through a check-off system (pesticides cost deducted from a
farmer’s coffee earnings). Such farmers used part of these pesticides, meant for coffee, to
control the mango fruit fly.
Table 4.7: Pesticide misuse amongsampled mango farmers.
Practices Percentage response (n=805)
Increase pesticides dosage 14.78 Increase frequency of spraying 21.12 Use of unrecommended pesticides brands 56.77 Do nothing 24.72 source: Survey data 2013
About 25 percent of the sampled mango farmers increased frequency of pesticide
spraying while use of incorrect pesticide dosage was practiced by 14.78 percent of the
sampled farmers. The study results further indicated that mango farmers used a wide range of
pesticides brands for control of the fruit fly. These brands include; Balyton, Ogor, Bestox,
Marshall, Simithion, Alpha tata, Bulldock, Lannatte, Agranate, Thiovate, Diaznon, Copper,
Wetsurf, Daspan, Thunder, Danadim, Servin, Dimethoate, Milraz and Twigathoate.
About 78 percent of the sampled mango farmers were aware that pesticide application
have negative health effects and about 63 percent used at least one spraying protective gear
among the five observed namely; spraying mask, gloves, gumboots, overall jackets and
spraying goggles. However, about 30 percent reported having felt sick after spraying
pesticides on their mangoes. The major pesticides exposure symptoms reported and the
number of farmers reporting them were; dizziness (18 percent), sneezing (14 percent) skin
irritation (9.7 percent), nausea (4.72 percent) and coughing (4.72 percent). About 21 percent
of the sampled mango farmers hired other people to actually do the spraying of their mangoes
67
and there was a statistically significant association between hiring pesticides applicators and
tertiary and university degree levels of education (P<0.05).
Given that majority of the farmers (70 percent) reported that pesticide spraying alone
was an ineffective fruit fly control strategy, it is expected that pesticide misuse will be
prevalent in the study area. Furthermore, more than half (63percent) of the sampled mango
farmers used at least one spraying protective gear hencehigh pesticide misuse is expected in
the study area since farmers feel protected from pesticides exposure and its related health
hazards. Only 30percent of the sampled farmersstated that they fell sick after spraying
pesticides hence pesticide misuse is expected since farmers may not understand the harmful
effects of pesticides spraying.
Easy access to pesticides through check-off system is expected to enhance pesticide
misuse, particularly use of unrecommended pesticide brands, in the study area.The positive
association between level of education (college and university levels) and hiring of pesticides
applicators suggest that more educated farmers are more likely to engage in pesticide misuse
since they are not directly exposed to pesticides and their related hazards.
4.3.2: Factors Influencing Pesticide Misuse among Mango Farmers in Embu East Sub-County
To achieve objective two of the study, a logit model was estimated to assess the
determinants of pesticides misuse, and the results are presented in table 4.8 below. The chi-
square statistic for the overall performance of the model is highly significant with a P-
valuemuch lower than 1 percent (P-value of 0.0000), implying that the independent variables
taken together have parameter estimates which are significantly different from zero at the 1
percent level. In addition, the value of the calculated Hosmer-Lemeshow statistic of the
model was insignificant indicating that there is no significant difference between the
observed and predicted values, thus the model estimates fit the data at 5 percent level of

68
significance.Empirical results of the study revealed that the major factors influencing
pesticide misuse were; number of years of formal education completed, use of spraying
protective gear, adoption of at least one IPM component, source of pest management
information, and dependency ratio.
Table 4.8: Logit regression results for factors influencing pesticide misuse
Dependent variable: Pesticide misuse (1= Yes, 0= No)
Marginal Effects
Independent variables Coefficient Std errors
Gender of the household head (Dummy, 1= Yes, 0= No) -0.033 0.049
Age of the household head (Years) -0.039 0.079
Education of household head (Years of schooling completed) 0.013*** 0.005
Number of spraying protective clothing used (Discrete) 0.055*** 0.011
Distance to nearest mango input market (Continuous) 0.023 0.019
Access to credit (Dummy, 1= Yes, 0= No) 0.003 0.057
Source of pest management information (1= Yes, 0= No) 0.132*** 0.037
Access to extension services (Dummy, 1= Yes, 0= No) -0.029 0.041
Adoption of at least one fruit fly IPM component (1= Yes, 0= No) 0.190*** 0.036
Number of mature trees planted (Discrete) 0.032 0.021
Membership in agricultural group (1= Yes, 0= No) 0.054 0.050
Dependency ratio (continuous) -0.001* 0.000
Constant -0.587 1.608
Pseudo R2 = 0.1334
Wald chi2(12) = 116.66
Prob > chi2= 0.0000
Level of significance; *** (1percent), ** (5percent) and *(10percent)
Source; Survey data 2013
The dependency ratio had a significant negative influence on pesticide misuse among
mango farmers. The likely explanation of this result is that household with more dependants

69
spent a larger proportion of their incomes on basic needs such as food and clothing, leaving
them with little money resources to spend on pesticides hence did not engage in expensive
pesticide misuse such as; increasing pesticides dosage and frequency of spraying. Another
possible explanation to this finding is that pesticide application on mangoes is laborious
hence household with more dependants (inadequate labour force) were less likely to engage
in labour intensive pesticide misuse practices such as frequent mango canopy cover spraying.
Contrary to expectation, adoption of at least one mango fruit fly IPM component had a
significant positive influence on use of pesticides misuse at 1 percent level. Calculated
marginal effects indicate that adoption of at least one IPM component was associated with a
19 percent higher likelihood of using pesticides misuse, all other factors held constant. The
likely explanation for this finding is that during the survey, some of the IPM components
particularly the food bait component was unavailable in the market since the producing firm
(Corn Product International Kenya) withdrew the product from the market shortly after its
introduction for undisclosed reasons (Korir et al., 2015). Since food bait IPM component
involved pesticides spraying (usually on 1 meter square spot on mango tree canopy), farmers
who had adopted it but could not access it from the market to replenish their stock were
forced to revert to the conventional canopy spraying which entails frequent spraying to avert
fruit losses.
It is also important to note that optimum pest management results, in the context of
IPM, are realized when all the components of the package are integrated together. Therefore,
in case some components are unavailable to the farmers, they may be forced to increase
pesticides application since adopting only one component may not produce the desired pest
control results. This argument is reinforced by the descriptive statistics which revealed that
only 2.48 percent and 13.79 percent of the sampled farmers adopted three and two IPM
components respectively while 42.48 percent and 41.24 adopted one and zero components

70
respectively (Appendix 3). This result supports findings by Maupin and Norton (2010) and
Harper et al. (1990) who found that adoption of IPM actually increases chemical pesticide
spending and pounds of active pesticide ingredients sprayed on US farms.
Mango farmers who preferred to obtain pest management information from pesticides
distributors and traders had a 13.2 percent higher likelihood of misusing pesticides compared
to those who sought this information from other sources. Pesticide distributors and traders are
motivated by profits from pesticides sale, thus they are likely to encourage farmers to
increase their pesticides dosage and frequency of spraying in order to boost their sales
volumes. In addition, some traders may lack the expertise to advice farmers on proper
pesticides application hence may not provide appropriate pesticides use advice to their
customers. This result supports findings of (Rashid, et al., 2003; Baral et al., 2006 and
Macharia et al., 2013) who found that obtaining pest management information from
pesticides dealers increased the probability of pesticide misuse in Bangladesh, India and
Kenya respectively.
Contrary to expectation, use of more spraying protective clothing (used as a proxy for
awareness of pesticides health hazards and means of pesticides exposure) increased the
probability ofpesticide misuseby 13.6 percent. It is likely that mango farmers who used more
spraying protective gear felt adequately protected from pesticides exposure and
thereforeengaged inpesticides misuse through overdosing of pesticide concentration, frequent
canopy cover spraying and use of unrecommended pesticides brands, without fear of
poisoning. In addition, this finding can be attributed to lack of awareness among mango
farmers on the hazardous effects of pesticides use on natural enemies of the pest and
environmental pollution such as contamination of water, thus applied pesticides
indiscriminately as long as they felt protected from poisoning.
71
Surprisingly, the number of years of formal education completed by the household head
had a positive influence on pesticide misuse and was significant at 10 percent. A one year
increase in formal education completed by the household head increased the probability of
pesticide misuse by 1.3 percent, all other factors held constant. Descriptive statistics results
indicate that about 21 percent of the sampled farmers hired other people to spray their
mangoes and there was a significant association between hiring pesticides applicators and
attaining college level of education (P<0.05). More educated farmers who hired other people
to spray their mangoes had a higher likelihood of misusing pesticides because they were not
directly exposed to pesticides hazards as they did not participate during spraying. This result
supports findings by Harper et al., (1990) who found that the probability of pesticides
spraying increased with level of education among rice farmers in the US.

72
CHAPTER 5: SUMMARY, CONCLUSION AND RECOMMENDATIONS
5.1: Summary
Mango production is a major source of income for both medium and small-scale
farmers in Kenya. However, fruit fly infestation curtails the production and trade of mangoes
since it lowers the quality and quantity of edible and marketable fruits. This consequently
hurts the livelihoods of mango farmers and traders who depend on the mangoes for income
and consumption. The primary control strategy against the fruit fly in Kenya is chemical
pesticides, a strategy which has been shown to be ineffective because its larvae, the
destructive stage of the pest, is held inside the fruit tissue and it cannot be reached by
pesticides applied on the fruit surface.
This has led mango farmers to misuse pesticides through frequent spraying, overdosing
pesticides concentration and using unrecommended pesticides brands all targeting to improve
fruit fly control effectiveness. In addition to being ineffective against the fruit fly, these
practices have adverse health, environmental and economic consequences. To respond to this
situation, ICIPE developed and conducted trials on a mango fruit fly IPM package which was
shown to reduce fruit fly damage in pesticide intensive orchards from 24-60 percent to less
than 14 percent and to also reduce pesticides use by 46.4 percent (ICIPE, 2011 and Kibira,
2015). Despite the success of the mango fruit fly IPM package in controlling fruit fly
infestation and reducing pesticides use, its intensity of adoption remains unknown. Similarly,
the factors influencing pesticide misuse among mango farmershave not been studied.
The overall objective of this study was to assess adoption of the fruit fly IPM package
and pesticides misuse among mango farmers in Embu East sub-County. Embu East sub-
County was chosen for this study because it is a major mango producing area which hosted
the mango fruit fly IPM package trials project. The specific objectives were to; assess the
socio-economic characteristics of mango farmers, determine the factors influencing the

73
intensity of adoption of the mango fruit fly IPM package and examine factors influencing
pesticide misuse among mango farmers in Embu East Sub-County.
To achieve these objectives, primary data on socio-economic characteristics of farmers,
mango production and pest management were collected from a sample of 805 mango farmers.
Multistage sampling procedure was used to randomly select the farmers and the data were
collected through face to face interview using a semi structured questionnaire. The socio-
economic characteristics of the mango farmers were assessed using descriptive statistics
while a Poisson regression model was estimated to analyse the factors influencing the
intensity of adoption of the mango fruit fly IPM package. In addition, a logit model was
estimated to examine the factors influencing pesticides misuse.
5.2: Conclusion and Recommendations
The results of the study revealed that 58.51 percent of the sampled mango farmers
adopted at least one component of the mango fruit fly IPM package developed and promoted
by ICIPE. However, the mean intensity of adoption of the IPM package was 0.8 components.
The most commonly adopted IPM component was burying fallen fruits (46.96 percent),
followed by attractant traps (18.76 percent), bait sprays (3.73 percent), smoking flies out
using repellent herbs (3.48 percent) and burning fallen fruits (1.99 percent). The least adopted
components were; soil inoculation with fungal pathogens and orchard sanitation using a tent
like structure used to kill fruit flies while allowing beneficial insects back to the orchard
(Augmentorium) both adopted by 0.37 percent. The major reasons cited for low adoption
levels of these IPM components were, unavailability in the market and difficulty in
construction of the Augmentorium(tent like structure). Nonetheless, these results imply that
adoption of the IPM package is fairly good given that more than half (58.51 percent) of the
farmers adopted at least one component. However, unavailability of some components
hinderedfull adoption of the IPM package.

74
The empirical results of the Poisson regression model revealed that the intensity of
adoption of the mango fruit fly IPM package was positively influenced by; education of
household head, number of mature mango trees planted, distance to the nearest mango inputs
market, use of spraying protective clothing, access to extension services and gender of the
household head. However, obtaining pest management information from pesticide dealers
and traders had a negative influence on the intensity of adoption of the mango fruit fly IPM
package. From these results, it can be concluded that pesticides traders, in a bid to increase
their sales, encourage mango farmers to intensify pesticide application to control the fruit fly
instead of adopting alternative strategies such as IPM.In addition, the significant positive
effect of number of mature mango trees planted on intensity of IPM adoption suggests that
farmers who operate larger orchards derive higher benefits (reduced fruit damage and lower
pesticide expenditure) from adopting IPM compared to those with smaller mango orchards. It
also appears that IPM results are easier to see on larger mango farms. Furthermore, the
positive influence of number of years of formal education on adoption of IPM implies that
the mango fruit fly IPM package is a knowledge intensive technology thus more educated
farmers, able to process new information easily, were more likely to adopt more components
than their less educated counterparts.
The positive influence of use of spraying protective gear on the intensity of adoption of
IPM implies that mango farmers who were aware of negative health effects of pesticides and
how they are acquired (dermal absorption, ingestion, inhalation and absorption through the
eye) seek alternative pest control strategies that have minimal pesticide exposure such as
IPM. Access to formal agricultural extension services positively influenced intensity of
adoption of IPM implying the IPM package is a knowledge intensive technology, thus
farmers who had access to formal agricultural extension services had a higher likelihood of
adopting more IPM components.

75
The results of the study further revealed that 67.45 percent of the sampled mango
farmersmisused pesticides through; overdosing pesticides concentration, frequent spraying
and use of unrecommended pesticides brands. The estimated (logit) model revealed that
number of years of formal education completed had a positive influence on pesticides
misuse.A chi square test revealed that there was a positive association between hiring
pesticide applicators and college and university level of education. The finding supports the
conclusion thatmore educated mango farmers engage in pesticide misuse because they hire
other people to do the actual spraying so they are not directly exposed to pesticides hazards.
Adoption of at least one IPM component had a positive influence on pesticides misuse.
Descriptive statistics indicated that only 2.48 percent of the sampled mango farmers adopted
3 IPM components while 42.48 percent and 41.24 adopted one and zero components
respectively. These findings implythat partial adoption of the IPM package did not produce
results which could induce the farmer to reduce pesticide use or abandon it completely. In
addition, the positive influence of obtaining pest management advice from pesticide traders
on pesticide misuse imply that traders may not provide objective advice on pest management
to mango farmers as they seek to increase their sales volumes.
Since mango farmers who used spraying protective gear were more likely to misuse
pesticidesit would appear that they protect themselves from pesticide health hazards with
little regard to environmental pollution arising from the pesticide they use. As expected, the
dependency ratio had a negative influence on pesticide misuse which leads to the conclusion
that pesticides application is a labour intensive strategy hence is less appealing to mango
farmers who have more dependents and fewer productive members.

76
The recommendation emerging from this study can be summarized as follows:
1. Pesticide traders and dealers as sources of pest management information were shown
to have a negative influence on the intensity of adoption of the fruit fly IPM package,
but had a positive influence onpesticides misuse. It is therefore recommended that
information about pest managementshould be disseminated through independent
sources such as agricultural extension service providers in order to enhance adoption
of IPM and minimize pesticides misuse in the study area.
2. Extension services should be made more accessible to mango farmers in order to
enhance adoption of IPM in the study area.
3. IPM promotional campaigns should target more educated farmers to improve intensity
of adoption.It is also recommended thatfarmers should be encouraged to use part of
their mango revenues to attend basic education in order to improve their knowledge
base and consequently enhance theirunderstanding ofagricultural practices such as the
IPM concept.
4. Use of spraying protective clothing (proxy for awareness of different means of
exposure to pesticides hazards) had a significant positive influence on both the
intensity of adoption of the IPM package and pesticides misuse.Training on safe use
of pesticide should stress both the health and environmental hazards associated with
pesticide use.
5. The size of the mango orchard operated had a positive influence on the intensity of
adoption of the fruit fly IPM package. It is therefore recommended that the mango
fruit fly IPM promotional campaignsshould focus onlarge mango orchard operatorsin
order to increase the intensity of its adoption in the study area.

77
6.0:REFERENCES
Abdulai, A., and Huffman, W. E. (2005). The diffusion of new agricultural technologies: the
case of crossbred-cow technology in Tanzania. American Journal of Agricultural
Economics, 87(3), 645-659.
Adandonon, A., Vayssières, J. F., Sinzogan, A., and Van Mele, P. (2009). Density of
pheromone sources of the weaver ant Oecophylla longinoda affects oviposition
behaviour and damage by mango fruit flies (Diptera: Tephritidae). International
Journal of Pest Management, 55(4), 285-292.
Adesina, A. A., and Baidu-Forson, J. (1995). Farmers' perceptions and adoption of new
agricultural technology: evidence from analysis in Burkina Faso and Guinea, West
Africa. Agricultural economics, 13(1), 1-9.
Ajayi, O. O. (2000). Pesticide Use Practices, Productivity and Farmers’ Health: TheCase of
Cotton-Rice Systems in Côte d’Ivoire, West Africa. Pesticide Policy Project
Publication Series Special Issue No. 3, November 2000. University of Hannover
Alston, D. G. (2011, July).The integrated Pest Management (IPM) Concept.UTAH PESTS
fact sheet series, pp. 1-2.
Andersson, H., Tago, D., and Treich, N. (2014).Pesticides and health: A review of evidence
on health effects, valuation of risks, and benefit‐cost analysis (No. 825). Institut
d'Économie Industrielle (IDEI), Toulouse.
Antle, J. M., and Pingali, P. L. (1994). Pesticides, productivity, and farmer health: A
Philippine case study. American Journal of Agricultural Economics, 76(3), 418-430.
Asfaw S., Mithöfer D., and Waibel, H. (2010). Agrifood supply chain, private‐sector
standards, and farmers' health: evidence from Kenya. Agricultural Economics, 41(3‐4),
251-263.

78
Baral, K., Roy, B. C., Rahim, K.M.B., Chatterjee, H., Mondal, P., Monda, D. l., Ghosh, D.,
and Talekar, N.S. (2006). Socio-economic parameters of pesticide use and assessment
of impact of an IPM strategy for the control of eggplant fruit and shoot borer in West
Bengal, India. Technical Bulletin No. 37.AVRDC publication number 06-673. AVRDC
– The World Vegetable Center, Shanhua, Taiwan: pp. 36
Bett, C. (2004, February). Farm level adoption decisions of soil and water management
technologies in semi-arid Eastern Kenya.In 48th Annual Conference of the Australian
Agricultural and Resource Economics Society.
Biovision (2013).Fruit Fly Control. Higher mango yields thanks to integrated pest
management. Fact sheet 2013.
Blake, G., Sandler, H. A., Coli, W., Pober, D. M., and Coggins, C. (2007).An assessment of
farmer perceptions and factors influencing adoption of IPM in commercial cranberry
production.Renewable Agriculture and Food Systems, 22(02): pp 134-144.
Bonabana-Wabbi, J. (2002). Assessing factors affecting adoption of agricultural technologies:
The case of integrated pest management (IPM) in Kumi district, Eastern
Uganda.Unpublished Msc. Thesis Virginia Polytechnic Institute and State University.
Burrows, T. M. (1983). Pesticide demand and integrated pest management: a limited
dependent variable analysis. American Journal of Agricultural Economics, 65(4), 806-
810.
Cameron, A. C., and Trivedi, P. K. (2001).Essentials of count data regression.A companion to
theoretical econometrics, 331.
Cox, S., Niskar, A. S., Narayan, K. V., and Marcus, M. (2007). Prevalence of self-reported
diabetes and exposure to organochlorine pesticides among Mexican Americans:
Hispanic health and nutrition examination survey, 1982-1984. Environmental health
perspectives, 1747-1752.
79
Crann, S. E., Fairley, C., Badulescu, D., Mohn, W. W., and O'Doherty, K. C. (2015). Soils,
microbes, and forest health: A qualitative analysis of social and institutional factors
affecting genomic technology adoption. Technology in Society, 43. Pp 1-9.
Cuyno, L., Norton, G. W., and Rola, A. (2001). Economic analysis of environmental benefits
of integrated pest management: a Philippine case study. Agricultural Economics,
25(2‐3), pp 227-233.
Dasgupta, S., Meisner, C., and Wheeler, D. (2004). Is environmentally friendly agriculture
less profitable for farmers? Evidence on integrated pest management in
Bangladesh.Applied Economic Perspectives and Policy, 29(1): pp 103-118.
Ekesi .S (2010).Combating Fruit Flies in Eastern and Southern Africa (COFESA): Elements
of a Strategy and Action Plan for a Regional Cooperation Programme.World bank.
Ekesi .S (2010). What can farmers do against fruit flies? The Organic Farmer, No. 59 April,
2010.
Ekesi, S., Mohamed, S., and Hanna, R. (2010). Rid fruits and vegetables in Africa of
notorious fruit flies. CGIAR SP-IPM Technical Innovation Brief, 4(2).
Ekesi, S., Nderitu, P. W., and Rwomushana, I. (2006). Field infestation, life history and
demographic parameters of the fruit fly Bactrocera invadens (Diptera: Tephritidae) in
Africa. Bulletin of entomological research, 96(04), 379-386.
Erbaugh, J. M., Donnermeyer, J., Amujal, M., and Kidoido, M. (2010).Assessing the impact
of farmer field school participation on IPM adoption in Uganda.Journal of
International Agricultural and Extension Education, 17(3), 5-17.
FAO (2009). Value Chain Analysis of the Tropical Fruit Subsector: The Case of Mango
Production, Processing and Trade In Kenya. Joint Meeting Of The Fourth Session Of
The Sub-Group On Bananas And The Fifth Session Of The Sub-Group On Tropical
Fruits. 9th – 11th December, 2009. Rome

80
FAO (2011). Funding application for the common fund for commodities: participatory
dissemination and promotion of management technologies for Bactrocera invadens,
ceratitis fruit flies and mango seed weevil that constraint production and export of
mango and avocado in east Africa. Integrated group on Bananas and Tropical
fruits.Fifth session Cameroon 3-5 May, 2011.
Farah, J. (1994). Pesticide policies in developing countries: do they encourage excessive
use?World Bank discussion paper Number. 238. Washington D.C.
Feder, G., Just, R. E., and Zilberman, D. (1985).Adoption of agricultural innovations in
developing countries: A survey. Chicago: The University of Chicago.
Fernandez-Cornejo, J. (1996). The microeconomic impact of IPM adoption: theory and
application. Agricultural and Resource Economics Review, 25: pp 149-160.
Fernandez-Cornejo, J., and Ferraioli, J. (1999). The environmental effects of adopting IPM
techniques: the case of peach producers. Journal of Agricultural and Applied
Economics, 31(03), 551-564.
Fernandez-Cornejo, J., Beach, E. D., and Huang, W. Y. (1994).The adoption of IPM
techniques by vegetable growers in Florida, Michigan and Texas.Journal of
Agricultural and Applied Economics, 26(01), 158-172.
Ferreira, J. D., Couto, A. C., Pombo-de-Oliveira, M. S., Koifman, S., and Brazilian
Collaborative Study Group of Infant Acute Leukemia.(2013). In utero pesticide
exposure and leukemia in Brazilian children less than 2 years of age.Environmental
Health Perspectives (Online), 121(2), 269
Frisvold, G. B., Hurley, T. M., and Mitchell, P. D. (2010). Adoption of best management
practices to control weed resistance by corn, cotton, and soybean farmers. AgBioForum,
12(3&4), 2009 | 371
81
Garming, H., and Waibel, H. (2007). Do farmers adopt IPM for health reasons? The case of
Nicaraguan vegetable farmers. In Proceedings of the Tropentag Conference Utilisation
of Diversity in Land Use Systems: Sustainable and Organic Approaches to Meet
Human Needs: pp. 9-11.
Gitonga, Z. M., Okello, J. J., Mithoefer, D., Olaye, C., Ritho, C. N., Tenywa, J. S., ... and
Nampala, M. P. (2009). From a success story to a tale of daily struggle: the case of leaf
miner control and compliance with food safety standards in Kenya's snow
pea/horticultural industry. In 9th African Crop Science, Conference Proceedings, Cape
Town, South Africa, 28 September-2 October 2009 (pp. 571-578). African Crop Science
Society.
Government of Kenya, (2012).Kenya's LAPSSET Corridor Mango Production Investment
Opportunity.Government Printers, Nairobi.
Govindasamy, R., Italia, J., and Adelaja, A. (2001).Predicting willingness-to-pay a premium
for integrated pest management produce: a logistic approach.Agricultural and Resource
Economics Review, 30(2), 151-159.
Greene H.W (2007). Econometric analysis: Pearson Education Inc. New York University.
Greene W (2008). Functional forms for the negative binomial model for count data.
Economics Letters 99(2008): pp 585-590.
Griesbach, J. (2003). Mango growing in Kenya.World Agroforestry Centre.
Gujarati D. N. (2003).Basic Econometrics.Fourth Edition.Tata McGraw-Hill Publishing
Company limited, New Delhi.
Harper, J. K., Rister, M. E., Mjelde, J. W., Drees, B. M., and Way, M. O. (1990). Factors
influencing the adoption of insect management technology.American Journal of
Agricultural Economics, 72(4), 997-1005.

82
Hoppin, J. A., Umbach, D. M., Kullman, G. J., Henneberger, P. K., London, S. J., Alavanja,
M. C., andSandler, D. P. (2007). Pesticides and other agricultural factors associated
with self-reported farmer’s lung among farm residents in the Agricultural Health Study.
Occupational and environmental medicine, 64(5), 334-341.
Hoppin, J. A., Umbach, D. M., London, S. J., Henneberger, P. K., Kullman, G. J., Coble, J.,
and Sandler, D. P. (2009). Pesticide use and adult-onset asthma among male farmers in
the Agricultural Health Study.European Respiratory Journal, 34(6), 1296-1303.
Horticultural Crops Development Authority (2013).Role of Horticultural Crops Development
Authority.Nairobi, March 2013.
Horticultural News (2010).Managing the Invader Fruit Fly.September-October, 2010. No. 13
Horticultural News (2011). The fruit fly turf wars. ICIPE’s research threatens the fly’s
survival, but red tape and disagreements give the fly a new lease of life. August-
September 2011. No.18
Horticultural News (2014).Resistance management through IPM.May-June, 2014. No.33
ICIPE (2011).Assessment of Fruit Fly Damage on Mangoes and the Willingness to Pay for
Integrated Pest Management in Embu District, Kenya.Baseline survey.ICIPE press.
Isgin, T., Bilgic, A., Forster, D. L., and Batte, M. T. (2008). Using count data models to
determine the factors affecting farmers’ quantity decisions of precision farming
technology adoption. Computers and electronics in agriculture, 62(2): pp 231-242.
Isoto, R. E., Kraybill, D. S., and Erbaugh, M. J. (2008). Impact of integrated pest
management technologies on farm revenues of rural households: The case of
smallholder Arabica coffee farmers. African Journal of Agricultural and Resource
Economics Volume, 9(2), 119-131.
Israel, G. D. (1992). Determining sample size.University of Florida Cooperative Extension
Service, Institute of Food and Agriculture Sciences, EDIS.

83
Jaetzold, R., Schmidt, H., Hornetz, B., and Shisanya, C. (2006).Farm management handbook
of Kenya Vol.II: Natural conditions and farm management information Part C East
Kenya Subpart C1 Eastern Province.Nairobi: Ministry of Agriculture Kenya in
cooperation with Germany Agency for Technical Cooperation (GTZ).
Jankwowski, A., Mithöfer, D., Löhr, B., and Weibel, H. (2007).Economics of biological
control in cabbage production in two countries in East Africa.In Conference on
International Agricultural Research for Development, 8 p. Tropentag.
Kaliba, A. R., Verkuijl, H., and Mwangi, W. (2000).Factors affecting adoption of improved
maize seeds and use of inorganic fertilizer for maize production in the intermediate and
lowland zones of Tanzania.Journal of Agricultural and Applied Economics, 32(01), 35-
47.
Kenya Agricultural Organic Network (2006).Report of Random testing for pesticide residues
in common food stuffs from Nairobi markets.
Kenya Development Learning Centre, (2010).Smallholder farmers’ involvement in
commercial horticulture.Kenya’s perspective.Video conference on high value
horticulture for Eastern andSouthern Africa. 2nd November 2010
Kibira, M. N. (2015). Economic Evaluation of Integrated Pest Management Technology for
Control of Mango Fruit Flies in Embu County, Kenya.Unpublished Msc. Thesis,
Kenyatta University.
Kogan M. (1998). Integrated pest management: historical perspectives and contemporary
developments. Annual Review of Entomology Vol. 43: pp 243-270
Korir, J. K., Affognon, H. D., Ritho, C. N., Kingori, W. S., Irungu, P., Mohamed, S. A., and
Ekesi, S. (2015). Grower adoption of an integrated pest management package for
management of mango-infesting fruit flies (Diptera: Tephritidae) in Embu, Kenya.
International Journal of Tropical Insect Science, 1-10.

84
Koutsoyannis, A. (1973). Theory of Econometrics.Macmillan Education Ltd.
Krain, E., Ngugi A., Ndegwa, N., and Njeru, J. (2008). Enterprise Budgets for Market-
Oriented Mango Farming: The Case of Embu and Mbeere Districts. Promotion of
Private Sector Development in Agriculture. GoK, PSDA and GTZ
Lapar, M. L. A., and Pandey, S. (1999). Adoption of soil conservation: the case of the
Philippine uplands. Agricultural economics, 21(3): pp 241-256.
Leovinsoh, M., Meijerink, G., and Salasya, B. (1998).Integrated pest management in
Smallholder Farming in Kenya.Kenya Agricultural Research Institute, Nairobi,
Kenya.Edited by International Service for National Agricultural Research
(ISNAR).Evaluation of a Pilot Project.Discussion paper No. 98-13. October, 1998.
Edited by Kenya Agricultural Research Institute, 1998.
Lionberger, M.F. (1968). Adoption of New Ideas and Practices.Iowa State University.
Llewellyn, R. S., Lindner, R. K., Pannell, D. J., and Powles, S. B. (2007). Herbicide
resistance and the adoption of integrated weed management by Western Australian
grain farmers. Agricultural Economics, 36(1): pp 123-130.
Lohr, L., and Park, T. A. (2002). Choice of insect management portfolios by organic farmers:
lessons and comparative analysis. Ecological Economics, 43(1): pp 87-99.
Lux, S.A., Ekesi, S., Dimbi, S., Mohamed, S., and Billah, M. (2003).Mango infesting fruit
Xies in Africa-Perspectives and limitations of biological approaches to their
management. In: Neuenschwander, P., Borgemeister, C., Langewald, J. (Eds.),
Biological Control in Integrated Pest Management Systems in Africa. CABI,
Wallingford: pp. 277–293.
Lynch, S. M., Mahajan, R., Freeman, L. E. B., Hoppin, J. A., and Alavanja, M. C. (2009).
Cancer incidence among pesticide applicators exposed to butylate in the Agricultural
Health Study (AHS). Environmental research, 109(7), 860-868.
85
Macharia, I. N., Mithöfer, D., and Waibel, H. (2009).Potential environmental impacts of
pesticides use in the vegetable sub-sector in Kenya.African Journal of Horticultural
Science, 2.
Macharia, I. N., Mithöfer, D., and Waibel, H. (2013). Pesticide handling practices by
vegetable farmer in Kenya. Environment, development and sustainability, 15(4), 887-
902.
Marra, M., and Carlson, G. (1987).The role of Farm Size and Resource Constraint in the
Choice between Riskyt Technologies.Western journal of Agricultural Economicas.
12(2), 109-118.
Maumbe B. M., and Swinton, S. M. (2000). Why do smallholder cotton farmers in Zimbabwe
Adopt IPM? Role of Pesticide-related health risks and technology Awareness: Selected
paper for presentation at the annual meeting of the American Agricultural Economics
association, Tampa, FL, July 30- August 3. 2000.
Maumbe, B. M., andSwinton, S. M. (2003). Hidden health costs of pesticide use in
Zimbabwe's smallholder cotton growers. Social Science andMedicine, 57(9), 1559-
1571.
Maupin, J, and Norton, G. (2010). Pesticide use and IPM adoption: Does IPM reduce
pesticide use in the United States. Selected Paper prepared for presentation at the
Agricultural andApplied Economics Association 2010 AAEA, CAES, andWAEA Joint
Annual Meeting, Denver, Colorado, July 25-27, 2010.
Mbaga-Semgalawe, Z., and Folmer, H. (2000). Household adoption behaviour of improved
soil conservation: the case of the North Pare and West Usambara Mountains of
Tanzania. Land use policy, 17(4), 321-336.
McFadden, D. (1984). Econometric analysis of qualitative response models.Handbook of
Econometrics, 2, 1395-1457.
86
Ministry of Agriculture (2010). Agriculture Sector Development Strategy 2010-2020.
Government Printers, Nairobi.
Msabeni, A., Muchai, D., Masinde, G., Mato, S., and Gathara, V. (2010).Sweetening the
Mango: Strenghtening the value chain.An analysis of the organizational linkages along
the mango value chain, Mbeere District Eastern Province, Kenya.
Muchiri C. M. (2012). Economic assessment of losses due to fruit fly infestation in mango
and the willingness to pay for an integrated pest management package in Embu district,
Kenya. Unpublished Msc. Thesis, University of Nairobi.
Mutuku, M., Njogu, P., and Nyagah, G. (2014). Assessment of pesticides use and application
practices in tomato based agro systems in Kaliuni Sub-location, Kathiani district,
Kenya. JAGST Vol. 16(2) 2014
Ndiaye, M., Dieng, E. O., and Delhove, G. (2008). Population dynamics and on-farm fruit fly
integrated pest management in mango orchards in the natural area of Niayes in Senegal.
Pest Management in Horticultural Ecossystems, 14(1): pp 1-8.
Norton, G.W., and Mullen J.D. (1993).Economic Evaluation of Integrated Pest Management
Programs.publication No. 446140. Virginia Polytechnic Institute and State University,
Blacksburg. USA.
Nowak, P.J. (1987). The Adoption of Agricultural conservation Technologies.Economic and
Diffusion Explanations.Rural Sociology 52, 208-220.
Nyakundi , W. O., Magoma, G., Ochora, J., and Nyende, A.B. (2010). A survey of pesticide
use and application patterns among farmers: a case study from selected horticultural
farms in rift valley and central provinces, Kenya. In proceedings of the 12th KARI
Biennial Scientific conference p. 618-630.

87
Odendo, M., Obare, G., and Salasya, B. (2009) Factors responsible for differences in uptake
of integrated soil fertility management practices amongst smallholders in western
Kenya. African Journal of Agricultural Research Vol. 4 (11), pp. 1303-1311.
Ohayo-Mitoko, G.J.A., and Partow H. (1997). Pesticide Management and Use in Kenya.
Occupational Pesticide Exposure among Kenyan Agricultural Workers: pp 18–45.
Okello, J. J. (2005). Compliance with international food safety standards: The case of green
bean production in Kenyan family farms. PhD dissertation, Michigan State University.
Okello, J. J., and Swinton, S. M. (2007). Compliance with international food safety standards
in Kenya's green bean industry: Comparison of a small-and a large-scale farm
producing for export. Applied Economic Perspectives and Policy, 29(2), 269-285.
Orr, A. (2003). Integrated pest management for resource-poor African farmers: Is the
emperor naked? World Development, 31(5): pp 831-845.
Peshin, R., and Dhawan, A. K. (2009).Innovation-development process.Springer.
Pingali, P. L. (1993). Pesticides, rice productivity, and farmers' health: an economic
assessment. IRRI CABI.
Raghu, P. T., and Manaloor, V. (2014). Factors influencing adoption of farm management
practices in agro-biodiversity hotspots of India: An analysis using Negative Binomial
Count Data model. Journal of Natural Resources and Development, 04: pp 46 – 53
Ramirez, O, A., and Schultz S, D. (2000) Poisson count models to explain the adoption of
agricultural and natural resource management technologies by small farmers in Central
American countries. Journal of Agricultural and Applied Economics 32, pp 21–33.
Rashid, M. A., Alam, S. N., Rouf, F. M. A., and Talekar, N. S. (2003).Socio-economic
parameters of eggplant pest control in Jessore District of Bangladesh.AVRDC-
WorldVegetableCenter.
88
Richter, E. D. (2002). Acute human pesticide poisonings.Encyclopedia of pest management,
3-6.
Ridgley, A. M., and Brush, S. (1992). Social factors and selective technology adoption: the
case of integrated pest management. Human Organization, 51(4), 367-378.
Rogers E. M., and Shoemaker, F. (1971).Communication of Innovations.2nd Edition.The
press, New York.
Rwomushana, I. (2008). Bio-ecology of the invasive fruit fly Bactrocera invadens (Diptera:
Tephritidae) and its interaction with indigenous mango infesting fruit fly species.
Unpublished PhD thesis, Kenyatta University, Kenya.
Singh, A., Vasisht, A. K., Kumar, R., and Das, D. K. (2008). Adoption of integrated pest
management practices in paddy and cotton: A case study in Haryana and Punjab.
Agricultural Economics Researh Review, 21(2), 221-226.
Sorby, K., Fleischer, G., and Pehu, E. Integrated Pest Management in Development :Review
of Trends and Implementation Strategies. Agriculture andRural Development Working
Paper 5. Washington, D.C.: World Bank.
Standard Trade Development Facility (2009).Regional action plan to control fruit flies in
West Africa.Background document of the STDF donor workshop in Bamako Mali.29-
30 September. Pp 17
Tjornhom J. D., Norton, G. W., and Heong, K. L. (1996).Socioeconomic characteristics and
pesticide misuses in Philippine vegetable production.American Journal of Agricultural
Economics (Vol. 78, No. 5), pp. 1398-1398.
Tschirley D., and Ayieko M. (2008). Assessment of Kenya's Domestic Horticultural
Production and Marketing Systems and Lessons for the future.Tegemeo Institute of
Agricultural Policy and Development.Egerton University. WPS XXX/2008

89
United Nations, World Population Policies 2005 (United Nations publication, Sales No.
E.06.XIII.5, 2006)
USDA-APHIS (2008). Federal import quarantineorder for host materials of Bactrocera
Invadens (Diptera:Tephritidae) invasive fruit fly species. United states Department of
Agriculture (USDA) - Animal and plant quarantine inspection (APHIS). 3 pp
Varga R. I., Piñero, J. C., and Leblanc, L, (2015). An Overview of Pest Species of Bactrocera
Fruit Flies (Diptera: Tephritidae) and the Integration of Biopesticides with Other
Biological Approaches for Their Management with a Focus on the Pacific Region.
Insects, 6(2), 297-318.
Vayssieres, J. F., Sinzogan, A., Korie, S., Ouagoussounon, I., and Thomas-Odjo, A, (2009).
Effectiveness of spinosad bait sprays (GF-120) in controlling mango-infesting fruit flies
(Diptera: Tephritidae) in Benin. Journal of economic entomology, 102(2), 515-521.
Williamson, S., Ball, A. S., and Pretty, J, (2008).Trends for pesticide use and safer pest
management in four African countries.Crop Protection 27: pp 1327–1334.
Wilson, C., and Tisdell, C. (2001). Why farmers continue to use pesticides despite
environmental, health and sustainability costs. Ecological economics, 39(3): pp 449-
462.
Yudelman, M., Ratta, A., and Nygaard, D. F. (1998).Pest management and food production:
looking to the future (Vol. 25). Intl Food Policy Res Inst.

90
7.0: APPENDICES
Appendix1: Survey questionnaire used for data collection CONFIDENTIALITY The questions I will ask you in this interview will help us understand the factors influencing adoption of the IPM package for control of mango fruit fly. The information gathered will be used for academic purposes only. Section A: Background information Questionnaire number: …………… Enumerator’s name: Village: ………………………… Sub-location Location: ………………………………….. Division: District: …………………………………… Section B: Household Demography: 1.1. Name of the household (HH) head: ________________________________________ 1.2. House hold head’s mobile contact ________________________________________ 1.3. Respondent’s name (if not HH head) ________________________________________ 1.4. How are you related with the HH (If respondent is not the household head)? / / Use Codes (1= spouse, 2= Eldest son, 3 =Eldest daughter, 4= farm worker, 5=other, Specify 1.5 Gender of household head (1=male, 2 = female).
1.6 Age of (HH) (years). 1.7 Can the household head read and write? (1.=YES /____/ 2.= NO /_______/)
Section C: Household Composition: 1.8. Number of persons in the household* /_/ (please fill in the table below for details) Age Male Female Total 0 year to 14 years 15 years to 64 years More than 64 years *A household consists of people who live in the same compound and eat from the same pot in the last 12 months 1.9. Education level of the HH head (0). None /__________/ (1). Primary school /________/ (2). High school /___________/ (3). University /____________/ (4). College or polytechnic) /______/ (5). Other /___________/ (Specify) _____ 1.10. What is the total number of years spent in school? 1.11 Which year did you start growing and making your own mango farming decisions 1.12 What motivated you to start growing mangoes? #Section 1: Labour contribution last season. 1.13 How many household members worked in the family farm full time. 1.14 How many household members worked in the family farm part time. 1.15 How many household members worked outside the family farm full time. Section2: Mango production, sales and related constraints last season. 2.1 Let us now talk about your mango production, home consumption and sales last season. Which Mango Variety did you grow last season? (Tick appropriately).
Total number of trees planted.
Number of trees in production now.
Number of young trees
Total quantity of mangoes harvested last season.
Total quantity of mangoes consumed at home.
Total quantity of mangoes sold last season.
Market/ buyer. (Codes B.)
Qty
Unit. (Code A).
Qty
Unit. (Code A.)
Qty
Unit (Code A.)
Price per Unit
1.Apple 2.Tommy atkins
3.Ngowe 4.Kent

91
5.Van dyke 6.Sensation 7.Haden 8.Sabine 9. Kagege Other specify
Unit codes (A): 1= pieces, 2=bags; 3=crate, 4=4kg carton, 5=6kg carton, 6= other (specify Market Codes (B): 1= farm gate, 2=village market, 4= District market, 5= urban markets outside the district, 6=processors, 7= Exporter, 8= other, specify 2.2 After your mangoes have been harvested, are they usually sorted/graded/ / 1=Yes, 2=No 2.2.1 If yes, who sorts them? //. Codes, (1= seller/farmer, 2= buyer, 3= other, specify…..) 2.3 How do you sell your mangoes? / / (1= individually, 2 = as a group of farmers specify 2.4 Do you have a Global Gap standard compliance certificate/. 1=yes, 2=No. 2.5. In your opinion how is the mango production this last season compared to the previous season? 1=Much worse now/____/ 2= little worse no /______/ 3=No change /______/ 4=little better now /____/ 5= Much better now /_____/ 2.6. Is there a market for your mangoes? / /1. YES, 0. NO /__/ 2.7. How would you rate the market you have for your mango produce?1=very poor /__/ 2=poor /__/ 3=fair /__/ 4=Good /__/ 5=Very good /__/ 2.8. What is the distance to the nearest market? ____km 2.9. Were there any mangoes you harvested that were rejected by buyers last season? / / 2.10 If yes to 2.9 above, what were the reasons for rejection?.. 2.11 If yes to 2.9, indicate the amounts rejected for each variety in the table below. Variety Amounts rejected What did you do with the rejects? (Use codes B.) Quantity Units. (Code
A)
Unit codes (1= pieces, 2=bags, 3=crate, 4=4kg carton, 5=6kg carton, 6= other, specify. Codes B: (1=Leave them in the field, 2= compost as farmyard manure, 3= Give them away, 4= feed to my animals, 5= Dispose them by burying or burning, 6= other, specify. 2.12 Do you intercrop mango trees with other crops in your orchard? // 1= yes, 2 = No. 2.13 If yes, please give details of the intercrop(s) last season in the table below. Crop intercropped with mango trees. Acreage
(Acres) Quantity harvested.
Reason for intercropping (Code A).
Codes A (1=Consumption, 2=. Income, 3= Food diversification, 4. Others specify. 2.14 What were your main constraints to mango production last season? Please rank them in order of importance.
Constraint 1=yes 0=No Rank (See code) Propagation problem Access to farm inputs Pests Diseases Post harvest handling Other (specify)…………….
Rank: 1= Most serious, 2=fairly serious, 3=least serious 2.15 Which pests and / or diseases damaged your mangoes last season? (Please show the pictorials below to respondent if unable to mention any)

Fruit fly
Anthracnose damage on fruits
Mango nut weevil Stem end rot (branches drying up)
Section 4: Awareness of Fruit fly and Mango crop protection practices last season4.1 Have you ever had fruit fly infestation in your mango orchard? / / 4.1.1 If yes to 5.1, how did you know that there was fruit fly infestation in your orchard?
Through 1=Symptoms appropriate indicators)1Black exudates on fruit surface.2 Premature ripening of fruits.3 Rotting of fruits.4 Falling of fruits.5 Others specify………………………..
4.2 Let us now talk about fruit fly damage in your orchard last season.4.2.1 How severe was fruit fly damage on your mangoes last season? Codes for fruit fly damage severity / (1= high, 2= moderate, 3 = low). 4.22 Out of the quantity you harvested during the lastby fruit flies and diseases and quantity fit for sale?
Section 3: I will now ask you about your mango production practices.3.1 Do you keep mango production records? / / 3.1.1. If yes to 4.1, Which ones?/ / (Circle all that apply)records, 3= fertilizer/manure records, 4=sales records, 5= yield re3.2 Do you prune your mango trees? / / 1=3.2.1 If yes, when did you last prune? / / (year). 3.2.2. How often do you prune your mango trees? / /seasonal, 5=Never).
92
External fruit fly damage on mango fruit
Internal damage of fruit by fruit fly.
Anthracnose damage on leaves Rusty leaves.
Powdery mildew. Rusty leaf Mango scab (falling of fruits) Sooty moulds (whitish fruits).
Fruit fly and Mango crop protection practices last season 4.1 Have you ever had fruit fly infestation in your mango orchard? / / Yes =1, No=2.
, how did you know that there was fruit fly infestation in your orchard? 1=Symptoms on mango fruits, (circle appropriate indicators)
2=Observing the fruit fly itself.
1Black exudates on fruit surface. 2 Premature ripening of fruits. 3 Rotting of fruits. 4 Falling of fruits. 5 Others specify………………………..
fly damage in your orchard last season. 4.2.1 How severe was fruit fly damage on your mangoes last season? Codes for fruit fly damage severity
4.22 Out of the quantity you harvested during the last mango season, what quantities (estimates) were damaged by fruit flies and diseases and quantity fit for sale?
Section 3: I will now ask you about your mango production practices. mango production records? / / 1=Yes, 2= No.
If yes to 4.1, Which ones?/ / (Circle all that apply). (1=Labour wage records, 2= pesticide application records, 3= fertilizer/manure records, 4=sales records, 5= yield records. 6= other, specify
you prune your mango trees? / / 1=Yes, 2=No. 3.2.1 If yes, when did you last prune? / / (year). 3.2.2. How often do you prune your mango trees? / / (1=yearly, 2=once in two years, 3=once in three years, 4=
Internal damage of fruit by fruit
Rusty leaves.
Sooty moulds (whitish fruits).
2=Observing the fruit fly itself.
4.2.1 How severe was fruit fly damage on your mangoes last season? Codes for fruit fly damage severity /
mango season, what quantities (estimates) were damaged
wage records, 2= pesticide application cords. 6= other, specify)
(1=yearly, 2=once in two years, 3=once in three years, 4=

93
Mango Variety
Total quantity of mango produced.
Total quantity of mango harvested.
Quantity damaged by fruit fly
Quantity damaged by diseases
Total quantity of mango sold
Qty Unit Qty Unit Qty Unit Qty Unit Qty Unit Price /unit
1. Apple 2.Tommy atkins
3. Ngowe 4. Kent 5. Van dyke 6. Keitt 7. Sensation 8. Haden 9. Sabine 10. Kagege Other (specify) -----------
Unit codes: 1= pieces; 2=bags; 3=crate; 4=4kg carton; 5=6kg carton; 6= others (specify) 4.2.2 Are there other fruits in your orchard that were infested by the fruit fly last season? // Yes=1, No=2. 4.2.2.1. If yes, list the fruits affected indicating their respective output loss. Fruits Qty harvested Damage
Quantity Unit. Use code Quantity Unit. Use code. Code A ((1= pieces, 2=bags, 3=crate, 4=4kg carton, 5=6kg carton, 6= other (specify) 4.4 Awareness of mango fruit fly IPM 4.4.1 Have you ever heard of the mango fruit fly integrated pest management package introduced by ICIPE?// Yes=1, No=2. 4.4.2 If yes to 4.4.1, from who did you first hear about it? /______/. Code (1= extension officer, 2= mango buyer, 3=ICIPE staff, 4= from other farmers, 5= other (specify) 4.4.3 If yes to 4.4.1, which mango fruit fly IPM components you are aware of? (Record all components mentioned by the respondent) 4.4.4 Did you participate in fruit fly IPM package trials by ICIPE? // Yes=1, No=2. 4.4.5 If yes to 4.4.4 which year did you participate? // 4.4.6 If no to 4.4.4 above, what is the distance in (KMs) between your farm and the nearest orchard where IPM trials were held? // Section 5: Let us now talk about pesticide use in your orchard last mango season 5.1 Did you use pesticides during the last mango season? // Yes = 1, No=2. 5.1.1 If yes, fill the table below indicating the pesticides used, the target pests, timing and pesticides costs Pesticide name
Target pest
Timing of application. (Code A)
Pesticide Source (Code B)
Package size Price per package. (KShs).
Frequency of spraying.
Waiting days before harvesting.
Qty Units(g/mg/ml)
Note: let the respondent mention the pesticide source used and application time followed last season. Code A. timing of spraying. (1=before flowering 2= at flowering, 3= fruit setting, 4= shortly before harvesting, 5=other, (specify).).Codes (B) pesticides source(1=old stock, 2= friends, 3= agro vets, 4=farmer group/club, 5= mango buyer/processor, 6=others specify). 5.2 From your experience, are pesticides effective in controlling the fruit fly? // Yes = 1, No=2. 5.3 What do you wear when mixing and spaying pesticides? // (Let the respondent mention and circle all that apply). (1= Spraying masks, 2= Gloves, 3= Gumboots, 4= Goggles, 5= spraying overall, 6 = other, specify 5.4 Did you scout for fruit fly before pesticide application on mango trees last season? / / Yes= 1, No = 2.

94
5.4.1 If yes, please give details of the methods used to scout for fruit fly. / /Let the respondent mention and Circle all the codes that apply. (1=Use of attractant trap, 2= Observing fruit fly damage on mango fruits, 3= Observing the pest itself, 4= other,) 5.5 What was the dosage of the main pesticide brand you used last season?/ / Codes (1 = as recommended by manufacture, 2= more, 3= less, 4= I don’t know). 5.6 From your experience, are there negative or harmful effects of using pesticides? / / 1=yes, 2=No. 5.6.1. If yes, list the negative/ harmful effects …………………………… 5.7 Have you or any member of your household ever suffered any pesticide related health problem? // Yes = 1, No= 2. 5.8 In case one pesticide brand fails to control the fruit fly, what do you do? / / circle all the codes mentioned by the respondent.(1 = Increase pesticide dosage, 2= Increase frequency of spraying, 3= Mix different pesticide brands, 4= change to a different pesticide brand, 5= Do nothing, 6= other, specify pesticide brand shifted to………………). 5.8.1 Does the alternative method(s) applied in 5.8 works? /___________/ (1=yes, 2=No). 5.9 Did you hire a knapsack sprayer for spraying mangoes last season? / / yes=1, No=2. 5.9.1 If yes, how much did it cost per spraying / per day? // (KShs.). 5.10 What were your spraying intervals for mango trees last season? //. Codes (1= after 2 weeks, 2= after 1 month, 3= after 2 months, 4= after 3 months, 5 = other, specify)

95
4.3.0 Mango crop protection practices and adoption of fruit fly IPM package. 4.3.1: I will now ask you about your fruit fly control practices. (Let the respondent mention the practices used, then record in the table below.) Code A (1= research centers (ICIPE), 2= IPM trial orchards, 3= Neighbors, 4=Bought from local agro vet dealers, 5= provided by government agency e.g KARI, 6=
provided free by NGOs, 7= mango buyer / processor/ exporter, 8= other (specify
Have you ever used any of the following fruit fly control strategies?
Yes = 1, No =2.
If yes, give year first used.
Main source of technology. Code A.
Which year did you start buying the technology on your own?
Have you been using this technology continuously? Yes=1, No=0.
Does the technology work? Yes = 1, No = 2.
Amount spent on the technology last mango season. (KShs).
1 Population monitoring Male attractant traps (male lures i.e. methyl eugenol). Dudu lure traps 2 Biological control Parasitoids wasps. Fungal Biopesticides. Weaver Ant technology. Soil inoculation with fungus. 3 Chemical control Broad spectrum pesticides Less toxic insecticides e.g. Methomex Bait sprays (Mazoferm andspinosad). 4. Orchard sanitation Use of Augmentorium Bagging fallen fruits to kill fruit fly larvae. Burying fallen fruits. Removal of unwanted host fruits. Burning of infested fruits Other, specify …………………………… 5. Traditional control methods Smoke repellant herbs on mango trees. Homemade concoctions (mixture of detergent, Mexican marigold leaves, Neem, and garlic)
6. Do nothing.

96
Section 6: Let us now talk about your perception of pesticide application and IPM practices (use the codes below to fill the gaps appropriately).
1= Strongly Agree 2= Agree 3=Somewhat Agree 4= Disagree 5=Strongly Disagree 6.1 Pesticides harm natural enemies of the fruit fly pest / / 6.2 IPM practices are useful in controlling fruit fly pest. // 6.3 IPM practices are safer relative to pesticide control. / / 6.4 IPM inputs are readily available. / / 6.5 IPM package is affordable. / / 6.6 If you adopted any IPM component, rate the following IPM attributes?
Attribute Rating (use codes). 1 Reduction in labour costs. 2 Reduction in pesticide use. 3 Reduction in pesticide expenditure. 4 Increase in yields. 5 Better mango prices/ quality improvement.
Rating: 0=Ineffective; 1=Less Effective; 2=Effective; 3=Very Effective Section 7: Mango production input use and costs last season (objective 4) 7.1 Fertilizer and manure application for mango production during last mango season. 7.1.1 Did you apply fertilizer in your mango orchard last season? //. 1= yes, No=2. 7.1.2 Did you apply manure in your mango orchard last season? //. 1= yes, 2= No. 7.2. If yes to 7.1, fill the table below recording the cost of fertilizer and manure last season. 7.2.1 Fertilizer type Qty Units code A Cost per unit. (KShs) Timing of application. (Code B) 7.2.2 Manure Qty Units code A Cost per unit. (KShs) Timing of application. (Code B) Unit (Codes A): 1= wheelbarrow, 2= 50 kgs bags, 3= 20 liter debe, 4= pick up, 5= lorry, 6 = other, specify, Timing of application (Code B): 1= after pruning, 2 =onset of flowering, 3= after flowering, 4= other, specify 7.3 How much money did you spend on labour for these activities related to mango production last mango season? Activity (Fill only if the farmer carried out the activity)
Hired Labour Family Labour
No. of people
No. of days
Rate Per day
Total Cost (KShs)
No. of people
No. of days
Rate Per day (KShs)
Total Cost (KShs)
Digging up Weeding Irrigation Fertilizer Application Manure Application Pesticide Spraying Pruning Orchard sanitation Top-working (grafting).
Harvesting Sorting andgrading. Note: If harvesting and grading is done by the buyer, please don’t fill the respective rows. Section 8: Access to credit and information on mango production and pesticide use (objective 2). 8.1 Did you or your spouse receive any form of credit/loan last season for the purpose of improving mango production? // 1=yes, No=2. 8.1.1 If yes, please fill the table below.

97
Source of credit. (Use code A)
Amount received KShs.
Form of credit. (Code B) Purpose of credit. (Code C)
Code A.Source: 1= Farmer group, 2= other self-help group, 3= Friends/Relative, 4= Bank, 5=Microfinance, 6=AFC, 7= other, specify, Code B. Form: 1= in kind e.g. inputs, 2=money, 3=other (specify), Code C. Purpose: 1= to purchase seedlings, 2= to purchase fertilizer, 3= to purchase pesticides, 5= to rent additional land, 6= to expand crop area, 7= other (specify). Access to mango production, pesticide use and mango fruit fly IPM package information. 8.2 Have you been receiving information on improving mango production? // Yes=1, No=2. 8.3 Have you been receiving new information on pesticide use? / /. Yes=1, No=2. 8.5 If yes to 8.2 and8.3 above, fill the table below ranking the sources of information on pestmanagement andpesticide use and mango production last season in order of importance. (Let the respondent mention them) Source of information. Ranking for pesticide use Ranking for IPM package. Government extension officers Farmer club / group Family member Neighbouring mangofarmers. Research center (e.g. ICIPE), Agro vet store Pesticide supplier (Dealer). Field days in IPM trial orchards Mass media (TV, Newspapers) NGOs Radio Demonstration plots Reading pesticides labels. Others (specify…) 8.5 How often do you receive new pesticide use information from the main source? / / (often=1, rarely =2, never = 3). 8.5 .1 If often or rarely, when was the last time you received new pesticide use information? monthandyear). 8.6 How many times were you visited by an agricultural extension officer last mango season? 8.7 How many times did you visit/consult an agricultural extension officer last mango season? // 8.8 Did you attend a farmer field day/ seminar on mango production last mango season, 1=yes, 2= No. 8.8.1 If yes, how many times did you attend the seminars last season? // . 8.8.2. State the topics covered during the training. Let the respondent mention then Circle all the codes that apply. (1=pest and disease control, 2= pesticides selection and use, 3=orchard sanitation, 4= use of attractant traps, 5= use of biological control agent, 6= seedling production and grafting, 7= source of high yielding grafts, 8= mango marketing, 9= others, specify) 9.0: Let us now talk about your occupation, household income(s) and group membership last mango season (Objective 2, 3 and4) 9.1 What is your main occupation? Occupation codes // (farming =1, other=2) other specify. 9.2 Apart from sale of mangoes, rank your other sources of income last season in the table below. Ranking. Income
source. Number of days worked per month/ number of units sold.
Actual Daily /weekly / monthly pay rate for labour and unit price for products sold (KShs).
Earnings per month/season (KShs).
1 2 3 4 5 6 7 9.3: Group membership of the household head and the spouse(s) (social network).
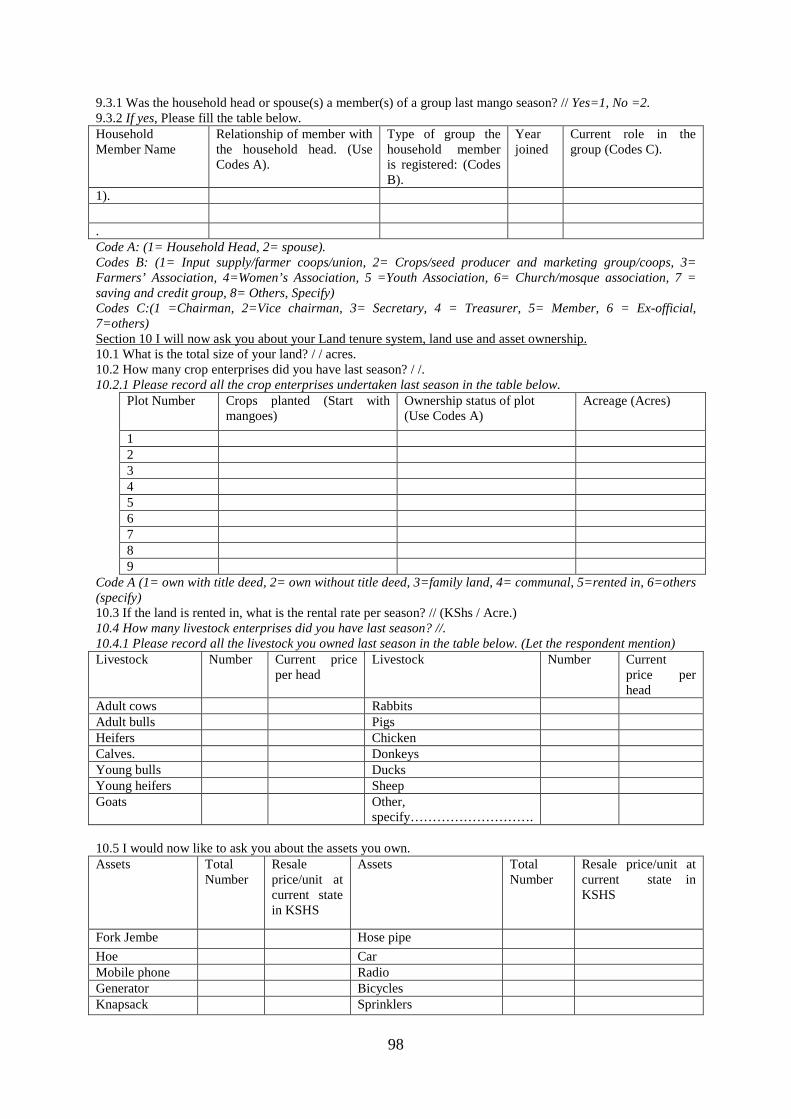
98
9.3.1 Was the household head or spouse(s) a member(s) of a group last mango season? // Yes=1, No =2. 9.3.2 If yes, Please fill the table below. Household Member Name
Relationship of member with the household head. (Use Codes A).
Type of group the household member is registered: (Codes B).
Year joined
Current role in the group (Codes C).
1).
. Code A: (1= Household Head, 2= spouse). Codes B: (1= Input supply/farmer coops/union, 2= Crops/seed producer and marketing group/coops, 3= Farmers’ Association, 4=Women’s Association, 5 =Youth Association, 6= Church/mosque association, 7 = saving and credit group, 8= Others, Specify) Codes C:(1 =Chairman, 2=Vice chairman, 3= Secretary, 4 = Treasurer, 5= Member, 6 = Ex-official, 7=others) Section 10 I will now ask you about your Land tenure system, land use and asset ownership. 10.1 What is the total size of your land? / / acres. 10.2 How many crop enterprises did you have last season? / /. 10.2.1 Please record all the crop enterprises undertaken last season in the table below.
Plot Number Crops planted (Start with mangoes)
Ownership status of plot (Use Codes A)
Acreage (Acres)
1 2 3 4 5 6 7 8 9
Code A (1= own with title deed, 2= own without title deed, 3=family land, 4= communal, 5=rented in, 6=others (specify) 10.3 If the land is rented in, what is the rental rate per season? // (KShs / Acre.) 10.4 How many livestock enterprises did you have last season? //. 10.4.1 Please record all the livestock you owned last season in the table below. (Let the respondent mention) Livestock Number Current price
per head Livestock Number Current
price per head
Adult cows Rabbits Adult bulls Pigs Heifers Chicken Calves. Donkeys Young bulls Ducks Young heifers Sheep Goats Other,
specify……………………….
10.5 I would now like to ask you about the assets you own. Assets Total
Number Resale price/unit at current state in KSHS
Assets Total Number
Resale price/unit at current state in KSHS
Fork Jembe Hose pipe
Hoe Car Mobile phone Radio Generator Bicycles Knapsack Sprinklers
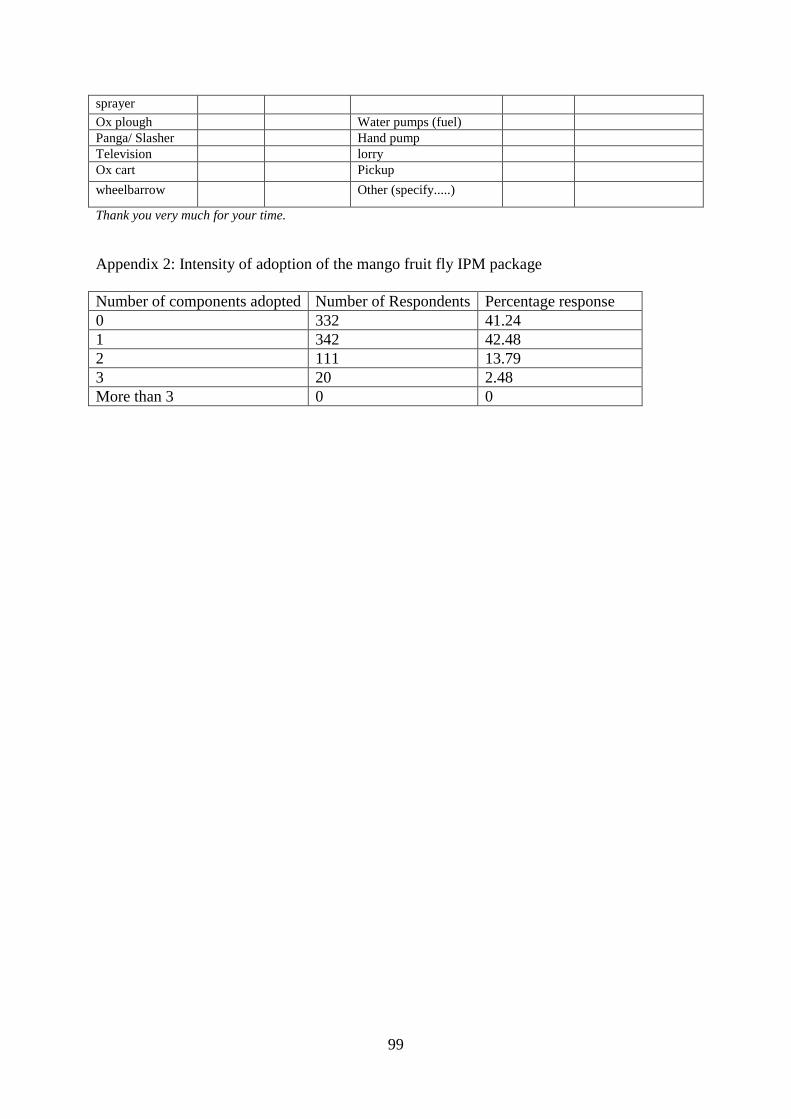
99
sprayer
Ox plough Water pumps (fuel) Panga/ Slasher Hand pump Television lorry Ox cart Pickup
wheelbarrow Other (specify.....)
Thank you very much for your time.
Appendix 2: Intensity of adoption of the mango fruit fly IPM package Number of components adopted Number of Respondents Percentage response 0 332 41.24 1 342 42.48 2 111 13.79 3 20 2.48 More than 3 0 0