Peening Intensity - shotpeener.com
6
ACADEMIC STUDY Dr. David Kirk | Coventry University 26 The Shot Peener | Summer 2016 Peening Intensity True Meaning and Measurement Strategy INTRODUCTION The two most important quantitative terms for shot peeners are “Coverage” and “Peening Intensity.” “Coverage” has a single, unambiguous, definition: The percentage of the peened area that has been indented at least once. “Peening Intensity,” on the other hand, is defined in several ways. Customers identify peening intensity as being the arc height of a specified point on a so-called “Saturation Curve.” In addition, internet searches for definitions of peening intensity commonly yield “Peening intensity is the measure of the energy of the shot stream”—which is incorrect. This wrongly implies that peening intensity will increase with shot stream flow rate and therefore leads to confusion. Having accepted a customer-specified value for peening intensity arc height, peeners must employ some sort of measurement strategy. An early definition of strategy is “a high level plan to achieve one or more goals under conditions of uncertainty.” This definition resonates with shot peeners who are constantly faced with having to balance customer requirements for specified intensity with the variability of the factors that affect intensity. An effective strategy is therefore important because the resources available to satisfy customers are usually limited. Most jobbing shot peeners base their strategy on satisfying specified customer requirements as economically as possible. Relevant specifications, such as SAE J443, allow a range of measurement strategies. Large companies, however, may employ in-house strategies that differ significantly from those embodied in international specifications. Such in-house strategies can be very effective. This article is essentially in two parts. The first part briefly discusses the true meaning of “Peening Intensity.” The second part considers, in relative depth, a range of peening intensity measurement strategies that are available, together with their “pros and cons.” Finally it is suggested that a combination of set-up and verification strategies offers an improved type of strategy. TRUE MEANING OF “PEENING INTENSITY” The true meaning of peening intensity can be expressed as: “the average dent capability of the individual shot particles that collectively make up a shot stream.” It does not matter, for example, if one particle or a million particles are emerging from a nozzle per second. What does matter is the average dent capability of the individual particles. Consider the analogy of being bitten by insects. Angry wasps inflict larger bites than small midges. The average size of each bite is analogous to a peening intensity value. Peen coverage is analogous to the percentage area of skin containing at least one bite. An average wasp weighs 200 times as much as an average midge. Wasp bites would therefore have to be 200 times as large as midge bites to achieve the same coverage rate as can midges. We find with shot peening that the smaller the shot the greater the coverage rate with all other things being equal. The following is a light-hearted exercise in parallel thinking. Dent Size Capability of Ship’s Cannonballs Several parallels can be drawn between shot particles and cannonballs. Imagine a man-o-war equipped with three rows of cannons shown schematically in fig.1. A typical Fig.1. Man-o-war with three rows of cannons.
-
Upload
khangminh22 -
Category
Documents
-
view
0 -
download
0
Transcript of Peening Intensity - shotpeener.com
ACAdEMIC STudyDr. David Kirk | Coventry University
26 The Shot Peener | Summer 2016
Peening IntensityTrue Meaning and Measurement Strategy
INTRODUCTIONThe two most important quantitative terms for shot peeners are “Coverage” and “Peening Intensity.” “Coverage” has a single, unambiguous, definition: The percentage of the peened area that has been indented at least once. “Peening Intensity,” on the other hand, is defined in several ways. Customers identify peening intensity as being the arc height of a specified point on a so-called “Saturation Curve.” In addition, internet searches for definitions of peening intensity commonly yield “Peening intensity is the measure of the energy of the shot stream”—which is incorrect. This wrongly implies that peening intensity will increase with shot stream flow rate and therefore leads to confusion. Having accepted a customer-specified value for peening intensity arc height, peeners must employ some sort of measurement strategy. An early definition of strategy is “a high level plan to achieve one or more goals under conditions of uncertainty.” This definition resonates with shot peeners who are constantly faced with having to balance customer requirements for specified intensity with the variability of the factors that affect intensity. An effective strategy is therefore important because the resources available to satisfy customers are usually limited. Most jobbing shot peeners base their strategy on satisfying specified customer requirements as economically as possible. Relevant specifications, such as SAE J443, allow a range of measurement strategies. Large companies, however, may employ in-house strategies that differ significantly from those embodied in international specifications. Such in-house strategies can be very effective. This article is essentially in two parts. The first part briefly discusses the true meaning of “Peening Intensity.” The second part considers, in relative depth, a range of peening intensity measurement strategies that are available, together with their “pros and cons.” Finally it is suggested that a combination of set-up and verification strategies offers an improved type of strategy.
TRUE MEANING OF “PEENING INTENSITY”The true meaning of peening intensity can be expressed as: “the average dent capability of the individual shot particles that collectively make up a shot stream.” It does not matter,
for example, if one particle or a million particles are emerging from a nozzle per second. What does matter is the average dent capability of the individual particles. Consider the analogy of being bitten by insects. Angry wasps inflict larger bites than small midges. The average size of each bite is analogous to a peening intensity value. Peen coverage is analogous to the percentage area of skin containing at least one bite. An average wasp weighs 200 times as much as an average midge. Wasp bites would therefore have to be 200 times as large as midge bites to achieve the same coverage rate as can midges. We find with shot peening that the smaller the shot the greater the coverage rate with all other things being equal. The following is a light-hearted exercise in parallel thinking.
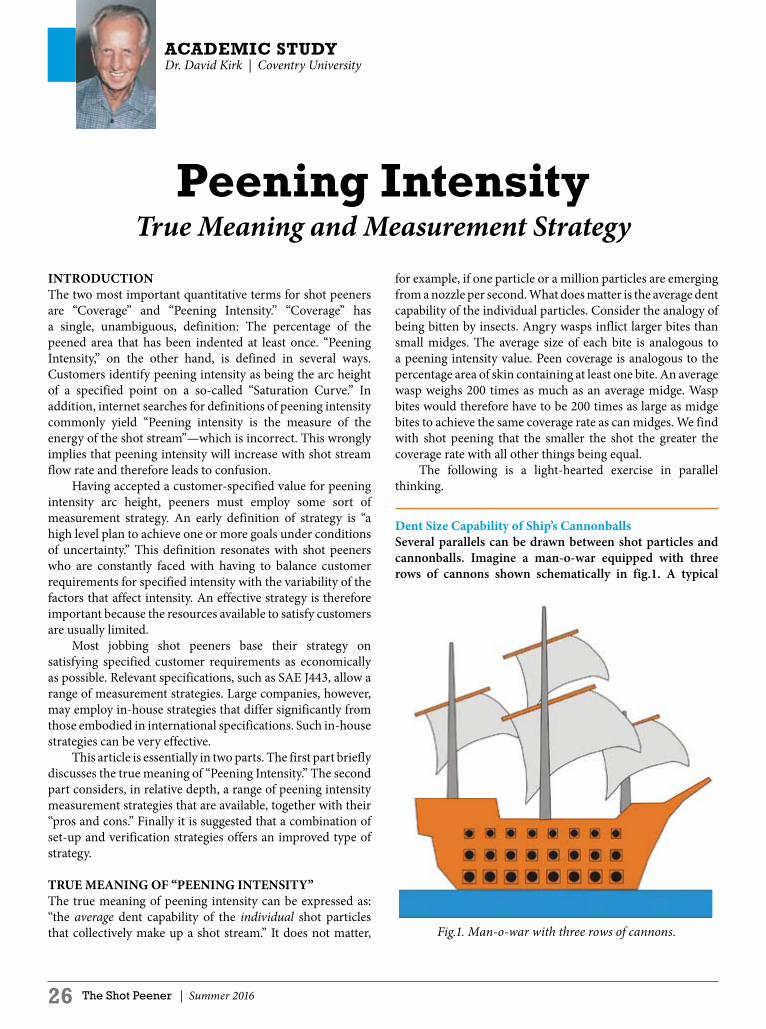
Dent Size Capability of Ship’s CannonballsSeveral parallels can be drawn between shot particles and cannonballs. Imagine a man-o-war equipped with three rows of cannons shown schematically in fig.1. A typical
Fig.1. Man-o-war with three rows of cannons.

ACAdEMIC STudy Continued
28 The Shot Peener | Summer 2016
British man-o-war would have had 42-pounder cannons on the lowest deck, 24-pounders on the middle deck and 12-pounders on the upper deck. Cannonballs weighing 42 pounds would obviously have a greater dent size potential than smaller cannonballs. We can therefore draw a parallel between this and the effect of shot size when shot peening. Larger shot has the capability of generating larger dents than smaller shot provided that it is accelerated to the same velocity. A second parallel can be drawn between peening coverage and the effect of prolonged cannon firing. The ship’s captain would have to consider both the dent size capability of individual cannonballs and the number striking his target. With prolonged firing the target would become more and more covered with dents. Coverage would depend on both the size of dents and the number of dents. The third, most important, parallel is that the average dent size capability of a cannonball is the equivalent of the average dent size capability (aka peening intensity) of the individual shot particles in a shot stream. Dent size capability does not depend on the number of cannonballs fired nor does that of shot particles. The number fired does, however, affect coverage - which is measured independently. Quantification of individual cannonball dent size capability was not attempted. With shot peening, however, we do have a quantitative measure of shot dent size capability—peening intensity arc height. This measure accommodates the fact that a shot stream contains vast numbers of particles. It would not be practicable to measure the dent size capability of every individual shot particle and then derive an average value.
A shot stream comprises vast quantities of flying particles. Indirect measurement of the average dent size capability was made possible by John Almen. He realized that it was not practicable to use a method based on measuring dent size. As an alternative he devised a procedure based on the curvature of steel strips induced by the dents. Other things being equal, the greater the dent size the greater is the induced curvature. Almen’s procedure has evolved greatly since it was first introduced in pre-computer days. His concept of a set of identical steel strips peened for different times yielded the familiar “saturation curve” shape for arc heights plotted against peening time. For this shape he decided that the “knee” of the curve could be used as a point for defining peening intensity (aka dent capability). Unfortunately, location of this knee point varied between peen shop operators who were not required to be expert mathematicians. Ideally every operator would have been able to settle on one particular point on the curve. The term “lowest point at which the arc height increases by no more than 10%” therefore entered the vocabulary which reduced, but did not eliminate, variation
of manual knee location. With the advent of readily-available computers, however, operator-variability of knee location can now eliminated. The term “knee” was introduced to indicate the region where the “sharpness” of the saturation curve was greatest. Early drawings of saturation curves exaggerated the sharpness of the knee region, making it look nearer to the shape of a human leg (in side view when sitting). Today we have the power of computers to identify one particular point within the knee region: “the point of the curve for which the arc height increases by precisely 10% when the peening time is doubled.” This point, H,T, is no longer the measured arc height for a particular peened Almen strip but is a point on a curve that has been fitted to the data points. The difference is indicated in fig.2.
Fig.2. Derived Peening Intensity Point, H,T.
Mathematicians would argue that the point of greatest sharpness of a curve is best determined by the second differential of the curve’s equation. This concept must be dismissed in favor of the “10%” point which can be more readily appreciated by non-mathematicians. Peening intensity measurements are required for two stages of peening operations: (1) Set-up and (2) Verification.
For both stages there is a range of available measurement strategies. Within this range a strategy must be selected governed by factors such as: cost of measurement, customer satisfaction and component criticality. These factors overlap as illustrated in fig.3 on page 30. A secondary use for peening intensity measurements is that corresponding saturation curves are an indication of shot stream stability.
SET-UP MEASUREMENT STRATEGIES Specifications, such as J442 and J443, regulate the procedure

ACAdEMIC STudy Continued
30 The Shot Peener | Summer 2016
Fig.3. Factors affecting peening intensity strategy selection.
for the estimation of set-up peening intensity. A minimum of four Almen strips peened for different times is allowed in order to plot a saturation curve. The actual number used is a key strategy factor. It is important to appreciate that: (1) Every measurement point is subject to variability
(even if the shot stream is perfectly constant—which it cannot be) and
(2) The shot stream itself is subject to variability.
These variabilities are illustrated schematically in fig.4. This figure assumes that this particular shot stream has relatively-low variability—as compared to measurement variability—which is normally the case. A strategy involving low cost/quality Almen strips, inferior gauges and poor attention to technique will obviously introduce a greater measurement variability.
The basic elements of every set-up strategy are: (1) Selection of a curve-fitting program, (2) Deciding on the number of data points to be
obtained in order to produce the saturation curves and
(3) Using prior knowledge of similar peening parameters.
(1) Selection of a curve-fitting programSelection has, normally, to satisfy the requirements of SAE J2597 “Computer Generated Shot Peening Saturation Curves.” Available curve-fitting programs usually involve a fitting equation that has two parameters a and b. For example, one commonly-used fitting equation is given by:
h = a*t/(b + t) (1)
where h is arc height, a and b are the deduced parameters and t is the peening time (or its equivalent). Three-parameter equations are also available but these require more than the absolute minimum of four data points. Fig.5 shows the six-point SAE J2597 Data Set No.10 fitted using three different equations: A, B and C (two being two-parameter equations and one being a three-parameter equation). The second point in the data set is hidden by the derived intensity points because they are very similar.
Fig.5. Different fitting equations applied to SAE Data Set No. 10.
Different fitting equations must, by their very nature, have slightly different shapes. This is evident in fig.5, where equation A “flattens out” more quickly than do equations B and C. A (hopefully diminishing) number of peeners cling to the erroneous belief that saturation curves should flatten out quickly. They would therefore prefer to employ fitting equation A. That is in spite of the great weight of evidence to the contrary about actual rates of flattening. Fig.4 Schematic representation of both measurement and
shot stream variabilities.

ACAdEMIC STudy Continued
32 The Shot Peener | Summer 2016
SAE J2597 “Computer Generated Shot Peening Saturation Curves” requires that a fitting equation has to be capable of deriving a peening intensity value that is within ±0.001 inch of their published value (0.0054 in the case of Data Set No.10). This surprisingly liberal requirement is included in fig.5. All three fitting equations give derived intensity points that are both well within the required limits and also are very similar to one another. These intensities happen to be 5.49, 5.47 and 5.38 for the fitting equations A, B and C respectively. It is suggested that whatever computer program is used, it should be able to derive intensity values that are close to the published SAE Data Set values—not simply within the permitted range.
(2) Number of data points. Any decision on the number of data points to be used for set-up procedures has to involve a compromise between measurement cost, customer satisfaction and component criticality. The number of data points has to be at least four in order to satisfy specification requirements. This bare minimum is normal when measurement costs must be kept to a minimum because profit margins are small. Customers would, however, have greater confidence if a larger number of data points were being used. This is particularly important for critically-stressed components. If, however, close control of every peening parameter is being exercised, the use of only four data points has greater validity.
(3) Employing prior knowledge. Employing prior knowledge is at the heart of every intensity measurement strategy. Prior knowledge can either be stored in a shop foreman’s head or by using some form of data base. Every arc height measurement has commercial value, particularly if it is part of a data base that can filter previous measurements. Prior knowledge is used primarily for setting process parameters. Fig.6 illustrates one method by which prior knowledge can be effectively employed. This uses a Comparator version of one of the Curve Solver Suite programs (available for download at www.shotpeener.com). Assume, here, that specific processing parameters were previously employed and gave the values shown as “Reference Curve.” The same parameters were later employed in a nominally-identical set-up to give, hopefully, similar values. In this particular example the results shown as “Current Curve” and “Reference Curve” are easily compared: the saturation intensities are very similar but the corresponding ‘T’ times are substantially different. If prior knowledge of appropriate peening parameters is very limited, or even absent, then a preliminary two-strip set-up strategy can be employed. This strategy was described in a previous TSP article (“Two-Strip Setting-up and Verification Program for Peening Intensity”, Fall, 2010). In essence two strips are peened using a “best guess” of peening
variables. A two-parameter saturation curve is then derived. If the intensity yielded by this curve is within the required specification range then further strips can then be peened, at different exposure times, to make up at least the minimum required for a J443 saturation curve. Prior knowledge can have other uses such as for detecting the drift of peening intensity when using a nominally identical set of peening parameters. During a long run the peening intensity of a set shot stream can drift due to factors such as shot, nozzle and hose wear. Fig.7 is a hypothetical example that shows how drift can be detected provided the measurement strategy results in a low level of measurement variability. Fig.8 on page 34 shows how drift detection would be much more difficult if there was a much higher level of measurement variability. For both figures it is assumed that a dozen repeat intensity measurements were made during a long run of peening with set peening parameters.
VERIFICATION MEASUREMENT STRATEGIES The two types of verification measurement strategy that are
Fig.6. Comparator program illustrating difference between expected and achieved results.
Fig.7. Repeat intensity measurements at required intervals clearly indicating drift.

ACAdEMIC STudy Continued
34 The Shot Peener | Summer 2016
allowed in SAE J443 have been described fully in a recent TSP article (“Verification of Peening Intensity”, Fall, 2015). One type of strategy relates to single-holder situations and involves the peening of a single Almen strip. The second type of strategy relates to multi-holder situations with a single strip being peened at each holder.
Single-Holder StrategiesSAE J443 allows two single-holder strategies. The first is that the verification strip is to be peened for the time, T, of the peening intensity point that has been derived from the fitted saturation curve. This is illustrated in fig.9 (obtained using SAE Data Set No.5) where a peening intensity of 6.55 occurs at an amount of peening, T, of 4.71. If the amount of peening was controlled by time then it would be possible to peen a verification strip for 4.71 seconds. If, however, the amount of peening corresponded to integral units, e.g. strokes, then applying 4.71 strokes would not be possible. Hence a second strategy is allowed. This is that the amount of peening applied can be the nearest practicable integer to T—chosen as 5 in fig.9. The arc height being aimed at is to be derived from the saturation curve—which for 5 strokes would be 6.62. This is effectively the “target height” introduced for multi-holder strategies. Derivation of the target height can be done either using a plotted curve or can be calculated if the parameters of the fitting curve equation are known. As an example: for the Solver 2PF equation used in fig.9 (h= a*t/(b + t)) the derived parameters were a = 8.01 and b = 1.05 so that when t = 5 we have that h = 8.01*5/(1.05 + 5) or h = 6.62. For both strategies, the arc heights obtained must repeat the value from the saturation curve ± 0.0015 inch.
Multi-Holder StrategyA single multi-holder strategy is described in SAE J443 for which the same amount of peening is applied to every holder. Arc heights are deduced from the corresponding fixture saturation curves for this fixed amount of peening. These are called “target arc heights.” The arc heights obtained
by peening for the fixed amount of peening must repeat the target arc heights to within ± 0.0015 inch. The selected amount of peening can be either a saturation time, T, or an integral number of strokes by agreement with the customer.
COMBINED SET-UP AND VERIFICATION MEASUREMENT STRATEGIES A combination of set-up and measurement strategies is employed by a least one major shot peening company. One such combination type of strategy can be summarized as: (1) Carry out set-up peening for the chosen number of
strips, (2) Derive peening intensity and time, T, from the
set-up data, (3) Determine the appropriate verification amount of
peening and (4) Peen an additional strip for this verification amount
of peening.
Fig.10 (page 34) illustrates this type of combination strategy using the same SAE Data Set as for fig.9. The 4 points, 1, 2, 3 and 4, are obtained (not necessarily in that order) and curve-fitted. This allows the verification amount of peening to be determined. A fifth strip is then peened for this verification amount of peening. In fig.10 the corresponding arc height is shown as lying exactly on the saturation curve which would not, of course, normally be the case. The obvious advantages of this combined strategy are that (1) we can be doubly confident of the verification arc height and (2) we now have five points that yield a more reliable saturation curve than for the bare minimum four points (noting that the fifth point can be included in a recalculation of the saturation curve).
Fig.8. Repeat intensity measurements at required intervals vaguely indicating drift.
Fig.9. Single-holder verification alternatives

ACAdEMIC STudy Continued
36 The Shot Peener | Summer 2016
A second combination strategy can be summarized as; (1) Carry out a preliminary two-strip set-up strategy
based on prior knowledge, (2) Derive peening intensity and time, T, from this
preliminary set-up data, (3) Carry out peening at times indicated from (2) for the
additional number of strips required to produce an acceptable saturation curve,
(4) Plot and analyze the saturation curve, (5) Determine the appropriate verification amount of
peening and (6) Peen an additional strip for this verification amount
of peening.
CONCLUSIONSPeening intensity is a measure of the average dent capability of the individual particles that make up a shot stream. Dent capability varies from particle to particle. The established procedure of deducing the arc height at the “10% point” accurately indicates average dent capability. This procedure is, however, only part of the overall measurement strategies adopted to take account of measurement cost, customer satisfaction and component criticality. The precision of peening intensity measurement is influenced by the several factors that are involved in an overall measurement strategy. These include quality of Almen strips and gages, gage maintenance, operator training, fitting curve selection, number of points in each data set, employing prior knowledge and verification tactics. Combining set-up and verification peening offers considerable advantages. l
Fig.10. Combination of 4-point set-up and verification amount of peening.
Precision shot peen masks and fixtures for the aerospace and commercial sectors
Timely quoting • Competitive lead times An ISO 9001:2000 Certified Company
Quality Engineering Inc. Tel: 203-269-5054 Fax: 203-269-9277 Web: www.qes1.com
122 North Plains Industrial Road, Wallingford, CT 06492
For Quotations: [email protected]