A comprehensive framework for comparing water use intensity ...
32
Hadjikakou et al. (2015) – Journal of Sustainable Tourism 1 A COMPREHENSIVE FRAMEWORK FOR COMPARING WATER USE INTENSITY ACROSS DIFFERENT TOURIST TYPES Michalis Hadjikakou 1,2 *, Graham Miller 3 , Jonathan Chenoweth 2 , Angela Druckman 2 , Christos Zoumides 4 1 Water Research Centre, University of New South Wales, Sydney, NSW 2052, Australia 2 Centre for Environmental Strategy, University of Surrey, Guildford, GU2 7XH, UK 3 School of Hospitality and Tourism Management, University of Surrey, Guildford, GU2 7XH, UK 4 Energy, Environment and Water Research Center (EEWRC), The Cyprus Institute, Nicosia 2121, Cyprus Principal author contact (*) details: Dr. Michalis Hadjikakou Position: Postdoctoral Research Associate Full Postal Address: Water Research Centre, School of Civil & Environmental Engineering, University of New South Wales, NSW 2051, Australia Contact number: +61 2 9385 4151 Email address: [email protected] Please cite article as: Hadjikakou, M., Miller, G., Chenoweth, J., Druckman, A. & Zoumides, C. (2015): A comprehensive framework for comparing water use intensity across different tourist types, Journal of Sustainable Tourism, DOI: 10.1080/09669582.2015.1044753. Published online: 30 Jul 2015 To link to this article: http://dx.doi.org/10.1080/09669582.2015.1044753
-
Upload
khangminh22 -
Category
Documents
-
view
1 -
download
0
Transcript of A comprehensive framework for comparing water use intensity ...
Hadjikakou et al. (2015) – Journal of Sustainable Tourism
1
A COMPREHENSIVE FRAMEWORK FOR COMPARING WATER USE
INTENSITY ACROSS DIFFERENT TOURIST TYPES
Michalis Hadjikakou1,2
*, Graham Miller3, Jonathan Chenoweth
2, Angela Druckman
2, Christos
Zoumides4
1 Water Research Centre, University of New South Wales, Sydney, NSW 2052, Australia
2 Centre for Environmental Strategy, University of Surrey, Guildford, GU2 7XH, UK
3 School of Hospitality and Tourism Management, University of Surrey, Guildford, GU2 7XH,
UK
4 Energy, Environment and Water Research Center (EEWRC), The Cyprus Institute, Nicosia
2121, Cyprus
Principal author contact (*) details:
Dr. Michalis Hadjikakou
Position: Postdoctoral Research Associate
Full Postal Address: Water Research Centre, School of Civil & Environmental Engineering,
University of New South Wales, NSW 2051, Australia
Contact number: +61 2 9385 4151
Email address: [email protected]
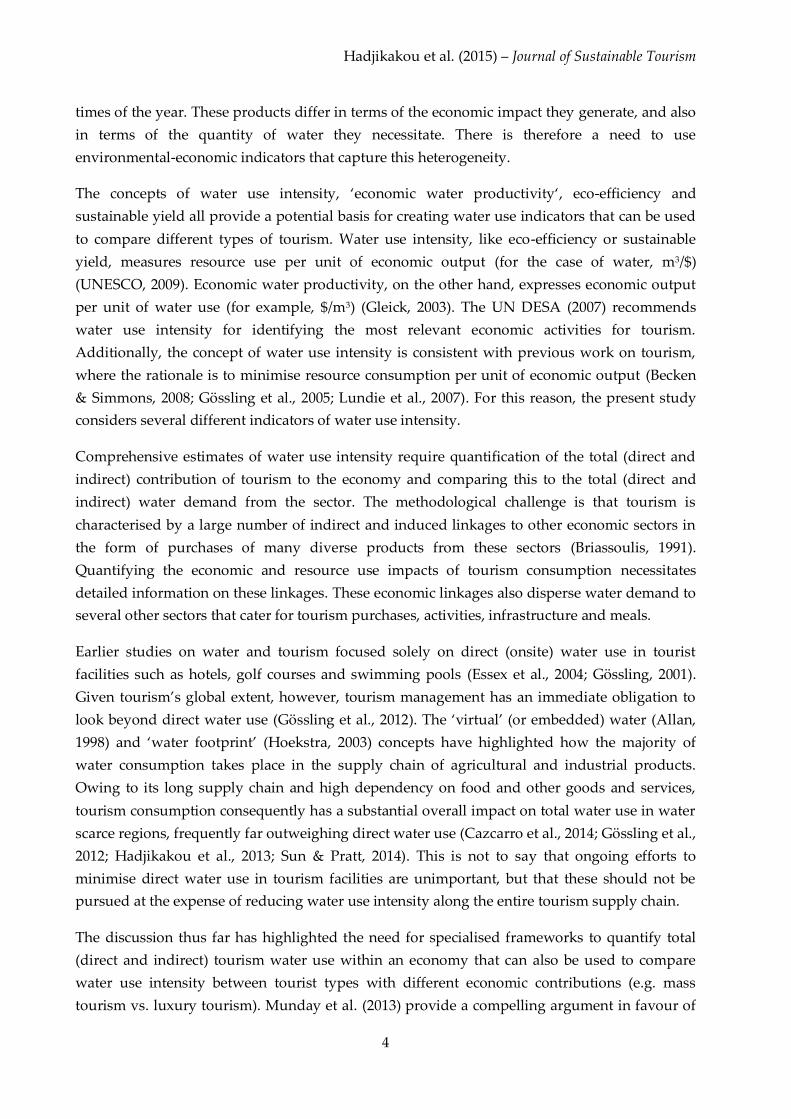
Please cite article as:
Hadjikakou, M., Miller, G., Chenoweth, J., Druckman, A. & Zoumides, C. (2015): A
comprehensive framework for comparing water use intensity across different tourist types,
Journal of Sustainable Tourism, DOI: 10.1080/09669582.2015.1044753.
Published online: 30 Jul 2015
To link to this article: http://dx.doi.org/10.1080/09669582.2015.1044753

Hadjikakou et al. (2015) – Journal of Sustainable Tourism
2
Abstract
Tourism products vary in their direct and indirect (supply chain) water use, as well as their
economic contribution. Hence, water-scarce destinations require a method to estimate and
compare water use intensity (water use in relation to economic output) for different kinds of
tourist products in order to optimise their tourism offering. The present study develops an
original framework that integrates segmentation with an Environmentally Extended Input-
Output (EEIO) framework based on detailed tourism expenditure data and Tourism Satellite
Accounts (TSAs) in order to quantify the total (direct and indirect) economic impact and water
use for multiple tourism segments. To demonstrate the rigour of the methodology it is applied
to the eastern Mediterranean island of Cyprus as a case study. The results show that cheaper
forms of tourism tend to have a significantly lower total water use and, depending on the
economic impact indicator of interest, may have above-average economic contribution per unit
of expenditure. The proposed framework provides a significant step towards achieving
sustainable water use through destination-specific estimates of water use intensity which take
into consideration segment-specific attributes. It is envisaged that this could eventually lead to
customised interventions for diverse tourism market segments.
Keywords: environmental indicators; sustainable tourism; market segmentation;
environmentally extended input–output; water footprint; environmental management
Introduction
The issue of water use by the tourism industry has been attracting considerable attention in
recent years, as demonstrated by the theme for the 2013 World Tourism Day: “Tourism and
Water”. On this occasion, the United Nations World Tourism Organization’s (UNWTO)
Secretary General highlighted the value of water as one of tourism’s most precious resources
(UNWTO, 2013a). Despite the importance of water as an input, on paper tourism appears to
have a negligible impact on global water resources, with published figures suggesting that
international tourism accounts for less than one per cent of national water use in most countries
(Gössling et al., 2012). However, water demand from tourism tends to be extremely
concentrated in space and time (Essex, Kent, & Newnham, 2004; Hadjikakou, Chenoweth, &
Miller, 2012). This can put considerable stress on local water resources, often accounting for a
significant percentage of water use in places where tourism is an important economic activity
(Gössling et al., 2012; Hadjikakou, Chenoweth, & Miller, 2013).
This stress is set to increase: in addition to being one of the world's largest industries,
generating more than 9.5% of global GDP in 2013 (WTTC, 2014b), tourism is also one of the
fastest-growing economic sectors, with new destinations constantly emerging and tourist
arrivals worldwide expected to increase by an average of 3.3% per annum from 2010 to 2030
(UNWTO, 2013c). Recent publications on the topic of tourism water use in both academic
(Cazcarro, Hoekstra, & Sánchez Chóliz, 2014; Cole, 2014; Gössling et al., 2012; Hadjikakou et al.,

Hadjikakou et al. (2015) – Journal of Sustainable Tourism
3
2013; Kasim, Gursoy, Okumus, & Wong, 2014; Sun & Pratt, 2014) and non-academic circles
(Becken, Rajan, Moore, Watt, & McLennan, 2013; Tourism Concern, 2012; UNEP-UNWTO,
2012) demonstrate the significance of the need to better quantify both direct and supply chain
water consumption in the tourism sector. In order to do so, appropriate methodologies and
relevant water use indicators that allow water-specific comparisons between different types of
tourism, must be explored. This is a prerequisite for ultimately developing sustainable
management solutions customised to specific tourism products in water scarce destinations.
Given tourism’s undeniable role in generating economic output and supporting livelihoods in
many parts of the world, efforts to sustainably use water must ideally be geared towards
maintaining or even increasing industry profits. Comprehensive methodologies for quantifying
water use should therefore incorporate both environmental and economic impact indicators.
The argument for minimising environmental impacts whilst maintaining high economic
benefits is prominent in recent sustainable tourism literature. The concepts of eco-efficiency
(Becken & Patterson, 2006; Gössling et al., 2005) and sustainable yield (Becken & Simmons,
2008; Lundie, Dwyer, & Forsyth, 2007; Northcote & Macbeth, 2006) have succeeded in
advancing the traditional economic measures of tourism yield to account for environmental
impacts, including water use (Lundie et al., 2007; Sun & Pratt, 2014).
Developing water-specific yield approaches is particularly relevant and timely for water scarce
destinations and, in particular, established tourism destinations looking to diversify their
product base. In the last decade there has been much talk of upgrading or diversifying tourism
in the Mediterranean (Bramwell, 2004; Rico-Amoros, Olcina-Cantos, & Sauri, 2009), an area
traditionally associated with ‘sun and sand’ mass tourism, with the purpose of maximising
tourism revenue. Recent studies suggest that the luxury end of the tourism market uses
considerably more water, mainly as a result of its reliance on water-intensive facilities (Hof &
Schmitt, 2011; Rico-Amoros et al., 2009; Tortella & Tirado, 2011). However, these studies
consider only direct water use and do not include any economic impact estimates.
The primary aim of the present research is to contribute towards addressing this
methodological gap. Using an environmentally extended input-output (EEIO) (Leontief, 1970)
framework which combines tourism satellite account (TSA) data and alternative market
segmentation techniques, the study develops a novel approach to comprehensively estimate
and subsequently compare total water consumption and economic impact of different tourist
types in a Mediterranean island. A secondary aim is to critically assess the potential of the
approach to generate insightful context-specific policy implications.
Quantifying tourism water use using the notion of water use intensity
The notion of generating more economic and societal utility using less water is irrefutably
attractive (Gleick, 2003). One of the challenges in the case of tourism is that it is a highly diverse
industry, offering a plethora of products that cater for different tastes and budgets at different
Hadjikakou et al. (2015) – Journal of Sustainable Tourism
4
times of the year. These products differ in terms of the economic impact they generate, and also
in terms of the quantity of water they necessitate. There is therefore a need to use
environmental-economic indicators that capture this heterogeneity.
The concepts of water use intensity, ‘economic water productivity‘, eco-efficiency and
sustainable yield all provide a potential basis for creating water use indicators that can be used
to compare different types of tourism. Water use intensity, like eco-efficiency or sustainable
yield, measures resource use per unit of economic output (for the case of water, m3/$)
(UNESCO, 2009). Economic water productivity, on the other hand, expresses economic output
per unit of water use (for example, $/m3) (Gleick, 2003). The UN DESA (2007) recommends
water use intensity for identifying the most relevant economic activities for tourism.
Additionally, the concept of water use intensity is consistent with previous work on tourism,
where the rationale is to minimise resource consumption per unit of economic output (Becken
& Simmons, 2008; Gössling et al., 2005; Lundie et al., 2007). For this reason, the present study
considers several different indicators of water use intensity.
Comprehensive estimates of water use intensity require quantification of the total (direct and
indirect) contribution of tourism to the economy and comparing this to the total (direct and
indirect) water demand from the sector. The methodological challenge is that tourism is
characterised by a large number of indirect and induced linkages to other economic sectors in
the form of purchases of many diverse products from these sectors (Briassoulis, 1991).
Quantifying the economic and resource use impacts of tourism consumption necessitates
detailed information on these linkages. These economic linkages also disperse water demand to
several other sectors that cater for tourism purchases, activities, infrastructure and meals.
Earlier studies on water and tourism focused solely on direct (onsite) water use in tourist
facilities such as hotels, golf courses and swimming pools (Essex et al., 2004; Gössling, 2001).
Given tourism’s global extent, however, tourism management has an immediate obligation to
look beyond direct water use (Gössling et al., 2012). The ‘virtual’ (or embedded) water (Allan,
1998) and ‘water footprint’ (Hoekstra, 2003) concepts have highlighted how the majority of
water consumption takes place in the supply chain of agricultural and industrial products.
Owing to its long supply chain and high dependency on food and other goods and services,
tourism consumption consequently has a substantial overall impact on total water use in water
scarce regions, frequently far outweighing direct water use (Cazcarro et al., 2014; Gössling et al.,
2012; Hadjikakou et al., 2013; Sun & Pratt, 2014). This is not to say that ongoing efforts to
minimise direct water use in tourism facilities are unimportant, but that these should not be
pursued at the expense of reducing water use intensity along the entire tourism supply chain.
The discussion thus far has highlighted the need for specialised frameworks to quantify total
(direct and indirect) tourism water use within an economy that can also be used to compare
water use intensity between tourist types with different economic contributions (e.g. mass
tourism vs. luxury tourism). Munday et al. (2013) provide a compelling argument in favour of

Hadjikakou et al. (2015) – Journal of Sustainable Tourism
5
‘consumption-based accounting1’ methods such as EEIO to concurrently estimate the
environmental and economic impacts of tourism consumption. Several tourism studies have
successfully used variants of EEIO to estimate environmental-economic impacts of tourism
consumption in different settings (Cazcarro et al., 2014; Jones & Munday, 2007; Lundie et al.,
2007; Munday et al., 2013; Sun & Pratt, 2014; Sun, 2014).
Lundie et al. (2007), Cazcarro et al. (2014), and Sun & Pratt (2014) are, to our knowledge, the
only previous tourism-related studies which explicitly quantify total water use with EEIO
frameworks. Lundie et al. (2007) estimate water use along with energy use, greenhouse gas
emissions and ecological footprint for different tourism niche markets in Australia, in an
attempt to establish trade-offs between economic and environmental objectives of tourism
policy. Their results show that tourism markets with high daily expenditure also appear to
have the highest environmental impact. Cazcarro et al. (2014) use a highly disaggregated input-
output model to estimate tourist water footprints in Spain, offering a detailed breakdown of
direct and indirect (from both local and imported products) water use. They conclude that in
order to maximise potential water savings, the tourism industry should aim to reduce the
quantity and water intensity of inputs used directly or indirectly in the production of tourist
goods and services. The latest tourism EEIO study is Sun & Pratt (2014), who estimate eco-
efficiency in terms of carbon and water use intensity for Chinese tourists in Taiwan, and
compare this to four other major country markets. Their results show that Chinese tourists have
a higher water use intensity compared to other tourists, mainly due to high expenditure on
food products.
The present study is significant because it builds on the three aforementioned water-related
EEIO studies by adding novel elements in order to create more insightful water use intensity
indicators. Firstly, segmentation and yield estimation are treated as part of an integrated
framework, as the way in which tourist types are defined plays a crucial role when performing
water use intensity comparisons. This integration is only previously seen in Becken et al. (2003)
and also provides a follow-up to AUTHORS (DATE) who emphasise the need for market
segments that go beyond country of origin distinctions between tourists. Secondly, whilst the
universal indicator for water use impact is the volume of water used, there are numerous
possible indicators for economic impact expressed in both monetary and non-monetary terms
(Dwyer & Forsyth, 2008; Pratt, 2012). A further contribution of the study is to explore
alternative water use intensity indicators which consider economic value added and
employment generation along the whole tourism supply chain. The result is a rigorous, original
1 The consumption accounting principle (CAP) attributes resource use or emissions to the end consumer
irrespective of the origin of products or services (Sun, 2014). By contrast, the production accounting
principle (PAP) attributes all resource use or emissions to the producing region. According to Munday et
al. (2013) and Sun (2014), the ideal accounting principle for capturing all carbon emissions associated
with aviation lies in between the PAP and the CAP. This argument does not apply to water accounting
where CAP is the appropriate accounting principle (as seen in Cazcarro et al., 2014).

Hadjikakou et al. (2015) – Journal of Sustainable Tourism
6
and versatile tool able to select the most useful segmentation and water use intensity indicators
in different destinations.
Methods
Case study destination
The Republic of Cyprus (hereinafter ‘Cyprus’) in the eastern Mediterranean is chosen as the
case study destination. Cyprus is an ideal choice for a number of reasons.
Firstly, it is a popular destination, with tourism established as the dominant economic sector
since the early 1980s. In 2013, around 2.4 million international tourists visited Cyprus – almost
three times the resident population of 860,000 (based on the 2011 census) (CYSTAT, 2014). In
the same year, the tourism sector made an estimated total contribution of 20.6% to GDP and
supported 22.1% of total employment (WTTC, 2014a).
Secondly, Cyprus is considerably water scarce. With an average annual precipitation of around
460mm, the climatic regime is classified as semi-arid, making it one of the European Union (EU)
member states experiencing the highest levels of water stress (Hochstrat & Kazner, 2009). As in
other Mediterranean islands, water demand can often exceed natural water availability during
the summer months, as this is when most tourists visit and is also a time when natural flows
are lacking. Future water availability is expected to be severely affected by climate change,
since the eastern Mediterranean region is considered to be an extremely sensitive ‘hotspot’
(Ludwig, Roson, Zografos, & Kallis, 2011).
Thirdly, Cyprus, traditionally a ‘sun and sand’ resort particularly popular with British tourists,
is currently attempting to upgrade its product base. The government and the tourism sector
alike are eager to diversify the tourism product in order to attract higher-spending clientele
(Adamou & Clerides, 2009).
Finally, Cyprus is a small island nation and a member of the EU. The small geographic area
(9250 km2) means that the need to account for inter-regional differences is minimised. The
economic importance of the tourism sector, along with its EU membership, also means that
Cyprus has comprehensive data on tourism, including TSAs2. With the current economic
downturn in the EU and the recent collapse of Cyprus as an offshore banking centre, the
President of the country has stressed the importance of tourism to the economy (UNWTO,
2013b). The present study is therefore a timely attempt to comprehensively quantify the total
(direct and indirect) water consumption of the tourism sector, and to compare water use
intensity between different tourist types typically present on the island.
2 TSAs are satellite accounts of the core national accounts compiled from visitor expenditure data,
industry data, and supply and use relationships in the System of National Accounts (Dwyer, Forsyth, &
Dwyer, 2010).

Hadjikakou et al. (2015) – Journal of Sustainable Tourism
7
Methodological framework
Figure 1 provides a generalised illustration of the framework employed in the present study
and suggested as a blueprint for future tourism EEIO studies. The framework consists of: (a)
establishing market segments whose water use (or other resource use) intensity is to be
subsequently compared, (b) collecting and harmonising the different types of environmental
and economic data required to run the EEIO model and (c) running the EEIO model to estimate
total environmental and economic impact for each tourist segment. Each step is subsequently
elaborated, using data specific to the present case study.
Figure 1 Simple illustration of the three-stage framework highlighting its potential to be used
iteratively for updating and refining the analysis.
(a) Market segmentation
The Cyprus Tourism Organisation (CTO) only differentiates tourists based on their country of
origin (COO), which is usually the basis for collecting and interpreting tourism data (Reid &
Reid, 1997). However, AUTHORS (DATE) have recently argued that existing COO market
segments do not accurately capture differences within large country markets. In the case of
Cyprus, grouping and targeting all UK tourists who accounted for 37-57% of annual inbound
tourism in the period 2005-2012 (CYSTAT, 2014), overlooks the considerable heterogeneity
within this important market segment. In order to better appreciate the factors that influence
(a) MARKET SEGMENTATIONDivide tourists using suitable criteria depending on variable(s) of interest
(b) EEIO MODEL SETUPMatch economic and environmental data to obtain EEIO model variables
(c) RUN EEIO MODELEstimate economic & environmental
impact for each segment
Process is iterative as aims and
data change

Hadjikakou et al. (2015) – Journal of Sustainable Tourism
8
water use and water use intensity, it is necessary to consider alternative options of
segmentation based on tourist characteristics and consumption patterns rather than on
nationality.
The process of ‘tourism market segmentation’ (UNWTO, 2007) should be seen as an integral
first step in studies in which the objective is to compare the economic and environmental
impacts (including but not restricted to water use) of different tourist types. Depending on the
kind of comparison sought, multiple appropriate segmentation criteria may need to be tested.
This is illustrated by the potential of the framework to operate iteratively, although this was not
performed in the present study (Figure 1).
The market segments considered here were recently published in AUTHORS (DATE) using a
large passenger survey dataset from the Cyprus Statistical Service (CYSTAT) consisting of
30,849 completed questionnaires from 2007. The following market segments are included:
The average inbound tourist and the main country markets for Cyprus (UK, Russia,
Germany, Sweden and Greece). This provides an established mode of comparison
between different tourists and also acts as the first layer of segmentation necessary
before forming sub-segments of the UK country market.
Three expenditure-based sub-segments of the UK country market: low spending,
medium-spending and high-spending tourists. This provides an idea of how total
expenditure influences water use and economic contribution, and can be used to
ascertain whether or not a higher expenditure produces enough economic impact to
compensate for the potential increase in direct and indirect water use.
Three sub-segments of the UK country market established using data-driven
segmentation (see Dolnicar, 2008) based on socio-demographic and behavioural visitor
characteristics: ‘luxury tourists’, ‘average non-package’ and ‘budget mass tourists’
(AUTHORS, DATE). Despite some similarity with the expenditure-based segments, this
type of segmentation provides an example of how a host of factors other than
expenditure, such as the purpose of the trip or the type and location of accommodation,
affect water use and economic impact.
(b) Data harmonisation in relation to model set-up
EEIO analysis is a top-down environmental accounting method that allows the association of
economic accounts with environmental accounts of resource use or pollution. It is based on the
input-output (IO) model (Leontief, 1936) that makes use of sectoral monetary transactions to
account for interdependencies between industries in modern economies. The fundamental
starting point in performing an IO analysis is information on the flows of products from each
economic sector to each of the other sectors (Miller & Blair, 2009). This is typically available in
the form of an input-output table (IOT) of the economy. Most statistical agencies regularly
produce IOTs as part of their System of National Accounts (SNA).
Hadjikakou et al. (2015) – Journal of Sustainable Tourism
9
The starting point for deriving the Leontief input-output model is to replace the inter-sectoral
flow terms (denoted by z) with technical coefficients, interpreted as the monetary input value
per monetary unit of output for each sector, described using the ratio:
𝑎𝑖𝑗 =𝑧𝑖𝑗
𝑥𝑗 (1)
The basic Leontief model is then based on the economic principle that total output (x) is equal
to intermediate demand plus final demand, given by:
𝐱 = 𝐀𝐱 + 𝐲
(2)
where A is the ‘direct requirements matrix’ whose elements are all the technical coefficients (a
in equation 1) for a given economy, and y is the vector of sectoral final demand. y can
correspond to final demand from any group of consumers such as households, exports or, as
performed in the present study, tourists. x is the vector of sectoral total outputs. Equation 2 is
finally rearranged in terms of x:
𝐱 = (𝐈 − 𝐀)−1𝐲
(3)
where I is an identity matrix3. (𝐈 − 𝐀)−1 is the ‘Leontief inverse’ matrix which captures an
infinite sequence of additions into a single matrix inverse, ensuring that IO analysis can cover
all supply chains at an infinite length (Murray & Lenzen, 2010). x thus represents the total
production (output) generated by each economic sector in order to satisfy final demand (y) in
the economy.
EEIO uses an extended IO model that combines economic and environmental data in order to
incorporate environmental externalities (Leontief, 1970). It makes use of the Leontief inverse
(equation 3), allowing both direct and indirect environmental pressures (resource use or
pollution) corresponding to a given final demand (y) to be estimated. In addition to the total
environmental impact, EEIO is can also trace the origin and destination responsible for the
impact. This may be carried out from a variety of perspectives: per sector, per product, or
correlated to the use of a natural resource. Common applications of EEIO include carbon
emissions (Druckman & Jackson, 2009), ecological footprint considerations (Wiedmann, Minx,
Barrett, & Wackernagel, 2006) and water use (Lenzen & Foran, 2001; Zhao et al., 2011).
The basic EEIO approach requires estimation of direct impact coefficients for each economic
sector (denoted by the vector w for water use in this case). This is a vector of resource use per
unit of output for each sector within the IO framework, calculated as:
3 I is a matrix with the same dimensions as A, with ones on the main diagonal and zeroes elsewhere.

Hadjikakou et al. (2015) – Journal of Sustainable Tourism
10
𝐰 =𝐞
𝐱 (4)
where 𝐞𝐢 is a vector of water use (in m3) by each economic sector or commodity and 𝐱𝐢 is the
previously defined vector of total sector output. The generalised expression for calculating the
total water use for any given final demand vector is given by:
𝑊𝑇 = 𝐰(𝐈 − 𝐀)−1𝐲 + 𝑊𝑑 (5)
where 𝑊𝑇 stands for total water use, and 𝑊𝑑 corresponds to direct onsite water use (in the case
of tourism, this refers to water use in places of accommodation), which needs to be added
separately since it is not contained in the Leontief inverse.
Through the addition of imports into the IOT, EEIO can also distinguish between embedded
water that originates from domestic sources and that which is imported from abroad. Cyprus is
a small nation where many products consumed by tourists and residents are imported,
implying that significant amounts of water are also imported ‘embedded’ in these products.
The simple single-region model described in equation 5 must therefore be expanded to account
for trade. There are several ways to achieve this, depending on the quality of data available and
the objectives of the study. The present study uses the two-region Proops et al. (1993)
framework and the ‘domestic technology assumption’ (DTA)4 to overcome the absence of
information on the water (resource) intensity and economic structure of the rest of the world.
Equation 5 is therefore refined as follows:
𝑊𝑇 = 𝐰(𝐈 − 𝐀𝟏)−1𝐲𝟏𝟏 + 𝐰(𝐈 − 𝐀𝟏)−1𝐁𝟐𝟏(𝐈 − 𝐀𝟏)−1𝐲𝟏𝟏
+ 𝐰(𝐈 − 𝐀𝟏)−1𝐲𝟐𝟏 + 𝑊𝑑
(6)
where WT refers to total water use, A1 is the domestic ‘direct requirements matrix’ for Cyprus,
B21 is the import matrix of products from the rest of the world to Cyprus, y11 is the final demand
for domestic products, y21 is the final demand for imported products and the rest of the terms
remain as defined in equations 1-5.
The variables w, A1, y11, y21, B21 and Wd in Equation 6 dictate the data requirements of the EEIO
framework. In terms of environmental data, the framework requires sectoral water use data (wi)
as well as data from household and tourist accommodation (Wd). The economic data required
are input-output tables (IOTs) from which to estimate A1 and B21 and TSAs from which to
derive y11 and y21 for each tourist segment.
The Cyprus Water Development Department (WDD) (2011) provides estimated water
consumption (in m3) for different sectors of the economy. Sectoral water use (e in equation 4)
allows the calculation of w. The WDD also provides information on domestic water use (Wd) for
households, estimated at 217 litres per capita per day (WDD, 2011). For tourists, the
4 This assumes that the virtual water content of imported goods is equal to that of equivalent local goods.

Hadjikakou et al. (2015) – Journal of Sustainable Tourism
11
segmentation data from step (a) on area and accommodation type and class for each segment
were used to derive spatially- and temporally- specific water use figures for tourism
accommodation from Savvides et al. (2001). This provides segment-specific Wd values.
As Cyprus does not currently release its own official IOTs, the study uses an IOT for Cyprus
from the free online World Input-Output Database (WIOD) (Timmer et al., 2012). The WIOD
IOT is a square 35 by 35 matrix. The decision to use the WIOD IOT was taken following a
comparison of sectoral value added, total intermediate inputs and gross output for the period
2005-2009 against the Cyprus National Accounts (CYSTAT, 2012), to ensure its consistency. The
WIOD IOTs are used to estimate (𝐈 − 𝐀)−1, 𝐁𝟐𝟏and also to give the values for 𝐲𝟏𝟏 and 𝐲𝟐𝟏 for
Cypriot households, which are used as a basis for comparison with the tourist segments.
In order to then estimate 𝐲𝟏𝟏 and 𝐲𝟐𝟏 for the tourist segments, it was necessary to use the latest
edition of the Cyprus TSAs for 2003-2007. This first allowed matching the expenditure patterns
of the segmented groups5 to those of the TSA classification following the procedure described
in AUTHORS (DATE). The ‘production accounts table’ in the TSAs was subsequently used to
distribute the initial expenditure into economic sectors which closely match those of the IOT
classification. APrice base conversions from purchasers’ prices into basic prices were performed
using additional data from the Cyprus National accounts, and all final demand vectors were
converted to 2007 USD prices using exchange rates provided by the WIOD (Timmer et al., 2012)
to match the IOTs. Appendix 2 shows the TSA to IOT final demand ratios along with the price
base conversion coefficients and relative shares of imports and local production for each IOT
sector.
All environmental and economic data used in the framework are for the year 2007, which
corresponds to the latest edition of the Cyprus TSAs. The use of slightly dated economic data is
common in tourism EEIO studies as these require several matching datasets rarely produced on
an annual basis (see, for example, Munday et al., 2013 and Sun & Pratt., 2014).
(c) Estimating and comparing water use and total economic impact for each tourist segment
The analysis stage aims to, firstly, explore water use variations (in terms of total direct and
indirect water use) between different tourist groups and, subsequently, differences in their
water use intensity as well as trade-offs in different indicators. The following indicators of total
(direct and indirect) economic contribution have been estimated using the EEIO model in the
present study:
The objective of the analysis stage was to produce a wealth of comparison data that allows,
firstly, an understanding of water use variations (in terms of total direct and indirect water use)
between different tourist groups and, subsequently, differences in their water use intensity as
5 Expenditure comprised of the following expenditure categories (sectors): transport, accommodation,
food and drink, clothing and footwear, health, communications, culture and recreation, and other.

Hadjikakou et al. (2015) – Journal of Sustainable Tourism
12
well as trade-offs across selected indicators. The following indicators of economic impact are
employed the present study.
Total gross value added (GVA in USD). This is defined as the value of output less the value of
intermediate consumption (OECD, 2001). The total GVA in an economy plus taxes and minus
subsidies on products is equal to gross domestic product (ONS, 2013). GVA per sector is given
in the IOT.
Total employment contribution as number of full-time jobs equivalent (FTE). This is the number of
jobs in the economy directly or indirectly supported by tourist spending. It is chosen to
complement GVA because it is a non-monetary indicator with stronger social welfare
implications. Furthermore, economic sectors with a high GVA do not necessarily employ many
people. The WIOD provides estimates of employment per sector based on the Cyprus National
Accounts.
Total GVA per American dollar (USD) of initial expenditure – This is a more composite indicator
which allows for an appreciation of the GVA generated per dollar of expenditure. It is
dependent on the pattern of expenditure as opposed to the total sum of expenditure. This
indicator has previously been used in Salma & Heaney (2004), but the current study is the first
to relate this to water use per tourist segment.
Total employment contribution per million USD of initial expenditure – Similarly to the above, this
allows for an estimation of the number of jobs generated for each million USD spent, and has
previously been used in Salma & Heaney (2004) and Dwyer et al. (2010). This is now related to
water use in the present study.
Results and analysis
This section firstly presents selected findings in order to illustrate differences in water
consumption between conventional COO markets before considering expenditure-based and
cluster analysis-derived UK sub-segments. It then considers water use intensity across all COO
and UK segments as a means to exploring the diverse impacts arising from different degrees of
overall spending and forms of tourism.
COO markets total water use
Figure 2 shows a considerable range in daily water use between tourists and households, with
the average tourist consuming almost twice as much water (1426 l) as the average Cypriot
resident (719 l). Direct water use accounts for 17-25% of total water use by tourists, with indirect
water use accounting for 75-83%. Local indirect water use makes up to 36-41% of total water
use, with imported water making up 39-42%. Slight variations between country markets are
related to differences in spending patterns. When direct water use (all of which is local) is also

Hadjikakou et al. (2015) – Journal of Sustainable Tourism
13
considered, local water use accounts for 59-61% of the total, implying that well over half the
water consumed is from within Cyprus.
Figure 2 Daily direct and indirect water for the main country markets, the average tourist and
households.
UK segment total water use
Figure 3 shows that there is considerably more variation in daily per capita water use (892-2142
l/cap/day) within the UK tourism segment than between the different country segments (Figure
2). This shows that considerable heterogeneity is lost when only considering different country
segments. Segments that spend the most money (‘luxury’ and ‘high-spending’) are the ones
associated with the highest total water use, with both of these segments consuming around
three times as much water as an average Cypriot resident.
The relative contribution of direct and indirect (local or imported) water use also shows
considerable variability, as highlighted in a comparison between the two extremes within the
UK market. In the ‘luxury’ segment, 87% of total water use comes from the supply chain (43%
31%
20%
23%
25%
21%
19%
23%
17%
35%
39%
37%
36%
38%
40%
38%
41%
34%
41%
40%
39%
40%
42%
40%
42%
0 250 500 750 1000 1250 1500 1750 2000
Average Resident
Average Tourist
Germany
Greece
UK
Russia
Sweden
Other
Water use (l/cap/day)
Direct (on-site) water use Indirect water use (local) Indirect water use (imported)

Hadjikakou et al. (2015) – Journal of Sustainable Tourism
14
of which is local and 45% of which is imported), with only 13% of water being directly used on-
site. In contrast, in the ‘package’ segment, 70% of total water use comes from the supply chain
(34% of which is local and 36% of which is imported), with 31% of total water use taking place
on-site. Thus, even though on-site water use in absolute terms does not differ widely between
the two segments, overall water use is around double in the ‘high-spending’ segment, owing
largely to higher spending to buy food and other goods that require significant inputs of water
in their production.
Figure 3 Daily direct and indirect water for different segments of the UK market.
Water use intensity indicators – all segments
Figure 4 shows that an average tourist uses 10.6 litres for every USD of total value added
generated. This is significantly less than the average Cypriot resident, who requires 17 litres in
order to generate one USD of value added. This suggests that, even though tourists use
significantly more water than local residents, they do contribute considerably more to the
economy. It therefore becomes more important to explore the range of values for different
tourist types. Once again, taking two extremes as an example, the ‘package’ segment requires
12.1 litres (14% more than the average tourist) for every USD of value added generated whereas
31%
20%
30%
27%
13%
13%
20%
31%
35%
39%
34%
35%
42%
43%
39%
34%
34%
41%
36%
38%
44%
45%
41%
36%
0 250 500 750 1000 1250 1500 1750 2000 2250
Average Resident
Average Tourist
Low-spending
Medium-spending
High-spending
Luxury
Average
Package
Water use (l/cap/day)
Direct (on-site) water use Indirect water use (local) Indirect water use (imported)

Hadjikakou et al. (2015) – Journal of Sustainable Tourism
15
the ‘luxury’ segment requires only 9.7 litres (8% less than the average tourist) for every USD of
value added. These seemingly small differences in water use intensity per USD become
substantial when multiplied by total expenditure per tourist over an entire trip.
It is evident that the higher-spending tourist segments (‘luxury’ and ‘high-spending’) tend to
generate more value added for each litre of water they use. Tourists from Greece, Russia, and
countries other than the five included (hereafter ‘Other’) also require less water than average
(10.6 l per USD value added) for every USD of value added generated. In the case of Russia and
Other this is to be expected as both have high value added contributions (see Table 1). Greece
on the other hand, is a slightly surprising result, as this country segment has a low per capita
Figure 4 Water use intensity for all tourist segments and residents.
expenditure and value added (Table 1). Understanding this result requires exploring some
additional indicators and comparing these to the original expenditure results (which indicate
the sectors of the economy receiving the initial spending).
Figure 5 is a matrix plot, designed to reveal trade-offs between different indicators. The
segments in the bottom-right quadrant (Greece, Germany and ‘medium-spending’) are the ones
which perform best in both indicators as they have a lower than average water consumption
and higher than average value added per USD. In contrast, the segments in the top-right
19.0
11.9
11.8
11.7
12.2
11.8
12.3
11.5
12.6
12.0
11.6
11.3
12.6
13.0
0.0 5.0 10.0 15.0 20.0
Average Resident
Average Tourist
Germany
Greece
UK
Russia
Sweden
Other
Low-spending (UK)
Medium-spending (UK)
High-spending (UK)
Luxury (UK)
Non-package (UK)
Package (UK)
Water use in l/cap/day per 1 USD of value added

Hadjikakou et al. (2015) – Journal of Sustainable Tourism
16
quadrant (‘high-spending’ and Russia) perform worst across both indicators, with higher than
average water use and lower than average value added per USD.
The good performance of Greece, Germany and the ‘medium-spending’ segment can be
explained by their higher proportion of spending in sectors with high value added coefficients
and low water use coefficients (see Appendix). The higher than average proportion of spending
on accommodation, transport and other expenditure categories is a characteristic shared by all
three segments. The ‘medium-spending’ segment does have lower spending on
accommodation, which gives it a lower ratio of value added to USD spent compared to the
other segments. An analysis of the IO sectors receiving the bulk of the initial or first-round
expenditure on accommodation, transport and other expenditure categories reveals that these
are all sectors with high value added in relation to output such as retail trade,
telecommunications, real estate and maintenance of motor vehicles. These are also incidentally
sectors with low to moderate water consumption coefficients (see Appendix) allowing the
segments to remain below average water use.
Figure 5 Value added per USD of tourist expenditure (in basic prices) and water use (l/cap/day) in
relation to the corresponding values of the average inbound tourist for 2007.
Figure 6 shows the relation between water use and the number of jobs supported directly and
indirectly for every million USD spent. Greece and Germany perform well again and are joined
by the UK (average) and the ‘low-spending’ segment. The presence of Greece and Germany
coupled with the absence of the ‘medium-spending’ segment suggest that the spending on
Germany
Greece UK average
Russia
Sweden
Other
Low-spending (UK)
Medium-spending (UK)
High-spending (UK) Luxury (UK)
Non-package (UK)
Package (UK)
800
1000
1200
1400
1600
1800
2000
2200
1.06 1.08 1.1 1.12 1.14 1.16 1.18 1.2 1.22 1.24
To
tal w
ate
r u
se
(l/
ca
p/d
ay)
Total value added per initial USD spent
Average water use
Average value added

Hadjikakou et al. (2015) – Journal of Sustainable Tourism
17
accommodation (spread between the retail, hotel and restaurant, and agricultural sectors)
contributes significantly to employment. The UK (average) and ‘low-spending’ segments spend
a higher percentage of their overall expenditure on food, drinks and tobacco, which are also
associated with high employment contribution. Their water use remains low mainly because
their overall spending is lower than average.
Figure 6 Total (direct and indirect) employment (jobs FTE) generated per one million USD of
expenditure and water use (l/cap/day) compared to the average inbound tourist for 2007.
Discussion
Direct water use
The results support the findings of previous studies where indirect water use dominates over
direct water use for all kinds of tourism consumption (Cazcarro et al., 2014; Gössling et al.,
2012a; Lundie et al., 2007; Yang, Hens, De Wulf, & Ou, 2011). However, direct water use still
constitutes an important percentage of overall water use for the more budget end of the market
(up to 35% for package tourists). For destinations that rely predominantly on mass tourism,
solutions to increase on-site efficiency in tourism establishments may provide the most
immediate and cost-effective way to reduce water use intensity (Becken et al., 2013; Gössling et
al., 2012a; UNEP-UNWTO, 2012).
Indirect and total water use and origin of water
Germany
Greece UK average
Russia
Sweden
Other
Low-spending (UK)
Medium-spending (UK)
High-spending (UK)
Luxury (UK)
Non-package (UK)
Package (UK)
800
1000
1200
1400
1600
1800
2000
2200
22 22.5 23 23.5 24 24.5 25 25.5 26 26.5 27
To
tal w
ate
r u
se
(l/
ca
p/d
ay)
Total employment (FTE) per million USD spent
Average water use
Average employment

Hadjikakou et al. (2015) – Journal of Sustainable Tourism
18
Summing up water use across all inbound tourism segments reveals that tourism consumption
was directly and indirectly responsible for around 21 MCMs (million m3) or 10% of the total
water use in Cyprus in 2007. Direct water use by tourism was around 4%, (WDD, 2011),
meaning that the supply chain used up around 6% of the country’s annual water resources to
satisfy approximately 2.5 million tourists. When imported water is also considered, the total is
around 34 MCMs. The results highlight the global dimension of tourism-related water
consumption (Cazcarro et al., 2014). Imports of agricultural products allow Cyprus to ‘save’
more than half of the water that would have been needed if all products which cater for tourism
had been produced locally. Some key solutions for minimising tourist water use actually lie
outside the tourism domain (for instance, by increasing water use efficiency in agriculture).
Imports of water-intensive crops like fruit and vegetables may increase as water becomes
scarcer on the island.
Water use intensity and sustainable yield implications
Adopting the perspective of Lundie et al. (2007) and Becken & Simmons (2008), tourism
management initiatives should aim to reduce water use intensity from all segments. In the
context of the present study, this could be interpreted as exploring ways to push segments
towards the ‘coveted’ bottom-right quadrant in Figures 5 and 6. In principle, this is an attractive
concept because the matrix graph may allow a prioritisation of management efforts to achieve a
higher yield. Segments in the bottom-right quadrant already have lower than average water use
so for some (for example “package”, “low” and Sweden) it may be a case of trying to increase
expenditure by the right amount (as too much may then drive water use up) to ‘push’ them into
the bottom-right quadrant. For the ones in the top-right quadrant, it may be a case of seeking
higher water efficiency in accommodation or encouraging behavioural changes.
Segments with an otherwise low per capita contribution to value added and employment (such
as Germany or Greece), have a low water use impact as well as a high contribution to
employment and value added with respect to their expenditure. Boosting expenditure and
pursuing more arrivals from these market segments (or other segments with similar
characteristics) may represent a sustainable strategy and provide a preferable option to
boosting expenditure elsewhere through diversification and attempts to target the higher end
of the market. These findings support the arguments made in previous studies with respect to
the environmental and economic advantages of maintaining a healthy mass tourism product in
Mediterranean destinations like Cyprus (Ayres, 2000; Farsari, Butler, & Prastacos, 2007;
Ioannides & Holcomb, 2003; Sharpley, 2003).
A choice to import more agricultural products in order to save local water is not likely to have a
substantial impact on value added as the contribution of the agricultural sector to GDP is low,
even when accounting for multiplier effects (see Appendix). Nevertheless, the agricultural
sector does have a relatively high contribution to employment with respect to the number of

Hadjikakou et al. (2015) – Journal of Sustainable Tourism
19
jobs it sustains directly and indirectly (see Appendix), and one of the attractions of a tourist
destination can often be the sampling of local agricultural produce by tourists. Negative
impacts on employment carry social implications and need to be evaluated. Investigating such
trade-offs in detail (for specific goods and services) requires a disaggregated EEIO model, the
need for which is further discussed below.
Framework appraisal and future research avenues
Performing segmentation as part of an integrated segmentation-yield framework has several
advantages compared to previous work. Firstly, the outputs of the segmentation procedure are
at the right level of detail and in the necessary classification to perform yield estimates.
Secondly, it allows for an in-depth appreciation of the differences between diverse tourist
groups and a better understanding of the reasons behind dissimilarities in economic impact
and/or water use. This knowledge can subsequently provide guidance on how to improve the
performance of different segments (Becken & Simmons, 2008; Lundie et al., 2007). Thirdly, the
details with respect to type of accommodation, area, and time of year of the visits allow an
accurate determination of direct water use using secondary data. The method allows spatially
and temporally weighted direct water use estimates for any given market segment. Fourthly, in
this framework, segmentation research which does not typically trace the impacts of tourism
spending is combined with more elaborate yield measures to compare the economic
contribution of groups established on the basis of their total expenditure. This also allows for an
assessment of the expenditure categories which contribute most to different measures of
economic impact.
The present framework potentially allows for estimating the performance of different types of
tourism across numerous economic and environmental indicators. Research shows that
different indicators of economic contribution often result in a different ranking of segments
(Dwyer & Forsyth, 2008; Lundie et al., 2007; Pratt, 2012). Further indicators of economic yield as
well as other environmental indicators (carbon emissions, waste, land use) may be investigated
using a similar model setup to reveal trade-offs and synergies between policy objectives in any
destination. Sun & Pratt (2014) propose the use of a weighted aggregation of criteria. The
emphasis here was on water use, value added and employment, as these are key variables of
concern in water scarce Mediterranean destinations.
Using actual and projected trends in numbers for different tourist types, the framework could
be used to evaluate the water use and economic impacts of changes in the tourism sector. For
instance, this could include increases in arrivals from certain countries or increased numbers of
golf tourists. Moreover, research based on surveys of tourists and hotel and restaurant

Hadjikakou et al. (2015) – Journal of Sustainable Tourism
20
managers could explore why different tourist types have different preferences, to better
understand consumption patterns associated with higher water use intensity.
Limitations and uncertainty – improving estimates
A number of sources of uncertainty originate from the use of the EEIO model. This includes
limitations related to the use of EEIO such as linearity and homogeneity, sector aggregation,
and the ‘domestic technology assumption’, in addition to issues specific to the present
framework.
Firstly, on the issue of linearity and homogeneity, IO analysis does not take into account
economies of scale in production as it assumes a fixed relationship between sector output and
its inputs. As the representation of flows is linear, a doubling in output requires a doubling of
inputs, thus ignoring dynamic effects such as behavioural change and response to changes in
price (Murray & Lenzen, 2010). The same linear proportionality applies to estimating
environmental impacts whereby impact of a particular product or service is linearly correlated
to expenditure.
Secondly, in almost every EEIO study there is a need for more disaggregated economic and
environmental impact estimates which would allow for investigating the effects of changes in
demand for certain products. The negative impacts arising from sector aggregation have been
stressed in previous tourism research (Briassoulis, 1991; Lundie et al., 2007). As indirect water
use is closely associated to food consumption (Gössling et al., 2012; Hadjikakou et al., 2013; Sun
& Pratt, 2014), it is imperative that the analysis is carried out at a level of disaggregation
capable of producing specific recommendations for hotel buffets or restaurant menus in order
to reduce water use intensity for different kinds of tourism consumption. This would
complement a growing literature on the critical issue of sustainable food consumption in the
tourism context (Gössling & Hall, 2013; Pratt, 2013).
The third inherent assumption of the present framework is the DTA. In reality, the water
intensity of imports may differ from that of domestic products. It is therefore widely
acknowledged that multi-region input-output (MRIO) models account for trade in a more
realistic manner (Lenzen et al., 2004; Wiedmann, 2009), which implies that studies employing
the DTA tend to be associated with larger errors in terms of estimated environmental impacts.
Since Cyprus is a water scarce country which tends to import most of its products from
European countries that are less water scarce and have higher production efficiencies, it is likely
that the DTA assumption leads to a higher embedded water content for imports than in reality
(this point was previously made in reference to Australia in Lenzen & Foran, 2001).
DTA is justified firstly because of a lack of disaggregated water coefficients for other countries
that trade with Cyprus. Additionally, it is consistent with Renault’s (2002) ‘savings’ perspective
which assumes that the volume water embedded in imported products is the volume of water
that would have been consumed if Cyprus had produced the goods domestically. This is
Hadjikakou et al. (2015) – Journal of Sustainable Tourism
21
commonly employed in EEIO water studies focusing on single countries (see, for example,
Lenzen & Foran, 2001; Sun & Pratt, 2014; Zhao et al., 2010) and where identifying the origin and
impact of water originating from abroad falls outside the scope of the study. Nonetheless, the
EEIO framework described in this study can certainly accommodate an MRIO model as a future
refinement (see Cazcarro et al., 2014).
In terms of study-specific limitations, two important issues need to be acknowledged. Firstly,
assumptions were made in estimating the original WIOD IOT based on trade data, National
Account data and price base conversions with incomplete data (Timmer et al., 2012). The
internal structure of the IOT is produced by simulation and there was no previous official IOT
to test it against. Secondly, there is no standardised procedure for allocating initial tourism
expenditure into the IO classifications. Briassoulis (1991) refers to this issue as the ‘assumed
sectoral distribution of tourist spending’. Deciding which sectors are likely to receive the initial
injection of expenditure as given in the tourism survey or the TSAs involves a significant
degree of subjectivity (Jones & Munday, 2007). The sector matching/disaggregation procedure
is admittedly a source of error however, based on previous studies, this is to be expected when
using aggregated passenger survey and TSA data to produce final demand vectors compatible
with the more disaggregated IOT structure (Jones & Munday, 2007; Lundie et al., 2007).
Quantitative assessment of uncertainty in IO models involves identifying uncertainty in the
source data and its effect on the final result. This tends to reveal that errors from over- or
under- reporting from the multitude of data sources normally used to construct IOTs are
random and result in a reduced final error once all the sources are aggregated (Murray &
Lenzen, 2010). Lenzen (2000) has estimated that errors in organisation studies lie in the 10-20%
range whereas economy-wide studies have potentially lower error margins. The water
consumption results obtained for residents of Cyprus based on the framework outlined in this
study are similar to those from previous work (Arto, Genty, Rueda-Cantuche, Villanueva, &
Andreoni, 2012; Mekonnen & Hoekstra, 2011; Steen-Olsen, Weinzettel, Cranston, Ercin, &
Hertwich, 2012), implying that the water use multipliers and the IO structure are producing
sensible results.
Conclusions
Minimising the water use impact of tourism is certainly desirable, but in a competitive industry
any water savings should ideally not compromise potential economic benefits to the receiving
country. The primary aim of the study was to deliver a methodological framework which
allows estimates of water use intensity for a variety of tourist types. The use of EEIO ensures
that both environmental and economic impacts throughout the supply chain of tourism are
captured, which allows for an appreciation of trade-offs and synergies using several indicators.
The framework developed here also integrates a segmentation procedure that allows for
comparisons between tourist market segments, as well for accurate direct water use estimates
Hadjikakou et al. (2015) – Journal of Sustainable Tourism
22
for any sub-segment of the sample. No previous study has performed such in-depth analysis of
water use in relation to economic impact at a tourism destination.
The secondary aim of the study was to test the ability of the framework to generate insightful
context-specific results. The findings from the Cyprus case study reveal significant variations in
total water use (from around 900 to 2150 l per capita daily) as well as in the relative ratios of
direct and indirect water use between segments, owing mainly to their diverse spending
patterns. Although higher-spending segments appear to have the lowest water use intensity
because their overall spending compensates for their water use, several low-spending segments
appear to offer high value added and employment contribution with respect to their
expenditure and water use. These findings caution against seeing diversification as a panacea in
tourism management, at a time when Cyprus, like other mature destinations, appears to be
investing towards the luxury end of the market.
Nonetheless, tourism is highly diverse, and so is the higher-end of the market. It is likely that
some tourists willingly pay higher prices for higher quality products with lower environmental
impact. Sustainably run higher-end resorts, could, in theory, outperform cheaper
establishments in terms of direct and indirect water, energy and other resource uses.
Ultimately, it is perhaps preferable to accept that it is difficult to define an optimal tourist type
(Becken & Simmons, 2008). Tourists will always come in an assortment of different market
segments and there is no ‘one-size-fits-all’ management approach for reducing water use (and
other environmental) impacts. Thorough quantification, offered by approaches such as the one
developed here, could help understand and minimise economic-environmental trade-offs with
the potential to inform the development of bespoke management interventions for different
forms of tourism.
Please cite article as:
Hadjikakou, M., Miller, G., Chenoweth, J., Druckman, A. & Zoumides, C. (2015): A
comprehensive framework for comparing water use intensity across different tourist types,
Journal of Sustainable Tourism, DOI: 10.1080/09669582.2015.1044753.
Published online: 30 Jul 2015
To link to this article: http://dx.doi.org/10.1080/09669582.2015.1044753

Hadjikakou et al. (2015) – Journal of Sustainable Tourism
23
References
Adamou, A., & Clerides, S. (2009). Tourism, development and growth: International evidence
and lessons for Cyprus. Cyprus Economic Policy Review, 3(2), 3-22.
Allan, J. A. (1998). Virtual water: A strategic resource global solutions to regional deficits.
Ground Water, 36(4), 545-546.
Arto, I., Genty, A., Rueda-Cantuche, J. M., Villanueva, A., & Andreoni, V. (2012). Global
resources use and pollution, volume 1 / production, consumption and trade (1995-2008).
Luxembourg: Joint Research Centre (JRC), European Commission.
AUTHORS (DATE). Re-thinking the economic contribution of tourism: Case study from a
Mediterranean island. JOURNAL .
Ayres, R. (2000). Tourism as a passport to development in small states: Reflections on Cyprus.
International Journal of Social Economics, 27(2), 114-133.
Becken, S., & Patterson, M. (2006). Measuring national carbon dioxide emissions from tourism
as a key step towards achieving sustainable tourism. Journal of Sustainable Tourism, 14(4),
323-338.
Becken, S., Rajan, R., Moore, S., Watt, M., & McLennan, C. (2013). White paper on tourism and
water. Brisbane: EarthCheck Research Institute.
Becken, S., & Simmons, D. (2008). Using the concept of yield to assess the sustainability of
different tourist types. Ecological Economics, 67(3), 420-429.
Becken, S., Simmons, D., & Frampton, C. (2003). Segmenting tourists by their travel pattern for
insights into achieving energy efficiency. Journal of Travel Research, 42(1), 48-56.
Bramwell, B. (2004). Mass tourism, diversification and sustainability in southern Europe’s
coastal regions. In B. Bramwell (Ed.), Coastal mass tourism: Diversification and sustainable
development in southern Europe (pp. 1-31). Clevedon: Channel View Publications.
Briassoulis, H. (1991). Methodological issues: Tourism input-output analysis. Annals of Tourism
Research, 18(3), 485-495.
Cazcarro, I., Hoekstra, A. Y., & Sánchez Chóliz, J. (2014). The water footprint of tourism in
Spain. Tourism Management, 40, 90-101.
Cole, S. (2014). Tourism and water: From stakeholders to rights holders, and what tourism
businesses need to do. Journal of Sustainable Tourism, 22(1), 89-106.
CYSTAT. (2012). National economic accounts 2011. Nicosia, Cyprus: Cyprus Statistical
Service/Press and Information Office.

Hadjikakou et al. (2015) – Journal of Sustainable Tourism
24
CYSTAT. (2014). Cyprus statistical service homepage. Retrieved April 12, 2014 from
http://www.mof.gov.cy/mof/cystat/statistics.nsf/index_gr/index_gr?OpenDocument.
Dolnicar, S. (2008). Market segmentation in tourism. In A. Woodside, & D. Martin (Eds.), (pp.
129-150). Cambridge: CABI.
Druckman, A., & Jackson, T. (2009). The carbon footprint of UK households 1990–2004: A socio-
economically disaggregated, quasi-multi-regional input–output model. Ecological
Economics, 68(7), 2066-2077.
Dwyer, L., & Forsyth, P. (2008). Economic measures of tourism yield: What markets to target?
International Journal of Tourism Research, 10(2), 155-168.
Dwyer, L., Forsyth, P., & Dwyer, W. (2010). Tourism economics and policy. Bristol: Channel View
Publications.
Essex, S., Kent, M., & Newnham, R. (2004). Tourism development in Mallorca: Is water supply a
constraint? Journal of Sustainable Tourism, 12(1), 4-28.
Farsari, Y., Butler, R., & Prastacos, P. (2007). Sustainable tourism policy for Mediterranean
destinations: Issues and interrelationships. International Journal of Tourism Policy, 1(1), 58-78.
Gleick, P. H. (2003). Water use. Annual Review of Environment and Resources, 28(1), 275-314.
Gössling, S. (2001). The consequences of tourism for sustainable water use on a tropical island:
Zanzibar, Tanzania. Journal of Environmental Management, 61(2), 179-191.
Gössling, S., & Hall, C. M. (2013). Sustainable culinary systems. In S. Gössling, & C. M. Hall
(Eds.), Sustainable culinary systems: Local foods, innovation, tourism and hospitality (pp. 3-44).
Abingdon: Routledge.
Gössling, S., Peeters, P., Ceron, J. P., Dubois, G., Patterson, T., & Richardson, R. B. (2005). The
eco-efficiency of tourism. Ecological Economics, 54(4), 417-434.
Gössling, S., Peeters, P., Hall, C. M., Ceron, J. P., Dubois, G., Lehmann, L. V., & Scott, D. (2012a).
Tourism and water use: Supply, demand, and security. an international review. Tourism
Management, 33(1), 1-15.
Hadjikakou, M., Chenoweth, J., & Miller, G. (2012). Water and tourism. In. A. Holden & D.A.
Fennell (Eds.), The Routledge Handbook of Tourism and the Environment (pp. 435-446),
Abingdon, Oxon: Routledge.
Hadjikakou, M., Chenoweth, J., & Miller, G. (2013). Estimating the direct and indirect water use
of tourism in the eastern Mediterranean. Journal of Environmental Management, 114, 548-556.
Hochstrat, R. & Kazner, C. (2009). Case study report Cyprus: Flexibility in coping with water
stress and integration of different measures. TECHNEAU, European Commission.
Hadjikakou et al. (2015) – Journal of Sustainable Tourism
25
Hoekstra, A. Y. (2003). Virtual water trade. Delft, The Netherlands: IHE Delft.
Hof, A., & Schmitt, T. (2011). Urban and tourist land use patterns and water consumption:
Evidence from Mallorca, Balearic Islands. Land use Policy, 28(4), 792-804.
Ioannides, D., & Holcomb, B. (2003). Misguided policy initiatives in small-island destinations:
Why do up-market tourism policies fail? Tourism Geographies, 5(1), 39-48.
Jones, C., & Munday, M. (2007). Exploring the environmental consequences of tourism: A
satellite account approach. Journal of Travel Research, 46(2), 164.
Kasim, A., Gursoy, D., Okumus, F., & Wong, A. (2014). The importance of water management
in hotels: A framework for sustainability through innovation. Journal of Sustainable Tourism,
22(7), 1090-1107.
Lenzen, M. (2000). Errors in conventional and Input‐Output—based Life—Cycle inventories.
Journal of Industrial Ecology, 4(4), 127-148.
Lenzen, M., & Foran, B. (2001). An input-output analysis of Australian water usage. Water
Policy, 3(4), 321-340.
Lenzen, M., Pade, L. L., & Munksgaard, J. (2004). CO2 multipliers in multi-region input-output
models. Economic Systems Research, 16(4), 391-412.
Leontief, W. (1936). Quantitative input and output relations in the economic systems of the
United States. The Review of Economic Statistics, 18(3), 105-125.
Leontief, W. (1970). Environmental repercussions and the economic structure: An input-output
approach. The Review of Economics and Statistics, 52(3), 262-271.
Ludwig, R., Roson, R., Zografos, C., & Kallis, G. (2011). Towards an inter-disciplinary research
agenda on climate change, water and security in southern Europe and neighboring
countries. Environmental Science & Policy, 14, 794-803.
Lundie, S., Dwyer, L., & Forsyth, P. (2007). Environmental-economic measures of tourism yield.
Journal of Sustainable Tourism, 15(5), 503-519.
Mekonnen, M. M., & Hoekstra, A. Y. (2011). National water footprint accounts: The green, blue and
grey water footprint of production and consumption. Delft, the Netherlands: UNESCO-IHE
Institute for Water Education.
Miller, R. E., & Blair, P. D. (2009). Input-output analysis: Foundations and extensions (2nd ed.).
Cambridge: Cambridge University Press.
Munday, M., Turner, K., & Jones, C. (2013). Accounting for the carbon associated with regional
tourism consumption. Tourism Management, 36, 35-44.

Hadjikakou et al. (2015) – Journal of Sustainable Tourism
26
Murray, J., & Lenzen, M. (2010). Introduction to input-output analysis. In J. Murray, & R. Wood
(Eds.), The sustainability practitioner's guide to input-output analysis (pp. 3-22). Champaign,
Ill: Common Ground Publishing.
Northcote, J., & Macbeth, J. (2006). Conceptualizing yield: Sustainable tourism management.
Annals of Tourism Research, 33(1), 199-220.
OECD. (2001). Glossary of statistical terms. Retrieved May 10, 2012, Source:
http://stats.oecd.org/glossary/detail.asp?ID=1184.
ONS. (2013). The relationship between gross value added (GVA) and gross domestic product
(GDP). Retrieved 15 October, 2013 from http://www.ons.gov.uk/ons/guide-
method/method-quality/specific/economy/national-accounts/gva/relationship-gva-and-
gdp/gross-value-added-and-gross-domestic-product.html.
Pratt, S. (2012). Tourism yield of different market segments: A case study of Hawaii. Tourism
Economics, 18(2), 373-391.
Pratt, S. (2013). Minimising food miles: Issues and outcomes in an ecotourism venture in fiji.
Journal of Sustainable Tourism, 21(8), 1148-1165.
Proops, J. L. R., Faber, M., & Wagenhals, G. (1993). Reducing CO2 emissions: A comparative input-
output study for Germany and the UK. Heidelberg: Springer-Verlag Berlin.
Reid, L. J., & Reid, S. D. (1997). Traveler geographic origin and market segmentation for small
island nations: The Barbados case. Journal of Travel & Tourism Marketing, 6(3-4), 5-21.
Renault, D. (2003). Value of virtual water in food: Principles and virtues Value of Water
Research Report Series No.12. Delft, the Netherlands: UNESCO-IHE.
Rico-Amoros, A. M., Olcina-Cantos, J., & Sauri, D. (2009). Tourist land use patterns and water
demand: Evidence from the western Mediterranean. Land use Policy, 26(2), 493-501.
Salma, U., & Heaney, L. (2004). Proposed methodology for measuring yield. Tourism Research
Report (the Journal of Tourism Research Australia), 6(1), 73-81.
Savvides, L., Dörflinger, G., & Alexandrou, K. (2001). The assessment of water demand of Cyprus.
FAO Land and Water Development Division.
Sharpley, R. (2003). Tourism, modernisation and development on the island of Cyprus:
Challenges and policy responses. Journal of Sustainable Tourism, 11(2-3), 246-265.
Steen-Olsen, K., Weinzettel, J., Cranston, G., Ercin, A. E., & Hertwich, E. G. (2012). Carbon, land,
and water footprint accounts for the European Union: Consumption, production, and
displacements through international trade. Environmental Science & Technology, 46, 10883-
10891.

Hadjikakou et al. (2015) – Journal of Sustainable Tourism
27
Sun, Y. (2014). A framework to account for the tourism carbon footprint at island destinations.
Tourism Management, 45, 16-27.
Sun, Y., & Pratt, S. (2014a). The economic, carbon emission, and water impacts of Chinese
visitors to Taiwan: Eco-efficiency and impact evaluation. Journal of Travel Research, DOI:
10.1177/0047287513517420.
Timmer, M., Erumban, A. A., Francois, J., Genty, A., Gouma, R., Los, B., . . . de Vries, G. J.
(2012). The world input-output database (WIOD): Contents, Sources and methods. Source:
http://www.wiod.org: WIOD.
Tortella, B. D., & Tirado, D. (2011). Hotel water consumption at a seasonal mass tourist
destination. the case of the island of Mallorca. Journal of Environmental Management, 92(10),
2568-2579.
Tourism Concern. (2012). Water equity in tourism: A human right, a global responsibility. London:
Tourism Concern. Source: http://www.tourismconcern.org.uk/uploads/Water-Equity-
Tourism-Report-TC.pdf.
UN DESA. (2007). Indicators of sustainable development: Guidelines and methodologies. New York:
United Nations Department of Economic and Social Affairs.
UNEP-UNWTO. (2012). Tourism in the green economy – background report. Madrid: UNWTO.
UNESCO. (2009). Monitoring progress in the water sector: A selected set of indicators. New York:
United Nations.
UNWTO. (2007). Handbook on tourism market segmentation - maximising marketing effectiveness.
Madrid: World Tourism Organization and European Travel Commission.
UNWTO. (2013a). Message by UNWTO secretary-general taleb rifai. Retrieved 06 November,
2013, Source: http://wtd.unwto.org/en/content/unwtosg.
UNWTO. (2013b). President of Cyprus – tourism key for the country. Retrieved September 10,
2013, Source: http://media.unwto.org/en/press-release/2013-06-05/president-cyprus-
tourism-key-country.
UNWTO. (2013c). UNWTO Tourism Highlights, 2013 edition. Madrid: World Tourism
Organization (UNWTO).
WDD. (2011). Water demand estimates. In Ministry of Agriculture, Natural Resources and
Environment. Nicosia: Cyprus Water Development Department (WDD).
Wiedmann, T. (2009). A review of recent multi-region input–output models used for
consumption-based emission and resource accounting. Ecological Economics, 69(2), 211-
222.

Hadjikakou et al. (2015) – Journal of Sustainable Tourism
28
Wiedmann, T., Minx, J., Barrett, J., & Wackernagel, M. (2006). Allocating ecological footprints to
final consumption categories with input-output analysis. Ecological Economics, 56(1), 28-48.
WTTC. (2014a). Economic Impact 2013: Cyprus. London: World Travel and Tourism Council
(WTTC).
WTTC. (2014b). Economic Impact of Travel & Tourism 2014 annual update: Summary. London:
World Travel and Tourism Council (WTTC).
Yang, M., Hens, L., De Wulf, R., & Ou, X. (2011). Measuring tourist’s water footprint in a
mountain destination of northwest Yunnan, China. Journal of Mountain Science, 8(5), 682-
693.
Zhao, X., Yang, H., Yang, Z., Chen, B., & Qin, Y. (2010). Applying the Input-Output Method to
Account for Water Footprint and Virtual Water Trade in the Haihe River Basin in China.
Environmental Science & Technology, 44(23), 9150-9156.

Hadjikakou et al. (2015) – Journal of Sustainable Tourism
29
Table 1. Economic impact indicators for all tourist segments in current basic USD prices for 2007.
Segment Daily
expenditure
Total
Value Added
Employment
(per 1000
tourists)
Final
demand Total Output
VA per USD
spent
Employment
per USD
million
($) ($) FTE ($) ($) - FTE
Average Tourist 106.09 120.27 2.56 146.93 201.92 1.13 24.13
Germany 100.28 118.26 2.58 144.14 198.27 1.18 25.73
Greece 79.87 96.94 2.13 117.85 162.36 1.21 26.67
UK 98.47 109.54 2.30 133.94 183.81 1.11 23.36
Russia 131.84 148.34 3.17 181.33 249.13 1.13 24.04
Sweden 88.73 95.87 1.97 117.25 160.63 1.08 22.20
Other 130.35 152.35 3.33 185.96 256.26 1.17 25.55
Low spenders 63.43 70.62 1.46 86.12 117.92 1.11 23.02
Medium spenders 78.59 89.43 1.87 108.93 149.38 1.14 23.79
High spenders 167.56 185.36 3.92 227.04 311.85 1.11 23.39
Luxury 157.10 178.48 3.84 218.33 300.34 1.14 24.44
Non-package 90.91 99.32 2.08 121.77 167.19 1.09 22.88
Package 71.10 79.25 1.64 96.70 132.48 1.11 23.07

Hadjikakou et al. (2015) – Journal of Sustainable Tourism
30
Appendix - Direct and total water use and economic contribution coefficients based on sectoral output and the Leontief inverse matrix.
ECONOMIC SECTOR
Direct water
use
Total water
use
Direct VA Total VA Direct Employment Total Employment l /USD l /USD VA/Output VA/Output # of jobs/1M Output # of jobs/1M Output
1 Agriculture, Hunting, Forestry and Fishing 152.600 167.100 0.452 0.688 18.574 23.942 2 Mining and Quarrying 10.800 11.000 0.563 0.775 5.739 8.728 3 Food, Beverages and Tobacco 1.500 19.600 0.275 0.663 7.316 16.219 4 Textiles and Textile Products 0.200 2.400 0.377 0.665 22.091 29.150 5 Leather, Leather and Footwear 0.200 1.100 0.485 0.757 14.399 19.935 6 Wood and Products of Wood and Cork 0.200 1.100 0.372 0.659 11.602 18.645 7 Pulp, Paper, Paper , Printing and Publishing 0.200 0.400 0.402 0.689 9.635 14.950 8 Chemicals and Chemical Products 0.600 0.900 0.356 0.586 7.943 12.304 9 Rubber and Plastics 0.200 0.400 0.372 0.567 10.626 14.269 10 Other Non-Metallic Mineral 3.700 5.500 0.307 0.673 4.821 10.363 11 Basic Metals and Fabricated Metal 0.200 0.400 0.337 0.436 8.635 10.203 12 Machinery, Nec 0.100 0.200 0.357 0.517 9.814 12.677 13 Electrical and Optical Equipment 0.100 0.300 0.223 0.447 5.280 9.495 14 Transport Equipment 0.200 0.300 0.391 0.623 10.064 14.278 15 Manufacturing, Nec; Recycling 0.200 0.700 0.368 0.627 12.921 18.855 16 Electricity, Gas and Water Supply 0.100 0.200 0.428 0.446 1.800 1.984 17 Construction 0.000 0.800 0.459 0.717 10.033 14.522 18 Sale, Maintenance and Repair of Motor
Vehicles
0.000 0.100 0.563 0.864 15.981 18.425 19 Wholesale Trade and Commission Trade 0.000 0.100 0.607 0.802 12.377 16.036 20 Retail Trade 0.000 0.100 0.635 0.886 22.018 24.870 21 Hotels and Restaurants 0.000 4.200 0.522 0.792 15.292 20.673 22 Inland Transport 0.000 0.000 0.524 0.694 19.452 22.255 23 Water Transport 0.000 0.100 0.477 0.538 13.607 14.629 24 Air Transport 0.000 0.300 0.249 0.471 3.421 7.455 25 Other Supporting and Auxiliary Transport
Activities
0.000 0.200 0.597 0.766 9.556 12.147 26 Post and Telecommunications 0.000 0.000 0.629 0.864 5.773 8.363 27 Financial Intermediation 0.000 0.000 0.764 0.933 8.970 11.521 28 Real Estate Activities 0.000 0.200 0.732 0.917 1.067 4.422 29 Renting of M&Eq and Other Business
Activities
0.000 0.100 0.669 0.890 12.317 15.773 30 Public Admin and Defence; Compulsory Social
Security
0.000 0.100 0.693 0.802 12.861 14.601 31 Education 0.000 0.700 0.874 0.942 17.642 18.663 32 Health and Social Work 0.000 0.200 0.665 0.767 14.355 16.350 33 Other Community, Social and Personal
Services
0.000 0.200 0.663 0.879 28.121 31.456
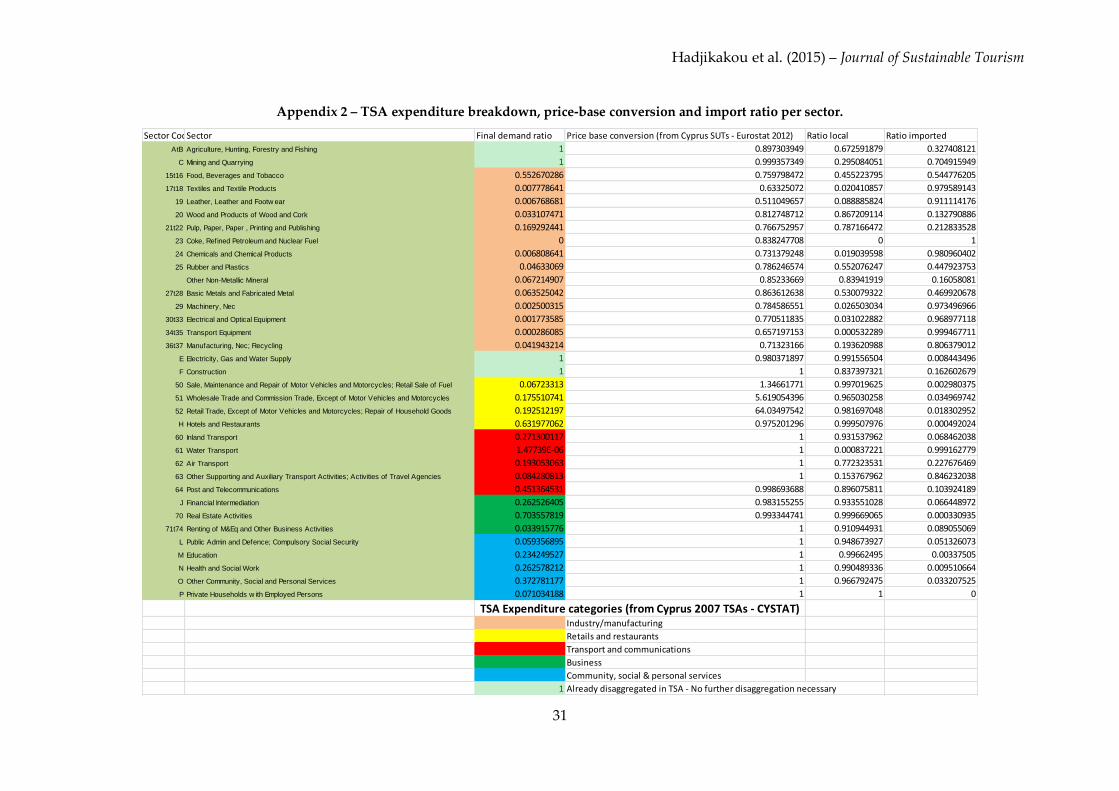
Hadjikakou et al. (2015) – Journal of Sustainable Tourism
31
Appendix 2 – TSA expenditure breakdown, price-base conversion and import ratio per sector.
Sector CodeSector Final demand ratio Price base conversion (from Cyprus SUTs - Eurostat 2012) Ratio local Ratio imported
AtB Agriculture, Hunting, Forestry and Fishing 1 0.897303949 0.672591879 0.327408121
C Mining and Quarrying 1 0.999357349 0.295084051 0.704915949
15t16 Food, Beverages and Tobacco 0.552670286 0.759798472 0.455223795 0.544776205
17t18 Textiles and Textile Products 0.007778641 0.63325072 0.020410857 0.979589143
19 Leather, Leather and Footw ear 0.006768681 0.511049657 0.088885824 0.911114176
20 Wood and Products of Wood and Cork 0.033107471 0.812748712 0.867209114 0.132790886
21t22 Pulp, Paper, Paper , Printing and Publishing 0.169292441 0.766752957 0.787166472 0.212833528
23 Coke, Refined Petroleum and Nuclear Fuel 0 0.838247708 0 1
24 Chemicals and Chemical Products 0.006808641 0.731379248 0.019039598 0.980960402
25 Rubber and Plastics 0.04633069 0.786246574 0.552076247 0.447923753
Other Non-Metallic Mineral 0.067214907 0.85233669 0.83941919 0.16058081
27t28 Basic Metals and Fabricated Metal 0.063525042 0.863612638 0.530079322 0.469920678
29 Machinery, Nec 0.002500315 0.784586551 0.026503034 0.973496966
30t33 Electrical and Optical Equipment 0.001773585 0.770511835 0.031022882 0.968977118
34t35 Transport Equipment 0.000286085 0.657197153 0.000532289 0.999467711
36t37 Manufacturing, Nec; Recycling 0.041943214 0.71323166 0.193620988 0.806379012
E Electricity, Gas and Water Supply 1 0.980371897 0.991556504 0.008443496
F Construction 1 1 0.837397321 0.162602679
50 Sale, Maintenance and Repair of Motor Vehicles and Motorcycles; Retail Sale of Fuel 0.06723313 1.34661771 0.997019625 0.002980375
51 Wholesale Trade and Commission Trade, Except of Motor Vehicles and Motorcycles 0.175510741 5.619054396 0.965030258 0.034969742
52 Retail Trade, Except of Motor Vehicles and Motorcycles; Repair of Household Goods 0.192512197 64.03497542 0.981697048 0.018302952
H Hotels and Restaurants 0.631977062 0.975201296 0.999507976 0.000492024
60 Inland Transport 0.271300117 1 0.931537962 0.068462038
61 Water Transport 1.47739E-06 1 0.000837221 0.999162779
62 Air Transport 0.193053063 1 0.772323531 0.227676469
63 Other Supporting and Auxiliary Transport Activities; Activities of Travel Agencies 0.084280813 1 0.153767962 0.846232038
64 Post and Telecommunications 0.451364531 0.998693688 0.896075811 0.103924189
J Financial Intermediation 0.262526405 0.983155255 0.933551028 0.066448972
70 Real Estate Activities 0.703557819 0.993344741 0.999669065 0.000330935
71t74 Renting of M&Eq and Other Business Activities 0.033915776 1 0.910944931 0.089055069
L Public Admin and Defence; Compulsory Social Security 0.059356895 1 0.948673927 0.051326073
M Education 0.234249527 1 0.99662495 0.00337505
N Health and Social Work 0.262578212 1 0.990489336 0.009510664
O Other Community, Social and Personal Services 0.372781177 1 0.966792475 0.033207525
P Private Households w ith Employed Persons 0.071034188 1 1 0
Industry/manufacturing
Retails and restaurants
Transport and communications
Business
Community, social & personal services
1 Already disaggregated in TSA - No further disaggregation necessary
TSA Expenditure categories (from Cyprus 2007 TSAs - CYSTAT)

Hadjikakou et al. (2015) – Journal of Sustainable Tourism
32
Please cite article as:
Hadjikakou, M., Miller, G., Chenoweth, J., Druckman, A. & Zoumides, C. (2015): A
comprehensive framework for comparing water use intensity across different tourist types,
Journal of Sustainable Tourism, DOI: 10.1080/09669582.2015.1044753.
Published online: 30 Jul 2015
To link to this article: http://dx.doi.org/10.1080/09669582.2015.1044753