An exploratory study of fault-proneness in evolving aspect-oriented programs
Upload
independentCategory
view
10download
0
Comparing Fault�Proneness
Estimation Models
P� Bellini� I� Bruno� P� Nesi� D� Rogai
Department of Systems and Informatics� University of Florence
Via di S� Marta �� ������ Florence� Italy
http���www�dsi�uni�it�nesi� nesi�dsi�uni�it� tel� ��� ��� �������� fax� ��� ��� �������
Abstract
Over the last years� software quality has become
one of the most important requirement in the devel�
opment of systems� Fault�proneness estimation could
play a key role in quality control of software prod�
ucts� In this area� much e�ort has been spent in
de�ning metrics and identifying models for system as�
sessment� Using these metrics to assess which parts of
the system are more fault�proneness is of primary im�
portance� This paper reports a research study begun
with the analysis of more than ��� metrics and aimed
at producing suitable models for fault�proneness esti�
mation and prediction of software modules��les� The
objective has been to �nd a compromise between the
fault�proneness estimation rate and the size of the es�
timation model in terms of number of metrics used in
the model itself� To this end� two di�erent method�
ologies have been used� compared� and some synergies
exploited� The methodologies were the logistic regres�
sion and the discriminant analyses� The correspond�
ing models produced for fault�proneness estimation
and prediction have been based on metrics address�
ing di�erent aspects of computer programming� The
comparison has produced satisfactory results in terms
of fault�proneness prediction� The produced models
have been cross validated by using data sets derived
from source codes provided by two application sce�
narios�
Index terms� maintenance� fault�proneness estima�
tion� fault�proneness prediction� cross validation� em�
pirical validation�
�� Introduction
Software reliability is one of the most important
features for many software applications� In many
cases� it is considered the most relevant quality indi�
cator of software modules� A particular attention to
this feature is given by companies that develop com�
munication systems embedded with real�time con�
straints and medical applications� In both cases� a
high reliability has to be guaranteed to limit dam�
ages and high maintenance costs� High reliability fre�
quently implies high investments for software testing�
veri�cation and validation� These activities are very
expensive to be exhaustively performed� on the other
hand� their costs can be reduced thanks to methods
and models for estimating the fault�proneness of sys�
tem modules� thus allowing the identi�cation of the
most critical components that have to be more care�
fully veri�ed ��� � The details about software model
veri�cation and validation and improvement are not
taken into account in this paper� A software mod�
ule is stated to be fault�prone when there is a high
risk that a fault will be discovered during its opera�
tive work ��� � Typically when a software module has
been identi�ed as fault�prone� it can be veri�ed and
tested more accurately� This increases the probabil�
ity of identifying future bugs and reduces the risks of
faults and thus the maintenance costs�
In order to estimate�predict the fault�proneness of
software modules several di�erent technologies and
models have been proposed� in the literature� They
can be classi�ed into several groups� Logistic Regres�
sions �� � �� � ��� � Discriminant Analysis ��� � ��� �
Discriminant power ��� � Discriminant Coordinates
��� � Optimized reduction sets �� � Neural Networks

�� � fuzzy Classi�cation �� � Classi�cation and Regres�
sion Trees ��� �
Most of these solutions� the aim is to propose a
technique� capable to create a model for estimat�
ing the fault�proneness of software modules or classes
in the event of Object�Oriented programming lan�
guages� The models are typically based on set of
technical low�level metrics that can be estimated by
processing the source code� In many cases� the met�
rics of the model are selected from a larger set of pos�
sible metrics according to the model de�nition pro�
cess itself� The reduction in the number of metrics
allows obtaining a model that can be used to obtain
easier and faster fault�proneness estimations� In ad�
dition� the identi�cation of a restricted number of
metrics allows also to identifying better the techni�
cal aspects related to the fault�proneness of a given
software module in a given context or software type�
This identi�cation allows providing some guidelines
for a more careful veri�cation�validation of software
modules� for example� the metric which was more rel�
evant in estimating the fault�proneness of a source
can denote which kind of additional test should be
performed on such source�
Once the model is obtained� it has to be assessed
and validated in order to con�rm the con�dence of
the obtained results� Frequently� the validation is
performed by using empirical and statistical signi��
cance of coe�cients to verify the con�dence of the
numbers that are the model parameters� Other types
of approaches are based on cross�validation� a part
of the data set a data subset is used to create the
model typically for training or model de�nition and
the other subset to perform the validation�
As it has been highlighted in many research works
cited above� only a few metrics are relevant to ob�
tain a good fault�proneness estimation�prediction of
software modules� An investigation on how all met�
rics are related to fault�proneness estimation and
how many of these metrics are needed to obtain a
good model has been performed in many papers� In
many cases� the selected metrics covered di�erent ar�
eas�features of software systems and the capability
of a model with respect to the others is based on the
combination of the mathematical model and the met�
rics which produce estimation� In fact� in some cases�
it occurs that the metrics producing high quality re�
sults with a model are not capable to provoke similar
rates when they are used in other models� The large
number of metrics selected as independent variables
and the several aspects taken into account by pre�
vious works� suggested that models including met�
rics that consider di�erent aspects can be suitably
used for de�ning model for fault proneness estima�
tion�prediction� This assumption has been also par�
tially supported in �� � where the model obtained rel�
evant results� This paper con�rms that a model com�
prised of metrics that take into account several as�
pects coupling and cohesion� structural� functional
can be suitably applied to faulty class identi�cation
obtaining a very high value of con�dence� The exper�
iments reported in this paper were based on the data
sets brie�y described in the following�
The main goal of the study reported in this pa�
per has been to de�ne and validate models for fault�
proneness estimation� The planned goal was mainly
to de�ne a model independent from a speci�c soft�
ware context with fault�proneness estimation greater
than the ��� the meaning of this number will be�
come clearer later in the paper� limiting the number
of metrics used in the model to a manageable number�
that could be less than ����� metrics�
For this purpose� two di�erent methodologies
for the production of fault�proneness models have
been considered� statistical analysis based on logis�
tic regression� discriminant analysis based on risk�
threshold� The starting point was to collect the mea�
sures of several metrics available in the literature� for
the modules��les of two real industrial software sys�
tems� The �rst goal of the performed analysis and
comparison of the di�erent methodologies has been to
verify if the two models lead to extract the common
metrics from the larger initial set of metrics� A part of
the work was aimed at identifying a model for fault�
proneness estimation independent on the project con�
text� company� methodology� software tool domain
and development people� etc� It has been also inter�
esting to compare the results which can be obtained
by statistical and discriminant analysis in order to
verify which of them can be better ranked in fault�
proneness estimation� on the basis of the same data
sets and metrics�
This paper is organized as follows� In Section �� the
statistical technique based on principal components
and logistic regression is described� In Section �� the
discriminant analysis on risk�threshold is explained�
�

Section � reports the description of the data sets used
for the empirical validation and for the cross valida�
tion of the proposed models for fault�proneness es�
timation� In Section �� the experimental results are
reported comparing� statistical analysis and discrim�
inant analysis models� Conclusions are drawn in Sec�
tion ��
� Statistical Techniques for Data Analysis
Several statistical techniques have been applied for
de�ning software fault�proneness models see �� � �� �
��� � To this end two commonly used statistical tech�
niques have been adopted� The former is the principal
component analysis� while the latter is the multivari�
ate logistic regression�
The Principal Component Analysis PCA �� is
typically used to extract Principal Components PCs
from the variance of a set of variables� Principal Com�
ponents PCs are the orthogonal linear combinations
of variables whose variance is equal to those observed�
The �rst PC is the linear combination of variables
which explain the maximum amount of variance in
the data set� The other PCs are orthogonal to the
previously extracted components and explain in turn
the maximum amount of the residual variance� Usu�
ally only a small subset of all the variables has a large
coe�cient loading in a PC� and therefore only these
variables should be considered as signi�cant from a
statistical point of view� The variables having a high
loading usually identify the dimension captured� even
if a certain degree of interpretation is required� In or�
der to simplify the structure of the PCs� a rotation of
the components is usually performed� This operation
tends to reduce the loading of the coe�cients that
were small in the component matrix and to increase
the loading of the already signi�cant components� In
this paper� the Varimax rotation method has been
adopted �� �
� Discriminant Analysis on Risk�threshold
Discriminant Analysis ��� � has been used in soft�
ware fault classi�cation and estimation and divided
into some categories� Discriminant power ��� � Dis�
criminant Coordinates ��� � Optimized reduction sets
�� �
In this paper� a discriminant analysis based on risk
has been presented ��� � The starting point for the
risk analysis was the de�nition and measurement of
a set of experimental parameters connected to the
structure of software products in terms of code�
The number of faults recorded during the execu�
tion of a code source has been compared to certain
critical values found in the same code for some of the
measured parameters which can be directly or indi�
rectly estimated in terms of code metrics� In this
way� the reliability level of a program is related to
some metrics� In general� the aim of the metric is
to identify those parameters which� in the light of
the values measured� explain the presence of faults in
software modules and which can be de�ned as risky
metrics for that reason� The identi�cation of these
risky metrics and the �les�modules which have a high
risk to contain faults can be used to pre�process the
modules during the releasing and testing session� The
choice regarding which metrics have to be taken into
account depends primarily on the application� not to
mention a whole range of characteristics related to
the programming environment� such as the language
used� the available tools� the rules governing software
development and internal testing� the types of prob�
lems faced� etc� Starting from a database of programs
and signaled faults� the correlation between a set of
metrics and the faults found in each module��le have
to be modeled� After de�ning the model� this can
be easily used in analyzing all new �les�modules be�
fore testing session� The analytical steps of the model
de�nition are�
�� The process starts with a large set of m metrics�
�� Each metric� i� has been measured in each �le�
j� as xij � � i � m� � � j � n� being n the
number of �les�modules�
�� For each metric i� the mean value Mi and the
standard deviation estimated on values obtained
for all �les�modules has been computed as Si �rPn
j���xij�Mi��
n� where Mi �
�n
Pn
j��xij�
�� For each metric i� for each �le j� the values Sij
have been considered as the o�set of the metric
evaluated on the jth �le from the metric mean
value Mi� normalized on the standard deviation
of the metric Si� Sij �jxij�Mij
Si�
�� The risk level of metric i� MRLi� is calculated
asPn
j��Rj �Sij being Rj considered � if the �le
�

j has reported faults� � else� All the risk values
MRLi have been normalized with respect to the
sum of all MRL�
�� The risk level of �le j� FRLj� is computed on
the basis of the metric value and their risk level
as� FRLj �Pm
i��MRLi � xij� all the risk levels
FRLj have been normalized with respect to the
sum of all FRL�
The DiscriminantAnalysis on risk�threshold is per�
formed by splitting the �les�modules data set into two
data subsets for training and validation� The objec�
tive of the training phase is to compute the risk level
for each metric MRLi on the basis of the processed
�les�modules� On the basis of the MRLi� the risk
level of a source �le�module FRLj is computed�
The risk�threshold� which is responsible of the
�le�module classi�cation� has been taken as in the
middle of the average values of FRLs of the two dis�
joint classes� modules with faults and those with�
out� The risk�threshold is de�ned as MFRLf �
MFRLnf�� where MFRLf � avgFRLjj�fault
and MFRLnf � avgFRLjj�nonfault in the mid�
dle between the two mean values extracted from each
class� An uncertain interval is arranged around the
risk�threshold not all the modules could be classi�
�ed�
The modules of the validation subset have their
own risk level FRL� Such FRL has been compared to
the risk�threshold in order to classify the �le�module�
Since the uncertain interval is arbitrary and our ob�
jective was to produce a model with an acceptable
fault�proneness estimation rate� the risk�threshold
uncertain interval was set to obtain at least ��� of
general classi�cation�
It is evident that the set of metrics have to be
reduced to the minimum set of representative param�
eters� to avoid metrics which are not useful in the
analysis or which introduce noise in the evaluation
of data� Empirical methods to reduce the metric set
have been applied as described in the Section ����
� Experiment data sets description
The experiments to produce the fault�proneness
models have been carried out processing sources from
two di�erent software projects� They present �les
coming from di�erent environments of development
and application �elds� both of them can be classi�
�ed as small�medium systems written in C language�
Their main properties are�
� INDUSTRIAL� industrial low�level application
context� ��� modules to implement an embedded
network router� with and without cryptographic
features�
� MEDICAL� graphical user interface and data ac�
cess context� ��� modules to implement front�
end application of management software for med�
ical purposes�
The experimental data set have been collected with
heterogeneous source types in order to highlight sim�
ilarities and di�erences among development scenar�
ios� The companies which are the owners of these
software systems have not provided the needed au�
thorization to mention them� The considered metrics
to create the data sets have been estimated by using
two assessment tools for the analysis of programming
code� These measuring tools are� CPP�Analyzer see
��� and PAMPA Project Attribute Monitoring and
Prediction Associate ��� � These tools estimate the
metrics de�ned by the corresponding research teams�
and also several other metrics published in the liter�
ature� for a total of more than ��� di�erent metrics
at system module level for C language code�
The data related to faults have been used as the
dependent variable for the following study� In par�
ticular� a software module has been considered faulty
if at least a fault has been recorded� Since the num�
ber of cases� against whose the model could be �tted
was limited� no further inspection on the relation�
ships between faulty modules with � or more faults
and metrics has been carried out�
The cited tools can process C source codes to pro�
duce measures of more than ��� metrics� All these
metrics could be potentially considered as indepen�
dent variables for the de�nition of models for esti�
mation and prediction of fault�proneness in software
systems� Details about these metric suites can be re�
covered in the above mentioned papers�
The considered metrics cover all the aspects of
software measures presented in the quoted literature�
Due to lack of space� it is impossible to describe such
metrics and quote all the corresponding technical pa�
pers in which they are de�ned and discussed�
�

� Experimental Results
In this section� a short description of the proce�
dures adopted for the data analysis and for the model
de�nition are reported� The objective has been to
�nd a model with a reasonable number of metrics
needed to estimate fault�proneness in software� The
�rst aim was to �nd a model capable to maintains
acceptable computational costs low number of met�
rics� while providing a prediction rate over ��� of
the e�ective result� The main idea was to start from
the analysis of the whole set of metrics so as to iden�
tify the most important metrics� on the basis of their
contribution in estimating fault�proneness� To this
end� at the beginning� all the metrics estimable by
the CPP�analyzer and PAMPA tools have been con�
sidered� In this phase� no limitation on the number of
metrics was adopted� For this reason� the ��� metrics
calculated by the two adopted tools have been ana�
lyzed with descriptive statistic techniques� On the ba�
sis of descriptive statistic� meaningless variables with
a null variance were removed�
Experiments were performed by using the above
mentioned models and data sets mentioned before�
and can be summarized as follows�
Statistical analysis
�� PCA for metric reduction has been applied se�
lecting the metrics which are the most related
to the Principal Components extracted on IN�
DUSTRIAL and MEDICAL data sets�
�� Logistic regression with di�erent techniques has
been used to �nd an early model�
�� PCA has been applied a second time for a further
reduction�
�� Logistic regression has been performed to obtain
a model with a smaller set of metrics�
�� The models identi�ed by statistical analysis have
been evaluated�
Discriminant analysis
�� Each data set MEDICAL� INDUSTRIAL has
been separated into two sets called training and
validation�
�� The risk�coe�cient has been calculated for each
�le�module of the training set and mean values
have been computed for fault and no�fault sub�
groups�
�� The risk�threshold has been �xed between the
two means with a �neutral� range centered in the
threshold value to exclude critical value from the
classi�cation�
�� The metric set has been clustered� grouping met�
rics of the same nature� complexity� size� etc�
�� The discriminant analysis has been performed on
metric clusters and results have been produced�
�� The metric clusters have been empirically re�
duced on the basis of risk contribution in order to
produce a reduced number of metrics with a rea�
sonable �tting according to the above mentioned
target results e�g�� ����
�� The models identi�ed by discriminant analysis
have been evaluated�
In the reported experiments� di�erent approaches
for creating fault�proneness models have been applied
by using the same set of metrics� In the experiments�
the metrics have been considerer as the main sub�
ject of the analysis� searching for the minimum set of
them which could produce an acceptable rate ���
for fault�proneness estimation�
5.1 Statistical analysis results
In this section� the statistical analysis has been ap�
plied in these two di�erent data sets� INDUSTRIAL
and MEDICAL�
Results on INDUSTRIAL data set
Before the application of the logistic regression on
the INDUSTRIAL data set� the statistical method
began with the PCA to reduce the set of variables
to a smaller set� In this case� � principal components
were considered� In fact� the component analysis pro�
cess was stopped when the eigenvalue of the covari�
ance matrix reached the value of ��� regardless of the
variance� covering more than ���� Over the �th prin�
cipal component� the variance contribution did not
increase anymore with respect to what was obtained
�

with the �rst � PCs� On the basis of the �rst � princi�
pal components� the most relevant metrics have been
selected and the whole collection of metrics has been
reduced to ��� the selection has been made on the
basis of the contribution of each metrics to the PCs�
To this end� the metrics with contribution outside
a range of ���������� have been excluded� because
of the low in�uence in the covariance matrix� The
metrics related to the �rst principal component cover
more than ��� of the variance�
After this preliminary selection� the logistic regres�
sion has been applied to identify the model accord�
ing to this reduced set of metrics belonging only to
the �rst principal component� Di�erent techniques of
logistic regression have been used on this metric set
and data� The logistic regression with backward tech�
nique has reduced the metric set to only �� metrics�
while losing only a small percentage on the prediction
rate�
Another model has been produced by using the
whole set of �� metrics concerning the � PCs� using
conventional and backward regressions� In this case�
better results were obtained� and the backward tech�
nique has been capable to reduce the model of ��
metrics by obtaining the prediction rate close to ���
with �� metrics�
The statistical analysis on the basis of �� metrics
has produced better results� while still using a large
amount of metrics� A further work has been per�
formed to reduce the number of metrics� A new set of
metrics has been extracted from the � PCs� From the
�rst � PCs� �� metrics have been selected consider�
ing the contribution parameters in the ������������
range� The conventional technique of logistic regres�
sion on the metrics related to the �rst component
obtained a rate greater than ���� On the whole set
of metrics related to the � principal components the
conventional logistic regression has not produced sat�
isfactory results� In fact� the same prediction rate has
been obtained with the backward technique which
reduced the metric set from �� to �� metrics� In
this case� the results have reached the ��� of fault�
proneness estimation�
This last model based on �� metrics with a rate
of ��� has been more carefully analyzed� The met�
rics have been considered one by one� excluding some
of them due to their conceptual irrelevance with the
fault�proneness estimation problem� For example� a
metric related to the number of macro de�nitions was
eliminated� On the basis of this analysis� the metric
set has been empirically reduced� The remaining ��
metrics maintained a prediction rate which was still
on the ��� the same achieved with �� metrics set
as shown in Tab� ��
backward threshold � ���
� empyrical reduction
Actual
Model no fault fault � correct
no fault ��� �� ������
fault �� �� ������
total ������
Table 1. Results of logistic regression with �� met
rics on all PCs of the second reduction on the IN
DUSTRIAL data set�
The obtained model has been evaluated consider�
ing the typical statistical coe�cients of dichotomous
classi�cation� The values describing this model based
on logistic regression are reported in Tab��� where it
is evident that the value of the Wald coe�cients con�
�rm the relevance of the metrics� except for the o�set�
Results on MEDICAL data set
On the MEDICAL data set the �rst step of the prin�
cipal component analysis has found �� principal com�
ponents which covered more than the ��� of the to�
tal variance� Considering the range of ���������� �
�� metrics of the initial ��� have been selected for
the �� PCs� The logistic regression with backward
technique reduced the number of metrics to ��� the
prediction model for this set was near ��� �
An additional PCA on the �� metrics identi�ed
that most of the variance was modeled by the �rst
� principal components� Using the logistic regression
with step�wise forward techniques only � metrics have
been selected and the results were comparable with
those obtained from whole set� On the other hand�
the backward technique produced higher percentages
including �� metrics� In Tab� �� more details about
the model based on � metrics are reported� Please
note that� in this case� all the metrics involved in the
model are signi�cant in terms of p�value and Wald�
The metrics which have been selected by both models
are NDR and DATADECLS� which are metrics that
�
Statistical coe�� result theoretic
Bravais Pearson ����� �
Sensibility ����� �
Correctness ����� �
Completeness ����� �
Classication Corr� ����� �
Type I Errors ����� �
Type II Errors ����� �
Metric � Std� Error Wald p value
CDF ����� ����� ����� �����
DATADECLS ����� ����� ����� �����
NAIV ����� ����� ������ �����
NCFB ����� ����� ����� �����
NDDTU ����� ����� ����� �����
NDR ����� ����� ������ �����
NDS ����� ����� ����� �����
NDSTT ����� ����� ����� �����
NPCD ����� ����� ����� �����
NROV ����� ����� ������ �����
NST ����� ����� ����� �����
intercept ����� ������ ����� �����
Table 2. Model obtained by statistical analysis
based on �� metrics on INDUSTRIAL data set�
count the number of data structures�
5.2 Discriminant Analysis results
Discriminant analysis on risk�threshold method is
based on two phases� training and validation� The
risk�level of the metrics MRL is estimated to create
the model during the training phase� This activity is
performed by using a training data set di�erent from
the one used for validation� In the training phase� the
risk�threshold was also identi�ed on the basis of the
processed �les and it a�ected the classi�cation of �les
in the validation data set�
On both data sets� using the whole metric sets con�
tribution� results are not so good as expected� the
models classi�ed about ��� of modules in each group�
but the correctness was around ���� In this case� the
high number of metrics failed in producing a suitable
model for fault proneness estimation�prediction� due
to the low risk level of some metrics� the classi�ca�
tion correctness which has been achieved from IN�
DUSTRIAL is ���� where only one half of the �les
with faults have been identi�ed�
Statistical coe�� result theoretic
Bravais Pearson ����� �
Sensibility ����� �
Correctness ����� �
Completeness ����� �
Classication Corr� ����� �
Type I Errors ����� �
Type II Errors ����� �
Metric � Std� Error Wald p value
NSLT ����� ����� ������ �����
NGCL ����� ����� ������ �����
NDR ����� ����� ������ �����
CHUNKS ����� ����� ����� �����
DATADECLS ����� ����� ����� �����
intercept ����� ����� ������ �����
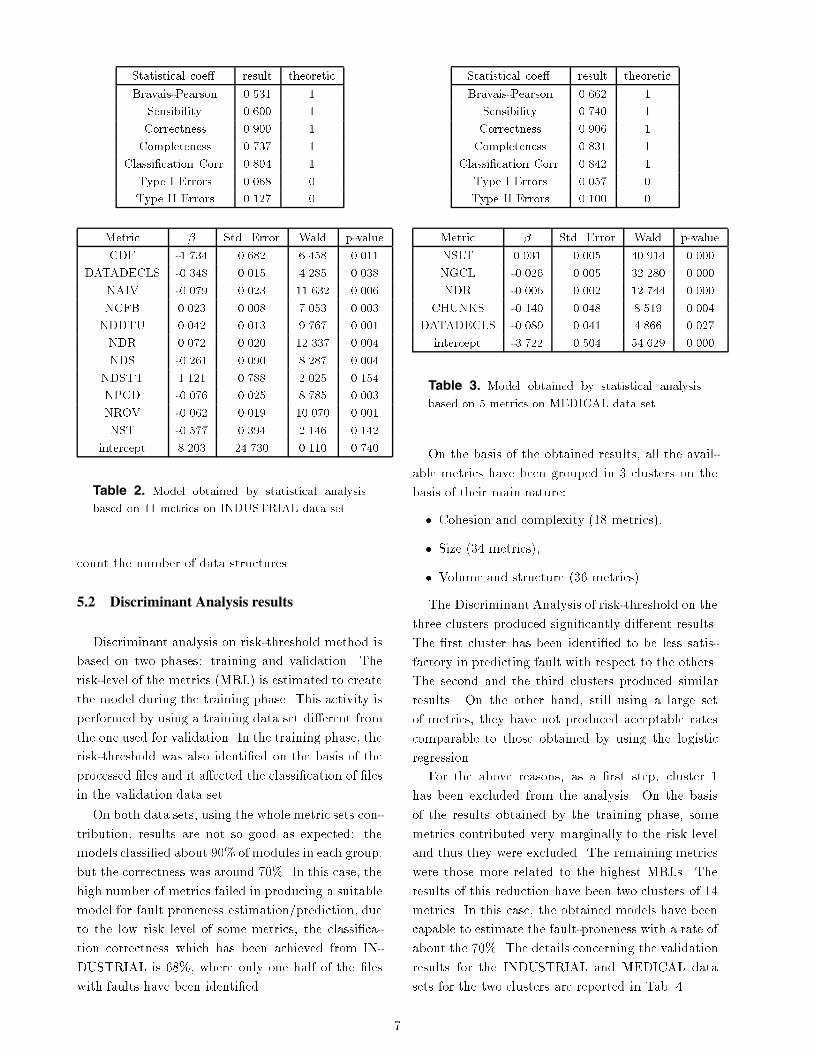
Table 3. Model obtained by statistical analysis
based on � metrics on MEDICAL data set�
On the basis of the obtained results� all the avail�
able metrics have been grouped in � clusters on the
basis of their main nature�
� Cohesion and complexity �� metrics�
� Size �� metrics�
� Volume and structure �� metrics�
The Discriminant Analysis of risk�threshold on the
three clusters produced signi�cantly di�erent results�
The �rst cluster has been identi�ed to be less satis�
factory in predicting fault with respect to the others�
The second and the third clusters produced similar
results� On the other hand� still using a large set
of metrics� they have not produced acceptable rates
comparable to those obtained by using the logistic
regression�
For the above reasons� as a �rst step� cluster �
has been excluded from the analysis� On the basis
of the results obtained by the training phase� some
metrics contributed very marginally to the risk level
and thus they were excluded� The remaining metrics
were those more related to the highest MRLs� The
results of this reduction have been two clusters of ��
metrics� In this case� the obtained models have been
capable to estimate the fault�proneness with a rate of
about the ���� The details concerning the validation
results for the INDUSTRIAL and MEDICAL data
sets for the two clusters are reported in Tab� ��
�

INDUSTRIAL �ndcluster
Actual
Model no fault fault � correct
no fault �� �� ������
fault �� �� ������
total ������
������ not classied ������ classication�
MEDICAL �ndcluster
Actual
Model no fault fault � correct
no fault �� �� ������
fault �� �� ������
total ������
����� not classied ������ classication�
INDUSTRIAL �rdcluster
Actual
Model no fault fault � correct
no fault �� �� ������
fault �� �� ������
total ������
������ not classied ������ classication�
MEDICAL �rdcluster
Actual
Model no fault fault � correct
no fault �� �� ������
fault �� �� ������
total ������
����� not classied ������ classication�
Table 4. Results of the risk threshold analysis ap
plied on clusters � and � of �� metrics each�
The same method for reducing the dimension of
the metric set based on MRL has been applied to
select the metrics which are more related to risk of
faults� After this second phase of reduction� two clus�
ters of � metrics have been identi�ed� They have
produced satisfactory validation results on both IN�
DUSTRIAL and MEDICAL data sets as shown in
Tab� ��
Two di�erent models based on di�erent groups of
metrics have been produced by using MEDICAL and
INDUSTRIAL data sets� while these models are very
similar for the presence of � identical metrics on ��
The results of the evaluation are reported in Tab� ��
Observing the reduced clusters of metrics see Tab� �
INDUSTRIAL
Actual
Model no fault fault � correct
no fault �� �� ������
fault � �� ������
total ������
������ not classied ������� classication�
MEDICAL
Actual
Model no fault fault � correct
no fault �� �� ������
fault �� �� ������
total ������
����� not classied ������ classication�
Table 5. Results of the risk threshold analysis
method applied on reduced clusters ��� of � metrics
each�
for MRLs which built the models� it is evident that
some of the identi�ed metrics are in common for their
dominance on risk contribution� more precisely� what
was found out is that � metrics NAIV� NDR� NST�
BYTES are shared in common in the models pro�
duced from the processing of MEDICAL and INDUS�
TRIAL data sets� respectively�
5.3 Comparing Statistical and DiscriminantAnalyses
The obtained models for fault�proneness estima�
tion have produced results which are in the range of
those already obtained in past experiments performed
by other research groups� when small set of metrics
are used �� � ��� � ��� � etc� On the other hand� the
models have highlighted some common metrics and
their corresponding behaviours�
The models produced by Statistical Analysis logistic
regression have the following properties�
� estimate fault proneness with a rate of about ���
on both data sets�
� based on �� metrics for INDUSTRIAL sources
and � metrics for MEDICAL data sets�
� include � metrics which are in common between
the two models identi�ed starting from the two
�

Statistical coe�� result theoretic
Bravais�Pearson ����� �
Sensibility ����� �
Correctness ����� �
Completeness ����� �
Classi�cation Corr� ����� �
Type I Errors ����� �
Type II Errors ����� �
MRL
Metric MEDICAL INDUSTRIAL
NDR ����� �����
NAIV ����� �����
BYTES ����� �����
NST ����� �����
NII ����� �
SPNLIVEVAR � �����
Table 6. Models obtained by discriminant analysis
on risk threshold of � metrics each on MEDICAL
and INDUSTRIAL data sets�
data sets�
The models produced by Discriminant Analysis risk�
threshold have the following properties�
� predict fault proneness on the validation subsets
with a rate of about ��� on INDUSTRIAL data
set and ��� on MEDICAL data set�
� based on � metrics for both data sets�
� include � metrics which are in common between
the two models identi�ed starting form the two
data sets�
This analysis suggested to consider the metrics�
which have been identi�ed by the two models� as the
most relevant for fault�proneness estimation and pre�
diction� In this joined group of metrics� two of them
NDR� NAIV are present in both� Thus� the resulted
set was a group of � metrics that was supposed to be
suitable to build a model for fault�proneness estima�
tion�prediction� with less dependence on the software
project�
� Conclusions
This paper reported a research study begun with
the analysis of about ��� metrics with the aimof iden�
tifying suitable models for the fault�proneness esti�
mation and prediction of software modules��les� The
objective has been to �nd out a compromise between
the fault�proneness estimation rate and the size of
the model in terms of number of metrics used and
to compare two di�erent methodologies for the gen�
eration of fault�proneness models� To this end� di�er�
ent methodologies have been used and compared� and
their synergies exploited� The metodologies which
have been taken into account are the statistic anal�
ysis PCA and di�erent forms of logistic regression
and the discriminant analysis as risk�threshold anal�
ysis� They have been used to create models for
fault�proneness estimation and prediction by using
metrics addressing di�erent aspects of computer pro�
gramming� complexity� size� quality� cohesion� etc�
These models have been cross validated by using data
coming from two di�erent projects of di�erent compa�
nies that work in the telecommunication and medical
areas�
These produced models have been cross validated
by using data sets produced from source codes pro�
vided by two �rms� The models include metrics re�
lated to software complexity� data size� general size�
and cohesion among modules� This seems to be very
interesting since the model has a quite good predic�
tion rate compared to most of the models proposed in
the literature and the rational could be the adoption
of a model that takes into account a larger number of
factors including the data size� The comparison with
other similar models presented in the literature con�
�rms the relevance of the proposed models in terms
of accuracy of the results�
Acknowledgments
The authors thank the two companies that pro�
vided the source codes mentioned in the article as
INDUSTRIAL and MEDICAL� A special thanks
to Dr� F� Cinotti and Dr� L� Bruciamacchie� for
their help in producing the huge amount of experi�
ments and processing the code� A sincere thanks to
Harry Sneed who provided the CPP�Analyzer tool
for these experiments� Finally the authors thank
Prof� M� Pighin for the valuable details and sugges�
tions regarding risk�threshold method�
References
��� V� R� Basili� L� Briand� and W� L� Melo� A valida
�

tion of object oriented design metrics as quality indi
cators� IEEE Transactions on Software Engineering�
pp��������� October �����
��� L� C� Briand� V� R� Basili� and C� J� Hetman
ski� Developing interpretable models with optimized
set reduction for identifying high risk software com
ponents� IEEE Transactions Software Engineering�
vol���� n���� pp� ���� ����� November �����
��� L� C� Briand� J� Wust� J� W� Daly� and D� V� Porter�
Exploring the relationships between design measures
and software quality in object oriented systems�
Journal of Systems and Software� �����
��� G� Dunteman� Principal Component Analysis� Sage
University Paper� �� ��� Thousand Oaks� CA� USA�
�����
��� C� Ebert� Classication techniques for metric based
software development� Software Quality J�� vol���
no��� pp���� ���� December �����
��� F� Fioravanti� P� Nesi� and S� Perlini� Assessment of
system evolution through characterization� In Proc�
of the IEEE International Conference on Software
Engineering� pp��������� Kyoto� Japan� April �����
��� F� Fioravanti� P� Nesi� A Study on Fault Proneness
Detection of Object Oriented Systems� In Proc� of
the Fifth European Conference on Software Mainte
nance and Reengineering� IEEE Press� pp���������
Lisbon� Portugal� March �����
��� H� F� Kaiser� The varimax criterion for analytic
rotation in factor analysis� Psychometrika� vol����
pp��������� �����
��� R� Hochman� T� M� Khoshgoftaar� E� B� Allen�
J� P� Hudepohl� S� J� Aud� Application of neural net
works to software quality modeling of a very large
telecommunications system� Neural Networks� IEEE
Transactions on�vol��� n���pp��������� July ���� �
���� T� M� Khoshgoftaar and E� B� Allen� Logistic regres
sion modeling of software quality� Int� J� Reliability�
Quality� and Safety Engineering�� vol��� n��� pp����
���� December �����
���� T� M� Khoshgoftaar� E� B� Allen� D� Jianyu� Using
regression trees to classify fault prone software mod
ules� IEEE Transactions on Reliability�vol��� �n���
pp���� ����December �����
���� J�C� Munson� T�M� Khoshgoftaar� The Detection of
Fault prone Programs� IEEE Transactions on Soft
ware Engineering� vol���� n��� pp��������� �����
���� N� Ohlsson� M� Zhao� and M� Helander� Application
of multivariate analysis for software fault prediction�
Software Quality Journal� vol� �� pp��� ��� �����
���� D� B� Simmons �editor�� N� C� Ellis� H� Fujihara�
W� Kuo� Software Measurement� A Visualization
Toolkit For Project Control and Process Improve
ment Prentice Hall� November� ����� ISBN � ��
������ ��
���� M� Pighin� R� Zamolo� A predictive metric based on
discriminant statistical analysis� In Proc� of the ��th
International Conference on Software Engineering�
ICSE ��� Boston� Massachusetts� USA� pp���������
May �����
���� N� F� Schneidewind� Software metrics model for in
tegrating quality control and prediction� in Proc� �th
Int� Symp� Software Reliability Engineering� pp����
���� �����
���� H� M� Sneed� Estimating the costs of software main
tenance tool� In Proc� International Conference on
Software Maintenance� pp���� ���� Opio� France�
October �����
��
Copyright © 2022 FDOKUMEN