Comparing Surface and Fine-Wire Electromyography Activity ...
Upload
khangminh22Category
view
1download
0
Research reportFluoride 48(4)281-304October-December 2015
Comparing defluoridation and safe sourcing for fluorosis mitigationin the Ethiopian Central Rift Valley
Datturi, van Steenbergen, van Beusekom, Kebede
281281
COMPARING DEFLUORIDATION AND SAFE SOURCING FOR FLUOROSIS MITIGATION IN THE ETHIOPIAN
CENTRAL RIFT VALLEYSara Datturia,* Frank van Steenbergen,a Martin van Beusekom,a Seifu Kebedeb
’s-Hertogenbosch, The Netherlands, and Addis Ababa, Ethiopia
SUMMARY: In the Ethiopian Central Rift Valley (ECRV) an estimated 8 million peopleare exposed to high levels of naturally occurring fluoride. Consumption of drinkingwater, beverages, and food puts them at risk of dental and skeletal fluorosis. Thispaper describes the outcomes of a study comparing the efficacy of the two mainmitigation measures, defluoridation and safe sourcing, in terms of sustainability,cost-effectiveness, and vulnerability. The study’s outcomes suggest that sourcingdrinking water from safe sources is the preferred approach, because it reducesmanagement burden and enables wider coverage. When safe sources are absent,community based bone char fluoride removal systems are proven to be a goodalternative. Community involvement before the project is implemented plays acrucial role in the success of defluoridation.
Keywords: Fluorosis Mitigation, Fluoride, Ethiopia, defluoridation, safe sourcing
INTRODUCTION
Fluorine is a common element, widely distributed in the earth’s crust. It exists asthe Bach anion fluoride (F-) in natural waters, with higher concentrations oftenprevailing in ground water.1 Although the evidence that topical fluoride (F) has aprotective effect against dental caries is considered to be strong, the scientificevidence that the systemic application of F via drinking water is beneficial is lessconvincing.2 Doses of F over 0.1 mg F/kg body weight/day weaken the skeletonand teeth.3 According to UNESCO4 more than 200 million people worldwide relyon drinking water with F- concentrations exceeding the present World HealthOrganization (WHO) guideline of a “desirable” upper limit of 1.5 mg/L.5 Long-term consumption of this water can lead to severe health effects like dental (DF)and skeletal fluorosis (SF).3,6,7 In 2006, the WHO listed 28 countries where theprevalence of the diseases DF and SF is a consequence of a long-termconsumption of drinking water with high levels of F. Among these, the mostaffected countries are India, Ethiopia, and China.3,8
Fluorosis does not only affect people’s health; it also has serious economic andsocial consequences. For instance, appearance-related and psychological problemsare caused by the repulsive effect of dental fluorosis, particularly among the youth.The prevalence of fluorosis and the related widespread health problems stigmatizeentire villages.9-12 Studies have shown that the prevalence of dental fluorosis inthe Ethiopian Central Rift Valley (ECRV) is above 80%.1,7,12 It is difficult toobtain accurate prevalence figures for skeletal fluorosis because of the widesymptomatology, which ranges from mild radiological evidence to cripplingfluorosis with or without neurological manifestation. Estimations set the
aMetaMeta Research, Paardskerkhofweg 4, 5223 AJ, ’s-Hertogenbosch, The Netherlands;bSchool of Earth Sciences, Addis Ababa University, Addis Ababa, Ethiopia; *Forcorrespondence: Sara Datturi, MetaMeta Research, Paardskerkhofweg 4, 5223 AJ, ’s-Hertogenbosch, The Netherlands; E-mail: [email protected]
Research reportFluoride 48(4)281-304October-December 2015
Comparing defluoridation and safe sourcing for fluorosis mitigationin the Ethiopian Central Rift Valley
Datturi, van Steenbergen, van Beusekom, Kebede
282282
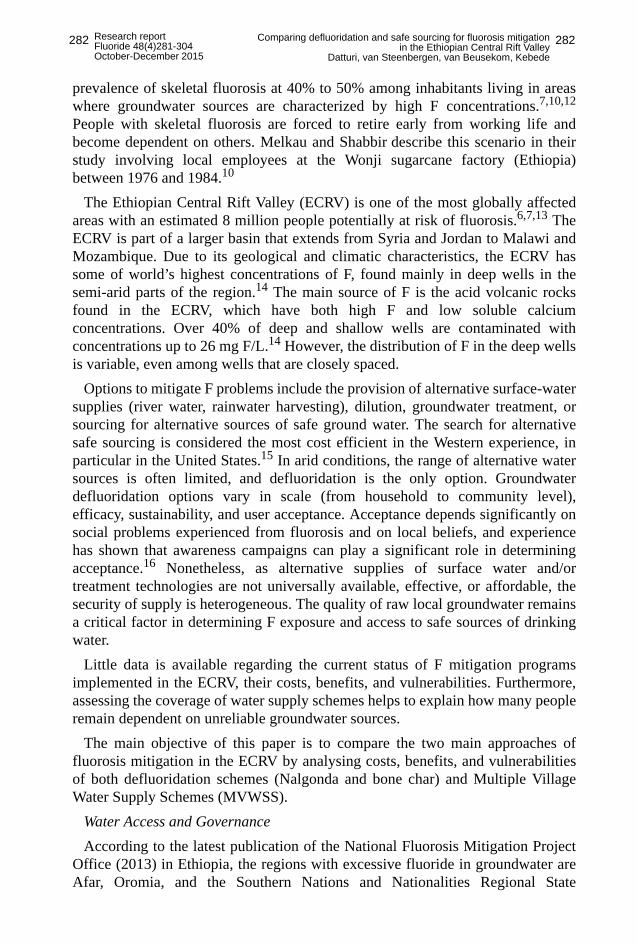
prevalence of skeletal fluorosis at 40% to 50% among inhabitants living in areaswhere groundwater sources are characterized by high F concentrations.7,10,12
People with skeletal fluorosis are forced to retire early from working life andbecome dependent on others. Melkau and Shabbir describe this scenario in theirstudy involving local employees at the Wonji sugarcane factory (Ethiopia)between 1976 and 1984.10
The Ethiopian Central Rift Valley (ECRV) is one of the most globally affectedareas with an estimated 8 million people potentially at risk of fluorosis.6,7,13 TheECRV is part of a larger basin that extends from Syria and Jordan to Malawi andMozambique. Due to its geological and climatic characteristics, the ECRV hassome of world’s highest concentrations of F, found mainly in deep wells in thesemi-arid parts of the region.14 The main source of F is the acid volcanic rocksfound in the ECRV, which have both high F and low soluble calciumconcentrations. Over 40% of deep and shallow wells are contaminated withconcentrations up to 26 mg F/L.14 However, the distribution of F in the deep wellsis variable, even among wells that are closely spaced.
Options to mitigate F problems include the provision of alternative surface-watersupplies (river water, rainwater harvesting), dilution, groundwater treatment, orsourcing for alternative sources of safe ground water. The search for alternativesafe sourcing is considered the most cost efficient in the Western experience, inparticular in the United States.15 In arid conditions, the range of alternative watersources is often limited, and defluoridation is the only option. Groundwaterdefluoridation options vary in scale (from household to community level),efficacy, sustainability, and user acceptance. Acceptance depends significantly onsocial problems experienced from fluorosis and on local beliefs, and experiencehas shown that awareness campaigns can play a significant role in determiningacceptance.16 Nonetheless, as alternative supplies of surface water and/ortreatment technologies are not universally available, effective, or affordable, thesecurity of supply is heterogeneous. The quality of raw local groundwater remainsa critical factor in determining F exposure and access to safe sources of drinkingwater.
Little data is available regarding the current status of F mitigation programsimplemented in the ECRV, their costs, benefits, and vulnerabilities. Furthermore,assessing the coverage of water supply schemes helps to explain how many peopleremain dependent on unreliable groundwater sources.
The main objective of this paper is to compare the two main approaches offluorosis mitigation in the ECRV by analysing costs, benefits, and vulnerabilitiesof both defluoridation schemes (Nalgonda and bone char) and Multiple VillageWater Supply Schemes (MVWSS).
Water Access and GovernanceAccording to the latest publication of the National Fluorosis Mitigation Project
Office (2013) in Ethiopia, the regions with excessive fluoride in groundwater areAfar, Oromia, and the Southern Nations and Nationalities Regional State
Research reportFluoride 48(4)281-304October-December 2015
Comparing defluoridation and safe sourcing for fluorosis mitigationin the Ethiopian Central Rift Valley
Datturi, van Steenbergen, van Beusekom, Kebede
283283
(SNNPR). All regions are located in the Ethiopian Rift Valley region of the GreatAfrican Rift Valley.
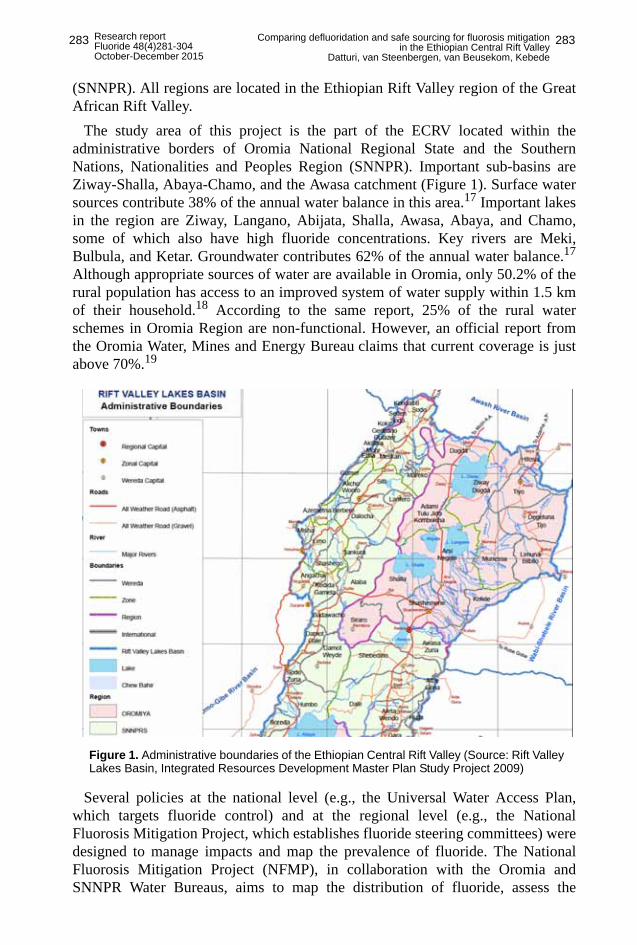
The study area of this project is the part of the ECRV located within theadministrative borders of Oromia National Regional State and the SouthernNations, Nationalities and Peoples Region (SNNPR). Important sub-basins areZiway-Shalla, Abaya-Chamo, and the Awasa catchment (Figure 1). Surface watersources contribute 38% of the annual water balance in this area.17 Important lakesin the region are Ziway, Langano, Abijata, Shalla, Awasa, Abaya, and Chamo,some of which also have high fluoride concentrations. Key rivers are Meki,Bulbula, and Ketar. Groundwater contributes 62% of the annual water balance.17
Although appropriate sources of water are available in Oromia, only 50.2% of therural population has access to an improved system of water supply within 1.5 kmof their household.18 According to the same report, 25% of the rural waterschemes in Oromia Region are non-functional. However, an official report fromthe Oromia Water, Mines and Energy Bureau claims that current coverage is justabove 70%.19
Several policies at the national level (e.g., the Universal Water Access Plan,which targets fluoride control) and at the regional level (e.g., the NationalFluorosis Mitigation Project, which establishes fluoride steering committees) weredesigned to manage impacts and map the prevalence of fluoride. The NationalFluorosis Mitigation Project (NFMP), in collaboration with the Oromia andSNNPR Water Bureaus, aims to map the distribution of fluoride, assess the
Figure 1. Administrative boundaries of the Ethiopian Central Rift Valley (Source: Rift ValleyLakes Basin, Integrated Resources Development Master Plan Study Project 2009)
Research reportFluoride 48(4)281-304October-December 2015
Comparing defluoridation and safe sourcing for fluorosis mitigationin the Ethiopian Central Rift Valley
Datturi, van Steenbergen, van Beusekom, Kebede
284284
chemical risk of water sources, and perform feasibility studies for alternative watersupply.
Stakeholders such as NGOs (e.g., OSHO and CRS), research institutes (e.g.,Eawag and UNICEF) have carried out studies and piloted defluoridation schemesto test ways to supply low fluoride water in the ECRV. An overview of theexperiences of the above-mentioned organizations is provided below.
In the ECRV, the low-income population relies on agriculture and cattle rearingas their main source of income. Access to water is limited. In vulnerablehouseholds, children and women are in charge of collecting water for theirfamilies, walking an average of 10 to 15 km per day.20 During the dry season,access to water becomes even more problematic due to increased pressure onwater sources and the lowered water tables, which lead to pump failure. However,communities do not always recognize the link between potable water andfluorosis. Cultural beliefs remain in place; for instance; some water users linkdental fluorosis to the will of local spirits.21 This awareness is changing thanks tothe various intervention programs in the region.
MATERIALS AND METHODS
Data were collected on current fluoride mitigation programs implemented in theECRV to understand the socioeconomic and institutional context of the watersupply systems. Data collected concerned installation and operation andmaintenance costs, benefits, and vulnerabilities of both defluoridation schemesand MVWSS. All defluoridation schemes are village sized and community owned.The safe sourcing schemes are multi-village sized and owned by the regionalgovernment, as low fluoride water sources are scarce and such systems aredeveloped to serve multiple large areas simultaneously. Data were also collectedon local acceptance, perceptions, and functionality (quality of the service) of thewater supply systems. Through a cost-benefit-vulnerability analysis ofdefluoridation and safe sourcing schemes, this paper improves the understandingof challenges and opportunities of current fluorosis mitigation programs in theECRV and hopes thereby to better inform decision making processes on whatstrategy is favourable in a given context.
The study utilized a qualitative method consisting of two different parts. Thefirst was an expert consultation on the current state of art on fluoride mitigation inECRV. The second consisted of field visits to the defluoridation sites and MVWSSand interviews with governmental, non-governmental, and non-profit stakeholders(Appendix 1).
Figure 2 shows the location of the ten defluoridation and five MVWSS schemessurveyed. Defluoridation schemes included six community bone char filtersimplemented by Oromia Self Help Organization (OSHO), eight Nalgondaschemes developed by Catholic Relief Service (CRS) (half of which were non-functional), and two Nalgonda schemes developed by Lay Volunteer InternationalAssociation (LVIA) (both non-functional). The last LVIA two were visited inorder to understand the vulnerabilities of defluoridation schemes. As for MVWSS,

Research reportFluoride 48(4)281-304October-December 2015
Comparing defluoridation and safe sourcing for fluorosis mitigationin the Ethiopian Central Rift Valley
Datturi, van Steenbergen, van Beusekom, Kebede
285285
water supply offices were visited in Adama, Ziway, Bulbula, Arsi Negelle, Siraro,and Shashamane.
8
8
8
85
8
73 2
43366
3
641
Figure 2. Study area: Defluoridation schemes and MVWSS, visited and not visited, inEthiopian Central Rift Valley (Source: Google Earth). Symbols: 1 Lay Volunteer International Association (LVIA) Nalgonda scheme (non-functional, visited); 2 Catholic Relief Service (CRS) Nalgonda scheme (functional, visited); 3Catholic Relief Service (CRS) Nalgonda scheme (non-functional, not visited); 4 CatholicRelief Service (CRS) Nalgonda scheme (functional, not visited); 5 Oromia Self HelpOrganization (OSHO) bone char scheme (functional, not visited); 6 Oromia Self HelpOrganization (OSHO) bone char scheme (functional, visited); 7 Single village water supplyscheme (functional, visited); 8 Multiple village water supply scheme (functional, visited).

Research reportFluoride 48(4)281-304October-December 2015
Comparing defluoridation and safe sourcing for fluorosis mitigationin the Ethiopian Central Rift Valley
Datturi, van Steenbergen, van Beusekom, Kebede
286286
During the visits to both MVWSS and defluoridation schemes, interviews wereconducted with water officers, local water users, and NGO project managers.
Implemented fluorosis mitigation strategies: In the ECRV, two main fluorosismitigation strategies are in place: safe sourcing and community defluoridationschemes.
Since the discovery of high fluoride levels in drinking water in the ECRV in1970, scientists have developed various ways to reduce the F- concentration indrinking water. At present, a wide range of techniques exists for F- removal.7 Themost common defluoridation techniques are absorption, precipitation, coagulationand membrane processes. Ion exchange and/or adsorption are widely acceptedtechnologies used on a full-scale basis in various countries worldwide.3,4
Although multiple technologies have been developed, the Nalgonda and bone chartechniques are the most widely implemented at the local level, as seen in Kenya,India,22 and Ethiopia.23 The Ethiopian government is also investing in the searchfor alternative safe sourcing and in up scaling the existing safe sourcing schemesthrough the multi-village water supply schemes.
Nalgonda: The Nalgonda technique was developed and adapted in India by theNational Environmental Engineering Research Institute (NEERI) to be used ateither community or household level. It uses the process of aluminium sulphatebased coagulation-flocculation-sedimentation, where the dosage is designed toensure F- removal from the water. In Ethiopia, under the fluorosis mitigationproject promoted by UNICEF and the Federal Water and Energy Ministry, theNalgonda technique has been piloted in several rural communities. CRS has beenimplementing this technique in communities in the ECRV since 2005.
1
3
4
Raw water
Cattle trough
Public water point
6
Defluoridator
4
5
H2O
Borehole
1Pump
High fluoride water
Treated water
Figure 3. Nalgonda defluoridation scheme. Water (H20) from a borehole (1) is pumped by a pump (2) to a raw water storage tank (3) from which some untreated high fluoride water is piped to a cattle trough (3) while some is piped to a defluoridator (4) where aluminium and lime are added (5) after which the water is distributed to a public water point (6)
Aluminum and lime
2

Research reportFluoride 48(4)281-304October-December 2015
Comparing defluoridation and safe sourcing for fluorosis mitigationin the Ethiopian Central Rift Valley
Datturi, van Steenbergen, van Beusekom, Kebede
287287
Over the last 10 years, 20 Nalgonda systems have been installed in the ECRV.Half of them are no longer functional, and some of them were never used. TheNalgonda functioning schemes are those implemented by CRS (in cooperationwith the National Fluoride Steering Committee, NFSC). Some NGOs that tried toestablish Nalgonda systems faced several constraints.
In the following section, an account of the Nalgonda implementation experienceof CRS is presented. In Dodo (Bora woreda) 85 m deep borehole pumps F- richwater into a 10 m3 untreated water tank. This raw water is then diverted into thede-fluoridator (Figure 3, number 4) where the technician treats it with aluminiumsulphate and lime. This tank has a steer root to mix the chemicals. This processtakes five minutes. After the mixing, flocculation occurs over three to four hours.The treated water is then released to the common water point. On the other side, acattle trough is attached to the raw water tank.
Bone char: The bone char technique uses a locally produced filter media ofactivated carbon and hydroxyl apatite (using bones collected from local butchers,mainly from cows). In Ethiopia, OSHO as implemented this technique. Thecommunity-level projects were financed by British and Swiss foundations andsupported with the technical, economic, and social expertise of Eawag and SwissInter-Church Aid (HEKS).23
Bone char filters are made of grained cow bones. The factory processing thefilters is based in Mojo (15km north of Adama), established through an Eawagproject fund. OSHO’s first experience with defluoridation technology involvedintroducing the filter to 200 household units an approach that the targetcommunities did not embrace. The main reasons for their rejection of the approachwere the necessity to manage the filter, as households had to rely on external helpfor the water quality test, and their inability to realize when the filter needed to beregenerated. Figure 4 depicts a household bone char filter unit and its functions.The household bone char filter is made of two blue plastic baskets. The raw waterbasket has a 15L capacity. Filtered through a layer of bone sand (3kg), the waterdrips into the second tank. This process takes about 30 minutes. Users can keep theprocess going if they keep refilling the first tank with raw water. Lessons learnedwere integrated in a new design for bone char filters at the community level.
There are currently seven community bone char schemes implemented byOSHO in cooperation with Eawag benefitting over 3,000 households. Eawag,OSHO, and Nakaru Catholic Foundation (NCF) highlight that this is the mostsustainable setup in a rural context in developing countries, as it is fairly low-techand can be assembled using locally available material, decreasing the need forexternal assistance (Figure 5).

Research reportFluoride 48(4)281-304October-December 2015
Comparing defluoridation and safe sourcing for fluorosis mitigationin the Ethiopian Central Rift Valley
Datturi, van Steenbergen, van Beusekom, Kebede
288288
.
Figure 4. Household bone char filter.
Wind mill pump
Raw water tank (5,000 L)
Raw water storage tank
Water for cattle and sanitary purposes
H2O
Raw water
Figure 5A. Community bone char defluoridation scheme. The raw water is pumped from a bore by a wind mill pump and stored for use for cattle and sanitary purposes or piped to the bone char defluoridators.

Research reportFluoride 48(4)281-304October-December 2015
Comparing defluoridation and safe sourcing for fluorosis mitigationin the Ethiopian Central Rift Valley
Datturi, van Steenbergen, van Beusekom, Kebede
289289
Multiple-village water supply schemes: At present, five MVWSS are inoperation in the study area of the ECRV: Adama, Ziway, Bulbula, Arsi Negelle/Siraro, and Shashamane. Adama, Ziway, and Shashamane are urban water supplyschemes, which, according to their design, aim to supply mainly urban dwellers,but currently they are also serving rural kebeles. Bulbula, Arsi, and Negelle/Siraroare rural water supply schemes. The Bulbula Rural Water supply project aims tosupply rural communities in 13 villages, including Bulbula town, with a fluoride-free water supply system. The Arsi Negelle/Siraro water supply project suppliesrural communities in three woredas with a fluoride-free water supply system (ArsiNegelle, Shashamane, and Siraro woredas). Siraro is now located in the newlycreated woreda of ‘Shalla’. A new MVWSS, ‘Oromia Lakes Region Water SupplyProject,’ is currently under construction. It aims to supply safe drinking water toArsi Negelle, Shalla, Shashamane, and Siraro woredas through a 170 kmdistribution network (with 57 water points and 23 cattle troughs).
These MVWSS’s are supported at the regional level by the Water, Mines, andEnergy Bureaus of Oromia and SNNPR, which have invested in safe sourcingstrategies to deal with the high fluoride concentrations and extend safe watersupply coverage to remote rural communities. The MVWSS were constructed overseveral years, and have been extended and renovated over time. For instance, theMVWSS in Adama was built in 2002 and extended to Wonji/Shoa villages,located 5 km south of Adama, in 2006. Supply-demand ratios do not lead theplanning of MVWSS (Table 1). Three of the five MVWSS schemes use lowfluoride water from lakes or rivers and are equipped with a treatment facility.Bulbula and Arsi Negelle/Siraro rely on groundwater derived from springs andboreholes. The number of connections differs from scheme to scheme. All wateroffices report that water users have to pay for a private connection, while users ofpublic water points are not charged.
Rawwater
1,100 kg of bone char added to each defluoridator
Treated water storage tank 5,000 L
Treated water
Water point (kiosk)
Figure 5B. Community bone char defluoridation scheme. After the raw water is pumped from a bore by a wind mill pump to a 5,000 L raw water tank it is piped to two defluoridators, each containing 1,100 kg of bone char, and then to a 5,000 L treated water storage tank which supplies the water kiosks.

Research reportFluoride 48(4)281-304October-December 2015
Comparing defluoridation and safe sourcing for fluorosis mitigationin the Ethiopian Central Rift Valley
Datturi, van Steenbergen, van Beusekom, Kebede
290290
Costs, benefits, and vulnerability: Sixty randomly selected water users wereinterviewed. An average of seven beneficiaries at each water defluoridationscheme and MVWSS were interviewed, among whom three were women. Data onthe reasons for failure, water consumer patterns, and perception of the fluorideproblem were collected.
Six parameters were used to calculate the costs for both types of schemes: (i)initial investment costs; (ii) total operational costs; (iii) investment costs per m3;(iv) operational costs per m3; (v) profit per m3; and (vi) water tariff.
The benefits were calculated by identifying the number of beneficiaries perdefluoridation scheme and MVWSS. The number of beneficiaries includes dailywater users from the communities and irregular users from external kebeles. Thisindicator estimates the population with access to low-fluoride water.
Table 1. Main characteristics of multiple-village water supply schemes.
Multiple-village water supply
scheme
Year of implementation
Source of water
Current total
length of pipes
including branches to each water point
Treatment plant
Designed number of
users benefiting
from MVWSS
Number of water users
benefiting from
MVWSS
Adama extension to Wonji/Shoa water scheme
2002
Awash River DNA* Yes 200,000
295,000 of a total population of 422,000
Ziway water scheme 2002 Ziway
Lake 85 Yes 20,000
41,420 of a total population of 43,610
Bulbula water scheme 2008
Tufa Spring + 3 springs
111 No – 73,000
ArsiNegelle/Siraro water scheme 1995 - 1998
13 wells drilled; 10 are productive
153 No
120,000 257,000
Shashamane water scheme
2010 boreholes 1999 Wesh river
Wesh river + 2 boreholes
DNA* Yes
–
160,000 of a total population of 300,000
Total number of water users benefiting from MVWSS 826,420
*Data not available.

Research reportFluoride 48(4)281-304October-December 2015
Comparing defluoridation and safe sourcing for fluorosis mitigationin the Ethiopian Central Rift Valley
Datturi, van Steenbergen, van Beusekom, Kebede
291291
The vulnerability of the schemes was measured by calculating the reliability ofthe water supply. The local community expressed that a waiting time of more than15 minutes was unreliable. Furthermore, NGOs implementing defluoridation planswere visited, such as CRS, OSHO, and LVIA.
RESULTSMULTIPLE VILLAGE WATER SUPPLY SCHEMES (MVWSS)
Costs: Collecting data on the costs of individual MVWSS schemes proveddifficult because of the absence of systematic and standardized financial reports.In Table 2 an estimation of the total operation costs is presented, based upon whichthe profit and monthly return on investments can be estimated.
The Arsi Negelle/Siraro scheme required the largest investment per m3 (15.22Birr/m3) compared to the other schemes (Table 2). This significant difference isprobably due to the cost of drilling 10 wells (180–200 meters deep) as the mainsource of water.
Operational cost typically ranges between 0.43 and 23.44 Birr/m3 (1 Euro: 26.8Birr: 1 April 2014 used as the basis of computation). However, operational costsincrease significantly when there are power cuts requiring the use of generators orwhen additional chemicals are required. Water operators in Arsi Negelle/Siraroand Shashamane, in particular, frequently experience power cuts, which isreflected in the high operational costs, 23.44 and 9.77 Birr/m3 respectively. The
Table 2. Investment and operational costs per multiple village water supply scheme
Multiple water supply scheme
Initial investment cost (Birr)
Total operational
costs* (Birr/yr)
Investment cost†
(Birr/m3)
Operational cost
(Birr/m3)
Profit‡ (Birr/m3)
Water tarrif
(Birr/m3)
Adama extension to Wonji/Shoa water scheme
110,000,000 5,450,000 1.63 1.61 2.44 4.05
Ziway water scheme 29,500,000 4,474,203 1.17 3.55 2.45 6
Bulbula water scheme 26,000,000 3,000,000 0.19 0.43 9.57 10
ArsiNegelle/ Siraro water scheme
48,000,000 3,696,000 15.22 23.44 –9.44 14
Shashamane water scheme 60,000,000 8,622,185 3.40 9.77 –5.27 4.50
*The maintenance, chemical, and electricity costs are summed together give the total operational costs. The total operational costs were calculated using the data available. Not all schemes had discrete data available for electricity, maintenance, chemical, and management costs. In these cases, estimations were made. †The return of the investment cost was calculated over the life span of the system (20 years). ‡The profits may not represent the actual reality on the ground as management issues, such as illegal connection and non-revenue water, were not allowed for in the calculations.

Research reportFluoride 48(4)281-304October-December 2015
Comparing defluoridation and safe sourcing for fluorosis mitigationin the Ethiopian Central Rift Valley
Datturi, van Steenbergen, van Beusekom, Kebede
292292
highest total operational costs are seen in Shashamane’s MVWSS. This is due tothe high costs of chemicals used to treat water from Wondo River. Thesechemicals are all imported, except for aluminium sulphate. Furthermore, leaks andbreaks in the water supply system require constant maintenance.
Water tariffs have also been raised to cover increased operational costs. In ArsiNegelle/Siraro, for example, a higher water tariff of 14 Birr/m3 is now in place.However, the higher operational costs are not calculated in the water tariff inShashamane (4.50 Birr/m3), explaining the loss posted by the Shashamane waterutility.
Benefits: The number of people served by the MVWSS is large, ranging from41,420 to 295,000 per system (Table 1). In each of the six MVWSS, water usersfrom rural kebeles come to fetch water from public water points. In Adama, inaddition to serving urban water users, the MVWSS is also used by four ruralkebeles. Every day, women, children, and cattle fetch water from Adama waterpoints. The same happens for Ziway, where external water users come from fiverural kebeles. In Bulbula users are from four rural kebeles, in Arsi Negelle/Sirarousers are from two rural kebeles, and in Shashamane users are from five ruralkebeles.
Walking distances have shortened over time (from one hour to 30 minutes). Withthe extension of the safe water supply networks, more villages, such as Wonji/Shoa, that previously had to rely on unsafe groundwater sources are now able toaccess microbiologically chemically acceptable low-fluoride water. During thefieldwork it was observed that the youth who consume water from these waterpoints no longer suffer from undesirable effects on their appearance related todental fluorosis (such as mottled teeth).
Vulnerabilities: The main problems reported with MVWSS are water shortages,leaks, and issues related to daily operational and maintenance costs. According tothe data collected as presented in Table 3, Adama (3 to 5), Bulbula (3 to 4), andZiway (3 to 4) have faced the most instances of water shortage for the longestperiod of time. Exceptional conditions applied in Adama city, including roadconstruction, interfered with the water line system during the reporting period.None of the water scheme designs took into consideration population growth overthe following 20 years. This lead to an increase of water demands, in particular inAdama, where of a population of 350,000 plus 72,000 in Wonji/Shoa, the coverageof water supply is only 70% (only 295,000 are inhabitants covered by theMVWSS). This situation is also present in Shashamane, where of a currentpopulation of 300,000, the actual number of persons covered by MVWSS is160,000.24 As reported by water officers in these areas and in Ziway, morechemicals are needed to treat the increased pollution in Awash River. Dailymaintenance of the pipeline, power cuts, and problems with old pipes are the mainissues in these water supply schemes. In Bulbula, daily maintenance is needed dueto frequent breakdowns of the new water pipeline structure, although a life cycleof 20 years was guaranteed. Pipes and lines need to be changed, but there areinsufficient funds to complete the project.

Research reportFluoride 48(4)281-304October-December 2015
Comparing defluoridation and safe sourcing for fluorosis mitigationin the Ethiopian Central Rift Valley
Datturi, van Steenbergen, van Beusekom, Kebede
293293
Table 3. Vulnerabilities of multiple village water supply schemes
Multiple water supply scheme
Frequency of water shortage per week
Main problems reported
Adama extension to Wonji/Shoa water scheme
3 – 5
• Leaks, from 30% to 40% • Old pipes in the line • Daily maintenance due to (road) construction • Increase in cost of chemicals • All chemical additives except for alum are
imported
Ziway water scheme 3 – 4
• Operation and maintenance costs increase of
30% to 50% (over the last five years) • Old pipes and increase of leaks along the main
line • Increase in pollution • Increase in cost of chemicals • All chemical additives except for alum are
imported
Bulbula water scheme 3 – 4
• The system’s maintenance structure is unstable • Frequent bursts • Daily maintenance needed due to frequent
breakdown • The structure is of low quality (the system is quite
new; a life cycle of 20 years was guaranteed). • Pipes and lines need to be changed, but at the
moment there are not enough funds to do that • Leaks
ArsiNegelle/ Siraro water scheme 2
• Breaking pipes (3 to 4 times per week) • Leaks • Old pipes (13 years old) • Water pollution • Dirty pumps, water gets stuck • Interruptions in power supply • Water users complain about the high costs of
supply
Shashamane water scheme 1
• All chemical additives except for alum are
imported • Not enough water for the whole community • People use Wondo river when they face water
shortages; this is a health risk • Illegal connections • Power interruptions (at least once a week) • Lack of transportation facilities • People tend to emigrate
*No water available for two hours or more.

Research reportFluoride 48(4)281-304October-December 2015
Comparing defluoridation and safe sourcing for fluorosis mitigationin the Ethiopian Central Rift Valley
Datturi, van Steenbergen, van Beusekom, Kebede
294294
DEFLUORIDATION SCHEMES
Costs of defluoridation schemes: Table 4 shows the defluoridation scheme costsincluding the initial investment and operational costs, in total and on a per m3
basis, the treated water tariff, the profit per m3, and the profit per month. For allschemes visited, a shallow motorized or windmill well was in place. An overviewof the costs of developing a water source are considered in Table 5.
Table 5. Costs of developing a water source.
Type of single water supply scheme Initial inves tment (Birr)
Hand dug well From 10,000 to 30,000 Birr
Motorized shallow well of 100 m depth* Up to 500,000 Birr
Motorized deep well of 250 m depth* From 1,200,000 to 1,500,000 Birr
Spring protection Up to 50,000 Birr
*The motor pumps water to the surface.
Table 4. Inves tment, operational cos ts and prof it for each defluoridation scheme
Type of defluoridation
scheme
Initial investment
(Birr)*
Inves tment cost
(Birr/m3)†
Total operational
costs (Birr/m onth)‡
Operat ional costs
(Birr/m3)
Treated water tarif f
(Birr/m3)
Profit (Birr/m3)
Profit per
month (Birr)
Nalgonda§ 560,000 8.52 8,449 15 11 –0.65 –349
Bone char community with fuel||
543,418 7.44 7,852 13 22 9.91 5,948
Bone char community wind-powered
543,418
7.44 2,852 4 20 15.24 9,148
Household bone char** 5,710 0.62 816 10 20 NAD†† NAD
*For all three-community def luoridat ion schemes the initial investments have included the costs to develop a shallow well-motorized water source. Furthermore, these data were reported considering the initial inves tment to set up the entire scheme (water tanks, pipe line, kiosk and water storage). †The value is calculated considering a life span of Nalgonda and bone char schemes of ten years. ‡For the Nalgonda schemes, the total operat ional costs include: salary of water caretakers, fuel, guard salaries, and chemicals. For the community bone char schemes, the costs inc lude: the water caretaker salary, maintenance, regeneration, and sampling. For the household unit bone char systems, the operat ional costs only consis t of regenerat ion and sampling. §As implemented by the Catholic Relief Service (CRS) and the Lay Volunteer Internat ional Assoc iation (LVIA). The data were collec ted from their reports and during the interviews . The calculations were made by making an average between the two schemes’ costs. | |As implemented by Oromia Self Help Organization (OSHO). The data were collec ted during interviews. **Household Bone Char Systems are not in use anymore and the profit per m3 and per month could be calculated. †† NDA: Non-available data.

Research reportFluoride 48(4)281-304October-December 2015
Comparing defluoridation and safe sourcing for fluorosis mitigationin the Ethiopian Central Rift Valley
Datturi, van Steenbergen, van Beusekom, Kebede
295295
In a community defluoridation scheme, the installation of a water source is themajor part of the initial investment and it has direct consequences on the operationcosts. Community bone char and Nalgonda schemes visited have motorized/windmill shallow wells. In contrast, the initial investment for household bone charfilters does not have any development of water source costs because any watersource available near the household can be used.
According to Table 4, which summarizes the data collected in the field,household bone char filter units cost the least to the community members.However, they are not in use anymore.
Table 4 shows that the initial investments required by Nalgonda systems arehigher than those of bone char systems and their treatment capacity is also lower(8.52 versus 7.44 Birr/m3). On top of that, the operational costs of Nalgondasystems are also higher because of the relatively expensive chemicals required.Fuel costs involved in both community bone char and Nalgonda treatmentmethods contribute to operational costs. For this reason, bone char systems withwindmill-powered pumps have lower operation costs as reflected in the watertariffs (4 Birr/m3 for windmill-powered pumps compared to 6 Birr/m3 formotorized pumps using fuel).
The Nalgonda systems reviewed had lower water tariffs than the the bone charsystems. However, this price did not cover the total operational costs, as thechemicals were subsidized for CRS by the government.
The community bone char systems in operation are able to break-even and evenmake a small profit after covering the costs. In Nalgonda systems, on the otherhand, the operational costs that invariably outweigh income. In engine-poweredcommunity bone char systems, returns on investment can be expected within 7months. Windmill-powered ones can expect returns within 4 months.
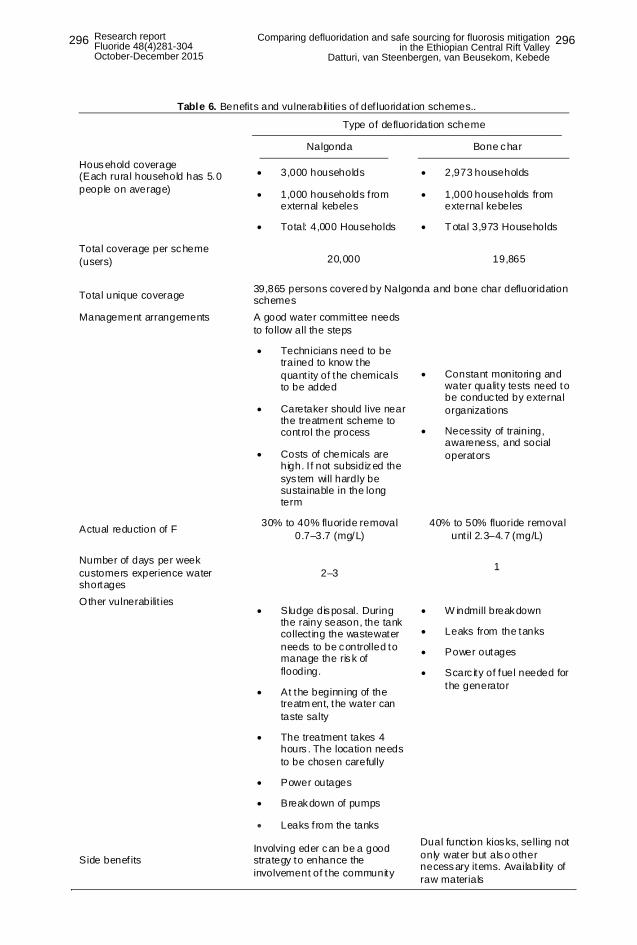
Benefits: As Table 6 shows, a total of 39,865 people currently have access tolow-fluoride water (data collected in the field). This value was calculated byconsidering a rural household to be characterized by 5.0 people24 and to includecovered by Nalgonda systems covered 3,000 households and 1,000 householdsfrom remote rural kebeles giving a total of 20,000 individual water users.Community bone char systems covered 2,973 households and approximately1,000 households from remote rural areas from outside the coverage area giving atotal of 19,865 individual users.
The kiosks developed by OSHO and through the involvement of eder in CRSNalgonda schemes are an important benefit of community systems. Eder is atraditional social institution, established with the mutual agreement of communitymembers, to help whenever community members face adverse situations. Peoplevoluntarily choose to participate. In the case of the death of a community member,eder membership entails taking charge of burial activities or supporting grievingfamilies economically.
Research reportFluoride 48(4)281-304October-December 2015
Comparing defluoridation and safe sourcing for fluorosis mitigationin the Ethiopian Central Rift Valley
Datturi, van Steenbergen, van Beusekom, Kebede
296296
Table 6. Benefits and vulnerabilities of def luoridat ion schemes..
Type of defluoridation scheme
Nalgonda Bone char
Household coverage (Each rural household has 5.0 people on average)
• 3,000 households
• 1,000 households from external kebeles
• Total: 4,000 Households
• 2,973 households
• 1,000 households from external kebeles
• Total 3,973 Households
Total coverage per scheme (users)
20,000
19,865
Total unique coverage 39,865 persons covered by Nalgonda and bone char defluoridation schemes
Management arrangements A good water committee needs to follow all the steps
• Technicians need to be trained to know the quant ity of the chemicals to be added
• Caretaker should live near the treatment scheme to control the process
• Costs of chemicals are high. I f not subsidized the sys tem will hardly be sustainable in the long term
• Constant monitoring and water quality tests need to be conduc ted by external organizations
• Necessity of training, awareness, and social operators
Actual reduction of F 30% to 40% fluoride removal 0.7–3.7 (mg/L)
40% to 50% fluoride removal unt il 2.3–4.7 (mg/L)
Number of days per week customers experience water shortages
2–3 1
Other vulnerabilit ies • Sludge disposal. During
the rainy season, the tank collect ing the wastewater needs to be controlled to manage the risk of flooding.
• At the beginning of the treatm ent, the water can taste salty
• The treatment takes 4 hours . The location needs to be chosen carefully
• Power outages
• Breakdown of pumps
• Leaks f rom the tanks
• W indmill breakdown
• Leaks from the tanks
• Power outages
• Scarc ity of fuel needed for the generator
Side benef its Involving eder can be a good strategy to enhance the involvement of the community
Dual funct ion kiosks, selling not only water but also other necessary items. Availability of raw materials

Research reportFluoride 48(4)281-304October-December 2015
Comparing defluoridation and safe sourcing for fluorosis mitigationin the Ethiopian Central Rift Valley
Datturi, van Steenbergen, van Beusekom, Kebede
297297
OSHO developed a kiosk at which the water caretaker sells treated water andother items. In this way, the caretaker’s commitment increases, because it is in his/her interest to stay at the kiosk and cater to customers.
In both experiences (OSHO and CRS), location was key to the functioning ofthe system. Water points can be reached from the main road, and in the case oftechnical problems users do not have to wait long for repairs. However, thelocation is not ‘central’ for a person living in a remote rural area, which meanswalking long distances to access water. In cases in which they have to pay theoriginal price of treated water, they prefer to go to Meki town rather than NGO-developed water points.
Vulnerabilities: The main vulnerabilities of Nalgonda systems pertain to bothsocial and technical issues. The weekly water shortage is higher in the Nalgondasystems than in the community bone chars systems (two to three times per weekcompared to one). Other vulnerabilities reported are common to both schemes:power outages, leaks in tanks, breaking of pumps, etc. Specific limitations ofNalgonda systems pertain to technology and the management of these systems.They include the inevitable saline taste in the treated water, the long time requiredto treat the water, and the necessity of employing a well-trained caretaker tomanage the administration of chemicals to the high-fluoride water during thetreatment process.
The main limitations of bone char systems include the need to replenish thebone char every six months, the value of choosing an appropriate site andinvolving people, and the need for constant monitoring (monthly) of the quality oftreated water.
DISCUSSION AND CONCLUSIONS
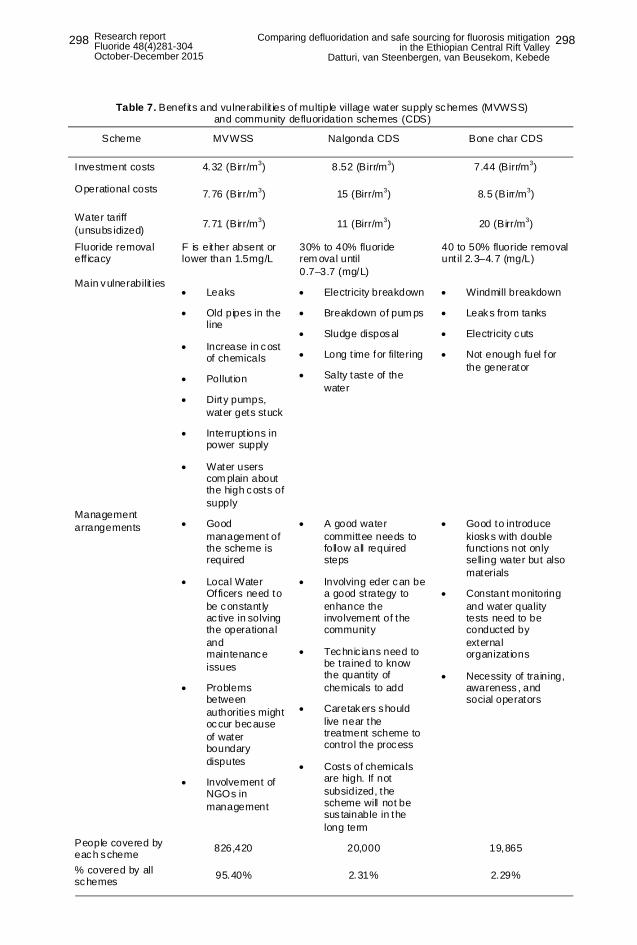
This cost-benefit-vulnerability analysis of defluoridation and safe sourcingsystems provides several insights into the efficacy of current programs andprojects to mitigate fluorosis. The analysis identifies the common causes offailures, the socio-technical vulnerabilities, and profitability of the schemes (Table7).
Cost-benefit analyses show that MVWSS are less costly than communitydefluoridation methods regarding water affordability (although investment costsare much higher). On the scale of vulnerability, both methods encounter dailyoperational problems, but problems with MVWSS are more likely to be fixed. Fordefluoridation schemes, community engagement is fundamental for long-termfunctioning, although full economic-managerial independence wass not yet inplace in the schemes visited. Regarding social benefits, MVWSS are able to reachmore people than community defluoridation schemes (826,420 versus 39,865).However, community defluoridation schemes are vital in areas where other safesources are unavailable, because they allow people to access low fluoride water.
Research reportFluoride 48(4)281-304October-December 2015
Comparing defluoridation and safe sourcing for fluorosis mitigationin the Ethiopian Central Rift Valley
Datturi, van Steenbergen, van Beusekom, Kebede
298298
The following lessons can be learnt to assist agencies in their mission to providechemical, and microbiological, acceptable water to rural communities in theECRV.
Table 7. Benefits and vulnerabilit ies of multiple village water supply schemes (MVWSS) and community defluoridation schemes (CDS)
Scheme MVWSS Nalgonda CDS Bone char CDS
Investment costs 4.32 (Birr/m3) 8.52 (Birr/m3) 7.44 (Birr/m3)
Operational costs 7.76 (Birr/m3) 15 (Birr/m3) 8.5 (Birr/m3)
Water tariff (unsubs idized) 7.71 (Birr/m3) 11 (Birr/m3) 20 (Birr/m3)
Fluoride removal eff icacy
F is either absent or lower than 1.5mg/L
30% to 40% fluoride rem oval until 0.7–3.7 (mg/L)
40 to 50% fluoride removal unt il 2.3–4.7 (mg/L)
Main vulnerabilit ies • Leaks
• Old pipes in the line
• Increase in cost of chemicals
• Pollut ion
• Dirty pumps, water gets stuck
• Interrupt ions in power supply
• Water users com plain about the high costs of supply
• Electricity breakdown
• Breakdown of pum ps
• Sludge disposal
• Long t ime for filtering
• Salty taste of the water
• Windmill breakdown
• Leaks from tanks
• Electricity cuts
• Not enough fuel for the generator
Management arrangements • Good
management of the scheme is required
• Local Water Officers need to be constant ly ac tive in solving the operational and maintenance issues
• Problems between authorities might occur because of water boundary disputes
• Involvement of NGOs in management
• A good water committee needs to follow all required steps
• Involving eder can be a good strategy to enhance the involvement of the community
• Technic ians need to be t rained to know the quantity of chemicals to add
• Caretakers should live near the treatment scheme to control the process
• Costs of chemicals are high. If not subsidized, the scheme will not be sus tainable in the long term
• Good to introduce kiosks with double funct ions not only selling water but also materials
• Constant monitoring and water quality tests need to be conducted by external organizat ions
• Necessity of training, awareness , and social operators
People covered by each scheme 826,420 20,000 19,865
% covered by all schemes 95.40% 2.31% 2.29%

Research reportFluoride 48(4)281-304October-December 2015
Comparing defluoridation and safe sourcing for fluorosis mitigationin the Ethiopian Central Rift Valley
Datturi, van Steenbergen, van Beusekom, Kebede
299299
Nevertheless, there is an urgency to investigate opportunities to find sustainablesafe sources of water for permanent sourcing or as a backup for multi village watercommunity schemes. Considering an average of drinking/cooking waterconsumption in Ethiopia of 3,650 L per year (UNDP, 2006), and taking theaverage of the water tariff for the community defluoridation schemes andMVWSS, the cost per person per year is much lower for safe sourcing (Figure 6).
The first lesson is to develop large water supply schemes from the randomlydistributed, chemically acceptable water resources located in the ECRV. This studyshows that these systems hold the potential to generate the required impact at thenecessary scale to serve a population of over 15 million and to be more affordablethan community defluoridation schemes. Such systems have shown the capabilityto source low-fluoride water and distribute it in a safe and cost effective way overlarge groups of consumers. They also serve a wide variety of rural households, asthey attract people from the target communities as well as from remote rural areas.More remote communities experience barriers, such as distance and the risk ofexclusion, to using defluoridated water when projects are developed at thecommunity-level. Attention should be paid to the profitability of large schemes.The costs of the repairs associated with frequent breakdown of pipelines, use ofdiesel generators during power outages, and increased pre-treatment costs ofsourced low fluoride water are currently not reflected in hikes in water tariffs, butare borne by the water bureaus. To enhance the sustainability of large waterschemes, it is necessary that their designs take into account possible environmentaland social risks, such as drought and increase in water demand from consumptiveand productive uses. These future vulnerabilities need to be factored into anintegrated plan that connects climate change resilience with pollution preventionand development of specific natural standards (filters for industries andenvironmental impact assessment).
Cost of water in Birr/m3 or Birr/person/year
Multiple village water supply schemes (MVWSS) Community defluoridation schemes (CDS)
Figure 6. Water tariff per unit of water (Birr/m3) and cost per person per year (Birr/person/year) for Multiple village water supply schemes (MVWSS) and community defluoridation schemes (CDS).
MVWSS water tariff (Birr/m3)
MVWSS cost/person/year (Birr/person/year)
CDS water tariff (Birr/m3)
CDScost/person/year (Birr/person/year)
100
0
Research reportFluoride 48(4)281-304October-December 2015
Comparing defluoridation and safe sourcing for fluorosis mitigationin the Ethiopian Central Rift Valley
Datturi, van Steenbergen, van Beusekom, Kebede
300300
The second lesson is that community defluoridation systems are appropriate forisolated communities that cannot be connected to large water supply schemes.Such systems can also be developed in regions facing clean water shortages. Theseschemes require a much lower upfront investment compared to large-scale watersupply schemes, and are typically constructed by NGOs and charity organizations.
The third lesson is that the capacity of NGOs to connect with local institutions,norms, and needs is decisive for the long-term sustainability of community leveldefluoridation schemes. It has been observed that ongoing systems and programsintensively consult the community and the traditional leadership (eder) in theselection of the location of the system and the choice of the defluoridation method.Malfunctioning or abandoned systems have often seen a general lack ofcommunity involvement and sense of ownership.
The fourth lesson is that the community level defluoridation schemes are notprofitable and that running costs for the purchase of expensive chemicals (in thecase of Nalgonda systems, for example) and water sampling and replacement offilters (bone char) still have to be subsidized by external agencies such as NGOs.However, based on our analysis and considering only economics, when lowfluoride sources are unavailable it is possible to conclude that bone char is cheaperthan Nalgonda filters because of the lower operational costs involved.
The fifth lesson is that understanding the current strategies in place to deal withhigh fluoride concentration is as important as understanding the distribution offluoride in groundwater. The integration of both findings is required in order toimplement efficient and locally based fluoride mitigation strategies in the ECRV.
The sixth lesson is that the Ethiopian government, under the fluoride mitigationproject, is making great efforts in carrying out multidisciplinary research onfluoride. At the same time, functionality of water schemes, operation andmaintenance costs, and systematic water quality checks need to be carried out in amore integrated way.
Integration of lessons 1 and 2 is restricted by the limited insights into thedistribution of low-fluoride groundwater sources in the ECRV. This limits thepossibility of an informed decision-making process that can help large watersupply schemes (governments) and community-level water supply schemes(NGOs) serve communities better.
ACKNOWLEDGEMENTS
The authors would like to thank the many informants and resource persons thatprovided information for this study. In particular, thanks to Dr Zewge Felleke forhis constructive comments. This research was made possible under the UPGRO(Unlocking the Potential for Groundwater for the Poor in Sub-Saharan Africa)Research Programme funded by DFID, NERC, and ESCR, and in particular, thecatalyst research Improving Access to Safe Drinking Water: Prospection for Low-Fluoride Sources.

Research reportFluoride 48(4)281-304October-December 2015
Comparing defluoridation and safe sourcing for fluorosis mitigationin the Ethiopian Central Rift Valley
Datturi, van Steenbergen, van Beusekom, Kebede
301301
REFERENCES1 Dace O, Wiatrowsky E, Samachson J, Spencer H. Fluoride analysis of the human diet and
of biological samples. Clinica Chimica Acta 2002;51:211-6.
Appendix 1. List of interviewed stakeholders and topics discussed
Stakeholders interviewed Topics
National/regional State level
• Fluoride Nat ional Steering Committee
• Ethiopia Water and Energy Ministry
• Oromia Water and Mines Bureau
1. Overview of: on-going activities and programs in safe sourcing and fluoride treatment, awareness and investments plans
2. Planned and discussed National fluoride programs for the future
3. National vs. international WHO water quality standards
4. Dental and skeletal f luorosis assessment
NGOs
• Lay International Volunteer Organization
• Oromia Self Help Organization
• Catholic Relief Service
1. Type of schemes implemented
2. Schem e select ion rat ionale and efficacy of schemes 3. Schem e locat ion criteria
4. Number of people served 5. Operation and maintenance cos ts
6. Investment costs
7. Actual fluoride reduction Water off icers at the Town/woreda level for mult iple village water supply schemes • Adama • Meki • Ziway • Bulbula • ArsiNegelle/Siraro • Shashamane
1. Implementation of the scheme
2. Number of people served 3. Inves tment costs
4. Operational and maintenance pract ices 5. Water quality
6. Managem ent arrangements
7. Breakdown risks of the scheme 8. Side costs (such as sludge disposal and tas te)
9. Addit ional benefits 10. Price of water charged
11. Main issues and challenges
Local communities
• ShirkanoKeta • QoroBotojota • Dodo • Tejitu • Bofo • Graba File • Gura • KorkeAdi • Serity • W.Gabriel
1. Uses of water within the community
2. Reliability of water schemes, expressed as waiting time to fetch water (0-15; 15-30; 30-45; 45-60 and >60minutes)
3. Water consumption per household per day 4. Perception and acceptability of the de-fluoridation scheme
5. Willingness to pay 6. Water commit tee management
7. Coping strategies of the community during water shortage 8. community main source of water during dry and wet season
Research reportFluoride 48(4)281-304October-December 2015
Comparing defluoridation and safe sourcing for fluorosis mitigationin the Ethiopian Central Rift Valley
Datturi, van Steenbergen, van Beusekom, Kebede
302302
2 Scientific Committee on Health and Environmental Risks (SCHER). Opinion of criticalreview of any new evidence on the hazard profile, health effects, and human exposure tofluoride and the fluoridating agents of drinking water. Brussels, Belgium: DirectorateGeneral for Health and Consumers, European Commission; 2011 May 16. pp. 2-4.
3 Bailey K, Chilton J, Dahi E, Fewtrell L, Magara Y. Fluoride in drinking-water. Geneva: WorldHealth Organization with IWA publishing; 2006. pp1-144.
4 Feenstra L, Vasak L, Griffioen J. Fluoride in groundwater: overview and evaluation ofremoval methods. Report SP 2007-1. Utrecht, The Netherlands: International GroundwaterResource Assessment Centre (IGRAC); 2007. pp. 1-25.
5 WHO. Guidelines for drinking-water quality: Third Edition Incorporating the First andSecond Agenda. Volume 1 Recommendations. Geneva, Switzerland: World HealthOrganization (WHO); 2008.
6 Rango T, Kravchenko J, Atlaw B, McCornick PG, Jeuland M, Merola B, Vengosh A.Groundwater quality and its health impact: an assessment of dental fluorosis in ruralinhabitants of the Main Ethiopian Rift. Environ Int 2012;43:37-47. doi: 10.1016/j.envint.2012.03.002. Epub 2012 Apr 6.
7 Tekle-Haimanot R. Study of fluoride and fluorosis in Ethiopia with recommendations onappropriate defluoridation technologies: a UNICEF sponsored consultancy [unpublishedmanuscript]. Addis Ababa, Ethiopia: Addis Ababa University; 2005.
8 Susheela AK, Bhatnagar Reversal of fluoride induced cell injury through elimination offluoride and consumption of diet rich in essential nutrients and antioxidants. Mol CellBiochem 2002;234-5(1-2):335-40.
9 McKnight CB, Levy SM, Cooper SE, Jakobsen JR. A pilot study of aesthetic perceptions ofdental fluorosis vs. selected other dental conditions. ASDC J Dent Child 1998;65(4):233-8,229.
10 Melaku Z, Ismail S. Perception on fluoride related health problems in an area of endemicfluorosis in Ethiopia: an exploratory qualitative study. Ethiop J Health Dev 2002; 16(1):85-94.
11 Rodd HD, Davidson LE. The aesthetic management of severe dental fluorosis in the youngpatient. Dent Update 1997; 24(10):408-11.
12 Tekle-Haimanot R, Haile G. Chronic Alcohol consumption and the development of skeletalfluorosis in a fluoride endemic area of the Ethiopian Rift Valley. Journal of Water Resourceand Protection 2014;6(2):149-55. Available from: (http://www.scirp.org/journal/jwarp)http://dx.doi.org/10.4236/jwarp.2014.62020
13 Kravchenko J, Rango T, Akushevich I, Atlaw B, McCornick PG, Merola RB, et al. The effectof non-fluoride factors on risk of dental fluorosis: evidence from rural populations of theMain Ethiopian Rift. Sci Total Environ. 2014 Aug 1;488-489:595-606. doi: 10.1016/j.scitotenv.2013.12.087. Epub 2014 Jan 22.
14 Tekle-Haimanot R, Melaku Z, Kloos H, Reimann C, Fantaye W, Zerihun L, Bjorvatn K. Thegeographic distribution of fluoride in surface and groundwater in Ethiopia with an emphasison the Rift Valley. Sci Total Environ 2006;367(1):182-90. Epub 2005 Dec 19.
15 Brindha K, Elango L. Fluoride in groundwater: causes, implications and mitigationmeasures. In: Monroy SD, editor. Fluoride properties, applications and environmentalmanagement. New York; Nova Press, an imprint of Nova Science Publishing; 2011; pp. 111-36.
16 Sonego, Huber AC, Mosler HJ. Does the implementation of hardware need software? Alongitudinal study on fluoride-removal filter use in Ethiopia. Environ Sci Technol 2013;47(22):12661-8. doi: 10.1021/es402787s. Epub 2013 Oct 30.
17 Hengsdijk H, Jansen H. Ecosystems for water, food and economic development in theEthiopian central rift valley (BO-10-006-22). Report of inception mission to Ethiopia andWork plan. Wageningen, The Netherlands; Plant Research International B.V.; 2006.
18 Ministry of Water Resources, Federal Democratic Republic of Ethiopia. National water andsanitation inventory. Addis Ababa, Ethiopia: Ministry of Water Resources, FederalDemocratic Republic of Ethiopia; 2012.

Research reportFluoride 48(4)281-304October-December 2015
Comparing defluoridation and safe sourcing for fluorosis mitigationin the Ethiopian Central Rift Valley
Datturi, van Steenbergen, van Beusekom, Kebede
303303
19 Oromia Water, Mines and Energy Bureau. Water access in rural areas. Addis Ababa,Ethiopia: Oromia Water, Mines and Energy Bureau, The Federal Democratic Republic ofEthiopia; 2014.
20 UN Entity for the Gender Equality and the Empowerment of Women, UNIFEM Fact Sheet:At a Glance – women and water UN Women. 2011 Jun [cited 2014 November 12].Available from: http://www.unifem.org/materials/fact_sheets.php?StoryID=289.
21 Huber AC, Mosler HJ. Determining behavioural factors for interventions to increase safewater consumption: a cross-sectional field study in rural Ethiopia. Int J Environm HealthRes 2013;23(2):96-107.
22 Ayoob S, Gupta AK, Venugopal TB. A conceptual overview on sustainable technologies forthe defluoridation of drinking water, Critical Reviews in Environmental Science andTechnology 2008;3(6):401-70.
23 Osterwalder L, Johnson CA, Yang H, Johnston RB. Multi-criteria assessment of community-based fluoride removal-technologies for rural Ethiopia. Sci Total Environ 2014;488-9:532-8.doi: 10.1016/j.scitotenv.2013.10.072. Epub 2013 Nov 14.
24 Central Statistical Agency (CSA). Federal Democratic Republic of Ethiopia StatisticalAbstract December, 2005. Addis Ababa: Central Statistical Agency; 2005.
Copyright © 2015 The International Society for Fluoride Research Inc. www.fluorideresearch.org www.fluorideresearch.com www.fluorideresearch.net
Editorial Office: 727 Brighton Road, Ocean View, Dunedin 9035, New Zealand.

Research reportFluoride 48(4)281-304October-December 2015
Comparing defluoridation and safe sourcing for fluorosis mitigationin the Ethiopian Central Rift Valley
Datturi, van Steenbergen, van Beusekom, Kebede
304304
References in reference section but not mentioned in the text:
6 Dessalegne M, Zewge F. Daily dietary fluoride intake in rural villages of the Ethiopian RiftValley. Toxicological & Environmental Chemistry 2013;95(6):1056-68.
11 Kaseva ME. Contribution of trona (magadi) into excessive fluorosis: a case study in Maji YaChai Ward, northern Tanzania. Sci Total Environ 2006; 366(1):92-100.
13 Malde MK, Scheidegger R, Julshamn K, Bader HP. Substance flow analysis: a case studyof fluoride exposure through food and beverages in young children living in Ethiopia.Environ Health Perspect 2011;119(4):579-84.
16 Ministry of Water Resources, Federal Democratic Republic of Ethiopia. Ethiopia waterresources management policy: review of rural water supply UAP implementation andreformulation of plans and strategies for accelerated implementation. Addis Ababa,Ethiopia: Ministry of Water Resources, Federal Democratic Republic of Ethiopia,; 1999.
17 Ministry of Water Resources, Federal Democratic Republic of Ethiopia. Ethiopianguidelines: specification for drinking water quality. Addis Ababa, Ethiopia: Ministry of WaterResources, Federal Democratic Republic of Ethiopia; 2002.
18 Ministry of Water Resources, Federal Democratic Republic of Ethiopia. Rift Valley LakesBasin Integrated Resources: development master plan study project. Addis Ababa,Ethiopia: Ministry of Water Resources, Federal Democratic Republic of Ethiopia; 2009.
19 Ministry of Water Resources. Federal Democratic Republic of Ethiopia. Revised rural watersupplies universal access plan. Federal Democratic Republic of Ethiopia. Addis Ababa,Ethiopia: Ministry of Water Resources, Federal Democratic Republic of Ethiopia; 2011.
21 Ministry of Water Resources, Federal Democratic Republic of Ethiopia. Spatial distributionof fluoride in the Ethiopian and its adjacent highlands. Water Supply and SanitationDirectorate National Fluorosis Mitigation Project Office. Addis Ababa, Ethiopia: Ministry ofWater Resources, The Federal Democratic Republic of Ethiopia; 2013. pp. 1-149.
25. Rango T, Vengosh A, Dwyer G, Bianchini G. Mobilization of arsenic and other naturallyoccurring contaminants in groundwater of the Main Ethiopian Rift aquifers. Water Res2013;47(15):5801-18. doi: 10.1016/j.watres.2013.07.002. Epub 2013 Jul 11.
32 United Nations Development Programme. Human development report 2006: Beyondscarcity–power, poverty and the global water crisis. Basingstoke, United Kingdom:Palgrave Macmillan; 2006.
Copyright © 2022 FDOKUMEN