
light intensity distribution inside PBR
11
ORIGINAL PAPER Studies on light intensity distribution inside an open pond photo-bioreactor Ramakant Pandey 1 • Akhilesh Sahu 1 • Vasumathi K. K 1 • Premalatha M 1 Received: 23 March 2015 / Accepted: 29 March 2015 Ó Springer-Verlag Berlin Heidelberg 2015 Abstract Light intensity profiles inside an open tank were studied using ANSYS Fluent. Experiments were performed by taking Scenedesmus arcuatus, green mi- croalgae at three different concentrations under actual sunlight conditions. Absorption of light intensity at dif- ferent depths was measured experimentally. The results generated from CFD simulations were compared with the experimental results and the cornet model. It has been found that there is a good agreement between the light intensity profile obtained from the CFD simulation and that calculated using the Cornet’s model. Light intensity pro- files at different depths were calculated using CFD simulation by varying the dimensions of the tank. The ef- fect of wall reflectivity, diffuse fraction and scattering phase function on light profile in side open tank are also studied using CFD simulation. Keywords Microalgae Open pond Light intensity CFD Cornet’s model Discrete ordinates model List of symbols PBR Photo-bioreactor PAR Photo synthetically active radiation (lmol m -2 s -1 or photons) RTE Radiative transport equation DO Discrete ordinate Method OD Optical density A Absorbance L Light path length (m) n Refractive index of the medium r Stefan–Boltzmann constant T Local temperature (K) A Phase function X 0 Solid angle (sr -1 ) X Microalgae density (kg/m 3 ) E a Mass absorption coefficient (m 2 /kg) E s Mass scattering coefficient (m 2 /kg) I 0 Incident radiation (lmol m -2 s -1 ) I Local radiation intensity (lmol m -2 s -1 ) r ! Position vector s ! Direction vector s ! 0 Scattering direction vector r s Scattering coefficient (m -1 ) k Absorption coefficient (m -1 ) b Extinction coefficient (m -1 ) x Single scattering albedo N Cell number density (cells/m 3 ) s Transmittivity e Molar absorptivity f d Diffuse fraction q Radiative flux (W/m 2 ) Band-0 400–500 nm Band-1 500–650 nm Band-2 650–700 nm Subscripts k At particular wavelength w Wall In Incoming Out Outgoing a Absorption s Scattering d Diffuse & Premalatha M [email protected] 1 National Institute of Technology, CEESAT, Tiruchirappalli, India 123 Bioprocess Biosyst Eng DOI 10.1007/s00449-015-1398-3
Transcript of light intensity distribution inside PBR

ORIGINAL PAPER
Studies on light intensity distribution inside an open pondphoto-bioreactor
Ramakant Pandey1• Akhilesh Sahu1
• Vasumathi K. K1• Premalatha M1
Received: 23 March 2015 / Accepted: 29 March 2015
� Springer-Verlag Berlin Heidelberg 2015
Abstract Light intensity profiles inside an open tank
were studied using ANSYS Fluent. Experiments were
performed by taking Scenedesmus arcuatus, green mi-
croalgae at three different concentrations under actual
sunlight conditions. Absorption of light intensity at dif-
ferent depths was measured experimentally. The results
generated from CFD simulations were compared with the
experimental results and the cornet model. It has been
found that there is a good agreement between the light
intensity profile obtained from the CFD simulation and that
calculated using the Cornet’s model. Light intensity pro-
files at different depths were calculated using CFD
simulation by varying the dimensions of the tank. The ef-
fect of wall reflectivity, diffuse fraction and scattering
phase function on light profile in side open tank are also
studied using CFD simulation.
Keywords Microalgae � Open pond � Light intensity �CFD � Cornet’s model � Discrete ordinates model
List of symbols
PBR Photo-bioreactor
PAR Photo synthetically active radiation
(lmol m-2s-1 or photons)
RTE Radiative transport equation
DO Discrete ordinate Method
OD Optical density
A Absorbance
L Light path length (m)
n Refractive index of the medium
r Stefan–Boltzmann constant
T Local temperature (K)
A Phase function
X0 Solid angle (sr-1)
X Microalgae density (kg/m3)
Ea Mass absorption coefficient (m2/kg)
Es Mass scattering coefficient (m2/kg)
I0 Incident radiation (lmol m-2s-1)
I Local radiation intensity (lmol m-2s-1)
r! Position vector
s! Direction vector
s!0 Scattering direction vector
rs Scattering coefficient (m-1)
k Absorption coefficient (m-1)
b Extinction coefficient (m-1)
x Single scattering albedo
N Cell number density (cells/m3)
s Transmittivity
e Molar absorptivity
fd Diffuse fraction
q Radiative flux (W/m2)
Band-0 400–500 nm
Band-1 500–650 nm
Band-2 650–700 nm
Subscripts
k At particular wavelength
w Wall
In Incoming
Out Outgoing
a Absorption
s Scattering
d Diffuse
& Premalatha M
1 National Institute of Technology, CEESAT,
Tiruchirappalli, India
123
Bioprocess Biosyst Eng
DOI 10.1007/s00449-015-1398-3

Introduction
Microalgal bioreactors are often designed differently from
bioreactors which are used to grow other microorganisms.
This is because most microalgae are photo-autotrophs and
depend on light as energy source. Supply, distribution and
utilisation of light by microalgal cultures are therefore
central aspects, which receive particular attention in the
design of photo-bioreactors.
Basically, a photo-bioreactor (PBR) is a bioreactor that
incorporates some type of light source. Virtually any
translucent container could be called as a PBR; however,
the term is more commonly used to define a closed system,
as opposed to an open tank or pond. Growing algae in
PBRs reduces risk of contamination, improves the repro-
ducibility of cultivation conditions, provides control over
hydrodynamics and temperature, and allows appropriate
technical design [1].
Light is one of the important factors that affect com-
position of biomass and growth rate. Typical light intensity
requirements of microalgae are relatively low in compar-
ison to higher plants. For example, saturating light intensity
of Chlorella sp. and Scenedesmus sp. is around
200 lmol m-2 s-1 [2]. Density of algal culture affects
both the available light intensity as well as the light
penetration depth. It has been observed that optimal cell
density varies with the strain [3]. The wavelengths of light
used to cultivate the algae also affect the growth. The fact
is that more than 50 % of the incident solar radiation is not
useful for photosynthesis [1]. The quantity of light termed
as photons (lmol m-2 s-1) and available between wave-
lengths of 400–700 nm (visible spectrum) is only useful for
photosynthesis and this fraction of sunlight is called pho-
tosynthetically active radiation (PAR).
The radiation properties of microalgae were ex-
perimentally determined in [4, 5]. They measured extinc-
tion coefficients of each species from normal–normal
transmittance measurements in the wavelength range of
400–800 nm using UV–Vis–NIR spectrophotometer. They
observed that absorption coefficient is strongly dependent
on the wavelength of the light used and scattering phase
function for Chlorella sp., B. braunii and C. littorale mi-
croalgae peaks in the forward direction which is almost
constant for the wavelength studied. Similar observations
were reported by [6]. Moreover, they found that the value
of scattering albedo was approximately 0.9.
Houf and Incropera [7] compared various methods of
determining radiation transfer through aqueous suspensions
to predict radiative flux and absorption profiles within the
suspension, as well as overall absorption and reflection by
the suspension. They calculated various radiation pa-
rameters such as scattering albedo, bottom reflectance,
overall optical depth, and directional distribution of the
incident radiation and found reasonable agreement among
three flux, six flux and discrete ordinate method for various
conditions. On the other hand, absorption effects were
consistently under predicted by forward scattering method
and over predicted by Delta-Eddington method.
Lambert–Beer’s law can give reasonable estimate of
light distribution within algae suspensions but it does not
consider differential wavelength absorption by algae and
scattering effect explicitly. Cornet et al. [8–10] proposed a
model which separately accounts for absorption and scat-
tering and is able to produce good results for mono-di-
mensional approximation. This approach is very useful to
analyse the effect of light intensity distribution on the
growth of microalgae.
Acien et al. [11] proposed an empirical model to de-
termine light attenuation which is hyperbolic in nature and
requires only geographic, geometric, and solar position
parameters.
The present state of art of CFD simulation for PBR was
reviewed by [12] and modelling of light intensity distri-
bution inside the PBR was identified as one of the major
factors for getting accurate results through simulation. In
order to model the light transfer in three dimensions, one
has to solve the radiation transport equation. The radiative
transport equation (RTE) is a semi-empirical integro-dif-
ferential equation and analytical solution is possible only
for very simple mono-dimensional cases.
Pareek et al. [13, 14] determined light intensity distri-
bution in photo-catalytic reactor by solving RTE nu-
merically. They used finite volume approach of discrete
ordinate (DO) method available with FLUENT to solve the
RTE. They evaluated the effects of wall reflectivity, cata-
lyst loading and phase function parameter on light intensity
distribution. They found that, for relatively low catalyst
loadings, the wall reflectivity strongly influenced the light
intensity distribution. However, for an optically thick
medium, the wall reflectivity had negligible effect. Pareek
[15] simulated light intensity distribution, in dual lamp
photo-reactor filled with titania-slurry, using conservative
variant of discrete ordinate method and performed CFD
simulation for both homogeneous as well as heterogeneous
reactors. The model predictions were used to evaluate the
effect of catalyst loading on light intensity distribution for
various reactor configurations.
Duran et al. [16] modelled irradiation in annular photo-
reactors using finite volume method and found that the
models with diffused radiation emission showed better
overall irradiance prediction capabilities. The available
literature indicates that there is a huge possibility of ap-
plying CFD simulations to analyse radiation characteristics
of solid in suspension, the effect of concentration on light
Bioprocess Biosyst Eng
123

profile and the effect of geometry on light distribution in-
side the reactor.
Hence in this work, radiation characteristics of Scene-
desmus arcuatus were determined experimentally and light
intensity profile inside an open tank under actual solar ra-
diation was measured using online PAR sensor. Ex-
perimentally measured radiation characteristics were used
for CFD simulation and then CFD simulations were
validated with the theoretical Cornet’s model.
Light intensity Profile
Experimental method
Green microalgae S. arcuatus available at bio-energy lab,
CEESAT, National institute of technology Trichy, Tamil
Nadu, India was used as living culture in aqueous medium.
It was inoculated in a rectangular tank (0.56 9
0.36 9 0.36 m3) filled with pure water. The culture was
supplied with CO2 as a carbon source three times a day
which also maintained a PH, the original morphology of
Scenedesmus sp. was changed from colonies (a group
generally found as 8 or 4) to single cells upon supply of
100 % pure CO2 [17]. In order to avoid absorption and
scattering effects due to nutrient particles, no nutrients
were supplied and culture was allowed to grow in diffuse
sun light with the average PAR value varying between of
200 and 250 lmol m-2 s-1.
The optical density was measured using Vis spec-
trophotometer (HACH, DR2800). The calibration curves
were drawn by measuring the dry cell weight and the
number of cells per unit volume of suspension at different
optical densities (OD). The absorbance of the microalgae
was measured at 440 nm in cuvette with the path length of
1 inch using a UV–Vis spectrophotometer. Then, the cell
number (N) was determined using the haemocytometer and
Image J software.
Finally, to find the dry weight, a known volume of mi-
croalgae suspension was filtered through mixed cellulose
filter membranes with 0.45 lm pore size and dried at 85 �C
for 15 h. The dried filters were weighed immediately after
being taken out of the oven on a precision balance with a
least count of 1 mg. Calibration curves for cell number
(N) and dry mass density per unit volume (X) versus OD at
440 nm are shown in Fig. 1a, b, respectively. The cell
number, density combined with microalgae shape, size
distribution, and chlorophyll content are important for
theoretically predicting radiation characteristics of algal
suspensions. In measuring the radiation characteristics it is
assumed that the microalgae were well mixed and ran-
domly oriented. Single scattering albedo for a particular
species does not vary significantly with concentration
although it changes slightly with wavelength [4]. It can be
observed from this literature, that single scattering albedo
is not varying much for Chlorella sp, B. braunii and C.
littorale. Hence, in this work, single scattering albedo of S.
arcuatus is considered equal to that of single scattering
albedo of C. littorale. The average radiation characteristics
calculated corresponding to the wavelength range are
shown in Table 1 as derived from [4].
Beer lamberts law relates Extinction coefficient with
absorbance and is given below
A ¼ � log10
I
Io
� �¼ eLC ¼ bL ð1Þ
Absorbance of Scenedesmus sp. at concentrations men-
tioned in Table 2 was measured and extinction coefficient
was calculated using Eq. 1, now Eq. 2 relates extinction
coefficient with scattering albedo and scattering coefficient,
Fig. 1 a, b Calibration curve showing cell density concentration and dry weight concentration as a function of optical density at 440 nm and for
1 inch path length
Bioprocess Biosyst Eng
123
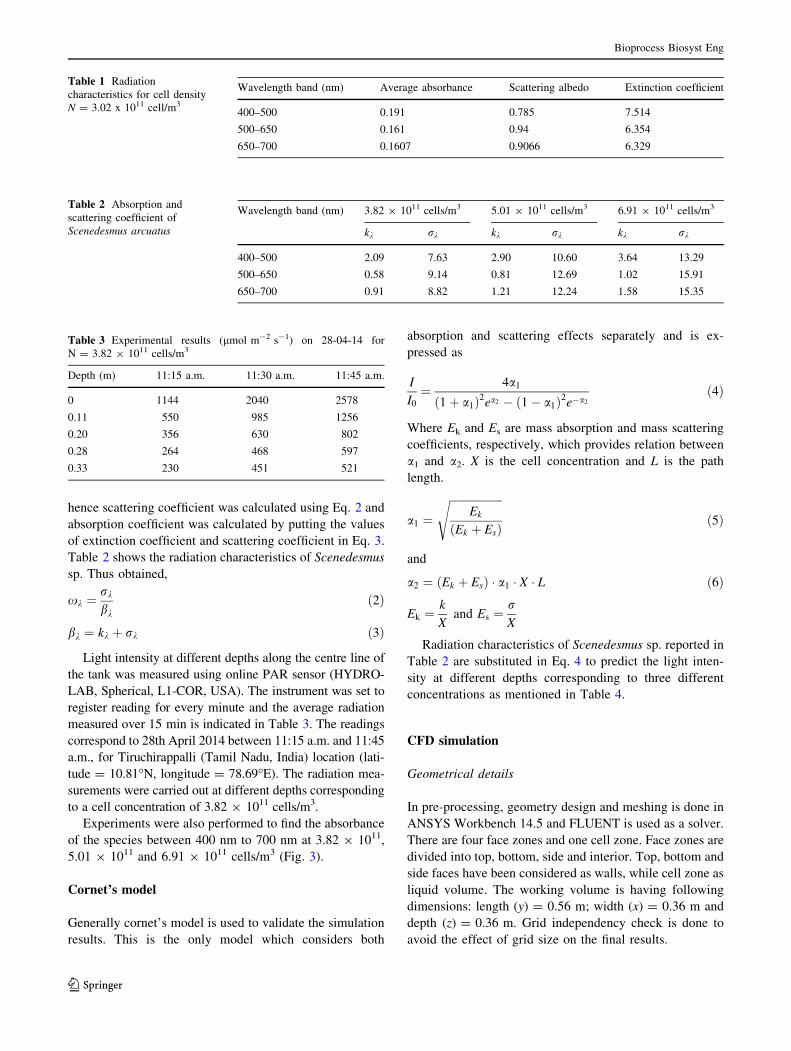
hence scattering coefficient was calculated using Eq. 2 and
absorption coefficient was calculated by putting the values
of extinction coefficient and scattering coefficient in Eq. 3.
Table 2 shows the radiation characteristics of Scenedesmus
sp. Thus obtained,
xk ¼rk
bkð2Þ
bk ¼ kk þ rk ð3Þ
Light intensity at different depths along the centre line of
the tank was measured using online PAR sensor (HYDRO-
LAB, Spherical, L1-COR, USA). The instrument was set to
register reading for every minute and the average radiation
measured over 15 min is indicated in Table 3. The readings
correspond to 28th April 2014 between 11:15 a.m. and 11:45
a.m., for Tiruchirappalli (Tamil Nadu, India) location (lati-
tude = 10.81�N, longitude = 78.69�E). The radiation mea-
surements were carried out at different depths corresponding
to a cell concentration of 3.82 9 1011 cells/m3.
Experiments were also performed to find the absorbance
of the species between 400 nm to 700 nm at 3.82 9 1011,
5.01 9 1011 and 6.91 9 1011 cells/m3 (Fig. 3).
Cornet’s model
Generally cornet’s model is used to validate the simulation
results. This is the only model which considers both
absorption and scattering effects separately and is ex-
pressed as
I
I0
¼ 4a1
1þ a1ð Þ2ea2 � 1� a1ð Þ2e�a2
ð4Þ
Where Ek and Es are mass absorption and mass scattering
coefficients, respectively, which provides relation between
a1 and a2. X is the cell concentration and L is the path
length.
a1 ¼ffiffiffiffiffiffiffiffiffiffiffiffiffiffiffiffiffiffiffi
Ek
ðEk þ EsÞ
sð5Þ
and
a2 ¼ Ek þ Esð Þ � a1 � X � L ð6Þ
Ek ¼k
Xand Es ¼
rX
Radiation characteristics of Scenedesmus sp. reported in
Table 2 are substituted in Eq. 4 to predict the light inten-
sity at different depths corresponding to three different
concentrations as mentioned in Table 4.
CFD simulation
Geometrical details
In pre-processing, geometry design and meshing is done in
ANSYS Workbench 14.5 and FLUENT is used as a solver.
There are four face zones and one cell zone. Face zones are
divided into top, bottom, side and interior. Top, bottom and
side faces have been considered as walls, while cell zone as
liquid volume. The working volume is having following
dimensions: length (y) = 0.56 m; width (x) = 0.36 m and
depth (z) = 0.36 m. Grid independency check is done to
avoid the effect of grid size on the final results.
Table 1 Radiation
characteristics for cell density
N = 3.02 x 10¹¹ cell/m3
Wavelength band (nm) Average absorbance Scattering albedo Extinction coefficient
400–500 0.191 0.785 7.514
500–650 0.161 0.94 6.354
650–700 0.1607 0.9066 6.329
Table 2 Absorption and
scattering coefficient of
Scenedesmus arcuatus
Wavelength band (nm) 3.82 9 1011 cells/m3 5.01 9 1011 cells/m3 6.91 9 1011 cells/m3
kk rk kk rk kk rk
400–500 2.09 7.63 2.90 10.60 3.64 13.29
500–650 0.58 9.14 0.81 12.69 1.02 15.91
650–700 0.91 8.82 1.21 12.24 1.58 15.35
Table 3 Experimental results (lmol m-2 s-1) on 28-04-14 for
N = 3.82 9 1011 cells/m3
Depth (m) 11:15 a.m. 11:30 a.m. 11:45 a.m.
0 1144 2040 2578
0.11 550 985 1256
0.20 356 630 802
0.28 264 468 597
0.33 230 451 521
Bioprocess Biosyst Eng
123

Governing equations
Radiative transport equation is the basic governing equa-
tion to describe the radiation transfer. It comprises of solar
radiation transfer within absorbing, scattering, and non-
emitting media such as micro-organism suspensions. The
basic RTE at position r!, in the direction s!, can be written
as’
dI r!; s!� �
dsþ k þ rsð ÞI r!; s!
� �
¼ kn2 rT4
pþ rs
4p
Z 4p
0
I r!; s!0� �
U s!: s!0� �
dX0 ð7Þ
The phase function U( s!. s!0) accounts for scattering
from the direction s!0, to the direction s!, and determines
the fraction of in-scattering radiation. This equation indi-
cates that intensity depends on spatial position and angular
direction. The sum of the absorption coefficient and the
scattering coefficient is often called the extinction coeffi-
cient (b = k ? rs).
Radiation model
Conservative variant of discrete ordinate method has
been used to solve the RTE since DO models account
for exchange of radiation between gas and particulates.
It also allows modelling semi-transparent walls of var-
ious types, specular reflection and computing non-grey
radiation.
Non-grey radiation model is used to account for the non-
grey nature of solar radiation. Following inputs were given
to solar calculator for Tiruchirappalli location. Solar cal-
culator available with ANSYS FLUENT was used to de-
termine the direction of beam radiation for the day and
time under consideration. Solar radiation in PAR region
(400–700 nm) (Fig. 2) was divided into three bands: Band
0 (400–500 nm); Band 1 (500–650 nm) and Band 2
(650–700 nm). Green microalgae S. arcuatus having re-
fractive index of the culture as 1.339 were used as a
medium for absorption of light inside the tank. Radiation
characteristics such as absorption coefficient and scattering
coefficient for three different wavelength bands obtained
from experimental results were used for simulation
(Table 2).
Boundary conditions
Bottom and side walls were considered opaque, while top
wall which is a phase boundary was considered as semi-
transparent wall. The top wall was exposed to solar ra-
diation. The PAR was divided in three wavelength bands and
used as radiation source for top wall. Radiation energy as-
sociated with each wavelength band was referred from [18].
Results and discussion
Validation of CFD simulation results
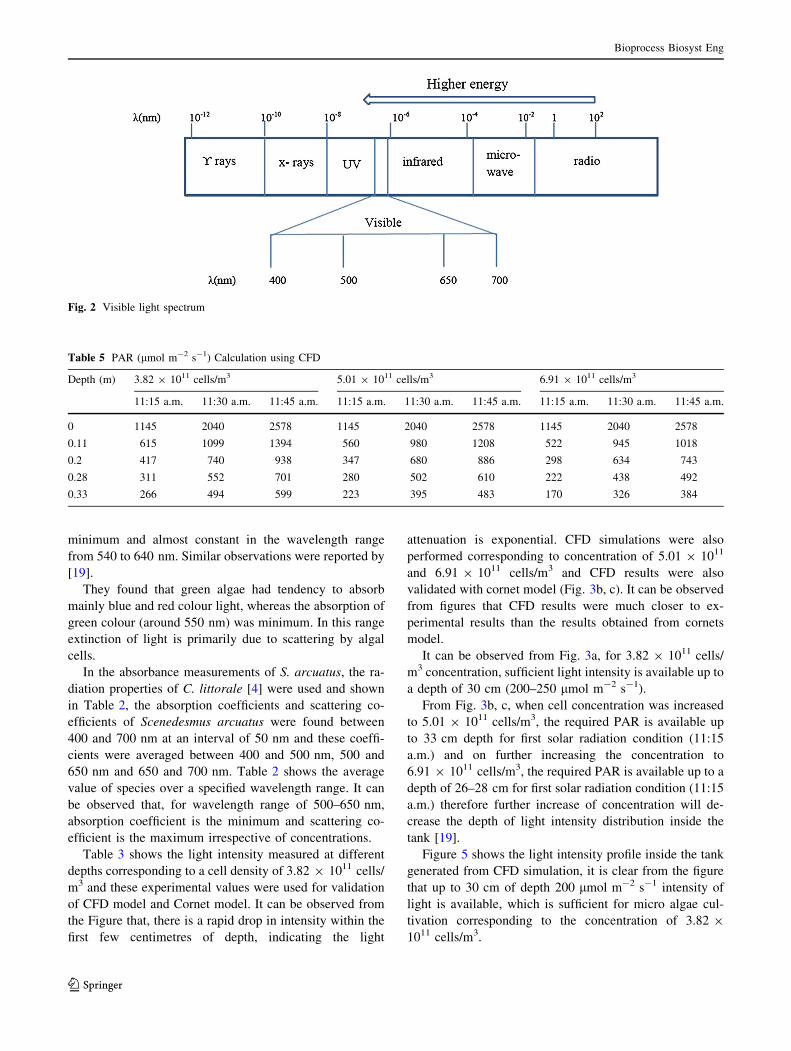
Table 5 shows the light intensity profile obtained from
CFD simulation. CFD results was compared with Cornet’s
model and Experimental method to check the validity of
CFD results.
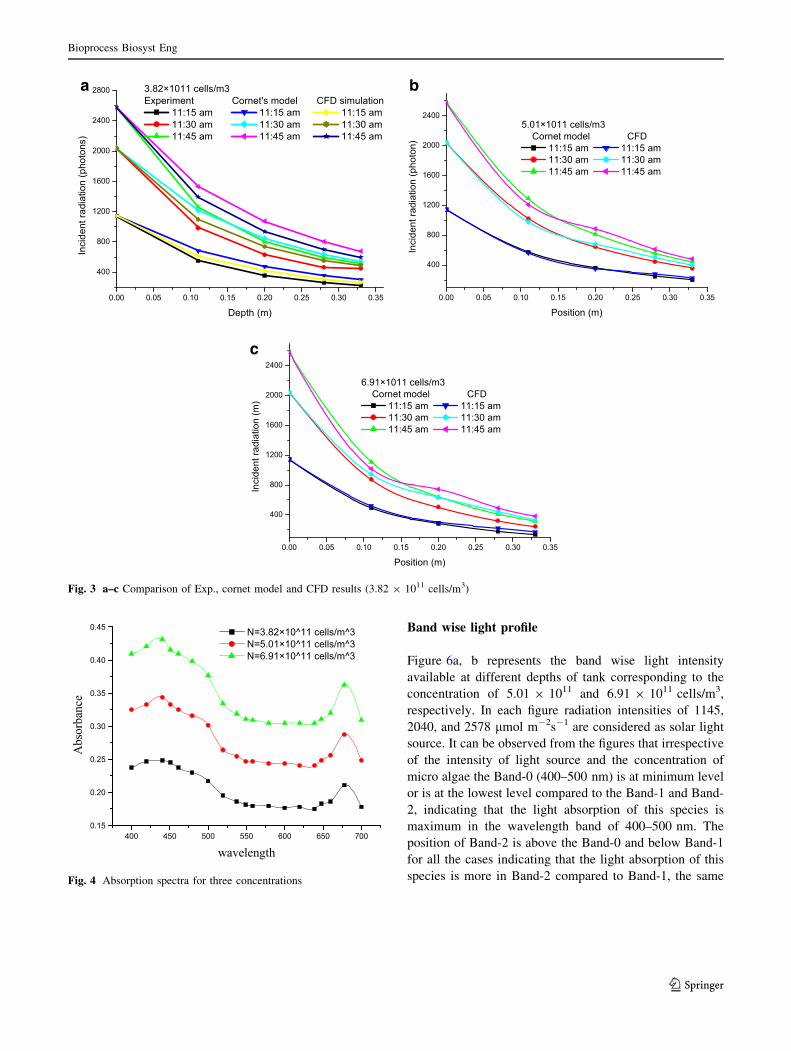
It has been found that there is a good agreement be-
tween light intensity profile obtained from CFD and that
of calculated by Cornet’s model with maximum error of
14.2 % and average deviation of 5 %. Whereas max-
imum deviation of 15.3 % with an average deviation of
4 % between CFD and experimentally measured PAR
was observed. From Fig. 3 the results obtained from
CFD are lying in between the experimental results and
the results obtained from cornet model, hence it indi-
cates that the deviation between the CFD results and
experimental results is less as compared to that of results
obtained from CFD and cornet model. The result pre-
dicted by CFD is much closer then results predicted by
cornet model.
Radiation characteristics of Scenedesmus arcuatus
Figure 4 shows the absorption spectra of S. arcuatus
measured at three different concentrations. It is clear from
the absorption spectra that absorbance peaks at 440 and
680 nm. It can also be observed that the absorbance is
Table 4 PAR (lmol m-2 s-1) calculation using cornet’s model
Depth (m) 3.82 9 1011 cells/m3 5.01 9 1011 cells/m3 6.91 9 1011 cells/m3
11:15 a.m. 11:30 a.m. 11:45 a.m. 11:15 a.m. 11:30 a.m. 11:45 a.m. 11:15 a.m. 11:30 a.m. 11:45 a.m.
0 1145 2040 2578 1145 2040 2578 1145 2040 2578
0.11 681 1213 1532 573 1021 1291 492 877 1109
0.2 477 850 1074 362 645 815 283 505 638
0.28 357 637 805 249 444 561 180 321 406
0.33 301 536 678 200 356 449 138 246 310
Bioprocess Biosyst Eng
123
minimum and almost constant in the wavelength range
from 540 to 640 nm. Similar observations were reported by
[19].
They found that green algae had tendency to absorb
mainly blue and red colour light, whereas the absorption of
green colour (around 550 nm) was minimum. In this range
extinction of light is primarily due to scattering by algal
cells.
In the absorbance measurements of S. arcuatus, the ra-
diation properties of C. littorale [4] were used and shown
in Table 2, the absorption coefficients and scattering co-
efficients of Scenedesmus arcuatus were found between
400 and 700 nm at an interval of 50 nm and these coeffi-
cients were averaged between 400 and 500 nm, 500 and
650 nm and 650 and 700 nm. Table 2 shows the average
value of species over a specified wavelength range. It can
be observed that, for wavelength range of 500–650 nm,
absorption coefficient is the minimum and scattering co-
efficient is the maximum irrespective of concentrations.
Table 3 shows the light intensity measured at different
depths corresponding to a cell density of 3.82 9 1011 cells/
m3 and these experimental values were used for validation
of CFD model and Cornet model. It can be observed from
the Figure that, there is a rapid drop in intensity within the
first few centimetres of depth, indicating the light
attenuation is exponential. CFD simulations were also
performed corresponding to concentration of 5.01 9 1011
and 6.91 9 1011 cells/m3 and CFD results were also
validated with cornet model (Fig. 3b, c). It can be observed
from figures that CFD results were much closer to ex-
perimental results than the results obtained from cornets
model.
It can be observed from Fig. 3a, for 3.82 9 1011 cells/
m3 concentration, sufficient light intensity is available up to
a depth of 30 cm (200–250 lmol m-2 s-1).
From Fig. 3b, c, when cell concentration was increased
to 5.01 9 1011 cells/m3, the required PAR is available up
to 33 cm depth for first solar radiation condition (11:15
a.m.) and on further increasing the concentration to
6.91 9 1011 cells/m3, the required PAR is available up to a
depth of 26–28 cm for first solar radiation condition (11:15
a.m.) therefore further increase of concentration will de-
crease the depth of light intensity distribution inside the
tank [19].
Figure 5 shows the light intensity profile inside the tank
generated from CFD simulation, it is clear from the figure
that up to 30 cm of depth 200 lmol m-2 s-1 intensity of
light is available, which is sufficient for micro algae cul-
tivation corresponding to the concentration of 3.82 9
1011 cells/m3.
Fig. 2 Visible light spectrum
Table 5 PAR (lmol m-2 s-1) Calculation using CFD
Depth (m) 3.82 9 1011 cells/m3 5.01 9 1011 cells/m3 6.91 9 1011 cells/m3
11:15 a.m. 11:30 a.m. 11:45 a.m. 11:15 a.m. 11:30 a.m. 11:45 a.m. 11:15 a.m. 11:30 a.m. 11:45 a.m.
0 1145 2040 2578 1145 2040 2578 1145 2040 2578
0.11 615 1099 1394 560 980 1208 522 945 1018
0.2 417 740 938 347 680 886 298 634 743
0.28 311 552 701 280 502 610 222 438 492
0.33 266 494 599 223 395 483 170 326 384
Bioprocess Biosyst Eng
123
Band wise light profile
Figure 6a, b represents the band wise light intensity
available at different depths of tank corresponding to the
concentration of 5.01 9 1011 and 6.91 9 1011 cells/m3,
respectively. In each figure radiation intensities of 1145,
2040, and 2578 lmol m-2s-1 are considered as solar light
source. It can be observed from the figures that irrespective
of the intensity of light source and the concentration of
micro algae the Band-0 (400–500 nm) is at minimum level
or is at the lowest level compared to the Band-1 and Band-
2, indicating that the light absorption of this species is
maximum in the wavelength band of 400–500 nm. The
position of Band-2 is above the Band-0 and below Band-1
for all the cases indicating that the light absorption of this
species is more in Band-2 compared to Band-1, the same
0.00 0.05 0.10 0.15 0.20 0.25 0.30 0.35
400
800
1200
1600
2000
2400
2800In
cide
nt ra
diat
ion
(pho
tons
)
Depth (m)
a b
c
3.82×10¹¹ cells/m3 Experiment Cornet's model CFD simulation
11:15 am 11:15 am 11:15 am 11:30 am 11:30 am 11:30 am 11:45 am 11:45 am 11:45 am
0.00 0.05 0.10 0.15 0.20 0.25 0.30 0.35
400
800
1200
1600
2000
2400
Inci
dent
radi
atio
n (p
hoto
n)
Position (m)
5.01×10¹¹ cells/m3 Cornet model CFD
11:15 am 11:15 am 11:30 am 11:30 am 11:45 am 11:45 am
0.00 0.05 0.10 0.15 0.20 0.25 0.30 0.35
400
800
1200
1600
2000
2400
Inci
dent
radi
atio
n (m
)
Position (m)
6.91×10¹¹ cells/m3 Cornet model CFD
11:15 am 11:15 am 11:30 am 11:30 am 11:45 am 11:45 am
Fig. 3 a–c Comparison of Exp., cornet model and CFD results (3.82 9 1011 cells/m3)
400 450 500 550 600 650 7000.15
0.20
0.25
0.30
0.35
0.40
0.45
Abs
orba
nce
wavelength
N=3.82×10^11 cells/m^3 N=5.01×10^11 cells/m^3 N=6.91×10^11 cells/m^3
Fig. 4 Absorption spectra for three concentrations
Bioprocess Biosyst Eng
123

results have been obtained as a second peek in experiment
as shown in Fig. 4. Hence, the CFD results are validated
through experimental data. All the simulation results
indicate that the maximum light attenuation happens in
within 10 cm of the depth of the reactor irrespective of the
intensity of available light source, and concentration of the
species.
Light profile for different dimensions of tank
To analyse the effect of large volumes on light profile, the
following dimensions of tank were considered
(length 9 breadth 9 depth) m3
Geom 1 Geom 2 Geom 3
L 9 B 9 D 1 9 1 9 0.5 2 9 2 9 0.5 1 9 1 9 1
It could be referred from the profile that irrespective of
the depth or the other dimensions the light intensity profiles
remain the same, hence intensity profile is the function of
concentration of the species, source intensity and the
wavelength band (Figs. 6a, b, 7).
Wall effects
Wall reflection is stated as one of the major factors to
enhance uniform light intensity profile inside tank. CFD
simulations were performed to find out the effect of walls
Fig. 5 Light intensity for 3.82 9 1011 cells/m3 at 1144 lE m-2 s-1
0 m 0.11 m 0.20 m 0.28 m 0.33 m0
400
800
1200
1600
2000
2400
2800
Rad
iatio
n (p
hoto
ns)
Depth (m)
a b5.01×1011 cells/m3
band-0 at 11:15 am band-1 at 11:15 am band-2 at 11:15 am band-0 at 11:30 am band-1 at 11:30 am band-2 at 11:30 am band-0 at 11:45 am band-1 at 11:45 am band-2 at 11:45 am
0 m 0.11 m 0.20 m 0.28 m 0.33 m
0
400
800
1200
1600
2000
2400
2800
Rad
iatio
n (p
hoto
ns)
Depth (m)
6.91×10¹¹ cells/m3 band-0 at 11:15 am band-1 at 11:15 am band-2 at 11:15 am band-0 at 11:30 am band-1 at 11:30 am band-2 at 11:30 am band-0 at 11:45 am band-1 at 11:45 am band-2 at 11:45 am
Fig. 6 a, b Band wise profile at different solar Intensities and different algal concentration
0.0 0.1 0.2 0.3 0.4 0.5
200
400
600
800
1000
1200
1400
Inci
dent
radi
atio
n (p
hoto
n)
Position
Geometry 1 Geometry 2 Geometry 3
Fig. 7 Light profile corresponding for three different dimensions of
the tank
Bioprocess Biosyst Eng
123

0.00 0.05 0.10 0.15 0.20 0.25 0.30 0.350
200
a b
c d
e f
400
600
800
1000
1200
1400
1600
inci
dent
radi
atio
n (p
hoto
ns)
position (m)
maximum extinction coefficient 10.62-1
ref=0.1 ref=0.7 ref=0.3 ref=0.9 ref=0.5 ref=1
0.00 0.05 0.10 0.15 0.20 0.25 0.30 0.35
0
200
400
600
800
1000
inci
dent
radi
atio
n (p
hoto
ns)
position (m)
maximum extinction coefficient 44.86-1
ref=0.1 ref=0.5 ref=0.9 ref=1
0.00 0.05 0.10 0.15 0.20 0.25 0.30 0.35
200
400
600
800
1000
1200
1400
1600
inci
dent
radi
atio
n (p
hoto
ns)
position (m)
maximum extinctioncoefficient 10.62-1
Fd=0 Fd=0.7 Fd=0.3 Fd=0.9 Fd=0.5 Fd=1
0.00 0.05 0.10 0.15 0.20 0.25 0.30 0.350
200
400
600
800
1000
inci
dent
radi
atio
n (p
hoto
ns)
position (m)
maximum extinction coefficient 44.86-1
Fd=0.1 Fd=0.5 Fd=0.9 Fd=1
0.00 0.05 0.10 0.15 0.20 0.25 0.30 0.350
400
800
1200
1600
2000
2400
inci
dent
radi
atio
n (p
hoto
ns)
Position (m)
maximum extinction coefficient 10.62-1
top Fd=0 top Fd=0.1 top Fd=0.3 top Fd=0.5 top Fd=0.7 top Fd=0.9 top Fd=1
0.00 0.05 0.10 0.15 0.20 0.25 0.30 0.350
200
400
600
800
1000
1200
1400
1600
1800
2000
2200
inci
dent
radi
atio
n (p
hoto
ns)
position (m)
maximum Extinction coefficient 44.86-1
top Fd=0 top Fd=0.1 top Fd=0.5 top Fd=0.9 top Fd=1
Fig. 8 a, b Effect of wall reflectivity. c, d Effect of diffuse fraction of side and bottom walls on light distribution. e, f Effect of diffuse fraction of
top wall on light distribution. g, h Effect of scattering phase function on light intensity profile
Bioprocess Biosyst Eng
123

on the light intensity profile inside the tank. Input pa-
rameters such as reflectivity, diffuse fraction and scattering
phase function were considered, and for the simulation, the
values are varied from zero to one.
Effect of reflectivity of side and bottom walls on light
profile
In order to determine the effect of reflectivity of side and
bottom walls (opaque) on light distribution, CFD simula-
tions were carried out for range of wall reflectivity ranging
from zero to one. S. arcuatus suspensions having extinction
coefficient 10.62 m-1 (optically thin medium) and
44.86 m-1 (optically thick medium) are considered. The
extinction coefficients are calculated using Eq. 3 and ex-
trapolating the data given in Table 2. The cell concentra-
tions corresponding to optically thin and optically thick
medium are 4.2 9 1011 and 18.75 9 1011 cells/m3 re-
spectively. It could be inferred from Fig. 8a, b that the
bottom and side wall reflectivity has an impact on light for
optically thin medium and for optically thick medium the
effect of reflectivity is much less.
Effect of diffuse fraction of side and bottom walls on light
profile
Figure 8c, d shows the XY plots of light intensity profile
from top to bottom along centre line for various diffuse
fractions of side and bottom walls for S. arcuatus suspen-
sions using optically thin and optically thick media, re-
spectively. It means that diffuse fraction equal to zero
represents opaque walls and diffuse fraction 1 represents
transparent walls. From the figure, it could be inferred that
the diffuse fraction has no impact on light profile for
optically thick medium, which indicates that light is com-
pletely absorbed by the cells and is not available at the
walls for the diffusion, it could also be seen from the graph
at a depth corresponding to 0.15 m the light availability is
450 and 180 lmol m-2s-1 (fd = 1).
Thus, for optically thin medium, specularly reflecting
opaque walls should be used in order to have better light
intensity distribution.
Effect of diffuse fraction of top wall on light profile
For optically thin medium a material having diffuse frac-
tion 0.7 is acceptable and for optically thick medium ma-
terial having 0.5 is acceptable and material with lower fd
helps to control the high light intensities available and
admitting only the required light into the tank, which will
be helpful to reduce the photo inhibition effect.
Effect of scattering phase function on light distribution
To investigate the effect of scattering phase function on
light intensity distribution, CFD simulations were per-
formed for Delta-Eddington phase functions with various
forward scattering factors and with zero scattering coeffi-
cient. These simulations are performed for S. arcuatus
suspensions in open tank. XY plot of these simulations is
shown in Fig. 8g, h.
It can be observed that, for Delta-Eddington phase
function, with the increase in the value of forward scat-
tering factor, radiation inside the tank tends to be more
homogeneous and for a forward scattering factor of 1, in-
tensity is equal to the light intensity with zero scattering,
i.e. intensity behaves as if there is no scattering at all.
g h
0.00 0.05 0.10 0.15 0.20 0.25 0.30 0.350
200
400
600
800
1000
1200
inci
dent
radi
atio
n (p
hoto
ns)
position (m)
scattering f=0 f=0.7 f=0.8 f=0.9 f=1
0.00 0.05 0.10 0.15 0.20 0.25 0.30 0.35
200
400
600
800
1000
inci
dent
radi
atio
n (p
hoto
ns)
position (m)
forward scattering factor=1 scattering=0
Fig. 8 continued
Bioprocess Biosyst Eng
123

Conclusion
Light profile inside the tank is effected by the type of
species, its concentration and source light intensity. CFD is
a powerful tool to investigate the effect of such parameters
on light profile inside the tank and it is found that the
required amount of light for photosynthesis is available up
to a depth of 30–35 cm inside the tank corresponding to the
conditions studied. The absorbance of Scenedesmus sp. is
maximum in the wavelength range of 400–500 nm. For
optically less dense medium, reflectivity and diffusivity of
opaque wall, greatly affect the light intensity distribution
and for such cases specularly reflecting wall should be
used. And for optically thick media, effect of wall reflec-
tivity and wall diffusivity is negligible. Diffusivity of semi-
transparent walls should be selected based on the local
available light intensities to allow only required light in-
tensity inside i.e. higher the available light intensity, lower
should be the transmissivity of the transparent wall to avoid
photo-inhibition effect. Otherwise, use of innovative mix-
ing mechanism could also be helpful to avoid such effects.
Acknowledgments We greatly acknowledge Department of Sci-
ence and Technology (DST), Government of India, New Delhi for
funding this project (DST/IS-STAC/CO2-SR-12/07).
References
1. Pulz O, Scheibenbogen K (1998) Photo-bioreactors: design and
performance with respect to light energy input, Advance. Bio
Chem Eng Biotechnol 59:123–152
2. Katsuda T et al (2000) Light intensity distribution in the exter-
nally illuminated cylindrical photo-bioreactor and its application
to hydrogen production by Rhodobacter capsulatus. Biochem Eng
5:157–164
3. Richmond A (2004) Principles for attaining maximal microalgal
productivity in photo-bioreactors: an overview. Hydrobiologia
512(1–3):33–37
4. Berberoglu H, Gomez P, Pilon L (2009) Radiation characteristics
of Botryococcus braunii, Chlorococcum littorale, and Chlorella
sp. used for CO2 fixation and biofuel production. J Quant Spec-
trosc Radiat Transfer 110:1879–1893
5. Berberoglu H, Pilon L (2007) Experimental measurements of the
radiation characteristics of Anabaena variabilis ATCC 29413-
U and Rhodobacter sphaeroides ATCC 49419. Int J Hydrogen
Energy 32:4772–4785
6. Privoznik KG, Daniel KJ, Incropera FP (1978) Absorption, ex-
tinction and phase function measurements for algal suspensions
of Chlorella pyrenoidosa. J Quant Spectrosc Radiat Transf
20:345–352
7. Houf G, Incropera FP (1980) An assessment of techniques for
predicting radiation transfer in aqueous media-I. J Quant Spec-
trosc Radiat Transf 23:101
8. Cornet JF, Dussap CG, Gros JB, Binois C, Lasseur C (1995) A
simplified monodimensional approach for modeling coupling
between radiant light transfer and growth kinetics in photo-
bioreactors. Chem Eng Sci 50:1489–1500
9. Cornet JF, Dussap CG, Dubertret G (1992) A structured model
for simulation of cultures of the cyanobacterium Spirulina
platensis in photo-bioreactors, I. Coupling between light transfer
and growth kinetics. Biotechnol Bioeng 40:817–825
10. Cornet JF, Dussap CG, Cluzel P, Dubertret G (1992) A structured
model for simulation of cultures of the cyanobacterium Spirulina
platensis in photo-bioreactors, II. Identification of kinetic pa-
rameters under light and mineral limitations. Biotech Bioeng
40:826–834
11. Acien Fernandez FG, Garcıa Camacho F, Sanchez Perez JA,
Fernandez Sevilla JM, Molina Grima E (1997) A model for light
distribution and average solar irradiance inside outdoor tubular
photo-bioreactors for the microalgal mass culture. Biotechnol
Bioeng 55:701
12. Bitog JP et al (2011) Application of computational fluid dynamics
for modelling and designing photo-bioreactors for microalgae
production: a review. Comput Electron Agric 76:131–147
13. Pareek V, Cox S, Adesina AA (2003) Light intensity distribution
in photo-catalytic reactors using a finite volume method, Third
international conference on CFD in the minerals and process
industries. CSIRO, Melbourne, pp 10–12
14. Pareek V, Cox SJ, Brungs MP, Young B, Adesina AA (2003)
Computational fluid dynamic (CFD) simulation of a pilot-scale
annular bubble column photo-catalytic reactor. Chem Eng Sci
58:859–865
15. Pareek V (2005) Light intensity distribution in a dual-lamp photo-
reactor. Int J Chem Reactor Eng 3 (article A56)
16. Duran JE, Taghipour F, Mohseni M (2010) Irradiance modelling
in annular photo-reactors using the finite volume method. J Pho-
tochem Photobiol A 215:81–89
17. Vasumathi KK, Premalatha M, Subramanian P (2013) Ex-
perimental studies on the effect of harvesting interval on yield of
Scenedesmus arcuatus var. capitatus. Ecol Eng 58:13–16
18. Sukhatme SP (1996) Solar energy: principles of thermal collec-
tion and storage, 2nd edn. Tata Macgraw Hill, New Delhi
19. Yun YS, Park JM (2001) Attenuation of monochromatic and
polychromatic lights in Chlorella vulgaris suspensions. Appl
Microbiol Biotechnol 55:765–770
20. Huang Q, Liu T, Yang J, Yao L, Gao L (2011) Evaluation of
Radiative transfer using finite volume method in cylindrical
photoreactors. Chem Eng Sci 66(2011):3930–3940
21. Lee E, Pruvost J, He X, Munipalli R, Pilon L (2014) Design Tool
and Guidelines for Outdoor Photo-bioreactors. Chem Eng Sci
106:18–29
22. ANSYS FLUENT 14.5, Theory Guide
Bioprocess Biosyst Eng
123