Southeastern Louisiana evacuation/non-evacuation for Hurricane Katrina

Ensemble Data Assimilation Applied to RAINEX Observations ofHurricane Katrina (2005)
RYAN D. TORN AND GREGORY J. HAKIM
University of Washington, Seattle, Washington
(Manuscript received 20 May 2008, in final form 2 February 2009)
ABSTRACT
An ensemble Kalman filter (EnKF) based on the Weather Research and Forecasting model is applied to
generate ensemble analyses and forecasts of Hurricane Katrina (2005) and the surrounding area every 6 h
over the lifetime of the storm on a nested domain. Analyses are derived from assimilating conventional in situ
observations, reconnaissance dropsondes, including data taken during the Hurricane Rainband and Intensity
Exchange Experiment (RAINEX), and tropical cyclone position estimates. Observation assimilation at in-
dividual times consistently reduces errors in tropical cyclone position, but not necessarily in intensity;
however, withholding observations leads to significantly larger errors in both quantities. Analysis increments
for observations near the tropical cyclone are dominated by changes in vortex position, and these increments
increase the asymmetric structure of the storm. Data denial experiments indicate that dropsondes deployed
in the synoptic environment provide minimal benefit to the outer domain; however, dropsondes deployed
within the tropical cyclone lead to significant reductions in position and intensity errors on the inner domain.
Specifically, errors in the inner domain ensemble-mean 6-h forecasts of minimum pressure are 70% larger
when dropsonde data is not assimilated. Precipitation fields are qualitatively similar to Tropical Rainfall
Measuring Mission (TRMM) satellite estimates, although model values are double the values of the satellite
estimate. Moreover, the spinup period and initial imbalance in EnKF-initialized WRF forecasts is less than
starting the model from a GFS analysis. Ensemble-mean 48-h forecasts initialized with EnKF analyses have
track and intensity errors that are 50% smaller than GFS and NHC official forecasts.
1. Introduction
One method of improving numerical weather pre-
diction (NWP) model forecasts of tropical cyclones
(TCs) is to produce better initial conditions by com-
bining observations with a model forecast via data as-
similation. Most operational data assimilation systems
employ quasi-fixed error statistics to spread observation
information to model grid points, which are often not
appropriate for the TC environment. Given this diffi-
culty, several different techniques have emerged where
either a ‘‘bogused’’ vortex is inserted into the analysis
(e.g., Kurihara et al. 1995), or the TC is repositioned to
the best-track location during data assimilation (e.g.,
Liu et al. 2000). These procedures have been tuned to
work well for synoptic-scale TC forecasts, but are not
adequate for creating meso- and convective-scale ana-
lyses and forecasts of the storm, particularly for short
lead times. The lack of appropriate initial conditions for
storm-scale models may contribute to the lack of im-
provement in TC intensity forecasts during the past 15 yr
(Rogers et al. 2006).
The ensemble Kalman filter (EnKF) is an attractive
approach for TC state estimation because this technique
assimilates observations using flow-dependent error
statistics, which capture the strong spatial variability
near TCs. These flow-dependent error statistics, which
control the weight given to observations relative to a
short-term forecast and how observational information
affects model variables near the TC, should allow for
corrections to the TC structure and position without the
need for the special techniques described above. Several
studies (e.g., Houtekamer et al. 2005; Whitaker et al.
2008; Szunyogh et al. 2008; Torn and Hakim 2008) have
shown that assimilating real observations with an EnKF
Corresponding author address: Ryan Torn, University at
Albany, State University of New York, DEAS-ES 351, 1400
Washington Ave., Albany, NY 12222.
E-mail: [email protected]
SEPTEMBER 2009 T O R N A N D H A K I M 2817
DOI: 10.1175/2009MWR2656.1
� 2009 American Meteorological Society

leads to forecasts that are competitive with operational
data assimilation systems that incorporate significantly
more data, while Zhang et al. (2009) obtained a superior
forecast of Hurricane Humberto (2007) by assimilating
coastal radar observations with an EnKF. Since the
EnKF produces an ensemble of equally likely analyses,
TC ensemble forecasting is straightforward, and does
not require perturbing deterministic analyses. The in-
terested reader is directed to Evensen (2003) and
Hamill (2006) for reviews of the EnKF.
Here we test an EnKF for TC forecasting by imple-
menting such a system to generate analyses and forecasts
over the life of Hurricane Katrina (2005). Observations
taken during the Hurricane Rainband and Intensity
Change Experiment (RAINEX; Houze et al. 2006) pro-
vide an opportunity to test the performance of an EnKF
for TC forecasting with an unusually rich set of obser-
vations. Ensemble analyses and forecasts are generated
on a coarse-resolution outer domain, and on a nested,
higher-resolution inner domain.
We begin with an overview of the model setup and
data assimilation system in section 2. Results for the
coarse outer domain are presented in section 3, and the
nested inner domain results are shown in section 4. A
summary and concluding discussion is given in section 5.
2. Experiment setup
Gridded analyses of Hurricane Katrina and the sur-
rounding locations are generated every 6 h by cycling
an EnKF from 0000 UTC 22 August 2005 (42 h prior
to designation as a tropical depression) to 0000 UTC
30 August 2005 (6 h after landfall). The analysis en-
semble is advanced in time using version 2.1.2 of the
Advanced Research Weather Research and Forecasting
(ARW-WRF) model (Skamarock et al. 2005) on a
nested domain. The outer domain has 30-km horizontal
grid spacing and covers the eastern United States and
the northern Caribbean Sea (Fig. 1). The inner domain
has 10-km horizontal grid spacing and covers the Gulf
of Mexico and Florida during 1200 UTC 26 August–
0000 UTC 29 August (Fig. 1). Both domains have
38 vertical levels, and use the following components: WRF
three-class microphysics scheme (Hong et al. 2004),
Kain–Fritsch cumulus parameterization scheme (Kain
and Fritsch 1990), Yonsei University (YSU) boundary
layer scheme (Hong et al. 2006), and the Noah land
surface model (Ek et al. 2003).
An ensemble of lateral boundary conditions for the
outer domain is obtained using the fixed-covariance
perturbation (FCP) technique of Torn et al. (2006).
Ensemble lateral boundary conditions are derived by
drawing random perturbations from the WRF VAR
system (Barker et al. 2004), which are scaled by 1.7, and
subject to a temporal autocorrelation coefficient of 0.4;
these values are taken from Torn and Hakim (2008). The
perturbations on the lateral boundaries of the outer do-
main are added to 6-h forecasts of the National Centers
for Environmental Prediction (NCEP) Global Fore-
casting System (GFS). For each inner domain ensemble
member, one-way lateral boundary conditions are pre-
scribed by interpolating the corresponding background
(prior) forecast from the outer domain onto the bound-
ary points of the inner domain. In addition to cycling the
data assimilation system, 48-h ensemble forecasts on the
outer domain are generated every 12 h from 0000 UTC
25 August to 0000 UTC 27 August by advancing all 90
members with FCP ensemble boundary conditions; the
ensemble mean on the lateral boundaries is set to the
GFS forecast initialized at the same time.
Observations are assimilated from Automated Surface
Observing System (ASOS) stations, ships, buoys, rawin-
sondes, the Aircraft Communications Addressing and
Reporting System (ACARS), and cloud motion vectors
(Velden et al. 2005) every 6 h using a square root version
of the EnKF (Whitaker and Hamill 2002) for a 90-
member ensemble. In general, Katrina moves through an
area of relatively low observation density, except when
traversing Florida (Fig. 1). Previous studies have shown
that O(100) ensemble members are needed to accurately
resolve error covariances, while additional members pro-
vide minimal improvement (e.g., Whitaker et al. 2004;
Dirren et al. 2007). The National Hurricane Center
(NHC) TC advisory position (technically the latitude and
longitude of lowest sea level pressure) is assimilated every
3 h similar to the method described in Chen and Snyder
(2007). The TC latitude (longitude) is compared to the
latitude (longitude) of the minimum SLP in each en-
semble member’s forecast, and all model state variables
are adjusted by this innovation; the NHC position esti-
mates are assumed to have an error standard deviation
of 10 km. Observation errors for all other observations
are taken from European Centre for Medium-Range
Weather Forecasts (ECMWF) statistics, and we assume
that dropsonde errors are characterized by radiosondes.
These experiments also assimilate targeted drop-
sondes deployed by the National Oceanic and Atmo-
spheric Administration (NOAA) Hurricane Research
Division (HRD; e.g., Aberson 2002) and the RAINEX
field campaign. Since raw dropsonde data often contains
high-frequency temporal noise that can be problematic
for data assimilation, we assimilate postprocessed data
from HRD (e.g., Franklin et al. 1996) for observations
deployed within 1 h of an analysis time. Dropsonde drift
is accounted for by assimilating the sonde data at the
horizontal Global Positioning System (GPS) position of
2818 M O N T H L Y W E A T H E R R E V I E W VOLUME 137

each vertical level. Coordinated dropsondes deployed
by the NOAA P3 and the Naval Research Laboratory
(NRL) P3 sampled the structure of the TC, and the
NOAA G-IV took observations of the synoptic envi-
ronment surrounding the storm. The outer domain does
not have sufficient horizontal resolution to accurately
simulate mesoscale TC structure, which is problematic
when observations resolve such features. For example,
Aberson (2008) showed that assimilating eye and eye-
wall dropsonde data at coarse resolution can result in
degraded track and intensity forecasts. Therefore ob-
servations from the NOAA P3 and NRL P3 are not
assimilated on the outer domain. For similar reasons,
TC minimum SLP data is not assimilated in these
experiments.
Small ensembles have a tendency to produce spurious
long-distance covariances and to underestimate co-
variance magnitude, which we address with the follow-
ing conventional techniques. Analysis increments are
localized on both domains using Eq. (4.10) of Gaspari
and Cohn (1999) such that the increments reduce to
zero 2500 km from the observation location; vertical
localization is not employed. This distance is longer than
the value used on a midlatitude domain by Torn and
Hakim (2008) in approximate proportion to the increase
in Rossby radius. For the outer domain, analysis devi-
ations from the ensemble mean are given by averaging
the prior and posterior deviations from the mean with a
0.75 and 0.25 weighting, respectively (Zhang et al. 2004).
These weighting factors are determined empirically by
performing experiments in which these weights are ad-
justed until the mean-squared error in ensemble-mean
6-h forecasts (computed with respect to rawinsondes)
matches the innovation variance; for an optimal en-
semble system, these two values should be equal
(Houtekamer et al. 2005). Covariance inflation is not
applied to the inner domain because it magnifies
asymmetries due to TC position during assimilation; this
issue will be discussed further in section 4. Torn and
Hakim (2008) describe in more detail how the covari-
ance localization radius and weighting factors are de-
termined for similar EnKF studies.
EnKF experiments with global models are often ini-
tialized with random climatological states (e.g., Whitaker
et al. 2004; Anderson et al. 2005), but this approach
is problematic on limited-area domains because of the
mismatch of the domain interior with lateral bound-
ary conditions based on 6-h forecasts. Here, we follow
the approach of Dirren et al. (2007) and initialize the
outer domain ensemble on 0000 UTC 22 August by
adding random, scaled, fixed-covariance perturbations
from the WRF VAR system (Barker et al. 2004) to the
FIG. 1. Number of observation reports assimilated by the WRF EnKF within 60 km of each
grid point from 0000 UTC 22 Aug 2005 to 0000 UTC 30 Aug 2005 (shading). The dashed line
encloses the inner computational domain and the thick solid line is Katrina’s track.
SEPTEMBER 2009 T O R N A N D H A K I M 2819

GFS 36-h forecast initialized on 1200 UTC 20 August.
The scaling factor for the perturbations (i.e., 1.9) is
determined by matching the RMS error in this 36-h
forecast to the standard deviation of the WRF VAR
perturbations. By the time Katrina is declared a tropical
depression (at 1800 UTC 23 August), the 6-h forecast
errors with respect to observations come into equilibrium
with the ensemble variance, which indicates that the en-
semble has little memory of the initial ensemble (shown
below). The inner domain is initialized at 1200 UTC
26 August by pairing each inner domain ensemblemember
to an outer domain ensemble member and interpolating
the outer ensemble member onto the inner member’s
grid.
To summarize the tuning measures adopted here,
covariance averaging is used to increase ensemble
spread, and random perturbations are used to populate
ensemble lateral boundary conditions. Ensemble spread
near the storm is reduced by assimilating NHC advisory
position data, and dropsonde observations that resolve
mesoscale structure near the storm are only assimilated
on the nested domain.
3. Outer domain results
Prior to describing the performance of the WRF
EnKF forecasts of TC track and intensity, we present
verification statistics for two fields with respect to ra-
winsonde and ASOS observations within the domain.
For 6-h WRF EnKF forecasts, we also calculate the ob-
servation innovation standard deviation,1 which should
match the RMS error for a well-calibrated ensemble
(Houtekamer et al. 2005).
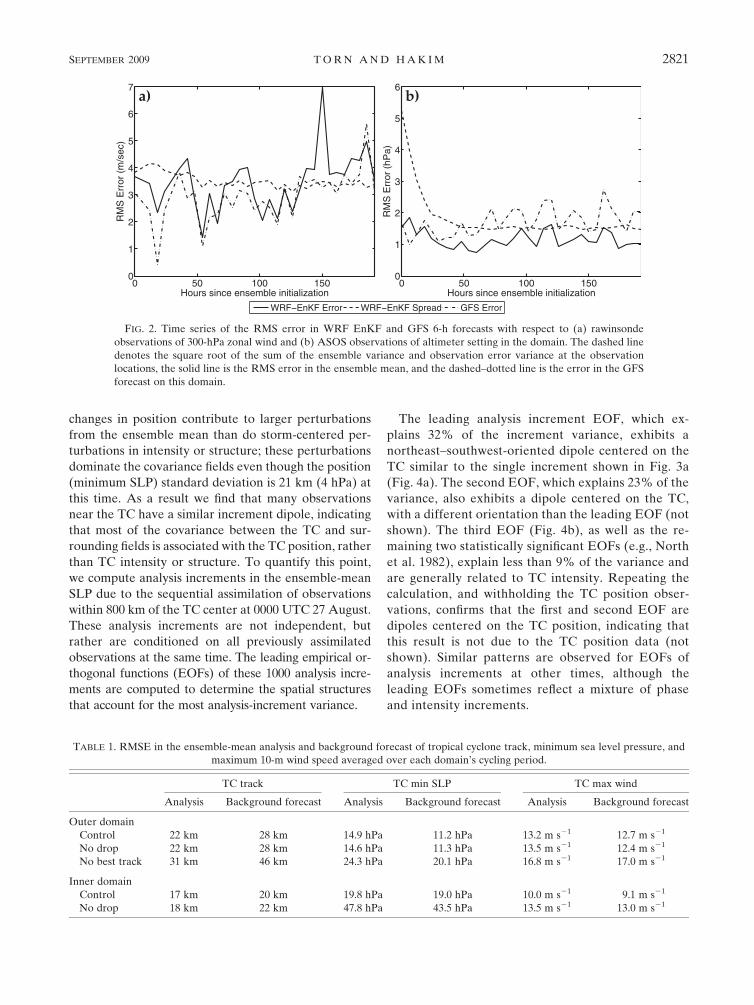
Figure 2 shows that after a 2-day ensemble spinup
period, the RMS error and spread in 6-h WRF EnKF
300-hPa zonal wind and altimeter setting forecasts come
into statistical equilibrium with the observations; other
fields show similar results. Over this period, the average
error in 300-hPa wind (altimeter) is 3.6 m s21 (1.19 hPa),
which is 0.4 m s21 larger (0.5 hPa lower) than the av-
erage error in 6-h GFS forecasts during the same period.
Whereas the ensemble spread is generally higher than
the RMS error for altimeter, the ensemble is well cali-
brated for the 300-hPa wind. The performance of this
filter configuration is similar to the real-time EnKF
system described by Torn and Hakim (2008).
Analyses and forecasts are also verified on the outer
domain using position and intensity estimates from
NHC tropical storm best-track data. Table 1 displays
the RMS difference between the NHC best-track posi-
tion and intensity for the ensemble-mean analysis and
background forecast (denoted ‘‘control’’). These quan-
tities are defined by the grid point of lowest sea level
pressure (SLP) in the region near the storm for each
ensemble member. On average, the RMS error in TC
track is lower for the ensemble-mean analysis than for
the background forecast, which indicates that observa-
tion assimilation systematically reduces position errors.
We note that although position data is assimilated, TC
position is not a state variable, thus verifying that the
analysis against best-track data provides a check that
the flow-dependent error statistics consistently correct
the ensemble during assimilation. The largest position
errors occur at 0000 UTC 24 August when Katrina is first
designated as a tropical depression; however, as the TC
intensifies and the circulation becomes better defined, the
analysis position errors are consistently less than the
horizontal grid spacing. Although these experiments
do not assimilate the best-track estimate of TC mini-
mum SLP or maximum surface wind, the RMS errors
in minimum SLP for the ensemble-mean analysis and
background forecast are less than 15 hPa (Table 1). Fur-
thermore, the error in maximum wind speed2 is 13 m s21,
which is roughly equivalent to the error in 36-h official
NHC forecasts of Katrina (Beven et al. 2008). For most
analysis times, the minimum SLP (maximum wind) on
the outer domain is higher (lower) than best-track esti-
mates, especially after Katrina undergoes rapid intensi-
fication on 28 August.
Table 1 reveals larger errors in the analyses of TC
intensity as compared to the background forecast, which
indicates that assimilating observations has an adverse
impact on TC intensity. To illustrate how a nearby
observation affects the TC, Fig. 3 shows the SLP and
500-hPa zonal wind increment due to the 500-hPa wind
observation taken by a nearby dropsonde at 0000 UTC
27 August 2005. Assimilating this observation leads to
an increase (decrease) in SLP to the west (east) of the
TC center, achieving a shift in the position of the storm
to the east. For 500-hPa wind, the largest impact is not at
the observation location; rather, this observation leads
to an increase (decrease) on the northwest and south-
east (northeast and southwest) side of the TC, which is
consistent with an eastward displacement of the TC. A
similar result based on assimilating vortex position was
found by Chen and Snyder (2007), and is attributable to
the large gradients associated with TC structure. Small
1 This quantity is defined by the square root of the diagonal
elements of HPbHT 1 R, where H is an operator that maps from
model-state variables to observations, Pb is the background error
covariance matrix, and R is the observation error variance matrix.
2 Maximum wind speed in the model is found by computing the
highest 10-m wind speed within 250 km of the TC center.
2820 M O N T H L Y W E A T H E R R E V I E W VOLUME 137
changes in position contribute to larger perturbations
from the ensemble mean than do storm-centered per-
turbations in intensity or structure; these perturbations
dominate the covariance fields even though the position
(minimum SLP) standard deviation is 21 km (4 hPa) at
this time. As a result we find that many observations
near the TC have a similar increment dipole, indicating
that most of the covariance between the TC and sur-
rounding fields is associated with the TC position, rather
than TC intensity or structure. To quantify this point,
we compute analysis increments in the ensemble-mean
SLP due to the sequential assimilation of observations
within 800 km of the TC center at 0000 UTC 27 August.
These analysis increments are not independent, but
rather are conditioned on all previously assimilated
observations at the same time. The leading empirical or-
thogonal functions (EOFs) of these 1000 analysis incre-
ments are computed to determine the spatial structures
that account for the most analysis-increment variance.
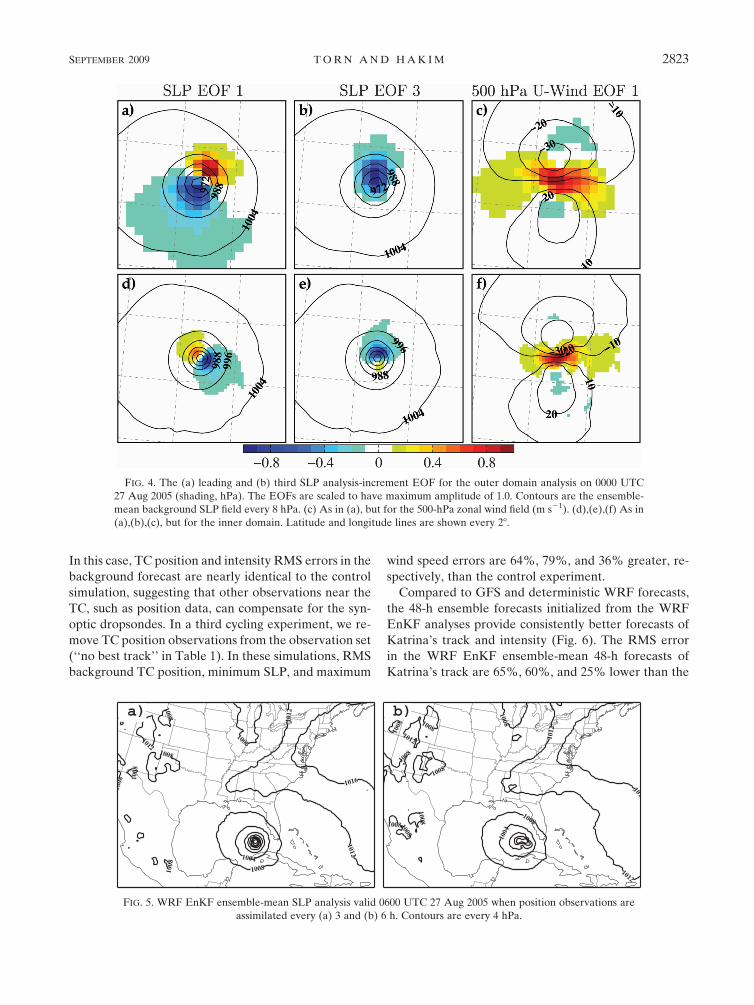
The leading analysis increment EOF, which ex-
plains 32% of the increment variance, exhibits a
northeast–southwest-oriented dipole centered on the
TC similar to the single increment shown in Fig. 3a
(Fig. 4a). The second EOF, which explains 23% of the
variance, also exhibits a dipole centered on the TC,
with a different orientation than the leading EOF (not
shown). The third EOF (Fig. 4b), as well as the re-
maining two statistically significant EOFs (e.g., North
et al. 1982), explain less than 9% of the variance and
are generally related to TC intensity. Repeating the
calculation, and withholding the TC position obser-
vations, confirms that the first and second EOF are
dipoles centered on the TC position, indicating that
this result is not due to the TC position data (not
shown). Similar patterns are observed for EOFs of
analysis increments at other times, although the
leading EOFs sometimes reflect a mixture of phase
and intensity increments.
TABLE 1. RMSE in the ensemble-mean analysis and background forecast of tropical cyclone track, minimum sea level pressure, and
maximum 10-m wind speed averaged over each domain’s cycling period.
TC track TC min SLP TC max wind
Analysis Background forecast Analysis Background forecast Analysis Background forecast
Outer domain
Control 22 km 28 km 14.9 hPa 11.2 hPa 13.2 m s21 12.7 m s21
No drop 22 km 28 km 14.6 hPa 11.3 hPa 13.5 m s21 12.4 m s21
No best track 31 km 46 km 24.3 hPa 20.1 hPa 16.8 m s21 17.0 m s21
Inner domain
Control 17 km 20 km 19.8 hPa 19.0 hPa 10.0 m s21 9.1 m s21
No drop 18 km 22 km 47.8 hPa 43.5 hPa 13.5 m s21 13.0 m s21
FIG. 2. Time series of the RMS error in WRF EnKF and GFS 6-h forecasts with respect to (a) rawinsonde
observations of 300-hPa zonal wind and (b) ASOS observations of altimeter setting in the domain. The dashed line
denotes the square root of the sum of the ensemble variance and observation error variance at the observation
locations, the solid line is the RMS error in the ensemble mean, and the dashed–dotted line is the error in the GFS
forecast on this domain.
SEPTEMBER 2009 T O R N A N D H A K I M 2821

The leading EOFs for other fields are also consistent
with a shift in TC position. For 500-hPa zonal winds
(Fig. 4c), the leading EOF (27% of variance) is a north–
south-oriented tripole pattern centered on the TC cen-
ter, with the largest magnitude within the gradient in the
zonal wind, and is associated with north–south shifts in
the TC position. Whereas the second EOF (14% of
variance) is a quadrupole pattern, which is consistent
with east–west translation in TC position, the third EOF
(8% of variance) is maximized at the wind magnitude
extremes, and is therefore associated with intensity
changes (not shown).
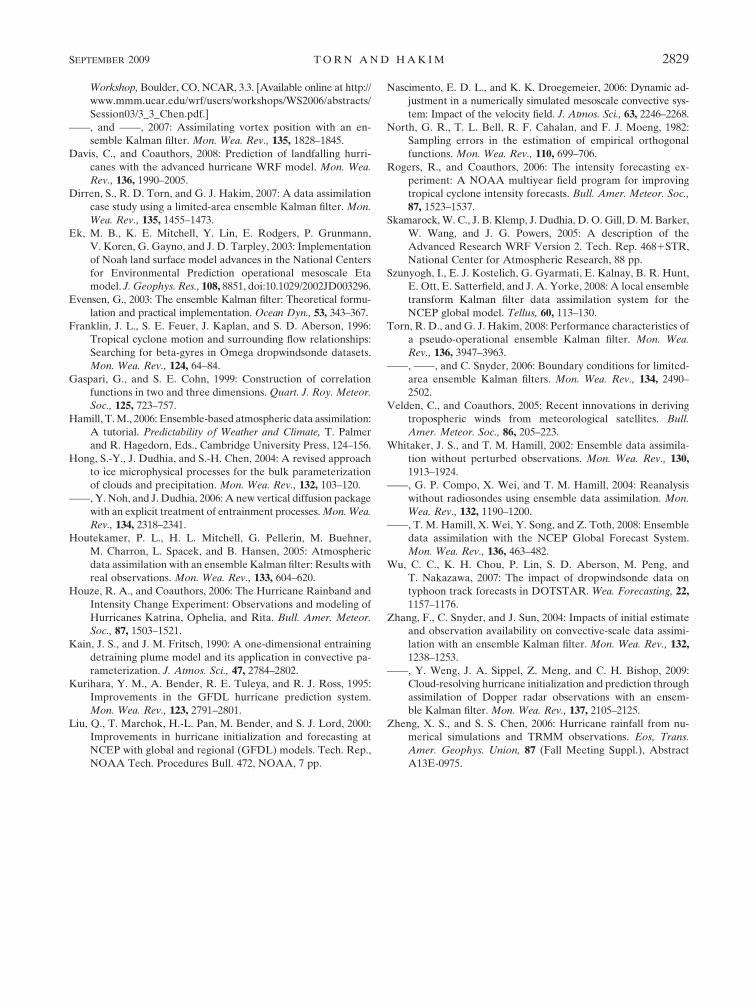
Excessive variance in TC position can have an ad-
verse affect on the shape and intensity of the TC. For
example, Fig. 5 shows the 0600 UTC 27 August analysis
when assimilating best-track position every 6 h, com-
pared to every 3 h. The 6-h position assimilation has more
variance in the TC position, and the resulting asymmetric
increments distort the structure of the vortex. This result
indicates that TC position observations may have an
adverse affect on the analysis when the background TC
is more than a few grid points from the best-track posi-
tion; a similar conclusion is drawn by Chen and Snyder
(2007).
The value of cycling the data assimilation system
is evaluated by comparison with a deterministic 8-day
WRF forecast on the outer domain, initialized on
0000 UTC 22 August using GFS analyses for initial and
boundary conditions. The tropical wave that evolves
into Katrina fails to intensify into a tropical depression
in this simulation (not shown). We conclude that con-
tinuous observation assimilation yields analysis correc-
tions that are necessary to capture TC genesis in this
case. In a separate experiment, we cycle the EnKF
system over the same 8-day period, but withhold drop-
sonde observations (denoted as ‘‘no drop’’ in Table 1).
FIG. 3. Analysis increment of (a) SLP (hPa) and (b) 500-hPa zonal wind (m s21) on the outer
domain obtained by assimilating one 500-hPa zonal wind dropsonde observation at the location
indicated by the dot on 0000 UTC 27 August 2005 (color shading). Contours are the ensemble-
mean background field. (c),(d) As in (a),(b), but for the inner domain. Latitude and longitude
lines are shown every 28.
2822 M O N T H L Y W E A T H E R R E V I E W VOLUME 137
In this case, TC position and intensity RMS errors in the
background forecast are nearly identical to the control
simulation, suggesting that other observations near the
TC, such as position data, can compensate for the syn-
optic dropsondes. In a third cycling experiment, we re-
move TC position observations from the observation set
(‘‘no best track’’ in Table 1). In these simulations, RMS
background TC position, minimum SLP, and maximum
wind speed errors are 64%, 79%, and 36% greater, re-
spectively, than the control experiment.
Compared to GFS and deterministic WRF forecasts,
the 48-h ensemble forecasts initialized from the WRF
EnKF analyses provide consistently better forecasts of
Katrina’s track and intensity (Fig. 6). The RMS error
in the WRF EnKF ensemble-mean 48-h forecasts of
Katrina’s track are 65%, 60%, and 25% lower than the
FIG. 4. The (a) leading and (b) third SLP analysis-increment EOF for the outer domain analysis on 0000 UTC
27 Aug 2005 (shading, hPa). The EOFs are scaled to have maximum amplitude of 1.0. Contours are the ensemble-
mean background SLP field every 8 hPa. (c) As in (a), but for the 500-hPa zonal wind field (m s21). (d),(e),(f) As in
(a),(b),(c), but for the inner domain. Latitude and longitude lines are shown every 28.
FIG. 5. WRF EnKF ensemble-mean SLP analysis valid 0600 UTC 27 Aug 2005 when position observations are
assimilated every (a) 3 and (b) 6 h. Contours are every 4 hPa.
SEPTEMBER 2009 T O R N A N D H A K I M 2823

official NHC forecast, the GFS model, and a WRF
forecast, respectively, on the outer domain using initial
and boundary conditions from GFS analyses (WRF-
GFS). Since the ensemble-mean lateral boundary con-
ditions for the WRF EnKF and WRF-GFS forecasts are
identical, differences between these forecasts are mostly
due to the initial conditions.3 A specific example of
the track improvements is illustrated in Fig. 7, which
shows that WRF EnKF forecasts initialized at 1200 UTC
25 August and 0000 UTC 26 August capture the ob-
served southwesterly motion of Katrina across Florida,
whereas the other forecasts have a more westerly track.
WRF EnKF forecasts also have lower errors in TC
intensity as compared to the other forecasts considered
here. For all forecast hours, the error in the ensemble-
mean 10-m wind speed is approximately 14 m s21,
compared to approximately 18 m s21 for the WRF-GFS
forecasts (Fig. 6b). Unlike WRF EnKF analyses, the
TC structure is poorly represented in the WRF-GFS
initial conditions and the vortex must spin up during the
first few hours of the simulation; this issue will be fur-
ther explored in the next section. At short lead times
(,18 h), the official NHC forecast has smaller errors as
compared to the EnKF; beyond that, the WRF EnKF
errors are roughly 7 m s21 smaller. We note that the
large intensity errors in GFS forecasts partially result
from the coarse horizontal resolution of the available
model output (18 latitude and longitude).
Although the dropsonde data has only a small affect
on 6-h TC forecasts, it is possible that the impact of this
data could become greater at longer lead times. To test
this possibility, 48-h forecasts initialized from the no
drop analysis ensemble are compared to the control
forecasts. At all forecast lead times, the track and in-
tensity forecast errors for the no drop ensemble are
within 5% of the control ensemble forecast, indicating
that for longer lead times, the dropsonde data has
minimal affect on the TC forecast. Although other
studies have shown positive impact of dropsonde data
over many cases (e.g., Aberson 2003; Wu et al. 2007;
Aberson 2008), there are individual storms for which
the dropsonde data have minimal impact or lead to de-
graded forecasts.
4. Inner domain results
Assimilation on the inner domain also produces
analysis ensembles that capture well the track and, to a
lesser extent, the intensity of Katrina. The RMS error in
the TC position is slightly larger than the horizontal grid
spacing (Table 1). In contrast to the minimum SLP es-
timates on the outer domain, the TC minimum SLP for
the inner domain analyses are generally too low. While
FIG. 6. RMS error in (a) tropical cyclone position and (b) tropical cyclone maximum wind speed as a function of
the forecast hour. The thick solid line is for the ensemble-mean forecast, the dotted–dashed line is for GFS
forecasts, the thin solid line denotes the WRF forecast initialized from the GFS analysis, and the dashed line is for
the official NHC forecast. Forecasts apply to the outer domain and are initialized every 12 h from 0000 UTC 25 Aug
2005 to 0000 UTC 27 Aug 2005.
3 Differences can arise in individual members because of the
lateral boundary condition perturbations.
2824 M O N T H L Y W E A T H E R R E V I E W VOLUME 137

it may appear that the outer domain has smaller mini-
mum SLP errors, the RMS outer domain analysis SLP
errors are 1.5 hPa higher during the time period covered
by the inner domain. The largest errors occur around
0600 UTC 28 August, because the TC undergoes rapid
intensification 12 h earlier than NHC advisory esti-
mates. For maximum wind speed, the errors are smaller
than the outer domain; however, these values are typi-
cally less than the best-track estimate. Assimilating
dropsonde data within the TC is important on this do-
main. The RMS error in the ensemble-mean back-
ground forecast of TC position and minimum SLP are
20% and 70% larger, respectively, when dropsonde
data is not assimilated (no drop case in Table 1). We
note that TC position assimilation is needed on this
domain because information from the outer domain is
communicated to the inner domain only through lateral
boundary conditions.
Even though data assimilation is performed inde-
pendently on each domain, analysis increments on the
inner domain show a similar dipole pattern to that
obtained on the outer domain (Figs. 3c,d). Assimilat-
ing the dropsonde wind observation northwest of the
TC shifts the storm to the southeast in both SLP and
500-hPa zonal wind. The leading two EOFs of the SLP
analysis increments on this domain exhibit dipoles
centered on the TC and explain 25% and 20%, re-
spectively, of the variance (Fig. 4d). The third EOF
(Fig. 4e) explains 9% of the variance and is mainly
related to intensity, as is the case for the outer domain.
For 500-hPa zonal wind, the leading EOF is a north–
south-oriented tripole centered on the TC, explains
17% of the variance, and is associated with north–
south displacements in the TC (Fig. 4f). The second
(13% of variance) and third (6% of variance) 500-hPa
zonal wind EOFs are related to east–west displace-
ments and intensity, respectively (not shown).
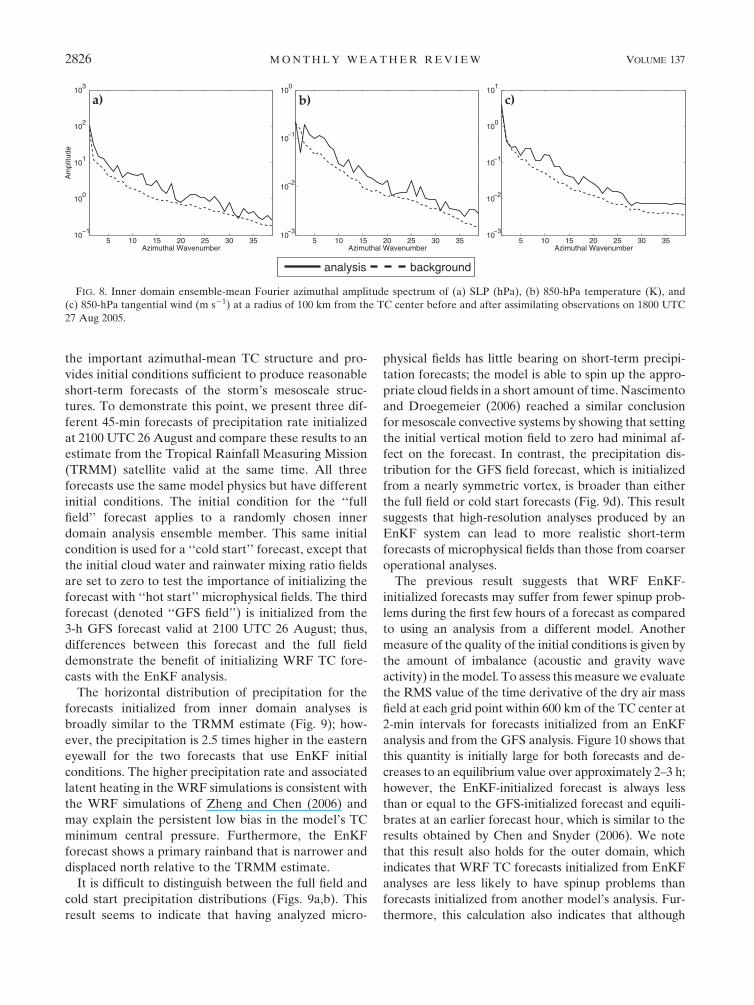
Recall that covariance inflation is not applied on this
domain because it amplifies asymmetric increments to
the TC, which distort its structure. To demonstrate how
data assimilation affects the TC structure, Fig. 8 shows
the ensemble-averaged azimuthal Fourier amplitude
spectrum4 of SLP, 850-hPa temperature, and 850-hPa
tangential wind at a radius of 100 km from the TC cen-
ter before and after data assimilation at 1800 UTC
27 August. This time coincides with an intensive observ-
ing period for the RAINEX project, with many drop-
sondes available for assimilation within the TC; other
times show qualitatively similar results. The spectra show
a peak at azimuthal wavenumber 1 with a steep decline
toward higher wavenumbers. With few exceptions, the
analysis amplitude is larger at nearly all wavenumbers,
but especially at higher wavenumbers, which suggests
that data assimilation renders the storm more asym-
metric. Conversely, these results also suggest that the
storm becomes more axisymmetric during the 6-h fore-
cast. The enhanced asymmetric structure in the analysis
could result from a number of factors, including variance
in storm position, sampling error due to using a small
ensemble, and differences in the location and amplitude
of convection in each ensemble member.
Although EnKF data assimilation introduces asym-
metric noise to the TC structure, the analysis still retains
FIG. 7. 48-h forecasts of Katrina’s track for the WRF EnKF ensemble-mean, GFS, and NHC initialized at
(a) 1200 UTC 25 Aug 2005 and (b) 0000 UTC 26 Aug 2005. The thin solid line is for the ensemble-mean forecast, the
dashed line denotes the GFS forecast, the dotted–dashed line is for the official NHC forecast, and the thick solid line
is the NHC best-track position. Latitude and longitude lines are shown every 28.
4 Note that because the TC location differs between ensemble
members, the mean Fourier spectrum is not equal to the spectrum
of the ensemble mean.
SEPTEMBER 2009 T O R N A N D H A K I M 2825
the important azimuthal-mean TC structure and pro-
vides initial conditions sufficient to produce reasonable
short-term forecasts of the storm’s mesoscale struc-
tures. To demonstrate this point, we present three dif-
ferent 45-min forecasts of precipitation rate initialized
at 2100 UTC 26 August and compare these results to an
estimate from the Tropical Rainfall Measuring Mission
(TRMM) satellite valid at the same time. All three
forecasts use the same model physics but have different
initial conditions. The initial condition for the ‘‘full
field’’ forecast applies to a randomly chosen inner
domain analysis ensemble member. This same initial
condition is used for a ‘‘cold start’’ forecast, except that
the initial cloud water and rainwater mixing ratio fields
are set to zero to test the importance of initializing the
forecast with ‘‘hot start’’ microphysical fields. The third
forecast (denoted ‘‘GFS field’’) is initialized from the
3-h GFS forecast valid at 2100 UTC 26 August; thus,
differences between this forecast and the full field
demonstrate the benefit of initializing WRF TC fore-
casts with the EnKF analysis.
The horizontal distribution of precipitation for the
forecasts initialized from inner domain analyses is
broadly similar to the TRMM estimate (Fig. 9); how-
ever, the precipitation is 2.5 times higher in the eastern
eyewall for the two forecasts that use EnKF initial
conditions. The higher precipitation rate and associated
latent heating in the WRF simulations is consistent with
the WRF simulations of Zheng and Chen (2006) and
may explain the persistent low bias in the model’s TC
minimum central pressure. Furthermore, the EnKF
forecast shows a primary rainband that is narrower and
displaced north relative to the TRMM estimate.
It is difficult to distinguish between the full field and
cold start precipitation distributions (Figs. 9a,b). This
result seems to indicate that having analyzed micro-
physical fields has little bearing on short-term precipi-
tation forecasts; the model is able to spin up the appro-
priate cloud fields in a short amount of time. Nascimento
and Droegemeier (2006) reached a similar conclusion
for mesoscale convective systems by showing that setting
the initial vertical motion field to zero had minimal af-
fect on the forecast. In contrast, the precipitation dis-
tribution for the GFS field forecast, which is initialized
from a nearly symmetric vortex, is broader than either
the full field or cold start forecasts (Fig. 9d). This result
suggests that high-resolution analyses produced by an
EnKF system can lead to more realistic short-term
forecasts of microphysical fields than those from coarser
operational analyses.
The previous result suggests that WRF EnKF-
initialized forecasts may suffer from fewer spinup prob-
lems during the first few hours of a forecast as compared
to using an analysis from a different model. Another
measure of the quality of the initial conditions is given by
the amount of imbalance (acoustic and gravity wave
activity) in the model. To assess this measure we evaluate
the RMS value of the time derivative of the dry air mass
field at each grid point within 600 km of the TC center at
2-min intervals for forecasts initialized from an EnKF
analysis and from the GFS analysis. Figure 10 shows that
this quantity is initially large for both forecasts and de-
creases to an equilibrium value over approximately 2–3 h;
however, the EnKF-initialized forecast is always less
than or equal to the GFS-initialized forecast and equili-
brates at an earlier forecast hour, which is similar to the
results obtained by Chen and Snyder (2006). We note
that this result also holds for the outer domain, which
indicates that WRF TC forecasts initialized from EnKF
analyses are less likely to have spinup problems than
forecasts initialized from another model’s analysis. Fur-
thermore, this calculation also indicates that although
FIG. 8. Inner domain ensemble-mean Fourier azimuthal amplitude spectrum of (a) SLP (hPa), (b) 850-hPa temperature (K), and
(c) 850-hPa tangential wind (m s21) at a radius of 100 km from the TC center before and after assimilating observations on 1800 UTC
27 Aug 2005.
2826 M O N T H L Y W E A T H E R R E V I E W VOLUME 137

data assimilation introduces high-wavenumber noise into
the TC, this noise appears to have relatively little impact
on the balanced fields after about 1 h.
5. Discussion and conclusions
Ensemble analyses and forecasts of Hurricane
Katrina are generated on a nested domain using an en-
semble Kalman filter based on the WRF model. Conven-
tional in situ observations, reconnaissance dropsondes,
and NHC position data are assimilated every 6 h for the
duration of Katrina’s lifetime. These experiments show
that the EnKF approach performs well for TC data
assimilation without employing special schemes such
as vortex bogusing and repositioning. Although this
method performed well for a single storm, further re-
search with additional cases is needed to assess the
generality of the results.
Comparisons with NHC best-track estimates indicate
that the EnKF analysis and forecast ensembles on both
domains provide accurate estimates of the TC position,
and to a lesser extent, the TC intensity. On the outer
domain, assimilating position data leads to lower anal-
ysis errors as compared to the background forecast,
though the same is not true for intensity. In contrast,
when position observations are withheld, the position
and intensity errors are significantly larger. Data denial
experiments indicate that dropsondes that sample the
synoptic environment provide minimal benefit to the
outer domain; however, dropsondes deployed within
the TC lead to significant reductions to the position and
intensity errors on the inner domain. Horizontal distri-
butions of precipitation on the inner domain compare
qualitatively well with TRMM satellite estimates, ex-
cept that the model produces twice as much precipita-
tion as the satellite value. This favorable comparison is
attributed to having initial conditions that contain a
dynamically consistent three-dimensional representa-
tion of the TC, rather than properly analyzed micro-
physical fields (cf. Figs. 9a,b).
FIG. 9. (a) Full field, (b) cold start, and (c) GFS field 45-min forecasts of precipitation rate on the inner domain
initialized on 2100 UTC 26 Aug. (d) The 2148 UTC TRMM satellite rain rate overlaid onto the 2045 UTC GOES-12
visible image (colors, inches per hour). White shading in (a)–(c) indicates the location of clouds in the model. The
TRMM figure is courtesy of the Naval Research Laboratory Monterey Marine Meteorology Division.
SEPTEMBER 2009 T O R N A N D H A K I M 2827

Ensemble forecasts initialized from the WRF EnKF
analyses have smaller errors for TC track and intensity
compared to GFS forecasts, WRF forecasts on the same
domain that are initialized from GFS analyses, and the
official NHC forecast. Smaller track and intensity errors
indicate that the WRF EnKF analyses provide a better
estimate of the steering flow and a TC structure that is
more compatible with the model, respectively.
WRF forecasts initialized from EnKF analyses have a
shorter spinup time and contain less initial imbalance as
compared to simulations that use initial conditions from
the GFS model. As a consequence, high-resolution TC
forecasts initialized from an EnKF analysis are less
likely to suffer from large convective bursts that may
occur during the first 6 h (e.g., Davis et al. 2008). If large
enough, these convective bursts can significantly alter
the TC short-term structure, which in turn, can limit the
usefulness of longer-term forecasts (C. Davis, NCAR,
2008, personal communication).
Analysis increments for observations near the TC
tend primarily to shift the position of the storm. Ex-
cessive variance in the TC position also produces
asymmetric analysis increments, which can erroneously
affect the intensity of the storm and introduce asym-
metric structural noise. These asymmetries distort the
TC in the analysis, and often lead to a weakening of the
TC through axisymmetrization during the first few
hours. Assimilating observations before this symmetri-
zation is complete may potentially contribute even
more high-wavenumber noise, which would result in
larger short-term intensity forecast errors. This problem
of excessive TC position variance can be partially
overcome by assimilating TC position at high temporal
frequency, thereby decreasing position variance.
Acknowledgments. We thank Chris Velden and Dave
Stettner of CIMSS/SSEC for providing cloud winds for
these experiments. Yongsheng Chen (NCAR) and two
anonymous reviewers provided helpful comments.
ACARS data for this study were made available to
the Earth System Research Laboratory/Global Systems
Division by the following commercial airlines: Ameri-
can, Delta, Federal Express, Northwest, United, and
United Parcel Service. Processed dropsonde data is
provided by the NOAA/Hurricane Research Division of
AOML. Stacy Brodzik helped obtain the RAINEX
dropsonde data used in this study. This work was sup-
ported by NSF Grant ITR-0205648, NOAA CSTAR
Grant NA17RJ1232, and ONR Grant N00014-06-1-0510.
REFERENCES
Aberson, S. D., 2002: Two years of operational hurricane synoptic
surveillance. Wea. Forecasting, 17, 1101–1110.
——, 2003: Targeted observations to improve operational tropical
cyclone track forecast guidance. Mon. Wea. Rev., 131, 1613–
1628.
——, 2008: Large forecast degradations due to synoptic surveil-
lance during the 2004 and 2005 hurricane seasons. Mon. Wea.
Rev., 136, 3138–3150.
Anderson, J. L., B. Wyman, S. Q. Zhang, and T. Hoar, 2005: As-
similation of surface pressure observations using an ensemble
filter in an idealized global atmospheric prediction system.
J. Atmos. Sci., 62, 2925–2938.
Barker, D. M., W. Huang, Y. R. Guo, A. J. Bourgeois, and
Q. N. Xiao, 2004: A three-dimensional variational data as-
similation system for MM5: Implementation and initial re-
sults. Mon. Wea. Rev., 132, 897–914.
Beven, J. L., and Coauthors, 2008: Atlantic hurricane season of
2005. Mon. Wea. Rev., 136, 1109–1173.
Chen, Y., and C. Snyder, 2006: Initializing a hurricane vortex with
an ensemble Kalman filter. Preprints, Seventh WRF Users
FIG. 10. RMS value of the derivative of WRF dry air mass with respect to time within 600 km of the TC center as a
function of lead time for an (a) outer or (b) inner domain forecast initialized from the 1800 UTC 27 Aug 2005 WRF
EnKF and GFS analysis.
2828 M O N T H L Y W E A T H E R R E V I E W VOLUME 137
Workshop, Boulder, CO, NCAR, 3.3. [Available online at http://
www.mmm.ucar.edu/wrf/users/workshops/WS2006/abstracts/
Session03/3_3_Chen.pdf.]
——, and ——, 2007: Assimilating vortex position with an en-
semble Kalman filter. Mon. Wea. Rev., 135, 1828–1845.
Davis, C., and Coauthors, 2008: Prediction of landfalling hurri-
canes with the advanced hurricane WRF model. Mon. Wea.
Rev., 136, 1990–2005.
Dirren, S., R. D. Torn, and G. J. Hakim, 2007: A data assimilation
case study using a limited-area ensemble Kalman filter. Mon.
Wea. Rev., 135, 1455–1473.
Ek, M. B., K. E. Mitchell, Y. Lin, E. Rodgers, P. Grunmann,
V. Koren, G. Gayno, and J. D. Tarpley, 2003: Implementation
of Noah land surface model advances in the National Centers
for Environmental Prediction operational mesoscale Eta
model. J. Geophys. Res., 108, 8851, doi:10.1029/2002JD003296.
Evensen, G., 2003: The ensemble Kalman filter: Theoretical formu-
lation and practical implementation. Ocean Dyn., 53, 343–367.
Franklin, J. L., S. E. Feuer, J. Kaplan, and S. D. Aberson, 1996:
Tropical cyclone motion and surrounding flow relationships:
Searching for beta-gyres in Omega dropwindsonde datasets.
Mon. Wea. Rev., 124, 64–84.
Gaspari, G., and S. E. Cohn, 1999: Construction of correlation
functions in two and three dimensions. Quart. J. Roy. Meteor.
Soc., 125, 723–757.
Hamill, T. M., 2006: Ensemble-based atmospheric data assimilation:
A tutorial. Predictability of Weather and Climate, T. Palmer
and R. Hagedorn, Eds., Cambridge University Press, 124–156.
Hong, S.-Y., J. Dudhia, and S.-H. Chen, 2004: A revised approach
to ice microphysical processes for the bulk parameterization
of clouds and precipitation. Mon. Wea. Rev., 132, 103–120.
——, Y. Noh, and J. Dudhia, 2006: A new vertical diffusion package
with an explicit treatment of entrainment processes. Mon. Wea.
Rev., 134, 2318–2341.
Houtekamer, P. L., H. L. Mitchell, G. Pellerin, M. Buehner,
M. Charron, L. Spacek, and B. Hansen, 2005: Atmospheric
data assimilation with an ensemble Kalman filter: Results with
real observations. Mon. Wea. Rev., 133, 604–620.
Houze, R. A., and Coauthors, 2006: The Hurricane Rainband and
Intensity Change Experiment: Observations and modeling of
Hurricanes Katrina, Ophelia, and Rita. Bull. Amer. Meteor.
Soc., 87, 1503–1521.
Kain, J. S., and J. M. Fritsch, 1990: A one-dimensional entraining
detraining plume model and its application in convective pa-
rameterization. J. Atmos. Sci., 47, 2784–2802.
Kurihara, Y. M., A. Bender, R. E. Tuleya, and R. J. Ross, 1995:
Improvements in the GFDL hurricane prediction system.
Mon. Wea. Rev., 123, 2791–2801.
Liu, Q., T. Marchok, H.-L. Pan, M. Bender, and S. J. Lord, 2000:
Improvements in hurricane initialization and forecasting at
NCEP with global and regional (GFDL) models. Tech. Rep.,
NOAA Tech. Procedures Bull. 472, NOAA, 7 pp.
Nascimento, E. D. L., and K. K. Droegemeier, 2006: Dynamic ad-
justment in a numerically simulated mesoscale convective sys-
tem: Impact of the velocity field. J. Atmos. Sci., 63, 2246–2268.
North, G. R., T. L. Bell, R. F. Cahalan, and F. J. Moeng, 1982:
Sampling errors in the estimation of empirical orthogonal
functions. Mon. Wea. Rev., 110, 699–706.
Rogers, R., and Coauthors, 2006: The intensity forecasting ex-
periment: A NOAA multiyear field program for improving
tropical cyclone intensity forecasts. Bull. Amer. Meteor. Soc.,
87, 1523–1537.
Skamarock, W. C., J. B. Klemp, J. Dudhia, D. O. Gill, D. M. Barker,
W. Wang, and J. G. Powers, 2005: A description of the
Advanced Research WRF Version 2. Tech. Rep. 4681STR,
National Center for Atmospheric Research, 88 pp.
Szunyogh, I., E. J. Kostelich, G. Gyarmati, E. Kalnay, B. R. Hunt,
E. Ott, E. Satterfield, and J. A. Yorke, 2008: A local ensemble
transform Kalman filter data assimilation system for the
NCEP global model. Tellus, 60, 113–130.
Torn, R. D., and G. J. Hakim, 2008: Performance characteristics of
a pseudo-operational ensemble Kalman filter. Mon. Wea.
Rev., 136, 3947–3963.
——, ——, and C. Snyder, 2006: Boundary conditions for limited-
area ensemble Kalman filters. Mon. Wea. Rev., 134, 2490–
2502.
Velden, C., and Coauthors, 2005: Recent innovations in deriving
tropospheric winds from meteorological satellites. Bull.
Amer. Meteor. Soc., 86, 205–223.
Whitaker, J. S., and T. M. Hamill, 2002: Ensemble data assimila-
tion without perturbed observations. Mon. Wea. Rev., 130,
1913–1924.
——, G. P. Compo, X. Wei, and T. M. Hamill, 2004: Reanalysis
without radiosondes using ensemble data assimilation. Mon.
Wea. Rev., 132, 1190–1200.
——, T. M. Hamill, X. Wei, Y. Song, and Z. Toth, 2008: Ensemble
data assimilation with the NCEP Global Forecast System.
Mon. Wea. Rev., 136, 463–482.
Wu, C. C., K. H. Chou, P. Lin, S. D. Aberson, M. Peng, and
T. Nakazawa, 2007: The impact of dropwindsonde data on
typhoon track forecasts in DOTSTAR. Wea. Forecasting, 22,
1157–1176.
Zhang, F., C. Snyder, and J. Sun, 2004: Impacts of initial estimate
and observation availability on convective-scale data assimi-
lation with an ensemble Kalman filter. Mon. Wea. Rev., 132,
1238–1253.
——, Y. Weng, J. A. Sippel, Z. Meng, and C. H. Bishop, 2009:
Cloud-resolving hurricane initialization and prediction through
assimilation of Dopper radar observations with an ensem-
ble Kalman filter. Mon. Wea. Rev., 137, 2105–2125.
Zheng, X. S., and S. S. Chen, 2006: Hurricane rainfall from nu-
merical simulations and TRMM observations. Eos, Trans.
Amer. Geophys. Union, 87 (Fall Meeting Suppl.), Abstract
A13E-0975.
SEPTEMBER 2009 T O R N A N D H A K I M 2829
Copyright © 2022 FDOKUMEN