Multiporous nanofibers of SnO 2 by electrospinning for high efficiency dye-sensitized solar cells
Upload
independentCategory
view
1download
0
This article appeared in a journal published by Elsevier. The attachedcopy is furnished to the author for internal non-commercial researchand education use, including for instruction at the authors institution
and sharing with colleagues.
Other uses, including reproduction and distribution, or selling orlicensing copies, or posting to personal, institutional or third party
websites are prohibited.
In most cases authors are permitted to post their version of thearticle (e.g. in Word or Tex form) to their personal website orinstitutional repository. Authors requiring further information
regarding Elsevier’s archiving and manuscript policies areencouraged to visit:
http://www.elsevier.com/copyright

Author's personal copy
Electrochimica Acta 54 (2009) 4123–4130
Contents lists available at ScienceDirect
Electrochimica Acta
journa l homepage: www.e lsev ier .com/ locate /e lec tac ta
Enhancing the performance of dye-sensitized solar cells based on an organicdye by incorporating TiO2 nanotube in a TiO2 nanoparticle film
Kun-Mu Leea,∗, Vembu Suryanarayananb, Jen-Hsien Huangc, K.R. Justin Thomasd,Jiann T. Lind, Kuo-Chuan Hoc,∗
a Photovoltaics Technology Center, Industrial Technology Research Institute, Chutung, Hsinchu 31040, Taiwanb Electro Organic Division, Central Electrochemical Research Institute, Karaikudi 630006, Tamil Nadu, Indiac Department of Chemical Engineering, National Taiwan University, Taipei 10617, Taiwand Institute of Chemistry, Academia Sinica, 115 Nankang, Taipei, Taiwan
a r t i c l e i n f o
Article history:Received 15 October 2008Received in revised form 13 February 2009Accepted 14 February 2009Available online 26 February 2009
Keywords:Dye-sensitized solar cellsElectron transferOrganic dyeTiO2 Nanotube
a b s t r a c t
The photoelectrochemical properties of a high molar extinction coefficient charge transfer organic dyecontaining thienylfluorene segment called FL, and the effect of incorporating TiO2 nanotube (TiNT) in TiO2
nanoparticle film along with the above dye on the photovoltaic performance of dye-sensitized solar cells(DSSCs) were investigated. The influence of soaking time of the TiO2 electrode in dye solution and theeffect of varying its concentration, on the solar cell efficiency was also studied. Cyclic voltammetric (CV)analysis revealed the linear relationship between the anodic peak current and the scan rate, indicating asurface-confined diffusion process.
The surface morphology of TiNT was characterized using SEM, TEM and XRD. The open-circuit voltage(VOC) of the DSSC increased with the increase in the wt% of TiNT and shows optimal value at about 5 wt%,which is correlated with the suppression of the electron recombination as found out from the electronlifetime studies.
The electrochemical impedance spectroscopy (EIS) technique was employed to quantify the chargetransport resistance (Rct) and electron lifetime under different ratios of the TiNT/nanoparticle. The elec-tron lifetimes of the DSSCs based on FL and N3 dye were very close to one another and the DSSC based onthe FL showed respectable photovoltaic performance of ca. 7.8% under the light intensity of 100 mW cm−2
(AM 1.5G).© 2009 Elsevier Ltd. All rights reserved.
1. Introduction
Dye sensitized solar cells (DSSCs), composed of a dyed oxidesemiconductor, a redox electrolyte and a counter electrode, haveproved themselves as the most promising low-cost alternative forthe effective conversion of light energy into electrical energy [1]. Inthese devices, conversion efficiency is achieved by ultra-fast injec-tion of an electron from a photoexcited dye into the conductionband of TiO2 followed by subsequent dyes regeneration and holestransportation to the counter electrode.
Recent progress with the DSSCs has triggered the demand forthe search of new organic and organometallic dyes suitable forapplication in such modules [2–5]. The organic dyes, which areefficient in photocurrent generation, contain a donor and accep-tor bridged by p-conjugation. In most designs, amines serve asdonors while a 2-cyanoacrylic acid or rhodamine unit render the
∗ Corresponding author. Tel.: +886 2 2366 0739; fax: +886 2 2362 3040.E-mail address: [email protected] (K.-M. Lee).
acceptor functionality. The presence of a carboxylic acid moietyin the acceptor end assists the anchoring of the dye moleculeson the TiO2 surface. Recently, we constructed highly efficientDSSCs based on FL containing thiophene and fluorene segments,and a good solar energy to electric conversion efficiency wasachieved (5.23%) under the light intensity of 100 mW cm−2 (AM1.5G) [6].
Up to now, the conversion efficiency of the DSSC has reachedto ∼11% [7]. One of the limiting factors on the performance of theDSSC is related to electron transport in TiO2 nanoparticle electrode.The large surface area increases with increasing thickness of thenanoporous TiO2 film, while the loss of electron transport throughthe randomly distributed 3D network also increases due to the pres-ence of more grain boundaries and limited diffusion length [8,9]. Itis known that highly ordered TiO2 tube array has been used in theDSSC, and a better performance than TiO2 nanoparticle has beenobtained on the TiO2 film at the same film thickness [10]. How-ever, the film thickness of the highly ordered TiO2 tube array onFTO glass is limited to only 500 nm and is not enough to provideoptimal performance of the DSSCs [11–13].
0013-4686/$ – see front matter © 2009 Elsevier Ltd. All rights reserved.doi:10.1016/j.electacta.2009.02.052
Author's personal copy
4124 K.-M. Lee et al. / Electrochimica Acta 54 (2009) 4123–4130
In this study, the photoelectrochemical properties, Incident Pho-ton to Conversion Efficiency (IPCE) and solar cell performance of theDSSCs containing FL based on the TiO2 nanoparticle film incorporat-ing TiO2 nanotube (TiNT) were investigated. The optimal conditionsfor the fabrication of the DSSCs with various amounts of TiNT andthe electron transport properties in the TiO2 films were also evalu-ated and explored. Finally, the DSSC based on FL with the additionof 5 wt% TiNT/TiO2 film were optimized to give the respectableconversion efficiency of 7.84% under 100 mW cm−2 (AM 1.5G).
2. Experimental
Anhydrous LiI, I2, poly(ethylene glycol) (PEG), and 4-tertiarybutyl pyridine (TBP) were obtained from Merck. Titanium (IV)tetraisopropoxide (>98%), NaOH and HCl were purchased fromAcros and used as such. Tertiary butanol and acetonitrile (AN)were purchased from Merck. FL ((E)-2-cyano-3-(5-(9,9-diethyl-7-(naphthalen-1-yl(phenyl)amino)-9H-fluoren-2-yl)thiophen-2-yl)acrylic acid) was synthesized in laboratory based on previousreport [6] and N3 dye was obtained from Solaronix (Aubonne,Switzerland).
The preparation of the TiO2 nanoparticle and the electrode fab-rication were carried out according to the procedures mentioned inthe literatures [14,15] except after autoclave treatment, where thesolution was concentrated to 13 wt% and PEG (MW 20,000) wasadded to the TiO2 paste to prevent the film from cracking duringdrying. The commercial P25 TiO2 powder was used as a startingmaterial for preparation of TiNT. 1–1.5 g of the commercial TiO2powders were mixed with 100 ml of NaOH aqueous solution withthe concentration of 5 mol L−1, followed by hydrothermal treat-ment at 150 ◦C in a Teflon-lined autoclave for 12 h. The treatedpowders were washed thoroughly with de-ionized water and 0.1 MHCl for several times and subsequently filtered and dried at 80 ◦Cfor 2 days. The TiO2 pastes were coated on a fluorine-doped tinoxide (FTO) glass plate (Rsh = 15 � square−1) using glass rod method.The structural and chemical natures of the obtained materials werestudied using powder X-ray diffraction (XRD, Rigaku RAD systemwith Cu K� radiation), Scanning Electron Microscopy (SEM, HitachiS-4700) and Transmission Electron Microscopy (TEM, JOEL JEM-1230).
An active area of 0.25 cm2 was selected from sintered electrodeand the electrodes were immersed in different concentrations of FLsolution for several times. Pt (100 nm thick) sputtered on FTO glasswas used as the counter electrode. The electrolyte was composedof 0.5 M LiI/0.05 M I2/0.5 M TBP in acetonitrile. The photoelectro-chemical characterizations of the DSSCs were carried out using anAM 1.5 simulated light radiation. The light source was a 450 W Xelamp (#6266, Oriel) equipped with a water-based IR filter and AM1.5 filter (#81075, Oriel). The photovoltage transients of assembleddevices were recorded with a digital oscilloscope (LeCroy, modelLT322). Pulsed laser excitation was applied by a frequency-doubledQ-switched Nd:YAG laser (Spectra-Physics laser, model Quanta-RayGCR-3-10) with 2 Hz repetition rate at 532 nm, and 7 ns pulse widthat half-height. The beam size was slightly larger than 0.25 cm2 tocover the area of the device with an incident energy of 1 mJ cm−2.The average electron lifetime can be estimated approximately by fit-ting a decay of the open circuit voltage transient with exp (−t �−1
e ),where t is the time and �e is an average time constant before recom-bination.
UV–vis absorption data was measured by UV–vis spectra(V-570, Jasco). Photoelectrochemical characteristics and the ac-impedance measurements of the DSSCs were recorded with apotentiostat/galvanostat (PGSTAT 30, Autolab, Eco-Chemie, theNetherlands). The applied bias voltage and ac amplitude were setat open-circuit voltage of the DSSCs and 10 mV between the FTO/Pt
counter electrode and the FTO/TiO2/dye working electrode, respec-tively, and the frequency range explored was 10 mHz to 65 kHz. Theimpedance spectra were analyzed by an equivalent circuit modelinterpreting the characteristics of the DSSCs [16].
3. Results and discussion
3.1. The photoelectrochemical properties of FL and the cellperformance of the DSSC
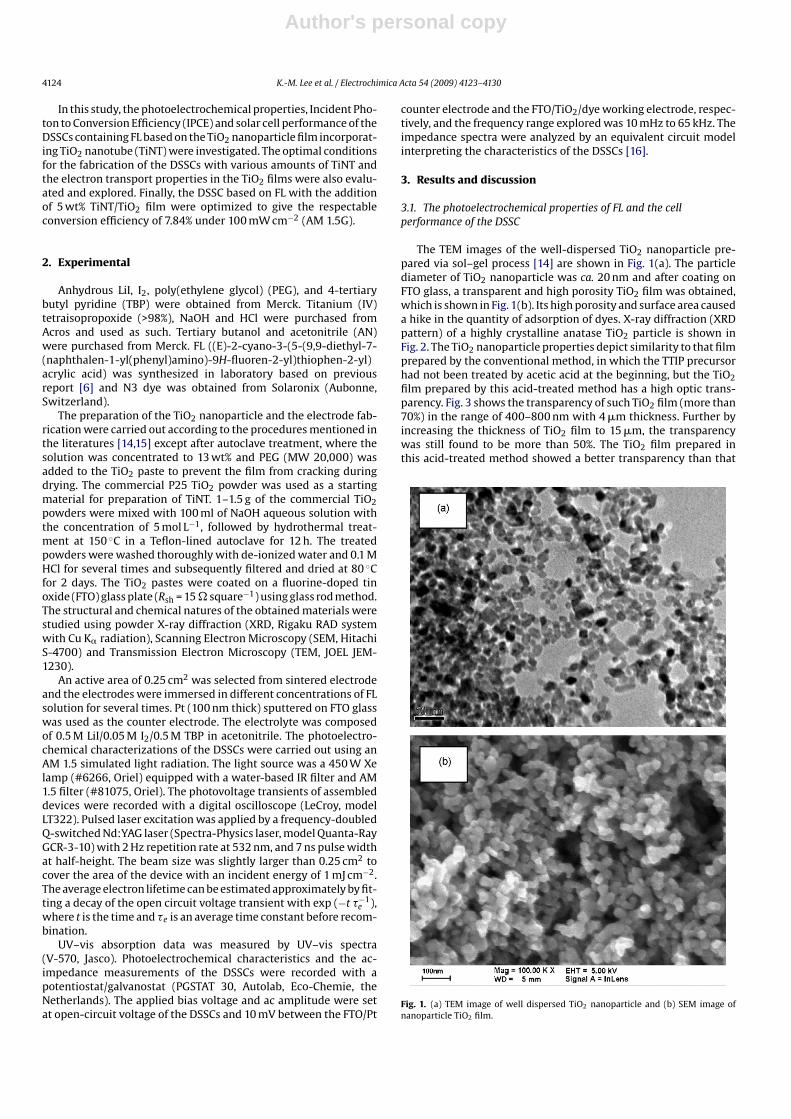
The TEM images of the well-dispersed TiO2 nanoparticle pre-pared via sol–gel process [14] are shown in Fig. 1(a). The particlediameter of TiO2 nanoparticle was ca. 20 nm and after coating onFTO glass, a transparent and high porosity TiO2 film was obtained,which is shown in Fig. 1(b). Its high porosity and surface area causeda hike in the quantity of adsorption of dyes. X-ray diffraction (XRDpattern) of a highly crystalline anatase TiO2 particle is shown inFig. 2. The TiO2 nanoparticle properties depict similarity to that filmprepared by the conventional method, in which the TTIP precursorhad not been treated by acetic acid at the beginning, but the TiO2film prepared by this acid-treated method has a high optic trans-parency. Fig. 3 shows the transparency of such TiO2 film (more than70%) in the range of 400–800 nm with 4 �m thickness. Further byincreasing the thickness of TiO2 film to 15 �m, the transparencywas still found to be more than 50%. The TiO2 film prepared inthis acid-treated method showed a better transparency than that
Fig. 1. (a) TEM image of well dispersed TiO2 nanoparticle and (b) SEM image ofnanoparticle TiO2 film.

Author's personal copy
K.-M. Lee et al. / Electrochimica Acta 54 (2009) 4123–4130 4125
Fig. 2. The XRD pattern of the TiO2 nanoparticle after sintering at 500 ◦C.
Fig. 3. The transparent spectra of nanoparticle TiO2 film with different thicknesses.
prepared by traditional method at the same thickness of the TiO2film.
The photoelectrochemical properties of FL incorporated on thischaracteristic TiO2 electrode were investigated. The absorptionspectra of the FL on 4 �m of the TiO2 film and in THF solution aredisplayed in Fig. 4. The photoelectrochemical properties of the FLand N3 dye are also compared and listed in Table 1. It is well knownthat the adsorption of the dye takes place on the TiO2 film due tothe presence of a carboxylic group in the molecule. The evidencefor this is obtained from the shift of absorption maxima of freeand bound FL on the TiO2 film. The absorption peak of FL in THFsolution is 454 nm but the absorption maximum of FL on TiO2 filmobviously shifts to a shorter wavelength of 438 nm. This shift wasdue to the formation of aggregation of FL on the TiO2 film throughthe carboxylic group. Since the stacked aggregation on the TiO2 film
Table 1Photoelectrochemical properties of FL and N3 dye.
Complex Absorption maximum EHOMO Eg ELUMOa
�max (nm) [ε (104/M cm)] (V vs. NHE) (eV) (V vs. NHE)
FL 454 [5.29]b 1.15 2.06 −0.91N3 536 [1.30]c 0.99 1.65 −0.66
a LUMO = HOMO–Eg.b Measured in acetonitrile/tert-butanol (1:1) solution.c Measured in THF solution.
Fig. 4. The absorption spectra of FL in THF solution and anchored on TiO2 film.
might decrease the electron injection due to intermolecular energytransfer, the dye adsorption for cell assembly had been carried outalong with co-adsorbents [17,18].
The FL exhibits a single prominent band probably representingthe superposition of �–�* and charge transfer transition. From themolecular modeling study, the ground state structure of FL is only aslight twist between the thienyl and the fluorenyl segments. The FLcan be reversibly oxidized at moderately high oxidation potentials.The oxidation potential is more positive than I−/I3− redox couple(the I−/I3− redox couple is located at 0.2 V vs. SCE) [19]. An oxi-dation potential higher than that of the iodine couple is necessaryto forbid the backward electron transport to electrolyte solutionand ensure forward electron injection into the TiO2 electrode in theDSSC. The reversibility of the oxidation couple will be beneficial forthe stability of the DSSCs in long run.
Fig. 5 shows the amount of dye adsorption and the cell con-version efficiency at various soaking times of the TiO2 film (4 �mthickness) in 2.5 × 10⁻⁴ M of dye solution. It is observed that theamount of dye adsorption increases with the soaking time, andreaches a saturation at ∼6 × 10⁻⁷ mol cm−2 until about 2 h. Haraet al. had also suggested that the organic dye adsorption increasedwith the soaking time and the absorption peak shifted to shorterwavelength with increase in the amount of the dye molecule on theTiO2 film leading to aggregation [18]. In addition, the cell conver-sion efficiency also increased with the soaking time and showed agood trend with the amount of dye adsorbed on the TiO2 film, sug-
Fig. 5. The relationship between the quantity of dye adsorption on the TiO2 film andcell conversion efficiencies against the soaking times of the TiO2 film in dye solutionat 25 ◦C.

Author's personal copy
4126 K.-M. Lee et al. / Electrochimica Acta 54 (2009) 4123–4130
Fig. 6. (a) The change of normalized absorption maximum value and the absorptionmaximum wavelength with the concentration of dye solutions. (b) The relationshipof photovoltaic parameters of the DSSCs with the concentration of dye solutions.
gesting the amount of dye on the TiO2 electrode plays an importantrole on the performance of the DSSC. Furthermore, the influence ofdifferent concentrations of dye solution on the photophysical andthe cell performance of the DSSC were also investigated and areshown in Fig. 6. The figure reveals that the absorption maximumwavelength shifts from 426 nm (lower than 2.5 × 10⁻⁵ M) to 446 nm(higher than 5 × 10⁻⁵ M), and the adsorption of dye on the TiO2film has reached saturation when the concentration of dye solu-tion is higher than 5 × 10⁻⁵ M (Fig. 6(a)). The changes of absorptionpeak with increase of concentration may be due to the dimeriza-
Fig. 7. Cyclic voltammograms of FL anchored on 4 �m TiO2 film. Scan rates (frominner to outer): 50, 100, 200, 300, 400 and 500 mV s−1, respectively. The inset showsthe dependence of anodic peak currents on scan rates.
tion through the hydrogen bonds of the carboxylic groups or theformation of aggregation through the planar conjugated molecu-lar structure [18]. Fig. 6(b) shows the influence of the different ofconcentrations of dye solutions on the performance of the DSSCs. Itis noted that when the concentration is below 2.5 × 10⁻⁵ M, a lowVOC, JSC, FF and � has been obtained and further with the increase inconcentration of the dye solution, the � increases and reaches a sat-uration of ca. 6%. Additionally, the JSC slightly increases and the VOChas a little decrease when the dye solution is increased more than2.5 × 10−4 M. This may be correlated with the dye aggregation onthe TiO2 film when it was immersed at a higher dye concentration.
Furthermore, typical cyclic voltammograms (CV) of 4 �m thick-ness of the TiO2 electrode grafted with FL in acetonitrile solutioncontaining 0.1 M TBAPF6 as supporting electrolyte is shown in Fig. 7.When the potential was scanned between 0 and 1.2 V, chemicallyreversible redox waves with the half wave potential, (Eox + Ered)/2,at 0.66 V vs. Ag/Ag+ were observed, which could be attributed to theone electron oxidation and reduction of FL. It is known that the TiO2film has no electroactivity in the investigated potential range. Theanodic and cathodic peak potentials shifted symmetrically, result-ing in a constant half wave potential at various scan rates (from 50 to500 mV s−1). As shown in the inset of Fig. 7, the anodic peak currentsare linearly proportional to the scan rate, indicating a surface con-fined electrochemical process [20]. In addition, the uncompensated
Fig. 8. SEM and TEM images of the TiO2 nanotube (TiNT).

Author's personal copy
K.-M. Lee et al. / Electrochimica Acta 54 (2009) 4123–4130 4127
Fig. 9. XRD pattern of the TiO2 nanotube (TiNT) after sintering at various tempera-tures.
ohmic drop, the non-zero peak splitting arising from the solvationof the redox center or the structure of dye monolayer may changewith the oxidation states [20,21].
3.2. The influences of incorporating the TiO2 nanotube (TiNT) in aTiO2 nanoparticle film on the cell performance of the DSSCs
As we know that an electron, injected from dye moleculesinto TiO2 nanoparticle composed of 10 �m thick mesoporous film,is required to pass through more than 106 particles with grainboundaries until reaching the conductive substrate [22]. In orderto improve the electron transport property in mesoporous TiO2electrodes, use of TiO2 nanotube having higher aspect ratio willbe preferable as electron transporting structure [23].
The SEM and TEM images of the TiNT prepared by hydrothermalmethod at 150 ◦C for 12 h are shown in Fig. 8. The TiO2 nanotubeshave a diameter of approximately 10 nm and a length of several hun-dreds nanometers to several micrometers. The SEM image revealsthat the sample is composed of several nanotubes. Fig. 9 showsthe X-ray diffraction patterns for the as-synthesized nanotubesat different heating temperature. The XRD patterns obtained atroom temperature (the bottom pattern in Fig. 9) is without anneal-ing. At 200 ◦C, a clear peak shift (to 2� = 9.17◦) is observed. Thereflection peak at 2� = 9.17◦ corresponds to the (2 0 0) reflection ofH2Ti3O7 phase, d200 ∼ 9.69 Å namely, the interlayer spacing of lay-ered titanate. By increasing the heating temperature, the shift of(2 0 0) reflection is clearly notable. The peak-shift behavior fromroom temperature to 500 ◦C could be explained by the dehydra-tion of interlayer water. The results are consistent with the workreported by Feist and Davies [24].
The cell performance of the DSSCs with TiO2 electrodes incor-porating with various amounts of TiNTs of 4 �m thickness wasinvestigated and showed in Fig. 10. The TiNT had a higher elec-tron transport rate, electron diffusion coefficient and surface areathan the TiO2 nanoparticle [25]. With the TiO2 film containing5 wt% TiNT, the JSC, VOC and � was higher than its absence owingto the increase of charge-collection efficiency. However, with fur-ther increase of TiNT up to 10 and 15 wt%, the JSC decreased andthe VOC increased due to the shrunk of TiNT, which is associatedwith decrease in the surface area of the TiO2 film followed bythe increase in the interconnection among TiO2 particles and nan-otubes as a result of sintering at 500 ◦C. The influence of the additionTiNT on the cell performance of the DSSC was studied further byElectrochemical Impedance Spectroscopy (EIS) which as showedin Fig. 11(a) and the equivalent circuit of this study was shown
Fig. 10. The FL based solar cell performances with nanoparticle TiO2 film incorpo-rating various amount of TiNT.
Fig. 11. (a) Nyquist plot of the DSSCs containing different amounts of TiNT in theTiO2 electrodes and (b) the equivalent circuit of this study.
in Fig. 11(b), and the characteristic parameters were also listed inTable 2. Generally, all the spectra of the DSSCs exhibit three semi-circles, which are assigned to electrochemical reaction at the Ptcounter electrode (Rct1), charge transfer at the TiO2/dye/electrode(Rct2) and Warburg diffusion process of I−/I3− in electrolyte (Rdiff).The C�2 is the chemical capacitance of TiO2 film. The ohmic serialresistance (Rs) in the high-frequency region corresponds to the elec-trolyte and the FTO resistance. It was found that the values of RS
Table 2The fitting data from Nyquist plot of the DSSCs based on various amounts of TiNT innanoparticle TiO2 film measured under illumination of 100 mW cm−2.
wt% of TiNT RS (ohm) Rct1 (ohm) Rct2 (ohm) C�2 (mF) Rdiff (ohm)
0% 25.3 ± 0.3 14.2 ± 0.2 26.4 ± 0.3 1.12 ± 0.5 11.2 ± 0.25% 27.4 ± 0.3 12.3 ± 0.2 25.3 ± 0.4 0.95 ± 0.5 11.3 ± 0.2
10% 27.3 ± 0.3 10.3 ± 0.2 27.0 ± 0.3 1.18 ± 0.5 11.4 ± 0.215% 25.5 ± 0.4 17.6 ± 0.2 28.8 ± 0.4 1.30 ± 0.5 11.6 ± 0.2

Author's personal copy
4128 K.-M. Lee et al. / Electrochimica Acta 54 (2009) 4123–4130
Fig. 12. The effects of the TiO2 film thickness on short circuit current density (JSC),open circuit voltage (VOC), fill factor (FF) and cell conversion efficiency (�) of theDSSCs.
and Rdiff, respectively, were similar with various amounts of theTiNT in the TiO2 film. However, the values of Rct2 increased withthe increase of TiNT from 5 to 15 wt%, as shown in Table 2.
Based on the optimum ratio of TiNT/TiO2 electrode (5 wt%), thecell performance of the DSSC was studied. It is well known thatthe DSSC performance depends on the thickness of the TiO2 film.Fig. 12 illustrates the correlation between the thickness of the filmand the photoelectrochemical characteristics. From this figure, it isobserved that there is a linear increase of JSC from 2 to 12 �m, how-ever, further increase in thickness, the JSC reaches saturation andlowers the efficiency. This is found to be contradictory, as thickerfilms will enhance the adsorption of the dye on the TiO2 materi-als resulting in higher JSC values. However, the scenario is totallydifferent here. One of the causes for this effect is that the chargerecombination between electrons injected from the excited dye tothe conduction band of the TiO2 and the I3− ions in the electrolytewill become more dominant in thick films [11,26], which is detri-mental to electron collection on the back contact. Contrary to thebehavior of JSC, VOC decreases with increasing the thickness of theTiO2 film. Charge recombination and the series resistance in thethick film lead to a decreased VOC [27]. In addition, it is found thatthe FF also decreases by increasing the thickness of the TiO2 film asit deals with the total cell IR drops significantly. With the same sheetresistance of FTO, the photocurrent is directly related to IR drop andfor this reason, fabricating the device with less sheet resistant FTOwill improve the FF and enhance the cell conversion efficiency.
The cell conversion efficiency (�) of DSSC was calculated by thefollowing equation:
� =(
JSCVOCFFPin
)× 100% (1)
where JSC is the short-circuit photocurrent density, VOC is the open-circuit voltage, Pin is the light power per unit area and FF is the fillfactor which is calculated by the following equation:
FF = Imax × Vmax
ISC × VOC(2)
where Imax and Vmax are the current and potential at the maximumpower point, respectively, in J–V curves of solar cells. The J–V char-acterization was conducted under Pin of 100 mW cm−2 for the �calculation.
It is concluded from Fig. 12 that optimal thickness of the TiO2films falls at ca. 12 �m, and the best performance is listed in Table 3.For comparison, the photoelectrochemical characteristics of theDSSC sensitized by N3 dye using the same TiO2 film under identi-cal experimental condition are also included. It was found that the
Table 3The average electron lifetimes and solar cell performances of the DSSCs containingFL and N3 dye, respectively.
Samples �e (ms)a JSC (mA cm−2) VOC (V) � (%) FF
FL 2.42 16.98 0.722 7.84 0.640N3 2.55 18.04 0.741 8.28 0.620
a Average electron lifetime in TiO2 electrode.
Fig. 13. The average electron lifetimes of FL and N3 dye.
best conversion efficiency based on FL reached the value of 7.84%,whose value is very close to that of N3 dye. In addition, the averageelectron lifetime (�e) was also studied by the laser induced photo-voltage transient technique. The result is shown in Fig. 13 and thevarious parameters are listed in Table 3. The average electron life-time can be estimated approximately by fitting a decay of the opencircuit voltage transient with exp (−t �−1
e ), where t is the time and�e is an average time constant before recombination. It was foundthat the values of �e of the DSSCs based on FL and N3 dye were 2.42and 2.55 ms, respectively. Meanwhile, for comparison, the IncidentPhoton to Current Efficiency (IPCE) action spectra of the solar cellsbased on FL and N3 dye, respectively, are shown in Fig. 14. The IPCEsare obtained by the following equation:
IPCE (%) = 1240 (eV nm) × Jph (mA cm−2)
� (nm) × ˚ (mW cm−2)× 100 (3)
Fig. 14. Action spectrum of IPCE of the DSSCs based on FL and N3 dye.

Author's personal copy
K.-M. Lee et al. / Electrochimica Acta 54 (2009) 4123–4130 4129
Table 4The photovoltaic parameters of the DSSCs with FL under different incident lightintensities.
Pin (mW cm−2) JSC (mA cm−2) VOC (V) � (%) FF
10 1.86 0.654 8.00 0.65835 6.30 0.696 8.07 0.64470 12.28 0.705 7.95 0.643
100 16.85 0.723 7.81 0.641
where Jph is the short-circuit photocurrent density for monochro-matic irradiation and � and ˚ are the wavelength and the intensity,respectively, of the monochromatic light. The IPCE exceeds 70% ina spectral range from 400 to 500 nm and reaches the maximum ofabout 80% at 465 nm for FL. Therefore, the N3 dye has a broaderfeature covering almost the entire visible spectrum which has amaximum peak value of about 75% at 520 nm wavelength than FL,due to the contribution of metal to ligand charge transfer (MLCT)transition, leading to a higher photocurrent density.
We also have investigated the effect of light intensity on theperformance of the DSSCs. The overall power conversion efficien-cies at different light intensities are listed in Table 4. The JSC, VOC,and FF of devices under 100 mW cm−2 are 16.85 mA cm−2, 0.723 V,and 0.641, respectively, yielding an overall conversion efficiency of7.81%, which is comparable with the N3 dye. At lower incident lightintensities, overall conversion efficiencies are ca. 8%. This result isdue to the fact that transport kinetics are fast enough to regeneratethe dye under reduced illumination; however, under full illumina-tion, ten times more dye molecules are active, and the transport ofI3−/I− ions to and from the counter electrode is not fast enough tofully regenerate the dye molecules.
Further study by using EIS, the impedance spectra of the DSSCswith the TiO2 electrode containing 5 wt% TiNT at different lightintensities are shown in Fig. 15a (Nyquist plot) and b (Bode phaseplot). The results indicate that Rct2 decreases and the characteristicfrequency peaks are shifted to higher frequency as the light inten-sity increases. Those results also suggest that more electrons areinjected in the TiO2 electrode, but the injected electrons are lostmore rapidly with the increase in the light intensity. Meanwhile,under illumination, VOC can be expressed as [28,29]:
VOC = RT
ˇFln
(AI
n0k1[I−3 ] + n0k2[D+]
)(4)
where k1 and k2 being the kinetic constant of back reactionof injected electrons with triiodide and recombination of theseelectrons with oxidized dye, respectively, and n0 being the con-centration of accessible electronic states in the conduction band.Neglecting the loss term due to recombination with the oxidizeddye molecules, VOC depends logarithmically on the inverse concen-tration of I3− and increases with incident photo flux I. The VOC of theDSSCs measured under 100, 70, 35 and 5 mW cm−2 illumination arefound to be 0.723, 0.705, 0.696 and 0.623 V, respectively, as shownin Table 4, following the predicted logarithmical relation. Any vari-ations of the local triiodide concentration due to light illuminationappear to have a small effect [28].
For device at-rest stability test, the DSSC with 4 �m TiO2 filmadsorbed FL stored in the dark at 30 ◦C was investigated. The DSSCshowed an excellent stability and after the observation for 50 days,the cell conversion efficiency decreased from 5.1% to 4.5% (Fig. 16).The decrease in efficiencies is mainly due to the gradual drop ofphotocurrents while the photovoltages shows little bit increase.The decrease in photocurrent and the increase in photovoltage afterstorage may be due to the sealing problem resulting in solvent evap-oration and the negative shift of quasi Fermi level of mesoporousanatase semiconductor.
Fig. 15. EIS analysis of the DSSCs under different light intensities. (a) Nyquist plotand (b) Bode phase plot.
Fig. 16. The at-rest stability of the DSSC with FL based on 4 �m TiO2 film for 50 days.
4. Conclusions
The photoelectrochemical properties of the DSSCs containingorganic dye, FL, and the effect of incorporating the TiNT in theTiO2 nanoparticle film on the solar cell performance were studied.The TiO2 electrode immersed in high concentration of dye solutionled to the dye aggregation easily and decreased the cell perfor-

Author's personal copy
4130 K.-M. Lee et al. / Electrochimica Acta 54 (2009) 4123–4130
mance. Voltammetric analysis reveals a linear relationship betweenthe anodic peak current and the scan rate, indicating a surface-confined diffusion process. The TiO2 nanotubes have a diameter ofapproximately 10 nm and a length of several hundreds nanome-ters to several micrometers as revealed by TEM and SEM analysis.The VOC increased with the increases in the wt% of TiO2 nanotube.The improvement in the photovoltage varied with the increase ofthe electron transport rate and caused the suppression of the elec-tron recombination. When the TiO2 nanotubes were incorporatedat about 5 wt% in the TiO2 nanoparticle film, the conversion effi-ciency showed the best result. The DSSC based on FL dye yields acell conversion efficiency of 7.8% under 1 sun irradiation. From theEIS study, the values of Rct2 increased as the ratio of the TiNT/particlevaried from 5 to 15 wt%. Those data supports the result that the cellconversion efficiency of the DSSC based on FL can reach 90% to thatof N3 dye.
Acknowledgements
This work was financially supported by the Academia Sinica,Taipei, Taiwan, the Republic of China, under grant AS-97-TP-A08.We also want to thank Professor King-Chuen Lin and his researchgroup members, of Department of Chemistry, National Taiwan Uni-versity, for the help in making the pulsed laser apparatus availableto us.
References
[1] B. O’Reagen, M. Grätzel, Nature 353 (1991) 373.[2] M. Grätzel, Chem. Lett. 34 (2005) 8.
[3] K. Hara, T. Sato, R. Katoh, A. Furube, T. Yoshihara, M. Murai, M. Kurashige, S. Ito,A. Shinpo, S. Suga, H. Arakawa, Adv. Funct. Mater. 15 (2005) 246.
[4] T. Horiuchi, H. Miura, K. Sumioka, S. Uchida, J. Am. Chem. Soc. 126 (2004) 3014.[5] A. Hagfeldt, M. Grätzel, Acc. Chem. Res. 33 (2000) 269.[6] K.R. Justin Thomas, J.T. Lin, Y.C. Hsu, K.C. Ho, Chem. Commun. (2005) 4098.[7] M. Grätzel, J. Photochem. Photobiol. A: Chem. 164 (2004) 3.[8] B.A. Gregg, Corrd. Chem. Rev. 248 (2004) 1215.[9] S.H. Kang, J.Y. Kim, Y. Kim, H.S. Kim, Y.E. Sung, J. Phys. Chem. C 111 (2007) 9614.
[10] G.K. Mor, K. Shankar, M. Paulose, O.K. Varghese, C.A. Grimes, Nano Lett. 6 (2006)215.
[11] Z.S. Wang, H. Kawauchi, T. Kashima, H. Arakawa, Coord. Chem. Rev. 248 (2004)1381.
[12] K.M. Lee, V. Suryanarayanan, K.C. Ho, Sol. Energy Mat. Sol. Cells 90 (2006) 2398.[13] C.J. Barbé, F. Árendse, P. Comte, M. Jirousek, F. Lenzmann, V. Shklover, M. Grätzel,
J. Am. Ceram. Soc. 80 (1997) 3157.[14] M. Grätzel, J. Sol–Gel Sci. Technol. 22 (2001) 7.[15] K. Hara, T. Nishikawa, M. Kurashige, H. Kawauchi, T. Kashima, K. Sayama, K. Aika,
H. Arakawa, Sol. Energy Mat. Sol. Cells 85 (2005) 21.[16] K.M. Lee, V. Suryanarayanan, K.C. Ho, J. Power Sources 185 (2008) 1605.[17] M.K. Nazeeruddin, P. Péchy, M. Grätzel, Chem. Commun. (1997) 1705.[18] K. Hara, T. Sato, R. Katoh, A. Furube, Y. Ohga, A. Shinpo, S. Suga, K. Sayama, H.
Sugihara, H. Arakawa, J. Phys. Chem. B 107 (2003) 597.[19] A. Hagfeldt, M. Grätzel, Chem. Rev. 95 (1995) 49.[20] P. Wang, S.M. Zakeeruddin, P. Comte, R. Charvet, R. Humphry-Baker, M. Grätzel,
J. Phys. Chem. B 107 (2003) 14336.[21] H.O. Finklea, in: A.J. Bard, I. Rubinstein (Eds.), Electroanalytical Chemistry, vol.
19, Marcel Dekker, New York, 1996, p. 108.[22] K.D. Benkstein, N. Kopidakis, J. van de Lagemaat, A.J. Frank, J. Phys. Chem. B 107
(2003) 7759.[23] Y. Ohsaki, N. Masaki, T. Kitamura, Y. Wada, T. Okamoto, T. Sekino, K. Niihara, S.
Yanagida, Phys. Chem. Chem. Phys. 7 (2005) 4157.[24] T.P. Feist, P.K. Davies, J. Solid State Chem. 101 (1992) 275.[25] K. Zhu, N.R. Neale, A. Miedaner, A.J. Frank, Nano Lett. 7 (2007) 69.[26] C. Longo, A.F. Nogueira, M.A. De Paoli, J. Phys. Chem. B 106 (2002) 5925.[27] M.K. Nazeeruddin, A. Kay, I. Rodicio, R. Humphry-Baker, E. Muller, P. Liska, N.
Vlachopoulos, M. Grätzel, J. Am. Chem. Soc. 115 (1993) 6382.[28] Q. Wang, J.E. Moser, M. Grätzel, J. Phys. Chem. B 109 (2005) 14945.[29] M. Koelsch, S. Cassaignon, C. Ta Thanh Minh, J.F. Guillemoles, J.P. Jolivet, Thin
Solid Films 451–452 (2004) 86.
Copyright © 2022 FDOKUMEN