
Role of energy level alignment in solar cells sensitized with a metal-free organic dye: A combined...
11
Copyright line will be provided by the publisher pss-Header will be provided by the publisher 1 2 3 4 5 6 7 8 9 10 11 12 13 14 15 16 17 18 19 20 21 22 23 24 25 26 27 28 29 30 31 32 33 34 35 36 37 38 39 40 41 42 43 44 45 46 47 48 49 50 51 52 53 54 55 56 57 Review copy – not for distribution (pss-logo will be inserted here by the publisher) Role of energy level alignment in solar cells sensitized with a metal- free organic dye – A combined experimental and theoretical approach Corneliu I. Oprea 1 , Anca Dumbravă 2 , Irina Enache 2,3 , Jeanina Lungu 1 , Adrian Georgescu 1 , Florin Moscalu 1 , Camelia Oprea 1 and Mihai A. Gîrţu *,1 1 Department of Physics, Ovidius University of Constanţa, 900527 Constanţa, Romania 2 Department of Chemistry, Ovidius University of Constanţa, 900527 Constanţa, Romania 3 Department of Mathematics and Sciences, Constanţa Maritime University, 900663 Constanţa, Romania Received DD August YYYY, revised DD January YYYY, accepted ZZZ Published online ZZZ Keywords dye-sensitized solar cells, mordant yellow 10, photovoltaic conversion efficiency, Time-Dependent Density Functional Theory, optical spectra * Corresponding author: e-mail [email protected], Phone: +40 241 606 418, Fax: +40 241 618 372, We report results of combined experimental and theoreti- cal studies of dye-sensitized solar cells using 5-(4 - sul- fophenylazo)salicylic acid disodium salt, known as Mor- dant Yellow 10 (MY-10), as TiO 2 sensitizer. We focus on a single dye but vary the solvent and the pH of the so- lution as well as the photoelectrode preparation condi- tions to determine the conditions for best photovoltaic conversion efficiency. We found experimentally that the efficiency, measured under standard AM 1.5G conditions, was higher in solutions of ethanol than of water, but still small (up to 0.174%), although the fill factor was large (up to 0.73). Of the dyes in ethanol, MY-10 in alkaline solution showed the best matching of the solar spectrum but displayed the lowest efficiency. Density Functional Theory calculations provided the optimized geometry, electronic structure and electronic spectrum of the dye in fully protonated as well as partially and totally deproto- nated forms, in solution. The calculated optical spectra are consistent with the experimental data, with strong ab- sorption in the visible range only for the alkaline dye so- lution. The low device efficiency is very likely related to the weak optical absorption in the visible range. The much higher photovoltaic conversion efficiency of the DSSCs fabricated using acid or roughly neutral pH solu- tions, corresponding to the protonated and partially de- protonated forms of MY-10, respectively, is likely caused by the better alignment of the ground state of the dye with the redox level of the electrolyte. The decrease with pH of the dye solution of the short-circuit current was linked to a weaker charge injection from the excited state of the dye to the conduction band of the oxide, which is correlated with the shifting of the excited state of the dye deeper into the CB edge of the semiconductor. The vari- ation of the open-circuit voltage with the pH of the solu- tion was linked to the adjustment of the conduction band edge of TiO 2 , depending on the number of protons trans- ferred from the dye to the oxide surface. Based on our results, we analyze the relative importance of the main criteria that should be met by a dye to be used in a DSSC. Copyright line will be provided by the publisher 1 Introduction Increasing energy demands and con- cerns over global warming have led to a greater focus on renewable energy sources, particularly on solar cell tech- nologies [1]. Among organic-based photovoltaic devices [2], dye-sensitized solar cells (DSSCs) [3] have attracted a special interest due to the prospect of low production cost [2], transparency and flexibility, when desired. For such reasons, DSSCs may constitute a choice for affordable low power generation in urban areas and in particular a possi- bility of producing power generating windows [4]. The DSSCs consist of an electrode with a porous layer of nanocrystalline wide band gap semiconductor, such as TiO 2 , covered with a sensitizing dye, a redox electrolyte (e.g. I 3 ¯ /I ¯ ) and a counter electrode for instance platinized
-
Upload
independent -
Category
Documents
-
view
6 -
download
0
Transcript of Role of energy level alignment in solar cells sensitized with a metal-free organic dye: A combined...
Copyright line will be provided by the publisher
pss-Header will be provided by the publisher
1 2 3 4 5 6 7 8 9 10 11 12 13 14 15 16 17 18 19 20 21 22 23 24 25 26 27 28 29 30 31 32 33 34 35 36 37 38 39 40 41 42 43 44 45 46 47 48 49 50 51 52 53 54 55 56 57
Review copy – not for distribution
(pss-logo will be inserted here by the publisher)
Role of energy level alignment in solar cells sensitized with a metal-free organic dye – A combined experimental and theoretical approach
Corneliu I. Oprea1, Anca Dumbravă2, Irina Enache2,3, Jeanina Lungu1, Adrian Georgescu1, Florin Moscalu1, Camelia Oprea1 and Mihai A. Gîrţu*,1
1 Department of Physics, Ovidius University of Constanţa, 900527 Constanţa, Romania 2 Department of Chemistry, Ovidius University of Constanţa, 900527 Constanţa, Romania 3 Department of Mathematics and Sciences, Constanţa Maritime University, 900663 Constanţa, Romania
Received DD August YYYY, revised DD January YYYY, accepted ZZZ Published online ZZZ
Keywords dye-sensitized solar cells, mordant yellow 10, photovoltaic conversion efficiency, Time-Dependent Density Functional Theory, optical spectra * Corresponding author: e-mail [email protected], Phone: +40 241 606 418, Fax: +40 241 618 372,
We report results of combined experimental and theoreti-cal studies of dye-sensitized solar cells using 5-(4 - sul-fophenylazo)salicylic acid disodium salt, known as Mor-dant Yellow 10 (MY-10), as TiO2 sensitizer. We focus on a single dye but vary the solvent and the pH of the so-lution as well as the photoelectrode preparation condi-tions to determine the conditions for best photovoltaic conversion efficiency. We found experimentally that the efficiency, measured under standard AM 1.5G conditions, was higher in solutions of ethanol than of water, but still small (up to 0.174%), although the fill factor was large (up to 0.73). Of the dyes in ethanol, MY-10 in alkaline solution showed the best matching of the solar spectrum but displayed the lowest efficiency. Density Functional Theory calculations provided the optimized geometry, electronic structure and electronic spectrum of the dye in fully protonated as well as partially and totally deproto-nated forms, in solution. The calculated optical spectra are consistent with the experimental data, with strong ab-sorption in the visible range only for the alkaline dye so-
lution. The low device efficiency is very likely related to the weak optical absorption in the visible range. The much higher photovoltaic conversion efficiency of the DSSCs fabricated using acid or roughly neutral pH solu-tions, corresponding to the protonated and partially de-protonated forms of MY-10, respectively, is likely caused by the better alignment of the ground state of the dye with the redox level of the electrolyte. The decrease with pH of the dye solution of the short-circuit current was linked to a weaker charge injection from the excited state of the dye to the conduction band of the oxide, which is correlated with the shifting of the excited state of the dye deeper into the CB edge of the semiconductor. The vari-ation of the open-circuit voltage with the pH of the solu-tion was linked to the adjustment of the conduction band edge of TiO2, depending on the number of protons trans-ferred from the dye to the oxide surface. Based on our results, we analyze the relative importance of the main criteria that should be met by a dye to be used in a DSSC.
Copyright line will be provided by the publisher
1 Introduction Increasing energy demands and con-cerns over global warming have led to a greater focus on renewable energy sources, particularly on solar cell tech-nologies [1]. Among organic-based photovoltaic devices [2], dye-sensitized solar cells (DSSCs) [3] have attracted a special interest due to the prospect of low production cost [2], transparency and flexibility, when desired. For such
reasons, DSSCs may constitute a choice for affordable low power generation in urban areas and in particular a possi-bility of producing power generating windows [4].
The DSSCs consist of an electrode with a porous layer of nanocrystalline wide band gap semiconductor, such as TiO2, covered with a sensitizing dye, a redox electrolyte (e.g. I3
¯ /I¯ ) and a counter electrode for instance platinized
2 S. Bahrs et al.: Manuscript preparation guidelines
Copyright line will be provided by the publisher
1 2 3 4 5 6 7 8 9 10 11 12 13 14 15 16 17 18 19 20 21 22 23 24 25 26 27 28 29 30 31 32 33 34 35 36 37 38 39 40 41 42 43 44 45 46 47 48 49 50 51 52 53 54 55 56 57
conductive glass. The working principle of the device is based on light absorption in the dye anchored to the TiO2 nanocrystal, followed by transfer of the resulting photoe-lectron from the excited level of the dye into the conduc-tion band of TiO2, and through the electrode into the exter-nal circuit. The electrolyte facilitates the transport of the electron and the regeneration of the sensitizer, through re-duction of the triiodide ion at the counter electrode, fol-lowed by oxidation of the iodide ion at the dye [3].
The efficiency of the photovoltaic device depends strongly upon the dye used [5]. The highest efficiencies of power conversion in standard air mass 1.5 global (AM 1.5G) conditions, in excess of 11%, have been obtained us-ing Ru(II)-polypyridyl complexes [6,7], and values of up to 9% have been obtained also with metal-free organic dyes [8]. Although the efficiency of the latter is lower, they possess some advantages over the former: ease of synthesis, high molar extinction coefficient, tunable ab-sorption spectral response from the visible to the near infrared region, as well as environmentally friendly and low cost production methods [9].
In the quest for new dyes for DSSCs, much attention has been focused on the investigation of metal-free organic dyes such as merocyanines [10], coumarins [11], styryl, indoline [12] dyes, ring fluorinated fluoresceins [13] as well as novel organic dyes with triethoxysilyl units as anc-horing groups [14], etc. However, not much attention has been given, in connection to DSSCs, to the synthetic textile dyes, most of them being azo (–N=N–) dyes, which benefit from an intense absorption in the visible region, the pres-ence of linking groups such as carboxylate, salicylate or sulfonate, absence of heavy metals and low cost large scale manufacturing possibilities [15].
The previous study about the use of mordant dyes as sensitizers [15] reported that the most effective mordant dyes contained a salicylate chelating group. In the same study many other direct dyes, which have a bis–azo struc-ture and many of which contain a salicylate group, were al-so used in DSSCs with poorer results and no explanation was given regarding the factors that influence the efficien-cy of the various dyes as TiO2 sensitizers. In our work we take a different approach. We focus on a single dye, Mordant Yellow 10 (MY-10), 5-(4 - sulfophe-nylazo)salicylic acid disodium salt, C13H8N2Na2O6S (see Fig. 1), and perform extensive experimental and theoretical studies to understand the role of the various factors affect-ing the solar cell efficiency. MY-10 has the structural pat-tern of salicylic acid, having three functional groups; one of them (–SO3
-) ensures its solubility in water and the oth-ers (-COO-, -OH) act as chelating groups.
The MY-10 may be viewed as the product of the double deprotonation of an organic acid, 5-(4 - sulfopheny-lazo)salicylic acid, which for convenience will be labeled here as H3ACY (acid chrome yellow). Consequently, we further label H2ACY-
, HACY2-, and ACY3-, the corres-ponding partially and fully deprotonated species.
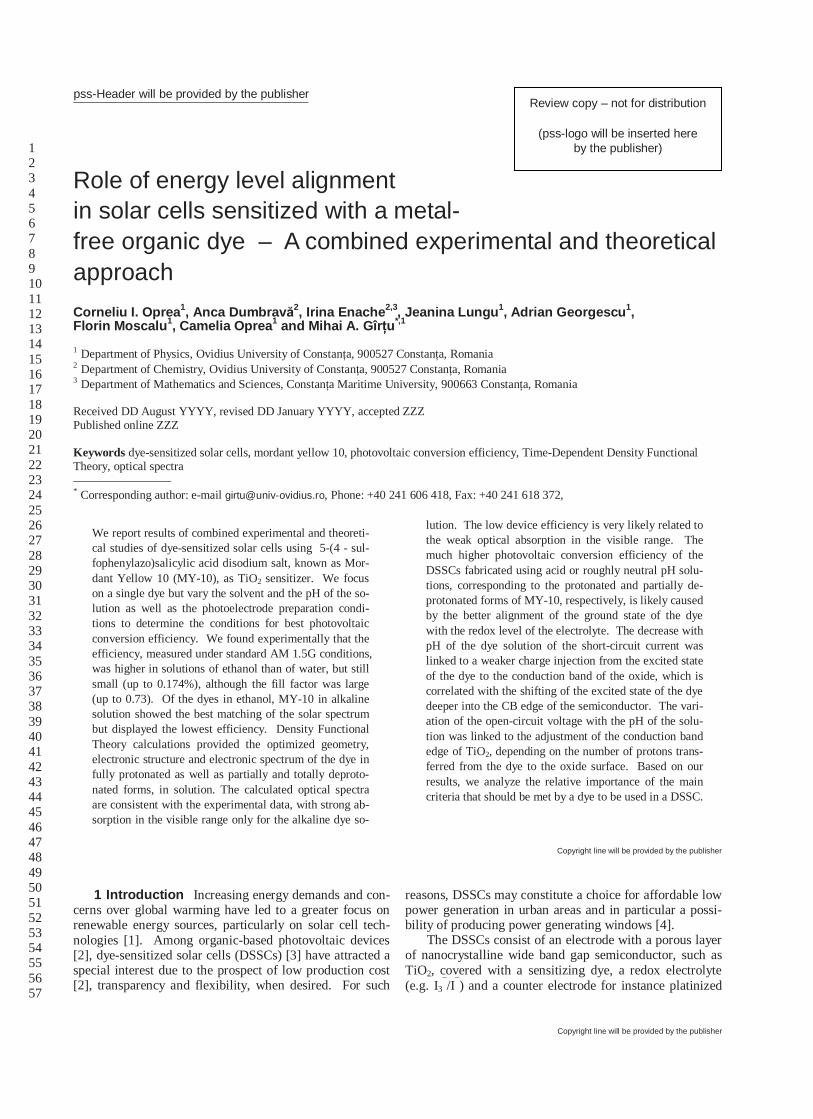
Figure 1 Chemical structure of 5-(4-sulfophenylazo)salicylic acid disodium salt (MY-10).
We report here the use of MY-10 as sensitizer for TiO2-based DSSCs, exploring the role of the pH of dye so-lution, the nature of solvent, the treatment of the semicon-ducting electrode, etc. on the solar cell efficiency. To bet-ter understand the mechanisms responsible for better cell operation we also performed density functional theory (DFT) calculations and determined the optimized geometry the electronic structure, and the optical absorption spec-trum of the protonated, partially deprotonated and fully de-protonated states. 2 Experimental
2.1 DSSC fabrication The photoelectrodes were prepared starting from a substrate consisting of a soda lime glass sheet of 2.2 mm thickness, covered with a conductive layer of fluorine-doped tin oxide (SnO2:F) with a 7 ohm/square resistivity (Solaronix). The conductive glass substrates were pretreated by immersing in a 0.2 M solu-tion of TiCl4 (Fluka) and kept for 40 min at 70oC, to in-crease the short-circuit photocurrent [16]. The oxide paste was prepared by the sol-gel method, using anatase TiO2 powder (P25, Sigma-Aldrich) and titanium isopropoxide (Sigma-Aldrich) [17]. The paste was applied as a porous nanocrystalline layer onto the substrate by the ‘‘doctor-blade’’ technique, then sintered at 4500C for 60 min. The resulting photoanodes were further treated in various ways: (I) used without a subsequent treatment, (II) immersed in a HCl 0.5 M solution and kept for 6 hours [18] or (III) im-mersed in a TiCl4 0.2 M solution, kept overnight and then sintered at 4500C for 1 hour [19].
Six dye solutions were prepared, using commercially available MY-10 by changing the solvent (water and etha-nol) and the pH (using HCl and NaOH for pH adjustment). For solutions a, b, and c, the solvent was water and the pH values were 2, 8, and 10, respectively, whereas for d, e, and f, the solution was ethanolic with pH = 3, 8, and 12, respectively. The photoanode plates were immersed in dye solutions for 2 h at 800C. The plates immersed in solutions a, b, and c were rinsed with water, whereas those im-mersed in solutions d, e, and f were rinsed in ethanol until the rinse liquid was colorless, then dried for 10 min at 800C.
In order to compare the performance of MY-10 cells with a reference DSSC, a titanium dioxide plate was sensi-tized with the N719 (Ruthenium 535-bisTBA) pigment, cis-diisothiocyanato-bis(2,2’-bipyridyl-4,4’-dicarboxylato) ruthenium(II) bis(tetrabutylammonium) [19] (from Sola-ronix) 0.2 mM in absolute ethanol by soaking at 800C for 2
pss-Header will be provided by the publisher 3
Copyright line will be provided by the publisher
1 2 3 4 5 6 7 8 9 10 11 12 13 14 15 16 17 18 19 20 21 22 23 24 25 26 27 28 29 30 31 32 33 34 35 36 37 38 39 40 41 42 43 44 45 46 47 48 49 50 51 52 53 54 55 56 57
hours. The plate was rinsed with absolute ethanol to re-move the excess dye and dried for 10 min at 800C.
Platinum counter electrodes were prepared by spread-ing a few drops of 5 mM H2[PtCl6]·6H2O solution in 2-propanol on the FTO glass, followed by drying at 100ºC for 10 min and than at 400ºC for 30 min. All photoelec-trode and counterelectrode plates were stored in desicca-tors before use.
The DSSCs were obtained by assembling the two elec-trodes. The liquid electrolyte (Iodolyte TG-50, 50 mM of tri-iodide in Tetraglyme, from Solaronix) is drawn into the space between the electrodes by capillary action. The pla-tinised surface of the cathode was slowly pressed onto the photoanode to avoid creating air bubbles, and the plates were secured together with small bulldog clips [15,20]. 2.2 Measurements The UV-VIS absorption spectra of dye solutions were recorded in the range 200 – 900 nm on a Jasco V 550 UV/Vis spectrophotometer, in quartz cu-vettes in absorption mode. The electro-optic parameters of the DSSCs, mainly the fill factor, FF, the photovoltaic conversion efficiency, η, the short circuit current, ISC, and the open circuit voltage, VOC, of the photovoltaic cells were measured under AM 1.5G standard sun conditions (1000W/m2) at 25oC, using a class A small area solar simu-lator [21]. The cell surface was exposed to light through a circular slit of 10 mm diameter, resulting in a useful area of about 0.785 cm2. The current and voltage values were measured using two digital bench multimeters (Mastech MS8050) and a precision decadic resistance box. All mea-surements were made at about 45 s intervals, allowing time for each reading to stabilize. The incident photon-to-current conversion efficiency (IPCE) was determined using the solar simulator and the efficiency setup, together with 12 interferometric filters of about 10 nm linewidth at half maximum; the spectrum and optical power was measured using an OceanOptics HR4000CG spectrometer. 3. Computational details The ground state geome-trical structures of the protonated and deprotonated forms of the dye were optimized using the Density Functional Theory [22] with the hybrid B3LYP exchange-correlation functional [23] and the 6-31G(d) basis set [24]. Optical absorption spectra of all MY-10 derived species, including the lowest 20 singlet-singlet excitations, were simulated using the Time Dependent-DFT (TD-DFT) method [25] with the 6-31+G(d) [24] basis set augmented with diffuse functions for more accurate electronic energies. Solvent effects in ethanol were taken into account by employing the non-equilibrium conductor-like polarizable continuum model (C-PCM) [26]. All calculations were performed with the GAUSSIAN 03 package [27]. 4 Results and discussion 4.1 Optical and electro-optical measurements Experimental electronic spectra of MY-10 solutions of the
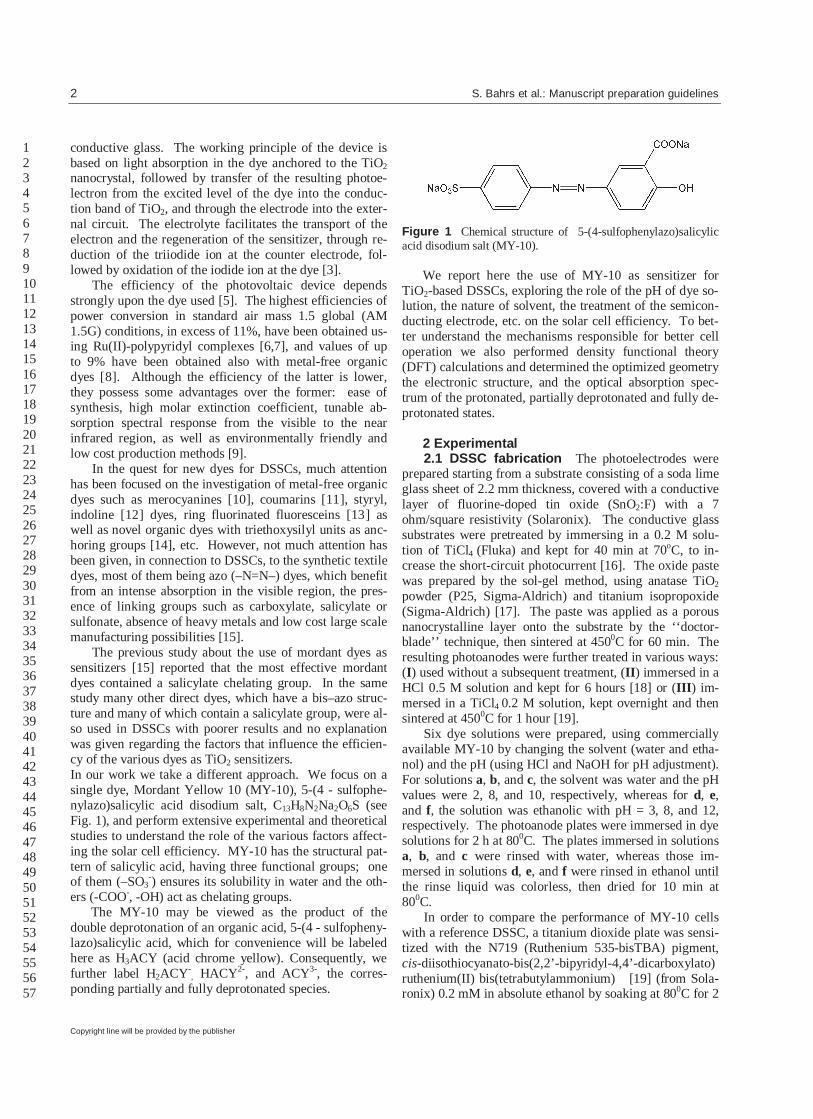
same concentration, 5 mM,in ethanol (d, e, f solutions) are presented in Fig. 2 for all three values of pH: 3, 8 and 12. It can be seen that when increasing the pH of the solution the absorption bands extend more from the UV towards the visible region of the spectrum. For instance, at pH = 12 the absoption band starts just below 550 nm, whereas at pH = 8 it starts below 500 nm, and at pH = 3 the first signifi-cant maximum lies below 400 nm. Based on UV-Vis spec-tra, given the weak absorption in the visible range for low and medium pH solutions, the best candidate for use in the fabrication of DSSC would be the dye in the alkaline solu-tion. We note that similar results regarding the depen-dence of the UV-Vis spectra on the pH of the dye solution have been obtained in the case of aqueous solutions of the MY-10 dye (a-c solutions) [28]
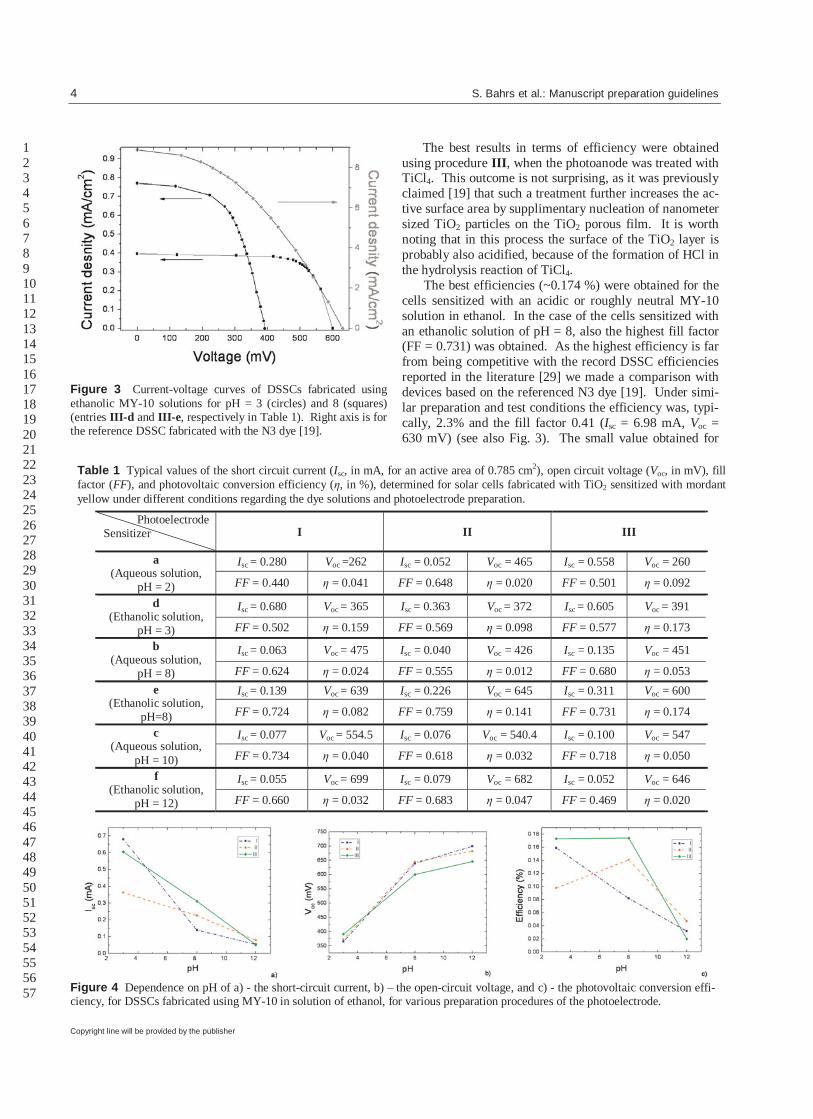
Figure 2 Experimental UV-Vis absorption spectra of MY-10 in ethanolic solutions of pH = 3, 8, and 12. The typical values resulting from the electro-optical measurements performed on DSSCs fabricated with dye solutions a-f using photoelectrodes I, II, and III are dis-played in detail in Table 1 and illustrated as I-V curves for a few cases of interest in Fig. 3. The first observation is that the values of the efficiencies are in most cases larger when ethanol is used instead of water as a solvent for the MY-10 dye. Concentrating on the results obtained for the ethanol solutions we note that some clear correlations can be drawn between the pH of the dye solution and the main re-sults obtained from the I-V curves (see Fig. 4). First, the short-circuit current consistently decreases with pH, re-gardless of the treatments performed during the fabrication of the photoelectrode. Second, the open-circuit voltage monotonically increases with pH, reaching relatively high values around 650 mV. Third, there is an overall correla-tion between the photovoltaic conversion efficiency and the pH of the dye solution in ethanol.
4 S. Bahrs et al.: Manuscript preparation guidelines
Copyright line will be provided by the publisher
1 2 3 4 5 6 7 8 9 10 11 12 13 14 15 16 17 18 19 20 21 22 23 24 25 26 27 28 29 30 31 32 33 34 35 36 37 38 39 40 41 42 43 44 45 46 47 48 49 50 51 52 53 54 55 56 57
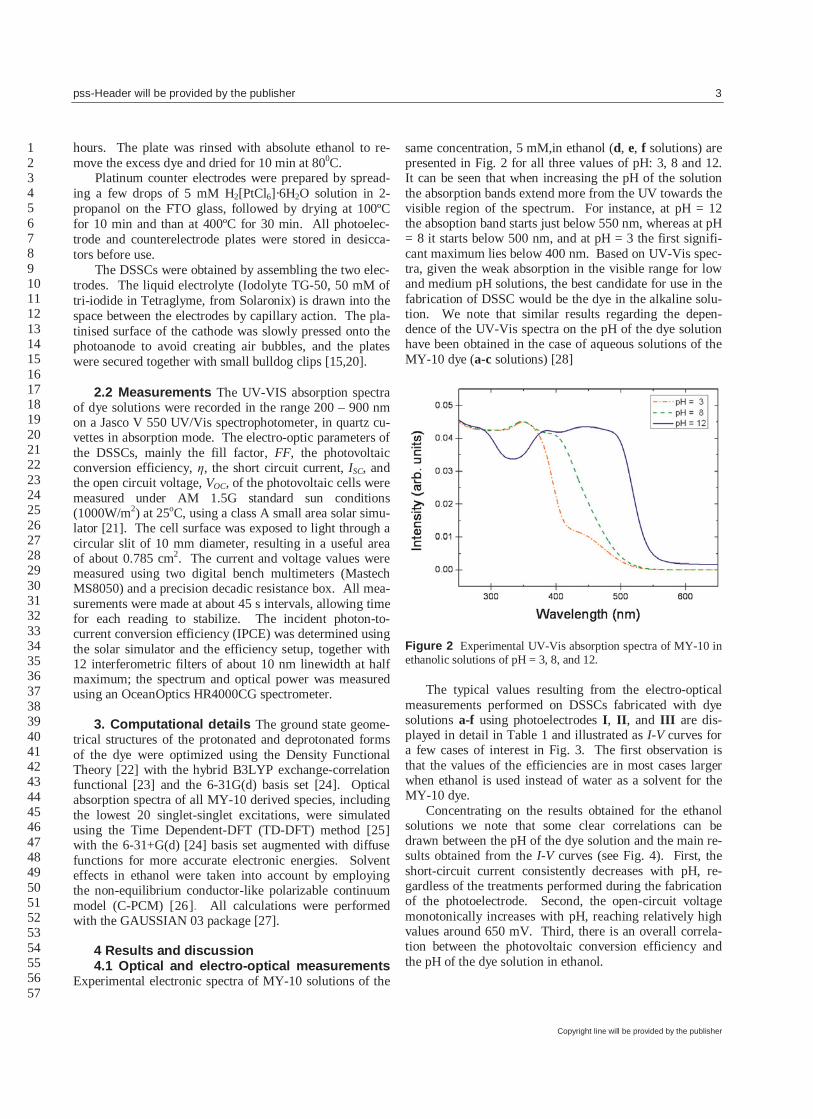
Figure 3 Current-voltage curves of DSSCs fabricated using ethanolic MY-10 solutions for pH = 3 (circles) and 8 (squares) (entries III-d and III-e, respectively in Table 1). Right axis is for the reference DSSC fabricated with the N3 dye [19].
The best results in terms of efficiency were obtained using procedure III, when the photoanode was treated with TiCl4. This outcome is not surprising, as it was previously claimed [19] that such a treatment further increases the ac-tive surface area by supplimentary nucleation of nanometer sized TiO2 particles on the TiO2 porous film. It is worth noting that in this process the surface of the TiO2 layer is probably also acidified, because of the formation of HCl in the hydrolysis reaction of TiCl4.
The best efficiencies (~0.174 %) were obtained for the cells sensitized with an acidic or roughly neutral MY-10 solution in ethanol. In the case of the cells sensitized with an ethanolic solution of pH = 8, also the highest fill factor (FF = 0.731) was obtained. As the highest efficiency is far from being competitive with the record DSSC efficiencies reported in the literature [29] we made a comparison with devices based on the referenced N3 dye [19]. Under simi-lar preparation and test conditions the efficiency was, typi-cally, 2.3% and the fill factor 0.41 (Isc = 6.98 mA, Voc = 630 mV) (see also Fig. 3). The small value obtained for
Table 1 Typical values of the short circuit current (Isc, in mA, for an active area of 0.785 cm2), open circuit voltage (Voc, in mV), fill factor (FF), and photovoltaic conversion efficiency (η, in %), determined for solar cells fabricated with TiO2 sensitized with mordant yellow under different conditions regarding the dye solutions and photoelectrode preparation.
Photoelectrode Sensitizer I II III
a (Aqueous solution,
pH = 2)
Isc = 0.280 Voc =262 Isc = 0.052 Voc = 465 Isc = 0.558 Voc = 260
FF = 0.440 η = 0.041 FF = 0.648 η = 0.020 FF = 0.501 η = 0.092
d (Ethanolic solution,
pH = 3)
Isc = 0.680 Voc = 365 Isc = 0.363 Voc = 372 Isc = 0.605 Voc = 391
FF = 0.502 η = 0.159 FF = 0.569 η = 0.098 FF = 0.577 η = 0.173
b (Aqueous solution,
pH = 8)
Isc = 0.063 Voc = 475 Isc = 0.040 Voc = 426 Isc = 0.135 Voc = 451
FF = 0.624 η = 0.024 FF = 0.555 η = 0.012 FF = 0.680 η = 0.053
e (Ethanolic solution,
pH=8)
Isc = 0.139 Voc = 639 Isc = 0.226 Voc = 645 Isc = 0.311 Voc = 600
FF = 0.724 η = 0.082 FF = 0.759 η = 0.141 FF = 0.731 η = 0.174
c (Aqueous solution,
pH = 10)
Isc = 0.077 Voc = 554.5 Isc = 0.076 Voc = 540.4 Isc = 0.100 Voc = 547
FF = 0.734 η = 0.040 FF = 0.618 η = 0.032 FF = 0.718 η = 0.050
f (Ethanolic solution,
pH = 12)
Isc = 0.055 Voc = 699 Isc = 0.079 Voc = 682 Isc = 0.052 Voc = 646
FF = 0.660 η = 0.032 FF = 0.683 η = 0.047 FF = 0.469 η = 0.020
Figure 4 Dependence on pH of a) - the short-circuit current, b) – the open-circuit voltage, and c) - the photovoltaic conversion effi-ciency, for DSSCs fabricated using MY-10 in solution of ethanol, for various preparation procedures of the photoelectrode.

pss-Header will be provided by the publisher 5
Copyright line will be provided by the publisher
1 2 3 4 5 6 7 8 9 10 11 12 13 14 15 16 17 18 19 20 21 22 23 24 25 26 27 28 29 30 31 32 33 34 35 36 37 38 39 40 41 42 43 44 45 46 47 48 49 50 51 52 53 54 55 56 57
the reference cells shows that further efforts should be made in order to optimize and control the fabrication.
As the UV-Vis spectra are strongly dependent on pH, we also investigated the effect of pH on the incident pho-ton-to-current conversion efficiency (IPCE), which deter-mines the ratio between the number of photons that gener-ate electrons in the external circuit and the number of inci-dent photons of monochromatic light. Figure 5 displays IPCE for the three MY-10 solutions in ethanol pH 3, 8 and 12. It can be seen that IPCE increases with decreasing pH, which is consistent with the pH variation of the short-circuit current. This result is not surprising, as Isc appears in the nominator of the IPCE.
The wavelength dependence of the IPCE shows very low efficiency in the red and green regions, with a strong increase below 500 nm. We note the apparent contradic-tion between the good absorption in the visible spectrum of the high pH sample and the low IPCE. This paradoxical result is confirmed by the efficiency values in Fig.4c. To solve this contradiction and better understand the mechan-isms responsible for higher DSSC efficiencies we at-tempted some theoretical calculations.
Figure 5 IPCE of MY-10 in ethanolic solutions of pH = 3, 8, and 12. 4.2 Theoretical calculations The geometrical structures of the protonated (H3ACY), partially deproto-nated (H2ACY- and HACY2-) and fully deprotonated (ACY3-) forms of the MY-10 dye were optimized for the singlet ground state. In the case of single deprotonation we removed H2 (which is more probable to adsorb on the semiconductor substrate [ 30 ]), whereas in the case of double deprotonation we considered the case of H1 and H2 removal, keeping in mind the correspondence to the origi-nal MY-10 disodium salt. Figure 6 displays the structures whereas Table 2 contains the main bond lengths and bond angles between atoms of the dye in each of the three spe-cies of the dye.
Figure 6 Optimized geometries of the MY-10 dye, calculated at DFT/B3LYP/6-31G* level for: (a) protonated (H3ACY), (b) par-tially deprotonated, H2 being removed (H2ACY-), (c) partially deprotonated, H1 and H2 being removed (HACY2-), and (d) fully deprotonated (ACY3-); atom labeling for Table 2 (e). Analyzing the results of the geometry optimization, particularly the τ1, τ2, and τ3 dihedral angles, we note that the two benzene rings are coplanar, regardless of the de-gree of deprotonation; moreover, the azo- group lies within the same plane. The dihedral angles τ4 and τ5 vary strongly from the fully protonated form, when the oxygen atoms lie in the plane, to the deprotonated forms when the –COO- group rotates as an entity by over 48o with respect to the plane of the molecule. The fact that O6 is located in or close to the plane of the molecule is revealed by the values close to 180o of τ6.
6 S. Bahrs et al.: Manuscript preparation guidelines
Copyright line will be provided by the publisher
1 2 3 4 5 6 7 8 9 10 11 12 13 14 15 16 17 18 19 20 21 22 23 24 25 26 27 28 29 30 31 32 33 34 35 36 37 38 39 40 41 42 43 44 45 46 47 48 49 50 51 52 53 54 55 56 57
The bond angles θ1 - θ6 have all values close to 120o,
consistent with an sp2 hybridization of the C and N atoms, indicating a proper conjugation along the molecule, which allows, as we shall see below, the delocalization of the π orbitals of the dye. The r2 and r3 bond lengths have oppo-site variations when the H2 proton is removed, r3 decreas-
ing by more than 0.1 Ǻ. When H3 is removed both r2 and r3 show a slight increase of about 0.01 Ǻ. The bond length r4 increases slightly when H2 is removed but, as expected, decreases more sharply when H3 is detached.
At the other end of the molecule, the behavior of the -SO3
- group when the proton is removed is revealed by the corresponding bond distances and bond angles. As ex-pected, in the fully protonated case, the largest S-O bond length is r5, with the oxygen atom bond to H1, whereas the smallest is r7. When H1 is removed the three distances are about the same, fact that is also valid for the fully deproto-nated species. Moreover, the bond angles θ7 – θ9 become equal upon removal of H1, the differences being still small at full deprotonation. The dihedral angle τ7 takes the al-most 90o value only after the H1 proton is detached. The differences between τ7 and τ8 as well as between τ7 and τ9 is about 110o, revealing the distortion caused by the presence of H1, and about 120o when the dye is deproto-nated.
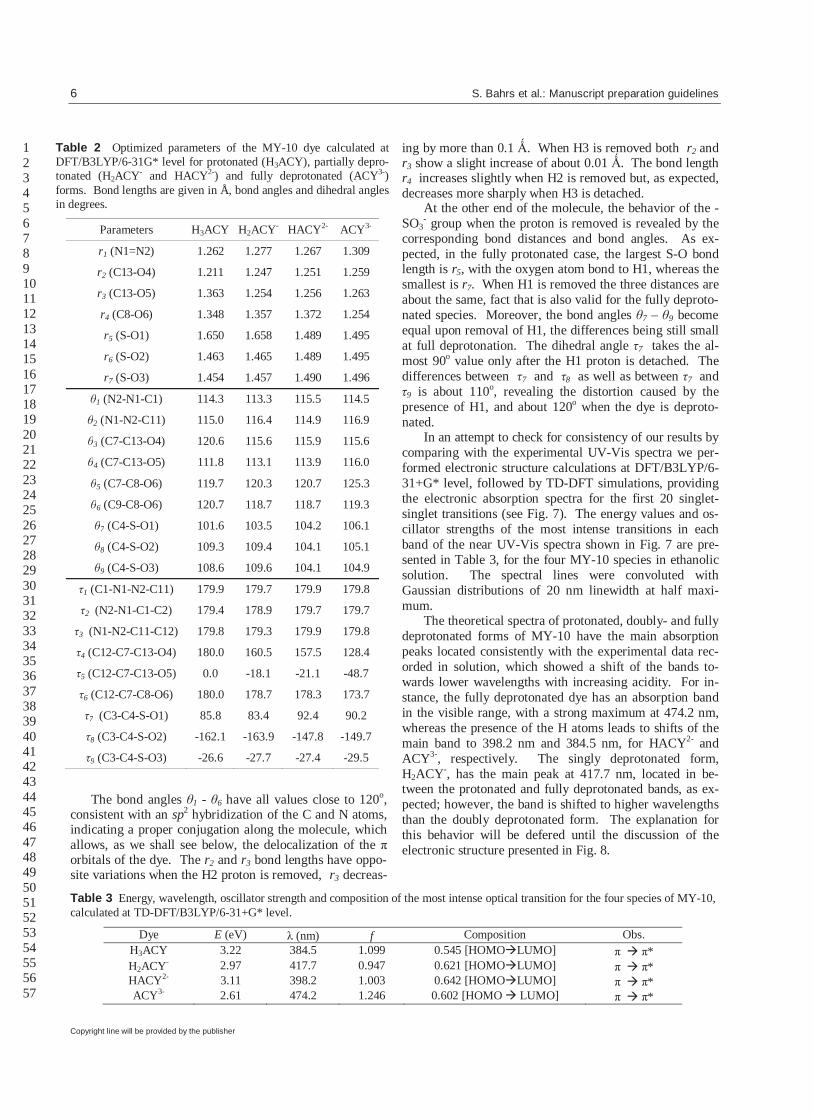
In an attempt to check for consistency of our results by comparing with the experimental UV-Vis spectra we per-formed electronic structure calculations at DFT/B3LYP/6-31+G* level, followed by TD-DFT simulations, providing the electronic absorption spectra for the first 20 singlet-singlet transitions (see Fig. 7). The energy values and os-cillator strengths of the most intense transitions in each band of the near UV-Vis spectra shown in Fig. 7 are pre-sented in Table 3, for the four MY-10 species in ethanolic solution. The spectral lines were convoluted with Gaussian distributions of 20 nm linewidth at half maxi-mum.
The theoretical spectra of protonated, doubly- and fully deprotonated forms of MY-10 have the main absorption peaks located consistently with the experimental data rec-orded in solution, which showed a shift of the bands to-wards lower wavelengths with increasing acidity. For in-stance, the fully deprotonated dye has an absorption band in the visible range, with a strong maximum at 474.2 nm, whereas the presence of the H atoms leads to shifts of the main band to 398.2 nm and 384.5 nm, for HACY2- and ACY3-, respectively. The singly deprotonated form, H2ACY-, has the main peak at 417.7 nm, located in be-tween the protonated and fully deprotonated bands, as ex-pected; however, the band is shifted to higher wavelengths than the doubly deprotonated form. The explanation for this behavior will be defered until the discussion of the electronic structure presented in Fig. 8.
Table 2 Optimized parameters of the MY-10 dye calculated at DFT/B3LYP/6-31G* level for protonated (H3ACY), partially depro-tonated (H2ACY- and HACY2-) and fully deprotonated (ACY3-) forms. Bond lengths are given in Å, bond angles and dihedral angles in degrees.
Parameters H3ACY H2ACY- HACY2- ACY3-
r1 (N1=N2) 1.262 1.277 1.267 1.309
r2 (C13-O4) 1.211 1.247 1.251 1.259
r3 (C13-O5) 1.363 1.254 1.256 1.263
r4 (C8-O6) 1.348 1.357 1.372 1.254
r5 (S-O1) 1.650 1.658 1.489 1.495
r6 (S-O2) 1.463 1.465 1.489 1.495
r7 (S-O3) 1.454 1.457 1.490 1.496
θ1 (N2-N1-C1) 114.3 113.3 115.5 114.5
θ2 (N1-N2-C11) 115.0 116.4 114.9 116.9
θ3 (C7-C13-O4) 120.6 115.6 115.9 115.6
θ4 (C7-C13-O5) 111.8 113.1 113.9 116.0
θ5 (C7-C8-O6) 119.7 120.3 120.7 125.3
θ6 (C9-C8-O6) 120.7 118.7 118.7 119.3
θ7 (C4-S-O1) 101.6 103.5 104.2 106.1
θ8 (C4-S-O2) 109.3 109.4 104.1 105.1
θ9 (C4-S-O3) 108.6 109.6 104.1 104.9
τ1 (C1-N1-N2-C11) 179.9 179.7 179.9 179.8
τ2 (N2-N1-C1-C2) 179.4 178.9 179.7 179.7
τ3 (N1-N2-C11-C12) 179.8 179.3 179.9 179.8
τ4 (C12-C7-C13-O4) 180.0 160.5 157.5 128.4
τ5 (C12-C7-C13-O5) 0.0 -18.1 -21.1 -48.7
τ6 (C12-C7-C8-O6) 180.0 178.7 178.3 173.7
τ7 (C3-C4-S-O1) 85.8 83.4 92.4 90.2
τ8 (C3-C4-S-O2) -162.1 -163.9 -147.8 -149.7
τ9 (C3-C4-S-O3) -26.6 -27.7 -27.4 -29.5
Table 3 Energy, wavelength, oscillator strength and composition of the most intense optical transition for the four species of MY-10, calculated at TD-DFT/B3LYP/6-31+G* level.
Dye E (eV) λ (nm) f Composition Obs. H3ACY 3.22 384.5 1.099 0.545 [HOMO LUMO] π π* H2ACY- 2.97 417.7 0.947 0.621 [HOMO LUMO] π π* HACY2- 3.11 398.2 1.003 0.642 [HOMO LUMO] π π* ACY3- 2.61 474.2 1.246 0.602 [HOMO LUMO] π π*
pss-Header will be provided by the publisher 7
Copyright line will be provided by the publisher
1 2 3 4 5 6 7 8 9 10 11 12 13 14 15 16 17 18 19 20 21 22 23 24 25 26 27 28 29 30 31 32 33 34 35 36 37 38 39 40 41 42 43 44 45 46 47 48 49 50 51 52 53 54 55 56 57
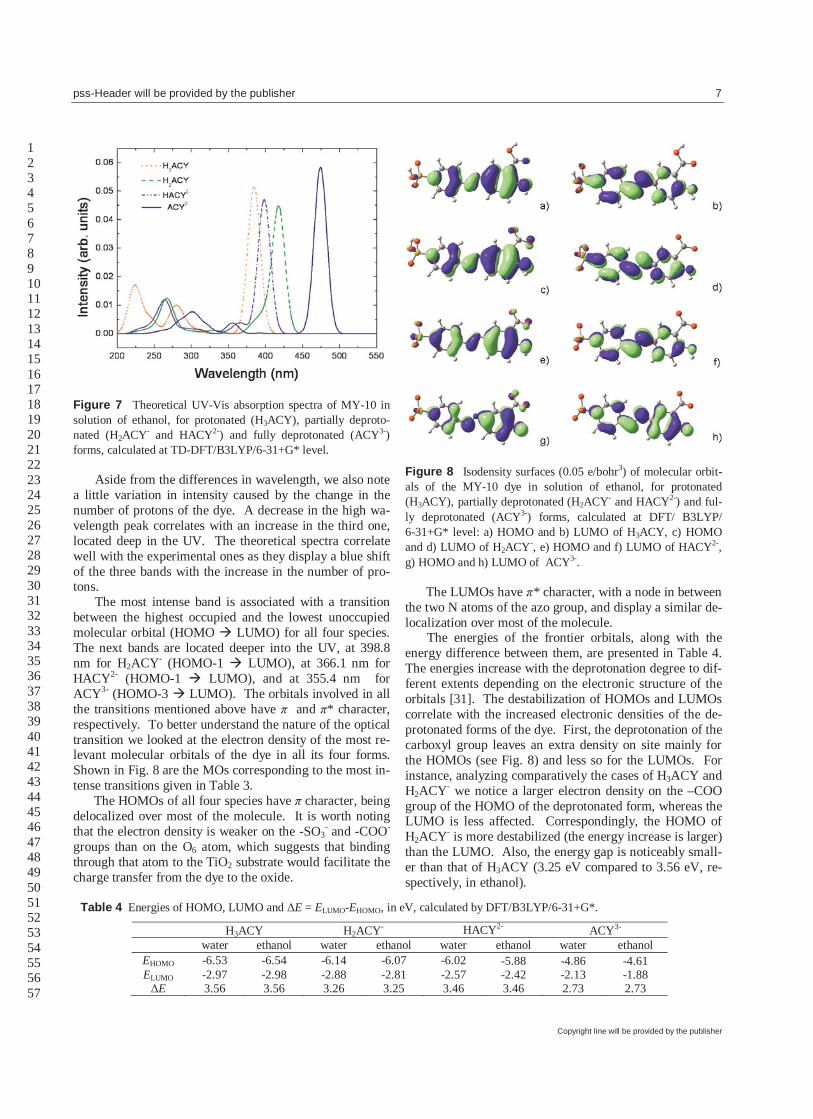
Figure 7 Theoretical UV-Vis absorption spectra of MY-10 in solution of ethanol, for protonated (H3ACY), partially deproto-nated (H2ACY- and HACY2-) and fully deprotonated (ACY3-) forms, calculated at TD-DFT/B3LYP/6-31+G* level.
Aside from the differences in wavelength, we also note a little variation in intensity caused by the change in the number of protons of the dye. A decrease in the high wa-velength peak correlates with an increase in the third one, located deep in the UV. The theoretical spectra correlate well with the experimental ones as they display a blue shift of the three bands with the increase in the number of pro-tons.
The most intense band is associated with a transition between the highest occupied and the lowest unoccupied molecular orbital (HOMO LUMO) for all four species. The next bands are located deeper into the UV, at 398.8 nm for H2ACY- (HOMO-1 LUMO), at 366.1 nm for HACY2- (HOMO-1 LUMO), and at 355.4 nm for ACY3- (HOMO-3 LUMO). The orbitals involved in all the transitions mentioned above have π and π* character, respectively. To better understand the nature of the optical transition we looked at the electron density of the most re-levant molecular orbitals of the dye in all its four forms. Shown in Fig. 8 are the MOs corresponding to the most in-tense transitions given in Table 3. The HOMOs of all four species have π character, being delocalized over most of the molecule. It is worth noting that the electron density is weaker on the -SO3
- and -COO- groups than on the O6 atom, which suggests that binding through that atom to the TiO2 substrate would facilitate the charge transfer from the dye to the oxide.
Figure 8 Isodensity surfaces (0.05 e/bohr3) of molecular orbit-als of the MY-10 dye in solution of ethanol, for protonated (H3ACY), partially deprotonated (H2ACY- and HACY2-) and ful-ly deprotonated (ACY3-) forms, calculated at DFT/ B3LYP/ 6-31+G* level: a) HOMO and b) LUMO of H3ACY, c) HOMO and d) LUMO of H2ACY-, e) HOMO and f) LUMO of HACY2-, g) HOMO and h) LUMO of ACY3-. The LUMOs have π* character, with a node in between the two N atoms of the azo group, and display a similar de-localization over most of the molecule.
The energies of the frontier orbitals, along with the energy difference between them, are presented in Table 4. The energies increase with the deprotonation degree to dif-ferent extents depending on the electronic structure of the orbitals [31]. The destabilization of HOMOs and LUMOs correlate with the increased electronic densities of the de-protonated forms of the dye. First, the deprotonation of the carboxyl group leaves an extra density on site mainly for the HOMOs (see Fig. 8) and less so for the LUMOs. For instance, analyzing comparatively the cases of H3ACY and H2ACY- we notice a larger electron density on the –COO group of the HOMO of the deprotonated form, whereas the LUMO is less affected. Correspondingly, the HOMO of H2ACY- is more destabilized (the energy increase is larger) than the LUMO. Also, the energy gap is noticeably small-er than that of H3ACY (3.25 eV compared to 3.56 eV, re-spectively, in ethanol).
Table 4 Energies of HOMO, LUMO and ΔE = ELUMO-EHOMO, in eV, calculated by DFT/B3LYP/6-31+G*.
H3ACY H2ACY- HACY2- ACY3- water ethanol water ethanol water ethanol water ethanol
EHOMO -6.53 -6.54 -6.14 -6.07 -6.02 -5.88 -4.86 -4.61 ELUMO -2.97 -2.98 -2.88 -2.81 -2.57 -2.42 -2.13 -1.88 ΔE 3.56 3.56 3.26 3.25 3.46 3.46 2.73 2.73
8 S. Bahrs et al.: Manuscript preparation guidelines
Copyright line will be provided by the publisher
1 2 3 4 5 6 7 8 9 10 11 12 13 14 15 16 17 18 19 20 21 22 23 24 25 26 27 28 29 30 31 32 33 34 35 36 37 38 39 40 41 42 43 44 45 46 47 48 49 50 51 52 53 54 55 56 57
Second, the deprotonation of the sulphonic group is af-fecting the electronic structure of the HOMO, pulling the charge density towards the –SO3 group, but even more the LUMO, which has an extra nodal plane between sulfur atom and the bonding phenyl ring. In the case of the doub-ly deprotonated form, HACY2-, the LUMO is more desta-bilized than the HOMO and, consequently, the energy gap increases (3.46 eV).
Finally, the proton removal from position H3 leads to an increase of electronic density on the salicylic group for both HOMO and LUMO. The electron density increase is larger for the HOMO, due to the higher density on the sali-cylic acid, compared to the LUMO, which is more evenly delocalized on both rings. Consequently, we obtain for ACY3- the smallest energy difference between the excited and ground states (2.73 eV), consistent with the experi-mentally observed red-shift of the main absorption band of the alkaline solution (see Fig. 2).
In summary, the results of the TD-DFT theoretical cal-culations regarding the electronic spectra in ethanolic solu-tions are consistent with the experimental data, indicating strong absorption in the visible range for the fully deproto-nated dye, which corresponds to the alkaline solution (with pH = 12), for which the efficiency was the lowest. To solve the contradiction between the optical absorption spectra, recommending the alkaline solution in ethanol, and the efficiency determinations, which gave poorest re-sults for the alkaline dye, we need to keep in mind other requirements for the dyes used in DSSCs. For instance, the strength and the type of the bonding of the dye to the TiO2 nanoparticle affects both the mechanical adherence and the transfer of the electron from the dye to the cluster [32]. The proper alignment of the energy levels of the oxide, the dye and the electrolyte plays a crucial role in the
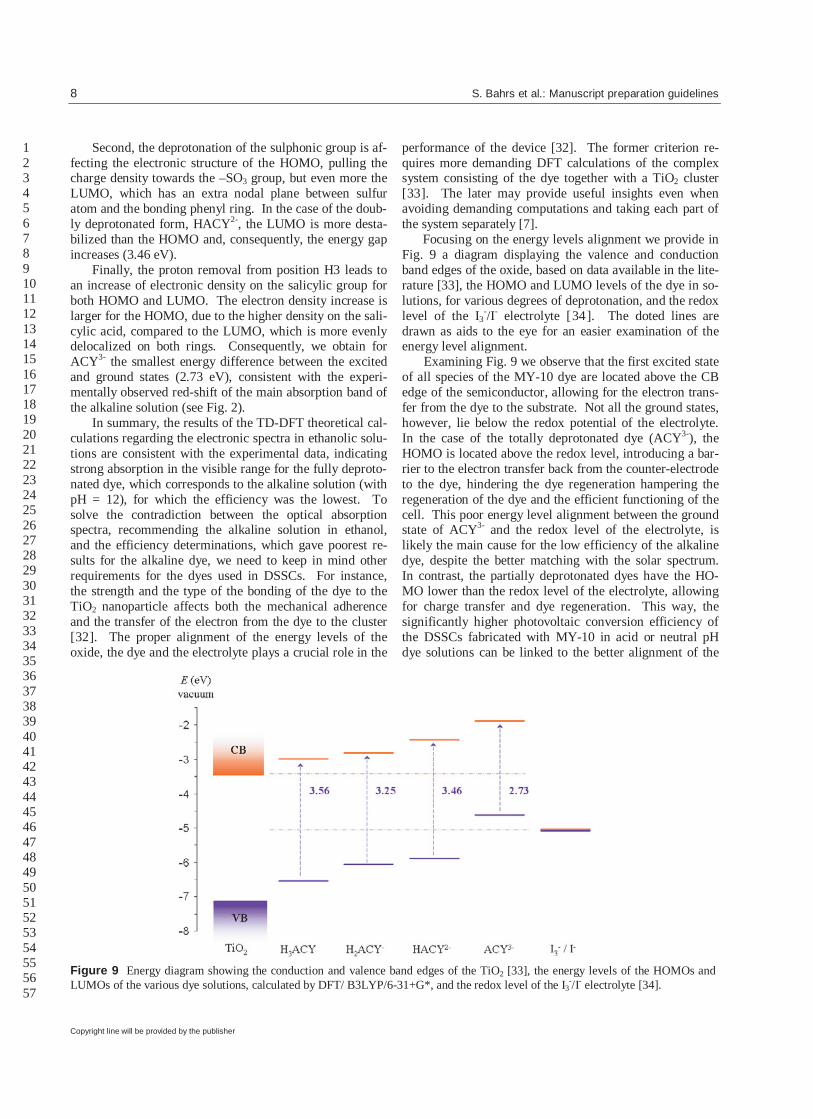
performance of the device [32]. The former criterion re-quires more demanding DFT calculations of the complex system consisting of the dye together with a TiO2 cluster [33]. The later may provide useful insights even when avoiding demanding computations and taking each part of the system separately [7]. Focusing on the energy levels alignment we provide in Fig. 9 a diagram displaying the valence and conduction band edges of the oxide, based on data available in the lite-rature [33], the HOMO and LUMO levels of the dye in so-lutions, for various degrees of deprotonation, and the redox level of the I3
-/I- electrolyte [34]. The doted lines are drawn as aids to the eye for an easier examination of the energy level alignment.
Examining Fig. 9 we observe that the first excited state of all species of the MY-10 dye are located above the CB edge of the semiconductor, allowing for the electron trans-fer from the dye to the substrate. Not all the ground states, however, lie below the redox potential of the electrolyte. In the case of the totally deprotonated dye (ACY3-), the HOMO is located above the redox level, introducing a bar-rier to the electron transfer back from the counter-electrode to the dye, hindering the dye regeneration hampering the regeneration of the dye and the efficient functioning of the cell. This poor energy level alignment between the ground state of ACY3- and the redox level of the electrolyte, is likely the main cause for the low efficiency of the alkaline dye, despite the better matching with the solar spectrum. In contrast, the partially deprotonated dyes have the HO-MO lower than the redox level of the electrolyte, allowing for charge transfer and dye regeneration. This way, the significantly higher photovoltaic conversion efficiency of the DSSCs fabricated with MY-10 in acid or neutral pH dye solutions can be linked to the better alignment of the
Figure 9 Energy diagram showing the conduction and valence band edges of the TiO2 [33], the energy levels of the HOMOs and LUMOs of the various dye solutions, calculated by DFT/ B3LYP/6-31+G*, and the redox level of the I3
-/I- electrolyte [34].
pss-Header will be provided by the publisher 9
Copyright line will be provided by the publisher
1 2 3 4 5 6 7 8 9 10 11 12 13 14 15 16 17 18 19 20 21 22 23 24 25 26 27 28 29 30 31 32 33 34 35 36 37 38 39 40 41 42 43 44 45 46 47 48 49 50 51 52 53 54 55 56 57
ground state of the dye with the redox level of the electro-lyte.
We also notice that the low device efficiency even for the partially deprotonated MY-10 is very likely related to the weak optical absorption in the visible range of these species, as shown by both the experimental and theoretical UV-Vis spectra. The poor matching with the sun spectrum keeps the efficiency an order of magnitude lower than that of the typical dyes widely used in DSSCs [6-8].
Taking the analysis further, we note that the LUMO is closest to the TiO2 conduction band edge for the neutral, fully protonated dye (H3ACY). Moreover, the monotonic increase of the LUMO energy with the degree of deproto-nation correlates well with the decrease of the short-circuit current with the pH of the solution (see Fig. 4a). One possible explanation of this effect may be the hindering of the charge injection from the excited state of the dye to the conduction band of the oxide when the energy difference between the two grows larger. The importance of the good matching between the electron donor (excited dye) and the acceptor (semiconductor conduction band) in order for in-jection to occur at a sufficiently rapid rate was previously mentioned by other authors [35] but the restrictions regard-ing the energy step [36] have not been analyzed in detail. In our results, the increase of the energy step from 0.46 eV (for H3ACY) to 1.02 eV (for HACY2-) leads to a drop of Isc of about one half. The decrease is even more dramatic in the case of the totally deprotonated dye but in that case the charge injection is probably reduced also by the slow regeneration of the sensitizer due to the misalignment with the redox level of the electrolyte, as discussed above.
Unlike the short-circuit current, the open-circuit vol-tage increases with pH, as we observed in Fig. 4b. This re-sult is not surprising, as it is well known [35] that any im-provement in the ISC is bound to cause a decrease of VOC. The open-circuit voltage is the difference between the qua-si-Fermi energy level of the system consisting of the TiO2 nanoparticles and the SnO2:F transparent conducting oxide, on which the TiO2 porous layer is deposited, and the elec-trochemical potential of the electrolyte [34,36,37,38]. The increase of VOC with pH has been previously observed [39,40] and it was shown [41] that the anchoring groups of the sensitizer that contain protons, upon adsorption trans-fers most of its protons to the TiO2 surface, charging it po-sitively, and thereby the Fermi level moves down. The electric field associated with the surface dipole generated in this fashion enhances the adsorption of the dye and as-sists electron injection from the excited state of the sensi-tizer into the titania conduction band, favoring higher pho-tocurrents. However, the shift downwards of the Fermi level decreases the gap between the redox couple and the Fermi level, resulting in lower open-circuit potential [41]. The theoretical results show small differences (within 0.25 eV) in the HOMO and LUMO energies for the two solvents, water and ethanol, regardless of acidity, with higher values in the case of ethanol (see Table 4). Experi-
mentally, however, the conversion efficiencies are consis-tently better in the case of ethanol; similarly, in most cases both ISC and VOC are larger when using ethanol instead of water (see Table 1). We are exploring various possible ex-planations for this behavior and the issue will be addressed elsewhere [28].
5. Conclusions We reported results of combined experimental and theoretical studies of dye-sensitized solar cells using mordant yellow -10, as TiO2 sensitizer. Expe-rimentally, we measured the UV-Vis spectra and we fabri-cated DSSCs using the MY-10 dye in solutions of water and ethanol of various values of pH, with different prepa-ration conditions for the photoelectrode, in order to deter-mine the conditions for best photovoltaic conversion effi-ciency. We found that the efficiency, measured under standard AM 1.5G conditions, was small (up to 0.174%) but the fill factor was high (up to 0.73). Puzzling was the fact that of the dyes in ethanol, the alkaline solution, which showed the best matching with the solar spectrum, dis-played the lowest IPCE and the lowest overall efficiency. We also observed that the short-circuit current decreases with pH whereas the open-circuit voltage increases with pH. Moreover, the treatment of the photoelectrode plays an important role on the overall efficiency, best results be-ing obtained when post-processing the plate with TiCl4.
To better understand the large differences in the over-all photovoltaic conversion efficiency between the dyes, we performed DFT calculations providing the structure, electronic properties and electronic spectra of the dye in fully protonated, partially deprotonated and totally depro-tonated forms, in solution. The calculated optical spectra are consistent with the experimental data, with strong ab-sorption in the visible range only for the alkaline, fully de-protonated dye. The three major electronic bands, ob-served regardless of pH, were assigned to π π* transi-tions between the HOMO and the LUMO of the dye.
The comparison between the theoretical and the expe-rimental results showed that the overall low device effi-ciency is very likely related to the weak optical absorption in the visible range and, consequently, to poor matching with the solar spectrum. Furthermore, we were able to ex-plain the experimental results based on the energy level alignment with respect to the TiO2 substrate and the elec-trolyte. The much higher photovoltaic conversion effi-ciency of the DSSCs fabricated with the dye solution of neutral or even low pH is caused, likely, by the better alignment of the HOMO of the dye with the redox level of the electrolyte, allowing the electron transfer and, thus, the regeneration of the sensitizer.
The decrease with pH of the short-circuit current was linked to the weaker charge injection from the excited state of the dye to the conduction band of the oxide, as the ener-gy of the LUMO moves higher with respect to the CB edge of the semiconductor when pH is increased. The increase of the open-circuit voltage with pH was associated with the
10 S. Bahrs et al.: Manuscript preparation guidelines
Copyright line will be provided by the publisher
1 2 3 4 5 6 7 8 9 10 11 12 13 14 15 16 17 18 19 20 21 22 23 24 25 26 27 28 29 30 31 32 33 34 35 36 37 38 39 40 41 42 43 44 45 46 47 48 49 50 51 52 53 54 55 56 57
increase in the conduction band edge of TiO2 in a more al-kaline environment.
If we were to make a hierarchy of some of the main criteria required of a dye to be used in a DSSC, based on our study, we suggest that the first condition to be met is the proper binding to the oxide. The lack of anchoring groups that could allow the adsorption to the semiconduct-ing substrate prevents any use in photovoltaic cells. Sec-ond is the appropriate energy level alignment between the excited state of the dye and the conduction band edge of the oxide as well as between the ground state of the pig-ment and the redox level of the electrolyte. Lack of align-ment (as is the case with ACY3-) leads to poor efficiency. The third requirement is related to the matching of the ab-sorption spectrum with the solar irradiation spectrum. Al-though they show energy level alignment, H2ACY- and HACY2- still lead to small photovoltaic conversion effi-ciencies because of poor absorption in the high wavelength region of the visible spectrum. A forth criterion is related to the electron transfer probability (once the energetics of the process are met). The transfer is more likely when the electron of the excited state of the dye is more localized towards the substrate and when the overlap between that orbital and the crystalline orbital of the TiO2 semiconduc-tor is high.
Our study reveals the relative importance of the vari-ous criteria required of the sensitizing pigments, DFT be-ing a powerful tool in understanding the mechanisms re-sponsible for DSSC operation, providing the experimental-ist with useful insight for designing better materials for more efficient devices.
Acknowledgements C.I. Oprea acknowledges the finan-
cial support from CNCSIS/UEFISCSU grant code PN2-RU-PD-603/2010
References
[1] D. Ginley, M.A. Green, R. Collins, MRS Bulletin 33, 355
(2008). [2] S.E. Shaheen, D.S. Ginley, and G.E. Jabbour, MRS Bulletin
30, 10 (2005). [3] B. O’Regan, M. Grätzel, Nature 353, 737 (1991); M.
Grätzel, Nature 414, 338 (2001). [4] C. Bechinger, S. Ferrere, A. Zaban, J. Sprague, B.A. Gregg,
Nature 383, 608 (1996); G. Phani, G. Tulloch, D. Vittorio, I. Skryabin, Renew. Energy 22, 303 (2001); K.-S. Ahn, S.J. Yoo, M.-S. Kang, J.-W. Lee, Y.-E. Sung, J. Power. Sources 168, 533 (2007); R. Baetens, B.P. Jelle, A. Gustavsen, Sol. Energy Mater. Sol. Cells 94, 87 (2010).
[5] M. Gratzel, Inorg. Chem. 44, 6841 (2005); M.K. Nazeerud-din, S.M. Zakeeruddin, J.-J. Lagref, P. Liska, P. Comte, C. Barolo, G. Viscardi, K. Schenk, M. Graetzel, Coord. Chem. Rev. 248, 1317 (2994), N. Robertson, Angew. Chem. Int. Ed. 45, 2338 (2006); N. Robertson, Angew. Chem. Int. Ed. 47, 1012 (2008).
[6] M. K. Nazeeruddin, P. Pechy, T. Renouard, S. M. Zakeerud-
din, R. Humphry-Baker, P. Comte, P. Liska, L. Cevey, E. Costa, V. Shklover, L. Spiccia, G. B. Deacon, C. A. Bignoz-zi, M. Gratzel, J. Am. Chem. Soc. 123, 1613 (2001).
[7] M. K. Nazeeruddin, F. De Angelis, S. Fantacci, A. Selloni, G. Viscardi, P. Liska, S. Ito, T. Bessho, M. Gratzel, J. Am. Chem. Soc. 127, 16835 (2005).
[8] T. Horiuchi, H. Miura, K. Sumioka, S. Uchida, J. Am. Chem. Soc. 126, 12218 (2004); S. Ito, S. M. Zakeeruddin, R. Humphry-Baker, P. Liska, R. Charvet, P. Comte, M. K. Nazeeruddin, P. Pechy, M. Takata, H. Miura, S. Uchida, M. Gratzel, Adv. Mater. 18, 1202 (2006); S. Hwang, J. H. Lee, C. Park, H. Lee, C. Kim, C. Park, M.-H. Lee, W. Lee, J. Park, K. Kim, N.-G. Park, C. Kim, Chem. Commun. 4887 (2007).
[9] A. Mishra, M.K.R. Fischer, P. Bauerle, Angew. Chem. Int. Ed. 48, 2474 (2007).
[10] K. Sayama, S. Tsukagoshi, K. Hara, Y. Ohga, A. Shinpou, Y. Abe, S. Suga, H. Arakawa, J. Phys. Chem. B 106 (2002) 1363; K. Sayama, S. Tsukagoshi, T. Mori, K. Hara, Y. Ohga, A. Shinpou, Y. Abe, S. Suga, H. Arakawa, Sol. Energy Mater. Sol. Cells 80, 47 (2003).
[11] K. Hara, T. Sato, R. Katoh, A. Furube, Y. Ohga, A. Shinpo, S. Suga, K. Sayama, H. Sugihara, H. Arakawa, J. Phys. Chem. B 107, 597 (2003); Z.-S. Wang, Y. Cui, Y. Dan-oh, C. Kasada, A. Shinpo, K. Hara J. Phys. Chem. C 112, 17011 (2008).
[12] S. Ito, S.M. Zakeeruddin, R. Humphry-Baker, P. Liska, R. Charvet, P. Comte, M.K. Nazeeruddin, P. Péchy, M. Takata, H. Miura, S. Uchida, M. Grätzel, Adv. Mater. 18, 1202 (2006); D. Kuang, S. Uchida, R. Humphry-Baker, S.M. Zakeeruddin, M. Gratzel, Angew. Chem. Int. Ed. 47, 1923 (2008).
[13] K. Funabiki et al., Journal of Fluorine Chemistry 127, 257 (2006).
[14] C. Baik, D. Kim, M. S. Kang, S. O. Kang, J. Ko, M. K. Nazeeruddin, M. Grätzel, J. Photochem. Photobiol. A: Che-mistry 201, 168 (2009).
[15] K.R. Millington, K,W. Fincher, A.L. King, Sol. Energy Ma-ter. Sol. Cells 91, 1618 (2007); K. R. Millington, K. W. Fincher, A. L. King, Photoelectric materials and photo-voltaic cells, PCT/AU2006/001369.
[16] S. Ito, P. Chen, P. Comte, M.K. Nazeeruddin, P. Liska, P. Pechy, M. Gratzel, Prog. Photovolt: Res. Appl. 15, 603 (2007).
[17] U. Opara Krasovec, M. Berginc, M. Hocevar, M. Topic, Sol. Energy Mater. Sol. Cells 93, 379 (2009).
[18] D. Zhang et al., J. Photochem. Photobiol. A: Chemistry 195, 72 (2008).
[19] M. K. Nezeeruddin, A. Kay, I. Rodicio, R. Humphry-Baker, E. Muller, P. Liska, N. Vlachopoulos, M. Gratzel, J. Am. Chem. Soc. 115, 6382 (1993).
[20] G. P. Smestad, M Gratzel, J. Chem. Educ. 75, 752 (1998). [21] A. Georgescu, G. Damache, M. A. Gîrţu, J. Optoelectron.
Adv. Mater. 10, 2996 (2008). [22] P. Hohenberg and W. Kohn, Phys. Rev. 136, B864 (1964);
W. Kohn, L.J. Sham, Phys. Rev. A, 140, 1133 (1965); R. G. Parr, W. Yang, Density-Functional Theory of Atoms and Molecules (Oxford University Press, New York, 1989).
[23]. A.D. Becke, J. Chem. Phys. 98, 5648 (1993); C. Lee, W. Yang, R.G. Parr, Phys. Rev. B, 37, 785 (1988).
pss-Header will be provided by the publisher 11
Copyright line will be provided by the publisher
1 2 3 4 5 6 7 8 9 10 11 12 13 14 15 16 17 18 19 20 21 22 23 24 25 26 27 28 29 30 31 32 33 34 35 36 37 38 39 40 41 42 43 44 45 46 47 48 49 50 51 52 53 54 55 56 57
[24] V. A. Rassolov, M. A. Ratner, J. A. Pople, P. C. Redfern,
and L. A. Curtiss, J. Comp. Chem. 22, 976 (2001). [25] E. Runge and E.K.U. Gross, Phys. Rev. Lett. 52, 997 (1984);
M.A.L. Marques, C.A. Ullrich, F. Nogueira, A. Rubio, K. Burke, and E.K.U. Gross (eds.), Time-Dependent Density Functional Theory (Springer-Verlag, 2006)
[26] V. Barone, M. Cossi, J. Phys. Chem. A 102, 1995 (1998); J. Tomasi, B. Mennucci, R. Cammi, Chem. Rev. 105, 1999 (2005).
[27] Gaussian 03, Revision C.02, M. J. Frisch, G. W. Trucks, H. B. Schlegel, G. E. Scuseria, M. A. Robb, J. R. Cheeseman, J. A. Montgomery, Jr., T. Vreven, K. N. Kudin, J. C. Burant, J. M. Millam, S. S. Iyengar, J. Tomasi, V. Barone, B. Mennuc-ci, M. Cossi, G. Scalmani, N. Rega, G. A. Petersson, H. Na-katsuji, M. Hada, M. Ehara, K. Toyota, R. Fukuda, J. Hase-gawa, M. Ishida, T. Nakajima, Y. Honda, O. Kitao, H. Na-kai, M. Klene, X. Li, J. E. Knox, H. P. Hratchian, J. B. Cross, V. Bakken, C. Adamo, J. Jaramillo, R. Gomperts, R. E. Stratmann, O. Yazyev, A. J. Austin, R. Cammi, C. Pomel-li, J. W. Ochterski, P. Y. Ayala, K. Morokuma, G. A. Voth, P. Salvador, J. J. Dannenberg, V. G. Zakrzewski, S. Dap-prich, A. D. Daniels, M. C. Strain, O. Farkas, D. K. Malick, A. D. Rabuck, K. Raghavachari, J. B. Foresman, J. V. Ortiz, Q. Cui, A. G. Baboul, S. Clifford, J. Cioslowski, B. B. Ste-fanov, G. Liu, A. Liashenko, P. Piskorz, I. Komaromi, R. L. Martin, D. J. Fox, T. Keith, M. A. Al-Laham, C. Y. Peng, A. Nanayakkara, M. Challacombe, P. M. W. Gill, B. Johnson, W. Chen, M. W. Wong, C. Gonzalez, and J. A. Pople, Gaus-sian, Inc., Wallingford CT, 2004.
[28] A. Dumbravă, C.I. Oprea, I. Enache, J. Lungu, A. Georges-cu, M.A. Gîrţu, to be published
[29] M.A. Green, K. Emery, Y. Hishikawa, W. Warta, Prog. Photovolt: Res. Appl. 18, 144 (2010).
[30] Y.-X. Weng, L. Li, Y. Liu, L. Wang, G.-Z. Yang, J. Phys. Chem. B 107, 4356 (2003).
[31] F. de Angelis, S. Fantacci, A. Selloni, Chem. Phys. Lett. 389, 204 (2004).
[32] J. Lungu, C.I. Oprea, A. Dumbravă, I. Enache, A. Georgescu, C. Rădulescu, I. Ioniţă, G.V. Cimpoca, M.A. Gîrţu, J. Optoelectron. Adv. Mater. 12, 1969 (2010).
[33] F. de Angelis, S. Fantacci, A. Selloni, Nanotechnology 19, 424002 (2008).
[34] L.M. Peter, J. Phys. Chem. C 111, 6601 (2007). [35] T.W. Hamann, R.A. Jensen, A.B.F. Martinson, H. Van
Ryswyk, J.T. Hupp, Energy Environ. Sci. 1, 66 (2008); S. A. Haque, E. Palomares, B. M. Cho, A. N. M. Green, N. Hirata, D. R. Klug and J. R. Durrant, J. Am. Chem. Soc. 127, 3456 (2005).
[36] J. Nelson, J. Kirkpatrick, P. Ravirajan, Phys. Rev. B 69, 035337 (2004).
[37] S. Y. Huang, G. Schlichthorl, A. J. Nozik, M. Gratzel, A. J. Frank, J. Phys. Chem. B 101, 2576 (1997).
[38] J. Ferber, J. Luther, J. Phys. Chem. B 105, 4895 (2001). [39] G. Redmond, D. Fitzmaurice, J. Phys. Chem. 97, 1426
(1993); S. G. Yan, J. T. Hupp, J. Phys. Chem. 100, 6867 (1996);
[40] M.K. Nazeeruddin, R. Humphry-Baker, P. Liska, M. Gratzel J. Phys. Chem. B 107, 8981 (2003); C.-Y. Chen, H.-C. Lu, C.-G. Wu, J.-G. Chen, K.-C. Ho, Adv. Funct. Mater. 17, 29 (2007).
[41] S. Ruhle, M. Greenshtein, S.-G. Chen, A. Merson, H. Pizem,
C.S. Sukenik, D. Cahen, A. Zaban, J. Phys. Chem. B 109, 18907 (2005).