Dye-sensitized Solar Cells: Improving Lifetime Stability and ...
272
Dye-sensitized Solar Cells: Improving Lifetime Stability and Performance Dissertation presented to the Faculty of Engineering of the University of Porto for obtaining the degree of Doctor in Chemical and Biological Engineering by José Miguel Lopes Maçaira Nogueira Adélio Miguel Magalhães Mendes, Full Professor – Supervisor Luísa Manuela Madureira Andrade Silva, Assistant Researcher – Co-supervisor Department of Chemical Engineering, Faculty of Engineering, University of Porto, Portugal 2016
-
Upload
khangminh22 -
Category
Documents
-
view
4 -
download
0
Transcript of Dye-sensitized Solar Cells: Improving Lifetime Stability and ...

Dye-sensitized Solar Cells: Improving
Lifetime Stability and Performance
Dissertation presented to the Faculty of Engineering of the University of Porto
for obtaining the degree of
Doctor in Chemical and Biological Engineering
by
José Miguel Lopes Maçaira Nogueira
Adélio Miguel Magalhães Mendes, Full Professor – Supervisor
Luísa Manuela Madureira Andrade Silva, Assistant Researcher – Co-supervisor
Department of Chemical Engineering,
Faculty of Engineering, University of Porto, Portugal
2016


This work was partially financially supported by: Project POCI-01-0145-FEDER-
006939 (Laboratory for Process Engineering, Environment, Biotechnology and Energy
– LEPABE) funded by FEDER funds through COMPETE2020 - Programa
Operacional Competitividade e Internacionalização (POCI) – and by national funds
through FCT – Fundacao para a Ciencia e a Tecnologia through the Ph.D. grant
SFRH/BD/80449/2011, under the Programme POCH/FSE.
© José Miguel Lopes Maçaira Nogueira, 2011-2016
Laboratory for Process Engineering, Environment, Biotechnology and Energy
University of Porto – Faculty of Engineering
Rua Dr. Roberto Frias s/n, 4200-465 Porto
Portugal


Agradecimentos / Acknowledgements
A minha primeira palavra de agradecimento vai para a pessoa que me convenceu a
embarcar nesta aventura, o meu orientador, Professor Adélio Mendes. Agradeço o seu
apoio, motivação, ensinamentos e amizade. Deixo-lhe uma palavra de apreço e de
reconhecimento pela sua enorme capacidade de trabalho, competência e perseverança.
Obrigado pela sua disponibilidade e por me ter providenciado condições de trabalho
excepcionais. Agradeço também à minha co-orientadora, Doutora Luísa Andrade, pelo
apoio e disponibilidade que sempre demonstrou. Obrigado pelas discussões úteis e
interessadas, pelos conhecimentos transmitidos, pela sua enorme capacidade de gestão
e pela confiança que sempre demonstrou em mim. Deixo ainda uma palavra de
reconhecimento aos meus orientadores pela forma como sempre liberaram a minha
criatividade. O sucesso deste trabalho também dependeu em grande parte de ambos.
Agradeço e reconheço ainda ao Prof. Joaquim Mendes a sua participação essencial nos
projectos SolarSel e WinDSC, em particular a selecção da fonte laser utilizada no
processo de selagem.
Agradeço à Efacec (Energias Renováveis), parceira dos projectos SolarSel e WinDSC,
por ter assumido o risco de investir em I&D. Durante dois anos foi local de trabalho e
uma escola. Em particular deixo uma palavra de apreço ao Eng. Nuno Delgado, Eng.
Luis de Pessoa Santos, e Eng. Fernando Vaz. Uma palavra especial ao Eng. Nelson
Marques, ao Sr. Zé e ao Sr. Jorge pela disponibilidade que sempre demonstraram em
ajudar, particularmente na instalação eléctrica da LaserBox.
Um agradecimento especial ao Eng. Fernando Ribeiro, colega de trabalho na Efacec.
Parceiro de equipa que rapidamente se tornou num fiel amigo. Obrigado pela tua
tempestuosidade e teimosia, causa de profundas discussões técnicas, científicas,
filosóficas, políticas e religiosas. Uma combinação improvável que resultou num
trabalho puro de equipa e que permitiu a optimização do processo de selagem.
Reconheço aqui a tua enorme capacidade técnica e grandíssima dedicação ao projecto
SolarSel.

Queria também agradecer aos (muitos!) colegas de trabalho do grupo de investigação
“Solar” (LEPABE, FEUP) liderado pelo Prof. Adélio Mendes, cujo trabalho se
desenvolve na UPTEC ‒ Centro de Inovação. Este é um grupo ímpar, multidisciplinar
e em constante crescimento onde o ambiente descontraído e condições de trabalho são
propícias à excelência dos projectos de I&D.
Aos meus amigos da FEUP pelo companheirismo de sempre, pelos bons momentos
passados e pela amizade! Ao João Carneiro, Diana Olariu, Ali Emami, João Silva,
Paula Dias, João Mendes, Sara Paula, André Santos, André Maia, Marta Pimenta, Ana
Duarte, António Leal, Ricardo Teixeira e Isabel Gomes. Aos meus amigos alfacinhas,
João Robalo e Joana Do Vale pelos momentos inesquecíveis que passamos nestes anos,
pela cumplicidade e amizade! Aos meus amigos de Espinho, Godinho, Hugo, Jonathan,
Mário e Miguel. Amigos de sempre e para sempre! Nestes últimos anos a dedicação
aos respectivos trabalhos retirou-nos tempo de convívio, mas não o brilho especial de
quando nos juntamos.
Um agradecimento especial à minha família. Fazer parte dela é um privilégio e uma
responsabilidade. Obrigado pelos momentos especiais, pelos pilares e valores
inabaláveis que têm passado de geração em geração. Uma palavra especial ao Jaime e
Marisa, pelas tertúlias com vista de mar que duram até de manhã! Obrigado Tio pelas
conversas profundas e intensas! Pelas vivências partilhadas! Um obrigado também à
Leonor por nos fazeres trabalhar num futuro melhor. Aos meus sogros, Helena Doutel
e Luis Costa pelo apoio constante, pela amizade e pelos bons momentos passados.
Aos meus pais, Fernando Nogueira e Maria de Lurdes Maçaira, por serem uma
referência de vida, pelo vosso apoio incondicional. Tudo o que sou hoje se deve a
vocês. Ao meu irmão, Pedro Maçaira Nogueira, por cresceres comigo, pela
cumplicidade, pela personalidade e pelo apoio. Parceiro para a vida!
Por fim, à minha mulher Erica Doutel Costa, o amor da minha vida. Obrigado por seres
como és, única! Obrigado por partilhares a tua vida comigo.
A todos que, de uma forma ou de outra, contribuíram para o atingir de mais um
objectivo. O meu sincero e humilde obrigado!

To my lovely wife


Preface
In September 2011 Prof. Adélio Mendes (FEUP) challenged me for developing a glass-
to-glass laser sealing by applying his idea of what we later named of scan pattern. This
technology was applied to dye-sensitized solar cells, and then what became by being an
optimization work evolved into my PhD thesis. This dissertation is submitted for the
degree of Doctor of Philosophy at University of Porto – Faculty of Engineering
(FEUP). The present work was developed in Laboratory for Process Engineering,
Environment, Biotechnology and Energy (LEPABE), at the Chemical Department of
FEUP, and at the facilities of EFACEC in Maia. The work was supervised by Professor
Adélio Mendes and co-supervised Dr. Luísa Andrade from LEPABE‒FEUP.
From this PhD work resulted the publication of 5 scientific articles and 1 international
patent. 1 more scientific article is under revision.


Contents Dye-sensitized Solar Cells: Improving Lifetime
Stability and Performance
Abstract xiii
Resumo xiv
Abbreviations and Symbols xvi
Chapter 1. Introduction 1
1.1 Dye Sensitized Solar Cells: Operating principles & State of the art 7
1.2 Nanostructured photoelectrodes 11
1.2.1 Electron transport in nanostructure photoelectrodes 12
1.2.2 1-D nanostructures 14
1.2.3 3-D hierarchically ordered nanostructures 20
1.2.4 3-D template based backbones 24
1.2.5 Hybrid TiO2/Graphene nanostructures 34
1.2.6 Outlook for high performance photoelectrode 38
1.3 Long term stability of DSCs 40
1.4 Scope of the thesis 42
Acknowledgements 43
References 43

viii Contents
Chapter 2. Development and Optimization of a laser sealing
process for DSC devices 55
2.1 Introduction 57
2.2 Materials and methods 58
2.2.1 Glass frit sealant 58
2.2.2 Glass paste thermal conditioning 60
2.2.3 LaserBox equipment 62
2.2.4 Sealing Procedure 64
2.2.5 Thermal cycling tests 64
2.2.6 Leak and shear stress tests 65
2.2.7 DSC performance characterization 67
2.3 Results and Discussion 68
2.3.1 Response surface methodology 68
2.3.2 Process Modeling 69
2.3.3 Influence of the operation conditions 71
2.3.4 Temperature history during the laser sealing process 72
2.3.5 SEM and elemental analysis 74
2.3.6 Leak and shear stress tests 77
2.4 Integration of the laser assisted process in the fabrication of DSCs 78
2.4.1 Sealing process influence on performance of DSC devices 81
2.5 Conclusions 85
Acknowledgments 86
References 86

Contents ix
Chapter 3. Laser Sealed Dye-Sensitized Solar Cells: Efficiency
and long term stability analysis 89
Abstract 91
3.1 Introduction 92
3.2 Material and Methods 93
3.2.1 Laser sealed DSC fabrication 93
3.2.2 I-V and EIS characterization 95
3.2.3 Accelerated ageing tests 95
3.3 Results and Discussion 97
3.3.1 Photovoltaic performance 97
3.3.2 Electrochemical impedance spectroscopy 100
3.4 Conclusions 104
Acknowledgements 105
References 105
Chapter 4.Temperature Role in the Recombination Reaction
on Dye-Sensitized Solar Cells 107
Abstract 109
4.1 Introduction 110
4.2 Material and Methods 112
4.2.1 Laser sealed DSCs and half-cell fabrication 112
4.2.2 Experimental Setup 115
4.3 Results and Discussion 119
4.3.1 Temperature influence in DSC performance 119
4.3.2 Recombination and DSC performance as a function of the temperature 130
4.4 Conclusions 138
Acknowledgements 138
References 139

x Contents
Chapter 5. Modeling, Simulation and Design of Dye-
Sensitized Solar Cells 143
Abstract 145
5.1 Introduction 146
5.2 Modeling 149
5.3 Experimental 157
5.3.1 Dye sensitized solar cell preparation 157
5.4 Results and Discussion 158
5.4.1 Current-potential characteristics 158
5.4.2 Influence of recombination in DSCs 160
5.4.3 Interpretation of recombination in charge extraction experiments 167
5.4.4 Optimization of electrode thickness 171
5.5 Conclusions 177
Acknowledgements 178
References 178
Chapter 6. High efficient DSC photoelectrode using a SiO2
scaffold layer coated with a 3 nm TiO2 film 183
Abstract 185
6.1 Introduction 186
6.2 Materials and Methods 188
6.2.1 SiO2 scaffold film 188
6.2.2 TiO2 reaction mechanism in ALD 190
6.2.3 Dye sensitized solar cells fabrication 192
6.2.4 DSC performance characterization 193
6.3 Shrinking core model 193
6.4 Results and Discussion 199
6.4.1 Planar TiO2 ALD films 199

Contents xi
6.4.2 Three-dimensional SiO2/TiO2 ALD layer 201
6.4.3 Optical characterization of SiO2/TiO2 films 205
6.4.4 DSCs based on SiO2/TiO2 architecture 207
6.5 Conclusions 217
Acknowledgements 219
References 219
Chapter 7. Concluding Remarks and Outlook 223
7.1 Main Conclusions 225
7.2 Outlook for dye-sensitized solar cells 229
References 232
Appendix 233
A. Design of Experiments: Design matrix with coded and actual values 235
B. Developed LabVIEW control panel interfaces 236
C. Atomic layer deposition (ALD) process operation details 239
D. Estimation of minimum TIP pulse time for complete coverage of SiO2 scaffold layer
with TiO2 film 245
References 246


xiii
Abstract
Global energy demand is increasing rapidly and by 2030 it is projected that energy
consumption will grow 50 %. The Earth serious environmental problems dictate that
there is urgency in use clean, secure and affordable energy sources. Photovoltaic (PV)
energy is believed to meet these requirements, but up to now PV technology struggles
to economically compete with other energy sources. This work studies dye-sensitized
solar cells (DSCs), a technology that promises low cost PV energy generation. In
particular it addresses the two main bottlenecks that prevent DSC technology to
become a commercial alternative; these bottlenecks are lifetime stability and
performance.
Concerning stability, encapsulation was identified as critical to obtain stable DSC
devices. A new sealing process was developed based on laser assisted glass frit
melting. The feasibility of the laser sealing process is investigated and the operating
conditions were optimized for sealing DSCs. The sealed samples were subjected to
stringent encapsulation tests according to international standards. Accelerated ageing
was used to assess the lifetime stability of the laser sealed DSCs and compared with
the devices sealed using common polymer materials. The developed laser assisted
sealing allowed studying the temperature effect on DSCs performance, in a wide
temperature range between - 5 to 105 ºC. The activation energies for the recombination
reaction were determined and its dependence on the semiconductor/electrolyte
interfaces discussed.
Phenomenological modelling was used as a simulation tool to assess the two main
electrochemical processes that rule the DSC performance: electron transport and
recombination. The model was used to describe how transport and recombination
influence the solar cell efficiency and the optimum design of the photoelectrode (PE).
Finally, a new PE architecture was developed for increasing DSC efficiency. The
new architecture aimed at increasing the specific photoelectrode surface area, the
transparency and decreasing electron recombination. The developed PE is made of a
mesoporous SiO2 scaffold layer coated with a TiO2 film deposited by atomic layer
deposition (ALD). The parameters used at the ALD were optimized and the TiO2 film
thickness that originates the most efficient device determined. The new PE architecture
was compared with commercial TiO2 films, and future enhancements in DSC design
were discussed.


xv
Resumo
A procura global de energia está a aumentar rapidamente prevendo-se que até 2030
o seu consumo cresça 50 %. Os graves problemas ambientais do planeta reforçam a
urgência em encontrar fontes de energia limpas, seguras e economicamente viáveis.
Existe a espectativa de que a energia fotovoltaica (PV) possa cumprir estes requisitos,
mas até agora esta tem tido dificuldade em competir economicamente com outras
fontes de energia. Este trabalho foca-se no estudo de células solares sensibilizadas por
corante (DSCs), uma tecnologia que promete produção de energia elétrica a baixo
custo. São abordadas em particular as duas principais limitações que impedem que a
tecnologia DSC se torne uma alternativa comercialmente viável: estabilidade a longo
prazo e eficiência.
No que diz respeito à estabilidade, o encapsulamento das células foi identificado
como fundamental para a obtenção de dispositivos DSC estáveis a longo prazo. Foi
desenvolvido um novo processo de selagem baseado na fusão de vidro auxiliada por
laser. A viabilidade técnica do processo de selagem laser é investigada e as condições
de operação otimizadas. As amostras seladas foram submetidas a testes rigorosos de
encapsulação de acordo com normas internacionais. De forma a avaliar a estabilidade a
longo prazo da solução desenvolvida, foram realizados testes de envelhecimento
acelerado em células seladas a laser e em células seladas com o polímero normalmente
empregue.
O processo de selagem laser desenvolvido permitiu também estudar o efeito da
temperatura no desempenho das DSCs numa gama alargada de temperaturas entre -5 e
105 °C. As energias de ativação para a reação de recombinação foram determinadas e
foi analisada a sua dependência das interfaces semicondutor/eletrólito presentes na
célula solar.
De forma a avaliar os dois processos eletroquímicos que regem o desempenho das
células DSC, transporte e recombinação de eletrões, foi utilizado um modelo
fenomenológico como ferramenta de simulação. O modelo foi usado para descrever de
que forma os fenómenos de transporte e recombinação eletrónicos influenciam a
eficiência da célula solar e o design ótimo do seu fotoelétrodo (PE).
Por fim, foi desenvolvida uma nova arquitetura para o fotoelétrodo de forma a
aumentar a eficiência das DSCs. O novo PE visava aumentar a área de superfície

disponível, a transparência e diminuir a recombinação dos eletrões. O PE desenvolvido
é constituído por uma camada mesoporosa de SiO2 cuja superfície interna é coberta por
um filme fino de TiO2 depositado por camada atómica (ALD). Os parâmetros do
processo ALD foram otimizados e a influência da espessura do filme de TiO2 no
desempenho DSCs foi estudada e discutida. O novo PE é comparado com filmes de
TiO2 comerciais e foram discutidas implicações futuras no design das células DSC.

xvii
Abbreviations and Symbols
Abbreviation Definition Units
A active area of the solar cell m2
ALD atomic layer deposition
AM air mass
As specific superficial area m2·g
-1
BET Brunauer-Emmett-Teller
BHJ Barrett-Joyner-Halenda
BIPV building integrated photovoltaics
cµ chemical capacitance F
CCE double layer capacitance at the platinum/TCO interface. F
CE counter electrode
Ci concentration of species i M
CTCO/EL double layer capacitance at exposed TCO/electrolyte
interface F
Da dimensionless number (equivalent to Damkölher number)
Deff effective diffusion coefficient of electrons m2·s
-1
Di diffusion coefficient of species m2·s
-1
Dk Knudsen diffusivity m2·s
-1
dp pore size m
Dref reference diffusion coefficient m2·s
-1
DSC dye-sensitized solar cell
dSiO2 SiO2 nanoparticle diameter m
E energy J
E0
redox standard redox energy J
Ea activation energy eV
Ecb conduction band energy J
Ecbc corrected conduction band energy J
EDS energy-dispersive X-ray spectroscopy

xviii Abbreviations and Symbols
Ef Fermi energy J
Efeq dark equilibrium Fermi energy J
Eg bandgap energy J
EIS electrochemical impedance spectroscopy
EOC
redox open circuit redox energy J
Eredox redox energy J
F Faraday constant (F = 96 485,3399 C·mol‐1) C· mol‐
1
FF fill factor
FTO fluorine-doped Tin oxide
Gi generation rate of specie i m-3
·s-1
H Planck constant (h = 6.62606896×10⁻³⁴
J·s) J·s
HOMO highest occupied molecular orbital
I electric current A
Is incident photon flux m2·s
-1
J0 exchange current density at the counter electrode A·m-2
Ji current density of species i A·m-2
Jrec recombination current A·m-2
Jsc short circuit current density A·m-2
kB Boltzmann constant J·K-1
kr recombination reaction rate constant m-3(1-β)
·s-1
l position coordinate in the SiO2 mesoporous layer m
LAGF laser assisted glass frit
Lf thickness of the DSC mesoporous layer m
Ln electrons diffusion length m
LUMO highest unoccupied molecular orbital
MFC-C N2 flowrate in ALD vacuum chamber cm3·s-1
MFC-R N2 flowrate in ALD reactor cm3·s-1
NCB effective density of states in the TiO2 conduction band m-3
neq dark equilibrium electron density m-3
NHE normal hydrogen electrode

Abbreviations and Symbols xix
ni density of specie i m-3
Ni number of moles of specie i mol
NP nanoparticles
nref reference particle density m-3
P pressure atm
PCE power conversion efficiency %
PE photoelectrode
PV photovoltaic
q elementary charge (q = 1.60217646 × 10‐19
C) C
Qfrit quality of the glass frit sealing
Qi flux of specie i m-3
·s-1
R ideal gas constant (R = 8.314472 J· K−1
· mol−1
) J· K−1
· mol−1
Rc contact and wire series resistances Ω
Rce charge‐transfer resistance at the counter electrode Ω
Rext load parameter: external resistance Ω
Ri recombination rate of species i m-3
·s-1
Rk electron recombination resistance Ω
Rp shunt resistances Ω
Rseries external series resistances Ω
RTCO transparent conductive oxide sheet resistance Ω
RTCO/EL charge transfer resistance at exposed TCO/electrolyte
interface Ω
Rw electron transport resistance Ω
SEM scanning electron microscopy
STP standard conditions of temperature and pressure (273.15 K,
105 Pa)
T temperature K
t time s
TCO thin conductive oxide
Tg transition temperature K
TIP titanium isopropoxide

xx Abbreviations and Symbols
tpurge,i ALD purge time of component i
Ts softening temperature K
UV ultra-violet
Vcb conduction band potential V
Vcbc corrected conduction band potential V
Vext external cell potential V
Vf fermi level potential V
Vint internal cell potential V
Voc open-circuit potential V
wt. weight
X position coordinate in the TiO2 mesoporous layer m
X coded factors for the design matrix of the DOE
Xf coverage factor of SiO2 porous layer with TiO2 film %
Z’ real part of impedance Ω
Z’’ imaginary part of impedance Ω
Zd Warburg element of the Nernst diffusion of I3
-within
electrolyte Ω
Greek symbol Definition Units
γ coordinate of shrinking core position m
α wavelength-dependent absorption coefficient m-1
β recombination reaction order
Δti ALD pulse time of component i s
ΔVcb shift in the conduction band potential, V V
ΔVint variation of the applied potential, V V
ε porosity
ζ symmetry coefficient
η solar to energy conversion efficiency %
ηinj electron injection efficiency %
ηPt electrochemical overpotential at Pt electrode V
θ dimensionless time variable

Abbreviations and Symbols xxi
λ wavelength m
ξ tortuosity
ρi molar density of specie i mol·m-3
𝜏e− electron lifetime s
𝜏minp
minimum time required for the full coverage SiO2 porous
layer with TiO2 film s
𝜏tr electron transport time s
φ dimensionless number
ϕ dimensionless number (Equivalent to Thiele modulus)
ψ thermal expansion coefficient ºC-1
Superscript Definition
* dimensionless variable
0- external point of the current collector
0+ xx coordinate close to the photoanode
init initial conditions
p pulse
t total
Subscripts Definition
c+ cations
CB conduction band
CE counter electrode
e- electrons
ht high temperature
I− iodide
I3− triiodide
lt low temperature
MPP maximum power point
OC open-circuit
SC short-circuit
VB valence band


CHAPTER 1 Introduction
“The stone age didn’t end because they ran out of stones.”
Unknown author

Adapted from the peer-reviewed article
J. Maçaira, L. Andrade, and A. Mendes, Review on nanostructured photoelectrodes
for next generation dye-sensitized solar cells. Renewable and Sustainable Energy
Reviews, 2013. 27(0): p. 334-349.

1
Introduction
World energy consumption will increase 56 % before 2040 driven by the economic
growth and increasing population in developing countries and in emerging economies
such as China and India1 – Figure 1.1. Relatively high oil prices, as well as concerns
about the environmental impact of the fossil fuels combustion and strong government
incentives, have made the harvest of energy from renewable sources the fastest
growing energy source according to the International Energy Outlook of 20131.
Figure 1.1 a) World total energy consumption in OECD and non-OECD countries
and b) by fuel type, from 1990 with projections to 2040 (ordinate scale in quadrillion
Btu, equivalent to TJ) (adapted from International Energy Outlook 20131)

4 Introduction
Dye-sensitized Solar Cells: Improving Lifetime Stability and Performance
The total energy generation from renewable sources has increased 2.5 % per year
and it is expected to grow from 19 %, recorded in 2008, to 28 % in 20401 – Figure
1.2b). In particular, solar energy is the fastest growing segment of technologies for
harvest energy from renewable sources and photovoltaic (PV) market is expected to
grow up to 450 GW of installed capacity until 2019, according to the global market
outlook for solar power2 – Figure 1.2.
Figure 1.2 Solar PV cumulative market scenarios until 2019 (adapted from Global
market outlook for solar power 2015-2019 2)
Solar energy is the most abundant renewable energy source, and undoubtedly can
be regarded as safe, inexhaustible and reliable at a human scale. The total solar power
available to the planet Earth exceeds by a factor of 1500 the total human power
consumption3. There is huge economic potential in solar energy; however, it is highly
dependent on the cost of PV devices. Obviously the PV market evolution will make
use of the most competitive solar panels at the time, most likely the first generation
crystalline and polycrystalline silicon solar panels (c-Si). These devices at lab scale can
achieve up to 25 % sun to power conversion efficiency (PCE, η) and their recent
progressively lower prices reflects its industrial establishment that, undoubtedly, makes
use of the today’s semiconductor industry infrastructures. However, the high
production and environmental costs led to a constant progress in the development and
establishment of new PV technologies (Figure 1.3) aiming to avoid the drawbacks of

Chapter 1 5
Dye-sensitized Solar Cells: Improving Lifetime Stability and Performance
the c-Si solar panels. Some established semiconductor based technologies comprise
gallium arsenide tin film solar cells (GaAs, η ≈ 24 %), copper-indium-gallium-
(di)selenide (CIGS, η ≈ 20 %), cadmium-telluride (CdTe, η ≈ 17 %) and
amorphous/nanocrystalline silicon (η ≈ 10 %) solar cells4. This second generation of
thin film technologies have had an important role in the PV installation capacity up to
now5. However, they share the same performance and cost limitations as conventional
Si devices. After approximately 20 years of research and development, third generation
thin film solar devices are starting to emerge in the marketplace. This new generation
of photovoltaic systems includes semiconductor quantum dots (QDPV, η ≈ 6 – 10 %)6,
organic semiconductors (OPV, η ≈ 10 %) 4, 7
and dye sensitized solar cells (DSCs, η ≈
14 %)8. These new technologies benefit from their low processing costs and
environmental impact and thus short payback time when compared to the conventional
solar devices. At present stage, third generation PV technologies are still far behind the
efficiency values of the conventional Si-based solar cells (~ 20 %); nevertheless, the
promise of low processing costs and usage of available environmental-friendly raw
materials make them subject to an intensive research and development.
Figure 1.3 Best research solar cell efficiencies (courtesy of the National Renewable
Energy Laboratory, Golden, CO9).

6 Introduction
Dye-sensitized Solar Cells: Improving Lifetime Stability and Performance
Dye sensitized solar cells (DSCs) present themselves as a very promising
photovoltaic technology. They are made of cheap components that are non-toxic and
world-wide available and offer distinctive features such as semi-transparency, multi-
colour range possibilities, flexibility and lightweight applications, but also good
performance under low light conditions and different solar incident angles10-12
– Figure
1.4. These unique characteristics open a new possibility of applications and markets
where conventional solar devices will never be able to penetrate, e.g. low-power
consumer electronics, outdoor or indoor recreational and building integrated
photovoltaics (BIPV) applications. In fact, the DSC technology has recently been used
by several companies in showcase applications by Glass2Energy, DyePower,
Solaronix, Sony, Fujikura, Panasonic, G24i, Dyesol, 3G Solar and Toyota-Asin.
Figure 1.4. Glass façade composed by 300 m2 of dye-sensitized solar cells
demonstration modules in EPFL’s SwissTech Convention Center, Lausanne,
Switzerland (adapted from13
) .
However, for the DSC technology to become a competitive alternative to the
present PV technologies, major breakthroughs are necessary mainly concerning the
two critical aspects of any PV device: power conversion efficiency and lifetime.

Chapter 1 7
Dye-sensitized Solar Cells: Improving Lifetime Stability and Performance
Regarding the device lifetime, at least 25 years of constant power conversion
efficiency should be guaranteed for outdoor applications. This aspect has caught
researchers’ attention in order to enhance DSCs’ stability and thus many reports are
being published concerning improvements on the stability and new sealing methods14-
19. Then, several methods were proposed to enhance the efficiency of DSCs
20-23, being
one of the most promising the use of nanostructured materials as photoelectrodes to
enhance light harvesting and charge extraction to improve photocurrent, photovoltage
and fill factor.
1.1 Dye Sensitized Solar Cells: Operating principles & State of
the art
In 1991 O’Regan and Grätzel proposed the first bulk heterojuntion
photoelectrochemical solar cell with 7 % power conversion efficiency, taking
advantage of the three-dimensional TiO2 photoelectrode film and using a ruthenium
dye as sensitizer24
. DSCs mimic natural photosynthesis and differ from conventional p-
n junction devices because light collection and charge transport are separated in the
cell. Light absorption occurs in the chemisorbed sensitizer molecule, while electron
transport occurs in the semiconductor TiO2 - Figure 1.5.
Figure 1.5. Representation of the working principles of DSCs.

8 Introduction
Dye-sensitized Solar Cells: Improving Lifetime Stability and Performance
The photoelectrode is a mesoporous oxide layer composed of nanometer-sized
particles. Attached to the surface of the oxide is a monolayer of dye responsible for
light absorption. The optical absorbance that occurs in the dye molecules results in
excitation of an electron from the highest occupied molecular orbital (HOMO) to the
lowest unoccupied molecular orbital (LUMO)25
. The photogenerated electrons are
transferred to the conduction band of the semiconductor oxide and percolate through
the semiconductor network, being collected at the transparent conducting oxide. The
oxidized dye is regenerated by electron donation from the electrolyte solution
containing a redox couple, typically of iodide/triiodide. The triiodide ions formed in
the semiconductor’s surface during the redox reaction diffuse to the Pt-catalyzed
counter-electrode, where they are reduced back to iodide by the electrons from the
external circuit. The efficiency (η) of the solar cell is determined by its current-voltage
characteristics, specifically the open-circuit photovoltage (Voc), the photogenerated
current density measured under short-circuit conditions (Jsc), light irradiance (Is) and
the fill factor of the cell (FF), which depends on the series resistances and on the shunt
resistances in the cell26
:
𝜂 =𝐽sc𝑉oc𝐼s
FF (1.1)
The short-circuit photocurrent (Jsc) is essentially related to the amount of sunlight
harvested in the visible part of the solar spectrum by the sensitizer. Consequently, dye
molecules play a critical role in photon capture and for this reason the progress in
DSCs have been closely followed by the constant development of new porphyrin and
organic sensitizers that have high extinction coefficients and broader optical absorption
spectra. These have even supplanted the commonly used Ru(II) polypyridil sensitizers
in liquid but also in solid-state electrolyte DSCs14, 20, 27-35
.
The open-circuit voltage (Voc) is related to the energy difference between the quasi-
Fermi level of electrons in the semiconductor and the chemical potential of the redox
mediator in the electrolyte36
. The most common electrolyte in high performance DSCs
uses the triiodide/iodide (I3
-
/ I-
) redox couple27,37,38
. Despite the excellent results
achieved so far using this redox couple, it presents some drawbacks such as the
corrosion of several current collectors and partial absorption of visible light around 430

Chapter 1 9
Dye-sensitized Solar Cells: Improving Lifetime Stability and Performance
nm, resulting in a voltage loss39
. To mitigate these effects several alternatives have
been studied35, 40-43
. Good results have been reported using an amorphous organic hole-
transport material (HTM), spiro-OMeTAD (2,2’,7,7’-tetrakis(N,N-di-p-
methoxyphenyl-amine)9,9’-spirobifluorene)44
and cobalt based (Co (II/III)
tri(bypiridyl)) non-corrosive electrolyte. These new hole transport materials yielded
impressive results, reaching PCEs higher than 14 % and Voc of 1 V for liquid-state
DSCs and 7.2 % and 965 mV for solid-state devices 8,20,45-50
. Other materials like
processable p-type direct bandgap CsSnI3 semiconductor have been used very recently
for hole conduction, aiming to replace the liquid iodide/triiodide based electrolyte. This
hole conductor yielded record efficiencies of 8.5 % for solid state DSCs51
. A very
interesting and underexplored class of materials of organometallic halide pervoskite
have also been used as sensitizers in liquid electrolyte-based photoelectrochemical
cells with conversion efficiencies from 3.5 to 6.5 %52, 53
. These materials provide
excellent support for binding organic and inorganic components to form a molecular
composite that not only acts as a sensitized, but also as a hole and electron conductor.
Recently CsSnI3 perovskite was shown to be an efficient hole conductor in a solid state
DSC achieving 8.5 % efficiency51
. Another specific perovskite, a methylamonium lead
iodide chloride (CH3NH3PbI2Cl), was used as the light absorbing material in
conjunction with TiO2 as transparent n-type component and spiro-OMeTAD as p-type
hole conductor. The device achieved 8 % efficiencies54
. Interestingly, the authors
found out that by replacing the TiO2 by an insulating framework of Al2O3 the power to
conversion efficiency was improved to almost 11 %. Apparently the perovskite
material employed is a much better electron conductor than the TiO2, and the Al2O3
only acts as a “scaffold” to support and provide surface area for the perovkite to be
coated on. Other record-breaking work proposed an innovative platform that includes a
three dimensional nanocomposite and bilayer architecture with an inorganic-organic
hybrid heterojuntion55
: the use of TiO2 /CH3NH3PbI3 /polymeric HTMs / Au system
boosted efficiencies of solid state perovskites solar cells up to 20 %. Although this
devices have very high efficiencies, they have not yet proven stable enough for
commercialization56
.

10 Introduction
Dye-sensitized Solar Cells: Improving Lifetime Stability and Performance
The main processes in a DSC system are light absorption, charge injection,
electron transport and collection and electrolyte diffusion. Since 1991 most of the
improvements in DSCs efficiency have been achieved through major improvements in
molecular sensitizers and redox electrolytes57
. However, directly or indirectly all of
above mentioned phenomena strongly depend on the photoelectrode. In particular, the
two competing processes that rule the performance of a DSC are electron transport in
the mesoporous semiconductor and recombination losses in the
semiconductor/electrolyte interface58
. Both effects have been widely studied mainly
using electrochemical impedance spectroscopy (EIS) but there are challenges that still
remain particularly in the photoanode36,59-66
. Consequently new photoanode structure
models are needed to suppress electron recombination and to enhance light harvesting
but keeping the cell’s transparency characteristics.
The ideal photoelectrode should have a high surface area to ensure high dye
loading and efficient light harvesting. Even though a greater amount of electrons are
photogenerated, there is also a higher probability of electrons to recombine in the
interface semiconductor/electrolyte – dark current – since the pathway to get the
current collector is also higher. Thus, the electron transport in the photoelectrodes
plays a very important role in the electron collection efficiency since it directly
influences the dark current67
. The electron transport is essentially governed by a
diffusion mechanism and it is controlled by hoping phenomena limited by the low
conductivity of TiO2 nanoparticles and their multiple grain boundaries68
. Good
electrolyte diffusion should also be guaranteed in the photoelectrode; however liquid
electrolytes tend to have low viscosities, so its diffusion in the photoelectrode should
not be a performance-limiting process in DSCs.
Researchers have proposed several strategies to address the transport limiting
process, such as using bare 1-D nano-structures composed by TiO2, SnO, or ZnO to
increase electron mobility in the photoelectrode69,70
. Although these structures provide
direct pathways for electrons to reach the collecting substrate, the inefficient dye
adsorption of this type of structures do not generate enough electrons to produce high
photocurrents. A common-sense development was to mix high surface area
nanoparticles with high conductive 1-D structures and create hybrid photoelectrodes71
,

Chapter 1 11
Dye-sensitized Solar Cells: Improving Lifetime Stability and Performance
in a way they can benefit from the advantages of each structure. Other approach
consists in creating hierarchically ordered photoelectrodes with large aggregate
particles composed by smaller ones72-74
; this strategy aims to achieve high surface
areas, guaranteed by small particles, and efficient electrolyte diffusion, provided by
macropores created by the larger aggregates. These photoelectrodes benefit from a
good light scattering effect, resulting in high performance devices. Another interesting
approach was to use highly conductive host backbones to serve as charge extraction
support to the high surface area nanoparticles21,75,76
. The idea of having a 3-D TCO
collecting substrate has great potential because, if carefully optimized, it should be able
to create a DSC where every generated electron can be collected. Following this idea
of increasing the photoelectrode conductivity, graphene has also been used in
DSCs77-81
. Benefiting from its high electrical conductivity and having a work function
close to the one of TiO2 (4.42 - 4.5 eV vs. 4.5 eV, respectively), graphene should
enhance electron mobility and extraction in DSCs. These various approaches are
described and discussed below.
1.2 Nanostructured photoelectrodes
Nano science has opened the door to the development of new nanostructured
materials and concepts that were not available before82-85
. Nanostructures such as
nanoparticles83,86,87
, nanowires88-92
, nanotubes88,89,93-96
, nanorods97-99
and nanobelts100
have been developed in the last decade for use in an array of applications in
electronics, sensor devices, optoelectronics, photovoltaic and photocatalysis84
.
Nanomaterials can have very high specific surface areas even up to several hundred of
m2∙g
-1
101,102. Photoelectrodes of nanomaterials allow the adsorption of a large amount
of sensitizer molecules in a monolayer configuration; the dye coated area relates to the
photocurrent generated by the DSC device. Nanosize materials also affect the way
electrons are transported through the photoelectrode structure. Unlike p-n junction
solar cells, in DSCs there is no macroscopic electrostatic potential gradient in the film,
fact caused by the small size of the individual colloidal particles and by the presence of
concentrated electrolytes. This means that in the nanoparticle film the governing

12 Introduction
Dye-sensitized Solar Cells: Improving Lifetime Stability and Performance
electron transport process is diffusion, contrary to the drift process seen in p-n junction
solar cells for carrier separation in the presence of an electrical field25,103
.
The most common material found in DSC’s photoelectrode is anatase TiO2. This
commercial metal oxide has typically surface areas between 40-100 m2 and an electric
resistivity in the order of 1 to 10
2 Ω·cm
104, 105.
1.2.1 Electron transport in nanostructured photoelectrodes
The typical electron diffusion coefficient in TiO2 nanoparticle film, 5×10⁻⁵
cm2·s
-1,
is found to be several orders of magnitude below single crystal (bulk) values106-108
. The
higher electron mobility and diffusion coefficients in single crystals are related to their
higher electron concentrations (caused either by illumination or application of external
voltage)67,109
. The values determined for the electron diffusion coefficients point out
the fact that diffusion is much slower in nanostructured materials than in single
crystals; this is related to the multicrystalline nature of these structures that creates
electron traps and consequently limit the lifetime of the excited electrons67
. Although
still subject of some debate67,110,111
, it is generally accepted that electron transport
occurs by the combination of two phenomena: percolation through a network of sites
and thermal accessibility to energy states. Therefore, morphological parameters such as
porosity, surface area, pore size, particle diameter, shape and elemental crystal size and
orientation within the nanostructures have an important impact on the electron
diffusion coefficient but also in the energetic properties of the material, such as the
distribution of trap energy or electronic concentration.
The electron transport and recombination properties can be studied by several
techniques, including photocurrent/photovoltage transient techniques112,113
, intensity
modulated photocurrent spectroscopy (IMPS)/intensity modulated photovoltage
spectroscopy (IMVS)106,114
and by electrochemical impedance spectroscopy
(EIS)59,115
. In particular EIS is a powerful technique for investigating the kinetic
processes of DSCs. Electron transport and chemical potential in the semiconductor
film, electron recombination in the photoelectrode/electrolyte interface, charge transfer
at the counter electrode and the diffusion of the redox species in the electrolyte can be
well distinguished based on the impedance response of the system as a function of

Chapter 1 13
Dye-sensitized Solar Cells: Improving Lifetime Stability and Performance
frequency. Compared to the other techniques, EIS has the potential to allow obtaining
most parameters that reflect the kinetic processes of the device. Making use of the
Nyquist plots, the impedance data is fitted by an adequate equivalent circuit and the
electron transport and recombination properties parameters are estimated. From these
experiments three main parameters can be obtained: the recombination resistance, Rk,
transport resistance, Rw and chemical capacitance of the semiconductor Cμ. In this way
the electron diffusion length, 𝐿n, and the electron lifetime, 𝜏e− , can be determined by
using the following equations65
:
𝜏𝑒− = 𝑅k𝐶μ (1.2)
𝐿n = 𝐿f√𝑅k𝑅w
(1.3)
𝐿n = √𝜏n𝐷eff (1.4)
where Deff is the electron diffusion coefficient and 𝐿f is the semiconductor film
thickness. Combining eq.(1.2) and eq.(1.3) the effective diffusion coefficient of
electrons in the semiconductor can be determined by:
𝐷eff = (𝑅k𝑅w)(𝐿f2
𝜏n) (1.5)
Using the electron diffusion coefficient the electron transport time, 𝜏tr , can be
determined by116,117
:
𝜏tr =𝐿f2
𝐷eff (1.6)
This value indicates for how long an electron can percolate through the
semiconductor before recombining with electrolyte. Before the electrons can be
collected at the FTO substrate there is the possibility of recombination with the
electrolyte, so an electron collecting rate at the FTO substrate should be defined20
.
Based on the two processes that rule the performance of a DSC, recombination and
transport, a collection efficiency, ηcc, can be determined by118
:

14 Introduction
Dye-sensitized Solar Cells: Improving Lifetime Stability and Performance
𝜂cc =[−𝐿n𝛼 cosh (
𝐿f𝐿n) + sinh (
𝐿f𝐿n) + 𝐿n𝛼𝑒
−𝛼𝐿f] 𝐿n𝛼
(1 − 𝐿n2𝛼2)(1 − 𝑒−𝛼𝐿f) cosh (
𝐿f𝐿n)
(1.7)
where α is the photoelectrode film absorption coefficient.
1.2.2 1-D nanostructures
Considerable attention has been given to the fact that morphological features can
have a clear impact in the performance of photoelectrodes in dye-sensitized solar cells,
mainly in the electron transport effectiveness and the electron recombination with
electrolyte. Particular interest is given to 1-D nanostructures that are believed to
improve electron transport by providing direct pathways throughout the structure of the
photoelectrode to the collecting substrate. The so-called 1-D structures include
nanotubes, nanowires and nanofibers that can be composed by several metal oxide
materials such as TiO2 ZnO or SnO269,70
. Generally, these materials have higher
diffusion coefficients than non-ordered nanostructures and are meant to give electron
diffusion lengths larger than film thickness. These structures can be used directly as
photoelectrodes with dye molecules adsorbed in their surface – Figure 1.6 a) – or by
adding metal oxide nanoparticles to the 1-D structure – Figure 1.6 b). Table 1.1
presents the diffusion coefficients as well as the corresponding cell performance
characteristic values for several DSCs produced with photoelectrodes based on 1-D
nanostructures. The values presented in Table 1.1 show that 1-D nanostructures present
higher values of diffusion coefficients than nanoparticle based structures, meaning that
generated electrons can move and reach the collecting substrate faster. However the
overall DSC performance is far from the ones obtained using the conventional TiO2
nanoparticle film. This is mainly attributed to the comparatively low internal surface
area available for the adsorption of dye molecules.

Chapter 1 15
Dye-sensitized Solar Cells: Improving Lifetime Stability and Performance
Figure 1.6 a) Schematic of 1-D nanostructures with sensitizing dye adsorbed on the
surface; b) 1-D nanostructures decorated with semiconductor nanoparticles.
Table 1.1 1-D nanostructured DSC performance values and electron diffusion
coefficients.
1-D Nanostructure Ref.
Cell performance Diffusion
coefficient
η / % Jsc /
mA∙cm-2
Voc /
mV FF Deff / cm2∙s-1
N719 TiO2 NP 119 5.00 11.3 670 0.660 7.2×10⁻⁵
Mercurochrome-sensitized ZnO nanowire 119 0.84 3.40 500 0.490 1.8×10⁻³
Mercurochrome-sensitized ZnO nanowire/ NP
composite 119
2.20 6.30 610 0.580 2.1×10⁻⁴
TiO2 NP/nanotubes, 10 wt. % 71 3.10 8.33 630 0.600 7.1×10⁻⁴
TiO2 nanorods 120 0.56 2.22 575 0.440 3.3×10⁻⁷
TiO2 nanorods coated with ZnO nanoparticles 120 0.83 3.57 545 0.430 8.0×10⁻⁶
TiO2 nanorods coated with TiO2 nanoparticles 120 0.19 0.71 592 0.470 4.3×10⁻⁶
Kang et al.121
were one of the first authors to report good performance values with
semi-transparent DSCs using a photoelectrode composed only by nanotubes. They
produced nanotube arrays with external diameter of 295 nm, tube lengths of 6‒15 μm
and wall thickness of 21‒41 nm, respectively – Figure 1.7. The incorporation of this
material in a DSC configuration exhibited a Voc of 610 mV, a Jsc of 8.26 mA∙cm-2
and a
fill factor of 0.70, giving an overall power conversion efficiency of 3.5 %. Although
A B

16 Introduction
Dye-sensitized Solar Cells: Improving Lifetime Stability and Performance
these results are an improvement for nanotube-based DSC photoelectrodes, the TiO2
nanoparticle-based DSCs still presents higher performance. As mentioned earlier, the
low surface area of these types of 1-D nanotube arrays can explain the relatively low
efficiency of the corresponding DSC devices.
Figure 1.7 Field emission-SEM images TiO2 nanotubes 121
.
To overcome the low surface area that 1-D nanostructures have compared with
nanoparticle films, some researchers combined both structures in order to take
advantage of the benefits of each of them122,123
. Gan et al.123
created a hybrid structure
combining vertically aligned ZnO nanowires (NW) with TiO2 nanoparticles (NP)
attached. ZnO has similar band gap of 3.2 eV124
but electron mobility up to two orders
of magnitude higher than TiO2: (0.1 ‒ 4) cm2·(V·s)
-1 vs. 65 cm
2·(V·s)-1
at 25 ºC,
respectively70,105, 125-127
. This makes ZnO a particularly interesting metal oxide to
compete with TiO2 in DSCs. The high value of Deff of ZnO NW – based DSC
substantiates that the electrons injected from excited dye molecules can travel faster
and therefore are collected more efficiently - Figure 1.7. However, the low value of Jsc
in the bare ZnO electrode confirms the low surface area of these 1-D aligned
nanostructures. Incorporating TiO2 NPs with inherent high surface areas in the ZnO
nanowires, an increase in the current density from 1.60 to 3.54 mA∙cm-2
was obtained
by these authors. The hybrid cell revealed a Deff value of 6.92 × 10⁻⁴
cm2∙s
-1 that falls
between those of the bare ZnO film (2.8×10⁻³
cm2∙s
-1) and the TiO2 NP electrode (≈ 5 ×
10-5
cm2∙s
-1) ‒ Table 1.2. Actually, it is almost fifteen times larger than the Deff of TiO2
NP film, showing that the hybrid electrode combines the advantages of both structures:

Chapter 1 17
Dye-sensitized Solar Cells: Improving Lifetime Stability and Performance
improved electron transport along the vertically aligned nanowire array and increased
surface area provided by the TiO2 NP. Nevertheless, the performance of the hybrid cell
(2.2 %) is still far from the nanoparticle-based DSC (5 % in Table 1.1), mainly because
the surface area provided by the hybrid solution is still low compared to a similar
thickness film constituted only by nanoparticles. This fact was caused by the low
coverage of the nanowires with nanoparticles as shown in Figure 1.8 and Table 1.2, as
well as the low thickness of the hybrid photoanode (3 μm). Nonetheless, better results
can be expected if an optimization is performed to balance the ratio between the
vertically aligned structures and the quantity of nanoparticles attached to their surface.
Figure 1.8 SEM images of vertically aligned nanowires: (a) without and (b) with NP
attached to its surface 123
.
Table 1.2 DSC performance parameters and diffusion coefficients, correspondent to
devices using the photoelectrodes presented in Figure 1.8.
Electrode Jsc mA·cm2 Voc / mV FF η / % τ/ ms Deff / cm2·s-1
TiO2 NP 2.52×10⁻⁵
ZnO NW 1.60 610 0.40 0.390 84.0 2.80×10⁻³
ZnO NW/TiO2 NP 3.54 600 0.37 0.790 57.3 6.92×10⁻⁴
A common strategy to achieve high electron mobility but also high surface area is
blending 1-D nanostructures, such as TiO2 nanotubes, with TiO2 nanoparticles; this
way the photoelectrode can benefit from both the high conductive 1-D nanostructure
and from the high surface area available for dye adsorption – Figure 1.9.

18 Introduction
Dye-sensitized Solar Cells: Improving Lifetime Stability and Performance
Figure 1.9 Schematic of 1-D nanostructures blended with metal oxide particles.
Zhong et al.71
showed that it is possible to increase the photovoltaic performance
of DSCs by blending different concentrations of TiO2 nanotubes into a TiO2
mesoporous film. These authors blended anodic TiO2 nanotubes with different
concentrations into a P25 based TiO2 mesoporous film and studied the electron
transport properties of the film and the recombination phenomena by electrochemical
impedance spectroscopy ‒ Figure 1.10. Although this study uses a low performance
TiO2 reference electrode (0 wt. % of nanotubes) it provides complete EIS data allowing
to withdraw important conclusions about the use of nanotubes in DSC photoelectrodes.
Figure 1.10 (a) SEM micrograph of nanotubes sinthetized by Zhong et al.71
; (b)
Schematic diagram of the electron transport in the hybrid TiO2 film.

Chapter 1 19
Dye-sensitized Solar Cells: Improving Lifetime Stability and Performance
The same authors optimized the concentration of nanotubes blended in the
photoelectrode film, increasing electron transport and slowing the electron
recombination. Figure 1.11 presents the electron properties of DSCs with different
nanotube concentrations. There is a correlation between the device’s efficiency and the
electron diffusion coefficient, electron diffusion length and ultimately with the electron
collection efficiency. The interpretation of the diffusion length, Ln, reflects the main
phenomena occurring in DSCs: the electron transport and electron recombination. For
a nanotubes concentration of 10 wt. %, η and Deff present maximum values. For a
blending level of 10 wt. % nanotubes dispersed in the TiO2 particles supply shorter
paths for electron transport than the disordered interconnected TiO2 nanoparticles. For
a 30 wt. % nanotubes concentration, the decrease in the device efficiency is followed
by the decrease of the electron diffusion coefficient and electron diffusion length due
to the increase of the electron transport time. So, in this specific case, the concentration
of TiO2 nanotubes might be acting as trap centers that difficult transportation to FTO
substrate. Although the TiO2 nanotubes are more conductive than TiO2 nanoparticles,
above a certain concentration the increase of nanotubes does not result in higher
electron diffusion coefficients in the film. For concentrations higher than 30 wt. %, the
electron lifetime increases even though the global efficiency of the device decreases. In
fact, the ratio between electron lifetime and transit time becomes constant, meaning
that the recombination resistance decreases at the same level of the transport resistance
increases; thus the electron diffusion length remains approximately constant.
Therefore, the low photocurrent density explains the efficiency decrease since the
inclusion of nanotubes above 30 wt. % strongly diminishes the available surface area
for dye adsorption.
20 Introduction
Dye-sensitized Solar Cells: Improving Lifetime Stability and Performance
Figure 1.11 Electron transport properties and DSC performance value of DSCs with
different nanotube concentrations (adapted from71
).
1.2.3 3-D hierarchically ordered nanostructures
The key aspects of a photoelectrode structure are large surface area, necessary to
ensure high loading of dye molecules that will generate electrons, and sufficiently large
pores with excellent interconnectivity for efficient electrolyte diffusion. Additionally,
the defect level and the number of particle boundaries must be low to suppress electron
loss by recombination with the electrolyte and allow a good electron transport to the
collecting substrate. However, in a standard TiO2 nanostructure high surface area and
large pores are not compatible. Even if an increase of the surface area is important to
adsorb a great amount of dye, it simultaneously decreases the average pore size, thus
limiting the diffusion of the redox species in the nanostructure. As stated before, 1-D
vertically aligned structures solve the electron transport issue and facilitate the
electrolyte diffusion throughout the photoelectrode, but do not ensure enough dye
loading that could result in high performance devices. This way, 3-D hierarchical pore
structures are very interesting as they have several scales of pores. Indeed, such

Chapter 1 21
Dye-sensitized Solar Cells: Improving Lifetime Stability and Performance
materials are of great interest as they provide high surface areas and large pore sizes at
the same time: nanometer pores that ensure high amount of adsorbed dye molecules -
Figure 1.12 (II) ‒ and large micro or mesopores that allow fast electrolyte diffusion -
Figure 1.12 (I)72-74
.
Figure 1.12 Schematic representation of a hierarchical nanoparticle film, having two
different scale pores: (I) meso/macropores and (II) smaller nanopores.
Kim et al.128
developed a solvothermal method for preparing crystallized TiO2
sphere with ultrahigh surface areas up to 117.9 m2∙g
-1 and a well-defined nanoporous
structure. The strategy used for the preparation of these spheres involves a two-step
approach. First, the controlled hydrolysis reaction (equation 1.8) is carried out to form
the TiO2:
TiOCH(CH3)24 + 2H2O → TiO2 + 4(CH3)2CHOH (1.8)
This reaction produces TiO2 spheres in the amorphous phase and with a smooth
surface without any pores - Figure 1.13a). The shape and size of the spheres can be
controlled by the conditions of the hydrolysis reaction128
. Then, the formed spheres are
collected and washed with ethanol, and transferred to a titanium autoclave containing
ethanol to conduct a hydrothermal reaction. The temperature is raised to 240 ºC and
held for 6 h; by this means the amorphous spheres are converted to a crystallized
structure with high porosity - Figure 1.13b) and c).

22 Introduction
Dye-sensitized Solar Cells: Improving Lifetime Stability and Performance
Figure 1.13 SEM micrographs of the spheres synthesized by Kim et al.128
: a) before
and b) after the hydrothermal treatment and c) TEM image with detail showing the
porosity of the spheres.
The produced spheres have a diameter of 250 nm. The Brunauer-Emmett-Teller
(BET) surface area of these structures was measured to be up to 117.9 m2∙g
-1, which is
1.7 times higher than the usual surface area of a P25 film. This is an indication of the
high internal surface area built in the spheres. The authors also measured the pore size
distribution and found that, as expected, the spheres exhibit a bimodal pore size
distribution. The N2 adsorption-desorption isotherms showed that the TiO2 nanoparticle
film has mainly pores of 29 nm, while the spheres show pores with average pore sizes
of 9 nm and 55 nm. The smaller pores are inside the nanoporous sphere, visible in
Figure 1.13c), and they are responsible for the high surface area of the final structure.
The 55 nm sized pores are originated by the interstitial voids formed by the close-
packed 250 nm spheres and they are responsible for the electrolyte diffusion
improvement throughout the film. The internal pore of ~ 9 nm did not affect the
diffusion of the electrolyte probably because the diffusion length is only ≈125 nm (half
of the bead diameter = 250 nm). The spheres were used to prepare TiO2 electrodes with
thicknesses in the range of 10 ‒ 10.3 μm. The resulting DSCs revealed a high Jsc of
14.6 mA∙cm-2
, a Voc of 804 mV, a FF of 0.72 and an efficiency of η = 8.44 %. These
values are considerable better than the results obtained for a standard nanoparticle TiO2
film: Jsc of 12.7 mA∙cm-2
, a Voc of 811 mV, a FF of 0.72 and an efficiency of η = 7.40
%. The main difference between both types of DSCs is the short-circuit current density
Jsc that was considerably enhanced. This increase is mainly ascribed to the increased
amount of adsorbed dye molecules in semiconductor structure ‒ 140.4 μmol∙cm-2
for

Chapter 1 23
Dye-sensitized Solar Cells: Improving Lifetime Stability and Performance
the cell equipped with the new photoelectrode and 122.1 μmol∙cm-2
for the
conventional cell. Additionally, the produced photocurrent should also benefit from
scattering effect of the larger 250 nm particles in the photoelectrode. The same authors
added to the previous photoelectrode a 500 nm interfacial TiO2 layer to decrease the
electron recombination at the FTO/electrolyte interface. The TiO2 spheres were then
treated with TiCl4 and, finally, the photoelectrode outer surface was coated with hollow
TiO2 nanoparticles to act as scattering layer. The final DSC device showed an excellent
result of 19.6 mA∙cm-2
of Jsc, a Voc of 766 mV, a FF of 0.69 and an efficiency of η =
10.52 %.
Sauvage et al.23
reported a single titania layer based on the same principle, using
mesoporous beads of 830 nm ‒ Figure 1.14. The reported bead film had 89 m2∙g
-1 and a
mean pore size of 23 nm. The beads showed a mesoporous structure from the surface
to the core and therefore the interior titania nanoparticles remain highly accessible to
both chemisorption of dye molecules and electrolyte diffusion. The authors also
presented evidences that inside the beads exist densely packed TiO2 grains, having
each grain contact with the neighbouring ones. This aspect is responsible for the
increase of electron lifetime and enhanced electron mobility, reducing the electron
recombination effect with the electrolyte.
Figure 1.14 SEM micrographs of the obtained beads prepared by Sauvage et al.23
showing: (a) their close packing in the film and (b) the high mesoporosity to the
core.

24 Introduction
Dye-sensitized Solar Cells: Improving Lifetime Stability and Performance
The authors reported 10.6 % efficiency and an IPCE of 92 % at a wavelength of
570 nm with a 12 μm single bead film and using a heteroleptic tiophene-based dye
(C101 dye). However, using the standard N719 dye with the above mentioned
semiconductor structure resulted in a DSC with only 8.3 % efficiency. This allows
concluding that the morphology and chemical nature of both nanoparticle film and dye
molecule must be optimized for each other. The same authors found that the solar cells
prepared with bead film showed enhanced electron lifetime, electron diffusion
coefficients and diffusion length compared to a P25 film. The superior performance of
the beads was mainly attributed to the close packing of grains and crystal intergrowth
within the mesoporous titania beads. Similarly to what Kim et al. 128
have done, a triple
layer DSC was prepared by Sauvage et al.23
, combining mesoporous beads with a
transparent P25 TiO2 interfacial layer and a light scattering layer on top of the beads,
rendering an impressive Jsc of 19.90 mA∙cm-2
, a Voc of 724 mV, a FF of 0.77 and an η
of 11.2 %. Even though the higher efficiency obtained based on a complex structure it
is impressive that a single 12 μm film of TiO2 beads gave 10.6 % PCE.
1.2.4 3-D template based backbones
Other types of hierarchical systems include structures with different length scales
with different physical properties, e.g. systems including larger backbones with several
pore and crystal sizes. It was reported to be possible to create hierarchical structures
with individual control over the macro and mesostructure morphologies and
dimensions, by infiltration of mesoporous amorphous silica in macroporous ceramic129
or titania backbones130
.

Chapter 1 25
Dye-sensitized Solar Cells: Improving Lifetime Stability and Performance
Figure 1.15 Schematic representation of the preparation method of hierarchical
titania frameworks. A template material, such as polystyrene spheres, is impregnated
with a titania solution precursor that after the hydrolization reaction is calcinated to
form the crystallized anatase backbone, adapted from76
.
This approach was later used to create fully crystalline hierarchical titania
backbones, as reported by Kuo et al.131
. This work revealed a novel multi-scale TiO2
nanostructure, composed by a TiO2 blocking layer at the FTO surface and an inverse
opal main structure. Then, organized transport channels were created between
contacting spherical voids of the TiO2 inverse opal and then TiO2 nanoparticles were
coated on the spherical surfaces of the voids ‒ Figure 1.16. The TiO2 inverse opal film
was created by coating the blocking layer with polystyrene spheres (PS) with 100 nm
of diameter. The PS template was infiltrated by electrochemical deposition of TiO2 ‒
Figure 1.16a) ‒ and a close packing of PS spheres was obtained – Figure 1.16b).
Afterwards, the resulting PS template was removed by calcination to obtain a
crystalline inverse opal anatase scaffold opal Figure 1.16 c) and d). Then, this structure
was treated with TiCl4 in order to introduce TiO2 NP into the structure and then to
originate a larger surface area photoanode.
26 Introduction
Dye-sensitized Solar Cells: Improving Lifetime Stability and Performance
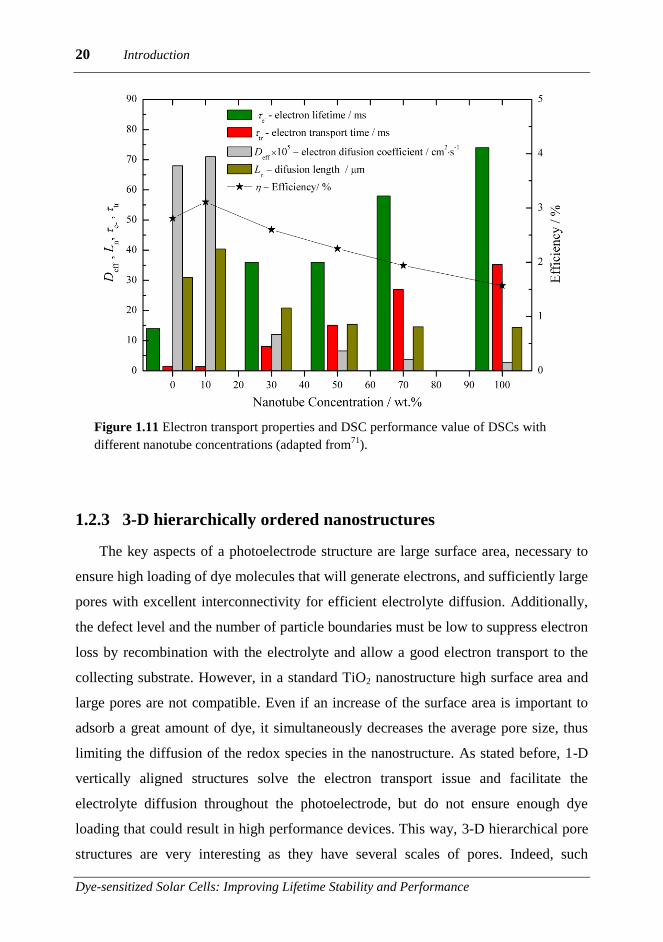
Figure 1.16 a) Schematic representation of the synthesis method of a highly ordered
multi-scale nanostructure of TiO2 proposed by Kuo et al.131
; b) Film composed by
the polystyrene opals revealing their close packing; SEM micrographs of the TiO2
inverse opal c) before and d) after TiCl4 treatment; e) TEM images of the TiO2
nanoparticle decorated inverse opal revealing the coating of the macroporous
transport channels. Adapted from131
.
Figure 1.16 c) and d) present SEM pictures of the anatase inverse opal structure
before and after the TiCl4 treatment. These figures show TiO2 NP of 10‒15 nm
attached to the backbone, as well as the transport channel openings of 30~50 nm for
dye solution and electrolyte penetration. Similarly to the bead structures presented
before, these features are believed to enhance the load of dye molecules and electrolyte
diffusion within the structure. The TEM picture presented in Figure 1.16 e) shows that
TiO2 NP are well crystallized and well connected, characteristics that are essential for a
good electron transport through the structure. Because the NP are organized and
attached to the walls of the main large pores, they have excellent access to the
electrolyte. The fabricated TiO2 nanostructure was assembled in a DSC configuration,
yielding a Jsc of 8.2 mA∙cm-2
, a Voc of 720 mV, a FF of 0.62 and an efficiency of η =
3.7 %. Although offering many potential advantages, the structure proposed by Kuo et

Chapter 1 27
Dye-sensitized Solar Cells: Improving Lifetime Stability and Performance
al.131
still has low performance. Unfortunately, the authors did not present results on
the surface area of the developed hierarchical structure, which may be the cause of the
reported low efficiency. This issue could be addressed coating the surface area of the
voids created by the PS spheres with a higher amount of TiO2 NP.
A similar approach was reported by Mandlmeier et al.76
. The authors created a
similar highly crystalline macroporous inverse opal backbone but using
polymethylmethacrylate (PMMA) spheres and a titania precursor for solution
impregnation. The spheres diameter was 200 nm, two times the size of the spheres used
by Kuo et al.131
. This originated voids in the macroporous crystalline titania structure
also twice the size and the intervoid connection was determined to be around 50-70
nm. The obtained scaffold can be seen in Figure 1.17a) and with detail in Figure
1.17b). After impregnation with titania precursor solution and calcination at 450 ºC,
the hierarchical film consists of crystalline anatase ‒ Figure 1.17 c) and d) ‒ with
crystal size larger than 20 nm in the macroporous scaffold walls and 4‒6 nm in the
mesoporous walls; these values have been confirmed by HRTEM and X-ray scattering.
Thus, in the same hierarchical structure there are two crystal sizes: larger sizes in the
walls of the macroporous backbone and smaller ones in the mesoporous anatase filling.
The authors concluded that the highly crystalline scaffold had a strong effect in the
crystallization of the mesoporous filling, acting as a nucleation site for further
crystallization of the initially amorphous phase76
. Besides this, the macroporous
backbone has a stabilization effect in the mesoporous material embedded in its
structure, preventing pore shrinkage due to heating. Thus, the final size of the
mesoporous is even 50 % larger than the same material when applied on a flat surface.
Mandlmeier et al.76
also performed nitrogen adsorption experiments and determined
that the macroporous scaffold exhibited a type II isotherm, typical for porous materials
with macropores, and a surface area of 64 m2∙g
-1 ‒ Figure 1.17e) curve A. After
impregnation with titania solution, the hierarchical structure have a completely
different adsorption behaviour, exhibiting a type IV isotherm with a surface area of 154
m2∙g
-1 - Figure 1.17e) curve B. This behaviour, suggests the existence of different pore
sizes, ranging from micro to meso and macropores. The narrow hysteresis between the
adsorption and desorption isotherms indicate a good pore distribution and its shape

28 Introduction
Dye-sensitized Solar Cells: Improving Lifetime Stability and Performance
indicates mostly mesoporosity132
. Although Figure 1.17e) shows very similar isotherms
for the hierarchical film (isotherm B) and for a standard mesoporous film grown in a
flat surface (isotherm C), the pore size distributions, shown in Figure 1.17e) and f) are
different and the average pore diameter are 6.1 nm and 5.1 nm, respectively.
Additionally, a decrease in surface area from 210 m2∙g
-1 for the mesoporous film grown
in the flat surface to 174 m2∙g
-1 for the hierarchical film was also observed. The
increase in pore size up to 20 % confirms the non-shrinking effect described earlier due
to the nanoparticles embedded in the macroporous backbone.
Figure 1.17 SEM images of macroporous scaffold created by Mandlmeier et al.76
:
before (a and b) and after (c and d) TiO2 NP infiltration. e) Nitrogen
adsorption/desorption isotherms (A - macroporous scaffold; B - macroporous
scaffold with TiO2 NP infiltration; C - reference mesoporous TiO2 film); and f) pore
size distribution of the macroporous scaffold material (B) and the reference
mesoporous TiO2 (C).
Using this hierarchical titania layer as photoelectrode in a DSC the authors
achieved Jsc = 7.17 mA∙cm-2
, Voc = 780 mV, FF = 0.71 and an efficiency of η = 4.0 %.
This result compared to the single mesoporous titania backbone film (Jsc of 0.97
mA∙cm-2
, a Voc of 980 mV, a FF of 0.52 and an efficiency of η = 0.4 %) represents an
improvement of nearly ten times. Nonetheless, the performance is very limited
compared for instance to the above mentioned beads by Kim et al.128
or by Sauvage et
al.23
, who reported a performance of ~ 10 % PCE in DSCs.
It is important to holdback that there is no clear relation between the
photoelectrode surface area and the performance of the DSC. In fact, Sauvage et al.23
used 400 nm spherical beads with 89 m2∙g
-1 and achieved ~10 % PCE; Kim et al.
128

Chapter 1 29
Dye-sensitized Solar Cells: Improving Lifetime Stability and Performance
used smaller size beads (250 nm) with larger surface area (117 m2∙g
-1) and obtained
also ~ 10 % with similar film thickness (10-12 μm); Mandlmeier et al.76
prepared a
porous photoelectrode with the largest surface area which did not surpass 4 % PCE
DSC even if they have used a film with nearly half of the thickness used by the
previous two authors (5.5 μm) and no additional scattering layer. On the other hand,
there is a clear impact of the morphological parameters of the porous semiconductor on
the DSC performance even though the relation between both is not always clear; it is
still missing a deeper understanding in how the morphological features of the porous
material influences the working kinetics of DSCs. Electrochemical impedance
spectroscopy can play an important role in unraveling this relation but works
describing a systematic electrochemical analysis on the new hierarchically ordered
photoanodes are very scarce. A very recent report by Cho et al. 75
described the
preparation of a similar hierarchical structure as described by Kuo et al. 131
and
Mandlmeier et al. 76
. The authors studied the influence of the template colloidal
particles diameter in the final macroporous structure and its role in the electron
transport properties in the final DSC device. The thickness of the electrode was
changed by controlling the macroporous inverse opal support and the diameter of the
mesopores was controlled using different sizes of template colloidal particles. Several
complete DSC devices were prepared and Figure 1.18 presents the corresponding DSC
performance values, the adsorbed amount of dye in the photoelectrode and the charge
transfer resistance in the TiO2 interface, Rk, (determined by EIS) as a function of the
mesoscale pore diameter. It can be observed that the pore diameter and the DSC
performance are inversely proportional. This happens because the pore diameter
increase corresponds to the diminishing of the surface area available for dye adsorption
and, consequently, the decrease of the short-circuit current density. At this stage, the
specific surface area available for dye adsorption governs the DSC performance.
Electrochemical impedance spectroscopy showed lower charge transfer resistances at
the TiO2 interfaces for smaller mesopore diameters, implying that the
electron/electrolyte recombination resistance was higher in photoelectrodes with 35 nm
pore size.

30 Introduction
Dye-sensitized Solar Cells: Improving Lifetime Stability and Performance
Figure 1.18 DSC performance values as a function of the mesoscale pore diameter
of the photoelectrode (adapted from75
).
The challenge of increasing the amount of adsorbed dye molecules and increase
the electron transport through the semiconductor to the FTO collecting substrate still
remains. Nonetheless, hierarchical structures using template techniques are very
promising because they give control over the whole pore structure of the
photoelectrode. However, more kinetic data such as electron diffusion coefficients,
electron diffusion lengths and ionic diffusion coefficients should be determined and
correlated to the morphological features of the nanostructures in order to optimize the
photoelectrode structure and maximize efficiency.
As was described throughout this review work, the increase of the specific surface
area to enhance dye adsorption in TiO2 nanostructures does not pose great challenge.
What is not trivial is to increase the adsorbed amount of dye without increasing the
electron/electrolyte recombination rate; indeed this should be the reason why most of
the 3-D strategies up to now did not produce high performance devices. The electronic
loss by recombination is induced mainly by slow electron transport through the
photoelectrode. Bearing this in mind, Tétreault et al.21
followed the idea of using
templating techniques to build macroporous backbones. In this case, besides using
TiO2 a thin conductive material of SnO2 or Al/ZnO was also used to coat the template

Chapter 1 31
Dye-sensitized Solar Cells: Improving Lifetime Stability and Performance
material ‒ Figure 1.19. By using polystyrene spheres they created a macroporous
structure with well-defined morphological characteristics. Then, by atomic layer
deposition (ALD) they created a 3-D TCO macroporous scaffold. Comparing this
backbone to the previously described TiO2 ones, this shows the clear advantage of
having higher electron mobility and thus to offer a 3-D network for electron collection.
Figure 1.19 Schematic diagram for the fabrication method of the 3-D host
passivation guest dye sensitized solar cell.
To avoid the electron recombination at the TCO backbone/electrolyte interface,
this structure was then protected with a dense passivating TiO2 thin layer, once again
deposited by ALD. Afterwards, the backbone was filled with 17 nm anatase
nanoparticles to ensure high surface area. This approach targeted high dye loadings and
injection dynamics of typical anatase nanoparticles-based DSC. Figure 1.20 shows
SEM micrographs of such structures where the good connection between the TCO
backbone and the flat TCO substrate can be seen ‒ Figure 1.20 a) and c). This
electronic connection ensures efficient charge extraction throughout the
photoelectrode. The inherent disordered structure caused by the template spheres
creates an open structure that, according to the authors, only uses a small fraction of
the 3-D film (~10 %), leaving enough volume to be filled with small TiO2 particles
with high superficial surface area for dye adsorption. Figure 1.20 c) confirms that the

32 Introduction
Dye-sensitized Solar Cells: Improving Lifetime Stability and Performance
TCO backbone is well coated in both sides by the dense passivation TiO2 layer that
should enable the TCO chemical stability and preventing electron recombination.
Figure 1.20 SEM micrograph of a self-assembled 3-D Al:ZnO TiO2 host-
passivation guest DSC photoanode: a) cross sectional view of the 3-D backbone; b)
top view of the 3-D backbone; c) high-magnification micrograph showing the TiO2
covered 3-D macroporous Al:ZnO host in direct contact with the front FTO
electrode; d) high magnification micrograph showing the 3-D backbone coated with
dense TiO2 inside and outside; and e) complete photoanode after infiltration and
calcination of the TiO2 nanoparticle paste21
.
Using this new 3-D material concept Tétreault et al.21
prepared DSCs based on
TiO2, SnO2 and Al/ZnO 3-D host photoelectrodes in combination with Z907 dye. The
best result was found using SnO2 host backbone, rendering devices with Jsc of 10.4
mA∙cm-2
, a Voc of 803 mV, a FF of 0.70 and an η of 5.8 %. These results showed an
increase of almost 100 mV when comparing with the Z907 best performing devices133
.
The electron mobility was also measured using electrochemical impedance
spectroscopy and the authors found that in fact the Al/ZnO and SnO2 films have
electron diffusion coefficients six orders of magnitude higher than TiO2 nanoparticles
films (6.19 cm2∙s
-1 and 0.423 cm
2∙s
-1, respectively, compared to 610
-6 cm
2∙s
-1 for the
TiO2 NP film).
Table 1.3 compares these results with those obtained by Kuo et al.131
and
Mandlmeier et al.76
. Despite using similar template techniques to create a TiO2
macroporous backbone, Kuo and Mandlmeier did not report DSC efficiencies higher

Chapter 1 33
Dye-sensitized Solar Cells: Improving Lifetime Stability and Performance
than 4 %. The difference between their and Tétreault et al.21
results might be in the
electron diffusion coefficient. Since the three authors followed the same architecture
concept, it can be concluded that the higher performance observed is due to the higher
electron mobility in the Al/ZnO and SnO2 hosts. The findings by these authors should
motivate studies to determine the influence of these highly conductive host backbones
and their interaction with semiconductor particles, particularly their influence in the
injection dynamics and in the overall kinetics of DSCs.
Table 1.3 Influence of the macroporous template backbone material on DSC
performance.
Author Host
Material Voc Jsc / mA∙cm
-2 FF Efficiency / %
Kuo et al.131
TiO2 720 8.2 0.62 3.7
Mandlmeier et al.76
TiO2 780 7.17 0.71 4.0
Tétreault et al.21
TiO2 791 6.9 0.73 4.0
Al/ZnO 842 7.5 0.77 4.9
SnO2 803 10.4 0.70 5.8
In a recent work, Crossland et al.134
followed this idea, and disclosed the synthesis
method for a mesoporous TiO2 crystals that deliver enhanced mobility and
optoelectronic device performance. This innovative work showed that mesoporous
single-crystal (MSC) semiconductor could provide long range electronic connectivity
and structural coherence. Using TiO2 MSCs films processed under 150 ºC, the authors
fabricated all solid state devices with 7.3 % efficiency. This result is quite remarkable,
taking into account that TiO2 nano-crystalline films are usually processed at 500 ºC to
improve electrical connection between nanoparticles. The synthesis process is based on
a templating technique, which uses silica beads with tuneable sizes from 20 to 250 nm
that act as host backbone. The template material is first “seeded” with a titanium
precursor, TiF4, and only then is immersed in the reaction vessel. The reaction,
hydrothermal growth of TiF4 in the presence of hydrofluoric acid, is then carried out in
the template pores. The acid stabilizes the precursor and significantly decreases the
nucleation rate, allowing the synthesis of a high surface area (70 m2·g
-1) single crystal

34 Introduction
Dye-sensitized Solar Cells: Improving Lifetime Stability and Performance
of anatase TiO2. These single crystals benefit from a much higher electron conductivity
of 1.5 × 10⁻⁵
S·cm-1
comparing to 2.2 × 10⁻⁷
S·cm-1
measured for a TiO2 nanoparticle
sintered film. Obviously, with very similar surface area (70 vs. 75 m2·g
-1 for TiO2
MSCs and nanoparticles, respectively) and electrical conductivity two orders of
magnitude higher, the mesoporous TiO2 single crystals are an excellent candidate for
replacing TiO2 nanoparticle films in DSCs. These results, for a solid state device,
surpass all the other template based techniques discussed so far, even more because
they were tested with liquid electrolytes.
1.2.5 Hybrid TiO2/Graphene nanostructures
In the last couple of years graphene has attracted enormous attention because of its
unique properties and array of applications135-138
. With a theoretical surface area of
2630 m2∙g
-1, graphene is an ideal support material with enhanced interfacial contact
even when used in small amounts139
. Its electron mobility of 104 cm
2∙V
-1
135 at room
temperature means that graphene has an excellent ability to transport electrons. These
facts have made it very attractive for incorporation in photocatalytic mesoporous films
140-143 and in DSC’s counter electrode
144-146, where its electrocatalytic properties have
been put to use to substitute the expensive platinum catalyst. Recently, graphene has
also been incorporated in DSC’s photoelectrodes – Figure 1.2177-81
. Fourier transform
infrared spectroscopy (FT-IR) experimental results of pure TiO2 and graphene-TiO2
hybrid films showed that Ti-O-C bonds are formed, indicating the chemical interaction
between surface hydroxyl groups of TiO2 and functional groups of graphene oxide147
.
Experimental data also shows that the presence of graphene in the TiO2 photoelectrode
also increases the total amount of dye adsorbed in the film78,147,148
. This fact is
explained by these authors based on the huge surface area of graphene that provides
more anchoring sites for TiO2. But in fact, and similarly to what happens in
photocatalytic studies where there are π-π conjugations between methylene blue
molecules and the aromatic rings of graphene oxide sheets, a chemical interaction
between sensitizing dye and graphene might exist, helping to explain the higher
amount of adsorbed dye in hybrid films80,147,149
.

Chapter 1 35
Dye-sensitized Solar Cells: Improving Lifetime Stability and Performance
Graphene is produced mainly by the chemical oxidation method resulting in
graphene oxide (GO)150,151
, which can be then reduced either chemically or thermally.
However, reduced graphene oxide (RGO) contains oxygen functional groups (-OH and
=O) on the planes and –COOH and carbonyl groups in the periphery of the planes144,
145. This, along with the lattice surface defects created during the exfoliation process, is
believed to be responsible for the electrocatalytic behaviour of graphene152-154
. Because
of GO electrocatalytic properties and its high extinction coefficient155
, RGO should be
handled carefully when used in the photoelectrode of DSCs; if not properly reduced,
the remaining oxygen containing groups could promote recombination of electrons
with electrolyte. In high amounts, graphene can also compete with the sensitizer
molecules on light absorption and thus decrease the performance of DSCs. Therefore,
the successful introduction of graphene in the photoelectrodes of DSCs depends on a
careful balance between its conductive ability and electrocatalytic behaviour.
Figure 1.21 Schematic representation of a TiO2/graphene hybrid photoanode.
Tang et al.78
reported the development of a photoanode where exfoliated graphene
sheets (GS) were attached to a TiO2 nanoparticles matrix - Figure 1.22. The authors
used a molecular grafting method where the graphene sheets were chemically
exfoliated and chemisorbed in the TiO2 matrix. By controlling the oxidation time, it
was possible to achieve a highly efficient electronic conductive film and thus a good
attachment between the GO and the nanoparticles. In fact, the determined resistivity of

36 Introduction
Dye-sensitized Solar Cells: Improving Lifetime Stability and Performance
a GO/TiO2 decreased by more than two orders of magnitude from 2.1±0.9105
Ω to
3.6±0.9102
Ω78
. These authors determined that the GO provided additional and more
efficient electronic transport paths but also increased the dye loading of the film,
leading to a photocurrent increase.
Figure 1.22 Schematic representation of a TiO2 film with GS attached (left) and
SEM micrographs of the prepared film with detail to the graphene sheet attached to
the TiO278
.
Sun et al. 77
developed a method where graphene was dispersed using Nafion® and
then incorporated in TiO2 particles by a heterogeneous coagulation particles. Because
the opposite zeta potentials of P25 particles (~15 mV) and graphene (-42 mV) there is
a strong electrostatic attractive force that binds the TiO2 NP to the surface of the
graphene. The authors succeeded to coat graphene sheets with TiO2 resulting in a
composite structure with a P25 to graphene ratio of 200:1(w/w). The DSC with P25
nanoparticles showed a Jsc of 5.04 mA∙cm-2
and η of 2.70 %. In the presence of 0.5 wt.
% of graphene the Jsc increased 66 % to 8.38 mA∙cm-2
, resulting in an efficiency of
4.28 %. The authors ascribe this enhanced performance to an increase in dye
adsorption due to the creation of surface morphologies with more sites available and an
extended electron lifetime since electrons travel through long mean free paths without
recombining.
Yang et al.79
successfully incorporated graphene in TiO2 nanostructure to form 2D
graphene bridges in DSCs. The authors reported an optimum result for graphene oxide
content of 0.6 wt. % that originated a DSC with a Jsc of 16.29 mA∙cm-2
, a Voc of 690

Chapter 1 37
Dye-sensitized Solar Cells: Improving Lifetime Stability and Performance
mV, a FF of 0.62 and a η of 6.97 %. This result represent an increase of 45 % in the
short-circuit current density and 39 % in the conversion efficiency, when compared to
a P25 film-based DSC, shown in Figure 1.22. Comparing this result to DSCs equipped
with a photoanode containing CNTs prepared by the same method and weight
percentage ‒ 0.4 % ‒ a huge difference emerges since CNT devices perform
significantly worse: Jsc of 3.35 mA∙cm-2
, Voc of 420 mV, FF of 0.41 and η of 0.58 %.
The Fermi level of a CNT is between its conduction band (CB, -4.5 eV vs. vacuum)
and its valence band. Besides, its CB is below the CB of TiO2 (-4 eV vs. vacuum)
resulting in a decrease of the Voc. In opposition, graphene is a zero band material 156
and its work function is calculated to be higher than CNT value (4.42 to 4.5 eV vs.
vacuum)77,157,158
. This makes graphene perfect to be introduced in the TiO2 structure
because the apparent Fermi Level is not decreased. This fact explains why in the Yang
et al. results the Voc was not affected by the introduction of graphene (up to 0.4 wt. %)
as can be seen in Figure 1.23. The unaffected Voc and the enhanced efficiency mean
that graphene increased charge transport and partially suppressed electron
recombination with the electrolyte. In higher concentrations graphene starts to compete
with the sensitized TiO2 nanoparticle for light absorption and becomes a recombination
center for electrons; consequently the DSC performance is affected ‒ Figure 1.23.
Figure 1.23 TiO2/graphene hybrid DSC normalized performance values vs. different
graphene oxide contents present in the photoanode.

38 Introduction
Dye-sensitized Solar Cells: Improving Lifetime Stability and Performance
1.2.6 Outlook for high performance photoelectrode
Morphological features have a great impact in the performance of photoelectrodes
in dye sensitized solar cells, mainly determined by changes in the electron transport
effectiveness, surface area available for dye loading and pore diameter for electrolyte
diffusion.
1-D nanostructures provide direct pathways for electron transport and when used
as photoelectrodes improve the electron diffusion length, electron lifetime and
diffusion coefficient. However, they have a fundamental disadvantage: they do not
provide the necessary specific surface area for dye adsorption, resulting in DSCs with
poor efficiencies (~0.5 %). To overcome this challenge researchers began coating the
1-D nanostructures with nanoparticles or blended 1-D nanostructures in nanoparticles
films for taking advantage of the characteristics of both structures: high surface area of
the nanoparticles and high electron transport characteristics of the 1-D structures.
However, again relatively low efficiency values have been reported using these
structures (~3 %).
3-D hierarchical pore structures are very interesting as they have several scales of
pores. Hierarchically structured metal oxides have nanometer pores that ensure high
amount of adsorbed dye molecules and large micro or mesopores, allowing good
electrolyte diffusion. A hierarchically bead-made film shows enhanced electron
lifetimes, electron diffusion coefficients and diffusion lengths compared to a P25 film.
The superior performance of the beads, with an efficiency of ~11 %, was mainly
attributed to the close packing of grains and crystal intergrowth within the mesoporous
titania beads. Another type of hierarchical systems includes structures with different
length scales of two different morphological characteristics, for example, pore diameter
and crystal size of a larger backbone. It was reported to be possible to create
hierarchical structures where there is individual control over the macro and meso
structures morphologies and dimensions by infiltration of mesoporous amorphous
silica in macroporous ceramics or in titania backbones. The most promising technique
in this category of hierarchical films is the one proposed by Tréteault et al.21
that used
the template idea to create a 3-D TCO macroporous scaffold by atomic layer

Chapter 1 39
Dye-sensitized Solar Cells: Improving Lifetime Stability and Performance
deposition. Although the relatively low efficiency (~6 %) attained so far, the idea of
creating a 3-D network as electron collecting substrate has great potential. The key
parameters of this structure are the compact TiO2 layer coating of the TCO
macroporous scaffold to avoid electron recombination with the electrolyte and the
proper filling of the structure with TiO2 NP to achieve good adsorption of sensitizing
molecules. A different idea was proposed and tested successfully by Crossland et al.134
In this work a mesoporous TiO2 single crystal with high surface area and considerable
higher electrical conductivity delivered a remarkable 7.3 % energy efficiency when
inserted in a solid state solar cell. By demonstrating that MSCs displayed higher
electron conductivities than nanocrystalline TiO2, while eliminating the thermal
sintering treatment, this work opened the door for a new kind of photoelectrodes in
DSCs, multijuntion device fabrication, temperature-sensitive substrate choice, and
reduced device fabrication costs.
Finally, some reports concerning the use of graphene in combination with TiO2
photoelectrodes show that graphene enhances the DSC performance when used in very
low amounts (~0.5 wt. %). This material promises to bring the photoelectrodes of
DSCs to the next level of development. The presence of graphene-bridges in a TiO2 NP
photoelectrode provides: i) a higher electron mobility; ii) higher amount of adsorbed
dye; and iii) decreases the electron recombination with electrolyte, improving the
overall solar cell efficiency. Due to its electrocatalytic properties and high extinction
coefficient, when graphene is used in higher concentrations (>0.5 wt. %) and it is not
properly reduced, it competes with the sensitizer for light absorption and acts as a
recombination centre.
The challenge of increasing both the amount of adsorbed dye molecules and the
electron transport through the semiconductor to the FTO collecting substrate still
remains. More kinetic data such as electron diffusion coefficients, electron diffusion
lengths and ionic diffusion coefficients should be determined and correlated to the
morphological features of the nanostructures to optimize the photoelectrode and
maximize efficiency. This state of art review aims to motivate other studies to
investigate different materials and structures for photoelectrodes applications. Highly
conductive host backbones and graphene structures are identified as promising for

40 Introduction
Dye-sensitized Solar Cells: Improving Lifetime Stability and Performance
increasing the overall kinetics of DSCs and thus their influence and interaction with
different metal oxide particles should be deeply understood.
1.3 Long term stability of DSCs
The commercial success of any PV technology depends on the reliability, energy
efficiency and cost of the devices. The degradation pathways of real PV system devices
can occur at system, module, cell and molecular levels as illustrated in Figure 1.24.
Large solar power plants are controlled by complex operational centers that integrate
information from weather stations and grid operators to maximize profit without
destabilizing the electricity grid.
Figure 1.24 Illustration of the different levels where degradation of PV fields can
occur: system, module, cell and molecular levels.

Chapter 1 41
Dye-sensitized Solar Cells: Improving Lifetime Stability and Performance
For DSC technology to become a real commercial alternative to fossil fuels, at
least 25 year of constant power conversion efficiency should be guaranteed for outdoor
applications. Therefore, any product based on DSC technology must comply to
stringent standards such as IEC 61646 for thin-film PV modules159
. The standard
comprises series of accelerated stress tests aiming duplicating the expected failures in a
shorter time frame compared to outdoor exposure. The tests include thermal cycles,
damp heat tests, humidity freeze and mechanical loads, among others. The degradation
mechanisms occurring at the DSC device can be categorized into two main levels, as
shown in Figure 1.24: at the DSC device or at the molecular level. Degradation at the
cell level deals with sealing failures, which allows contaminants to enter the cell and in
severe cases electrolyte leakage; both mechanisms are considered critical factors that
determine long term stability of the solar cell160
. The degradation at the molecular level
deals with deactivation of the inner components of the cell, which in most of the cases
are related to external contamination, like water and oxygen160-162
. The specific
degradation processes have been subjected to much scrutiny in the scientific
community and are usually assigned to dye desorption163-165
, electron recombination at
the photoelectrode166-168
, degradation of the counter electrode169-171
, decrease in
triiodide concentration169, 172, 173
, water and oxygen inside the cell174-177
and UV light
exposure163, 165, 178
. These mechanisms are usually triggered by external factors like
light intensity, temperature and moisture, which in turn stress a critical pre-requisite of
the DSC cell: the encapsulation of the liquid electrolyte. Consequently, the sealing
reliability of DSCs is considered a key pre-requisite that a DSC cell must fulfil to be
suitable for real outdoor testing165
. Besides, unreliable cell tightness questions the
stability studies on molecular level of the inner components employed in the solar cell.
The commonly employed sealing materials are thermoplastic polymers, such as
Surlyn®, that are unreliable at temperatures above 60 ºC due to its low softening
temperature (~60-70 ºC)165
. Above this temperature it is known to be permeable to
oxygen and continuous exposure to light and temperature cycling eventually causes
sealing failure160
. Although it is widely used by research teams all around the world in
laboratory test cells, this sealant is not appropriate for stable operation in real outdoor
conditions174, 179, 180
.

42 Introduction
Dye-sensitized Solar Cells: Improving Lifetime Stability and Performance
1.4 Scope of the thesis
DSC technology is a promising candidate for low cost renewable electricity
generation. However, there are technical limitations that prevent commercialization of
the technology. Two main aspects are identified as critical for DSCs to emerge in the
PV market: lifetime stability and energy efficiency. The work developed in this thesis
targets these limitations, by creating robust engineering solutions to the DSC
industrialization constraints.
This work is divided in seven chapters. In Chapter 1, modern society energy
paradigm is revisited and perspectives for energy harvesting from renewable sources
are discussed: particular emphasis is given to the DSC technology potential. An
overview of the operation principles is given, as well as state-of-the-art DSC
configurations. The influence of the photoelectrode morphology in the DSC
performance is analysed and the best strategies to improve DSC efficiency and stability
are identified.
Chapter 2 focuses on the development and optimization of a sealing process for
obtaining stable DSC devices. An innovative sealing process based on laser assisted
glass melting was developed and optimized for DSC sealing.
The following chapter, Chapter 3, compares the laser-assisted glass sealing
process against the commonly used sealing method concerning performance and
stability. Chapter 4 aims at understanding and quantifying the recombination process
at TiO2/electrolyte and FTO/electrolyte interfaces and their dependence with
temperature. The developed laser assisted sealing allows studying the temperature
effect in DSC performance up to 105 ºC, the highest temperature ever considered in
kinetic studies of liquid state DSCs.
Chapter 5 concerns modelling, simulation and design of DSCs. A
phenomenological model is used to describe transport and recombination processes
affecting the DSC performance, and in which way they can be tuned to optimize its
operation. This chapter provides a useful framework in the exploration of new concepts
and designs for improving DSCs performance.

Chapter 1 43
Dye-sensitized Solar Cells: Improving Lifetime Stability and Performance
Chapter 6 displays the development of innovative photoelectrode architecture for
DSCs. The new PE aims at increasing DSCs efficiency by targeting the transport and
recombination limitations of the commonly employed TiO2 nanoparticle films.
Finally, Chapter 7 lays out the main conclusions of the thesis, along with future
work ideas, suggestions and guidelines.
Acknowledgements
J. Maçaira and L. Andrade are grateful to the Portuguese Foundation for Science
and Technology (FCT) for their PhD and postdoctoral grants (References:
SFRH/BD/80449/2011, SFR/BPD/74944/2010, respectively). Financial support by
FCT through the project SOLARCONCEPT (Reference PTDC/EQU-
EQU/120064/2010 is also acknowledged. Financial support by European Research
Council (Contract no: 321315) is also acknowledged.
References
1. P. H. J. Conti, International Energy Outlook 2013, U.S. Energy Administration,
2013.
2. F. T. Manoel Rekinger, SolarPower Europe, Global Market Outlook for Solar
Power 2015-2019, SolarPower Europe, 2015.
3. U. N. D. Programme, World energy assement: Energy and the challenge of
sustainability United Nations Development Programme, 2000.
4. M. A. Green, K. Emery, Y. Hishikawa, W. Warta and E. D. Dunlop, Progress in
Photovoltaics: Research and Applications, 2012, 20, 12-20.
5. J. Ciesielska, Global Market Outlook for Photovolatics until 2015, 2011.
6. T. Sugaya, O. Numakami, R. Oshima, S. Furue, H. Komaki, T. Amano, K.
Matsubara, Y. Okano and S. Niki, Energy & Environmental Science, 2012, 5,
6233-6237.
7. J. D. Servaites, M. A. Ratner and T. J. Marks, Energy & Environmental Science,
2011, 4, 4410-4422.

44 Introduction
Dye-sensitized Solar Cells: Improving Lifetime Stability and Performance
8. K. Kakiage, Y. Aoyama, T. Yano, K. Oya, J.-i. Fujisawa and M. Hanaya, Chem.
Commun., 2015.
9. Best research solar cell efficiencies chart,
http://www.nrel.gov/ncpv/images/efficiency_chart.jpg, Accessed October, 2015.
10. L. M. Goncalves, V. d. Z. Bermudez, H. A. Ribeiro and A. M. Mendes, Energy
& Environmental Science, 2008, 1, 655-667.
11. M. K. Nazeeruddin, E. Baranoff and M. Grätzel, Solar Energy, 2011, 85, 1172-
1178.
12. M. Grätzel, Journal of Photochemistry and Photobiology C: Photochemistry
Reviews, 2003, 4, 145-153.
13. Report: The Cutting Edge of Research – EPFL’s SwissTech Convention Center,
http://www.detail-online.com/inspiration/report-the-cutting-edge-of-research-
%E2%80%93-epfl%E2%80%99s-swisstech-convention-center-111842.html,
Accessed Ocotber 2015.
14. J.-H. Yum, S.-J. Moon, C. S. Karthikeyan, H. Wietasch, M. Thelakkat, S. M.
Zakeeruddin, M. K. Nazeeruddin and M. Grätzel, Nano Energy, 2012, 1, 6-12.
15. D. Kuang, C. Klein, S. Ito, J. E. Moser, R. Humphry-Baker, N. Evans, F.
Duriaux, C. Grätzel, S. M. Zakeeruddin and M. Grätzel, Advanced Materials,
2007, 19, 1133-1137.
16. L. Andrade, S. M. Zakeeruddin, M. K. Nazeeruddin, H. A. Ribeiro, A. Mendes
and M. Grätzel, ChemPhysChem, 2009, 10, 1117-1124.
17. F. Ribeiro, J. Maçaira, R. Cruz, J. Gabriel, L. Andrade and A. Mendes, Solar
Energy Materials and Solar Cells, 2012, 96, 43-49.
18. J. Wu, S. Hao, Z. Lan, J. Lin, M. Huang, Y. Huang, P. Li, S. Yin and T. Sato, J.
Am. Chem. Soc., 2008, 130, 11568-11569.
19. W. Wu, J. Li, F. Guo, L. Zhang, Y. Long and J. Hua, Renewable Energy, 2010,
35, 1724-1728.
20. A. Yella, H.-W. Lee, H. N. Tsao, C. Yi, A. K. Chandiran, M. K. Nazeeruddin, E.
W.-G. Diau, C.-Y. Yeh, S. M. Zakeeruddin and M. Grätzel, Science, 2011, 334,
629-634.
21. N. Tétreault, É. Arsenault, L.-P. Heiniger, N. Soheilnia, J. Brillet, T. Moehl, S.
Chapter 1 45
Dye-sensitized Solar Cells: Improving Lifetime Stability and Performance
Zakeeruddin, G. A. Ozin and M. Grätzel, Nano Letters, 2011, 11, 4579-4584.
22. J.-Y. Liao, H.-P. Lin, H.-Y. Chen, D.-B. Kuang and C.-Y. Su, Journal of
Materials Chemistry, 2012, 22, 1627-1633.
23. F. d. r. Sauvage, D. Chen, P. Comte, F. Huang, L.-P. Heiniger, Y.-B. Cheng, R.
A. Caruso and M. Graetzel, ACS Nano, 2010, 4, 4420-4425.
24. B. O'Regan and M. Grätzel, Nature, 1991, 353, 737-740.
25. A. Hagfeldt and M. Grätzel, Acc. Chem. Res., 2000, 33, 269-277.
26. L. R. Andrade, H. A.; Mendes, A, Dye‐Sensitized Solar Cells: an Overview, in
Energy Production and Storage: Inorganic Chemical Strategies for a Warming
World, John Wiley & Sons, Ltd, Chichester, UK, 2010.
27. F. Gao, Y. Wang, D. Shi, J. Zhang, M. K. Wang, X. Y. Jing, R. Humphry-Baker,
P. Wang, S. M. Zakeeruddin and M. Gratzel, Journal of the American Chemical
Society, 2008, 130, 10720-10728.
28. F. Gao, Y. Wang, J. Zhang, D. Shi, M. Wang, R. Humphry-Baker, P. Wang, S.
Zakeeruddin and M. Grätzel, Chem. Commun., 2008, 2635-2637.
29. M. Nazeeruddin, P. Péchy and M. Grätzel, Chem. Commun., 1997, 1705-1706.
30. M. Nazeeruddin, A. Kay, I. Rodicio, R. Humphry-Baker, E. Mueller, P. Liska,
N. Vlachopoulos and M. Grätzel, J. Am. Chem. Soc., 1993, 115, 6382-6390.
31. M. K. Nazeeruddin, T. Bessho, L. Cevey, S. Ito, C. Klein, F. De Angelis, S.
Fantacci, P. Comte, P. Liska, H. Imai and M. Graetzel, Journal of
Photochemistry and Photobiology A: Chemistry, 2007, 185, 331-337.
32. V. Shklover, M.-K. Nazeeruddin, S. M. Zakeeruddin, C. Barbe, A. Kay, T.
Haibach, W. Steurer, R. Hermann, H.-U. Nissen and M. Gratzel, Chemistry of
Materials, 1997, 9, 430-439.
33. W. Zhou, B. Zhao, P. Shen, S. Jiang, H. Huang, L. Deng and S. Tan, Dyes and
Pigments, 2011, 91, 404-412.
34. H.-H. Chou, C.-Y. Hsu, Y.-C. Hsu, Y.-S. Lin, J. T. Lin and C. Tsai,
Tetrahedron, 2012, 68, 767-773.
35. C. Teng, X. Yang, C. Yuan, C. Li, R. Chen, H. Tian, S. Li, A. Hagfeldt and L.
Sun, Organic Letters, 2009, 11, 5542-5545.

46 Introduction
Dye-sensitized Solar Cells: Improving Lifetime Stability and Performance
36. L. Andrade, J. Sousa, H. A. Ribeiro and A. Mendes, Solar Energy, 2011, 85,
781-793.
37. Y. Chiba, A. Islam, Y. Watanabe, R. Komiya, N. Koide and L. Han, Japanese
Journal of Applied Physics, Part 2: Letters, 2006, 45, L638-L640.
38. M. Nazeeruddin, P. Pechy, T. Renouard, S. Zakeeruddin, R. Humphry-Baker, P.
Comte, P. Liska, L. Cevey, E. Costa, V. Shklover, L. Spiccia, G. Deacon, C.
Bignozzi and M. Grätzel, J. Am. Chem. Soc., 2001, 123, 1613-1624.
39. A. Martinson, T. Hamann, M. Pellin and J. Hupp, Chemistry - A European
Journal, 2008, 14, 4458-4467.
40. M. Wang, N. Chamberland, L. Breau, J.-E. Moser, R. Humphry-Baker, B.
Marsan, S. M. Zakeeruddin and M. Grätzel, Nat Chem, 2010, 2, 385-389.
41. Z. Zhang, P. Chen, T. N. Murakami, S. M. Zakeeruddin and M. Grätzel,
Advanced Functional Materials, 2008, 18, 341-346.
42. B. Bergeron, A. Marton, G. Oskam and G. Meyer, J. Phys. Chem. B, 2005, 109,
937-943.
43. G. Oskam, B. Bergeron, G. Meyer and P. Searson, J. Phys. Chem. B, 2001, 105,
6867-6873.
44. U. Bach, D. Lupo, P. Comte, J. Moser, F. Weissortel, J. Salbeck, H. Spreitzer
and M. Grätzel, Nature, 1998, 395, 583-585.
45. H. Nusbaumer, J. E. Moser, S. M. Zakeeruddin, M. K. Nazeeruddin and M.
Gratzel, J. Phys. Chem. B, 2001, 105, 10461-10464.
46. S. Sapp, C. Elliott, C. Contado, S. Caramori and C. Bignozzi, J. Am. Chem. Soc.,
2002, 124, 11215-11222.
47. H. Nusbaumer, S. Zakeeruddin, J. Moser and M. Grätzel, Chemistry - A
European Journal, 2003, 9, 3756-3763.
48. P. Cameron, L. Peter, S. Zakeeruddin and M. Grätzel, Coordination Chemistry
Reviews, 2004, 248, 1447-1453.
49. S. Nakade, Y. Makimoto, W. Kubo, T. Kitamura, Y. Wada and S. Yanagida, J.
Phys. Chem. B, 2005, 109, 3488-3493.
50. J. Burschka, A. Dualeh, F. Kessler, E. Baranoff, N.-L. Cevey-Ha, C. Yi, M. K.
Nazeeruddin and M. Grätzel, Journal of the American Chemical Society, 2011,
Chapter 1 47
Dye-sensitized Solar Cells: Improving Lifetime Stability and Performance
133, 18042-18045.
51. I. Chung, B. Lee, J. He, R. P. H. Chang and M. G. Kanatzidis, Nature, 2012,
485, 486-489.
52. A. Kojima, K. Teshima, Y. Shirai and T. Miyasaka, Journal of the American
Chemical Society, 2009, 131, 6050-6051.
53. J.-H. Im, C.-R. Lee, J.-W. Lee, S.-W. Park and N.-G. Park, Nanoscale, 2011, 3,
4088-4093.
54. M. M. Lee, J. Teuscher, T. Miyasaka, T. N. Murakami and H. J. Snaith, Science,
2012, 338, 643-647.
55. J. H. Heo, S. H. Im, J. H. Noh, T. N. Mandal, C.-S. Lim, J. A. Chang, Y. H. Lee,
H.-j. Kim, A. Sarkar, K. NazeeruddinMd, M. Gratzel and S. I. Seok, Nat Photon,
2013, 7, 486-491.
56. G. Niu, X. Guo and L. Wang, Journal of Materials Chemistry A, 2015.
57. M. D. McGehee, Science, 2011, 334, 607-608.
58. M. Gratzel, Inorganic Chemistry, 2005, 44, 6841-6851.
59. J. Bisquert, M. Gratzel, Q. Wang and F. Fabregat-Santiago, The Journal of
Physical Chemistry B, 2006, 110, 11284-11290.
60. F. Fabregat-Santiago, J. Bisquert, G. Garcia-Belmonte, G. Boschloo and A.
Hagfeldt, Solar Energy Materials and Solar Cells, 2005, 87, 117-131.
61. J. Bisquert, F. Fabregat-Santiago, I. n. Mora-Sero̕, G. Garcia-Belmonte and S.
Gime̕nez, The Journal of Physical Chemistry C, 2009, 113, 17278-17290.
62. J. Villanueva-Cab, G. Oskam and J. A. Anta, Solar Energy Materials and Solar
Cells, 2010, 94, 45-50.
63. S. A. Haque, Y. Tachibana, D. R. Klug and J. R. Durrant, J. Phys. Chem. B,
1998, 102, 1745-1749.
64. J. Bisquert and V. S. Vikhrenko, The Journal of Physical Chemistry B, 2004,
108, 2313-2322.
65. J. Bisquert, The Journal of Physical Chemistry B, 2002, 106, 325-333.
66. J. Bisquert, Journal of Electroanalytical Chemistry, 2010, 646, 43-51.
67. J. A. Anta, Current Opinion in Colloid & Interface Science, 2012, 17, 124-
131.

48 Introduction
Dye-sensitized Solar Cells: Improving Lifetime Stability and Performance
68. N. Tetreault and M. Gratzel, Energy & Environmental Science, 2012.
69. A. B. F. Martinson, M. r. S. Goes, F. Fabregat-Santiago, J. Bisquert, M. J. Pellin
and J. T. Hupp, The Journal of Physical Chemistry A, 2009, 113, 4015-4021.
70. P. Tiwana, P. Docampo, M. B. Johnston, H. J. Snaith and L. M. Herz, ACS
Nano, 2011, 5, 5158-5166.
71. P. Zhong, W. Que, J. Zhang, Q. Jia, W. Wang, Y. Liao and X. Hu, Journal of
Alloys and Compounds, 2011, 509, 7808-7813.
72. Y. Wang and F. Caruso, Advanced Functional Materials, 2004, 14, 1012-1018.
73. Y. Zhao and X. S. J. Z. L. J. C. Y. Z. S. Y. L. D. Zhu, ChemPhysChem, 2007, 8,
856-861.
74. W. Fan, M. A. Snyder, S. Kumar, P.-S. Lee, W. C. Yoo, A. V. McCormick, R.
Lee Penn, A. Stein and M. Tsapatsis, Nat Mater, 2008, 7, 984-991.
75. C.-Y. Cho and J. H. Moon, Langmuir, 2012, 28, 9372–9377.
76. B. Mandlmeier, J. M. Szeifert, D. Fattakhova-Rohlfing, H. Amenitsch and T.
Bein, Journal of the American Chemical Society, 2011, 133, 17274-17282.
77. S. Sun, L. Gao and Y. Liu, Applied Physics Letters, 2010, 96, 083113.
78. Y.-B. Tang, C.-S. Lee, J. Xu, Z.-T. Liu, Z.-H. Chen, Z. He, Y.-L. Cao, G. Yuan,
H. Song, L. Chen, L. Luo, H.-M. Cheng, W.-J. Zhang, I. Bello and S.-T. Lee,
ACS Nano, 2010, 4, 3482-3488.
79. N. Yang, J. Zhai, D. Wang, Y. Chen and L. Jiang, ACS Nano, 2010, 4, 887-894.
80. M.-Y. Yen, M.-C. Hsiao, S.-H. Liao, P.-I. Liu, H.-M. Tsai, C.-C. M. Ma, N.-W.
Pu and M.-D. Ger, Carbon, 2011, 49, 3597-3606.
81. S. R. Kim, M. K. Parvez and M. Chhowalla, Chemical Physics Letters, 2009,
483, 124-127.
82. M. F. Ashby, P. J. Ferreira and D. L. Schodek, in Nanomaterials,
Nanotechnologies and Design, Butterworth-Heinemann, Boston, 2009, pp. 1-16.
83. A. S. Edelstein, in Encyclopedia of Materials: Science and Technology (Second
Edition), eds. K. H. J. B. Editors-in-Chief: , W. C. Robert, C. F. Merton, I.
Bernard, J. K. Edward, M. Subhash and V. Patrick, Elsevier, Oxford, 2001, pp.
5916-5927.
84. in Frontiers of Nanoscience, ed. W. Gerhard, Elsevier, 2009, vol. Volume 1, p.

Chapter 1 49
Dye-sensitized Solar Cells: Improving Lifetime Stability and Performance
ii.
85. B. Bhushan, Springer Handbook of Nanotechnology, Springer, 2010.
86. C. A. F. Daniel L. Fedlheim, Metal Nanoparticles: Synthesis, Characterization,
and Applications, CRC, 2001.
87. P. R. Solanki, A. Kaushik, V. V. Agrawal and B. D. Malhotra, NPG Asia Mater,
2011, 3, 17-24.
88. K. D. Sattler, Handbook of Nanophysics: Nanotubes and Nanowires, CRC,
2010.
89. X. Sun and M. S. Saha, ed. J. Zhang, Springer London, 2008, pp. 655-714.
90. D. K. Ferry, Science, 2008, 319, 579-580.
91. R. Yan, P. Pausauskie, J. Huang and P. Yang, Proceedings of the National
Academy of Sciences, 2009, 106, 21045-21050.
92. C. Cheng and H. J. Fan, Nano Today, 2012, 7, 327-343.
93. R. H. Baughman, C. Cui, A. A. Zakhidov, Z. Iqbal, J. N. Barisci, G. M. Spinks,
G. G. Wallace, A. Mazzoldi, D. De Rossi, A. G. Rinzler, O. Jaschinski, S. Roth
and M. Kertesz, Science, 1999, 284, 1340-1344.
94. A. Salehi-Khojin, K. Y. Lin, C. R. Field and R. I. Masel, Science, 2010, 329,
1327-1330.
95. F. M. Toma, A. Sartorel, M. Iurlo, M. Carraro, P. Parisse, C. Maccato, S.
Rapino, B. R. Gonzalez, H. Amenitsch, T. Da Ros, L. Casalis, A. Goldoni, M.
Marcaccio, G. Scorrano, G. Scoles, F. Paolucci, M. Prato and M. Bonchio, Nat
Chem, 2010, 2, 826-831.
96. B. Y. Lee, M. G. Sung, J. Lee, K. Y. Baik, Y.-K. Kwon, M.-S. Lee and S. Hong,
ACS Nano, 2011, 5, 4373-4379.
97. X. Wang, X. Chen, L. Gao, H. Zheng, M. Ji, C. Tang, T. Shen and Z. Zhang,
Journal of Materials Chemistry, 2004, 14, 905-907.
98. J. R. Morber, Y. Ding, M. S. Haluska, Y. Li, J. P. Liu, Z. L. Wang and R. L.
Snyder, The Journal of Physical Chemistry B, 2006, 110, 21672-21679.
99. A. M. More, T. P. Gujar, J. L. Gunjakar, C. D. Lokhande and O. S. Joo, Applied
Surface Science, 2008, 255, 2682-2687.
100. Z. W. Pan, Z. R. Dai and Z. L. Wang, Science, 2001, 291, 1947-1949.

50 Introduction
Dye-sensitized Solar Cells: Improving Lifetime Stability and Performance
101. Z. Zhang, S. Brown, J. B. M. Goodall, X. Weng, K. Thompson, K. Gong, S.
Kellici, R. J. H. Clark, J. R. G. Evans and J. A. Darr, Journal of Alloys and
Compounds, 2009, 476, 451-456.
102. D. Chen, L. Cao, F. Huang, P. Imperial, Y. B. Cheng and R. A. Caruso, Journal
of the American Chemical Society, 2010, 132, 4438-4444.
103. Q. Zhang and G. Cao, Nano Today, 2011, 6, 91-109.
104. B. Huber, A. Brodyanski, M. Scheib, A. Orendorz, C. Ziegler and H. Gnaser,
Thin Solid Films, 2005, 472, 114-124.
105. K. Madhusudan Reddy, S. V. Manorama and A. Ramachandra Reddy, Materials
Chemistry and Physics, 2003, 78, 239-245.
106. L. Dloczik, O. Ileperuma, I. Lauermann, L. M. Peter, E. A. Ponomarev, G.
Redmond, N. J. Shaw and I. Uhlendorf, J. Phys. Chem. B, 1997, 101, 10281-
10289.
107. A. C. Fisher, L. M. Peter, E. A. Ponomarev, A. B. Walker and K. G. U.
Wijayantha, The Journal of Physical Chemistry B, 2000, 104, 949-958.
108. L. Forro, O. Chauvet, D. Emin, L. Zuppiroli, H. Berger and F. Lévy, Journal of
Applied Physics, 1994, 75, 633-635.
109. F. Cao, G. Oskam, G. J. Meyer and P. C. Searson, Journal of Physical
Chemistry, 1996, 100, 17021-17027.
110. J. Bisquert, The Journal of Physical Chemistry B, 2004, 108, 2323-2332.
111. J. Bisquert and I. n. Mora-Sero, The Journal of Physical Chemistry Letters,
2009, 1, 450-456.
112. J. van de Lagemaat and A. J. Frank, The Journal of Physical Chemistry B, 2001,
105, 11194-11205.
113. N. Kopidakis, K. D. Benkstein, J. van de Lagemaat and A. J. Frank, The Journal
of Physical Chemistry B, 2003, 107, 11307-11315.
114. C. Chen, M. Wang and K. Wang, The Journal of Physical Chemistry C, 2009,
113, 1624-1631.
115. Q. Wang, S. Ito, M. Gratzel, F. Fabregat-Santiago, I. Mora-Sero, J. Bisquert, T.
Bessho and H. Imai, J. Phys. Chem. B, 2006, 110, 25210-25221.
116. K. Fan, T. Peng, J. Chen and K. Dai, Journal of Power Sources, 2011, 196,

Chapter 1 51
Dye-sensitized Solar Cells: Improving Lifetime Stability and Performance
2939-2944.
117. A. Hagfeldt, G. Boschloo, L. Sun, L. Kloo and H. Pettersson, Chemical Reviews,
2010, 110, 6595-6663.
118. L. Bertoluzzi and S. Ma, Physical Chemistry Chemical Physics, 2013, 15, 4283-
4285.
119. C.-H. Ku and J.-J. Wu, Applied Physics Letters, 2007, 91, 093117.
120. M. Samadpour, N. Taghavinia, A. Iraji-zad, M. Marandi and F. Tajabadi, Eur.
Phys. J.-Appl. Phys, 2012, 57.
121. T.-S. Kang, A. P. Smith, B. E. Taylor and M. F. Durstock, Nano Letters, 2009,
9, 601-606.
122. D. K.-P. Wong, C.-H. Ku, Y.-R. Chen, G.-R. Chen and J.-J. Wu,
ChemPhysChem, 2009, 10, 2698-2702.
123. X. Gan, X. Li, X. Gao, F. Zhuge and W. Yu, Thin Solid Films, 2010, 518, 4809-
4812.
124. R. Zhang, A. A. Elzatahry, S. S. Al-Deyab and D. Zhao, Nano Today, 2012, 7,
344-366.
125. A. Moezzi, A. M. McDonagh and M. B. Cortie, Chemical Engineering Journal,
2012, 185–186, 1-22.
126. R. R. Hasiguti and E. Yagi, Physical Review B, 1994, 49, 7251-7256.
127. L.-c. Ji, L. Huang, Y. Liu, Y.-q. Xie, F. Liu, A.-y. Liu and W.-z. Shi, Thin Solid
Films, 2011, 519, 3789-3791.
128. Y. J. Kim, M. H. Lee, H. J. Kim, G. Lim, Y. S. Choi, N.-G. Park, K. Kim and W.
I. Lee, Advanced Materials, 2009, 21, 3668-3673.
129. S. Costacurta, L. Biasetto, E. Pippel, J. Woltersdorf and P. Colombo, Journal of
the American Ceramic Society, 2007, 90, 2172-2177.
130. P. C. Angelomé, M. C. Fuertes and G. J. A. A. Soler-Illia, Advanced Materials,
2006, 18, 2397-2402.
131. C. Kuo and S. Lu, Nanotechnology, 2008, 19, 095705.
132. G.-S. Shao, L. Liu, T.-Y. Ma and Z.-Y. Yuan, Chemical Engineering Journal,
2011, 174, 452-460.
133. Y. Cao, Y. Bai, Q. Yu, Y. Cheng, S. Liu, D. Shi, F. Gao and P. Wang, The

52 Introduction
Dye-sensitized Solar Cells: Improving Lifetime Stability and Performance
Journal of Physical Chemistry C, 2009, 113, 6290-6297.
134. E. J. W. Crossland, N. Noel, V. Sivaram, T. Leijtens, J. A. Alexander-Webber
and H. J. Snaith, Nature, 2013, 495, 215-219.
135. K. S. Novoselov, A. K. Geim, S. V. Morozov, D. Jiang, Y. Zhang, S. V.
Dubonos, I. V. Grigorieva and A. A. Firsov, Science, 2004, 306, 666-669.
136. Z.-S. Wu, G. Zhou, L.-C. Yin, W. Ren, F. Li and H.-M. Cheng, Nano Energy,
2012, 1, 107-131.
137. S. Yang, X. Feng and K. Müllen, Advanced Materials, 2011, 23, 3575-3579.
138. M. F. Craciun, S. Russo, M. Yamamoto and S. Tarucha, Nano Today, 2011, 6,
42-60.
139. A. Peigney, C. Laurent, E. Flahaut, R. R. Bacsa and A. Rousset, Carbon, 2001,
39, 507-514.
140. I. C. Robin, A. Jouini, C. Tavares, J. Rothman, G. Feuillet, D. Ehrentraut and T.
Fukuda, J Korean Phys Soc, 2008, 53, 2888-2892.
141. Y. H. Ng, I. V. Lightcap, K. Goodwin, M. Matsumura and P. V. Kamat, The
Journal of Physical Chemistry Letters, 2010, 1, 2222-2227.
142. N. J. Bell, Y. H. Ng, A. Du, H. Coster, S. C. Smith and R. Amal, The Journal of
Physical Chemistry C, 2011, 115, 6004-6009.
143. J. Du, X. Lai, N. Yang, J. Zhai, D. Kisailus, F. Su, D. Wang and L. Jiang, ACS
Nano, 2010, 5, 590-596.
144. D. W. Zhang, X. D. Li, H. B. Li, S. Chen, Z. Sun, X. J. Yin and S. M. Huang,
Carbon, 2011, 49, 5382-5388.
145. R. Cruz, D. A. Pacheco Tanaka and A. Mendes, Solar Energy, 2012, 86, 716-
724.
146. M.-H. Yeh, C.-L. Sun, J.-S. Su, L.-Y. Lin, C.-P. Lee, C.-Y. Chen, C.-G. Wu, R.
Vittal and K.-C. Ho, Carbon, 2012, 50, 4192-4202.
147. T.-D. Nguyen-Phan, V. H. Pham, E. W. Shin, H.-D. Pham, S. Kim, J. S. Chung,
E. J. Kim and S. H. Hur, Chemical Engineering Journal, 2011, 170, 226-232.
148. B. Tang and G. Hu, Journal of Power Sources, 2012, 220, 95-102.
149. Z. Liu, J. T. Robinson, X. Sun and H. Dai, Journal of the American Chemical
Society, 2008, 130, 10876-10877.

Chapter 1 53
Dye-sensitized Solar Cells: Improving Lifetime Stability and Performance
150. D. Li, M. B. Muller, S. Gilje, R. B. Kaner and G. G. Wallace, Nat Nano, 2008, 3,
101-105.
151. G. I. Titelman, V. Gelman, S. Bron, R. L. Khalfin, Y. Cohen and H. Bianco-
Peled, Carbon, 2005, 43, 641-649.
152. T. N. Murakami and M. Grätzel, Inorganica Chimica Acta, 2008, 361, 572-580.
153. K. Imoto, K. Takahashi, T. Yamaguchi, T. Komura, J.-i. Nakamura and K.
Murata, Solar Energy Materials and Solar Cells, 2003, 79, 459-469.
154. L. Kavan, J. H. Yum and M. Grätzel, ACS Nano, 2010, 5, 165-172.
155. A. Gray, M. Balooch, S. Allegret, S. D. Gendt and W.-E. Wang, Journal of
Applied Physics, 2008, 104, 053109.
156. M. Freitag, Nat Nano, 2008, 3, 455-457.
157. R. Czerw, B. Foley, D. Tekleab, A. Rubio, P. M. Ajayan and D. L. Carroll,
Physical Review B, 2002, 66, 033408.
158. J. W. G. Wilder, L. C. Venema, A. G. Rinzler, R. E. Smalley and C. Dekker,
Nature, 1998, 391, 59-62.
159. IEC-61646, Thin-film terrestrial photovoltaic (PV) modules - Design
qualification and type approval, 2008.
160. M. I. Asghar, K. Miettunen, J. Halme, P. Vahermaa, M. Toivola, K. Aitola and
P. Lund, Energy & Environmental Science, 2010, 3, 418-426.
161. R. Harikisun and H. Desilvestro, Solar Energy, 2011, 85, 1179-1188.
162. L. Tao, Z. Huo, Y. Ding, Y. Li, S. Dai, L. Wang, J. Zhu, X. Pan, B. Zhang, J.
Yao, M. K. Nazeeruddin and M. Gratzel, Journal of Materials Chemistry A,
2015, 3, 2344-2352.
163. P. M. Sommeling, M. Späth, H. J. P. Smit, N. J. Bakker and J. M. Kroon,
Journal of Photochemistry and Photobiology A: Chemistry, 2004, 164, 137-144.
164. P. Wang, S. Zakeeruddin, J. Moser, M. Nazeeruddin, T. Sekiguchi and M.
Grätzel, Nat Mater, 2003, 2, 402-407.
165. A. Hinsch, J. Kroon, R. Kern, I. Uhlendorf, J. Holzbock, A. Meyer and J. Ferber,
Progress in Photovoltaics: Research and Applications, 2001, 9, 425-438.
166. M. Toivola, J. Halme, L. Peltokorpi and P. Lund, International Journal of
Photoenergy, 2009, 2009, 15.

54 Introduction
Dye-sensitized Solar Cells: Improving Lifetime Stability and Performance
167. K. Miettunen, J. Halme and P. Lund, The Journal of Physical Chemistry C,
2009, 113, 10297-10302.
168. M. Ikegami, J. Suzuki, K. Teshima, M. Kawaraya and T. Miyasaka, Solar
Energy Materials and Solar Cells, 2009, 93, 836-839.
169. W. J. Lee, E. Ramasamy, D. Y. Lee and J. S. Song, Solar Energy Materials and
Solar Cells, 2008, 92, 814-818.
170. E. Ramasamy, W. J. Lee, D. Y. Lee and J. S. Song, Applied Physics Letters,
2007, 90, 173103.
171. N. Papageorgiou, W. Maier and M. Grätzel, Journal of The Electrochemical
Society, 1997, 144, 876-884.
172. W. Kubo, S. Kambe, S. Nakade, T. Kitamura, K. Hanabusa, Y. Wada and S.
Yanagida, The Journal of Physical Chemistry B, 2003, 107, 4374-4381.
173. B. Macht, M. Turrión, A. Barkschat, P. Salvador, K. Ellmer and H. Tributsch,
Solar Energy Materials and Solar Cells, 2002, 73, 163-173.
174. F. O. Lenzmann and J. M. Kroon, Advances in OptoElectronics, 2007, 2007, ID
65073.
175. J. M. Kroon, N. J. Bakker, H. J. P. Smit, P. Liska, K. R. Thampi, P. Wang, S. M.
Zakeeruddin, M. Grätzel, A. Hinsch, S. Hore, U. Würfel, R. Sastrawan, J. R.
Durrant, E. Palomares, H. Pettersson, T. Gruszecki, J. Walter, K. Skupien and G.
E. Tulloch, Progress in Photovoltaics: Research and Applications, 2007, 15, 1-
18.
176. H. Greijer Agrell, J. Lindgren and A. Hagfeldt, Solar Energy, 2003, 75, 169-180.
177. H. Pettersson and T. Gruszecki, Solar Energy Materials and Solar Cells, 2001,
70, 203-212.
178. M. K. I. Senevirathna, P. K. D. D. P. Pitigala, E. V. A. Premalal, K. Tennakone,
G. R. A. Kumara and A. Konno, Solar Energy Materials and Solar Cells, 2007,
91, 544-547.
179. M. Ye, X. Wen, M. Wang, J. Iocozzia, N. Zhang, C. Lin and Z. Lin, Materials
Today, 2015, 18, 155-162.
180. F. Kong, S. Dai and K. Wang, Advances in OptoElectronics, 2007, 2007, 75384.

CHAPTER 2 Development and Optimization of a laser
sealing process for DSC devices
“No man is an island”
John Donne

Adapted from the peer-reviewed article
F. Ribeiro, J. Maçaira, R. Cruz, J. Gabriel, L. Andrade, A. Mendes, Laser assisted
glass frit sealing of dye-sensitized solar cells. Solar Energy Materials and Solar Cells,
2012. 96(1): p. 43-49.
and international patent
A. Mendes, L. Andrade, J. Mendes, F. Ribeiro, J. Nogueira “Substrate and electrode
for solar cells and the corresponding manufacturing process”, PCT/IB2012/051376
and WO2012/127443, 2012.

2
Development and Optimization of a Laser
Sealing Process for DSC devices
2.1 Introduction
Long-term stability is a basic requirement for all solar cell technologies. Despite all
the efforts to enhance DSCs performance, long-term stability is still a major issue that
limits market implementation. In fact, for building-integrated photovoltaic (BIPV)
applications it is expectable that DSCs performance remains stable for no less than 25
years1. The long-term stability problem of DSCs is directly related to the commonly
employed sealing methods, which use thermoplastic sealants such as Surlyn® or
Bynel®. Although being the most used sealants, they originate poor device
encapsulation with consequent contamination with external oxygen and humidity and
electrolyte leakage, which result in quite reduced DSC lifetime.
Other sealing methods are also used to encapsulate DSCs2-7
, such as the thermo-
compressive glass frit bonding process8, 9
. This sealing method is quite interesting since
it has been demonstrated that lead-free glass frits are thermal and mechanical stable
barriers, as well as chemically inert towards the electrolyte. However, the thermo-
compressive method requires the use of high processing temperatures (> 440 °C) and
long process times with mechanical pressure to ensure an appropriate sealing2,9
. This

58 Development and optimization of a laser sealing process for DSC devices
Dye-sensitized Solar Cells: Improving Lifetime Stability and Performance
results in high manufacturing costs and process complexity, which compromises the
expected low cost of DSCs.
The present work focuses on the development of an innovative laser-assisted glass
frit sealing process. It is proposed a cost-effective, fast and leak-free sealing process
for DSCs. Lasers are used in a wide range of bonding processes10-13
, such as low
temperature direct glass bonding14
and pulsed laser for direct joining glass substrates11
.
However, these processes cannot be used in DSCs devices since photoelectrode and
counter-electrode should be spaced by ca. 40 µm. In the present work an intermediate
layer is used that acts simultaneously as spacer and as sealing layer. This bonding layer
consists of a commercial low melting point glass frit paste that upon laser melting
allows glass-glass-glass sealing. This glass sealing has to be performed at a substrate
temperature such as tensions originated by differential thermal expansions are
dissipated. This temperature is, however, significantly lower than the temperature
required in thermo-compressive bonding methods. The feasibility of this laser-assisted
glass frit paste sealing procedure is investigated and the optimized laser operating
conditions are discussed. Different tests were performed to the sealed samples and
conclusions are drawn concerning the quality of the implemented solutions.
2.2 Materials and methods
2.2.1 Glass frit sealant
The presence of a liquid electrolyte in DSCs requires that a hermetic sealing is
obtained to reach long term stability. Thus, the sealing material has to meet several
requirements15
:
chemical stability in contact with the corrosive liquid electrolyte;
excellent barrier properties and particularly no permeability towards water
and oxygen;
good adhesion to the TCO glass;
processing compatibility with DSC components (maximum process
temperatures of PE and CE are ca. 500 ºC and 450 ºC, respectively);
thermal expansion similar to the TCO glass substrates;

Chapter 2 59
Dye-sensitized Solar Cells: Improving Lifetime Stability and Performance
low melting point;
high absorbance to the wavelength of the laser beam.
Glass frits are glass powders usually milled into grain sizes lower than 15 μm.
Then, they are transformed into a printable paste by mixing organic binders and
solvents. A mixture of a lead-free bismuth borosilicate-based glass frit paste (AGC-
ASAHI glass Company, Ltd) was used ‒ Table 2.1. According to the manufacturer, the
glass paste has a thermal expansion coefficient (ψ) of 7.5 × 10⁻⁶
ºC-1
, which closely
matches the standard glass substrates of DSCs (soda-lime glass, 8.3 × 10⁻⁶
ºC-1
to 8.9 ×
10-6
ºC-1 16
). This characteristic is particularly important because the final PV device is
subjected to temperature variations that cause materials to expand and contract
throughout its lifetime; these mechanical expansions stress the bonding interface
usually causing micro fissures that eventually originate sealing failures16
. Figure 2.1
shows the particle size distribution of the glass paste used (Beckman Coulter LSTM
230
particle size analyzer). A bimodal distribution was determined with particle sizes
between 30 nm and 3.0 μm.
Table 2.1 Properties of the chosen glass paste (as provided from manufacturer)
Glass paste Glass type
Firing
condition/
ºC-min
ψ x10-6 /
ºC-1 Tg / ºC Ts / ºC
Viscosity /
Pa·s
5115HT1 SiO2.BiO3·ZnO 450-10 7.5 355 415 140
Figure 2.1 Size distribution of the glass frit particles present in the glass paste.

60 Development and optimization of a laser sealing process for DSC devices
Dye-sensitized Solar Cells: Improving Lifetime Stability and Performance
The glass substrates used were 2.2 mm thick soda-lime based (TEC15 from
Dyesol, Ltd) coated with a conductive fluorine doped tin dioxide layer, SnO2:F (ca.
500 nm and 15Ω·-1
). Before deposition of the glass paste on the glass substrates, these
were washed sequentially with a detergent solution (Alconox®, VWR) in an ultrasonic
cleaner (Amsonic TTC 2530) at 55 ºC for 15 min, followed by ultrasonic cleaning in
deionized water at room temperature and dried with air at 50 ºC. Afterwards, they were
additionally cleaned for 20 min in a UV/O3 system (UVO-Cleaner® model 42-220).
The glass paste was homogenized on a mixer mill (Retsch® MM mill) using a
zirconium oxide grinding jar with zirconium oxide balls before use. The deposition of
the glass paste was done by screen-printing using a screen made of a stainless steel net
200 mesh/in coated with a suitable resin. This printing technique provides precise
deposition of the glass paste perimeter with the shape and dimensions required to form
the seal and spacer of the solar cell. Glass paste rectangles with dimensions of 18.5 ×
8.5 mm2 and 0.8 mm width were screen-printed on the FTO face of the glass
substrates. The printed height of the glass paste was about 40 μm, which provides
adequate gap between sealed electrodes to hold the PE and CE materials.
2.2.2 Glass paste thermal conditioning
Before the electrode assembly and the actual sealing, a thermal conditioning of the
glass paste was carried out. The electrodes were fired at 450 ºC during 10 min,
according to the manufacturer specifications shown in Table 2.1. Nonetheless the
thermal conditioning had to be optimized beyond manufacturer specifications to get a
void-free sealing cord between both FTO-coated glass substrates. Figure 2.2 shows the
thermal conditioning tests conducted for obtaining a void-free sealing cord between
both FTO-coated glass substrates. Organic binders and volatile solvents present in the
glass paste provide an appropriate rheology suitable to the screen-printing deposition
process; however, they are not required for the glass-glass bonding process. If traces of
solvents and organics are still present in the paste when the glass/glass frit melting
takes place, the final sealing between glasses will have voids left by the evaporation of
these components, which compromise its robustness. Therefore the pre-conditioning
step is crucial for obtaining a void-free sealing cord between both FTO-coated glass

Chapter 2 61
Dye-sensitized Solar Cells: Improving Lifetime Stability and Performance
substrates. The thermal conditioning tests performed, shown in Figure 2.2, started with
the manufacturer specifications (test A, 450 ºC during 10 min) and were gradually
upgraded to get a sealing cord free of voids (test E). Figure 2.3 shows images
comparing the final appearance of a glass cord submitted to test A heating profile
(Figure 2.3 a and c) and test E (Figure 2.3b and d). It was found out that intermediate
steps are essential for efficiently remove all solvents and organics from the glass paste.
The best thermal conditioning profile (test E) considers a step at 250 ºC for 30 min to
drive out the solvents, followed by an organic burn out at 350 ºC for 30 min and glass
frit glazing at 470 ºC for 30 min until the surface has a glossy appearance.
Figure 2.2 Optimization of the thermal conditioning history applied to the printed
glass paste.

62 Development and optimization of a laser sealing process for DSC devices
Dye-sensitized Solar Cells: Improving Lifetime Stability and Performance
Figure 2.3 Micrographs (50x) taken to the laser assisted sealed sample with glass
paste thermal conditioning: a) and c) according to manufacturer specifications (test
A in Figure 2.2); b) and d) with the optimized thermal conditioning (test E in Figure
2.2).
2.2.3 LaserBox equipment
The sealing process takes place in an in-house made “LaserBox” equipment shown
schematically in Figure 2.4. LaserBox comprises a laser source connected to a laser-
scan head using an optic fiber and a controlled heating plate. Ytterbium fiber-delivery
laser diode array (IPG photonics) with a wavelength of 1080 nm was used. The 2D
optical scan head directs the laser beam through f-theta lens to the sample on top of the
heating plate. The scan head software application Waverunner® allows controlling the
laser shooting pattern as well as the beam velocity. An in-house developed National
Instruments LabVIEW®
application was used to control and acquire the laser source
parameters during operation (laser power, firing time, laser temperature, etc.) – Figure
B.1 and B.2 in shown appendix. Parallel to the laser and scan head control software, a
PID algorithm ran in another LabVIEW® application to control the heated plate
temperature (T5) and to acquire the signal of four K-type thermocouples that were
placed in different locations of the sample (T1 to T4) to record the temperature histories
during the sealing process. A picture of the LaserBox is shown in Figure 2.5.

Chapter 2 63
Dye-sensitized Solar Cells: Improving Lifetime Stability and Performance
Figure 2.4 Schematic diagram of the LaserBox used for sealing DSC devices.
Figure 2.5 Photograph of the LaserBox equipment where the laser assisted sealing
process is conducted.

64 Development and optimization of a laser sealing process for DSC devices
Dye-sensitized Solar Cells: Improving Lifetime Stability and Performance
2.2.4 Sealing Procedure
Following the glass paste thermal conditioning, the substrates with the glass paste
(Figure 2.6a) were aligned and assembled together (Figure 2.6b). The sandwiched cells
were then transferred to the “LaserBox” and placed on the controlled heating plate. A
heating rate of 10 °C·min-1
was applied up to end temperature to avoid the formation of
internal tensions in the glass substrates during the laser sealing process16
. After thermal
equilibration of the sealing cell is obtained, the laser beam is pointed to the glass frit
perimeter and fired following a specific scan pattern described elsewhere17
.
After laser sealing, the heating plate is turned off and samples cool down to room
temperature. For comparison purposes, Surlyn® sealed cells were also prepared.
Commercial Surlyn® sealing film with thickness of 25 μm (Meltonix 1170-25,
Solaronix) was laser cut (Versalaser VLS 2.30) to match the exact dimensions of the
glass paste cord used in the laser assisted sealing method. Glass substrates were sealed
in a hot press at 160 ºC, by applying 10 bar for 20 seconds.
Figure 2.6 Picture of FTO glass substrates a) with printed glass paste and b) the
assembled glass substrates spaced by glass frit sealant.
2.2.5 Thermal cycling tests
To determine the ability of the sealed samples to withstand thermal mismatch,
fatigue and other stresses caused by repeated temperature changes, temperature cycling
tests were conducted in a thermal chamber Aralab FitoClima 300 (Figure 2.7a). The
test followed the international standard IEC 61646 for thin-film terrestrial PV modules,
which requires 200 cycles to be performed. Each cycle consists on temperature ranging

Chapter 2 65
Dye-sensitized Solar Cells: Improving Lifetime Stability and Performance
from -40 ºC to 85 ºC, with heating and cooling rates of 1.5 ºC·min-1
and 10 min of dwell
time - Figure 2.7.
Figure 2.7 a) Thermal chamber Aralab FitoClima 300 where thermal cycling tests
were performed and b) cycle characteristics according to international standard IEC
61646.
2.2.6 Leak and shear stress tests
Leak tests were performed using helium gas to determine the effectiveness and
tightness of the seal. There are several standard leakage tests but none of them refer to
photovoltaic devices such as DSCs. Therefore, the tests performed followed a
procedure described in the MIL-STD-883H test method standard (method 1014.13-A1)
for microcircuits suitable for use within military and aerospace electronic systems (US
Department of Defense). The experimental apparatus required for the procedure is
shown in Figure 2.8 and considers a pressure chamber (C1), a vacuum chamber (C2)
and a mass spectrometer-type leak detector (Alcatel, ASM 142 D). The volume of the
chamber used for leak rate measurement should be held to the minimum practical,
since this chamber volume has an adverse effect on sensitivity limits.

66 Development and optimization of a laser sealing process for DSC devices
Dye-sensitized Solar Cells: Improving Lifetime Stability and Performance
Figure 2.8 Experimental setup for leak rate determination according to the MIL-
STD-883H test method standard: a) pressurization step and b) helium leak
measurement.
The sealed device is placed in chamber C1 to which is applied vacuum and then
pressurized with a tracer gas of 97.5 ± 2.5 % purity helium for the required time (t1)
and pressure (P1). The pressure is then relieved and each specimen transferred (the
transfer must occur within a maximum interval of time of t2) to the next chamber (C2),
which is connected to the evacuating system and a mass-spectrometer leak detector.
When the chamber is evacuated, any tracer gas which was previously forced into the
specimen inner volume will thus be drawn out and analyzed by the leak detector (R1).
The cells were tested using the appropriate conditions specified in the MIL-STD-883H
standard (Table 2.2) for the cavity volume of the package under test (~0.006 cm3): 75
Psia (5.2 bar) for 4 h and maximum dwell time of 1 h.

Chapter 2 67
Dye-sensitized Solar Cells: Improving Lifetime Stability and Performance
Table 2.2 Leak test conditions according to MIL-STD-883H
Package
volume/ cm3
Pressure /
Psia ± 2
Minimum exposure
time (t1) / h
Maximum
dwell (t2) / h
Reject limit atm cm3/s
He
<0.05 75 2 1 5 x 10⁻⁸
>0.05 - <0.5 75 4 1 5 x 10⁻⁸
>0.5 - <1.0 45 2 1 1 x 10⁻⁷
>1.0 - <10.0 45 5 1 5 x 10⁻⁸
>10.0 - <20.0 45 10 1 5 x 10⁻⁸
The shear stress tests are essential to assess the mechanical resistance of the
devices. They are particularly important to determine the future PV device ability to
withstand wind, snow and ice loads. The tests were performed according to
International standard ISO 13445 (“Adhesives – Determination of shear stress of
adhesive bonds between rigid substrates by block-shear method”). The test specimens
were 90 x 30 mm2
glass devices sealed with 43 mm2 of glass frit. They were subjected
to mechanical shear tests by a universal traction equipment (TIRA GmbH universal
machine) with a load cell Typ 32 500N from HBM. The traction equipment was set to 5
mm/min and a maximum transducer load of 500 N.
2.2.7 DSC performance characterization
The prepared DSCs were characterized by their current-voltage (I-V) curves and
electrochemical impedance spectroscopy (EIS). I-V characteristic curves were obtained
in a setup equipped with a 1600 W xenon light source (Oriel class B solar simulator,
Newport, USA) with variable light intensity, from 10 to 100 mW·cm-2
(0.1 to 1 sun
light intensity), and using a 1.5 air mass filter (Newport, USA). The simulator was
calibrated using a single crystal Si photodiode (Newport, USA). The I-V characteristics
of the solar cells were obtained applying an external potential load and measuring the
generated photocurrent using an AUTOLAB electrochemical station. This station was
also used to characterize the cells trough EIS. The frequency range for EIS
measurements was from 100 kHz to 0.05 Hz with an AC modulation signal of 10 mV.
EIS measurements were carried out in dark and at the open circuit potential (Voc)
measured at 1 sun.

68 Development and optimization of a laser sealing process for DSC devices
Dye-sensitized Solar Cells: Improving Lifetime Stability and Performance
2.3 Results and Discussion
2.3.1 Response surface methodology
The LaserBox equipment has several operating parameters and a systematic
optimization should be followed to obtain the best operating conditions. A response
surface methodology (RSM) implemented in commercial software (JMP 8.0.2, SAS
software) was applied. This method combines mathematical and statistic tools for
studying in an effective way processes where responses are dependent on several
operating variables18
. In this work the central composite design (CCD) method was
considered for fitting the second order models obtained. The quality of the glass frit
sealing (Qfrit) obtained after the laser-assisted bonding process was chosen for the
working function; the glass frit quality was assessed visually and rated from 1 (worst)
to 10 (best). The visual assessment took into account the final aspect of the sealed cells
in terms of: damaged glass, cracks in the sealing cord, burned glass frit and bubble
formation. The factors identified that affect the process response and considered for the
optimization are: temperature of the heating plate where the glass samples are placed
(Tp), laser power (Pl) and laser-scanning velocity (vl). Table 2.3 shows the design
factors and levels. A three factor central composite design was built with three center
points. For generating the design matrices (shown in Appendix, Table A1) coded
factors (Xi) ranging from -1 to +1 were used. The coded factors are computed from
their actual values (xi), middle value and the semi-variation interval as shown in
equation (2.1)19
.
Table 2.3 CCD factors and respective levels.
Factor Symbol Level
-1 0 1
Tp / °C x1 280 305 330
Pl / W x2 20 35 50
vl / mm·s-1
x3 300 400 500

Chapter 2 69
Dye-sensitized Solar Cells: Improving Lifetime Stability and Performance
𝑋1 =𝑥1 − 305
25; 𝑋2 =
𝑥2 − 35
15; 𝑋3 =
𝑥3 − 400
100; (2.1)
2.3.2 Process Modeling
A second order polynomial equation was fitted to the process response:
𝑦 = 𝑎0 + ∑ 𝑎𝑖𝑋𝑖
3
𝑖=1
+ ∑ ∑(𝑎𝑖𝑗𝑋𝑖𝑋𝑗 + 𝑎𝑖𝑖𝑋𝑖2)
3
𝑗=1
3
𝑖=1
(2.2)
where y is the process response, Xi are the dimensionless process factors, a0 is the
interception coefficient, ai are the coefficients related to the dimensionless factors Xi,
aij correspond to the cross interaction between different factors and aii are the
coefficients related to the quadratic effects (curvature)20
.
A standard least squares analysis was performed and the p-values (Prob > F) were
used to assess the relevance of each factor to the process response, where a p-value
smaller than 0.05 indicates a high relevance and between 0.05 and 0.15 indicates a
marginal relevance. Finally, if p-values are higher than 0.15 the corresponding
parameter has a negligible effect on the response 18
. Following this criterion the heating
plate temperature (X1) was removed from the initial model. The final model is then:
𝑦 = 5.700 + 2.306𝑋2 − 1.944𝑋22 − 1.444𝑋3
2 (2.3)
where all factors have a p-value smaller than 0.01.
The fitting model can be used to predict the response values within the range of the
factors.
Figure 2.9 compares the predicted with the experimental results for the same
operating conditions – parity plot. The plot indicates a good agreement with the
experimental results.

70 Development and optimization of a laser sealing process for DSC devices
Dye-sensitized Solar Cells: Improving Lifetime Stability and Performance
Figure 2.9. Parity graph concerning the sealing process optimization (R2=0.87).
Based on the interpolating model, the operating conditions that produce the best
glass bonding are given in Table 2.4. Although the temperature of the heating plate was
not included in the model it was decided to perform the sealing at the highest possible
temperature, i.e. 330 °C. For the optimal operating conditions, the laser beam
completes a sealing loop in about 1.8 seconds. The predicted sealing quality for the
operating conditions is 6.3 ± 1.0.
Table 2.4 Determined optimal operating conditions and predicted response.
Factor value Qfrit
Laser Power / W 44 6.3±1.0
Laser scan velocity / mm·s-1
400
A new run was performed using the optimized operating conditions, resulting in
very good sealed samples with high reproducibility. The experimental results were
rated with relative sealing quality of 7. Figure 2.10 shows the laser sealed glass
substrates sealed, alongside with a Surlyn® sealed sample for comparison.
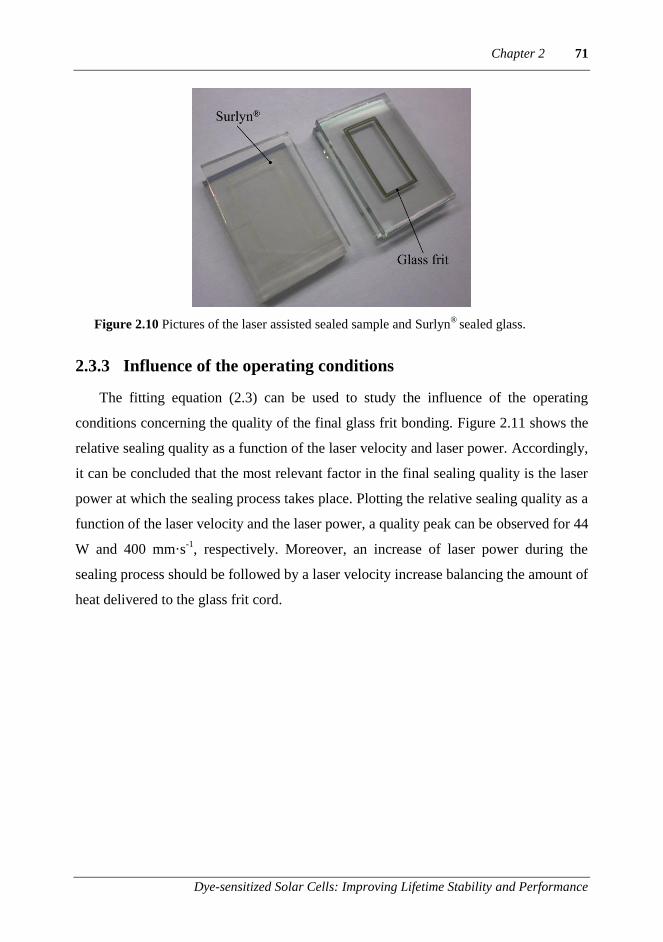
Chapter 2 71
Dye-sensitized Solar Cells: Improving Lifetime Stability and Performance
Figure 2.10 Pictures of the laser assisted sealed sample and Surlyn®
sealed glass.
2.3.3 Influence of the operating conditions
The fitting equation (2.3) can be used to study the influence of the operating
conditions concerning the quality of the final glass frit bonding. Figure 2.11 shows the
relative sealing quality as a function of the laser velocity and laser power. Accordingly,
it can be concluded that the most relevant factor in the final sealing quality is the laser
power at which the sealing process takes place. Plotting the relative sealing quality as a
function of the laser velocity and the laser power, a quality peak can be observed for 44
W and 400 mm·s-1
, respectively. Moreover, an increase of laser power during the
sealing process should be followed by a laser velocity increase balancing the amount of
heat delivered to the glass frit cord.

72 Development and optimization of a laser sealing process for DSC devices
Dye-sensitized Solar Cells: Improving Lifetime Stability and Performance
Figure 2.11 Relative sealing quality as a function of laser velocity and laser power.
2.3.4 Temperature history during the laser sealing process
Temperature history readings were obtained during the sealing process at several
sample positions (T1 to T5) according to Figure 2.4. Figure 2.12 shows that, due to the
used scan pattern17
, each position of the glass frit is hit by the laser ca. 14 times during
the sealing of the sample. The temperature on the border of the cord (T2) is lower than
at the center of the cord (T1), where the laser beam hits directly the paste. Lateral
heating caused by the laser beam is already quite small at 1 mm away from the glass
cord - Figure 2.12b. The glass paste heats significantly more than the glass substrate,
due to its high absorbance in the near infra-red part of the spectrum (wavelength of the
laser is 1080 nm). The optical characteristics of the glass paste and the bare TCO glass

Chapter 2 73
Dye-sensitized Solar Cells: Improving Lifetime Stability and Performance
were obtained by spectrophotometry (Shimadzu UV-3600) and their absorbance
spectrum is presented in Figure 2.13.
Figure 2.12 a) Temperature histories during the laser assisted sealing process,
measured at different positions from the glass frit; and b) Maximum temperature
recorded by the thermocouples as a function of their relative position.
Figure 2.13 a) Near IR absorbance spectrum for the used glass paste b) and glass
substrate c).

74 Development and optimization of a laser sealing process for DSC devices
Dye-sensitized Solar Cells: Improving Lifetime Stability and Performance
2.3.5 SEM and elemental analysis
The sealed samples were characterized by scanning electron microscopy (SEM)
analysis. A glass-sealed device sealed at the best operating conditions was sectioned,
polished and analyzed by SEM – Figure 2.14. The glass frit cord is free of occluded
gas and has an excellent contact with both substrates with no cracks between the glass
frit sealant and glass substrates. The distance between the glass substrates is 36 μm,
which results in an appropriate gap between electrodes to host DSC inner components
(typical TiO2 photoanode thickness ranges from 2 to 20 μm21, 22
).
Figure 2.14 SEM micrograph of a cross section of the glass frit cord prepared by the
laser assisted process.
Elemental analysis performed along a sealed sample (Figure 2.15) confirmed the
glass frit composition provided by the manufacturer: it is mainly composed of bismuth
oxide matrix embedded with particles of silica, aluminum and zinc oxide. The main
constituents of glass are silica, sodium and magnesium.

Chapter 2 75
Dye-sensitized Solar Cells: Improving Lifetime Stability and Performance
Figure 2.15 Elemental analysis profile of a cross section of a glass bonding layer
using the laser assisted sealing process.
2.3.6 Leak and shear stress tests
The laser-sealed cells were tested for leakage according to standard MIL-STD-
883H described previously in section 2.2.6. For comparison, Surlyn® sealed cells of
similar dimensions (as shown in Figure 2.10) were also tested. Briefly, helium tracer
gas was forced into the specimen inner volume, and then drawn out and analyzed by a
calibrated helium mass spectrometer. Four types of analysis were performed: blank
tests (air), FTO glass, Surlyn® sealed glass and laser sealed glass (LAGF). The Surlyn
®
sealed devices were tested right after preparation (as described in section 2.2.4); the
LAGF samples were tested after enduring temperature cycling tests (200 cycles, from -
40 to 85ºC as described in section 2.2.5). The results, presented in Figure 2.16, showed
that the Surlyn® sealed samples exhibited the largest leakages, above the rejection limit
required by standard MIL-STD-883H. The laser sealed samples passed the
encapsulation standard, even after 200 cycles of thermal cycles according to IEC
61646 for thin-film terrestrial PV modules. The results of leakage rate of LAGF

76 Development and optimization of a laser sealing process for DSC devices
Dye-sensitized Solar Cells: Improving Lifetime Stability and Performance
samples are comparable with plain FTO glass, which confirms the excellent
encapsulation properties of the developed sealing process.
Figure 2.16 Blank leakage rate and leakage rate obtained with Surlyn® and laser-
assisted sealed devices (LAGF).
The strength tests are essential to evaluate the sealing process since the bonding
process must be strong enough to allow the scale up of the DSC technology. The glass
frit bonding layer is tested in different segments lengths and in different directions as
described in ISO 13445 (section 2.2.6). The results showed that the maximum shear
stress that the glass sealed samples (18.5 × 8.5 mm2 with 43 mm
2 of sealed glass frit)
withstands is ca. 250 N. This means that the glass paste sealed cord withstands ca. 5.8
N·mm-2
. The requirement for edge seal strength for glass in buildings according to
European norm EN 1279-4 is shown in Figure 2.17: sealant failure corresponds to
breakage of sealant inside the red triangle. The laser sealed samples clearly passed the
specified requirements, which clears the developed sealing for use as seal in BIPV.

Chapter 2 77
Dye-sensitized Solar Cells: Improving Lifetime Stability and Performance
Figure 2.17 Applied force vs. elongation of laser sealed glass samples with 43 mm2
of sealed area; the red triangle corresponds to the sealant failure area according to
EN 1279-4.
2.4 Integration of the laser assisted process in the fabrication of
DSCs
Figure 2.18 sketches a DSC and its correspondent components numbered from 1 to
10. The DSC is constituted by two sheets of glass (1 and 8) coated with a thin layer of
a transparent conductive oxide (TCO, 4) usually fluorine doped tin oxide (FTO, SnO2-
F). In one of the glass sheets is deposited the mesoporous semiconductor layer (7),
usually titanium dioxide where a quantity of dye molecules is adsorbed. The catalyst
layer (3), normally platinum, is employed to ensure the reduction reaction of triiodide
to iodide. The inner volume of the cell is filled with a liquid electrolyte (6), and is
delimited by the sealing perimeter (5) that encapsulates the device and ensures the
spacing between both electrodes. The counter electrode glass substrate (1) has two
drilled channels (9) that connect the interior of the cell with the outside. These
channels are used to perform the dye adsorption into the semiconductor (7) and
electrolyte filling of the cell and are sealed using Surlyn® polymer covered by a glass
lamella (10). The electrical connection to the external circuit is performed using
conductive metal lines, usually of silver (2). Figure 2.18a) and b) illustrates a laser
sealed dye-sensitized solar cell.

78 Development and optimization of a laser sealing process for DSC devices
Dye-sensitized Solar Cells: Improving Lifetime Stability and Performance
Figure 2.18 Schematic of a laser sealed dye-sensitized solar cell a) top and cross b)
sectional views. 1 – counter electrode glass; 2 – electrical contact; 3 – platinum
catalyst; 4 – TCO; 5 – glass frit sealing; 6 – electrolyte; 7 – TiO2 with adsorbed
sensitizer; 8 – photoelectrode glass 9 – filling hole; 10 – filling hole cover.
The optimized experimental procedure for preparing dye sensitized solar cells is
summarized in Figure 2.19. Briefly, the procedure is divided into five main steps: glass
preparation; screen-printing of materials and sintering; laser assisted sealing; dye
adsorption; and electrolyte filling. It begins with the preparation of the glass substrates
where the photo- and counter-electrodes of the solar cell will be applied. The glass
must be cut to match the final dimensions of the solar cell, and then cleaned for
removing any solid particles and organic compounds. For the cleaning step, a distilled
water/detergent mixture is used as washing bath in an ultrasound-cleaning machine
(Amsonic TTC 2530) followed by a UV-O3 (UVO Cleaner model 42-220) cleaning
unit, both illustrated in Figure 2.20.

Chapter 2 79
Dye-sensitized Solar Cells: Improving Lifetime Stability and Performance
Figure 2.19 Schematic diagram of the experimental procedure for producing laser
sealed DSCs.

80 Development and optimization of a laser sealing process for DSC devices
Dye-sensitized Solar Cells: Improving Lifetime Stability and Performance
Figure 2.20 a) Ultrasounds cleaning machine (Amsonic TTC 2530) and b) UV-O3
cleaning unit (UVO Cleaner model 42-220).
After the cleaning step, the sealing material is applied by screen-printing
(Rokuprint® screen printer) to the FTO glass substrates ‒ Figure 2.21a). This technique
allows a reproducible and fast deposition that is easily adaptable for different
configurations and scalable for larger areas. The catalyst layer, usually a platinum
paste, and the sealing material, a glass frit paste, are printed and fired sequentially on
the same glass sheet, and titanium dioxide paste is printed and fired on the other glass
sheet. The firing steps are carried out in a furnace (Nabertherm Gmbh model GF75 -
Figure 2.21b) to remove solvents and binders present in the printed component and for
sintering. Each material follows a defined sintering program, usually as recommended
by the manufacturer.
Figure 2.21 a) Rokuprint® screen printer used for printing the components of the
solar cell and b) Nabertherm® furnace used for firing the printed materials.

Chapter 2 81
Dye-sensitized Solar Cells: Improving Lifetime Stability and Performance
After sealing, the samples are left to cool to the room temperate. At this stage they
are glass sealed cells made of a FTO glass substrate coated with a sintered layer of
titanium dioxide nanoparticles and a FTO glass substrate coated with a sintered thin
layer of platinum catalyst. A dye solution is then pumped through the holes and adsorb
to the inner surface of the titanium dioxide layer. After allowing the dye to adsorb to
the photoelectrode, ethanol is passed through the cell to remove the unabsorbed dye
molecules; nitrogen is passed at the end to dry out the cell. Finally, the cell is filled
with the redox electrolyte and the holes are sealed. Figure 2.22a and b) show pictures
of glass sealed dye sensitized solar cells of 2 cm2 to 230 cm
2 of sealed area.
Figure 2.22 10 × 20 mm2
(a) and 150 × 150 mm2 (b) DSCs prepared by the
described experimental procedure.
2.4.1 Sealing process influence on performance of DSC devices
The performance of a dye-sensitized solar cell sealed by the laser assisted glass frit
method (LAGF) was compared to a device sealed using the conventional thermoplastic
sealant (Surlyn®) - Figure 2.23. The corresponding photovoltaic parameters (short-
circuit current density, Jsc; open circuit voltage, Voc; fill factor, FF; and efficiency, η)
are presented in Table 2.5.

82 Development and optimization of a laser sealing process for DSC devices
Dye-sensitized Solar Cells: Improving Lifetime Stability and Performance
Figure 2.23 I-V (black) and power curves (red) of the prepared DSCs sealed by
Surlyn®
sealed and laser assisted glass frit sealed DSCs.
Table 2.5 DSC Performance parameters for Surlyn®
sealed and laser assisted glass
frit sealed DSCs.
Sealing method Performance parameters
Voc /V Jsc / mA·cm-2
FF η / %
LAGF 0.78 ± 0.02 10.7 ± 0.05 0.71 ± 0.06 6.07 ± 0.05
Surlyn®
0.76 ± 0.04 11.0 ± 0.09 0.66 ± 0.04 5.60 ± 0.03
Although the performance parameters in Table 2.5 show there are no significant
differences between both types of DSCs, to further study any possible degradation
caused by the laser sealing process, the devices were analyzed by EIS. This technique
allows time resolving the electrochemical processes in a DSC. Figure 2.25 shows the
Nyquist (a) and Bode (b) plots obtained under dark conditions, at Voc of the DSCs (-
0.78 V and -0.76 V for LAGF and Surlyn®, respectively). The experimental data was
fitted to appropriated electrical analogues, namely a simplified transmission line
model22,23
, using ZView® (Scribner Associates Inc.). This model, proposed by Bisquert
et al.24
, is widely used to describe the transport and recombination kinetic in DSCs.

Chapter 2 83
Dye-sensitized Solar Cells: Improving Lifetime Stability and Performance
Because the EIS analysis was conducted at the open circuit potential of the cells (Voc),
electron transport resistance through the TiO2 layer was considered negligible. The
electrical analogue is presented in Figure 2.24.
Figure 2.24 Simplified transmission line model used to fit EIS experimental data of
DSCs. Rs – series resistances; Rk – recombination resistance; CPE – chemical
capacitance at the TiO2 anode; RCE – charge transfer at platinum/TCO interface; CCE
double layer capacitance at the platinum/TCO interface.
The Bode plot shows two frequency peaks, corresponding to the electron
recombination at the photoelectrode (low frequency) and to the reduction reaction
occurring at the platinum counter-electrode (high frequency). In the case of Surlyn®
sealed cells the second peak is located at slightly higher frequency than the LAGF cell.
This and the larger first semicircle in the Nyquist plot show that the performance of the
counter electrode is marginally better in the case of the LAGF cell than in the Surlyn®
sealed cell. The model parameters are shown in Table 2.6. The fitted parameters do not
suggest any significant difference in both types of devices. Therefore it should be
concluded that the glass sealing method allows preparing cells with the same energy
efficiency of the Surlyn®-sealed cells.

84 Development and optimization of a laser sealing process for DSC devices
Dye-sensitized Solar Cells: Improving Lifetime Stability and Performance
Figure 2.25 Bode a) and Nyquist b) plots obtained under dark conditions, at the Voc
of the DSCs (-0.78 V and -0.76V for LAGF and Surlyn®, respectively).
Table 2.6 Results obtained by fitting the EIS experimental data to the presented
equivalent circuit for Surlyn®
sealed and laser assisted glass frit sealed DSCs.
Sealing method Rs /Ω RCE /Ω CCE /F Rk /Ω CPE /F τe- / ms
Surlyn® 9.071 46.33 3.91×10
-6 80.02 4.79×10
-4 23.6
LAGF 10.03 32.79 1.02×10⁻⁵
82.17 5.68×10⁻⁴
23.4

Chapter 2 85
Dye-sensitized Solar Cells: Improving Lifetime Stability and Performance
2.5 Conclusions
Laser assisted glass encapsulation was evaluated for sealing DSC devices. A
response surface methodology allowed optimizing the process parameters, where the
laser power was identified as the most important factor in the process. The empiric
model obtained, relating the sealing quality and the process parameters, showed a good
agreement with the experimental results. Glass samples sealed by the developed
process passed the following standards:
Helium leak tests : MIL-STD-883H, “Encapsulation suitable for microcircuits
for use within military and aerospace electronic systems” ;
Thermal cycling tests : IEC 61646, “International standard for thin-film
terrestrial PV modules”;
Shear strength tests: ISO 13445, “Adhesives - Determination of shear strength
of adhesive bonds between rigid substrates by the block-shear method”; and
EN 1279-4, “Glass in Buildings - Insulating glass units, requirements for
sealants”.
The substrate temperature (330 ºC) at which the laser assisted sealing takes place is
lower than the maximum tolerable temperature of commonly used materials in the
photoelectrode and counter-electrode layers of DSC devices, i.e. titanium dioxide
photoelectrode (~500 °C) and platinum counter-electrode (~450 °C). The photovoltaic
characterization (I-V and EIS analysis) of the DSCs prepared with the laser assisted
glass frit sealant were similar to those obtained with the cells sealed with Surlyn®,
showing no evidence that the sealing process influences the performance of DSCs.
These results showed that the developed sealing process is suitable for DSC
technology, and brings promise of long term stability for the technology.

86 Development and optimization of a laser sealing process for DSC devices
Dye-sensitized Solar Cells: Improving Lifetime Stability and Performance
Acknowledgments
This research has been funded by the Portuguese Innovation Agency (AdI) (Project
SolarSel - SI IDT - 3423/2008) in the framework of the QREN Initiative and European
Regional Development Fund through the Operational Program for Competitiveness
Factors. L. Andrade is grateful to the Portuguese Foundation for Science and
Technology (FCT) for her Post-Doctoral grant (reference: SFRH/BPD/74944/2010).
The authors also acknowledge Efacec – Engenharia e Sistemas S. A. for the facilities
and financial support. J. Maçaira is grateful to A. Emami with the assist in the Helium
leak tests.
References
1. N. Kato, K. Higuchi, H. Tanaka, J. Nakajima, T. Sano and T. Toyoda, Solar
Energy Materials and Solar Cells, 2011, 95, 301-305.
2. R. Sastrawan, J. Beier, U. Belledin, S. Hemming, A. Hinsch, R. Kern, C. Vetter,
F. M. Petrat, A. Prodi-Schwab, P. Lechner and W. Hoffmann, Solar Energy
Materials and Solar Cells, 2006, 90, 1680-1691.
3. W. J. Lee, E. Ramasamy, D. Y. Lee and J. S. Song, J. Photochem. Photobiol. A-
Chem., 2006, 183, 133-137.
4. A. J. Bard and L. R. Faulkner, Electrochemical methods fundamentals and
applications, John Wiley & Sons, New York, 1980.
5. H. Matsui, K. Okada, T. Kitamura and N. Tanabe, Solar Energy Materials and
Solar Cells, 2009, 93, 1110-1115.
6. F. C. Krebs, Solar Energy Materials and Solar Cells, 2006, 90, 3633-3643.
7. K. Maeda, K. Teramura, D. Lu, T. Takata, N. Saito, Y. Inoue and K. Domen,
Nature, 2006, 440, 295-295.
8. R. Knechtel, Microsyst Technol, 2005, 12, 63-68.
9. K. Itoh and J. O. M. Bockris, Journal of The Electrochemical Society, 1984, 131,
1266-1271.
Chapter 2 87
Dye-sensitized Solar Cells: Improving Lifetime Stability and Performance
10. K. F. Tamrin, Y. Nukman and S. S. Zakariyah, Materials and Manufacturing
Processes, 2013, 28, 857-871.
11. W. Watanabe, S. Onda, T. Tamaki and K. Itoh, Applied Physics B: Lasers and
Optics, 2007, 87, 85-89.
12. A. Mathieu, R. Shabadi, A. Deschamps, M. Suery, S. Matte, D. Grevey and E.
Cicala, Optics & Laser Technology, 2007, 39, 652-661.
13. V. M. Aroutiounian, V. M. Arakelyan, G. E. Shahnazaryan, G. M. Stepanyan, J.
A. Turner and O. Khaselev, International Journal of Hydrogen Energy, 2002,
27, 33-38.
14. D. Ando, K. Oishi, T. Nakamura and S. Umeda, Proc Ieee Micr Elect, 1997,
186-190.
15. C. J. Brabec, V. Dyakonov, J. Parisi and N. S. Sariciftci, Organic Photovoltaics:
Concepts and Realization, Springer Berlin Heidelberg, 2013.
16. E. L. Bourhis, Glass: Mechanics and Technology, Wiley, 2008.
17. PCT/IB2012/051376, 2012.
18. D. C. Montgomery, Design and analysis of experiments, John Wiley & Sons,
New York [etc], 2001.
19. R. H. Myers and D. C. Montgomery, Response surface methodology process and
product optimization using designed experiments, John Wiley & Sons, New
York, 2002.
20. P. J. W. M.J. Anderson, RSM Simplified: Optimizing Processes Using Response
Surface Methods For Design of Experiments, Productivity Press, New York,
2005.
21. M. Ni, M. K. H. Leung and D. Y. C. Leung, The Canadian Journal of Chemical
Engineering, 2008, 86, 35-42.
22. L. Andrade, S. M. Zakeeruddin, M. K. Nazeeruddin, H. A. Ribeiro, A. Mendes
and M. Grätzel, ChemPhysChem, 2009, 10, 1117-1124.
23. J. Bisquert, M. Gratzel, Q. Wang and F. Fabregat-Santiago, The Journal of
Physical Chemistry B, 2006, 110, 11284-11290.
24. J. Bisquert, The Journal of Physical Chemistry B, 2002, 106, 325-333.


CHAPTER 3 Laser sealed DSCs: Efficiency and Long
term stability
“Many of life's failures are people who did not realize how close they were to success when
they gave up”
Thomas A. Edison

Adapted from the peer-reviewed article
J. Maçaira, L. Andrade, A. Mendes, Laser sealed DSCs: Efficiency and Long term
stability analysis, accepted for publication in Solar Energy Materials and Solar Cells,
2016

3
Laser sealed DSCs: Efficiency and Long term
stability
Abstract
Long-term stability is still a major issue that limits dye-sensitized solar cells
(DSCs) market implementation. The stability problem of the DSC design is directly
related to the common sealing methods, which use thermoplastic sealants, such as
Surlyn® or Bynel
®. This work follows previous developments by the research group
1-3
on laser assisted glass frit sealing and demonstrates that the developed sealing process
originates stable and efficient DSC devices. To assess the stability of the prepared
devices, accelerated ageing was performed during 1000 h, at 63±2 ºC, visible light
intensity of 765 W·m-2
and resistive electrical load close the maximum power point of
the cells (~0.6 V). Laser sealed DSCs showed remarkable stability with negligible
efficiency loss compared to the Surlyn® sealed devices (ca. 2 % vs. 44 % loss of initial
efficiency, respectively). The main degradation mechanism of thermoplastic sealed
devices was ascribed to electrolyte leakage and external moisture contamination. These
results show that efficient encapsulation methods are crucial to DSC stability and that
the developed sealing process can bring stable and efficient DSCs to the PV market.

92 Laser sealed DSCs: Efficiency and Long term stability
Dye-sensitized Solar Cells: Improving Lifetime Stability and Performance
3.1 Introduction
Besides offering favorable performance-to-cost ratio, emerging photovoltaic
technologies must guarantee device stability. Dye sensitized solar cells (DSCs) have
low manufacturing costs, use environmental friendly materials and show distinctive
characteristics that make them worth to invest4-6
. Contrary to crystalline silicon (c-Si)
photovoltaic (PV) devices, DSCs work especially well under low light levels (0.3 - 0.5
sun)7, 8
, such as light intensity typically available in the facades of buildings. Their
ability to convert light into electricity while maintaining some transparency, unlike
other PV technologies, make them particularly interesting for building integrated
photovoltaics (BIPV) 9. The operation of DSCs comprises dye excitation and electron
injection into TiO2 conduction band, charge transport through TiO2 porous network to
the SnO2-F substrate and dye regeneration by the redox electrolyte10
. These
photo/electrochemical processes rely on the chemical compatibility of all DSC
components. Graetzel et al.11
showed that the redox system I-3/I
- combined with
ruthenium dyes can achieve 20 years of molecular stability11
. However, this intrinsic
stability can only be accomplished if no electrolyte leakage or external contaminants
penetrate into the cell. In fact, it has been shown that DSCs durability is highly
dependent on efficient cell encapsulation and it is the most common reason for long-
term stability failure12,13
. The commonly employed sealants for encapsulating DSCs are
polymers, such as Surlyn® and Bynel
®, which have some permeability towards oxygen
and moisture14
; their relatively low softening point makes them unreliable sealants at
temperatures above 50 ‒ 60 ºC, which prevent their use in commercial DSC
applications 9,13,15
.
This work reports accelerated aging tests in DSCs fabricated by our previously
developed laser assisted glass sealing process1-3
. Although the laser process produces
excellent glass to glass bonding, the technology is not yet fully developed for sealing
the electrolyte filling holes; therefore these were sealed combining Surlyn®
thermoplastic sealant and high temperature resistant resin. For comparison, Surlyn®
sealed DSC devices were also tested.

Chapter 3 93
Dye-sensitized Solar Cells: Improving Lifetime Stability and Performance
The aging tests were conducted at 63±2 ºC, under 765 W·m-2
of continuous
illumination and resistive electrical load close the maximum power point of the cells (~
0.6 V). The devices were characterized every 200 hours, during the aging period of
1000 h, by intensity-voltage (I-V) and electrochemical impedance spectroscopy (EIS)
analysis.
3.2 Material and Methods
3.2.1 Laser sealed DSC fabrication
Laser sealed DSCs were prepared as described elsewhere 1-3
(Chapter 2, section
2.4). Briefly, the photoelectrodes were prepared on 2.2 mm thick, 7 Ω·-1 SnO2-F
(FTO) coated glass substrates from Solaronix®. First, the glasses were washed
sequentially with a detergent solution (Alconox®, VWR) in an ultrasonic cleaner
(Amsonic TTC) at 55 ºC for 15 min, followed by ultrasonic cleaning in deionized
water at room temperature and dried with air at 50 ºC.
A TiO2 blocking layer is deposited above the FTO layer by atomic layer deposition
(ALD – Beneq Oy thin film system TFS200). Deposition of TiO2 was carried out at
225 °C using titanium isopropoxide (TIP, feeding tank at 45 ºC) and H2O (feeding tank
at 20 ºC). 250 cycles (~7.5 nm) of TiO2 were deposited under a nitrogen flow of 300
cm3·min
-1, with a pulse/purge lengths of 2 s / 20 s for TIP and 1 s / 3 s for H2O. Then,
samples were coated with a porous TiO2 photelectrode layer by sequentially screen-
printing 3 layers of a commercial TiO2 paste (Ti-Nanoxide T/SP from Solaronix®),
followed by drying at 100 ºC for 5 minutes, and annealing at 475 ºC for 15 min in an
infrared electrical oven (Nabertherm Gmbh model GF75). After firing, the samples
were treated with a 40 mM TiCl4 aqueous solution at 70 ºC for 20 minutes, before
being sintered at 475 ºC for 30 min.
The counter electrodes, prepared on the same type of glass substrates and cleaned
as described before, were drilled previously with two holes of 1 mm diameter. A
commercial platinum based paste (Platisol T/SP from Solaronix®) was applied on the
glass substrate by screen-printing followed by annealing at 400 ºC for 15 minutes. The
two electrodes are then assembled and sealed using the developed laser assisted glass
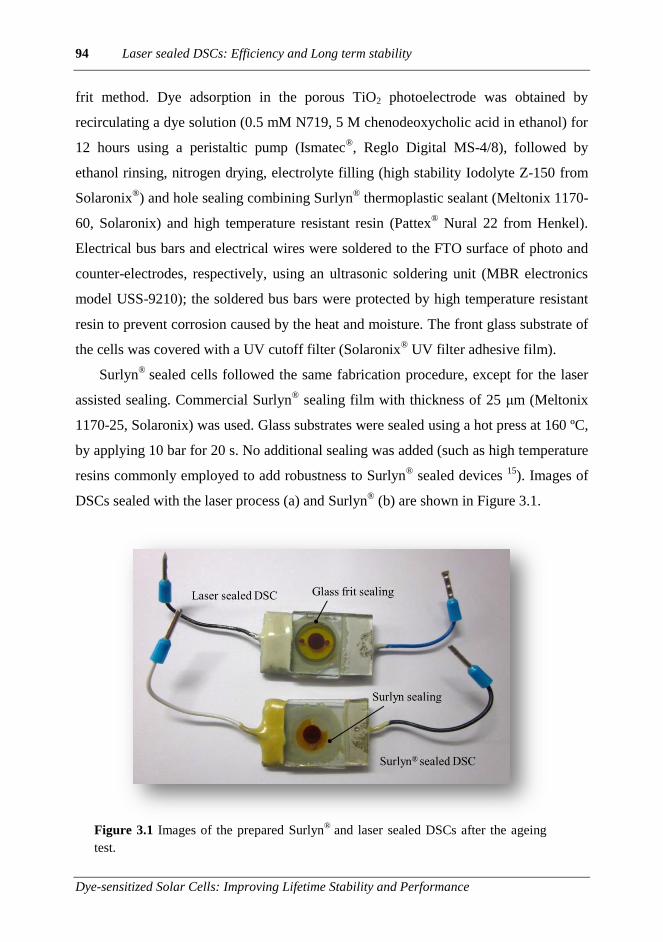
94 Laser sealed DSCs: Efficiency and Long term stability
Dye-sensitized Solar Cells: Improving Lifetime Stability and Performance
frit method. Dye adsorption in the porous TiO2 photoelectrode was obtained by
recirculating a dye solution (0.5 mM N719, 5 M chenodeoxycholic acid in ethanol) for
12 hours using a peristaltic pump (Ismatec®, Reglo Digital MS-4/8), followed by
ethanol rinsing, nitrogen drying, electrolyte filling (high stability Iodolyte Z-150 from
Solaronix®) and hole sealing combining Surlyn
® thermoplastic sealant (Meltonix 1170-
60, Solaronix) and high temperature resistant resin (Pattex® Nural 22 from Henkel).
Electrical bus bars and electrical wires were soldered to the FTO surface of photo and
counter-electrodes, respectively, using an ultrasonic soldering unit (MBR electronics
model USS-9210); the soldered bus bars were protected by high temperature resistant
resin to prevent corrosion caused by the heat and moisture. The front glass substrate of
the cells was covered with a UV cutoff filter (Solaronix® UV filter adhesive film).
Surlyn®
sealed cells followed the same fabrication procedure, except for the laser
assisted sealing. Commercial Surlyn® sealing film with thickness of 25 μm (Meltonix
1170-25, Solaronix) was used. Glass substrates were sealed using a hot press at 160 ºC,
by applying 10 bar for 20 s. No additional sealing was added (such as high temperature
resins commonly employed to add robustness to Surlyn® sealed devices
15). Images of
DSCs sealed with the laser process (a) and Surlyn® (b) are shown in Figure 3.1.
Figure 3.1 Images of the prepared Surlyn
® and laser sealed DSCs after the ageing
test.

Chapter 3 95
Dye-sensitized Solar Cells: Improving Lifetime Stability and Performance
3.2.2 I-V and EIS characterization
DSCs were characterized periodically based on recorded I-V curves, using a setup
equipped with a 150 W xenon light source (Oriel class A solar simulator, Newport,
USA) with variable light intensity, from 10 to 1000 W·m-2
(0.1 to 1 sun light intensity),
and using a 1.5 air mass filter (Newport, USA). The simulator was calibrated using a
single crystal Si photodiode (Newport, USA). The I-V characteristics of the solar cells
were obtained applying an external potential load and measuring the generated
photocurrent using an AUTOLAB electrochemical station (PGSTAT 302 N). This
station was also used to characterize the cells based on electrochemical impedance
spectra. The frequency range for the electrochemical impedance spectroscopy (EIS)
measurements was from 100 kHz to 0.05 Hz with an AC modulation signal of 10 mV.
The experimental EIS data was fitted to appropriate electrical analogues, namely a
simplified transmission line model16, 17
, shown in Figure 3.2, using the commercial
software ZView® (Scribner Associates Inc.).
Figure 3.2 Simplified transmission line model used to fit EIS experimental data of
DSCs. Rs – series resistances; Rk – recombination resistance; CPE – chemical
capacitance at the TiO2 anode; RCE – charge transfer at platinum/TCO interface; CCE
double layer capacitance at the platinum/TCO interface.
3.2.3 Accelerated ageing tests
Accelerated ageing tests were performed with continuous light illumination,
temperature control and resistive electric load, in a closed test chamber (Atlas
SUNTEST XLS+), shown in Figure 3.3, during 1000 h. The ageing conditions were
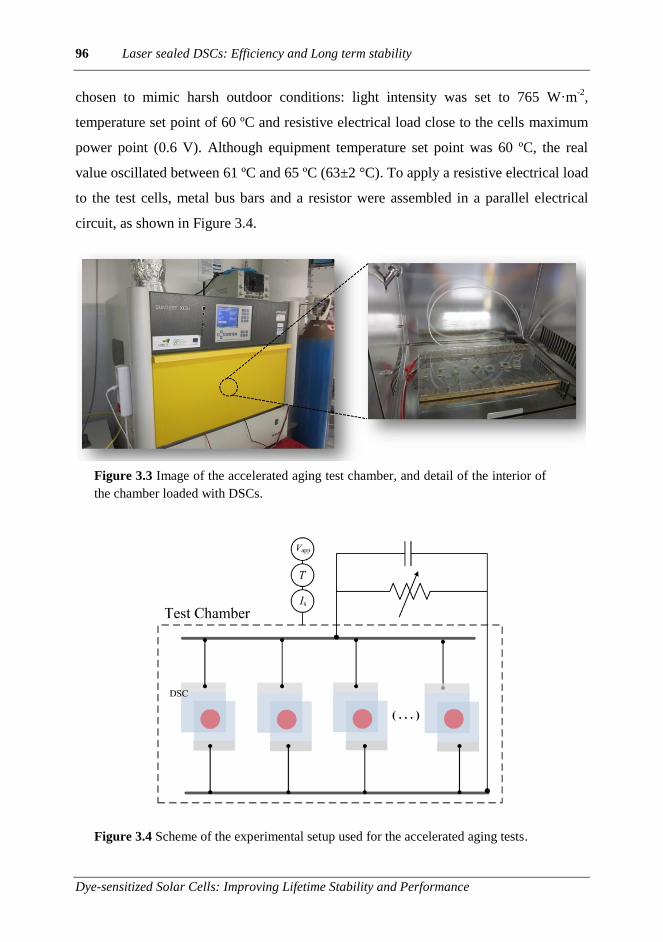
96 Laser sealed DSCs: Efficiency and Long term stability
Dye-sensitized Solar Cells: Improving Lifetime Stability and Performance
chosen to mimic harsh outdoor conditions: light intensity was set to 765 W·m-2
,
temperature set point of 60 ºC and resistive electrical load close to the cells maximum
power point (0.6 V). Although equipment temperature set point was 60 ºC, the real
value oscillated between 61 ºC and 65 ºC (63±2 °C). To apply a resistive electrical load
to the test cells, metal bus bars and a resistor were assembled in a parallel electrical
circuit, as shown in Figure 3.4.
Figure 3.3 Image of the accelerated aging test chamber, and detail of the interior of
the chamber loaded with DSCs.
Figure 3.4 Scheme of the experimental setup used for the accelerated aging tests.

Chapter 3 97
Dye-sensitized Solar Cells: Improving Lifetime Stability and Performance
3.3 Results and Discussion
3.3.1 Photovoltaic performance
During the aging test, the DSCs were taken from the ageing chamber each 200
hours for I-V and EIS characterization. Figure 3.5 shows the normalized solar to
electrical energy conversion efficiency (), open circuit potential (Voc), short circuit
current density (Jsc) and fill factor (FF) of the tested DSCs sealed with Surlyn® and
with glass frit. The results presented are the average of 4 DSC samples for each sealing
method. The laser assisted glass frit DSCs (LAGF) exhibit excellent stability during
the accelerated aging test; LAGF cells retained almost 98 % of their initial efficiency.
On contrary, Surlyn® sealed DSCs showed ca. 34 % efficiency loss after 1000 h.
Analyzing the performance parameters shown in Figure 3.5 it can be concluded
that the degradation of the Surlyn® sealed cells results mainly from a loss of ca. 13 %
on Voc. Particularly, after 400 h of ageing, all photovoltaic parameters showed a steady
and constant decrease; this was assigned to partial leakage of electrolyte and external
moisture penetration of the Surlyn® sealed devices. LAGF cells showed a minor
decrease of Jsc (-5.1 %) and FF (-7.4 %), that was compensated with a 8.3 % increase
in the Voc; this resulted in a remarkable stability of the initial efficiency of ca. 98 %,
something seldom seen in aged DSCs 15,18,19
.
Figure 3.6 shows the I-V curves of Surlyn® sealed (a) and laser sealed DSCs (b)
before and after the complete 1000 h ageing test. The I-V curves of Surlyn®
sealed
DSCs show a large Voc decrease, alongside with a dark current increase, which
indicates higher electron/electrolyte recombination rate. Contrarily, LAGF showed
similar curves before and after the test, with a slight decrease in dark current.
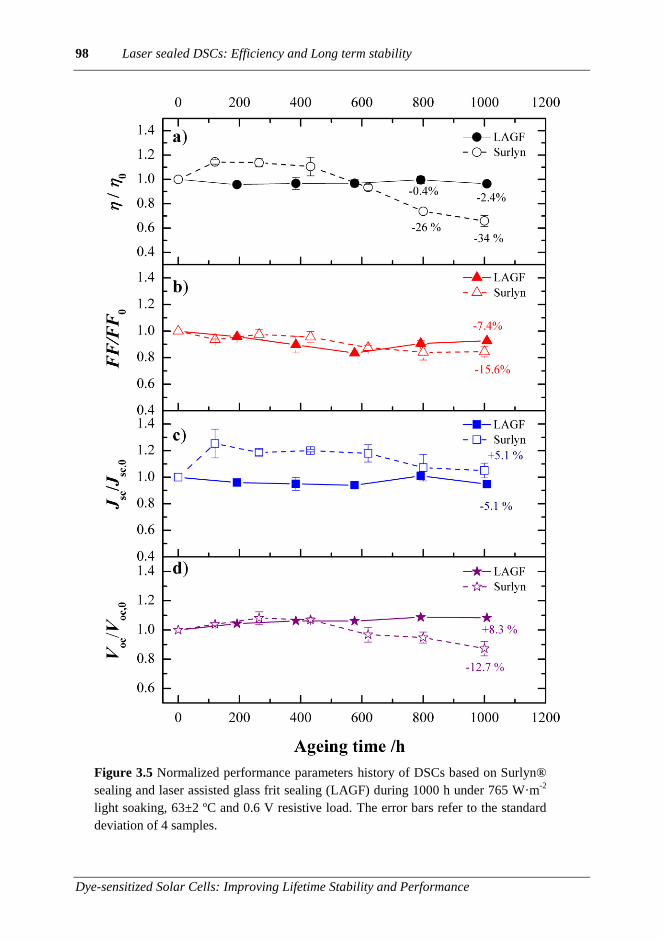
98 Laser sealed DSCs: Efficiency and Long term stability
Dye-sensitized Solar Cells: Improving Lifetime Stability and Performance
Figure 3.5 Normalized performance parameters history of DSCs based on Surlyn®
sealing and laser assisted glass frit sealing (LAGF) during 1000 h under 765 W·m-2
light soaking, 63±2 ºC and 0.6 V resistive load. The error bars refer to the standard
deviation of 4 samples.

Chapter 3 99
Dye-sensitized Solar Cells: Improving Lifetime Stability and Performance
Figure 3.6 I-V curves obtained at 0.85 sun and dark conditions, for Surlyn®
sealed
(a) and laser sealed DSCs (b) before and after the 1000h of the aging test.
The performance parameters of the devices (, Voc, Jsc and FF) before and after the
aging test are shown in Table 3.1. Besides a reduction in the Voc value (~ 13 %) cells
show also ca. 16 % reduction in FF, indicating massive series resistance increase; these
two factors suggest that in Surlyn® sealed devices recombination and series resistances
play a key role in the final efficiency loss (34 %). Globally, the performance
parameters of the LAFG cells showed different ageing behavior and proved to be more
resistant than Surlyn® sealed cells to the aging test.
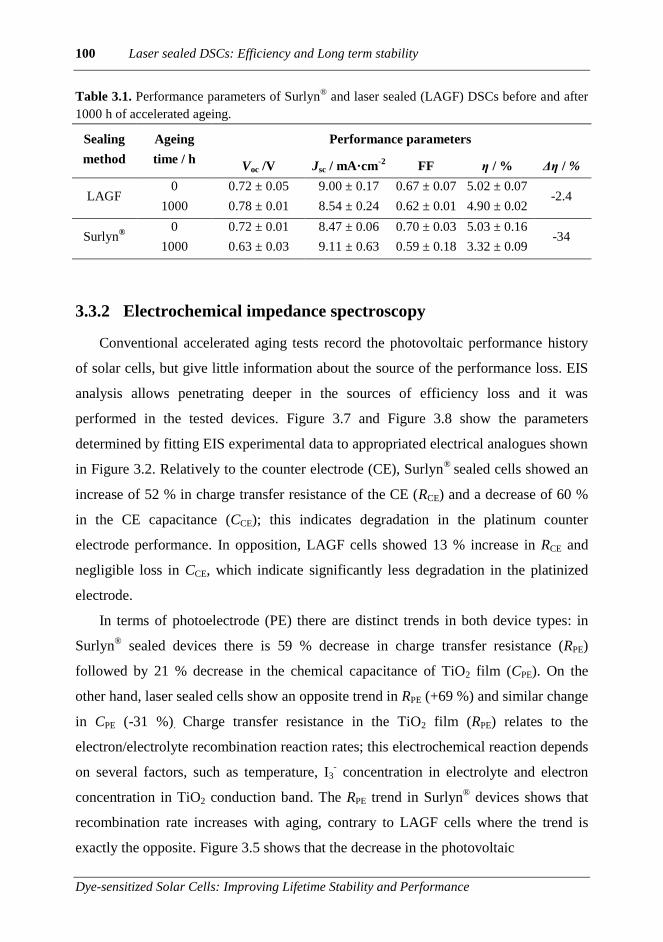
100 Laser sealed DSCs: Efficiency and Long term stability
Dye-sensitized Solar Cells: Improving Lifetime Stability and Performance
Table 3.1. Performance parameters of Surlyn® and laser sealed (LAGF) DSCs before and after
1000 h of accelerated ageing.
Sealing
method
Ageing
time / h
Performance parameters
Voc /V Jsc / mA·cm-2
FF η / % Δη / %
LAGF 0 0.72 ± 0.05 9.00 ± 0.17 0.67 ± 0.07 5.02 ± 0.07
-2.4 1000 0.78 ± 0.01 8.54 ± 0.24 0.62 ± 0.01 4.90 ± 0.02
Surlyn®
0 0.72 ± 0.01 8.47 ± 0.06 0.70 ± 0.03 5.03 ± 0.16 -34
1000 0.63 ± 0.03 9.11 ± 0.63 0.59 ± 0.18 3.32 ± 0.09
3.3.2 Electrochemical impedance spectroscopy
Conventional accelerated aging tests record the photovoltaic performance history
of solar cells, but give little information about the source of the performance loss. EIS
analysis allows penetrating deeper in the sources of efficiency loss and it was
performed in the tested devices. Figure 3.7 and Figure 3.8 show the parameters
determined by fitting EIS experimental data to appropriated electrical analogues shown
in Figure 3.2. Relatively to the counter electrode (CE), Surlyn®
sealed cells showed an
increase of 52 % in charge transfer resistance of the CE (RCE) and a decrease of 60 %
in the CE capacitance (CCE); this indicates degradation in the platinum counter
electrode performance. In opposition, LAGF cells showed 13 % increase in RCE and
negligible loss in CCE, which indicate significantly less degradation in the platinized
electrode.
In terms of photoelectrode (PE) there are distinct trends in both device types: in
Surlyn® sealed devices there is 59 % decrease in charge transfer resistance (RPE)
followed by 21 % decrease in the chemical capacitance of TiO2 film (CPE). On the
other hand, laser sealed cells show an opposite trend in RPE (+69 %) and similar change
in CPE (-31 %). Charge transfer resistance in the TiO2 film (RPE) relates to the
electron/electrolyte recombination reaction rates; this electrochemical reaction depends
on several factors, such as temperature, I3- concentration in electrolyte and electron
concentration in TiO2 conduction band. The RPE trend in Surlyn® devices shows that
recombination rate increases with aging, contrary to LAGF cells where the trend is
exactly the opposite. Figure 3.5 shows that the decrease in the photovoltaic

Chapter 3 101
Dye-sensitized Solar Cells: Improving Lifetime Stability and Performance
Figure 3.7 Fitted EIS parameters history for Surlyn® sealed and LAGF DSCs. Rk –
recombination resistance; CPE – chemical capacitance at the TiO2 anode; RCE –
charge transfer resistance at platinum/TCO interface; CCE double layer capacitance
at the platinum/TCO interface.
performance of Surlyn® devices (mainly driven by the Voc and FF), is particular steep
after ca. 400 hours of ageing, which matches closely to the decrease of RPE. This shows
that at this point, something led to an irreversible increase in recombination and
degradation of performance of the cells, which in this case is ascribed to electrolyte
leakage. This is further confirmed by data presented in Figure 3.8. In the Surlyn®

102 Laser sealed DSCs: Efficiency and Long term stability
Dye-sensitized Solar Cells: Improving Lifetime Stability and Performance
sealed cells, series resistances (Rs) increase and electron lifetime (τe-) decrease confirm
that instant 400 h is a critical moment when series resistances and recombination cause
the performance drop of Surlyn® sealed cells. Comparatively, LAGF cells show a
remarkable Rs and τe- stability, which in turn contribute to their performance steadiness.
Figure 3.8 Fitted EIS parameters history for Surlyn® sealed and LAGF DSCs Rs –
series resistances; τe- - electron lifetime.
Figure 3.9 shows Bode and Nyquist plots of Surlyn® and LAGF cells before and
after the 1000 h ageing test. The simplified transmission line model presented in Figure
3.2 fits well the EIS experimental data. The bode plot from Surlyn® cells (Figure 3.9a)
shows that first peak shifts to higher frequencies, indicating a smaller recombination
resistance in TiO2/electrolyte interface; this is confirmed by the Nyquist plot (Figure
3.9a) where the 1000 h analysis results in smaller second Nyquist semicircle. It is also
possible to observe an increase in the displacement of the first semicircle to higher
resistances, which indicates the increase of the series resistances, as explained before.
In turn, LAGF cells display a second semicircle with a larger diameter that results from
an increase of electron lifetime; this shows that the recombination in LAFG is lower,
and thus its efficiency is maintained.

Chapter 3 103
Dye-sensitized Solar Cells: Improving Lifetime Stability and Performance
Figure 3.9 Bode (a, c) and Nyquist (b, d) plots for Surlyn® sealed cells (a, b) and
LAGF cells (c, d) obtained under dark conditions, at the Voc of the cell, before and
after the ageing test (1000 h, 765 W·m-2
, 63±2 ºC, ~0.6 V resistive electrical load).
Table 3.2 shows the EIS fitted parameters, before (0 h) and (1000 h) the ageing
test. Altogether, the EIS data show that the degradation process of the Surlyn® sealed
cells is mainly related to τe- and Rs, explained the largest variation compared to their
initial value and with LAGF cells.
Table 3.2 Parameters obtained by fitting the EIS experimental data to the presented
equivalent circuit for Surlyn® sealed and LAGF DSCs, before and after ageing test.
Sealing method LAGF Surlyn®
Ageing time / h 0 1000 Δ 0 1000 Δ
EIS
fit
RCE / Ω 32.8 28.53 +13% 46.3 70.4 +52%
CCE / F 1.02×10⁻⁵ 1.01×10⁻⁵ -1.0% 3.91×10⁻⁶ 1.56×10⁻⁶ -60%
RPE / Ω 82.2 139 +69% 80.0 32.8 -59%
CPE / F 5.68×10⁻⁴ 3.87×10⁻⁴ -32% 4.79×10⁻⁴ 3.74×10⁻⁴ -22 %
Rs / Ω 10.0 9.6 -3.9% 9.07 20.3 +124%
τe- / ms 23.4 32.5 +3.0% 23.6 16.1 -68%

104 Laser sealed DSCs: Efficiency and Long term stability
Dye-sensitized Solar Cells: Improving Lifetime Stability and Performance
3.4 Conclusions
Laser assisted glass frit (LAGF) sealed DSCs were tested for stability against
DSCs sealed with the commonly employed Surlyn® polymer. Accelerated ageing was
carried out during 1000 hours under continuous illumination (765 W·m-2
), at 63±2 ºC,
and applying an electrical resistive load close to the maximum power point (~ 0.6 V) of
the cells. The results showed significant differences in stability: after 1000 h of test
Surlyn®
sealed cells presented 34 % energy efficiency degradation; in turn LAGF cells
exhibited negligible efficiency loss (-2.4 %). The degradation occurring after ca. 400
hours of test was assigned to electrolyte leakage and moisture penetration inside the
Surlyn®
sealed cells; this has a negative impact in the cell operation and leads to a
constant decrease in Voc and FF of the cells that cause efficiency degradation.
Oppositely, in LAGF cells, the slight loss of current (-5 %) was balanced by an
increase in the Voc (+8 %) that allowed efficiency steadiness. EIS showed that series
resistances and recombination were the main causes of performance loss in Surlyn®
sealed cells. In turn, LAGF cells showed nearly no Rs degradation (-3.9 %) and less
recombination (+3 % in τe-) after 1000 h of test, which contributed to performance
durability of the cells.
These results showed that efficient encapsulation is crucial for obtaining long term
stable DSCs. The developed laser assisted glass sealing process produces stable DSC
devices, with negligible efficiency loss under the accelerated ageing tested conditions.
In turn, Surlyn® by itself cannot guarantee efficient encapsulation, therefore not
providing durability for DSC devices.

Chapter 3 105
Dye-sensitized Solar Cells: Improving Lifetime Stability and Performance
Acknowledgements
J. Maçaira is grateful to the Portuguese Foundation for Science and Technology
(FCT) for his PhD Grant (Reference: SFRH/BD/80449/2011). L. Andrade
acknowledges European Research Council (Contract no: 321315) for her contract.
Financial support from the European Research Council (Contract no: 321315) is also
acknowledged. J. Maçaira grateful acknowledges J. Pinto for his assistance in
assembling the electrical circuit.
References
1. PCT/IB2012/051376, 2012.
2. F. R. J.Maçaira , L.Andrade, J.Gabriel, A.Mendes presented in part at the
CHEMPOR 2011 : 11th International Chemical and Biological Engineering
Conference, Lisbon, Portugal, 5-7 September, 2011.
3. F. Ribeiro, Maçaira,J. , Cruz, R., Gabriel, J., Andrade, L., Mendes, A., Solar
Energy Materials and Solar Cells, 2012, 96, 43-49.
4. J. Maçaira, L. Andrade and A. Mendes, Renewable and Sustainable Energy
Reviews, 2013, 27, 334-349.
5. L. M. Goncalves, V. d. Z. Bermudez, H. A. Ribeiro and A. M. Mendes, Energy
& Environmental Science, 2008, 1, 655-667.
6. M. I. Asghar, K. Miettunen, J. Halme, P. Vahermaa, M. Toivola, K. Aitola and
P. Lund, Energy & Environmental Science, 2010, 3, 418-426.
7. T. M. W. J. Bandara, W. J. M. J. S. R. Jayasundara, H. D. N. S. Fernado, M. A.
K. L. Dissanayake, L. A. A. De Silva, I. Albinsson, M. Furlani and B. E.
Mellander, Journal of Applied Electrochemistry, 2015, 45, 289-298.
8. C.-P. Lee, C.-A. Lin, T.-C. Wei, M.-L. Tsai, Y. Meng, C.-T. Li, K.-C. Ho, C.-I.
Wu, S.-P. Lau and J.-H. He, Nano Energy, 2015, 18, 109-117.
9. A. Fakharuddin, R. Jose, T. M. Brown, F. Fabregat-Santiago and J. Bisquert,
Energy & Environmental Science, 2014, 7, 3952-3981.
10. B. E. Hardin, H. J. Snaith and M. D. McGehee, Nat Photon, 2012, 6, 162-169.

106 Laser sealed DSCs: Efficiency and Long term stability
Dye-sensitized Solar Cells: Improving Lifetime Stability and Performance
11. M. Grätzel, Comptes Rendus Chimie, 2006, 9, 578-583.
12. T. Toyoda, T. Sano, J. Nakajima, S. Doi, S. Fukumoto, A. Ito, T. Tohyama, M.
Yoshida, T. Kanagawa, T. Motohiro, T. Shiga, K. Higuchi, H. Tanaka, Y.
Takeda, T. Fukano, N. Katoh, A. Takeichi, K. Takechi and M. Shiozawa,
Journal of Photochemistry and Photobiology A: Chemistry, 2004, 164, 203-207.
13. N. Jiang, T. Sumitomo, T. Lee, A. Pellaroque, O. Bellon, D. Milliken and H.
Desilvestro, Solar Energy Materials and Solar Cells, 2013, 119, 36-50.
14. A. G. Kontos, T. Stergiopoulos, V. Likodimos, D. Milliken, H. Desilvesto, G.
Tulloch and P. Falaras, The Journal of Physical Chemistry C, 2013, 117, 8636-
8646.
15. R. Harikisun and H. Desilvestro, Solar Energy, 2011, 85, 1179-1188.
16. J. Bisquert, M. Gratzel, Q. Wang and F. Fabregat-Santiago, The Journal of
Physical Chemistry B, 2006, 110, 11284-11290.
17. L. Andrade, S. M. Zakeeruddin, M. K. Nazeeruddin, H. A. Ribeiro, A. Mendes
and M. Grätzel, ChemPhysChem, 2009, 10, 1117-1124.
18. L. Tao, Z. Huo, Y. Ding, Y. Li, S. Dai, L. Wang, J. Zhu, X. Pan, B. Zhang, J.
Yao, M. K. Nazeeruddin and M. Gratzel, Journal of Materials Chemistry A,
2015, 3, 2344-2352.
19. D. Perganti, A. G. Kontos, T. Stergiopoulos, V. Likodimos, J. Farnell, D.
Milliken, H. Desilvestro and P. Falaras, Electrochimica Acta, 2015, 179, 241-
249.

CHAPTER 4 Temperature Role in the Recombination
Reaction on Dye-Sensitized Solar Cells
“In the middle of difficulty lies opportunity”
Albert Einstein

Adapted from the peer-reviewed article
J. Maçaira, I. Mesquita, L. Andrade, A. Mendes, Role of temperature in the
recombination reaction on dye-sensitized solar cells. Physical Chemistry Chemical
Physics, 2015. 17: p. 22699-22710

4
Temperature Role in the Recombination
Reaction on Dye Sensitized Solar Cells
Abstract
The performance of photovoltaic (PV) devices as a function of temperature is
crucial for technical development and for accurate commercial information. Along
with solar irradiance, temperature is the most important operating factor of PV devices
performance. Normally it is wide accepted that dye sensitized solar cells (DSC) show
minimal energy efficiency dependence with temperature (20 °C – 60 °C). The energy
efficiency in DSCs depends on light absorption, charge transport (ohmic resistances)
and recombination rates. In this work the recombination reaction kinetics is studied
within a wide temperature range. A unique laser assisted sealing technique that allows
studying the temperature effect between -5 ºC and 105 ºC without electrolyte leakage
or external contamination was used. To the best of our knowledge, this is the highest
operating temperature ever considered in kinetic studies of liquid state DSCs. The
electrochemical reaction between electrons and triiodide/iodide ions is shown to be the
most important factor to determine the energy efficiency of DSCs as a function of
temperature. It was concluded that the activation energy of the recombination reactions
depends on the interface where it happens – TiO2/electrolyte and SnO2-F/electrolyte -
and on the temperature. It was found that besides temperature having a deep influence
in the recombination reaction rate, the energy of the injecting electron is also critical.
These conclusions should provide solid ground for further developments in the DSCs
and perovskite solar cell fields, and allow a better comparison between the energy
efficiency of different PV technologies for a range of operating temperatures.

110 Temperature Role in the Recombination Reaction on Dye-Sensitized Solar Cells
Dye-sensitized Solar Cells: Improving Lifetime Stability and Performance
4.1 Introduction
Alongside with solar irradiance, temperature is probably the most important
outdoor variable that affects the conversion efficiency of PV devices. However,
temperature studies on DSCs are scarce and usually limited to temperatures up to
60 ºC1-3
. Moreover, the glass substrates normally used to assemble DSCs are poor
thermal conductors, resulting that real temperature value are usually lower than
anticipated by typical temperature control setups; solar simulators irradiance also
increase the glass temperature (absorbance of ca. 20 %), which makes it difficult to
have a good control over the temperature analysis. To the best knowledge of the
authors, all reported studies have not considered these effects and should lack of
accuracy making our knowledge on the temperature effect on DSCs performance just
qualitative.
Generally, conduction band shift of the TiO2 film, recombination and charges
transport kinetics are in a DSC the phenomena that have the greatest contribution for
its performance dependence on the temperature4-6
. Charge recombination corresponds
to the undesirable reaction of generated electrons with electrolyte species, ultimately
ruling the final performance of DSCs. This reaction involves either free conduction
band electrons or electrons trapped in lower energy states7. Electronic traps are sites
within the semiconductor (energetically localized in the bandgap) that restrict the
movement of electrons. They are caused either by chemical impurities, morphological
defects or imperfections in the regular spacing of the atoms8. The driving force for
recombination is related to the energy level where electrons are located in the TiO2 and
temperature, both related to the rate constant, kr(T), and the electron concentration9,10
.
As Voc changes, the Fermi level (EF) in TiO2 moves towards or away from the
conduction band edge (ECB); when the Fermi level moves up, the respective electron
traps below are filled. Taking this into consideration, it can be expected that the
activation energy (Ea) of recombination is proportional to (ECB-EF)11
. However,
recombination processes do not take place only at TiO2/electrolyte interface; they can
occur by reaction of electrolyte species with generated electrons that can be located
either in the TiO2 photoelectrode or in the transparent conductive oxide (TCO) –

Chapter 4 111
Dye-sensitized Solar Cells: Improving Lifetime Stability and Performance
Figure 4.1a). This information is well known in the DSC community, and several
passivation methodologies have been developed to decrease recombination12-17
. The
most successful strategies include the use of blocking layers over the TCO film15,16,18-20
the use of TiO2 sols applied to the mesoporous TiO2 layer21, 22
; and more recently the
use an encapsulation layer by atomic layer deposition (ALD) of TiO2 applied over the
dyed semiconductor 17
. These approaches were developed to prevent recombination by
different mechanisms, and although proved effective, studies that link temperature
effects with recombination rates are rare.
Usually the recombination kinetics is well characterized by electrochemical
impedance spectroscopy (EIS) and its magnitude can be analyzed by fitting the
experimental data to appropriate electrical analogues23,24
. The electron lifetime (𝜏e−)
can be extracted and thus the recombination rate constant (𝑘r = 1/ 𝜏e−) in the solar
cell can be calculated. This powerful analytical technique has proven invaluable during
the DSC technological development; unfortunately, by itself, it does not allow
distinguishing different recombination reaction pathways, i.e. at TiO2 or SnO2-F
interface – Figure 4.1b).
Figure 4.1 a) Schematic representation of the working principles at a dye sensitized
solar cell; and b) diagram of energy levels of each functional layer in the DSC. The
full arrows represent electron pathways through the device; the dashed arrows
represent the main loss reaction mechanisms due to recombination through TiO2 or
SnO2-F interfaces (R1 and R2, respectively). The actual energy levels may change
upon assembling.

112 Temperature Role in the Recombination Reaction on Dye-Sensitized Solar Cells
Dye-sensitized Solar Cells: Improving Lifetime Stability and Performance
The present work aims understanding and quantifying the recombination at
TiO2/electrolyte and FTO/electrolyte interfaces and their dependence with temperature.
This should provide valuable information for the development of more efficient
materials, solar cell architectures and to better predict temperature influence on PV
output of future commercial applications. An experimental setup was developed that
accurately controls the inner temperature of DSC devices, allowing their
characterization as a function of the temperature. Laser assisted glass sealing, reported
elsewhere25,26
, was used to make the solar cells hermetic, even up to the boiling point
of the electrolyte; the setup and sealing process allows to obtain very accurate
characterizing results between -5 ºC and 105 ºC. The temperature influences in I-V
curves as well as in the electrochemical kinetics of the solar cell was determined and
are discussed. It was developed an experimental methodology that distinguishes the
recombination occurring at TiO2/interface from recombination occurring at TCO
(SnO2-F) interface; to do so the exposed TCO area to electrolyte was progressively
increased to deliberately cause changes in the recombination rate constant. This allows
quantifying the temperature influence for both recombination pathways and its
implications in solar cells operation and respective architecture design.
4.2 Material and Methods
4.2.1 Laser sealed DSCs and half-cell fabrication
In the present work two types of devices were fabricated: DSCs and half-cells –
Figure 4.2 and Figure 4.3. DSCs are made of two electrodes: the photo electrode (PE)
and the counter electrode (CE); the electrolyte in between contains the iodide/triiodide
redox pair. PE and CE are each applied on glass coated with a transparent conducting
oxide (TCO); the PE includes a mesoporous TiO2 film sensitized with a dye
responsible for light absorption. The CE consists of a nanometric platinum layer
applied on the TCO surface and responsible for catalyzing the reduction of triiodide to
iodide. A half-cell configuration consists of two identical TCO glasses coated with the
relevant material, separated the electrolyte. They mimic the phenomena in a DSC
allowing evaluating the CE and electrolyte behaviors without the interference of the

Chapter 4 113
Dye-sensitized Solar Cells: Improving Lifetime Stability and Performance
sensitized porous TiO2 layer; in the present work they are used to study the
electrochemical reaction of electrons with electrolyte species over a specific interface.
Half-cells made with thin films of SnO2-F, Pt, and TiO2 were assembled to study the
recombination reaction as a function of temperature. The preparation of both devices
(DSCs and half-cells) is described as follows.
Photoelectrodes were prepared on 2.2 mm thick, 7 Ω·-1 SnO2-F (FTO) coated
glass substrates from Solaronix®. First, the glasses were washed sequentially with a
detergent solution (Alconox®, VWR) in an ultrasonic cleaner (Amsonic TTC) at 55 ºC
for 15 min, followed by ultrasonic cleaning in deionized water at room temperature,
rinsed with ethanol and dried with air at 50 ºC. Then, samples were coated with a
porous TiO2 layer by screen-printing a commercial TiO2 paste (Ti-Nanoxide T/SP from
Solaronix®), followed by drying at 100 ºC for 5 minutes. To control the final thickness
of the transparent layer of TiO2, the screen-printing and drying procedures were
repeated as necessary to get the desired thickness (12 μm-thick photoelectrodes were
obtained with three screen-printing cycles). Samples were annealed at 475 ºC for 15
min in an infrared electrical oven (Nabertherm Gmbh model GF75). After firing, the
samples were treated with a 40 mM TiCl4 aqueous solution at 70 ºC for 20 minutes,
before being sintered at 475 ºC for 30 min. In cells where blocking layer is required, a
thin and compact layer of TiO2 above the FTO layer was applied immersing the FTO
glasses in a 40 mM TiCl4 aqueous solution at 70 ºC for 20 minutes; after washing with
water and ethanol, the samples were dried with a nitrogen flow. The counter electrodes,
prepared on the same type of glass substrates and cleaned as described before, were
drilled previously with two holes of 1 mm diameter. A commercial platinum based
paste (Platisol T/SP from Solaronix®) was applied on the glass substrate by screen-
printing followed by annealing at 400 ºC for 15 minutes.
Both DSCs and half cells devices, the two electrodes were assembled and sealed
using a laser assisted glass frit method25
. To control the exposed SnO2-F area to
electrolyte, the glass frit-sealing perimeter was varied from 5 to 12 mm (see Figure
4.18), without changing the total distance to the electrical contact; this way the electron
lifetime can be controlled without changing the series resistances. Dye adsorption in
the porous TiO2 photoelectrode was obtained by recirculating a dye solution (0.5 mM

114 Temperature Role in the Recombination Reaction on Dye-Sensitized Solar Cells
Dye-sensitized Solar Cells: Improving Lifetime Stability and Performance
N719, 5 M chenodeoxycholic acid in ethanol) for 12 hours using a peristaltic pump
(Ismatec®, Reglo Digital MS-4/8), followed by ethanol rinsing, nitrogen drying,
electrolyte filling (high stability iodolyte Z-150 from Solaronix®) and hole sealing by a
combination of thermoplastic sealant (Surlyn®, Dupont) and high temperature resistant
resin (Pattex® Nural 22 from Henkel). Solder bus bars and electrical wires were applied
to the FTO surface of the photo and counter-electrodes, respectively, using an
ultrasonic soldering unit (MBR electronics model USS-9210); the soldered bus bars
were protected by high temperature resistant resin to prevent corrosion caused by the
heat and moisture. The described manufacture process produced devices resistant at
least to 120 ºC, without electrolyte leakage. The DSCs manufactured have between 5
and 6 % efficiency (25ºC, 100 mW·cm-2
, 1.5 air mass filter) which is a typical
efficiency value in devices prepared with a non-volatile electrolyte (Iodolyte Z150 –
Solaronix) based on methoxypropionitrile (MPN), which is known to produced stable
but less efficient devices than acetonitrile based electrolytes.
Figure 4.2 Schematics of the manufactured DSC device (not in scale): 1 –
Photoelectrode glass; 2 – electrical contact; 3 – counter-electrode glass; 4 – filling
hole cover; 5 – drilled hole for temperature measurement, T2; 6 –filling hole; 7 -
drilled hole for temperature measurement, T1; 8 – TCO; 9 – platinum catalyst; 10 –
TiO2 with adsorbed sensitizer; 11 – electrolyte; 12 – glass frit sealing.

Chapter 4 115
Dye-sensitized Solar Cells: Improving Lifetime Stability and Performance
Figure 4.3 Pictures of the laser sealed: (a) half-cells and (b) dye-sensitized solar
cells: 1 – drilled hole for temperature measurement; 2 – electrical contact; 3 –
electrical terminal; 4 – glass frit sealing; 5 – electrolyte filling hole.
4.2.2 Experimental Setup
The experimental I-V characteristics were obtained in a setup equipped with a 150
W xenon light source (Oriel class A solar simulator, Newport, USA) with variable light
intensity, from 10 to 100 mW·cm-2
(0.1 to 1 sun light intensity), and using a 1.5 air
mass filter (Newport, USA). The simulator was calibrated using a single crystal Si
photodiode (Newport, USA). The I-V characteristics of the solar cell were obtained
applying an external potential load and measuring the generated photocurrent using an
AUTOLAB electrochemical station. This station was also used to characterize the cells
through EIS. The frequency range for EIS measurements was from 100 kHz to 0.05 Hz
with an AC modulation signal of 10 mV. EIS measurements were carried out in dark
and at the open circuit potential measured at 25ºC (Voc, 25ºC) for DSCs and at 0 V for
half-cells. The operation temperature of the solar cell was controlled using an in-house
made experimental setup, shown in Figure 4.4 and Figure 4.5, based on a peltier device
(Marlow Industries, model RC12-6) connected to a Keithley DC power supply (Model
2425C). A PID algorithm was run on a National Instruments LabVIEW application
shown in appendix B, Figure B3. Four K-type thermocouples were placed in different
locations: in a drilled axial hole in the photoelectrode glass (T1), in the counter
electrode glass (T2) and at aluminum slabs connected to the cold and hot side (T3 and

116 Temperature Role in the Recombination Reaction on Dye-Sensitized Solar Cells
Dye-sensitized Solar Cells: Improving Lifetime Stability and Performance
T4, respectively) of the thermo-electrical element (peltier module). All heat transfer
interfaces were filled with thermal conducting paste to maximize the heat transfer.
When a potential difference is applied to the thermo-electrical element (4), a
temperature difference is created between both sides (T3 and T4) of the peltier device.
By using a PID algorithm it is possible to accurately control temperature at the
DSC (T3). The heat-dissipating surface (T4) of the peltier device was cooled using a
thermal fluid from a thermostatic bath (Julabo model ME, Germany) (5). Under
illumination, and without temperature control, the temperature inside the DSC can
increase more than 10 ºC in a few minutes. Figure 4.6 show that when the temperature
control is turned on, the system immediately responds to correct the temperature to the
desired set-point.
Figure 4.4 Experimental setup used for temperature control of an under illumination
DSC between -10 °C and 105 °C. 1- thermal insulator black mask; 2- DSC; 3-
aluminum slab; 4- peltier device; 5- aluminum slab with drilled thermal fluid circuit.

Chapter 4 117
Dye-sensitized Solar Cells: Improving Lifetime Stability and Performance
Figure 4.5 Experimental setup used for temperature control of an under illumination
DSC between -5 °C and 105 °C. 1–Keithley DC supply; 2–Newport solar simulator;
3– temperature control unit; 4– NI acquisition board; 5– solar simulator; 6– cooling
fluid lines; 7– DSC electrical connections to autolab potentiostat; 8– aluminum slab
with drilled thermal fluid circuit; 9 – thermocouple T2 ; 10 – peltier device; 11 –
DSC; 12– thermocouple T1; thermocouple T3; 14 – electrical connections from
peltier device to Keithley DC supply.
Figure 4.6 Temperature measurements of an illuminated DSC (100 mW·cm-2
, AM
1.5) with and without temperature control (temperature set point = 25ºC ).

118 Temperature Role in the Recombination Reaction on Dye-Sensitized Solar Cells
Dye-sensitized Solar Cells: Improving Lifetime Stability and Performance
Figure 4.7 Temperature values from: a) T1 (photoelectrode), T2 (counter electrode),
calculated temperature difference between electrodes; and b) average cell
temperature vs. set point temperature.
Figure 4.7 shows the temperature readings of a DSC device under illumination.
Typically the temperature difference between the counter-electrode side (T2) and the
peltier cold side (T3) is less than 1 ºC, as the heat conduction of the aluminium slab is
quite high. However, the temperature difference between the glass substrates of both
electrodes of the solar cell can be relatively high, especially at low or high

Chapter 4 119
Dye-sensitized Solar Cells: Improving Lifetime Stability and Performance
temperatures. Above a set point of 50 ºC the temperature gap starts widening and it can
go up to 20 ºC at 110 ºC; this illustrates the low thermal conductivity of the glass
substrates. Although the gap between both electrodes is filled with liquid electrolyte,
there is always a temperature gradient inside the cell, particularly at temperatures far
from room temperatures. This fact highlights the importance of taking correct
temperature readings when analyzing the temperature effect. In all results presented in
this work the temperature was corrected to the average cell temperature calculated by
the readings taken inside both glass electrodes of the solar cell (T1 and T2).
4.3 Results and Discussion
4.3.1 Temperature influence in DSC performance
I-V and EIS analysis were conducted in several batches of DSCs, from set point
temperatures ranging from -5 ºC to 105 ºC. Voc, Jsc, FF and were read for each
temperature using the average of three devices; these parameter were used to
characterize the performance of the cells and are now on called performance
parameters. The photoconversion efficiency (η) of the solar cell was determined by its
current-voltage characteristics, specifically the open-circuit photovoltage (Voc), the
photogenerated current density measured under short-circuit conditions (Jsc), the
intensity of incident light (Is) and the fill factor of the cell (FF). The current and voltage
output of the DSC result from a balance between charge generation flux and
recombination flux. The effect of temperature in the I-V curves of a typical DSC batch
is presented in Figure 4.8. The I-V curves have been normalized with respect to Voc and
Jsc obtained at 25 ºC. As the temperature rises, there is a decrease in both Voc and Jsc
values, leading to a decrease in the performance.

120 Temperature Role in the Recombination Reaction on Dye-Sensitized Solar Cells
Dye-sensitized Solar Cells: Improving Lifetime Stability and Performance
Figure 4.8 (a) I-V and (b) power curves normalized to the corresponding values at
25ºC. (Voc,25ºC = 0.77 V ; Jsc,25ºC = 9.4 mA·cm-2
; FF25ºC = 0.65 ; η25ºC = 4.8 %), as a
function of the temperature.
Figure 4.9 shows the performance parameters, normalized by the corresponding
values obtained at 25 ºC, as a function of the temperature. FF appears to be the only
parameter that has some increase with temperature. It can be clearly seen that there are
different decrease rates of Voc and Jsc as a function of the temperature; the short circuit
current has a higher decrease with temperature than the open circuit voltage. FF is the
ratio between the maximum power density and the product of Voc and Jsc; because the
Voc decreases with temperature at a higher rate than Jsc, there is a higher FF for higher

Chapter 4 121
Dye-sensitized Solar Cells: Improving Lifetime Stability and Performance
temperatures. In this particular batch of cells, the efficiency is approximately constant
with temperature up to ca. 50 ºC. Considering 25 ºC as the reference temperature, at 50
ºC these cells retained about 91 % of the efficiency; at 70 ºC, 70 % and at 100 ºC, only
ca. 30 %.
Figure 4.9 Performance parameters normalized to the corresponding values 25 ºC
values (Voc,25ºC = 0.77 V ; Jsc,25ºC = 9.4 mA·cm-2
), as a function of the operating
temperature. Lines were added for readability.
To check whether this loss of efficiency was reversible, the I-V characterization
was repeated at 25 ºC after the samples underwent the highest temperature analysis
(Figure 4.10 and Table 4.1). The performance of DSCs showed excellent temperature
resistance: there was a decrease in Jsc, but an increase in the FF that resulted in a higher
efficiency (5.83 % vs. 6.01 % before and after the tests, respectively). The Voc showed
no meaningful changes before and after the tests. The DSCs also showed less than 15
% total efficiency degradation after over 1000 hours of storage at room temperature in
dark conditions, after conducting the temperature tests – Figure 4.11. This was mainly
due to a decrease in the Jsc, which in turn is probably caused by dye desorption from
TiO2 film occurred at high temperatures, a known phenomenon with the N719/I3-
system27,28
; the Voc and FF showed remarkable stability with no particular degradation.

122 Temperature Role in the Recombination Reaction on Dye-Sensitized Solar Cells
Dye-sensitized Solar Cells: Improving Lifetime Stability and Performance
These results show that, in the described analysis conditions and up to 100 ºC, there is
no internal degradation of the solar cell components, which attests the thermal
resistance and sealing quality of the prepared DSCs; this allows a correct analysis of
the temperature influence.
Figure 4.10 I-V and power density curves for a DSC before and after sustaining the
temperature analysis range from 0 to 100 ºC. Lines were added for readability.
Table 4.1 Performance parameters, obtained at 25 ºC, of samples that underwent the
temperature analysis, before and after the tests.
Parameter Before temperature tests After temperature tests
Voc / V 0.77 ± 0.03 0.77 ± 0.02
Jsc / mA·cm-2
11.3 ± 0.25 10.8 ± 0.19
MMP / mW·cm-2
5.72 ± 0.16 5.95 ± 0.13
FF 0.66 ± 0.12 0.71 ± 0.18
/ % 5.83 ± 0.05 6.07 ± 0.04

Chapter 4 123
Dye-sensitized Solar Cells: Improving Lifetime Stability and Performance
Figure 4.11 Performance parameters vs. time since preparation of samples that
underwent the temperature analysis (0 to 100 ºC): Voc – open circuit voltage; Jsc –
short circuit current density; FF – fill factor; η - photo conversion efficiency. Lines
were added for readability.
The DSC efficiency dependence on the temperature is normally assigned to the
conduction band shifts in the TiO2 photoelectrode, recombination and charge transport
processes 29, 30
. Temperature controlled EIS experiments were conducted in platinum
half cells, in order to characterize the temperature influence at the counter electrode
during the operation of the DSCs. Bode and Nyquist diagrams are shown for platinum
half cells in Figure 4.4, obtained at 0 V and under dark conditions for different
temperatures; the electrochemical reaction at the platinum catalyst layer and electrolyte
was then assessed. The Bode diagram shows two frequency peaks, one at low
frequencies, corresponding to the diffusion of ionic species in the electrolyte (I- and I3
-
), and another at high frequencies, ascribed to the electrochemical reaction at the
platinum counter electrode with the electrolyte31-33
. The operating temperature causes a
slight frequency shift in the low frequency peak, and a moderate shift in the high
frequency peak, suggesting a higher temperature influence in the charge transfer
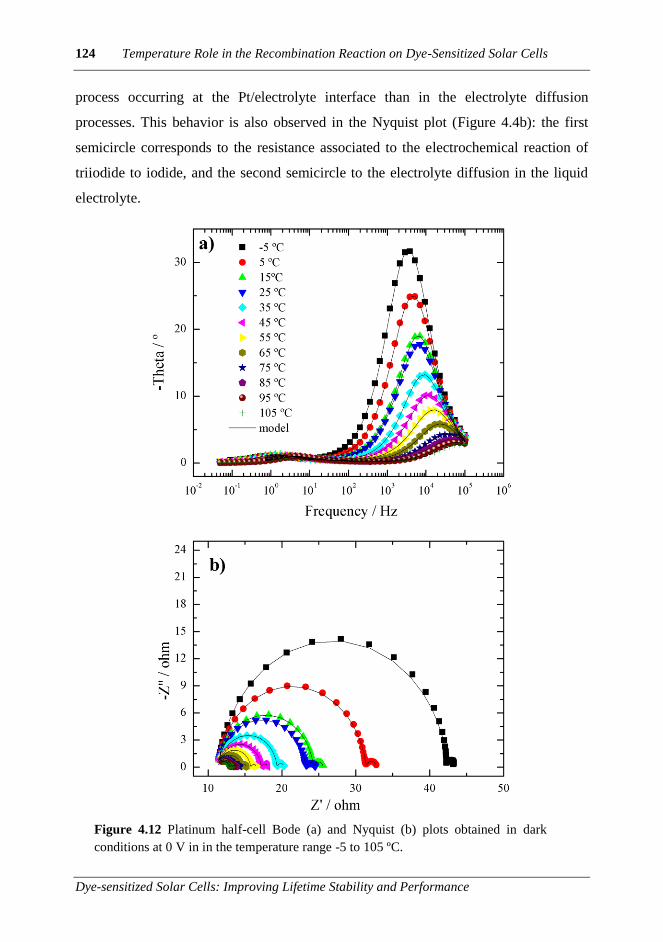
124 Temperature Role in the Recombination Reaction on Dye-Sensitized Solar Cells
Dye-sensitized Solar Cells: Improving Lifetime Stability and Performance
process occurring at the Pt/electrolyte interface than in the electrolyte diffusion
processes. This behavior is also observed in the Nyquist plot (Figure 4.4b): the first
semicircle corresponds to the resistance associated to the electrochemical reaction of
triiodide to iodide, and the second semicircle to the electrolyte diffusion in the liquid
electrolyte.
Figure 4.12 Platinum half-cell Bode (a) and Nyquist (b) plots obtained in dark
conditions at 0 V in in the temperature range -5 to 105 ºC.

Chapter 4 125
Dye-sensitized Solar Cells: Improving Lifetime Stability and Performance
From the Nyquist plot it can be seen that the first semicircle changes considerably
with temperature while the second semicircle changes only slightly. To understand and
quantify this influence, the EIS experimental data was fitted to an equivalent electrical
analogue based on a Randles-type circuit (presented in Figure 4.13), using ZView®
(Scribner Associates Inc.)34,35
. The fitting results are shown in Figure 4.14, where the
charge transfer resistance (RCE), chemical capacitance of the counter electrode (CCE),
and ionic diffusion coefficient (𝐷I3−) are plotted against temperature. RCE displays an
exponential trend with temperature as expected from the Butler-Volmer equation; the
electrolyte diffusion shows an exponential increase with temperature as well, whereas
the counter electrode electrochemical capacitance remains relatively constant,
unsurprisingly, as the reaction surface area is unchanged by temperature36
. These
results suggest that temperature has a highly beneficial effect regarding to the counter
electrode operation. In DSCs, the electrochemical reaction at the counter electrode is
basically the same that might happen at the photoelectrode when generated electrons
undesirably react with electrolyte species present in the porous film of titanium
dioxide; this prejudicial reaction, typically called recombination reaction, is believed to
be the main limiting factor of efficiency, not only in DSCs but in the majority of solar
technologies37-39
. The fundamental difference between both reactions is the source of
electrons and the interface where the electrochemical reactions take place. At the
counter electrode the triiodide reduction reaction takes place catalyzed by platinized
layer applied on the SnO2:F substrate; iodine diffuse then to the photoelectrode for
regenerating the oxidized dye. Direct reduction of triiodide may happen at the
photoelectrode – external recombination, which limits the total current and voltage and
thus the final efficiency of the device. The recombination reaction can occur directly at
TiO2/electrolyte interface (R1) or at the FTO/electrolyte interface (R2), as represented
in Figure 4.1.

126 Temperature Role in the Recombination Reaction on Dye-Sensitized Solar Cells
Dye-sensitized Solar Cells: Improving Lifetime Stability and Performance
Figure 4.13 Electrical analogue used for fitting the electrochemical impedance
spectra of half-cells. Rs – series resistances ; RCE – charge transfer at catalytic
interface; CCE double layer capacitance at catalytic interface; Zd- Nernst diffusion
within electrolyte
Figure 4.14. Impedance data obtained for a platinum half-cell, at 0 V in dark
conditions cells in the temperature range studied. Lines were added for readability.
Figure 4.16 shows for a typical batch of DSCs the EIS results. The experimental
data was fitted using appropriated electrical analogues, namely using the transmission
line model (presented in Figure 4.15)40-42
. This model, proposed by Bisquert et al.23
, is
widely used to describe the transport and recombination kinetic processes in DSCs.

Chapter 4 127
Dye-sensitized Solar Cells: Improving Lifetime Stability and Performance
Figure 4.15 Transmission line model used to fit EIS experimental data of DSCs. Rs
– series resistances; RTCO/EL – charge transfer resistance at exposed TCO/electrolyte interface;
CTCO/EL double layer capacitance at exposed TCO/electrolyte interface; Rk – recombination
resistance; Rw – transport resistance; cµ – chemical capacitance; Zd- Warburg element of the
Nernst diffusion of I3-within electrolyte; RCE – charge transfer at platinum/TCO interface; CCE
double layer capacitance at the platinum/TCO interface.
Figure 4.16 Complete DSC Bode (a) and Nyquist (b) plots obtained under dark
conditions, at the Voc of the cell at 25 ºC (-0.78 V) for the temperature range of 5 °C
to 105 ºC.

128 Temperature Role in the Recombination Reaction on Dye-Sensitized Solar Cells
Dye-sensitized Solar Cells: Improving Lifetime Stability and Performance
The experiments were conducted under dark conditions at the Voc value obtained at
25 ºC (0.77 V). The Bode diagram shows two frequency peaks, corresponding to the
electron transport and recombination at the photoelectrode (low frequency) and to the
reduction reaction occurring at the platinum counter electrode (high frequency). Both
phase peaks shift to higher frequencies as temperature increases; the shift of the high
frequency peak in the Bode diagram and the first semicircle in the Nyquist plot teaches
that the counter electrode performance improves with the temperature. Looking at the
low frequency peak in the Bode diagram (Figure 4.16a) and the second semicircle in
the Nyquist plot (Figure 4.16b) it appears that the electron/electrolyte recombination
resistance decreases with the temperature. The calculated parameters from the model
fitting 41
are plotted against temperature in Figure 4.17. Transport and recombination
related parameters are the photoelectrode capacitance, CPE, electron diffusion
coefficient, Deff, recombination resistance, Rk, and electron lifetime, τe-. While CPE
appears to be relatively constant, due to the unchanged reaction surface area, Rk and τe-
decrease exponentially with temperature. This highlights the fact that the
recombination reaction is highly enhanced by temperature. However, electron
transport, evaluated by Deff, improves with temperature. Considering that the final
performance of the solar cell is a balance between electron generation, recombination
and transport, there are two opposite effects caused by temperature: on one hand the
recombination increases with the temperature; however, the electron transport rate also
increases with temperature. Assuming that electron generation rate, conduction band
and electrolyte redox potentials are mostly constant with temperature6, in terms of DSC
performance clearly the balance is negative as seen from the global efficiency vs.
temperature results (Figure 4.8 and Figure 4.9). This highlights that, in terms of
temperature dependence, recombination is dominant over the charge transport.

Chapter 4 129
Dye-sensitized Solar Cells: Improving Lifetime Stability and Performance
Figure 4.17 Impedance parameters obtained by EIS for complete DSCs cells at 0.78
V under dark conditions, for the temperature range studied. Lines were added for
readability.

130 Temperature Role in the Recombination Reaction on Dye-Sensitized Solar Cells
Dye-sensitized Solar Cells: Improving Lifetime Stability and Performance
4.3.2 Recombination and DSC performance as a function of the
temperature
To assess the recombination rate at interfaces TiO2/electrolyte and FTO/electrolyte
of the solar cell and their temperature dependence, five batches of DSCs were prepared
and analyzed by means of I-V and EIS characterization. Each batch, of three identical
cells, differs in terms of total recombination rate constant, kr(i). To experimentally
change the total recombination reaction constant, kr(1) to kr(5), the perimeter length of
the glass frit sealing was varied as displayed by Figure 4.18a); all the remaining solar
cell design parameters (such as TiO2 active area, distance to metallic contacts, etc.)
were kept constant. This way it is possible to change the extent of free TCO area in
contact with electrolyte, and thus the amount of generated electrons that may
recombine with triiodide. It should be emphasized that the total distance from the
active area to the metallic contact remains constant; therefore the series resistance in
the solar cell is also constant between batches. Because the TiO2/electrolyte interface is
constant for all five batches of cells, it is then possible to assess the temperature effect
on the recombination rate constant at the FTO/electrolyte.
Figure 4.18b) plots the electron lifetime against the exposed electrolyte area for
DSCs with and without TiO2 blocking layer. Indeed, the exposed area affects
recombination, even in the case of DSCs with TiO2 blocking layer applied over the
SnO2-F film. This illustrates the importance of minimizing the exposed non-active area
to electrolyte, as well as the optimization of blocking layer design. An ideal blocking
layer should completely prevent recombination, fact that does not happen according to
the results presented in Figure 4.18b). The blocking layer employed was applied by
chemical bath deposition of aqueous TiCl4 solution; although this is a common method
when preparing high efficient DSCs, it is known that this procedure may produce a
defected blocking layer12,43
.

Chapter 4 131
Dye-sensitized Solar Cells: Improving Lifetime Stability and Performance
Figure 4.18 a) Schematic diagram showing the methodology to control the
FTO/electrolyte exposed reaction interface in the photoelectrode; 1 – TCO; 2 – glass
frit sealing; 3 – electrolyte; 4 – TiO2 with adsorbed sensitizer; 5 – electrical contact;
the dashed lines represent the relative positioning of the glass frit sealing. b)
Experimental results of electron lifetime versus exposed area of electrolyte to FTO
or TiO2 blocking layer. Lines were added for readability.
Analyzing the I-V parameters (normalized by results at 25 ºC) for the different
DSC batches, Figure 4.19, it is possible to conclude that the trend of each parameter
(Voc, Jsc, FF and η) depends on the total recombination rate constants; the rate constants
were numbered from the highest, kr(1), to the lowest kr(5). The results indicate that the
total recombination reaction rate increases monotonously with interface area and
temperature. This means that even though the prepared solar cells at 25 ºC have similar

132 Temperature Role in the Recombination Reaction on Dye-Sensitized Solar Cells
Dye-sensitized Solar Cells: Improving Lifetime Stability and Performance
Figure 4.19 I-V performance parameters relative to 25 ºC values of five different
batches of DSCs differing in the recombination reaction constant kr(i).The black
dashed line in a) corresponds to the theoretical Voc vs. temperature trend expected for
a cell with no recombination (calculated from the Butler-Volmer equation44
). Lines
were added for readability.
efficiencies (~ 5 % to 6 %), when subjected to different operating temperatures,
substantial changes in performance emerge. The differences observed in the FF and
efficiency are caused by Voc(T) and Jsc(T) values. On one hand, it is expected TiO2
conduction band down shift to the electrolyte redox potential, reducing in this way the
open circuit voltage; however, this shift causes only a slight change as seen Figure
4.19a) (dashed black line, calculated from the Butler-Volmer equation44
). The
difference between the normalized open circuit potential values, V*oc, predicted by
Butler-Volmer and the observed values was assigned to the recombination. On the
other hand, Jsc is basically determined by the balance between electron generation and
recombination. Assuming that the temperature has a negligible effect in the photon

Chapter 4 133
Dye-sensitized Solar Cells: Improving Lifetime Stability and Performance
absorption and electron generation processes45,46
, the trend observed in Figure 4.19b)
should then be mainly attributed to recombination. It can be concluded that
recombination has a preponderant influence in the Voc and Jsc evolution with
temperature.
The recombination rate constants of the five batches of DSCs were plotted against
the inverse of temperature to construct the Arrhenius plot – Figure 4.20a). As expected,
the curves corresponding to cells with higher recombination display higher
recombination rates. There are clearly two different trends in each curve with a
breaking point at ca. 40 ºC, which correspond to different activation energy values.
The activation energies (Ea) were calculated for each batch of cells, based on two linear
fittings. The two Ea values for each batch corresponds to the temperature ranges below
(Ea,lt) and above (Ea,ht) 40 °C. These values were plotted against the respective rate
constants in Figure 4.20b). There are two important observations: i) for both
temperature ranges, the activation energies increase with recombination rate; ii) Ea,lt is
lower than Ea,ht. This means that more efficient cells, i.e. with less recombination
(lower kr), have lower activation energy values. This fact can be explained as follows:
in this work to obtain high recombination cells the exposed TCO interface to
electrolyte was increased as previously described; this means that for high
recombination cells (i.e., kr(1)) most of the recombination interface is SnO2-F.
Oppositely, in low recombination cells (i.e., kr(5)) there is nearly no FTO exposed, and
the main recombination reaction proceeds at TiO2 interface.
The results suggest that the driving force for the electrochemical reaction between
electrons and triiodide is related not only with a reaction rate constant, kr(T), (that is
temperature dependent) and chemical concentration of triiodide in electrolyte (that in
this case is constant across devices), but also with the energy level of electrons. Given
this, when electrons are in a higher energy level (i.e. TiO2 CB, -4.2 eV47
) the activation
energy required for recombination is lower comparing with electrons in lower energy
levels (i.e. SnO2-F CB, -4.7 eV47
). This support the results for the activation energies
being lower for TiO2 dominant cells compared with DSCs with largely exposed TCO.
Indeed, these results clearly show that the activation energy barrier rules the
recombination process.

134 Temperature Role in the Recombination Reaction on Dye-Sensitized Solar Cells
Dye-sensitized Solar Cells: Improving Lifetime Stability and Performance
Figure 4.20 Arrhenius plot, with respective linear fittings, for several sets of DSCs
with different recombination rate constants; b) Activation energies vs. recombination
rate constant and respective exponential fits, calculated from the Arrhenius plot
trends found for temperatures lower and above 40 ºC. The calculated activation
energies increase with recombination; an axis displaying the lifetime of electrons is
also shown. Lines were added for readability.

Chapter 4 135
Dye-sensitized Solar Cells: Improving Lifetime Stability and Performance
Chemical reactions occasionally show an Arrhenius plot with two different linear
trends at regions of low and high temperatures, respectively. Typically, this feature is
associated with simultaneous and competing reactions or reaction mechanisms
involving different activation energies48
, with one reaction being dominant depending
on the temperature range. In the present case, to understand the two trends of the DSCs
recombination reaction Arrhenius plot, half-cells of FTO (SnO2-F), TiO2 and platinum
films were prepared and analyzed as described before; the corresponding Arrhenius
plot is shown in Figure 4.21. As expected the platinum half-cells show very high
reaction rates since platinum is good catalyst for the reduction reaction of triiodide to
iodide. The SnO2-F / SnO2-F half-cells show two clear distinct trends in the Arrhenius
plot: between 30 °C - 40 ºC there is very little influence of temperature in the reaction
rate, showing very small activation energy in this temperature range. However, for
temperatures higher than 40 ºC there is a good linear fit resulting in activation energy
of 0.66 eV. Contrarily, in the case of TiO2/TiO2 half-cells, the Arrhenius plot does not
show multiple trends and the calculated activation energy was found to be 0.47 eV.
To rationalize the shape of the Arrhenius plots for recombination in DSCs, seen in
Figure 4.20a), the logarithmic of the average rate constants for SnO2-F and TiO2 was
plotted -green curve in Figure 4.21. This has a similar shape as the ones from complete
DSCs, showing that the influence that temperature has in the recombination process
makes a contribution from two distinct recombination mechanisms that occur at the
different interfaces of the solar cell.
The data presented at Figure 4.21 shows that at temperatures below 40 ºC,
temperature has almost no influence in recombination reaction rate at the TCO
interface. This suggests that at low temperature the main recombination reaction
mechanism should be between trapped electrons and electrolyte. SnO2-F trap states,
located at energies below the conduction band, could be positioned close and even at
lower energies than the redox energy of the electrolyte (energies from SnO2-F CB and
redox energy of electrolyte are close, ca. -4.7 and -5.0 eV, respectively47
), which
means that below a certain temperature (40 ºC according to the results of this work) the
reaction rate is mostly temperature independent, simply because most electrons do not
have sufficient energy to react with the electrolyte. However, in the TiO2 case, due to

136 Temperature Role in the Recombination Reaction on Dye-Sensitized Solar Cells
Dye-sensitized Solar Cells: Improving Lifetime Stability and Performance
its higher conduction band energy (~ -4.26 eV), most trap states ought to be located
above the redox energy of the electrolyte. This means that, for the temperature range
studied, most trapped electrons should have enough energy to react with electrolyte
species.
The results suggest that there is a shift in the dominant recombination pathway
from trapped electrons to electrolyte to CB electrons to electrolyte, which explains the
different trends in the Arrhenius plots. The recombination reaction mechanism between
CB electrons and electrolyte species requires less activation energy; this is confirmed
by the activation energy values presented in Figure 4.20b). As the total recombination
increases (higher kr in abscissas axis of Figure 4.20b), activation requires progressively
more energy due to the trapping energy.
The different shapes found in the Arrhenius plots of the platinum half cells can
also be explained considering that the catalyst layer consists of platinum nanoparticles
deposited on the TCO; SnO2-F crystals exposed to electrolyte at this surface provide an
alternative reaction pathway from the Pt catalyst.
Taking into account the above considerations, the main results concerning
recombination vs. temperature are compiled in Table 4.2. The cells with low kr show
higher Voc and higher activation energies for recombination reaction that occurs mainly
at TiO2 /electrolyte: Ea,lt = 0.26 eV and Ea,ht = 0.42 eV; when the main recombination
interface is SnO2-F/electrolyte (high kr) the activation energy is found to be Ea,lt = 0.43
eV and Ea,ht = 0.46 eV.

Chapter 4 137
Dye-sensitized Solar Cells: Improving Lifetime Stability and Performance
Figure 4.21 Arrhenius plot of recombination reaction (reduction of triiodide) for
three types of half-cells: SnO2-F, TiO2 blocking layer and Pt. The green curve
represents the average between the TiO2 and SnO2-F curves.
Table 4.2 Recombination rate constants, open-circuit voltages at 25 ºC, and
activation energies calculated for different batches of complete DSCs and half-cells.
Device kr,25ºC / s-1
Voc,25ºC / V Ea,lt / eV Ea,ht / eV
DSCs
kr,(1) 281 0.719 0.43 0.46
kr,(2) 122 0.727 0.38 0.48
kr,(3) 62.1 0.734 0.33 0.43
kr,(4) 42.8 0.768 0.32 0.42
kr,(5) 20.8 0.770 0.26 0.42
Half-cells
Pt 4257
0.30 0.75
SnO2-F 22.64 0.0 0.66
TiO2 16.00 0.47 0.47

138 Temperature Role in the Recombination Reaction on Dye-Sensitized Solar Cells
Dye-sensitized Solar Cells: Improving Lifetime Stability and Performance
4.4 Conclusions
DSC performance as a function of the temperature was assessed for a wide range
of temperatures, from -5 ºC up to 105 ºC. DSC cells were hermetically sealed using the
recently developed laser assisted glass sealing process, which allowed obtaining
reliable results. Within the temperature range considered, it was not observed
degradation of the components of the solar cells, with full efficiency reversibility (at 25
ºC) in samples tested up to 100 ºC.
The recombination was quantified as a function of temperature and for SnO2-
F/electrolyte and TiO2/electrolyte interfaces. It was concluded that the electrons energy
level significantly affects the recombination reaction: when electrons are in a higher
energy level (i.e. TiO2 CB) the driving force for recombination is lower comparing
with lower energy level electrons (i.e. SnO2-F CB). Thus, the activation energy was
found to be lower for the recombination taking place at TiO2 interface than SnO2-F
interface with electrolyte (0.47 eV vs. 0.66 eV, respectively).
Arrhenius plots for recombination rates in DSCs showed two different activation
energies for temperatures below and above ca. 40 ºC. To explain this fact, the authors
propose a shift in the dominant recombination pathway from trapped
electrons/electrolyte to CB electrons/electrolyte. This work shows that recombination
depends on both the temperature and semiconductor interfaces present in the solar cell.
Generally temperature has an overall negative effect on the DSC performance; this
effect was shown to be governed by the total electron/electrolyte recombination.
Acknowledgements
J. Maçaira is grateful to the Portuguese Foundation for Science and Technology
(FCT) for his PhD Grant (Reference: SFRH/BD/80449/2011). L. Andrade
acknowledges European Research Council (Contract no: 321315). Financial support
by European Research Council (Contract no: 321315), FCT (PTDC/EQU-
EQU/120064/2010) and Project WinDSC SI&IDT (ref. 21539/2011) for financial
support are also acknowledged.

Chapter 4 139
Dye-sensitized Solar Cells: Improving Lifetime Stability and Performance
References
1. S. R. Raga and F. Fabregat-Santiago, Physical Chemistry Chemical Physics,
2013, 15, 2328-2336.
2. M. Toivola, L. Peltokorpi, J. Halme and P. Lund, Solar Energy Materials and
Solar Cells, 2007, 91, 1733-1742.
3. M. Berginc, U. Opara Krašovec, M. Jankovec and M. Topič, Solar Energy
Materials and Solar Cells, 2007, 91, 821-828.
4. H. Yang, C. Yu, Q. Song, Y. Xia, F. Li, Z. Chen, X. Li, T. Yi and C. Huang,
Chem. Mater., 2006, 18, 5173-5177.
5. K. Lobato and L. M. Peter, The Journal of Physical Chemistry B, 2006, 110,
21920-21923.
6. J. S. Henry, S.-M. Lukas, G. Michael and C. Marco, Physical Review B
(Condensed Matter and Materials Physics), 2006, 74, 045306 045301-045306
045306
7. M. Wang, P. Chen, R. Humphry-Baker, S. M. Zakeeruddin and M. Gratzel,
ChemPhysChem, 2009, 10, 290-299.
8. R. Memming, Semiconductor Electrochemistry, Wiley-VCH, 2001.
9. M. Bailes, P. J. Cameron, K. Lobato and L. M. Peter, The Journal of Physical
Chemistry B, 2005, 109, 15429-15435.
10. B. O'Regan, L. Xiaoe and T. Ghaddar, Energy & Environmental Science, 2012,
5, 7203-7215.
11. B. C. O'Regan and J. R. Durrant, The Journal of Physical Chemistry B, 2006,
110, 8544-8547.
12. P. J. Cameron and L. M. Peter, The Journal of Physical Chemistry B, 2003, 107,
14394-14400.
13. L. Kavan, N. Tétreault, T. Moehl and M. Grätzel, The Journal of Physical
Chemistry C, 2014.
14. L. Kavan, M. Zukalova, O. Vik and D. Havlicek, ChemPhysChem, 2014, 15,
1056-1061.
15. D. H. Kim, M. Woodroof, K. Lee and G. N. Parsons, ChemSusChem, 2013, 6,

140 Temperature Role in the Recombination Reaction on Dye-Sensitized Solar Cells
Dye-sensitized Solar Cells: Improving Lifetime Stability and Performance
1014-1020.
16. J. Xia, N. Masaki, K. Jiang and S. Yanagida, The Journal of Physical Chemistry
B, 2006, 110, 25222-25228.
17. H.-J. Son, C. Prasittichai, J. E. Mondloch, L. Luo, J. Wu, D. W. Kim, O. K.
Farha and J. T. Hupp, Journal of the American Chemical Society, 2013, 135,
11529-11532.
18. K.-I. Jang, E. Hong and J. Kim, Korean J. Chem. Eng., 2012, 29, 356-361.
19. C. Jiang, W. L. Koh, M. Y. Leung, W. Hong, Y. Li and J. Zhang, Journal of
Solid State Chemistry, 2013, 198, 197-202.
20. W. Yongzhen, Y. Xudong, C. Han, Z. Kun, Q. Chuanjiang, L. Jian, P. Wenqin,
I. Ashraful, B. Enbing, Y. Fei, Y. Maoshu, Z. Peng and H. Liyuan, Applied
Physics Express, 2014, 7, 052301.
21. B. C. O'Regan, J. R. Durrant, P. M. Sommeling and N. J. Bakker, The Journal of
Physical Chemistry C, 2007, 111, 14001-14010.
22. F. d. r. Sauvage, D. Chen, P. Comte, F. Huang, L.-P. Heiniger, Y.-B. Cheng, R.
A. Caruso and M. Graetzel, ACS Nano, 2010, 4, 4420-4425.
23. J. Bisquert, The Journal of Physical Chemistry B, 2002, 106, 325-333.
24. J. Bisquert, Journal of Electroanalytical Chemistry, 2010, 646, 43-51.
25. F. Ribeiro, Maçaira,J. , Cruz, R., Gabriel, J., Andrade, L., Mendes, A., Solar
Energy Materials and Solar Cells, 2012, 96, 43-49.
26. PCT/IB2012/051376, 2012.
27. N. Jiang, T. Sumitomo, T. Lee, A. Pellaroque, O. Bellon, D. Milliken and H.
Desilvestro, Solar Energy Materials and Solar Cells, 2013, 119, 36-50.
28. N. Kato, K. Higuchi, H. Tanaka, J. Nakajima, T. Sano and T. Toyoda, Solar
Energy Materials and Solar Cells, 2011, 95, 301-305.
29. A. Usami, S. Seki, Y. Mita, H. Kobayashi, H. Miyashiro and N. Terada, Solar
Energy Materials and Solar Cells, 2009, 93, 840-842.
30. H. J. Snaith and L. Schmidt-Mende, Advanced Materials, 2007, 19, 3187-3200.
31. L. Andrade, J. Sousa, H. A. Ribeiro and A. Mendes, Solar Energy, 2011, 85,
781-793.
32. R. Cruz, D. A. Pacheco Tanaka and A. Mendes, Solar Energy, 2012, 86, 716-

Chapter 4 141
Dye-sensitized Solar Cells: Improving Lifetime Stability and Performance
724.
33. F. Fabregat-Santiago, J. Bisquert, G. Garcia-Belmonte, G. Boschloo and A.
Hagfeldt, Solar Energy Materials and Solar Cells, 2005, 87, 117-131.
34. R. Cruz, J. P. Araujo, L. Andrade and A. Mendes, Journal of Materials
Chemistry A, 2014, 2, 2028-2032.
35. A. Hauch and A. Georg, Electrochimica Acta, 2001, 46, 3457-3466.
36. J. Bisquert, Physical Chemistry Chemical Physics, 2003, 5, 5360-5364.
37. H. J. Snaith, Advanced Functional Materials, 2010, 20, 13-19.
38. B. E. Hardin, H. J. Snaith and M. D. McGehee, Nat Photon, 2012, 6, 162-169.
39. J. Maçaira, L. Andrade and A. Mendes, Renewable and Sustainable Energy
Reviews, 2013, 27, 334-349.
40. J. Bisquert, M. Gratzel, Q. Wang and F. Fabregat-Santiago, The Journal of
Physical Chemistry B, 2006, 110, 11284-11290.
41. L. Andrade, S. M. Zakeeruddin, M. K. Nazeeruddin, H. A. Ribeiro, A. Mendes
and M. Grätzel, ChemPhysChem, 2009, 10, 1117-1124.
42. Q. Wang, J.-E. Moser and M. Grätzel, The Journal of Physical Chemistry B,
2005, 109, 14945-14953.
43. B. Yoo, K.-J. Kim, S.-Y. Bang, M. J. Ko, K. Kim and N.-G. Park, Journal of
Electroanalytical Chemistry, 2010, 638, 161-166.
44. J. Macaira, L. Andrade and A. Mendes, RSC Advances, 2014, 4, 2830-2844.
45. M. Grätzel, Progress in Photovoltaics: Research and Applications, 2000, 8, 171-
185.
46. M. Grätzel and J.-E. Moser, in Electron Transfer in Chemistry, ed. V. Balzani,
Wiley-VCH, Weinheim, 2001, vol. 5, ch. Part 3.
47. R. Memming, in Semiconductor Electrochemistry, Wiley-VCH Verlag GmbH,
2007, pp. 241-263.
48. L. Masgrau, À. González-Lafont and J. M. Lluch, Theor Chem Acc, 2003, 110,
352-357.


CHAPTER 5 Modeling, Simulation and Design of Dye
Sensitized Solar Cells
“Design is not just what it looks like and feels like. Design is how it works”
Steve Jobs

Adapted from the peer-reviewed article
J. Macaira; L. Andrade; A. Mendes, Modeling, simulation and design of dye
sensitized solar cells. RSC Advances 2014, 4, (6), 2830-2844.

5
Modeling, Simulation and Design of Dye
Sensitized Solar Cells
Abstract
It is well known that recombination and transport rule the performance of dye
sensitized solar cells (DSCs); although, the influence that these two phenomena have in
their performance, particularly in the open circuit-potential (Voc) and in the short circuit
current (Jsc), is not fully understood. In this paper a phenomenological model is used to
describe the quantitative effect that transport and recombination have in the
performance of the solar cell and their influence in its optimal design. The model is
used to predict the influence of the recombination reaction rate constant (kr) and
diffusion coefficient (Deff) in the Voc and in the Jsc, whether a linear or non-linear
recombination kinetics is considered. It is provided a methodology for decoupling the
conduction band shifts from recombination effect in charge extraction experiments.
Results also suggest that the influence of recombination in the Voc and in Jsc is highly
dependent on the reaction order considered. This fact highlights the importance of
considering the reaction order when modeling data obtained by experimental methods.
The combined results are analyzed and discussed in terms of the collection efficiency
and in the optimization of the photoelectrode thickness. The model provides also a
useful framework for exploring new concepts and designs for improving DSCs
performance.

146 Modeling, Simulation and Design of Dye Sensitized Solar Cells
Dye-sensitized Solar Cells: Improving Lifetime Stability and Performance
5.1 Introduction
The dye sensitized solar cell (DSC) is a potentially low cost photovoltaic
technology that recently has achieved 12 % efficiency by two different approaches1,2
.
A very recent work reported an energy conversion efficiency of 15 % for a new
sensitized solar cell3. This world record has been announced by M. Gräztel at the
Hybrid and Organic Photovoltaic conference (HOPV 2013) meeting held in Seville in
2013 and has been certified as 14 % of energy efficiency by Newport Corporation3.
Dye sensitized solar cells (DSCs) mimic natural photosynthesis and differ from
conventional p-n junction devices because light collection and charge transport are
separated in the cell4. Light absorption occurs in the chemisorbed sensitizer molecule,
while electron transport occurs in the semiconductor. The photo conversion energy
efficiency (η) of the solar cell is determined by its current-potential characteristics,
specifically the open-circuit photopotential (Voc), the photocurrent density measured
under short-circuit conditions (Jsc), the intensity of incident light (Is) and the fill factor
of the cell (FF). The working principles of DSCs, illustrated in Figure 5.1, can be
summarized in the following steps:
a) Light harvesting: photon absorption by dye molecules adsorbed in a
monolayer on the surface of the mesoporous semiconductor (typically
TiO2); electrons from the ground state (S) are promoted to the excited state
(S*, k11):
S
ℎ𝑣 ,𝑘11 → 𝑘12
← S∗ (5.1)
b) Injection: the excited electrons are injected into the conduction band of the
semiconductor (k21), resulting in the oxidation of the sensitizer (S+):
S∗
𝑘21 → 𝑘22
← S
+ + eCB−
(5.2)
c) Dye regeneration: reduction of the oxidized sensitizer (S+) to its original
state (S) by electron donation from I- present in the liquid electrolyte,
producing I3− (k3):

Chapter 5 147
Dye-sensitized Solar Cells: Improving Lifetime Stability and Performance
S+ +3
2I−
𝑘3 →
1
2I3− + S (5.3)
d) Collection: diffusive collection of electrons from the mesoporous
semiconductor to the transparent conductive oxide (TCO) where they
become available for electrical work in the external circuit;
e) Electrolyte mass transfer: diffusive transport of the reduced I3− and
oxidized I- through the pores of the semiconductor to and from the counter
electrode (usually coated with a platinum catalyst);
f) Electrolyte regeneration: at the counter electrode the platinum catalyst
reduces the oxidized I3−
back to I- by reaction with a low energy electron
from the external circuit (k4):
I3− + 2e−
𝑃𝑡 ,𝑘4 → 3I− (5.4)
During this series of reactions, there are also processes that are unfavorable to
the DSC performance:
g) Decay of dye excited state: decay of the excited state of the dye (S+) to the
ground state (S) before electron injection in the conduction band of the
semiconductor. This reaction (k12) competes directly with the injection step
(k21);
h) Electron-dye recombination (k22): reaction between the oxidized dye
molecules (S+) and electrons in the conduction band of the TiO2. This
competes with dye regeneration (k3) and with collection of electrons from
the TiO2 (d);
i) Electron-electrolyte recombination: reaction of conduction band electrons
with electrolyte species. This reaction competes with electron collection
(d).
I3− + 2e𝐶𝐵
− 𝑘5 → 3I− (5.5)

148 Modeling, Simulation and Design of Dye Sensitized Solar Cells
Dye-sensitized Solar Cells: Improving Lifetime Stability and Performance
Figure 5.1 Illustration of DSC’s working principles. The full arrows represent the
forward electron transfer reactions; the dashed arrows represent electron losses
routes.
For solar cell to produce electrical energy, the forward electron transfer reactions
(k11, k21, k3 and k4) must overcome the possible electron lost pathways (k12, k22 and k5).
The time constant ranges of each reaction are illustrated in Figure 5.25. The
recombination reaction of electrons with electrolyte species (k5) is considered to be one
of the most important energy efficiency bottlenecks. Because the electrolyte is present
throughout all the porous structure of the semiconductor, the recombination reaction is
affected by the photoelectrode thickness, iodide concentration, dye structure and
others6-9
.
The average electron diffusion coefficients in anatase TiO2 range between 10-4
and
10-5
cm2∙s
-1 10, resulting in an electron transport time constant (τtr) for a typical 10 µm
thick photoelectrode in the range of few milliseconds. The electron lifetime (τe-)
corresponding to a recombination reaction constant of k5 – Figure 5.2, has the same
order of magnitude of the electron transport time constant resulting in a direct

Chapter 5 149
Dye-sensitized Solar Cells: Improving Lifetime Stability and Performance
competition between these two mechanisms. The current and potential outputs of the
DSC are recombination limited, and result from a balance between the charge
generation and the recombination fluxes. Controlling charge extraction, by increasing
transport, and lowering charge recombination will increase the efficiency of DSCs.
Thus, understanding charge recombination and controlling recombination rate
constants is of utmost importance. Several studies have been carried out to understand
how recombination can been lowered in DSCs, and many articles have been published
examining the effect of electrolyte additives, new photoanode architectures, new dyes,
surface coatings, among other factors11-23
.
Figure 5.2 Dynamics of the electrochemical processes during DSCs operation;
adapted from 5.
In this work a dynamic phenomenological model proposed initially by Andrade et
al.24
is used to describe the quantitative effect that transport and recombination have in
the performance of the solar cell, and the influence that this has in its design. The
model is used to predict the influence of the recombination reaction rate constants (kr)
and diffusion coefficients (Deff) in the Voc and Jsc, considering linear or non-linear
recombination reaction. The results are helpful, particularly in decoupling phenomena
seen in charge extraction experiments that are usually used to assess and compare
recombination rates among DSC samples.
5.2 Modeling
The model used in this work is based on the initially proposed model by Andrade
et al.24
but taking into account the recombination reaction order parameter β. The
mobile species considered in the present model are electrons in the conduction band of

150 Modeling, Simulation and Design of Dye Sensitized Solar Cells
Dye-sensitized Solar Cells: Improving Lifetime Stability and Performance
TiO2 and iodide and triiodide ions in the liquid electrolyte. The developed model of an
irradiated DSC assumes the following physical and chemical processes:
1) electron generation (from excited dye molecules);
2) electron transport in the porous semiconductor (TiO2);
3) electron recombination with electrolyte species;
4) oxidation of iodide (inside the pores of TiO2);
5) and reduction of triiodide (at the platinum catalyst).
It is assumed that the cell is irradiated perpendicularly to the photoelectrode and
that each absorbed photon generates one injected electron into the TiO2 conduction
band. All injected electrons are considered from the excited state of the dye, and not
from TiO2 band gap excitation. Reactions (1) and (2) are considered irreversible since
their forward kinetic constants are much higher that the corresponding reverse kinetic
constants (k11 >> k12 and k21 >> k22)5. Therefore only one possible mechanism for
electron loss is assumed, corresponding to the recombination reaction of electrons with
electrolyte species (reaction 5, k5).
Figure 5.3 illustrates the modeled DSC. The photoelectrode is deposited over the
TCO layer, which has an electrical resistance of RTCO, and is made of a film of sintered
TiO2 nanoparticles with thickness Lf and porosity ε. The dye is adsorbed on this
mesoporous film of TiO2 as a monolayer. The dye has a wavelength-dependent light
absorption coefficient of α(λ). The liquid electrolyte, made of the redox pair I−/ I3−
(with diffusion coefficients 𝐷I−and 𝐷I3−), is responsible for the regeneration of the dye,
transporting low energy electrons from the counter-electrode. The TCO-TiO2 interface
was defined to be at x = 0. This interface is modeled as an ideal ohmic contact,
meaning that there is no charge transfer resistance at the interface. At the counter
electrode, the interface electrolyte-platinum catalyst happens at x = L and the
electrochemical reduction of I3− was described by the Butler-Volmer equation. The
electron transport in the photoelectrode was assumed to be governed by diffusion
(negligible convection)18
.

Chapter 5 151
Dye-sensitized Solar Cells: Improving Lifetime Stability and Performance
Figure 5.3 Scheme of the modeled DSC.
From the previous assumptions, the continuity and transport equation that describe
the mobile species is24
:
−𝜕𝐽i
𝜕𝑥+ 𝐺i(𝑥) − 𝑅i(𝑥) =
𝜕𝑛i
𝜕𝑡, 𝑖 = e− , I3
− , I− (5.6)
The first term on the left hand side of equation (5.6) represents the charge carrier
flux. The second and third terms, Gi(x) and Ri(x), represent the generation and
recombination rates of species i, respectively. The term on the right hand side of the
equation is the time derivative of the species i concentration. The charge carrier flux,
Ji, is assumed to occur by diffusion only and is given by the Fick’s law25
:
𝐽i = −𝐷i𝜕𝑛i
𝜕𝑥 (5.7)
and the generation rate is given by the Beer-Lambert law that relates the absorption of
light to the properties of the material through which the light is travelling:
𝐺i = 𝜂inj𝛼(𝜆)𝐼0𝑒−𝛼(𝜆)𝑥 (5.8)
Each absorbed photon is assumed to produce one injected electron. The developed
model considers a uniformly distributed monolayer of dye through the surface area of
TiO2. The injection efficiency parameter, 𝜂inj, takes into account this phenomenon but
also the light reflection and glass and electrolyte absorption losses.
For each two electrons that react with triiodide, three ions of iodide are formed
(reaction 5). The recombination rate term can be written as follows26
:

152 Modeling, Simulation and Design of Dye Sensitized Solar Cells
Dye-sensitized Solar Cells: Improving Lifetime Stability and Performance
𝑅e− = 𝑘r(𝑛e−(𝑥, 𝑡) − 𝑛eq)𝛽
(5.9)
The recombination reaction kinetics is subject of much debate and some of the
scientific work published so far considers that this reaction follows first-order kinetics:
𝛽 = 1 ; 𝑘r =1
𝜏e− (5.10)
where kr is the reacton rate constant and 𝜏e− is the electron lifetime.
However, several uncertainties surround the recombination kinetics in DSCs and
the respective parameters that govern the solar cells behavior. Some models assume
that the rate at which electrons are transferred from the conduction band to the redox
electrolyte is first order in free electron concentration (β = 1)27,28
. However, it has been
suggested that deviations from the first order model may arise from the recombination
process being mediated by electronic surface states below the TiO2 conduction
band29-31
. A non-linear model formulation is then being suggested:
𝛽 ≠ 1 ; 𝑘𝑟 = 𝑘01
𝜏e− (5.11)
where kr is the reaction rate constant, in m-3(1-β)·s-1
, and k0 is a model constant. The
driving force of the recombination reaction is the diference between the generated
electrons density, 𝑛e−(𝑥, 𝑡), and the dark equilibrium electron density, 𝑛eq. This
electron density corresponds to the resulting equilibrium bewteen the electron at the
fermi level and the redox potential of the electrolyte:
𝑛eq = 𝑁CB exp [−𝐸CB −𝐸redox
kB𝑇] (5.12)
According to the above assumptions the model equations can be written as follows:
Electrons balance
Introducing equations (5.7)‒(5.9) into the continuity equation (5.6), the continuity
equation for electrons comes:
𝐷e−𝜕2𝑛e−
𝜕𝑥2+ 𝜂inj𝛼(𝜆)𝐼0𝑒
−𝛼(𝜆)𝑥 − 𝑘𝑟(𝑛e−(𝑥, 𝑡) − 𝑛eq)𝛽=
𝜕𝑛e−
𝜕𝑡 (5.13)
Assuming that for t = 0 the cell is not illuminated, the electron density is equal to
the dark electron density, neq:

Chapter 5 153
Dye-sensitized Solar Cells: Improving Lifetime Stability and Performance
𝑡 = 0 𝑛e− (𝑥, 0) = 𝑛eq (5.14)
A charge balance at the interface x = 0 determines that the electron flux at x=0+
equals the electron flux at x=0-. Therefore, the charge balance at this interface is given
by 𝐽e−0+ = 𝐽e−
0−. Because 𝐽e−0+ corresponds to the diffusive electrons transported through
the TiO2, which in steady state is the net current produced by the solar cell, Jcell, the
boundary condition for x=0 is:
𝑥 = 0 ; 𝐽e−0+ = − q𝐷e−
∂ne−
∂x𝑥=0+ (5.15)
where q is the electron elementary charge. At x=L there is no contact between the film
of TiO2 nanoparticles and the platinized FTO. Therefore, there are no electrons
bridging between the photoelectrode and the counter-electrode. Only iodide and
triiodide perform this charge transfer. Thus, the corresponding boundary condition for
x = L is:
𝑥 = 𝐿 ;𝜕𝑛e−
𝜕𝑥 = 0 (5.16)
Iodide and Triiodide balance
Each generated mole of electrons causes the consumption of one mole of I- ion and
the production of half mole of I3- that can be reduced back to I
- form either at the
platinum layer or due to the recombination reaction (undesirable back reaction).
Besides the reduction of triiodide that takes place at the counter-electrode, the
oxidation and reduction reactions of the ionic species take place in the photoelectrode
porosity. Accordingly to the stoichiometry reactions (5.3) and (5.4) the terms of
generation and recombination of triiodide and iodide must be affected by the
corresponding coefficients:
𝐷I−𝜕2𝑛I−
𝜕𝑥2−
3
2𝜀[𝜂inj𝛼(𝜆)𝐼0𝑒
−𝛼(𝜆)𝑥 − 𝑘𝑟(𝑛e−(𝑥, 𝑡) − 𝑛eq)𝛽−
𝜕𝑛e−(𝑥,𝑡)
𝜕𝑡 ] =
𝜕𝑛I−(𝑥,𝑡)
𝜕𝑡
(5.17)
𝐷I3−𝜕2𝑛I3
−
𝜕𝑥2+
1
2𝜀[𝜂inj𝛼(𝜆)𝐼0𝑒
−𝛼(𝜆)𝑥 − 𝑘𝑟(𝑛e−(𝑥, 𝑡) − 𝑛eq)𝛽−
𝜕𝑛e−(𝑥,𝑡)
𝜕𝑡 ] =
𝜕𝑛I3−(𝑥,𝑡)
𝜕𝑡
(5.18)

154 Modeling, Simulation and Design of Dye Sensitized Solar Cells
Dye-sensitized Solar Cells: Improving Lifetime Stability and Performance
At instant t = 0, the concentration of iodide and triiodide is known:
𝑡 = 0 ∶ 𝑛I3−(𝑥, 0) = 𝑛I3−ini ; 𝑛I−(𝑥, 0) = 𝑛I−
ini (5.19)
At the interface of TiO2/TCO, x = 0, only electrons are able to flow so the net flux
of I3− and I− is zero:
𝑥 = 0 ∶ 𝜕𝑛I3
−
𝜕𝑥 = 0 ;
𝜕𝑛I−
𝜕𝑥 = 0 (5.20)
Although there is generation and consumption of both ionic species, their total
number of moles remains constant, thus resulting in the following integral boundary
condition:
𝑥 = 𝐿 : ∫ 𝑛I3−(𝑥)𝑑𝑥𝐿
0= 𝑛I3−
ini 𝐿 ; ∫ 𝑛I−(𝑥)𝑑𝑥𝐿
0= 𝑛I−
ini 𝐿 (5.21)
For the three charged species, e−, I3− and I−, the initial and boundary conditions,
(5.14), (5.15), (5.16) and (5.19)-(5.21), are given and are necessary to solve the three
non-linear differential equation system, (5.13), (5.17) and (5.18). However, additional
information is needed at x = 0 to solve the system: the net current at this interface must
be known, Jcell. Assuming that the external circuit has no resistances, the electron
density generated by the cell, Jcell, equals the current density that is returned to the cell
via the counter electrode, J0. Here, electrons participate in the reduction reaction of
triiodide to iodide - reaction (5.4) - catalyzed by the platinum catalyst deposited on top
of the TCO surface and thus it can be treated as an electrochemical half-cell32
; the
charge transfer can be described by the Butler-Volmer equation. This approach is
considered to describe the electrochemical kinetics at this interface x = L+∆33,34
:
𝐽cell = 𝐽0 [𝑛I3
−(𝐿)
𝑛I3−oc(𝐿)
𝑒𝛼𝑞𝜂Pt𝑘𝐵𝑇 −
𝑛I−(𝐿)
𝑛I−oc(𝐿)
𝑒−(1−𝛼)𝑞𝜂Pt
𝑘𝐵𝑇 ] (5.22)
The Butler-Volmer equation describes the reduction reaction overpotential at the
counter-electrode catalyst as a function of the current density. It describes the charge
transfer over a metal/electrolyte interface assuming no charge diffusion limitations in
the electrolyte. The charge transfer reaction at the platinized interface has a charge
transfer resistance, Rct. An overpotential is necessary to drive the reaction at a certain
current density, Jcell. As stated by equation (5.22), the current density of the cell
depends on the exchange current density, J0, which is the electron’s ability to exchange
with the solution, but also on the platinum overpotential, ηPt. This value translates the

Chapter 5 155
Dye-sensitized Solar Cells: Improving Lifetime Stability and Performance
necessary potential to overcome the energy barrier of the reaction of the electrons with
the triiodide. This corresponds to an overall potential loss of the solar cell and must be
as low as possible35,36
. The counter electrode overpotential, ηPt, can be obtained as
follows24
:
Δ𝑉int =1
𝑞[𝐸CB + 𝑘𝐵𝑇 ln
𝑛e−(𝑥=0)
𝑁CB− 𝐸redox
0 −𝑘𝐵𝑇
2ln
𝑛I3−oc
(𝑛I−oc𝐿)3
− 𝑞𝜂Pt]
𝜂Pt =𝐸CB−𝐸redox
oc
𝑞+
𝑘𝐵𝑇
𝑞[ln
𝑛I3−oc
2(𝑛I−oc𝐿)
3 + ln𝑛e−(𝑥=0)
𝑁CB] − Δ𝑉int (5.23)
Analyzing equation (5.23) is understood that ηPt, and consequently the electrons
flux, depends on the internal potential of the solar cell. There are also external
resistances that should be accounted for and correlated to the internal resistances; this
can be done using Kirchhoff’s and Ohm’s laws32
:
∆𝑉int = (𝑅s + 𝑅ext) (𝑅𝑝
𝑅ext+𝑅s+𝑅𝑝)𝐴 𝐽cell (5.24)
where Rs is the sum of all external resistances, Rext is the applied load, Rp are the
shunt resistances, and A the active area of the DSC. Equation (5.24) should be inserted
in the counter electrode overpotential equation (5.23) and then introduced in the
Butler-Volmer equation (5.22). Thus the produced current of the solar cell, equation
(5.22), can be determined by the applied load, Rext. The external potential given by the
device is calculated taking into account the produced current, the applied load and the
other resistances taken into account in the model:
𝑉ext = 𝑅ext (𝑅𝑝
𝑅ext+𝑅s+𝑅𝑝)𝐴 · 𝐽cell (5.25)
To decrease the number of variables and to improve numerical convergence issues
of the numerical methods, the model parameters were made dimensionless respecting
to the electron and ionic species parameters and the semiconductor thickness:
𝜑 = 𝛼(𝜆)𝐿, 𝜃 =𝐷ref
𝐿2𝑡, 𝑛i
∗ =𝑛𝑖
𝑛ref, 𝑥∗ =
𝑥
𝐿,
𝐷i∗ =
𝐷i
𝐷ref, 𝑗cell
∗ =𝐽cell
𝐽0, 𝐷𝑎 =
𝐿2·𝜂inj·𝛼(𝜆)·𝐼0
𝐷ref·𝑛ref, 𝜙 = 𝐿√𝐿3(1−𝛽) ·
𝑘r
𝐷ref
Using the above established dimensionless variables, the dimensionless equations
and respective initial and boundary conditions can be written as follows for the three
modeled species (e−, I3− and I−):
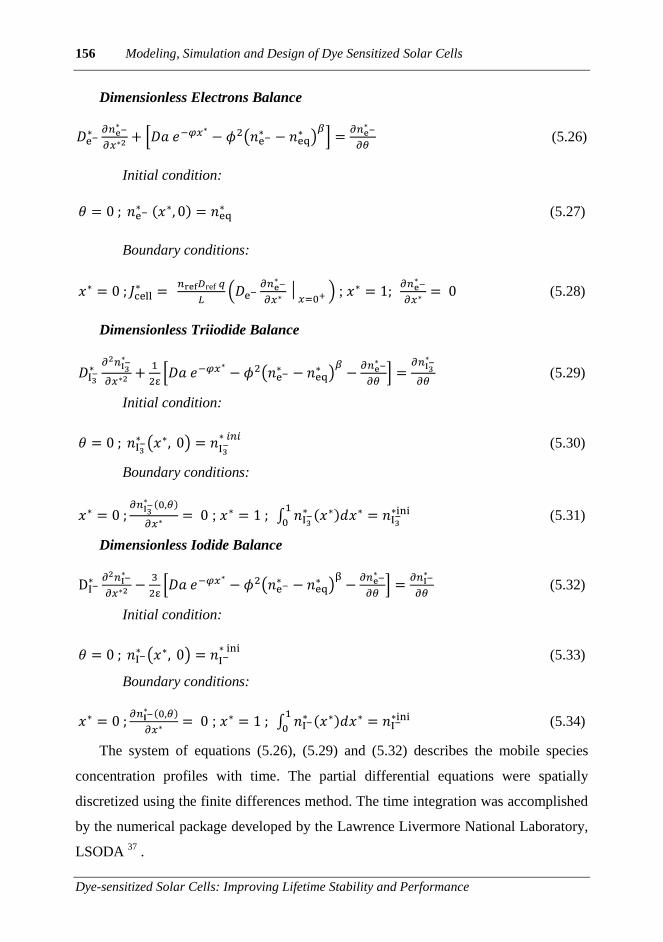
156 Modeling, Simulation and Design of Dye Sensitized Solar Cells
Dye-sensitized Solar Cells: Improving Lifetime Stability and Performance
Dimensionless Electrons Balance
𝐷e−∗ 𝜕𝑛e−
∗
𝜕𝑥∗2+ [𝐷𝑎 𝑒−𝜑𝑥
∗− 𝜙2(𝑛e−
∗ − 𝑛eq∗ )
𝛽] =
𝜕𝑛e−∗
𝜕𝜃 (5.26)
Initial condition:
𝜃 = 0 ; 𝑛e−∗
(𝑥∗, 0) = 𝑛eq
∗ (5.27)
Boundary conditions:
𝑥∗ = 0 ; 𝐽cell∗ =
𝑛ref𝐷ref 𝑞
𝐿(𝐷e−
𝜕𝑛e−∗
𝜕𝑥∗𝑥=0+ ) ; 𝑥∗ = 1;
𝜕𝑛e−∗
𝜕𝑥∗= 0 (5.28)
Dimensionless Triiodide Balance
𝐷I3−∗𝜕2𝑛I3
−∗
𝜕𝑥∗2+
1
2ε[𝐷𝑎 𝑒−𝜑𝑥
∗− 𝜙2(𝑛e−
∗ − 𝑛eq∗ )
𝛽−
𝜕𝑛e−∗
𝜕𝜃] =
𝜕𝑛I3−∗
𝜕𝜃 (5.29)
Initial condition:
𝜃 = 0 ; 𝑛I3−∗ (𝑥∗, 0) = 𝑛I3−
∗ 𝑖𝑛𝑖 (5.30)
Boundary conditions:
𝑥∗ = 0 ;𝜕𝑛I3
−∗ (0,𝜃)
𝜕𝑥∗= 0 ; 𝑥∗ = 1 ; ∫ 𝑛I3−
∗ (𝑥∗)𝑑𝑥∗1
0= 𝑛I3−
∗ini (5.31)
Dimensionless Iodide Balance
DI−∗ ∂2𝑛I−
∗
∂𝑥∗2−
3
2ε[𝐷𝑎 𝑒−𝜑𝑥
∗− 𝜙2(𝑛e−
∗ − 𝑛eq∗ )
β−
∂𝑛e−∗
∂𝜃] =
∂𝑛I−∗
∂𝜃 (5.32)
Initial condition:
𝜃 = 0 ; 𝑛I−∗ (𝑥∗, 0) = 𝑛I−
∗ ini (5.33)
Boundary conditions:
𝑥∗ = 0 ;𝜕𝑛𝐈−
∗ (0,𝜃)
𝜕𝑥∗= 0 ; 𝑥∗ = 1 ; ∫ 𝑛I−
∗ (𝑥∗)𝑑𝑥∗1
0= 𝑛I−
∗ini (5.34)
The system of equations (5.26), (5.29) and (5.32) describes the mobile species
concentration profiles with time. The partial differential equations were spatially
discretized using the finite differences method. The time integration was accomplished
by the numerical package developed by the Lawrence Livermore National Laboratory,
LSODA 37
.

Chapter 5 157
Dye-sensitized Solar Cells: Improving Lifetime Stability and Performance
5.3 Experimental
5.3.1 Dye sensitized solar cell preparation
Steady state simulated results were critically compared with experimental results
of two DSCs with different photoelectrode thicknesses: device A with 7.5 µm and
device B with 12.5 µm. The photoelectrodes were prepared on 2.2 mm thick and
7 Ω·-1
FTO coated glass substrates from Solaronix®. First, the glasses were washed
sequentially with a detergent solution (Alconox®, VWR) in an ultrasonic bath at 55 ºC
for 15 min, followed by ultrasonic cleaning in deionized water at room temperature,
rinsed with ethanol and dried with air. To form a thin and compact layer of TiO2 above
the FTO layer, the substrates were immersed in a 40 mM TiCl4 aqueous solution at 70
ºC, for 20 minutes. After washing with water and ethanol, the samples were dried with
a nitrogen flow. Then, the samples were coated with porous TiO2 layer by screen
printing a commercial TiO2 paste (Ti-Nanoxide T/SP from Solaronix®), followed by
drying at 80 ºC for 20 minutes. To control the final thickness of the transparent layer of
TiO2, the screen printing procedure (printing and drying) was repeated as necessary to
get the desired thickness of photoelectrode. The samples were annealed at 500 ºC for
15 min in an infrared electrical oven. After firing, the samples were again treated with
a 40 mM TiCl4 aqueous solution at 70 ºC for 20 minutes, before being sintered at 500
ºC for 30 min. The counter electrodes, prepared on the same type of glass substrates
and cleaned as described before, were drilled previously with two holes of 1 mm
diameter. A drop of H2PtCl6 solution (2 mg of Pt in 1 mL ethanol) was applied on the
glass substrate followed by annealing at 400 ºC for 15 minutes. Both electrodes were
assembled and sealed using a laser assisted glass frit method described in Chapter 2 38
.
Dye adsorption in the porous TiO2 was obtained recirculating 1 mM N719 dye solution
for 10 hours, followed by ethanol rinsing, nitrogen drying, electrolyte filling (Iodolyte
Z-150 from Solaronix®) and hole sealing by thermoplastic sealant (Surlyn
®, Dupont).

158 Modeling, Simulation and Design of Dye Sensitized Solar Cells
Dye-sensitized Solar Cells: Improving Lifetime Stability and Performance
5.4 Results and Discussion
5.4.1 Current-potential characteristics
The input values of parameters for the simulation step are listed in Table 5.1. For
each parameter it is indicated if the value was obtained by fitting to the experimental
results (parameters kr, β and Ec-Eredox) or from an independent source.
The experimental I-V characteristics were obtained in a set-up equipped with a
1600 W xenon light source (Oriel class B solar simulator, Newport, USA) irradiating
100 mW·cm-2
(1 sun light intensity) and using a 1.5 air mass filter (Newport, USA).
The simulator was calibrated using a single crystal Si photodiode (Newport, USA). The
I-V characteristics of the solar cell were obtained applying an external potential bias
(electrical load) and measuring the generated photocurrent.
Figure 5.4 plots the experimental and simulated I-V and power curves for the two
sets of samples. The experimental and simulated results are in good agreement. Table
5.2 present the experimental and simulated performance parameters; the relative
difference between both is smaller than 2 % showing that the model is able to simulate
accurately the experimental results.
Figure 5.4 Experimental and simulated results I-V and power curves for device A
and B (photoelectrode with 7.5 µm and 12.5 µm thickness). All other parameters are
presented in Table 5.1.
0
2
4
6
8
10
12
14
16
0
2
4
6
8
10
12
14
16
0.00 0.10 0.20 0.30 0.40 0.50 0.60 0.70 0.80
Pow
er D
ensi
ty /
mW
· c
m-2
Cu
rren
t D
ensi
ty/
mA
· cm
-2
Potential /V Experimental I-V, device B Experimental I-V, device AExperimental power curve, device B Experimental power curve, device AModel

Chapter 5 159
Dye-sensitized Solar Cells: Improving Lifetime Stability and Performance
Table 5.1 Input values for the simulation step for devices A and B.
Parameter notation Device
A
Device
B Ref
Morphological
features
PE Thickness Lf / μm 7.5 12.5 Measured
Film Porosity ε 0.63 Computed
Active area A / cm2 0.158 Measured
Photon
absorption/
electron
Injection
Incident
Photon Flux Is / cm
-2·s
-1 1.47×10
17 Measured
Injection
Efficiency ηinj 0.90
39
Dye
Absorption
Coefficient
α(λ) / cm-1
1000 Computed
Temperature T / K 298 Measured
Initial/boundar
y
concentrations
of species
Initial
Concentrations
C0
e- 0 -
𝐶I3−0 /mmol·dm
-3 100.0 Computed
𝐶I−0 / mmol·dm
-3 1100 Computed
Open-Circuit
Concentrations
𝐶I3−oc
/ mmol·dm-3
99.00 Computed
𝐶I−oc / mmol·dm
-3 1102 Computed
Diffusion
coefficients of
species
Diffusion
coefficients
𝐷I3− / cm2·s
-1 4.91×10
-6
24
𝐷I− / cm2·s
-1 4.91×10
-6
24
Deff / cm2·s
-1 1.10 × 10
-4
24
Pt Counter
electrode
Exchange
Current
Density
J0 / mA·cm-2
6.81 × 10⁻²
Computed
Symmetry
Parameter ζ 0.78
32
Recombination
reaction
Reaction order
coefficient β 0.75 Fit
Rate constant kr / m-0.75
·s-1
8.00 6.62 Fit
Density of
States
Ecb - Eredox eV 0.93 0.94 Fit
Effective
density of
states in the
TiO2
conduction
band
Nc / cm-3
1.00 × 10²¹
40
External
Resistances
Shunt
Resistances Rp / Ω 76129 14392 Computed
External Series
resistances Rs / Ω 40 47 Computed

160 Modeling, Simulation and Design of Dye Sensitized Solar Cells
Dye-sensitized Solar Cells: Improving Lifetime Stability and Performance
Table 5.2 Performance parameters of the simulated and experimental results.
Semiconductor
thickness 12.5 µm 7.5 µm
Performance
Parameter Simulation Experimental (σ / %) Simulation Experimental (σ / %)
Jsc / mA·cm-2
12.93 12.95 (0.1) 10.21 10.23 (0.2)
Voc / V 0.75 0.76 (0.6) 0.76 0.76 (0.7)
MMP /mW·cm-2
7.18 7.12 (0.9) 5.98 5.88 (1.7)
Vmpp / V 0.61 0.60 (1.2) 0.62 0.62 (0.0)
Jmpp / mA·cm-2
11.85 11.89 (0.1) 9.63 9.48 (1.6)
Fill Factor, FF 0.74 0.73 (1.4) 0.77 0.76 (1.2)
Efficiency, η 7.18 7.12 (0.9) 5.98 5.88 (1.7)
Even though the model predicts the experimental results reasonably well, there are
some deviations, particularly in the maximum power point. The deviation is caused by
the difference in the simulated and experimental fill factor. This difference probably
relates to the rough estimation made for the shunt resistance. The shunt resistance
relates to the back electron transfer across the TiO2/dye/electrolyte interface,
particularly in the dye free areas of the TiO2 surface and can be estimated from the
slope of the experimental I-V curve at short circuit41
.
5.4.2 Influence of recombination in DSCs
Controlling the recombination reaction is believed to be the key to developing new
materials and cell architectures for high efficient DSCs. Thus the interpretation of the
recombination rate constants influence in the working mechanisms of DSCs is of
extreme importance40,42
. In the previous section the model was compared to
experimental results and proved to model well the steady state behavior of the prepared
DSCs. In this section, the influence of kr in the performance of the solar cell is
assessed. This parameter affects the amount of generated electrons that react back to
the electrolyte. Figure 5.5 shows the simulated I-V curves for recombination rate
constants ranging from 5 to 1000 s-1
(β = 1). Clearly, the I-V curve is affected by the

Chapter 5 161
Dye-sensitized Solar Cells: Improving Lifetime Stability and Performance
amount of electrons that recombine, which is reflected particularly in the Jsc and Voc
values.
Figure 5.6 shows the simulated electron density profiles at steady-state conditions
and the theoretical photon absorption/electron generation through the TiO2 film
according to the Beer-Lambert law. Since solar radiation is assumed to strike the
photoanode side of the solar cell (see Figure 5.3), at x = 0, most of the electrons are
generated near this interface, due to the exponential behavior of the absorption law. For
this reason, and also because the transport path for the generated electrons increases
from x = 0 to 12.5 µm, a larger electron density gradient is seen at the beginning of the
film decreasing towards zero at positions close to x = 12.5 µm. This indicates that the
initial TiO2 layer thickness fraction closer to the illuminated side of the solar cell is the
one that contributes the most for the current delivered by the cell. The change in the
electron lifetime (assumed first order recombination) has a strong influence in the
electron density across the semiconductor. The electron density profiles have been
simulated for short-circuit (Figure 5.6), maximum power point (Figure 5.7) and open
circuit conditions (Figure 5.8). As expected, for higher recombination rates the
concentration of electrons are lower justifying the lower values of Jsc (Figure 5.6) and
Voc (Figure 5.8) parameters.
Figure 5.5 Simulated I-V curves with different recombination reaction rate
constants. All other parameters are presented in Table 5.1, device B.
0
2
4
6
8
10
12
14
16
0.00 0.20 0.40 0.60 0.80 1.00
Cu
rren
t D
ensi
ty /
mA
·cm
-2
Potential /V
Recombination r
rate constant kr / s-1
5
10
22
43
85
170
340
1000

162 Modeling, Simulation and Design of Dye Sensitized Solar Cells
Dye-sensitized Solar Cells: Improving Lifetime Stability and Performance
Figure 5.6 Simulated electron density profiles for short circuit conditions with
different recombination reaction rate constants. All other parameters are presented in
Table 5.1, device B.
Figure 5.7 Simulated electron density profiles for maximum power point with
different recombination reaction rate constants. All other parameters are presented in
Table 5.1, device B.
0
2
4
6
8
10
12
14
0
5
10
15
20
25
30
35
40
45
0 2 4 6 8 10 12
Ele
ctro
n g
ener
ati
on
/ ×
10
19 c
m-3
Ele
ctro
n d
ensi
ty /
× 1
016 c
m-3
Position x in TiO2 / μm kr / s
-1 20 45 65 200 Electron generation
0
2
4
6
8
10
12
14
0
10
20
30
40
50
60
0 2.5 5 7.5 10 12.5
Ele
ctro
n g
ener
ati
on
/ ×
10
19 c
m-3
Ele
ctro
n d
ensi
ty /
× 1
016 c
m-3
Position x in TiO2 / μm
kr / s-1 20 45 65 200 1000 Electron generation

Chapter 5 163
Dye-sensitized Solar Cells: Improving Lifetime Stability and Performance
Figure 5.8 Simulated electron density profiles for open circuit conditions with
different recombination reaction rate constants. All other parameters are presented in
Table 5.1, device B.
At open circuit conditions the recombination flux matches the photocurrent and
there are no electrons flowing to the external circuit. At these conditions there is almost
no electron gradient, as seen in Figure 5.8, and this equilibrium determines the open
circuit potential, Voc, of the device26
. Therefore, recombination determines the open
potential, Voc, of the device and also controls the short circuit current, Jsc. The excited
electron density profiles in the TiO2 film, simulated for different electron
recombination rates, enlighten the influence that this reaction has in the open potential,
Voc, of the solar cell. The electron recombination rate affects the electron flow through
the external circuit, and therefore, affects the chemical potential that is built inside the
device due to the presence of energy states below the Fermi level of the semiconductor.
This way, the amount of electrons that react with the triiodide affects the final potential
of the system, as can be confirmed in Figure 5.8 where higher recombination rates
reduce the electron density in the device at open circuit conditions and, by doing so,
the chemical potential within the device, acts to reduce the final Voc of the solar cell.
0
2
4
6
8
10
12
14
0
50
100
150
200
250
300
350
400
0 2.5 5 7.5 10 12.5
Ele
ctro
n g
ener
ati
on
/ ×
10
19 c
m-3
Ele
ctro
n d
ensi
ty /
×1
016 c
m-3
Position x in TiO2 / μm
kr / s-1 20 45 65 200 1000 Electron generation

164 Modeling, Simulation and Design of Dye Sensitized Solar Cells
Dye-sensitized Solar Cells: Improving Lifetime Stability and Performance
The concentration profiles of the ionic species, shown in Figure 5.9, are also
influenced by recombination. For an illuminated cell, triiodide is formed where there is
photon absorption and consequently electron injection, due to the regeneration reaction
of the oxidized dye with iodide, producing triiodide. Therefore electron generation
increases the consumption of iodide and consequently the formation of triiodide. By
increasing the recombination reaction rate constant, the amount of electrons that react
with triiodide is higher, and thus there is an extra consumption of triiodide besides the
amount that is produced by the regeneration reaction of iodide with the oxidized dye.
However, because there are less electrons flowing to the external circuit and being
returned back to the device through the counter electrode, there is an accumulation of
triiodide, mainly at the interface x = 12.5 µm, where the reduction reaction back to
iodide takes place at the platinum catalyst. Along with the extra consumption of
triiodide higher kr also causes higher formation of iodide; because the fraction of iodide
consumption due to the dye regeneration is independent of kr, for higher recombination
rates there is an accumulation of I- verified for x=0 ‒ Figure 5.9.
Figure 5.9 Simulated ionic concentration profiles for maximum power point for
different recombination reaction rate constants. All other parameters are given in
Table 5.1, device B.
0.80
0.85
0.90
0.95
1.00
0.950
0.960
0.970
0.980
0.990
1.000
0 5 10
Dim
ensi
on
less
Tri
iod
ide
con
cen
tra
tio
n
Dim
ensi
on
less
Io
did
e co
nce
ntr
ati
on
Position x in TiO2 / μm species, kr /s-1
Iodide, 20 Iodide , 45 Iodide, 200 Iodide , 1000
Triiodide, 20 Triiodide, 45 Triiodide, 200 Triiodide, 1000

Chapter 5 165
Dye-sensitized Solar Cells: Improving Lifetime Stability and Performance
The effect of recombination in the open circuit potential and in the short circuit
current is illustrated in Figure 5.10a. In this figure the values of Voc and Jsc are plotted
as a function of the recombination reaction rate constant for several values of the
recombination reaction coefficient β. The Voc shows a logarithmic dependence as a
function of the recombination reaction rate constant across all the values of kr and for
all values of β. The effect of the recombination in the Voc becomes higher for lower
values of β. However, in the case of the Jsc, apparently there are two distinct
logarithmic trends: lower recombination rates (kr < 50 s-1
) influence less Jsc than higher
values of kr. This fact remains true for β values higher than 0.7. For lower values of β
(< 0.7) the “non-ideality” trend of Jsc tends to disappear and the logarithmic
dependence remains constant for all values of kr. This “non-ideal” trend of Jsc vs. kr is
verified only for low values of kr and thus for situations where there is almost no
recombination in the DSC. Therefore, at these conditions, the Jsc does not appear to be
recombination-limited; hence the curves tend to predict the same Jsc regardless of the β
value, as can be seen in Figure 5.10b). This fact highlights the importance of
considering the reaction order especially for high values of kr, as it is where the β value
influences the most the predicted Jsc.

166 Modeling, Simulation and Design of Dye Sensitized Solar Cells
Dye-sensitized Solar Cells: Improving Lifetime Stability and Performance
Figure 5.10 Influence of the recombination reaction rate constants in the Voc (a) and
Jsc (b), considering several values of the recombination reaction coefficient, β. All
other parameters are presented in Table 5.1, device B.
0.6
0.65
0.7
0.75
0.8
0.85
1 10 100 1000 10000
Voc / V
kr / m-3(1-β)·s-1
Recombination reaction
coefficient, β
1.0 0.8 0.7 0.65
0
2
4
6
8
10
12
14
16
18
20
1 10 100 1000
Jsc
/ m
A . c
m-2
kr / m-3(1-β)·s-1
Recombination reaction
coefficient, β
1.0 0.8 0.7 0.65
a)
b)

Chapter 5 167
Dye-sensitized Solar Cells: Improving Lifetime Stability and Performance
5.4.3 Interpretation of recombination in charge extraction
experiments
The previous section studied the influence of the recombination effect on Jsc and
Voc; now, the influence of kr is discussed in terms of charge concentration. Usually
charge extraction experiments are used as a tool to assess limitations in the solar
cells40,43
. The method relies on the optical perturbation of the solar cell and the
corresponding measurement of the output transient electrical signals (current or
potential) of the device44,45
. This approach allows researchers to determine critical
information about the electron concentration, transport and recombination inside the
solar cell. This is particularly interesting for the development of new materials for
DSCs as it allows comparing results from different devices and understanding
differences in recombination, collection efficiency, conduction band shifts and other
factors that have a crucial role in the final performance of the DSC.
In this section the phenomenological model is used to predict the charge
concentration in DSCs for a given set of defined parameters, as a function of kr and
(Ecb-Eredox). The independent influence that recombination and conduction band shifts
have in the plots of charge concentration versus potential in the DSC is evaluated and
discussed. Figure 5.11a) shows the charge density as a function of the applied potential
calculated for several values of kr. The charge concentration shows an exponential
increase with the potential applied to the solar cell. Although there is some debate in
the academic field, the exponential behavior of charge density versus potential is
commonly attributed to the exponential distribution of the trap states below the
conduction band edge of TiO2 that are able to accept electrons44
. Because
recombination with electrolyte species is believed to occur with electrons in the
conduction band, a vertical shift up of the charge density curves generally means that
recombination decreases, see Figure 5.11a). In this figure, however, the value of (Ecb-
Eredox) was kept constant between simulations, which seldom happens experimentally.
When comparing recombination rates from experimental charge density results, there
is a high probability that a shift in the semiconductor conduction band edge also
occurs. The Ecb shift is caused by differences in the surface electric field between the

168 Modeling, Simulation and Design of Dye Sensitized Solar Cells
Dye-sensitized Solar Cells: Improving Lifetime Stability and Performance
TiO2 and the electrolyte. It can be caused by several factors, such as electrolyte
composition46-49
, surface treatments of TiO2 50,51
, dye molecular properties52
, dye
adsorption methods40,53
, temperature changes54
, among others. In Figure 5.11b) the
charge density is plotted versus the applied potential for several values of (Ecb-Eredox)
and for kr =14 s-1
. Figure 5.11b) shows that a relative shift of Ecb compared to Eredox
corresponds to a lateral displacement of the curve in the plot. The maximum attainable
Voc is affected mainly by two contributions: (Ecb-Eredox) and kr55
; because kr has been
fixed, the difference in the Voc between simulations corresponds to the actual ∆(Ecb-
Eredox) between curves.
Figure 5.11 a) Simulated data of charge density vs. applied potential for several
values of kr and (Ecb - Eredox) = 0.95 eV, b) Simulated data of charge density vs.
applied potential for several values of (Ecb - Eredox) and kr =14 s-1
. All other
parameters are given in Table 5.1, device B.
When charge extraction experiments are used to compare recombination between
cells the Ecb shift can mask the effect of changes in kr40,56,57
. Thus, it is crucial knowing
how to decouple both processes for assessing the recombination rates taking into
account changes in Ecb. In Figure 5.12a) changes in kr and shifts in Ecb are considered
between simulations. This is an example of what could be expected in experimental
results. Direct analysis of the plot does not allow taking conclusions about which curve
belongs to solar cells with higher or lower recombination rates.
0
5
10
15
20
25
30
35
40
45
50
0.50 0.60 0.70 0.80
Ch
arge
Den
sity
× 1
0-1
6 c
m-3
Potential / V
kr / s-1
7
14
22
43
167
0
5
10
15
20
25
30
35
40
45
50
0.50 0.70 0.90
Ch
arge
Den
sity
× 1
0-1
6 c
m-3
Potential / V
(Ecb - Eredox) / eV
0.90
0.95
1.0
1.1
a) b)

Chapter 5 169
Dye-sensitized Solar Cells: Improving Lifetime Stability and Performance
Figure 5.12 a) Simulated data of charge density vs. applied potential for several
values of (Ecb-Eredox) and kr, b) Recombination current vs. potential with variable
values of (Ecb-Eredox) and kr, without correction of Ecb, c) Simulated data of
normalized charge density vs. applied potential for several combinations of (Ecb-
Eredox) and kr, d) Recombination current vs. (Vapp-Vcbc) with variable values of values
of (Ecb-Eredox) and kr. All other parameters are accordingly with Table 5.1, device B.
In this case, the lateral displacement of the curves caused by the relative change in Ecb
masks the vertical displacement caused by different recombination rate constants.
The comparison of recombination rate constants between DSCs can be done,
accordingly to some reports, by examining plots of the recombination current, Jrec, vs.
potential, calculated by eq. (5.35), and shown in Figure 5.12b) 40
:
𝐽rec =𝑛𝑒−(𝑉)
𝜏𝑒− (5.35)
Because recombination current depends only on the concentration of electrons in
the conduction band and on the recombination rate constant, this allows separating the
0
10
20
30
40
50
60
70
80
90
0.60 0.70 0.80
Ch
arge
den
sity
× 1
0-1
6 c
m-3
Potential / V
kr / s-1, (Ecb-Eredox) /eV
10, 0.90
7 , 0.95
5, 0.99
11, 0.98
14 , 1.0
50 , 1.0
0.0
0.1
0.2
0.3
0.4
0.5
0.6
0.60 0.70 0.80
Rec
om
bin
atio
n c
urr
ent
/ m
A·c
m-2
Potential / V
kr / s-1, (Ecb-Eredox) /eV
10, 0.9050 , 0.997, 0.9511, 0.9814, 1.05, 0.99
0
5
10
15
20
25
30
0.30 0.50 0.70 0.90
Norm
aliz
ed c
har
ge
den
sity
×1
0-1
6 c
m-3
Potential / V
kr / s-1, (Ecb-Eredox) /eV
10, 0.90
7 , 0.95
5, 0.99
11, 0.98
14, 0.99
50, 1.0
0.0
0.1
0.2
0.3
0.4
0.5
0.6
0.7
0.190.240.290.34
Rec
om
bin
atio
n c
urr
ent
/ m
A·c
m-2
(Vapp -Vcbc) / V
kr / s-1, (Ecb-Eredox) /eV
50, 1.0
14, 1.0
11, 0.98
10, 0.90
7 , 0.95
5, 0.99
d)
a) b)
c)

170 Modeling, Simulation and Design of Dye Sensitized Solar Cells
Dye-sensitized Solar Cells: Improving Lifetime Stability and Performance
overlap effect of Ecb shift. However, plotting Jrec versus potential, Figure 5.12b), does
not order by recombination current the curves of the plot. Even in this case the effect of
lateral displacement by Ecb shift is verified. Aiming to completely remove this
influence and correctly analyze the data, the conduction band shift should be accounted
for. To do that, the recombination currents should be compared for the same value of
(Ef - Eredox), which means that the comparison should be done for the same amount of
free electrons able to recombine with electrolyte. This can be done as follows40
:
a) First the shift in the conduction band edge has to be determined. The total
charge density, 𝑛e−t , can be obtained at short circuit conditions for each
simulation; then it is subtracted to the 𝑛e−t at short circuit of a pre-defined
standard simulated curve (kr = 7 s-1
and (Vapp-Vcbc) = 0.95 V, purple line in
plots from Figure 5.12. This represents the offset at short-circuit in the
total charge density between the two curves. In each simulated curve the
offset is added to 𝑛e−t for all potentials – Figure 5.12c). Then the shift in
Vcb (∆Vcb) can be estimated directly from the plot by the lateral
displacement of each curve – Figure 5.12c).
b) After ∆Vcb has been determined it can be added to the Vcb of each curve of
Figure 5.12b), resulting in curves with a corrected conduction band
potential Vcbc= Vcb+∆Vcb;
c) Then the Vcbc is used to plot Jrec versus (Vapp-Vcbc) – Figure 5.12d). In this
case, the Vcb was set at -1 V vs. electrolyte, which is a common accepted
value for iodide/iodine based electrolytes. Afterwards, the curves are
placed according to their recombination rate constants, independently of
their (Ecb-Eredox) values, contrary to what is normally found in literature.

Chapter 5 171
Dye-sensitized Solar Cells: Improving Lifetime Stability and Performance
5.4.4 Optimization of electrode thickness
Throughout this work the influence of electron recombination and charge transport
in the performance of DSCs was studied. Some critical aspects that must be taken into
account in interpreting charge extraction results have been discussed. Now, the
relevance of electron recombination and transport within the photoelectrode is
evaluated in the design of solar cells. Figure 5.13 shows the I-V curves for DSCs with
several photoelectrode layer thicknesses.
Figure 5.13 Influence of the photoelectrode thickness in the DSC I-V characteristics
for kr = 50 s-1
. All other parameters are given in Table 5.1, device B.
Figure 5.13 points out an obvious conclusion: for a given DSC system, there is
an optimum thickness of semiconductor. This fact is many times observed in real
devices, and is usually optimized experimentally58,59
. The photo-electrode optimum
thickness is related to the length that a generated electron can diffuse before
recombining with electrolyte species; this is called diffusion length, Ln26,60,61
. Given a
certain effective electron diffusion coefficient, Deff, a semiconductor thickness, Lf, and
a recombination reaction rate constant, kr, two parameters can be defined: the electron
lifetime, 𝜏e−, and the transport time, 𝜏tr. The lifetime depends on kr, and the transport
time on Deff and Lf. The charge collection efficiency, ηcc, can now be written; it
0
2
4
6
8
10
12
14
16
18
0.00 0.10 0.20 0.30 0.40 0.50 0.60 0.70 0.80
J sc
/ m
A·c
m-2
Potential /V
Photoelectrode thickness / μm
50 40 30
20 7.5 5

172 Modeling, Simulation and Design of Dye Sensitized Solar Cells
Dye-sensitized Solar Cells: Improving Lifetime Stability and Performance
depends of electron transport in the mesoporous semiconductor and recombination
losses. If charge collection is much faster than charge recombination, then ηcc value
will be higher. The electron collection efficiency, ηcc, can be given by62
:
𝜂cc =[−𝐿n𝛼(𝜆) cosh (
𝐿f𝐿n) + sinh (
𝐿f𝐿n) + 𝐿n𝛼(𝜆)𝑒
−𝛼(𝜆)𝐿f] 𝐿n𝛼
(1 − 𝐿n2𝛼(𝜆)2)(1 − 𝑒−𝛼(𝜆)𝐿f) cosh (
𝐿f𝐿n)
(5.36)
The relation between the ratio of lifetime and transport, and the active layer
thickness and diffusion length has been established by Bisquert et al.25
and included in
eq. (5.36). When Ln >> Lf, most electrons diffuse through the entire length of
photoelectrode before recombining with the electrolyte. On the other hand, in the case
of high reactivity, Ln << Lf, most electrons recombine at the TiO2/electrolyte interface.
When recombination does not occur predominantly via the conduction band, the
electron diffusion length can no longer be defined as previously, giving rise to a non-
linear reaction order29,30
. Assuming for a defined device that the two ruling processes
of transport and recombination are held constant, increasing the semiconductor
thickness will reduce the collection efficiency as shown in Figure 5.14; increasing the
recombination, ηcc still decreases with Lf. This implies that the optimum thickness of
active layer is highly dependent on the relation between transport and recombination in
the solar cell.
Figure 5.14 Collection efficiency determined as a function of the active layer
thickness, for several recombination rate constants. All other parameters are given in
Table 5.1, device B.
0.4
0.5
0.6
0.7
0.8
0.9
1.0
0.0 0.2 0.4 0.6 0.8 1.0
ηcc
Dimensionless active layer thickness
kr / s-1
10
22
50
200

Chapter 5 173
Dye-sensitized Solar Cells: Improving Lifetime Stability and Performance
In the same way, the electron effective diffusion coefficient plays an important role
in the collection efficiency. Using a constant value of kr, the influence of Deff in the
performance of the DSC can be determined, as illustrated in Figure 5.15. By increasing
Deff the transport time becomes lower and ηcc and η increase. However, for the assumed
device parameters (cf. Table 5.1, device B) it is necessary to increase Deff two orders of
magnitude to see a clear impact on the collection efficiency since the recombination is
relatively small. Nonetheless, it is safe to state that the performance of the solar cell
would greatly benefit from higher electron conductivities in the semiconductor.
Figure 5.15 Collection efficiency, relative efficiency and transport time as a
function of the diffusion coefficient. All other parameters are given in Table 1,
device B.
Figure 5.16 shows the curves of efficiency as a function of active layer thickness
assuming several kr and Deff values. The two plots highlight quantitatively the influence
that recombination and transport have in the performance of DSCs. For example,
assuming kr = 10 s-1
(low recombination rate comparing to kr = 200 s-1
), the optimum
photoelectrode thickness is three times the normal thickness (from ca.10 µm to 30 µm)
0.01
0.1
1
10
0.60
0.65
0.70
0.75
0.80
0.85
0.90
0.95
1.00
1.05
0.00001 0.0001 0.001 0.01
Tra
nsp
ort
tim
e /
ms
η a
nd η
cc
Electron Diffusion coefficient, Deff / cm2·s-1
collection efficiency relative efficiency Transport time

174 Modeling, Simulation and Design of Dye Sensitized Solar Cells
Dye-sensitized Solar Cells: Improving Lifetime Stability and Performance
and the DSC efficiency increases almost 5 percentage points (from ca. 5 % to 10 %).
The highlighted points in the curves in Figure 5.16 (black diamonds) are the respective
optimum thicknesses values. As expected, as the recombination rate decreases and/or
the electron diffusivity increases, the optimum photoelectrode thickness increases.
Figure 5.17 shows that the influence of kr and Deff at the optimum photoelectrode
thickness is logarithmic.
Figure 5.16 a) Efficiency vs. photoelectrode thickness, for several kr and Deff = 1.10 × 10⁻⁴
cm-2·s-1; b) Efficiency vs. photoelectrode thickness, for several values of Deff and kr = 20 s-1.
The black diamonds are the maximum efficiency values for each curve. All other parameters
are given in Table 5.1, device B.
2
4
6
8
10
0 10 20 30 40 50
η /
%
Photoelectrode Thickness / um
kr / s-1
10 22 50 200
2
4
6
8
10
0 10 20 30 40 50
η /
%
Photoelectrode Thickness / µm
Deff × 104 / cm2 . s-1
10 3 1 0.5
a)
b)

Chapter 5 175
Dye-sensitized Solar Cells: Improving Lifetime Stability and Performance
Figure 5.17 Influence of kr and Deff in the optimum photoelectrode thickness. The
parameters used for the simulations are given in Table 5.1
In fact, a recent report by Crossland et al.63
showed that a new mesoporous TiO2
single crystal has electronic mobility values over one order of magnitude higher than
the typical TiO2 mesoporous film. This development resulted in an efficiency boost of
almost 130 % in a solid state device. The reported electronic mobility should allow
increasing the optimal thickness of the photoelectrodes in current DSC cells. Using the
optimization curves of Figure 5.17 and 10-2
cm2∙s
-1 as the new electron diffusion
coefficient (typical coefficients values in anatase TiO2 range between 10-4
and 10-5
cm2∙s
-1 10,63), the optimum thickness for the new material should be around 40 μm and
the energy efficiency could increase to 12 %. If one considers the use of the new
porphyrin dye with cobalt (II/III)–based redox electrolyte for attaining open circuit
voltages near 1 V 2, a 15 % efficient DSC could be expected in a near future.
0.1
1
10
100
1
10
100
1000
10 15 20 25 30 35
Def
f ×
10
-4 /
cm
2 .
s -1
kr /
s-1
Optimum photoelectrode thickness / µm

176 Modeling, Simulation and Design of Dye Sensitized Solar Cells
Dye-sensitized Solar Cells: Improving Lifetime Stability and Performance
5.5 Conclusions
Phenomenological modeling is a powerful tool to study the fundamentals of DSC
operation. The transient model used considers the continuity equations for the three
modeled species (electrons, iodide and triiodide) and their respective initial and
boundary conditions. It is assumed that the cell is irradiated perpendicularly to the
photoelectrode and that each absorbed photon generates one injected electron into the
TiO2 conduction band. Only one possible mechanism for electron loss is assumed,
corresponding to the recombination reaction of electrons with electrolyte species. The
presented phenomenological model is able to properly simulate steady state I-V curves
of dye-sensitized solar cells. The model has been used as a simulation tool to assess the
two processes that rule the performance of DSCs: electron transport and
recombination. The quantitative effect of the recombination reaction rate constant, kr,
and the electron diffusion coefficient, Deff, in the collection efficiency was shown and
discussed. The influence of kr in the Voc and Jsc of DSCs has been determined and has
been shown to be highly dependent on the recombination reaction kinetics.
The model was used to evaluate the influence that conduction band shifts have in
charge extraction experiments. The described methodology is able to decouple the
conduction band shifts from the recombination effect. This is particularly useful for
material synthesis where charge experiments are used to assess changes in the
recombination rate constants between different samples.
It simulated the influence that electron transport and recombination have in the
optimization of the photoelectrode thickness. It was found that the optimum
photoelectrode thickness varies logarithmically with the recombination rate and with
the electron diffusion coefficient. The optimization procedure developed is particularly
interesting when developing high efficiency DSCs.

Chapter 5 177
Dye-sensitized Solar Cells: Improving Lifetime Stability and Performance
Acknowledgements
J. Maçaira is grateful to the Portuguese Foundation for Science and Technology
(FCT) for his PhD Grant (Reference: SFRH/BD/80449/2011). L. Andrade
acknowledges European Research Council for funding within project BI-DSC –
Building Integrated Dye sensitized Solar Cells (Contract Number: 321315). Financial
support by FCT through the project SolarConcept (Reference PTDC/EQU-
EQU/120064/2010) and WinDSC SI&IDT (Reference 21539/2011) is also
acknowledged.
References
1. J. H. Heo, S. H. Im, J. H. Noh, T. N. Mandal, C.-S. Lim, J. A. Chang, Y. H. Lee,
H.-j. Kim, A. Sarkar, K. NazeeruddinMd, M. Gratzel and S. I. Seok, Nat Photon,
2013, 7, 486-491.
2. A. Yella, H.-W. Lee, H. N. Tsao, C. Yi, A. K. Chandiran, M. K. Nazeeruddin, E.
W.-G. Diau, C.-Y. Yeh, S. M. Zakeeruddin and M. Grätzel, Science, 2011, 334,
629-634.
3. J. Burschka, N. Pellet, S.-J. Moon, R. Humphry-Baker, P. Gao, M. K.
Nazeeruddin and M. Gratzel, Nature, 2013.
4. B. O'Regan and M. Grätzel, Nature, 1991, 353, 737-740.
5. M. Grätzel, Inorg. Chem., 2005, 44, 6841-6851.
6. M. Grätzel and J. R. Durrant, in Nanostructured and photoelectrochemical systems
for solar photon conversion, Imperial College Press, London, 2008, ch. 8.
7. M. D. Archer and A. J. Nozik, Nanostructured and photoelectrochemical
systems for solar photon conversion, Imperial College Press ; World Scientific
Pub. Co., London; Singapore; Hackensack, NJ, 2008.
8. L. R. Andrade, H. A.; Mendes, A, Dye‐Sensitized Solar Cells: an Overview, in
Energy Production and Storage: Inorganic Chemical Strategies for a Warming
World, John Wiley & Sons, Ltd, Chichester, UK, 2010.
9. M. Wang, P. Chen, R. Humphry-Baker, S. M. Zakeeruddin and M. Gratzel,

178 Modeling, Simulation and Design of Dye Sensitized Solar Cells
Dye-sensitized Solar Cells: Improving Lifetime Stability and Performance
ChemPhysChem, 2009, 10, 290-299.
10. G. He, L. Zhao, Z. Zheng and F. Lu, Journal of Physical Chemistry C, 2008,
112, 18730-18733.
11. J. Shi, B. Peng, J. Pei, S. Peng and J. Chen, Journal of Power Sources, 2009,
193, 878-884.
12. G. Boschloo, L. Haggman and A. Hagfeldt, J. Phys. Chem. B, 2006, 110, 13144-
13150.
13. S. Y. Huang, G. Schlichthorl, A. J. Nozik, M. Gratzel and A. J. Frank, The
Journal of Physical Chemistry B, 1997, 101, 2576-2582.
14. S. Nakade, Y. Makimoto, W. Kubo, T. Kitamura, Y. Wada and S. Yanagida, J.
Phys. Chem. B, 2005, 109, 3488-3493.
15. S. Nakade, T. Kanzaki, W. Kubo, T. Kitamura, Y. Wada and S. Yanagida, J.
Phys. Chem. B, 2005, 109, 3480-3487.
16. F. Matar, T. H. Ghaddar, K. Walley, T. DosSantos, J. R. Durrant and B.
O'Regan, Journal of Materials Chemistry, 2008, 18, 4246-4253.
17. P. M. Sommeling, B. C. O'Regan, R. R. Haswell, H. J. P. Smit, N. J. Bakker, J.
J. T. Smits, J. M. Kroon and J. A. M. vanRoosmalen, J. Phys. Chem. B, 2006,
110, 19191-19197.
18. N. Tetreault and M. Gratzel, Energy & Environmental Science, 2012.
19. N. Tétreault, É. Arsenault, L.-P. Heiniger, N. Soheilnia, J. Brillet, T. Moehl, S.
Zakeeruddin, G. A. Ozin and M. Grätzel, Nano Letters, 2011, 11, 4579-4584.
20. B. Mandlmeier, J. M. Szeifert, D. Fattakhova-Rohlfing, H. Amenitsch and T.
Bein, Journal of the American Chemical Society, 2011, 133, 17274-17282.
21. S. Guldin, S. Huttner, M. Kolle, M. E. Welland, P. Muller-Buschbaum, R. H.
Friend, U. Steiner and N. Tetreault, Nano Letters, 2010, 10, 2303-2309.
22. J. N. Clifford, M. Planells and E. Palomares, Journal of Materials Chemistry,
2012, 22, 24195-24201.
23. J. Maçaira, L. Andrade and A. Mendes, Renewable and Sustainable Energy
Reviews, 2013, 27, 334-349.
24. L. Andrade, J. Sousa, H. A. Ribeiro and A. Mendes, Solar Energy, 2011, 85,
781-793.

Chapter 5 179
Dye-sensitized Solar Cells: Improving Lifetime Stability and Performance
25. J. Bisquert, The Journal of Physical Chemistry B, 2002, 106, 325-333.
26. J. Bisquert and I. n. Mora-Sero, The Journal of Physical Chemistry Letters,
2009, 1, 450-456.
27. Y. Liu, A. Hagfeldt, X.-R. Xiao and S.-E. Lindquist, Solar Energy Materials and
Solar Cells, 1998, 55, 267-281.
28. P. R. F. Barnes, L. Liu, X. Li, A. Y. Anderson, H. Kisserwan, T. H. Ghaddar, J.
R. Durrant and B. C. O’Regan, Nano Letters, 2009, 9, 3532-3538.
29. J. Villanueva-Cab, H. Wang, G. Oskam and L. M. Peter, The Journal of Physical
Chemistry Letters, 2010, 1, 748-751.
30. J. P. Gonzalez-Vazquez, G. Oskam and J. A. Anta, The Journal of Physical
Chemistry C, 2012, 116, 22687-22697.
31. J. A. Anta, J. Idigoras, E. Guillen, J. Villanueva-Cab, H. J. Mandujano-Ramirez,
G. Oskam, L. Pelleja and E. Palomares, Physical Chemistry Chemical Physics,
2012, 14, 10285-10299.
32. J. Ferber, R. Stangl and J. Luther, Solar Energy Materials and Solar Cells, 1998,
53, 29-54.
33. K. Nithyanandam and R. Pitchumani, Solar Energy, 2012, 86, 351-368.
34. M. Penny, T. Farrell and G. Will, Solar Energy Materials and Solar Cells, 2008,
92, 24-37.
35. A. Ofir, L. Grinis and A. Zaban, The Journal of Physical Chemistry C, 2008,
112, 2779-2783.
36. A. Hagfeldt, G. Boschloo, L. Sun, L. Kloo and H. Pettersson, Chemical Reviews,
2010, 110, 6595-6663.
37. L. Petzold, Siam J. Sci. Stat. Computing, 1983, 4, 136-148.
38. F. Ribeiro, Maçaira,J. , Cruz, R., Gabriel, J., Andrade, L., Mendes, A., Solar
Energy Materials and Solar Cells, 2012, 96, 43-49.
39. H. J. Snaith, Advanced Functional Materials, 2010, 20, 13-19.
40. B. O'Regan, L. Xiaoe and T. Ghaddar, Energy & Environmental Science, 2012,
5, 7203-7215.
41. S. Zhang, X. Yang, Y. Numata and L. Han, Energy & Environmental Science,
2013, 6, 1443-1464.

180 Modeling, Simulation and Design of Dye Sensitized Solar Cells
Dye-sensitized Solar Cells: Improving Lifetime Stability and Performance
42. B. C. O'Regan and J. R. Durrant, The Journal of Physical Chemistry B, 2006,
110, 8544-8547.
43. P. Docampo, S. Guldin, U. Steiner and H. J. Snaith, The Journal of Physical
Chemistry Letters, 2013, 4, 698-703.
44. P. R. F. Barnes, K. Miettunen, X. Li, A. Y. Anderson, T. Bessho, M. Gratzel and
B. C. O'Regan, Advanced Materials, 2013, 25, 1881-1922.
45. L. M. Peter, The Journal of Physical Chemistry C, 2007, 111, 6601-6612.
46. S. A. Haque, E. Palomares, B. M. Cho, A. N. M. Green, N. Hirata, D. R. Klug
and J. R. Durrant, J. Am. Chem. Soc., 2005, 127, 3456-3462.
47. F. Fabregat-Santiago, J. Bisquert, G. Garcia-Belmonte, G. Boschloo and A.
Hagfeldt, Solar Energy Materials and Solar Cells, 2005, 87, 117-131.
48. H. Wang and L. M. Peter, The Journal of Physical Chemistry C, 2012, 116,
10468-10475.
49. B. C. O'Regan, K. Bakker, J. Kroeze, H. Smit, P. Sommeling and J. R. Durrant,
The Journal of Physical Chemistry B, 2006, 110, 17155-17160.
50. B. C. O'Regan, J. R. Durrant, P. M. Sommeling and N. J. Bakker, The Journal of
Physical Chemistry C, 2007, 111, 14001-14010.
51. X. Wu, L. Wang, F. Luo, B. Ma, C. Zhan and Y. Qiu, The Journal of Physical
Chemistry C, 2007, 111, 8075-8079.
52. E. Ronca, M. Pastore, L. Belpassi, F. Tarantelli and F. De Angelis, Energy &
Environmental Science, 2013, 6, 183-193.
53. A. B. F. Martinson, M. r. S. Goes, F. Fabregat-Santiago, J. Bisquert, M. J. Pellin
and J. T. Hupp, The Journal of Physical Chemistry A, 2009, 113, 4015-4021.
54. S. R. Raga and F. Fabregat-Santiago, Physical Chemistry Chemical Physics,
2013, 15, 2328-2336.
55. S. R. Raga, E. M. Barea and F. Fabregat-Santiago, The Journal of Physical
Chemistry Letters, 2012, 3, 1629-1634.
56. H.-P. Wu, Z.-W. Ou, T.-Y. Pan, C.-M. Lan, W.-K. Huang, H.-W. Lee, N. M.
Reddy, C.-T. Chen, W.-S. Chao, C.-Y. Yeh and E. W.-G. Diau, Energy &
Environmental Science, 2012, 5, 9843-9848.
57. H.-P. Wu, C.-M. Lan, J.-Y. Hu, W.-K. Huang, J.-W. Shiu, Z.-J. Lan, C.-M. Tsai,

Chapter 5 181
Dye-sensitized Solar Cells: Improving Lifetime Stability and Performance
C.-H. Su and E. W.-G. Diau, The Journal of Physical Chemistry Letters, 2013, 4,
1570-1577.
58. J.-Y. Liao, H.-P. Lin, H.-Y. Chen, D.-B. Kuang and C.-Y. Su, Journal of
Materials Chemistry, 2012, 22, 1627-1633.
59. S. Ito, S. Zakeeruddin, R. Humphry-Baker, P. Liska, R. Charvet, P. Comte, M.
Nazeeruddin, P. Péchy, M. Takata, H. Miura, S. Uchida and M. Grätzel,
Advanced Materials, 2006, 18, 1202-1205.
60. H. Wang and L. M. Peter, The Journal of Physical Chemistry C, 2009, 113,
18125-18133.
61. P. R. F. Barnes and B. C. O’Regan, The Journal of Physical Chemistry C, 2010,
114, 19134-19140.
62. L. Bertoluzzi and S. Ma, Physical Chemistry Chemical Physics, 2013, 15, 4283-
4285.
63. E. J. W. Crossland, N. Noel, V. Sivaram, T. Leijtens, J. A. Alexander-Webber
and H. J. Snaith, Nature, 2013, 495, 215-219.


CHAPTER 6 High efficient DSC photoelectrode using
a SiO2 scaffold layer coated with a 3 nm
TiO2 film
“As soon we are shown something old in an innovation, we are at peace.”
Friedrich Nietzsche

Adapted from the peer-reviewed article
J. Maçaira, L. Andrade, A. Mendes, High efficient DSC photoelectrode using a SiO2
scaffold layer coated with a 3 nm TiO2 film, submitted to Reaction Chemistry &
Engineering, RSC 2015

6
High efficient DSC photoelectrode using a SiO2
scaffold layer coated with a 3 nm TiO2 film
Abstract
A new photoelectrode (PE) architecture for incorporating in DSC devices was
developed aiming to increase the electron mobility, the specific surface area and the
transparency. The developed PE is made of a mesoporous SiO2 scaffold layer covered
by a conformal TiO2 film deposited by atomic layer deposition (ALD). The shrinking
core model was used to predict the minimum pulse time (25 s and DTIP = (4.23 ± 0.65)
× 10-3
) required for the complete coverage of the inner SiO2 scaffold surface area (ca.
160 m2·g
-1). The TiO2 film thickness proved to be related to two DSC operation
regimes: transport limited regime (Deff ∝ TiO2 thickness, where Deff is the electron
effective diffusivity) and a recombination limited regime (Deff constant); in the latter
regime, the minimum recombination rate constant, kr, resulted in maximum DSC
performance. DSCs based on the new PE coated with an optimized TiO2 film thickness
(3.3 nm, 150 ALD cycles) exhibited an average of 8 % higher energy conversion
efficiency than the standard devices, η = 8.43 % vs. η = 7.82 % and 10 % more
transmittance in the visible range. The superior performance exhibited by the new PE
was ascribed to: higher surface area and lower electron recombination. The increased
recombination resistance was attributed to lower morphological defects and better dye
coverage of the TiO2 layer. This work shows that an ALD deposited TiO2 film with 3
to 4 nm thickness is suitable for the dye adsorption and electron transport; when
applied over a large surface area scaffold, the TiO2 nanolayer displayed the same
transport abilities as conventional TiO2 mesoporous films. The proposed PE opens the

186 High efficient DSC photoelectrode using a SiO2 scaffold layer coated with a 3 nm TiO2 film
Dye-sensitized Solar Cells: Improving Lifetime Stability and Performance
doors to new architectures and the use of new semiconductors with better properties
concerning electronic mobility, conduction band energy level, stability, transparency
and recombination.
6.1 Introduction
Films assembled by nanoparticles have a much larger surface area then the
corresponding bulk materials; this allowed dye sensitized solar cells (DSC) to emerge
in 1991 amongst promising photovoltaic technologies1,2
. Larger surface areas allow
superior dye loading and therefore high current densities. However, nanoparticle films
present much higher number of grain boundaries and morphological defects than their
bulk counterparts3; this causes unavoidable interfacial electron recombination and
reduces electron transport mobility in the film4,5
. Photovoltaic (PV) performance
results from balance between photocurrent density and electron transport and
recombination in the photoelectrode, and then there is an optimum thickness of the
mesoporous TiO2 film6. The best performing DSC devices still use too thin
photoelectrodes to harvest the incident solar radiation, making the research of new
photoelectrodes arrangements a hot research topic6-8
.
One-dimensional structures such as nanowires9,10
, nanotubes11-13
and nanorods14,15
have been failed strategies in the pursuit of DSCs efficiency improvement. Although
they provide higher electron transport properties, their low specific surface area limits
the photocurrent generation. Photoelectrodes with hierarchical structures 16-18
are
interesting assemblies that provide large dye adsorption surface areas and effective
light scattering; nevertheless, they share the nanoparticle films transport and
recombination limitations. Other interesting approaches use removable templates of
e.g. polystyrene and polyacrylate before depositing metal-oxides by atomic layer
deposition (ALD)19-21
. This strategy originates hollow nanostructures where the inner
surface area is defined by the size of the template particles. Although this approach
offers a continuous 3D network for electron collection the reported works show no
improved photocurrents due to the large size of the template particles employed16,19
.

Chapter 6 187
Dye-sensitized Solar Cells: Improving Lifetime Stability and Performance
In terms of DSC photoelectrodes, mesoporous TiO2 films made of nanoparticles
are still dominating the PV performance, because TiO2 nanoparticles have the best
balance between dye loading, electron transport and optical transparency 6,8
. This work
uses an approach that separates the morphological features of the PE film from the
electrochemical properties of the semiconductor. This is possible using different
materials as surface area provider and layers of semiconductors, respectively. The
idealized photoelectrode is illustrated in Figure 6.1. It comprises a porous SiO2 scaffold
layer, coated with a suitable metal-oxide semiconductor, TiO2. The role of the scaffold
is to provide a large surface area for the dye adsorption and consequently an efficient
solar radiation harvest. The SiO2 material is responsible for the final morphology of the
photoelectrode and should be as transparent as possible to ensure that light reaches the
adsorbed dye molecules. Although the pores of this layer should be as small as possible
to ensure large surface areas, they must be large enough to allow the deposition of an
optimized semiconductor coating thickness; the amount of TiO2 deposited in the
template pores determines the ability of the PE to adsorb dye and efficiently transport
electrons to the FTO surface. To achieve a homogeneous dense coating of the scaffold
particles, the TiO2 film was deposited by ALD. The deposited film should be compact
and uniform with minimum number of grain boundaries and morphological defects
compared to conventional TiO2 mesoporous photoelectrode. Therefore, it is reasonable
to expect better transport characteristics and less electron/electrolyte recombination in
the proposed architecture. Using a template that maximizes the surface area of the PE
while maintaining pore size slightly larger than ALD deposited layer, the engineered
PE architecture separates morphological features of the PE from electrochemical
properties of the semiconductor. This opens opportunities for using new
semiconductors without the usual concern of nanoparticle morphological control.
In this study the ALD process was optimized for deposition of TiO2 within a
mesoporous scaffold with pores of ca. 20 nm; the TiO2 precursors were titanium
isopropoxide (TIP) and water. The shrinking core model 22,23
was used to predict the
minimum exposure time for TIP to diffuse and completely cover the scaffold inner
surface area; the calculations were performed for TIP since this is the slower reactant.

188 High efficient DSC photoelectrode using a SiO2 scaffold layer coated with a 3 nm TiO2 film
Dye-sensitized Solar Cells: Improving Lifetime Stability and Performance
The thickness of the deposited TiO2 film was optimized, and its influence on the DSC
transport and recombination assessed.
Figure 6.1 Schematic representation of the new photoelectrode architecture.
6.2 Materials and Methods
6.2.1 SiO2 scaffold film
The properties of the SiO2 nanoparticles (Sigma-Aldrich® ref. 637246) are given in
Table 6.1. Brunauer-Emmett-Teller (BET) surface area analysis and Barrett-Joyner-
Halenda (BJH) pore size analysis were conducted in the powder as received from the
supplier (cf. appendix D, Figure D.1). A screen-printable paste formulation was
developed to achieve optimum film characteristics, i.e., suitable viscosity for screen
printing, good particle packing, good adhesion to FTO substrate and no visible
cracking of the film. The optimized paste formulation contains terpineol (Sigma-
Aldrich® ref. W304506) as solvent and ethyl cellulose (Sigma-Aldrich
® ref. 46070) as
binder and is given in Table 6.1.

Chapter 6 189
Dye-sensitized Solar Cells: Improving Lifetime Stability and Performance
Table 6.1 SiO2 particles morphological characteristics and paste formulation composition
SiO2 particles
(powder form) Paste composition / wt. %
SiO2 layer morphology
(after sintering)
dSiO2 / nm As / m
2·g-1 SiO2
Ethyl
cellulose Terpineol dp / nm ε
15.0±0.5 159±0.55 20.0 10.0 70.0 21.0±0.6 0.63±0.09
The SiO2 paste was applied by screen-printing (Rokuprint® screen printer) 5 × 5
mm2 areas using a 43‒80 mesh screen (43 threads/cm and 80 μm thread diameter) on
previously cleaned FTO glasses. The printed samples were then fired in an infrared
furnace (Nabertherm Gmbh model GF75) at 450 ºC during 30 min to remove the
solvent and binder used, and to promote adhesion between particles and the FTO glass
surface. Figure 6.2 shows a scanning electron microscopy (SEM) cross-section image
of the SiO2 film applied on a FTO glass. The porosity (ε) and average pore size (dp) of
SiO2 layer were calculated based on the density of the SiO2 particles and of the SiO2
layer, as detailed in appendix D. The average pore size calculated for the sintered SiO2
layer based on layer and particle densities (ca. 21.0 nm) is lower than the pore size
obtained by BJH analysis (ca. 30 nm) to the a sample of SiO2 particles. The difference
was assigned to particle packing and necking between particles during the firing step.
Actually, the sintered layer of SiO2 was expected to display a smaller porosity than the
corresponding powder sample.
Figure 6.2 Cross section SEM image of the developed SiO2 film applied by screen
printing on FTO coated glass substrate (left) and respective magnification (right).

190 High efficient DSC photoelectrode using a SiO2 scaffold layer coated with a 3 nm TiO2 film
Dye-sensitized Solar Cells: Improving Lifetime Stability and Performance
6.2.2 TiO2 reaction mechanism in ALD
Atomic layer deposition of TiO2 was accomplished using a titanium metal
precursor, titanium isopropoxide (C12H28O4Ti, titanium(IV) isopropoxide ≥ 97%,
Sigma Aldrich®), and distilled water (H2O) as oxidizing agent. The reaction
mechanism is illustrated in Figure 6.3. First, the titanium precursor (TIP) was pulsed
into the reaction chamber reacting with the OH groups present at the substrate surface
until a monolayer has been chemisorbed and no more adsorption took place. Then, the
reaction chamber is purged and the second precursor (water) is pulsed reacting with the
chemisorbed TIP to form TiO2 and propanol as byproduct. The reaction chamber is
purged again and a monolayer of TiO2 is obtained at the substrate. The half reactions of
TIP and H2O to produce TiO2 are given by:
OH + Ti[OCH(CH3)2]4 → OTi[OCH(CH3)2]4 + C3H8O (6.1)
OTi[OCH(CH3)2]3 + 2 H2O → TiO2 − OH + 3C3H8O (6.2)
where the symbol designates a surface bond.
This reaction cycle was repeated until the desired thickness has been reached.
Therefore, the ALD growth rate is proportional to the number of cycles rather than the
flux of the reactants.
The ALD deposition was conducted in a Beneq Oy thin film system equipped with
a TFS 200 reactor. The process operation is described in detail in appendix C. The
deposition of TiO2 was assessed initially directly on FTO substrates. Table C1 (in
appendix C) shows the operating variables used. The precursor pulse/purge times
chosen took into account recommended values24
and were chosen conservatively to
prevent the mixture of the precursors either in the flow system tubing or in the reactor.
For FTO glasses TIP pulse time (ΔtTIP,2) was set to 1 s while for the SiO2 mesoporous
layer this pulse time (ΔtTIP,2) was optimized. Nevertheless, for all tested ΔtTIP,2 values,
the TIP to water pulse times ratio, the TIP purge to pulse times ratio and the water
purge to pulse times ratio were kept constant according to equations C.2, C.3 and C.4
respectively, also presented in appendix C.

Chapter 6 191
Dye-sensitized Solar Cells: Improving Lifetime Stability and Performance
Propanol - C3H7OH
Water - H2O
OH surface
groups
Pulsing TIP
TIP surface adsorption;
by-product : propanol
(Purged)
Pulsing H2O:
Reaction between surface
adsorbed TIP and H2O
molecules
Repeat “N” cycles to obtain
“N” atomic layers of TiO2
Surface reaction
product: TiO2
By-product : propanol
(Purged)
Figure 6.3 Schematic diagram of the ALD process for TiO2 coating using TIP and
H2O.

192 High efficient DSC photoelectrode using a SiO2 scaffold layer coated with a 3 nm TiO2 film
Dye-sensitized Solar Cells: Improving Lifetime Stability and Performance
6.2.3 Dye sensitized solar cells fabrication
Photoelectrodes were assembled on 7 Ω·-1
SnO2-F (FTO) coated glass substrates
(2.2 mm thick) from Solaronix®. The glass substrates were washed using a cleaning
solution (Alconox®, VWR) in an ultrasonic cleaner (Amsonic TTC) at 55 ºC for 15
min, followed by ultrasonic cleaning in deionized water at room temperature and dried
with air at 50 ºC. Glass substrates were coated with the previously described SiO2 paste
by screen-printing followed by firing at 450 ºC for 30 minutes. After firing the
substrates were loaded into the ALD reactor and coated with TiO2 with different
thicknesses. The TiO2/SiO2 electrodes were then calcined at 450 ºC during 30 min to
promote the crystallization of the TiO2 film. Dye adsorption was carried out dipping
the electrodes in the dye solution (0.5 mM N719, ruthenizer 535-bisTBA from
Solaronix®) during 24 hours. Afterwards, the electrodes were rinsed with ethanol and
dried under nitrogen flow.
The counter-electrodes, prepared on the same type of glass substrates and cleaned
as described before, were drilled previously with two holes of 1 mm diameter – Figure
2.19. A commercial platinum paste (Platisol T/SP from Solaronix®) was applied on the
counter-electrode glass substrate by screen-printing followed by annealing at 400 ºC
for 15 minutes in an infrared furnace (Nabertherm Gmbh model GF75).
The two electrodes were assembled and sealed with a 60 µm Surlyn® film
(Meltonix 1170-60, Solaronix®) using a hot press at 160 ºC, applying 10 bar for 20 s.
After sealing, the electrolyte (EL-HPE, Dyesol) was injected trough the drilled holes,
which were then sealed applying heat and pressure on a glass lamella / Surlyn® film
sandwich. Solder bus bars were applied to the FTO surface of the photo and counter-
electrodes using an ultrasonic soldering device (MBR electronics model USS-9210).
For comparison, reference DSCs were prepared using commercial TiO2 paste (DSL
18NR-AO, Dyesol). Two layers were screen-printed using a 43-80 mesh screen with
the same active area of the SiO2 films (5 × 5 mm2) and fired at 500 ºC for 60 min. All
other preparation details were similar to SiO2/TiO2 DSCs.

Chapter 6 193
Dye-sensitized Solar Cells: Improving Lifetime Stability and Performance
6.2.4 DSC performance characterization
The performance of the prepared DSCs was assessed from the I-V characteristics
and from electrochemical impedance spectroscopy (EIS) analysis. The I-V curves were
obtained at 100 mW·cm-2
(1 sun light intensity) and using a 1.5 air mass filter
(Newport, USA) in a setup equipped with a 150 W xenon light source (Oriel class A
solar simulator, Newport, USA). The simulator was calibrated using a single crystal Si
photodiode (Newport, USA). The I-V characteristics were obtained applying an
external potential load and measuring the generated photocurrent using an AUTOLAB
electrochemical station (PGSTAT 302 N). The EIS measurements were performed in
dark, from 100 kHz to 0.05 Hz with an AC modulation signal of 10 mV and at several
loads between 0 V and the Voc.
6.3 Shrinking core model
For depositing a TiO2 film within the mesoporous SiO2 scaffold the precursor
reactants, in this case TIP or water vapor, are pulsed into the ALD reaction chamber
infiltrating and adsorbing at the pore walls of the SiO2 mesoporous layer. However,
due to the very large surface area of the SiO2 layer (≈160 m2·g-1
) the gas molecules
may not reach all available adsorption sites. The screen-printed SiO2 has a layer
thickness (Lf) of ca. 20 ± 3 μm, and average pores size of 20 nm – see appendix C;
therefore, it is reasonable to assume that the gas transport in the porous SiO2 film falls
in the Knudsen regime22,25,26
. In the present work, the printed SiO2 film was
parallelepiped shaped with dimensions 5 mm × 5 mm × 20 µm, as illustrated in Figure
6.4a).

194 High efficient DSC photoelectrode using a SiO2 scaffold layer coated with a 3 nm TiO2 film
Dye-sensitized Solar Cells: Improving Lifetime Stability and Performance
Figure 6.4 a) 3D illustration of the printed SiO2 layer on FTO coated glass (not in
scale) and b) model of reacting SiO2 porous layer during precursor exposure. L
represents the length and width of the printed SiO2 layer, Lf the layer thickness and γ
the position of the unreacted core.
Because L >> Lf (L = 5 mm and Lf = 20 ± 3 µm), the top area of the SiO2 layer is
ca. 63 times larger than the lateral areas of the film (0.25 cm2 vs. 0.004 cm
2); therefore,
it was assumed a 1D diffusion model.
As the precursor molecules diffuse into the porous SiO2 layer, two regions are
defined: a region where the SiO2 spheres were coated with a monolayer of one of the
two reactants and an uncoated region, within the SiO2 layer – Figure 6.4b. The
uncoated region shrinks with time in a process analogous to a burning particle; the
progressive coating can then be well represented by the so-called shrinking-core model
(SCM)22, 23
. Following the notation of this model, the uncoated region is named “core”
while the coated region is named “shell”. The boundary of the unreacted core

Chapter 6 195
Dye-sensitized Solar Cells: Improving Lifetime Stability and Performance
(represented in green color in Figure 6.4) moves inwards towards the FTO surface and
its position is considered to be l = γ, the shrinking core position. For the gas/solid
system under study, it is reasonable to consider that the unreacted core shrinkage is
much slower than the flow rate of precursor molecules towards the unreacted core22,23
.
The main assumptions of the model are: one-dimensional mass transport, uniform
morphologic characteristics of SiO2 layer, isothermal transport, constant diffusion
coefficient of TIP through the diffusion layer, constant bulk precursor concentration,
TIP chemisorbs over the SiO2 support as a monolayer originating TiO2 upon reaction
with water, and pseudo steady state. Of the two reactants, TIP is the heaviest and
therefore the slowest one. Since the objective of the model was estimating the
minimum pulse time, TIP gives the most conservative result and it was then used to
compute the pulse time. Taking into account these assumptions the rate of TIP
chemisorption at steady state on SiO2 layer inner surface, at any instant t and position
l, is given by23
:
−d𝑁TIP
d𝑡= 𝑄TIP · 𝐴𝑠 (6.3)
where 𝑁TIP and 𝑄TIP are the number of moles and the flux of TIP, respectively, and As
is the reaction surface. The flux of TIP can be expressed according to the Fick’s first
law:
𝑄TIP = 𝐷TIP ·d𝐶TIP
d𝑙 (6.4)
where 𝐷TIP is the effective TIP diffusivity and 𝐶TIP is the molar concentration of TIP at
axial position l. Both 𝑄TIP and 𝐶TIP are positive in the coordinates system presented in
Figure 6.4. Combining (6.3) and (6.4) the following equation is obtained:
−d𝑁TIP
d𝑡= 𝐴𝑠 · 𝐷TIP ·
d𝐶TIP
d𝑙 (6.5)
Integrating (6.5) from the exterior surface 𝑙 = 𝐿f (bulk concentration of TIP,
𝐶TIPb ) to the boundary of the unreacted core surface 𝑙 = 𝛾 (𝐶TIP = 0) one obtains:

196 High efficient DSC photoelectrode using a SiO2 scaffold layer coated with a 3 nm TiO2 film
Dye-sensitized Solar Cells: Improving Lifetime Stability and Performance
−d𝑁TIP
d𝑡∫
d𝑙
𝑙2=
𝛾
𝐿f
𝐷TIP · ∫ d𝐶TIP
0
𝐶TIPb
(6.6)
and after integration:
−d𝑁TIP
d𝑡(
1
𝛾−
1
𝐿𝑓) = 𝐷TIP · 𝐶TIP
𝑏 (6.7)
Equation (6.7) gives the moving boundary of chemisorbed TIP monolayer as it
progress down in the SiO2 mesoporous layer. According to the half reactions (6.1) and
(6.2), TIP surface adsorption results in the same amount of loss in hydroxyl surface
groups (OH):
−d𝑁TIP = −d𝑁OH (6.8)
where NOH is the number of moles of hydroxyl groups. Rewriting Eq. (6.8) using the
molar density of OH and the volume of the unreacted core gives:
−d𝑁TIP = −d𝑁OH = −ρOHd𝑉 = −ρOHd(𝛾3) = −3 ρOH 𝛾2d𝛾 (6.9)
Inserting equation (6.9) into (6.7), the rate of reaction in terms of the shrinking core
position () is:
−d𝑁TIP
d𝑡= −3 ρOH 𝛾2 (
1
𝛾−
1
𝐿)
d𝛾
d𝑡= 𝐷TIP 𝐶TIP
𝑏 (6.10)
Integrating and rearranging, the unreacted shrinking cores varies with time as follows:
𝑡 =ρOH𝐿f
2
2𝐷TIP𝐶TIP𝑏 [1 − 3 (
𝛾
𝐿f)
2
+ 2 (𝛾
𝐿f)
3
] (6.11)
For complete coverage of the SiO2 surface area with TIP, 𝛾 = 0, the minimum
pulse time, 𝜏minp
, can be written as:
𝜏minp
=ρOH𝐿f
2
2𝐷TIP𝐶TIPb
(6.12)
Combining (6.11) and (6.12), the progression of the reaction can be written in terms of
the time required for the full coverage, 𝜏𝑚𝑖𝑛𝑝
:
𝑡
𝜏minp = 1 − 3 (
𝛾
𝐿f)
2
+ 2 (𝛾
𝐿f)
3
(6.13)
and in terms of the surface coverage fraction:

Chapter 6 197
Dye-sensitized Solar Cells: Improving Lifetime Stability and Performance
𝑡
𝜏minp = 1 − 3(1 − 𝑋f)
2 + 2(1 − 𝑋f)3 (6.14)
where 𝑋f = 1 − 𝛾 𝐿f⁄ is the surface coverage fraction. The effective TIP
diffusivity, 𝐷TIP, is given by22, 28
:
𝐷TIP = 𝐷k
𝜀
𝜉 (6.15)
where ε and 𝜉 are the porosity and tortuosity of the SiO2 and 𝐷k is the Knudsen
diffusivity given by:
𝐷k =𝑑p
3√
8𝑅𝑇
𝜋 𝑀TIP (6.16)
where 𝑑p is the pore diameter, R the gas constant, 𝑀TIP the molecular mass of the gas
(TIP), and T the temperature. With the pore size for TIP diffusion and using eq. (6.16)
and (6.12) it is possible to have an initial estimation of the minimum TIP pulse time,
𝜏minp
, for the complete coverage of the SiO2 scaffold layer. Table 6.2 shows the
parameters used for calculating 𝐷k and 𝜏minp
. The results are plotted in Figure 6.5 for a
range of pore sizes and show that for dp ≤ 10 nm, 𝜏minp
varies exponentially with pore
size; for dp ≥ 10 nm 𝜏minp
is approximately linear with dp. Because the pore size
decreases with each ALD cycle, the Knudsen diffusivity is lower and the minimum
pulse time required for complete diffusion of TIP in the porous layer increases.
Therefore due to the increasingly lower dp during ALD deposition, 𝜏minp
should be
chosen accordingly to the required TiO2 film thickness.
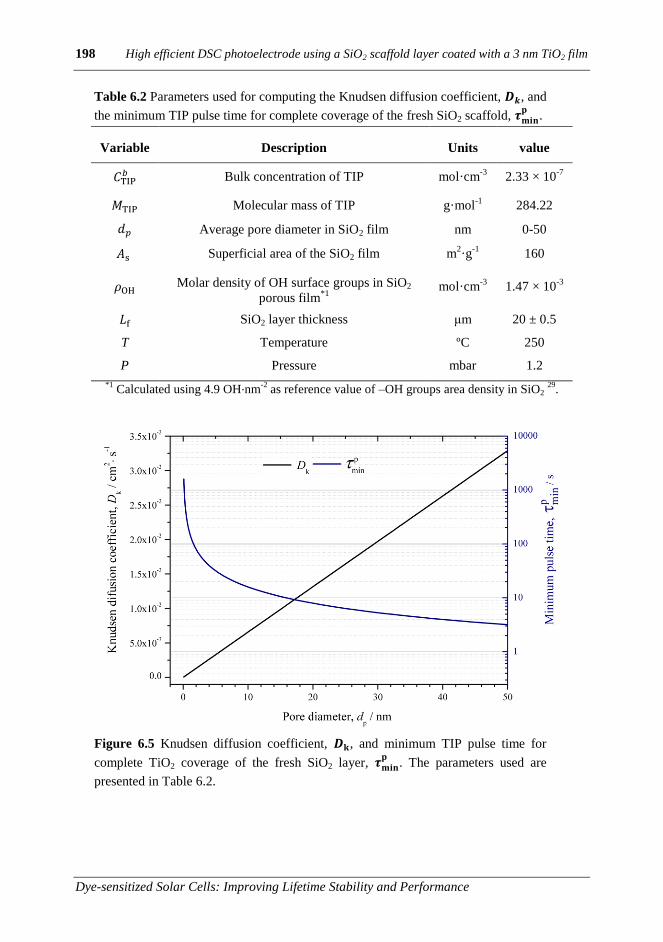
198 High efficient DSC photoelectrode using a SiO2 scaffold layer coated with a 3 nm TiO2 film
Dye-sensitized Solar Cells: Improving Lifetime Stability and Performance
Table 6.2 Parameters used for computing the Knudsen diffusion coefficient, 𝑫𝒌, and
the minimum TIP pulse time for complete coverage of the fresh SiO2 scaffold, 𝝉𝐦𝐢𝐧𝐩
.
Variable Description Units value
𝐶TIP𝑏 Bulk concentration of TIP mol·cm
-3 2.33 × 10
-7
𝑀TIP Molecular mass of TIP g·mol-1
284.22
𝑑𝑝 Average pore diameter in SiO2 film nm 0-50
𝐴s Superficial area of the SiO2 film m2·g
-1 160
𝜌OH Molar density of OH surface groups in SiO2
porous film*1
mol·cm
-3 1.47 × 10
-3
𝐿f SiO2 layer thickness μm 20 ± 0.5
T Temperature ºC 250
P Pressure mbar 1.2
*1 Calculated using 4.9 OH·nm
-2 as reference value of –OH groups area density in SiO2
29.
Figure 6.5 Knudsen diffusion coefficient, 𝑫𝐤, and minimum TIP pulse time for
complete TiO2 coverage of the fresh SiO2 layer, 𝝉𝐦𝐢𝐧𝐩
. The parameters used are
presented in Table 6.2.

Chapter 6 199
Dye-sensitized Solar Cells: Improving Lifetime Stability and Performance
6.4 Results and Discussion
6.4.1 Planar TiO2 ALD films
TiO2 films were deposited on FTO glass substrates according to the ALD operation
conditions presented in appendix C, Table C1. The number of ALD cycles was varied
from 100 to 4000. Figure 6.6 shows a SEM image of one of these films, obtained after
2000 ALD cycles. The deposited TiO2 film is compact and very conformal,
accompanying the irregular surface of the FTO. The optical characteristics of FTO
glass and the ALD TiO2 films were determined by spectrophotometry (Shimadzu UV-
3600); their transmittance spectra are presented in Figure 6.7a). The deposition of 100
ALD cycles resulted in no noticeable changes in the transmittance spectrum (from 200
nm till 800 nm) compared with a reference FTO glass substrate; from 500 to 4000
ALD cycles the transmittance of the coated samples start decreasing due to the
increased thickness of the TiO2 deposited layer.
Figure 6.6 Cross sectional SEM image of a TiO2 film produced after 2000 ALD
cycles (white scale bar represents 500 nm). All other operating details are given in
appendix C, Table C1.
The UV absorbance of the TiO2 films was computed from transmittance and
reflectance data. Figure 6.7b) shows that the UV absorbance (320 nm) of the TiO2
films is linear with the ALD number of cycles. Thickness measurements by SEM
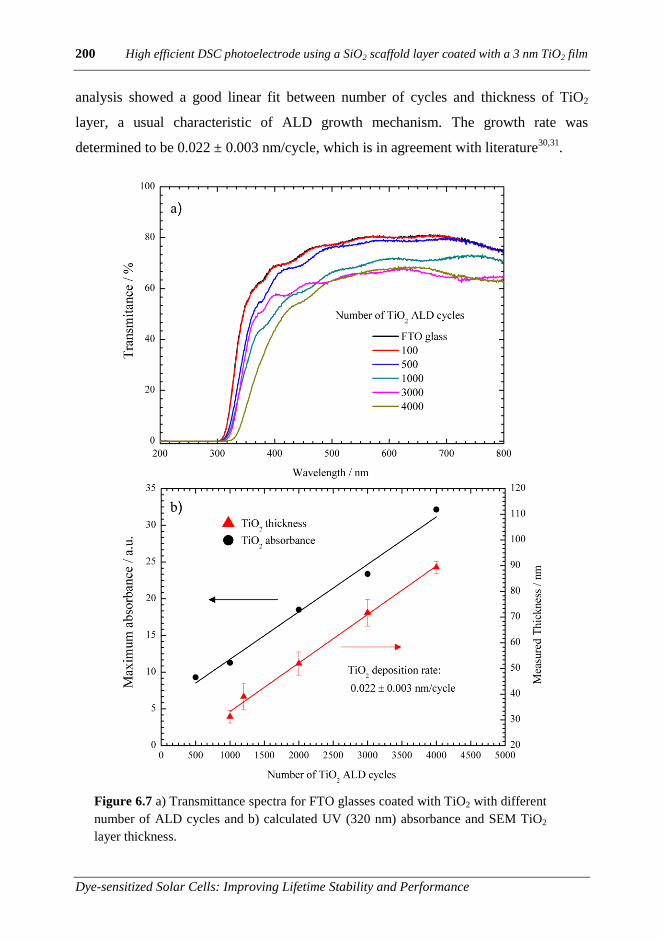
200 High efficient DSC photoelectrode using a SiO2 scaffold layer coated with a 3 nm TiO2 film
Dye-sensitized Solar Cells: Improving Lifetime Stability and Performance
analysis showed a good linear fit between number of cycles and thickness of TiO2
layer, a usual characteristic of ALD growth mechanism. The growth rate was
determined to be 0.022 ± 0.003 nm/cycle, which is in agreement with literature30,31
.
Figure 6.7 a) Transmittance spectra for FTO glasses coated with TiO2 with different
number of ALD cycles and b) calculated UV (320 nm) absorbance and SEM TiO2
layer thickness.

Chapter 6 201
Dye-sensitized Solar Cells: Improving Lifetime Stability and Performance
6.4.2 Three-dimensional SiO2/TiO2 ALD layer
The success of the photoelectrode architecture highly depends on the ability to
completely coat the surface area of the SiO2 scaffold. Insufficient coverage of the SiO2
scaffold results in poor electrical connection between the photoelectrode and the FTO,
back contact. As starting point, the SiO2 layer was infiltrated using the same pulse time
used for planar TiO2 coating on the FTO substrates (ΔtTIP,2= 2 s). The number of cycles
was selected in order to deposit an amount of TiO2 that would not cause pore blocking
of the SiO2 scaffold. According to the calculated average pore size of the “fresh” SiO2
layer (no TiO2 film, dp = ca. 20 nm, appendix D, Table D.1), it was determined to
deposit 3 nm of TiO2 film (i.e. total of 6 nm reduction in pore size); using a linear
extrapolation of the fitted growth rate in Figure 6.7 this means ca. 140 ALD cycles.
Figure 6.8 shows a SEM cross-section image of a SiO2 layer infiltrated with 140
cycles of TiO2. Energy-dispersive X-ray spectroscopy (EDS) profile analysis was
performed to check the infiltration of the TiO2 deposited by ALD. The atomic count
profile of Sn, Ti, Si and Na are plotted and overlapped over the SEM image. The
atomic counts of these elements give a good indication of the relative position of the
FTO layer, the infiltrated TiO2 film, the SiO2 nanoparticle layer and the glass substrate,
respectively. The atomic count signal of Sn from the FTO (SnO2-F) was used to set L*
= 0 in the SEM image. As expected, the atomic count of Si is constant across the SiO2
layer. Because calcium is present only in the glass substrate its signal is mainly present
at L* < 0.
The Ti atomic count shows that the amount of titanium dioxide at the porous
scaffold gradually decreases towards the interface with the FTO layer. Although the
TIP pulse time ΔtTIP,2 = 2 s was sufficient for covering planar structures such as FTO
(showed in Figure 6.6), it is unsatisfactory to cover the mesoporous SiO2 layer.
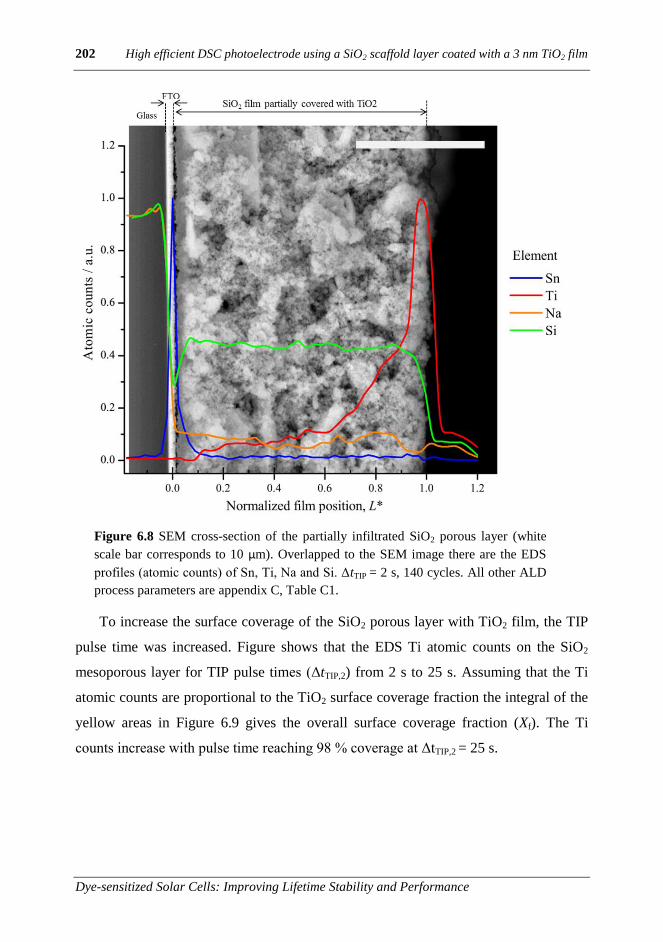
202 High efficient DSC photoelectrode using a SiO2 scaffold layer coated with a 3 nm TiO2 film
Dye-sensitized Solar Cells: Improving Lifetime Stability and Performance
Figure 6.8 SEM cross-section of the partially infiltrated SiO2 porous layer (white
scale bar corresponds to 10 μm). Overlapped to the SEM image there are the EDS
profiles (atomic counts) of Sn, Ti, Na and Si. ΔtTIP = 2 s, 140 cycles. All other ALD
process parameters are appendix C, Table C1.
To increase the surface coverage of the SiO2 porous layer with TiO2 film, the TIP
pulse time was increased. Figure shows that the EDS Ti atomic counts on the SiO2
mesoporous layer for TIP pulse times (ΔtTIP,2) from 2 s to 25 s. Assuming that the Ti
atomic counts are proportional to the TiO2 surface coverage fraction the integral of the
yellow areas in Figure 6.9 gives the overall surface coverage fraction (Xf). The Ti
counts increase with pulse time reaching 98 % coverage at ΔtTIP,2 = 25 s.

Chapter 6 203
Dye-sensitized Solar Cells: Improving Lifetime Stability and Performance
Figure 6.9 Titanium atomic counts profiles by EDS analysis in cross sections of the
SiO2 mesoporous layer infiltrated using 140 ALD cycles with different TIP pulse
times: a) 2 s b) 5 s c) 15 s d) 25 s. All other ALD process parameters are presented
in appendix C, Table C1.
Taking into account the reduction in the average pore size (from ca. 20 nm to ca. 14
nm) after the deposition of ca. 3 nm thick TiO2 film (140 ALD cycles) the Knudsen
diffusivity becomes Dk = 8.75 × 10⁻³
cm2·s-1
and a time of ca. 12 s would be necessary
for the complete coverage of the SiO2 layer – Figure 6.5. However, as shown by Figure
6.9, at least 25 s is required for the complete surface coverage. This difference was
assigned to the wide range of pore sizes as well as the tortuosity of the pores. The
experimental values of Xf as a function of TIP pulse time (shown in Figure 6.10) were
fitted using equations (6.12) and (6.14) minimizing the sum of the square difference to
obtain the effective diffusion coefficient of TIP in the SiO2 film, DTIP. The model fits
well the experimental data, and DTIP was found to be (4.23 ± 0.65) × 10-3
cm2·s-1
.

204 High efficient DSC photoelectrode using a SiO2 scaffold layer coated with a 3 nm TiO2 film
Dye-sensitized Solar Cells: Improving Lifetime Stability and Performance
Figure 6.10 Experimental and predicted surface coverage (Xf) as a function of the
TIP pulse time (ΔtTIP, 2).
Using the predicted Dk for the complete SiO2 surface coverage taking into account
the pore size reduction with 140 ALD TiO2 cycles (Dk = 9.83 × 10⁻³
cm2·s-1
), the fitted
effective TIP diffusivity, (4.23 ± 0.65) × 10-3
cm2·s-1
, and the porosity of the film (ε =
0.63) then Eq. (6.16) allows computing the tortuosity of the SiO2 porous layer –
𝜉 =1.46. The minimum pulse time, 𝜏minp
, can now be computed taking into account the
tortuosity of the SiO2 layer, and the size reduction caused by the deposition of the TiO2
film; Figure 6.11 shows that the pore size reduction and 𝜏minp
as a function of the
thickness of TiO2 film. To assure the complete coverage in SiO2 layer used for
preparing DSC devices, the pulse time was set according to the amount of TiO2 film to
be coated in the scaffold layer, using Figure 6.11 and Table D1 presented in appendix
D. All other ALD process variables were set according to Table C.1 and equations C.2,
C.3 and C.4, presented in appendix C.

Chapter 6 205
Dye-sensitized Solar Cells: Improving Lifetime Stability and Performance
Figure 6.11 Minimum TIP pulse time, 𝜏minp
, required for complete TiO2 coverage of
the SiO2 layer taking into account pore size reduction due to TiO2 film ALD.
6.4.3 Optical characterization of SiO2/TiO2 films
SiO2/TiO2 composite layer (20 µm thick) on FTO glass substrate prepared with
140 ALD cycles and TIP pulse time according to Figure 6.11, were characterized
optically using spectrophotometry; FTO glass substrate, FTO glass substrate with 3 nm
ALD TiO2 film, FTO glass substrate with the mesoporous SiO2 layer (20 µm thick),
and a conventional mesoporous TiO2 film (20 µm thick, 18NR-AO-Dyesol®) were also
analyzed. Figure 6.12a) and b) show the transmittance and reflectance spectra of these
samples. The mesoporous SiO2 layer shows a maximum of ca. 60 % transmittance and
ca. 30% reflectance in the visible range. Adding 3 nm of ALD TiO2 to the FTO glass
substrate did not result in noticeably transmittance or reflectance changes; however,
when 3 nm of TiO2 are applied in the mesoporous SiO2 layer, the optical characteristics
of the sample change drastically. Due to the large inner surface area of the SiO2 layer,
the integral of TiO2 film thickness becomes much higher than 3 nm. Therefore the
transmittance of the sample decreases ca. 10 % and there is a significant increase (ca.
50 %) in reflectance that reaches 60 % at 400 nm. This is particular interesting for DSC

206 High efficient DSC photoelectrode using a SiO2 scaffold layer coated with a 3 nm TiO2 film
Dye-sensitized Solar Cells: Improving Lifetime Stability and Performance
applications due to the strong absorption of N719 in this spectrum region, as showed
by the dye absorption curve in Figure 6.12b).
Figure 6.12 Optical characteristics of FTO glass substrate, FTO glass substrate with
planar 3 nm ALD TiO2 film, FTO glass substrate with 20 µm SiO2 layer, FTO glass
substrate with 20 µm SiO2/TiO2 composite layer, FTO with 20 µm of conventional
TiO2 layer (18NR-AO-Dyesol®). The absorption spectrum of N719 dye is also
shown.

Chapter 6 207
Dye-sensitized Solar Cells: Improving Lifetime Stability and Performance
The optical bandgap (Eg) of the prepared SiO2/TiO2 composite layer was calculated
from the Tauc plot 32
presented in Figure 6.13. The optical bandgap found for the TiO2
in composite layer was 3.30 eV while for the conventional TiO2 layer it was 3.25 eV.
The increased TiO2 bandgap when inserted in the composite layer, compared with the
conventional TiO2 layer, was assigned to the substrate effect; actually, a 3 nm TiO2
film is expected to suffer optical deformations due to the scaffold layer 33
.
Figure 6.13 Tauc plot calculated from the absorption data of TiO2 film (3 nm thick)
deposited in the SiO2 porous scaffold layer (20 μm) and of the conventional TiO2
mesoporous layer (20 µm, 18NR-AO Dyesol®).
6.4.4 DSCs based on SiO2/TiO2 architecture
The prepared SiO2/TiO2 composite photoelectrodes were then used in DSC
devices. Figure 6.14 shows the I-V curves obtained under illumination (AM 1.5, 100
mW·cm-2
) and in dark conditions for the SiO2/TiO2-DSCs, where the TiO2 film
thickness in the SiO2/TiO2 composite layer was varied from 40 to 200 ALD cycles (ca.
0.9 nm to 4.4 nm). The results presented are the average of a minimum of 3 DSC
samples. Figure 6.14 shows that the TiO2 number of cycles has a large influence in the

208 High efficient DSC photoelectrode using a SiO2 scaffold layer coated with a 3 nm TiO2 film
Dye-sensitized Solar Cells: Improving Lifetime Stability and Performance
I-V curves and namely in the short-circuit current density (Jsc) and in the open circuit
potential (Voc). A preliminary analysis of the I-V curves obtained in dark conditions
shows that the TiO2 thickness has a large effect in the dark current, suggesting that
recombination plays a major role in the DSCs performance.
Figure 6.15 shows the computed performance parameters (Jsc, Voc, η, and FF) from
the experimental I-V curves. The efficiency (η) of the DSC devices has an exponential
increase with the number of TiO2 cycles, up to 150 cycles where it reaches a maximum
of 8.4 %; the η increase is driven mainly by the Jsc.
Figure 6.14 I-V curves obtained in light (AM 1.5 global 100 mW·cm-2
) and dark
conditions of DSCs prepared using the SiO2/TiO2 architecture, with varying the
number of TiO2 ALD cycles.

Chapter 6 209
Dye-sensitized Solar Cells: Improving Lifetime Stability and Performance
The minimum number of ALD cycles tested (40 cycles) resulted in very low
efficient DSCs, η = 0.1 %; yet the Voc and FF of this cell are relatively close to the
values obtained for the optimum TiO2 film thickness (150 ALD cycles). Hence, the
reason for such low efficiency is related to the current output of the cell. Considering
that the surface area of the electrode is approximately constant across all the
experiments, dye loading is expected to be also approximately constant; therefore the
reason for low Jsc should be related to the electron transport characteristics of the TiO2
layer. Consequently increasing the number of ALD TiO2 cycles results in enhanced
electron transport characteristics.
The optimum number of ALD cycles was found to be 150, which mean ca. of 3.3
nm thick TiO2 film, which cause a 6.6 nm pore size reduction. Considering 20 nm the
average pore size the deposited TiO2 film should not cause pore blockage, therefore the
loss of Jsc and η was assigned to the inferior photoelectrode surface area and to the
transport/recombination balance.
Figure 6.15 Calculated performance parameters from experimental I-V curves of
SiO2/TiO2-DSCs, with TiO2 ALD cycles ranging from 40 to 200. The error bars
refer to the standard deviation of at least 3 samples.

210 High efficient DSC photoelectrode using a SiO2 scaffold layer coated with a 3 nm TiO2 film
Dye-sensitized Solar Cells: Improving Lifetime Stability and Performance
Figure 6.16 Bode (a) and Nyquist (b) plots obtained under dark conditions at the Voc
of the cells for a range of deposited ALD cycles of TiO2.
Electrochemical impedance spectroscopy (EIS) was used to study the ALD TiO2
thickness influence in recombination and transport characteristics of the prepared
SiO2/TiO2-DSC. Figure 6.16 shows the obtained Bode (a) and Nyquist (b) plots in dark
and at Voc. Again, it is observed a large influence of the deposited TiO2 film thickness
in the recombination and transport properties. The Nyquist plots show semi-circles that
change shape from 100 to 150 ALD cycles. Up to 100 ALD cycles, Nyquist plots
show, a very large resistance associated with the electron transport resistance. To
understand and quantify the influence of TiO2 thickness on electron transport and

Chapter 6 211
Dye-sensitized Solar Cells: Improving Lifetime Stability and Performance
recombination, the EIS experimental data were fitted to an appropriate electrical
analogue, namely using the transmission line model34-37
.
The computed parameters from the model fitting were used to assess transport and
recombination in the DSCs based on SiO2/TiO2 composite photoelectrode. Electron
diffusion coefficient, Deff, and the recombination rate constant, kr, were calculated
according to equations presented elsewhere6. Figure 6.17 shows that between 140 to
200 TiO2 deposition cycles, Deff is similar and increases exponentially with the applied
potential. However, for less than 140 cycles there are large differences in Deff among
cells and the potential influence is less pronounced.
Figure 6.17 Electron diffusion coefficients, Deff, as a function of the applied
potential, calculated for DSCs based on SiO2/TiO2 composite photoelectrodes with
several deposited number of TiO2 ALD cycles.
Figure 6.18 shows kr as a function of the applied potential for the same samples.
Generally, the recombination rate increases with the potential. From 140 to 200 TiO2
ALD cycles, recombination increases with TiO2 thickness for all potentials; however,
when analyzing recombination in SiO2/TiO2-DSCs with less than 140 ALD cycles, the
influence of TiO2 thickness in kr is not clear.

212 High efficient DSC photoelectrode using a SiO2 scaffold layer coated with a 3 nm TiO2 film
Dye-sensitized Solar Cells: Improving Lifetime Stability and Performance
Figure 6.18 Recombination rate constants, kr, as a function of the applied potential,
calculated for DSCs based on SiO2/TiO2 composite photoelectrode with several
deposited number of TiO2 ALD cycles.
To elucidate the ALD TiO2 thickness influence in recombination and transport, the
electron lifetime, transport time and collection efficiency38
(𝜏e−, 𝜏tr and 𝜂cc,
respectively) were plotted at a fixed potential (0.7 V) against the number of TiO2 ALD
cycles. Figure 6.19 shows that up to 100 cycles, the transport time, 𝜏tr is greater than
the electron lifetime, 𝜏e−; consequently the generated electrons in the SiO2/TiO2
porous layer tendentiously recombine before being collected, therefore the collection
efficiency, 𝜂cc , of the DSC is low. From the 100 cycle point on, 𝜏e− > 𝜏tr , so 𝜂cc
increases up to 140 cycles becoming the constant and approximately equal to 1. This
shows that there is a minimum TiO2 film thickness required for the efficient transport
of electrons, which in the present case ranges between 3.0 nm and 3.5 nm.
Figure 6.20 allows distinguishing two regimes of operation of the SiO2/TiO2-
DSCs. This figure shows that up to 140 ALD cycles of TiO2 the prepared DSCs
operate in a transport-limited regime; in this region the deposited thickness of TiO2 (<
3 nm) is insufficient for efficiently transport the electrons, and Deff increases
exponentially with the deposition cycles of TiO2. For more than 140 ALD cycles of

Chapter 6 213
Dye-sensitized Solar Cells: Improving Lifetime Stability and Performance
TiO2, Deff stabilizes at Deff = (2.40 ± 0.05) × 10-6
cm2·cm
-1 at 0.7 V. This region is
characterized by a constant Deff and a minimum recombination rate, kr, originating then
the maximum current density, Jsc, and efficiency, η; in this region it is the
recombination that determines the DSC efficiency. The increase of the recombination
rate constant after 150 cycles could be ascribed to pore size reduction due to the excess
of TiO2 deposition; this originates: i) surface area decrease; ii) ionic transfer limitations
and; iii) smaller surface area available for dye adsorption. The SiO2 layer should
display a wide range of pore sizes due to the particles assemble process. Since the
average pore size of the SiO2 scaffold decreases with the number of TiO2 ALD
deposition cycles, the smaller pores should reach a point where the bulky dye molecule
hardly diffuses through, leaving uncoated surface areas. The smaller molecules of
electrolyte, however, still diffuse through these small pores finding uncoated spaces
where the recombination takes place, as illustrated in Figure 6.19 and Figure 6.20; this
same effect was also observed by O’Regan & coauthors39
.
Figure 6.19 TiO2 thickness influence in the electron lifetime, transport time and
collection efficiency (𝝉𝐞−, 𝝉𝐭𝐫 and 𝜼𝐜𝐜
, respectevely) for EIS conducted in dark
conditions and at 0.7 V.

214 High efficient DSC photoelectrode using a SiO2 scaffold layer coated with a 3 nm TiO2 film
Dye-sensitized Solar Cells: Improving Lifetime Stability and Performance
Figure 6.20 TiO2 film thickness influence on transport (Deff,) and recombination (kr)
in the SiO2/TiO2-DSCs (EIS analysis conducted at dark conditions and at 0.7 V).
DSCs prepared with the optimum amount of TiO2 (150 ALD cycles, ca. 3.3 nm
film thick) were compared with conventional cells using a nanoparticulate TiO2 paste
(DSL 18NR-AO, Dyesol). Figure 6.21 and Table 6.3 show I-V curves and the
respective performance parameters in light and in dark conditions. The SiO2/TiO2-DSC
cell shows enhanced current–density and open–circuit potential and less dark current
than the reference cell. The increased current should be ascribed to the larger surface
area of the porous layer (160 m2·g-1
vs. 74 m2·g-1
40
). The increase in the Voc is within
the experimental error.
Table 6.3 Photovoltaic parameters of the reference DSCs and of the SiO2/TiO2-
DSCs
Photo-electrode Performance parameters
Voc /V Jsc / mA·cm-2
FF η / %
TiO2 nanoparticle reference 0.78 ± 0.02 12.7 ± 0.1 0.71 ± 0.02 7.82 ± 0.05
SiO2 / TiO2 0.80 ± 0.05 14.6 ± 0.1 0.65 ± 0.04 8.43 ± 0.20

Chapter 6 215
Dye-sensitized Solar Cells: Improving Lifetime Stability and Performance
Figure 6.21 I-V curves of the prepared DSCs with the developed SiO2/TiO2 PE and
a reference cell prepared with a commercial TiO2 paste. (measurement at 1-sun, 1.5
AM illumination).
The recombination and charge transport resistances in both devices was obtained
by EIS analysis at several potentials. Figure 6.22 shows the Nyquist and Bode plots for
both devices at 0.8 V, 0.6 V and 0.4 V. At potentials close to the Voc (0.8 V) Nyquist
and Bode plots (Figure 6.22a and b) show that the difference between both cells is
rather small. However, at potentials close to the maximum power point (0.6 V, (Figure
6.22c and d) there is a large difference in the second semicircle in the Nyquist plot and
first frequency peak in Bode phase plot, showing that recombination resistance is lower
in the reference cell at this potential. At 0.4 V, the difference is even more noticeable
as the impedance spectra of the SiO2/TiO2-DSCs show recombination resistances
orders of magnitude higher than the reference cell.
The recombination rate constants and diffusion coefficients in both devices were
calculated as a function of the potential and plotted in Figure 6.23. There are two
important observations: 1) electron transport, evaluated by Deff, is similar between the
devices; 2) electron recombination, characterized by kr, is higher in the reference cell.

216 High efficient DSC photoelectrode using a SiO2 scaffold layer coated with a 3 nm TiO2 film
Dye-sensitized Solar Cells: Improving Lifetime Stability and Performance
Taking into account these observations, the difference in the performance between both
devices should be assigned to the electron recombination rate. Consequently, the lower
recombination in the SiO2/TiO2-DSCs contributes, along with larger surface area, to
the higher current delivered by this cell type.
Figure 6.22 Impedance spectra obtained under dark conditions at 0.80 V, 0.6 V and
0.4 V for SiO2/TiO2-DSCs (150 ALD cycles of TiO2) and reference DSCs (Dyesol®
18NR-AO TiO2 paste).
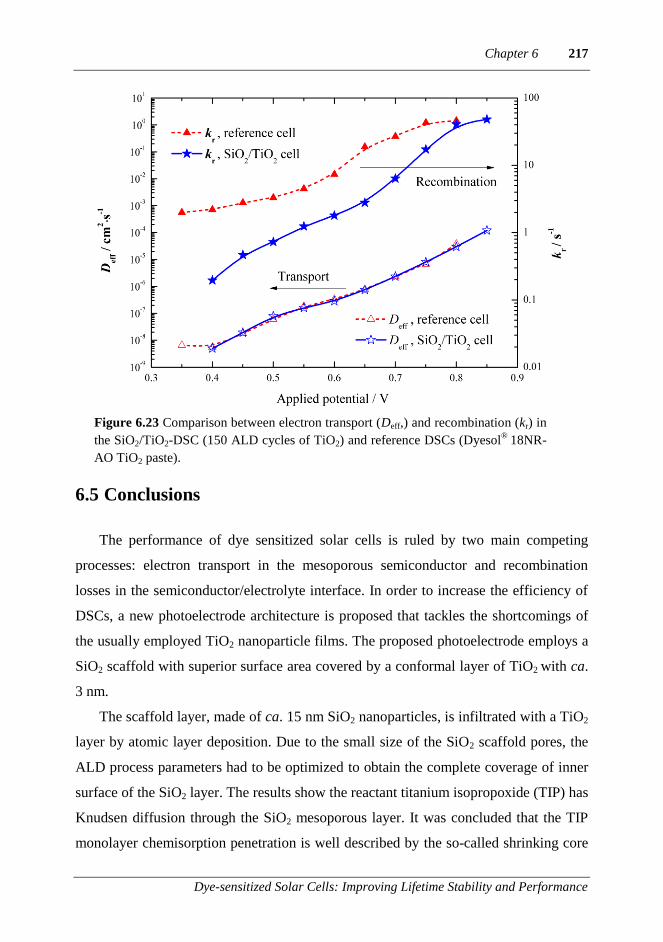
Chapter 6 217
Dye-sensitized Solar Cells: Improving Lifetime Stability and Performance
Figure 6.23 Comparison between electron transport (Deff,) and recombination (kr) in
the SiO2/TiO2-DSC (150 ALD cycles of TiO2) and reference DSCs (Dyesol®
18NR-
AO TiO2 paste).
6.5 Conclusions
The performance of dye sensitized solar cells is ruled by two main competing
processes: electron transport in the mesoporous semiconductor and recombination
losses in the semiconductor/electrolyte interface. In order to increase the efficiency of
DSCs, a new photoelectrode architecture is proposed that tackles the shortcomings of
the usually employed TiO2 nanoparticle films. The proposed photoelectrode employs a
SiO2 scaffold with superior surface area covered by a conformal layer of TiO2 with ca.
3 nm.
The scaffold layer, made of ca. 15 nm SiO2 nanoparticles, is infiltrated with a TiO2
layer by atomic layer deposition. Due to the small size of the SiO2 scaffold pores, the
ALD process parameters had to be optimized to obtain the complete coverage of inner
surface of the SiO2 layer. The results show the reactant titanium isopropoxide (TIP) has
Knudsen diffusion through the SiO2 mesoporous layer. It was concluded that the TIP
monolayer chemisorption penetration is well described by the so-called shrinking core

218 High efficient DSC photoelectrode using a SiO2 scaffold layer coated with a 3 nm TiO2 film
Dye-sensitized Solar Cells: Improving Lifetime Stability and Performance
model. The diffusion coefficient for TIP in the fresh SiO2 scaffold (DTIP) was
determined to be (4.23 ± 0.65) × 10-3
cm2·s-1
. Deposition cycle times of TIP of no less
than 25 s are required to fully coat the 20 µm thick SiO2 scaffold layer.
There were identified two DSC operation regimes: i) a transport limited regime, in
which the TiO2 film controls the electron transport, which is observed for film
thicknesses smaller than ca. 3.5 nm; and ii) a recombination limited regime, where Deff
is constant ((2.40 ± 0.05) × 10-6
cm2·s
-1 at 0.7 V) and the DSC performance is
determined by the recombination rate. The best DSC results were obtained for 150
ALD deposition cycles of TiO2, corresponding approximately to a film thickness of 3.3
nm.
The SiO2/TiO2-DSC showed better energy performance than the conventional
device, made with a nanoparticulated photoelectrode layer, due to enhanced current
density (14.6 ± 0.1 vs. 12.7 ± 0.1 mA·cm-2
) owing to lower electron recombination and
larger surface area; SiO2/TiO2-DSCs showed and average of η = 8.43 % vs. η = 7.82 %
of the conventional DSC devices. The superior recombination resistance was assigned
to more uniform TiO2 photoelectrode film, which allows a better dye coverage. It must
be emphasized that a ca. 3 nm thick ALD deposited film of TiO2 is suitable for the
electron transport of a DSC with over 8.4 % energy efficiency. The new SiO2/TiO2
composite layer also showed 10 % higher transmittance than the conventional
mesoporous TiO2 layer, making this PE more attractive to applications requiring semi-
transparency such as building integrated photovoltaics (BIPV).
Due to the ability of ALD process to deposit a wide range of metal‒oxides, the
proposed photoelectrode architecture opens the doors for new materials to be tested as
photoelectrodes in DSCs. Metal-oxides such as ZnO, SnO2 and Nb2O5 (alone or
combined with TiO2) are examples of promising materials to serve as semiconductor
layers in the proposed photoelectrode architecture.

Chapter 6 219
Dye-sensitized Solar Cells: Improving Lifetime Stability and Performance
Acknowledgements
J. Maçaira is grateful to the Portuguese Foundation for Science and Technology
(FCT) for his PhD Grant (Reference: SFRH/BD/80449/2011). L. Andrade
acknowledges European Research Council (Contract no: 321315) for her contract.
Financial support from the European Research Council (Contract no: 321315) is also
acknowledged. The authors are thankful to CEMUP (Centro de Materiais da
Universidade do Porto) for the SEM/EDS analysis; and to S. Queirós and C. Mateos-
Pedrero for the BET analysis.
References
1. J. Desilvestro, M. Grätzel, L. Kavan, J. Moser and J. Augustynski, J. Am. Chem.
Soc., 1985, 107, 2988-2990.
2. B. O'Regan and M. Grätzel, Nature, 1991, 353, 737-740.
3. E. J. W. Crossland, N. Noel, V. Sivaram, T. Leijtens, J. A. Alexander-Webber
and H. J. Snaith, Nature, 2013, 495, 215-219.
4. S. Mori, K. Sunahara, Y. Fukai, T. Kanzaki, Y. Wada and S. Yanagida, The
Journal of Physical Chemistry C, 2008, 112, 20505-20509.
5. M. Wang, P. Chen, R. Humphry-Baker, S. M. Zakeeruddin and M. Gratzel,
ChemPhysChem, 2009, 10, 290-299.
6. J. Maçaira, L. Andrade and A. Mendes, Renewable and Sustainable Energy
Reviews, 2013, 27, 334-349.
7. Q. Zhang and G. Cao, Nano Today, 2011, 6, 91-109.
8. N. Tetreault and M. Gratzel, Energy & Environmental Science, 2012.
9. X. Gan, X. Li, X. Gao, F. Zhuge and W. Yu, Thin Solid Films, 2010, 518, 4809-
4812.
10. H. W. Wang, C. F. Ting, M. K. Hung, C. H. Chiou, Y. L. Liu, Z. W. Liu, K. R.
Ratinac and S. P. Ringer, Nanotechnology, 2009, 20, 9.
11. C. H. Lee, S. W. Rhee and H. W. Choi, Nanoscale Research Letters, 2012, 7, 48.

220 High efficient DSC photoelectrode using a SiO2 scaffold layer coated with a 3 nm TiO2 film
Dye-sensitized Solar Cells: Improving Lifetime Stability and Performance
12. A. B. F. Martinson, M. r. S. Goes, F. Fabregat-Santiago, J. Bisquert, M. J. Pellin
and J. T. Hupp, The Journal of Physical Chemistry A, 2009, 113, 4015-4021.
13. X. D. Li, D. W. Zhang, S. Chen, Z. A. Wang, Z. Sun, X. J. Yin and S. M.
Huang, Materials Chemistry and Physics, 2010, 124, 179-183.
14. P. Zhong, X. Ma, X. Chen, R. Zhong, X. Liu, D. Ma, M. Zhang and Z. Li, Nano
Energy, 2015, 16, 99-111.
15. J.-Y. Liao, B.-X. Lei, D.-B. Kuang and C.-Y. Su, Energy & Environmental
Science, 2011, 4, 4079-4085.
16. C.-Y. Cho and J. H. Moon, Langmuir, 2012.
17. Z. Zhao, G. Liu, B. Li, L. Guo, C. Fei, Y. Wang, L. Lv, X. Liu, J. Tian and G.
Cao, Journal of Materials Chemistry A, 2015, 3, 11320-11329.
18. L. N. Quan, Y. H. Jang, Y. J. Jang, J. Kim, W. Lee, J. H. Moon and D. H. Kim,
ChemSusChem, 2014, 7, 2590-2596.
19. N. Tétreault, É. Arsenault, L.-P. Heiniger, N. Soheilnia, J. Brillet, T. Moehl, S.
Zakeeruddin, G. A. Ozin and M. Grätzel, Nano Letters, 2011, 11, 4579-4584.
20. P. Labouchere, A. K. Chandiran, T. Moehl, H. Harms, S. Chavhan, R. Tena-
Zaera, M. K. Nazeeruddin, M. Graetzel and N. Tetreault, Advanced Energy
Materials, 2014, 4, n/a-n/a.
21. N. Tétreault, G. von Freymann, M. Deubel, M. Hermatschweiler, F. Pérez-
Willard, S. John, M. Wegener and G. A. Ozin, Advanced Materials, 2006, 18,
457-460.
22. G. F. Froment and K. B. Bischoff, Chemical Reactor Analysis and Design, John
Wiley and Sons, 1990.
23. O. Levenspiel, Chemical reaction engineering, Wiley, 1972.
24. J. Aarik, A. Aidla, T. Uustare, M. Ritala and M. Leskelä, Applied Surface
Science, 2000, 161, 385-395.
25. H.-Y. Lee, C. J. An, S. J. Piao, D. Y. Ahn, M.-T. Kim and Y.-S. Min, The
Journal of Physical Chemistry C, 2010, 114, 18601-18606.
26. P. F. Lito, S. P. Cardoso, A. E. Rodrigues and C. M. Silva, Separation &
Purification Reviews, 2015, 44, 283-307.
Chapter 6 221
Dye-sensitized Solar Cells: Improving Lifetime Stability and Performance
27. A. M. M. Mendes, C. A. V. Costa and A. E. Rodrigues, Gas Separation &
Purification, 1994, 8, 229-236.
28. J. R. Welty, C. E. Wicks and R. E. Wilson, Fundamentals of momentum, heat,
and mass transfer, Wiley, 1976.
29. A. Mortensen, Concise Encyclopedia of Composite Materials, Elsevier Science,
2006.
30. D. H. Kim, M. Woodroof, K. Lee and G. N. Parsons, ChemSusChem, 2013, 6,
1014-1020.
31. D.-J. Lee, K.-J. Kim, S.-H. Kim, J.-Y. Kwon, J. Xu and K.-B. Kim, Journal of
Materials Chemistry C, 2013, 1, 4761-4769.
32. O. Stenzel, The Physics of Thin Film Optical Spectra: An Introduction, Springer
Berlin Heidelberg, 2005.
33. X. Zheng, S. Meng, J. Chen, J. Wang, J. Xian, Y. Shao, X. Fu and D. Li, The
Journal of Physical Chemistry C, 2013, 117, 21263-21273.
34. J. Macaira, I. Mesquita, L. Andrade and A. Mendes, Physical Chemistry
Chemical Physics, 2015, 17, 22699-22710.
35. J. Bisquert, M. Gratzel, Q. Wang and F. Fabregat-Santiago, The Journal of
Physical Chemistry B, 2006, 110, 11284-11290.
36. L. Andrade, S. M. Zakeeruddin, M. K. Nazeeruddin, H. A. Ribeiro, A. Mendes
and M. Grätzel, ChemPhysChem, 2009, 10, 1117-1124.
37. Q. Wang, J.-E. Moser and M. Grätzel, The Journal of Physical Chemistry B,
2005, 109, 14945-14953.
38. L. Bertoluzzi and S. Ma, Physical Chemistry Chemical Physics, 2013, 15, 4283-
4285.
39. B. O'Regan, L. Xiaoe and T. Ghaddar, Energy & Environmental Science, 2012,
5, 7203-7215.
40. J. Lin, A. Nattestad, H. Yu, Y. Bai, L. Wang, S. X. Dou and J. H. Kim, Journal
of Materials Chemistry A, 2014, 2, 8902-8909.


CHAPTER 7 Concluding Remarks and Outlook
“One’s destination is never a place, but rather a new way of looking at things”
Henry Miller


7
Concluding Remarks and Outlook
The work portrayed in this Thesis addresses relevant constraints that prevent dye-
sensitized solar cell (DSC) technology to become a commercial photovoltaic (PV)
solution. Regarding this matter two critical aspects were identified: device stability and
solar energy conversion efficiency.
This chapter highlights the main achievements obtained. An outlook for the DSC
technology and its challenges is also presented, alongside with suggestions for future
research.
7.1 Main Conclusions
A broad state of the art study was conducted, revealing a vast amount of academic
work done related to DSCs efficiency enhancement, but relatively scarce regarding
DSC stability. Improvements in the photoelectrode (PE) were identified as the most
promising route for increasing the efficiency of DSCs. The influence of the PE
morphology in the DSC performance was analysed and discussed. Electron transport
and recombination are key mechanisms that rule the DSC efficiency. Electrolyte
leakage and the permeation of external contaminants into the cell were identified as the
technology bottlenecks. Therefore, efficient encapsulation was targeted as a main goal
concerning DSCs long-term stability.
Regarding stability, a new sealing process, based on laser assisted glass melting,
was developed and optimized for sealing DSC devices. A response surface
methodology was used to optimize the process parameters, where laser power was
identified as the most important factor. The obtained empiric model relates the sealing
226 Concluding Remarks and Outlook
Dye-sensitized Solar Cells: Improving Lifetime Stability and Performance
quality with the process parameters, and displayed good agreement with the
experimental results. Glass samples sealed by the developed process passed the
following international standards:
Helium leak tests : MIL-STD-883H, “Encapsulation suitable for microcircuits
for use within military and aerospace electronic systems” ;
Thermal cycling tests : IEC 61646, “International standard for thin-film
terrestrial PV modules”;
Shear strength tests: ISO 13445, “Adhesives - Determination of shear strength
of adhesive bonds between rigid substrates by the block-shear method”; and
EN 1279-4, “Glass in Buildings - Insulating glass units, requirements for
sealants”.
Though none of these standards address specifically DSCs, it is expected that an
encapsulated cell meeting the above requirements endure 20 years of leak free
operation. The laser sealing process takes place at 330 ºC, which is lower than the
maximum tolerable temperature of commonly employed materials in the
photoelectrode (PE) and counter electrode (CE) layers of DSC devices, i.e. titanium
dioxide (~ 500 °C) and platinum (~ 450 °C) in the PE and CE respectively. I-V
characteristics and electrochemical impedance spectroscopy analysis (EIS) were used
to characterize the laser sealed DSCs, demonstrating that the sealing process had no
influence in performance.
Laser assisted glass frit sealed DSCs were tested for stability against DSCs sealed
with the commonly employed sealant (Surlyn® polymer). Accelerated aging was
carried out during 1000 hours of continuous illumination (765 W·m-2), temperature
between 60 and 65 ºC, and electrical resistive load close to the cells operating
maximum power point (~ 0.6 V). The periodic PV characterization showed excellent
stability results for laser sealed devices, with minimal efficiency loss (-2.4%). As for
Surlyn®
sealed cells degradation onset after ca. 400 hours, and at the end of the test
they presented 34 % efficiency degradation. EIS analysis showed that the increase of
series resistances (Rs) and recombination rate are the main causes of performance loss
in Surlyn®
sealed cells. In turn, laser sealed cells showed nearly no Rs degradation (-3.9

Chapter 7 227
Dye-sensitized Solar Cells: Improving Lifetime Stability and Performance
%) and less recombination (+3% in electron lifetime, τe-) after 1000 h of test,
contributing to their performance stability. The results showed that, contrary to Surlyn®
sealant, the developed laser assisted glass frit sealing process guarantees efficient
encapsulation for DSC cells, therefore providing the necessary durability of the
devices.
Temperature, alongside with solar irradiance, is the most important operating
factor of PV devices. Temperature influence in DSC performance was assessed for a
wide range of temperatures, from -5 ºC up to 105 ºC. Within this temperature range,
the laser sealed DSCs did not show any degradation and displayed full efficiency
reversibility at 25 ºC. Temperature has an overall negative effect on the DSC
performance; this effect was shown to be caused by the total electron/electrolyte
recombination process that is enhanced by temperature. The temperature influence in
the recombination reaction was quantified for SnO2-F/electrolyte and TiO2/electrolyte
interfaces. The results showed that the energy level of electrons significantly affects
the recombination reaction rate: when electrons are in a higher energy level (i.e. TiO2
conduction band, CB) the driving force for recombination is lower comparing with
lower energy level electrons (i.e. SnO2-F conduction band). Thus, the activation energy
was lower for the recombination taking place at TiO2 interface (0.47 eV) than SnO2-F
(0.66 eV) interface with electrolyte. The Arrhenius plots for recombination rates in
DSCs showed two different activation energies for temperatures below and above ca.
40 ºC. It was proposed a shift in the dominant recombination pathway from trapped
electrons/electrolyte to CB electrons/electrolyte to explain the different activation
energies. This work shows that electron recombination highly depends on the cell
operating temperature but also on the semiconductor interfaces present in the solar cell.
Increasing the solar to energy conversion efficiency of DSCs requires a
fundamental understanding of the solar cell operation mechanisms. Phenomenological
modeling was used as a simulation tool to assess the two processes that rule the
performance of DSCs: electron transport and recombination. The effect of the
recombination reaction rate constant, kr, and the electron diffusion coefficient, Deff, in
the collection efficiency, ηcc, of the DSC was discussed. The influence of kr in the
open-circuit voltage (Voc) and short-circuit current density (Jsc) of DSCs has been

228 Concluding Remarks and Outlook
Dye-sensitized Solar Cells: Improving Lifetime Stability and Performance
determined and has been shown to be highly dependent on the recombination reaction
kinetics considered in the model. It was also shown that the optimum PE thickness
varies logarithmically with kr and with Deff, showing that the thickness of the
photoactive layer should be carefully designed for developing high efficiency DSCs.
In order to increase the efficiency of DSCs, a new photoelectrode architecture was
explored that tackles the shortcomings of the usually employed TiO2 nanoparticulated
films. The new PE employs a SiO2 scaffold layer with superior surface area than
commercial TiO2 films, covered by a thin nanometric film of TiO2.
The scaffold layer is composed by SiO2 nanoparticles of ca.15 nm and has surface
area of ca. 160 m2·g
-1. This film hosts a thin TiO2 film deposited by atomic layer
deposition (ALD). Due to the small pore size of the SiO2 film, the ALD process
parameters had to be optimized for complete coverage of the inner surface area of the
SiO2 layer. The results showed that titanium isopropoxide (TIP) has Knudsen diffusion
through the SiO2 mesoporous layer, and that the shrinking core model can predict the
pulse time required for complete TiO2 coverage. The diffusion coefficient for TIP in
the SiO2 scaffold (DTIP) was determined to be (4.23 ± 0.65) × 10-3
cm2·s-1
and the
minimum TIP pulse time for complete SiO2 coverage with the TiO2 film was 25 s.
Two DSC operating regimes were determined based on the number of cycles
deposited in the inner surface area of the SiO2 layer:
1) < 140 cycles (ca. 3 nm): transport limited regime showing that the minimum
TiO2 thickness required for efficient transport of electrons ranged between 3.5
and 4 nm.
2) > 140 ALD cycles: recombination limited regime, where Deff is constant
((2.40 ± 0.05) × 10-6
cm2·s
-1 at 0.7 V) and efficiency is highly dependent on the
recombination rate.
The best DSC results using the developed SiO2/TiO2 PE architecture used 150
ALD cycles which is ca. 3.3 nm thick film of TiO2. The SiO2/TiO2-DSCs showed
better overall PV performance than reference DSCs using a commercial TiO2 paste:
(8.43 ± 0.20) % vs. (7.82 ± 0.05) % and 10 % higher transmittance in the visible range.
The increase in efficiency was ascribed to enhanced current density (14.6 ± 0.12 vs.
12.7 ± 0.08 mA·cm-2
) due to lower electron recombination and higher surface area. The
Chapter 7 229
Dye-sensitized Solar Cells: Improving Lifetime Stability and Performance
superior recombination resistance characteristics were attributed to lower
morphological defects and better dye coverage in the TiO2 ALD layer.
The TiO2 thin film displayed the same transport capabilities but less recombination
rates than conventional TiO2 nanoparticle films. Its effectiveness in preparing high
efficient DSCs depends only on appropriated scaffold films (i.e. large surface area) and
careful optimization of the ALD process (precursor pulse time and number of cycles).
The proposed architecture considers a SiO2 scaffold and coated with a very thin film
(ca. 3.3 nm) of TiO2 as semiconductor; therefore, it is expected that the overall
material costs for fabricating the proposed architecture are lower than when using pure
TiO2 nanoparticle films. The higher transmittance than the conventional mesoporous
TiO2 layer, makes the new PE more attractive to applications requiring semi-
transparency such as building integrated photovoltaics (BIPV).
7.2 Outlook for dye-sensitized solar cells
In 1991 O’Regan and Grätzel showed that dye sensitized solar cells could become
a potential competitor to other photovoltaic technologies1. Since then, the DSC
technology has struggled to stand out in the PV market mainly due to stability
constraints. The work portrayed in this thesis has brought a realistic solution to this
problem. The developed laser assisted glass sealing produces hermetic devices that are
stable under standard and extreme operating conditions. An interesting extension of the
laser assisted sealing is the adaptation of the process for sealing perovskite solar cells
(PSCs). PSCs are solid-state mesoscopic solar cells that employ an extremely efficient
sensitizer, CH3NH3PbI3, coupled with a solid hole transport material (HTM). The high
absorption of the perovskite film allowed ramping efficiencies from 3.81 % in 2012 to
an impressive 20.1 % in 2015, making this technology a serious competitor to silicon
based solar cells2,3
. However, PSC technology has yet to prove its stability in standard
operating conditions and at elevated temperatures4. With a certified efficiency of 20.1
%, PSCs future challenge will be its durability and stability, therefore making any

230 Concluding Remarks and Outlook
Dye-sensitized Solar Cells: Improving Lifetime Stability and Performance
suitable encapsulation method extremely valuable. The developed laser assisted sealing
should be adapted for sealing this type of devices; in particular the sealing temperature
(330 ºC) should be lowered at least to ca. 120 ºC. The use of a similar laser system
combined with an extremely low melting glass frit, alongside appropriate optimization
of the process parameters should allow sealing at ≤ 120 ºC where the PSCs inner
components are not damaged.
Concerning the fundamental understanding of the DSC operation, the used
phenomenological modeling was proven to be an invaluable tool for optimizing the
photoelectrode thickness in DSCs using commercial TiO2 films. It would be
particularly interesting to use the model to simulate the DSC operation using the newly
developed SiO2/TiO2 photoelectrode. The results should allow optimizing the PE
thickness and SiO2 size in the new DSC architecture and study opportunities to
increase conversion efficiency. Another important addition to the model should be the
influence of temperature. Chapter 4 shows that temperature has a preponderant effect
in the electron recombination reaction rate; in turn this process rules the overall
efficiency dependence on temperature. The obtained experimental data allowed
extracting the activation energies for the recombination reaction in TiO2/electrolyte and
SnO2-F/electrolyte interfaces. This effect is not taken into account in the
phenomenological model and should be included in the future. With this new feature,
the model can accurately predict the DSC behavior in more real operating
conditions. Furthermore, the recombination reaction activation energy should be
determined for the new SiO2/TiO2 architecture. Assessing different metal oxides in
place of TiO2 it should be possible to determine the metal oxide (or combination of
different metal oxides) that have the highest activation energy for recombination and
electrical conductivity and a suitable conduction band energy position. Promising
metal-oxides that can be processed by ALD include ZnO, SnO2 and Nb2O5. Doped
metal-oxides that should yield higher electrical conductivities than TiO2 are AZO and
TZO (ZnO doped with aluminum or titanium, respectively) 5, 6
and Nb-TiO2 (niobium
doped TiO2)7 .
Finally, a promising route to enhance the efficiency of the developed SiO2/TiO2
architecture is the substitution of the iodide redox electrolytes by cobalt redox

Chapter 7 231
Dye-sensitized Solar Cells: Improving Lifetime Stability and Performance
mediator. This new electrolyte shows negligible visible light absorption and is less
aggressive than iodine towards metallic conductors, such as Ag, Au and Cu, allowing
them to be used as current collectors in DSC modules. Most importantly cobalt redox
electrolyte have larger redox potential than iodine based electrolytes, allowing open
circuit voltages of ca. 1 V to be obtained8,9
. Unfortunately, cobalt based electrolytes
show recombination rates several orders of magnitude higher than iodine based
electrolytes10
; this led to the substitution of standard ruthenium dyes and to the
molecular design of new dyes (such as zinc porphyrin dyes, silyl-anchor dye and
carboxy-anchor dyes) that retard electron/electrolyte recombination given their better
surface coverage of the TiO2 nanoparticles11, 12
. Although these dyes resulted in record
efficient DSCs (12 % to 14 %) they require complex multi-step preparation processes
that can hinder the promise of low cost PV solution by DSCs. The new SiO2/TiO2
photoelectrode showed exceptional electron recombination resistance compared to
their nanoparticle counterparts; therefore it would be very interesting to see whether
standard ruthenium dyes in combination with cobalt redox mediators would work well
on this architecture, avoiding in this way the zinc porphyrin dyes which have
prohibitive high manufacturing costs.

232 Concluding Remarks and Outlook
Dye-sensitized Solar Cells: Improving Lifetime Stability and Performance
References
1. B. O'Regan and M. Grätzel, Nature, 1991, 353, 737-740.
2. N. J. Jeon, J. H. Noh, W. S. Yang, Y. C. Kim, S. Ryu, J. Seo and S. I. Seok,
Nature, 2015, 517, 476-480.
3. H. Zhou, Q. Chen, G. Li, S. Luo, T.-b. Song, H.-S. Duan, Z. Hong, J. You, Y.
Liu and Y. Yang, Science, 2014, 345, 542-546.
4. G. Niu, X. Guo and L. Wang, Journal of Materials Chemistry A, 2015.
5. D.-J. Lee, K.-J. Kim, S.-H. Kim, J.-Y. Kwon, J. Xu and K.-B. Kim, Journal of
Materials Chemistry C, 2013, 1, 4761-4769.
6. T. Tommi and K. Maarit, Semiconductor Science and Technology, 2014, 29,
043001.
7. A. K. Chandiran, F. d. r. Sauvage, M. Casas-Cabanas, P. Comte, S. M.
Zakeeruddin and M. Graetzel, The Journal of Physical Chemistry C, 2010, 114,
15849-15856.
8. S. M. Feldt, E. A. Gibson, E. Gabrielsson, L. Sun, G. Boschloo and A. Hagfeldt,
Journal of the American Chemical Society, 2010, 132, 16714-16724.
9. J.-H. Yum, E. Baranoff, F. Kessler, T. Moehl, S. Ahmad, T. Bessho, A.
Marchioro, E. Ghadiri, J.-E. Moser, C. Yi, M. K. Nazeeruddin and M. Grätzel,
Nat Commun, 2012, 3, 631.
10. L. E. Polander, A. Yella, B. F. E. Curchod, N. Ashari Astani, J. Teuscher, R.
Scopelliti, P. Gao, S. Mathew, J.-E. Moser, I. Tavernelli, U. Rothlisberger, M.
Grätzel, M. K. Nazeeruddin and J. Frey, Angewandte Chemie International
Edition, 2013, 52, 8731-8735.
11. A. Yella, H.-W. Lee, H. N. Tsao, C. Yi, A. K. Chandiran, M. K. Nazeeruddin, E.
W.-G. Diau, C.-Y. Yeh, S. M. Zakeeruddin and M. Grätzel, Science, 2011, 334,
629-634.
12. K. Kakiage, Y. Aoyama, T. Yano, K. Oya, J.-i. Fujisawa and M. Hanaya, Chem.
Commun., 2015.

APPENDIX
Appendix A. Design of Experiments: Design matrix with coded and
actual values
Appendix B. Developed LabVIEW control panel interfaces
Appendix C. Atomic layer deposition (ALD) operation details
Appendix D. Estimation of minimum TIP pulse time for complete
coverage of SiO2 scaffold layer with TiO2

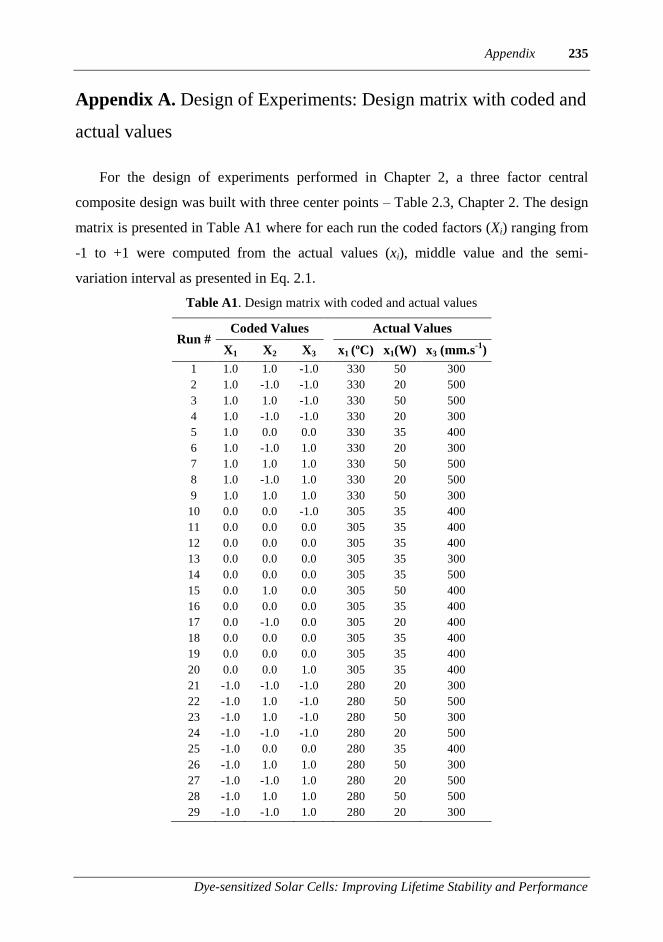
Appendix 235
Dye-sensitized Solar Cells: Improving Lifetime Stability and Performance
Appendix A. Design of Experiments: Design matrix with coded and
actual values
For the design of experiments performed in Chapter 2, a three factor central
composite design was built with three center points – Table 2.3, Chapter 2. The design
matrix is presented in Table A1 where for each run the coded factors (Xi) ranging from
-1 to +1 were computed from the actual values (xi), middle value and the semi-
variation interval as presented in Eq. 2.1.
Table A1. Design matrix with coded and actual values
Run # Coded Values Actual Values
X1 X2 X3 x1 (ºC) x1(W) x3 (mm.s-1
)
1 1.0 1.0 -1.0 330 50 300
2 1.0 -1.0 -1.0 330 20 500
3 1.0 1.0 -1.0 330 50 500
4 1.0 -1.0 -1.0 330 20 300
5 1.0 0.0 0.0 330 35 400
6 1.0 -1.0 1.0 330 20 300
7 1.0 1.0 1.0 330 50 500
8 1.0 -1.0 1.0 330 20 500
9 1.0 1.0 1.0 330 50 300
10 0.0 0.0 -1.0 305 35 400
11 0.0 0.0 0.0 305 35 400
12 0.0 0.0 0.0 305 35 400
13 0.0 0.0 0.0 305 35 300
14 0.0 0.0 0.0 305 35 500
15 0.0 1.0 0.0 305 50 400
16 0.0 0.0 0.0 305 35 400
17 0.0 -1.0 0.0 305 20 400
18 0.0 0.0 0.0 305 35 400
19 0.0 0.0 0.0 305 35 400
20 0.0 0.0 1.0 305 35 400
21 -1.0 -1.0 -1.0 280 20 300
22 -1.0 1.0 -1.0 280 50 500
23 -1.0 1.0 -1.0 280 50 300
24 -1.0 -1.0 -1.0 280 20 500
25 -1.0 0.0 0.0 280 35 400
26 -1.0 1.0 1.0 280 50 300
27 -1.0 -1.0 1.0 280 20 500
28 -1.0 1.0 1.0 280 50 500
29 -1.0 -1.0 1.0 280 20 300

236 Appendix
Dye-sensitized Solar Cells: Improving Lifetime Stability and Performance
Appendix B. Developed LabVIEW Control panel interfaces
Figure B.1 LabVIEW control panel interface of the LaserBox heating plate.

Appendix 237
Dye-sensitized Solar Cells: Improving Lifetime Stability and Performance
Figure B.2 LabVIEW control panel interface of the LaserBox IPG laser.

238 Appendix
Dye-sensitized Solar Cells: Improving Lifetime Stability and Performance
Figure B.3 LabVIEW control panel interface for the temperature control of an under illumination DSC.

Appendix 239
Dye-sensitized Solar Cells: Improving Lifetime Stability and Performance
Appendix C. Atomic layer deposition (ALD) operation details
The ALD relies on surface reactions that require precursors to diffuse and
chemically adsorb in monolayer to the target surface. Therefore, it is essential that
there is no gas mixture between both precursors in the reactor volume. The ALD
deposition was conducted with a Beneq TFS 200 system. Figure C.1 sketches the
experimental setup. The main elements of the ALD device comprise the carrier gas
flow system, precursor containers, vacuum chamber, reaction chamber and a vacuum
pump (Alcatel Adixen 2033C2). The ALD deposition is conducted using constant flow
of nitrogen as carrier gas. The nitrogen feed is divided into two lines, in which the
flowrate is controlled by two mass flow controllers (MFC-R and MFC-C). MFC-C
controls nitrogen that flows through the vacuum chamber and MFC-R controls the flow
used as carrier gas to the reactor. Nitrogen flowrates set by MFC-R and MFC-C
determine the base pressures of the reactor and vacuum chamber.
During a typical operation, nitrogen is fed to the vacuum chamber that encloses the
reactor. The reactor has a small aperture to the vacuum chamber and only the reactor is
connected to the vacuum pump, as illustrated in Figure C.1. Therefore MFC-C sets the
nitrogen flow, and then the pressures at the vacuum chamber and at the reactor; the
pressure at the vacuum chamber is always higher than at the reactor. This prevents the
precursors from escaping the reactor to the vacuum chamber. The vacuum pump is
separated from the reactor by two pneumatic valves: DV-P1 for large flowrates and
DV-P2 for accurate flowrate control. Between the reactor and DV-P1 and DV-P2, a
particle filter is installed to prevent any solids to flow into the vacuum pump.
The precursors are enclosed in temperature controlled steel canisters that are
connected to the flow system through hand valves and pneumatic valves. Each
precursor has its carrier feeding line after MFC-R, and each one is connected to the
reactor (represented as light blue for TIP and green tubing for H2O). Each precursor
can flow to the reaction chamber based on its vapor pressure or driven using a carrier
gas. In the first mode, the precursor is pulsed into the reactor by opening the pneumatic
pulsing valves (DV-PL1 for H2O, or DV-PH1 for TIP). This mode requires that the
precursors have a vapor pressure higher than the working pressure of the reactor. When

240 Appendix
Dye-sensitized Solar Cells: Improving Lifetime Stability and Performance
the precursor vapor pressure is lower than the reactor pressure, the carrier assisted
mode is used: the carrier gas is pressurized inside the container (DV-BL1 for H2O and
DV-BH1 and DV-BHA1 for TIP) and pulsed (DV-PL1 for H2O, or DV-PH1 for TIP)
to the reactor.
Figure C.1 Sketch of the experimental setup for the atomic layer deposition process
of TiO2 using titanium isopropoxide and water.
Figure C.2 shows the vapor pressure of TIP and H2O as a function of temperature,
calculated using the Antoine equation1. Because of its high vapor pressure at room
temperature (~20 mbar @ 20 °C), H2O was pulsed using its own vapor pressure (TI-S1
= 20 ºC). In turn, since the TIP has a much lower vapor pressure at room temperature,
the temperature of the TIP container was set to 50 ºC (TC-SC2), where the pressure

Appendix 241
Dye-sensitized Solar Cells: Improving Lifetime Stability and Performance
vapor is ca. 1 mbar, and the carrier gas mode had to be used (charging time of ΔtTIP,1 =
1 s).
Figure C.2 Vapor pressure of water and titanium (IV) isopropoxide dependence
with temperature. Values were determined using Antoine equation with coefficients
given in reference A1
.
Figure C.3 illustrates the experimental procedure used for the atomic layer
deposition of TiO2. The procedure involves sequential pulsing/purging of each
precursor into the reaction chamber. Each cycle comprises the following steps: pulse
TIP; purge TIP; pulse H2O and purge H2O. The sequence is repeated n times to obtain
the desired TiO2 thickness.

242 Appendix
Dye-sensitized Solar Cells: Improving Lifetime Stability and Performance
Figure C.3 Schematic representation of the ALD process operation according to the
experimental setup presented in Figure C1.
Table C1 shows the operating variables used for the deposition of TiO2 on FTO
substrates. The TIP to water pulse time ratio, the TIP to water purge time ratio and the
water purge to pulse time ratio were kept constant:
Δ𝑡TIP,2
Δ𝑡H2O,1= 2 (C.1)
𝑡purge,TIP
Δ𝑡TIP,2= 10 (C.2)
𝑡purge,H2O
Δ𝑡H2O,1= 3 (C.3)

Appendix 243
Dye-sensitized Solar Cells: Improving Lifetime Stability and Performance
Table C.1 ALD process conditions for TiO2 deposition on FTO glasses using
C12H28O4Ti (TIP) and H2O as metal and oxidizing sources, respectively.
Process unit Description Variable units value
Reactor/vacuum
chamber
flowrate (chamber) MFC-C cm3·s-1 10
flowrate (reactor) MFC-R cm3·s-1 5
temperature TC-R ºC 225
working pressure PT-V1 mbar 1
TIP source
temperature TC-S2 ºC 50
charge time ΔtTIP,1 s 1
pulse time ΔtTIP,2 s 2
purge time tpurge, TIP s 20
H2O source
temperature TI-S1 ºC 20
pulse time ΔtH2O,1 s 1
purge time tpurge, H2O s 3
Figure C.4 shows the pressure history for the operating variables shown in Table
C.1. The base pressures of the reactor and of the vacuum chamber were constant,
respectively 1.2 and 5.4 mbar. The alternate pulse of TIP and water originate pressure
pulses of ca. 11 and 23 mbar, respectively; these values are in line with the water vapor
pressure at 20 ºC and with TIP vapor pressure at 50 ºC added of the carrier gas
overpressure.

244 Appendix
Dye-sensitized Solar Cells: Improving Lifetime Stability and Performance
Figure C.4 Pressure monitoring during ALD operation. The process parameters are detailed in
Table C.1

Appendix 245
Dye-sensitized Solar Cells: Improving Lifetime Stability and Performance
Appendix D. Estimation of minimum TIP pulse time for complete
coverage of SiO2 scaffold layer with TiO2 film
Figure D.1. shows the N2 adsorption/desorption isotherms obtained for the SiO2
nanoparticle powder. The BET surface area and BHJ average pore sizes are also
presented.
Figure D.1 Nitrogen adsorption / desorption isotherms performed in SiO2 powder; values of
BET surface area and BHJ pore size analysis are also presented.
The surface area of the SiO2 layer is determined by it porosity and pore size.
Considering uniform and spherical pores with diameter dp, then the surface (Sp) to
volume (Vp) ratio is given by:
𝑆p
𝑉p=
6
dp (D.1)
Assuming that the surface area of the SiO2 layer (As) is approximately the surface
area of its pores, and the volume of the pores is given by Vp = ε ·V, where ε is the

246 Appendix
Dye-sensitized Solar Cells: Improving Lifetime Stability and Performance
porosity of the SiO2 layer and V its volume, then the average pore size of the SiO2 layer
is given by:
𝑑p =6 · 𝜀 · 𝑉
𝑆p (D.2)
The porosity of the SiO2 layer was determined from:
𝜀 = 1 −𝜌SiO2 film
𝜌SiO2 particle
(D.3)
where 𝝆SiO2 particle = 2.5 g·cm-3
, 𝝆SiO2 film = (0.98 ± 0.03 ) g·cm-3
, ε = 0.63 ± 0.09
and As = 160 m2·g
-1. The mass was obtained using an analytical balance (Radwag
® AS
60/220/C/2).
Table D.1 shows the calculated dp and minimum TIP pulse time for complete
coverage of the SiO2 porous layer taking into account pore reduction due to the TiO2
film thickness coated by ALD.
Table D.1 Minimum TIP pulse time, 𝜏minp
, for complete coverage of the SiO2
porous layer taking into account pore size reduction by the TiO2 film thickness
coated by ALD
TiO2 deposited dp / nm
Pore
occlusion % Dk / cm
2·s
-1 DTIP/ cm
2·s
-1 𝝉𝐦𝐢𝐧
𝐩 / s
No ALD cycles thickness / nm
0 0 21.1 0.0 1.39×10⁻²
5.97×10⁻³
17.6
40.0 0.90 19.4 8.30 1.27×10⁻²
5.48×10⁻³
19.2
70.0 1.50 18.0 14.6 1.19×10⁻²
5.10×10⁻³
20.6
100 2.20 16.7 20.8 1.10×10⁻²
4.73×10⁻³
22.2
140 3.08 14.9 29.2 9.83×10⁻³
4.23×10⁻³
24.8
150 3.30 14.5 31.3 9.54×10⁻³
4.11×10⁻³
25.6
160 3.52 14.1 33.4 9.25×10⁻³
3.98×10⁻³
26.3
175 3.85 13.4 36.5 8.82×10⁻³
3.79×10⁻³
27.7
200 4.40 12.3 41.7 8.10×10⁻³
3.48×10⁻³
30.1
References
A1. J. Dykyj, J. Svoboda, R. C. Wilhoit, M. Frenkel and K. R. Hall, Vapor
Pressure and Antoine Constants for Oxygen Containing Organic Compounds,
Springer Berlin Heidelberg, 2000.