Enhancing Photoactivity of TiO 2 (B)/Anatase Core-Shell Nanofibers by Selectively Doping Cerium Ions...
7
DOI: 10.1002/chem.201202719 Enhancing Photoactivity of TiO 2 (B)/Anatase Core–Shell Nanofibers by Selectively Doping Cerium Ions into the TiO 2 (B) Core Dongjiang Yang,* [a, b] Jian Zhao, [b] Hongwei Liu, [b] Zhanfeng Zheng, [b] Moses O. Adebajo, [b] Hongxia Wang, [b] Xiaotang Liu, [c] Hongjie Zhang, [d] Jin-cai Zhao,* [e] John Bell, [b] and Huaiyong Zhu* [b] Introduction Titanium dioxide (TiO 2 ) is the most studied photocatalyst material owing to its chemical stability, low cost, and non- toxicity. [1–3] TiO 2 photocatalysts can absorb photons with an energy larger than or equal to their bandgap energy so elec- trons in the valence band are excited to the conduction band, leaving holes in the valence band. The separated charges (electrons and holes) migrate to the solid surface and cause reduction and oxidation of species on the sur- face. [1, 4, 5] Hence, a key issue for the photocatalytic activity of TiO 2 solids is efficiently separating the photogenerated charge as the fate of most photogenerated charges is to quench—the photogenerated electrons and holes recombine releasing heat—and a small fraction of them induces chemi- cal reactions on the surface of the photocatalyst. It has been reported that doping various metal atoms/metal ions into pure TiO 2 of the anatase phase could enhance separation of photogenerated charges and thus allow more charges to par- ticipate in redox reactions on the photocatalyst surface, thereby improving its photoactivity. [6–13] Moreover, solids with mixed anatase and rutile phases, such as Degussa P25, exhibit much higher photocatalytic activity than the solids of either pure anatase or rutile phases in many reactions. The superior activity is also attributed to the efficient charge separation at the interface between the two phases. [14–17] Abstract: Cerium ions (Ce 3 +) can be selectively doped into the TiO 2 (B) core of TiO 2 (B)/anatase core–shell nanofi- ACHTUNGTRENNUNGbers by means of a simple one-pot hy- drothermal treatment of a starting ma- terial of hydrogen trititanate (H 2 Ti 3 O 7 ) nanofibers. These Ce 3 + ions (0.202 nm) are located on the (110) lattice planes of the TiO 2 (B) core in tunnels (width 0.297 nm). The intro- duction of Ce 3 + ions reduces the de- fects of the TiO 2 (B) core by inhibiting the faster growth of (110) lattice planes. More importantly, the redox potential of the Ce 3 + /Ce 4 + couple (E8(Ce 3+ /Ce 4+ ) = 1.715 V versus the normal hydrogen electrode) is more negative than the valence band of TiO 2 (B). Therefore, once the Ce 3 + -doped nanofibers are irradiated by UV light, the doped Ce 3 + ions—in close vicinity to the interface between the TiO 2 (B) core and anatase nano- shell—can efficiently trap the photo- generated holes. This facilitates the mi- gration of holes from the anatase shell and leaves more photogenerated elec- trons in the anatase nanoshell, which results in a highly efficient separation of photogenerated charges in the ana- tase nanoshell. Hence, this enhanced charge-separation mechanism acceler- ates dye degradation and alcohol oxi- dation processes. The one-pot treat- ment doping strategy is also used to se- lectively dope other metal ions with variable oxidation states such as Co 2 + /3 + and Cu +/2 + ions. The doping sub- stantially improves the photocatalytic activity of the mixed-phase nanofibers. In contrast, the doping of ions with an invariable oxidation state, such as Zn 2 + , Ca 2 + , or Mg 2 + , does not enhance the photoactivity of the mixed-phase nano- fibers as the ions could not trap the photogenerated holes. Keywords: cerium · doping · nano- structures · photocatalysts · tita- nates [a] Prof. D. Yang College of Chemistry, Chemical and Environmental Engineering Laboratory of Fiber Materials and Modern Textile the Growing Base for State Key Laboratory Qingdao University, Qingdao 266071 (P.R. China) E-mail : [email protected] [b] Prof. D. Yang,Dr. J. Zhao, Dr. H. Liu, Dr. Z. Zheng, Dr. M.O. Adebajo, Dr. H. Wang, Prof. J. Bell, Prof. H. Zhu Discipline of Chemistry, Queensland University of Technology GPO Box 2434, Brisbane, QLD 4001 (Australia) Fax: (+ 61) 7-3138-1804 E-mail: [email protected] [c] Prof. X. Liu College of Sciences, South China Agricultural University Guangzhou 510642 (P.R. China) [d] Prof. H. Zhang Changchun Institute of Applied Chemistry Chinese Academy of Sciences Changchun, 130022 (P.R. China) [e] Prof. J.-c. Zhao Institute of Chemistry, The Chinese Academy of Science Beijing 100080 (P.R. China) E-mail: [email protected] Supporting information for this article is available on the WWW under http://dx.doi.org/10.1002/chem.201202719. Chem. Eur. J. 2013, 19, 5113 – 5119 # 2013 Wiley-VCH Verlag GmbH&Co. KGaA, Weinheim 5113 FULL PAPER
Transcript of Enhancing Photoactivity of TiO 2 (B)/Anatase Core-Shell Nanofibers by Selectively Doping Cerium Ions...

DOI: 10.1002/chem.201202719
Enhancing Photoactivity of TiO2(B)/Anatase Core–Shell Nanofibers bySelectively Doping Cerium Ions into the TiO2(B) Core
Dongjiang Yang,*[a, b] Jian Zhao,[b] Hongwei Liu,[b] Zhanfeng Zheng,[b]
Moses O. Adebajo,[b] Hongxia Wang,[b] Xiaotang Liu,[c] Hongjie Zhang,[d]
Jin-cai Zhao,*[e] John Bell,[b] and Huaiyong Zhu*[b]
Introduction
Titanium dioxide (TiO2) is the most studied photocatalystmaterial owing to its chemical stability, low cost, and non-toxicity.[1–3] TiO2 photocatalysts can absorb photons with anenergy larger than or equal to their bandgap energy so elec-trons in the valence band are excited to the conductionband, leaving holes in the valence band. The separatedcharges (electrons and holes) migrate to the solid surfaceand cause reduction and oxidation of species on the sur-face.[1,4,5] Hence, a key issue for the photocatalytic activityof TiO2 solids is efficiently separating the photogeneratedcharge as the fate of most photogenerated charges is toquench—the photogenerated electrons and holes recombinereleasing heat—and a small fraction of them induces chemi-cal reactions on the surface of the photocatalyst. It has beenreported that doping various metal atoms/metal ions intopure TiO2 of the anatase phase could enhance separation ofphotogenerated charges and thus allow more charges to par-ticipate in redox reactions on the photocatalyst surface,thereby improving its photoactivity.[6–13] Moreover, solidswith mixed anatase and rutile phases, such as Degussa P25,exhibit much higher photocatalytic activity than the solids ofeither pure anatase or rutile phases in many reactions. Thesuperior activity is also attributed to the efficient chargeseparation at the interface between the two phases.[14–17]
Abstract: Cerium ions (Ce3+) can beselectively doped into the TiO2(B) coreof TiO2(B)/anatase core–shell nanofi-ACHTUNGTRENNUNGbers by means of a simple one-pot hy-drothermal treatment of a starting ma-terial of hydrogen trititanate (H2Ti3O7)nanofibers. These Ce3+ ions(�0.202 nm) are located on the (110)lattice planes of the TiO2(B) core intunnels (width�0.297 nm). The intro-duction of Ce3+ ions reduces the de-fects of the TiO2(B) core by inhibitingthe faster growth of (110) latticeplanes. More importantly, the redoxpotential of the Ce3+/Ce4+ couple(E8(Ce3+/Ce4+)= 1.715 V versus thenormal hydrogen electrode) is more
negative than the valence band ofTiO2(B). Therefore, once the Ce3+
-doped nanofibers are irradiated byUV light, the doped Ce3+ ions—inclose vicinity to the interface betweenthe TiO2(B) core and anatase nano-shell—can efficiently trap the photo-generated holes. This facilitates the mi-gration of holes from the anatase shelland leaves more photogenerated elec-trons in the anatase nanoshell, whichresults in a highly efficient separation
of photogenerated charges in the ana-tase nanoshell. Hence, this enhancedcharge-separation mechanism acceler-ates dye degradation and alcohol oxi-dation processes. The one-pot treat-ment doping strategy is also used to se-lectively dope other metal ions withvariable oxidation states such as Co2+
/3+ and Cu+ /2+ ions. The doping sub-stantially improves the photocatalyticactivity of the mixed-phase nanofibers.In contrast, the doping of ions with aninvariable oxidation state, such as Zn2+
, Ca2+ , or Mg2+ , does not enhance thephotoactivity of the mixed-phase nano-fibers as the ions could not trap thephotogenerated holes.
Keywords: cerium · doping · nano-structures · photocatalysts · tita-nates
[a] Prof. D. YangCollege of Chemistry, Chemical and Environmental EngineeringLaboratory of Fiber Materials and Modern Textilethe Growing Base for State Key LaboratoryQingdao University, Qingdao 266071 (P.R. China)E-mail : [email protected]
[b] Prof. D. Yang, Dr. J. Zhao, Dr. H. Liu, Dr. Z. Zheng,Dr. M. O. Adebajo, Dr. H. Wang, Prof. J. Bell, Prof. H. ZhuDiscipline of Chemistry, Queensland University of TechnologyGPO Box 2434, Brisbane, QLD 4001 (Australia)Fax: (+61) 7-3138-1804E-mail : [email protected]
[c] Prof. X. LiuCollege of Sciences, South China Agricultural UniversityGuangzhou 510642 (P.R. China)
[d] Prof. H. ZhangChangchun Institute of Applied ChemistryChinese Academy of SciencesChangchun, 130022 (P.R. China)
[e] Prof. J.-c. ZhaoInstitute of Chemistry, The Chinese Academy of ScienceBeijing 100080 (P.R. China)E-mail : [email protected]
Supporting information for this article is available on the WWWunder http://dx.doi.org/10.1002/chem.201202719.
Chem. Eur. J. 2013, 19, 5113 – 5119 � 2013 Wiley-VCH Verlag GmbH & Co. KGaA, Weinheim 5113
FULL PAPER

Therefore, we infer that if we can selectively dope onephase of a mixed-phase systems with cations that can en-hance the charge separation, the contribution to the chargeseparation from the doped cations and the phase interfacemay combine together, and more efficient photocatalystsmay be obtained. Clearly, it is a challenging task to dopeonly one phase of two mixed TiO2 phases. However, such adelicate structure of a doped phase and an undoped phasemay also be interesting for applications other than photocat-ACHTUNGTRENNUNGa ACHTUNGTRENNUNGlysts. The key issue of the combination approach to deliverimproved performance is dependent on the choice of cationsand the mixed-phase systems.
Anatase and rutile phases have been widely stud-ied.[14, 15,18,19] In contrast, only a few studies have been re-ported on the photoreactivity of TiO2(B)[20–23]—a metastablemonoclinic polymorph of TiO2—and solids of mixedTiO2(B) and anatase phases.[16,24] In our recent study, deli-cate TiO2 nanofibers with a single-crystal TiO2(B) core anda shell of anatase nanocrystals were prepared from hydro-gen trititanate (H2Ti3O7, abbreviated as T3(H)) nanofibersby means of a two-step hydrothermal reaction approach.[16]
These mixed-phase nanofibers are more photoactive thancatalysts of either pure anatase or pure TiO2(B). The mixed-phase structure is able to promote irreversible hole transferfrom the anatase phase to the TiO2(B) phase, which resultsin higher photoactivity. These mixed-phase nanofibers werechosen to selectively dope the TiO2(B) phase of the fiberswith proper cations to further enhance charge separationand, thus, the photocatalytic performance as hypothesized.The hydrogen trititanate phase has a layered structure withprotons existing in between the negatively charged layers.Cations can be introduced into the interlayer space by ionexchange with protons. Also, the nanofibers of this phasecan be partially or completely converted to anatase nano-crystals, depending on the reaction conditions.[25] This allowsus to obtain a com ACHTUNGTRENNUNGposite structure of T3(H) nanofiberscoated with a shell of anatase nanocrystals from the pristinehydrogen trititanate fibers by a carefully controlled hydro-thermal treatment in acidic media. Cations can be intro-duced into the titanate core of the composite structure byion exchange as the anatase crystals in the shell have nocation-exchange ability. This highlights, therefore, an oppor-tunity: we may selectively dope metal cations into the tita-nate core of the composite fibers and then convert thisdoped phase into the TiO2(B) phase simply by heating at723 K to produce nanofibers with a metal-ion-dopedTiO2(B) core and a shell of anatase nanocrystals.
In the present study, a one-pot treatment was developedto selectively dope cerium ions (Ce3+) into the TiO2(B) coreof the mixed-phase nanofibers as the Ce3+ ions are stable inthe acidic media required for the formation of anatase nano-crystals coated on the fibril titanate core. The hydrogen tri-ACHTUNGTRENNUNGtitanate nanofibers were first treated in an aqueous solutionof Ce ACHTUNGTRENNUNG(NO3)3 (8� 10�5–8 � 10�3
m) and HNO3 (0.05 m) underhydrothermal conditions (373 K). During this process, ana-tase nanocrystals formed on the surface of the nanofibersdue to the dehydration of the surface region of the hydrogen
trititanate; meanwhile, the Ce3+ ions diffused into the tita-nate core of the fibers by means of ion exchange with pro-tons. The doped titanate core was then converted to theTiO2(B) phase by calcination at 723 K while the fibril mor-phology and the anatase crystals on the fiber surface re-mained unchanged. Characterization results also show thatwhen Ce3+ ions were doped on the anatase nanocrystals ofthe shell by using this approach, a clear decrease in the pho-tocatalytic activity of the mixed-phase nanofibers was ob-served.
Results and Discussion
TEM and XRD : Figure 1 displays the typical TEM imagesof three nanofiber samples. As shown in Figure 1a–c, a largeamount of anatase nanocrystals—white and like fish
scales—are coated on the surface of the nanofibers. Ce2O3/CeO2 nanoparticles are observed on the anatase nanocrystalshell of the samples treated by the post-phase-transitionmethod, for example, T(AB)Ce04_P fiber (Figure 1b). Incontrast, such Ce2O3/CeO2 particles are not found in theT(AB)Ce04 sample treated by a one-pot approach (Fig-ure 1c). The high-resolution TEM (HRTEM) images (Fig-
Figure 1. TEM images of the mixed-phase nanofibers: a) undopedT(AB), b) post-phase synthesized T(AB)Ce04_P, and c) one-pot dopedT(AB)Ce04. Inset: EDX patterns of T(AB)Ce04_P and T(AB)Ce04.HRTEM images of d) T(AB), e) T(AB)Ce04_P, and f) T(AB)Ce04. IFFTimage g) corresponds to the selected area in d); image h) to that in e);and image i) to that in f). Arrows indicate the dislocation defects in theTiO2(B) phase.
www.chemeurj.org � 2013 Wiley-VCH Verlag GmbH & Co. KGaA, Weinheim Chem. Eur. J. 2013, 19, 5113 – 51195114

ure 1d–f) and the inverse fast Fourier transform (IFFT)images of the selected areas (Figure 1g–i) also reveal moresubtle structural changes induced by the introduction ofCe3+ ions. Numerous defects are observed in the TiO2(B)core from undoped T(AB) nanofiber (Figure 1g). The post-phase-transition doping cannot have an effect on theTiO2(B) core because the introduced Ce3+ ions are locatedon the surface of the anatase shell. In contrast, the Ce3+
ions selectively doped into the TiO2(B) core by one-pottreatment clearly reduce the dislocations (line defects), andthus most of the defects disappear (Figure 1i). Evidently, theintroduction of trace Ce3+ ions improves the crystallinity ofthe TiO2(B) phase. Given that the numerous dislocations inTiO2(B) are from the faster growth of (110) lattice planesduring the phase-transformation process,[26] and the intro-duced Ce3+ ions can inhibit the phase transformation ofTiO2 crystals,[27,28] some of the doped Ce3+ ions should be lo-cated on the (110) lattice plane so that they are able to de-press the lattice growth and thus, reduce the dislocations.
Figure 2 shows XRD patterns of the TiO2 nanofiber sam-ples prepared by different approaches. Diffractions from theanatase phase (JCPDS 21-1272) and TiO2(B) phase (JCPDS74-1940) are observed in all samples prepared by one-potsynthesis (Figure 2a), which indicates that these nanofibersare of mixed anatase and TiO2(B) phases. The diffractionpeaks of the anatase phase are labeled A* and those ofTiO2(B) are labeled B*. The molar ratio between TiO2(B)and the anatase phase is about 3:1, which was estimated
from the intensity ratio (I33.48/I37.88) of the peak at 33.48 tothe peak at 37.88 and using a calibration curve. The twopeaks correspond to the (3̄11) plane of TiO2(B) and (004)plane of anatase, respectively. The patterns of Ce3+-dopedsamples are similar to those of undoped fibers, T(AB),which suggests that the doping of trace Ce3+ ions did notinduce the formation of any new crystal phase. For samplesprepared by the post-phase-transition doping method—T(AB)Ce05_P, T(AB)Ce04_P, and T(AB)Ce03_P—the dif-fraction intensity of the anatase phase decreases evidentlyas more Ce3+ ions were doped (Figure 2b), especially thepeaks corresponding to the (101), (004), (105), and (211)planes. However, there is no clear change in the diffractionintensity of the peaks from the TiO2(B) phase. This suggeststhat the doped Ce3+ ions mainly exist in the anatase shell.This is reasonable because the post-phase-transition dopingstrategy is developed using the mixed-phase T(AB) nanofi-ACHTUNGTRENNUNGbers as starting materials. The Ce3+ ions are inclined to de-posit on the external anatase surface forming cerium oxideand cannot diffuse into the TiO2(B) core.
X-ray photoelectron (XPS), photoluminescence (PL), anddiffuse reflectance (DR) UV-visible spectra : Figure 3ashows the Ce 3d XPS spectra of T(AB)Ce03 andT(AB)Ce03_P. The representative photoelectron peaks ofCe 3d were observed from the spectrum of T(AB)Ce03_P.
Figure 2. XRD patterns of Ce3+-doped mixed-phase TiO2 nanofibers ob-tained by a) the one-pot treatment, and b) the post-phase-transition ap-proach.
Figure 3. a) Ce 3d XPS spectra of one-pot doped T(AB)Ce03 and post-phase synthesized T(AB)Ce03_P. b) PL spectrum of Eu3+-doped mixed-phase nanofibers prepared by one-pot treatment. Inset: the excitationspectrum monitored at 613 nm.
Chem. Eur. J. 2013, 19, 5113 – 5119 � 2013 Wiley-VCH Verlag GmbH & Co. KGaA, Weinheim www.chemeurj.org 5115
FULL PAPERPhotoactivity of TiO2(B)/Anatase
This means the doped Ce3+ ions obtained by means of thepost-phase-transition approach were located at the externalanatase shell as the XPS technique can only probe the ele-mental composition of the surface region (<10 nm thick).The clear u’/v’ doublet pertains to photoemission from theCe3+ ion, and the weak u/v doublet is assigned to the photo-emission from the Ce4+ ion. This indicates that the dopedCe exists as a mixture of Ce2O3 and CeO2.
[10] However, theCe 3d photoemission signal was not observed from the spec-trum of sample T(AB)Ce03, which is obtained by using theone-pot doping method. This also means the Ce3+ ionsdoped by one-pot treatment are located inside the TiO2(B)core rather than in the external anatase shell.
To further verify the location of the doped Ce3+ ions inthe nanofibers of a TiO2(B) core and anatase shell preparedusing one-pot treatment, Eu3+ ions (instead of Ce3+ ions)were introduced into the fibers by using the same one-pot
doping method. Eu3+ ions can provide a strong photolumi-nescence signal that is affected by the crystal lattice. Thesignal can be used to determine which phase the Eu3+ ionsexist in. The fluorescent excitation and emission spectra ofEu3+-doped mixed-phase nanofibers are shown in Figure 3b.The excitation spectrum of Eu3+ (inset) is composed of twoabsorption bands: one at 394 nm caused by electronic transi-tions corresponding to 7F0–
5L6, and one at 468 nm corre-sponding to the 7F0–
5D2 transition. Additionally, the emis-sion spectrum excited by the 394 nm light is similar to thatexcited by the 464 nm light. The sharp peaks ranging from560 to 720 nm are intense characteristic emissions of Eu3+ ,which are caused by the 5D0–
7FJ (J=1–4) transitions of Eu3+
ions. The dominant peak in the spectra is located at 614 nmand corresponds to the Eu3+ electric dipole transition of5D0–
7F2, which illustrates that there is no inversion symmetryat the site of the Eu3+ ions.[29] In other words, the ions existin an unsymmetrical structure. Given that TiO2(B) has amonoclinic structure, and space group C2/m, a typical un-symmetrical structure, the PL result indicates that Eu3+ ionsshould be selectively doped into the TiO2(B) phase. This isconsistent with the result from XPS analysis.
Figure 4 shows the DR-UV-visible spectra of the samples.A slight blueshift is observed for T(AB)Ce04 andT(AB)Ce05 (samples obtained by the one-pot dopingmethod) compared with the spectrum of the undopedsample T(AB) fibers. Such a slight blueshift could be attrib-uted to the reduction of defects in the TiO2(B) phase. Forthe samples prepared using post-phase-transition doping,the absorption edge shifts towards longer wavelengths (Fig-ure 4b). This is due to the transition of Ce 4f electrons as re-ported in the literature.[30,31]
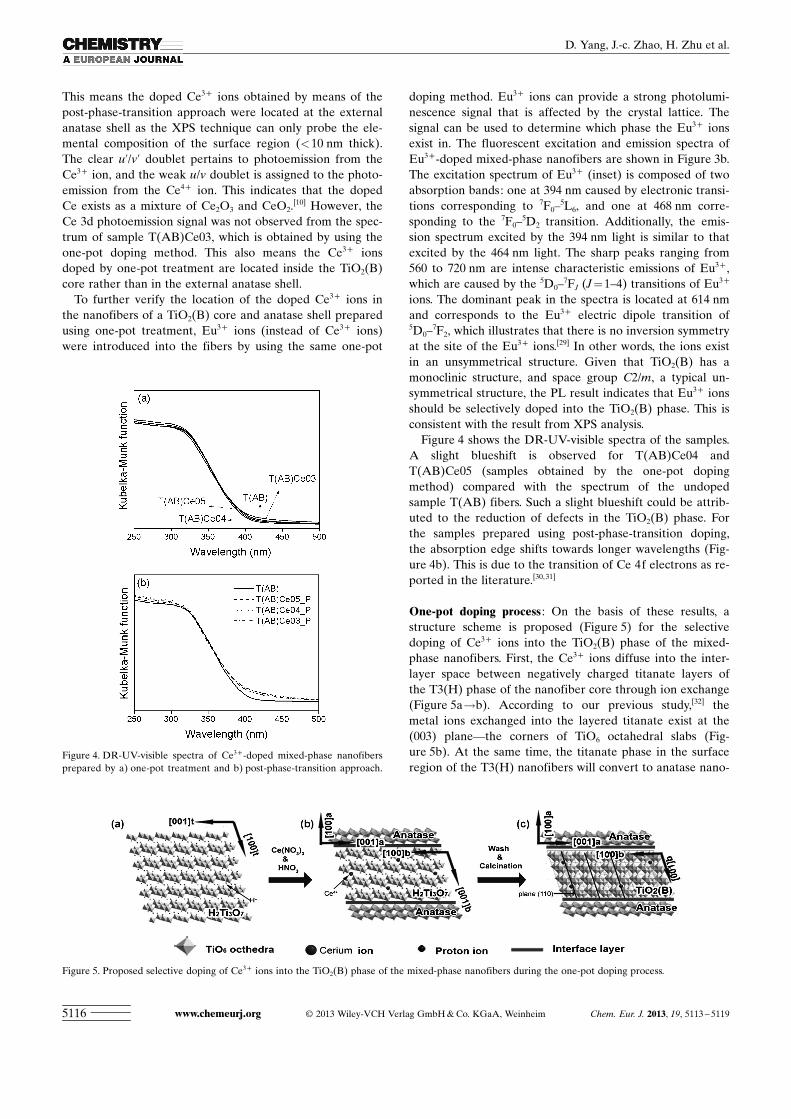
One-pot doping process : On the basis of these results, astructure scheme is proposed (Figure 5) for the selectivedoping of Ce3+ ions into the TiO2(B) phase of the mixed-phase nanofibers. First, the Ce3+ ions diffuse into the inter-layer space between negatively charged titanate layers ofthe T3(H) phase of the nanofiber core through ion exchange(Figure 5a!b). According to our previous study,[32] themetal ions exchanged into the layered titanate exist at the(003) plane—the corners of TiO6 octahedral slabs (Fig-ure 5b). At the same time, the titanate phase in the surfaceregion of the T3(H) nanofibers will convert to anatase nano-
Figure 4. DR-UV-visible spectra of Ce3+-doped mixed-phase nanofibersprepared by a) one-pot treatment and b) post-phase-transition approach.
Figure 5. Proposed selective doping of Ce3+ ions into the TiO2(B) phase of the mixed-phase nanofibers during the one-pot doping process.
www.chemeurj.org � 2013 Wiley-VCH Verlag GmbH & Co. KGaA, Weinheim Chem. Eur. J. 2013, 19, 5113 – 51195116
D. Yang, J.-c. Zhao, H. Zhu et al.

crystals due to the acidic environment.[16,25] It is very difficultfor the Ce3+ dopants to be incorporated into the lattice ofanatase nanocrystals because of the large difference be-tween the ionic radii of Ce3+ (0.101 nm) and Ti4+
(0.068 nm).[33] Then, the unconverted core of the T3(H)nanofibers will transform to the TiO2(B) phase in the subse-quent calcination at 723 K (Figure 5b!c). It is known thatthe perfect TiO2(B) lattice possesses parallel tunnels perpen-dicular to the (010) plane that have been used to insert Li+
ions into TiO2(B) nanowires.[21,34] The size of the tunnels(�0.297 nm, Figure S1 in the Supporting Information) islarge enough to accommodate the doped Ce3+ ions. Moreimportantly, as shown in Figure 5c, the tunnels are dis ACHTUNGTRENNUNGtrib-ACHTUNGTRENNUNGuted on the (110) plane. This means the Ce3+ ions accom-modated in the tunnels will also be located on the (110)plane. This location of Ce3+ ions explains their function ofre ACHTUNGTRENNUNGducing defects on the faster growth of (110) lattice planesof TiO2(B) during the phase-transformation process(Figure 1).
Photoactivity : The photocatalytic performance of the selec-tively Ce3+-doped TiO2 nanofibers in decomposing a syn-thetic dye, sulforhodamine B (SRB), under UV irradiationis shown in Figure 6. Apparently, the doped sample
T(AB)Ce04 displays higher photoactivity than the undopedT(AB) nanofibers. However, if the Ce3+ ions are depositedonto the surface of the anatase shell by means of post-phasetransition, a negative effect on photoactivity is observed.For instance, the photodecomposition ability ofT(AB)Ce04_P is much lower than that of the parent T(AB)nanofiber. We also used the Ce3+-doped TiO2 mixed-phasenanofibers as catalysts to selectively oxidize benzyl alcoholto benzaldehyde, which is a fundamental transformation inthe synthesis of fine chemicals. The conversion and selectivi-ty of the oxidation of benzyl alcohol are shown in Figure S3in the Supporting Information. Benzyl alcohol could be oxi-dized to benzaldehyde by all the TiO2 mixed-phase nanofi-ACHTUNGTRENNUNGbers under UV-light irradiation in the presence of O2. Com-pared with the undoped T(AB) nanofibers, the selectively
Ce3+-doped samples prepared by means of one-pot treat-ment, such as T(AB)Ce03 and T(AB)Ce04, displayed higherconversions. However, the conversion of Ce3+-doped nano-fibers prepared by post-phase transition is lower than thatof undoped T(AB) nanofibers.
Proposed holes entrapment mechanism : Based on the core/shell structure and selective doping scheme shown in Fig-ure 5c, we can interpret the enhanced photoactivity of thenanofibers with doped Ce3+ ions in the TiO2(B) core. First,from the DR-UV-visible spectra of the samples (Figure S2ain the Supporting Information), the bandgaps of TiO2(B)and the anatase phase can be estimated to be approximately3.05 and approximately 3.19 eV, respectively.[16] Their va-lence band edge positions were also calculated by usingMott–Schottky measurements[35,36] and are presented in Fig-ure S2 in the Supporting Information. Since the bandgap ofTiO2(B) is narrower than that of anatase and there are well-matched interfaces between the TiO2(B) core and anatasenanocrystals in the shell, which facilitate the interphasecharge migration, the photogenerated charges can migratefrom the anatase shell to the TiO2(B) core.[16] Given that thephotogenerated holes migrate faster than photogeneratedelectrons in anatase nanocrystals,[16,37] the holes can migratemore promptly to the adjacent TiO2(B) core than the elec-trons can. The overall outcome of the interphase charge mi-gration is that a higher electron concentration is left withinthe anatase shell. This reduces the quenching of the photo-generated electrons and holes in the anatase shell and in-creases the opportunity for the oxygen molecules adsorbedon the anatase surface to participate in the oxidation by cap-turing electrons. The anatase surface has a much strongerability to adsorb and activate oxygen molecules (the oxi-dant) than the TiO2(B) surface does.[17] Hence, the mixed-phase nanofibers exhibit higher photoactivity than fibers ofeither pure component TiO2 phase.[16] Second, the redox po-tential of the Ce3+/Ce4+ couple (E8(Ce3+/Ce4+)= 1.715 Vversus the normal hydrogen electrode (NHE)) is more nega-tive than the valence band of TiO2(B) as shown in Figure 7a.Thus, the doped Ce3+ ions—in close vicinity to the interfacebetween the TiO2(B) core and anatase nanocrystals in theshell—can trap holes, and are oxidized to Ce4+ . This facili-tates the migration of holes from the anatase shell and con-tributes to the separation of photogenerated charges in theshell. Such a mechanism is schematically illustrated in Fig-ure 7a.
Compared with the undoped samples, the more holes thatmigrate to the Ce3+ ion-doped TiO2(B) core, the more pho-togenerated electrons are left in the anatase shell to reactwith O2. The enhanced hole migration due to the doping ofCe3+ ions is confirmed by an EPR technique. The EPRspectra of T(AB) and T(AB)Ce04 are displayed in Fig-ure 7b. When the samples are exposed to UV irradiation for5 min, a peak at g= 2.006 (attributed to the hole signal ofanatase) and a peak at g= 2.016 (attributed to the holesignal of the TiO2(B) phase) are observed.[16] Interestingly,the slightly enhanced intensity of the peak at g=2.016 and
Figure 6. The photocatalytic activity for degradation of SRB by Ce3+
-doped mixed-phase TiO2 nanofibers under UV light by one-pot synthesisand the post-phase-transition approach.
Chem. Eur. J. 2013, 19, 5113 – 5119 � 2013 Wiley-VCH Verlag GmbH & Co. KGaA, Weinheim www.chemeurj.org 5117
FULL PAPERPhotoactivity of TiO2(B)/Anatase

the decreased intensity of the peak at g= 2.006 are observedfrom the spectrum of the T(AB)Ce04 sample, in which Ce3+
ions are selectively doped in the TiO2(B) core. This suggeststhat more holes generated in the valence band of anatasenanocrystals of this sample migrated to the Ce3+-ion-dopedTiO2(B) core (to its valence band and to oxidize Ce3+ ionsto Ce4+ ions). Hence, more photogenerated electrons areleft in the anatase shell, compared with those in the un-ACHTUNGTRENNUNGdoped T(AB) nanofibers. These electrons can be capturedby O2 molecules, yielding active O2
� that is responsible forthe oxidation of alcohols and the dye-degradation process.
According to the mechanisms proposed in Figures 5 and7, the doping strategy of one-pot treatment should also beeffective to selectively dope other metal ions into theTiO2(B) core of mixed-phase nanofibers. To verify themechanism of the contribution of the doped cations to thephotocatalyst performance, various metal ions were intro-duced into the TiO2(B) core using the same one-pot dopingmethod. They can be grouped into cations with variable oxi-dation states such as Co2+ /3+ and Cu+ /2+ , and ions with aninvariable oxidation state such as Zn2+ , Ca2+ , and Mg2+ .The results in Figure 8 indicate that doping ions with varia-ble oxidation states substantially improved the photocatalyt-ic activity of the doped mixed-phase nanofibers. In contrast,those ions with an invariable oxidation state did not en-hance the photoactivity of the mixed-phase nanofibers be-cause they could not entrap the photogenerated holes. The
results suggest that the mechanism illustrated in Figure 7afor Ce3+ /4+ ions is applicable to other ions with variable oxi-dation states. These ions doped in the TiO2(B) core of themixed-phase nanofibers can enhance photocatalytic activity.
Conclusion
In summary, the one-pot treatment is an effective and rela-tively simple approach to produce a delicate structure ofTiO2 nanofibers with a single-crystal TiO2(B) core and ashell of anatase nanocrystals. The TiO2(B) core is selectivelydoped with metal ions of variable oxidation states such asCe3+ , Co2+ , and Cu+ ions, whereas the anatase nanocrystalsin the shell are undoped. These nanofibers exhibited superi-or photocatalytic performance to the undoped T(AB) nano-fibers. These doped ions can effectively trap the photogener-ated holes while themselves being oxidized to a higher oxi-dation state. This facilitates migration of the holes from theanatase shell to the TiO2(B) core. The hole migration re-duces the recombination of the photogenerated holes andelectrons in the anatase shell, and increases the opportunityfor O2 molecules adsorbed on the anatase surface to capturephotogenerated electrons, thus improving the photoactivity.This one-step doping and phase-transition strategy can alsobe utilized for applications beyond photocatalysts to createadvanced materials.
Experimental Section
Synthesis of Ce-doped mixed-phase TiO2 nanofibers : All the TiO2 nano-fiber samples were prepared from H-titanate nanofibers that were syn-thesized using TiOSO4·H2O as raw material.[30] The one-pot treatmentwas performed as follows: H-titanate nanofibers (0.3 g) were dispersed inaqueous solution (30 mL) of mixed Ce ACHTUNGTRENNUNG(NO3)3 (8 � 10�5
m) and HNO3
(0.05 m) and kept at 383 K for 24 h. The surface of the parent H-titanatenanofibers were converted to anatase crystals. The obtained nanofibersof H-titanate core/anatase shell structure were separated by filtering andwere washed carefully with deionized water to remove the Ce3+ ions ad-sorbed on the surface. The washed nanofibers were calcined in air at
Figure 7. a) Proposed mechanism of the enhanced electron–hole separa-tion in the mixed-phase nanofibers that were selectively doped with Ce3+
ions under UV-light illumination. b) EPR spectra of T(AB) andT(AB)Ce04 after 5 min of UV illumination. The spectra were measuredat 135 K.
Figure 8. Photocatalytic activity of mixed-phase nanofibers doped by Co,Cu, Zn, and Ca by means of the one-pot method and Mg for SRB degra-dation under UV light, respectively.
www.chemeurj.org � 2013 Wiley-VCH Verlag GmbH & Co. KGaA, Weinheim Chem. Eur. J. 2013, 19, 5113 – 51195118
D. Yang, J.-c. Zhao, H. Zhu et al.

723 K, and the H-titanate core was converted to the TiO2(B) phase, de-noted as T(AB)Ce05. The other Ce-doped samples were prepared in thesame way but using 8� 10�4 and 8� 10�3
m Ce ACHTUNGTRENNUNG(NO3)3 aqueous solutions,and denoted as T(AB)Ce04 and T(AB)Ce03, respectively. The undopednanofibers, denoted T(AB), were prepared using the same procedure butwithout CeACHTUNGTRENNUNG(NO3)3. For comparison, the T(AB) samples were also treatedwith an aqueous solution of mixed CeACHTUNGTRENNUNG(NO3)3 and HNO3. In such a post-phase-transition approach, T(AB) nanofibers (0.3 g) were dispersed in8� 10�5
m Ce ACHTUNGTRENNUNG(NO3)3 aqueous solution (30 mL). The suspension was mag-netically stirred for 24 h at ambient temperature. The nanofibers wereseparated from the suspension by filtering and then calcined in air at723 K. This product was labeled T(AB)Ce05_P. Prepared in the sameway but using 8 � 10�4 and 8 � 10�3
m CeACHTUNGTRENNUNG(NO3)3 aqueous solutions, twoother Ce-doped samples were obtained and denoted T(AB)Ce04_P andT(AB)Ce03_P, respectively. It was expected that the Ce3+ ions weredoped on the surface of the T(AB) nanofibers by this approach.
Characterization : The TEM study on the fibers was conducted on a FEITecnai F20 microscope operating at 200 kV. The composition of somesamples was determined by energy-dispersive X-ray spectroscopy (EDX)attached onto the same microscope. XRD patterns of the sample powderwere recorded on a Siemens D5000 diffractometer equipped with agraphite monochromator. CuKa radiation and a fixed power source(40 kV and 40 mA) were used. We measured the DR-UV-visible spectraof the samples on a Varian Cary 5000 spectrometer. EPR spectra wererecorded with a Bruker EPR ELEXSYS 500 spectrometer operating at afrequency of 9.5 GHz in the X-band mode. Measurements were per-formed with an ER 4131 VT variable-temperature accessory at 135 K.The spectra were acquired when samples within the cavity were illumi-nated at 135 K by UV light, and an irradiation source (a Quanta-RayNd: YAG laser system with a wavelength of 355 nm) was used. The XPSanalyses were performed on a Kratos AXIS Ultra with a monochromaticAl X-ray source at 150 W.
Photocatalytic activity test : The photocatalytic oxidation of benzyl alco-hol was carried out under irradiation by a 100 W Hg lamp (B-100APhigh intensity UV lamp, UAP, UK). Briefly, benzyl alcohol (0.1 mmol)and photocatalyst (25 mg) were dissolved in benzotrifluoride solvent(1.5 mL). The photocatalysts used here were pretreated with acid.[38]
After the reaction (2 h), the products were separated and analyzed byGC-MS methods (Agilent 6890/5973) with a HP-5MS column. The UVlight source for degradation of dye was six tubular Hg lamps (NEC,FL20SBL) of 20 W, and the irradiation peaked at a wavelength of about350 nm. The catalyst concentration was 0.5 g L�1, and the initial concen-tration (C0) of the sulforhodamine B (Aldrich) was 1.8� 10�5
m. At regu-lar irradiation time intervals, the dispersion was sampled, and the speci-men was filtered through a Millipore filter (400 nm, Teflon) to removethe catalyst particles prior to the analysis. The filtrate was analyzed byUV-visible spectroscopy (Varian Cary 100 spectrometer) for the absorb-ance intensity using a reading at 565 nm.
Acknowledgements
We thank Associate Prof. Lingxuan Wang for EPR measurements andYi-Cheng Huang for her careful revision of the manuscript. Financialsupport from the ARC (DP0877108), NSFC (20920102034, 20906074,21276206), and the Starting Research Funds from Qingdao Universityare gratefully acknowledged.
[1] A. Fujishima, K. Hashimoto, H. Watanabe, TiO2 Photocatalysis :Fundamentals and Applications, BKC, Inc., Tokyo, 1999.
[2] M. R. Hoffmann, S. T. Martin, W. Choi, D. W. Bahnemann, Chem.Rev. 1995, 95, 69 –96.
[3] A. L. Linsebigler, G. Q. Lu, J. T. Yates, Chem. Rev. 1995, 95, 735 –758.
[4] A. Mills, S. Le Hunte, J. Photochem. Photobiol. A 1997, 108, 1– 35.[5] M. I. Litter, Appl. Catal. B 1999, 23, 89– 114.
[6] S. T. Martin, C. L. Morrison, M. R. Hoffman, J. Phys. Chem. 1994,98, 13695 –13704.
[7] X. F. Zhao, X. F. Meng, Z. H. Zhang, L. Liu, D. Z. Jia, J. Inorg.Mater. 2004, 19, 140 –146.
[8] F. B. Li, X. Z. Li, M. F. Hou, K. W. Cheah, W. C. H. Choy, Appl.Catal. A 2005, 285, 181 –189.
[9] K. T. Ranjit, I. Willner, S. H. Bossmann, A. M. Braun, Environ. Sci.Technol. 2001, 35, 1544 –1549.
[10] B. M. Reddy, P. M. Sreekanth, E. P. Reddy, Y. Yamada, Q. Xu, H.Sakurai, T. Kobayashi, J. Phys. Chem. B 2002, 106, 5695 –5700.
[11] M. Miyauchi, A. Nakajima, T. Watanabe, K. Hashimoto, Chem.Mater. 2002, 14, 4714 –4720.
[12] E. Bae, W. Choi, Environ. Sci. Technol. 2003, 37, 147 – 152.[13] M. Jakob, H. Levanon, P. V. Kamat, Nano. Lett. 2003, 3, 353 – 358.[14] D. C. Hurum, A. G. Agrios, S. E. Crist, K. A. Gray, T. Rajh, M. C.
Thurnauer, J. Electrom Spectrosc. Relat. Phenom. 2006, 150, 155 –163.
[15] D. C. Hurum, K. A. Gray, T. Rajh, M. C. Thurnauer, J. Phys. Chem.B 2005, 109, 977 – 980.
[16] D. J. Yang, H. W. Liu, Z. F. Zheng, Y. Yuan, J. C. Zhao, E. R. Wacla-wik, X. B. Ke, H. Y. Zhu, J. Am. Chem. Soc. 2009, 131, 17885 –17893.
[17] Z. F. Zheng, J. Teo, X. Chen, H. Liu, Y. Yuan, E. R. Waclawik, Z.Zhong, H. Zhu, Chem. Eur. J. 2010, 16, 1202 –1211.
[18] T. Kawahara, Y. Konishi, H. Tada, N. Tohge, J. Nishii, .S. Ito,Angew. Chem. 2002, 114, 2935 – 2937; Angew. Chem. Int. Ed. 2002,41, 2811 –2813.
[19] B. Sun, V. V. Alexandre, G. S. Panagiotis, Langmuir 2003, 19, 3151 –3156.
[20] R. Marchand, L. Brohan, M. Tournoux, Mater. Res. Bull. 1980, 15,1129 – 1133.
[21] G. Nuspl, K. Yoshizawa, T. J. Yamabe, J. Mater. Chem. 1997, 7,2529 – 2536.
[22] S. Yin, Y. Fujishiro, J. Wu, M. Aki, H. Sato, J. Mater. Process. Tech-nol. 2003, 137, 45– 48.
[23] S. Yin, J. Wu, M. Aki, H. Sato, Int. J. Inorg. Mater. 2000, 2, 325 –331.[24] H.-L. Kuo, C.-Y. Kuo, C.-H. Liu, J.-H. Chao, C.-H. Lin, Catal. Lett.
2007, 113, 7–12.[25] H. Y. Zhu, X. P. Gao, Y. Lan, D. Y. Song, Y. X. Xi, J. C. Zhao, J.
Am. Chem. Soc. 2004, 126, 8380 – 8381.[26] B. Zhao, F. Chen, W. Qu, J. Zhang, J. Solid State Chem. 2009, 182,
2225 – 2230.[27] Z. M. Shi, W. G. Yu, X. Bayar, Scr. Mater. 2004, 50, 885 –889.[28] M. S. P. Francisco, V. R. Mastelaro, Chem. Mater. 2002, 14, 2514 –
2518.[29] G. Blasse, A. Bril, J. Inorg. Nucl. Chem. 1967, 29, 2231 – 2241.[30] T. Tong, J. Zhang, B. Tian, F. Chen, D. He, M. Anpo, J. Colloid In-
terface Sci. 2007, 315, 382 – 388.[31] a) D. J. Yang, Z. F. Zheng, H. Y. Zhu, H. W. Liu, X. P. Gao, Adv.
Mater. 2008, 20, 2777 –2781; b) D. J. Yang, Z. F. Zheng, H. W. Liu,H. Y. Zhu, X. B. Ke, Y. Xu, D. Wu, Y. H. Sun, J. Phys. Chem. C2008, 112, 16275 –16280.
[32] Y. Xu, Z. Zeng, J. Mol. Catal. A 2008, 279, 77– 81.[33] X. Shen, Z. Liu, S. Xie, J. Guo, J. Hazard. Mater. 2009, 162, 1193 –
1198.[34] A. R. Armstrong, G. Armstrong, J. Canales, P. G. Bruce, Angew.
Chem. 2004, 116, 2336 – 2338; Angew. Chem. Int. Ed. 2004, 43, 2286 –2288.
[35] F. P. Koffyberg, K. Dwight, A. Wold, Solid State Commun. 1979, 30,433 – 437.
[36] X. Zhang, L. Zhang, T. Xie, D. Wang, J. Phys. Chem. C 2009, 113,7371 – 7378.
[37] B. Enright, D. Fitzmaurice, J. Phys. Chem. 1996, 100, 1027 –1035.[38] Q. Wang, M. Zhang, C. C. Chen, W. H. Ma, J. C. Zhao, Angew.
Chem. 2010, 122, 8148 –8151; Angew. Chem. Int. Ed. 2010, 49, 7976 –7979.
Received: July 29, 2012Revised: November 28, 2012
Published online: February 18, 2013
Chem. Eur. J. 2013, 19, 5113 – 5119 � 2013 Wiley-VCH Verlag GmbH & Co. KGaA, Weinheim www.chemeurj.org 5119
FULL PAPERPhotoactivity of TiO2(B)/Anatase