Engineered 3D environments to elucidate the effect of environmental parameters on drug response in...
9
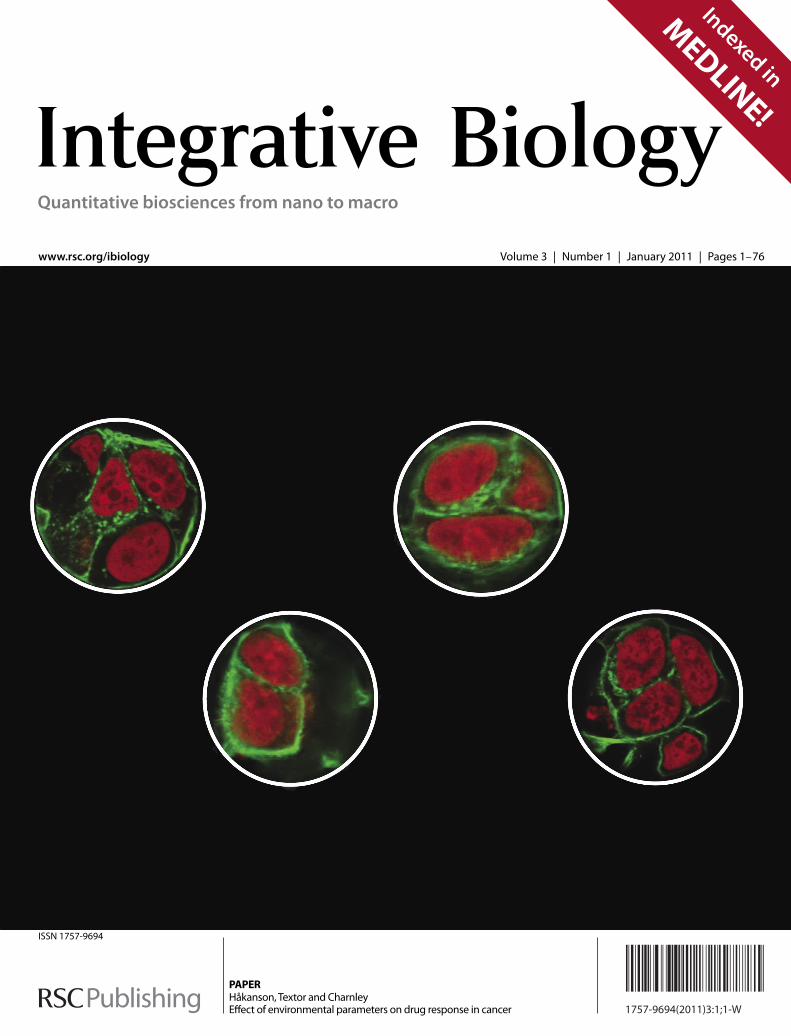
ISSN 1757-9694 1757-9694(2011)3:1;1-W www.rsc.org/ibiology Volume 3 | Number 1 | January 2011 | Pages 1–76 PAPER Håkanson, Textor and Charnley Effect of environmental parameters on drug response in cancer Quantitative biosciences from nano to macro Indexed in MEDLINE!
Transcript of Engineered 3D environments to elucidate the effect of environmental parameters on drug response in...
ISSN 1757-9694
1757-9694(2011)3:1;1-W
www.rsc.org/ibiology Volume 3 | Number 1 | January 2011 | Pages 1–76
PAPERHåkanson, Textor and CharnleyEff ect of environmental parameters on drug response in cancer
Quantitative biosciences from nano to macro
Indexed in
MED
LINE!
MyRSC – Online Community
http://my.rsc.orgRegistered Charity Number 207890
How to register with MyRSC Go to http://my.rsc.org and click on register, fill out the form.
An email will be sent to your specified address, follow the link to activate your MyRSC account.
You can find and download our quick start guide at http://my.rsc.org/quickstartguide
A professional network for the
chemical sciences, hosted by the RSCMyRSC is leading the way in providing an international networking hub for advancing the chemical sciences. Connect, engage and interact with scientists across the globe regardless of location, career stage or interest.
• Personalise your profile to reflect your specific interests
• Grow your network with people who share common interests, research or workplace
• Join groups and communities based in your field
• Exchange knowledge and expertise with fellow scientists or to get help and ask questions
• Follow blogs and discussion forums - carry on the debate
Dow
nloa
ded
on 2
9 Ja
nuar
y 20
11Pu
blis
hed
on 0
3 N
ovem
ber
2010
on
http
://pu
bs.r
sc.o
rg |
doi:1
0.10
39/C
0IB
0007
4D
View Online
This journal is c The Royal Society of Chemistry 2011 Integr. Biol., 2011, 3, 31–38 31
Cite this: Integr. Biol., 2011, 3, 31–38
Engineered 3D environments to elucidate the effect of environmental
parameters on drug response in cancerw
Maria Hakanson, Marcus Textor and Mirren Charnley*
Received 3rd August 2010, Accepted 7th October 2010
DOI: 10.1039/c0ib00074d
Traditional in vitro models used for the development of anti-cancer drugs are based on the
monolayer culture of cells, which has a limited predictivity of in vivo efficacy. A number of cell
culture platforms have been developed in recent years to improve predictivity and further to
elucidate the mechanisms governing the differing responses observed in vitro versus in vivo. One
detrimental aspect of current in vitro models is their inability to decouple the effect of different
extrinsic factors on the responsiveness of the cells to drug treatment. Here, we have used an
engineered poly(dimethylsiloxane) (PDMS) microwell array as a reductionist approach to study
the effect of environmental parameters, independently of each other. It is observed for MCF-7
breast cancer cells, that culture within the three-dimensional (3D) environment of the microwells
alone had an effect on the response to Taxol and results in a reduction of cell death in
comparison to cells cultured on flat substrates. Additionally the microwells allowed the response
of single versus multicell clusters to be differentiated. It was found that the formation of cell–cell
contacts alters the drug response, depending on the type of adhesive protein present. Thus, with
this microwell platform it is revealed that the presence of cell–cell contacts in addition to the
dimensionality and the matrix composition of the environment are important mediators of
altered drug responses. In conclusion the microwell array can not only serve as a platform
to reveal which parameters of the extracellular environment affect drug response but further
the interdependence of these parameters.
Introduction
The prognosis of breast cancer patients has greatly improved
during recent years, partly because many new therapies, including
new chemotherapeutic drugs and targeted treatments, have
been developed.1 Despite these advances, breast cancer remains
a major clinical problem worldwide. Currently one in four
deaths in the United States are due to cancer, where breast
cancer alone is responsible for 15% of cancer related deaths in
women.2 One hurdle is the still ineffective development process
of new drugs, with many drugs being lost in the transition
from in vitro drug screening to animal models and clinical
trials,3 articulating a demand for more relevant preclinical
models. Still today the early screening process uses cancer
models based on monolayer culture of cells, which do not
ETH Zurich, Wolfgang-Pauli-Str. 10, Zurich, Switzerland.E-mail: [email protected]; Fax: +41-44-633 10 27;Tel: +41-44-633 63 48w Electronic supplementary information (ESI) available: Supplementalfigure. See DOI: 10.1039/c0ib00074d
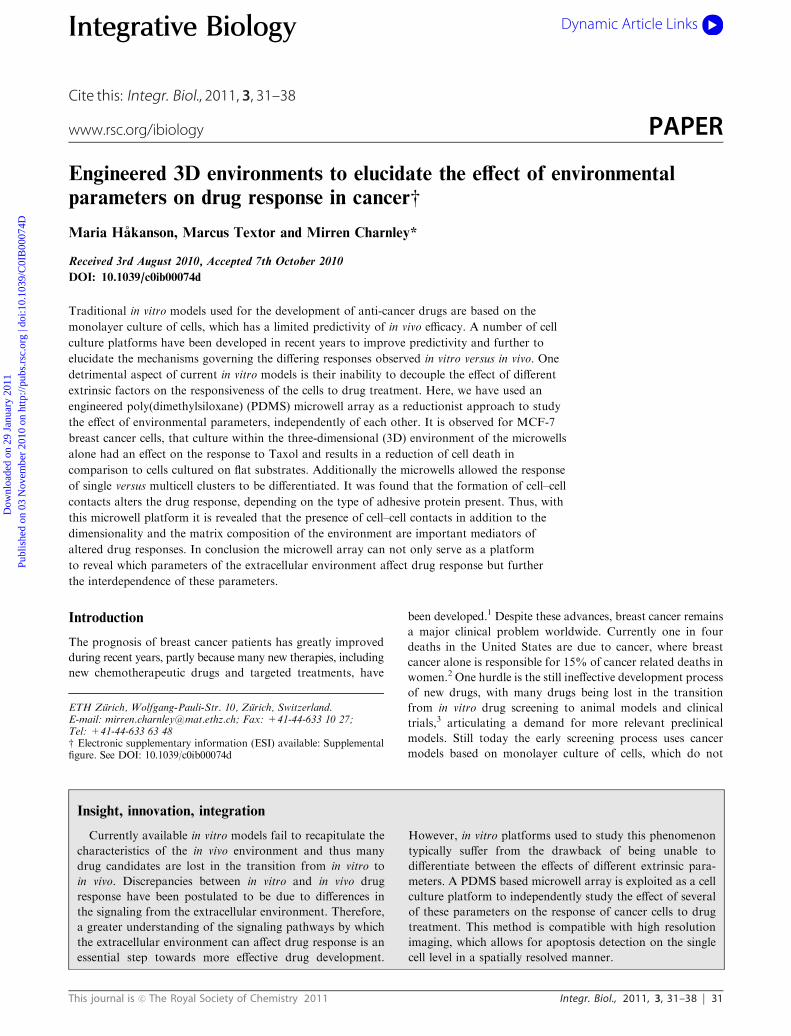
Insight, innovation, integration
Currently available in vitro models fail to recapitulate the
characteristics of the in vivo environment and thus many
drug candidates are lost in the transition from in vitro to
in vivo. Discrepancies between in vitro and in vivo drug
response have been postulated to be due to differences in
the signaling from the extracellular environment. Therefore,
a greater understanding of the signaling pathways by which
the extracellular environment can affect drug response is an
essential step towards more effective drug development.
However, in vitro platforms used to study this phenomenon
typically suffer from the drawback of being unable to
differentiate between the effects of different extrinsic para-
meters. A PDMS based microwell array is exploited as a cell
culture platform to independently study the effect of several
of these parameters on the response of cancer cells to drug
treatment. This method is compatible with high resolution
imaging, which allows for apoptosis detection on the single
cell level in a spatially resolved manner.
Integrative Biology Dynamic Article Links
www.rsc.org/ibiology PAPER
Dow
nloa
ded
on 2
9 Ja
nuar
y 20
11Pu
blis
hed
on 0
3 N
ovem
ber
2010
on
http
://pu
bs.r
sc.o
rg |
doi:1
0.10
39/C
0IB
0007
4D
View Online
32 Integr. Biol., 2011, 3, 31–38 This journal is c The Royal Society of Chemistry 2011
accurately reflect the physiological environment of the tumor
in vivo. On the contrary, it has become common knowledge
that conventional monolayer culture induces both phenotypic
and genotypic changes in the cells,4 for example growth
kinetics and metabolic rates of cells are different for cells
cultured in 2D and 3D.5 Therefore such preclinical in vitro
models have had limited predictivity for in vivo efficacy.6
A central reason for the failure of current in vitro techniques
is their inability to mimic key aspects of the in vivo environ-
ment of the tumor. Hence, in order to improve the in vivo
to in vitro translation efficiency new culture models that
better mimic the in vivo environment need to be developed.
Therefore, the emphasis in current research has been to
elucidate which are the key parameters of the extracellular
environment that affect drug response. It has long been known
that cells in 3D multicellular tumor spheroids (MCTSs)
typically have a lower susceptibility to cytotoxic drugs com-
pared to cells grown on 2D substrates. This difference has been
argued to be an effect of lower drug penetration, development
of a hypoxic core and decreased growth.7 Increased signaling
from enhanced cell–cell contacts in 3D culture could be one
important factor in the reduced drug responsiveness in spheroids,8
which could in turn be the determinant of decreased growth.9
Indeed, it has been shown that in the presence of E-cadherin
interfering antibody, cells within spheroids were sensitized to
several chemotherapeutic drugs.10
As MCTSs typically are formed on non-adhesive substrates
or in hanging drops, the interaction with the extracellular
matrix is absent in this model.7 However, the composition of
the ECM has shown to have an important effect on drug
response. In initial work it was found that the growth of
cancer cells on flat substrates coated with different ECM
proteins affected their response to anti-cancer drugs.11 A recent
paper uses a more in vivo like fibronectin matrix, produced by
fibroblast cells, to study matrix induced alteration of drug
response.12 The matrices can be tuned to mimic different
stages of the tumor progression by altering the fibroblasts that
produce them, for example matrices derived from NIH-3T3
fibroblasts are regarded as control (non-cancerous) or early-stage
cancerous environments.13 Using this model it was possible to
show that not only the presence of the matrix but also the
organization of the matrix in 2D or 3D influences drug
response. The effect of the dimensionality of the environment
on the behavior of cancer cells has further been studied
using porous polymeric scaffolds. It was revealed that the
3D culture of cells within the scaffolds induced a decreased
drug response.14,15 Therefore dimensionality, the extracellular
matrix and cell–cell contacts all play a role in determining drug
responsiveness.
However, there are several drawbacks of the aforementioned
models. One disadvantage is that most of the models are
limited to study the effect of only one or a few parameters
of the extracellular environment. An even more important
consideration is the inability of many of these models to
differentiate between the effects of different extrinsic para-
meters. In fundamental studies of cell biology, reductionist
models of the in vivo environment have shown promise in the
deconvolution of the importance of extrinsic factors on cell
behavior.16,17 Such models typically rely on micropatterned
substrates, for example protein patterns in the size of a single
cell that have been used to study the effect of cell spreading on
different cell behaviors.18 However, until recently there has
been a lack of tools that enable the investigation of cells
cultured within structurally and biochemically controlled 3D
environments. Therefore, within our lab we have developed a
poly(dimethylsiloxane) (PDMS) based microwell array for the
culture of cells in a 3D environment, in which not only
dimensionality but also cell cluster size and protein coating
can be controlled independently.19
This work aimed at evaluating the microwell array as a
reductionist approach to study the effect of different extrinsic
parameters on the response to anti-cancer drugs. The microwell
array has been developed to be compatible with high-resolution
microscopy (Fig. 1). This allowed detailed information of cell
health at the single cell level to be obtained, eliminating the
need for population based measurements, which are typically
associated with large errors and can be difficult to adapt for
measurements in 3D cultures.20 As a model experiment we
have chosen to study the Taxol-induced apoptosis in breast
carcinoma cells. In short, this paper presents the use of a
microwell array to investigate the individual effects of the 3D
culture, matrix composition and cell–cell contacts on cellular
responses to Taxol. In a central experiment we compared the
results obtained using this model to a more complex 3D
fibronectin matrix, which has been previously used as an
in vitro model of the tumor stroma.12
Results
Determining the rate and type of cell death induced by Taxol
The induction of cell death by Taxol, a standard drug in the
treatment of breast cancer,21,22 was initially investigated using
two different assays. Taxol acts by suppressing microtubule
dynamics, which leads to a mitotic block and apoptosis in
cancer cells.23 In a first experiment we measured the number of
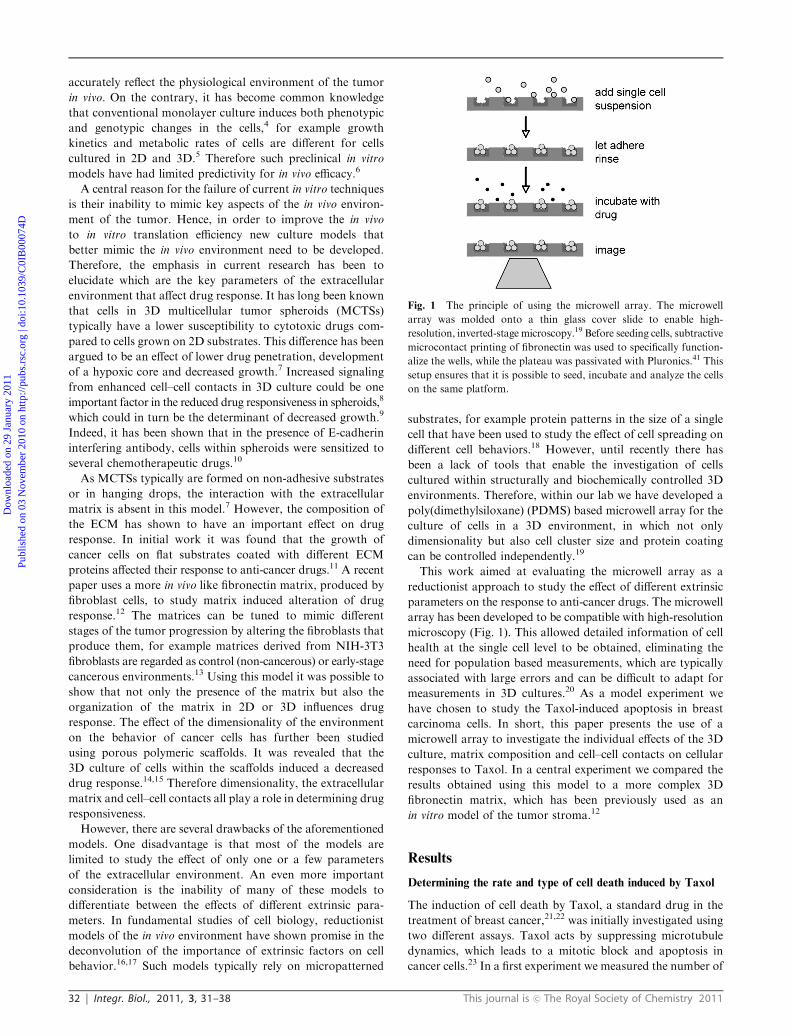
Fig. 1 The principle of using the microwell array. The microwell
array was molded onto a thin glass cover slide to enable high-
resolution, inverted-stage microscopy.19 Before seeding cells, subtractive
microcontact printing of fibronectin was used to specifically function-
alize the wells, while the plateau was passivated with Pluronics.41 This
setup ensures that it is possible to seed, incubate and analyze the cells
on the same platform.
Dow
nloa
ded
on 2
9 Ja
nuar
y 20
11Pu
blis
hed
on 0
3 N
ovem
ber
2010
on
http
://pu
bs.r
sc.o
rg |
doi:1
0.10
39/C
0IB
0007
4D
View Online
This journal is c The Royal Society of Chemistry 2011 Integr. Biol., 2011, 3, 31–38 33
both apoptotic and necrotic cells in a population of cells
grown on flat fibronectin-coated PDMS substrates and treated
with 100 nM Taxol. The LIVE/DEAD assay identifies dead
cells on the basis of membrane integrity and was used to
differentiate necrotic from apoptotic cells,24,25 while apoptosis
was detected by nuclear fragmentation, which is an easily
identifiable characteristic of apoptosis.26 It was observed that
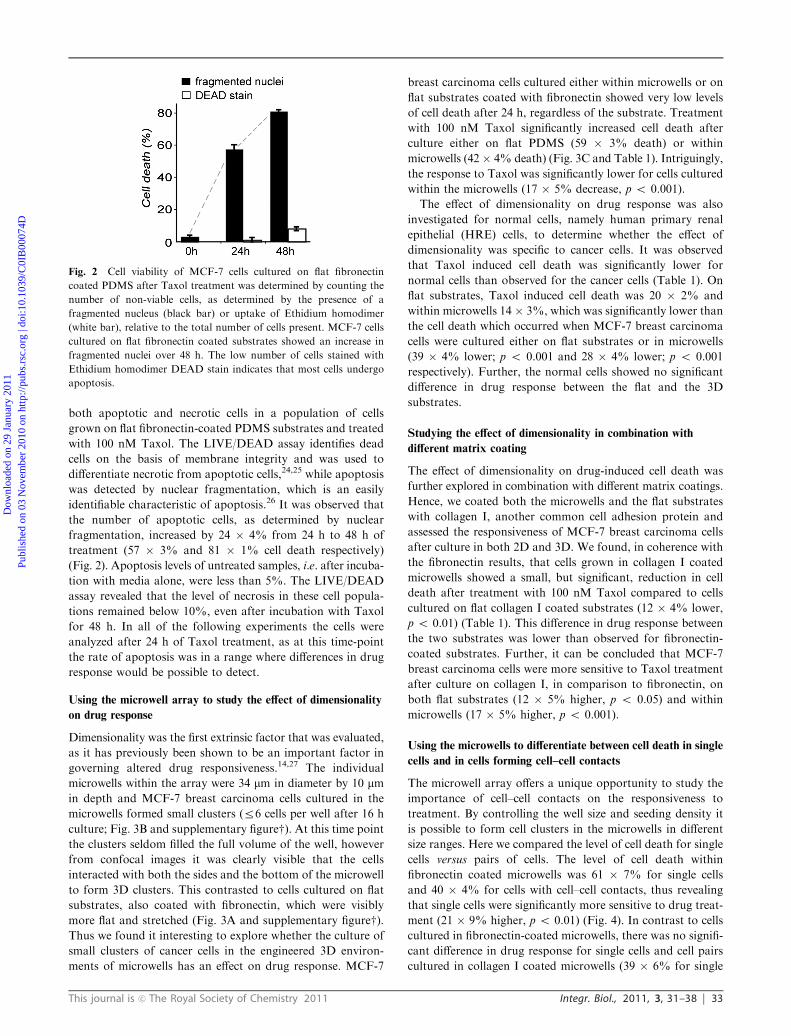
the number of apoptotic cells, as determined by nuclear
fragmentation, increased by 24 � 4% from 24 h to 48 h of
treatment (57 � 3% and 81 � 1% cell death respectively)
(Fig. 2). Apoptosis levels of untreated samples, i.e. after incuba-
tion with media alone, were less than 5%. The LIVE/DEAD
assay revealed that the level of necrosis in these cell popula-
tions remained below 10%, even after incubation with Taxol
for 48 h. In all of the following experiments the cells were
analyzed after 24 h of Taxol treatment, as at this time-point
the rate of apoptosis was in a range where differences in drug
response would be possible to detect.
Using the microwell array to study the effect of dimensionality
on drug response
Dimensionality was the first extrinsic factor that was evaluated,
as it has previously been shown to be an important factor in
governing altered drug responsiveness.14,27 The individual
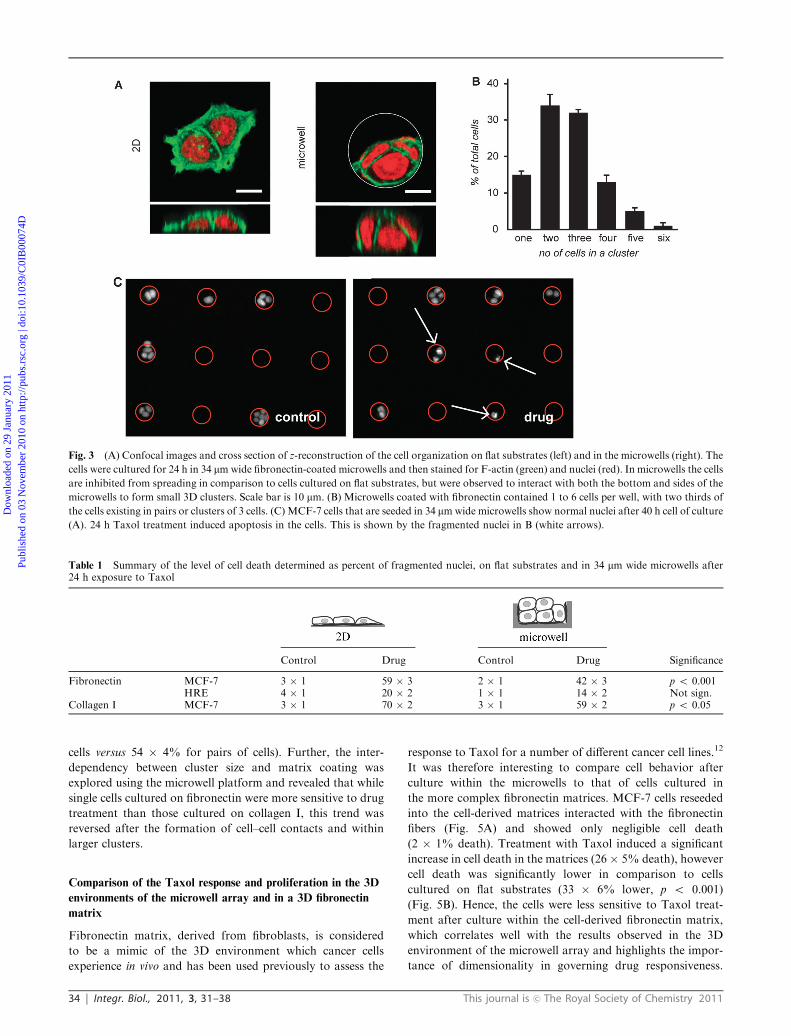
microwells within the array were 34 mm in diameter by 10 mmin depth and MCF-7 breast carcinoma cells cultured in the
microwells formed small clusters (r6 cells per well after 16 h
culture; Fig. 3B and supplementary figurew). At this time point
the clusters seldom filled the full volume of the well, however
from confocal images it was clearly visible that the cells
interacted with both the sides and the bottom of the microwell
to form 3D clusters. This contrasted to cells cultured on flat
substrates, also coated with fibronectin, which were visibly
more flat and stretched (Fig. 3A and supplementary figurew).Thus we found it interesting to explore whether the culture of
small clusters of cancer cells in the engineered 3D environ-
ments of microwells has an effect on drug response. MCF-7
breast carcinoma cells cultured either within microwells or on
flat substrates coated with fibronectin showed very low levels
of cell death after 24 h, regardless of the substrate. Treatment
with 100 nM Taxol significantly increased cell death after
culture either on flat PDMS (59 � 3% death) or within
microwells (42� 4% death) (Fig. 3C and Table 1). Intriguingly,
the response to Taxol was significantly lower for cells cultured
within the microwells (17 � 5% decrease, p o 0.001).
The effect of dimensionality on drug response was also
investigated for normal cells, namely human primary renal
epithelial (HRE) cells, to determine whether the effect of
dimensionality was specific to cancer cells. It was observed
that Taxol induced cell death was significantly lower for
normal cells than observed for the cancer cells (Table 1). On
flat substrates, Taxol induced cell death was 20 � 2% and
within microwells 14 � 3%, which was significantly lower than
the cell death which occurred when MCF-7 breast carcinoma
cells were cultured either on flat substrates or in microwells
(39 � 4% lower; p o 0.001 and 28 � 4% lower; p o 0.001
respectively). Further, the normal cells showed no significant
difference in drug response between the flat and the 3D
substrates.
Studying the effect of dimensionality in combination with
different matrix coating
The effect of dimensionality on drug-induced cell death was
further explored in combination with different matrix coatings.
Hence, we coated both the microwells and the flat substrates
with collagen I, another common cell adhesion protein and
assessed the responsiveness of MCF-7 breast carcinoma cells
after culture in both 2D and 3D. We found, in coherence with
the fibronectin results, that cells grown in collagen I coated
microwells showed a small, but significant, reduction in cell
death after treatment with 100 nM Taxol compared to cells
cultured on flat collagen I coated substrates (12 � 4% lower,
p o 0.01) (Table 1). This difference in drug response between
the two substrates was lower than observed for fibronectin-
coated substrates. Further, it can be concluded that MCF-7
breast carcinoma cells were more sensitive to Taxol treatment
after culture on collagen I, in comparison to fibronectin, on
both flat substrates (12 � 5% higher, p o 0.05) and within
microwells (17 � 5% higher, p o 0.001).
Using the microwells to differentiate between cell death in single
cells and in cells forming cell–cell contacts
The microwell array offers a unique opportunity to study the
importance of cell–cell contacts on the responsiveness to
treatment. By controlling the well size and seeding density it
is possible to form cell clusters in the microwells in different
size ranges. Here we compared the level of cell death for single
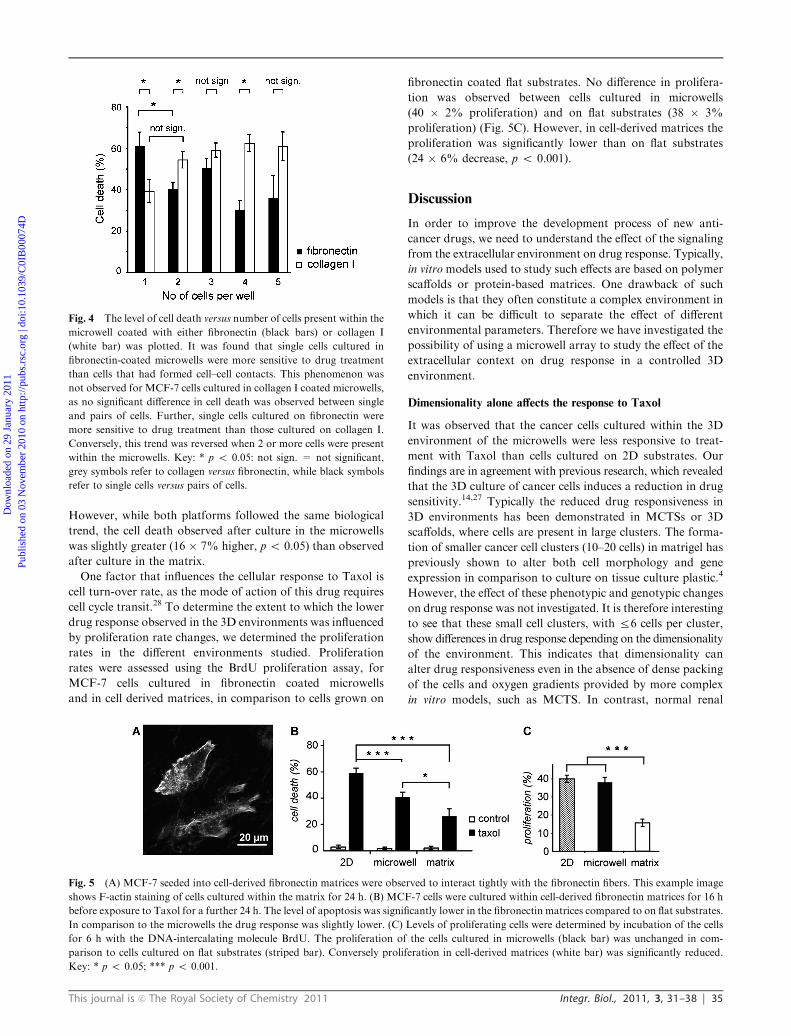
cells versus pairs of cells. The level of cell death within
fibronectin coated microwells was 61 � 7% for single cells
and 40 � 4% for cells with cell–cell contacts, thus revealing
that single cells were significantly more sensitive to drug treat-
ment (21 � 9% higher, p o 0.01) (Fig. 4). In contrast to cells
cultured in fibronectin-coated microwells, there was no signifi-
cant difference in drug response for single cells and cell pairs
cultured in collagen I coated microwells (39 � 6% for single
Fig. 2 Cell viability of MCF-7 cells cultured on flat fibronectin
coated PDMS after Taxol treatment was determined by counting the
number of non-viable cells, as determined by the presence of a
fragmented nucleus (black bar) or uptake of Ethidium homodimer
(white bar), relative to the total number of cells present. MCF-7 cells
cultured on flat fibronectin coated substrates showed an increase in
fragmented nuclei over 48 h. The low number of cells stained with
Ethidium homodimer DEAD stain indicates that most cells undergo
apoptosis.
Dow
nloa
ded
on 2
9 Ja
nuar
y 20
11Pu
blis
hed
on 0
3 N
ovem
ber
2010
on
http
://pu
bs.r
sc.o
rg |
doi:1
0.10
39/C
0IB
0007
4D
View Online
34 Integr. Biol., 2011, 3, 31–38 This journal is c The Royal Society of Chemistry 2011
cells versus 54 � 4% for pairs of cells). Further, the inter-
dependency between cluster size and matrix coating was
explored using the microwell platform and revealed that while
single cells cultured on fibronectin were more sensitive to drug
treatment than those cultured on collagen I, this trend was
reversed after the formation of cell–cell contacts and within
larger clusters.
Comparison of the Taxol response and proliferation in the 3D
environments of the microwell array and in a 3D fibronectin
matrix
Fibronectin matrix, derived from fibroblasts, is considered
to be a mimic of the 3D environment which cancer cells
experience in vivo and has been used previously to assess the
response to Taxol for a number of different cancer cell lines.12
It was therefore interesting to compare cell behavior after
culture within the microwells to that of cells cultured in
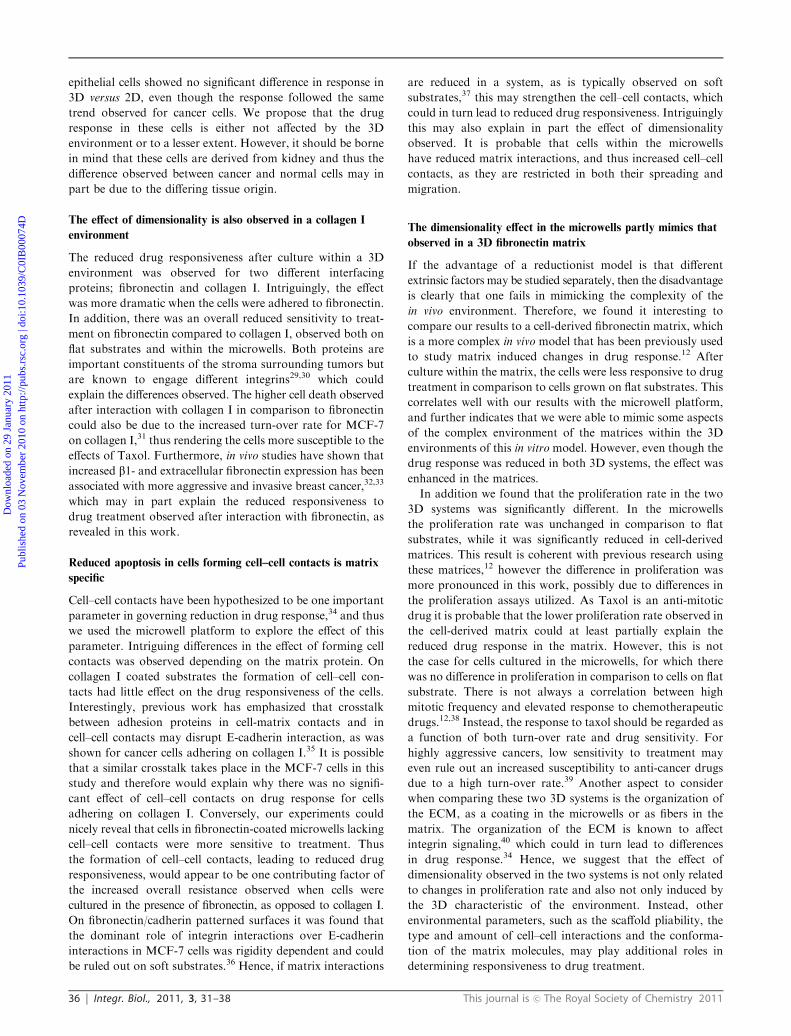
the more complex fibronectin matrices. MCF-7 cells reseeded
into the cell-derived matrices interacted with the fibronectin
fibers (Fig. 5A) and showed only negligible cell death
(2 � 1% death). Treatment with Taxol induced a significant
increase in cell death in the matrices (26� 5% death), however
cell death was significantly lower in comparison to cells
cultured on flat substrates (33 � 6% lower, p o 0.001)
(Fig. 5B). Hence, the cells were less sensitive to Taxol treat-
ment after culture within the cell-derived fibronectin matrix,
which correlates well with the results observed in the 3D
environment of the microwell array and highlights the impor-
tance of dimensionality in governing drug responsiveness.
Table 1 Summary of the level of cell death determined as percent of fragmented nuclei, on flat substrates and in 34 mm wide microwells after24 h exposure to Taxol
Control Drug Control Drug Significance
Fibronectin MCF-7 3 � 1 59 � 3 2 � 1 42 � 3 p o 0.001HRE 4 � 1 20 � 2 1 � 1 14 � 2 Not sign.
Collagen I MCF-7 3 � 1 70 � 2 3 � 1 59 � 2 p o 0.05
Fig. 3 (A) Confocal images and cross section of z-reconstruction of the cell organization on flat substrates (left) and in the microwells (right). The
cells were cultured for 24 h in 34 mmwide fibronectin-coated microwells and then stained for F-actin (green) and nuclei (red). In microwells the cells
are inhibited from spreading in comparison to cells cultured on flat substrates, but were observed to interact with both the bottom and sides of the
microwells to form small 3D clusters. Scale bar is 10 mm. (B) Microwells coated with fibronectin contained 1 to 6 cells per well, with two thirds of
the cells existing in pairs or clusters of 3 cells. (C) MCF-7 cells that are seeded in 34 mmwide microwells show normal nuclei after 40 h cell of culture
(A). 24 h Taxol treatment induced apoptosis in the cells. This is shown by the fragmented nuclei in B (white arrows).
Dow
nloa
ded
on 2
9 Ja
nuar
y 20
11Pu
blis
hed
on 0
3 N
ovem
ber
2010
on
http
://pu
bs.r
sc.o
rg |
doi:1
0.10
39/C
0IB
0007
4D
View Online
This journal is c The Royal Society of Chemistry 2011 Integr. Biol., 2011, 3, 31–38 35
However, while both platforms followed the same biological
trend, the cell death observed after culture in the microwells
was slightly greater (16 � 7% higher, p o 0.05) than observed
after culture in the matrix.
One factor that influences the cellular response to Taxol is
cell turn-over rate, as the mode of action of this drug requires
cell cycle transit.28 To determine the extent to which the lower
drug response observed in the 3D environments was influenced
by proliferation rate changes, we determined the proliferation
rates in the different environments studied. Proliferation
rates were assessed using the BrdU proliferation assay, for
MCF-7 cells cultured in fibronectin coated microwells
and in cell derived matrices, in comparison to cells grown on
fibronectin coated flat substrates. No difference in prolifera-
tion was observed between cells cultured in microwells
(40 � 2% proliferation) and on flat substrates (38 � 3%
proliferation) (Fig. 5C). However, in cell-derived matrices the
proliferation was significantly lower than on flat substrates
(24 � 6% decrease, p o 0.001).
Discussion
In order to improve the development process of new anti-
cancer drugs, we need to understand the effect of the signaling
from the extracellular environment on drug response. Typically,
in vitromodels used to study such effects are based on polymer
scaffolds or protein-based matrices. One drawback of such
models is that they often constitute a complex environment in
which it can be difficult to separate the effect of different
environmental parameters. Therefore we have investigated the
possibility of using a microwell array to study the effect of the
extracellular context on drug response in a controlled 3D
environment.
Dimensionality alone affects the response to Taxol
It was observed that the cancer cells cultured within the 3D
environment of the microwells were less responsive to treat-
ment with Taxol than cells cultured on 2D substrates. Our
findings are in agreement with previous research, which revealed
that the 3D culture of cancer cells induces a reduction in drug
sensitivity.14,27 Typically the reduced drug responsiveness in
3D environments has been demonstrated in MCTSs or 3D
scaffolds, where cells are present in large clusters. The forma-
tion of smaller cancer cell clusters (10–20 cells) in matrigel has
previously shown to alter both cell morphology and gene
expression in comparison to culture on tissue culture plastic.4
However, the effect of these phenotypic and genotypic changes
on drug response was not investigated. It is therefore interesting
to see that these small cell clusters, with r6 cells per cluster,
show differences in drug response depending on the dimensionality
of the environment. This indicates that dimensionality can
alter drug responsiveness even in the absence of dense packing
of the cells and oxygen gradients provided by more complex
in vitro models, such as MCTS. In contrast, normal renal
Fig. 5 (A) MCF-7 seeded into cell-derived fibronectin matrices were observed to interact tightly with the fibronectin fibers. This example image
shows F-actin staining of cells cultured within the matrix for 24 h. (B) MCF-7 cells were cultured within cell-derived fibronectin matrices for 16 h
before exposure to Taxol for a further 24 h. The level of apoptosis was significantly lower in the fibronectin matrices compared to on flat substrates.
In comparison to the microwells the drug response was slightly lower. (C) Levels of proliferating cells were determined by incubation of the cells
for 6 h with the DNA-intercalating molecule BrdU. The proliferation of the cells cultured in microwells (black bar) was unchanged in com-
parison to cells cultured on flat substrates (striped bar). Conversely proliferation in cell-derived matrices (white bar) was significantly reduced.
Key: * p o 0.05; *** p o 0.001.
Fig. 4 The level of cell death versus number of cells present within the
microwell coated with either fibronectin (black bars) or collagen I
(white bar) was plotted. It was found that single cells cultured in
fibronectin-coated microwells were more sensitive to drug treatment
than cells that had formed cell–cell contacts. This phenomenon was
not observed for MCF-7 cells cultured in collagen I coated microwells,
as no significant difference in cell death was observed between single
and pairs of cells. Further, single cells cultured on fibronectin were
more sensitive to drug treatment than those cultured on collagen I.
Conversely, this trend was reversed when 2 or more cells were present
within the microwells. Key: * p o 0.05: not sign. = not significant,
grey symbols refer to collagen versus fibronectin, while black symbols
refer to single cells versus pairs of cells.
Dow
nloa
ded
on 2
9 Ja
nuar
y 20
11Pu
blis
hed
on 0
3 N
ovem
ber
2010
on
http
://pu
bs.r
sc.o
rg |
doi:1
0.10
39/C
0IB
0007
4D
View Online
36 Integr. Biol., 2011, 3, 31–38 This journal is c The Royal Society of Chemistry 2011
epithelial cells showed no significant difference in response in
3D versus 2D, even though the response followed the same
trend observed for cancer cells. We propose that the drug
response in these cells is either not affected by the 3D
environment or to a lesser extent. However, it should be borne
in mind that these cells are derived from kidney and thus the
difference observed between cancer and normal cells may in
part be due to the differing tissue origin.
The effect of dimensionality is also observed in a collagen I
environment
The reduced drug responsiveness after culture within a 3D
environment was observed for two different interfacing
proteins; fibronectin and collagen I. Intriguingly, the effect
was more dramatic when the cells were adhered to fibronectin.
In addition, there was an overall reduced sensitivity to treat-
ment on fibronectin compared to collagen I, observed both on
flat substrates and within the microwells. Both proteins are
important constituents of the stroma surrounding tumors but
are known to engage different integrins29,30 which could
explain the differences observed. The higher cell death observed
after interaction with collagen I in comparison to fibronectin
could also be due to the increased turn-over rate for MCF-7
on collagen I,31 thus rendering the cells more susceptible to the
effects of Taxol. Furthermore, in vivo studies have shown that
increased b1- and extracellular fibronectin expression has been
associated with more aggressive and invasive breast cancer,32,33
which may in part explain the reduced responsiveness to
drug treatment observed after interaction with fibronectin, as
revealed in this work.
Reduced apoptosis in cells forming cell–cell contacts is matrix
specific
Cell–cell contacts have been hypothesized to be one important
parameter in governing reduction in drug response,34 and thus
we used the microwell platform to explore the effect of this
parameter. Intriguing differences in the effect of forming cell
contacts was observed depending on the matrix protein. On
collagen I coated substrates the formation of cell–cell con-
tacts had little effect on the drug responsiveness of the cells.
Interestingly, previous work has emphasized that crosstalk
between adhesion proteins in cell-matrix contacts and in
cell–cell contacts may disrupt E-cadherin interaction, as was
shown for cancer cells adhering on collagen I.35 It is possible
that a similar crosstalk takes place in the MCF-7 cells in this
study and therefore would explain why there was no signifi-
cant effect of cell–cell contacts on drug response for cells
adhering on collagen I. Conversely, our experiments could
nicely reveal that cells in fibronectin-coated microwells lacking
cell–cell contacts were more sensitive to treatment. Thus
the formation of cell–cell contacts, leading to reduced drug
responsiveness, would appear to be one contributing factor of
the increased overall resistance observed when cells were
cultured in the presence of fibronectin, as opposed to collagen I.
On fibronectin/cadherin patterned surfaces it was found that
the dominant role of integrin interactions over E-cadherin
interactions in MCF-7 cells was rigidity dependent and could
be ruled out on soft substrates.36 Hence, if matrix interactions
are reduced in a system, as is typically observed on soft
substrates,37 this may strengthen the cell–cell contacts, which
could in turn lead to reduced drug responsiveness. Intriguingly
this may also explain in part the effect of dimensionality
observed. It is probable that cells within the microwells
have reduced matrix interactions, and thus increased cell–cell
contacts, as they are restricted in both their spreading and
migration.
The dimensionality effect in the microwells partly mimics that
observed in a 3D fibronectin matrix
If the advantage of a reductionist model is that different
extrinsic factors may be studied separately, then the disadvantage
is clearly that one fails in mimicking the complexity of the
in vivo environment. Therefore, we found it interesting to
compare our results to a cell-derived fibronectin matrix, which
is a more complex in vivo model that has been previously used
to study matrix induced changes in drug response.12 After
culture within the matrix, the cells were less responsive to drug
treatment in comparison to cells grown on flat substrates. This
correlates well with our results with the microwell platform,
and further indicates that we were able to mimic some aspects
of the complex environment of the matrices within the 3D
environments of this in vitro model. However, even though the
drug response was reduced in both 3D systems, the effect was
enhanced in the matrices.
In addition we found that the proliferation rate in the two
3D systems was significantly different. In the microwells
the proliferation rate was unchanged in comparison to flat
substrates, while it was significantly reduced in cell-derived
matrices. This result is coherent with previous research using
these matrices,12 however the difference in proliferation was
more pronounced in this work, possibly due to differences in
the proliferation assays utilized. As Taxol is an anti-mitotic
drug it is probable that the lower proliferation rate observed in
the cell-derived matrix could at least partially explain the
reduced drug response in the matrix. However, this is not
the case for cells cultured in the microwells, for which there
was no difference in proliferation in comparison to cells on flat
substrate. There is not always a correlation between high
mitotic frequency and elevated response to chemotherapeutic
drugs.12,38 Instead, the response to taxol should be regarded as
a function of both turn-over rate and drug sensitivity. For
highly aggressive cancers, low sensitivity to treatment may
even rule out an increased susceptibility to anti-cancer drugs
due to a high turn-over rate.39 Another aspect to consider
when comparing these two 3D systems is the organization of
the ECM, as a coating in the microwells or as fibers in the
matrix. The organization of the ECM is known to affect
integrin signaling,40 which could in turn lead to differences
in drug response.34 Hence, we suggest that the effect of
dimensionality observed in the two systems is not only related
to changes in proliferation rate and also not only induced by
the 3D characteristic of the environment. Instead, other
environmental parameters, such as the scaffold pliability, the
type and amount of cell–cell interactions and the conforma-
tion of the matrix molecules, may play additional roles in
determining responsiveness to drug treatment.
Dow
nloa
ded
on 2
9 Ja
nuar
y 20
11Pu
blis
hed
on 0
3 N
ovem
ber
2010
on
http
://pu
bs.r
sc.o
rg |
doi:1
0.10
39/C
0IB
0007
4D
View Online

This journal is c The Royal Society of Chemistry 2011 Integr. Biol., 2011, 3, 31–38 37
Conclusions
In summary, with this platform it was possible to demonstrate
the individual effect of dimensionality, adhesive proteins and
cell–cell contacts on the responsiveness of breast cancer cells to
drug treatment. Further it was possible to explore the inter-
relationship between these environmental parameters and
reveal a cumulative effect of dimensionality and matrix
composition on drug response. The lowest sensitivity to Taxol
was acquired after culture in 3D in the presence of fibronectin.
This drug response pattern can be expected to be different for
different cancer cell types and would be interesting to explore.
In addition, this could be extended to larger clusters of cells,
using microwells with a higher volume, to provide more
predictive results for cells residing in dense tumors. There
is probably not one major extrinsic factor that alters the
responsiveness to treatment in vivo and it is clear that a crucial
step in the development of more effective treatments must be
the understanding of the interdependence of signaling from
different constituents of the environment.
Materials and methods
Materials and cells
Fibronectin was isolated from fresh human plasma (Swiss Red
Cross) and labeled, when required, with Alexa Fluor 488
(Molecular Probes, Switzerland). Collagen I was purchased
from Gibco, Switzerland. The protein solutions were diluted
to a working concentration of 25 mg ml�1 for fibronectin and
46 mg ml�1 for collagen I in PBS before use. MCF-7 cells were
purchased from the American Type Culture Collection
(ATCC, Manassas, VA, USA), while HRE cells and REBMt
(Renal Epithelial Cell Basal Medium) and REGM media
supplements were purchased from Ionza, Switzerland. Dulbecco’s
modified Eagle’s medium (DMEM) cell culture media, for
MCF-7 cells, penicillin/streptomycin and FBS were all
obtained from Invitrogen, Switzerland. Taxol was purchased
in 1 mg aliquots from Sigma Aldrich and stored as 1 mM stock
solutions in DMSO at �20 1C.
Fabrication of the microwell arrays
Arrays of microwells with a diameter of 34 mm and depth of
10 mm were fabricated in PDMS as previously described.19
Briefly, microstructures were created in SU-8 on a silicon
wafer using standard photolithograpy. The structures were
transferred into a PDMS master by molding PDMS onto the
silicon wafer. After fluorosilanization of the PDMS master, it
could be repeatedly used to create thin film PDMS replicates
on thin glass cover slips (Menzel-Glaser, Germany, strength 0,
approx. 100 mm thickness). The arrays were functionalized
with protein only in the wells using a recently developed
method41 based on substractive microcontact printing (mCP).In short, the arrays were first coated with protein, and then
substractive mCP was used to remove the protein from the
plateau surface using glutaraldehyde functionalized PDMS
stamps. In a final step the surface was rendered non-adhesive
for cells by backfilling with Pluronic F-127s. 2D samples were
prepared by molding thin PDMS films on thin glass cover slips
and subsequently rendered hydrophilic in an air-plasma to
facilitate coating with protein. All samples were glued into the
bottom of a Petri dish into which a hole was previously drilled
to facilitate cell culture and imaging of the samples.
Production of cell-derived fibronectin matrices
Fibronectin matrices were produced as previously described.42
In short, over-confluent NIH 3T3 fibroblasts were cultured in
96-well plates coated with fibronectin for at least 4 days and
subsequently decelluralized. After completed decelluralization
the matrices were rinsed with PBS and reseeded with MCF-7
breast carcinoma cells within a week.
Characterization of cell morphology on the substrates
MCF-7 cells were seeded onto the substrates at 3� 10�5 cells ml�1.
After 2 h the microwell substrates were rinsed twice to remove
any non-adherent cells. After 24 h the cells were fixed using
paraformalehyde (4% for 10 min at RT) and permeabilized with
triton-X (0.1% for 20 min at RT). The cells were stained for
F-actin with Phalloidin-Alexa Fluor 488 and nuclei were
stained with propidium iodide. Imaging was performed on
inverted confocal microscopy using at least 40�magnification.
(Olympus, Switzerland).
Drug treatment and apoptosis determination
MCF-7 breast carcinoma cells were maintained in DMEM
supplemented with foetal bovine serum (10% (v/v)), penicillin
(100 U ml�1) and streptomycin (100 mg ml�1) and were grown
in a humidified atmosphere (95% (v/v) air, 5% (v/v) carbon
dioxide at 37 1C). Human renal epithelial (HRE) cells were
cultured in REBMt supplemented with REGM media
supplements, as recommended by the cell supplier. For experi-
mentation MCF-7 or HRE cells were seeded onto the
substrates at 3 � 10�5 cells ml�1 and allowed to adhere for
ca. 2 h before rinsing twice with cell culture media to remove
any non-adherent cells. Cells were cultured on the substrates
for 16 h prior to incubation with Taxol (100 nM, including
0.1% (v/v) DMSO) for 24 or 48 h. Control samples consisted
of cells cultured in DMEM media with 0.1% (v/v) DMSO to
match test samples. Cell viability was determined using the
LIVE/DEAD assay (Invitrogen) according to the manufacture’s
protocol. Apoptosis was detected by nuclear fragmentation, as
described previously.11 Nuclei were stained with Hoechst
33 342 (0.3 mg ml�1 for 20 min at 37 1C) and total nuclei and
number of fragmented nuclei was determined using an
inverted widefield microscope (Zeiss, Germany) with a 20�air objective. See Fig. 3C. Experiments were always performed
in duplicates and repeated three times. In every experiment
4100 cells were counted, with an exception for the analysis
of single cells in microwells, in which a minimum of 20 cells per
experiment were counted.
Assessment of proliferation
Proliferation was assessed using the BrdU assay according
to the manufacture’s instructions. Samples preparation and
seeding of cells was performed as described above for the
drug treatment experiments. After overnight cell adhesion the
media was exchanged for media containing 10 mM BrdU
Dow
nloa
ded
on 2
9 Ja
nuar
y 20
11Pu
blis
hed
on 0
3 N
ovem
ber
2010
on
http
://pu
bs.r
sc.o
rg |
doi:1
0.10
39/C
0IB
0007
4D
View Online
38 Integr. Biol., 2011, 3, 31–38 This journal is c The Royal Society of Chemistry 2011
(Sigma Aldrich, Switzerland) and the samples were incubated
at 37 1C for 6 h; subsequently all the samples were fixed with
ice-cold methanol (70% (v/v) in water for 20 min). The
samples were treated with 2 M HCl for 20 min, neutralized
with 0.1 M Borax for 2 min and permeabilized with 0.1% (v/v)
Triton-X for 10 min. All stages after fixation were performed
at room temperature and in between each stage of the treat-
ment the cells were washed three times with PBS. Samples
were labeled with primary mouse-anti-BrdU IgG (1 : 100 (v/v);
60 min; BD Biosciences), washed three times with PBS
and incubated with goat anti-mouse IgG Alexa Fluor 488
(1 : 400 (v/v); 60 min; Molecular Probes). 0.5% (w/v) BSA was
included in all staining buffers to avoid non-specific binding.
The samples were counterstained with Hoechst 33 342, to label
cell nuclei, and imaged using a 20� objective on an inverted
Zeiss widefield microscope. BrdU-labeled versus Hoechst
33 342 labeled nuclei were manually counted with at least
100 cells per experiment. The experiments were performed in
duplicates and repeated three times.
Statistic analysis
Quantitative data was plotted as the mean � standard error of
the mean (SEM) and normalised relative to the negative
control (cells treated with media alone). Statistical analysis
was performed using Student’s unpaired two-way t-tests
(usingMinitabTM). Comparison between data sets was performed
using one-way ANOVA (Tukey test) using MinitabTM.
Differences were considered as statistically significant when
p o 0.05.
Acknowledgements
The authors would like to thank the Competence Center for
Materials Science and Research, Switzerland, CCMX, for
their kind support of this work.
References
1 C. Mettlin, CA Cancer J. Clin., 1999, 49, 138–144.2 A. Jemal, R. Siegel, E. Ward, Y. Hao, J. Xu, T. Murray andM. Thun, CA Cancer J. Clin., 2008, 58, 71.
3 G. N. Hortobagyi, Semin. Oncol., 2004, 31, 21–27.4 P. Kenny, G. Lee, C. Myers, R. Neve, J. Semeiks, P. Spellman,K. Lorenz, E. Lee, M. Barcelloshoff and O. Petersen, Mol. Oncol.,2007, 1, 84–96.
5 A. Ivascu and M. Kubbies, J. Biomol. Screening, 2006, 11,922–932.
6 L. A. Kunz-Schughart, J. P. Freyer, F. Hofstaedter and R. Ebner,J. Biomol. Screening, 2004, 9, 273–285.
7 J. Friedrich, R. Ebner and L. Kunz-Schughart, Int. J. Radiat. Biol.,2007, 83, 849–871.
8 A. Ivascu and M. Kubbies, Int. J. Oncol., 2007, 31, 1403.9 B. St Croix, C. Sheehan, J. W. Rak, V. A. Flørenes,J. M. Slingerland and R. S. Kerbel, J. Cell Biol., 1998, 142,557–571.
10 S. K. Green, G. Francia, C. Isidoro and R. S. Kerbel,Mol. CancerTher., 2004, 3, 149–159.
11 F. Aoudjit and K. Vuori, Oncogene, 2001, 20, 4995–5004.
12 I. Serebriiskii, R. Castello-Cros, A. Lamb, E. Golemis andE. Cukierman, Matrix Biol., 2008, 27, 573–585.
13 R. Castello-Cros, D. R. Khan, J. Simons, M. Valianou andE. Cukierman, BMC Cancer, 2009, 9, 94.
14 H. Dhiman, A. R. Alok and A. K. Panda, Biomaterials, 2005, 26,979–986.
15 C. Fischbach, R. Chen, T. Matsumoto, T. Schmelzle, J. S. Brugge,P. J. Polverini and D. J. Mooney, Nat. Methods, 2007, 4,855–860.
16 K. Bhadriraju and C. S. Chen, Drug Discovery Today, 2002, 7,612–620.
17 M. Ochsner, M. Textor, V. Vogel and M. L. Smith, PLoS One,2010, 5, 9445.
18 W. Liu and C. Chen, Adv. Drug Delivery Rev., 2007, 59,1319–1328.
19 M. Ochsner, M. R. Dusseiller, H. M. Grandin, S. Luna-Morris,M. Textor, V. Vogel and M. L. Smith, Lab Chip, 2007, 7,1074–1077.
20 K. Ng, D. Leong and D. Hutmacher, Tissue Eng., 2005, 11,182–191.
21 F. A. Holmes, R. S. Walters, R. L. Theriault, A. D. Forman,L. K. Newton, M. N. Raber, A. U. Buzdar, A. U. Frye andG. N. Hortobagyi, J. Natl. Cancer Inst., 1991, 83, 1797–1805.
22 E. P. Mamounas, J. Bryant, B. Leinbersky, L. Fehrenbacher,S. M. Sedlacek, B. Fisher, D. L. Wickerham, G. Yothers,A. Soran and N. Wolmark, J. Clin. Oncol., 2005, 23, 3686–3696.
23 M. A. Jordan and L. Wilson, Curr. Biol., 1998, 10, 123–130.24 N. Morley, A. Rapp, H. Dittmar, L. Salter, D. Gould,
K. O. Greulich and A. Curnow, Mutagenesis, 2006, 21, 105–114.25 W. C. Prozialeck, J. R. Edwards, P. C. Lamar, J. Liu, V. S. Vaidya
and J. V. Bonventre, Toxicol. Appl. Pharmacol., 2009, 238,306–314.
26 H. Lovborg, P. Nygren and R. Larsson, Mol. Cancer Ther., 2004,3, 521–526.
27 J. L. Horning, S. K. Sahoo, S. Vijayaraghavalu, S. Dimitrijevic,J. K. Vasir, T. K. Jain, A. K. Panda and V. Labhasetwar, Mol.Pharmaceutics, 2008, 5, 849–862.
28 D. Henley, M. Isbill, R. Fernando, J. S. Foster and J. Wimalasena,Cancer Chemother. Pharmacol., 2006, 59, 235–249.
29 M. C. Siebers, X. F. Walboomers, J. van den Dolder, S. C. G.Leeuwenburgh, J. G. C. Wolke and J. A. Jansen, J. Mater. Sci.:Mater. Med., 2008, 19, 861–868.
30 J. Heino, Matrix Biol., 2000, 19, 319–323.31 K. Hirtenlehner, M. Pec, E. Kubista and C. F. Singer, Eur.
Cytokine Network, 2002, 13, 234–240.32 E. Yao, H. Zhang, Y. Chen, B. Lee and K. Chew, Cancer Res.,
2007, 67, 659–664.33 E. Ioachim, A. Charchanti and E. Briasoulis, Eur. J. Cancer, 2002,
38, 2362–2370.34 L. A. Hazlehurst, T. H. Landowski and W. S. Dalton, Oncogene,
2003, 22, 7396–7402.35 A. Koenig, C. Mueller, C. Hasel, G. Adler and A. Menke,
Cancer Res., 2006, 66, 4662–4671.36 J. Tsai and L. Kam, Biophys. J., 2009, 96, L39–L41.37 T. Yeung, P. C. Georges, L. A. Flanagan, B. Marg, M. Ortiz,
M. Funaki, N. Zahir, W. Ming, V. Weaver and P. A. Janmey,Cell Motil. Cytoskeleton, 2004, 60, 24–34.
38 T. Aas, S. Geisler, G. E. Eide, D. F. Haugen, J. E. Varhaug,A. M. Bassøe, T. Thorsen, H. Berntsen, A. L. Børresen-Dale,L. A. Akslen and P. E. Lønning, Eur. J. Cancer, 2003, 39, 438–446.
39 M. Meads, R. Gatenby and W. Dalton, Nat. Rev. Cancer, 2009, 9,665–674.
40 S. Even-Ram and K. M. Yamada, Curr. Opin. Cell Biol., 2005, 17,524–532.
41 M. Rottmar, M. Hakanson, M. L. Smith and K. Maniura-Weber,J. Mater. Sci.: Mater. Med., 2009, 20, 1–6.
42 K. E. Kubow, E. Klotzsch, M. L. Smith, D. Gourdon, W. C. Littleand V. Vogel, Integr. Biol., 2009, 1, 635–648.
Dow
nloa
ded
on 2
9 Ja
nuar
y 20
11Pu
blis
hed
on 0
3 N
ovem
ber
2010
on
http
://pu
bs.r
sc.o
rg |
doi:1
0.10
39/C
0IB
0007
4D
View Online