Thermal Expansion Behavior of Hot-Pressed Engineered ...
28
S.V. Raj Glenn Research Center, Cleveland, Ohio Thermal Expansion Behavior of Hot-Pressed Engineered Matrices NASA/TM—2016-218953 February 2016
-
Upload
khangminh22 -
Category
Documents
-
view
1 -
download
0
Transcript of Thermal Expansion Behavior of Hot-Pressed Engineered ...

S.V. Raj Glenn Research Center, Cleveland, Ohio
Thermal Expansion Behavior of Hot-Pressed Engineered Matrices
NASA/TM—2016-218953
February 2016

NASA STI Program . . . in Profile
Since its founding, NASA has been dedicated to the advancement of aeronautics and space science. The NASA Scientific and Technical Information (STI) Program plays a key part in helping NASA maintain this important role.
The NASA STI Program operates under the auspices of the Agency Chief Information Officer. It collects, organizes, provides for archiving, and disseminates NASA’s STI. The NASA STI Program provides access to the NASA Technical Report Server—Registered (NTRS Reg) and NASA Technical Report Server—Public (NTRS) thus providing one of the largest collections of aeronautical and space science STI in the world. Results are published in both non-NASA channels and by NASA in the NASA STI Report Series, which includes the following report types: • TECHNICAL PUBLICATION. Reports of
completed research or a major significant phase of research that present the results of NASA programs and include extensive data or theoretical analysis. Includes compilations of significant scientific and technical data and information deemed to be of continuing reference value. NASA counter-part of peer-reviewed formal professional papers, but has less stringent limitations on manuscript length and extent of graphic presentations.
• TECHNICAL MEMORANDUM. Scientific
and technical findings that are preliminary or of specialized interest, e.g., “quick-release” reports, working papers, and bibliographies that contain minimal annotation. Does not contain extensive analysis.
• CONTRACTOR REPORT. Scientific and technical findings by NASA-sponsored contractors and grantees.
• CONFERENCE PUBLICATION. Collected papers from scientific and technical conferences, symposia, seminars, or other meetings sponsored or co-sponsored by NASA.
• SPECIAL PUBLICATION. Scientific,
technical, or historical information from NASA programs, projects, and missions, often concerned with subjects having substantial public interest.
• TECHNICAL TRANSLATION. English-
language translations of foreign scientific and technical material pertinent to NASA’s mission.
For more information about the NASA STI program, see the following:
• Access the NASA STI program home page at http://www.sti.nasa.gov
• E-mail your question to [email protected] • Fax your question to the NASA STI
Information Desk at 757-864-6500
• Telephone the NASA STI Information Desk at 757-864-9658 • Write to:
NASA STI Program Mail Stop 148 NASA Langley Research Center Hampton, VA 23681-2199

S.V. Raj Glenn Research Center, Cleveland, Ohio
Thermal Expansion Behavior of Hot-Pressed Engineered Matrices
NASA/TM—2016-218953
February 2016
National Aeronautics andSpace Administration
Glenn Research Center Cleveland, Ohio 44135

Acknowledgments
The author thanks the late Ms. Anna Palczer for making the thermal expansion measurements. Drs. John Mackay and Rick Rodgers were instrumental in conducting the x-ray analyses, and their help is gratefully acknowledged. This research was funded by NASA’s Aeronautics Research and Mission Directorate’s Seedling Fund, and this support is gratefully acknowledged.
Available from
Level of Review: This material has been technically reviewed by technical management.
NASA STI ProgramMail Stop 148NASA Langley Research CenterHampton, VA 23681-2199
National Technical Information Service5285 Port Royal RoadSpringfield, VA 22161
703-605-6000
This report is available in electronic form at http://www.sti.nasa.gov/ and http://ntrs.nasa.gov/

NASA/TM—2016-218953 1
Thermal Expansion Behavior of Hot-Pressed Engineered Matrices*
S.V. Raj National Aeronautics and Space Administration
Glenn Research Center Cleveland, Ohio 44135
Abstract Advanced engineered matrix composites (EMCs) require that the coefficient of thermal expansion
(CTE) of the engineered matrix (EM) matches those of the fiber reinforcements as closely as possible in order to reduce thermal compatibility strains during heating and cooling of the composites. The present paper proposes a general concept for designing suitable matrices for long fiber reinforced composites using a rule of mixtures (ROM) approach to minimize the global differences in the thermal expansion mismatches between the fibers and the engineered matrix. Proof-of-concept studies were conducted to demonstrate the validity of the concept. Powder mixtures of seven engineered matrices were formulated based on ROM calculations and hot-pressed for thermal expansion measurements: 10(vol.%)CrSi2-70%SiC-20%Si3N4 (CrSi2-EM); 10(vol.%)CrMoSi-60%SiC-30%Si3N4 (CrMoSi-EM); 10(vol.%)MoSi2-70%SiC-20%Si3N4 (MoSi2-EM); 10(vol.%)TiSi2-70%SiC-20%Si3N4 (TiSi2-EM); 10(vol.%)WSi2-70%SiC-20%Si3N4 (WSi2-EM); 50(vol.%)MoSi2-50%Si3N4 and 20(vol.%)TiSi2-80%Si3N4. Density measurements conducted on the hot-pressed specimens revealed that the volume fractions of total porosity varied between 36 and 43%. Thermal expansion measurements were conducted between room temperature and 1523 K during three heat-cool cycles. The corrected thermal expansion, (∆L/L0)thermal, varied with the absolute temperature, T, as
(∆L/L0)thermal = A(T – 293)3 + B(T – 293)2 + C(T – 293) + D
where, A, B, C and D are regression constants. The magnitudes of (∆L/L0)thermal for the 50(vol.%)MoSi2-50%Si3N4 and 20(vol.%)TiSi2-80%Si3N4 specimens increased with increasing thermal cycle due to an increase in the global residual tensile stresses. In contrast, excellent reproducibility was observed for the other five engineered matrix compositions containing SiC after the first heat-up cycle had relieved residual stresses due to hot-pressing. The experimental (∆L/L0)thermal data on these engineered matrices are shown to be close to those for SiC thereby proving the validity of the proposed concept.
1.0 IntroductionSilicon carbide fiber-reinforced ceramic matric composites (CMCs) are being developed for use
above 1400 K in aerospace applications [1,2,3,4,5]. Designing these hot sections of gas turbine engines with lighter weight SiC/SiCf CMCs allows them to operate at higher temperatures and higher pressure ratios with reduced cooling air while leading to lower fuel burn and reduced CO2 emissions. The use of reliable, high temperature, lightweight materials in the manufacture of aircraft engines is expected to result in lower fossil and bio-fuel consumption thereby leading to cost savings and lower carbon emissions due to air travel.
* Published in: Ceramics International, Volume 42, Issue 2, Part A, 1 February 2016, pp. 2557–2569, http://dx.doi.org/10.1016/j.ceramint.2015.10.058.

NASA/TM—2016-218953 2
Typically, the matrices in traditional SiC/SiCf CMCs may consist of a combination of SiC, unreacted carbon, free Si and porosity depending on the processing techniques used for fabricating the composites. The present generation SiC/SiCf CMCs possess a low toughness matrix, where the design stresses are limited by a relatively low matrix cracking stress of about 138 MPa, so that the SiC fibers carry most of the load. Above this matrix cracking stress, uncoated SiC/SiC composites show extensive matrix damage and low durability. Oxygen ingression from the external surfaces through interconnected matrix cracks to the fiber/matrix interface, and the subsequent oxidation of the boron nitride interfacial coating leads to the premature strength degradation of the reinforcing fibers [6]. This puts severe constraints on the design of CMCs for highly stressed components, such as the high-pressure turbine blade.
It is well-known that many ceramics can be toughened by ductile second phase particles, where the fracture toughness is dependent on the nonlinear deformation of the particles and their volume fraction, Vf [7]. The critical energy release rate for crack propagation, GR, which is the work required per unit crack length to propagate the crack from a to a+δa, is given by [7]
sijijR dhVfG ijγ+εσ= ∫
ε22
0 (1)
where 2h is the width of the process zone around the crack, σij and εij are the local stresses and strains at the crack tip, and 2γs is surface energy required for creating two new surfaces as the crack tip propagates to increase the length of the crack from a to a+δa.
Thus, if the brittle matrix in the traditional SiC/SiCf CMC is suitably reformulated by adding ductile second phase particles to enhance its local plasticity at operating temperatures, then an approaching crack tip would blunt it when it meets a ductile particle. The crack tip will be blunted if D >> r, where D is the dimension of the ductile phase and r is the crack tip radius [7]. Theoretical calculations reveal that the force required to propagate a blunted crack is 15 to 20% higher than that to propagate a sharp crack [8]. A blunted crack is likely to stabilize and prevent the matrix from prematurely shedding the load to fibers so that the matrix cracking strength and the proportional limit of the composite are expected to be higher than matrices without any local plasticity.1
Although refractory metals, such as Nb, Ta and V have been used to study the ductile phase toughening of ceramics [9,10,11,12], these metals are unsuitable for use in SiC/SiCf CMCs due to the possibility that they will react with SiC to form metallic carbides and silicides. In the present investigation, several metallic silicides were considered as potential additives to the SiC matrix to enhance the crack blunting capabilities of the matrix due to the fact that many of these silicides exhibit relatively low ductile-to-brittle transition temperatures (DBTT) [13]. Figure 1 compares the thermal expansions of Si [14], several silicides [15,16], SiC [15] and Si3N4 [15]. It is evident that the thermal expansions of metallic silicides are much larger than those of SiC and deviate from it with increasing temperature. An inspection of Figure 1 demonstrates that the thermal expansion of Si3N4 is lower than SiC thereby suggesting the possibility that a mixture of silicides and Si3N4 could result in a matrix with a thermal expansion closer to SiC. Hebsur [17] formulated MoSi2-(30 and 50 vol.%) Si3N4 matrices with thermal expansions designed to match that of SCS-6 large diameter SiC fibers, and demonstrated that the resulting composite could be thermally cycled between 473 and 1473 K for 1000 cycles without cracking. However, no data were reported on the thermal conductivity of these MoSi2/Si3N4 matrices, which is likely to be significantly lower than a pure SiC matrix due to the high volume fractions of MoSi2 and Si3N4 in the matrix. As a result, non-uniform temperature distribution and associated hot spots would lead to a non-uniform thermal strain distribution in a CMC component.
1 The term “local plasticity” as used in this paper refers to the properties of the matrix ahead of a crack tip. It differs from the concept of general plasticity observed in metallic systems.

NASA/TM—2016-218953 3
Figure 1.—Comparison of the temperature dependence of the average
thermal expansion behavior of hot-pressed CrSi2 [16], Cr-30(at.%)Mo-30%Si [16], MoSi2 [15], Si [14], SiC [15], Si3N4 [15], TiSi2 [16] and WSi2 [16] between 293 and 2000 K.
Figure 2.—Schematic showing a matrix consisting of a silicide, SiC and a
nitride engineered to match its thermal expansion with that of the SiC fibers.
Alternatively, an engineered matrix (EM) can be designed to theoretically match its thermal
expansion to that of the fibers (Figure 2) using a simple rule of mixtures (ROM) approach or a more sophisticated model with better durability and thermal conductivity properties than the MoSi2/Si3N4 matrices used by Hebsur [17]. An engineered matrix is designed by mixing different volume fractions of three or more constituents so that the following condition is fulfilled
(∆L/L0)fiber = (∆L/L0)EM = V1(∆L/L0)1 + V2(∆L/L0)2 + V3(∆L/L0)3 + … (2)

NASA/TM—2016-218953 4
where (∆L/L0)fiber is the thermal strain in the fiber, (∆L/L0)EM is the thermal strain in the engineered matrix, (∆L/L0)i is thermal strain of the ith constituent (i = 1,2,3…n), Vi is the volume fraction of the ith
constituent, and ∑ ==
ni iV
11 . It is important to note that Equation (2) is a general concept applicable for
any non-reactive long fiber engineered matrix composite (EMC). For the specific case of a three-constituent engineered matrix consisting of a silicide, SiC and Si3N4, Equation (2) can be expressed as
(∆L/L0)SiC fiber = (∆L/L0)EM = Vsilicide(∆L/L0)silicide + VSiC(∆L/L0) SiC + VSi3N4 (∆L/L0) Si3N4 (3)
Additional terms must be added if self-healing and other additives are added to the matrix. The current investigation was undertaken as part of a larger research program to develop self-healing
engineered matrix composites (EMCs) reinforced by SiC fibers [18].While in principle Equation (3) could be used to design engineered matrices to match the thermal expansion of the SiC fibers, this hypothesis needs to be demonstrated. The objective of the present paper is to demonstrate the validity of this theoretical concept on five engineered matrix compositions, which were formulated, hot-pressed and tested using Equation (3). The compositions of these engineered matrices were: 10(vol.%)CrSi2-70%SiC-20%Si3N4 (CrSi2-EM); 10(vol.%)CrMoSi-60%SiC-30%Si3N4 (CrMoSi-EM); 10(vol.%)MoSi2-70%SiC-20%Si3N4 (MoSi2-EM); 10(vol.%)TiSi2-70%SiC-20%Si3N4 (TiSi2-EM) and 10(vol.%)WSi2-70%SiC-20%Si3N4 (WSi2-EM). A 50(vol.%) MoSi2-50(%) Si3N4 specimen [17] was also tested to see whether randomly mixing intermetallic silicides with Si3N4 would result in an engineered matrix that is thermally compatible with the SiC. An additional composition consisting of 50(vol.%) TiSi2-80(%)Si3N4 was formulated using Equation (3) (i.e., VSiC = 0) tested, where the (∆L/L0)EM calculated for this engineered matrix was an exact match with (∆L/L0)SiC.
2.0 Experimental Procedures Commercially produced silicide powders (-325 mesh) of CrSi2, TiSi2, WSi2 and a Cr-30(at.%)Mo-
30%Si alloy (CrMoSi) [19,20] were used in this investigation, where the sources and chemical analyses of the powders are given elsewhere [16]. High purity Si3N4 (grade SN-E10) powders were procured from Ube America, Inc., New York, N.Y. High purity β-SiC (HSC059) submicron powders were procured from the Superior Graphite Co., Chicago, Illinois. X-ray diffraction analyses of the constituent powders were performed to identify the phases present in them (Table 1). The CrSi2, the two-phase CrMoSi alloy and the β-SiC powders contained the expected phases. In contrast, the MoSi2 contained about 0.3 (vol.%) Mo3Si and 8.3% free Si; the Si3N4 consisted of 98.5% of the β-phase and 1.5% of α-phase; the TiSi2 powder contained 7.3% free Si and 4.7% TiSi; whereas, the WSi2 powder contained 6.1%Si and 3.9% W5Si3.
TABLE 1.—PHASES PRESENT IN THE CONSTITUENT
POWDERS AS DETERMINED BY XRD Composition Major phases
(vol.%)a CrSi2 CrSi2 (100%)
CrMoSi (Cr,Mo)5Si3 (55.6%); (Cr,Mo)3Si (44.5%) MoSi2 MoSi2 (91.4%); Mo3Si (0.3%); Si (8.3%)
β-SiC β-SiC (100%)
α-Si3N4 α-Si3N4 (98.5%); β-Si3N4 (1.5%) TiSi2 TiSi2 (88.0%); Si (7.3%); TiSi (4.7%) WSi2 WSi2 (90.0%); Si (6.1%); W5Si3 (3.9%)
a Semi-quantitative analyses.

NASA/TM—2016-218953 5
The major constituents, SiC, Si3N4 and the metallic silicides, were weighed in the required amounts using Equation (3). Unfortunately, extensive thermal expansion data as a function of temperature were not always available for some of the silicides (e.g., CrSi2) used at the start of this investigation2 so that the calculated volume fractions, and the corresponding weight fractions, for these silicides had to be estimated based on limited data. Five engineered matrices were formulated for thermal expansion measurements: 10(vol.%)CrSi2-70%SiC-20%Si3N4 (CrSi2-EM); 10(vol.%)CrMoSi-60%SiC-30%Si3N4 (CrMoSi-EM); 10(vol.%)MoSi2-70%SiC-20%Si3N4 (MoSi2-EM); 10(vol.%)TiSi2-70%SiC-20%Si3N4 (TiSi2-EM) and 10(vol.%)WSi2-70%SiC-20%Si3N4 (WSi2-EM). Additionally, attrition milled 50(vol.%) MoSi2-50(%) Si3N4 powder from an earlier investigation [17] was also used in this investigation to determine whether the thermal expansion of this matrix is close to that for SiC. Powders consisting of 50(vol.%) TiSi2-80(%)Si3N4 were also formulated according to Equation (3) with VSiC = 0 for thermal expansion measurements. The powders were wet ball ground in ethanol using SiC grinding media for 48 h. After drying, the powder cake was hand ground to powder before being hot-pressed under pure argon into cylindrical specimens. The hot pressing temperatures varied between 1183 and 2073 K while the hot pressing stresses varied between 69 and 105 MPa for times varying between 0.25 and 4 h.
Porosity measurements were conducted on hot-pressed cylindrical specimens 25.4 mm long and 9.5 mm in diameter using the Archimedes immersion technique. The dry mass, the mass immersed in methyl ethyl ketone (MEK) (density = 0.8025 g/cc), and the mass in air after saturation with MEK were measured. The apparent volumes calculated from these measurements were in close agreement with the geometric volume, where the difference was less than 0.02 cm3 between the two sets of data. Table 2 tabulates the volume fractions of the closed, Vclosed, open, Vopen, and total, Vtotal, porosities in the specimens. The last column gives the values of the total porosity in the specimens determined from the physical, ρphysical, and theoretical, ρtheoretical, densities of the materials, where ρtheoretical, was estimated by ROM. It is clear that the two sets of values for Vtotal are in very close agreement.
Thermal expansion measurements were conducted on hot-pressed cylindrical specimens 25.4 mm long and 9.5 mm in diameter with flat and parallel faces using a NETZSCH Dilatometer Model DIL 402C equipped with a high purity alumina as a calibration standard. Measurements were made over three heat-cool cycles to: (a) minimize the effects of compositional, microstructural and processing variables on the data; (b) determine the extent of scatter in the data; and (c) to evaluate statistical averages of the coefficients for the regression curve. The specimen was placed in a sample holder and aligned with a single push-rod under an applied constant load of 0.2 N. The specimens were heated from 293 to 1523 K at 10 K/min in the first cycle and cooled to 373 K at 10 K/min in the first cool-down cycle. Subsequent cycles consisted of heating and cooling between 373 and 1523K. All measurements were conducted in a
TABLE 2.—VOLUME FRACTIONS OF CLOSED (fclosed), OPEN (fopen), AND TOTAL (ftotal) POROSITY IN THE HOT-PRESSED CTE SPECIMENS
Composition Vopen (%)
Vclosed (%)
Vtotal = Vopen + Vclosed (%)
Vtotal = (1 – ρphysical/ρtheoretical)a (%)
20(vol.%)TiSi2-80%Si3N4 41.8 1.5 43.3 43.1 10(vol.%)CrSi2-70%SiC-20%Si3N4 33.7 2.5 36.2 37.0 10(vol.%)MoSi2-70%SiC-20%Si3N4 34.8 3.7 38.5 39.8 10(vol.%)CrMoSi-60%SiC-30%Si3N4 34.7 1.7 36.5 36.3 10(vol.%)TiSi2-70%SiC-20%Si3N4 39.4 1.1 40.6 40.5 10(vol.%)WSi2-70%SiC-20%Si3N4 37.0 3.1 40.1 40.7
a ρphysical and ρtheoretical are the physical and theoretical densities, respectively.
2 The data on CrSi2 published in Ref. [16] was determined as part of the current research.

NASA/TM—2016-218953 6
He atmosphere flowing at 60 cc/min. The length changes were recorded by a computerized data acquisition system. The experimental strain, ∆L/L0, where ∆L is the differential change in length, L – L0, and L0 is the original length of the specimen at room temperature, were measured. Thermal expansion measurements were made on five engineered matrices (CrSi2-EM, CrMoSi-EM, MoSi2-EM, TiSi2-EM and WSi2-EM) as well as on MoSi2-50(vol.%)Si3N4 and TiSi2-80(vol.%)Si3N4 specimens. Previous measurements on CrSi2, Cr-30(at.%)Mo-30%Si, TiSi2, and WSi2 were reported in an earlier paper [16] and these data are included in Section 3.2.1 for the sake of completeness.
Microstructural characterization of the hot-pressed specimens were conducted by optical and scanning electron microscopy (SEM), back scattered electron (BSE) imaging, energy dispersive spectroscopy (EDS) and x-ray elemental maps. The specimens used in the thermal expansion studies were crushed by hand using a mortar and a pestle. These EM powders were examined by x-ray diffraction (XRD) using Cu Kα radiation. Quantitative phase analyses (QPA) were performed using whole pattern fitting by the Rietveld method. The analyses of the EM powders were complicated by the fact that there were several overlapping lines for the different phases for most of the compositions. In order to improve the accuracy of the phase analyses, the XRD patterns for each EM powder composition were compared with those for the individual constituents as well as with the EDS analyses. However, in a few instances, there were discrepancies between the QPA and the EDS analyses, which were attributed to one or more factors, such as an inhomogeneous distribution of the phases and difficulties in the QPA due to overlapping lines in the XRD patterns. However, the precise reasons for these discrepancies are unclear.
3.0 Results and Discussion 3.1 Microstructures and X-Ray Diffraction Analyses
Microstructural observations of the hot-pressed specimens revealed a distribution of relatively coarse SiC intermixed with finer Si3N4 particles; the white silicide particles were variously distributed in the microstructure (Figure 3 to Figure 8). The presence of coarse SiC particles suggested that the microstructures were not completely consolidated, which was consistent with the high level of porosity observed in these specimens (Table 2). In the case of the CrSi2-EM, the Si3N4 particles showed C and O peaks in addition to the N and Si peaks, while the white particles showed C, Cr, and Si peaks (Figure 3). Since the specimens were coated with carbon for the SEM observations, the observation of a C peak was at least in part due to the presence of this coating. Thus, it was unclear whether these were silicon oxy-nitride or silicon oxy-carbo-nitride particles. The white chromium silicide particles were distributed fairly homogenously within the microstructure (Figure 3(a) and (b)).
The EDS analyses of different particles in the CrMoSi-EM specimen revealed strong Cr, Mo and Si peaks and a much smaller O peak from the white particles (Figure 4(c)). Once again, the larger gray particles exhibited only C and Si peaks thereby confirming that they were SiC particles. The fine particles exhibited C, O, N and Si peaks in the EDS analysis suggesting that these were silicon oxy-nitride, or possibly silicon oxy-carbo-nitride particles. The white silicide particles were inhomogeneously distributed at the grain boundaries of the SiC/Si3N4 agglomerated microstructure. Figure 5(a) and (b) showed the low and high magnification microstructures of the MoSi2-EM specimens, where the white silicide particles were distributed fairly homogeneously throughout the microstructure. The EDS spectra from the white particles revealed that they were rich in Mo and Si while the gray phase entrapped within the white particles revealed the presence of C, Mo, O and Si peaks (Figure 5(c)). The BSE images for the TiSi2-EM specimen showed that the white particles were inhomogeneously distributed throughout the microstructure (Figure 6(a) and (b)). These white particles exhibited strong Si and Ti peaks and a relatively weak C peak in the EDS analysis (Figure 6(c)). In contrast, the EDS analysis of the gray particles showed a strong Si peak and relatively weak C and Ti peaks. The BSE images for the WSi2-EM specimen revealed a relatively homogeneous distribution of the white particles in the microstructure

NASA/TM—2016-218953 7
(Figure 7(a) and (b)), where an EDS analysis revealed a strong W peak and an absence of Si; a weak C peak was observed (Figure 7(c)). The adjacent gray phase showed overlapping Si and W peaks. X-ray elemental maps confirmed that the white particles contained C and W with an absence of Si, thereby suggesting that they were WC particles (Figure 8). The gray particles shown in Figure 7(c) revealed an absence of W but contained C and Si thereby suggesting that they were SiC particles.
Figure 3.—(a) Low and (b) high magnification views of back scattered electron images of a hot-pressed
10(vol.%)CrSi2-70%SiC-20%Si3N4 specimen; and (c) energy dispersion spectra from different regions of a backscattered electron micrograph.

NASA/TM—2016-218953 8
Figure 4.—(a) Low and (b) high magnification views of secondary electron images of a hot-pressed 10(vol.%)CrMoSi-
60%SiC-30%Si3N4 specimen; and (c) back-scattered electron micrograph and energy dispersion spectra.

NASA/TM—2016-218953 9
Figure 5.—(a) Low and (b) high magnification views of secondary electron images of a hot-pressed 10(vol.%)MoSi2-
70%SiC-20%Si3N4 specimen; and (c) energy dispersion spectra from different regions of a secondary electron image.

NASA/TM—2016-218953 10
Figure 6.—(a) Low and (b) high magnification views of back-scattered electron images of a hot-pressed
10(vol.%)TiSi2-70%SiC-20%Si3N4 specimen; and (c) energy dispersion spectra of regions C and D showing gray Si-rich and white particles containing Si and Ti, respectively.
Table 3 shows the QPA determined by XRD of the hot-pressed engineered matrix specimens after
they were ground to powder following the thermal expansion measurements. All the powders revealed that SiC and Si3N4 originally present in the attrition milled powders were still the two major phases in the hot-pressed engineered matrix specimens. The x-ray data revealed that the intermetallic phases in the powders had reacted with the SiC and the Si3N4 during hot pressing and/or subsequent thermal expansion measurements. However, the x-ray analyses were not always consistent with the EDS results discussed above and the reasons for these inconsistencies, while not unambiguously identified at present, appear to be due to difficulties in the analyses of the XRD data, which exhibited many overlapping peaks. For example, the EDS and the x-ray data are consistent for the CrSi2-EM material but they are inconsistent for the CrMoSi-EM material. In the latter case, the EDS revealed that the white particles contained Cr, Mo and Si (Figure 4), whereas the x-ray data shown in Table 3 does not contain any phase with these elements. Similarly, while the EDS observations on the gray phase shown in Figure 5 shows peaks for C, O, Mo and Si for the MoSi2-EM material, the x-ray analyses failed to reveal any phase with these four elements (Table 3). Again, the x-ray data analyses did not show the presence of any Ti-Si phase although the EDS spectra from the white phase shown in Figure 6 shows C, Si and Ti peaks. In contrast, the EDS results for the WSi2-EM material (Figure 7 and Figure 8) are consistent with the x-ray data and confirms that the silicide particles had reacted to form WC and W2C particles (Table 3).

NASA/TM—2016-218953 11
TABLE 3.—QUANTITATIVE PHASE ANALYSES OF THE SPECIMENS AFTER THERMAL EXPANSION MEASUREMENTS DETERMINED BY XRD USING THE WHOLE PATTERN RIETVELD METHOD
Nominal composition Phases (vol.%)a
20(vol.%)TiSi2-80%Si3N4 α-Si3N4 (79.2%); TiSi2 (12.5%); TiN (2.8%); Ti0.83N0.17 (2.7%); SiO2 (2.2%) β-Si3N4 (0.7%)
10(vol.%)CrSi2-70%SiC-20%Si3N4 β-SiC (68.4%); α-Si3N4 (20.8%); Cr5-xSi3-zCx+z (3.0%); Si2N2O (2.5%); α-SiC (1.8%); CrSi2 (1.7%); CrSi (0.9%); β-Si3N4 (0.9%)
10(vol.%)CrMoSi-60%SiC-30%Si3N4 β-SiC (54.4%); α-Si3N4 (33.7%); β-Si3N4 (5.9%); Cr5-xSi3-zCx+z (4.2%); α-SiC (1.9%) 10(vol.%)MoSi2-70%SiC-20%Si3N4 β-SiC (64.3%); α-Si3N4 (24.7%); β-Si3N4 (4.1%); α-SiC (2.2%); Mo5Si3 (1.8%);
MoxSi3Cy (1.7%); MoC0.5 (0.6%); SiC2N4 (0.5%); Mo (0.2%)
10(vol.%)TiSi2-70%SiC-20%Si3N4 β-SiC (51.6%); α-Si3N4 (19.4%); α-SiC (18.1%); Si2N2O (5.9%); TiN (3.4%); β-Si3N4 (1.6%)
10(vol.%)WSi2-70%SiC-20%Si3N4 β-SiC (60.2%); α-Si3N4 (31.8%); β-Si3N4 (4.6%); WC (2.8%); W2C (0.6%); W (0.04%) a The XRD data were obtained from powders after grinding the specimens used in the thermal expansion measurements.
Figure 7.—(a) Low and (b) high magnification views of back-scattered electron images of a hot-pressed
10(vol.%)WSi2-70%SiC-20%Si3N4 specimen; and (c) energy dispersion spectra of regions A and B showing presumably gray W-Si particles and white W-rich particles, respectively.

NASA/TM—2016-218953 12
Figure 8.—Scanning electron image of hot-pressed 10(vol.%)WiSi2-70%SiC-20%Si3N4 engineered matrix and C, Si
and W x-ray maps showing SiC, WC and WSi2 particles, respectively.
3.2 Thermal Expansion
3.2.1 Thermal Expansion of Binary Silicides and CrMoSi Figure 9 and Figure 10(a) to (c) show the thermal expansion behaviors of CrSi2 CrMoSi, TiSi2 and
WSi2, respectively, for three heat-cool cycles. Details of the thermal expansion data generated on the disilicides and the CrMoSi alloy used in this investigation are reported in detail elsewhere [16]. For CrSi2
and WSi2, the thermal expansions during the first heat-up cycle were different than those in the subsequent cool-down and heat-up cycles (Figure 9 and Figure 10(c)). These differences in behavior were attributed to the effects of global residual stresses generated during cool down from the hot-pressing temperatures, which are subsequently annealed out after the first heat-up cycle similar to observations in other materials [21]. There were no significant differences in the thermal expansion behaviors of CrMoSi and TiSi2 between the first heat-up and the other thermal cycles. Neglecting the data from the first heat-up cycle, the data from the first cool-down to the third cool-down cycles were fitted with Equation (4):
(∆L/L0)thermal = A(T – 293)3 + B(T – 293)2 + C(T – 293) + D (4)
where, (∆L/L0)thermal is the magnitude of the ∆L/L0 without any residual processing strains, T is the absolute temperature, A, B, C and D are regression constants. The magnitudes of these constants are reported elsewhere [16].

NASA/TM—2016-218953 13
Figure 9.—Temperature dependence of the thermal expansion
behavior of a CrSi2 specimen during three heat up-cool down cycles between 293 and 1523 K [16].
Figure 10.—Temperature dependence of the thermal expansion
behaviors of (a) a Cr-30(at.%)Mo-30%Si specimen, (b) TiSi2 and (c) WSi2 during three heat up-cool down cycles between 293 and 1523 K [16]. The literature data for Cr3Si, TiSi2 and WSi2 are also shown in the figure for comparison [15].

NASA/TM—2016-218953 14
Figure 10.—Concluded.
3.2.2 Effect of Si3N4 Addition on the Thermal Expansions of MoSi2 and TiSi2
As demonstrated in Figure 2, the magnitudes of ∆L/L0 for MoSi2 and TiSi2 are larger than those for SiC and Si3N4 with the extent of deviation increasing with increasing temperature. Since the ∆L/L0 – T curves for the silicides and Si3N4 lie on either side of the data for SiC, an important question that arises is: Can the binary silicides be mixed with appropriate amounts of Si3N4 so that the thermal expansions of the engineered materials equal those of SiC at all temperatures? In an earlier investigation [17], it was suggested that the addition of 50(vol.%) Si3N4 to MoSi2 can decrease its thermal expansion to values close to those of SiC. Figure 11 shows the thermal expansion behavior of a specimen made from the same MoSi2-50(vol.%)Si3N4 powder.3 The magnitudes of ∆L/L0 for the first heat-up cycle are in excellent agreement with the literature data for SiC4 [15,22] up to 1200 K. Beyond 1200 K, there is a significant deviation in the values of ∆L/L0 for the two materials, which increases with increasing temperature. The ∆L/L0 data for MoSi2-50(vol.%)Si3N4 are significantly higher than those for SiC at all temperatures in the subsequent cycles. Unlike the excellent reproducibility observed for the disilicides and the CrMoSi alloy after the first heat-up cycle (Figure 9 and Figure 10), the ∆L/L0 – T curves are displaced upwards towards higher values of ∆L/L0 with each thermal cycle for the MoSi2-50(vol.%)Si3N4 material. The increasing values of ∆L/L0 with increasing number of thermal cycles and the fact that ∆L/L0 values are positive suggests that thermal cycling of this material leads to the development of global residual tensile stresses.
Figure 12 shows the thermal expansion behavior of the TiSi2-80(vol.%) Si3N4 material. Once again, the ∆L/L0 – T curves for TiSi2-80(vol.%) Si3N4 and SiC [15] are in excellent agreement until about 1300 K for the first heat-up cycle but deviate significantly for subsequent cool-down and heat-up cycles. A close examination of the data shows hysteresis after each heat-up and cool-down stage with the curves shifting upwards to higher values of ∆L/L0. The observation of hysteresis indicates plastic deformation of the matrix presumably due to deformation of the TiSi2 phase above the DBTT. The fact that the ∆L/L0 – T curves for first heat-up cycle matches very well the data for SiC is consistent with the predictions of
3 It is noted that the first and the second heat-up and cool-down cycles were conducted in two separate runs due to a problem with the equipment after the first cool-down cycle. Thus, a constant offset correction of 0.195% was added to the second heat-up and cool-down cycle data to enable the end point of the first cool-down cycle to match the starting point of the second heat-up cycle. 4 The data shown in this paper are for α-SiC which were determined over a larger temperature range than those for β-SiC. It is noted that the thermal expansion data for α-SiC [15] and β-SiC [22] are fairly close up to 1300 K so that the inclusion of α-SiC data in the figures is expected to be representative for β-SiC. Thus, the curves are generically identified as “SiC” in this paper.

NASA/TM—2016-218953 15
Equation (3). However, subsequent thermal cycles results in a significant deviation between the two sets of curves, with the ∆L/L0 – T curves shifting upwards after each cycle, due to the development of global tensile residual stresses in the TiSi2-80(vol.%) Si3N4 matrix.
Clearly, just adding sufficient amounts of Si3N4 to MoSi2 and TiSi2 does not reproducibly reduce the thermal expansion mismatch between these silicides and SiC. The reason for this mismatch appears to be due to the development of residual tensile stresses. If sufficiently high, these tensile stresses can lead to crack formation in the matrix and a resulting increase in the magnitudes of ∆L/L0. These observations give credence to the fact that engineered matrices must be designed carefully to ensure resistance to thermal fatigue.
Figure 11.—Temperature dependence of the thermal expansion
behavior of a MoSi2-50(vol.%)Si3N4 specimen during three heat up-cool down cycles between 293 and 1688 K. The data for SiC is included for comparison [15].
Figure 12.—Temperature dependence of the thermal expansion
behavior of TiSi2-80(vol.%)Si3N4 during three heat up-cool down cycles between 293 and 1523 K. The literature data for SiC is also shown in the figure for comparison [15].
-0.5
0.0
0.5
1.0
1.5
2.0
0 200 400 600 800 1000 1200 1400 1600 1800
∆L/
L 0(%
)
T (K)
1st heat up1st-cool down2nd heat up2nd cool downSiC Touloukian et al. (1977)
MoSi2-50(vol.%)Si3N4
SiC
NASA/TM—2016-218953 16
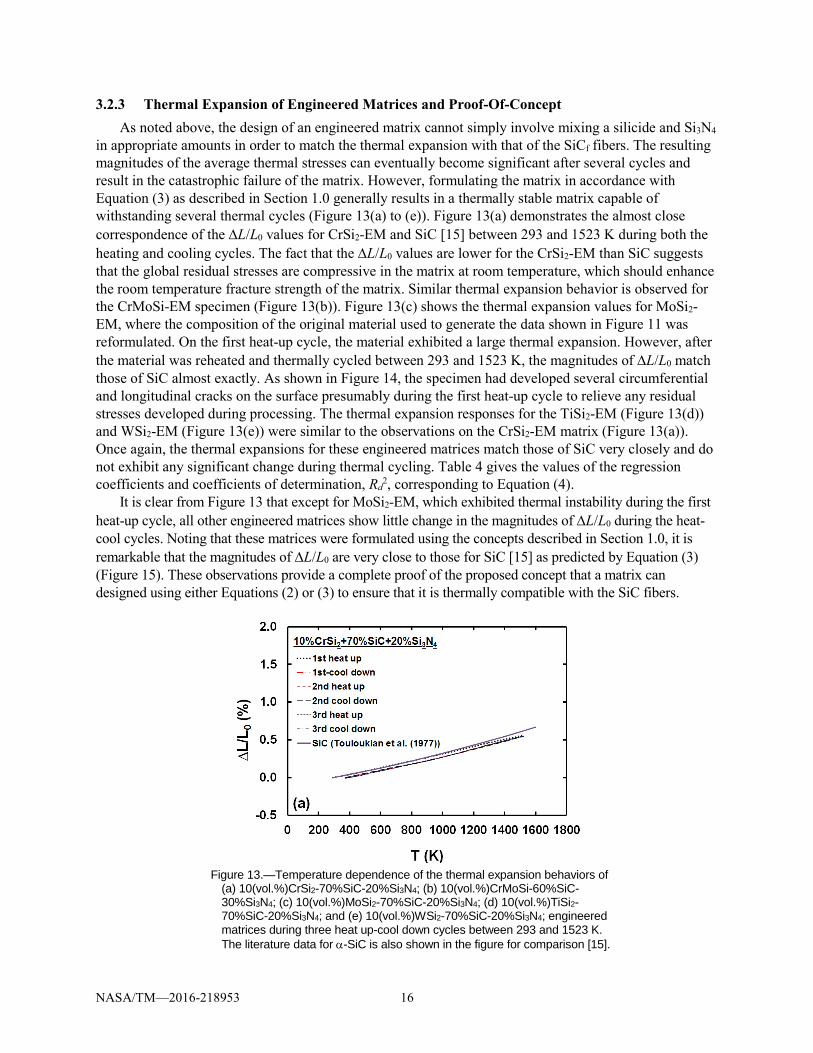
3.2.3 Thermal Expansion of Engineered Matrices and Proof-Of-Concept As noted above, the design of an engineered matrix cannot simply involve mixing a silicide and Si3N4
in appropriate amounts in order to match the thermal expansion with that of the SiCf fibers. The resulting magnitudes of the average thermal stresses can eventually become significant after several cycles and result in the catastrophic failure of the matrix. However, formulating the matrix in accordance with Equation (3) as described in Section 1.0 generally results in a thermally stable matrix capable of withstanding several thermal cycles (Figure 13(a) to (e)). Figure 13(a) demonstrates the almost close correspondence of the ∆L/L0 values for CrSi2-EM and SiC [15] between 293 and 1523 K during both the heating and cooling cycles. The fact that the ∆L/L0 values are lower for the CrSi2-EM than SiC suggests that the global residual stresses are compressive in the matrix at room temperature, which should enhance the room temperature fracture strength of the matrix. Similar thermal expansion behavior is observed for the CrMoSi-EM specimen (Figure 13(b)). Figure 13(c) shows the thermal expansion values for MoSi2-EM, where the composition of the original material used to generate the data shown in Figure 11 was reformulated. On the first heat-up cycle, the material exhibited a large thermal expansion. However, after the material was reheated and thermally cycled between 293 and 1523 K, the magnitudes of ∆L/L0 match those of SiC almost exactly. As shown in Figure 14, the specimen had developed several circumferential and longitudinal cracks on the surface presumably during the first heat-up cycle to relieve any residual stresses developed during processing. The thermal expansion responses for the TiSi2-EM (Figure 13(d)) and WSi2-EM (Figure 13(e)) were similar to the observations on the CrSi2-EM matrix (Figure 13(a)). Once again, the thermal expansions for these engineered matrices match those of SiC very closely and do not exhibit any significant change during thermal cycling. Table 4 gives the values of the regression coefficients and coefficients of determination, Rd
2, corresponding to Equation (4). It is clear from Figure 13 that except for MoSi2-EM, which exhibited thermal instability during the first
heat-up cycle, all other engineered matrices show little change in the magnitudes of ∆L/L0 during the heat-cool cycles. Noting that these matrices were formulated using the concepts described in Section 1.0, it is remarkable that the magnitudes of ∆L/L0 are very close to those for SiC [15] as predicted by Equation (3) (Figure 15). These observations provide a complete proof of the proposed concept that a matrix can designed using either Equations (2) or (3) to ensure that it is thermally compatible with the SiC fibers.
Figure 13.—Temperature dependence of the thermal expansion behaviors of
(a) 10(vol.%)CrSi2-70%SiC-20%Si3N4; (b) 10(vol.%)CrMoSi-60%SiC-30%Si3N4; (c) 10(vol.%)MoSi2-70%SiC-20%Si3N4; (d) 10(vol.%)TiSi2-70%SiC-20%Si3N4; and (e) 10(vol.%)WSi2-70%SiC-20%Si3N4; engineered matrices during three heat up-cool down cycles between 293 and 1523 K. The literature data for α-SiC is also shown in the figure for comparison [15].

NASA/TM—2016-218953 17
Figure 13(b)
Figure 13(c)
Figure 13(d)
Figure 13.—Continued.

NASA/TM—2016-218953 18
Figure 13(e)
Figure 13.—Concluded.
Figure 14.—Macrograph of the 10(vol.%)MoSi2-70%SiC-20%Si3N4
specimen after thermally cycling between 293 and 1523 K showing several circumferential and longitudinal cracks.
TABLE 4.—VALUES OF THE REGRESSION CONSTANTS FOR SEVERAL ENGINEERED MATRICES Engineered matrix Cycle description A
(%K–3) B
(%K–2) C
(%K–1) D
(%) Rd2
10%CrSi2-70%SiC-20%Si3N4 (Figure 13(a))
1st cool-down to 3rd cool-down 2.1×10⁻¹² 7.6×10⁻⁸ 3.8×10⁻⁴ –3.5×10⁻² 0.9995
10%CrMoSi-60%SiC-30%Si3N4 (Figure 13(b))
1st cool-down to 3rd cool-down 3.8×10⁻¹¹ 3.6×10⁻⁸ 3.6×10⁻⁴ –4.7×10⁻² 0.9989
10%MoSi2-70%SiC-20%Si3N4 (Figure 13(c))
1st reheat up to 3rd cool-down –1.5×10⁻¹¹ 8.9×10⁻⁸ 3.5×10⁻⁴ 1.4×10⁻² 0.9938
10%TiSi2-70%SiC-20%Si3N4 (Figure 13(d))
1st heat up to 3rd cool-down –5.6×10⁻¹¹ 1.9×10⁻⁷ 3.6×10⁻⁴ –1.2×10⁻² 0.9861
10%WSi2-70%SiC-20%Si3N4 (Figure 13(e))
1st heat up to 3rd cool-down –6.2×10⁻¹¹ 2.0×10⁻⁷ 3.2×10⁻⁴ –1.5×10⁻² 0.9870

NASA/TM—2016-218953 19
Figure 15.—Comparison of the temperature dependence of the
thermal strains for disilicides [16], CrMoSi [16], engineered matrices, α-SiC [15] and α-Si3N4 [15].
4.0 Summary and Conclusions A generalized concept is proposed to design engineered matrix compositions which are thermally
compatible with the SiCf fiber reinforcements using a rule of mixtures approach. In order to test this concept, thermal expansion measurements were conducted on several hot-pressed engineered matrix specimens between room temperature and 1523 K, and these data were compared with literature data for α-SiC. The matrix compositions tested were: 10(vol.%)CrSi2-70%SiC-20%Si3N4 (CrSi2-EM), 10(vol.%)CrMoSi-60%SiC-30%Si3N4 (CrMoSi-EM), 10(vol.%)TiSi2-70%SiC-20%Si3N4 (TiSi2-EM) and 10(vol.%)WSi2-70%SiC-20%Si3N4 (WSi2-EM)MoSi2-50(vol.%)Si3N4 and TiSi2-80(vol.%)Si3N4. It was observed that the ∆L/L0 – T curves for MoSi2-50(vol.%)Si3N4 and TiSi2-80(vol.%)Si3N4 moved upwards towards higher values of ∆L/L0 after the first heat-up cycles due to the development of tensile residual stresses during thermal cycling.
The 10(vol.%)MoSi2-70%SiC-20%Si3N4 (MoSi2-EM) material showed a large increase in ∆L/L0 during the first heat-up cycle, which was presumably due to the development of circumferential and longitudinal cracks observed on the sample surface after testing. However, the ∆L/L0 – T curves were almost identical to that for SiC in subsequent heat-up-cool down cycles. In contrast, the ∆L/L0 – T curves for CrSi2-EM, CrMoSi-EM, TiSi2-EM and WSi2-EM either exactly matched or were below the curve for SiC. It is concluded that these observations prove the concept proposed in this paper that a rule of mixtures approach can be used to engineer matrices with thermal expansions similar to SiCf fibers in CMCs.
References1. D. Brewer, “HSR/EPM Combustor Materials Development Program,” Mater. Sci. Eng. A, A261,
(1999) 284-291. 2. C. M. Grondahl and T. Tsuchiya, “Performance Benefit Assessment of Ceramic Components in a
MS9001FA Gas Turbine,” J. Eng. Gas Turbine Power 123, (2000) 513-519.
0.0
0.5
1.0
1.5
2.0
0 500 1000 1500 2000 250
∆L/
L 0(%
)
T (K)
CrSi2
CrMoSi
MoSi2+50%Si3N4
Si3N4
SiC
TiSi2
WSi2
CrSi2-EM
CrMoSi-EM
MoSi2-EM
TiSi2-EM
WSi2-EM
SiC
Si3N4
Disilicides & CrMoSi

NASA/TM—2016-218953 20
3. T. Kameda, Y. Itoh, T. Hishata and T. Okamura, “Development of Continuous Fiber Reinforced Reaction Sintered Silicon Carbide Matrix Composite for Gas Turbine Hot Parts Application,” ASME, 2000-GT-67 (2000).
4. G. S. Corman and K. L. Luthra, “Silicon Melt Infiltrated Ceramic Composites (HiPerComp),” in: N. P. Bansal (Ed.), Handbook of Ceramic Composites, Kluwer Academic Publishers, Boston, MA (2005) pp. 99-115.
5. F. Christin, “CMC Materials for Space and Aeronautical Applications,” in: W. Krenkel (Ed.), Ceramic Matrix Composites, Wiley-VCH Verlag, (2008) pp. 327-351.
6. J. A. DiCarlo, H. M. Yun, G. N. Morscher and R. T. Bhatt, “SiC/SiC Composites for 1200 °C and Above,” in: N. P. Bansal (Ed.), Handbook of Ceramic and Composites, Kluwer Academic Publishers, Boston, MA (2005) pp. 77-98.
7. T. L. Anderson, Fracture Mechanics: Fundamentals and Applications (2nd ed.), CRC Press, Boca Raton, LA, (1995) pp. 343-350.
8. L. L. Fischer and G. E. Beltz, “The effect of crack blunting on the competition between dislocation nucleation and cleavage,” J. Mech. Phys. Sol. 49, (2001) pp. 635-654.
9. L. S. Sigl, P. A. Mataga, B. J. Dalgleish, R. M. McMeeking and A. G. Evans, “On the toughness of brittle materials reinforced with a ductile phase,” Acta Metall. 36, (1988) pp. 945-953.
10. A. G. Evans, J. Amer. Ceram. Soc., “Perspective on the Development of High-Toughness Ceramics,” 73, (1990) pp. 187-206.
11. P. F. Becher, “Microstructural Design of Toughened Ceramics,” J. Amer. Ceram. Soc. 74, (1991) pp. 255-269.
12. D. S. Fischer, “Development of In-Situ Toughened Silicon-rich Alloys: A New Class of Castable Engineering Ceramics,” Ph.D. Thesis, Massachusetts Institute of Technology, Cambridge, MA (2010).
13. Y. Umakoshi, T. Nakashima, T. Nakano and E. Yanagisawa, “ Plastic Behavior and Deformation Structure of Silicide Single Crystals with Transition Metlas at High Temperatures,” in: C. L. Briant, J. J. Petrovic, B. P. Bewlay, A. K. Vasudevan, H. A. Lipsitt (Eds.), High Temperature Silicides and Refractory Alloys vol. 322, Materials Research Society, Pittsburgh, PA, (1994) pp. 9-20.
14. C. A. Swenson, “Recommended values of thermal expansivity of silicon from 0 to 1000 K,” J. Phys. Chem. Ref. Data, 12, (1983) pp. 179-182.
15. Thermal Expansion: Nonmetallic Solids, Thermophysical Properties of Matter, in: Y.S. Touloukian, R. K. Kirby, R. E. Taylor, T. Y. R. Lee (Eds.) vol. 13, Plenum, New York, (1977) pp. 1195-1220.
16. S. V. Raj, “Comparison of the Thermal Expansion Behavior of Several Intermetallic Silicide Alloys between 293 and 1523 K,” J. Mater. Engineer. Perform. 24, (2015) pp. 1199-1205. DOI: 10.1007/s11665-015-1390-8.
17. M. Hebsur, “Development and characterization of SiC(f)/MoSi2-Si3N4(p) hybrid composites,” Mater. Sci. Eng. A261, (1999) pp. 24-37.
18. S.V. Raj, M. Singh and R. T. Bhatt, “High Temperature Lightweight Self-Healing Ceramic Composites for Aircraft Engine Applications,” NASA/TM—2014-218352, NASA Glenn Research Center, Cleveland, OH (2014).
19. S.V. Raj, “High Temperature Creep and Oxidation Resistant Chromium Silicide Matrix Alloy Containing Molybdenum,” U. S. Patent No. 5,330,590 issued July 19, 1994.
20. S. V. Raj, “An evaluation of the properties of Cr3Si alloyed with Mo,” Mater. Sci. Eng., A 201, (1995) pp. 229-241.
21. S. V. Raj and A. Palczer, “Thermal expansion of vacuum plasma sprayed coatings,” Mater. Sci. Eng., A 527, 2129-2135 (2010).
NASA/TM—2016-218953 21
22. “Properties and Characteristics of Silicon Carbide,” in: A. H. Rashed (Ed.), Poco Graphite, Inc., Decatur, TX (2002). http://www.poco.com/Portals/0/Properties.and.Characteristics.of.Silicon.Carbide.pdf