Endurance training modulates the muscular transcriptome response to acute exercise
10
SKELETAL MUSCLE Silvia Schmutz Christoph Da¨pp Matthias Wittwer Michael Vogt Hans Hoppeler Martin Flu¨ck Endurance training modulates the muscular transcriptome response to acute exercise Received: 3 March 2005 / Revised: 22 June 2005 / Accepted: 15 July 2005 / Published online: 14 December 2005 ȑ Springer-Verlag 2005 Abstract We hypothesized that in untrained individuals (n=6) a single bout of ergometer endurance exercise provokes a concerted response of muscle transcripts towards a slow-oxidative muscle phenotype over a 24-h period. We further hypothesized this response during recovery to be attenuated after six weeks of endurance training. We monitored the expression profile of 220 selected transcripts in muscle biopsies before as well as 1, 8, and 24 h after a 30-min near-maximal bout of exercise. The generalized gene response of untrained vastus lateralis muscle peaked after 8 h of recovery (P=0.001). It involved multiple transcripts of oxidative metabolism and glycolysis. Angiogenic and cell regula- tory transcripts were transiently reduced after 1 h inde- pendent of the training state. In the trained state, the induction of most transcripts 8 h after exercise was less pronounced despite a moderately higher relative exercise intensity, partially because of increased steady-state mRNA concentration, and the level of metabolic and extracellular RNAs was reduced during recovery from exercise. Our data suggest that the general response of the transcriptome for regulatory and metabolic pro- cesses is different in the trained state. Thus, the response is specifically modified with repeated bouts of endurance exercise during which muscle adjustments are estab- lished. Keywords Endurance exercise Gene expression Skeletal muscle Structure Time course Introduction Skeletal muscle tissue shows a remarkable malleability to remodel its structural make-up and to adapt func- tionally in response to contractile stimuli. For instance, endurance training is known to lead to specific improvements of oxidative metabolism [14, 16, 28, 37], capillarity [1, 8, 28] and occasionally a shift towards a slower contractile phenotype [15]. Several studies also demonstrate an increase in the content of intramyocel- lular lipids (IMCL) [14, 32], while the size of muscle fibers seems to remain essentially unchanged with endurance training [6, 14]. Concerted changes in the concentration of expressed messenger ribonucleic acids (mRNAs), i.e., the tran- scriptome, have been identified as a major molecular strategy of muscle for governing structural and func- tional adaptations with exercise training [4, 12, 13, 21]. A match between the quantity of multiple mitochondrial transcripts, both coded on the nuclear and mitochon- drial genome, and mitochondrial volume density was found in highly endurance-trained subjects [24, 25, 31]. Thus, coordinated adaptations of the concentration of mitochondrial transcripts appear to underlie the improvement of oxidative metabolism in the endurance- trained state. However, the involvement of other gene families and the time course of the response of the transcriptome remain largely unknown. In untrained vastus lateralis muscle, a single bout of intense or prolonged ergometer exercise is known to induce transient expressional adaptations of gene on- tologies involved in lipid metabolization (LPL), mito- chondrial biogenesis (TFAM, PGC-1a), redox regulation (UCP3, HO1), carbohydrate metabolism (GLUT4, HKII, PDK4) and angiogenesis (VEGF) within the first hours of recovery [17, 22, 23, 26, 33, 34, 36]. Repetitive exercise bouts have further been shown to enhance the basal concentration of factors of oxidative (FAT, CPT1) and glycolytic metabolism (GAPD) after weeks to years of endurance training [22, 36, 39]. This Electronic Supplementary Material Supplementary material is available in the online version of this article at http://dx.doi.org/ 10.1007/s00424-005-1497-0 S. Schmutz C. Da¨pp M. Wittwer M. Vogt H. Hoppeler M. Flu¨ck (&) Department of Anatomy, University of Bern, Baltzerstrasse 2, 3000 Bern 9, Switzerland E-mail: fl[email protected] Tel.: +41-31-6314619 Fax: +41-31-6313807 Pflugers Arch – Eur J Physiol (2006) 451: 678–687 DOI 10.1007/s00424-005-1497-0
-
Upload
independent -
Category
Documents
-
view
1 -
download
0
Transcript of Endurance training modulates the muscular transcriptome response to acute exercise
SKELETAL MUSCLE
Silvia Schmutz Æ Christoph Dapp Æ Matthias Wittwer
Michael Vogt Æ Hans Hoppeler Æ Martin Fluck
Endurance training modulates the muscular transcriptome responseto acute exercise
Received: 3 March 2005 / Revised: 22 June 2005 / Accepted: 15 July 2005 / Published online: 14 December 2005� Springer-Verlag 2005
Abstract We hypothesized that in untrained individuals(n=6) a single bout of ergometer endurance exerciseprovokes a concerted response of muscle transcriptstowards a slow-oxidative muscle phenotype over a 24-hperiod. We further hypothesized this response duringrecovery to be attenuated after six weeks of endurancetraining. We monitored the expression profile of 220selected transcripts in muscle biopsies before as well as1, 8, and 24 h after a 30-min near-maximal bout ofexercise. The generalized gene response of untrainedvastus lateralis muscle peaked after 8 h of recovery(P=0.001). It involved multiple transcripts of oxidativemetabolism and glycolysis. Angiogenic and cell regula-tory transcripts were transiently reduced after 1 h inde-pendent of the training state. In the trained state, theinduction of most transcripts 8 h after exercise was lesspronounced despite a moderately higher relative exerciseintensity, partially because of increased steady-statemRNA concentration, and the level of metabolic andextracellular RNAs was reduced during recovery fromexercise. Our data suggest that the general response ofthe transcriptome for regulatory and metabolic pro-cesses is different in the trained state. Thus, the responseis specifically modified with repeated bouts of enduranceexercise during which muscle adjustments are estab-lished.
Keywords Endurance exercise Æ Gene expression ÆSkeletal muscle Æ Structure Æ Time course
Introduction
Skeletal muscle tissue shows a remarkable malleabilityto remodel its structural make-up and to adapt func-tionally in response to contractile stimuli. For instance,endurance training is known to lead to specificimprovements of oxidative metabolism [14, 16, 28, 37],capillarity [1, 8, 28] and occasionally a shift towards aslower contractile phenotype [15]. Several studies alsodemonstrate an increase in the content of intramyocel-lular lipids (IMCL) [14, 32], while the size of musclefibers seems to remain essentially unchanged withendurance training [6, 14].
Concerted changes in the concentration of expressedmessenger ribonucleic acids (mRNAs), i.e., the tran-scriptome, have been identified as a major molecularstrategy of muscle for governing structural and func-tional adaptations with exercise training [4, 12, 13, 21].A match between the quantity of multiple mitochondrialtranscripts, both coded on the nuclear and mitochon-drial genome, and mitochondrial volume density wasfound in highly endurance-trained subjects [24, 25, 31].Thus, coordinated adaptations of the concentration ofmitochondrial transcripts appear to underlie theimprovement of oxidative metabolism in the endurance-trained state. However, the involvement of other genefamilies and the time course of the response of thetranscriptome remain largely unknown.
In untrained vastus lateralis muscle, a single bout ofintense or prolonged ergometer exercise is known toinduce transient expressional adaptations of gene on-tologies involved in lipid metabolization (LPL), mito-chondrial biogenesis (TFAM, PGC-1a), redoxregulation (UCP3, HO1), carbohydrate metabolism(GLUT4, HKII, PDK4) and angiogenesis (VEGF)within the first hours of recovery [17, 22, 23, 26, 33, 34,36]. Repetitive exercise bouts have further been shown toenhance the basal concentration of factors of oxidative(FAT, CPT1) and glycolytic metabolism (GAPD) afterweeks to years of endurance training [22, 36, 39]. This
Electronic Supplementary Material Supplementary material isavailable in the online version of this article at http://dx.doi.org/10.1007/s00424-005-1497-0
S. Schmutz Æ C. Dapp Æ M. Wittwer Æ M. Vogt Æ H. HoppelerM. Fluck (&)Department of Anatomy, University of Bern,Baltzerstrasse 2, 3000 Bern 9, SwitzerlandE-mail: [email protected].: +41-31-6314619Fax: +41-31-6313807
Pflugers Arch – Eur J Physiol (2006) 451: 678–687DOI 10.1007/s00424-005-1497-0

indicates that the accumulation of specific gene tran-scripts in skeletal muscle due to the repetitive action ofexercise stimuli may contribute to the functionalimprovements that are typical of the endurance-trainedstate [10, 12, 25, 31]. Recent evidence further suggeststhat the transcriptional response of metabolic factors(HKII, TFAM, PPARa, CPT1, FAT) may be differentin the trained compared to the untrained state [23, 36].However, the knowledge on how short-term transcrip-tional changes relate to long-term adjustments of thetranscriptome with exercise stimuli and whether theyreflect the time course of improvements of muscularperformance with training [30] is limited.
In order to gain information on the coordination ofthe gene response during endurance exercise-inducedalterations, we carried out a gene expression profilingstudy. Biopsies were taken from vastus lateralis muscleduring the first 24 h of recovery from a single bout ofintense ergometer cycling before and after 6 weeks ofendurance training. The samples were subjected toanalysis on custom-designed microarrays. This allowedfor parallel analysis of transcript levels of gene ontolo-gies involved in metabolic, contractile and regulatorymuscle function as well as in the adjustment of theinterstitial compartment. It was hypothesized that theacute alterations of the transcriptome of sedentarysubjects to a single bout of endurance exercise shouldencompass the set of genes responsible for the structuraland biochemical muscle adjustments occurring withtraining. Secondly, it was hypothesized that the acutetranscript-level adaptations of the trained muscle to asingle bout of exercise at the same relative intensitywould be qualitatively similar to those seen in the un-trained state, but reduced in quantity due to the ex-pected increase in steady-state concentration of mRNA.
Materials and methods
Subjects
Six healthy, not systematically trained men gave theirwritten consent to participate in the study. The studywas conducted with permission of the Ethics Com-mittee of Bern, Switzerland, in compliance with theHelsinki Convention for Research on human subjects.
Anthropometric parameters (age, height, body mass,and percent body fat) were determined at the begin-ning of the study and after the 6 weeks’ training per-iod. Percent body fat was determined by a seven-pointskin fold measurement using a calibrated skin foldcaliper (GPM, Switzerland).
Endurance training
During the 6 weeks, the subjects trained five times perweek for 30 min at an intensity of approximately 65% ofthe maximal workload (Pmax). The training intensity wasmonitored and adjusted by heart rate. Training work-load was increased as necessary to maintain a constantindividual training heart rate which corresponded to83±1% of the maximal heart rate in the first trainingweek and to 90±2% in the sixth training week.
Exercise test
The subjects were advised to stop extra physical activity4 weeks before the start of the study (see Fig. 1). Allsubjects were familiarized with the test equipment2 weeks before the initial exercise single bout. At thesame time, an exercise test was carried out to determinethe admissible intensity of the initial exercise bout. Asecond exercise test was carried out after the 6 weeks’training period. Exercise tests were carried out on abicycle ergometer (Ergoline 800S, Ergoline GmbH, Bitz,Germany). Expired air was analyzed with breath-by-breath measurements (Oxycon alpha, Jager GmbH,Wurzburg, Germany). Starting with 40 watts, theworkload was increased by 30 watts every 2 min untilthe subjects could no longer maintain a cadence of morethan 60 rpm.
Single endurance exercise bout
Before and after the endurance-training period, thesubjects performed a single bout of bicycle exercise at alow intensity (approximately 40% of Pmax) for 10 minfollowed by 30 min of high-intensity exercise (approxi-mately 65% of Pmax) on the ergometer. After the
Fig. 1 Experimental protocoltime line. Muscle biopsies weretaken before and after a singlebout of ergometer exercise inthe untrained state (EU) andafter 6 weeks of endurancetraining (ET)
679
6 weeks’ training period, the relative intensity was 6%higher and the absolute intensity was 21% higher thanbefore (Table 1).
Muscle biopsies
Using the Bergstroem technique [2], resting needlebiopsies were taken from the vastus lateralis muscle3 days before the first exercise test and 3 days after thetraining period. A fraction of the muscle tissue was fixedin glutaraldehyde and subsequently embedded in Eponfor microscopical analyses as described earlier [14]. Formeasuring the capillary density, 1 lm cross-sectionswere cut with an ultramicrotome from two tissue blocksrandomly chosen from each biopsy. Sections werestained with toluidin blue and pictures were obtained bylight microscopy at a final magnification of ·1,850. Onaverage 117 fibers were analyzed per muscle biopsy. Thenumber of capillaries was counted directly. For meanfiber cross-sectional area, point counting was performedin consecutive corners of the frames on 100-square meshgrids on the same sections.
The mitochondrial volume density was measured asdescribed on electron micrographs performing pointcounting with a B36 grid with 144 test points at a finalmagnification of ·24,000 [14].
For additional analysis of the molecular time course,fine needle biopsies (14 Gauge single use; Medilink S.A.,Pregassona, Switzerland) were taken 1, 3, 8 and 24 hafter the first and second single bout of exercise alter-nately from the left and right leg. For each biopsy a fresh
incision was made at a distance of at least 1.5 cm fromany previous biopsy of the same leg. These biopsies werefrozen in isopentane cooled by liquid nitrogen andsubsequently stored in liquid nitrogen.
Fiber typing
Immunohistochemical determination of fast, slow, andhybrid fiber types was carried out as described on 12-lmcryosections using monoclonal antibodies specific forfast myosin (My-32) or slow myosin (MAB1628) [11].Type II fiber percentage was determined by counting allfibers on the cross-sections of the biopsies.
Microarray analysis
Total RNA was isolated from 25 lm cryosections of themuscle biopsies and quantified as described previously[40]. Subsequently, microarray experiments and signalquantification using custom-designed low-density At-las� cDNA expression arrays (BD Biosciences, Allsch-wil, Switzerland) was carried out basically as describedpreviously [7]. The filter membrane held 229 double-spotted probes of human cDNAs associated withparticular aspects of skeletal muscle functioning (seesupplemental online Fig. 1). Additionally, cDNA probesfor the internal reference, 18S rRNA, were included onthe nylon membrane. 32P dATP-labeled cDNA wasgenerated from 0.8 lg of total RNA by using the 229gene-specific primers supplied. Probe synthesis for themeasurement of the internal 18S rRNA reference wascarried out in parallel. 0.3 lg of total RNA of eachsample was always run for the generation of 32P dATP-labeled cDNA with a specific primer for 18S rRNA.Filters were hybridized with a mix of total cDNA and18S cDNA diluted 1:1,800 and washed as described [7].The microarray experiment was designed to minimizevariability of the time course data for individual sub-jects. Therefore, samples from the pre, 1, 8, and 24 hbiopsies of any subject were processed in parallel forreverse transcription and array hybridization from thesame master mix. Due to space limitations during thewashing step, we had to process biopsies of the subjectstaken after 3 h of recovery from exercise separately. As aconsequence, we found a low variability for the timecourse in each subject as well as a low variability in thedataset for the 3-h recovery. Due to the fact that the 3-hrecovery data was generated separately, we did notinclude these data in the time course of each subject.
Array evaluation
Raw signals were determined from the average signalintensities of the two corresponding dots as describedpreviously [7]. The background was estimated using theGrid Background Dots mode for 54 dots. Transcripts
Table 1 Subject characteristics
Untrained Trained P
Age (years) 28 (21;38)Height (cm) 182 (172;189)Body mass (kg) 75.8 (65.0;101.8) 74.8 (65.8;99.3) 0.92Body fat (%) 12.1 (6.0;35.4) 12.9 (5.2;34.0) 0.60_V O2max(ml/min/kg)a 44.6 (26.8;56.2) 50.2 (28.5;58.7) 0.034 mmol/l Lactatethreshold (watt)a
199 (149;291) 228 (180;312) 0.03
Pmax (watt)a 285 (226;371) 316 (253;403) 0.03
Pexercise bout (%) lowa 39 (35;40) 42 (39;49) 0.03Pexercise bout (%) higha 62 (57;65) 66 (62;75) 0.03Pexercise bout (watt) low
a 105 (90;145) 138 (100;195) 0.03Pexercise bout (watt) high
a 170 (140;235) 205 (165;300) 0.03Vv(mt, f) (%)a 4.1 (2.8;5.8) 6.0 (3.7;7.3) 0.05NN(c,f) 1.8 (1.5;2.0) 1.8 (1.4;2.1) 0.60NA(c,f) (mm�2) 528 (455;634) 686 (457;803) 0.07a(f) (lm2)a 3426 (2605;4084) 2848 (2499;3847) 0.03Fiber type (% type II) 46.5 (39,9;56,9) 45.4 (39,5;54,1) 0.92
Median and range of the six subjects. Systemic and ultrastructuralchanges in response to 6 weeks of endurance training_V O2max maximal oxygen consumption, Pmax maximal power out-put, Pexercise bout (%) load of the single exercise bout relative toPmax, Vv(mt,f) total mitochondrial volume per fiber volume,NN(c,f) number of capillaries per number of fibers, NA(c,f) numberof capillaries per fiber area, a(f) fiber cross sectional areaaSignificantly changed (P<0.05) relative to the untrained state
680
were considered as detected if the corresponding signalintensity was 30% above background in at least four ofsix possible filter hybridizations for one time-point (seesupplemental online Fig. 1). This led to the inclusion of112 (untrained state) and of 104 (trained state) outof 229 possible transcript signals in the statistical eval-uation.
Statistics
Data are presented as median and range. Differencesbetween values obtained before and after 6 weeks oftraining were statistically evaluated using the pairedWilcoxon test (Statistica 6.1; StatSoft (Europe), Ham-burg, Germany).
Raw signals of the detected transcripts were back-ground-corrected. Negative values were set to zero and apixel count of one was added to each value. The cor-rected transcript signals were logarithmized to the base of2 and standardized to 18S rRNA by subtraction. Stan-dardization to 18S was chosen since ribosomal RNArepresents a major portion of the total RNA (i.e.,�27%)[18]. To analyze the overall effect of training on themRNA levels in both training states, an ANOVA withrepeated measurements was carried out with all 702 timecourses (117 transcripts of six subjects).
Afterwards, transcripts were divided into differentgene ontologies according to the literature. Then, thesame analysis was done for each ontology. To determinewhich mRNA signals were significantly different(P<0.05) throughout the time course, a FriedmanANOVA with repeated measurements was used for eachtranscript (Statistica 6.1). The nonparametric FriedmanANOVA was used because it is not possible to reliablytest for distribution with six observations. Then, to lo-cate differences between before and after the singleexercise bout, the paired Wilcoxon test was applied. Noadjustments were made for multiple testing.
Verification of the array results with RT-PCR
The levels of seven transcripts (LPL, CPT1, PFKM,PPARG,MCT1,MYH1,MYH2) were verified by meansof RT-PCR as previously described [31]. For this pur-pose, RNA from pre and 8-h biopsies was used fromthose four subjects where sufficient total RNA wasavailable and compared to the corresponding four arraymeasurements. New primers were designed with the Pri-mer Express software (PE Biosystems, Rotkreuz, Swit-zerland) for MYH1 (5¢-primer: ggaggaacaatccaacgtcaa,3¢-primer: tgacctgggactcagcaatg), MYH2 (5¢-primer: ca-atctagctaaattccgcaagc, 3¢-primer: tcacttatgacttttgtgt-gaacc) and MCT1 (5¢-primer: ccaaggcagggaaagataagtct,3¢-primer: atcttttttcacaccagattttcca). Relative cDNAamounts to 18S were calculated using the comparativeCT method (threshold cycle for target amplification)according to user bulletin no. 2 of the ABI Prism 7700
Sequence Detection System (PerkinElmer) with themodification that the relative efficiency of each primerpair was included in the calculation. To test for a trend oftranscript level alterations a paired Wilcoxon test at asignificance level of P<0.1 was applied on log-trans-formed 18S-normalized values.
Results
Anthropometry
All six subjects completed the 6 weeks of endurancetraining and the two acute bouts of ergometer exercise.The subjects performed 92±4% of the 30 possibletraining sessions. Neither body mass nor body fat wasaltered after training (see Table 1). Training improvedthe maximal power output by 11%, the maximal oxygenconsumption by 13% and the 4 mmol/l lactate thresholdby 15%.
Morphometry and fiber typing
Ultrastructural muscle analysis revealed an increase inthe mitochondrial density by 46% after training. Themean fiber area was reduced by 17%. The capillarydensity showed a shift towards an increase (30%). Thefiber type distribution remained unchanged (see Table 1).
Training effects on steady-state transcript levels
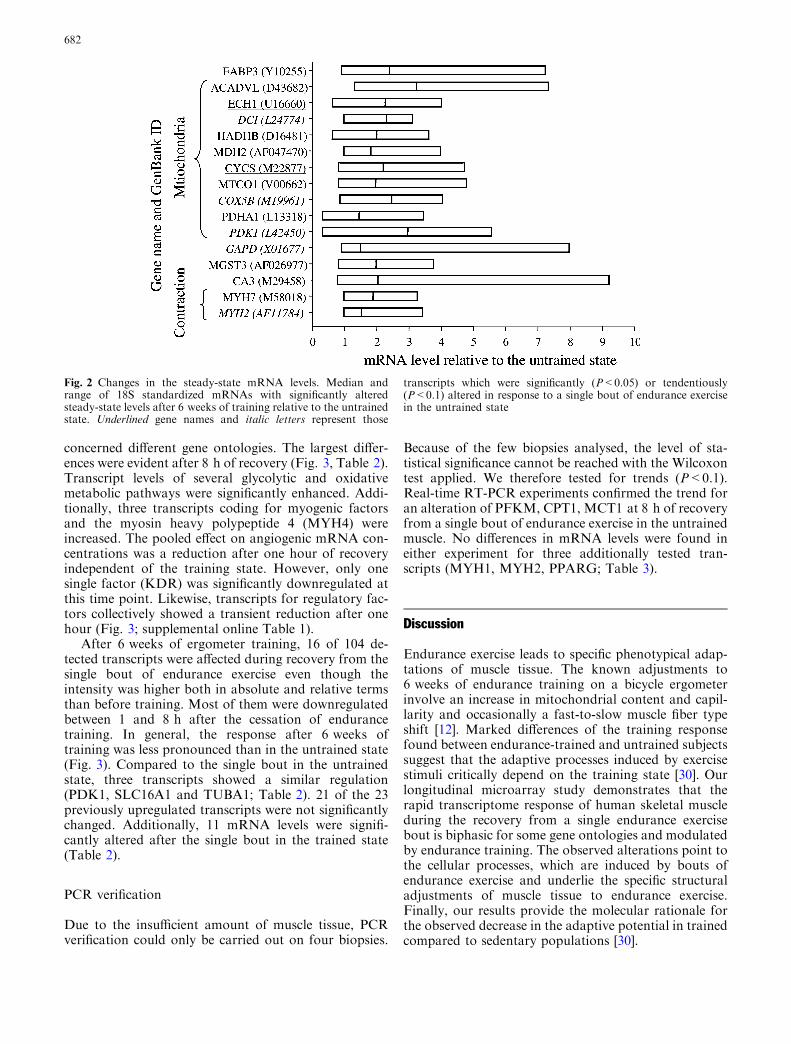
The steady-state mRNA concentration of 26 transcriptswas altered. Transcripts involved in oxidative metabo-lism were increased after 6 weeks of endurance training(Fig. 2). The number of transcripts of several matrixproteins (MMP8, MMP9, MMP15, PLAT, TIMP2,COL1A1, COL4A4) was also increased (data not shown).
Variability for microarray experiments
The separate analysis of the 3 h biopsies indicated animportant assay-to-assay variability for microarrayexperiments. Handling the 3 h biopsies on 2 consecutivedays resulted in a coefficient of determination (r2) of thetranscripts of 0.95 of this particular time point. This issignificantly better than the r2 of transcripts of the othertime points (r2=0.79), when biopsies were processed on6 different days.
Acute effects on muscle transcriptome
In the untrained state, a 30-min bout of exercise at 62%of Pmax led to an upregulation of the concentration of 23out of 112 detected transcripts. The concentration ofthree mRNAs was downregulated. These adaptations
681
concerned different gene ontologies. The largest differ-ences were evident after 8 h of recovery (Fig. 3, Table 2).Transcript levels of several glycolytic and oxidativemetabolic pathways were significantly enhanced. Addi-tionally, three transcripts coding for myogenic factorsand the myosin heavy polypeptide 4 (MYH4) wereincreased. The pooled effect on angiogenic mRNA con-centrations was a reduction after one hour of recoveryindependent of the training state. However, only onesingle factor (KDR) was significantly downregulated atthis time point. Likewise, transcripts for regulatory fac-tors collectively showed a transient reduction after onehour (Fig. 3; supplemental online Table 1).
After 6 weeks of ergometer training, 16 of 104 de-tected transcripts were affected during recovery from thesingle bout of endurance exercise even though theintensity was higher both in absolute and relative termsthan before training. Most of them were downregulatedbetween 1 and 8 h after the cessation of endurancetraining. In general, the response after 6 weeks oftraining was less pronounced than in the untrained state(Fig. 3). Compared to the single bout in the untrainedstate, three transcripts showed a similar regulation(PDK1, SLC16A1 and TUBA1; Table 2). 21 of the 23previously upregulated transcripts were not significantlychanged. Additionally, 11 mRNA levels were signifi-cantly altered after the single bout in the trained state(Table 2).
PCR verification
Due to the insufficient amount of muscle tissue, PCRverification could only be carried out on four biopsies.
Because of the few biopsies analysed, the level of sta-tistical significance cannot be reached with the Wilcoxontest applied. We therefore tested for trends (P<0.1).Real-time RT-PCR experiments confirmed the trend foran alteration of PFKM, CPT1, MCT1 at 8 h of recoveryfrom a single bout of endurance exercise in the untrainedmuscle. No differences in mRNA levels were found ineither experiment for three additionally tested tran-scripts (MYH1, MYH2, PPARG; Table 3).
Discussion
Endurance exercise leads to specific phenotypical adap-tations of muscle tissue. The known adjustments to6 weeks of endurance training on a bicycle ergometerinvolve an increase in mitochondrial content and capil-larity and occasionally a fast-to-slow muscle fiber typeshift [12]. Marked differences of the training responsefound between endurance-trained and untrained subjectssuggest that the adaptive processes induced by exercisestimuli critically depend on the training state [30]. Ourlongitudinal microarray study demonstrates that therapid transcriptome response of human skeletal muscleduring the recovery from a single endurance exercisebout is biphasic for some gene ontologies and modulatedby endurance training. The observed alterations point tothe cellular processes, which are induced by bouts ofendurance exercise and underlie the specific structuraladjustments of muscle tissue to endurance exercise.Finally, our results provide the molecular rationale forthe observed decrease in the adaptive potential in trainedcompared to sedentary populations [30].
Fig. 2 Changes in the steady-state mRNA levels. Median andrange of 18S standardized mRNAs with significantly alteredsteady-state levels after 6 weeks of training relative to the untrainedstate. Underlined gene names and italic letters represent those
transcripts which were significantly (P<0.05) or tendentiously(P<0.1) altered in response to a single bout of endurance exercisein the untrained state
682

Redox Regulation
-12.0
-11.5
-11.0
-10.5
-10.0
-9.5
-9.0
-8.5
8 24
Time point [h]
mR
NA
/ 18
S rR
NA
[lb
pix
el r
atio
]
**
Carbohydrate Metabolism
-11.0
-10.5
-10.0
-9.5
-9.0
-8.5
-8.0
8 24
Time point [h]
mR
NA
/ 18
S rR
NA
[lb
pix
el r
atio
]
**
Mitochondria
-10.0
-9.5
-9.0
-8.5
-8.0
-7.5
8 24Time point [h]
mR
NA
/ 18
S rR
NA
[lb
pix
el r
atio
]
**
†
††
Angiogenesis
-13.0
-12.5
-12.0
-11.5
-11.0
-10.5
-10.0
0 8 24Time point [h]
mR
NA
/ 18
S rR
NA
[lb
pix
el r
atio
]
*†
†
Cell Regulation
-12.5
-12.0
-11.5
-11.0
-10.5
-10.0
-9.5
-9.0
0 8 24
Time point [h]
mR
NA
/ 18
S rR
NA
[lb
pix
el r
atio
]
*
†
†
†
Fat Transport
-11.5
-11.0
-10.5
-10.0
-9.5
-9.0
-8.5
-8.0
8 24
Time point [h]
mR
NA
/ 18
S rR
NA
[lb
pix
el r
atio
]
*
All
-11.0
-10.8
-10.6
-10.4
-10.2
-10.0
-9.8
-9.6
-9.4
-9.2
-9.0
0 24
Time point [h]
mR
NA
/ 18
S rR
NA
[lb
pix
el r
atio
]
* *
†
†
††
untrained
trained
1 8
0 1 0 1
1
10 1
0 1
Fig. 3 Differences in the gene response after 6 weeks of endurancetraining. Mean values and standard error bars of logarithmized and18S standardized mRNA levels grouped into gene ontologies.Underlined titles indicate a significantly different response of theuntrained (dashed line) compared to the 6 weeks trained state (solidline; P<0.001). Bottom of each graph, asterisk symbol indicates
significant (P<0.05) difference between the same time point of thetwo states. dagger symbol indicates significant (P<0.05) differencebetween the time point and the pre biopsy of the same trainingstate. The transcripts included in this analysis are listed insupplemental online Table 1
683
Elevated steady-state mRNA levels after endurancetraining
The prominent, twofold enhancement of steady-statelevels of mRNAs encoding factors for fatty acid trans-port and mitochondrial respiratory functions points tothe coincident alterations of multiple aspects of theoxidative metabolism (Fig. 2). The changes indicate thattranscript concentrations of the myocellular fatty acidtransport (FABP3), import of pyruvate in the citratecycle (PDHA1, PDK1), beta oxidation (ECH1, HAD-HB, ACADVL, DCI), citrate cycle (MDH2), respiration(CYCS, MTCO1, COX5B) and redox regulation (CA3)are subject to concurrent regulation (Fig. 2). The train-ing-enhanced GAPD mRNA levels are in line with theincreased level of this transcript in professionally trainedcyclists [39]. Our observations thus extend previousfindings on elevated levels of other mitochondrial andglycolytic factors (HKII, GAPD) in endurance-trainedhuman skeletal muscle [23, 25, 31, 36, 39]. The novelobservation on significantly increased mRNA concen-trations of fast IIA (MYH2) and slow type I myosinheavy chain (MYH7) provide evidence that transcrip-tional alterations in contractile make-up are molecularmanifestations of the occasionally observed shift to-wards a slower contractile phenotype and the loss oftype IIB muscle fibers with 6 weeks of endurancetraining (Fig. 2; [15]). No significant shift towards type Ifibers could be observed in our study as estimated fromimmunohistochemistry, indicating that correspondingmRNA shifts towards the slower fiber types are moresensitive to training interventions than overt fiber typetransitions.
Only three of the RNA species of metabolic factorsfor which steady-state concentrations were significantlyincreased after 6 weeks of training showed an increaseafter the single bout of endurance exercise in the un-trained state (Table 2, Fig. 2) (FABP3, ECH1, CYCS).As most of the permanently increased mRNAs are notsignificantly affected after a single bout of exercise,transcriptional microadaptations need to accumulatewith repetition of the endurance exercise stimuli. Thismay be the cause for the increased pre-exercise concen-trations of several mRNAs in the trained state as pre-viously suggested [22, 36, 39].
Limitations in repeated biopsies
Any biopsy sampling scheme may influence transcriptlevels and thus interfere with the interpretations on theexercise-dependence of mRNAs during a time course ofrecovery from exercise [38]. Repeated sampling of mus-cle tissue has been shown to provoke a regenerative re-sponse in a small percentage (2% of total muscle area) ofmuscle fibers [20]. In the present study, we have usedminimally traumatic fine-needle biopsies in combinationwith alternate sampling at both legs to limit possible biasdue to the biopsy intervention. Hence, the 1-h biopsy is
taken from muscle that had not been traumatized bybiopsies and can thus be regarded as not being affectedby such biopsy-dependent micro-lesions. With regard tothe transcript alterations observed in the untrained statethat relate to muscle regeneration, i.e., IGFBP6 andIGF1, we cannot exclude interference from biopsydamage. The fact that these transcripts were not foundto be altered in the trained-state using the same biopsyscheme is an argument against the biopsy procedureproducing significant alterations in these (and possiblyother) transcript levels. Moreover, other significantlyaltered transcripts involved in muscle regeneration, i.e.,IL6 and MYOD1 have been reported to be elevatedafter cycling or resistance exercise in previously not bi-opsied legs [3, 35]. This indicates that some muscleregeneration is part of the normal response to exercise.
Limitations due to technical variability
We abstained from integrating the separately processed3 h time-point data into the set of time course data asthis inclusion massively added noise to the time coursedata. Further, this type of technical noise inhered inarray processing possibly prevented the identification oftranscript to structure relationships such as those pre-viously identified in RT-PCR studies [24, 31].
Acute transcriptome response to a single boutof endurance exercise in the untrained state
To the best of our knowledge, this is the first exploratorystudy to show concerted alterations of multiple genetranscripts of important metabolic pathways duringrecovery from endurance exercise in humans. Thistranscriptional response induced by a single bout ofendurance exercise in sedentary subjects included mul-tiple steps of myocellular oxidative, glycolytic and redoxmetabolism (Fig. 3, Table 2).
The quantified mRNA alterations of different geneontologies point to a general adaptive response in therecruited muscle of sedentary subjects in the first hoursafter a single bout of exercise (see Fig. 3). We assumethat the upregulation of the concentration of transcriptsinvolved in mitochondrial respiration is essential for theincrease of the mitochondrial density.
Difference in the transcriptome responsebetween the untrained and the trained state
Our study indicates that several aspects of transcriptlevel adaptations to a single bout of endurance exerciseare modified with endurance training. The dependenceof transcript level changes on the training state is shownby a less-pronounced response of the trained musclethroughout recovery (Fig. 3). In contrast to the un-trained state, the mRNA concentrations were decreased
684

Table 2 Time course of mRNA levels. Median values of 18Sstandardized transcript levels relative to the pre biopsy levels after asingle bout in the untrained and in the trained state. P-valuesresulting from the Friedman ANOVA are indicated. Significantly
upregulated and downregulated transcripts at P<0.05 are coloredin black or grey, respectively (Wilcoxon test). n.d. mRNA not de-tected. If the transcript could not be detected in the pre biopsy, theratios of the time course are italicized
685

throughout the first 24 h of recovery from the singlebout of endurance exercise in the trained state (Fig. 3).Relative changes in mRNA concentrations were dimin-ished after the 6 weeks of endurance training eventhough the absolute as well as the relative load washigher in the second single bout. The results are com-patible with previous observations on an attenuation ofexercise-induced changes of IL6 and HKII concentra-tions with endurance training [9, 23, 36]. However, theattenuation of the VEGF response due to training couldnot be confirmed [27] (Table 2). The lower gene responsein the trained state could be a reason why both func-tional [30] and structural [14] adaptations are attenuatedwith ongoing training with the same relative intensity.Hence, adaptations may possibly level out when thetraining stimulus is not changed.
Adjustments of major extracellular matrix compo-nents, i.e., collagen (COL1A1, COL4A4) and metallo-proteinases (MMP8, MMP9, MMP15), indicate animportant remodeling of interstitial components withendurance training. The decrease in the concentration ofthese factors and several transcripts involved in angio-genesis and redox regulation throughout the 24 h afterthe single bout of exercise in the trained state awaitsexplanation (see below).
Regulatory implications
How can the apparent downregulation of multipleRNAs (see Table 2) in response to exercise in the un-trained and trained state be explained? Our surprisingfindings may be related to the events governing rapidRNA degradation. The common pathway for degrada-tion of normally poly-adenylated RNA species includesa translation-mediated degradation via binding of fac-tors to AU-rich sequence elements in the 3¢-untranslatedregion (3¢UTR) of the RNA [29]. Inspection of the3¢UTRs in the up- and downregulated transcript speciesof our study does not indicate a strict association of thepresence of AU-rich sequences and reduced mRNAlevels after training for these mRNAs, which would haveexplained the observed phenomenon. We postulate thatan additional mechanism could be responsible for the
regulation of the observed drop after a single bout ofendurance exercise in the trained state. For instance,changed interaction of mRNA with stabilizing proteinssuch as seen for cytochrome c and VEGF mRNA afterincreased contractile activity [41] or local hypoxia [12,19] could be involved and needs investigation.
Remarkable findings
In contrast to similar studies, the capillary per fiber ratiowas not significantly increased after 6 weeks of endur-ance training. Angiogenesis could have been expected inresponse to endurance exercise, since muscle blood flowand mechanical stress are increased [5] and capillarysupply has previously been shown to be enhanced afterendurance training of similar duration and intensity [1,8, 28]. However, in keeping with the structural findingsof an essentially unchanged capillarity we found a lowincidence of transcriptional response of pro- and anti-angiogenic factors after the single bouts as well as due to6 weeks of endurance training. It is unclear at presentwhy this training study did not result in the expectedimprovement of capillarity.
Conclusions
An intense exercise bout induces a rapid, transienttranscriptome response in untrained muscle. The repet-itive impact of concentric endurance exercise stimulileads to increased steady-state levels of transcriptsmainly involved in mitochondrial metabolism, musclecontraction and extracellular matrix composition. Thesechanges go along with an increased mitochondrial den-sity but not with a shift towards a slow fiber phenotype.In the trained muscle, a lowered responsiveness oftranscript levels to a single bout of endurance exerciseand a different response between regulatory eventswhich are downregulated and metabolic processes thatwere upregulated after one hour of recovery is apparent.
Acknowledgements The support of the Swiss National ScienceFoundation (grant number 31-65276.01) and the University ofBern is gratefully acknowledged. Special thanks are addressed toFranziska Graber for assistance in morphometric analyses andRuth Vock and Hans Howald for advice on the manuscript.
References
1. Andersen P, Henriksson J (1977) Capillary supply of thequadriceps femoris muscle of man: adaptive response to exer-cise. J Physiol 270:677–690
2. Bergstrom J, Hermansen L, Hultman E, Saltin B (1967) Diet,muscle glycogen and physical performance. Acta Physiol Scand71:140–150
3. Bickel CS, Slade J, Mahoney E, Haddad F, Dudley GA,Adams GR (2005) Time course of molecular responses ofhuman skeletal muscle to acute bouts of resistance exercise.J Appl Physiol 98:482–488
Table 3 Array versus RT-PCR results. Median and range of the8 h biopsy compared to the pre biopsy in the untrained state (n=4)of the array as well as of the RT-PCR experiments
Gene Array 8 h/pre RT-PCR 8 h/pre
Median P Median P
LPL 3.8 (2.8;4.3) 0.07 1.1 (0.8;1.8) 0.47PPARG 1.5 (0.6;2.3) 0.27 1.4 (0.8;2.0) 0.27PFKM 1.9 (1.5;2.8) 0.07 1.4 (1.0;1.9) 0.07MCT1 1.3 (1.1;2.8) 0.07 1.2 (1.1;3.0) 0.07CPT1 2.7 (1.8;3.6) 0.07 1.4 (1.2;1.6) 0.07MYH2 1.8 (0.8;2.4) 0.14 1.0 (0.7;1.3) 0.72MYH1 1.4 (0.7;1.8) 0.27 1.3 (0.7;1.7) 0.27
686

4. Booth FW, Baldwin KM (1996) Muscle plasticity: energydemanding and supply processes, Sect 12, Chap 24. In: RowellLB, Shepherd JT (eds) Handbook of physiology. Oxford Uni-versity Press, New York, pp 1075–1123
5. Brown MD, Hudlicka O (2003) Modulation of physiologicalangiogenesis in skeletal muscle by mechanical forces: involve-ment of VEGF and metalloproteinases. Angiogenesis 6:1–14
6. Carter SL, Rennie CD, Hamilton SJ, Tarnopolsky (2001)Changes in skeletal muscle in males and females followingendurance training. Can J Physiol Pharmacol 79:386–392
7. Dapp C, Schmutz S, Hoppeler H, Fluck M (2004) Transcrip-tional reprogramming and ultrastructure during atrophy andrecovery of mouse soleus muscle. Physiol Genomics 20:97–107
8. Denis C, Chatard JC, Dormois D, Linossier MT, Geyssant A,Lacour JR (1986) Effects of endurance training on capillarysupply of human skeletal muscle on two age groups (20 and60 years). J Physiol (Paris) 81:379–383
9. Fischer CP, Plomgaard P, Hansen AK, Pilegaard H, Saltin B,Pedersen BK (2004) Endurance training reduces the contrac-tion-induced interleukin-6 mRNA expression in human skeletalmuscle. Am J Physiol 287:E1189–E1194
10. Fluck M (2004) Exercise-modulated mitochondrial phenotype;sensors and gene regulation. J Muscle Res Cell Motil 25:235–237
11. Fluck M, Chiquet M, Schmutz S, Mayet-Sornay MH, Desp-lanches D (2003) Reloading of atrophied rat soleus muscle in-duces tenascin-C expression around damaged muscle fibers.Am J Physiol 284:R792–R801
12. Fluck M, Hoppeler H (2003) Molecular basis of skeletal muscleplasticity—from gene to form and function. Rev Physiol Bio-chem Pharmacol 146:159–216
13. Hood DA (2001) Invited review: contractile activity-inducedmitochondrial biogenesis in skeletal muscle. J Appl Physiol90:1137–1157
14. Hoppeler H, Howald H, Conley K, Lindstedt SL, Claassen H,Vock P, Weibel ER (1985) Endurance training in humans:aerobic capacity and structure of skeletal muscle. J ApplPhysiol 59:320–327
15. Howald H, Hoppeler H, Claassen H, Mathieu O, Straub R(1985) Influences of endurance training on the ultrastructuralcomposition of the different muscle fiber types in humans.Pflugers Arch 403:369–376
16. Ingjer F (1979) Capillary supply and mitochondrial content ofdifferent skeletal muscle fiber types in untrained and endur-ance-trained men. A histochemical and ultrastructural study.Eur J Appl Physiol Occup Physiol 40:197–209
17. Kraniou Y, Cameron-Smith D, Misso M, Collier G, Harg-reaves M (2000) Effects of exercise on GLUT-4 and glycogeningene expression in human skeletal muscle. J Appl Physiol88:794–796
18. Larson DE, Zahradka P, Sells BH (1991) Control points ineucaryotic ribosome biogenesis. Biochem Cell Biol 69:5–22
19. Levy NS, Chung S, Furneaux H, Levy AP (1998) Hypoxicstabilization of vascular endothelial growth factor mRNA bythe RNA-binding protein HuR. J Biol Chem 273:6417–6423
20. Malm C, Nyberg P, Engstrom M, Sjodin B, Lenkei R, EkblomB, Lundberg I (2000) Immunological changes in human skeletalmuscle and blood after eccentric exercise and multiple biopsies.J Physiol 529(Pt 1):243–262
21. Neufer PD, Ordway GA, Hand GA, Shelton JM, RichardsonJA, Benjamin IJ, Williams RS (1996) Continuous contractileactivity induces fiber type specific expression of HSP70 inskeletal muscle. Am J Physiol 271:C1828–C1837
22. Pilegaard H, Ordway GA, Saltin B, Neufer PD (2000) Tran-scriptional regulation of gene expression in human skeletalmuscle during recovery from exercise. Am J Physiol 279:E806–E814
23. Pilegaard H, Saltin B, Neufer PD (2003) Exercise inducestransient transcriptional activation of the PGC-1alpha gene inhuman skeletal muscle. J Physiol 546:851–858
24. Puntschart A (1994) Molekulare Adaptation des menschlichenSkelettmuskels an Ausdauertraining. Thesis/Dissertation. ETHZurich
25. Puntschart A, Claassen H, Jostarndt K, Hoppeler H, Billeter R(1995) mRNAs of enzymes involved in energy metabolism andmtDNA are increased in endurance-trained athletes. AmJ Physiol 269:C619–C625
26. Richardson RS, Wagner H, Mudaliar SR, Henry R, Noys-zewski EA, Wagner PD (1999) Human VEGF gene expressionin skeletal muscle: effect of acute normoxic and hypoxic exer-cise. Am J Physiol 277:H2247–H2252
27. Richardson RS, Wagner H, Mudaliar SR, Saucedo E, HenryR, Wagner PD (2000) Exercise adaptation attenuates VEGFgene expression in human skeletal muscle. Am J Physiol279:H772–H778
28. Rosler K, Hoppeler H, Conley KE, Claassen H, Gehr P, Ho-wald H (1985) Transfer effects in endurance exercise. Adapta-tions in trained and untrained muscles. Eur J Appl PhysiolOccup Physiol 54:355–362
29. Sachs AB (1993) Messenger RNA degradation in eukaryotes.Cell 74:413–421
30. Saltin B, Henriksson J, Nygaard E, Andersen P, Jansson E(1977) Fiber types and metabolic potentials of skeletal musclesin sedentary man and endurance runners. Ann N Y Acad Sci301:3–29
31. Schmitt B, Fluck M, Decombaz J, Kreis R, Boesch C, WittwerM, Graber F, Vogt M, Howald H, Hoppeler H (2003) Tran-scriptional adaptations of lipid metabolism in tibialis anteriormuscle of endurance-trained athletes. Physiol Genomics15:148–157
32. Schrauwen-Hinderling VB, Schrauwen P, Hesselink MK, vanEngelshoven JM, Nicolay K, Saris WH, Kessels AG, Kooi ME(2003) The increase in intramyocellular lipid content is a veryearly response to training. J Clin Endocrinol Metab 88:1610–1616
33. Seip RL, Angelopoulos TJ, Semenkovich CF (1995) Exerciseinduces human lipoprotein lipase gene expression in skeletalmuscle but not adipose tissue. Am J Physiol 268:E229–E236
34. Seip RL, Mair K, Cole TG, Semenkovich CF (1997) Inductionof human skeletal muscle lipoprotein lipase gene expression byshort-term exercise is transient. Am J Physiol 272:E255–E261
35. Starkie RL, Arkinstall MJ, Koukoulas I, Hawley JA, FebbraioMA (2001) Carbohydrate ingestion attenuates the increase inplasma interleukin-6, but not skeletal muscle interleukin-6mRNA, during exercise in humans. J Physiol 533:585–591
36. Tunstall RJ, Mehan KA, Wadley GD, Collier GR, Bonen A,Hargreaves M, Cameron-Smith D (2002) Exercise training in-creases lipid metabolism gene expression in human skeletalmuscle. Am J Physiol 283:E66–E72
37. Turner DL, Hoppeler H, Claassen H, Vock P, Kayser B,Schena F, Ferretti G (1997) Effects of endurance training onoxidative capacity and structural composition of human armand leg muscles. Acta Physiol Scand 161:459–464
38. Vissing K, Andersen JL, Schjerling P (2005) Are exercise-induced genes induced by exercise?. FASEB J 19:94–96
39. Wittwer M, Billeter R, Hoppeler H, Fluck M (2004) Regula-tory gene expression in skeletal muscle of highly endurance-trained humans. Acta Physiol Scand 180:217–227
40. Wittwer M, Fluck M, Hoppeler H, Muller S, Desplanches D,Billeter R (2002) Prolonged unloading of rat soleus musclecauses distinct adaptations of the gene profile. FASEB J16:884–886
41. Yan Z, Salmons S, Jarvis J, Booth FW (1995) Increased musclecarnitine palmitoyltransferase II mRNA after increased con-tractile activity. Am J Physiol 268:E277–E281
687