Enantioselectivity of Haloalkane Dehalogenases and its Modulation by Surface Loop Engineering
19
Supporting Information # Wiley-VCH 2010 69451 Weinheim, Germany Enantioselectivity of Haloalkane Dehalogenases and its Modulation by Surface Loop Engineering** Zbynek Prokop, Yukari Sato, Jan Brezovsky, Tomas Mozga, Radka Chaloupkova, Tana Koudelakova, Petr Jerabek, Veronika Stepankova, Ryo Natsume, Jan G. E. van Leeuwen, DickB. Janssen, Jan Florian, Yuji Nagata, Toshiya Senda, and Jiri Damborsky* anie_201001753_sm_miscellaneous_information.pdf
Transcript of Enantioselectivity of Haloalkane Dehalogenases and its Modulation by Surface Loop Engineering
Supporting Information
� Wiley-VCH 2010
69451 Weinheim, Germany
Enantioselectivity of Haloalkane Dehalogenases and its Modulation bySurface Loop Engineering**Zbynek Prokop, Yukari Sato, Jan Brezovsky, Tomas Mozga, Radka Chaloupkova,Tana Koudelakova, Petr Jerabek, Veronika Stepankova, Ryo Natsume, Jan G. E. van Leeuwen,Dick B. Janssen, Jan Florian, Yuji Nagata, Toshiya Senda, and Jiri Damborsky*
anie_201001753_sm_miscellaneous_information.pdf

Supporting Information
Experimental
Kinetic analysis
Kinetic resolution. Kinetic resolution experiments were performed at room temperature (21°C) as follows.
Racemic substrates were added to a final concentration of 0.1 to 5 mM, depending on the apparent
enzyme affinity, to screw-capped reaction vessels containing 20 ml Tris-sulphate buffer (50 mM, pH 8.2)
and enzymatic reactions were initiated by adding an appropriate amount (depending on its specific
activity) of purified haloalkane dehalogenase (final enzyme concentration 0.025 to 0.15 mg/ml). The
progress of each reaction was monitored by periodically withdrawing samples from the reaction mixture,
extracting them with diethyl ether containing 1-chlorohexane as an internal standard, drying them on a
column containing anhydrous Na2SO4, and analyzing them using a Hewlett-Packard 6890 gas
chromatograph equipped with a flame ionization detector and a Chiraldex B-TA or G-TA chiral capillary
column (Alltech, USA). The enantiomeric ratio was calculated according to the equation E =
(kcat,R/Km,R)/(kcat,S/Km,S), where kcat/Km represents the specificity constant. To estimate E-values, the
equations describing competitive Michaelis-Menten kinetics were fitted by numerical integration to time
courses of changes in substrate concentrations obtained from the kinetic resolution experiments using
MicroMath Scientist for Windows (ChemSW, USA). Enantiopreference was determined by comparison
of retention times and GC-MS spectra between the produced alcohol or remaining substrate enantiomer
with enantiopure standards (Sigma-Aldrich, USA). Samples from kinetic resolution experiments and
standards were analyzed using a Trace MS 2000 GC-MS (Finnigan, USA) equipped with a Chiraldex B-
TA or G-TA chiral capillary column (Alltech, USA).
Enzymatic Synthesis (S)-2-bromopentane. Dehalogenation reaction was performed at a room temperature
(21ºC) in 24.6 l Tris sulfate buffer (50 mM, pH 8.2) containing 20% (v/v) dimethyl sulfoxide. The
substrate was added to a final concentration of 2 mM. Enzymatic reaction was initiated by addition of
DbjA wild-type crude extract (20 ml, 80 IU). The reaction was periodically monitored for 150 minutes
and samples were analyzed by gas chromatograph equipped with a CHIRALDEX capillary GC column
G-TA (Alltech, USA). When the total conversion of one enantiomer was reached, reaction was stopped
by mixing with sulphuric acid decreasing pH to 4.0. The unconverted enantiomer was extracted with
20×100 ml pentane. The organic phases were anhydrated by magnesium sulphate and pentane was
evaporated on rotavapor. The compounds were separated by flash column chromatography using pentane
as the eluent.[1] The presence of 2-bromopentane in collected fractions was controlled by gas
chromatography. Fractions containing 2-bromopentane were concentrated on rotavapor and distilled.

Chemical Synthesis of (R)-2-bromopentane. Optically active (S)-2-pentanol (0.84g, 9.53 mmol) and NaBr
in 3-ml glass bottle fitted with a mechanical stirrer were cooled to -10 to -5 ºC using ice-acetone bath.[2]
PBr3 (0.86 mg, 3.17 mmol) was added over a period of 20 min, during which time the temperature was
kept between -5 and -10 ºC. The reaction mixture was then stirred at -5 ºC for 1 h and at 0 ºC for another
1h. Then it was allowed for 15 min to warm to room temperature. The reaction mixture was neutralized
by sodium bicarbonate and washed with water. Both organic and aqua’s layers were extracted with
pentane. Pentane layers were anhydrated by magnesium sulphate and pentane was evaporated on
rotavapor. The compounds were separated by flash chromatography using pentane as the eluent. Fractions
containing 2-bromopentane were concentrated on rotavapor and distilled.
Measurement of Michaelis-Menten Constants. Dehalogenation reactions were performed at 37 ºC in 25-
ml Reacti Flasks closed by Mininert Valves. The reaction mixtures were composed of 13.5 ml 50 mM
Tris buffer (pH 8.2) and 1.5 ml dimethyl sulfoxide. Wide range of substrate concentrations was prepared
(0.05–1.5 mM). The substrate was allowed for 30 min to dissolve. Enzymatic reaction was initiated by
addition of enzyme solution (final concentration 0.15 μM). The reactions were monitored by withdrawing
of 0.5 ml samples by syringe at 0, 5, 10, 15 and 20 min from the reaction mixtures. The samples were
immediately mixed with 1 ml of diethyl ether. After extraction, samples were anhydrated on glass column
with sodium sulphate. Samples were analyzed by gas chromatograph equipped with a CHIRALDEX G-
TA or B-TA capillary GC column. Data points were measured in two independent replicates and
represented as average values. Michaelis-Menten constants (Km and kcat) were derived by non-linear curve
fit employing the software Origin 6.1 (OriginLab Corp., USA).
Crystallographic analysis
Crystal structure analysis of His-tagged DbjA. His-tagged DbjA (His-DbjA) was purified and crystallized,
then diffraction data were acquired from the crystals, as previously reported.[3] The structure of His-DbjA
was determined by the molecular replacement method using MOLREP,[4] and the subunit structure of
DhaA (PDB code: 1BN6)[5] as a search model. The structure was refined using CNS [6] and REFMAC5 [7]
(Supporting Information Table 2). However, the crystal structure of His-DbjA showed that the His-tag
was bound to the active site of the enzyme, which seemed likely to hamper preparation of the crystal of
the His-DbjA-product complex. Therefore, we analyzed the crystal structure of His-tag free wild-type
DbjA (DbjA).
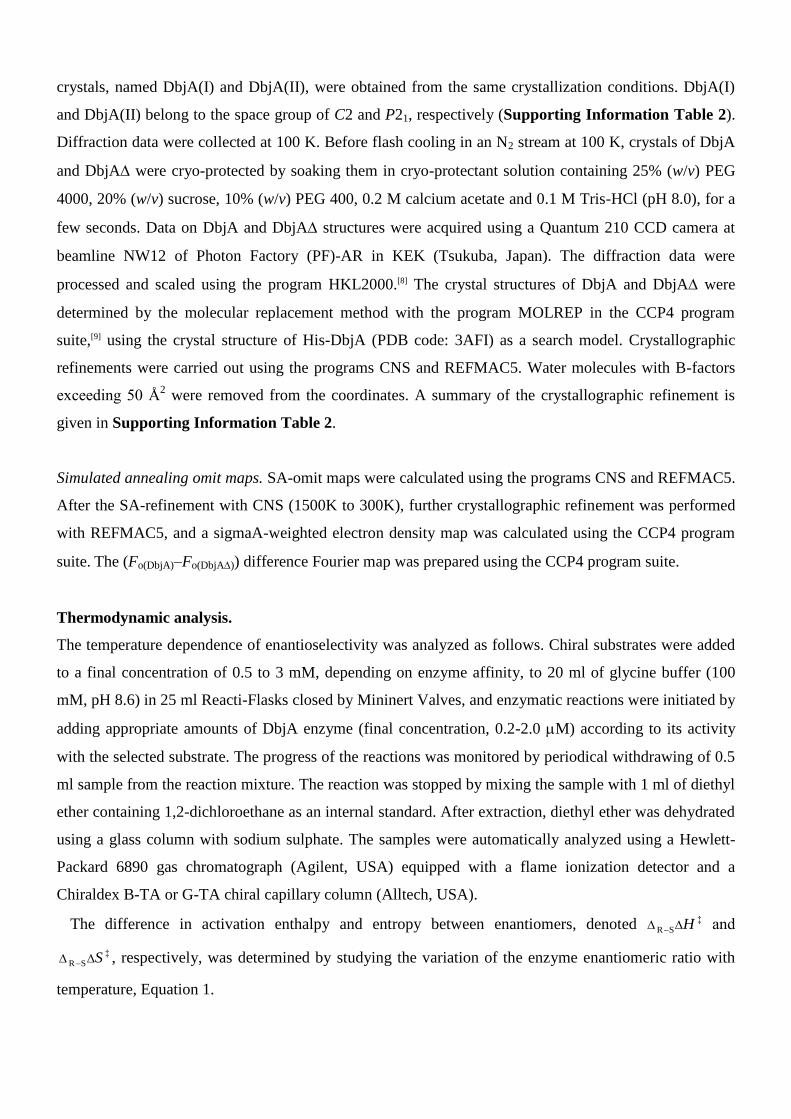
Crystallization and crystal structure analysis of DbjA and DbjA. In order to construct the DbjA
expression vector, the dbjA gene was inserted into pET11a (Novagen, Germany), and the obtained vector
was named pYBJA3. The DbjA construct encodes residues 1–310 of DbjA with its C-terminus fused to a
restriction site of Sal I with sequence Ala-Val-Asp, where Ala is residue 310 of the DbjA sequence. E.
coli, strain BL21(DE3), was transformed with the expression vector pYBJA3 and cultured in LB medium
containing 0.2% glucose and 0.2% glycerol at 37°C. The expression of DbjA was induced by adding 0.5
mM isopropyl--D-thiogalactopyranoside (IPTG) when the culture reached an OD660 of 0.6. After further
incubation for 24 hours at 25°C the cells were harvested, washed twice with 0.1 M Glycine-NaOH buffer
containing 10% (v/v) glycerol (pH 9.0), and re-suspended in the same buffer. The expressed DbjA was
then purified at 4°C, as follows. The cells were disrupted by sonication (VP-30S, Taitec, Japan), after
which cell debris and large particles were removed by centrifugation at 20000 x g for 30 min. The extract
was diluted to 13 mg/ml and dialyzed against 0.01 M Tris-H2SO4, 10% (v/v) glycerol and 30% (w/v)
ammonium phosphate (pH 7.5) for 90 min, and the resulting precipitate was removed by centrifugation at
20000 x g for 30 min. The supernatant was then dialyzed against 0.01 M Tris-H2SO4, 10% glycerol (v/v)
and 50% (w/v) ammonium phosphate (pH 7.5) for 2 hours. The resulting precipitate was again collected
by centrifugation at 20000 x g for 30 min, re-dissolved in 0.01 M Tris-H2SO4, 10% glycerol (v/v) (pH
7.5) (Buffer A) and dialyzed overnight against buffer A. The dialyzed enzyme solution was applied to a
DEAE-Sephalose FF (Amersham Biotech, USA) column (2.6 x 15 cm) equilibrated with buffer A, which
was washed with 200 ml of buffer A then eluted by a linear gradient of 0–0.4 M ammonium sulphate in
buffer A (total volume 200 ml, flow rate 3 ml/min, fraction volume 3 ml). DbjA was eluted in a
concentration range from 0.05 M to 0.11 M of ammonium sulphate. The DbjA-containing fractions were
dialyzed against buffer A containing 50% (w/v) ammonium sulphate (pH 7.5) for 4 hours. The precipitate
was collected by centrifugation at 20000 x g for 30 min, and dissolved in Buffer A then dialyzed
overnight against 0.1 M glycine-NaOH containing 10% glycerol (v/v) (pH 8.6). The dialyzed enzyme was
concentrated to 25 mg/ml using Amicon Ultra and Centricon ultrafiltration units (Millipore, USA) for
crystallization experiments. DbjA was also overexpressed in E. coli strain BL21(DE3). The expression
vector for DbjA, pYBJA2del, contains the DbjA gene coding residues 1–310, except residues 140–146,
with its C-terminus fused to an Ala-His-His-His-His-His-His affinity-tag (where Ala is residue 310 of
DbjA). DbjA was overproduced and purified using an Ni-column (Chelating Sephalose Fast Flow, GE
Healthcare, USA) as previously described.[3] The fractions containing DbjA were pooled and dialyzed
against 0.1 M Glycine-NaOH containing 10% glycerol (v/v) (pH 8.6). The dialyzed enzyme was
concentrated to 24 mg/ml using Amicon Ultra and Centricon ultrafiltration units (Millipore, USA) for
crystallization experiments. Both DbjA and DbjA were crystallized at 20°C by the hanging-drop vapor
diffusion method. In each case a hanging drop was prepared by mixing 1 l each of the protein and
reservoir solution (17–19.5% (w/v) PEG 4000, 0.2 M calcium acetate, and 0.1 M Tris-HCl pH 7.9–8.1).[3]
Microseeds of the His-DbjA were required for the crystallization of DbjA. Two forms of the DbjA
crystals, named DbjA(I) and DbjA(II), were obtained from the same crystallization conditions. DbjA(I)
and DbjA(II) belong to the space group of C2 and P21, respectively (Supporting Information Table 2).
Diffraction data were collected at 100 K. Before flash cooling in an N2 stream at 100 K, crystals of DbjA
and DbjA were cryo-protected by soaking them in cryo-protectant solution containing 25% (w/v) PEG
4000, 20% (w/v) sucrose, 10% (w/v) PEG 400, 0.2 M calcium acetate and 0.1 M Tris-HCl (pH 8.0), for a
few seconds. Data on DbjA and DbjA structures were acquired using a Quantum 210 CCD camera at
beamline NW12 of Photon Factory (PF)-AR in KEK (Tsukuba, Japan). The diffraction data were
processed and scaled using the program HKL2000.[8] The crystal structures of DbjA and DbjA were
determined by the molecular replacement method with the program MOLREP in the CCP4 program
suite,[9] using the crystal structure of His-DbjA (PDB code: 3AFI) as a search model. Crystallographic
refinements were carried out using the programs CNS and REFMAC5. Water molecules with B-factors
exceeding 50 Å2 were removed from the coordinates. A summary of the crystallographic refinement is
given in Supporting Information Table 2.
Simulated annealing omit maps. SA-omit maps were calculated using the programs CNS and REFMAC5.
After the SA-refinement with CNS (1500K to 300K), further crystallographic refinement was performed
with REFMAC5, and a sigmaA-weighted electron density map was calculated using the CCP4 program
suite. The (Fo(DbjA)–Fo(DbjA)) difference Fourier map was prepared using the CCP4 program suite.
Thermodynamic analysis.
The temperature dependence of enantioselectivity was analyzed as follows. Chiral substrates were added
to a final concentration of 0.5 to 3 mM, depending on enzyme affinity, to 20 ml of glycine buffer (100
mM, pH 8.6) in 25 ml Reacti-Flasks closed by Mininert Valves, and enzymatic reactions were initiated by
adding appropriate amounts of DbjA enzyme (final concentration, 0.2-2.0 M) according to its activity
with the selected substrate. The progress of the reactions was monitored by periodical withdrawing of 0.5
ml sample from the reaction mixture. The reaction was stopped by mixing the sample with 1 ml of diethyl
ether containing 1,2-dichloroethane as an internal standard. After extraction, diethyl ether was dehydrated
using a glass column with sodium sulphate. The samples were automatically analyzed using a Hewlett-
Packard 6890 gas chromatograph (Agilent, USA) equipped with a flame ionization detector and a
Chiraldex B-TA or G-TA chiral capillary column (Alltech, USA).
The difference in activation enthalpy and entropy between enantiomers, denoted ‡
SR H and
‡
SR S , respectively, was determined by studying the variation of the enzyme enantiomeric ratio with
temperature, Equation 1.

R
S
R
HE
‡
SR
‡
SR
T
1ln
(1)
where R is the universal gas constant and T is absolute temperature. Since free (R)- and (S)-enantiomers
of the same substrate have identical enthalpies and entropies, the activation enthalpy and entropy
differences can be replaced by relative enthalpies ( ‡H ) and entropies ( ‡S ) of the rate-limiting transition
states of the enzyme-catalyzed reaction as
‡
S
‡
R
‡
SR
‡
SR HHHH (2a)
‡
S
‡
R
‡
SR
‡
SR SSSS (2b)
Since lnE varies linearly with the reciprocal temperature the magnitudes of ‡
SR H /R and
‡
SR S /R were determined as the slope and intercept of this line, respectively. The racemic temperature
(Tr) was determined as the ratio of the differential activation enthalpy and entropy, Equation 3.
Tr RSH
‡
RSS ‡ (3)
Computational analysis
Molecular docking. Substrates were docked in the active sites of wild-type DbjA, DbjAΔ and
DbjA+His139Ala using the program AUTODOCK 3.05.[10] The structures of DbjA (PDB code 3A2M)
and DbjAΔ (PDB code 3A2L) originated from crystallographic analysis. The substitution His139Ala was
introduced to DbjA+His139Ala by the program Pymol 0.99 (DeLano Scientific, San Francisco).
Hydrogen atoms were added to these proteins by the program WHATIF 6.0.[11] The grid maps were
calculated using AUTOGRID 3.06 for all atom types occurring in the substrates,[10] with range set to 81 x
81 x 81 grid points and 0.25 Å spacing, centred at the nucleophilic oxygen atom of Asp103 to cover the
whole active site of the enzymes. 250 docking calculations were performed for both substrates. The
Lamarckian Genetic Algorithm was used with a population size of 250 individuals, a maximum of 1.5 x
106 energy evaluations and 27,000 generations, elitism value 1, mutation rate 0.02 and cross-over rate 0.8.
The local search was based on the pseudo Solis and Wets algorithm with a maximum of 300 iterations per
local search.[12] Final orientations from every docking were clustered with a clustering tolerance for the
root-mean-square positional deviation of 0.5 Å.

Molecular dynamics (MD) simulations. Starting structures for MD simulations were generated from the
docked structures (binding modes) of each enzyme complexed with investigated substrates. The addition
of three Na+ ions to this selection resulted in a zero total charge of a 23 Å-radius simulation sphere
centered at the OD1 atom of Asp103. All residues further than 18 Å from the center of the simulation
sphere were electroneutral. The water molecules were added to the simulated system by immersing the
simulation sphere into the sphere of TIP3P water molecules subjected to the surface-constraint all-atom
solvent type boundary condition.[13] These boundary conditions were designed to mimic the average
polarization and density of surface water molecules as if these molecules were part of the bulk aqueous
solution. Positions of water molecules in the active site were taken from the crystal structure. Positions of
atoms lying outside the sphere boundary were fixed at their crystallographic positions, and their non-
bonded interactions with the atoms within the simulation sphere were turned off. The structures of the
simulated systems were equilibrated by a gradual heating of the simulated system from 5K to 298K in a
series of twelve MD simulations with gradually increasing step sizes (0.5 to 2 fs) and 190 ps simulation
time in total. The energies were sampled every 10 steps. The SHAKE algorithm was applied to hydrogen
atoms of both solute and solvent molecules.[14] The non-bonded interactions were evaluated explicitly for
distances shorter than 10 Å. The local reaction field method was used to include long-range electrostatic
interactions for distances beyond a 10 Å cut-off.[15] The long-range potential was updated every 40 steps.
All MD simulations were carried out using the program Q.[13b]
Binding free energy calculations. Five different snapshots were selected from the equilibrated trajectory
for each binding mode as starting structures for five independent binding free energy calculations. The
reference system consisted of substrate molecule in the 23 Å radius sphere of TIP3P water molecules.
MD simulations of 3 ns length for all five starting structures and reference aqueous system were carried
out at 298K using 2 fs step-sizes. Binding free energies (LRA
bindG ) were calculated using the linear response
approximation (LRA/α) method.[16] In this approximation, LRA
bindG is evaluated from average energies <U>
of the substrate (l) sampled from MD trajectories calculated in the protein (p) and water (w) as
',,,,,
/ )()(l
p
lelecl
w
lwdwl
p
lwdwl
w
lelecl
p
lelec
LRA
bind UUUUUG (4)
where subscripts elec,l and vdW,l denote electrostatic and van der Waals components of the interaction
energy of l with its protein and/or water environment, α and β are empirical constants, and <>l’
is the MD
trajectory obtained with all atomic charges on l set to zero. The parameter α was adjusted to 0.56 by
comparing the observed and calculated hydration free energies for imidazole, difluorotoluene, and
protonated cytosine as representative of non-polar, polar and charged solutes, respectively.[16b] The

parameter = 0.5 is a theoretical parameter that relies on the validity of the electrostatic linear-response
theory.[17] The binding free energies for individual binding modes were obtained as averages over all
stable trajectories selected from five independent calculations, as described above.
Near Attack Configuration (NAC) analysis. The presence of NACs along calculated MD trajectories was
evaluated every 0.5 ps using a two-parameter geometric condition proposed by Hur and Bruice for this
reaction class.[18] More specifically, two parameters characterizing NAC states were defined: (i) the
distance between the nucleophilic oxygen and the attacked carbon atom ≤ 3.5 Å and (ii) the angle formed
by the nucleophilic oxygen, attacked carbon and leaving bromine had to exceed 140 degrees.
Results
Kinetic analysis
Kinetic resolution. Three different haloalkane dehalogenases were tested for their ability to resolve
kinetically a series of racemic substrates (Supporting Information Table 1). The magnitude of the chiral
resolution (E-values) was low for most of the substrates, but all tested dehalogenases showed excellent
enantioselectivity with -bromoesters. This experiment demonstrates, for the first time, that certain
enzymes of this family possess high enantioselectivity. The enzyme DbjA also showed strong
enantioselectivity with -substituted bromoalkanes, with preferences for converting the (R)-enantiomers
of 2-bromopentane, 2-bromohexane, 2-bromoheptane, methyl 2-bromopropionate, ethyl 2-
bromopropionate, methyl 2-bromobutyrate and ethyl 2-bromobutyrate.
Supporting Information Table 1 Kinetic resolution of a series of racemic substrates by DhaA, LinB and DbjA.
Substrate
Enzyme
DhaA LinB DbjA
E-value Act.a E-value Act.
a E-value Act.
a
2-chlorobutane n.d. n.d. 1 0.1 n.d. n.d.
2-bromobutane 2 0.2 2 0.7 1 0.8
2-bromopentane 7 0.5 16 0.4 145 0.1
2-bromohexane 4 0.3 12 0.3 68 0.5
2-bromoheptane 3 0.6 3 1.4 28 1.2
1,2-dichloropropane n.d. n.d. n.d. n.d. n.d. n.d.
1,2-dibromopropane 1 b n.r. 1 3.9 3 2.3
1-bromo-3-chloro-2-methylpropane 2 b n.r.
2 3.9 1 2.3
1,2-dichlorobutane n.d. n.d. n.d. n.d. n.d. n.d.
1,3-dichlorobutane 2 0.2 3 0.9 1 0.4
1,2-dibromobutane 2 b n.r.
10 2.1 3 1.9
1,3-dibromobutane 1 0.2 5 1.4 1 1.4
epibromohydrin 1 0.8 1 0.6 2 0.3
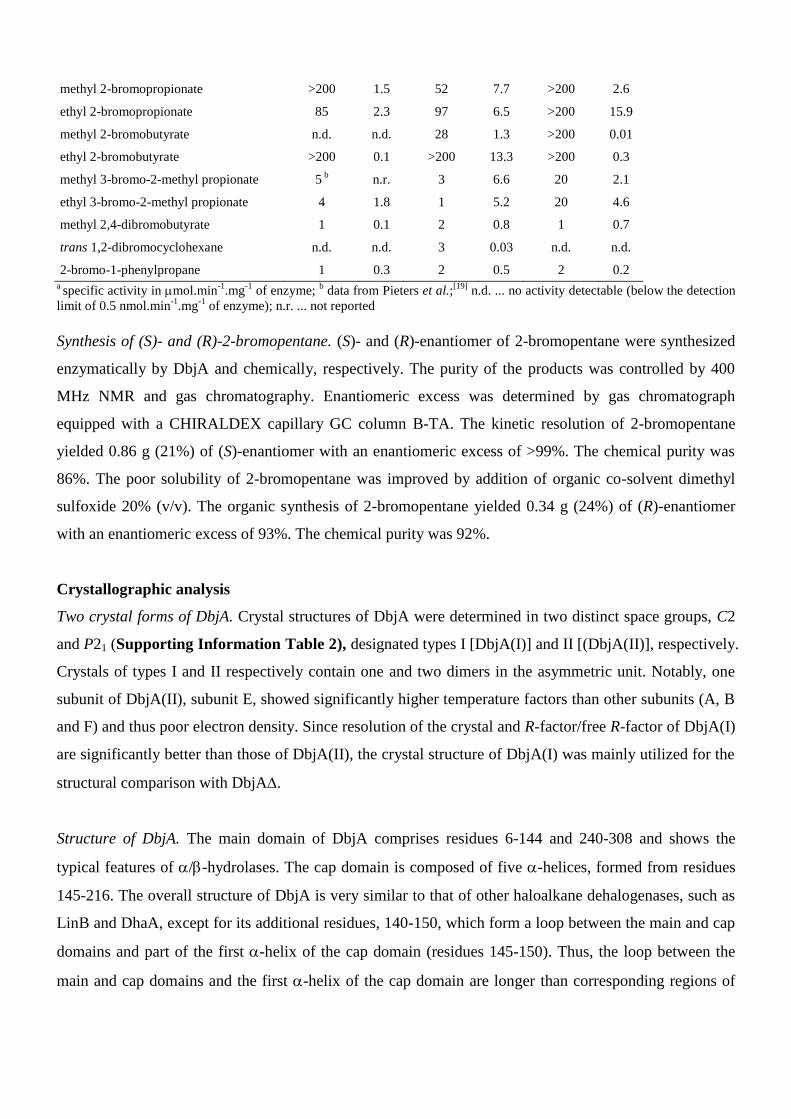
methyl 2-bromopropionate >200 1.5 52 7.7 >200 2.6
ethyl 2-bromopropionate 85 2.3 97 6.5 >200 15.9
methyl 2-bromobutyrate n.d. n.d. 28 1.3 >200 0.01
ethyl 2-bromobutyrate >200 0.1 >200 13.3 >200 0.3
methyl 3-bromo-2-methyl propionate 5 b n.r. 3 6.6 20 2.1
ethyl 3-bromo-2-methyl propionate 4 1.8 1 5.2 20 4.6
methyl 2,4-dibromobutyrate 1 0.1 2 0.8 1 0.7
trans 1,2-dibromocyclohexane n.d. n.d. 3 0.03 n.d. n.d.
2-bromo-1-phenylpropane 1 0.3 2 0.5 2 0.2 a specific activity in mol.min
-1.mg
-1 of enzyme;
b data from Pieters et al.;
[19] n.d. ... no activity detectable (below the detection
limit of 0.5 nmol.min-1
.mg-1
of enzyme); n.r. ... not reported
Synthesis of (S)- and (R)-2-bromopentane. (S)- and (R)-enantiomer of 2-bromopentane were synthesized
enzymatically by DbjA and chemically, respectively. The purity of the products was controlled by 400
MHz NMR and gas chromatography. Enantiomeric excess was determined by gas chromatograph
equipped with a CHIRALDEX capillary GC column B-TA. The kinetic resolution of 2-bromopentane
yielded 0.86 g (21%) of (S)-enantiomer with an enantiomeric excess of >99%. The chemical purity was
86%. The poor solubility of 2-bromopentane was improved by addition of organic co-solvent dimethyl
sulfoxide 20% (v/v). The organic synthesis of 2-bromopentane yielded 0.34 g (24%) of (R)-enantiomer
with an enantiomeric excess of 93%. The chemical purity was 92%.
Crystallographic analysis
Two crystal forms of DbjA. Crystal structures of DbjA were determined in two distinct space groups, C2
and P21 (Supporting Information Table 2), designated types I [DbjA(I)] and II [(DbjA(II)], respectively.
Crystals of types I and II respectively contain one and two dimers in the asymmetric unit. Notably, one
subunit of DbjA(II), subunit E, showed significantly higher temperature factors than other subunits (A, B
and F) and thus poor electron density. Since resolution of the crystal and R-factor/free R-factor of DbjA(I)
are significantly better than those of DbjA(II), the crystal structure of DbjA(I) was mainly utilized for the
structural comparison with DbjA.
Structure of DbjA. The main domain of DbjA comprises residues 6-144 and 240-308 and shows the
typical features of /-hydrolases. The cap domain is composed of five -helices, formed from residues
145-216. The overall structure of DbjA is very similar to that of other haloalkane dehalogenases, such as
LinB and DhaA, except for its additional residues, 140-150, which form a loop between the main and cap
domains and part of the first -helix of the cap domain (residues 145-150). Thus, the loop between the
main and cap domains and the first -helix of the cap domain are longer than corresponding regions of

DhaA and LinB. The DbjA has deleted residues 140-146. The residues 147-150 form a loop in DbjA
(Figure 1a,b).
Alternative conformations of His139. The crystallographic refinement suggested that the side-chains of
His139 in both subunits A and B of DbjA(I) adopt alternative conformations (Figure 1c,d), and this was
confirmed using Fo–Fc SA-omit maps. The SA-omit map that was calculated using the DbjA structure
with the inclined conformation gave a significant density (> 3.0 level) around the side-chain of the
deflected conformation, and vice versa. We thus concluded that His139 in each subunit of DbjA(I) adopts
both alternative conformations.
In the DbjA(II) crystal the situation is slightly different. The His139 of subunit B showed both
conformations, but the His139 residues of other subunits consistently adopted the inclined conformation.
The difference in the crystal packing between C2 and P21 might affect the difference of the His139
conformation between types I (C2) and II (P21) crystals.
Supporting Information Table 2 Crystallographic data summary.
His-DbjA DbjA(I) DbjA(II) DbjA
Bound product product free product free product free product free
Data collection
Light source PF BL5A PF-AR NW12 PF-AR NW12 PF-AR NW12
Space group P21212 C2 P21 C2
Cell dimensions 212.86, 125.27, 125.53, 125.55,
a, b, c (Å) 117.84, 48.69, 47.67, 48.65,
55.80 106.50 99.41 106.82
° 90, 90, 90 90, 97.36, 90 90, 93.61, 90 90, 97.93, 90
Resolution (Å) 35.18-1.75 33.71-1.84 32.82-1.89 43.19-1.78
(1.81-1.75) (1.92-1.85) (1.96-1.89) (1.84-1.78)
Rmerge 0.041 (0.175) 0.063 (0.254) 0.062 (0.187) 0.072 (0.349)
I / 14.0 10.7 14.9 10.8
Completeness (%) 95.2 (90.7) 99.9 (99.3) 99.5 (99.9) 98.6 (92.4)
Redundancy 6.1 (5.6) 4.8 (3.4) 4.8 (4.8) 3.5 (2.7)
Refinement
Resolution (Å) 35.18-1.75 33.71-1.84 33.71-1.89 43.18-1.78
No. reflections 127,902 52,726 94,703 57,853
Rwork 0.168 0.154 0.201 0.169
Rfree 0.193 0.187 0.243 0.205
No. atoms
Protein 9,299 4,681 9,308 4,544
Ligand/ion 124/4 46/2 0/3 52/2
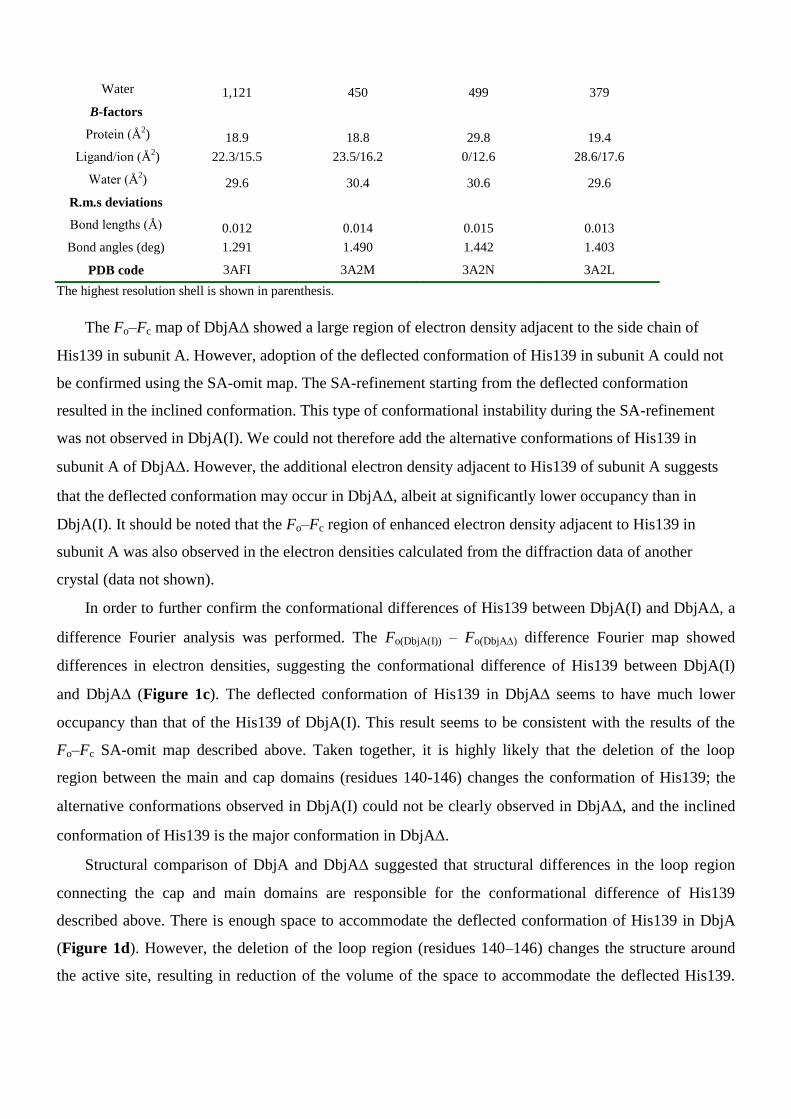
Water 1,121 450 499 379
B-factors
Protein (Å2) 18.9 18.8 29.8 19.4
Ligand/ion (Å2) 22.3/15.5 23.5/16.2 0/12.6 28.6/17.6
Water (Å2) 29.6 30.4 30.6 29.6
R.m.s deviations
Bond lengths (Å) 0.012 0.014 0.015 0.013
Bond angles (deg) 1.291 1.490 1.442 1.403
PDB code 3AFI 3A2M 3A2N 3A2L
The highest resolution shell is shown in parenthesis.
The Fo–Fc map of DbjA showed a large region of electron density adjacent to the side chain of
His139 in subunit A. However, adoption of the deflected conformation of His139 in subunit A could not
be confirmed using the SA-omit map. The SA-refinement starting from the deflected conformation
resulted in the inclined conformation. This type of conformational instability during the SA-refinement
was not observed in DbjA(I). We could not therefore add the alternative conformations of His139 in
subunit A of DbjA. However, the additional electron density adjacent to His139 of subunit A suggests
that the deflected conformation may occur in DbjA, albeit at significantly lower occupancy than in
DbjA(I). It should be noted that the Fo–Fc region of enhanced electron density adjacent to His139 in
subunit A was also observed in the electron densities calculated from the diffraction data of another
crystal (data not shown).
In order to further confirm the conformational differences of His139 between DbjA(I) and DbjA, a
difference Fourier analysis was performed. The Fo(DbjA(I)) – Fo(DbjA) difference Fourier map showed
differences in electron densities, suggesting the conformational difference of His139 between DbjA(I)
and DbjA (Figure 1c). The deflected conformation of His139 in DbjA seems to have much lower
occupancy than that of the His139 of DbjA(I). This result seems to be consistent with the results of the
Fo–Fc SA-omit map described above. Taken together, it is highly likely that the deletion of the loop
region between the main and cap domains (residues 140-146) changes the conformation of His139; the
alternative conformations observed in DbjA(I) could not be clearly observed in DbjA, and the inclined
conformation of His139 is the major conformation in DbjA.
Structural comparison of DbjA and DbjA suggested that structural differences in the loop region
connecting the cap and main domains are responsible for the conformational difference of His139
described above. There is enough space to accommodate the deflected conformation of His139 in DbjA
(Figure 1d). However, the deletion of the loop region (residues 140–146) changes the structure around
the active site, resulting in reduction of the volume of the space to accommodate the deflected His139.
The N atom of Gln147 and the C atom of Ala150 seem to make close contacts with deflected His139,
avoiding the deflected conformation of His139 in DbjAFigure 1d.
Thermodynamic analysis
The enantioselectivity of DbjA, DbjA and DbjA+His139Ala for selected representatives of -
bromoesters and -bromoalkanes was thermodynamically analyzed to obtain indications of enzyme- and
substrate-dependent differences among the transition states of the dehalogenation reactions.
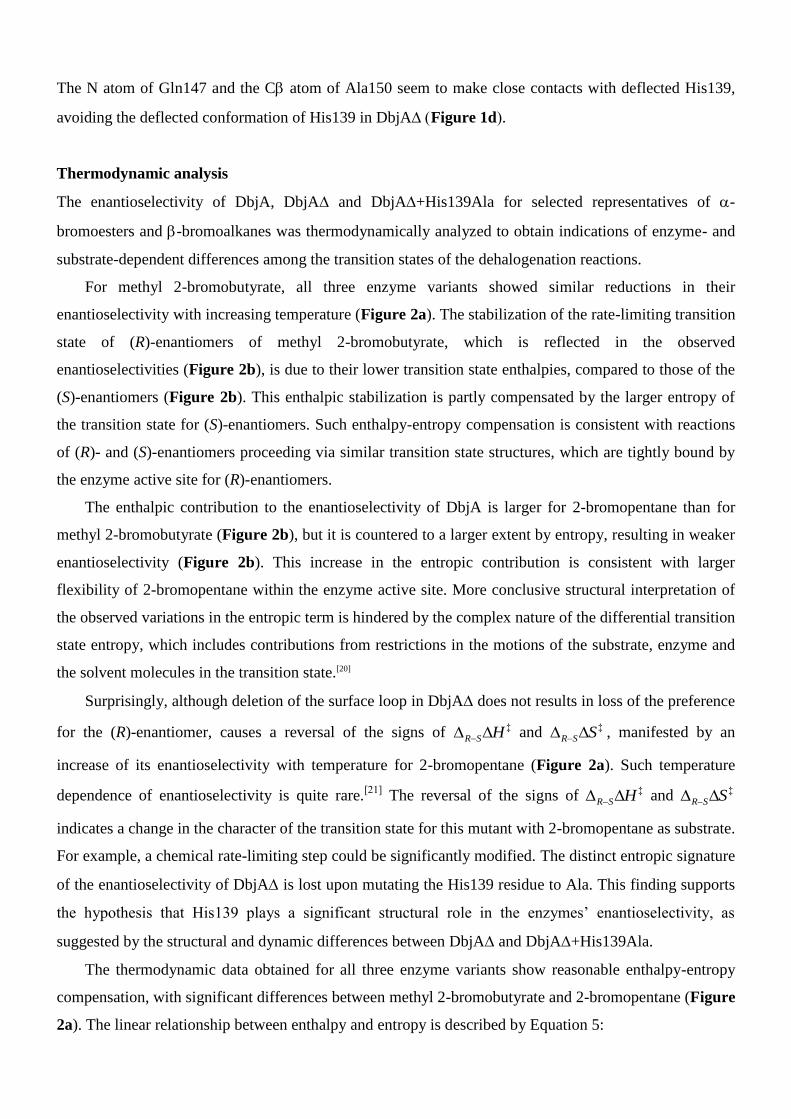
For methyl 2-bromobutyrate, all three enzyme variants showed similar reductions in their
enantioselectivity with increasing temperature (Figure 2a). The stabilization of the rate-limiting transition
state of (R)-enantiomers of methyl 2-bromobutyrate, which is reflected in the observed
enantioselectivities (Figure 2b), is due to their lower transition state enthalpies, compared to those of the
(S)-enantiomers (Figure 2b). This enthalpic stabilization is partly compensated by the larger entropy of
the transition state for (S)-enantiomers. Such enthalpy-entropy compensation is consistent with reactions
of (R)- and (S)-enantiomers proceeding via similar transition state structures, which are tightly bound by
the enzyme active site for (R)-enantiomers.
The enthalpic contribution to the enantioselectivity of DbjA is larger for 2-bromopentane than for
methyl 2-bromobutyrate (Figure 2b), but it is countered to a larger extent by entropy, resulting in weaker
enantioselectivity (Figure 2b). This increase in the entropic contribution is consistent with larger
flexibility of 2-bromopentane within the enzyme active site. More conclusive structural interpretation of
the observed variations in the entropic term is hindered by the complex nature of the differential transition
state entropy, which includes contributions from restrictions in the motions of the substrate, enzyme and
the solvent molecules in the transition state.[20]
Surprisingly, although deletion of the surface loop in DbjA does not results in loss of the preference
for the (R)-enantiomer, causes a reversal of the signs of ‡HSR and ‡SSR
, manifested by an
increase of its enantioselectivity with temperature for 2-bromopentane (Figure 2a). Such temperature
dependence of enantioselectivity is quite rare.[21]
The reversal of the signs of ‡HSR and ‡SSR
indicates a change in the character of the transition state for this mutant with 2-bromopentane as substrate.
For example, a chemical rate-limiting step could be significantly modified. The distinct entropic signature
of the enantioselectivity of DbjA is lost upon mutating the His139 residue to Ala. This finding supports
the hypothesis that His139 plays a significant structural role in the enzymes’ enantioselectivity, as
suggested by the structural and dynamic differences between DbjA and DbjA+His139Ala.
The thermodynamic data obtained for all three enzyme variants show reasonable enthalpy-entropy
compensation, with significant differences between methyl 2-bromobutyrate and 2-bromopentane (Figure
2a). The linear relationship between enthalpy and entropy is described by Equation 5:

STGH c c (5)
where Tc is the compensation temperature and Gc is the Gibbs free energy at Tc. Several explanations for
the compensation phenomenon have been proposed. Firstly, it may be due to the dominant role of water,
as the solvent in which the processes take place. Secondly, the restricted motion of the enzyme upon
binding of the substrate could be the major source of compensation; as the binding tightens the binding
enthalpy will become increasingly negative, the enzyme will become more rigid and lose more entropy.
Thirdly, differential solvation of the free and bound species might be responsible for the enthalpy-entropy
compensation.[22]
Finally, the possibility that enthalpy-entropy compensation is an artifact arising from
experimental or statistical errors should also be considered. However, we observed clear differences in
the temperature responses of the enzymatic enantioselectivity of DbjA, DbjA and DbjA+His139Ala
towards 2-bromopentane and methyl 2-bromobutyrate and clear evidence of enthalpy-entropy
compensation. Intense compensation was observed for kinetic resolution of 2-bromopentane, but weak for
methyl 2-bromobutyrate, with all enzyme variants. This implies that the kinetic resolution of 2-
bromopentane could be partly due to selective expulsion of bound solvent from the active site upon
binding of enantiomeric substrates.[21b]
Computational analysis
Molecular Docking. Two putatively productive binding modes were found for each enantiomer of methyl
2-bromobutyrate docked into the active sites of DbjA, DbjA and DbjA+His139Ala (Supporting
Information Figure 1a). In the R-N and S-N binding modes of (R)- and (S)-enantiomers, respectively,
the carbonyl group of the substrate was hydrogen-bonded to the side-chain of Asn38, which is one of the
halogen-stabilizing active-site residues. Alternatively, H-bonding interaction of this carbonyl group with
the side-chain of Trp104 occurred in binding modes labeled R-W and S-W.
A single putatively productive binding mode, designated R-N, was found for the (R)-enantiomer of 2-
bromopentane in all investigated enzymes (Supporting Information Figure 1b). In contrast, as many as
three possible binding modes were found for the (S)-enantiomer. The modes S-N and S-W are represented
by complexes with the alkyl chain of the substrate in close contact with Asn38 and Trp104, respectively.
The S-H mode, orienting the alkyl groups into close contact with His139, was obtained by docking the
(S)-enantiomer to DbjA and DbjA with the side-chain of His139 in inclined conformation. The side-
chain of His139 is rotated into the active site cavity in the mutant DbjA, it occupies both conformations
in DbjA and is absent in DbjAΔ+His139Ala, suggesting that the interaction of the substrate with His139
favors the S-H binding mode. In all binding modes, 2-bromopentane displaces two structural water
molecules from the active site of DbjA and DbjAΔ.

a
b
Supporting Information Figure 1 Structural representations of all putatively productive binding modes of methyl
2-bromobutyrate (a) and 2-bromopentane (b) in the active sites of the studied DbjA proteins obtained from docking
calculations. The ligands are in yellow sticks and the active sites in green sticks (represented by the residues Asn38, Asp103,
Trp104, His139, Phe176 and Tyr281). For methyl 2-bromobutyrate, all binding modes R-N, S-N, R-W and S-W were observed,
irrespective of the conformation of His139 (three H-bonds formed between substrate and halogen-stabilizing residues are
indicated by dashed blue lines). For 2-bromopentane, the binding modes R-N, S-N and S-W were observed irrespective of the
conformation of His139, while the binding mode S-H was not observed with His139 in the deflected conformation (in red
sticks; two H-bonds formed between substrate and halogen-stabilizing residues are indicated by dashed blue lines).
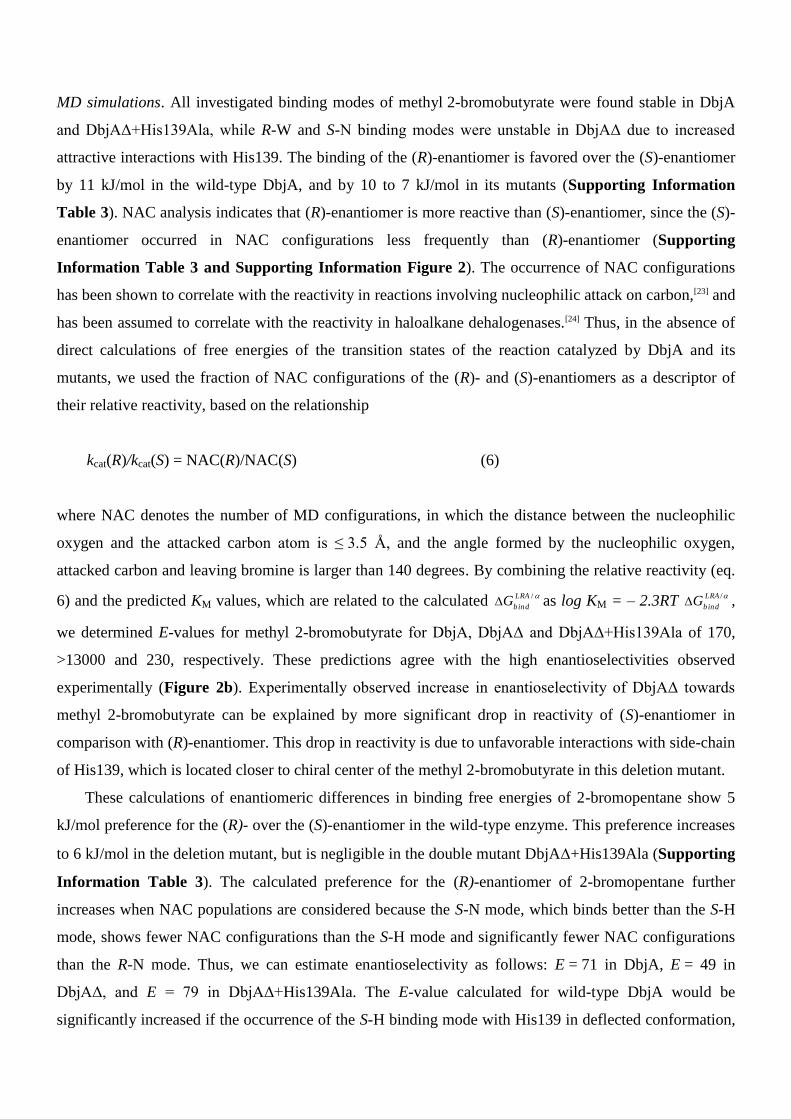
MD simulations. All investigated binding modes of methyl 2-bromobutyrate were found stable in DbjA
and DbjAΔ+His139Ala, while R-W and S-N binding modes were unstable in DbjAΔ due to increased
attractive interactions with His139. The binding of the (R)-enantiomer is favored over the (S)-enantiomer
by 11 kJ/mol in the wild-type DbjA, and by 10 to 7 kJ/mol in its mutants (Supporting Information
Table 3). NAC analysis indicates that (R)-enantiomer is more reactive than (S)-enantiomer, since the (S)-
enantiomer occurred in NAC configurations less frequently than (R)-enantiomer (Supporting
Information Table 3 and Supporting Information Figure 2). The occurrence of NAC configurations
has been shown to correlate with the reactivity in reactions involving nucleophilic attack on carbon,[23] and
has been assumed to correlate with the reactivity in haloalkane dehalogenases.[24] Thus, in the absence of
direct calculations of free energies of the transition states of the reaction catalyzed by DbjA and its
mutants, we used the fraction of NAC configurations of the (R)- and (S)-enantiomers as a descriptor of
their relative reactivity, based on the relationship
kcat(R)/kcat(S) = NAC(R)/NAC(S) (6)
where NAC denotes the number of MD configurations, in which the distance between the nucleophilic
oxygen and the attacked carbon atom is ≤ 3.5 Å, and the angle formed by the nucleophilic oxygen,
attacked carbon and leaving bromine is larger than 140 degrees. By combining the relative reactivity (eq.
6) and the predicted KM values, which are related to the calculated /LRA
bindG as log KM = – 2.3RT
/LRA
bindG ,
we determined E-values for methyl 2-bromobutyrate for DbjA, DbjAΔ and DbjAΔ+His139Ala of 170,
>13000 and 230, respectively. These predictions agree with the high enantioselectivities observed
experimentally (Figure 2b). Experimentally observed increase in enantioselectivity of DbjAΔ towards
methyl 2-bromobutyrate can be explained by more significant drop in reactivity of (S)-enantiomer in
comparison with (R)-enantiomer. This drop in reactivity is due to unfavorable interactions with side-chain
of His139, which is located closer to chiral center of the methyl 2-bromobutyrate in this deletion mutant.
These calculations of enantiomeric differences in binding free energies of 2-bromopentane show 5
kJ/mol preference for the (R)- over the (S)-enantiomer in the wild-type enzyme. This preference increases
to 6 kJ/mol in the deletion mutant, but is negligible in the double mutant DbjA+His139Ala (Supporting
Information Table 3). The calculated preference for the (R)-enantiomer of 2-bromopentane further
increases when NAC populations are considered because the S-N mode, which binds better than the S-H
mode, shows fewer NAC configurations than the S-H mode and significantly fewer NAC configurations
than the R-N mode. Thus, we can estimate enantioselectivity as follows: E = 71 in DbjA, E = 49 in
DbjAΔ, and E = 79 in DbjAΔ+His139Ala. The E-value calculated for wild-type DbjA would be
significantly increased if the occurrence of the S-H binding mode with His139 in deflected conformation,

in which the stability and reactivity of (S)-enantiomer is diminished, was taken into account. This binding
mode was not properly sampled during the MD simulations performed here due to the high time scales
needed to include His139 flexibility. However, the calculated data correctly reproduce the observed
decrease in enantioselectivity of the deletion mutant with 2-bromopentane. A closer analysis of the
simulated trajectories of DbjAΔ shows that 2-bromopentane in R-N and S-N binding modes is
repositioned in a manner that promotes interaction with the side-chain of His139, which is located closer
to alkyl chain of 2-bromopentane in DbjAΔ than in DbjA. This displacement of the (R)-enantiomer
disfavors formation of the reactive mode leading to a significant drop in enantioselectivity in this deletion
mutant (NAC = 19.7% and E = 71 in DbjA versus NAC = 6.4% and E = 49 in DbjAΔ). An additional
mutation of His139 to Ala restores the R-N reactivity and enantioselectivity to its original level (NAC =
24.1% and E = 79 in DbjAΔ+His139Ala). In contrast, displacement of 2-bromopentane bound in the S-N
mode increases its reactivity in DbjAΔ (Supporting Information Figure 3).
Supporting Information Table 3 Free energies of binding (/LRA
bindG ) and populations of near attack configurations
(NACs) calculated using linear response approximations (LRA/α) for DbjA, DbjA and DbjA+His139Ala.
Substrate Binding
mode
Enzyme
DbjA DbjAΔ DbjAΔ+His139Ala
NACs
[%]
/LRA
bindG
[kJ/mol]
NACs
[%]
/LRA
bindG
[kJ/mol]
NACs
[%]
/LRA
bindG
[kJ/mol]
methyl 2-bromobutyrate
R-N 43.1 -43±2 5.3 -58±9 40.5 -37±3
R-W < 0.02 a -31±2 -
b -
b < 0.02
a -30±2
S-N < 0.02 a -32±2 < 0.02
a -23±5 < 0.02
a -40±2
S-W 25.5 -32±2 < 0.02 a -48±8 3.4 -29±2
2-bromopentane
R-N 19.7 -36±2 6.4 -37±1 24.1 -27±1
S-Nc < 0.02
a -31±4 0.4 -31±3 < 0.02
a -26±3
S-Hc 9.7 -29±5 11.1 -27±3 1.2 -23±5
a No NACs were present among 6000 snapshots taken along a 15 ns MD trajectory.
b Complex was not stable during
equilibrium dynamics to allow further analysis. c S-N and S-H binding modes defined in the substrate docking calculation by
AUTODOCK, may both be sampled in a single MD simulation for DbjA and DbjA, but are not interchangeable in
DbjA+His139Ala. Thus, enantioselectivity of DbjA and DbjA with 2-bromopentane was evaluated by averaging LRA/α
and NAC data over all S-N and S-H trajectories (30 ns), but only trajectories of the S-H mode (which has a higher kcat/KM) were
used to calculate the enantioselectivity of DbjA+His139Ala.
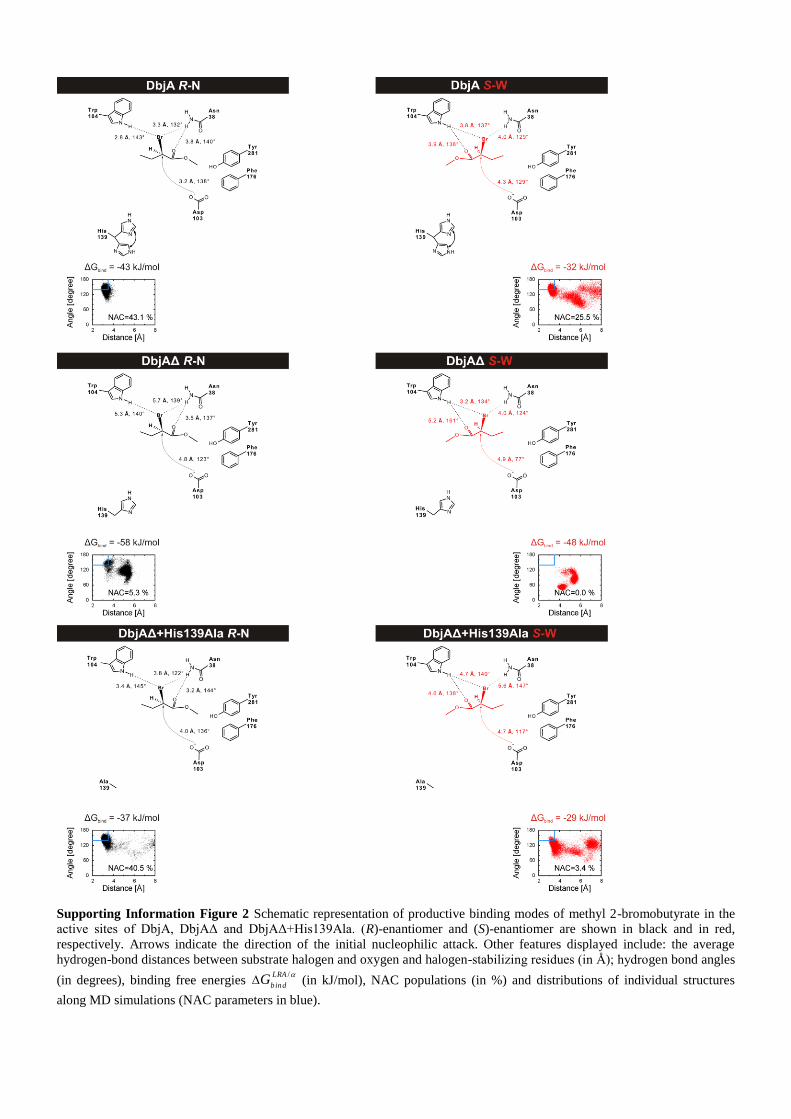
Supporting Information Figure 2 Schematic representation of productive binding modes of methyl 2-bromobutyrate in the
active sites of DbjA, DbjAΔ and DbjAΔ+His139Ala. (R)-enantiomer and (S)-enantiomer are shown in black and in red,
respectively. Arrows indicate the direction of the initial nucleophilic attack. Other features displayed include: the average
hydrogen-bond distances between substrate halogen and oxygen and halogen-stabilizing residues (in Å); hydrogen bond angles
(in degrees), binding free energies /LRA
bindG (in kJ/mol), NAC populations (in %) and distributions of individual structures
along MD simulations (NAC parameters in blue).

Supporting Information Figure 3 Schematic representation of productive binding modes of 2-bromopentane in the active site
of DbjA, DbjAΔ and DbjAΔ+His139Ala. (R)-enantiomer and (S)-enantiomer are shown in black and in red, respectively.
Arrows indicate the direction of the initial nucleophilic attack. The average hydrogen-bond distances between substrate
halogen and halogen-stabilizing residues (in Å), hydrogen-bond angles (in degrees), binding free energy /LRA
bindG (in kJ/mol),
NAC populations (in %) and distributions of individual structures along MD simulations.

References [1] W.C. Still, M. Kahn, A. Mitra, J. Org. Chem. 1978, 43, 2923-2925.
[2] R.O. Hutchins, D. Masilamani, C.A. Maryanoff, J. Org. Chem. 1976, 41, 1071-1073.
[3] Y. Sato, R. Natsume, M. Tsuda, J. Damborsky, Y. Nagata, T. Senda, Acta Crystallogr. Sect. F Struct.
Biol. Cryst. Commun. 2007, 63, 294-296.
[4] A.A. Lebedev, A.A. Vagin, G.N. Murshudov, Acta Crystallogr. D Biol. Crystallogr. 2008, 64, 33-39.
[5] J. Newman, T.S. Peat, R. Richard, L. Kan, P.E. Swanson, J.A. Affholter, I.H. Holmes, J.F. Schindler,
C.J. Unkefer, T.C. Terwilliger, Biochemistry 1999, 38, 16105-16114.
[6] A.T. Brünger, P.D. Adams, G.M. Clore, W.L. DeLano, P. Gros, R.W. Grosse-Kunstleve, J.S. Jiang, J.
Kuszewski, M. Nilges, N.S. Pannu, R.J. Read, L.M. Rice, T. Simonson, G.L. Warren, Acta
Crystallogr. D Biol. Crystallogr. 1998, 54, 905-921.
[7] G.N. Murshudov, A.A. Vagin, E.J. Dodson, Acta Crystallogr. D Biol. Crystallogr. 1997, 53, 240-255.
[8] Z. Otwinowski, W. Minor, in Macromolecular Crystallography Part A (Eds: C.W. Carter Jr., R.M.
Sweet), Academic Press, 1997, pp.307-326.
[9] Acta Crystallogr. D Biol. Crystallogr. 1994, 50, 760-763.
[10] G.M. Morris, D.S. Goodsell, R.S. Halliday, R. Huey, W.E. Hart, R.K. Belew, A.J. Olson, J. Comput.
Chem. 1998, 19, 1639-1662.
[11] G. Vriend, J. Mol. Graph. 1990, 8, 52-56, 29.
[12] F.J. Solis, R.J.B. Wets, Math. Oper. Res. 1981, 6, 19-30.
[13] a) G. King, A. Warshel, J. Chem. Phys. 1989, 91, 3647-3661; b) J. Marelius, K. Kolmodin, I.
Feierberg, J. Aqvist, J. Mol. Graph. Model. 1998, 16, 213-225, 261.
[14] J. Ryckaert, G. Ciccotti, H.J.C. Berendsen, J. Comput. Phys. 1977, 23, 327-341.
[15] F.S. Lee, A. Warshel, J. Chem. Phys. 1992, 97, 3100-3107.
[16] a) J. Florian, M.F. Goodman, A. Warshel, J. Phys. Chem. B 2002, 106, 5739-5753; b) J. Florián,
M.F. Goodman, A. Warshel, Biopolymers 2003, 68, 286-299.
[17] M. Born, Z. Phys. 1920, 1, 45-48; Y.Y. Sham, Z.T. Chu, H. Tao, A. Warshel, Proteins 2000, 39,
393-407.
[18] S. Hur, K. Kahn, T.C. Bruice, Proc. Natl. Acad. Sci. U.S.A 2003, 100, 2215-2219.
[19] R.J. Pieters, J.H. Lutje Spelberg, R.M. Kellogg, D.B. Janssen, Tetrahedron Lett. 2001, 42, 469-471.
[20] A. Shurki, M. Strajbl, J. Villà, A. Warshel, J. Am. Chem. Soc. 2002, 124, 4097-4107.
[21] a) V.T. Pham, R.S. Phillips, J. Am. Chem. Soc. 1990, 112, 3629-3632; b) R.S. Phillips, J. Mol.
Catal., B Enzym. 2002, 19-20, 103-107; c) A.O. Magnusson, M. Takwa, A. Hamberg, K. Hult,
Angew. Chem. 2005, 117, 4658-4661; Angew. Chem. Int. Ed. Engl. 2005, 44, 4582-4585.
[22] P.L. Overbeeke, J.A. Jongejan, J.J. Heijnen, Biotechnol. Bioeng. 2000, 70, 278-290.
[23] F.C. Lightstone, T.C. Bruice, J. Am. Chem. Soc. 1996, 118, 2595-2605.
[24] F.C. Lightstone, Y. Zheng, T.C. Bruice, J. Am. Chem. Soc. 1998, 120, 5611-5621.