Hot Test Loop A|*d^
212
KAERI/MR-287/96 lin iii||||| KR9700064 Operation of the Nuclear Fuel Cycle Test Facilities Hot Test Loop A|*d^ Operation of the Hot Test Loop Facilities 4 28122
-
Upload
khangminh22 -
Category
Documents
-
view
0 -
download
0
Transcript of Hot Test Loop A|*d^

KAERI/MR-287/96 liniii|||||
KR9700064
Operation of the Nuclear Fuel Cycle Test Facilities
Hot Test Loop A|*d^Operation of the Hot Test Loop Facilities
4
2 8 1 2 2

We regret thatsome of the pagesin this report may
not be up to theproper legibilitystandards, eventhough the best
possible copy wasused for scanning
KAERI/MR-287/96
MMMUOperation of the Nuclear Fuel Cycle Test Facilities
Hot Test LoopOperation of the Hot Test Loop Facilities
«• ^ * 4 ^ ^ -=?•

"Hot Test Loop
1997
JL
!@ft BLANK

I . *ll *
Hot Test Loop
II .
711UJ*
Hot Test Loop, Cold Test Loop ^ JL.gr, JL6^ 2Aov-n-§- ^ ^ ^ ^ l i l RCS
Loop, B & c Loop •§•
ffl.
PffR-Hot Test Loopl- ol-§-t> PWR
CANDU-Hot Test Loop-§- o | -g-^ CANFLEX
Cold Test Loopl- ° l -§-# PWR
RCS <&^ Loopl-
111

- B & C L o o p *
• Air-Water
• X-Ray Densitometer System
• RDT ^
IV.
K PWR-Hot
Test Loop-c: °I-|r^ < 2fJLzf-fl- - -tJlAl l Double Grid
CANDU-Hot Test Loop^ CANFLEX
.__ o ul^# 4I*I| iCold Test Loop A|-^oflA^ PWR
RCS Loop^
[. B & C Loopofl M-if: ~Z\ Component Q Loop
Phase Doppler
Particle .Analyzer, Parallel-Wire Probe, X-Ray Densitometer System
IV

SUMMARY
I . Project Title
Operation of the Hot Test Loop Facilities
II. Objective and Importance of the Project
A performance and reliability of a advanced nuclear fuel and
reactor newly designed should be verified by performing the
thermal hydrualics tests. In thermal hydraulics research team, the
thermal hydraulics tests associated with the development of an
advanced nuclear fuel and reactor have been carried out with the
test facilities, such as the Hot Test Loop operated under high
temperature and pressure conditions, Cold Test Loop, RCS Loop and
B & C Loop. The objective of this project is to obtain the
available experimental data and to develop the advanced measuring
techniques through taking full advantage of the facilities.
HI. Scope and Contents of the Project
The main scope and contents of the project are as follows :
- Performance tests of PWR fuel assembly in PWR-Hot Test Loop
- Performance tests of CANFLEX fuel in CANDU-Hot Test Loop
- In Cold Test Loop, thermal hydraulics tests relative to the
development of the advanced PWR nuclear fuel and HANARO
fuel

- CHF and natural circulation experiments in the RCS Loop
- Performance tests of safety/automatic depressurization
system in B & C Loop
- The development of the advanced experimental and measuring
techniques
IV. Results and Proposal for Applications
The facilities operated by the thermal hydraulics reseach team
have been maintained and repaired in order to carry out the
thermal hydraulics tests necessary for providing the available
data. The performance tests for the double grid type bottom end
piece which was improved on the debris filtering effectivity were
performed using the PWR-Hot Test Loop. The CANDU-Hot Test Loop was
operated to carry out the pressure drop tests and strength tests
of CANFLEX fuel. The Cold Test Loop was used to obtain the local
velocity data in subchannel within HANARO fuel bundle and to study
a thermal mixing characteristic of PWR fuel bundle.
RCS thermal hydraulic loop was constructed and the experiments
have been carried out to measure the critical heat flux. In B & C
Loop, the performance tests for each component were carried out.
In order to meet the thermal hydraulics test needs for
developing an avanced nuclear reactor in future, it is necessary
to supplement the manpower for operating the facilities.
VI

2 # Hot Test Loop A } ^ 3
*fl 1 PWR-Hot Test Loop A ] ^ 3
1. 7fl.fi. 3
2. *1«#*1 4-fi- 33. Al^^S.*! 6
4. -S- - JE. *1H(Uncertainty Analysis) 9
5. 17X17 PWR «!^S.^^>fl6|| Q WJ*\ ^-^Al^ 13
^ 1 2 ^ CANDU-Hot Test Loop A ] ^ 14
i. ^ l ^ ^ i - i ^ 7H.fi. H
2. A J ^ A l ^ ^ £ * } * ^ - i f ^ 1 15
3. >M«A1<S£J ^ ^ f l A i 16
4. Al^cH JjLi 71) 1 17
*11 3 ^ Cold Test Loop A|>^ 18
1. 7fl.fi. 18
2. PWR *}<££. ^ ^ 21
3. tfj-M-S. ^ i 1 ?!^ . - g ^ 27
^1 4 g RCS < i ^ ^ Loop ^*1 31
1. M^r 31
2. -S1HV*1 fljSL 32
3. Ti]^ gj Data Acquisition Tfl f- 40
4. £ 3 * M 7(|* 44
5. CHF ^ ^ ^ ^ f 45
6. ^A^^m 4951
vn

5 ^ B & C Loop #*1 53
1. 7fl.fi. 53
2. ^r*5M]-§- 53
3. W *l*l 64
-ti 67
115
ti 2 tifl * 1151. 7fl.fi, 115
2. -%]%! ^ S . ^ : ^ 116
3. ^Tll^s^-H-^ £«g 7l)t 12o
4. dr]7ll^Boi^.^ _n^ ig7^ 1 2 1
5. ^ € - 122
! 2 ^ ^ 3 | ^ Air-Water 2^-8-S- ^ ^ 123
1. ^ ^ ^ m ^ gl ^ - ^ 123
2 . ^ ^ * 1 51 2L£ 125
3. <U*> ^ - ^ ^ * 1 125
4. ^ ^ l } ?J £3} 126
ti 3 ;g ^Jg3f Air-Water 2^-%-%- <£*& 128
1. 7fl.fi. 128
2. ^ 7 ] ^jS.J£ ^ ; | j7l(Parallel-Wire Conductance Probe) 128
3. - g « # * l 51 wov^ 130
4. ^ ^ ^ 131
1 4 ^ X-Ray Densitometer System 133
1. 7fljEL 133
2. ^ - ^ Tflf- 9J ^ " ^ 135
3. ^ - ^ 1 ^ 4.3\ 136
fl 5 ^ RDT ^ ^ 137
vin
1. 7fl.fi. 137
2. il #*l 140
3. -fr^Tfl iL3 141
4. -B-§-7MS| ^ 143
5. "^7] jet-Sl - a ^ - ^ ^ " ^ - ^ ^ ^ ^ 7 f l * | 144
145
*ov 193
IX mm!©f t 8LANK

43-
Table 2.3-1 Energy Decay of Grid Turbulence 68
Table 2.4-1 Specifications of RCS Loop Facility 70
Table 2.4-2 Instrumentations of RCS Loop Facility 70
Table 2.5-1 List of Major Instrumentations for B & C Loop 71
Table 2.5-2 List of Major Acquisition Parameters for B & C
Loop 72
Table 2.5-3 Test Matrix for B & C Loop 73
Table 2.5-4 Technical Specification of the HP-DAS 74
Table 2.5-5 Triggering Signals for Each Test Mode 74
Table 2.5-6 Parameter List for Main Acquisition and Display — 75
Table 2.5-7 List of the Files for Data Monitoring andAcquisition in B & C Loop 76
Table 3.1-1 Test Matrix 147
Table 3.1-2 Comparison of Selected Critical Flow Dataand the Present Model 147
Table 3.2-1 Typical Parameters used in the Experiments 148
Table 3.4-1 Test matrix for the performance test of X-RayDensitometer system 149
Table 3.5-1 Technical Specification of the Steam Flow Meter --- 150
Table 3.5-2 Instrumentations and DAS for RDT Test 151
Table 3.5-3 Technical Specification of the Digital Balance 152
Table 3.5-4 Experimental Data for Flowmeter Calibration 153
Table 3.5-5 Test Matrix for Phase-I 156
X1 I 8SSXT PAGE(S)I leftBLA*

Fig. 2.1-1 Flow Diagram of PWR-Hot Test Loop 77
Fig. 2.1-2 Structure of Test section 78
Fig. 2.1-3 Locations of Pressure Tap in Test Section 79
Fig. 2.1-4 Pressure Loss Coefficients of Simulated PWR Fuel --- 80Assemblies with STD-BEP and DR-BEP
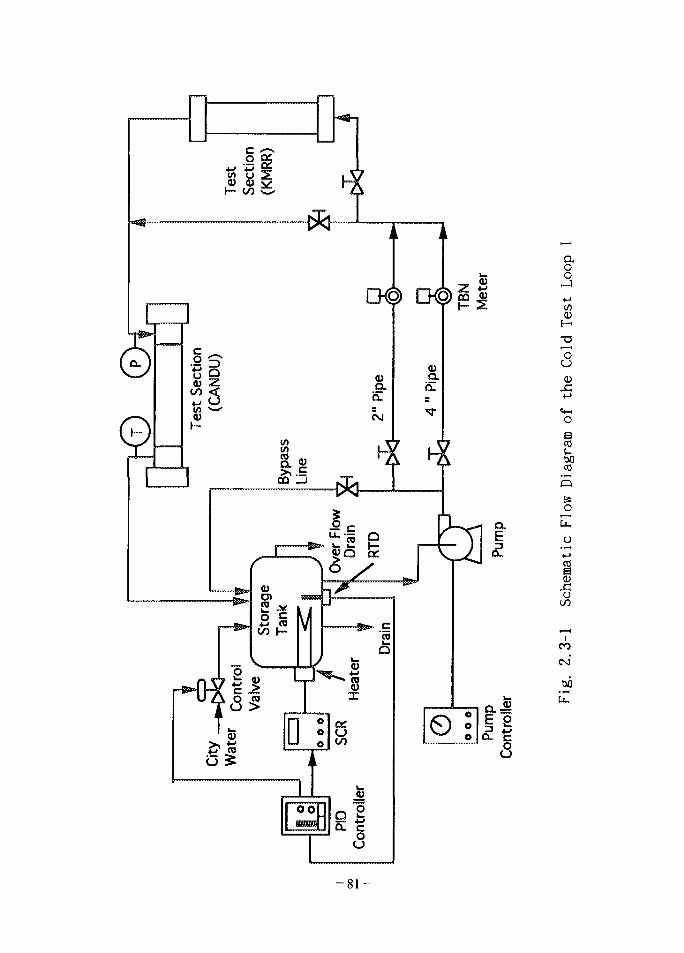
Fig. 2.3-1 Schematic Flow Diagram of the Cold Test Loop 81
Fig. 2.3-2 Backward Scattered Alignment Model of LDV System --- 82
Fig. 2.3-3 Axial Locations of Spacer Grids and Pressure Tapsfor PWR Test 83
Fig. 2.3-4 Cross-section of 5 x 5 Rod Bundles showing
the Measuring Locations 84
Fig. 2. 3-5 5 x 5 Spacer Grid 84
Fig. 2.3-6 Cross-section of 6 x 6 Rod Bundles showingthe Measuring Locations 85
Fig. 2.3-7 6 x 6 Spacer Grid combined by Mixing Vaned andStraight Types 85
Fig. 2.3-8 Axial Turbulent Intensity Decay behind the 5 x 5Spacer Grid at Points on the Path 1 86
Fig. 2.3-9 Axial Turbulent Intensity Decay behind the 5 x 5Spacer Grid at Points on the Path 2 86
Fig. 2.3-10 Axial Turbulent Intensity Decay behind the 5 x 5Spacer Grid at Points on the Path 3 87
Fig. 2.3-11 Axial Turbulent Intensity Decay behind the 6 x 6Spacer Grid at Points on the Path 2 88
Fig. 2.3-12 Horizontal Turbulent Intensity Decay behindthe 6 x 6 Spacer Grid at Points on the Path 2 89
Fig. 2.3-13 Schematic of the Test Section 90for HANARO Fuel Assembly
Fig. 2.3-14 LDV Measuring Paths for 18-Element FuelAssembly 91
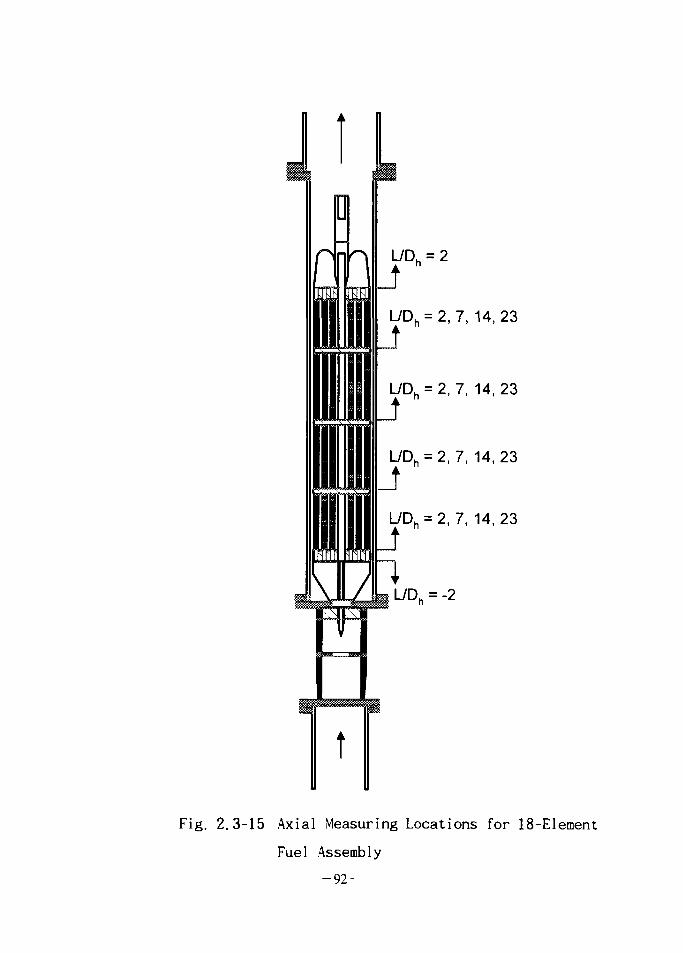
Fig. 2.3-15 Axial Measuring Locations for 18-Element FuelAssembly 92
xiii

Fig. 2.3-16 LDV Measuring Paths for 36-Element FuelAssembly 93
Fig. 2.3-17 Developing Axial Velocitiy at Path Afor 18-Element Fuel Assembly (m=12.7 kg/s) 94
Fig. 2.3-18 Developing Axial Velocitiy at Path Bfor 18-Element Fuel Assembly (m=12.7 kg/s) 95
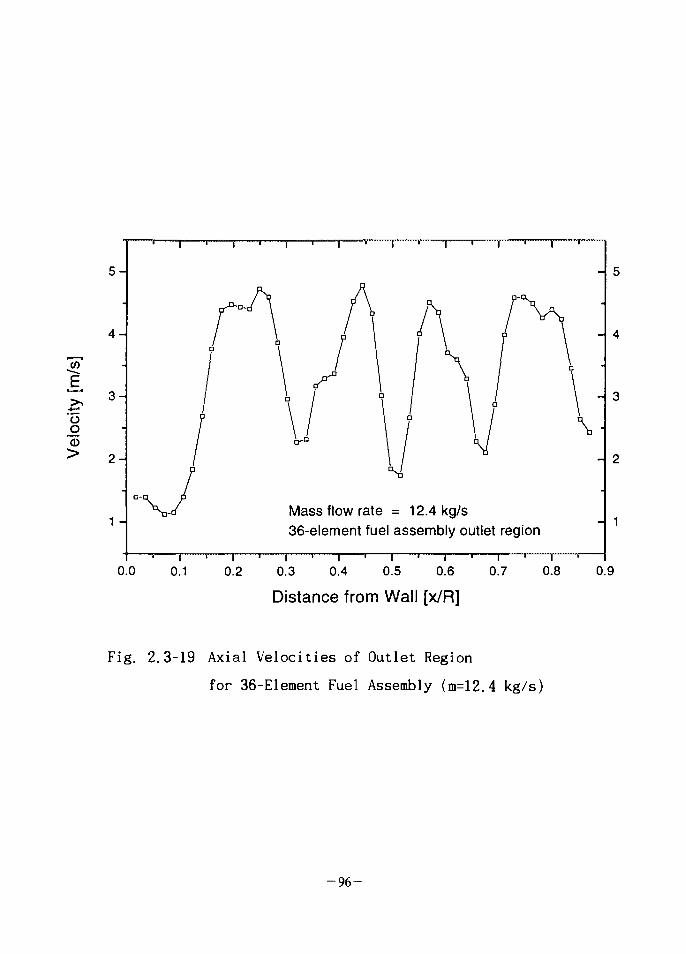
Fig. 2.3-19 Axial Velocities of Outlet Regionfor 36-Element Fuel Assembly (m=12.4 kg/s) 96
Fig. 2.3-20 Pressure Drop Data for 18-Element FuelAssembly 97
Fig. 2.3-21 Pressure Drop Data for 36-Element FuelAssembly 98
Fig. 2.4-1 Simplified Drawing of RCS Loop Facility 99
Fig. 2.4-2 Whole View of RCS Loop Facility 100
Fig. 2.4-3 Whole View of IRWST 101
Fig. 2.4-4 Data Acquisition System of RCS Loop Facility 102
Fig. 2.4-5 Transient Control System of RCS Loop Facility 103
Fig. 2.4-6 Parametric Trends of CHF with Mass Flux 104(Effect of Inlet Subcooling)
Fig. 2.4-7 Parametric Trends of CHF with Mass Flux 105
(Effect of Pressure)
Fig. 2.4-8 Effect of Pressure on CHF 106
Fig. 2.4-9 Steam Vent Line after Accident 107
Fig. 2.5-1 Typical Form of the DAS Output for MonitoringUnloaded Sensors 108
Fig. 2.5-2 Typical Form of the DAS Output for StartupMonitoring 109
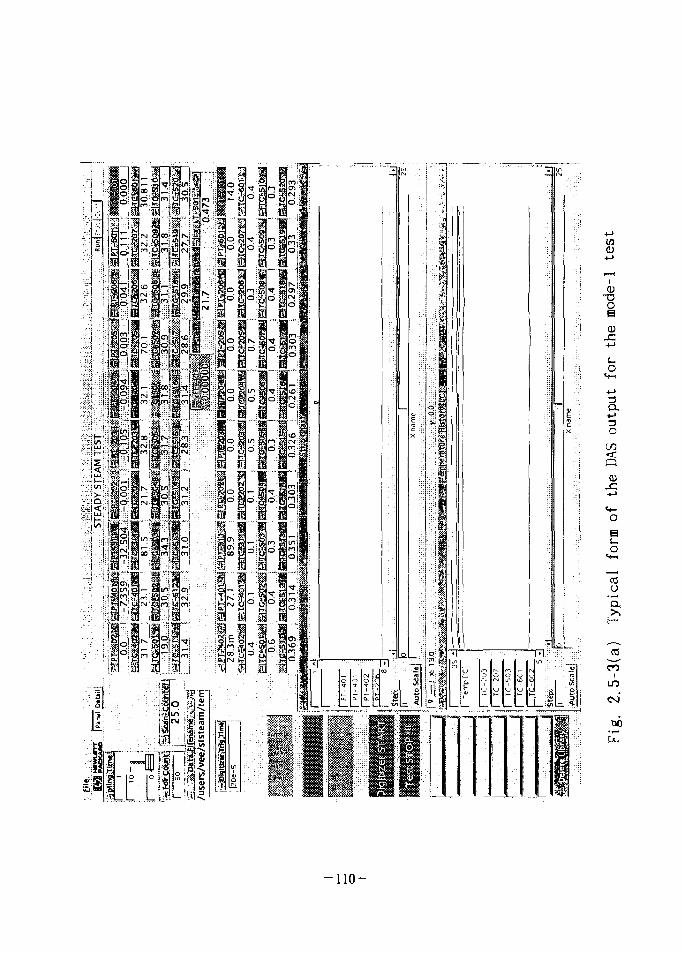
Fig. 2.5-3(a) Typical Form of the DAS Output for the Mode-1Test 110
Fig. 2.5-3(b) Typical Form of the DAS Output for the Mode-2Test 111
Fig. 2.5-3(c) Typical Form of the DAS Output for the Mode-3Test 112
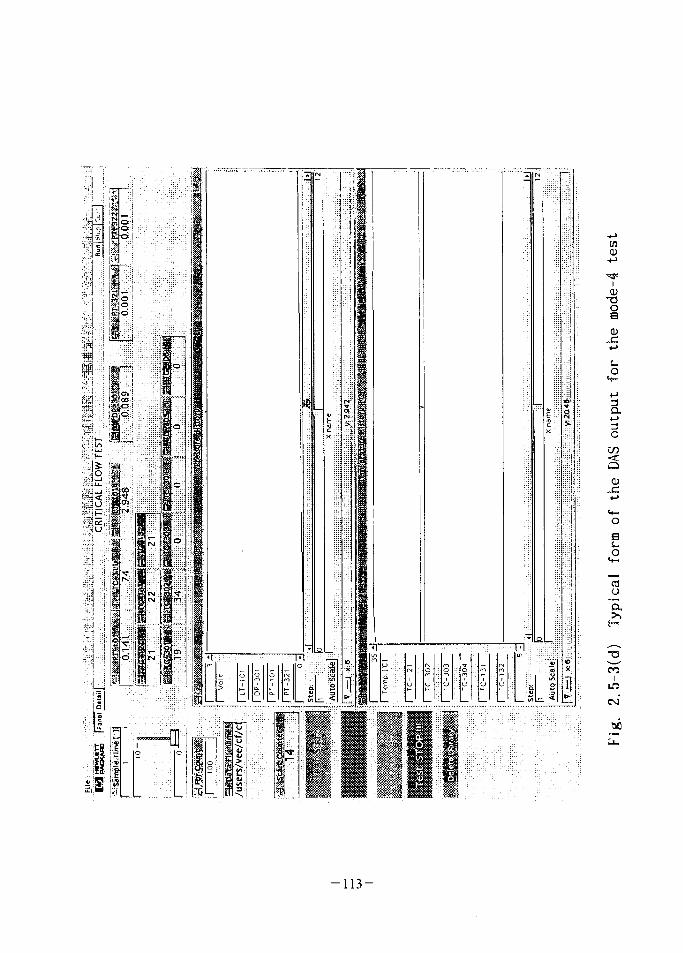
Fig. 2. 5-3(d) Typical Form of the DAS Output for the Mode-4Test 113
xiv

Fig. 2.5-3(e) Typical Form of the DAS Output for the Mode-5Test 114
Fig. 3.1-1 Measured Pressure Variations and the Location ofFlashing Inception within a Pipe for SubcooledTwo-Phase Flow Test 157
Fig. 3.1-2 Measured Pressure Profiles along the Test Sectionfor Various Initial Subcooling of the Water(Test Section No. 1) 158
Fig. 3.1-3 Dimension less Distance from the Pipe Inlet to theLocation of Saturation Pressure versusDimensionless Subcooling 159
Fig. 3.1-4 Mass Flux versus Stagnation Temperature for FourDifferent Stagnation Pressure Obtained at TestSection No. 1(D = 3.4 mm, L = 100 mm) 160
Fig. 3.1-5 Mass Flux versus Stagnation Temperature for ThreeDifferent Stagnation Pressure Obtained at TestSection No. 2 161
Fig. 3.1-6 Effects of Tube Size on Subcooled Critical Two-Phase Flow Rate 162
Fig. 3.1-7 Temperature Dependence of Mass Flux in DifferentSize Tube 163
Fig. 3.1-8 Nonlinear Least Square Curve Fittingfor Present Data 164
Fig. 3.1-9 Model Predictions and Measured Data(755 Data) 165
Fig. 3.2-1 Schematic Diagram of the Air-Water Loop 166
Fig. 3.2-2 Photography of the Arrangements of the TestSection and Optical Components 167
Fig. 3.2-3 Photography of the Test Section before
Assembling 168
Fig. 3.2-4 Schematic of the Transmitter for PDPA System 169
Fig. 3.2-5 Example of the Measured Droplet SizeDistribution 170
Fig. 3.2-6 Variation of the Droplet Size with SuperficialAir Velocity 171
Fig. 3.2-7 Comparison of the Measured Data withthe Prediction by Other Correlations 172
xv

Fig. 3.3-1 Configuration of the Parallel-Wire ConductanceProbe 173
Fig. 3.3-2 Block Diagram of Water Thickness MeasuringCircuit 174
Fig. 3.3-3 Schematic Diagram of the Horizontal Air-WaterLoop 175
Fig. 3.3-4 Typical Time Recordings of Interface
Uf - 0.0004 m/s) 176
Fig. 3.3-5 Variation of Power Spectra 177
Fig. 3.3-6 Variation of Spatial Growth Factor 178Fig. 3.4-1 Drawing of the Void Simulators : 179
(a) Bubbly Simulator, (b) Concentric Tapered Plug,(c) Eccentric Tapered Plug,(d) Inverted Tapered Plug,(e) Steel Pipe Enclosure
Fig. 3.4-2 Photographic View of the Void Simulators : 180(a) Tapered Plug, (b) Inverted Tapered Plug,(c) Bubbly Simulator, (d) Steel Pipe Enclosure
Fig. 3.4-3(a) Test Results for Bubbly Flow Simulator 181
Fig. 3.4-3(b) Test Results for Annular flow Simulator 182
Fig. 3.4-3(c) Test Results for Inverted Annular FlowSimulator(l) 183
Fig. 3.4-3(d) Test Results for Inverted Annular Flow
Simulator(2) 184
Fig. 3.4-4 Arrangements of the Pre- and Post-Collimators 185
Fig. 3.5-1 Schematic Diagram of the Experimental apparatus 186
Fig. 3.5-2 Schematic Diagram of the High-Speed Recorder Based
on the Combination of PC and A/D Converter 187
Fig. 3.5-3 Schematic Diagram of the Data Acquisition System — 188
Fig. 3.5-4 Relation between Water Level and Volumein the Quenching Tank 189
Fig. 3.5-5 Comparison of Flow Rates between Calculated Valuesand Measured Values 190
Fig. 3.5-6 Shapes of Steam Plume under Different Experimental
xvi

Condition 1 3 1
xvn

7]
PWR-Hot Test Loop, CANDU-Hot Test Loop
Cold Test L o o p ^
7fl1fczf
Reactor Coolant System "g^r^ Loop
Loop)A|- Blowdown and Condensation Loop(B & C Loop)^l X\]
1995V1
- 1 -

PWR-Hot Test Loop^- o|-g-»V PWR
CANDU-Hot Test Loop# o|-§-*f CANFLEX
Cold Test Loop# o|^.^> PWR
RCS < g ^ ^ Loop
B & C Loop!- o
• Air-Water
• X-Ray Densitometer System 7^**}
• RDT ^
£• Hot Test Loop A ] ^ ^ ^ J t J L ^ ^ . ^ | 2 ^ofl 7 l ^ A]* |O] Hot
Test Loop A]^ , Cold Test LoopofHSj ^ ^ ^ ^r<g2f ^ ^ 5 ] f e fl-§-
1 RCS Loopi} B & C
3
Phase Doppler Particle Analyzer, Parallel-Wire Conductance Probe,
X-Ray Densitometer System-^-
-2-

2 ^ Hot Test Loop
1 ^ PWR-Hot Test Loop
1 . 7 l | J3L
^ Fretting Wear ^ < ^ ^
l^LS. Full size PWR
PWR-Hot Test Loopl- '90^ 4^^] * 1 * H r^^l^l Sl^.n^f Fullsize
17X17 PWR
2 . ^ l ^ ^ l 7i|.fi.
PWR-Hot Test Loop^- Fullsize PWR
- 3 -

H^J 2.1-l<>fi ^r ^|-£] Flow Diagram^
-8-^ ^-^-g- Orificel
Loop 7}^7}M: x}^\ ^^^^.S. Sl^o>^-t:>. Loop
f. Loop - g ^ r £ ^ Loop 7}<£7)o\)
100 kW£] 7f<g-g-^S. floi^^K Loop - f r ^
Loop <gJ2.:&7H±=. ^H^^iL^l(RHX), ^4*8^^7] (CDHX)
Bleed -«iJ
-§- r# ofl^^JL Loop £ # ^^A]^7l *]*-> Loop 7f
-i- -fe°]ir ol4. 4^^L%7J^ Loop ^]A] Loop#
f-Sll}, Loop ^
Loop -g^*l ^
j 6oto],g.-^.ol^. J3L^3|-g-i- °|-§-*M ^rJ£ 25t:ofl>H pH 7.0,
1.0 micromhos/cm<y JL^S . Loop
176 7l<y-
330 °C
100 kg/sec(500 m3/hr)
De-Ionized Water
-4-

3.5-162 kgf/cm2,
-8-*g 102 m3/hr~500 m3/hro]^ ( o] ^ ^ ^ - 17X17
o\}*\$) Reynolds ^3. ^ K ! * ^ <$ 5.0Xl05<i
Grayloc Flange# 7f*l 16" Sch. 140 w f l ^
Flange S ^ A } O | ^ T]Z}^ 5461mm<>li:K
Al^-8-7m-¥-5l Aj^-f J jL^^ ^ ^ 5 - ^ 1 ^ 1 ^ ^^ (14X14 , 16X
16 ^ ^ 17X17), 3.71 gj ^J^j-S. i ^ ^ ^ - ^ ^ l re|-B>
2.1-2CH1 17x17 PWR
Flow Diffuseri} *}~¥-ii^?>> > 7fl ] Fullsize
fe 4 4 ^ gj Instrumentation Shield^ ^A^<>1 ^14. Flow Housing*}
^ ^ ^ H <?1^^ <y-^^.^^-( Pressure Sensing Line)^ Flow
Housing ]- A|^^-7l L-fl AJ-oj-g- tcj-ef Instrumentation Shield -f-^r^]A]
Instrumentation Head# ^f-*B^ Al^-§-7l $]^-S. - f r S ^ h ^ ^ ^ - ^ ^
Z\]6\) o]7}±t Loop -fr^S] q-*l < - -fe A] -8-71 *f >-f- 1 Flow
Diffuser ^ ^ -^^ofl^ Flow Housing^} ^l^-§-7l ufl^ A}O|S. -f$]
(Bypass)*>7fl $\°\ $X^\. t}^-^^^3] Hole 3.7} ^ ^ ^ 1 ^
3. * H f i i ^ ^ ^ ^«y*f7il ^711, 4 ^ * f S i 4 . Flow Housing^
«:#•§• 3-«y*MJ *j-7l^*H Flow Diffuser^i -^7|-^-<H]^ & £ -?-»g
^l Plate#
- 5 -

3. A
7}.
Loop
Heise
J-Type « i ^ c m Loop 7f<g7l ^ 7 ^ 7 1 ^ ^^1^1 K-Type
-§-^r ^ % ^ ^ Discharge afl -ofl >y^]^ Full Flow
0rifice7|-
High, Low
- 6 -

P T, = P TS 1+a ( Tf- Tr ) } (1)
A Tl = A Tr { 1+a ( T / - 7 \ ) }2 (2)
P = ^ ^ z]o] ( Wetted Perimeter ) [ m ]
A = •%-$, ^ [ m2 ]
Tf = ^ 1 ^ £S. [ TC ]
Tr = 71^ i [ °C ]
a = Stainless Steel ^ ^=J^j- 7}]^ ( 1.782 x 10~5 )
uf. -f jq^-( Bypass Flow )
Flow Housing 2}
Orifice
ischarge Coeffi
cient)^- 9.687 x 10"6 m2^. # 5]51^-^ Beroulli
= Q o - 4.932 x 10 ~2 {JAP~TP7)
- 7 -

Qo = Orifice oJM ^ g ^ JfrBi [ m3 /h r ]
Pt = t^^S. *^*fl &*fl<S) tfej %*} [ Pa
Pf = ^-*\}$) i ^S . [ kg/m3
eh
Instrumentation Head
Instrumentation Head ofM ^: ^°fl>M !+£•
Pa ]
^ ^ ) [ Pa
= Z f P m + ( P c - pf ) g- A2 ( 4 )
Instrumentation Head °\}*\
ZIP = z J P m - ( P C - P / ) g-AZ (5)

AZ = Instrumentation Head < ^ ] ^ ^ ^-^^ -k0]*} [ m ]
P, = 'MtJ-M **« vi$. [ kg/m3 ][ kg/m3 ]
- Loop - f } - ^ Full Flow Taps
Type SJ Orifice -
o = 0 . 0 2 3 2 3 4 • f a - fc \ M ^ ^ 0 - 2 2 . 6 0 4 8 ( p c - p f ) ) p j ( 6 )
/ a = { 1 + 1 . 7 8 2 x 1 0 - 5 ( T f - T r ) } 2
fc = - ^ P " + 0.9893 (7)K eo
Wo = Orifice o]}*\<!] ^ -%-% [ kg/s ]
= Orifice °]]*\2) A? [ Pa ]
= Orifice afl^<Hl-H^ Reynolds^
o) u% ( 7 ) AJSJ ^ ^ 7 f ^ - e o ^ ^ ^ o | H S . - H - So ^ ^ : ( 6 ) 2 f ( 7 )
4. ^-^j-^i ^^(Uncertainty Analysis)
- 9 -

iH*Rr
n|
fe ANSI/ASME PTC 19.1 Code[2]ofl
7}.
Error J£^- System Error)if -f«^^.^>(Random Error)S.
^MJ3Elfe J2.4JM 4
ision Index : o ] ^ .
- 1 0 -

s == 1 xk-x y
N-\
1/2y 2
i Xk NN-l
1/2
(8)
(9)
A :
^ *\±SK
2 }2 } m (10)
Limits cfl*f
B == (ID
-^-US.(Uncertainty)
Level
tl^S.(Confidence
- 1 1 -

overage)!- 4-§-$M. S^J£fe o]^ Parameter^ rfl*H
(99% iE^S. ) (12)
U = [ B2+ (t Sx)2 ]m (95% 3E^S.) (13)
Sample ^ 7 f
=1.965.
Parameter7f ^ £ H , °lw Parameter^ ^ S . •?•*]•
f. Parameter^ ^-^ -^-^fe Parameter^
Taylor Series^ A f ^ oi^ i]#^^5] #^-^J£l- -?-*>7l
Parameter^) g$^l p,S. ^ r# i | o j
Py) (14)
1/2
11"?
2I\
95%
- 1 2 -

Ur = [ B r2 + (tSr)
2]in
14. 4 Parameter^ tfl^:
K 4Accuracy*} o|
SensorS. - ^ i ] ^ ^ | ^ | ^ 4
(10) ^ (ll)6fl>M ^ ^ £ ^
4 ^TfloilAi^ AI (8) JE^. (9)7|. 4
7]^ ; Parameter^
(15)
5. 17x17 PWR
(Debris)oj
J- ty -^^S .^ Double
71 ۥ ^ < ^ ^ . ^ J ^ l A f DGg DR-BEP7f
Full size 7 ] ^ *f^> a^^l(STD-BEP) ^ DR-BEP
- 1 3 -

H ^ 2.1-4^1
Reynolds^, -^-4^:J£ ^ ^ ^ ^ 1 fl«H 4 4 0.8%, 5.7%, 2.5°C 0.5bar
CANDU-Hot Test Loop
CANDU-Hot Test Loop A
.>H. CANDU
: 341 nf/hr
: 176 kgf/orf
: 348 "C: Demineralized Water
CANDU-Hot Test Loop£
. CANDU-Hot Test Loop£| Main Loop
-14-
Supply Header, A)^c|)(Test Rig), Return Header#
Return Header^- 7]^ ^ ^ ^ r } . ^ ^ - g - ^ ^
5. £ £ ^ 1 7}<i7] 9J h§47Hl 5 ] * H ^ H ^ h Feed and Bleed
-Zr Main LoopoJH £ ^ - g - ^ <£^ «>of -g-^v))^ Crud5| -§-Sfl7f
}tf3g=ofl *]*H Main Loop<Hl
f. Chemical 7fl^£. ^
pH7f
Hydroxide!- Main Loopofl
Water T l j ^ Main
Main Loop.2}
Loop ^is]
] ^ Air S: Loop^
Chemical %
^ pH#
5|*H Lithium
. Make-up
Cooling Water Hot Test
2.
CANDU Hot Test Loop^
Distributed control system (DCS)# 3E.<y*H ^ ^
. DCS ^ nj
CANDU Hot Test Loop<H) D/3
^ D/3
- 1 5 -
S14.
3.
CANDU-Hot Test Loop
CANDU # >
^^^- ^ J L ^"cf. CANDU-Hot Test Loop £ Main Loop Tll f, Feed
and Bleed Tfl f-, Make-up Water Treatment 7j] f-, Chemical Tfl f-,
Cooling Water 7 1-f-, Control and Data Acquisition
. CANDU-Hot Test Loop S]
-b Feed and Bleed Tfl f-ofl ^^1^1 ^ ^ 1 - <^^-^^S. 4-g-
0} o]^ ^ ^ ao^l7f 5 )4 Feed and Bleed Tfl f-if Make-up Water
Treatment 7 j )^^ ^^ofl>fc| ^^5^71 nfl -ofl ^ ^ ^ o ] #_OB| S . ^
Feed and Bleed X|-f-^ ^-^ufl^^r ^*1 100i£# -f-^I^S. * H ^ H
3 £ £ wfl 91 -8-7151 -f Alo) 3.711 t * W a 4 .
i i ^ ^ ^ l ^ ^ A J * ] ^ ^ # 711 *1-71 JH*H Feed and
Bleed Tfl^z} Make-up Water Treatment Tfl f- < -f- afl^jif -g-7]# ^
- 1 6 -

4.
H 7]7l
- GA-201 Booster Pump
- GA-302 Polished water supply pump
- FA-301 Polished water storage tank
- FA-202 Overflow storage tank
7171
- GB-301 A,B Vacuum pump
- GA-301 Vacuum deaerator extraction pump
- EC-301 A.B Vacuum separator
- EG-301 Vacuum deaerator
- EB-301 Polished water heater
- FD-301 A,B Polished water Filter
5J Rolled jointofl
(End fitting)^-^.^. n ^ ^ M ^l^h Al^cll^l
Liner tube ^ Shield plug ^ ^ 600 MWe CANDU
m # $ ) vfl^^r 103.385
4", 1500 lb Flange7f -
-17-

Metal gasket#
" (sch. 80)*]
L5
CANDU-Hot Test Loop
L5
3 a* Cold Test Loop
7|iL
-18-

Cold Test Loop A ] ^ ^ -
^H^H ^ 2.3-11^ » , Test Section,
. Test Section^
JI 1 ^ - e o ^ Turbine
PID Controller, Control Valve, SCR Unit, Heater ^
RTD(Resistance Temperature Detector) ^^.S. ^ ^ 5 ] ^ ^r-E-^H^]
1- °l-§-$>4. - PID Controller^! £)*fe ^r^l- ^^l^l 1^ SCR Unit
ofl Sfl Heater7f 4 ^ * } ^ ^ * f e ^ ^ 1 ^ % ^ r # 7>^A]^>|I 5]
Setting^71- RTD5.-f^ 4^5]°1^1fe PV(Position Value)*ll-
Control Value7} <
^^^- Over-Flow Drain#
Test Section-^-S ^g-^-3£]^ -^-^^r OMEGA
Turbine^ ^ ^ ^ 5 + -
Q = A + B H (1)
Q : Flow Rate (GPM),
A, B : Constant (Given By OMEGA),
-19-

H '• Frequency (Hz).
A] (1)<HH - f r ^ -?-*B^l ol-fl-5]^ H ^ Turbine^
<H Turbine -fr TJl 3 (Electronic Part)#
// =^1 2+B 2 V (2)
A2t B2 '• Calibration Constant
V : Voltage (Volt)
L-f. LDV (Laser Doppler Velocimeter)
LDV ^ - ^ 7 1 ^ ^ Laser Beam# o]-g-*>
^|§fl Laserfe Doppler Shift
Doppler Shift
sin
Laser Wave Length, ^r^ Laser Beam
«>4(Half Angle)°]r}. One-component He-Ne LDV System^ TSI
^ 1 - (3-Q 2.3-2). Focusing =]1^1
^ 50mmolJL, Focusing
-20-

250mmo]u>. -
Natural Contaminant^.^
Silicon Carbide(3J3 : 1.5 |im, ^S. : 3.2 g/cm3)
Laser - i>^^^S.-fB|5] ^ 1 ^ 1 ^ Photomultiplierofl ^
°1 Photomultiplier^ -tl L-fe t\X\ Counter Type Processor
Counter Type - i i S ^ ^ l - b ^^}^r < H ^ ^ 1 .
Amplifier, Digital Output, D/A(Digital to Analog) Converter ^^.S.
2 . PWR
7\.
^ 5 x 5, 6 x 6
LDV(Laser Doppler Velocimeter)^
5 x 5
3 x 6
- 2 1 -

mixing v a n e #
* U r 5 x 5. 6 x 6
LDV^
H^ 9i^M|8S: l l ^ ^ ^ W l ^ ^ t^^^(turbulence
decay)<Hl
- 2 2 -

-b 25 °C
1 ^ H ^ 2.3-3O] J£<H^4. ^-c] 40 mm«] * l*13*fe 600 mm
l S H a i 4 . 5 x 5
2.3-4^ JE-^-i- ^^c f l housing^ * > ^ ^ ^ o | 7 | - 68 l ^
JL -g-u]-^^ -g-51 ^ ^ ^ 9.5 mm, p i t ch^ 12.6 mm, ^ ^ ^ ^
)^c: 11.21 mm °}t}. 5 x 5 * ] * ] ^ ^ f e spli t vane©] ^3]Mj-^jj. 22°
I^1^4 W«HI - Sl<>i ai4(n.^ 2.3-5). i l5 m/sec, ^^- f i -^^r 14.22 kg/sec, Reynolds ^
^ 62500014. 6 x 6 *1*13*1-A|- -g-uj-t -¥^rS. ^ ^ ^ ^ ^ r OL^ 2.3-6
-befl housing^ « > ^ ^ 7jo]7} 81 mm<y ^ A f 4 ^ o ] j i ^-
* ] 3 £ 9.5 mm, p i t c h ^ 12.6 mm, ^ ^ ( D h ) ^ : 11.468
mm o|cK *l*|| -f-^5.^1 ^ ^ : ^ - J £ ^ 5 m/sec, ^ ^ - ° r ^ ^ r 20 kg/sec,
Reynolds ^ f e 63924°!cf. 6 x 6 ^1^1 ^ f e ^-7l|-2] cfg- ^|^l^^]-7>
l ^ s ] 6 x 6 ^ | ^ | ^ 4 ^ o M n K l ? ! 2.3-7). ^ 4 4 ^ ^^ housing
^ -f-^^ acryl ic^5.^ |«l-*H laser beamo] ?§-3}*} <&A *}S14.
5 x 5 S\ 6 x 6 - g - 4 1 ^ ^ - ^ ^ ^ o f l - H ^ ^%£- 91 Point#^r
-L^ 2.3-4Af 2.3-6<>ll u j -44$14. P a t h # £ -g-41^ gap
4.
5 x 5
- 2 3 -

log - logiFSS. a ^ i ^ H ^ 2.3-8 ~ 2.3-10^-c|| o]^. mesh 4 * M screen^ f- - *>
screen^
Mesh qx}\} screen^ ^ ^ f e
mesh
A-] a, M, x0^ 4 4 fitting ^M1, 4^f mesha.7], virtual originmesh4^f3.7l M^
2.3-6 1 -1
(5)
o|uf. olAioflAi 4 i ] ^ - ^ - Sreenivasan et al. [6]£i mesh 4^} ^ ^ ^
^ • ^ ^ tMK'-S.^ 4 ^ # ^ - ^ f . 4?> virtual origin (xo/M=3 :
Sreenivasan et al. , xo/M=O : ^-
- 2 4 -

5 x 5 ^ 5 ) Paths 2, 3^5-1 Point#ofl
U5)*J- tt]J2.*}Sii:K Path 1^ ^2f«I HU 2.3-
*<?•§• -S-^l^K ^-^M- Path 25} Path 3S. o|
II
du2 _ 3 u2v _ d u2wdx dy dz
2_ d pu ,p dx
IV
3 2 M 2 d2u2 d2u2,~TT~H ZTT~)
dy dz
III
(6)
- 2 5 -

I, II, III, IV, V # # £ 4 4 tfl^-( Convection),
(Production),^HDiffusion), ^^UTT-S^Pressure re-distribution)
x, y,
. y,
^ U^ y,S7|- 7}%
6 x 6 ^ ^
2.3-11, 2.3-12)5. ^ ( 5 ) ^ ^•^•^i} MlJ2.*>Sl4. Mixing vane
Points 1 - 5#^] 4yo%1 V > ^ - 4 £ 4 ^ 1 - H^I 2.3-11
f. ne]uf n^J 2.3-12^
(7)
- 2 6 -

2.
7f. 711
^ COBRA-IV-I/KMRR Code7f
Cf.
Code
1) Test Section
Test Section^
- 2 7 -

Laser Beamo]
Test Section^
. LDV
Tapo) H7flAL.
2.3-13^1
2)
18 91 36-g-
H ^ 2.3-14, 2.3-
4
Plate
18-g-
c}. 36-g-
Top End Plate *Hf 9l Bottom End
40 °C ^ 4
3-r- ^ o * 12.7, 8.0 kg/s ofl cH*H, 36-g-
19.6, 12.4 kg/s ofl tfl*H 4 4
Fin wfl<i^4
4, 36-g-
5 . 5 ~ 1 6 , 8 - 22 0.5
>. 4
- 2 8 -

35/45°CSZ)
31
1) ^
18-g- « | ^ S . ^ W H 1 cH > Axial Velocity^
Bottom End Plate, 37fl | Spacer Grid ^ 5 . o|
3- n^$ ^ K ^ ^ , S l ^ ^ V Laser Beamvfl^-i- 4 4 L, Dh, x, RS*| JEAJ^cK
-L J 2.3-17< l -fi-^ 12.7 kg/s, Path A^M Bottom End Plate
4 Spacer Grid *BMHSJ ^ ^ ^ ^ - - £ ^ 5 t ^ ^ "End PlateAf 4 Spacer Grid
4 Spacer Grid *HMH*J ^
£ ^ : S ^ 7]*) -H-A} V 4 £ B l -e.<^^JI alt}. o}^. Bottom End
Plated- Spacer Grid£| ^ ^ o | u}#A5-*| ^ - f ^ £ ^ - # -2.^*fe
Blockage $.3}7\ r\^7] 4 ^ ^ . S . ^^>^^K Spacer Grid
^ ^ - ? ^ S . Jit} ^ ^S.$ ^T5L7\ 3.7]}
7} ^-S.^^0] ^^-^-^^<H1 B]*H 1 3.7)
2.3-18^1 ^L l 2.3-17i|- -|HJ*> - >2:?idfl>H Path B 6fl>H 4
*> -<g^6fl>H5l ^ i ^ S ^ ^ ^ ^ # M-EKfl#i:h Bottom End Plate^
Spacer Grid^ ^^B] 4°1<:H1 nfc- Blockage J l ^ ^ Path ^ g
^ 4 ^ * ^ 1 f j Gap -
- 2 9 -
Path A
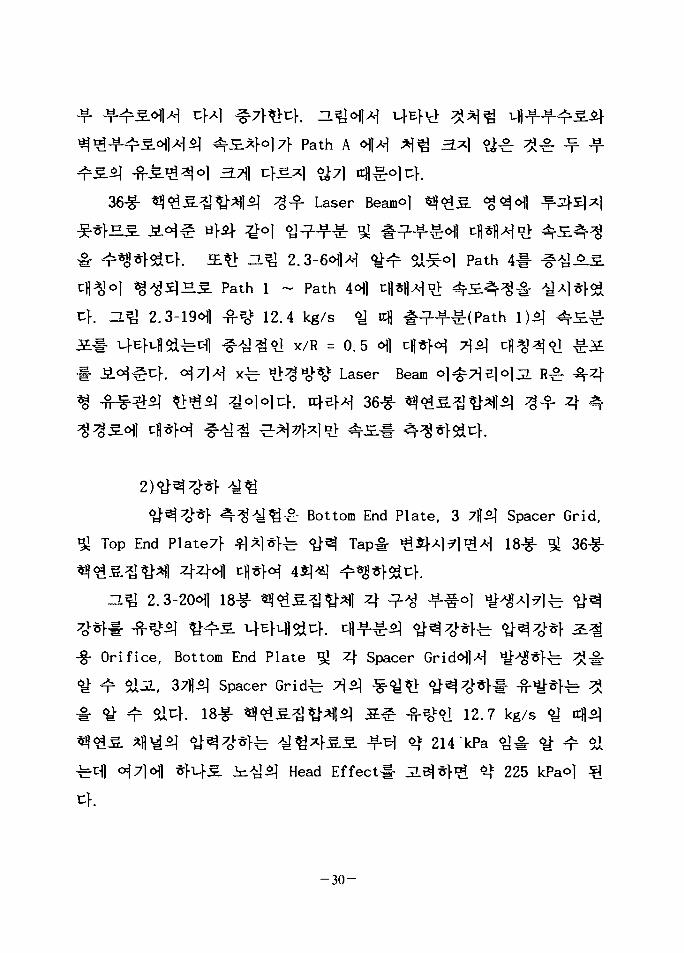
36-g- «|£.S.3J^aj|Sl ^g-f Laser Beam<>l
^ r ^ l Path 4
H ^ Path 1 ~ Path 4ofl
12.4 kg/s <y
ti X / R = 0.5 fl |
<H7]>H x ^ S l ^ ^ V Laser Beam
36^-
^ ^ Bottom End Plate, 3 7fl«] Spacer Grid,
Top End Plate?} *l*]*Rr <g^ Tap# ^ ^ ] ^ | ^ ^ 18-g- g 36-g-
2.3-20ofl
Ori fice, Bottom End Plate 5
.4. 18-g- « | ^ S ^ ^ :
1 ^ ^ l - b ^^}*f4S. h^^S] Head
1 4 Spacer
*« s ^ -8-
Effect! 3-
Gridofl>H
•^^1 12.7
\ 214 kPa
1 ^kg/s
225
^ nioj. ^
kPaol
>A
- 3 0 -

2.3-21OJ1 3 6 *
K 36* « ? ^ S ^ ^ ^ I ^ S ^ ^91 19.6
kg/s <y itflil «J&g. *| |^^ ^ ^ ^ f e * ^ x } i s . -f^ ^ 205 kPa
Head Effect# JL^*]-^ ^ 216 kPao] ^
RCS ' g ^ - ^ Loop
A^^. >y^*}7l ^*B i l ^ l ^ r ^ i ^ ^ 16.0
LooptI RCS(Reactor Coolant S y s t e m ) ^ ^ Loop
^r^*]-JLSlt;K ^ ^ 1 ^ -f<d 6j7(1 «g^4r(Critical Heat
Flux : CHF) ^ ^ , 3i l^6>^7)l^^ 7fl^
(Passive Residual Heat Removal : PRHR)7}l-fv£l
LOCA
- 3 1 -

2.
7>.
Closed Loop°ln}
16.0 MPa, ^ r ^ ^ r S . 347 °
LoopTflf-,
~L^ 2.4-2
7]
1)
, Test Chamber,
Test Chamber
%_<>) i$<&g_ Hea te r Rods<H|
- 3 2 -

Test Chamber*
7}
7\)
^ & ^ ^ -§-eo* 18.4 m3/hr, <$% 180 m H2O<q Non Seal
Type Canned Motor ^ ^ o | u | - . ^^X\ Test Section<HH
o| ^ ^ * B £ Test S e c t i o n ^ o i H < y ^ ^ - 5o ^ ^ 1 ^
Craneofl ^Sfl ^ ^ a f l ^ ^ 5^S.(Model:N2ST-50K-25S,
SERIAL NoO. :9424266-1), ZL 3.7}^ z±°}7\ 1619mm, ^°]7\ 975mm, ^
°] 452mmo]i:}. 5E^> ^ ^ . ^ Suction^] Diameter^- 3 inch«]jl
Discharged) Diameter^- 1.5incho]uf. ^5 :^) ^ -^^ l -b 440 Volt, 3
Phase*} #717}
^ Loopif o
Bypass^fe 27fl^ tifl:£ Line# nf^*f^uf. 4 Linear Jg f- ^M,o]}
*H ^rBl^oi SZ-M ^ r^#^ l fe ^ ^ ^ ^ ^ 1 ^ ^ ^ - * W ^ Linen>
^ 4^*f7fl^t:f. ^ Loop^ 3.71^ H«I^<>1 2 inch<>l
afl f Lineal 3.7}^ 4 4 1.5 inchij- 1 inchoju}.
9! ^-S-^-S-SJ Orifice -B- Tfl 9l
Inverter!- -f"*fH 7>ig*fe ty^o] ^Fg-^c}. Orifice
- 3 3 -

3] ^ ^ *}<$ t}4:S!] 7%% £ Data Acquisition Tfl^MH ^M)*} 7]
Uf) aj|<£7j
Test S e c t i o n 6 ^ -§-^
Test Chamber^MMH ^ * g 7 l # ^ * 1 * M . ^}^7]S] 3.71-b :Q.°}7\
2330 mmolJL, ufl-f-^^o| 128.3 mmo|a}, n. ^v\]7\ 20mm<>lcf. o| o j |^
7}o\] if*$£[o] *X^ Nozzle^S.^ *\^°] 2 inch<il Cooling Water^
Inlet Jf Outlet©] $XJL 3.7}7\ 0.5 inch*] Vent7} -^-^-5|oial^f. °fi
^ 7 l ^ ^Jg ^ ^ - 8 - 7 H ^ - ^ 40 kWi| 7f<g-g- Heater# ^ ^ ^ S i c K
Heater^ JB.^ 67fl7f ^^|5l«>i al-^-^ ^ 4 4 ^ 1 -S-^^r 6.7kWo|i:f.
Heater^ ^ ^ ^ 0.75 inch<>lJL Qo]^ 74.25 incholu}. J£*> Heater7>
fl-fe ^ w ^ I * f 7 ] ^ | * H 27H^ Support Plateif o ] ^ . o 4 ^ ^ c ^ ^ ^
Tie Rod7} ^^5]<H $X^h Heater#^^r SCR(Silicon Controlled
Rectifier 3E.±r Thyristor)# ^
Test Chamber
Test Chamber£) <£&?• ^r^-sr ^ r 4 Up Flow *£ Down Flow
Test Chamber, ^ Test Chamber, 2]-§^<i*{|7i LoopTJl f-g- 3.$] ±*}
•i: s£*\*k ^ Slsm wfl^^- n>^*fjL ^ J ^ ^ - ^ ^ t f l ^ ^ ixfej- Test
Section^ Jl*||, > i ^ ] ^ ^ sa>H 51<HS14. Test Chamber^ 3.7)] M] -f-
^r^-S. °]^-<H^ Sl^h ^T, Lower Plenum^]- Upper Plenum n.Z\3L Test
ion^.^, o|-f-o|^ SlI K Lower Plenum^- 4 ^ o l 6 inch^lJl ^o]7|-
600 mm<*i ^ ^ ^ Vessel^. S^<H5l^-^. Upper Plenum^; 4 ^ o | 2
- 3 4 -

incho]jl z]o|7l- 4f 380 mm l Pipe^Efl^, S H ^ h Test
£- 0.75 inch SCH 160 Pipe5_ S H S l -M ^ ° 1 ^ ^ 2880 mm°M
£f ^ 7 f 4 4 Lower Plenum^ Upper Plenum^] Flanged
z\. Test Chamber*-) Test Section-f &°\]^ ^<^5.-g-# £ ^ ^ > Heater
Rod7f ^ -^S |n | Heater Rod^ #*1 ^ T ^ |
Flat»>
Heater Rod^
no22
Cosine Shaped o| ^-
110
Heater Rod^
22
Powers Peak^
n| oj-f. Heating Length^
o|c> Heating^
r S ^ 1.40wfl ojcf. Heater Rod^ 7f
uK Heater Rod^ %• ^°\^ <% 4000mmol
°}^ 1830 mmo]jL, Heater^] *]=§£ 9.5mm
440Volt, 3Phase7f 4 - § " ^ 4 . i ^ > Heater
Heater Rod^ Burnout# ^ 1 * > 7 | ^*H
Burnout Detector^. °]-§-£l-fe- Sensorfe-
K-Type(Chromel Alumel) Thermocoupleo] o]-g-ij^c-l| O]T/C5] ^ 3 ^
0.5mmol L Sheath^) ^fl^^r NCF600o]uf. *fu|-^ Heating Rodoil 4 4 6
Thermocoupleol -f-*|"5]6\*\z\ Test Section^
]cK 600kWo]ul-.
Burnout Detector7f
Test Chamber ]A-] 2^-fHf
- 3 5 -

248mmo|jL ^ o | 7 } 1500mm°] ^f-^ Vesselo|c>. Vessel^
38mmolJL ofefli} ^ ^ | Flange^ - ^ ^ f e 75mmo]uf. Vessel^] v.||-f
^ 72 litero|u|-. Vesseloflfe J£-^- 47fl^ Nozzleo] -
ZL 3.7}^ S.Jf- « | ^o | 2 inchojuf. ^*> Vesseli|^ #^f ^
41 SI^- T/C7f - i*)£H al-^^ 6^^ ^-^-g- Tapo|
Control Valve7>
_o.^ U-Tube Type^-
717} *5L^ Shell J i ]^# ^ 4 ^ 7 f ^ ^ . ^ ^ 5 ] ^ ^ ^ . -§-^7]^ 3.7]
12 inchojji Z]o|7f ^ 2 0 0 0
1648.2mmolt:]-.
4afl<gS Pitch7}
H 2^f#^l 67fl^ Baffle^
200 j }
«»
*}<H O. -§-^^r 130 Liters. ^ ^ ^ ]
252mmolJL ^oj7> 2600mmtl ^^f-^^-S Vessel^] Jf^fl^ 36mm o]z}. 7}
- 3 6 -

2 inch PipeS g ^ S M Sl-fi-^ # 3 nA
Tapo] ^ S H ^ r f . £.*> DP# <>l-8-*H Water Level
40 kW^ 7f<g-§- Heater 7f
Heater^ JEL- - 87fl7f ^^|5|<H £ i - ^ 3. 4 4 ^ -g-^^r 5kWo]i:]-.
Heater^ 3 ]^^r 0.75 incho]jl ^ o | ^ 54 inch©]!:}. Heater#^^r SCR
Heater7f «1=.A) ^-ofl ^ 7 ^ ^ - ^7fl5]<H
^0} 40% o|*>^ ^-foU^- Heaterofl
5ll^ Control Valve7f
Over Pressure7j-
Safety Valve#
Test SectionoilA-1
U-Tube ^
3.71-fe- 3 i^o] 252mmo|jL ^<>l7> 1600mmo|c]-.
-^ 1471)71- ^ * 1 S | O 1 sa-fi-nj H # 77fl^ ^o l7} 2779
2848 mmolo| u}n]^l *>tfe. 2917mmolu}. Tube^ i l ^ ^ r 19.05mmo|
^ 4 * 1 1 ^ Pitch7} 25.
Baffleo] ^ ^ ^ ^ 6ic>. JE V Baffle^
Tie Rod# ^*l*fSacK ^ ^ ; - g - ^ ^ U
^c f l ^ J £ ^ 40
^ 10 ia^ : 600
- 3 7 -

<rt8*> ^ Tripol ^ ^ £ ] ^ Pressurized Water
Levelo] Low-Low Trip Level °]-s\M. 3|7|-fe ^-f7f ^ ^ ^ ^ - f Loop
5] Restart?} #7>^*f<H o ] ^ ^ JL<& ^ ^ 7 ) l ^ o ] ^ A * M . JE?1 ^ ^
3 « S ^ ^ 6 J ^ '-JzMaflS. ^ A * W . J L ^ ^ ^ T l l ^ - ^ Injection
Pump, Water Strage Tank, ZLe|jL Pipeif Heat Tracing^^.^. °]^-<H^
$XT=}. Injection Pump*} 7 ^ ^ ^ - b 0^170 Barojx^ ^cfl - f i - ^ 61.5
liter/hroju]-. - -5O ]<H ^ ^ ^ r Electric Stroke Contral Methodom
n ] ^ - ^ Crane Afofl^ ^ 4 ^ ^ ^ . S . (Model : 810C-72SE-TE330)
Diaghragm Typeol
-Bl Main Loop^]-^]^ Pipe< | Heat Tracing^-
23
2)
21 ^ « i ^ M 711^^ A^^ L o o p ^ ^Ai^ . s ^ l ^ f e PRHE
Heater, 7}<&7], IRWST# S.^^V Tank, Tankt-H«]
Bypass*l-o=l IRWST Tankufl*] Test Section^ ^ f - ^ M ^ Loop7 1 f- 1 uj-
l oilA-1 ^ ^ ^ ^ , ofl<g7l, ^ ^ 7 ] /
Loop^j T e s t chamber tj|*l S.3] 2r.
Heater!-
- 3 8 -

7\) PRHR Heating Vessel
- £ 5 . ^ PRHR Heating Vesselufl^ Heater7l-
.£..§.•£• IRWST Tankuflo] Heat Exchanger7} ^*]Sl<H $1
€[. PRHR Heating Vessel*] 3.7]^ vfl^o] 375.2 mm O|JL 4 ° | - b 1600
Vessel^ ^-^fe- 41 mmolu}. Heating^ J L ^ - #
VesselMl^f-ofl^. Flow Baffle# ^^l*>5i^.n^ ^ ^
- ^4*1-5514. Vessel^ vfl-f- -§-2o>^ 120
^ ^ 1.5 incho|u>. J t ^ # S.5l
<H 440 Volt, 3^S] ^ 7 ] # 4-§-*fe -§-5^ 300kW^ Heater#
cf. o] Heater^] - ? ^ ^ : 2 3 7 ^ Heater Rod^. £ H ^ 1 - ^ - ^ 4 Heater
3.7]^ ^ l ^o j l inchol^l ^ o f e 45 inch°M 4 4 ^ -g-^^- 13
Tank ^ Heat Exchanger
IRWST-i- JSL^^l Tank^ ^^f-^^LS. 4^°1 120
1000 cmojt:!-. Test Section^-S. °]-§-3c]^ Heat Exchanger Tube ^
200 mm*! 37fl^| View Por t# ^
Flanged
Test
Sectiono] s^cf. Test Section^ 4 ^ ° 1 19.05 mm°]jL -T-71]^ 2.6 mm
5.5 mol Tube 47fll- *i*l*M 4 4 -&51 ^ ^ i
. Tube*] ^>4^r 38 ma<>]r}m *}t}*\ TubecHl ^
>$T£O_3. -f-B] 550
mm ^ 4 - ^ - 5 . Tube^l ^ ^J£Af TubeM)^ ^ ^ ; - § - ^ £5E.-f
-39-

. Tube
0.05 cm«i K-Type°H
0.08 cm*] K-Typeoju}. o . ^ 2.4-3^: ^-^<H1 * l * l £ H £ l ^ IRWST l
3)
JJl -H-^ all<>!-§- Control Valve^}-
^ ^ ° 1 3 molJL $t<>]7} 2.4 m 3 .
^ ^ ^ - 585000 Kcal/hro|uK i]cfl ^ 4 ^ . 5 ^ 1 9 5 0
220 Volt, 3 P h a s e ^ o ] 4 - § - ^ T : } . ^ ^ ^ ^
°o>;?!ol 30 m H20o|jL -g-^oj 18 m3/hr<>|^ 220 Volt, 3
4)
^ ^ - S - ^ r ^ - ^ / ^ r ^ ^ e l ^-f -c : 1.0 micromho/cmo|*>^
De-Ionized Water# ^ ^ 1 * H Storage Tank(IRWST£f ^-g-), ^ Loop
^ l ^ ^ l "Er^W ^^> ^ ° 1 4 . Storage Tank<Hl ^ g -
Feed &^£. De-Ionizer
i, Feed ^ ^ ^ . ^ Loop ^ a l ^ ^
. De-ionizer^ i j c l l ^Sf -^^^ 600 l i t e r / h H ^ L 220 Volt
3. ] >V ^ Data Acquisition
- 4 0 -

7\.
, Heater Rod )
Acquisition c||*H
r Test Section
^ Heater Rod£]
2.4-2CH1 u}
Data
uf.
1) S.
Loop# : * s _ ^
Ungrounded Sheath ^ ^
SUS304 5 E ^ InconeHu}. <^^
^?] Ice Point Reference Unit
JL
heater Rod^ S ^ ^ r i ^ ^ r K-Type
. Sheath*] 4 ^ ^
?\x}
Data Acquisition(DAS)7fl^f-
2) oi
RCS LoopvH^
fe- PRHR Test Section
Pressurizer ^M.
TT Test Section
^ Smart Type <>l-g-*H
- 4 1 -

3.. Loop^ £*l 9| Loop
3) *]• <y-RCS Loop ^r*U| *f^g; Smart Type
1^ Test Section ^/#-?-, Sfe PRHR Test Section
, Loop
4)
]-b ISO( International Organizarion for
Standardization)-5167 ^f^<Hl n -e} Flange Tap ^ ^ .
•%•*£*& Orifice Plate
m = a e j £^2 AP p (1)
a? : mass flow rate(kg/s)
a : flow coefficient
-42-

£ : expansion factor
d '• orifice bore dia. (m)
AF'-pressure drop between orifice plate(Pa)
p • fluid density(kg/m3)
4) *1£ ^ ^ * 1 ^ ) ^ 3 ^ ^ ^ * H 7l^^e]7l , 7\<$7\, IRWST
Tank %!>\ ^ ^ 1 #
Calibration
f. Data Acquisition
Data AcquisitionTll^f-^r 4 ^-^7]7}S. -^ -^^ Analog
Digital *\$.S. ^^:*11 ^ ^ Scanning A/D Converter, ^
Digital ^ 5 l # ^I^^, ^B]^}7l ^1*> Computer Processor, Ajel
oil ccfs]- 4 711 -7] Controller^) ^ ] 5 l # JSLMI l ^*> D/A Converter,
j > Data# ^|^-*>7l ^*V tfl-g-%^ Hard Disk ^ A ^ ^ - ^ ^ 4 . 3.
2.4-4<Hl Data AcquisitionT
Data Acquisitionr7Jl^f-#
Parameter## ^]<J:*f7l ^1*H Computer Program^ 4Ao*l"55l^}. °1
Program^ HP-VEE, C-SCPI *£ C-<d<H ^ # ol-§-*f<H 4 A ^ S d - ^ ^ , ^
Main Program, A/D Converter^ Sampling Time !g
- 4 3 -

Sampling?]^ ^ ? # ^ ^ * f e Sub-Program, Memory5.-f-^ ^*\
^ S . SK>*fe Sub-Program ^
Sub-Program %-SLS
4. H 1^
Hl^KSteady State Test)
, Test
r PID( Proportional Integral
Derivative Control )*cN^ ^ H ^ l ^ ^^*]^|<>l-t *fl *f5Eli:K -fr3o*
^r Orifice ^-3OM]^] # ^ ^ 1 5 l # Qo\ Air-Operated
Inverterl- I-*!
7f<y-7| Heater^ # ^ # i^*l-SS.>H ^ H ^ } . Test
Test Section<y^-^:S.# ^^*f«H <gJ2-^;7l^ Bypass -%-*$
^ Test Section°J^g:S.# n|Afl
M-. ^1-S.^^ (Transient Test)
Test Section°J^-£.E ( ^ ^ gl - ^ - e o ^ ^ Parameter
^ nJB| Personal ComputercHl 4A^ ti^^l -fr5cM
Test Section^] Heater Rod #S|<Ml cHU: Transient 1<H ^-^. Program
- 4 4 -

(1) Test Section Heater Rod #^£] Transient
^^1 : 30 ~ 600 kW
= ^ ^ 120 sec
^l ^ Step : 0.1 sec
Transient : 1 sec Aj-ojofl .71 # ^ ^ 75
(2) Test Section ti-T^n-^-^ Transient
: 1.5-30 kg/s
ilcfl 120 sec
Step : 0.1 sec
7}-^ Transient : 1 sec Afo]^ 7] -fr^ 75
5. CHF
£• RCS ^1#
110 Kw^ -g-^^ JL *i#^ -&3E7}- Flat l heater7}
|~ 1.82 MPauS.-f-El 12.08
| 300^550 K^
-45-
o\] rcfB} Personal Computer^^ 4 * W 7 l # ^ I H $-*$ ^ Heater
Rodt- * W W . °M Test Section^H 6 ^ 1 , ^ <g-f>-
£ 3 * W ^ ^ A ^ # ^ 2.4-5<Hl
CHF7} a i ^ * | - ^ # ^ - f Heater Rod
*}<*{ CHF ^#7||-f^(Burn-0ut Detector System)#
Transient
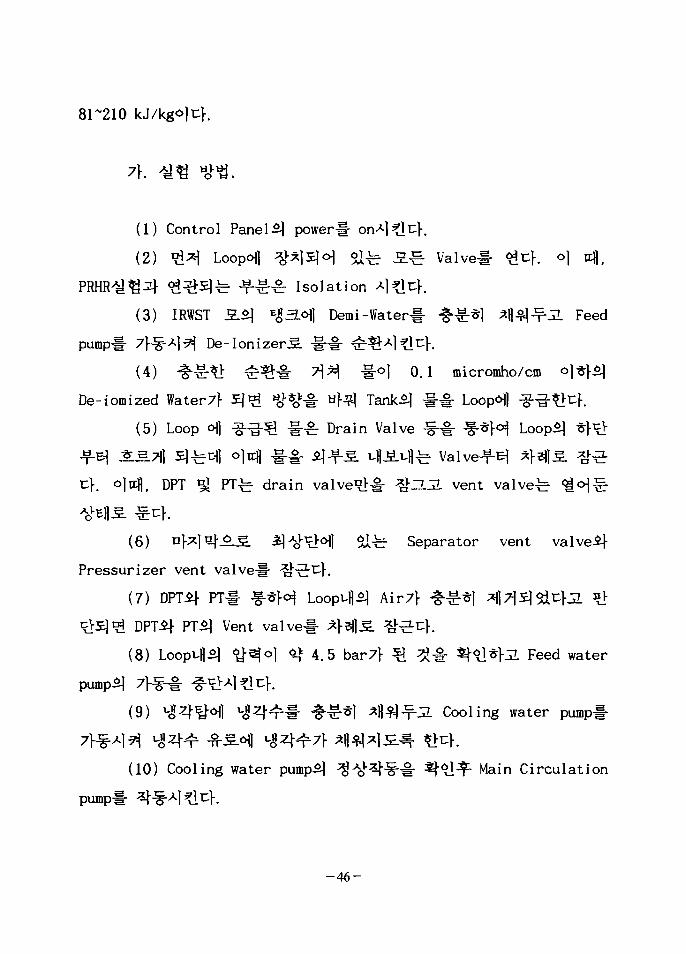
81-210 kJ/kgo]cf.
(1) Control PanelB\ power#
(2) °i*i Loopofl ^1S|<H Sl-fe J2.-E- Valve# g c } . o] rcfl,
^ ^ 5 | ^ -f-^S: Isolation ^]^\t\.
(3) IRWST S . ^ ^3.6fl Demi-Waterl- -§^ :*1 ^fl^-f-3. Feed
pump# 7HfAl*! De-IonizerS. # # ^ ^ l ^ I ^ K
(4) ^^:«> ^ ^ # ^ ^ l-o] 0.1 micromho/cm
De-iomized Water7} 5 ] ^ *£*£•& «
(5) Loop cHl ^ 9 4 1 1-^r Drain Valve ^ # f - * } ^ Loop^
DPT *i PTfe drain valve°>^- ^ZUL vent valve^
(6) n>^] B}-j$.S. i ] ^ 1 ^ ^ ] Sll-fe Separator vent valve-2}
Pressurizer vent valve-g- }"-5" K
(7) DPTif PT# ^ - * H LoopvH^ Air7> ^ ^ * 1 ^|7|Sl5it:>31 =>
DPTif PT*1 Vent valve# *}$}$. Q&T:}.
(8) LoopuH^ <&3H 6t 4.5 bar7]- ^ ^ # ^ ^ ^ J L Feed water
(9) h§4^°11 u ^ 4 ^ r # -§^-*l *H*|-¥-a Cooling water pumpl-
(10) Cooling water pump^ 3 ! V * H F # ^ " ^ ^ Main Circulation
p u m p *
- 4 6 -

(11) Pressurizer Heater# switch on*! ^ M*\*\ -§-5cM-
(12) Preheater# switch on*l ^
(13) Prz-heater, Preheater 7f 7Hf-£l'd LoopS-l
Loop £ . E ^ o f l *4€- ^ -8 -^ rS j ^ ^
AV^^ . BJ-7]^*B Loop-2-1 <y-^o| 30 bar o]^o] £}t*| Separator vent-§-
Control valvel- <&6\ {^-^ 6%$S.) Loop^ ^J-^^- 10 bar
(14)
(15) Loop^ ^rJ£7f 80°C
5|^ Loop-S] 7|~§--§- ^ ^ ^ I c } . Cooling Water circulationPump, Main
circulation Pump, Preheater, Pressurizer heater %-~=t Off ^]?l^f.
(16) Sepatator vent valve# < <H Flashing # ^
30 % $£.7} ^ e ] ^ Loop <y-e|o] Pressurizer
ESf^^°l*l-S. 1 < H ^ 1 ^ ^ Pressurizer ufl-f-
Water Leveloj ^ O ^ ^ I J ) A] )- >r:K Pressurize^ Water level
o] 55 % 3JS.O1H Separator vent valve# ^fe^K i l ^
Pressurized ^E!|7|- <^ 5 bar if 150°C flA-] flashings]
(17) Flashing -^^.^ Cooling water circulation pump main
circulation pump, Prz-heater, Preheater &SLS. Switch# On
(18) ^ # - H ? ^ <U^# Setting >cK
(19) 4 ^ 5 S ^ ^ ^ ^ 1 4 4 ^ - ^ Test Section
(20) Test section Heater<^| -^ Switch# On^l
- 4 7 -

(21) CHF -2-HMH # ^ # Step J-
^ A o ^ f l i - ^°J * **§• StepJljiL(22) CHF7} I H * } ^ Burout £ # 7 H ^*H ^ ^ g - g - i - 80°
Trip AJ luK
heater -g- f ^
^ o M ^ -y^^-H-b S ^ ^ r £ 7 f 400 °C
CHF7f «i^*> %SL$. ^^\Si^}.
Test section <£^-
, Test Section -*}-«£ ^ ^f^, heater
heater -g-«H] ^-oj5| f e 3 ^ o ] * } ^ - ^ ^ Aljr^. s = . ^ ^ . ^ e
1.81 MPa<HH 12.08
300^550 kg/irfsecoH ° J ^ ^ - ^ 4 £ f e 8r210^ 0.25~0.40
ZL^ 2.4-6, 2.4-7^ ^ ^ ^ ^ 1 - ^^- f r^-^ CHF5]
test Section
. a ^ 2.4-7^
- 4 8 -

0.994
HU 2.4-8^
300^550
fe 12.08 Mpa ^ - f # ^l^^fJL^ ^ ^ ^ J <g*<M ^
717f
6.
7}. CHF
>H 7]#51 Hfif ^ ^ ><y Heater Rod# Af-g-*H, ^ ^ - f r S . CHF
-i- ^*5*}JL TL o]^oflfe 3 x 3 Heater Rod t } ^ ^ ^ ^ - >H^*}JL
3 x 3 Heater Rod *}*££; ^^fl ^ l ^ ^ ^ l S^^-^. Heater Rod S
9.5 mm, 7>^^-?> zJoj^r 3.66 mS. *f^JL Rod J- ^ # ^ 66.6
4 4 Flat gj Cosine ^^-g-3E^ 27^17}
Heater Rod ^ ^
Heater Rod # ^ ^ 4 S . ^ 4 ^ A | ^ CHF
. Heater Rod t
- 4 9 -

9i ^ ^ 1 ^ ^ J " i ^ -^^^ i# TestCHF ^ 4 R v ^ l ^ 4 %
^ - & CHF<H1 ^ t > 0}
4
CHFcH] t:fl*> 7 j | ^ ^ ^ S . ^ 5 ) 5 } -0.01
U>^ Tight
Lattice Hexagonal ^<&g.
-g-ofl Wire Wrapo] - f - ^ 5 ) £
°l-8-*H " i ^ W * ] - ^ ^ ! cU*H ^l6^ Heater Rod l tfl*> CHF
77J1*] Heater Rod # 4-§-*fe Tight Lattice
- 5 0 -

ojuf.
7. A}J1 ^ J
7}. Separator Vent LineS^ &}£
•y^l : 1996\4 9 ^ 17^ i ^ 3^1 40^-
vfl-g- : 1996\1 9 ^ 16^ Jf-Ef ^-*^^ >^^(Job Name : Single
Annulus, CHF, Job No. : CHF-3)# ^«g*]-^ -§• w ^ t > 4^2-^.
120 bar<HH ^ e ^ ^ - o ] 300^550 kg/trfsec <
^ L o Op£| 6>>|^. *}o^ ^-oj-^. # ^ J* iy-Ag< Separator Vent
Separator^ Control Valve-S^ Pressurizer^] Control
- 5 1 -

CommonSjol <&^<>\ 5Hoi jL Separator JE-fe- Pressurizer
r Steam
^ Loop ^ 6 J "# ^1*M Separator*] Control valve
<$ 30»(Controller^ 7 j ]^ )# openAJtl ^ E H > H ^^*l"SEl#. i ^ ^
^-fofl Flashing*} 4 3 5 ^ ^ # Open*! ^ ^ ^ - « } EO ^ 1 4-11>
^.uf Flashing*] ^-f^- oj-^o] 30baro|*fo)^7. ^ S 7 f
U, ^ ^ ^ 3 ^ £ J Loop condition^ 120 bar, 255"C
>H ° 1 ^ ^ *}°}7\ tf-2;- ^ ^ r 5 o ^ Steam^- ^ # ^ 1 ^ Steam Jet
JL D. ^2} Vent l i ne^ ^ * ^ # 7 H ^ r ^-S-S- ^ ^ > ^ . AJ-JL l Vent
t -. xz\z}*\ Separator^] control valve# ^-A| T^-JL H
Vent l i n e ^ ^ * ^ ^ jg.o0i=o| 3.^ 2 . 4 -
(1) Vent line^ ^-^> e ] # Safety Valve line^f
(2) 5+S. ^-^*i J-oj. . «^l*>7l ^ * H Separator^
Control valve^) 7f|«o»-# 3|4i4} *j".
(3) Jlc} jL-I-a}oi ^oj- qi Loop L M # * H Injection line
^ Injection pump# ^ ]
- 5 2 -

B & C Loop
1. 7|| A
In-containment Refueling Water Storage Tank
(IRWST) <HH Af-g-% Spargerl- ^*}7] *1*J *KS.-t ^4i*K2., A ^ l
Si Sparger^ ^ ^ § - X\^*}7] *lt> ^ ^ H ^ ^Tfl, -g*l*>o|, 31*J
K 1994 id
(Blowdown and Condensation Loop ^ ^ - B & C Loop°|e}
^^Engineering iDEC)^ ^]^*f$it:f[10].
<>l-8-*H B & C Loop o\] cfl«i
Sparger
o] %o\]*\^ IRWST/Sparger
2.
- 5 3 -

Loop
. A Component
A.
Tank, Flow Meter,
7] ^*B t Ml-f- Heater, 7Jl^-g-
^7luf Subcooled Water
7(| f- fe Critical Flow
^ T f l ^ ^ ^ : 178
Heater7>
o.D|t
71 tf, 360
Safety Valve7|-
4, Quench
^cfl. Safety Valve 3.
Heater!-
ADS
370
27H
Heater^
Safety Valve<>lW ^ 150 7l
100
170
. C>n> 7\
- 5 4 -

r 1.0 MPaS] S ^ ^ 7 l # 0.1 kg/sS. &&*k "r $1^ 4
US. Reimers4 *fl# (Model ig RHP375)°lnJ, -O^Tfl^.^ Vortex Flow
Meter (1 inch, i j ^ L ^ - ^ ^ : 2.0 MPa) 7} ^ * l S H #c}. J£*>
^*ga .^ Kammer4 ^ -g - iS . ^ W 0 ! 2.0 MPaojnJ,
inch o]t\. ^7}^7} ^ |^gr Specification^]
»> ^«1S>H. TankS} Sparger, 7fl^#*| ^l^ltfl, Sump Pump
^-§- Spray %*)$. ^-^^cf. Tank*] *}-?-ofl . ^ 7 l # ^ 4 4
Sparger7f ^ ^ 5 ] ^ ol^T^, Sparger ^ o f l - b ^ 7 l ^ - § ^ « ^ #
)«> *]xM7\ s£*\5\o] $X^\. 5E > Tank
1^ 4 7B^ View Port7} #*j-*H 1<H ^7] 7}
. Quench Tankiq-
Tankif o]^- «^^*fe Manifold ^ <y-
. o) 7^1^^ Subcooled Water^]
Blowdown©m Critical Flow *I%M 7><y-7l Ml-^-^^-i-
Accumulator^. 4-§-*}3- Sl K ^ ^ 2 : ^ 1 ^ - il ^B l»g^ .^^ KammerAf
71 Bf 4 ^ » g a . ^ ^%sg: Specification^-
Specification^- ^*1*|-JL 014. t } ^ ^l^-7l7]S} Data Acquisition
System# ^ ^ * f e ^1°]#<H14^1 Noise7l- ^4*f^ l ^ ^ * H Noise afl
- 5 5 -

Noise7|-
7)1 ^^^f0^ Ground -*l?l-cr ^ ^ i f Noise *ll7) ;
Noise#
Noise
1) 7fl A
(transient)!-
^ <% 55. ojufl^ nfl-f
, *KHDP), ^r^I(LT) ^ 3 ^^LS.>H. 1-5 V
10 Hz)3 *1<>hi!:SL5. ^ ^ ^ c } .
^131 : K-type^ <i&tfl( thermocouple; T/C)S. -
cfl, <$ 20 mV (ilcH <i* 5 Hz) n|
(DPT) : 4 H 3 . -f-Bl 0-10 V
- 5 6 -

(FT) : 1-5 V (^tfl 10 Hz)£j ^ 6
201)Sl Venturis *}#-*!:£ (DP-201, 202)
(FT-401)-^ Vortex meter^ flow computer^] £|*H
^ S } ^eo>Al^7} 1 H J W J£t> 1- -^5oM| (FE-301)6J
Venturis -fr^ofl a]a(|*>^. *>^^!3l (DP-301, 302)7} i H ^ c } .
: charge amp. S. -f^ 0-10 V (£]tfl ^ 10 kHz)£) ^<^
Cf^5l 37W
(7f) Til71^ ^ 7 1 ^ ^ 71^- 3\% : ^ A ^-^717]^ 5:7] unload^
monitorcHlA-| VEE^^Hl displays]JI,
^A|(Startup monitoring)
3-8
disPlay5|jL,
(U>) ^}S.^^(Main acquisition)
2.5-2<Hl U^fVl a>-^ ^ - ^ ^ , ^ ^ - ^ Graphic^ e l ^ ^ f e monitor^
VEE^^*f^l displays]JL,
7} 7Hf£4li- ^u} . ^
test matrix^ rcfs} 3.7i] t[^-S] 57}*) 3^3.
- 5 7 -

o .5LE.-1
o JELE.-2
o JS..E1-3
o 3.B.-A
o J5LE.-5
o\6\]
Steady steam test
Transient steam test
Transient water test
Critical Flow (CF) test
Two-phase test
2)
£ - y ^ ^ l ^ DASfe HP-V743i/100# fe
(HP-DAS)if IBM-PC# ^^1^-S. * f e ^=>^r ^ -^^HPC-DAS)S
t h ° i ^ HP-DAS^ HP-V743i/100^] ^-S#B|ol] 2 ^ Scanning A/D
(64 channel )£} 67fl^ Digitizer (2 channel ) # ^ ^ K l L , o
HP-UX 9 . 0 ^ * ^ * H ^ 4 - ^ 5 1 ^ HP-Vee 3.
. ne ] jL PC
. S 2 . 5 - 4 - ^ HP-DAS#
Df, HP-DAS#
HP-DAS
Component1) Scanning A/D
(64 eh.)2) Digitizer
(2 ch. )3) D/A converter
(4 ch. )
Q'ty
2 ea
8 ea
1 ea
Total
SCP Type & No. of ChannelDirectinput
48
16
-
64
T/Cinput
64
-
-
64
SS&Hinput
8
-
-
8
Others
-
-
(4)
(4)
Total
120
16
(4)
136(140)
Remarks
for scanningacquisition
for high-speedacquisition
Not used forsparger test
- 5 8 -

3) *K5>lBl SSZL
S| SSZL^^ * J ^ ^.fi. *m±g.t: £ S program^
_g_ 7l^#^r subroutine^ JE-b function*} *>
ojirfl subroutine^?}
function^-7}
HP-DAS^ ^-f-^ ^1-S.^el^ 37M
HP-VEE-t ^ ^
display^cf.
HP-VEE#
display^
7f) 4
2. 5-
. Trigger!ng^li
(1) J je. .-l : Steady steam test
-59-

2.5-6ofl i
Graphic
(2) r^ 3.B.-2 • Transient steam test
^ ^ 1-2 -g-^ ^^
transient)^
Graphic^ els^u}.
(3) ^r^1 S.JE.-3 : Transient water test
(4) ^^J S ^ - 4 : CF test
^Nir S 2.5-6^1 tj-E>i4 alAt^, o|
. Graphic^ el siu}.
(5) ^ ^ j JSLH.-5 : Two-phase test
HP-DAS^
^ function ? ] 1 >4
-60-
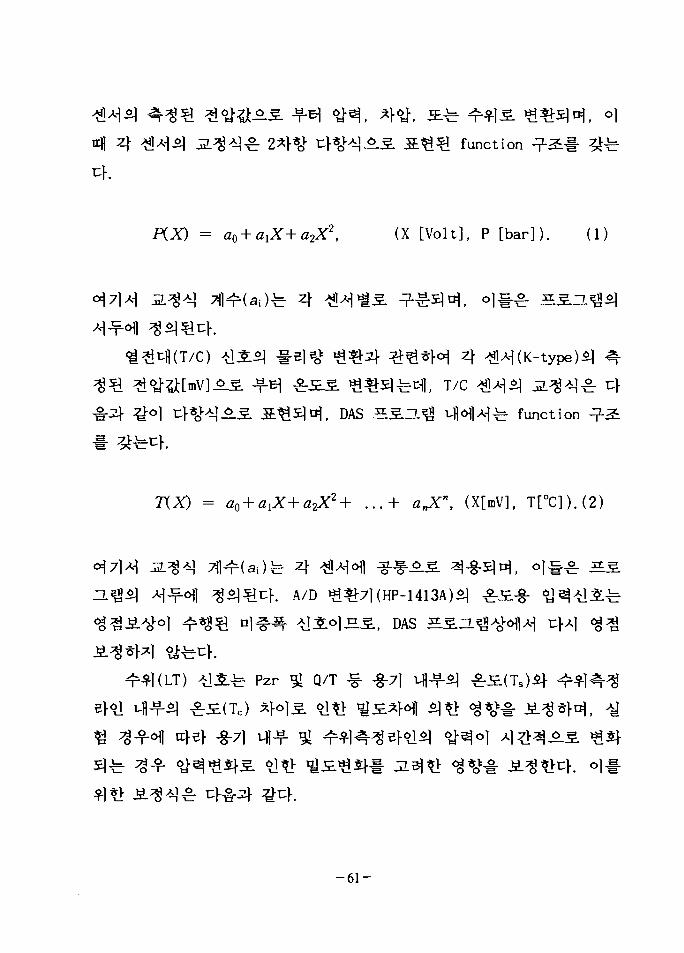
, o]
irfl 4 ^ A ^ J 2 . 3 ^ 2*>*<J" 4*<W^-5. S^*I function -?-^f ^fe
[Vol t ] , P [ b a r ] ) . (1)
) - 4
c|, T/C
, DAS S5.Z11« i-Hl^^ function
", (X[mV],
A/D ]
]«LS., DAS
Pzr 91 Q/T -g-7}
- 6 1 -
u - AP(pw.cps)gHl . .flu/ — 7 \ \o)
W ( P - P ) g
fe ^^-§-71 ufl*]
^ Handbook^] ^ ^ ^ C > .
^ ^ ^ ^^1^1 Venturis]
(DP-201, 202)#
n^, o]^. flow computer^]
^ D } . ^ "o^BH^^ofl ^ ^ m -B-=oMl(FE-301)^ Venturis
(DP-301, 302)#
(1) 3.71
(a) Pzr 31 Steam line-§- PT
o PT-101, PT-102
- 6 2 -
o PT-201, PT-202, PT-203, PT-204, PT-205, PT-206,
(b) Flowmeter Q Flow/Level-§- DP
o LT-101, LT-102, LT-501
o DP-201, DP-202, DP-203, FT-401
o DP-301, DP-302, DP-303,
(c) Water line Q SG line-§- PT
o PT-301, PT-302, PT-311
o PT-401, PT-402
(d) Steam line^ Test section-g- PT
o PT-213, PT-214, PT-215, PT-216, PT-217
(e) Water lineS] Test section-§- PT
o PT-303, PT-304, PT-321, PT-322, PT-323
o PT-324, PT-325, PT-326, PT-327, PT-328
(2) ofl(
2.5-25+
(a) 7}<&7] (Pzr) 2LQ
o Pzr «^^ : PT-101, PT-102
o Pzr £ S . : TC-131, TC-133, TC-135, TC-137, TC-139
o Pzr ^ * ] : LT-101, LT-102
o 7]t\ • PT-201,
(b) - g - ^ ^ ^ (Q/T) 2^£
o - § - ^ ^ ^ ^r^l : LT-501
o - § - ^ ^ 2 : ^rS. : TC-501, TC-502, TC-503, TC-504,
- 6 3 -

TC-505, TC-506, TC-507, TC-510, TC-512, TC-515,
TC-516
(c) ^71^-^-nH^: (SL) afl<£ 3,^
o afl^ MI-T^&S. : TC-201, TC-202, TC-203, TC-204,
TC-205, TC-206, TC-207
(d) f ^ H f l ^ (WL) afl<g ^ £
o tifl^: Ml-f-^E. : TC-301, TC-302
(e) ^ 7 l « ^ 7 ] #-?- (SGL) £.£
o tifl:£ ufl-f-^-£ : TC-401. TC-402, TC-311
o wfl^ -^ : FT-401
(3)
2. 5-6^]
M. 2 . 5 - ] a ^ ^ l ^ ^ 1 , ^ ^ ^ ^ K J l fi6jsjo} cX^l x\3J$Z] 5 S a ^ ^ 3711 source
(version 9.0)
r C-^<H^. ^ ^ ^ l ^ compile S]JL, o |^o]
HP-VEE# o]-g-*}<H Iink5]<>1 ^ ^ ^ c f . 4
^ VEE ^ ^ * H > H 3-ig 2.5-3if
- 6 4 -

B&C Loop
Loopofl
Spargerl-
^ H SpargerSpargerl- a l ^ ^ ^ l
NEXT PAQE(S)left BLANK

KAERI/RR-1004/90, 1991. 7.
2. "ASME Performance Test Code, Supplement on Instruments andApparatus, Part 1, Measurement Uncertainty", ANSI/ASME PTC19.1, 1985.
3. .$. ^ ^4, "17 x 17 « | < * l ^ DRBEP 7VM *IS1 Full Scale\ TR-TH-GEN-92006 Rev.O, 1992. 12.
4. D. S. Oh, "Analysis of Pressure Drop Test Results for DebrisResistance Bottom and Piece", KAERI/TR-290/92, 1992.
5. ^ # & 2) 13*1, "^r^-§-7])5c>«!<?!£. 3 ^ 1 ^ " , KAERI/RR-1637/95, 1996. 7.
6. Sreenivasan et al., K. R., "Temperature Fluctuations and Scalesin Grid-generated Turbulence", J. Fluid Mech., Vol. 100,part 3,PP. 597-621, 1942.
7. Corrsin, S., "Decay of Turbulence behind Three Similar G rids",Aero Eng. Thesis, California Institute of Technology, 1942.
8. Comte-Bellot, G. and Corrsin, S., "The Use of a Contraction toImprove the Isotropy of Generated Turbulence", J. Fluid Mech.Vol. 25, part4, pp. 657-682, 1966.
9. Uberoi, M. S., "The Effect of Wind Tunnel Contraction on FreeStream Turbulence", J. Aero, Sci. 23, pp. 754, 1956.
10. ^ ^:7]S], "#£<>}&?{}!§• "i^}^n, KAERI/RR-1323/93,1994.
11. ^ £r7l^, "-&#<>!:*}Tflf- 1 ^ 1 % ! " , KAERI/RR-1502/94,1995.
- 6 7 -

Table 2.3-1 Energy Decay of Grid Turbulence
Ref.
Present
Corrsin(7)
Comte-
Bellot
and
Corrsin(8)
Uberoi(9)
Sreeni-
vasan
et al . ( 6 )
Uav
(m/sec)
5
10
10
10
20
17
4.4
M
(cm)
1.26
1.27
2.54
2.54
2.54
2.54
2.54
Grid
Type
spacer
mesh
mesh
mesh
mesh
mesh
mesh
2 ,U -decay
ni
1.2
1.3
1.28
1.33
1.27
1.2
1.2
xoi/M
0
1
3
1.5
2.5
4
3
0.04
0.05
0.043
0.077
0.056
0.04
0.04
2 ,V -decay
0.84
1.22
1.14
1.27
1.24
1.2
-
X02/M
0
1.5
2.5
1.5
2
4
-
#2
0.017
0.017
0.016
0.05
0.04
0.028
-
-68-

Table 2.4-1 Specifications of RCS Loop Facility
1) LOOP Tfl f- 91 PRHR LOOP TJl^
: 16.0 MPa
- IRWST <U^ : 0.2 MPa
- ^ t f l ^ ^ ^ ^ - g - ^ £ j £ : 347'C
- Test Section ^-^ Subcooling ^ E . : 0 -1501C at 16.0MPa
- tfi^i -H-5o* : 3 kg/s
- ^ ^ S 6 O^ : 180 mH20
- PRHR LOOP -n-^ : Natural Circulation
- Test Scetion 3]tj| ^ § - ^ - ^ ^ : 600 kW
- PRHR LOOP Till- S ^ i ^ ^ - ^ - ^ 1 ^ : 400 kW: De-Ionized Water
: 2 in
2)
* vfl-f-g-^ : 30 I* heater ^ : 40 kW
: 200 kW
: 600 kW
-69-

Table 2.4-2 Instruments of RCS Loop
Intrumentation(1) Heater Rod Surface Temp.
PRHR Heat Exchanger
(2) Fluid Temp.- Flow Meter Inlet- Test Chanmber Inlet/Outlet- Test Scetion Inlet/Outlet- PRHR Inlet/Outlet- Test Section
(3) Pressure
Input to DAS24
(32)
21(1)(2)(2)(2)(14)
6- Test section Inlet/Outlet- Steam/Water Separater- Pressurizer- PRHR Inlet/Outlet
(4) Differencial Pressure- Test Section- PRHR
(5) Water Level- Steam/Water separater- Pressurizer- IRWST- Flow Calibration Tank
4(3)(1)
(6) Heating Power- Test Section Heater
(7) Mass Flow Rate- Orifice Flow Meter
Total 63(71)
- 7 0 -

Table 2.5-1. List of major instrumentations for B&C loop
Property1) Temperature
2) Pressure
(static)3) Flow
4) Pressure
(dynamic)
5) Press(diff. )
6) Level
7) Acceleration8) Strain/Stress
9) Density
InstrumentThermocouple
Pressure
Trasmit.Venturi, Vortex
Dynamic Press.
Transducer
DP Transmit.
DP Transmit.
AccelerometerStrain gauge
X-ray densito.Total No. of Channels
Channels80
25
3
25
10
3
88
163
LocationPzr, Piping,
Q/T internal, T/SPzr (2), Piping,
LJ/S, Sparger (1)Piping
Sparger (2),
Q/T wall (5) and
internal (18)Venturi (6), T/S (4)
Pzr (2), Q/T (1)
Pipe, Sparger & supportPiping (2), Sparger (3)
& support (3)T/S
Pzr : Pressurizer, Q/T : Quench Tank, T/S •' Test Section,
Piping : Discharge piping
- 7 1 -
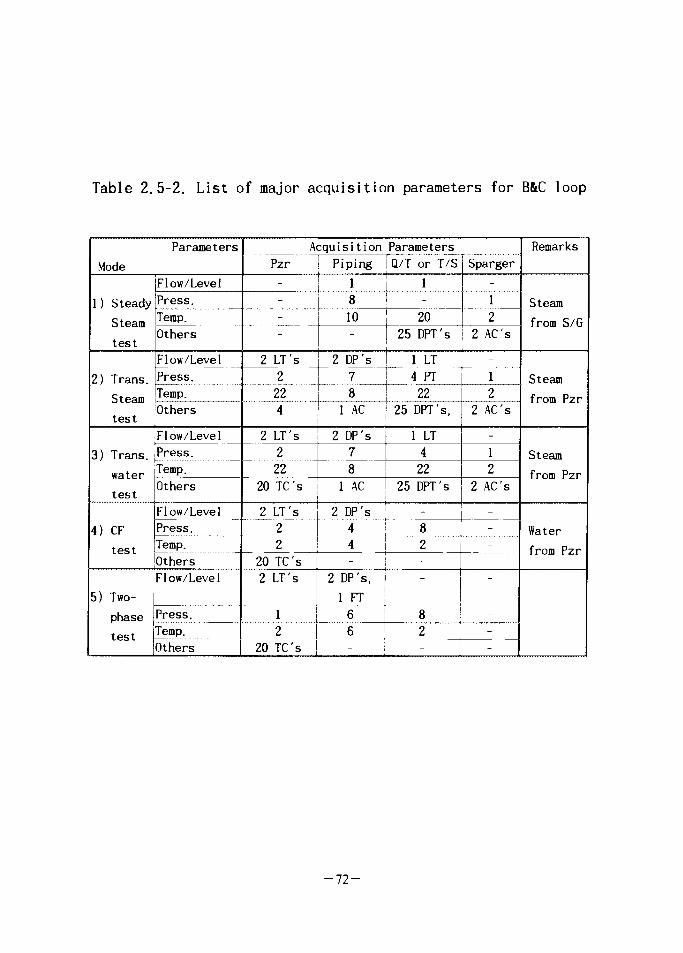
Table 2.5-2. List of major acquisition parameters for B&C loop
Mode
1) Steady
Steam
test
2) Trans.
Steam
test
3) Trans.
water
test
4) CF
test
5) Two-
phase
test
Parameters
Flow/Level
Press.
Temp.
Others
Flow/Level
Press.
Temp.
Others
Flow/Level
Press.
Temp.
Others
Flow/Level
Press.
Temp.
Others
Flow/Level
Press.
Temp.
Others
Acqu i s i t i on
Pzr Piping
- 1
1 8
-
2 LT's
2224
2 LT's
222
20 TC's
2 LT's
r 22
20 TC's
2 LT's
10
-
2 DP's
78
1 AC
2 DP's
l_ 78
1 AC
2 DP's
44-
2 DP's,
1 FT
1 6 •2
20 TC's
6
Parameters
Q/T or T/S
1-20
25 DPT's
1 LT
4 PT
2225 DPT's,
1 LT
422
25 DPT's
8 J2 ]
-
-
8
2: -j
Sparger
-
1
2
2 AC's
-
1
22 AC's
-
1
2
2 AC's
-
-
-
~
Remarks
Steam
from S/G
Steam
from Pzr
Steam
from Pzr
Water
from Pzr
- 7 2 -

Table 2.5-3. Test matrix for B&C loop
Parameter
Mode
1) Steady
Steam
test
2) Trans.
Steam
test
3) Trans,
water
test
4) CF
test
5) Two-
phase
test
Test Parameters
Press.
[MPa]
1.0
16.0
16.0
8.0
1.0
Flow
[kg/s]
0.3
20
20
-
Tank
temp.
15 -
100
15 -
100
15 -
100
-
Geometry
Piping or
T/S
-
-
Variable
T/S sizes
Var i ab1e
length/dia.
Var i ab1e
T/S length
& dia.
Q/T
Variable
subcooling
& level
-
_
-
Sparger
Variable
sparger
Optimal
spargers
Optional
sparger
-
Remarks
Sparger
design
Depres.
system
design
Critical
flow
Two-phase
pressure
drop
-73-

Table 2.5-4. Technical specification of the HP-DAS
No.
1.2.
3.4.
o.6.7.8.9.10.11.
Model
E1401AE1498A
C3020RE1413B
E1429AE1328AE1482BA4033CC3141AE3661A
Item
VXI C-size MainframeVXI EmbeddedController (V743/100)SCSI Mass StorageScanning A/DConverter (64 ch)
Digitizer (2 ch)D/A Converter (4 ch)VXI Bus ExtenderColor MonitorLaser Printer19" Rack SystemSoftware :1) HP-UX (Rev.9.0)2) VEE-Test (Rev.3.0)3) C-SCPI (S700)4) SICL
Technical Specification
o 13 slots, o 650 Wo Processor : PA-RISC 7100LCo RAM 128MB, 100MHz, 121.6MIPSo HDD-2GB, o DAT-2GB, o DDS-1.3GBo 16bit, 100 kHz :
(D Direct Voltage Input : 6 ea (48ch)® Sample/Hold Input : 2 ea (8ch)© Fixed Gain/Filter : 8 ea (64ch)
o 12bit, 20 msa/so ± 10.92V, ^ 21.8mA outputo C-size VXI-MXI moduleo 20" (1280x1024 resolution)o Model : Laserjet-4Vo 1600mm EIA-std
o C/ANSI-C developero Series 700
Table 2.5-5. Triggering signals for each test mode
s i gna1mode
1) Steadysteam Test
2) Transientsteam Test
3) Transientwater Test
4) CF Test
5) Two-phaseTest
Triggeringsignal-1Manual
(key-board)
Triggeringsignal-2
HC-2025] ON >i!3l(5.8 V)
rt
Q0V-301S] ON ^ 3 1(5.8 V)
HC-202£) ON ^.S.(5.8 V)
Triggeringsignal-3
PT-401
PT-101, PT-204
PT-101, PT-204
PT-101, PT-304
PT-101, PT-204
-74-
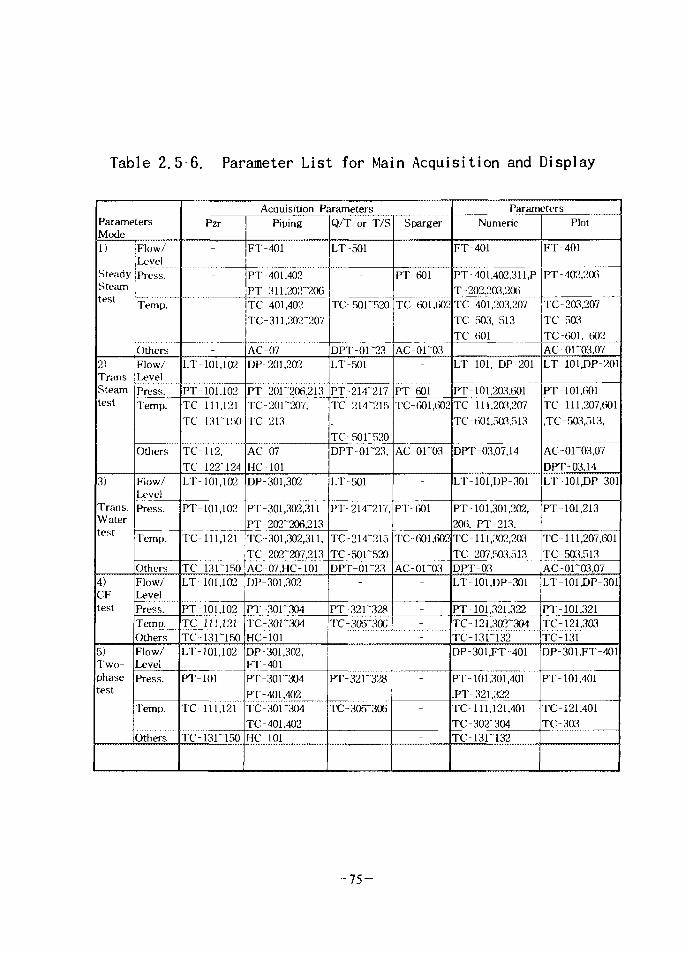
Table 2.5-6. Parameter List for Main Acquisition and Display
ParameMode1)
SteadySteiimtest
2)TransSteamtest
3)
Trans.Watertest
4)CFtest
5)Two-phasetest
ters
Flow/LevelPress.
Temp.
OthersFlow/LevelPress.Temp.
Others
Flow/LevelPress.
Temp.
OthersFlow/LevelPress.Temp.OthersFlow/LevelPress.
Temp.
Others
Acquisition ParametersPzr
-
-
LT-101,102
PT-101.102TC-111,121TC 13 r 150
TC-112,TC 122~124LT-101,102
PT-101,102
TC-111,121
TC-131" 150LT-101,102
PT-101.102TC-111.121Tc-iariiso'LT-101,102
PT-101
TC-111,121
TC-131~150
Piping
FT-401
PT -401.402PT 311.202~206TC-401,402TC-311,202~207
AC-07DP-201,202
PT-201~206.213TC-20P207.TC 213
AC-07HC-101DP-301,302
PT-301,302,311PT-202~206.213TC-301,302,311,TC-202~207,213AC-07.HC-101DP-301,302
PT-30r304TC-301~304HC-101DP-301,302,FT-401PT-301~304PT-401.402TC-301~304TC-401.402HC 101
Q/T or T/S
LT-501
TC-50P520
DPT-0P23LT-501
PT-214~217TC 214~215
TC-50P520DPT-0P23,
LT-501
PT-214~217,
TC-214~215TC-50P520DPT-0P23
-
PT-32r328TC-305~306
-
-
PT-321~328
TC-305~306
-
Sparger
PT 601
TC 601.602
AC-0P03-
PT-601TC-601,602
AC-oro3
-
PT-601
TC-601,602
AC-01~03-
---
-
-
-
-
ParametersNumeric
FT-401
PT-401,402,311,PT-202.203.2(XiTC 401,203.207TC 503, 513TC 601
LT-101, DP 201
PT-101.203.601TC-111.203.207TC-601,503,513
DPT03,07,14
LT-101.DP-301
PT-101.301,202,206. PT-213.TC-111,302,203TC-207,503.513DPT-03LT-101.DP-301
Plot
FT-401
PT-402,206
TC-203,207TC-503TC 601. 602AC0r03.07LT-101JDP-201
PT 101.601TC-111,207,601,TC-503,513,
AC-0r03,07DPT-03.14LT101XJP-301
PT-101,213
TClll,207,601TC-5a-!.513AC-01""03.07LT-101XJP-301
PT-101.321.322 jPT-101.321TC 121.302^304TC13ri32DP-301,FT-401
PT-101,301,401PT-321.322TC-111,121.401TC-302~304TC-131~132
TC-121.303TC-131DP-301.FT-401
PT-101,401
TC-121,401TC-303
- 7 5 -

Table 2.5-7. List of the files for data monitoring and
acquisition in B&C loop
Testmode
1) Monitoringof unloadedconditions
2) Startup
monitoring
3) Steadysteamtest
4) Transientsteamtest
5) Transient
water
test
6) Critical
flow
test
7) Two-phase
test
Note
VEE ExecutionFilename
Acquis i t i on
ini t.vee
startup,
vee
stdsteam
. vee
trsteam.vee
trwater.
vee
cf.vee
phase,
vee
Viewing
viewinit.vee
viewup.
vee
viewsteady. vee
viewsteam,vee
viewwater.
vee
viewcf.
vee
viewphase.vee
Source
Fi lename
init.cs
startup
. cs
ststeam.
cs
trsteam.cs
trwater.
cs
cf.
cs
twphase.
cs
.vee : HP-VEE file,
. cs •' C-language source file
.dat : data file
Compi1e
mkin
mkup
mkst
mktr
mkwa
mkcf
mkph
Dataf Filename
init.dat
startup,dat
steady,dat
steam,dat
water,
dat
cf.
dat
phase,
dat
Remarks
Mode-1
Mode-2
Mode-3
Mode-4
Mod-5
- 7 6 -

ao
3en0)
o
(0
no<oQ
I
a.
- 7 7 -

O
O0)w
U)
3+J
u
Cs)
- 7 8 -

co
oQ>
in
C
a,cacu
w
a .
05
o
COoo
COI
CVJ
- 7 9 -

26
V)
18
16
14
"»—"™r
Q Koa for STD-BEP
A Koa for DR-BEP
100000 200000 300000 400000 500000
Reynolds Number in Fuel Bundle
Fig. 2.1-4 Pressure Loss Coefficients of Simulated PWR FuelAssemblies with STD-BEP and DR-BEP
- 8 0 -
aoo
CD
•a"o<D
aCO
CO
Q
o
0!
ICO
u.
- 8 1 -

C
cO
oE
tern
w
.DV
i — l
oa)
- 8 2 -

600
80
40
x
.Mixing Vane
SpacerGrid
Pressure Tap
-x
FlowDirection
Unit: mm
u
z.W
&
Coordinate system
Fig. 2.3-3 Axial Locations of Spacer Grids and Pressure Taps
for PWR Test
- 8 3 -

, w
Ooooooooooo
-Point 1
Path 3 Path 2 Path 1
D = 9.5 mm, P=1 2.6 mm, H = 68 mm
Fig. 2.3-4 Cross-section of 5 x 5 Rod Bundles
showing the Measuring Locations
MixingVane
- (
• J 2 :
T
M7 T
T T"
t '
)- 12
F i g . 2 . 3 - 5 5 x 5 S p a c e r G r i d
- 8 4 -

oooOO0OOOoooooo
Path 1 Path 2 Path 3 Path 4 Path 5 Path 6 Path 7
0 » 9.S mm, P=12.6 mm, H =. 81mm
Fig. 2.3-6 Cross-section of 6 x 6 Rod Bundles
showing the Measuring Locations
<s i»
^ 2 ,2
i •> .
79.65
- 79.69 unit : mm
Fig. 2.3-7 6 x 6 Spacer Grid combined by
Mixing Vaned and Straight Types
- 8 5 -

Fig. 2.3-8 Axial Turbulent Intensity Decay behind the 5 x 5
Spacer Grid at Points on the Path 1
0.1 10 100
Fig. 2.3-9 Axial Turbulent Intensity Decay behind the 5 x 5
Spacer Grid at Points on the Path 2-86-

0.1
h 0.01
0.001
\
• \
•oA Au o
A mfa
. _fiAO
o
•D
V• s
>
• A<
o
D o
D E
' \
•
o
\V
H
5 O
\A
o
\
c
«
s
•
D
•
O
h
o m
5 A A
Point 13
Point 14
Point 15
Point 16
Point 17
Point 18
• Sreenivasan et.al.
• •
u A A
a AO
•
•I•
A'Npo •ft
o
•••
.•A*
so
L-l
10
X/P
100
Fig. 2.3-10 Axial Turbulent Intensity Decay behind the 5 x 5
Spacer Grid at Points on the Path 3
-87-

0.1
h* 0.01
0.001
\A.! \
c• ck
o
•
•
V
• • •r=a
A
c
3
-
i.
11
s
• 1
D
• 1
o I
* 1
A j
i
A S A
•
o
o o
A
3oint 7
3oint 8
3oint 9
3oint 10
=>oint 11
Doint 12
Sreenivasan e
J A*\ Q
Ol
•A •
k•
i
i.
10
x/P100
Fig. 2.3-11 Axial Turbulent Intensity Decay behind the 6 x 6
Spacer Grid at Points on the Path 2
- 8 8 -

0.1
0.01
0.001
10
x/P100
Fig. 2.3-12 Horizontal Turbulent Intensity Decay behind
the 6 x 6 Spacer Grid at Points on Path 2
- 8 9 -

Tap 16
130.0
UNIT: mm
Tap1
Tap Number
Fig. 2.3-13 Schematic of the Test Section
for HANARO Fuel Assembly
-90-

PathS
Path A
Fig. 2.3-14 LDV Measuring Paths for 18-Element Fuel Assembly
-91-
t
L/Dh = 2, 7, 14, 23
LVD = 2 , 7, 14,23
L7Dh = 2, 7, 14, 23
L/Dh = 2, 7, 14, 23
L/Dh = -2
Fig. 2.3-15 Axial Measuring Locations for 18-Element
Fuel Assembly
- 9 2 -

Path?Path 6Path 5Path 4Path 3Path 2Pathi
Fig. 2.3-16 LDV Measuring Paths for 36-Element Fuel Assembly
- 9 3 -

Fig. 2.3-17 Developing Axial Velocitiy at Path A
for 18-Element Fuel Assembly (m=12.7 kg/s) Irom Wall, x /R
-94-
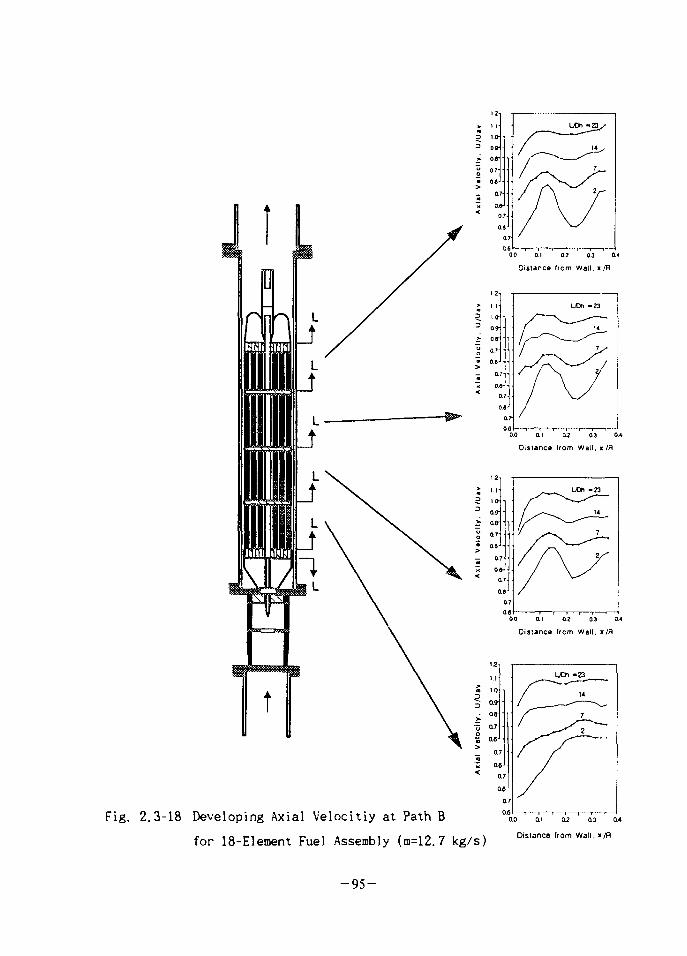
Fig. 2.3-18 Developing Axial Velocitiy at Path B
for 18-Element Fuel Assembly (m=12.7 kg/s)
- 9 5 -
Distance Irom Wall.
CO
o
CD
5-
4 -
3 -
2 -
1 -Mass flow rate = 12.4 kg/s36-element fuel assembly outlet region
0.0 0.1 0.2 0.3 0.4 0.5 0.6 0.7
Distance from Wall [x/R]
0.8 0.9
Fig. 2.3-19 Axial Velocities of Outlet Region
for 36-Element Fuel Assembly (m=12.4 kg/s)
-96-

75*
OQ
IwCO
400
350
300
250
200
150
100
50
0
•ooAffl
©V
-
-
RHS
DP1-2DP2-4DP5-7DP8-10DP11-13DP12-15DP15-16DP1-16
v v
VV
n D n D D D
gSpagaaeJlJM^ JK i utll nVt 1W fvt Ittfr
V
v vV
VV
V
999 990 9
i
_
VV
V_
-
n D
U
9 9 8 9 -
10 15Flow Rate [kg/s]
20
Fig. 2.3-20 Pressure Drop Data for 18-Element Fuel Assembly
-97-

Q
CO
400
350
300
d£ 250Q,2Q 200
150
100
50
0
nooA
a
©
V
DP1-2DP2-4DP5-7DP8-10DP11-13DP12-15DP15-16DP1-16
15
Flow Rate [kg/s]
25
Fig. 2.3-21 Pressure Drop Data for 36-Element Fuel Assembly
-98-

o
L J .
§•oan
a
"8
Q .
BOiZ
- 9 9 -

Fig. 2.4-2 Whole View of RCS Loop Facility
-100-

Fig. 2 .4 -3 Whole View of IRWST
- 1 0 1 -

Sensor
ScanningA/D
Converter(64 Ch.)
VXI bus
MassStorage(SCSI)
VXI Controller
(HP-V382)
Keyboard
Monitor(19")
Printer
Fig. 2.4-4 Data Acquisition System of RCS Loop Facility
- 1 0 2 -

otou.a.oo
DS
V-
oa
enin
O+J
0)
tn
CO
m
Csl
- 1 0 3 -

1.8
1.6
O
1.2
1.0
0.8
0.6
1
oX
p
11
1
(MPa)
8282
1 'Ahin(KJ/Kg)
21081
250 300 350 400 450 500 550 600
-2.Mass Flux (kg/m s)
Fig. 2.4-6 Parametric Trends of CHF with Mass Flux
(Effect of Inlet Subcooling)
-104-

1.8
1.6
1.2
1.0
0.8
o•A
A
X
P (MPa)1.824.055.877.99
12.08
Ahin(KJ/Kg)210210210210210
0.6200 300 400 500
Mass Flux (Kg/m2s)
600
Fig. 2.4-7 Parametric Trends of CHF with Mass Flux(Effect of Pressure)
-105-

LL.Xo
2.00
1.80
1.60
1.40
1.20
1.00
0.80
0.600
1
-o -- D -
—A—
- A -
i ' i
Ahln=210(KJ/KG)
G (Kg/m2s)
300 - x -350 - e -400 - • -450
G (Kg/m
500
550
600
i
2s)
6 8 10
Pressure (MPa)
12 14
Fig. 2.4-8 Effect of Pressure on CHF
-106-

'•- •
Fig. 2.4-9 Steam Vent Line after Accident
-107-

73
o 5o T- '£'V
vvq
T
*~~ i*
o ifc
-a-aoc3
O
coa
o
a,
o
IS £o oa c>. a)
LT5
ao
— 1 0 8 —

III• . : : : !
« ! • • • • • • • . . • : -
_ ; •
QO
| P
ress
o
-Id i
(NO
18
1 PT
7-^
•Io :
» • • . .
1 • t >
1 *
W)
osa303
i/3
3.o
Q>
oso
o
I
in
csino
- 1 0 9 -
IQ)
T3OS
a;C
o
3O
ma
5
O
COu
5,
«fl
I
in
mo
- n o -

0)
CM
H i - . i
• 1 ' : :
. : ' ( . • • ;
j ':•''
d)
oa: cu
JZ
3O
BO
CO
o'Q,
eni
in
- 1 1 1 -

Ill•
JI T
C-207
D
U TC-503
TC-301
if)
I0)-aoso
a3O
C3
<D
ao
a
oi
LT5
CO
BO
- 1 1 2 -
u
a C-1
21
..:
C-3
02
.;
o om
C-1
32
.-•
::i-:'::i:- J"
y 2'
in
-aoa0)
aoenQ
<DJZ
oa«_o
o
S,
LT5
- 1 1 3 -

U5
LOI
-aoe
a,
o
oB
O
CO
o
Q>
m
U,
- 1 1 4 -

1. 7fl.fi.
40 ^ 2 <H*H <£-7-*H <>|*M oj
u} [1]. > y ^ ^ <^^-fe, Marviken
[2] ^ - i - ^ I^*>JI^ f cfl^-^ # , 4 i ^ - ^ ^ ^ojuf Nozzle S f e
Orifice ^ - # 4-§-*H ^r^SlSi-5 .^ . 1980 Vl °1^^1 Leak Before
Break 5} ^-§-•§- ^-S*> JS.^ 7fl^^- |*f<H ^ " ^ ^ Crack # ^f-*l
[3,4].
# ± 50
Geometry
[5].
*H 1993
Loop 1- o|-g-t>
- 1 1 5 -

3. Data Base *\r\.
4
314.
2.
fe- Table 3.1-1
135
7f. Flashing Inception
3.1-1 ^ 1.0 MPa, 169 °C
(Flashing)
of
Flashing
-116-

°1 *13T*T Void Fraction
Void Fraction
ZL^ 3.1-2 ^ ^ o | 3.4 mm oj Al^^-ojl^ # 1.0 MPa
1) 2}S54H7> ^J5 .^ Flashing ^
2) ifh§4S7f H ^ ^ - £ °lAoH S]1^ Flashing £
Flashing *
1 B^fe 4 ^ (^-^ 3.1-1. o] 4^cl al
Flashing o| «J>»J ^ tl^BS. o] 4 ^
^r Flashing o] ^ ^ ^ 6 l ^ ^ ^ ^ 0 ] c f e ^o]c]- (Flashing o|
o.^ 3.1-3 ^ o]e]*>
(L*=Lsat/LT) -i-
0.4 JSL
Flashing
-117-

^ H r Geometry (S l i t ) ^
} ^ (3L% 3.1-3
Stagnation Quality i f ^ ^
L $Xt\. ^ Amos [3], John [4], Sozzi A|- Sutherland [7]
^ L ^ 3 . 1 - 4 -b 2 | ^ o l 3 . 4 mm *]
3L7J7]-
- 1 1 8 -

K ^ 3.Q 3.1-5 ^r 3 3 ° 1 7.1 mm ©1:2.
7]- 100 mm ©!
uf. Geometry
Sozzi [7], Marviken Researcher [2] -§-©1
Uf. ZL5]uf ©}3|7H ©H rfl*> Tg^?>
3.1-6 ^ <U- ©1 1.5 MPa SL JL^Q ^^M *\£. c^S- 4 7 H
i/Z7 7f ti]^*> Type 1 ^ Type 3
^ Type 1 ^ -°-^-©l Type 3 ^ ^ g - f ^ 4 4 ^ ^ ^ r ^ ^ 514.
^ 1/Z? 7} Scaling Parameter efjL < * 1 ^ ^ - ° - «I^©| ^j"# ^r^-
©] ^ i ^ I 4 ^ ^ ^ - # ^ # ^r SlI4. H 5 | 4 Scaling Parameter 7}
(D ^lefe ^ ^ # ° J ^ ^-f ^i^ t}€-<& ^ &±^ L/D 7} ^ # ^ -
- 1 1 9 -

3.^ 3.1-6
^ 20 °C 3] | 5 O ^ 4 ^ ^5 -*U sac>. ° lem ^g*o^ 4 4
Scaling Parameter 7}
^ 1 - ^ 6 J ^ 7 l ^ * H ^ ^ 3.1-6
20 °c $ ^ 3 O ^ 4 ^ U
ZI^ 3.1-7 ofl SA]*}5ii:>. H^ofl>H Sj-o]^- ^ ^ ^ u|-i|
*=C/G,r, Cre/- fe 20 °C # ^
Scaling Parameter efe 4 ^ # ^ C J 4 ^ &t}JL ^ ^ $1^}. ^ 7]t\20 °C # 3 ] ^3o>-^-^ol MS. ^}i£
7]
3. ^XI^IHH^
^ 4 4 ^ 4 ^ ^ 4 5 1 (47*)
120-

*§• 135
3.1-8 ofl SAl^f^uf. H ^ o M j i ^ u}if ^ o | 47* cfl
G* f . - *m^J •^•^i^S. S^ |% ^ $ic]-. Nonlinear Least Square
Curve Fitting ao ^ A S chg-Jf ^ ^ G*
2^ > ( l l + exp[(^r+0.578)/0.188]
fe 20 "C ^ l -o]
^)-°-5 (3)
PO> pb) K, f —: Stagnation Pressure, Back Pressure,
Entry Loss Coefficient, ^ Friction Factor # -2-1 nj*>i:j-. ^ (2) ^>
^ ] - 2.86.3 % o|t:>.
4.
%• 9 ^^"4^1 755 7fl5iuf. ^ ^ 3 : ^ ^ . 5 . <^^^r 0.21 - 17.0
MPa, 3 ] ^ ^ 0.25 - 509 mm, ^^>1^ 0 - 2,335 mm ° M
(Slit, Venturi, Nozzle, Tube, Pipe ^-) #
- 1 2 1 -

3.1-2).
(2) 20 -c
(/)
*1 (3)
3.1-2 9i ZL%! 3.1-9
5.
755 OL
- 1 2 2 -

Air-Water 2^MT-§-
# 3 f c Air-Water
71 Afl ^ojofl <s)sfl
-^-1^. °1 3"*H PDPA (Phase Doppler Particle Analyzer)#
1.
(PWR)^ r e f i l l , reflood
^ ^7} »o^-i- -Tf *}JL alfe 10 CFR 50, Appendix-Kofl tr}s.
reflood rate7} 1 in/sec olAoV<y ^-f-^lfe 7]^S] <>]•%•
data# 713:5. *} ^ ^ ^ AoV^^# 4~§-^ ^r Sl K ^LSJU reflood
rate7} 1 in/sec n]n>6] ^-fofl^. ^ 7 W ^*> h§4^°l 7>-^*fi:]-^
reflood rate7|-
>. reflood rate
Reflood ^ - ^ ^ A - ] ^ <^^3] ^afl-fe quench front
*oH^l^ ^ aI«H4 <£:§-I^f. a ^ £ L ^ post-dryout
^ ^ ECCS5] J L # # 711 *1-
(LOCA) 0 ) ^ 0 ) reflooding
- 1 2 3 -

Reflood eoH annular
data# 1 #£ i3
^Efl7f churn- turbulent *]
reflood -8-S
Reflood ^ f l
mechanistic
7]
SLS. 3.7]}
mecha-
nistic , o]
3.71-fe- entrapment mechanismif
turbulent
churn-
\] 3.711
data#
3.7]
fe ^ ^ ECCS
3.7}
3.7H1
PDPA# <>1-§-*]• o churn-turbulent
^ ^ (droplet)^ 3 7 l #
}jL, quench front
mechanistic post-dryout
37} o\}
-124-

ECCS
2.
-fe- air-water * l ^ * | - b ZL^ 3.2-H
18 mm, Zlo| 0.9
£]<H al^f. =L*& 3.
3.
- 1 2 5 -
ufl churn-turbulent^ #-^-7l 2^^-^ SL^M A 5 A ^ ^ O J?^-^ 3.7]
# PDPA# <>l-g-*H ^ - ^ ^ -
1- ^ * f J L , <^^5] 3.71 #
"^ 0 . 8 5 - 4 kg/m2sec*l
0 . 7 - 3 . 4

. o]
[i l l .
irfl churn-turbulent
fe PDPA
window^
[10]^ 3.^ 5.3-2-4^] u}
a]3 ^ - ^ ^ 1 - b Ar-ion
(fiber drive ^ transmitter),
module),
laser source), ^ -f-Af- -
T"(receiver ^ receiving
(data management
system) ^SLS, ^§$°] $1^}. ^ <&•=?-§: ^ | * H ^ 3.2-4^1 M-E^
^: transmitter^- ^-^*f7i] ^|4*)-$5l^K °l t ransmit ter^ 4080
^ ] l l - 7HJL £ U , -^ UJ^ J 2 . ^ f 4 ^ ^ 0.5° o|t^p e f l^#
«1 3 ] ^ ^ 2, 5, 10 mm . ^ ^ 1 ^ Sd f. <>1
transmitter^ ^-^r*}7fl ^14°1 ^ H SI<H>H ^ - ^ - f - ^ l ^ transmitter^}-
<>1«HI ^ 1 ^ t&SAJr 7^e|fe 1 mo]z\. receiver^
a 3.2-iofl
4.
- 1 2 6 -
^: Cheng/Teller [12], Teller/Rood [13]
^ 4 l ^ H £ 71^1^ 51**1 (jg < 1 m/sec)
Jg = 3.4
^ 7 } ufEfuf
, Cheng/Teller [12], Teller/Rood [13]^
<q*u
Kocamustafaogullari^ [14], Bartak-^ [15]^
o)§ 71 #
71
-127-

Air-Water
1. 7H
- Flooding^
Flooding
Silt:}.
2. ^7l * U e £ ^^7l(Parallel - Wire Conductance
Probe)
-128-

(^fl})| % M £Ur ^ ^ ^ ^ ^ 1 ^ ^ AC
Carrier signal°] ^*] 1- 3g-f <H^ ^r^Wl £^*}4 * H ^t>
Impedemce A ^ ^ r 7] 1 4sl-*|7fl ^C>. o|nj| q - ^ ^ Conductance^
_ n y h1 In dlr
conductance between wires
constant
conductivity
liquid height
distance between wires
wire radius.
Tension Screw# ol-g-*H
4.
^ 0.2
0.8mm
-129-

3.3-l H
*l*)-&-^, Wave*]
- - 15 mm
3.
L J 3.3-3<Hl U ^ F ai4. -y^^ l -b Testsection, # g-g-TJI f-, ^-7] ^-^•^^-^•^.S. -^A^cf. Test section^
£°1 4m,Tapo]
^71 (Parallel-Wire Conductance Probe)7}
Test SectionoflA-1
2L<>\] H P ^ M:-& 7 f ^ ^ J E JS.&1 ^xtofl o|*l| Test Section^.
^ -fr^€- ^ i l ^ Rotar Meter^ ^-^^cf. §*1 l - ^ * > ^ # ) ^
J2.e># ij4iS|-*l-a 3-<y# -^-^ i^i- i- ^^-^1^17|^*H Honeycomb^
Water Vessel^] ^^l*F^uf. ^-7l-b ^6o^7]^-^-^l<H) 1/2"
^-^ , Rota MeterS - ^ ^ ^ ^ ^ • i t
Fine Mesh# Test Section
Full Scale©] 19.99 mm H20^1 Micromanometer# o|
-130-

-8"*H ^ W & a , ^-71-1- 7 ^ ) ^ Wave Field#
Qusi-Steady State ^ #*}*1 ^ ^ -8-£
1 - ^ ^ - 3 o i : ^ ^ | ^ 0.0004-0.0204
), E}] g f 0 - 6
4. ^ ^ ^ ^ f
0.0004 m/s(
3.3-4(a)S| ^ o | si-jLi}
^ Pebbly Wave ^Efl7} ^EfufTi] ^u]-. o|
1 ^ 7 } A 1 ^ ] ^ z i ^ 3.3-4(b)ij- ^ ^ 2 ^ ^ Wave
2^>^ WaveS. 3>JL, 4 ^ ^ ^ 4 ^ ^ ° 1 ^ ^
Wave l ^ - ^ ^ 2^}^ WaveA}o]ofl n^^- 3]-^- Wave#o]
l- - f ^ x ] ^ ^ . Wave
Wave
>JL Wave*] ^ f ^-jfAl^u}. (a^J 3.3-4(c)).
Wave#ol ^ .^ .Aj^^g. a i^*Ml 51 n|, o|s]*> Wave
7}«H1 tt}e} 7JI4j^.^|5|i:}7} ^ ^ - Flooding < <H]
3.3-4(e)). Flooding^ ^ j s | ^ . «.^j c^o] s ^ ^g] U}7W ^ - ^ nfl
- 1 3 1 -

# , Water Vessel£] ^$7} ^-7}t>}7] *]*% * f e
3 .3 -5^ Power Spectrum^
oebbly £ 24^1 ^1^4 <g^6fl^fe uf^-^ Peak^o]
Peak# i o l J L £ 1 ^ 1 <>l-b ^ - T - ^ - ^ Tfl^sfl-o] Dominant
^ - A ^ SGF(Spatial Growth Factor)# ^f-*H ^
J > ^ ^ ^ > f e l l j f f . ZL^I 3 .3 -6
SGF1- ^-7] ^ ^ ^ H l
o] P e b b l y < g ^ o f l ^ ^ .
Pebbly Wave#o|
g ^ l ^ f ^ # ^ f ) ^ SGF
] ^ Conductance Probe ^
- 1 3 2 -

X-Ray Densitometer System
7l-«}
711
(void fraction)
pattern) -o]
^ " ^ ( s i n g l e - p h a s e flow)*]
4
o]
/ = 70exp[-^L ]
, Ife 44
cient)olcf.
4 4 ig, ii
X
(1)
^s.(intensity)ol^p L^
inear absorption coeffi-
-133-

cti £
(chordal density)#
(chordal void fraction).^. ^^A|7l
^ ^ ] d ^-«., HelJL photon
1 # ^ ^ photono]
°lfe collimator# 7 ^ ^ A
JSt f- ionization chamber^.
, collimationo]
oi
^ . 4 , photon^^l ^^^(monochromaticityH-f-, ^if^^Cbeam har-
dening)^^]
photo-electric JL 2f, pair-production SE.^- compton
<*HuHphoton^
-134-

(collimated beam)
DR (Digital Radiography) S.^ CT (Computerized Tomography)
2.
^ S 91 71S
BIR4(nl^)«J ACTIS-200VF £ ^ Digital Radio
graphy System^ ^ A 7 l 7 l #
X-
3.7]-^ 3*1*] sch. 160^1 i
-135-

X-id ^ £ detector, ZLEU O]
n}Jffi Sfl -g-o) 1H*1 & i ^ ^ £ ^ 1 , ^JL^-^i [17]^ n ^ 5.4-4
1250X2200X1620 mm*] ^ ^ © ] #
3.5mm^ u f l i l S ^ ( ^ ^ : s teel)^ .S. -?-^Sl<H 5 1 ^ - ^ , X->id
. Window g l a s s ( ^ ^ : l ead)# ^f
r Auto power-OFF 7]-^ofl ^Sfl X-^.3] power7> ONS] 1 ?>^tf.
[ 1 7 H ^Afl*l 7]
3.
i 713EJE.^71 (void simulator)
713ES.517]^^ ZL^ 3.4-1 ^
ZL^ 3.4-2ofl
- 1 3 6 -

5L517],
sch. 160 ^ 1 * 1 3 1 ^ «11 :(ZL^ 3.4-2
. H-% 3.4-3(a),(b),(c),(dH L-}Efuf ^ K
-Q 3.4-3(a),(c)ofl>H ^ ^ # ^r $1^ y>^} ^°1 post-collimator
3.4-4 ^ J
l t photono]
detector^ ^ 1 ^ ^ S . * | a ^ * f e ^ ^ - ^ . S . ^ , collima-
. ^ ^>fiM7f nfl-f 7 | | ^ ^ # ^ ^ Sit}.
3.4-3(a),(b),(c)>(d)^l
5 ^ RDT
1.
#^I 3,
(pressurizer) ^-f^l ^ ^ l ^ ^ $1^- ^^i^-^Ksafety valve)7\
tifl^^aL(RDT : Reactor Drain Tank)^
- 1 3 7 -
SLI*, RDTi} ^
uj- 4-g-sj
3,4 3171
RDTufl
RDT
RDT5]
7l 7}
-§ -^^A O 1- ( D CC : Direct Contact Condensa t ion)^ BWR
suppression pool ) i f PWR5] ^ Z | 4 u J | ^ E | 3 . (RDT
SDT)
A}7) (steam sparger)7f
- 1 3 8 -

ZL
^3.(quenching tank)ufl
jet7f
71 je t *HJ*fJL.
j e t
RDT
irfef
- 1 3 9 -

RDT5]
2.
generator), -§- -E<§3.( quench ing tank)
steam supply line) £
lm,
supply line), Hfl
^7Jl(PT_transmitter)
^ S 3.5-lofl
indicator)!- ^
^711H7] (steam
steam sparger),
water
transmitter), <£
T/C)
-140-

-b HU 3.5-lofl
5mm, 7mm, 10mm, 15mm,
20mmH a l ^ 7}% ^ ^ ^ ^tflo] i i # #
ABB-Atom ^ * ] ^ 4 7 1 , T-% ^A>7l, YGN-RDT
7} jet g 3 . ^^1 -
window# ^^l*]-^., ^L^- video#*l 3E^ 4^ l7 ]# ol-§-*fo^ 7}
7^7)7]S-^-^ ^ # ^ 1 ^151^ DT-2839 A/D converter (16DI/
32SE)# main boards. 4-g-*)\2. DT-2896 channel expander(48DI/96SE)
^ ^ * H 27 channel
. A/D converter*] «^^
4r nm 3.5-2,3^} ^JL 4 ^ 4 1 ^-^7171^1 ^^^;7Jl^ a 3. 5-2ofl
3. -n-BoM| J^-^ ( Vortex Flowmeter Calibration )
- 1 4 1 -

initial watermass
mDt
final watermass
overflowedwater mass
vortex flowmeter)^ ^
^ ( c o n s t a n t volume method)^- 4-g-*H
a ^ 3.5-1^] Drain Line-B)
m = A (1)
- 1 4 2 -

/TT : time span
M0Ver : overflowed water mass
V : volume of water
p, : initial water density
Pt '• final water density
l e v e l H H f l ^ f ^ } ^ ^ ] 1 ^ f
Z L ^ J 3 . 5 - 4
23.6°C
(997.47kg/m3)^.
3.5-5 1 -1 # r Sl -o] cH- §: ^f^.^ i^^^S-f-^ 5*^
4.
je t ^ ZL ^ -
window# ^*j*l-JLf J L ^ video^^l J £ ^ 4
- 1 4 3 -

*!7l# °l-8-*H 7llight sheet Sfe lamp#
laser
] B) ife ii#
l 5mm,
60 kg/hr^f 30kg/hr
3.5-6CH1 ^ E
5. "^71
a 3.5-5OH
- 1 4 4 -

1. E. Elias and G.S. Lei louche, "Two Phase Critical Flow", Int. J.Multiphase Flow Vol. 20, Suppl., 1994.
2. "The MARVIKEN Full Scale Critical Flow Tests", NUREG/CR-2671,MXC-301, 1982.
3. C.N. Amos and V.E. Schrock, "Two Phase Critical Flow in Slits",Nucl. Sci. Engng., Vol. 88, 1984.
4. H. John et al., "Critical Two Phase Flow through Rough Slits",Int. J. Multiphase Flow, Vol. 14, No. 2, 1988.
5. I. Brittain et al., "Critical Flow Modelling in NuclearSafety", OECD, Nuclear Energy Agency, Paris 1982.
6. %&7] ^1, "Hot Test Loop ^ x i r ^ " , KAERI/MR-268/95, 1996.
7. G.L. Sozzi and W.A. Sutherland, "Critical Flow of Saturated andSubcooled Water at High Pressure", NEDO-13428, 1975.
8. 10 CFR part 50, "Domestic Licensing of Production andUtilization Facilities".
9. G. Kocamustafaogullari, G. De Jarlais and M. Ishii, "DropletGeneration During Core Reflood", Trans. ANS, Vol.45,pp.804-805,1983.
10. J-g-7] £j, "Hot Test Loop A ] ^ •£<£", KAERI/MR-268/95, 1996. 1.
11. Bachalo, W., "Methods for measuring the size and velocity ofspheres by dual-beam light scatter interferometry", AppliedOptics, Vol. 19, No. 3, 1980.
12. Cheng, S.I. and Teller, A.J., "Free entrainment behavior insieve trays", AIChE J. , Vol. 7, pp. 282-287, 1961.
13. Teller, A.J. and Rood, R.E., "Coalescence and entrainment:
-145-

phenomena on sieve trays", AIChE J. , Vol. 8, pp. 369-372,
1961.
14. Kocamustafaogullari, G., DeJarlais, G. and Ishii, M., "Dropletgeneration during core reflood", Trans. ANS, Vol. 45, pp.804-805, 1983.
15. Bartak.J., Janicot.A. and Haapalehto, T.,"Recent developmentsin reflood modelling with CATHARE", Proc. Int. Conf. on NewTrends in Nuclear System Thermohydraulics, Pisa, Italy, Vol.1,pp. 297-310, 1994.
16. J. E. Koskie et al., "Parallel-Wire probes for measurement ofThick Liquid Films", Int. J. Multiphase Flow, 15, 521, 1989.
17. ^ ^ T 7 ] 9], "Hot Test Loop Aj^^r^", KAERI/MR-268/95, 1995.
18. ^ 7 1 $], "RDTufli) ^ ^ r ^ ^ ( D " , KAERI/TR-576/95,1995.
19. ^ g * ] , " ^^ 1 ^ - , KAIST, 1996.
-146-

Table 3.1-1 Test Matrix
TestSectionType 1Type 2Type 3Type 4
Diameter(mm)3.47.17.157.15
Length(mm)100100200400
L/D
29.414.128.055.9
Pressure(MPa)
0.5 - 2.00.5 - 1.50.5 - 2.01.0 - 1.5
Subcooling( °c)
0 - 1900 - 1830 - 1900 - 183
Table 3.1-2 Comparion of Selected Critical Flow data and thePresent Model
Experiment
Amos et al.
John et a l .
Celata et
al .Jeandey et
al.
Sozzi et
a l .
Reocreux et
al .
Powel1
Marviken
Pressure(MPa)
4.1-16.2
4.0-14.0
0.8-2.3
2.0-12.0
3.3-6.9
0.21-0.34
4.2-17.0
4.0-5.0
Hydrau1i cDiameter
(mm)
0.25-0.76
0.41-1.28
4.6
20.13
12.7
20
11.1
200-509
FlowLength
(mm)
63.5
46.0
46-1,380
363
0-1,778
2,335
-
166-1,589
So.of
Data
72
57
60
88
210
39
41
53
Mean(SO
-4.4
2.5
-3.2
-2.4
-0.2
-3.6
3.3
1.4
StandardDeviation
(*)
10.4
9.9
6.0
6.8
11.0
6.8
7.3
5.2
Remarks
S l i t
Down FlowSl i t
Down Flow
Pipe
Down Flow
Pipe
Lp Flow
TransientPipe, Nozzle
Horizontal
Pipe
Up Flow
Converger -
Dyverger
TransientPipe
Down Flow
-147-

Table 3.2-1 Typical parameters used in the experiments
Parameter
Velocity SetupHigh Voltage (V)Frequency Shift (MHz)DC Offset (mV)Mixer Frequency (MHz)Low Pass (MHz)Burst FilterThreshold (mV)Envel Filter (uS)Peak Detection=#= of SamplesSampling RateMin S/N RatioDiameter SetupSlope 63Refractive IndexAvailable Range(Transmitter)Collimating LensBeam SeparationsTransmitting Lens(Receiver)Collecting LensFocus LensApertureDetSep A B (0!_2)DetSep A-C (0i_3)
Description
channel 16 9 9
4 0
14.439.93
0 . 5
40 MHz BP10.0
3
O n1 2 8
1.25 MHz0 . 3
channel 26 9 9
4 0
40.339.915
0 . 5
40 MHz BP3 . 0
3O n
1 2 8
2.5 MHz0 . 3
0.4310 Reflection1.333
18.9 - 6217.4(ch 1)
235.004080
(ch2)2
35.004080
500 mm175 mm150 um
10.88 mm30.69 mm
-148-

Table 3.4-1. Test Matrix for the Performance Test
of X-Ray Densitometer System)
No.
1
2
3
4
5
6
7
Test
Case
VS-B
VS-AC
VS-AE
VS-IAC
VS-IAE
AWS
AWA
Test
section
SUS 3"sch.160
SUS 3"sch.160
SUS 3"sch 160
SUS 3"sch. 160
Acryle
Void
Simulator
Rods(13 ea)
TaperedHole
TaperedPlug
Air-WaterMixtures
Air-WaterMixtures
Piece
Arrangements
Var i ab1e
Concentric
Eccentric
Concentric
Eccentric
Randomdistributionof bubbles
SimulatedFlow
Pattern
Bubbly
Annu1ar
InvertedAnnular
Bubblyor Slug
VoidFractionRange
0 -0.18
0.2 -0.54
0.44 -0.86
File Name
VS-B-NC,VS-B-C1.C2.C3
VS-AC-Cl
VS-IAC-NC,VS-IAC-C1.C2.C3
VS-IAE-C1.C2.C3
AWS-l
AWA-1
VS • Void simulator, B : Bubbly, AC : Annular-Concentric,AE : Annular-Eccentric,IAC : Inveterd Annular-Concentric,
IAE : Inverted Annular-Eccentric, AWS : Air-Water in SUS pipe,AWA : Air-Water in Acryle pipe, NC : No Collimator, C : Collimator
- 1 4 9 -

Table 3.5-1 Technical Specification of the Steam Flow Meter
o Flow meter : 0VAL4, SSg. VAW1025-D2D1-2111
- Size : 25A JIS 20K Wafer type
- Flow : 45 ~ 721 kg/hr at 10 kg/cm2
- Output : Current or pulse
o Press. Transmitter : OVAL^K 3.^ AMD200
- Range : 0 ~ 15 kg/cm2 (Output : 4 ~ 20 mAdc)
- Power : 24 Vdc
o Temperature Sensor •' OMEGA^f, Thermocouple
- Type : T/C K-type
o Flow computer : OVAL*}, JEC| FC500
- Input : Flow (current or pulse)
Temperature (T/C K-type),
Pressure (4 ~ 20 mA)
- Output : 4 ~ 20 mA
-150-

Table 3.5-2 Instrumentations and DAS for RDT TestDAS11
Channel
00
01
02
03
04
0506
07
08
09
10
11
12
13
14
15
16
17
18
19
20
21
22
23
24
25
26
27
28
29
30
Sensor
NamePT-1
PT-2
rr-3LT-1
FT-1
-
-
-
TC-1
TC-2
TC-3
TC-4
TC-5
TC-6
TC-7
TC-8
TC-9
TC-10
TC-11
TC-12
TC-13
TC-14
TC-15
TC-16
-
DPT-1
DPT-2
DPT-3
DPT-4
DPT-5
DPT-6
ModelAMD-200
Rosemount••
"
OVAL
OMEGA (6.35mm)
"
"
WATLOW (4.8mm)
OMEGA (6.35mm)
WATLOW (1.6mm)
"
"
"
"
"
"
PCB-112A2"
"
Druck-PDCR922
PCB-112M247
LocationFM -'
Nozzle exit
Tank
"
FM-1 (25mm)
Pool water
"
Nozzle exit(Steam)
FM-1
Nozzle exit(water)
Steam Jet"
"
"
"
"
"
Tank wall
"
Nozzle exit
Range10 kg/cm"
10 kg/cm'
5 kg/cm"
1 m-HjO
0.72 ton/hr
0 ~ 500 'C
"
"
"
"
"
"
50 psi
"
"
"
1 bar
100 osi
Signal
1~5 V
"
"
(T10V
"
"
"
"
"
"
"
"
"
0~5V
"
"
"
0~10V
0~5V
Remarks
Vortex meter
Dual, indicator
Dual, indicator
Jet center
S/N : 14212
S/N : 14211
S/N : 14210
S/N : 14214
S/N : 718318
S/N :
* Note : 1) DAS : DT-2839 with DT-2896 (Diff. Input, Bipolar, 10V)
2) FM : Flow Meter (Vortex type for steam flow)
Table 3.5-3 Technical Specification of the Digital Balanceo Model : JR-30000D, PRECISA
o Capacity : 31 kg
o Resolution : 0.1 g
- 1 5 1 -

Table 3.5-4 Experimental Data for Flowmeter Calibration (1/4)
NO.
1
2
3
4
5
6
7
8
9
10
11
12
13
14
15
16
17
18
19
20
21
22
23
24
25
26
27
Q(flowmeter)
[volt]
2.76
2.03
2.31
1.72
2.65
2.38
2.40
2.57
2.32
1.44
2.15
2.72
2.21
1.85
2.67
2.62
1.83
1.61
1.71
1.80
1.87
1.93
1.98
2.05
1.70
2.22
2.34
T(initial)
[degree C]
13.08
21.19
14.65
28.75
20.45
16.80
20.67
20.49
16.23
21.24
25.49
22.54
23.09
25.11
14.80
17.16
18.26
33.12
16.70
29.79
17.15
22.56
31.28
39.32
14.81
25.62
22.39
T(final)
Idegree C]
46.82
41.60
42.21
42.40
49.74
46.83
46.33
50.96
42.63
30.99
50.82
50.21
50.64
43.19
47.90
47.03
33.36
44.42
30.11
45.52
22.64
31.59
39.65
46.67
25.82
44.96
43.75
Time
[sec]
644.90
664.97
710.41
648.03
583.40
727.95
613.08
644.16
673.34
733.24
734.81
520.91
757.51
704.57
668.66
568.05
603.05
624.82
601.35
659.07
197.53
306.18
276.58
221.57
520.97
522.06
525.02
Overflowed
water mass [kg]
69.25
42.01
Remark
55.94!
28.25
61.88
62.53
53.70
64.24
55.14
19.39
54.01
58.48
58.07
37.48
70.30
62.05
31.17
24.51
25.77
33.13
10.13
17.64
16.76
14.70
20.60!
41.47
44.26
- 1 5 2 -

Table 3.5-4 Experimental Data for Flowmeter Calibration (2/4)
No.
28
29
30
31
32
33
34
35
36
37
38
39
40
41
42
43
44
45
46
47
48
49
50
51
52
53
54
Q(flowmeter)
[volt]
2.60
1.82
1.72
1.48
1.52
1.60
1.63
1.97
1.86
2.03
1.97
1.66
1.72
1.97
1.49
2.47
2.46
2.20
2.42
2.28
2.09
2.14
1.74
1.43
2.01
2.02
2.26
T(initial)
[degree C]
24.98
17.87
23.55
28.85
33.56
37.88
43.09
17.13
26.83
35.24
43.20
14.22
20.52
27.57
38.51
28.32
26.35
27.90
25.41
13.46
28.78
37.45
22.24
30.31
36.07
14.08
25.69
T(final)
[degree C]
52.06
23.61
29.01
33.78
38.24
42.80
51.32
25.35
34.39
43.57
51.81
20.58
27.64
38.87
42.84
50.70
45.73
47.16
47.46
28.97
37.69
46.19
28.38
36.35
44.15
25.79
41.13
Time
[sec]
556.46
224.02
243.52
338.16
285.02
254.12
456.55
249.32
279.39
266.60
290.31
317.02
324.84
386.91
285.21
493.89
433.87
526.80
498.29
404.93
260.25
245.66
267.36
465.25
261.32
372.57
404.52
Overflowed
water mass [kg]
55.63
10.19
10.30
9.98
9.82
10.10
17.92
15.91
14.98
17.05
18.73
12.03
14.56
23.53
8.82
48.17
40.73
39.21
46.98
31.14
18.74
18.86
12.19
11.90
17.10
22.44
32.09
Remark
-153-
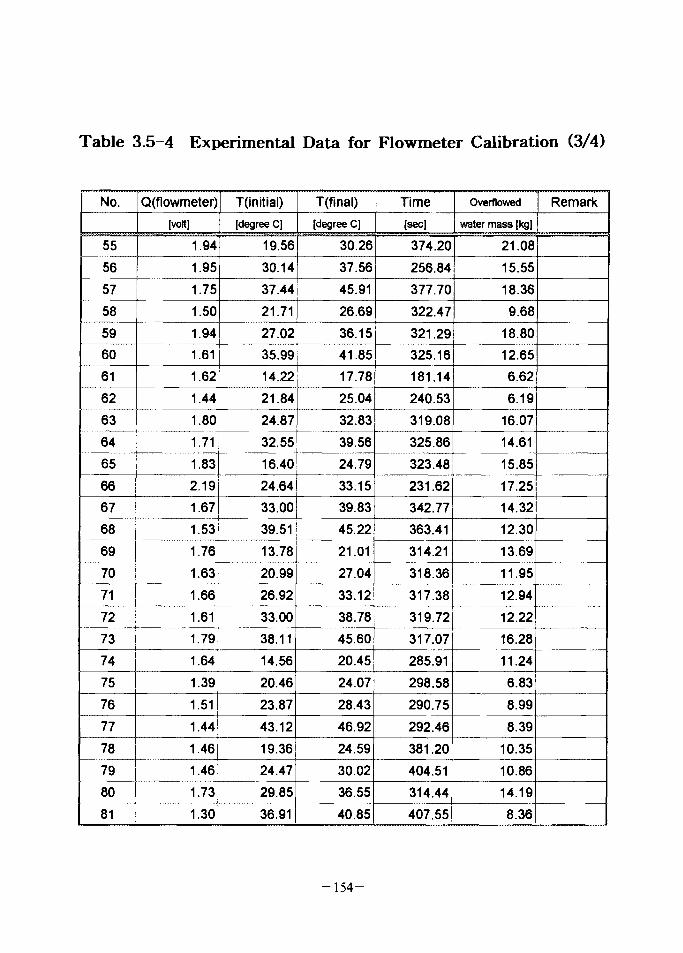
Table 3.5-4 Experimental Data for Flowmeter Calibration (3/4)
No.
55
56
57
58
59
60
61
62
63
64
65
66
67
68
69
70
71
72
73
74
75
76
77
78
79
80
81
Q (flowmeter)
[volt]
1.94
1.95
1.75
1.50
1.94
1.61
1.62
1.44
1.80
1.71
1.83
2.19
1.67
1.53
1.76
1.63
1.66
1.61
1.79
1.64
1.39
1.51
1.44
1.46
1.46
1.73
1.30
T(initial)
[degree C]
19.56
30.14
37.44
21.71
27.02
35.99
14.22
21.84
24.87
32.55
16.40
24.64
33.00
39.51
13.78
20.99
26.92
33.00
38.11
14.56
20.46
23.87
43.12
19.36
24.47
29.85
36.91
T(fmal)
[degree C]
30.26
37.56
45.91
26.69
36.15
41.85
17.78
25.04
32.83
39.56
24.79
33.15
39.83
45.22
21.01
27.04
33.12
38.78
45.60
20.45
24.07
28.43
46.92
24.59
30.02
36.55
40.85
Time
[sec]
374.20
256.84
377.70
322.47
321.29
325.16
181.14
240.53
319.08
325.86
323.48
231.62
342.77
363.41
314.21
318.36
317.38
319.72
317.07
285.91
298.58
290.75
292.46
381.20
404.51
314.44
407.55
Overflowed
water mass [kg]
21.08
15.55
18.36
9.68
18.80
12.65
6.62
6.19
16.07
14.61
15.85
17.25
14.32
12.30
13.69
11.95
12.94
12.22
16.28
11.24
6.83
8.99
8.39
10.35
10.86
14.19
8.36
Remark
- 1 5 4 -

Table 3.5-4 Experimental Data for Flowmeter Calibration (4/4)
No.
82
83
84
85
86
87
88
89
9091
Q(flowmeter)
[volt]
1.47
1.41
1.42
1.42
1.38
1.37
1.37
1.33
1.341.47
T(initial)
[degree C]
17.59
22.85
27.50
31.47
38.88
14.11
17.96
21.79
25.52
28.68
T(fmal)
[degree C]
22.88
27.54
31.60
35.37
42.95
17.96
21.86
25.56
28.70
32.86
Time
[sec]
375.20
381.06
337.20
311.20
369.16
338.42
338.81
369.42
304.44307.20
Overflowed Remark
water mass [kg]
10.24
9.60
8.73
8.14
9.20
7.34
7.31
7.56
6.48
8.90
- 1 5 5 -

Table 3.5-5 Test Matrix for Phase-I
Case
Case
Case
Case
Case
Case
NO.
5-1
5-2
5-3
5-4
5-5
7-1
7-2
7-3
7-4
7-5
10-110-210-310-410-515-115-215-315-415-520-120-220-320-420-5
Experimental ParameterNozzle Exit
dia. [mm]
5555577777101010101015151515152020202020
Mass Flux
[kg/m2sec]
MAX.
11321004920870
MAX.920870600460
MAX.600460350250
MAX.350250200150
MAX.250200150110
Mass Flow Rate[kg/sec]
MAX.
0.0220.0190.0180.017MAX.0.0360.0340.0240.018MAX.0.0490.0370.0280.020MAX.0.0660.0470.0380.028MAX.0.0790.0630.0470.035
Measuring Parameter
1. Axial Temp.
Distr ibution at the
Pool Temp. 20, 40,
60, 80°C
2. Je t Shape at the
Pool Temp. 20, 30,
40, 50, 60, 70, 80°C
3. Tank Wall
Pressure Transient at
the Pool Temp. 20,
30, 40, 50, 60, 70,
80°C
-156-

03CL
C/5CO
1.2
1.0
0.8
0.6
0.4
0.2
0.0
Inlet
Inception of Flashing
Test
PP -
T.AT
DL
Conditions:
1.015 MPa0.781 MPa
169.4 °C
11.1 "C3.4 mm100 mm
Exit
0 20 40 60 80 100
Distance from the Pipe Inlet (mm)
Fig. 3.1-1 Measured Pressure Variations and the Location of Flashing Inceptionwithin a Pipe for Subcooled Two-Phase Flow Test
- 1 5 7 -

2.0
1.8
1.6
1.4
S. 12
COCO
2CL
0.8
0.6
0.4
0.2
0.0
Test Conditions:
Symbol
•
D
•
O
A
AT«, CO
0261120306077
T.CC)
180178174169160150120103
• •
Inlet Exit.
A A A
• • •
0 20 40 60 80 100
Distance from the Pipe Inlet (mm)
Fig. 3.1-2 Measured Pressure Profiles along the Test Section for VariousInitial Subcooling of the Water (Test Section No. 1)
- 1 5 8 -

(DO
31obCOCO
JDcgCO
c0)
1.0
0.8
0.6
0.4
0.2
0.0
c
D D* DD
DD
D
AD
DD• A
a a DDD
A
aOD
DD D
ADD
DD D
D
- D *
D
A
Dcm
D
aD
1 • 1
• " /Exit
Symbol Data Source
* Present Worka Amos et al. [43]
Inlet
/
/
l . l . l .
0.0 0.1 0.2 0.3 0.4 0.5 0.6
D i m e n s i o n l e s s S u b c o o l i n g ( A T * )
Fig. 3.1-3 Dimensionless Distance from the Pipe Inlet to the Location of SaturationPressure versus Dimensionless Subcooling
- 1 5 9 -

80000
60000 -
CMCO
40000 -
COCO
20000 -
T
A A
—
• •
•
•
•
1
Test Conditions:
Po
(MPa)
0.51.01.52.0
•
* A
A W
A
* A
••
•• •
•
••
••
> • I
PresentData
•
•A
A
A
• *
• A
• 1
50 100 150 200
Stagnation Temperature (°C)
250
Fig. 3.1-4 Mass Flux versus Stagnation Temperature for Four Different StagnationPressures Obtained at Test Section No. 1 (D = 3.4 mm, L = 100 mm)
- 1 6 0 -

COCM
X
2LL.05COCO
uuuuu
40000
20000
n
A
O
•
•
-
•
o
1 ,
A
O
•
1
Test Conditions:
Po
(MPa)
0.51.01.5
A
AO
A
AO
8
" o
•
o•
• o•••
PresentData
•0
A
A
A
A
50 100 150 200
Stagnation Temperature (°C)
250
Fig. 3.1-5 Mass Flux versus Stagnation Temperature for Three Different StagnationPressures Obtained at Test Section No. 2
- 1 6 1 -

50000
40000
COI
XJ2LL.
30000
20000
10000
P =1.5MPa
^ AV
V A
O V *
o •
Test Conditions:
Symbol
•A
V
o
No.
1234
Test Section
D (mm)
3.47.1
7.157.15
L (mm)
100100200400
8
50 100 150 200
Stagnation Temperature (°C)
250
Fig. 3.1-6 Effects of Tube Size on Subcooled Critical Two-Phase Flow Rates
- 1 6 2 -

1.2
1.0 -
x3
COCO05
CO
co
coCO
Q
0.8 -
0.6 -
0.4 -
0.2
- *
Symbol
_ •
A
T
1
•
V
Test SectionNo.
1234
AU
V
i
1
Po=1.5MPa
•
A
Am
50 100 150 200 250
Stagnation Temperature (°C)
Fig. 3.1-7 Temperature Dependence of Mass Flux in Different Size Tubes
- 1 6 3 -

1.2
COCO
COCO
2CO
Q
1.0
0.8 -
0.6 -
0.4
0.2 -
0.0
• / ' \
J v Eq. (5.1.2)
mJ>v
Iffl Test Conditions:
[v Symbol
•
A
O
1 . | . |
Test Section
No.
1
2
3
4
j
D(mm)
3.4
7.1
7.15
7.15
1
L (mm)
100
100
200
400
1 .
0.0 0.2 0.4 0.6 0.8 1.0
Dimensionless Subcooling (AT)
1.2
Fig. 3.1-8 Nonlinear Least Square Curve Fitting for Present Data
- 1 6 4 -

160000
CO120000
X3LLCOCO05
"-a
80000 -
40000 -
0
Symbol Data Source
• Amos et. al.John et. al.Celata et. al.
» Jeandey et. al.Sozzi et. al.
• Reocreux• Powell
MarvikenPresent Work
a. / j
A/ A"""
+ 10% /
JV/
1
/ /
-10%
1
40000 80000 120000
Measured Mass Flux (kg/m -s)
160000
Fig. 3.1-9 Model Predictions and Measured Data (755 Data)
- 1 6 5 -

Feed Water [Xj—«
Bypass »-
H/X
Transmitter
from laser source
BubbleGenerator
Bypass
Receiver
Test Section
1
Rotameter
FromCentral AirSupply Sys.
Fig. 3.2-1 Schematic diagram of the air-water loop
- 1 6 6 -

Fig. 3.2-2 Photography of the arrangements of the test section
and optical components
- 1 6 7 -

Fig. 3.2-3 Photography of the test section before assembling
- 1 6 8 -

COLLIHATING HQOUiWOFLEXURE
Fig. 3.2-4 Schematic of the transmitter for PDPA system
- 1 6 9 -

MTA ACQUISITION
366 - r
V
!l miI I 1
Arittet ic ftean (DIB) = 656.8 mArea &in (520) = 715.5 o
Volugs Hsan (D30) = 772.3 mSauter &an (D32) = 899.8 m
Proks A m = 1.4&E-3 ca2t t e k r Density s 6.5BE+1 /ccVol. Flow Kate = 1.42E-3 cc/sUoluse Flux = 9.71E-1 cc/s/r.^2
Transit Tisses FVC i Transit ND
590 19S0 151(1Diat&ttr KK
II Valid||X Ualid||Correct«dIIRun TiEse
285674860.54 see
CHI Velocity E^an «-2.B27 M/S-- 8.534 i/s
-3.95 -2.13 -i.25 -S.3II «.5BVelocity 1 H/S
— — —— C:\..\JH5\TPF\SUNi5
Fig. 3.2-5 Example of the measured droplet size distribution
- 1 7 0 -

2000
1800
1600
1400
jjj 1200
E.5 1000
c(0<D 8 0 0L.
0)
5(010
600
400
200
l \
A
Chum-turbuten
Transit on
AA
A : Present experiment• : Cheng and Tellerfl : Teller and Rood
Annular
0.0 0.5 1.0 1.5 2.0 2.5 3.0
Superficial gas velocity (m/s)
t
3.5 4.0
Fig. 3.2-6 Variation of the droplet size with superficialair velocity
- 1 7 1 -

10"2
0
c(00)
raHi
KT1
0
00 8
0 : Present experiments: Kocamustafaogullari ef al.: Bartak et ai.
2 4 6 8
Superficial gas velocity (m/s)
10
Fig. 3.2-7 Comparison of the measured data withthe prediction by other correlations
- 1 7 2 -
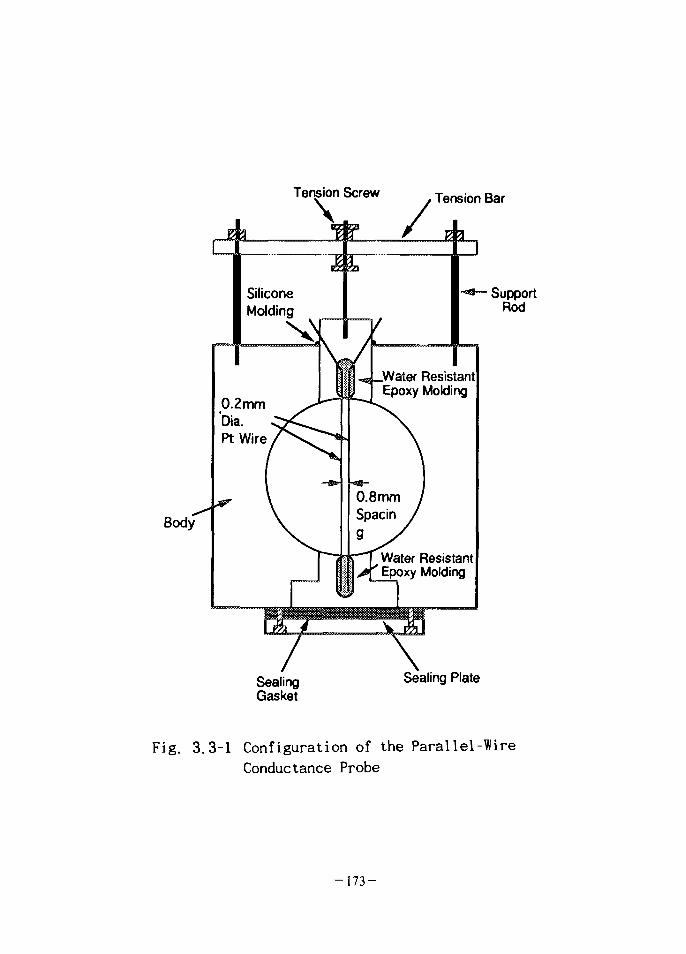
Tension Screw
3.
Body
SiliconeMolding
0.2 mmDia.Pt Wire
t Tension Bar
_Water ResistantEpoxy Molding
SupportRod
Water Resistant" Epoxy Molding
/ \SealingGasket
Sealing Plate
Fig. 3.3-1 Configuration of the Parallel-Wire
Conductance Probe
- 1 7 3 -

A
< Cs!
Isu. ZUJ UJ
O
W)
CO
o
CO
o
CO
I
enCO
- 1 7 4 -

£Ji<22 2Q-H ••Q.Q.O,
—j
CO
u
<c
CO
o
N
O
SCO
o
COI
CO
CO
- 1 7 5 -

0 0.25 0.5 0.73 1 »_2S 1.3 1.75
0 0.25 OS 0.75 I 1.23 1.5 1.75
0 0.25 0J 0.75 1 IJ5 U 1.71
0 0J5 0J 0.75 1 1.23 1.1 1.75 2
0 0.25 0.3 0.75 1 US 1.5 175 2
TIMEfsl
Fig. 3.3-4 Typical Time Recordings of Interface(Jt = 0.0004 m/s)
- 1 7 6 -

0.000012
0.00001
0.000008
0.000006
0.000004
0.000002
j,1-2.856 m/s
nL
c
0.00001 S
0.00001
a000006
2.5C-6
1f
20
, ^=5.5751
VV
m/s
•
o
(0.0003
3.00023
0X002
0.00015
0.0001
0.00005
> 20
1fl 1,-1.487
L
* "m/s
•
•
•
•
FREQUENCY [Hz]
Fig. 3.3-5 Variation of Power Spectra
-177-

Fig. 9 Variation of spatial growth factor(lower range of j/i
b -2-1
2 3 4
jg [rn/s]
Fig. 3.3-6 Variation of Spatial Growth Factor
-178-

—f . 3"
O M+J 3T—, a
1 t
i:
0)ueno
o.
- 1 7 9 -

ifis_o
CO
sin
"5,u
conoo
+Jo
0_
CM
iZ
3
"o,T3
tapere
ted
s_CDc
osur
enc
3pi
pete
el
-cs
•aa;s_aCO
co
3^3
- 1 8 0 -

oCM
in—d
<D
oo
o+J
cfl
3
W
o
o—d
mod
—
o(DI. i
nbbl
O
to
3(/)O$_
to
Cfl
en
- 1 8 1 -

cqo
ind
CO
ciCN
ci
CD
d
ECO
/oid
jo3CC
ntric
§oO
•
limat
oi
oo5
dCO
CO.
d
ind
(U
d
O+J
o
d
cod
CN
d
VaS
iticaS
Theo
re
annu
s fo
rst
re
su
ltTe
,
i^ <
en
00
pejnsB9|/\|
- 1 8 2 -

00
dcqd
cod
d
oqd
cod
J2CO
COO
I?OCD
s-o
+Jcfl
CO
so
CO
cCO
[_0)
o
in
3(0
<J
CO
1
dood
CD
dind
cod
cod
p9JnsB9|/\|
- 1 8 3 -
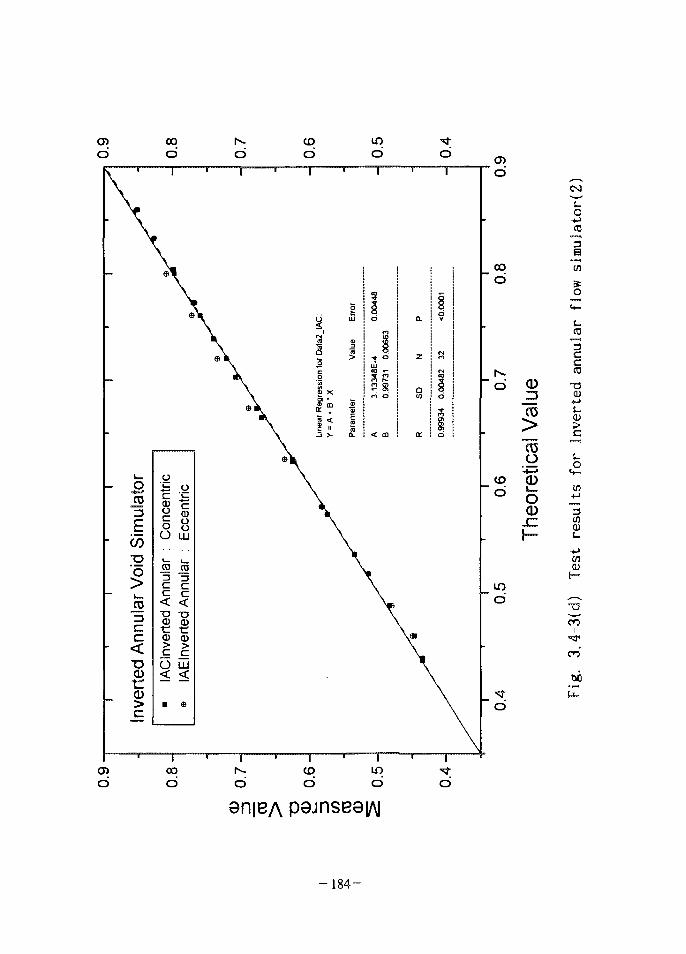
dCO
d dind
d
oqd
tod
ITo+Jffl
s
en
CO
d
CDd
0303
O
oCD
ccCO-a
Inve
r'
o
Its
3
no
- 1 8 4 -

x-ray tube
Batteredndlation . . .
snd-scutercoIluoKtor detector
Fig. 3.4-4 Arrangements of the pre- and post-col 1imators
-185-

o
oCO
iq
- 1 8 6 -

oc
COV7
sio
CO
Q ©
cc
O0)
CO
€0
Q |o
CO
0)
O 9)O C
oo
O
^ :CO O
in
- 1 8 7 -

(0
20>
w s J2 <»w c E aS- »_ eo .»- 3a n c h" o# . "g* (0 fl) OU UJ ^ mT O
CO>»(0
CO
"5
©
£
0)
- 1 8 8 -

inCVJ
oCVJ
oo
c1coc
CD
CD
CD
O
c5JO)
0)CQ
CCDCD
^_>CD
CD
CO
- 1 8 9 -
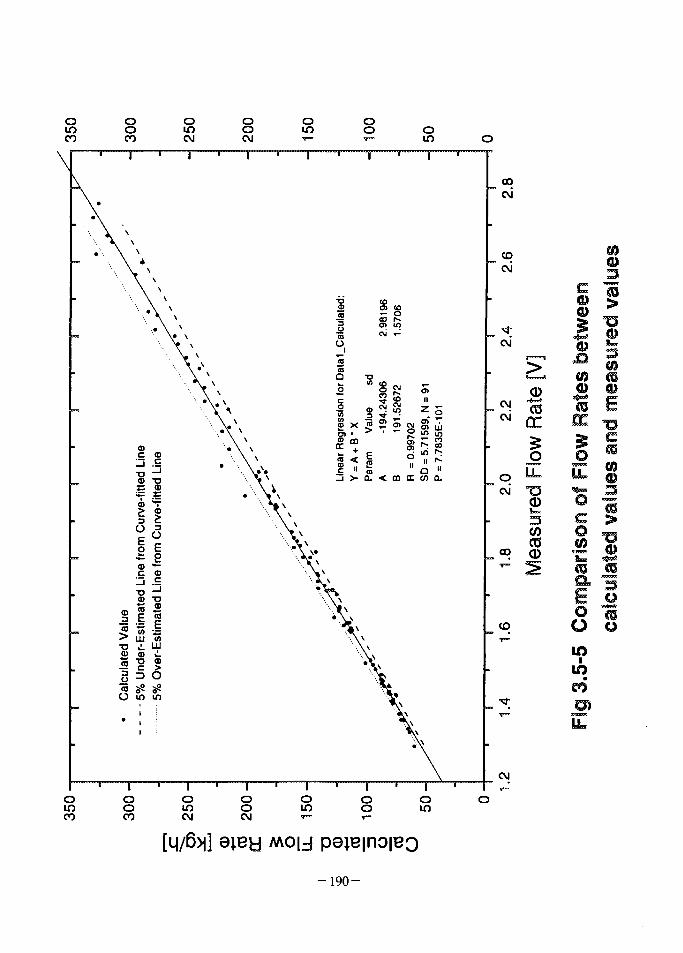
oinCO
ooCO
oin
ooCM
oin
oo o
in
\
• ' • • • \
-
•
-
—
IS
T3
£
cul;
(0
o
•
1 r
*\\
Line
•fit
ted
1
<D
urv
O
oIDC
!_|
73ID
imat
LU
573C
3?m
iii
\\
\
VV
a>
itted
Li
rve
OESa>_c—i
B
.EwHItL
a>6m
1
Ia3
\ 75. x u ,\ , \ - '
\ v 2\ • . aVv °X * -2
\ * • o
\ \ «
\ \ £\ \ o
• ' \ CD
V\ 1'•••• * » •>•
%
••• V
• - • K L
1 ' 1 ' 1 "
X
m+<II
>
| \
CD
Vali
i
Par
\\\\.\
1
too>
.981
CM
too
-19*
<
Sof^to
^~
C\Jr~toi n
191
m
fv\i
CMOL660 =
\
A^
enII
Z
599,
= 5.
71
aCO
o
5E-1
7.78
3
na.
\
•
CO
c\i
cqcvi
40)
CM
2
>
0
c\j
oo
co
CQ
oco
in
C\J
oCO
ooCOoin ooCJ
oin oo oin
- 1 9 0 -

a) Nozzle exit dia. = 5mm, Tpoo, = 20°CMass Flux = 424 kg/m2 sec
b) Nozzle exit dia. = 5mm, Tpool = 20°CMass Flux = 848 kg/m2 sec
Fig 3.5-6 Shapes of Steam Plume underDifferent Experimental Condition
— 1 9 1 —
HIXT PAHI(S)loft

4
PWR-Hot Test Loop f CANDU-Hot Test
Loop X\*££ ^7l*J°J *];*,§-
-fr*l, J i ^ f ^ u ] - . ^-*1 -g-VliE. CANDU-Hot Test Loop^
Distributed Control System^ ^
Feed and Bleed Tfl^J} Make-up Water Treatment Tfl-f-5]
-g-711- -^o] ^ ^ * H o ^ ^ ^EflolBflA: *1|#J=L^ J2.*fl*f55l4. PWR-Hot
Test Loop^r o l # ^ <^3i}-jL^# ^cflA]?] Double Grid
f. CANDU-Hot Test Loop^ CANFLEX
l Cold Test Loop ^l^aJM-fe Spacer Grid7f
5 x 5, 6 x 6 PWR
code
Laser Doppler Velocimeter(LDV)7> A}-§-5] uf. LDV7|^^) S^lL-b
£ RCS
- 1 9 3 -

B & C Loop^- In-containment Refueling Water
Storage Tank<HH 4-g-% Sparger# id?}] ^ ^ ^ 7 f # ^]*> ^%>4
31 %-g-Sju}. B & C LoopolM^ 4 Component ^ Loop #
B & C p ^ ^ ^ ^ ^ ^ | ^ # ^ } ]
^ ^ ^fl-fi-i- ^ ^ ^ H > M f e ^Tfl-fi-i- ^ A oH tfltf Data
Base7f ^ i i 5 | Sdc}. JE^> o] ^ i f s . A> -*f
^ ^r $Ll^ Tfl^ J £ ^ # 7fl«i ^ ^^*f$it:f. Laser ^ # <>l-g-*H
3.7]-§• ^ - ^ ^ f e Phase Doppler Particle Analyzer
Parallel-Wire Conductance Probe# 4-g-*> ^ ^ ^
^ ^ - ^ 7 ] ^ o ] S^iSlSiDK Void
X-Ray Densitometer System^] A
*1 %i l S! PWR, CANDU-Hot Test
Loop ^ Cold Test Loop*] ^^^g^of l -H £ ^ r 3-^r, ^ ^ ^ 1 ^ 1 ^Tfl,
71 - 7 ] ^ # u f e o ^ S R C S Loop ^ B & C
, 150 Channel^] o j e . ^ . SensorS.
JLl- ^ ^ . ^ B l * ^ DAS Tflf^ 7H^, Sensorif
DAS 4 o ] 6 | Tfioj-l-olH ^ i t } ^ Noised
- 1 9 4 -

- 1 9 5 -
*\ *1 % £. <g^•*g7]mLJL*\»i3L
KAERI/MR-287/96*1 7l3f i tn^ t l 3:! SL^ILJIM *i3:
Hot Test Loop ^l^-gr 'g•£-?-*»oj;4 ^i Jf-^ig *) xfl <g (cg-O-f-o^uy
•^ •§" 7 ] ,
UJ *3 *]sfl °1 *1
HliJeJJjL
^"t 6^ S ,^ . yVi O | 7+ Q ^5? J v j £-A— O —* • i —A— "^ , i_i Q . . T . , 0 Q i_
^ ^ 7 1 ^
P. 195 S. SL -fr (0) . -?- ( )
INIS ^Ml 3.B.
a> *W o ls o a
a. 711997. 1
19 x 26 cm'96 7l^;n-n-Al-oj;z|-;lfl
•§-7fi (0), n-Hilul ( ), •£• u } ^
3 L ^ (300 ^ o ] i-fl^j)7fl ^" i -S. 7ll^o
-y-i-^l^^l 'U Hot Test Loop, Co
i t J L ^ ^ ^ -
Tfl o-f •*! i
1 ^ J5L*> <y^*|\S.-i- ^-i>*l-
Id Test Loop ^J J l^ : , i ° JRCS Loop, B & C Loop •§• c>«o>^> Al^-& ^ i * } ^ ^+^ ^-fr
^•S" " r ^S^ ^r 515--^- -fr^l,i^*}SE[c}. PWR-Hot Test Loop-S:
°i^rit3.^
2^** -at*n -a^-i- n
A)?l Double Grid ^ *l-c> JL^g^l -^-fe-^1 °fl %-§-Sl &£:)•. CANTJU-Hot Test
CANFLEX ^ ° i 5 . 2 l °J^7O
V*} ^ l ^ ^ ;o"S-'»-l^0fl %-§-5lSdJl MlnStl K Cold Test Loop '"•l'i'Hl^fe PWR ^ ^ S - g - c } 1 ^ ^ I ^ - ^ - 1
$\Q RCS Loopfe- ^fl^, -^^]7} ^ S . 5 ] 2 i J l - y ^ ° l ^^S-^-ofl SicComponent ^J Loop ?i-*fl<H] c)) V ^ - ^ ^ 1 ^ - 1 - ^r-^*}°4JI «Jel«}•g-^jl^o)] cfl«V it^aj-fy^- *r<g»l-5j[i:>. «cV 2A
ov-n-§- ^ " ^ 7 1 ^
Part ic le Analyzer, Parallel-Wire Probe, X-Ray Densitometer
2]$] -4jTi], ^ll^oH -§•-§-% :5$°1CK i ^ } "#"^t.^ '^'Hl^ ^J^}5-5
•T^l1?) ^ 1 - ^ — (10 Q°] <-fl-2])Al/ti-§rco, Hot Test Loop, Cold Test I.oop, °^^r^RCS < g ^ 3 Loop, B & C Loop, ^-^7]^ 7fl^, - y ^
j2.^Al^-§. *
}. B & C Lo<Al€ ^ ^
S.-H Phase 1System -§-5.
•1 ^7)H A7\ Al-g-Sj-J!
6-i- 7fl *yjL
Loop^rSfl ^•Hl'f'Ofl
lAi M-E}\iDoppler

BIBLIOGRAPHIC INFORMATION SHEETPerforming Org.
Report No.
Sponsoring Org.
Report No.Standard Report No. IN1S Subject Code
KAERI/MR-287/96
Title/Subtitle
Operation of the Hot Test Loop Facilities
Project Manager and Dept. Seyoung Chun (Thermal Hydraulics Reseach Team)
Researcher and Dept. |
M. k. Chung, C. K. Park. S. K. Yang, S. Y. Won, C. H. Song
H. G. Jun, H. J. Chung, S. Cho, K. H. Min, C. H. Chung
(Thermal Hydraulics Research Team)
Pub. Place Taejon Pub. Org KAERI Pub. date Jan. 1997
Page 195 P. Fig. and Tab. Yes (0), No ( ) Size 19 x 26 cm
Note
Classified Open (0), Outside ( ), _ Class Report Type Research Report
Sponsoring Org. Contract No.
Abstract (About 300 words)
A performance and reliability of a advanced nuclear fuel and reactor newly
designed should be verified by performing the thermal hydrualics tests. In thermal
hydraulics research team, the thermal hydraulics tests associated with the
development of an advanced nuclear fuel and reactor have been carried out with
the test facilities, such as the Hot Test Loop operated under high temperature
and pressure conditions, Cold Test Loop, RCS Loop and B & C Loop. The objective
of this project is to obtain the available experimental data and to develop
the advanced measuring techniques through taking full advantage of the facilities.
The facilities operated by the thermal hydraulics reseach team have been
maintained and repaired in order to carry out the thermal hydraulics tests
necessary for providing the available data. The performance tests for the double
grid type bottom end piece which was improved on the debris filtering effectivity
were performed using the PWR-Hot Test Loop. The CANDU-Hot Test Loop was operated
to carry out the pressure drop tests and strength tests of CANFLEX fuel. The Cold
Test Loop was used to obtain the local velocity data in subchannel within HANARO
fuel bundle and to study a thermal mixing characteristic of PWR fuel bundle.
RCS thermal hydraulic loop was constructed and the experiments have been carried
out to measure the critical heat flux. In B & C Loop, the performance tests for
each component were carried out.
Subject Keywords (About 10 words)
Facility Management, Hot Test Loop, Cold Test Loop, Thermal Hydraulics Tests,
RCS Thermal Hydraulics Loop, B & C Loop, Development of Measuring Techniques,
Acquisition of experimental Data