
Enabling Total Process Digital Twin in Sugar Refining through ...
12
Citation: Vetter, F.L.; Strube, J. Enabling Total Process Digital Twin in Sugar Refining through the Integration of Secondary Crystallization Influences. Processes 2022, 10, 373. https://doi.org/ 10.3390/pr10020373 Academic Editor: Pei Liu Received: 12 January 2022 Accepted: 11 February 2022 Published: 15 February 2022 Publisher’s Note: MDPI stays neutral with regard to jurisdictional claims in published maps and institutional affil- iations. Copyright: © 2022 by the authors. Licensee MDPI, Basel, Switzerland. This article is an open access article distributed under the terms and conditions of the Creative Commons Attribution (CC BY) license (https:// creativecommons.org/licenses/by/ 4.0/). processes Article Enabling Total Process Digital Twin in Sugar Refining through the Integration of Secondary Crystallization Influences Florian Lukas Vetter and Jochen Strube * Institute for Separation and Process Technology, Clausthal University of Technology, Leibnizstr. 15, 38678 Clausthal-Zellerfeld, Germany; [email protected] * Correspondence: [email protected]; Tel.: +49-5323-72-2872 Abstract: Crystallization is the main thermal process resulting in the formation of solid products and, therefore, is widely spread in all kinds of industries, from fine chemicals to foods and drugs. For these high-performance products, a quality by design (QbD) approach is applied to maintain high product purity and steady product parameters. In this QbD-context, especially demanded in the foods and drugs industry, the significance of models to deepen process understanding and moving toward automated operation is steadily rising. To reach these aspired goals, besides major process influences like crystallization temperature, other impacting parameters have to be evaluated and a model describing these influences is sought-after. In this work, the suitability of a population balance-based physico-chemical process model for the production of sugar is investigated. A model overview is given and the resulting model is compared to a statistical DoE scheme. The resulting process model is able to picture the effects of secondary process parameters, alongside temperature or temperature gradients, the influences of seed crystal size and amount, stirrer speed, and additives. Keywords: quality by design; crystallization; sugar; foods and drugs; digital twin; modeling; DoE; natural resources 1. Introduction Crystallization, as a process, plays a major role in the purification and formulation of most pharmaceutical products and the food and nutrition sector [1]. Its importance in purification mainly results from the formation of pure crystals from mixed solutions [1] and thas been used in the production of sugar for centuries [2]. There are two different production processes for sucrose, based on the crops sugar cane and sugar beets [2]. These processes, however, differ mainly in the extraction and initial purification steps, e.g., the lime treatment in the production of beet sugar. Crystallization, on the other hand, is the basis for purification and formulation in both processes [2]. The main cost driver in the production of sugar is the solid–liquid separation of sugar crystals from the mother liquor. This is the reason why, in the context of automation, major advances were made in modeling and optimization of centrifugal processes [3–5]. As one of the main influences on the results and economics of a centrifugal process is particle size and particle size distribution, it is an important quality attribute of sugar crystals [6]. Hence, in combination with centrifugation a deepened process understanding of the crystallization process is needed to evaluate a total process optimum. To answer the increased demand for high-purity natural products, resulting from changing patterns of consumption in developing countries, as well as the demand for medicines of natural origin, it is called for an efficient total process design based on a quality- by-design approach [7,8]. For the production of sugar, the potential for optimization of extraction processes via a digital twin and the resulting increased process understanding has already been shown [9]. Furthermore, other process steps in the production of sugar have sophisticated process models [3–5,10]. An overview of the potential total process modeling is given in Figure 1. Process models for the extraction of sugar from beets have been shown Processes 2022, 10, 373. https://doi.org/10.3390/pr10020373 https://www.mdpi.com/journal/processes
-
Upload
khangminh22 -
Category
Documents
-
view
6 -
download
0
Transcript of Enabling Total Process Digital Twin in Sugar Refining through ...

�����������������
Citation: Vetter, F.L.; Strube, J.
Enabling Total Process Digital Twin
in Sugar Refining through the
Integration of Secondary
Crystallization Influences. Processes
2022, 10, 373. https://doi.org/
10.3390/pr10020373
Academic Editor: Pei Liu
Received: 12 January 2022
Accepted: 11 February 2022
Published: 15 February 2022
Publisher’s Note: MDPI stays neutral
with regard to jurisdictional claims in
published maps and institutional affil-
iations.
Copyright: © 2022 by the authors.
Licensee MDPI, Basel, Switzerland.
This article is an open access article
distributed under the terms and
conditions of the Creative Commons
Attribution (CC BY) license (https://
creativecommons.org/licenses/by/
4.0/).
processes
Article
Enabling Total Process Digital Twin in Sugar Refining throughthe Integration of Secondary Crystallization InfluencesFlorian Lukas Vetter and Jochen Strube *
Institute for Separation and Process Technology, Clausthal University of Technology, Leibnizstr. 15,38678 Clausthal-Zellerfeld, Germany; [email protected]* Correspondence: [email protected]; Tel.: +49-5323-72-2872
Abstract: Crystallization is the main thermal process resulting in the formation of solid productsand, therefore, is widely spread in all kinds of industries, from fine chemicals to foods and drugs.For these high-performance products, a quality by design (QbD) approach is applied to maintainhigh product purity and steady product parameters. In this QbD-context, especially demanded in thefoods and drugs industry, the significance of models to deepen process understanding and movingtoward automated operation is steadily rising. To reach these aspired goals, besides major processinfluences like crystallization temperature, other impacting parameters have to be evaluated anda model describing these influences is sought-after. In this work, the suitability of a populationbalance-based physico-chemical process model for the production of sugar is investigated. A modeloverview is given and the resulting model is compared to a statistical DoE scheme. The resultingprocess model is able to picture the effects of secondary process parameters, alongside temperatureor temperature gradients, the influences of seed crystal size and amount, stirrer speed, and additives.
Keywords: quality by design; crystallization; sugar; foods and drugs; digital twin; modeling; DoE;natural resources
1. Introduction
Crystallization, as a process, plays a major role in the purification and formulationof most pharmaceutical products and the food and nutrition sector [1]. Its importance inpurification mainly results from the formation of pure crystals from mixed solutions [1]and thas been used in the production of sugar for centuries [2].
There are two different production processes for sucrose, based on the crops sugar caneand sugar beets [2]. These processes, however, differ mainly in the extraction and initialpurification steps, e.g., the lime treatment in the production of beet sugar. Crystallization,on the other hand, is the basis for purification and formulation in both processes [2].
The main cost driver in the production of sugar is the solid–liquid separation of sugarcrystals from the mother liquor. This is the reason why, in the context of automation, majoradvances were made in modeling and optimization of centrifugal processes [3–5]. As one ofthe main influences on the results and economics of a centrifugal process is particle size andparticle size distribution, it is an important quality attribute of sugar crystals [6]. Hence, incombination with centrifugation a deepened process understanding of the crystallizationprocess is needed to evaluate a total process optimum.
To answer the increased demand for high-purity natural products, resulting fromchanging patterns of consumption in developing countries, as well as the demand formedicines of natural origin, it is called for an efficient total process design based on a quality-by-design approach [7,8]. For the production of sugar, the potential for optimization ofextraction processes via a digital twin and the resulting increased process understanding hasalready been shown [9]. Furthermore, other process steps in the production of sugar havesophisticated process models [3–5,10]. An overview of the potential total process modelingis given in Figure 1. Process models for the extraction of sugar from beets have been shown
Processes 2022, 10, 373. https://doi.org/10.3390/pr10020373 https://www.mdpi.com/journal/processes
Processes 2022, 10, 373 2 of 12
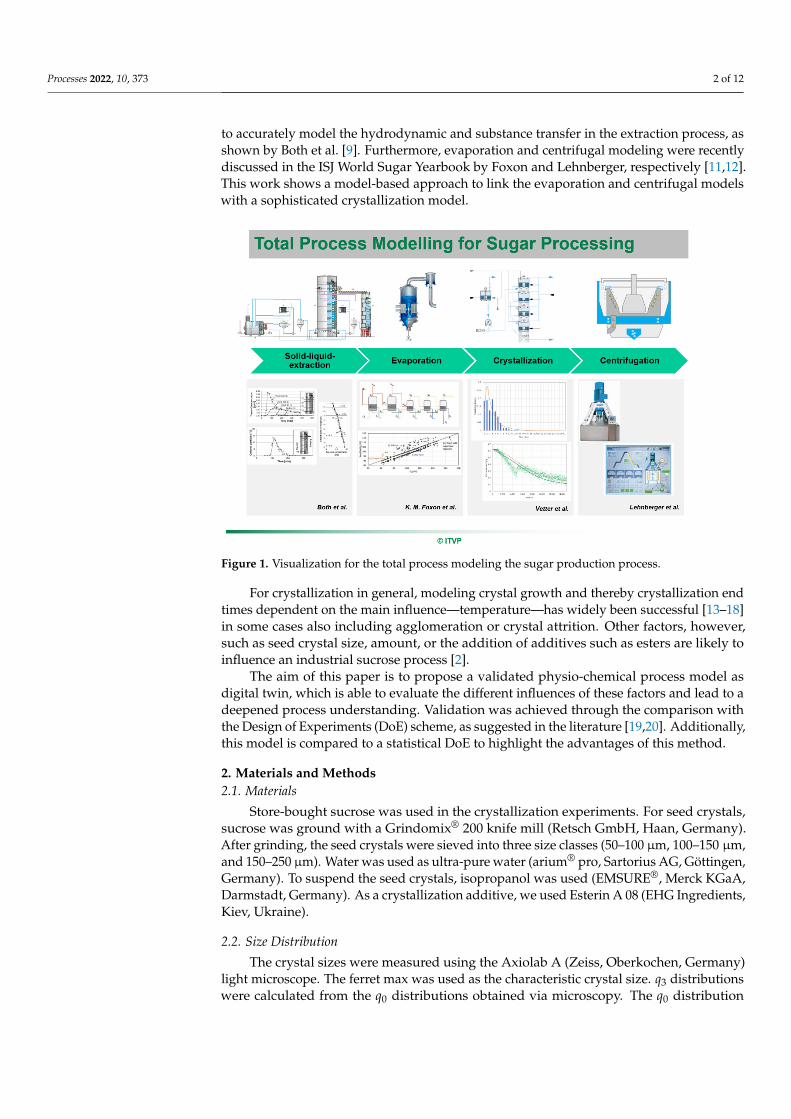
to accurately model the hydrodynamic and substance transfer in the extraction process, asshown by Both et al. [9]. Furthermore, evaporation and centrifugal modeling were recentlydiscussed in the ISJ World Sugar Yearbook by Foxon and Lehnberger, respectively [11,12].This work shows a model-based approach to link the evaporation and centrifugal modelswith a sophisticated crystallization model.
Processes 2022, 10, x FOR PEER REVIEW 2 of 13
quality‐by‐design approach [7,8]. For the production of sugar, the potential for optimiza‐
tion of extraction processes via a digital twin and the resulting increased process under‐
standing has already been shown [9]. Furthermore, other process steps in the production
of sugar have sophisticated process models [3–5,10]. An overview of the potential total
process modeling is given in Figure 1. Process models for the extraction of sugar from
beets have been shown to accurately model the hydrodynamic and substance transfer in
the extraction process, as shown by Both et al. [9]. Furthermore, evaporation and centrif‐
ugal modeling were recently discussed in the ISJ World Sugar Yearbook by Foxon and
Lehnberger, respectively [11,12]. This work shows a model‐based approach to link the
evaporation and centrifugal models with a sophisticated crystallization model.
Figure 1. Visualization for the total process modeling the sugar production process.
For crystallization in general, modeling crystal growth and thereby crystallization
end times dependent on the main influence—temperature—has widely been successful
[13–18] in some cases also including agglomeration or crystal attrition. Other factors, how‐
ever, such as seed crystal size, amount, or the addition of additives such as esters are likely
to influence an industrial sucrose process [2].
The aim of this paper is to propose a validated physio‐chemical process model as
digital twin, which is able to evaluate the different influences of these factors and lead to
a deepened process understanding. Validation was achieved through the comparison
with the Design of Experiments (DoE) scheme, as suggested in the literature [19,20]. Ad‐
ditionally, this model is compared to a statistical DoE to highlight the advantages of this
method.
2. Materials and Methods
2.1. Materials
Store‐bought sucrose was used in the crystallization experiments. For seed crystals,
sucrose was ground with a Grindomix® 200 knife mill (Retsch GmbH, Haan, Germany).
After grinding, the seed crystals were sieved into three size classes (50–100 μm, 100–150
μm, and 150–250 μm). Water was used as ultra‐pure water (arium® pro, Sartorius AG,
Göttingen, Germany). To suspend the seed crystals, isopropanol was used (EMSURE®,
Figure 1. Visualization for the total process modeling the sugar production process.
For crystallization in general, modeling crystal growth and thereby crystallization endtimes dependent on the main influence—temperature—has widely been successful [13–18]in some cases also including agglomeration or crystal attrition. Other factors, however,such as seed crystal size, amount, or the addition of additives such as esters are likely toinfluence an industrial sucrose process [2].
The aim of this paper is to propose a validated physio-chemical process model asdigital twin, which is able to evaluate the different influences of these factors and lead to adeepened process understanding. Validation was achieved through the comparison withthe Design of Experiments (DoE) scheme, as suggested in the literature [19,20]. Additionally,this model is compared to a statistical DoE to highlight the advantages of this method.
2. Materials and Methods2.1. Materials
Store-bought sucrose was used in the crystallization experiments. For seed crystals,sucrose was ground with a Grindomix® 200 knife mill (Retsch GmbH, Haan, Germany).After grinding, the seed crystals were sieved into three size classes (50–100 µm, 100–150 µm,and 150–250 µm). Water was used as ultra-pure water (arium® pro, Sartorius AG, Göttingen,Germany). To suspend the seed crystals, isopropanol was used (EMSURE®, Merck KGaA,Darmstadt, Germany). As a crystallization additive, we used Esterin A 08 (EHG Ingredients,Kiev, Ukraine).
2.2. Size Distribution
The crystal sizes were measured using the Axiolab A (Zeiss, Oberkochen, Germany)light microscope. The ferret max was used as the characteristic crystal size. q3 distributionswere calculated from the q0 distributions obtained via microscopy. The q0 distribution

Processes 2022, 10, 373 3 of 12
indicates the number of crystals in each size class, while the q3 distribution indicates thecrystal mass or volume found in each size class and can be calculated using Equation (1).
q3(x) =x3q0(x)∫ xmax
xminx3q0(x)dx
(1)
To evaluate the effects on particle size and particle size distribution, a method tosimplify the description of the particle size distribution was needed. A simple method toquantify these parameters is the evaluation of the measured q0 and q3 distributions as aRRSB (Rosin, Rammler, Sperling, and Bennet) distribution, also known as Weibull distri-bution, which is widely used in mechanical process engineering to describe particle sizedistributions [21]. Equation (2) allows obtaining d′ as the reciprocal grain size parameterof the 63rd—percentile and the form parameter k from the measured probability in thesize class x1 to x2 [21,22]. The form parameter k typically varies between 0 and 5, where0 is a maximum skewed distribution and values over 3.5 give distributions of vanishingskewness close to a normal distribution.
q(x1, x2) = d′−kx−k2 e−d′−kx−k
2(d′x2
)k − d′−kx−k1 e−d′−kx−k
1(d′x1
)k (2)
This method of simplifying the particle size distribution into the parameter k enablesthe evaluation via DoE; this also leads to the circumstance that the results of the DoE arenot as easily comparable to the results of the mass balance.
2.3. Crystallization
Crystallization was conducted in a 1 L stirred double jacketed vessel, during whichcrystallization turbidity and temperature was measured using an EXcell 230 (Exner, Reck-linghausen, Germany) turbidity sensor and a PT-100 thermometer. The crystallizationvessel was stirred using a ViskoPakt®-rheo 110 (HiTec Zang, Herzogenrath, Germany)stirrer in combination with a four-blade axial flow polytetrafluoroethylene stirrer, alsoknown as a paddler. During crystallization temperature, turbidity, torque, and RPMwere recorded.
For the crystallization experiments, 800 g sugar were solved in 200 g (sic) of water at90 ◦C, after turbidity reaches zero supersaturation is achieved by evaporating 56 g water.The evaporated water was condensed and caught in a weighted beaker to monitor thesupersaturation. After each crystallization, crystals were analyzed in suspension usingthe microscope.
Crystallization end time is difficult to measure reproducibly. To get around thisproblem in this study, we defined the crystallization to be finished, when 95% of the finalturbidity was reached. To find this value and, therefore, find the crystallization end time,we fitted a sigmoid function to the turbidity curve.
2.4. Design of Experiments (DoE)
Based on the generally acknowledged quality-by-design (QbD) approach, firstly, criti-cal quality attributes (CQA) have to be defined to determine the impact of different processparameters on these attributes [19,23]. As the sugar crystals need to be narrowly distributed,the large crystals were decided on by these CQAs, as discussed previously. We also addedcrystallization time, as an economically important attribute for the crystallization process.Probable influences on the CQAs were commonly identified using an Ishikawa diagram. Ageneral Ishikawa diagram for the crystallization process is given in Figure 2. For the designof our model, we decided on excluding “equipment” and “material” effects since sugarcrystallization is an established process and sugar has excellent solubility in water, allowingfor an economical process design. For the process parameters, we decided to exclude thetemperature influence in our DoE; in the model, however, a temperature influence couldbe easily be integrated via the crystallization growth speed and sugar solubility discussedin Section 2.5.

Processes 2022, 10, 373 4 of 12
Processes 2022, 10, x FOR PEER REVIEW 4 of 13
tion process. Probable influences on the CQAs were commonly identified using an Ishi‐
kawa diagram. A general Ishikawa diagram for the crystallization process is given in Fig‐
ure 2. For the design of our model, we decided on excluding “equipment” and “material”
effects since sugar crystallization is an established process and sugar has excellent solu‐
bility in water, allowing for an economical process design. For the process parameters, we
decided to exclude the temperature influence in our DoE; in the model, however, a tem‐
perature influence could be easily be integrated via the crystallization growth speed and
sugar solubility discussed in Section 2.5.
Analysis routine
Interval duration
Quality
Scheduling
Documentation
Particle load Solvent composition Solvent purities Side component influences
Concentration Purity Side components
Figure 2. General Ishikawa diagram for a crystallization process.
This results in the process parameters of stirring speed, seeding crystal size, mass,
and additives for our DoE. These variables were changed in a three‐step, full‐factorial DoE
scheme. The center point was repeated three times.
Seeding crystal size was varied in the aforementioned sieving classes and the seeding
crystal amount was varied in 100 mg, 200 mg, and 300 mg. Stirring speed was varied in
three steps 100 rpm, 200 rpm, and 300 rpm, and the additive amount was varied in 0 mL,
1 mL, and 2 mL steps.
2.5. Modeling of Crystallization
Crystallization was modeled using a population balance model, modeling crystal
growth, agglomeration, and aggregation as described in the literature [13,15,16,24] written
in Equation (3). Crystal nucleation was neglected. As seeding crystals were used, second‐
ary nucleation is the dominant mode to be expected [25].
𝜕𝑛𝜕𝑡
𝜕𝐺𝑛𝜕𝐿
𝐷 𝐿 𝐵 𝐿 (3)
This balance describes the change of the number density n over time, which results
from the growth rate of a single crystal G, the crystal death rate D and the crystal birth
rate B for crystals of a size L. The crystal growth rate is given by Equation (4). Since the
observed experimental space temperature is kept constant, this equation is simplified to
(5) [13,24].
𝐺 𝑘 ∙ 𝑒 ∗ 𝑆 (4)
𝐺 𝑘 ∙ 𝑆 (5)
𝑘 and 𝑘 are the kinetic constants of crystal growth. S is the supersaturation de‐
fined in Equation (6) [13,24], with the sugar concentration in equilibrium 𝑐 which is
Figure 2. General Ishikawa diagram for a crystallization process.
This results in the process parameters of stirring speed, seeding crystal size, mass,and additives for our DoE. These variables were changed in a three-step, full-factorial DoEscheme. The center point was repeated three times.
Seeding crystal size was varied in the aforementioned sieving classes and the seedingcrystal amount was varied in 100 mg, 200 mg, and 300 mg. Stirring speed was varied inthree steps 100 rpm, 200 rpm, and 300 rpm, and the additive amount was varied in 0 mL,1 mL, and 2 mL steps.
2.5. Modeling of Crystallization
Crystallization was modeled using a population balance model, modeling crystalgrowth, agglomeration, and aggregation as described in the literature [13,15,16,24] writtenin Equation (3). Crystal nucleation was neglected. As seeding crystals were used, secondarynucleation is the dominant mode to be expected [25].
∂n∂t
=∂Gn∂L− D(L) + B(L) (3)
This balance describes the change of the number density n over time, which resultsfrom the growth rate of a single crystal G, the crystal death rate D and the crystal birthrate B for crystals of a size L. The crystal growth rate is given by Equation (4). Since theobserved experimental space temperature is kept constant, this equation is simplified to(5) [13,24].
G = k1·e−k2T ∗ Sk3 (4)
G = k12·Sk3 (5)
k12 and k3 are the kinetic constants of crystal growth. S is the supersaturation definedin Equation (6) [13,24], with the sugar concentration in equilibrium ceq which is given byEquation (7) [2] and is correlated from Aeq and Beq which are determined to be Aeq = 0.0857
and Beq = 0.0106 to give equilibrium concentration in kgsucrosekgwater
based on literature data [2].
S =c− ceq
ceq(6)
ceq = Aeq ∗ eBeq∗T (7)

Processes 2022, 10, 373 5 of 12
The change in concentration in solution is expressed with Equation (8) [17] wherekv is the shape factor, σS the crystal density, mL the mass of water and L the characteristiclength of the crystal. The shape factor is assumed to be kv = 0.87 π
6 based on literature [26].
∂c∂t
= −3 ∗ σs ∗kv
mL∗ G ∗
∫ ∞
0L2n dL (8)
The birth and death terms in the population balance result from the effects of ag-glomeration and attrition. Agglomeration can be modeled with different stochastic ap-proaches [13,16]. The birth and death terms resulting from agglomeration are given inEquation (9) and Equation (10) [13].
BA =L2
2
∫ L
0
β
((L3 − λ3) 1
3 , λ
)n((
L3 − λ3) 13
)n(λ)
(L3 − λ3)23
dλ (9)
DA = n(L)∫ ∞
0β(L, λ)n(λ)dλ (10)
These equations describe the agglomeration between two crystals with the sizes Land λ. The two-dimensional matrix β(L, λ) describes the number of collisions per time fortwo crystals of the aforementioned sizes and is modeled as a triangle matrix according toEquation (11) [13].
β(L, λ) =1
We f f
2kT3ηL
(λ + L)(
1λ+
1L
)(11)
In Equation (11) We f f describes the agglomeration efficiency, which can be correlatedfor submicron particles according to Stokes–Einstein as the collision efficiency [16]. Sincethe observed crystals in this work are not submicron, We f f is determined using the obtainedexperimental data. k is the Boltzmann constant and ηL the viscosity of the solution. Forhighly concentrated sugar solution correlations for the viscosity are available [2].
The birth and death terms resulting from the effects of attrition are modeled based ondifferent approaches. Either it is assumed that two different size crystals are birthed froman attrition process or more than two same size crystals are birthed from it [16,27]. In thiswork, it is assumed that three same-size crystals result from attrition as this best describesthe experimental data. To model attrition, Equations (12) and (13) are used.
BB(L) = w DB(L) (12)
DB(L) = rBrn(L) (13)
In these, w is the number of crystals obtained from the attrition process and rBr is thebreakage rate calculated according to Equation (14) with γ and Λ being breakage constantsand E being the specific energy input through stirring, calculated from the torque and rpmmeasured in the experiments;
rBr = γEΛ (14)
2.6. Parameter Determination and Model Solution
To solve the differential equation system described in 2.5, we used Aspen CustomModeler V 11 (Aspen Technology Inc., Bedford, MA, USA). Discretization was done accord-ing to a 1st-order backward finite difference method. We used a mixed Newton nonlinearsolver and the gear integrator with a variable step size.
Most parameters are measured in the experiments or taken from literature data, asdescribed above. There are however k12, k3, L and We f f , which are determined usinga NL2SOL least squares solver on the experimental data. NL2SOL is a least squaresnonlinear solver employing a variation on Newton’s method. For the identification, we

Processes 2022, 10, 373 6 of 12
used least-squares as the optimization function. To identify the expected range, we used anunrestrained Nelder–Mead method and then decided on the limits given in Table 1.
Table 1. Limits used in the parameter determination.
Parameter Lower Limit Upper Limit
k12 1× 10−37 1× 10⁻⁴
k3 1× 10−37 1× 10⁻⁴
L 0.5 2We f f 1× 10−37 1× 1037
As training data, the concentration course was given for ten equidistant time points. Theparticle size was given as the measured q0 distributions from the microscopic measurements.
3. Results3.1. Design of Experiments
In Figure 3, examples for the experimental results are given. In (a), a very skeweddistribution can be observed. This is represented by the above-mentioned parameter kgiving a value of 3.22. The x63 is 866 µm. In comparison, (b) shows a very even distribu-tion around 1308 µm with a form factor of 5.38. For the evaluation of each experiment,300 crystals were evaluated. To better the understanding for these arbitrary metrics, wegave the corresponding Weibull distributions in (d–f). Particles above 1500 µm were notobserved, hence, the graph is shortened.
Processes 2022, 10, x FOR PEER REVIEW 7 of 13
(a) (b) (c)
(d) (e) (f)
Figure 3. Crystallization results of three experiments in the DoE (a–c). In (d–f), the corresponding
particle size densities are given. Here, the blue line is the q0 distribution, and the red is the q3 dis‐
tribution.
For this process, the DoE yields some satisfying results depicted in Figure 4Error!
Reference source not found.. The prediction for the particle size distribution, given in (b),
shows a good correlation of the observed effects to the input parameters with an R2 of 0.97
and a p‐value of 0.0041. For the particle size (𝑥 shown in (a) the prediction is not as
good, while remaining statistically significant with an R2 of 0.92 and a p‐value of 0.038.
Crystallization end time does not show a statistically significant correlation, with an R2 of
0.78 and a p‐value of 0.78. This is, to a large extent, due to the three center points (marked
with green circle), which cannot be mapped by the statistical model.
(a) (b) (c)
Figure 4. Results of the linear DoE scheme for (a) particle size (𝑥 , (b) skewness of the particle size
distribution (k), and (c) crystallization endtime. The blue line shows ideal fit, the red dashed lines
95% confidence intervals, and the black dashed line the average.
In Table 2, the parameter influence on the skewness of the particle size distribution
is given, ranked by the statistical influence on the distribution. Additive volume, for ex‐
ample, correlates most significantly with a more even distribution of particle sizes, the
Figure 3. Crystallization results of three experiments in the DoE (a–c). In (d–f), the correspondingparticle size densities are given. Here, the blue line is the q0 distribution, and the red is the q3 distribution.
For this process, the DoE yields some satisfying results depicted in Figure 4. Theprediction for the particle size distribution, given in (b), shows a good correlation of theobserved effects to the input parameters with an R2 of 0.97 and a p-value of 0.0041. For theparticle size (x63) shown in (a) the prediction is not as good, while remaining statisticallysignificant with an R2 of 0.92 and a p-value of 0.038. Crystallization end time does not show

Processes 2022, 10, 373 7 of 12
a statistically significant correlation, with an R2 of 0.78 and a p-value of 0.78. This is, to alarge extent, due to the three center points (marked with green circle), which cannot bemapped by the statistical model.
Processes 2022, 10, x FOR PEER REVIEW 7 of 13
(a) (b) (c)
(d) (e) (f)
Figure 3. Crystallization results of three experiments in the DoE (a–c). In (d–f), the corresponding
particle size densities are given. Here, the blue line is the q0 distribution, and the red is the q3 dis‐
tribution.
For this process, the DoE yields some satisfying results depicted in Figure 4Error!
Reference source not found.. The prediction for the particle size distribution, given in (b),
shows a good correlation of the observed effects to the input parameters with an R2 of 0.97
and a p‐value of 0.0041. For the particle size (𝑥 shown in (a) the prediction is not as
good, while remaining statistically significant with an R2 of 0.92 and a p‐value of 0.038.
Crystallization end time does not show a statistically significant correlation, with an R2 of
0.78 and a p‐value of 0.78. This is, to a large extent, due to the three center points (marked
with green circle), which cannot be mapped by the statistical model.
(a) (b) (c)
Figure 4. Results of the linear DoE scheme for (a) particle size (𝑥 , (b) skewness of the particle size
distribution (k), and (c) crystallization endtime. The blue line shows ideal fit, the red dashed lines
95% confidence intervals, and the black dashed line the average.
In Table 2, the parameter influence on the skewness of the particle size distribution
is given, ranked by the statistical influence on the distribution. Additive volume, for ex‐
ample, correlates most significantly with a more even distribution of particle sizes, the
Figure 4. Results of the linear DoE scheme for (a) particle size (x63), (b) skewness of the particle sizedistribution (k), and (c) crystallization endtime. The blue line shows ideal fit, the red dashed lines95% confidence intervals, and the black dashed line the average.
In Table 2, the parameter influence on the skewness of the particle size distribution isgiven, ranked by the statistical influence on the distribution. Additive volume, for example,correlates most significantly with a more even distribution of particle sizes, the second mostimportant influence is the diameter of the seeding crystals. The largest negative correlationis the interaction of seeding crystal mass and its diameter. The significant influences on thedistribution skewness are marked with a star.
Table 2. Parameter influence on the crystal size distribution. The terms marked with a star (*) arestatistically significant.
Term Parameter Std.-Error t-Value Prob > |t|
Additive volume 0.816514 0.122635 6.66 0.0012 *
Processes 2022, 10, x FOR PEER REVIEW 8 of 13
second most important influence is the diameter of the seeding crystals. The largest neg‐
ative correlation is the interaction of seeding crystal mass and its diameter. The significant
influences on the distribution skewness are marked with a star.
Table 2. Parameter influence on the crystal size distribution. The terms marked with a star (*) are
statistically significant.
Term Parameter Std.‐Error t‐Value Prob > |t|
Additive volume 0.816514 0.122635 6.66 0.0012 *
Diameter seeding crystals (SC) 0.768486 0.122635 6.27 0.0015 *
Mass SC * Diameter SC −0.76224 0.122635 −6.22 0.0016 *
RPM * additive volume 0.494736 0.122635 4.03 0.0100 *
Mass SC −0.38546 0.110978 −3.47 0.0178 *
RPM * mass SC 0.345264 0.122635 2.82 0.0373 *
Additive volume * diameter SC 0.317236 0.122635 2.59 0.0490 *
Additive volume * Mass SC 0.089736 0.122635 0.73 0.4972
RPM −0.07651 0.122635 −0.62 0.56
RPM * diameter SC −0.02724 0.122635 −0.22 0.833
In Table 3, the parameter influence on the crystal size is given. Different parameters
correlate to the 𝑥 crystal size, when compared to the size distribution. However, the
most significant correlation to the crystal size is still the diameter of the seeding crystals
as well as the volume of additive. Crystal mass has the largest negative correlation, which
can be easily explained, with the higher amount of resulting sugar crystals and, therefore,
smaller crystals in general as the supersaturation does not change.
Table 3. Parameter influence on the crystal size (𝑥 . The terms marked with a star (*) are statisti‐
cally significant.
Term Parameter Std.‐Error t‐Value Prob > |t|
Diameter Seeding crystals (SC) 166.9049 37.74014 4.42 0.0069 *
Additive volume * Diameter SC 151.0299 37.74014 4 0.0103 *
Mass SC −95.2148 34.15285 −2.79 0.0385 *
RPM * Mass SC −99.2799 37.74014 −2.63 0.0465 *
Additive Volume 81.84507 37.74014 2.17 0.0823
RPM * Diameter SC 76.22007 37.74014 2.02 0.0994
RPM 66.90493 37.74014 1.77 0.1365
Additive volume * Mass SC −31.7201 37.74014 −0.84 0.4390
Mass SC * Diameter SC −2.02993 37.74014 −0.05 0.9592
RPM * Additive Volume 1.77993 37.74014 0.05 0.9642
On the evaluation of the DoE, a failure mode and effect analysis (FMEA) can be
based, as the impact of failures in the secondary process parameters can be assessed. The
resulting FMEA is given in Figure 5. Green influences are the process parameter influ‐
ences based on the DoE. Occurrence is based on prior knowledge. For example, the addi‐
tive volume has shown a high impact on the crystallization process, however, in the scale
of 1 mL additive per 1 L crystallization volume, it is easily dosed in industrial scales. The
grey failures are other possible influences not evaluated in this study which can be ex‐
pected to have a significant influence, however, solutions to these are already employed
in the industrial processes or their occurrence and influence are low. For example, the
particle load would have a high relative impact, as it could start the crystallization uncon‐
trollably, this, however, is mitigated by a prior filtration. Supersaturation would have a
high impact, however, the occurrence is relatively low, as evaporation is a well‐controlled
process.
Diameter seeding crystals (SC) 0.768486 0.122635 6.27 0.0015 *Mass SC * Diameter SC −0.76224 0.122635 −6.22 0.0016 *RPM * additive volume 0.494736 0.122635 4.03 0.0100 *
Mass SC −0.38546 0.110978 −3.47 0.0178 *RPM * mass SC 0.345264 0.122635 2.82 0.0373 *
Additive volume * diameter SC 0.317236 0.122635 2.59 0.0490 *Additive volume * Mass SC 0.089736 0.122635 0.73 0.4972
RPM −0.07651 0.122635 −0.62 0.56RPM * diameter SC −0.02724 0.122635 −0.22 0.833
In Table 3, the parameter influence on the crystal size is given. Different parameterscorrelate to the x63 crystal size, when compared to the size distribution. However, the mostsignificant correlation to the crystal size is still the diameter of the seeding crystals as wellas the volume of additive. Crystal mass has the largest negative correlation, which can beeasily explained, with the higher amount of resulting sugar crystals and, therefore, smallercrystals in general as the supersaturation does not change.

Processes 2022, 10, 373 8 of 12
Table 3. Parameter influence on the crystal size (x63). The terms marked with a star (*) are statisticallysignificant.
Term Parameter Std.-Error t-Value Prob > |t|
Diameter Seeding crystals (SC) 166.9049 37.74014 4.42 0.0069 *
Processes 2022, 10, x FOR PEER REVIEW 8 of 13
second most important influence is the diameter of the seeding crystals. The largest neg‐
ative correlation is the interaction of seeding crystal mass and its diameter. The significant
influences on the distribution skewness are marked with a star.
Table 2. Parameter influence on the crystal size distribution. The terms marked with a star (*) are
statistically significant.
Term Parameter Std.‐Error t‐Value Prob > |t|
Additive volume 0.816514 0.122635 6.66 0.0012 *
Diameter seeding crystals (SC) 0.768486 0.122635 6.27 0.0015 *
Mass SC * Diameter SC −0.76224 0.122635 −6.22 0.0016 *
RPM * additive volume 0.494736 0.122635 4.03 0.0100 *
Mass SC −0.38546 0.110978 −3.47 0.0178 *
RPM * mass SC 0.345264 0.122635 2.82 0.0373 *
Additive volume * diameter SC 0.317236 0.122635 2.59 0.0490 *
Additive volume * Mass SC 0.089736 0.122635 0.73 0.4972
RPM −0.07651 0.122635 −0.62 0.56
RPM * diameter SC −0.02724 0.122635 −0.22 0.833
In Table 3, the parameter influence on the crystal size is given. Different parameters
correlate to the 𝑥 crystal size, when compared to the size distribution. However, the
most significant correlation to the crystal size is still the diameter of the seeding crystals
as well as the volume of additive. Crystal mass has the largest negative correlation, which
can be easily explained, with the higher amount of resulting sugar crystals and, therefore,
smaller crystals in general as the supersaturation does not change.
Table 3. Parameter influence on the crystal size (𝑥 . The terms marked with a star (*) are statisti‐
cally significant.
Term Parameter Std.‐Error t‐Value Prob > |t|
Diameter Seeding crystals (SC) 166.9049 37.74014 4.42 0.0069 *
Additive volume * Diameter SC 151.0299 37.74014 4 0.0103 *
Mass SC −95.2148 34.15285 −2.79 0.0385 *
RPM * Mass SC −99.2799 37.74014 −2.63 0.0465 *
Additive Volume 81.84507 37.74014 2.17 0.0823
RPM * Diameter SC 76.22007 37.74014 2.02 0.0994
RPM 66.90493 37.74014 1.77 0.1365
Additive volume * Mass SC −31.7201 37.74014 −0.84 0.4390
Mass SC * Diameter SC −2.02993 37.74014 −0.05 0.9592
RPM * Additive Volume 1.77993 37.74014 0.05 0.9642
On the evaluation of the DoE, a failure mode and effect analysis (FMEA) can be
based, as the impact of failures in the secondary process parameters can be assessed. The
resulting FMEA is given in Figure 5. Green influences are the process parameter influ‐
ences based on the DoE. Occurrence is based on prior knowledge. For example, the addi‐
tive volume has shown a high impact on the crystallization process, however, in the scale
of 1 mL additive per 1 L crystallization volume, it is easily dosed in industrial scales. The
grey failures are other possible influences not evaluated in this study which can be ex‐
pected to have a significant influence, however, solutions to these are already employed
in the industrial processes or their occurrence and influence are low. For example, the
particle load would have a high relative impact, as it could start the crystallization uncon‐
trollably, this, however, is mitigated by a prior filtration. Supersaturation would have a
high impact, however, the occurrence is relatively low, as evaporation is a well‐controlled
process.
Additive volume * Diameter SC 151.0299 37.74014 4 0.0103 *Mass SC −95.2148 34.15285 −2.79 0.0385 *
RPM * Mass SC −99.2799 37.74014 −2.63 0.0465 *Additive Volume 81.84507 37.74014 2.17 0.0823
RPM * Diameter SC 76.22007 37.74014 2.02 0.0994RPM 66.90493 37.74014 1.77 0.1365
Additive volume * Mass SC −31.7201 37.74014 −0.84 0.4390Mass SC * Diameter SC −2.02993 37.74014 −0.05 0.9592RPM * Additive Volume 1.77993 37.74014 0.05 0.9642
On the evaluation of the DoE, a failure mode and effect analysis (FMEA) can be based,as the impact of failures in the secondary process parameters can be assessed. The resultingFMEA is given in Figure 5. Green influences are the process parameter influences based onthe DoE. Occurrence is based on prior knowledge. For example, the additive volume hasshown a high impact on the crystallization process, however, in the scale of 1 mL additiveper 1 L crystallization volume, it is easily dosed in industrial scales. The grey failuresare other possible influences not evaluated in this study which can be expected to have asignificant influence, however, solutions to these are already employed in the industrialprocesses or their occurrence and influence are low. For example, the particle load wouldhave a high relative impact, as it could start the crystallization uncontrollably, this, however,is mitigated by a prior filtration. Supersaturation would have a high impact, however, theoccurrence is relatively low, as evaporation is a well-controlled process.
Processes 2022, 10, x FOR PEER REVIEW 9 of 13
Figure 5. FMEA for the sugar crystallization process.
3.2. Results of the Physico‐Chemical Model
Parameter determination was done for the experiments with 0, 1, and 2 mL additive
separately, as there is at this point no possibility to model the effects of the additive. The
aim of this is to identify the parameters which depend on the additive, whether it changes
kinetics, breakage, or agglomeration. In Table 4, the results of the parameter determina‐
tion are given. For Λ in the center point, the routine returns 0, which is due to the design
of the DoE scheme. This parameter scales the influence of stirrer speed on the occurrence
of breakage events, and as there was no difference in stirrer speed, the parameter cannot
have any influence on breakage, as the breakage events are now reduced to 𝛾 according to Equation (14).
Table 4. Results of the parameter determination for the three different additive classes 0, 1, and 2
mL.
Parameter Value 0 mL Value 1 mL Value 2 mL
𝑘 1.44 ∙ 10 2.34 ∙ 10 7.85 ∙ 10 𝑘 1.87 1.11 2.30 𝛾 7.81 ∙ 10 5.71 ∙ 10 2.40 ∙ 10
Λ 2.25 ∙ 10 0 5.49 ∙ 10 𝑊 3.86 ∙ 10 6.61 ∙ 10 5.85 ∙ 10
To evaluate the quality of the determined parameters in Table 5Error! Reference
source not found., a statistical evaluation of the training is given. The root‐mean square
error (RMSE) shows the average error is relatively small, while the result of the overall F‐
test demonstrates that the effects explained by the model far outweigh the residuals.
Table 5. Statistical evaluation of the determined parameters.
Value 0 mL Value 1 mL Value 2 mL
RMSE 6.746 ∙ 10 3.48 ∙ 10 5.538 ∙ 10
F‐test 5.429 ∙ 10 1.02 ∙ 10 6.581 ∙ 10
To visualize these in Figure 6, examples of the parameter estimation are given. The
model is able to depict the distribution broadening resulting from changing seed crystals
and stirrer speeds. A large extent of the observed errors results from the measurement
deviations as can be observed in (b). Here the model would expect a large concentration
Figure 5. FMEA for the sugar crystallization process.
3.2. Results of the Physico-Chemical Model
Parameter determination was done for the experiments with 0, 1, and 2 mL additiveseparately, as there is at this point no possibility to model the effects of the additive. Theaim of this is to identify the parameters which depend on the additive, whether it changeskinetics, breakage, or agglomeration. In Table 4, the results of the parameter determinationare given. For Λ in the center point, the routine returns 0, which is due to the design ofthe DoE scheme. This parameter scales the influence of stirrer speed on the occurrenceof breakage events, and as there was no difference in stirrer speed, the parameter cannothave any influence on breakage, as the breakage events are now reduced to γ according toEquation (14).

Processes 2022, 10, 373 9 of 12
Table 4. Results of the parameter determination for the three different additive classes 0, 1, and 2 mL.
Parameter Value 0 mL Value 1 mL Value 2 mL
k12 1.44× 10⁻⁵ 2.34× 10⁻⁶ 7.85× 10⁻⁵
k3 1.87 1.11 2.30γ 7.81× 10⁻⁵ 5.71× 10⁻⁵ 2.40× 10⁻⁵
Λ 2.25× 10⁻³ 0 5.49× 10⁻¹
We f f 3.86× 10⁻⁸ 6.61× 10⁻¹ 5.85× 10⁻²
To evaluate the quality of the determined parameters in Table 5, a statistical evaluationof the training is given. The root-mean square error (RMSE) shows the average error isrelatively small, while the result of the overall F-test demonstrates that the effects explainedby the model far outweigh the residuals.
Table 5. Statistical evaluation of the determined parameters.
Value 0 mL Value 1 mL Value 2 mL
RMSE 6.746× 10⁻² 3.48× 10⁻² 5.538× 10⁻²
F-test 5.429× 10⁴ 1.02× 10⁵ 6.581× 10⁴
To visualize these in Figure 6, examples of the parameter estimation are given. Themodel is able to depict the distribution broadening resulting from changing seed crystalsand stirrer speeds. A large extent of the observed errors results from the measurementdeviations as can be observed in (b). Here the model would expect a large concentration ofcrystals in class 3, however, much of the counted crystals are of class 4. In other experiments,as shown in (a), the smaller crystals are overrepresented in the data compared to the model.This is probably due to the smaller crystals are easier to count. Methods to rectify this effectare further discussed in Part 4.
Processes 2022, 10, x FOR PEER REVIEW 10 of 13
of crystals in class 3, however, much of the counted crystals are of class 4. In other exper‐
iments, as shown in (a), the smaller crystals are overrepresented in the data compared to
the model. This is probably due to the smaller crystals are easier to count. Methods to
rectify this effect are further discussed in Part 4.
(a) (b)
Figure 6. Results of the model for two different experiments (a) and (b) given as orange lines in
comparison to the experiment data, given as blue columns.
The fit of the concentration courses was also satisfying. In Figure 7, the concentration
courses of two different experiments are given. Comparing (a) and (b) the range of crys‐
tallization times in the DoE, resulting from the secondary effects becomes obvious. The
model allows for a good representation of the concentration course, even as the crystalli‐
zation times change from 5000 to 15,000 s. Experiments shown here are from the 0 mL
additive determination scheme, as such, the effects in particle size distribution and crys‐
tallization times that can be observed, solely result from the changed initial variables,
which are seed crystal mass, size, and stirrer speed.
(a) (b)
Figure 7. The concentration courses for two different experiments (a) and (b). Green crosses are
measured data, the dark blue line is the sigmoid function fit described in the methods, the orange
line is the result of the model.
4. Discussion
Based on the reported data, it is clear that a physico‐chemical model holds a signifi‐
cant advantage over a simple statistical evaluation. On the one side, the results of the
Figure 6. Results of the model for two different experiments (a,b) given as orange lines in comparisonto the experiment data, given as blue columns.
The fit of the concentration courses was also satisfying. In Figure 7, the concentrationcourses of two different experiments are given. Comparing (a) and (b) the range of crystal-lization times in the DoE, resulting from the secondary effects becomes obvious. The modelallows for a good representation of the concentration course, even as the crystallizationtimes change from 5000 to 15,000 s. Experiments shown here are from the 0 mL additivedetermination scheme, as such, the effects in particle size distribution and crystallizationtimes that can be observed, solely result from the changed initial variables, which are seedcrystal mass, size, and stirrer speed.

Processes 2022, 10, 373 10 of 12
Processes 2022, 10, x FOR PEER REVIEW 10 of 13
of crystals in class 3, however, much of the counted crystals are of class 4. In other exper‐
iments, as shown in (a), the smaller crystals are overrepresented in the data compared to
the model. This is probably due to the smaller crystals are easier to count. Methods to
rectify this effect are further discussed in Part 4.
(a) (b)
Figure 6. Results of the model for two different experiments (a) and (b) given as orange lines in
comparison to the experiment data, given as blue columns.
The fit of the concentration courses was also satisfying. In Figure 7, the concentration
courses of two different experiments are given. Comparing (a) and (b) the range of crys‐
tallization times in the DoE, resulting from the secondary effects becomes obvious. The
model allows for a good representation of the concentration course, even as the crystalli‐
zation times change from 5000 to 15,000 s. Experiments shown here are from the 0 mL
additive determination scheme, as such, the effects in particle size distribution and crys‐
tallization times that can be observed, solely result from the changed initial variables,
which are seed crystal mass, size, and stirrer speed.
(a) (b)
Figure 7. The concentration courses for two different experiments (a) and (b). Green crosses are
measured data, the dark blue line is the sigmoid function fit described in the methods, the orange
line is the result of the model.
4. Discussion
Based on the reported data, it is clear that a physico‐chemical model holds a signifi‐
cant advantage over a simple statistical evaluation. On the one side, the results of the
Figure 7. The concentration courses for two different experiments (a,b). Green crosses are measureddata, the dark blue line is the sigmoid function fit described in the methods, the orange line is theresult of the model.
4. Discussion
Based on the reported data, it is clear that a physico-chemical model holds a significantadvantage over a simple statistical evaluation. On the one side, the results of the physico-chemical model are more detailed, especially considering the concentration course, as itnot only gives the crystallization end time as a result. On the other hand, the particlesize distribution allows for a more complex distribution to take place, i.e., binary densitymaxima, which is not possible when working with a Weibull probability curve. In additionto these advantages, it should be pointed out that if a validated model is at hand, it canbe trained from the same experimental data as the DoE, and therefore does not demandany extra experiments. This is, however, not the case if nucleation should be a factor in thecrystallization process [13,16]. Then, polythermal experiments at different stirring ratesare needed to evaluate the borders of the metastable area [24]. In this context, it should benoted that the use of primary crystallization and, therefore, nucleation is not widely spreadin industrial crystallization due to the resulting challenges for solid–liquid separation [25],which plays a major role in process economics, as described above.
As we set out in the Introduction, the aim of this work is to design a model which canbe used to describe the course of an industrial sugar crystallization process given a definedstarting point. This enables the model to be used as a predictive tool to alter the startingpoint and optimize the process outcome. This qualifies the model as a Digital Twin, asopposed to a digital shadow [28]. However, as fluid, mechanically the stirring tank differssignificantly from an industrial crystallizer and the parameters have to be adjusted withthe help of industrial crystallization data.
The lack of fit of the probability density curves given by the Weibull fit, and to an extentthe lack of fit of the physico-chemical model to the experimental data, most probably resultsfrom the employed methods to measure the experimental results. The variance of countedcrystals for neighboring size classes would call for a higher crystal count to be evaluated.This, however, would be most optimally done dynamically during the crystallizationprocess, as in this way, the data set for parameter determination would be larger and morespread out over the process time and may result in easier model convergence. This datawould also enable the ability to better compare a physical and cyber state. As the sizedistribution is described by the skewness in the DoE, the comparison to the digital twinresults is lacking. The simplification of the digital twin results to the Weibull-parameterswas not feasible as the lack of fit of the Weibull curve is significant when calculated fromthe digital twin results. A method to obtain a smoother particle size distribution would beinline, in situ particle size measurements, already employed in wide parts of the industry,

Processes 2022, 10, 373 11 of 12
and which effects will be evaluated in future work, allowing us to improve parameterdetermination and model validation.
Author Contributions: Conceptualization: J.S.; methodology, experimental design, evaluation, andwriting: F.L.V.; editing and reviewing: F.L.V. and J.S.; supervision: J.S. All authors have read andagreed to the published version of the manuscript.
Funding: The authors want to gratefully acknowledge the Bundesministerium für Wirtschaft undEnergie (BMWi), especially Michael Gahr (Projektträger FZ Jülich), for funding the scientific work.We also kindly acknowledge the support of Open Access Publishing Fund of the Clausthal Universityof Technology.
Data Availability Statement: Data cannot be made publicly available.
Acknowledgments: The authors would like to thank Sebastian Rettmer, formerly a student at TUClausthal, for his considerate laboratory work in conducting experiments and microscopic evaluation,as well as the ITVP lab-team, especially Frank Steinhäuser, Volker Strohmeyer, and Thomas Knebel,for their efforts and support.
Conflicts of Interest: The authors declare no conflict of interest. The funders had no role in the designof the study; in the collection, analyses, or interpretation of data; in the writing of the manuscript, orin the decision to publish the results.
References1. McCabe, W.L.; Smith, J.C.; Harriott, P. Unit Operations of Chemical Engineering, 7th ed.; McGraw-Hill Higher Education: Boston,
MA, USA, 2005; ISBN 0-07-284823-5.2. SUSlick, K.S. Kirk-Othmer Encyclopedia of Chemical Technology; Wiley: New York, NY, USA, 2013; ISBN 9780471238966.3. Lambert, C.; Laulan, B.; Decloux, M.; Romdhana, H.; Courtois, F. Simulation of a sugar beet factory using a chemical engineering
software (ProSimPlus®) to perform Pinch and exergy analysis. J. Food Eng. 2018, 225, 1–11. [CrossRef]4. Mazaeda, R.; Merino, A.; de Prada, C.; Acebes, F. Hybrid modelling of batch centrifuges as part of a generic object oriented beet
Sugar Mill library. Simul. Model. Pract. Theory 2012, 22, 123–145. [CrossRef]5. Gleiss, M.; Hammerich, S.; Kespe, M.; Nirschl, H. Development of a Dynamic Process Model for the Mechanical Fluid Separation
in Decanter Centrifuges. Chem. Eng. Technol. 2018, 41, 19–26. [CrossRef]6. Kelly, F.H.C. Raw Sugar Quality; Congress of International Society of Sugar Cane Technologists: Durban, South Africa, 1974.7. Ditz, R.; Gerard, D.; Hagels, H.; Igl, N.; Schäffler, M.; Schulz, H.; Stürtz, M.; Tegtmeier, M.; Treutwein, J.; Strube, J. Proposal towards
a New Comprehensive Research Focus: Position Paper of the ProcessNet-Subject Division Plant Based Extracts—Products and Processes andthe European Working Group on Phytoextracts—Products and Processes; DECHEMA: Frankfurt, Germany, 2017.
8. Huter, M.; Schmidt, A.; Mestmäcker, F.; Sixt, M.; Strube, J. Systematic and Model-Assisted Process Design for the Extraction andPurification of Artemisinin from Artemisia annua L.—Part IV: Crystallization. Processes 2018, 6, 181. [CrossRef]
9. Both, S.; Eggersglüß, J.; Lehnberger, A.; Schulz, T.; Schulze, T.; Strube, J. Optimizing Established Processes like Sugar Extractionfrom Sugar Beets—Design of Experiments versus Physicochemical Modeling. Chem. Eng. Technol. 2013, 36, 2125–2136. [CrossRef]
10. Soares, R.M.; Câmara, M.M.; Feital, T.; Pinto, J.C. Digital Twin for Monitoring of Industrial Multi-Effect Evaporation. Processes2019, 7, 537. [CrossRef]
11. Foxon, K.M. An evaporator station model for estimating exhaust steam conversion and consumption. In ISJ's World SugarYearbook; 2021; pp. 20–31. Available online: https://internationalsugarjournal.com/paper-author/km-foxon/ (accessed on10 February 2022).
12. Lehnberger, A. IIoT for batch centrifugals—Initial results. In ISJ's World Sugar Yearbook; 2021; pp. 86–90. Available online:https://internationalsugarjournal.com/paper/iiot-for-batch-centrifugals-initial-results/ (accessed on 10 February 2022).
13. Mersmann, A.; Braun, B.; Löffelmann, M. Prediction of crystallization coefficients of the population balance. Chem. Eng. Sci. 2002,57, 4267–4275. [CrossRef]
14. David, R.; Marchal, P.; Marcant, B. Modelling of agglomeration in industrial crystallization from solution. Chem. Eng. Technol.1995, 18, 302–309. [CrossRef]
15. Schmok, K. Modelling of mechanism of agglomeration of KCl crystallization. Cryst. Res. Technol. 1988, 23, 967–972. [CrossRef]16. Laloue, N.; Couenne, F.; Le Gorrec, Y.; Kohl, M.; Tanguy, D.; Tayakout-Fayolle, M. Dynamic modeling of a batch crystallization
process: A stochastic approach for agglomeration and attrition process. Chem. Eng. Sci. 2007, 62, 6604–6614. [CrossRef]17. Codan, L.; Eckstein, C.F.; Mazzotti, M. Growth Kinetics of S—Mandelic Acid in Aqueous Solutions in the Presence of R -Mandelic
Acid. Cryst. Growth Des. 2013, 13, 652–663. [CrossRef]18. Lucke, M.; Koudous, I.; Sixt, M.; Huter, M.J.; Strube, J. Integrating crystallization with experimental model parameter determina-
tion and modeling into conceptual process design for the purification of complex feed mixtures. Chem. Eng. Res. Des. 2018, 133,264–280. [CrossRef]

Processes 2022, 10, 373 12 of 12
19. Sixt, M.; Uhlenbrock, L.; Strube, J. Toward a Distinct and Quantitative Validation Method for Predictive Process Modelling—Onthe Example of Solid-Liquid Extraction Processes of Complex Plant Extracts. Processes 2018, 6, 66. [CrossRef]
20. Kassing, M.; Jenelten, U.; Schenk, J.; Hänsch, R.; Strube, J. Combination of Rigorous and Statistical Modeling for ProcessDevelopment of Plant-Based Extractions Based on Mass Balances and Biological Aspects. Chem. Eng. Technol. 2012, 35, 109–132.[CrossRef]
21. Zogg, M. Einführung in Die Mechanische Verfahrenstechnik: Mit 29 Tabellen und 32 Berechnungsbeispielen, 3rd ed.; Überarb, A., Ed.;Teubner: Stuttgart, Germany, 1993; ISBN 3-519-16319-5.
22. Stieß, M. Verfahrenstechnik in Beispielen; Draxler, J., Siebenhofer, M., Eds.; Springer Fachmedien Wiesbaden: Wiesbaden, Germany,2014; ISBN 978-3-658-02739-1.
23. Uhlenbrock, L.; Jensch, C.; Tegtmeier, M.; Strube, J. Digital Twin for Extraction Process Design and Operation. Processes 2020, 8, 866.[CrossRef]
24. Huter, M. Modellunterstützte Prozessauslegung Unterschiedlicher Grundoperationen am Beispiel von Kontinuierlicher Ultrafil-tration und Absatzweiser Kristallisation. Ph.D. Dissertation, Technische Universität Clausthal, Clausthal-Zellerfeld, Germany,November 2020.
25. Hofmann, G. Kristallisation in der Industriellen Praxis; Wiley-VCH: Hoboken, NJ, USA, 2007; ISBN 9783527608881.26. Schuchmann, H.; Szembek, M.; Grüneberg, M.; Schubert, H. Einfluss von Partikeleigenschaften und Prozessparameter auf das
Strahlagglomerieren von Getränkepulvern. LWT Food Sci. Technol. 1994, 27, 350–357. [CrossRef]27. Ramkrishna, D. Population Balances: Theory and Applications to Particulate Systems in Engineering; Academic Press: San Diego, CA,
USA, 2000; ISBN 978-0-12-576970-9.28. Bergs, T.; Gierlings, S.; Auerbach, T.; Klink, A.; Schraknepper, D.; Augspurger, T. The Concept of Digital Twin and Digital Shadow
in Manufacturing. Procedia CIRP 2021, 101, 81–84. [CrossRef]