
Embedded Control System for a High Precision Flow ... - DiVA-Portal
82
Degree project in Communication Systems Second level, 30.0 HEC Stockholm, Sweden JOEL NILSSON Embedded Control System for a High Precision Flow Meter KTH Information and Communication Technology
-
Upload
khangminh22 -
Category
Documents
-
view
12 -
download
0
Transcript of Embedded Control System for a High Precision Flow ... - DiVA-Portal

Degree project inCommunication Systems
Second level, 30.0 HECStockholm, Sweden
J O E L N I L S S O N
Embedded Control System for a HighPrecision Flow Meter
KTH In fo rmat ion and
Commun ica t ion Techno logy

Embedded Control Systemfor a
High Precision Flow Meter
Degree project, in electronic and computer systems, second level
Joel Nilsson
Stockholm, 2011-10-03


Abstract
This degree project has been conducted to study flow meters and develop firmwarefor EC Instrument’s Reciflow. Flow rate is the volume of a fluid or mass of asubstance which passes through a surface per time unit. Conversion can be madebetween volumetric and mass flow rate if the gas density is known. A marketsurvey showed that Coriolis and thermal mass flow meters and positive displacement(volumetric) flow meters, as the Reciflow, are the most common kinds. The Reciflowconsist of a system-on-board and a displacement meter with an optical encoder. Thedisplacement meter is a cylinder with a piston within and valves at the ends. Thefirmware controls the valves so that the piston can reciprocate. The components ofthe Reciflow affects the accuracy and it is estimated to ±0,025 % for non-normalizedand ±0,2 % for normalized flow. It is measured under normal conditions to be±0,2 % normalized, relative to a reference. Further experiments must be performedto verify the accuracy and also the precision. The actual measurement of flow rateand volume is made with the encoder: as a difference in time between signal edgesand the total number of edges accounted for. Data with random noise is filteredwith moving average filters and heuristic methods is used to handle static noise.Serial communication has been implemented for on- and off-board uses. A usercan interact with the instrument using either a touchscreen or a terminal.
i

ii

Preface
EC Instruments is developing the Reciflow – a high precision flow meter with awide dynamic measuring range.
This degree project has been conducted at EC Instruments to develop parts of theembedded software (firmware) for the Reciflow instrument – a new implementationof a volumetric flow meter.
The project and the development of the Reciflow has gone well and everythingpoints to that the Reciflow is the new state of the art flow meter for low gasflows.
I want to give some thanks to: Mark Smith, my examiner at KTH Royal Instituteof Technology, as he was enthusiastic to accept this as my degree project; ErikCardelius and Mathias Eklund at EC Instruments for giving me the opportunity toparticipate in their development of the Reciflow and evolve my skills as an engineer;Martin Axelsson and Tim Nilsson for giving me feedback on this report.
Joel NilssonStockholm,June 2011
iii

iv

Contents
1 Introduction 11.1 Problem . . . . . . . . . . . . . . . . . . . . . . . . . . . . . . . . . 2
2 Flows and meters in theory 52.1 Flows . . . . . . . . . . . . . . . . . . . . . . . . . . . . . . . . . . 52.2 Meters . . . . . . . . . . . . . . . . . . . . . . . . . . . . . . . . . . 72.3 Accuracy, precision and resolution . . . . . . . . . . . . . . . . . . . 10
3 Market survey 133.1 Results . . . . . . . . . . . . . . . . . . . . . . . . . . . . . . . . . . 14
4 The Reciflow system 194.1 Displacement meter . . . . . . . . . . . . . . . . . . . . . . . . . . . 194.2 Optical sensor encoder . . . . . . . . . . . . . . . . . . . . . . . . . 204.3 Accuracy, precision and resolution . . . . . . . . . . . . . . . . . . . 21
5 The Reciflow firmware 255.1 Circular buffers . . . . . . . . . . . . . . . . . . . . . . . . . . . . . 255.2 RS-232 communication . . . . . . . . . . . . . . . . . . . . . . . . . 285.3 SPI communication . . . . . . . . . . . . . . . . . . . . . . . . . . . 305.4 Valve control . . . . . . . . . . . . . . . . . . . . . . . . . . . . . . 355.5 Data collection . . . . . . . . . . . . . . . . . . . . . . . . . . . . . 355.6 Moving average filter . . . . . . . . . . . . . . . . . . . . . . . . . . 41
v

CONTENTS
5.7 Data processing . . . . . . . . . . . . . . . . . . . . . . . . . . . . . 435.8 Data conversion . . . . . . . . . . . . . . . . . . . . . . . . . . . . . 465.9 User interfaces . . . . . . . . . . . . . . . . . . . . . . . . . . . . . . 49
6 Results 516.1 Numerical analysis with MATLAB . . . . . . . . . . . . . . . . . . 536.2 Accuracy and precision . . . . . . . . . . . . . . . . . . . . . . . . . 56
7 Discussion and conclusions 597.1 Numerical analysis with MATLAB . . . . . . . . . . . . . . . . . . 597.2 Accuracy and precision . . . . . . . . . . . . . . . . . . . . . . . . . 607.3 Flows and meters in theory . . . . . . . . . . . . . . . . . . . . . . 607.4 Market survey . . . . . . . . . . . . . . . . . . . . . . . . . . . . . . 617.5 Firmware . . . . . . . . . . . . . . . . . . . . . . . . . . . . . . . . 617.6 Further work . . . . . . . . . . . . . . . . . . . . . . . . . . . . . . 62
Bibliography 63
Appendices
vi

List of Abbreviations
ADC Analog to Digital Converter
ASCII American Standard Code for Information Interchange
CPU Central Processing Unit
CTS Clear To Send
DAC Digital to Analog Converter
DSP Digital Signal Processor
FIFO First-In-First-Out
FIR Finite Impulse Response
GUI Graphical User Interface
IDE Integrated Development Environment
IIR Infinite Impulse Response
ISR Interrupt Service Routine
LCD Liquid Crystal Display
vii

LIST OF ABBREVIATIONS
LDR Light Dependent Resistor
LED Light Emitting Diode
LSW Least Significant Word
MCU Micro Controller Unit
MSB Most Significant Bit
MSW Most Significant Word
NTC Negative Temperature Coefficient
PC Personal Computer
PIC Peripheral Interface Controller
RS-232 Recommended Standard 232
RTOS Real Time Operating System
RTS Request To Send
SPI Serial Peripheral Interface
TTL Transistor-Transistor Logic
UART Universal Asynchronous Receiver/Transmitter
USB Universal Serial Bus
viii

List of Figures
3.1 Schematic overview of the comparison in Table 3.1 . . . . . . . . . . 17
4.1 Block diagram of the system . . . . . . . . . . . . . . . . . . . . . . 204.2 Block diagram of the meter . . . . . . . . . . . . . . . . . . . . . . 214.3 Schematic of the encoder strip . . . . . . . . . . . . . . . . . . . . . 21
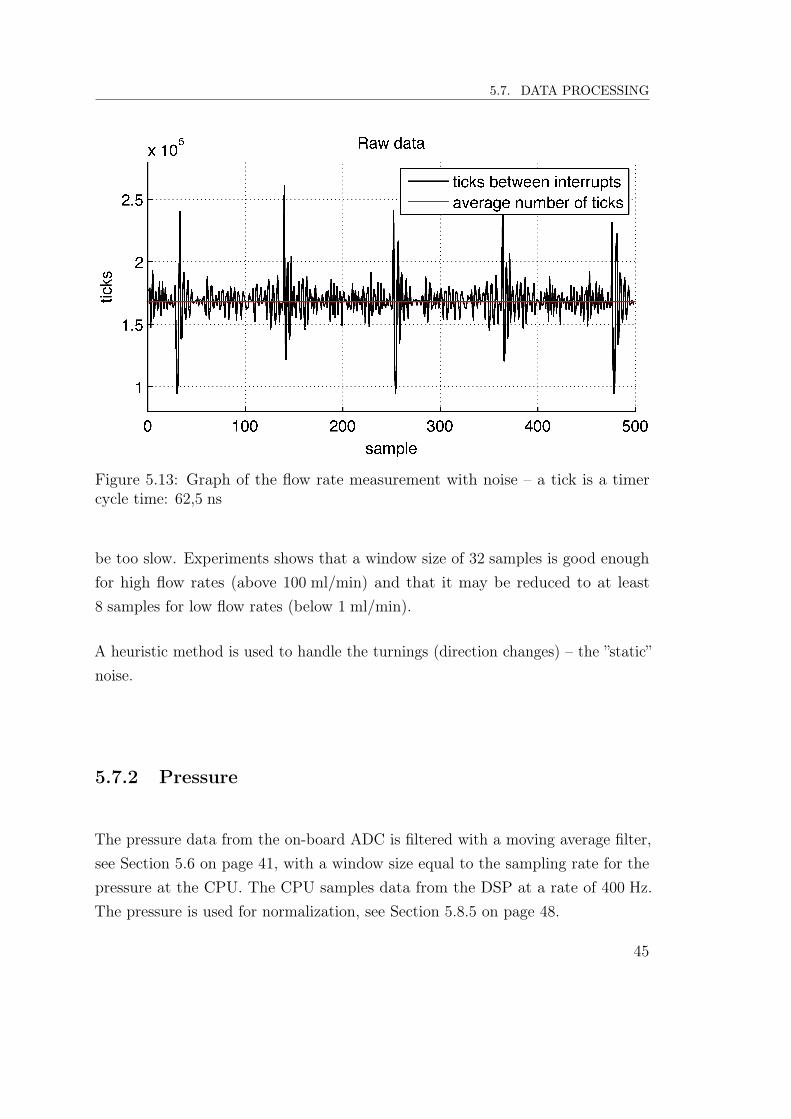
5.1 Flow chart of the main functions on the CPU and DSP . . . . . . . 265.2 Circular buffer with head and tail pointers, partly full . . . . . . . . 275.3 Linear buffer (array) behaving as a circular buffer . . . . . . . . . . 285.4 Flow chart of the UART receive interrupt (RS-232) . . . . . . . . . 315.5 Flow chart of the UART transmit interrupt (RS-232) . . . . . . . . 325.6 Flow chart of the RS-232 software module . . . . . . . . . . . . . . 335.7 Diagram of the SPI communication between the MCUs . . . . . . . 345.8 Flow chart of the limit sensor interrupts . . . . . . . . . . . . . . . 365.9 Flow chart of the change notification interrupt . . . . . . . . . . . . 385.10 Diagram of the change notification states . . . . . . . . . . . . . . . 395.11 Flow chart of the !ADRDY signal poller . . . . . . . . . . . . . . . 415.12 Flow chart of a moving average filter with a variable window size . 445.13 Graph of the flow rate measurement with noise – a tick is a timer
cycle time: 62,5 ns . . . . . . . . . . . . . . . . . . . . . . . . . . . 455.14 Graph, with linear fit, from measurements of pressure sensors . . . 48
6.1 Graph of the flow rate signal without processing @ 100 ml/min . . . 54
ix

LIST OF FIGURES
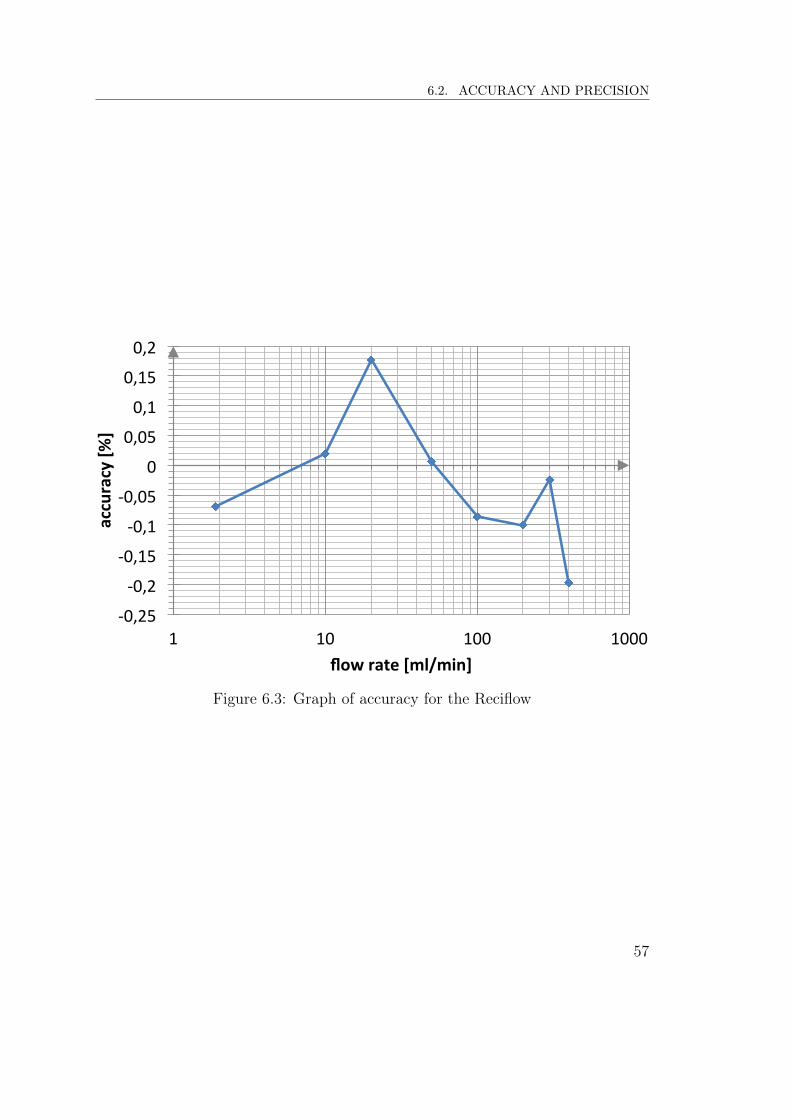
6.2 Graph of the flow rate signal with processing @ 100 ml/min . . . . 556.3 Graph of accuracy for the Reciflow . . . . . . . . . . . . . . . . . . 57
x

List of Tables
3.1 Comparison of flow meters for gas flows below ∼ 2 l/min . . . . . . 16
5.1 States for the change notification interrupt . . . . . . . . . . . . . . 365.1 States for the change notification interrupt (continued) . . . . . . . 37
xi

xii

Chapter 1Introduction
An embedded control system is a system with electronics and computers thatcontrols a device: in this case an instrument, another example is the anti-lockbraking system in a car or the control unit in a washing machine. The software inan embedded system is sometimes called firmware.
C is the most common programming language for firmware development and it isused in this project. The firmware is written for PICs, MCUs from Microchip [5],with their IDE: MPLAB X.
A flow meter is an instrument that measures the flow rate of a fluid. Flow metersare used for a wide range of applications in many areas. They can be foundmeasuring the amount of water flowing into a house, controlling the gas flow in amanufacturing process of semiconductor devices, calibrating and verifying otherflow meters and so on. It is therefore necessary that a flow meter has a highprecision (that a measurement is repeatable) and, depending on the application, ahigh accuracy [28].
The measuring principle for the flow meter in this project, called the Reciflow, isto lead a fluid into a cylinder and by controlling valves at the ends of this cylindera piston is made to reciprocate – repetitive back-and-forth motion. By measuringthe position of the piston within the cylinder and how it changes over time the flowrate can be measured [2].
1
CHAPTER 1. INTRODUCTION
The Reciflow is under development by EC Instruments, a quite recently foundedcompany in the area of Stockholm, Sweden. The company was founded in thesummer of 2010 with the purpose to develop flow meters using a new implementationof existing technologies to perform low flow measurements with a high accuracyand precision. The founders are engineers (M.Sc.) with backgrounds in medicaltechnology.
1.1 Problem
The problem to solve with this project was how the firmware should be implementto execute measurements with the wanted performance. The deliveries shouldbe a working prototype, which included parts not directly connected with themeasurement problem.
The issues to answer were
1. What is already done in this area?
2. How is it done?
3. What does competing products offer?
4. How shall the performance requirements be met?
5. How do the competitors solves this problem?
6. Will the performance requirements be met?
7. What are the customers needs in functions and interfaces?
and they were formalized in the following goals.
The main goals with this project was
• to conduct a pre-study on flows and meters
• to conduct a market survey
2

1.1. PROBLEM
• to compile a comparison chart and table of competing flow meters
• learn how to develop good firmware for embedded systems
• to develop parts of the Reciflow’s firmware
• to verify the performance of the instrument
The pre-study and market survey should try to answer the following ques-tions
• who are using flow meters
• what flow meters are used for
• how flow meters are used
• which interfaces to peripherals the competitors use
• how the competing products interact with the user
• if potential customers have any unanswered needs about the interfaces
• if there are any needs of data log storage
• which are the most common sensor types, how does they work in principaland what are their advantages and disadvantages
• which types of flows are there and how is conversion between them made
• what are the accuracy of the pressure and temperature sensors in this product
• how does the physics behind flow meters work
The firmware development had the following goals
• off-board RS-232 communication using the CPUs UART
• on-board SPI communication between the CPU and DSP
• support for the display
• a user interface with a debug console
3

CHAPTER 1. INTRODUCTION
• support for the touchscreen control
• a control function for the cylinder valves
• on-board SPI communication with the on-board ADC and DAC.
• an algorithm for the signal processing
• a prototype GUI
The wanted performance to achieve was
• Flow range, low flow version: 0,3 − 1000 ml/min.
• Flow meter accuracy, volumetric1: ≤ ±0,5 % of reading.
• Flow meter accuracy, standardized2: ≤ ±1,0 % of reading.
with the constraints that measurements would be made with air as medium undernormal pressure (∼ 1 kPa) and temperature (20 ∼ 25 ◦C). The precision was notexplicitly specified, but a measurement should always yield a result within theaccuracy. The resolution should be 1 µl/min for the lowest flow rate; a lesserresolution is acceptable for the higher flow rates.
1non-normalized2normalized
4

Chapter 2Flows and meters in theory
This chapter gives a short overview of the physics and theories behind flows offluids and flow meters. The fluids in this case is gases, but it can also be liquids,steams and so on.
2.1 Flows
There are two types of flow rates for fluids: volumetric flow rate and mass flow rate[10]. Volumetric flow rate is the volume of a fluid which passes through a givensurface per time unit. The volumetric flow rate is given by
Q = A · v (2.1)
where A is the cross-sectional area and v is the average velocity of the fluid.
Mass flow rate is the mass of a substance which passes through a given surface pertime unit. The mass flow rate is given by
m =dm
dt= ρ ·A · v = ρ ·Q (2.2)
where ρ is the density of the substance and Q is the volumetric flow rate, see
5
CHAPTER 2. FLOWS AND METERS IN THEORY
Equation (2.1).
The relationship between Equation (2.1) and (2.2) can be used to convert betweenvolumetric flow rate and mass flow rate if the density is known. According to theideal gas law
p ·V = n ·RM ·T =m
M·RM ·T (2.3)
the density, ρ = m/V , can be expressed as
ρ =p ·MRM ·T
(2.4)
where p is the absolute pressure, M is the molar mass of the substance, RM is theuniversal gas constant and T is the absolute temperature [7].
In thermodynamics it is common to define the specific gas constant as
R =RM
M(2.5)
and with this Equation (2.4) becomes
ρ =p
R ·T. (2.6)
Equation (2.4) and (2.6) is based on the ideal gas law which has its limits. Itis only accurate at relatively low pressures and high temperatures (for air thecritical pressure and temperature is 37 bar and −118 ◦C, respective [9]). With theintroduction of the so called gas compressibility factor (Z-factor) [28] this can becompensated for which leads to the true gas law
p ·V = Z ·n ·R ·T (2.7)
and now the density becomes
ρZ =p
Z ·R ·T. (2.8)
The Z-factor can be found in tables or extracted from charts. It is a function of
6
2.2. METERS
pressure, temperature and gas.
If the gas is being measured under ”ideal” conditions it is not necessary to com-pensate with the Z-factor since the accuracy is good enough. Cases where the realcharacteristics of the gas must be taken into account is near the condensation point,critical points and at high pressures. A critical point is where there is no cleardistinction between two phases of the fluid – liquid and gas. A high pressure ismagnitudes above the atmospheric pressure of ∼ 1 bar. The Reciflow does not allowso high pressures or extreme temperatures so the ideal gas law will be sufficient inthis case; it is designed for a maximum pressure of 3 bar and a temperature in theinterval of 0 − 50 ◦C.
2.2 Meters
There a three typical methods to measure flow rate in gases: volumetric, true massand inferential mass [11]. True mass flow measurement means that the measuredparameter is the mass flow rate per se (the molecular weight), in other words not theproduct of the density and volumetric flow rate as in Equation (2.2); for exampleCoriolis flow meters does this measurement [28], see Section 2.2.1 on the followingpage. Inferential mass flow measurement means that parameters to calculate themass flow rate is measured [28], in other words the mass flow rate is calculated as afunction of for example volumetric flow rate, temperature and pressure. Volumetricflow rate means that the volume and not the mass of the fluid is measured.
Flow meters that are measuring the mass flow is the most common kind for low flowgas measurements and these can be booth true (Coriolis) or inferential (thermal),see Table 3.1 on page 16. Mass flow meters can also be used to measure thevolumetric flow rate indirectly and vice versa. However, it is more suitable to use ameter that measures the wanted flow rate directly and as mentioned above thereare volumetric flow meters too; for low gas flows these are typical of the positivedisplacement kind, see Section 2.2.3 on page 9.
7

CHAPTER 2. FLOWS AND METERS IN THEORY
2.2.1 Coriolis mass flow meter
The Coriolis mass flow meter uses the basic principles of motion mechanics toweight the fluid as it passes through the meter. A fluid in motion through avibrating tube causes a so called Coriolis force to act in proportion to the mass ofthe fluid. The flow of fluid is forced to accelerate when it moves towards the pointof vibration peak amplitude and deaccelerate when it moves away from the peak.This causes the fluid to exert a force on the inlet side of the tube in resistance tothe acceleration and the inlet side lags behind the no-flow position; on the outletside it is the opposite and the outlet side leads ahead the no-flow position. Theresult of these forces is a twisting of the tube that can be measured and used forcalculation of the mass flow rate [28].
The Coriolis force is given by
F = 2 ·m ·ω · v (2.9)
where m is the mass, ω is the angular motion and v is the velocity. Furthercalculations, see [28], leads to this expression for the mass flow rate
W = K · ∆t (2.10)
where K is a geometric constant and ∆t is a time interval. K is temperaturedependent.
This is a true mass flow meter since it uses the properties of mass to measure theflow rate [28]. Its advantages is high accuracy due to virtually independence ofchanging fluid parameters [28], multi-parameter measurement (mass and density)[12] and no moving parts. Its disadvantages is that it is sensitivity to vibrations;that it needs zero offset calibration to withhold the promised performance whenthe operating temperature deviate to much (∼ ±10 ◦C) [28].
8

2.2. METERS
2.2.2 Thermal mass flow meter
The thermal mass flow meter measures how one heat characteristic of the fluidvaries as a function of the flow. This measurement can be divided into two types:"rate of heat loss to the flow stream" and "temperature rise of the flow stream"[28].
The heat loss to the flow stream is in practice measured with a sensor that is eitherheated with a constant power or heated to a constant temperature. The flow rateis then a function of change in temperature or change in required power. Thedisadvantages with these sensors are "nonlinear response, sensitivity to the thermalconductivity of the gas and dependency on the velocity profile due to the singlepoint of measurement" [28].
The relationship between the heat flow and mass is given by
Q = cp ·m · ∆T (2.11)
where Q is the heat flow, cp is the specific heat capacity for a constant pressure, mis the mass and ∆T the temperature difference [7].
A thermal mass flow meter can be either an inferential or a true mass flow meter[25]. It is for an example an inferential mass flow meter when the measurementis based on Equation (2.11). Its advantages is no moving parts, no need for anycorrections based on temperature and that it can be placed directly into the flow(dependent of the implementation). When it is a true mass flow meter it has theextra advantage that there is no need for correction based on pressure.
2.2.3 Positive displacement flow meter
The positive displacement flow meter, as the Reciflow, is a volumetric flow meter. Itmeasures how fast the fluid displaces an object of a known surface area, for examplea piston in a cylinder. The flow rate is then calculated as in Equation (2.1). Thepressure to move the piston in the cylinder implementation is very low ∼ 1 mbar
9

CHAPTER 2. FLOWS AND METERS IN THEORY
and its bias neglected; compression/decompression of the gas can be compensatedfor with heuristic methods in the firmware. The advantages is that it measures thevolumetric flow rate directly without the need to know any characteristics of thefluid, which allows a high accuracy. A disadvantage is moving parts that eventuallywill be worn out.
A disadvantage with the piston displacement flow meters currently at the market isthat they cannot perform continuously measurements, they can only take samplesat the turning points. An effect of this is that it can takes minutes to get a resultfor very low flows. The Reciflow does not have this disadvantage since its samplerate is a function of the encoders resolution, see Section 4.2 on page 20, and theflow rate.
2.3 Accuracy, precision and resolution
All the components that a flow meter is constructed from introduces an uncer-tainty in the accuracy and precision of the measurement. These components canbe organized into the following three categories: computational, electrical andmechanical.
Uncertainties to take into account are in this case the measurements of temperature,pressure, velocity and position, the tolerance of the piston’s cross-sectional areaand the encoder strip, see Section 4.3 on page 21 for more details.
Accuracy is a figure of a measured value’s closeness to the true value. The usualmethod to calculate a system’s accuracy is
System accuracy =√x1 · y21 + x2 · y22 + . . .+ xi · y2i (2.12)
where xi are the sensitivity coefficients of the various errors and yi the componentsaccuracy [28].
The accuracy is expressed as per cent of the actual flow rate or full scale flow rate.
10

2.3. ACCURACY, PRECISION AND RESOLUTION
For linear flow meters, as this case, the latter is preferable [28]
Full scale accuracy = ±Flow rate uncertaintyFull scale flow rate
· 100 (2.13)
but the first one is often used in the reality (at the market)
Rate accuracy = ± Flow rate uncertaintyInstantaneous flow rate
· 100 . (2.14)
The flow rate uncertainty is the system error expressed as a flow rate, for example0,3 ml/min.
Precision is a figure of the measurements repeatability. Components that aresensitive to for example variations in the ambient temperature will degrade theprecision as the measurement will vary with temperature. However, if the deviationis linear and the temperature is known it can be compensated for. For flow metersa high precision are usually wanted [28] as it is important to be sure that theinstrument measures correct on different occasions.
Resolution is a figure of the smallest change that can be detected and accounted for.For example, in this case the measurement of piston displacement is limited by theresolution of the optical encoder, see Section 4.3 on page 21. From a computationalpoint of view: resolution is the smallest value that can be represented and storedas a binary sequence of bits; the number of bits decides the resolution.
11

12

Chapter 3Market survey
A survey of the market has been made to see what competing products has tooffer in functionality, accuracy and precision. The functionality overview has beenfocusing on interfaces and data storage.
The survey is based on data sheets from competitors and discussions between ECInstruments and dealers.
Which interfaces does competing products have
a) with peripherals to the instrument?
b) to the user?
An interface to peripherals is desirable if for example the user wants to control theinstrument from an external device (for example a PC) or wants the instrument tocontrol a peripheral (for example a pressure regulator).
Does the user have any need of additional storage, for example data logs and graphsto a USB mass storage device?
13
CHAPTER 3. MARKET SURVEY
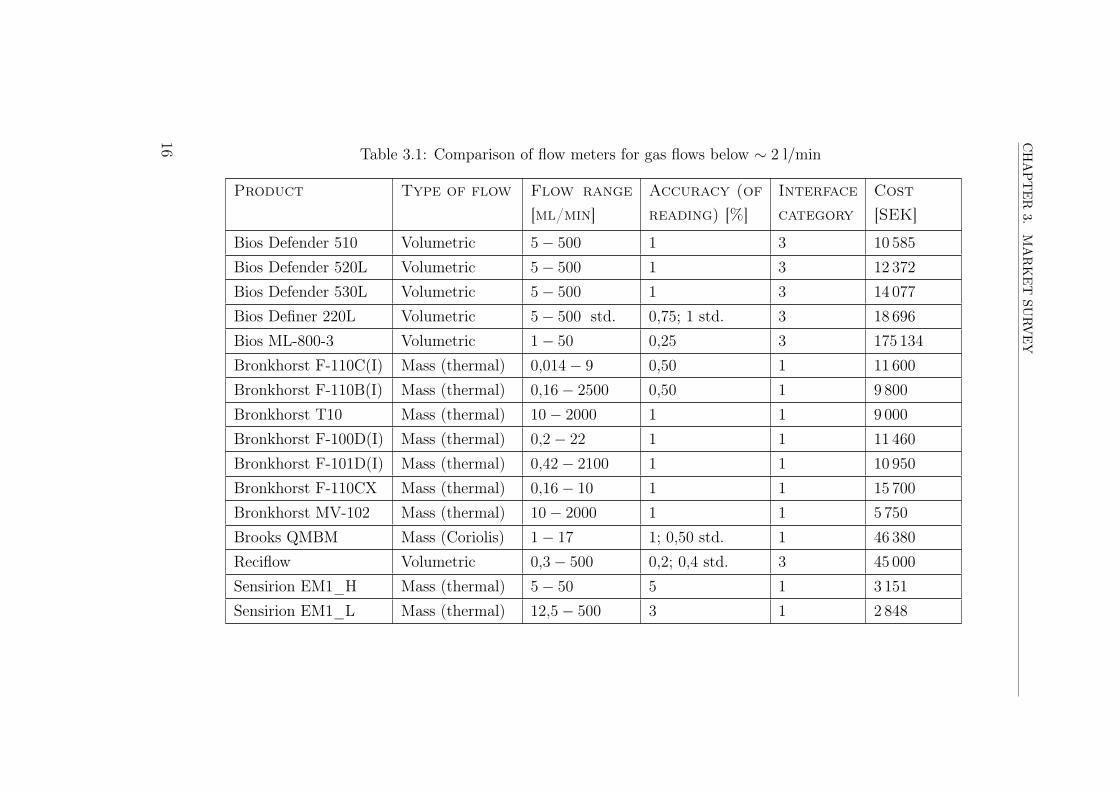
3.1 Results
The comparison of figures, like accuracy, has been focusing on flow meters for lowgas flows, where low flow was defined as about 2 l/min and below. The result,based on data sheets provided by the manufactures, can be viewed in Table 3.1on page 16 and a summary in Figure 3.1 on page 17. All manufactures has notspecified the conditions for the accuracy so the comparison is not complete and forexample the accuracy for Bronkhorst’s instruments is dependent of the ambienttemperature.
Serial communication using the RS-232 specification [33] is the most commondigital interface. The application may vary but typically it is used for configurationand also reading/collecting of data; some devices at the market has no built-inuser interfaces (as they are intended to be installed without user access) and aredependent of communication via a digital link to interact with the user.
There are other digital interfaces and usually a company has settled for only oneadditional to RS-232 (there are exceptions). Amongst them RS-485 [32], DeviceNet[29] and I2C [30] can be found. The exception mentioned above is a so calledMultiBus [1] which allows plugin modules for various interfaces; this allow thecustomer to tailor the flow meter for its specific need of network.
Analog interfaces are also quite common. The device outputs a voltage or currentin an interval that can be used to control external peripherals, for example reg-ulators. Typical the interval is 0 − 5 VDC for the voltage and 0 − 20 mA for thecurrent.
In one or another way the user needs to interact with the flow meter, for exampleto start a measurement and read the result or set it up – this is done via a userinterface.
There are three main categories of user interfaces in competing products
1. None included / external device
2. Display / LEDs
14
3.1. RESULTS
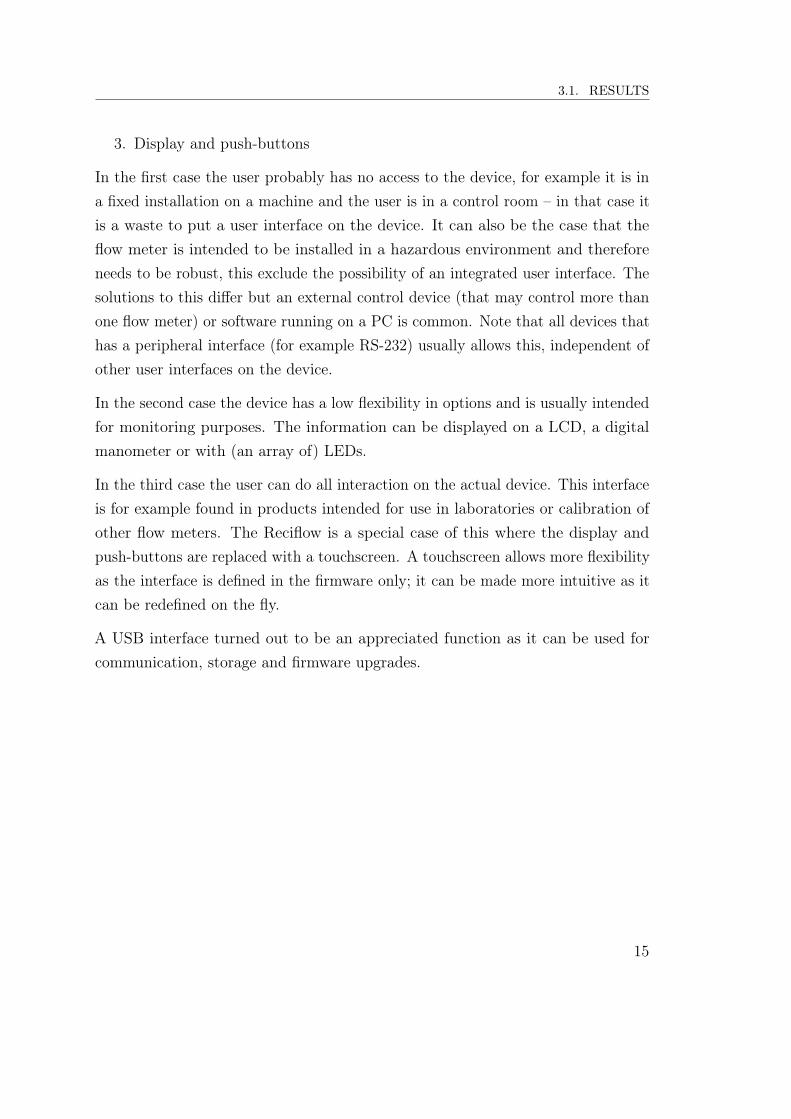
3. Display and push-buttons
In the first case the user probably has no access to the device, for example it is ina fixed installation on a machine and the user is in a control room – in that case itis a waste to put a user interface on the device. It can also be the case that theflow meter is intended to be installed in a hazardous environment and thereforeneeds to be robust, this exclude the possibility of an integrated user interface. Thesolutions to this differ but an external control device (that may control more thanone flow meter) or software running on a PC is common. Note that all devices thathas a peripheral interface (for example RS-232) usually allows this, independent ofother user interfaces on the device.
In the second case the device has a low flexibility in options and is usually intendedfor monitoring purposes. The information can be displayed on a LCD, a digitalmanometer or with (an array of) LEDs.
In the third case the user can do all interaction on the actual device. This interfaceis for example found in products intended for use in laboratories or calibration ofother flow meters. The Reciflow is a special case of this where the display andpush-buttons are replaced with a touchscreen. A touchscreen allows more flexibilityas the interface is defined in the firmware only; it can be made more intuitive as itcan be redefined on the fly.
A USB interface turned out to be an appreciated function as it can be used forcommunication, storage and firmware upgrades.
15
CH
AP
TE
R3.
MA
RK
ET
SURV
EY
Table 3.1: Comparison of flow meters for gas flows below ∼ 2 l/min
Product Type of flow Flow range
[ml/min]
Accuracy (of
reading) [%]
Interface
category
Cost
[SEK]
Bios Defender 510 Volumetric 5 − 500 1 3 10 585Bios Defender 520L Volumetric 5 − 500 1 3 12 372Bios Defender 530L Volumetric 5 − 500 1 3 14 077Bios Definer 220L Volumetric 5 − 500 std. 0,75; 1 std. 3 18 696Bios ML-800-3 Volumetric 1 − 50 0,25 3 175 134Bronkhorst F-110C(I) Mass (thermal) 0,014 − 9 0,50 1 11 600Bronkhorst F-110B(I) Mass (thermal) 0,16 − 2500 0,50 1 9 800Bronkhorst T10 Mass (thermal) 10 − 2000 1 1 9 000Bronkhorst F-100D(I) Mass (thermal) 0,2 − 22 1 1 11 460Bronkhorst F-101D(I) Mass (thermal) 0,42 − 2100 1 1 10 950Bronkhorst F-110CX Mass (thermal) 0,16 − 10 1 1 15 700Bronkhorst MV-102 Mass (thermal) 10 − 2000 1 1 5 750Brooks QMBM Mass (Coriolis) 1 − 17 1; 0,50 std. 1 46 380Reciflow Volumetric 0,3 − 500 0,2; 0,4 std. 3 45 000Sensirion EM1_H Mass (thermal) 5 − 50 5 1 3 151Sensirion EM1_L Mass (thermal) 12,5 − 500 3 1 2 848
16

3.1. RESULTS
Bronkhorst T/MV
Bronkhorst F
0 20000
3
1
Accuracy [%]
Range [ml/min]
0,5
0,25Reciflow
1000
Bios DefenderBios Definer
Bios ML
Sensirion
Figure 3.1: Schematic overview of the comparison in Table 3.1
17

18

Chapter 4The Reciflow system
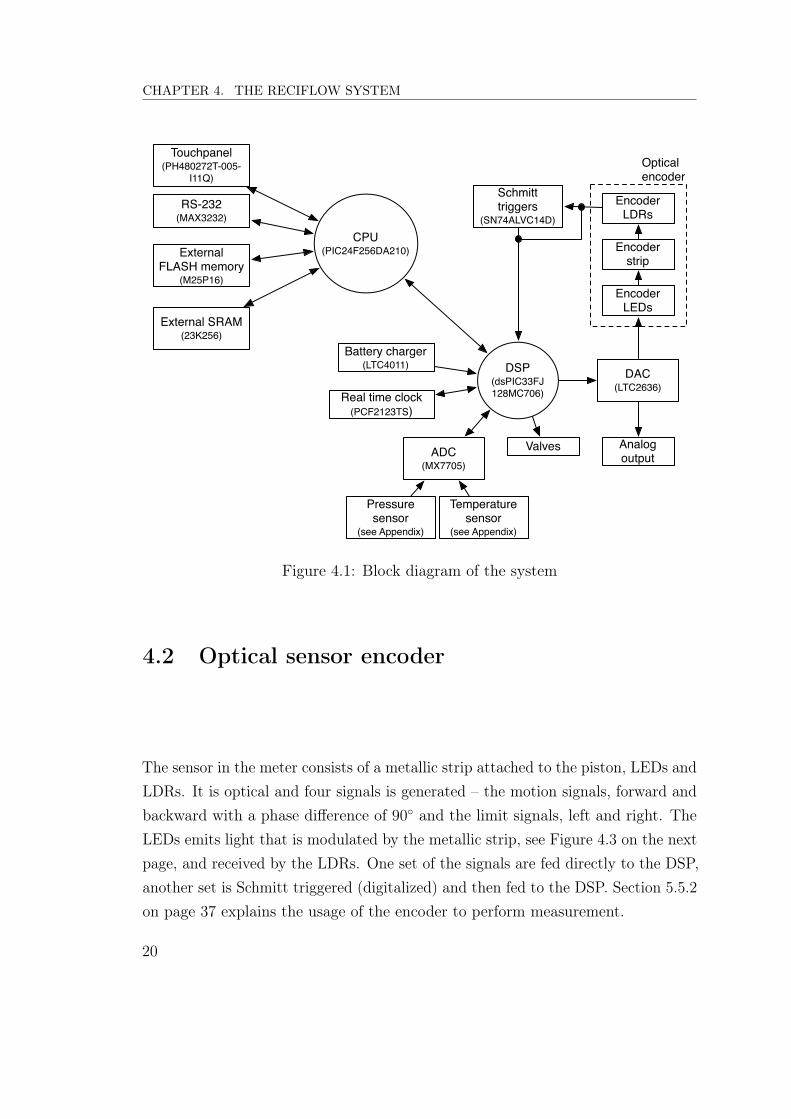
The hardware is a system-on-board with two MCUs, entitled CPU and DSP, and aset of on-board peripherals, for example converters between the analog and digitaldomains. A block diagram of the system can be viewed in Figure 4.1 on thefollowing page.
4.1 Displacement meter
The meter consist of a glass cylinder with a piston made from a corrosion resistantmaterial. The mechanical tolerance and the material properties provides a virtuallyleak free viscous seal between the piston and cylinder walls. At each end of thecylinder an electrical controlled valve is installed to control the flow [2]. The valvecontrol makes it possible for the piston to reciprocate in the cylinder, as a functionof the flow direction – see Section 5.4 on page 35. For a block diagram of the meter,see Figure 4.2 on page 21.
19
CHAPTER 4. THE RECIFLOW SYSTEM
CPU(PIC24F256DA210)
DSP(dsPIC33FJ128MC706)
RS-232(MAX3232)
DAC(LTC2636)
ADC(MX7705)
Encoder LEDs
Encoder LDRs
Pressure sensor
(see Appendix)
Temperature sensor
(see Appendix)
Touchpanel(PH480272T-005-
I11Q)Schmitt triggers
(SN74ALVC14D)
Valves
External FLASH memory
(M25P16)
Encoder strip
Opticalencoder
Analog output
Real time clock(PCF2123TS)
Battery charger (LTC4011)
External SRAM (23K256)
Figure 4.1: Block diagram of the system
4.2 Optical sensor encoder
The sensor in the meter consists of a metallic strip attached to the piston, LEDs andLDRs. It is optical and four signals is generated – the motion signals, forward andbackward with a phase difference of 90◦ and the limit signals, left and right. TheLEDs emits light that is modulated by the metallic strip, see Figure 4.3 on the nextpage, and received by the LDRs. One set of the signals are fed directly to the DSP,another set is Schmitt triggered (digitalized) and then fed to the DSP. Section 5.5.2on page 37 explains the usage of the encoder to perform measurement.
20

4.3. ACCURACY, PRECISION AND RESOLUTION
Figure 4.2: Block diagram of the meter
4.3 Accuracy, precision and resolution
As discussed in Section 2.3 on page 10 the components of the system affects theresulting accuracy, precision and resolution. For the Reciflow the main factorsare
• Piston
• Encoder
Left limit
Right limitWindow
Figure 4.3: Schematic of the encoder strip
21

CHAPTER 4. THE RECIFLOW SYSTEM
• Voltage reference
• A/D converter
• Thermistor (temperature sensor)
• Pressure sensor
The piston is the component being displaced by the flow and it affects theaccuracy in two ways: the tolerance of its diameter and a possible leakage.
Calculations of flow rate and volume depends on the displaced volume which isgiven by
V (x) = π · r2 ·x (4.1)
where r is the piston’s radius and x is the moved distance. This implies that theprecision of the piston’s diameter affects the accuracy of the calculation. Theprecision of the piston’s diameter depends on the tolerance in the manufacturingbut it can be compensated for.
There is a virtually leak free viscous seal between the piston and cylinder walls,but it is not entirely leak free. For very low flows it cannot be negligible, but itcan be compensated for.
The encoder is the component used to measure the piston’s movement. It is anoptical encoder and a strip made of metal, see Figure 4.3 on the preceding page,is used to modulate the optical signals. The tolerance of the distance betweenthe slits in the strip affects the accuracy, which is approximately ±0,025 % fromthe left to the right limit with respect to the distance the piston moves. It has aresolution of 0,1 mm.
The voltage reference (Analog Devices ADR363 [15]) is the component thatgenerates a reference voltage which is used by the ADC, pressure sensor and thethermistor circuit. The voltage reference has a typical value of 3 V with an accuracy
22

4.3. ACCURACY, PRECISION AND RESOLUTION
of ±0,1 %. The temperature coefficient is only 9 ppm/◦C and can be neglectedsince it is below the ADC’s resolution.
The A/D converter (Maxim MX7705 [24]) is the component that converts theanalog signals from the thermistor circuit and the pressure sensor to the digitaldomain. It will therefore limit the possible resolution and affect the accuracy. TheADC used in this system has a resolution of 16 bits and with a reference voltage at3 V it gives a resolution of 3/216 ≈ 45,8 µV. The noise is 2,79 µV when convertingthe temperature signal (gain 2, buffered) and 5,16 µV when converting the pressuresignal (gain 1, unbuffered) [24]. The noise in the ADC is in other words negligiblesince the resolution is lower than the noise.
The accuracy of the reference voltage affects the result for the pressure conver-sion since the voltage may not be exact 3 V. The effective resolution will be45,3 − 46,2 µV for an accuracy of ±0,1 % – it is in other words still negligible. Itdoes not affect the temperature conversion since the thermistor circuit uses thesame reference
The temperature sensor (see Appendix) is the component used to measure thetemperature in the meter and it only affects the accuracy when the measurementsare normalized; since normalization is a function of temperature and pressure. Thesensor consists of a thermistor and an electrical circuit, so the accuracy is limitedby the thermistor itself and the tolerance of the components in the circuit. Thethermistor has an accuracy from ±0,05 % to ±0,15 % dependent of the temperaturein a span of 0 − 50 ◦C; at room temperature (∼ 25 ◦C) its accuracy is ±0,1 %. Theelectric circuit has an accuracy of 0,1 % (defined by a resistor).
The pressure sensor (see Appendix) is the component used to measure thepressure and like the temperature sensor it only affects the accuracy for normaliza-tion; since normalization is a function of temperature and pressure. The sensor hasa non-linearity error of ±0,1 % of span and a hysteresis of ±0,02 % of span. It alsohas a temperature dependent error of ±0,75 % of span which can be compensated
23

CHAPTER 4. THE RECIFLOW SYSTEM
for since the temperature is known.
24

Chapter 5The Reciflow firmware
This chapter describes how the firmware has been implemented and some principlesregarding it. The firmware is developed from scratch, no RTOS is used, but softwarelibraries from Microchip – Microchip Application Library [4] – has for examplebeen used for the touchscreen and USB. The development has been made on PCsrunning Microsoft Windows 7 [36] and Apple Mac OS X Snow Leopard [31] withMicrochip’s IDE MPLAB X [20]; with the IDE a proprietary compiler based ongcc [3] is included. The main flow for the firmware on the CPU and DSP can beviewed in Figure 5.1 on the next page.
5.1 Circular buffers
Circular buffers, also known as ring or cyclic buffers, is a common method to bufferdata streams [26] to make sure that no samples are missed when the executiontime or sample rate is undeterministic.
A circular buffer is really an ordinary array (linear buffer) with a constant sizein the data memory. Additional index pointers and counters makes it possible tomimic a circular buffer with software routines, see Figure 5.2 on page 27.
Two index pointers are used – head and tail. Data is added at the tail, enqueued,
25

CHAPTER 5. THE RECIFLOW FIRMWARE
CPUStart
Infinite loop
Run the GUI
module
Run the RS-232 module
Main initialization
DSPStart
Infinite loop
Run the ADC extern module
Run the flow measurement
module
Main initialization
Run the peripherals
module
Run the SPI module
a data word receivedin the SPI buffer
SPI
Figure 5.1: Flow chart of the main functions on the CPU and DSP
26

5.1. CIRCULAR BUFFERS
Figure 5.2: Circular buffer with head and tail pointers, partly full
and at the head it is read and removed, dequeued. The head index is incrementedat a dequeue and the tail index is incremented at an enqueue. When an indexreaches the end of the array it wraps, in other words ”rewinds” to the beginninghence the cyclic behavior, see Figure 5.3 on the next page.
There are different methods to keep track of the number of objects in the bufferand therefore check if it is empty, full or something in between: use the positionof the index pointers, use a separate fill counter or use two separate counters forreads and writes. The latter is the most robust in a multi-threaded environment oran environment with interrupts, as in this case, so it is used for the filter buffersand RS-232 communication, see Section 5.2 on the following page and Section 5.7on page 43. It is more robust since different ”threads” does not alters the samedata.
27

CHAPTER 5. THE RECIFLOW FIRMWARE
Head Tail
2 3 4 5 6 7 8 9 10 11 12 13
Head Tail
16 9 10 11 12 13 14 15
HeadTail
Empty buffer
Partly full buffer
Partly full buffer,tail rewinded
16 17 18 19 20 21 22 23 24 25 10 11 12 13 14 15
HeadTail
Full buffer
Figure 5.3: Linear buffer (array) behaving as a circular buffer
5.2 RS-232 communication
RS-232 is a standard that defines the signaling and connectors for a particularserial connection. It originated in the 1960s and is still today very common forcommunication between devices [33]. It is included in almost all flow meters forlow gas flows, see Section 3.1 on page 14.
In MCUs there are buses, multiple lines, where data words (a series of bits) canbe transferred in parallel. However, as mentioned above, the RS-232 is a serialcommunication, in other words only one bit can be sent per time unit. A UARTis a piece of hardware that is used to translate the data between the parallel andseries forms. The UART is asynchronous and full duplex (like a telephone), so datacan be transmitted and received independently.
28

5.2. RS-232 COMMUNICATION
5.2.1 Implementation
The CPU is responsible for the RS-232 communication and one of the UARTmodules integrated in the PIC24F is used for this purpose. Conversion between theTTL voltage levels, generated by the PIC, and RS-232 voltage levels is made withan on-board device designed for that – Texas Instruments MAX3232 [23]. RS-232signals used in this implementation are: transmit data, receive data, CTS and RTS;the default configuration for the communication is a data rate of 115 kbaud witheight data bits, no parity bit and one stop bit [33].
The UART module has two separate buffers in its hardware; one for incomingdata and one for outgoing data. The buffers are four levels deep (equivalent tofour characters) and FIFO [21]. Since large data streams will be transceivedadditional circular buffers, see 5.1 on page 25, are implemented in the firmware toavoid overflow. However, if the data rate is too high the communication will betemporarily halted by the hardware flow control (the CTS and RTS signals).
This implementation of UART communication is made none-blocking with the useof interrupts to allow fast response – no polling is used. The interrupt handlinggives a slight overhead in computation but it is common practice in this case. Theinterrupts are raised by the hardware buffers, separately, and can be configured inseveral ways: first character received, hardware buffer full and so on.
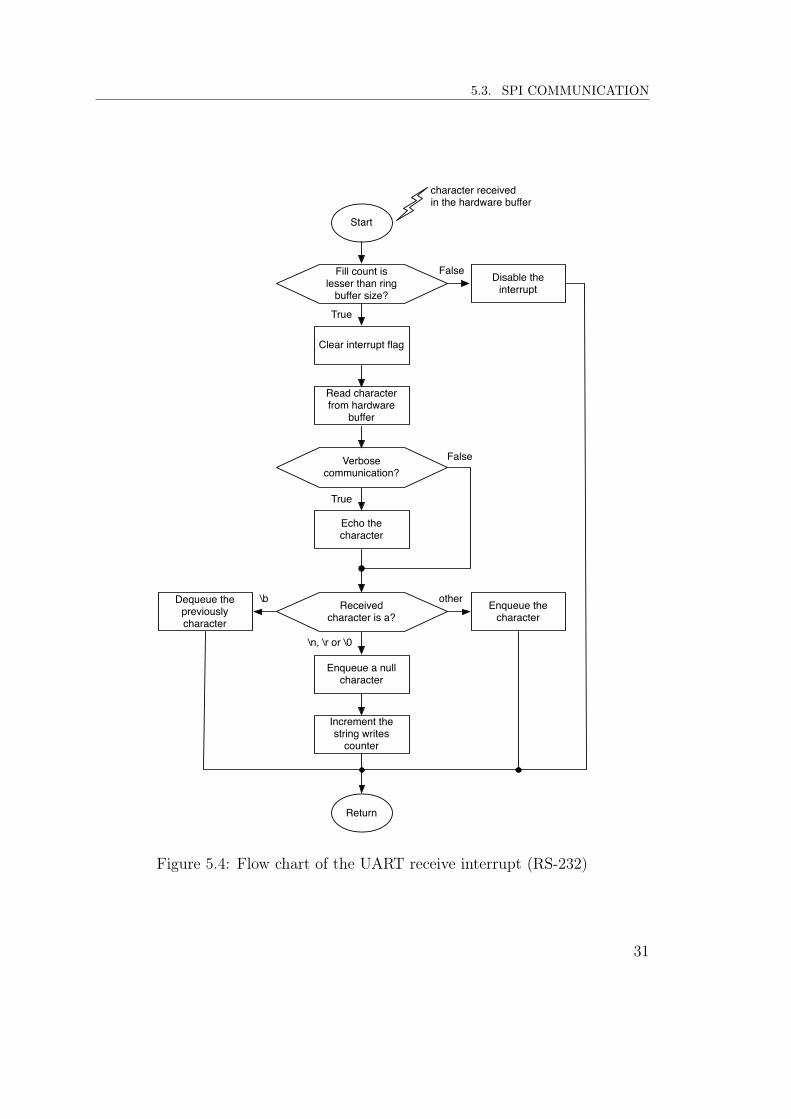
At the receiving side an interrupt is raised as soon there is a character in theincoming buffer. The receiving ISR, Figure 5.4 on page 31, reads the characterfrom the buffer and echoes it back to the sender if verbose mode is activated.The verbose mode is used when RS-232 is used for communication with a userand a terminal. When communication is made with another device it is probablypreferable with the non-verbose mode.
Depending on the received character one of three cases is executed:
1. The received character is a backspace (ASCII 0x08); the previously storedcharacter is removed from the circular buffer.
2. The received character is a line feed, carriage return or null (ASCII 0x0A,
29

CHAPTER 5. THE RECIFLOW FIRMWARE
0x0D or 0x00); a null character is stored in the circular buffer and a counteris incremented that is used by the RS-232 software module to calculate howmany strings that is stored in the buffer.
3. The received character is anything (7-bit ASCII) besides the four above andis then stored in the circular buffer.
By default the interrupt at the transmitting side is disabled. The software routineused for writing strings to the circular transmitting buffer, mimicking printf()
[8], enables the interrupt when a string is stored in the circular buffer or when thebuffer is full. The transmitting ISR, Figure 5.5 on page 32, dequeues charactersfrom the circular buffer and writes them to the output buffer until the circularbuffer is empty; it then disables the transmitting interrupt again.
When there are received strings the RS-232 software module, Figure 5.6 on page 33,performs further execution. The first step is to convert the string to a command; atext command for the Reciflow consists of two parts – an instruction and optionaldata, separated with a blank space. The software divides the string to its two parts;the instruction string is then compared to a set of pre-defined strings and translatedto an integer corresponding to a instruction in a set (enumerate) shared by theCPU and DSP; the data string is converted to a 16-bit unsigned integer.
When the received string has been translated to an instruction and data the RS-232module reacts to this command. In many cases the instruction and data will berelayed to the DSP by using the MCUs shared SPI channel, see Section 5.3. Inthese cases the CPU waits for the response and then reacts to it. The responseis either data from the DSP or an acknowledge/negative acknowledge to if thecommand was executed or not.
5.3 SPI communication
SPI is a serial data link, that unlike RS-232 is synchronous. The communication iscontrolled and initiated by a master device that communicates with an arbitrarynumber of slaves. The communication is synchronized with a clock signal that is
30
5.3. SPI COMMUNICATION
Start
Fill count is lesser than ring
buffer size?
Clear interrupt flag
character receivedin the hardware buffer
Read character from hardware
buffer
Verbose communication?
Echo the character
Received character is a?
Dequeue the previously character
Enqueue the character
Enqueue a null character
Increment the string writes
counter
Disable the interrupt
Return
True
False
\b
\n, \r or \0
other
True
False
Figure 5.4: Flow chart of the UART receive interrupt (RS-232)
31

CHAPTER 5. THE RECIFLOW FIRMWARE
Start
Fill count is greater than
zero?
Clear interrupt flag
character(s)in the hardware buffer
Disable the interrupt
True
False
Dequeue character
Transmit character
Return
Figure 5.5: Flow chart of the UART transmit interrupt (RS-232)
generated by the master during a transmission. For each clock cycle a bit is shiftedout from the master and into the selected slave and vice versa [34].
5.3.1 Implementation for the MCUs
The CPU and the DSP has, at least, two integrated SPI modules each [22, 18]. Onemodule of these at each MCU is connected with the other to share data betweenthe devices, with the CPU as master and the DSP as slave.
For standard buffer mode (the DSP only supports this, the CPU has an enhancedbuffer mode) the hardware buffers are one level deep for either 8-bit or 16-bit data– dependent on configuration. However, the need of high accuracy requires dataof 32 bits to be transceived. In principle this is easy to do, send the MSW andthen the LSW (or vice versa) and merge them; in practice the logic needs to know
32

5.3. SPI COMMUNICATION
Start
Any strings
received?
Increment the read strings
counter
Read string
Return
Module started?
Convert the string to a command
React to the command
React to data from command
execution
Print welcome message
Start module
Print prompt
False
True
False
True
called from the main loop
Figure 5.6: Flow chart of the RS-232 software module
33

CHAPTER 5. THE RECIFLOW FIRMWARE
which one that is being transceived.
The solution is to use the MSB in the data words as a mark when the CPU sendsdata. The DSP then knows if it is an instruction (MSW) or the following data(LSW). It mirrors the MSB as a synchronization signal when it has executed aninterrupt to keep the CPU in sync.
The current implementation uses four transmissions of 16-bit data, see Figure 5.7,to send 30 bits and get 32 bits of useful data – from the CPU’s point of view.However, the logic is simple and a more efficient transmission would be morecomplex.
5.3.2 Implementation for the converters
On the board there are one ADC to do precise measurements of pressure andtemperature and one DAC to control the encoder LEDs, see Chapter 4 on page 19.The converters are controlled by sending commands and data over a SPI channeland in the case of the ADC also to get data. The ADC and DAC shares a SPIchannel with the real time clock and chip selects are used to activate the SPI on adevice.
The number of bits that needs to be sent varies from 8 to 24 depending on thesituation. Therefore is this SPI module configured for 8-bit operation. The software
InstructionMSB = 0
DataMSB = 1
No oper.MSB = 0
No oper.MSB = 1
InstructionMSB = 0
DataMSB = 1
Don't careSync = 1
Don't careSync = 0
MSWSync = 1
LSWSync = 0
Don't careSync = 1
Don't careSync = 0
t
CPU
DSP
A complete transmission
Note: A slot is 16 bitsA command
A responsThe next transmission
Figure 5.7: Diagram of the SPI communication between the MCUs
34

5.4. VALVE CONTROL
routines used for transceiving is blocking and tailored for a specific device.
5.4 Valve control
One of the main features of the Reciflow is that it does continuous measurements ofthe flow rate. This is possible by making the piston to reciprocate in the cylinderby controlling the direction of the flow. When the piston reaches an end the statesof the valves toggles to change the direction of the flow.
In order to detect when the piston reaches an end the optical encoder is used, seeSection 4.2 on page 20. When the piston reaches the limit of the strip a signalgoes active. The limit signals, one for each end, triggers interrupts in the DSP, seeFigure 5.8 on the next page.
5.5 Data collection
The purpose of the Reciflow is to perform measurements of flow rate, total displacedvolume and also pressure and temperature – to normalize the measurements anddo conversion to mass flow rate. This section describes how the measurements aremade.
5.5.1 Flow rate
Volumetric flow rate is, as mentioned in Section 2.1 on page 5, volume per timeunit. The measurement of the flow rate can be done in either the time domain,which is more intuitive, or the volume domain as in this case.
The motion signals, see Section 4.2 on page 20, is connected to a so called changenotification module in the DSP. The change notification module triggers an interrupt,see Figure 5.9 on page 38, whenever any of the signals connected to it changesstate [16].
35

CHAPTER 5. THE RECIFLOW FIRMWARE
Start
Disable this interrupt
a limit signalgoes active
Enable the other limit interrupt
Handle the turnings
Change valves states
Calculate distance from the other limit
Return
Figure 5.8: Flow chart of the limit sensor interrupts
The change notification ISR calculates which signal that has changed state bychecking some conditions. The signals looks as in Figure 5.10 on page 39 and thestates are explained in Table 5.1. In this case, with two signals and sensing atboth rising and falling edges the interrupt will run four times per complete periodand allow measurements of four separate time periods, giving as high resolution aspossible with the encoder.
Table 5.1: States for the change notification interrupt
Description Direction
bit
Forward
bit
Backward
bit
Forward signal, falling edge 0 0 0Continuing
36

5.5. DATA COLLECTION
Table 5.1: States for the change notification interrupt (continued)
Description Direction
bit
Forward
bit
Backward
bit
Forward signal, falling edge 1 0 1Backward signal, rising edge 0 0 1Backward signal, rising edge 1 1 1Backward signal, falling edge 0 1 0Backward signal, falling edge 1 0 0Forward signal, rising edge 0 1 1Forward signal, rising edge 1 1 0
Timestamps are taken from a 32-bit timer that is running continuously in theDSP. The timer has a resolution of 62,5 ns and it can count for almost 4,5 min
before an overflow. At every instance there is an interrupt for a particular statethe current timestamp is differentiated with the previously one for that state. Thetime difference corresponds to the flow rate as the volume is constant per encoderstep. A low time difference means a high flow rate and vice versa.
5.5.2 Volume
The motion signals from the sensor encoder, see Section 4.2 on page 20, is fed to aquadrature encoder in the DSP.
The quadrature encoder counts edges, rising and falling, in the signals. If themotion is positive – defined as positive when it is moving away from the in- andoutlets – the counter is incremented, otherwise it is decremented: in other wordsthe counter gives the current relative position of the piston. Since the signals has aphase difference the quadrature encoder knows the direction by measuring whichone of the two signals is leading [17].
The distance between each edge is constant and as the piston’s diameter is constanteach step corresponds to a constant displaced volume. By accumulating the values
37

CHAPTER 5. THE RECIFLOW FIRMWARE
Start
Clear the interrupt flag
a motion signal changes state
Calculate the current state
Get the new timer value
Calculate time difference
Filter active?
Filter buffer full?
Store difference to
buffer
If activated, sampling of unfiltered data
True
True
False
False
Error control Return
Handle the turnings
Figure 5.9: Flow chart of the change notification interrupt
38

5.5. DATA COLLECTION
110
111
101
100
Positive motion direction
Negative motion direction
001
011
010
000
Direction bit:Forward bit:
Backward bit:
Direction bit:Forward bit:
Backward bit:
Forward signal
Backward signal
Forward signal
Backward signal
Figure 5.10: Diagram of the change notification states
39

CHAPTER 5. THE RECIFLOW FIRMWARE
of the position counter the total distance is obtained and therefore the totaldisplaced gas volume. A heuristic method is used to handle the turnings (directionchanges).
5.5.3 Pressure and temperature
The pressure and temperature in the sensor must be known to
• normalize the volume and flow rate
• calculate the density, for conversion from volumetric flow rate to mass flowrate
Normalization of volume and flow rate is with respect to the former IUPAC standarddefinition where temperature is normalized to 0 ◦C and pressure to 101,325 kPa
[35]. See Section 5.8.5 on page 48 for the actual calculations.
The pressure and temperature sensors are connected to an ADC on the board. TheDSP communicates with the ADC using SPI, see Section 5.3.2 on page 34.
After startup the DSP sends a command to the ADC that starts its self-calibrationand then conversion of the temperature. The self-calibration of the ADC’s internalcircuit makes sure that it has the promised performance. The DSP polls a signalthat the ADC activates when it is finished with the conversion. When the signal isactivated the DSP commands the ADC to send the data, see Figure 5.11 on thefacing page.
When a temperature sample is received the DSP commands the ADC to calibrateand start a conversion of the pressure. The procedure is then equal to the oneabove, with some exceptions.
Self-calibration is needed every time the channel is changed and as the calibrationtakes time it introduces a relatively huge overhead. The pressure varies more thanthe temperature, which is relatively stable, so to reduce the overhead the pressureis sampled a number of times in a row, before the temperature is sampled againand everything starts over.
40

5.6. MOVING AVERAGE FILTER
Start called from the ADC extern module
Signal !ADRDY has changed?
Return
!ADRDY is?
Start conversionRead converted data
True
False Active Inactive
Figure 5.11: Flow chart of the !ADRDY signal poller
The pressure data is filtered, see Section 5.7.2 on page 45, and therefore it is storedin a circular buffer, see Section 5.1 on page 25, instead of in a variable.
5.6 Moving average filter
A moving average filter is an averaging filter with a continuously moving samplewindow. It is a common method used to smooth data with random noise [27] andis used to smooth the flow rate and pressure signals, see Section 5.7.1 on page 43and Section 5.7.2 on page 45. An average is
zn[xi] =1
N·N−1∑i=0
xi =1
N· yn[xi] (5.1)
where yi is the accumulator/sum and N is the integer number of samples to collect,in other words the size of the sampling window. Normally all N samples arecollected and then the average is calculated; this delays the result with the timeit takes to collect all N samples; for the pressure filter, where N = 10, this will
41

CHAPTER 5. THE RECIFLOW FIRMWARE
be
t = tADC +N + 1
fclk=
= 18 · 0,04 +10 + 1
16 · 106= 720 ms (5.2)
where tADC is the time it takes for the ADC, with a self-calibration, to take allsamples [24], N is the number of samples to collect and fclk is the frequency of theDSP’s instruction clock. The term N + 1 corresponds to the number of instructioncycles the DSP needs to calculate the average (it is one per addition, subtraction,multiplication and division [19]). For the flow rate filter the time is dependent ofthe flow rate and the size of the sample window, that varies with the flow rate.
If some calculations in a row is analyzed a pattern can be found, here N = 11,
y10[xi] =10∑i=0
xi = x0 + ...+ x10
y11[xi] = x1 + ...+ x11 = y10 − x0 + x11
y12[xi] = y11 − x1 + x12 . (5.3)
It is clear that the n:th sum is the n − 1:th sum with the ”oldest” data sampleremoved and the ”newest” added. If the sum is calculated in this recursive way itcorresponds to a moving window. This will be faster since only an addition and asubtraction needs to be executed per new sample instead of N additions; how muchfaster depends on the size of the sample window, for N = 32 the computationaltime saving is approximately
∆t(N) =
∣∣∣∣2 −N
fclk
∣∣∣∣ =
∣∣∣∣ 2 − 32
16 · 106
∣∣∣∣ = 1,9 µs. (5.4)
For the case in Equation (5.2) the time will now be
t = 1 · 0,04 +1 + 1
16 · 106= 40 ms (5.5)
when a self-calibration is already performed; in other words a time saving of
42

5.7. DATA PROCESSING
approximately 720/40 = 18 times is achieved.
There will still be some delay from input to output of the first sum, if not theaverage is allowed to stabilize over time like this
z0[xi] =x01
z1[xi] =x0 + x1
2=y0 + x1
2
z2[xi] =y1 + x2
3...
z10[xi] =y9 + x10
11=y1011
. (5.6)
A flow chart of this implementation can be viewed in Figure 5.12 on the nextpage.
5.7 Data processing
This section describes how signal processing is made on the DSP, as there are datathat must be processed due to noise and other factors.
5.7.1 Flow rate
The flow rate signal contains random noise, due to signal asymmetry and smallvariations in the time differences, and a ”static” noise caused by the turnings, seeFigure 5.13 on page 45.
A smoothing filter is used to even out the random noise and present more stabledata. It is a moving average, see Section 5.6 on page 41, with an adaptive windowsize; the window size depends on the flow rate. A low flow rate results in a smallerwindow than a high flow rate since it implies a lower interrupt rate and thereforelonger time between the samples; the filter and hence the updates would therefore
43

CHAPTER 5. THE RECIFLOW FIRMWARE
Start
Buffer fill count is greater than the sample counter?
Calculate index of the newest data point
Add the newest data to the accumulator
Increment the sample counter
Sample counter is greater than
the window size?
Dequeue the oldest data sample from the
buffer
Remove the oldest data from the accumulator
Decrement the sample counter
Calculate the average (accumulator /
sample counter)
Get the newest data
True
False
Return
Output the result
True
False
Figure 5.12: Flow chart of a moving average filter with a variable window size
44
5.7. DATA PROCESSING
Figure 5.13: Graph of the flow rate measurement with noise – a tick is a timercycle time: 62,5 ns
be too slow. Experiments shows that a window size of 32 samples is good enoughfor high flow rates (above 100 ml/min) and that it may be reduced to at least8 samples for low flow rates (below 1 ml/min).
A heuristic method is used to handle the turnings (direction changes) – the ”static”noise.
5.7.2 Pressure
The pressure data from the on-board ADC is filtered with a moving average filter,see Section 5.6 on page 41, with a window size equal to the sampling rate for thepressure at the CPU. The CPU samples data from the DSP at a rate of 400 Hz.The pressure is used for normalization, see Section 5.8.5 on page 48.
45

CHAPTER 5. THE RECIFLOW FIRMWARE
5.8 Data conversion
Conversion of raw data, x from the DSP to human-readable data, f(x) is madeby the CPU. The purpose is to avoid loading the DSP more than necessary, as itsexecution is more time critical. All calculations uses integers and the numbers arescaled to achieve the wanted resolution.
5.8.1 Flow rate
The flow rate data, xfr from the DSP, a 32-bit integer, is in its raw form a timedifference in number of ticks, see Figure 5.13 on the preceding page. Thereforefurther calculations has to be made to add information that converts it to avolumetric flow rate.
First, the number of ticks must be normalized to time in seconds. That is easilydone since the clock frequency of the timer is known
∆t(xfr) =xfrfclk
(5.7)
where xfr is the measured number of ticks and fclk is the timer’s clock frequency(16 MHz in this case).
The volume for a period is constant, cvol,per, so the flow rate is
Q(∆t) =cvol,per
∆t(5.8)
or, if Equation (5.7) and (5.8) is combined
Q(xfr) =cvol,per · fclk
xfr. (5.9)
Depending on the wanted resolution and how the data is to be presented differentvolume constants is used.
46

5.8. DATA CONVERSION
5.8.2 Volume
The volume data, xvol is in its raw form the total distance the piston has moved innumber of steps. The volume of each step is constant, cvol,step, so
Vtot(xvol) = cvol,step ·xvol (5.10)
where xvol is the measured number of steps.
5.8.3 Pressure
The pressure in the instrument is measured to be used for normalization of flow rateand volume with respect to the former IUPAC standard definition [35], to performdensity calculations and to be presented to the user as additional information. Itis calculated from the data that the ADC has sampled from the pressure sensoras
p(xpress) = cgain ·xpress + coffset (5.11)
where xpress is the data, cgain is the gain/slope and coffset is the offset/bias. Thegain and offset varies from sensor to sensor and must be measured and preset foreach instrument, see Figure 5.14 on the next page for an example. The numbersare scaled to prevent loss of resolution and are stored as 32-bit integers.
5.8.4 Temperature
The temperature, xtemp is measured with a non-linear thermistor, see Appendix,and sampled by the on-board ADC, so a series of steps must be taken to calculatethe actual temperature.
The first step is to calculate the thermistor’s resistance from the sampled values.It is given by the following relationship (derived from the electric circuit)
Rtherm(xtemp) =RADC ·xtemp
cres ·GADC − xtemp
(5.12)
47

CHAPTER 5. THE RECIFLOW FIRMWARE
!"#$#%&'('()#*#+,(&,-#
!,#$#%&',"')#*#".+&,(#
%#
%&'#
"#
"&'#
,#
,&'#
+#
%# "%%%%# ,%%%%# +%%%%# /%%%%# '%%%%# (%%%%#
!"#$$%"#&'(
)"*&
+,-&.)/%#&
01233412#5"#01233412#5,#678291#:01233412#5";#678291#:01233412#5,;#
Figure 5.14: Graph, with linear fit, from measurements of pressure sensors
where RADC is the resistance of a resistor in the thermistor circuit, xtemp is thesampled value, cres is the ADC’s resolution and GADC is the ADC’s configured gainfor the temperature channel.
The second step is to approximate the measured Rtherm with a value in a tablewhich is defined by the manufacturer of the thermistor. The table values correlatesto integer temperatures in the interval 0 ◦C ≤ T ≤ 50 ◦C, with two significantdigits. The table look-up is made with a divide-and-conquer search algorithm.
The last step is then to interpolate the measured Rtherm with the two closest valuesin the table to get two additional digits. The second extra digit adds no informationbut can be used to perform a rounding instead of truncation.
5.8.5 Normalization
Normalization of the flow rate and volume are used to adapt the measurements tostandard conditions; the Reciflow’s default is the former IUPAC standard definition– temperature is normalized to 0 ◦C and pressure to 101,325 kPa [35].
When the flow rate is normalized the same calculation is made as described in
48

5.9. USER INTERFACES
Section 5.8.1 on page 46. The result is then multiplied with a coefficient
cnorm =pcurrpref
·TrefTcurr
(5.13)
where pcurr is the current pressure, pref is the reference pressure (101,325 kPa), Trefis the reference temperature (273,15 K) and Tcurr is the current temperature.
For the volume the difference between the previously and the current sample isnormalized with an averaged coefficient
cnorm,avg =pavgpref
·TrefTavg
(5.14)
where pavg and Tavg is the average pressure and temperature, respective, betweentwo volume samples.
5.9 User interfaces
There are two user interfaces on the Reciflow: a text interface for serial commu-nication (RS-232 or USB) and a graphical interface on a touchscreen. The textinterface is tightly integrated with the RS-232 module described in Section 5.2.1 onpage 29. If the RS-232 module is activated with verbose communication it prints awelcome message and prompts the user for input: READY. The user can then controlthe Reciflow with its commands, see Appendix. In the current implementationthere is no designation between debug and user mode; the text interface providesthe user with debug information and allows more control of the software than willbe allowed in the production version. There are no handling of bad input, anunrecognized command generates an error message: ?SYNTAX ERROR.
The graphical interface is built with Microchips’s Application Library [4]. Itcontains modules for GUI design, communication with display and touch sensorcapability. If the touchscreen is supported by the library, as in this case [14], itis ”only” to include the modules in the software project. For the Reciflow themodules are wrapped in a GUI module; at startup the module is initialized, in
49

CHAPTER 5. THE RECIFLOW FIRMWARE
other words objects are declared and defined. The GUI module is then called fromthe main loop where the objects are refreshed when needed. It is implemented asa state machine to avoid blocking due to delays. All objects are in the libraries’toolbox, including graphics; additional graphics can be stored on the on-boardflash memory.
50

Chapter 6Results
The specification for the project has been fulfilled
• a pre-study on flows and meters
• well written source code in C optimized for embedded systems
• off-board RS-232 communication using the CPUs UART
• a user interface for terminals
• a user interface on a touchscreen
• on-board SPI communication between the CPU and DSP
• on-board SPI communication with the on-board ADC and DAC.
• a control function for the valves
• algorithms and software routines for signal processing
• measurement of flows down to 0,3 ml/min with an accuracy of ±0,5 %.
The RS-232 communication allows communication with the instrument overa serial link by the use of Reciflow commands, see Appendix. The supported datarate is 115 kbaud and the command rate is at least two commands per second,but it is dependent of the software buffers size. If the command rate is too high
51

CHAPTER 6. RESULTS
the receiving circular buffer will get full and the hardware flow control will tellthe transmitter to pause until there is space again. This will only happen if thetransmitter streams commands without any pause at all.
The terminal user interface gives the user the opportunity to communicatewith the instrument with a classical text interface on a terminal, like for exampleDOS or UNIX. It reacts fast and the user is not usually aware of any latency, noteven when the DSP is included in the communication; which is the case whenfor example data is fetched directly from it. In the development version there isno designation between debug and user mode so the text interface can be usedfor debugging and testing. The baud rate for the terminal is 115 kbaud but thecommand rate depends on the size of the circular receiving buffer. However, fornormal terminal usage there is no visual lag to the user.
The touchscreen user interface gives the user the opportunity to communicatewith the instrument from an in-box touchscreen. In the development version only abasic GUI is implemented; it presents data to the user in numbers, for example theflow rate, or draws a graph of flow rate versus time. There are buttons in the mainview to clear all data and to open the graph; in the graph view there are buttonsto scale the flow rate and time axis and to return to the main view. The interfacehas no visual lag to the user.
The SPI communication between the MCUs allows the CPU to send commandsto the DSP and the DSP to respond with data as for example its status or flow rate.The DSP can communicate with the analog and digital converters to configurethem and collect samples from the ADC.
The valve control initiates the valves at startup with a positive motion directionas default, when possible. When there is a flow it allows the piston to reciprocateand it performs a heuristic compensation in the turnings.
52

6.1. NUMERICAL ANALYSIS WITH MATLAB
Algorithms and software routines to sample and process signals for flow rate,volume, pressure and temperature has been developed and implemented. Routinesto convert the processed data, calculate density and convert from volumetric tomass flow rate has been implemented. The routines have been numerically tested(tested with dummy data) and experiments have been performed to test and verifythe signal processing, see Section 6.2 on page 56 for more details.
6.1 Numerical analysis with MATLAB
Numerical analysis was made with MATLAB to test different filters before thefirmware implementation. Normalization and integration of raw data to volumeand derivation of volume to flow rate for constant flows was compared with onlineconversions on the Reciflow as a verification of software routines, see Section 5.8 onpage 46. An example of an unprocessed signal can be viewed in Figure 6.1 on thefollowing page; figures like that was used to analyze the signals for the developmentof the signal processing algorithms.
First a classical IIR filter was tested, but it was too slow because a great amountof feedback was needed to get sufficient smoothing. A feedback of at least 99 %
was needed which roughly means that it takes 99 samples of a hundred to affectthe average. The choice fell on a FIR filter, as described in Section 5.6 on page 41.The FIR filter has a good step response [27] and only a few samples are needed toaffect the average while it still gives a smooth curve.
The last piece was the heuristic method to handle the turnings – the peaks inFigure 5.13 on page 45 and Figure 6.1 on the next page. The processed signal canbe viewed in Figure 6.2 on page 55 which shows that the static noise from theturnings is gone and most of the random noise too.
53

CHAPTER 6. RESULTS
Figure 6.1: Graph of the flow rate signal without processing @ 100 ml/min
54

6.1. NUMERICAL ANALYSIS WITH MATLAB
Figure 6.2: Graph of the flow rate signal with processing @ 100 ml/min
55

CHAPTER 6. RESULTS
6.2 Accuracy and precision
The theoretical system accuracy as given by Equation (2.12) is only dependent ofthe piston’s and encoder’s tolerances if no normalization is used. As the piston’simpact can be compensated for the encoder sets the limit, in other words ±0,025 %,see Section 4.3 on page 21. When the flow data is normalized the pressure andtemperature sensors, including the voltage reference, adds errors and the accuracybecomes
System accuracy =√A2 +B2 + C2
1 + C22 +D2
1 +D22 =
=√
0,0252 + 0,12 + 0,022 + 0,12 + 0,12 + 0,12 =
= ±0,2 % (6.1)
where A is the optical encoder, B the voltage reference, C1 the pressure sensor’shysteris and C2 its non-linearity error, D1 the thermistor for 25 ◦C and D2 itselectric circuit, all coefficients are equal to unity – see Section 4.3 on page 21 forfurther details.
The empirical system accuracy, based on experiments with a reference system,yields a better accuracy than the goal, ±0,2 % with normalization under normalconditions, see Figure 6.3 on the next page. The figure is based on experimentsfor flows from 1,9 ml/min to 400 ml/min with rough compensations made. Thecompensations is mentioned in Section 4.3 on page 21.
56
6.2. ACCURACY AND PRECISION
!"#$%&
!"#$&
!"#'%&
!"#'&
!"#"%&
"&
"#"%&
"#'&
"#'%&
"#$&
'& '"& '""& '"""&
!""#$!"%&'(
)&
*+,&$!-.&'/01/23)&
Figure 6.3: Graph of accuracy for the Reciflow
57

58

Chapter 7Discussion and conclusions
The goal: that the flow meter should be able to measure flows down to 0,3 ml/min
with an accuracy of 0,5 % seems to be met for the volume measurement; in fact theempirical accuracy is about 0,2 %, see Figure 6.3 on page 57, with the constraintsthat the measurements are made with air at atmospheric pressure and roomtemperature – ∼ 1 kPa and 20 ∼ 25 ◦C, respective. No conclusions can be madeabout the precision (repeatability) since too few measurements has been performedwhen this is written. However, a series of measurements under the same conditions(eight of them) at 200 ml/min yielded a deviation of only ±0,05 %, but furtherverifications are needed.
7.1 Numerical analysis with MATLAB
The signal in Figure 6.2 on page 55 seems to be very noisy despite the processing.The instrument is extremely sensitive so it is probably caused by dirt in the cylinder;there is a limit to how noisy signal the filter can handle. This happens from time totime and in the production version there will be filters for the fluid. However, thefigure shows that the heuristic method is able to remove the peaks in the turningsand the average value is still correct.
59

CHAPTER 7. DISCUSSION AND CONCLUSIONS
7.2 Accuracy and precision
The first experiments with good results, see Figure 6.3 on page 57, indicates thatthe goal may have been met regarding the accuracy. However, it is still uncertainif it really is ”true”. Further experiments should be performed. There should forexample be a sufficient number of repeated experiments under equal conditions touse the central limit theorem for statistical analysis. It is also noteworthy that theaccuracy of the reference system has impact on these results.
The most straightforward method to verify the measurement of the flow rate wouldbe to measure the flow with another meter in series, the problem in this case is thatthere are no flow meters on the market with as high accuracy and wide dynamicrange as the Reciflow, see Figure 3.1 on page 17.
An alternative method would be to integrate the flow rate for a constant flow andcompare it with the verified volume measurement. It introduces a new uncertainty,but if they are equal (within the accuracy) it should be an indication that also theflow rate measurement is correct.
The precision is still uncertain. One experiment showed a deviation of ±0,05 %
for eight measurements with a flow rate of 200 ml/min and the same conditionsregarding pressure and temperature. To verify the precision further experimentsmust be performed where series of measurements are made for all combinationsof the specified conditions: flow rate 0,3 − 500 ml/min; temperature 0 − 50 ◦C;pressure 0 − 3 bar.
7.3 Flows and meters in theory
I think that the theoretical pre-study was able to answer the questions stated inSection 1.1 on page 2. However, the result is not that impressive; it was hard tofind good references (my main reference was [28]) as I do not count Wikipedia as agood one in this case. My goal was neither to dig very deep into the physics, asmechanics and thermodynamics are two big areas. Another limitation was also
60

7.4. MARKET SURVEY
the result from the market survey, see Section 7.4; it was not interesting to studyflow meters with applications far away from the Reciflow’s target, for examplecontinental gas distribution.
7.4 Market survey
The market survey was not able to yield all the results stated in Section 1.1 onpage 2. The comparison table is quite small, it was very hard to find flow meters forlow gas flows with data that was somewhat comparable, especially for volumetricflow meters; in other words, it is only a selection and not the full picture. Thecomparison chart is only a rough schematic overview of the table. Flow meters areused almost everywhere so there is not a good single answer to how they are used andby whom, but some examples are: leakage testing, gas analysis, chemical reactions,laboratory, calibration and reference. The group called potential customers turnedout to be dealers and no needs were stated that EC Instruments not already hadin the specification draft. The most common sensor types turned out to be onlythree, see Section 2.2 on page 7, which affected the width of the pre-study.
7.5 Firmware
Most of the projects resources has been on the firmware. All goals regarding itin the project plan has been accomplished and more than that. EC Instrumentsis satisfied with the results and feels that they have a good structure to continuefurther development on. My skills in embedded C programming has evolvedenormously and the code with it; early implementations has been refined to achievea modularized and flexible code structure.
I did not develop the firmware parts regarding the touchscreen user interface(GUI, display and touch sensor). It was only a question of integrating MicrochipsApplication Library [4] into our project and the problem in that case was only theintegration. The library is a good example of how C code should not be written for
61

CHAPTER 7. DISCUSSION AND CONCLUSIONS
embedded systems [6, 13]. It was a time consumer that did not add any engineeringvalue. However, the GUI module uses software routines that I have written and Ihave committed some small changes to its code.
7.6 Further work
There are still some things to do, fix, consider and verify:
• The RS-232 module should be implemented as a state machine, like the GUImodule, to avoid blocking and deadlock.
• The SPI communication between the MCUs could be more efficient.
• A dosage function still needs to be implemented.
• The firmware should be able to handle bidirectional flows.
• The empirical accuracy should be statistical verified.
• The accuracy of the flow rate measurement must be verified.
• The precision of the instrument must be verified.
• The flow rate does not goes down to zero when the flow stops; the latestcalculation remains as output.
• A semi-automatic adjustment of the encoder LEDs should be implemented.
• A PC application with a GUI to replace the terminal for RS-232 communica-tion may be developed.
• The text interface needs a clean-up to the production version by separatingdebug and user mode.
• A real GUI needs to be designed in opposite to the basic GUI in the develop-ment version.
62

Bibliography
[1] Bronkhorst High-Tech. http://www.bronkhorst.com/, 2011-07-06.
[2] EC Instruments. http://www.ecinstruments.com, 2011-02-22.
[3] GCC, the GNU Compiler Collection. http://gcc.gnu.org/, 2011-07-07.
[4] Microchip Application Library. http://
ww1.microchip.com/downloads/en/DeviceDoc/
microchip-application-libraries-v2011-06-02-windows-installer.
exe, 2011-07-07.
[5] Microchip Technology Inc. http://www.microchip.com, 2011-07-06.
[6] Michael Barr. Embedded C Coding Standard. Netrino, Charleston, USA, May2010.
[7] Olof Beckman, Göran Grimvall, Bengt Kjöllerström, and Tage Sundström.Energilära – grundläggande termodynamik. 2005.
[8] Ulf Bilting and Jan Skansholm. Vägen till C. Studentlitteratur, Lund, Sweden,3 edition, 2000.
[9] Erik Cardelius and Lars Skoglund. Snabb O2-sensor. Master’s thesis, KungligaTekniska högskolan, Stockholm, 2002.
63

BIBLIOGRAPHY
[10] Joseph J. Carr. Sensors and circuits: sensors, transducers, and supportingcircuits for electronic instrumentation, measurement, and control. Prentice-Hall International, London, UK, 1993.
[11] E. B. Jones. Instrument technology, volume 1. Butterworths, Borough Green,England, 4 edition, 1985.
[12] Chen Kun, Zhen Dezhi, Fan Shangchum, Li Fan, and Zhao Jianhui. Novelcoriolis mass flowmeter signal processing algorithms based on dft and digitalcorrelation. In IEEE Symposium on Industrial Electronics and Applications(ISIEA 2010), pages 56–60, Penang, 3-5 Oct. 2010.
[13] Motor Industry Reliability Association. MISRA-C:2004 Guidelines for the useof the C language in critical systems. MIRA, Nuneaton, 2 edition, 2008.
[14] Powertip Tech. Corp. PH480272T-005-I11Q. http://ww1.microchip.
com/downloads/en/DeviceDoc/SPF-PH480272T-005-I11Q_0021.pdf, 2011-07-20.
[15] Analog Devices. Low power, low noise voltage references with sink/source ca-pability. http://www.analog.com/static/imported-files/data_sheets/
ADR360_361_363_364_365_366.pdf, 2011-07-11.
[16] Microchip Technology Inc. dsPIC33 family reference manual, Sect. 10 I/OPorts. http://ww1.microchip.com/downloads/en/DeviceDoc/70193C.pdf,2011-07-13.
[17] Microchip Technology Inc. dsPIC33 family reference manual, Sect. 15 QEI.http://ww1.microchip.com/downloads/en/DeviceDoc/70208B.pdf, 2011-07-13.
[18] Microchip Technology Inc. dsPIC33 family reference manual, Sect. 18 SPI.http://ww1.microchip.com/downloads/en/DeviceDoc/70206C.pdf, 2011-07-13.
[19] Microchip Technology Inc. dsPIC33 family reference manual, Sect. 2 CPU.http://ww1.microchip.com/downloads/en/DeviceDoc/70204B.pdf, 2011-07-19.
64

BIBLIOGRAPHY
[20] Microchip Technology Inc. MPLABX IDE. http://ww1.microchip.com/
downloads/mplab/X_Beta/index.html, 2011-07-07.
[21] Microchip Technology Inc. PIC24F family reference manual, Sect. 21UART. http://ww1.microchip.com/downloads/en/DeviceDoc/en026583.
pdf, 2011-07-13.
[22] Microchip Technology Inc. PIC24F family reference manual, Sect. 23 SPI.http://ww1.microchip.com/downloads/en/DeviceDoc/39699b.pdf, 2011-07-13.
[23] Texas Instruments. MAX3232E. http://focus.ti.com/lit/ds/symlink/
max3232e.pdf, 2011-07-07.
[24] Maxim. 16-bit, low-power, 2-channel, sigma-delta ADC. http://datasheets.maxim-ic.com/en/ds/MX7705.pdf, 2011-07-11.
[25] Scott Rouse. Sensor design the key advantage in thermal mass flow meterperformance. Instrument Design and Technology, 2007.
[26] Ingo Sander. Lecture 6: Low power cpu. program design for embed-ded systems. http://www.ict.kth.se/courses/IL2206/0910/lectures/
IL2206-L06-ProgramDesign1.pdf, 2011-06-09.
[27] Steven W. Smith. The Scientist and Engieneer’s Guide to Digital SignalProcessing. California Technical Pub., 1 edition, 1997.
[28] David W. Spitzer, editor. Flow Measurement: practical guides for measurementand control. Instrument Society of America, USA, 1991.
[29] Wikipedia. DeviceNet. http://en.wikipedia.org/wiki/DeviceNet, 2011-07-06.
[30] Wikipedia. I2C. http://en.wikipedia.org/wiki/I2c, 2011-07-06.
[31] Wikipedia. Mac OS X Snow Leopard. http://en.wikipedia.org/wiki/Mac_OS_X_Snow_Leopard.
[32] Wikipedia. EIA-485. http://en.wikipedia.org/wiki/Rs-485, 2011-07-06.
65

BIBLIOGRAPHY
[33] Wikipedia. RS-232. http://en.wikipedia.org/wiki/RS-232, 2011-06-16.
[34] Wikipedia. Serial Peripheral Interface Bus. http://en.wikipedia.org/wiki/Serial_Peripheral_Interface_Bus, 2011-06-16.
[35] Wikipedia. Standard conditions for temperature and pressure. http://en.
wikipedia.org/wiki/Standard_temperature_and_pressure, 2011-07-11.
[36] Wikipedia. Windows 7. http://en.wikipedia.org/wiki/Windows_7, 2011-07-07.
66

www.kth.se
TRITA-ICT-EX-2011:181