
Mass Spectrometry-Based Proteomics for Pre-Eclampsia and Preterm Birth
Upload
independentCategory
view
0download
0
Elimination of Systematic Mass Measurement Errors in LiquidChromatography-Mass Spectrometry Based Proteomics usingRegression Models and a priori Partial Knowledge of the SampleContent
Vladislav A. Petyuk*, Navdeep Jaitly*, Ronald J. Moore, Jie Ding, Thomas O. Metz, KeqiTang, Matthew E. Monroe, Aleksey V. Tolmachev, Joshua N. Adkins, Mikhail E. Belov, AlanR. Dabney#, Wei-Jun Qian, David G. Camp II, and Richard D. Smith**Biological Sciences Division and Environmental Molecular Sciences Laboratory, Pacific NorthwestNational Laboratory, Richland, WA 99352
#Department of Statistics, Texas A&M University, College Station, TX, 77843
AbstractThe high mass measurement accuracy and precision available with recently developed massspectrometers is increasingly used in proteomics analyses to confidently identify tryptic peptidesfrom complex mixtures of proteins, as well as post-translational modifications and peptides fromnon-annotated proteins. To take full advantage of high mass measurement accuracy instruments it isnecessary to limit systematic mass measurement errors. It is well known that errors in themeasurement of m/z can be affected by experimental parameters that include e.g., outdated calibrationcoefficients, ion intensity, and temperature changes during the measurement. Traditionally, thesevariations have been corrected through the use of internal calibrants (well-characterized standardsintroduced with the sample being analyzed). In this paper we describe an alternative approach wherethe calibration is provided through the use of a priori knowledge of the sample being analyzed. Suchan approach has previously been demonstrated based on the dependence of systematic error on m/zalone. To incorporate additional explanatory variables, we employed multidimensional,nonparametric regression models, which were evaluated using several commercially availableinstruments. The applied approach is shown to remove any noticeable biases from the overall massmeasurement errors, and decreases the overall standard deviation of the mass measurement errordistribution by 1.2- to 2-fold, depending on instrument type. Subsequent reduction of the randomerrors based on multiple measurements over consecutive spectra further improves accuracy andresults in an overall decrease of the standard deviation by 1.8- to 3.7-fold. This new procedure willdecrease the false discovery rates for peptide identifications using high accuracy mass measurements.
INTRODUCTIONLiquid chromatography-mass spectrometry (LC-MS) is increasingly used to broadly identifyand quantify proteins over a large range of abundances in biological samples. Analysis of MS-based proteomic data generally uses search engines that compare the mass to charge ratios(m/z) of observed ions to those predicted from a finite set of candidates to infer the peptides(e.g., from proteolytic digestion of intact proteins) or proteins that may be present in a sample.
*These authors contributed equally to this work.**Correspondence: Dr. Richard D. Smith, Biological Sciences Division, Pacific Northwest National Laboratory, P.O. Box 999, MSIN:K8-98, Richland, WA 99352, USA. Email: [email protected]; Fax: (509) 376-7722.
NIH Public AccessAuthor ManuscriptAnal Chem. Author manuscript; available in PMC 2009 February 1.
Published in final edited form as:Anal Chem. 2008 February 1; 80(3): 693–706.
NIH
-PA Author Manuscript
NIH
-PA Author Manuscript
NIH
-PA Author Manuscript

Therefore, the confidence in the results depends significantly on the mass measurement error(MME) achieved. Lower MME allows superior discrimination e.g., between true and falsepeptide or protein identifications, as demonstrated by several groups over the last few years1-4
While most mass spectrometers can exhibit quite impressive MME (sub- to low-ppm) for singlecompounds and when properly calibrated (e.g. using an “internal standard”), such accuracy isproblematic with complex biological samples due to limitations on resolution of differentspecies as well as a range of experimental details. The latter issues and their effects vary fordifferent instruments or platforms. For example, temperature changes during LC separationscan cause drift of the power supply voltage and consequently lead to systematic MME usingtime-of-flight (TOF) instruments 5. Space charge effects resulting from the trapped ionpopulation is the major cause of systematic mass measurement errors for Fourier transform ioncyclotron resonance (FTICR) instruments. Outdated calibration coefficients can also contributeto systematic mass measurement errors.
Several experimental methodologies have been developed to reduce the systematic errors ofmass measurement. For example, some FTICR instruments are equipped with an automatedgain control (AGC) system that aims to control the number of ions trapped in the ICR cell. Themost effective approach is internal calibration, where known substances are measured in thesame spectrum with the analyte(s) of interest. It can be implemented by either introducingcalibrants to the sample prior ionization 6, by introducing calibrants into MS through anadditional electrospray source 7, 8, as well as by using ubiquitious chemical contaminants asinternal calibrants 2, 3. This approach generally works well, but is most effective when the m/z of both the analyte and calibrant are similar. Thus, for proteomic applications it is desirableto have multiple internal calibrants to extensively cover m/z range. However, such internalcalibrants can overlap with species of interest during MS scans and preclude their detection,as well as limit the analyte ion population that can be addressed (e.g. due to space chargelimitations), and thus limit the dynamic range achievable for measurements.
One approach for addressing the latter issues was to introduce a calibrant mixture immediatelybefore and after the LC separation and use multivariate regression approach to find thecalibration coefficients 9. However, this approach is limited in that it assumes a uniform driftof the calibration coefficients. It also fails to account for the influence of the total ion signalas well as the individual ion intensities on MME during the analysis. The latter is actually animportant factor for a certain type of time-of-flight instruments, as we are going to show laterin this report. This work also proposed the use of highly expressed proteins commonly presentin a given type of sample as effective internal calibrants in addition to external calibrants, whichwas subsequently demonstrated using abundant peptides in Deinococcus radiodurans samples10.
There are few approaches have been developed, which avoid the use of internal calibrants andrely solely on the information from the sample itself. One of the earliest approaches is basedon observation multiply charged states of the same peptides during MS scans in FTICRinstruments. That allowed for correction for space charge effects to produce an improvedcalibration function, a process referred to as deconvolution of Coulombic affected linearity, orDeCAL 11.
It is also worth mentioning similar efforts for recalibration of fragment ions in MS/MS spectraacquired on high-resolution instrumentation 12, 13. It has been shown, that for MS/MS scanrecalibration one can use all the theoretical fragments of a putatively identified peptide.
Recently, based upon the use of new hybrid instrumentation, it has been proposed to useconfident peptide identifications from MS/MS spectra in a post hoc strategy for recalibration
Petyuk et al. Page 2
Anal Chem. Author manuscript; available in PMC 2009 February 1.
NIH
-PA Author Manuscript
NIH
-PA Author Manuscript
NIH
-PA Author Manuscript

of parent ions 14. In one implementation of this approach 15 MS spectra from LC-MS/MSmeasurements are calibrated individually using peptide identifications from the neighboringMS/MS scans, that is several scans acquired right before or after the considered MS scan.However, this implementation did not take into account the effect of individual ion intensitieson mass measurement errors. In particular, the peptides used for calibration are sampled fromthe most highly-abundant peptides, and the obtained calibration coefficients are applied to theentire set of the observed species. Moreover, there is no guarantee that peptides identified byMS/MS fragmentation will cover as extensive m/z range as the peptides present in the MS scan.Nevertheless, we believe that with adjustment of the method for selection of parent ions forfragmentation, this approach holds a potential for use with appropriate hybrid instruments.
Another approach used a priori knowledge about the sample content instead of deriving it fromthe MS/MS data 16. Masses of ions in a sample are matched using a wide mass tolerance againstall the masses in a database of peptides expected to be detected in the sample. However, sincethe matching used only the monoisotopic masses, it is expected that the matches contain asignificant portion of false identifications for complex samples. Thus, the matches weremodeled as a mixture of correct and incorrect matches. The entire set of matches wasrecalibrated using a Bayesian statistical technique assuming certain distributions of true andfalse peptide matches, and the systematic bias of mass measurement error on m/z value wasremoved. The presence of a significant proportion of incorrect assignments in the initial setprohibited the authors from using regression models or scatter smoothing techniques. A robustscatter smoothing technique was used in another study 17 as a part of three-stage approachcombining external calibration, single “lock-mass” internal correction with a robust scattersmoothing approach to reduce any systematic dependencies of the mass measurement errorsalong the m/z parameter. Similarly, work from our lab attempted to account for the massmeasurement error dependency on a number of parameters like elution time, m/z, TIC andindividual ion intensity by partitioning the parameter space into multiple equally sized regions,with each region recalibrated independently 18. The recalibration was achieved by fitting alinear transformation functions from observed m/z values to theoretical m/z values. The meritof each transformation function was judged based on the height of the peak of the mass errorhistogram relative to the random errors of the false matches. However, that implementationprovided no statistical basis to defend the use of certain parameters or their combinations asdimensions for breaking the data into the regions. In addition, there were no global constraintsimposed and each region was recalibrated independently of each other. Those two factors canpotentially lead to overfitting of the data, and overestimation of the performance of therecalibration procedure. Ideally, we wish to describe the systematic error trends withcontinuous differentiable functions, as opposed to the discontinuous dependencies usedpreviously.
To address the aforementioned issues we developed a regression approach that uses a set ofcandidate matches between masses of peptide peaks observed in a measurement and a databaseof possible candidate peptide identifications, in order to detect and remove functionaldependencies that may be observed between mass measurement error and predefinedparameters. Such dependencies are often present in the data and are easily revealed byexploratory data analysis, such as plotting the mass measurement errors as a function of elutiontime, m/z, ion intensity, or other explanatory variables (Figure 1A). However, regressionanalysis is complicated by several factors. The set of candidate matches used in the regressionanalysis is composed of correct and incorrect matches, which have different error distributions.Because of the significant fraction of false matches that can be initially obtained, regressionanalysis is often unsuccessful with simple least-squares fitting. Thus, our approach involvesan analysis using robust regression techniques with a subset of matches that is enriched withtrue matches, and then applies the regression function to the entire dataset. The trends observedmay reveal nonparametric dependencies on multiple explanatory variables, such as m/z, LC
Petyuk et al. Page 3
Anal Chem. Author manuscript; available in PMC 2009 February 1.
NIH
-PA Author Manuscript
NIH
-PA Author Manuscript
NIH
-PA Author Manuscript
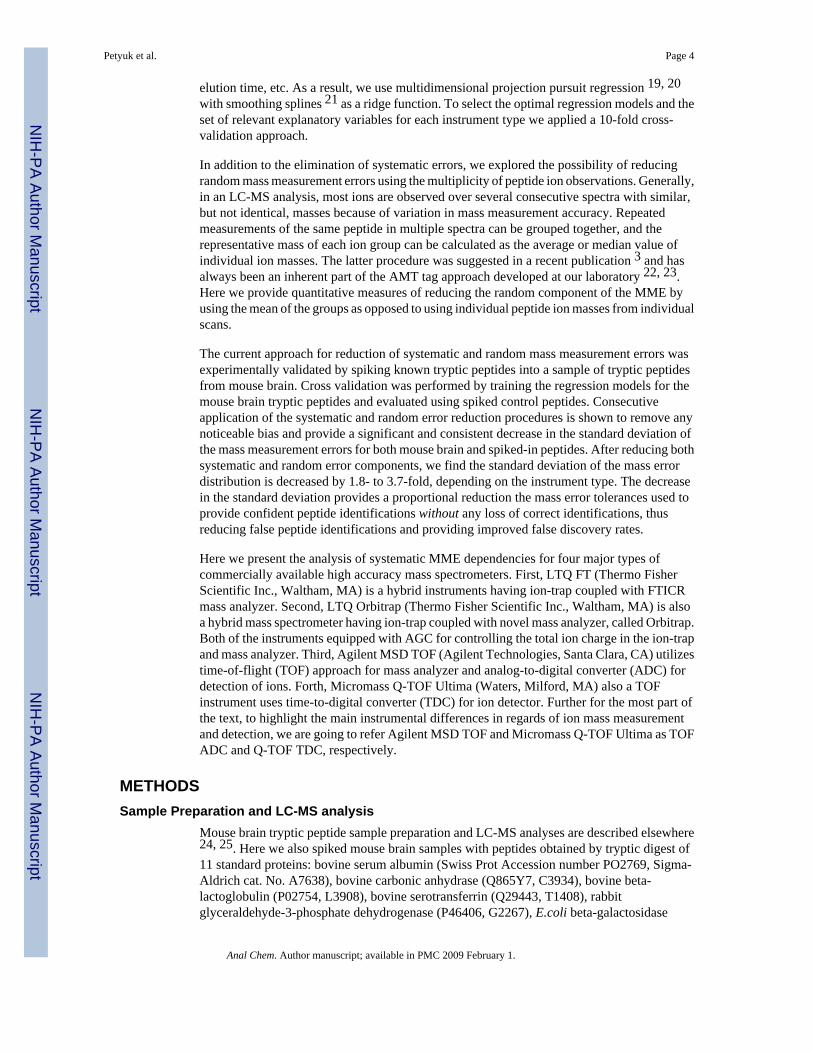
elution time, etc. As a result, we use multidimensional projection pursuit regression 19, 20with smoothing splines 21 as a ridge function. To select the optimal regression models and theset of relevant explanatory variables for each instrument type we applied a 10-fold cross-validation approach.
In addition to the elimination of systematic errors, we explored the possibility of reducingrandom mass measurement errors using the multiplicity of peptide ion observations. Generally,in an LC-MS analysis, most ions are observed over several consecutive spectra with similar,but not identical, masses because of variation in mass measurement accuracy. Repeatedmeasurements of the same peptide in multiple spectra can be grouped together, and therepresentative mass of each ion group can be calculated as the average or median value ofindividual ion masses. The latter procedure was suggested in a recent publication 3 and hasalways been an inherent part of the AMT tag approach developed at our laboratory 22, 23.Here we provide quantitative measures of reducing the random component of the MME byusing the mean of the groups as opposed to using individual peptide ion masses from individualscans.
The current approach for reduction of systematic and random mass measurement errors wasexperimentally validated by spiking known tryptic peptides into a sample of tryptic peptidesfrom mouse brain. Cross validation was performed by training the regression models for themouse brain tryptic peptides and evaluated using spiked control peptides. Consecutiveapplication of the systematic and random error reduction procedures is shown to remove anynoticeable bias and provide a significant and consistent decrease in the standard deviation ofthe mass measurement errors for both mouse brain and spiked-in peptides. After reducing bothsystematic and random error components, we find the standard deviation of the mass errordistribution is decreased by 1.8- to 3.7-fold, depending on the instrument type. The decreasein the standard deviation provides a proportional reduction the mass error tolerances used toprovide confident peptide identifications without any loss of correct identifications, thusreducing false peptide identifications and providing improved false discovery rates.
Here we present the analysis of systematic MME dependencies for four major types ofcommercially available high accuracy mass spectrometers. First, LTQ FT (Thermo FisherScientific Inc., Waltham, MA) is a hybrid instruments having ion-trap coupled with FTICRmass analyzer. Second, LTQ Orbitrap (Thermo Fisher Scientific Inc., Waltham, MA) is alsoa hybrid mass spectrometer having ion-trap coupled with novel mass analyzer, called Orbitrap.Both of the instruments equipped with AGC for controlling the total ion charge in the ion-trapand mass analyzer. Third, Agilent MSD TOF (Agilent Technologies, Santa Clara, CA) utilizestime-of-flight (TOF) approach for mass analyzer and analog-to-digital converter (ADC) fordetection of ions. Forth, Micromass Q-TOF Ultima (Waters, Milford, MA) also a TOFinstrument uses time-to-digital converter (TDC) for ion detector. Further for the most part ofthe text, to highlight the main instrumental differences in regards of ion mass measurementand detection, we are going to refer Agilent MSD TOF and Micromass Q-TOF Ultima as TOFADC and Q-TOF TDC, respectively.
METHODSSample Preparation and LC-MS analysis
Mouse brain tryptic peptide sample preparation and LC-MS analyses are described elsewhere24, 25. Here we also spiked mouse brain samples with peptides obtained by tryptic digest of11 standard proteins: bovine serum albumin (Swiss Prot Accession number PO2769, Sigma-Aldrich cat. No. A7638), bovine carbonic anhydrase (Q865Y7, C3934), bovine beta-lactoglobulin (P02754, L3908), bovine serotransferrin (Q29443, T1408), rabbitglyceraldehyde-3-phosphate dehydrogenase (P46406, G2267), E.coli beta-galactosidase
Petyuk et al. Page 4
Anal Chem. Author manuscript; available in PMC 2009 February 1.
NIH
-PA Author Manuscript
NIH
-PA Author Manuscript
NIH
-PA Author Manuscript

(P00722, G5635), bovine alpha-lactalbumin (P00711, L6010), equine skeletal musclemyoglobin (P02188, M0630), chicken ovalbumin (P01012, A2512), bovine cytochrome c(P00006, C2037), and rabbit phosphorylase b (P00489, P6635). An aliquot of 100 μg of mousebrain tryptic peptides was spiked with 0.5-2 μg of tryptic peptides from each of 11 knownproteins.
The 10 μg aliquots were analyzed on several different mass spectrometers: LTQ FT (ThermoFisher Scientific Inc., Waltham, MA), LTQ Orbitrap (Thermo Fisher Scientific Inc., Waltham,MA), Agilent MSD TOF (Agilent Technologies, Santa Clara, CA) and Micromass Q-TOFUltima (Waters, Milford, MA). The LC-MS gradient length was 100 min for the LTQ FT, LTQOrbitrap, and Agilent MSD TOF, and was 30 min for the Micromass Q-TOF. The LTQ FTand LTQ Orbitrap were operated with 5×10⁵ and 1×10⁶ ion population AGC setting,respectively. The resolution setting was 1×10⁵ at 400-2000 m/z range for both instruments.Both TOF instruments had 1 sec signal integration time and were operated in the V-mode.
LC-MS data analysisThe spectra deisotoping followed by peak matching was done using in-house developedsoftware ICR-2LS and VIPER 26, 27, respectively. The following regression analysis wasdone using scripts written in the R language for statistical computing 28. A demo R script isavailable in the supplement. For real-world data analysis, a variation of the present approachis embedded into the VIPER software.
The LC-MS features were defined as clusters of ion observations observed in consecutive MSspectra and having similar m/z values within certain tolerances. The m/z value of each LC-MSfeature was computed as a median of the m/z values of the constituting ions. The elution timeof the feature was defined as the time of the mass spectrum with the maximum ion abundance.Peptide identification was done by matching detected LC-MS features against a peptidedatabase, which contains theoretical monoisotopic masses and consistently observed LCelution times. In this study, we used a database consisting of ∼44,000 peptides (correspondingto ∼8,000 proteins) confidently identified in the mouse brain 25, 29 and ∼1,200 confidentlyidentified peptides from a tryptic digest of 11 spiked-in proteins. For the sake of simplicity,peptides common to both mouse brain and spiked-in standards were ignored.
Regression AnalysisThe MME of an ion can be described as the combination of systematic and randommeasurement errors:
(1)
The systematic error in ion mass measurement is the result of variation in several known andunknown physical parameters whose combined effect is difficult to predict. Some parameterslike m/z, ion intensity, total ion current, and temperature within the mass analyzer are knownto affect MME. MME can depend on mass to charge ratio if the instrument calibration isoutdated. It is also known that MME depends on TIC and ion intensity values because ofelectrostatic interactions between the ions that cause shifts of rotation frequencies in the ICRcells. Other physical parameters such as elution time are seen to affect the MME, but theserelationships are only correlational, rather than causational, and represent gross changes inunknown physical parameters that change during the course of an experiment. While some ofthe fundamental parameters such as m/z and ion intensity are captured during the course of theexperiment, others like temperature are not. Correspondingly, other gross correlationalparameters such as elution time are captured and implicitly represent some information aboutunknown parameters.
Petyuk et al. Page 5
Anal Chem. Author manuscript; available in PMC 2009 February 1.
NIH
-PA Author Manuscript
NIH
-PA Author Manuscript
NIH
-PA Author Manuscript

In this report, we attempted to model the systematic errors, εsystematic, as a function of the fourvariables m/z, elution time, ion intensity and TIC. Since the ion intensity and TIC valuesreported by the Xcalibur software (Thermo Finnigan, CA) are normalized by the AGCaccumulation times to 1 sec, we multiplied them by the accumulation times of thecorresponding spectra to get the actual values in the ICR or Orbitrap cells. While it is extremelychallenging to universally characterize systematic errors for all experiments using a functionof these four parameters, it is possible to fit models separately for each experiment by observingthe trend between MME and the parameters (Figure 1A). A statistical technique for modelingnonlinear trends in the space of multiple variables is the projection pursuit regression 20. Themodel expresses εsystematic in terms of a sum of univariate functions of linear combinations ofthe explanatory variables, translating the model (1) to
(2)
The proposed approach reduces systematic MME by estimating model (2) and subtracting offthe fitted values from the mass measurements of individual ions, leaving only the random errorcomponent.
The scatter plots of MME vs. the relevant variables in Figure 1A reveal a combination of densebands that represent true matches and scattered points that represent false matches. Dependencybetween MME and a variable can be seen from the band of true matches. The width of thedense bands reflects the amplitude of the random mass measurement error. The deviation ofthe trend of a dense band from the horizontal zero line serves as an indication of the systematicerror. It can be seen that in some cases the contribution of the systematic error is comparableor even larger than the contribution of the random error into the deviation of individual massmeasurement error residuals from the zero line. For example, the amplitude of the systematicMME trend for the TOF ADC dataset in response to the elution time parameter, or for the Q-TOF TDC dataset in response to the ion intensity parameter, exceeds the width of the banditself.
To reduce the interference of false identifications on the regression analysis, we filtered thedata based on elution time agreement criterion and retained only peptide identifications havingless than 1% difference with database elution time values. After performing regression analysison this subset, the trained function was recursively applied to the entire dataset. Although thepeptide identifications were enriched with true identifications using strict filtering criterionbased on peptide elution times, there are still enough false identifications to potentially havea detrimental effect on standard least-squares regression approaches. Thus we employed arobust two step regression approach. In the first pass, we applied Tukey’s running median (3)30, 31 to reduce the effect of outlying false identifications. The Tukey’s running mediansmoothed the error values by taking medians of the measurement errors εi in a sliding windowof odd width 2k+1. We then additionally smoothed the results of the running median intocontinuous differentiable function with a cubic smoothing spline (4) 21 (Figure 2). Fitting ofthe smoothing spline g is based on minimization of the objective function (PRSS), which isthe residual sum of squares plus the penalty for roughness weighted by the smoothing parameterλ.
(3)
(4)
Petyuk et al. Page 6
Anal Chem. Author manuscript; available in PMC 2009 February 1.
NIH
-PA Author Manuscript
NIH
-PA Author Manuscript
NIH
-PA Author Manuscript
Projection pursuit regression is an iterative process. Here for each of the iterations weconsidered points only within a certain interval around the zero line. For the first iteration thoseintervals were set at ±5 ppm, ±5 ppm, ±50 ppm and ±100 ppm for LTQ FT, LTQ Orbitrap,TOF ADC and Q-TOF TDC instruments, respectively. For subsequent iterations we either keptthe intervals fixed or dynamically adjusted them to 4 standard deviations of the MMEdistribution of the true identifications, derived with an expectation-maximization (EM)algorithm. However, in practice there was no noticeable difference for the final results. Theprocedure was applied iteratively until convergence was achieved or a predefined maximumnumber of iterations were performed.
To fit model (2), we must estimate the β parameters and the function g. To estimate the βparameters, we used a variant of a hill climbing optimization algorithm with fixed directionset along the coordinate axis, and successive reduction of the learning step length along thedimension used for each move (Figure 3). For each step the ridge function g was fit and thegoodness of fit evaluated as the average error within the initial fixed interval. As a ridge functiong we used Tukey’s running median followed by smoothing spline as described above (Figure2). We used average error or mean absolute error (MAE) instead of commonly used meansquared error (MSE) as a more robust goodness of fit measure in the presence of outlying falseidentifications.
Model SelectionBesides potentially complex dependencies, there is some degree of correlation between thefour selected explanatory variables under consideration. For example, the m/z of peptides iscorrelated with their elution times, with higher m/z peptides generally eluting later in an LCseparation. Thus, although some variables may reveal trends in the mass measurement errors,they may be largely explained by correlation with other variables. To select the parameter setthat sufficiently explains the systematic error, we searched for the model with the fewestvariables and with the lowest prediction error.
To estimate the prediction errors of all 15 models with all possible parameter combinations asexplanatory variables, we applied a 10-fold cross-validation approach. Unfortunately the massmeasurement error residuals do not follow the normal distribution, as it is contain for exampleresiduals of false matches. Thus, instead of relying on some sort of information criteria, wehad to use computationally intensive cross-validation procedure, which does not require theassumption of normality of the error residual distribution. In the situation when the errorresidual do not follow any distribution model, the assessment of statistical significancebecomes a non-trivial task. Nevertheless, we can certainly rank the performance of the modelsusing the results of 10-fold cross validation and choose the best one. In such an approach thedataset is randomly split into 10 parts and then 9 parts used to fit (train) the regression model;however the performance (prediction error) is estimated based on the error residuals for therest part not used for model training. Such cross validation approach penalizes overfitting.Particularly, increasing the complexity of the model by adding extra parameter, which indeedhave no affect on the mass accuracy only increases the prediction error since the training andtesting of the regression model performed on separate pieces of the dataset. The procedurerepeated 10 times, so each of the 10 parts is used for model testing and the overall predictionerror is taken as an average. The model having the minimal prediction error was consideredthe optimal solution (Figure 4).
RESULTSFigure 4 shows the performance of regression models having different combinations ofexplanatory variables for different LC-MS platforms. The results indicate that the systematicerror depends on elution time, m/z and ion intensities in all platforms except TOF ADC. The
Petyuk et al. Page 7
Anal Chem. Author manuscript; available in PMC 2009 February 1.
NIH
-PA Author Manuscript
NIH
-PA Author Manuscript
NIH
-PA Author Manuscript

systematic MME in the TOF ADC could be sufficiently explained by just two variables: elutiontime and m/z. Table 1 shows the results of applying the optimal models, along with thecontributions of the individual variables to the systematic errors observed for each platform.After correction with the optimal models (Figure 1B), no apparent dependency was observedbetween MME and any of the four variables. The improvement in the mass measurementaccuracy and precision was estimated by comparing the mean and the standard deviation ofmass measurement error residuals of the correct matches before and after the application ofthe model. To estimate those parameters, we assumed a mixture model for the errors: normaldistribution with relatively small standard deviation for the correct matches and another normaldistribution with large standard deviation (∼50 ppm 32) for incorrect matches. We used theexpectation-maximization algorithm to find maximum likelihood estimates of the means andstandard deviations of the distributions (Table 1).
Evaluation of Regression Models by Spiking a Set of Known PeptidesWe used a mouse brain tryptic peptide sample spiked with tryptic peptides from a set of knownpurified proteins to validate the approach. The regression model was trained using only themouse brain peptides, and the fitted model was applied to all the peptides, including the spikedset of peptides. It was expected that if the procedure performed correctly, both mouse brainpeptides and the spiked peptides would show similar distributions of MME after correction.Indeed, Figure 5 shows that the reduction of the standard deviation of MME of both the braintryptic peptides and peptides from the added protein are comparable. Besides elimination ofthe overall bias, the reduction of the standard deviations based on spiked-in sample is about1.3-fold for LTQ FT, 1.2-fold for LTQ Orbitrap instruments and about 1.9-fold for the TOFADC MS.
Reduction of the Random Error by Averaging the Mass Error ResidualsIn LC-MS measurements, the elution profile of an individual peptide usually consists of several(1-100) consecutive spectra and depends on the peak capacity of the LC column, the gradientlength, and the time required for the instrument to perform one scan, i.e. the duty cycle. Asmentioned earlier for the AMT tag approach, an ion seen in multiple consecutive spectra withsimilar m/z values will have its observations grouped together. The difference between thetheoretical monoisotopic masses of the peptides and the representative mass of the groups ofions is one of the main criteria for discrimination between the true and false peptideidentifications. The m/z value of each group is computed as a median of the m/z values of theindividual measurements. Here we explored the extent of reduction of the mass measurementerror by observing the reduction in MME between the median of the m/z values of the groupsand the individual m/z values. For the analyzed datasets, we observed an additional 1.8-, 1.3-and 1.8-fold reduction of the standard deviation of the peptide/group mass matching errors forthe LTQ FT, LTQ Orbitrap and TOF ADC instruments, respectively (Figure 5).
DISCUSSIONThe present report emphasizes the importance of selecting parameters that actually affect thesystematic mass measurement errors for a given MS instrument. Retaining only significantparameters allows the reduction of data dimensionality, and thus avoiding overfitting andreducing computational time. Our approach does not rely on any specific knowledge about thefactors affecting MME for each instrument type. The significance of the factors is discoveredbased solely on a statistical analysis of the mass error residuals of peaks matching a set of“expected” peptides. Most of the factors found to affect the MME for the studied datasets havepreviously been reported or commonly expected to have an affect on MME. For example, it isknown that TOF instruments may have a pronounced drift in the mass measurement accuracywith time. It should be noted that this drift is likely to be attributed to the temperature-dependent
Petyuk et al. Page 8
Anal Chem. Author manuscript; available in PMC 2009 February 1.
NIH
-PA Author Manuscript
NIH
-PA Author Manuscript
NIH
-PA Author Manuscript

changes of the power supply voltage and the expansion of the flight tube during the analysis,but not the LC elution time per se. One widely applied solution to this problem involves theintroduction of calibrants e.g. from a separate electrospray ionization source into theinstrument. In this report we did not consider the actual temperature of the power supply andthe flight tube during the spectrum acquisition as a parameter for each mass spectrum, butincluding additional temperature variables in the regression analysis might be helpful indecoupling temperature from other unknown parameters and could potentially provide a moreprecise understanding of systematic mass measurement errors. Similar considerations applyfor the LTQ Orbitrap instrument for which temperature change has been reported to be aprimary factor causing systematic mass measurement errors 3.
Although we have successfully applied the projection pursuit regression approach with robustsplines as ridge functions for post hoc systematic error elimination, we would like to discusssome potential limitations and corresponding improvements of the approach. For example, aswe mentioned before LC elution time may be a statistically good explanatory variable forsystematic error. However, elution time itself is not a physical factor directly affecting the massaccuracy, but simply reflects the changes of some other parameter with time, for examplethermal expansion of the flight tube on the TOF instruments, change of the power supplyvoltage on Orbitrap and TOF instruments or, as we mentioned above, ion composition in theICR cell. Potentially a problem may arise if any of these parameters (e.g. power supply voltage)undergo sudden change in time such that the systematic mass measurement error caused bythe sudden change appears comparable or large than standard deviation of the random errors.If the change is step-like and not smooth enough it may not be easily captured with the splineor some other continues function in the time domain. However such change is likely to be wellfit with a smooth continues function on the domain of the actual physical parameter directlyaffecting the mass measurement errors (e.g. power supply voltage). Thus it would helpful ifdevelopers of the commercial mass spectrometers make possible to log such an informationsuch as temperature of the flight tube and power supply voltage for the acquire scans and makeit user accessible. In addition it would also be helpful if such information could be stored inwidely accepted mass spectrometry data storage and exchange formats like mzXML 33 andmzData 34. Moreover, neither of the formats currently contains information on AGCaccumulation times for hybrid instrumentation like LTQ FT and LTQ Orbitrap, thus it becomesimpossible to account for the actual ion intensities and TIC parameters in recalibration, sincewe used that accumulation time to compute the mentioned parameter values in the ICR andOrbitrap cells because Xcalibur software returns those values normalized to 1 sec. Inclusionof more information into both of those formats should facilitate the development anddissemination of the software employing the described and perhaps other recalibrationstrategies accounting for multiple parameters affecting systematic mass measurement errors.
The present approach provides some new insights into aspects of platform performance. Forexample, the observed dependency of the LTQ FT systematic error on the LC elution time cannot be explained just by correlation of elution time with m/z values. Indeed the performanceof the regression model noticeably improves if elution time parameter accounted in additionto m/z and ion intensity (Figure 4). Such a dependency is somewhat unexpected and does nothave a straightforward explanation. The drift of the magnetic field is an almost negligible factorfor mass measurement accuracy and is typically < 0.05 ppm/hour for commercial instruments,and thus should not be more than 0.1 ppm for a 2 hour LC-MS measurement. It is likely thatthe observed dependency reflects a dependency on other factors. For example, although theLTQ FT instrument is equipped with AGC, which acts to minimize variation the total ioncurrent level, it is apparent that control is imperfect and that the actual stored ion populationsvary with time (Figure 6A), although certainly much greater variation would be observedwithout the use of AGC. We tentatively attribute the observation to the changes of the averagepeptide mass (and m/z) during the course of a separation (Figure 6B). Heavier species, with
Petyuk et al. Page 9
Anal Chem. Author manuscript; available in PMC 2009 February 1.
NIH
-PA Author Manuscript
NIH
-PA Author Manuscript
NIH
-PA Author Manuscript

higher charge states, tend to elute later from the reversed phase LC column. The average ioncharge of the peptides coming out of the LC column changes from ∼2 to ∼3, if to comparebeginning and the end of the gradient. Thus, the total signal, m/z, and average ion charge valuesall have some correlation with LC elution time, and potentially making it a better explanatoryvariable.
Another interesting finding is that in certain cases, in particular for LTQ Orbitrap instrument,there are clearly non-linear trends in dependency of systematic mass measurement errors onm/z (Figure 1A). To exclude the influence of other parameters we applied a regression modeltaking into account only the elution time, ion intensity and TIC and plot the resulting errorresiduals (Figure 7). We would like to emphasize that the dependency of the systematic erroron the m/z has still remained non-linear and rather complicated. Thus, such complicatedbehavior can not be explained by correlation of m/z with other parameters like elution time.This raises an important issue, that in this case calibration curve can not be perfectly fitted withcommonly used linear function. In the presented procedure it is well approximated with non-parametric spline function (Figure 1B). However, for other three types of instruments we didnot notice any significant deviations from linear dependency of the mass measurement errorson m/z.
The m/z and LC elution time variables are also correlated with each other. For example, forthe 100 min LC-MS analysis using the TOF instrument, the dependency trend of the errorresiduals on the m/z value primarily can be explained by the drift of mass measurement accuracywith LC elution time. This observation suggests some caution in using the entire LC-MSmeasurement dataset for calibrations schemes which does not take into account the elutiontime 4, 16, as the dependency on m/z may be primarily due to other factors (e.g. elution time)that correlate with m/z. The contribution of m/z to the systematic mass measurement error ishighly variable between instruments, and is likely to depend on how long ago the instrumentwas calibrated, how stable the calibration is, and the length of the LC-MS analysis.
Ion intensity was the most significant factor affecting mass measurement accuracy for the Q-TOF TDC. A change of one order of magnitude of the ion intensity caused a shift of themeasured mass errors by about 50 ppm. Such a dependency has a been previously observed,and a correction procedure has been proposed 35. This difference in behavior of the MMEbetween the TOF ADC and Q-TOF TDC instruments in response to the ion intensity valuestems from the differences in the ion detectors. The ADC takes the maximum of a signal’speak as an ion arrival time; whereas the TDC detects an ion arrival time as soon as its signalcrosses certain preset threshold level. This behavior causes mass measurements by TDC-baseddetectors to be very sensitive to ion intensities, since multiple ions create a signal that crossthe threshold faster, effectively making the ion masses appear to be of slightly lower m/z. Toisolate and visualize the effects of ion intensity parameter on the mass measurement errors forall four instruments we applied the regression models with elution time, m/z and TIC, to makesure all dependencies on other parameters are removed, and plotted the error residuals versusion intensity (Figure 8). The effect of ion intensity on the mass measurement errors is quitepronounced for LTQ FT and rather subtle for LTQ Obritrap. Indeed, the effect of individualion intensity on mass accuracy is well known for FTICR instruments, and recently arecalibration procedure has been proposed accounting for individual peak intensities 36.Intensity dependent effect for mass accuracy has also been observed for LTQ Orbitrapinstrumentation 3.
Another important observation is the variation of the random error component (width of thetrend) across some parameters. This effect is most apparent from the scatter plot of massmeasurement error residuals vs. ion intensity for the LTQ FT after the systematic errorelimination. We estimated the standard deviations for the subsets of correct matches for low
Petyuk et al. Page 10
Anal Chem. Author manuscript; available in PMC 2009 February 1.
NIH
-PA Author Manuscript
NIH
-PA Author Manuscript
NIH
-PA Author Manuscript

and high intensity ions that have log10 ion intensity values of 3.0±0.1 and 4.0±0.1, respectively.The standard deviation values estimated with the EM algorithm for low and high intensity ionshave a 2.5-fold difference, with values of 0.935 ppm and 0.365 ppm, respectively. Theobservation can be explained by a shorter transient signal in the ICR cells for low intensityions. Precision of the mass measurement is also known to linearly decrease with m/z of an ionfor ICR instruments and as a square root of m/z for the Orbitrap. These factors indicateheteroscedasticity and a mixture distribution for the random mass measurement errors, withstandard deviations being a function of ion intensity and m/z. The issue is more complicatedfor the groups of ions representing the same peptide, as the amplitude of the reduction of therandom error depends on the number of observations in a group. However, in the EM algorithmreported here, we used only a single normal distribution for correct matches and another normaldistribution for incorrect matches. Having one normal distribution for correct matches greatlyreduces the computational burden and simplifies comparisons of dataset measurements.Overall, the two mixture model proved effective (Figure 5), noticeable deviation was observedonly for the LTQ FT, which exhibited the strongest heteroscedasticity along the intensity andm/z parameters.
In this work we demonstrated a method for correction of systematic MME based on statisticsof peptides identified with AMT tag approach. It is important that the systematic massmeasurement error component is minimized or eliminated from LC-MS datasets, since theyhave a potential to cause artificial bias in the assignment of the confidence of the peptideidentifications. Since accurately measured peptide mass is one of the parameters used forpeptide identification in AMT tag approach, the benefit of using this method is apparent as ithelps to reduce the maximum allowable mass deviation and better discriminate between correctand incorrect identifications.
However, the reported algorithm can also benefit another widely used bottom-up proteomicapproach based on MS/MS fragmentation patterns if accurately measured parent ion mass isone of the parameters used for discrimination of correct and incorrect peptide identifications.For instance, for the instruments equipped both with fragmentation cells and high accuracymass analyzers, the subset of peptides enriched with true identifications can be selected basedon the goodness of matching of the observed fragmentation patterns with expected ones. XCorrand ΔCn values from SEQUEST 37 or E-values from X!Tandem 38 are couple of typical scoresused for discrimination between true and false peptide identifications based on theirfragmentation patterns. The subset of peptides enriched with true identification can be usedfor elimination of the systematic MME based on dependencies on m/z, elution time, ionintensity and other parameters as described in this report. To mitigate the effect of randomerrors, the peptide’s mass can be estimate as a mean of peptide’s ion masses from fewconsecutive scans 3, 22. Finally, after elimination of systematic and reducing the random errors,parent ion MME can be used as additional criteria to reduce the number of false identificationsto achieve lower FDR and higher confidence. Based on the results from the current work, weexpect that the presented procedure should results in a 2-4 fold decrease of the number of falsepositive identifications as to compare to simply using the raw, unrefined MME values.
Projection pursuit regression is computationally intensive procedure, especially given the sizeof the proteomic datasets (on average ∼105 detected isotopic envelops in this work). Areasonable compromise could be to use a simple additive model (5), which avoids the searchfor optimal projections and performs regressions along the parameter dimensions. Thus, it isdrastically less computationally intensive, but may not potentially capture complicated inter-parameter dependencies as a possible trade off.
(5)
Petyuk et al. Page 11
Anal Chem. Author manuscript; available in PMC 2009 February 1.
NIH
-PA Author Manuscript
NIH
-PA Author Manuscript
NIH
-PA Author Manuscript

The simple additive regression model has been implemented in the software developed at ourlaboratory 26, 27, 39 and currently allows for correction of the systematic mass measurementerrors as a function of elution time and m/z of the LC-MS features (Figure 9).
The presented algorithm for reduction of the MME based on statistics from errors for putativelyidentified components will be applied in future efforts at our laboratory and also expect it tobe adopted for a wide range of related LC-MS approaches (e.g. top-down proteomics,metabolomics) to increase the confidence of identifications for the data acquired on the high-resolution instrumentation.
AKNOWLEDGEMENTS
The research was supported by the NIH National Center for Research Resources (RR18522 to RDS). Proteomicanalyses were performed in the Environmental Molecular Sciences Laboratory, a U.S. Department of Energy (DOE)national scientific user facility located at the Pacific Northwest National Laboratory (PNNL) in Richland, Washington.PNNL is a multi-program national laboratory operated by Battelle Memorial Institute for the DOE under ContractDE-AC05-76RL01830.
REFERENCES(1). Qian WJ, Camp DG 2nd, Smith RD. Expert Rev Proteomics 2004;1:87–95. [PubMed: 15966802](2). Haas W, Faherty BK, Gerber SA, Elias JE, Beausoleil SA, Bakalarski CE, Li X, Villen J, Gygi SP.
Mol Cell Proteomics 2006;5:1326–1337. [PubMed: 16635985](3). Olsen JV, de Godoy LM, Li G, Macek B, Mortensen P, Pesch R, Makarov A, Lange O, Horning S,
Mann M. Mol Cell Proteomics 2005;4:2010–2021. [PubMed: 16249172](4). Jaffe JD, Mani DR, Leptos KC, Church GM, Gillette MA, Carr SA. Mol Cell Proteomics
2006;5:1927–1941. [PubMed: 16857664](5). Loboda AV, Krutchinsky AN, Bromirski M, Ens W, Standing KG. Rapid Commun Mass Spectrom
2000;14:1047–1057. [PubMed: 10861986](6). Palmer ME, Clench MR, Tetler LW, Little DR. Rapid Communications in Mass Spectrometry
1999;13:256–263.(7). Belov ME, Zhang R, Strittmatter EF, Prior DC, Tang K, Smith RD. Anal Chem 2003;75:4195–4205.
[PubMed: 14632135](8). Herniman JM, Bristow TW, O’Connor G, Jarvis J, Langley GJ. Rapid Commun Mass Spectrom
2004;18:3035–3040. [PubMed: 15543531](9). Strittmatter EF, Rodriguez N, Smith RD. Anal Chem 2003;75:460–468. [PubMed: 12585471](10). Strittmatter EF, Ferguson PL, Tang K, Smith RD. J Am Soc Mass Spectrom 2003;14:980–991.
[PubMed: 12954166](11). Bruce JE, Anderson GA, Brands MD, Pasa-Tolic L, Smith RD. J Am Soc Mass Spectrom
2000;11:416–421. [PubMed: 10790845](12). Matthiesen R, Trelle MB, Hojrup P, Bunkenborg J, Jensen ON. J Proteome Res 2005;4:2338–2347.
[PubMed: 16335983](13). Matthiesen R. Proteomics 2007;7:2815–2832. [PubMed: 17703506](14). Zubarev R, Mann M. Mol Cell Proteomics. 2006(15). Palmblad M, Bindschedler LV, Gibson TM, Cramer R. Rapid Commun Mass Spectrom
2006;20:3076–3080. [PubMed: 16988928](16). Yanofsky CM, Bell AW, Lesimple S, Morales F, Lam TT, Blakney GT, Marshall AG, Carrillo B,
Lekpor K, Boismenu D, Kearney RE. Anal Chem 2005;77:7246–7254. [PubMed: 16285672](17). Becker CH, Kumar P, Jones T, Lin H. Anal Chem 2007;79:1702–1707. [PubMed: 17297976](18). Tolmachev AV, Monroe ME, Jaitly N, Petyuk VA, Adkins JN, Smith RD. Anal Chem
2006;78:8374–8385. [PubMed: 17165830](19). Härdle, W. Applied nonparametric regression. Cambridge University Press; Cambridge [England] ;
New York: 1990.(20). Friedman JH, Stuetzle W. Journal of the American Statistical Association 1981;76:817–823.
Petyuk et al. Page 12
Anal Chem. Author manuscript; available in PMC 2009 February 1.
NIH
-PA Author Manuscript
NIH
-PA Author Manuscript
NIH
-PA Author Manuscript

(21). Hastie, T.; Tibshirani, R.; Friedman, JH. The elements of statistical learning : data mining, inference,and prediction : with 200 full-color illustrations. Springer; New York: 2001.
(22). Zimmer JS, Monroe ME, Qian WJ, Smith RD. Mass Spectrom Rev 2006;25:450–482. [PubMed:16429408]
(23). Lipton MS, Pasa-Tolic L, Anderson GA, Anderson DJ, Auberry DL, Battista JR, Daly MJ,Fredrickson J, Hixson KK, Kostandarithes H, Masselon C, Markillie LM, Moore RJ, Romine MF,Shen Y, Stritmatter E, Tolic N, Udseth HR, Venkateswaran A, Wong KK, Zhao R, Smith RD. ProcNatl Acad Sci U S A 2002;99:11049–11054. [PubMed: 12177431]
(24). Wang H, Qian WJ, Mottaz HM, Clauss TR, Anderson DJ, Moore RJ, Camp DG 2nd, Khan AH,Sforza DM, Pallavicini M, Smith DJ, Smith RD. J Proteome Res 2005;4:2397–2403. [PubMed:16335993]
(25). Petyuk VA, Qian WJ, Chin MH, Wang H, Livesay EA, Monroe ME, Adkins JN, Jaitly N, AndersonDJ, Camp DG 2nd, Smith DJ, Smith RD. Genome Res 2007;17:328–336. [PubMed: 17255552]
(26). http://ncrr.pnl.gov/software(27). Monroe ME, Tolic N, Jaitly N, Shaw JL, Adkins JN, Smith RD. Bioinformatics. 2007(28). http://www.r-project.org(29). Wang H, Qian WJ, Chin MH, Petyuk VA, Barry RC, Liu T, Gritsenko MA, Mottaz HM, Moore
RJ, Camp Ii DG, Khan AH, Smith DJ, Smith RD. J Proteome Res 2006;5:361–369. [PubMed:16457602]
(30). Tukey, JW. Exploratory data analysis. Addison-Wesley Pub. Co.: Reading, Mass.; 1977.(31). Hardle W, Steiger W. Applied Statistics-Journal of the Royal Statistical Society Series C
1995;44:258–264.(32). Wolski WE, Farrow M, Emde AK, Lehrach H, Lalowski M, Reinert K. Proteome Sci 2006;4:18.
[PubMed: 16995952](33). Pedrioli PG, Eng JK, Hubley R, Vogelzang M, Deutsch EW, Raught B, Pratt B, Nilsson E, Angeletti
RH, Apweiler R, Cheung K, Costello CE, Hermjakob H, Huang S, Julian RK, Kapp E, McCombME, Oliver SG, Omenn G, Paton NW, Simpson R, Smith R, Taylor CF, Zhu W, Aebersold R. NatBiotechnol 2004;22:1459–1466. [PubMed: 15529173]
(34). Orchard S, Taylor C, Hermjakob H, Zhu W, Julian R, Apweiler R. Expert Rev Proteomics2004;1:179–183. [PubMed: 15966812]
(35). Kofeler HC, Gross ML. J Am Soc Mass Spectrom 2005;16:406–408. [PubMed: 15734334](36). Masselon C, Tolmachev AV, Anderson GA, Harkewicz R, Smith RD. J Am Soc Mass Spectrom
2002;13:99–106. [PubMed: 11777206](37). Yates JR 3rd, Eng JK, McCormack AL, Schieltz D. Anal Chem 1995;67:1426–1436. [PubMed:
7741214](38). Fenyo D, Beavis RC. Anal Chem 2003;75:768–774. [PubMed: 12622365](39). Jaitly N, Monroe ME, Petyuk VA, Clauss TR, Adkins JN, Smith RD. Anal Chem 2006;78:7397–
7409. [PubMed: 17073405]
Petyuk et al. Page 13
Anal Chem. Author manuscript; available in PMC 2009 February 1.
NIH
-PA Author Manuscript
NIH
-PA Author Manuscript
NIH
-PA Author Manuscript

Petyuk et al. Page 14
Anal Chem. Author manuscript; available in PMC 2009 February 1.
NIH
-PA Author Manuscript
NIH
-PA Author Manuscript
NIH
-PA Author Manuscript

Figure 1.Scatter plots showing mass measurement error versus different parameters for differentinstruments before (A) and after (B) applying the systematic error correction procedure. Notedifferent scales of mass measurement error for different instruments.
Petyuk et al. Page 15
Anal Chem. Author manuscript; available in PMC 2009 February 1.
NIH
-PA Author Manuscript
NIH
-PA Author Manuscript
NIH
-PA Author Manuscript

Figure 2.An illustration of the iterative regression-based systematic error elimination approach. Thedata shows dependency of the mass measurement errors on elution time for the TOF ADCinstrument. We considered only data points that fell within a certain tolerance window (+/- 50ppm, in the case of TOF ADC, indicated by the dashed green line). (A) At the first step, thedata are smoothed using Tukey’s running median (red points). (B) At the second step, therunning medians are fitted with a smoothing spline (blue line). (C) The predicted systematicerrors are subtracted from the observed mass measurement errors for the entire dataset.
Petyuk et al. Page 16
Anal Chem. Author manuscript; available in PMC 2009 February 1.
NIH
-PA Author Manuscript
NIH
-PA Author Manuscript
NIH
-PA Author Manuscript

Petyuk et al. Page 17
Anal Chem. Author manuscript; available in PMC 2009 February 1.
NIH
-PA Author Manuscript
NIH
-PA Author Manuscript
NIH
-PA Author Manuscript
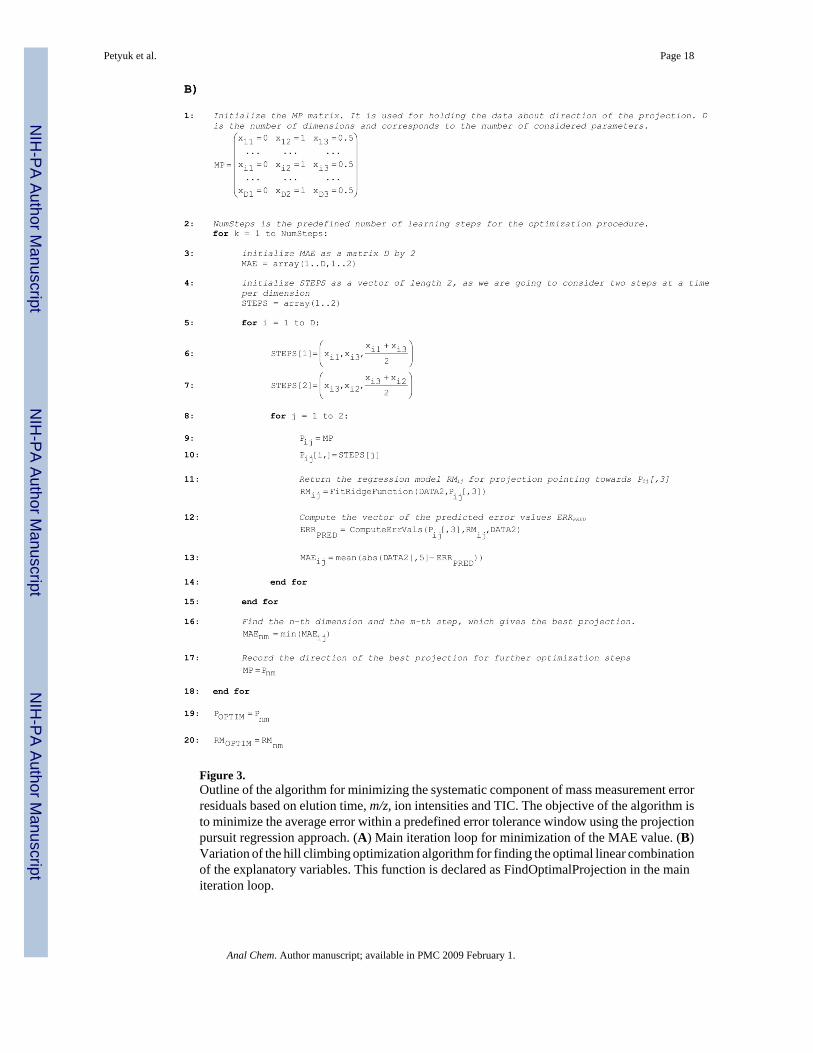
Figure 3.Outline of the algorithm for minimizing the systematic component of mass measurement errorresiduals based on elution time, m/z, ion intensities and TIC. The objective of the algorithm isto minimize the average error within a predefined error tolerance window using the projectionpursuit regression approach. (A) Main iteration loop for minimization of the MAE value. (B)Variation of the hill climbing optimization algorithm for finding the optimal linear combinationof the explanatory variables. This function is declared as FindOptimalProjection in the mainiteration loop.
Petyuk et al. Page 18
Anal Chem. Author manuscript; available in PMC 2009 February 1.
NIH
-PA Author Manuscript
NIH
-PA Author Manuscript
NIH
-PA Author Manuscript
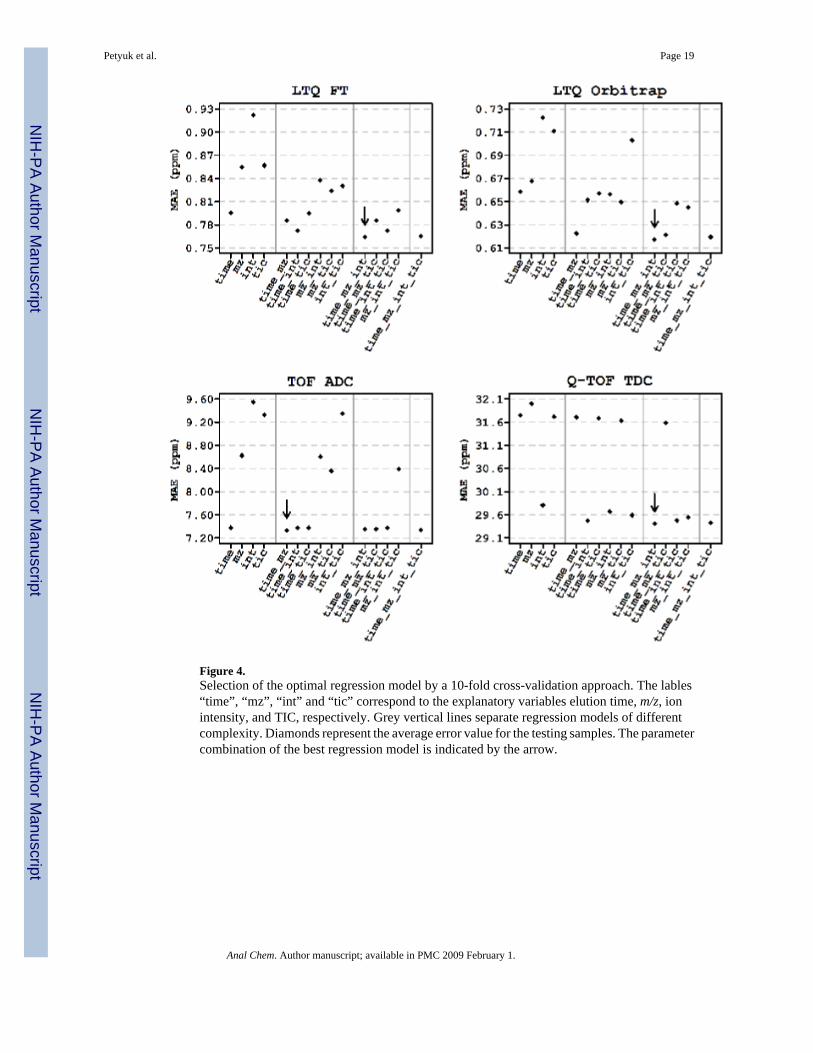
Figure 4.Selection of the optimal regression model by a 10-fold cross-validation approach. The lables“time”, “mz”, “int” and “tic” correspond to the explanatory variables elution time, m/z, ionintensity, and TIC, respectively. Grey vertical lines separate regression models of differentcomplexity. Diamonds represent the average error value for the testing samples. The parametercombination of the best regression model is indicated by the arrow.
Petyuk et al. Page 19
Anal Chem. Author manuscript; available in PMC 2009 February 1.
NIH
-PA Author Manuscript
NIH
-PA Author Manuscript
NIH
-PA Author Manuscript

Figure 5.Validation of the systematic error elimination approach using a set of known, spiked-inpeptides. Mass error distribution histograms were plotted before and after the procedure. Themean and the standard deviation of the correct matches were estimated using the EM algorithm.The regression model was trained only on tryptic peptides from mouse brain, but applied to allpeptides including spiked-in QC peptides. The reduction in MME of the spiked peptides wascomparable to that observed for the mouse peptides.
Petyuk et al. Page 20
Anal Chem. Author manuscript; available in PMC 2009 February 1.
NIH
-PA Author Manuscript
NIH
-PA Author Manuscript
NIH
-PA Author Manuscript
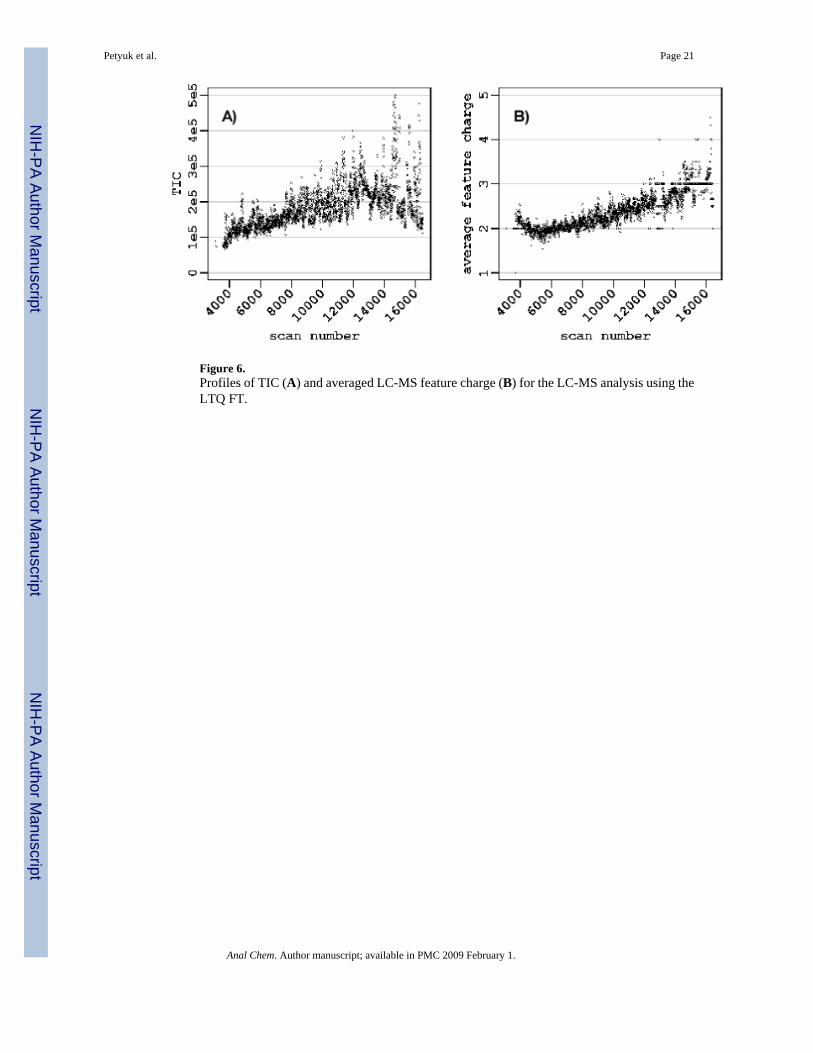
Figure 6.Profiles of TIC (A) and averaged LC-MS feature charge (B) for the LC-MS analysis using theLTQ FT.
Petyuk et al. Page 21
Anal Chem. Author manuscript; available in PMC 2009 February 1.
NIH
-PA Author Manuscript
NIH
-PA Author Manuscript
NIH
-PA Author Manuscript

Figure 7.Scatter plots showing the dependencies of mass measurement errors on elution time, m/z, ionintensity and TIC for LTQ Orbitrap instrument after apply systematic error eliminationprocedure taking into account all parameters other than m/z. The complicated non-lineardependency of mass measurement error on m/z still remained while none of other parametersused for regression model reveals any residual trend.
Petyuk et al. Page 22
Anal Chem. Author manuscript; available in PMC 2009 February 1.
NIH
-PA Author Manuscript
NIH
-PA Author Manuscript
NIH
-PA Author Manuscript

Figure 8.Scatter plots showing the dependency of mass measurements error residuals on ion intensityafter applying systematic error elimination procedure taking into account only elution time andm/z parameters. The dependency of systematic mass measurement error on ion intensity ishighly pronounced for Q-TOF TDC and LTQ FT instruments as a bias of high intense ionstowards lighter masses. For LTQ Orbitrap instrument the dependency is significantly less andpresent as a bias of low intense ions towards heavier masses. Mass measurement error for theTOF ADC does not exhibit any dependency on ion intensity.
Petyuk et al. Page 23
Anal Chem. Author manuscript; available in PMC 2009 February 1.
NIH
-PA Author Manuscript
NIH
-PA Author Manuscript
NIH
-PA Author Manuscript

Figure 9.One of the user interfaces of the VIPER software. Scatter plots show the mass measurementerror residuals of the LC-MS features before and after correction. The example shows dataobtained using an LTQ Orbitrap mass spectrometer.
Petyuk et al. Page 24
Anal Chem. Author manuscript; available in PMC 2009 February 1.
NIH
-PA Author Manuscript
NIH
-PA Author Manuscript
NIH
-PA Author Manuscript

NIH
-PA Author Manuscript
NIH
-PA Author Manuscript
NIH
-PA Author Manuscript
Petyuk et al. Page 25
Table 1Results of applying the regression model to eliminate the systematic MME component
LTQ FT LTQ Orbitrap TOF ADC Q-TOF TDCmean before/aftera) 0.056/-0.009 -0.580/0.001 -9.86/0.06 -1.13/0.26SD before/aftera) 0.93/0.71 0.69/0.54 8.2/4.0 8.5/5.5elution timeb) 81.4% 66.0% 98.7% 8.3%m/zb) 4.7% 30.6% 1.3% 6.3%ion intensityb) 13.9% 3.4% --- 85.4%TICb) --- --- --- ---a)
Reduction of the bias (ppm) and the standard deviation (ppm) after removing the systematic MME component using the optimal regression model.
b)Estimated contribution of individual parameters into reduction of the average error associated with systematic MME. The contributions were estimated
by applying models with increasing number of parameters and scaling the decrease of the average error from 0 to 100%. Where 0% is the average errorof zero-centered MME, and 100% is the average error after applying the optimized model. The order at which the parameters were added is derived fromthe results of model performance estimation (Figure 4) and starts from the most important to the least important. The order is elution time, ion intensity,m/z for LTQ FT, elution time, m/z, ion intensity for LTQ Orbitrap, elution time, m/z for TOF ADC and ion intensity, elution time, m/z for Q-TOF TDC.
Anal Chem. Author manuscript; available in PMC 2009 February 1.
Copyright © 2022 FDOKUMEN