
Elevation modeling using radargrammetry: Case study from Malaysia
11
12th AGILE International Conference on Geographic Information Science 2009 page 1 of 11 Leibniz Universität Hannover, Germany Elevation Modeling using Radargrammetry: Case study from Malaysia Biswajeet Pradhan, Tobias Bolch, Manfred F. Buchroithner Institute of Cartography, Faculty of Forestry, Geo and Hydro-Science Dresden University of Technology, 01062 Dresden, Germany, Tel: +49-351 463 33099; Fax: +49-351 463 37028 [email protected] (Corresponding author) ABSTRACT This paper presents the generation of DEM using six pairs of Radarsat-1 images for part of tropical terrain in Malaysia. The images were acquired with various beam modes and incident angles and used to generate DEMs by means of radargrammetry based on two SAR imaging models: Range-Doppler and Co-linearity condition equations model. First, the physical basis of these two models was assessed, and then, the characters and the performance of these models were evaluated. For the latter the accuracies of the DEMs were assessed using reference data such as digital contour maps. The results of the analysis shows that for all stereo pairs, the accuracy of DEMs by the Range-Doppler model are better than the Co-linearity condition equation model. Finally, the relationship between the DEM accuracy and some important factors, such as orbit, beam mode, spatial resolution, the intersection angle and the impact of terrain, were analyzed. Keywords: Radargrammetry, Radarsat, SAR image, DEM 1. INTRODUCTION Digital Elevation Model (DEM) has served as a very important source of data which is able to provide useful information about land transformations (Lin and King, 2001). It has been widely used for various GIS applications which require elevation as the main parameter. Conventionally, DEM is generated based on topographical survey. However, this method is extremely time consuming and less efficient when applied to an area which is not easily accessible. Remote sensing technology offers DEM generation using radargrammetry, which is more suitable for tropical areas due to its capability to work on all-day and all-weather, enables scientists to generate accurate DEM with minimum ground survey. Generally, there are three methods for generating DEM using SAR (Synthetic Aperture Radar) imagery (Schmieder and Huber, 2000; Lee and Grandi, 1996; Paquerault et al. 1996; Toutin and Gray, 2000) including StereoSAR and Radarclinometry), InSAR and Polarimetry. RADARSAT-1 offers 35 different beam-mode combinations, with incidence angles ranging from 10 to 59 degrees and spatial resolution varying from 10 to 100 m. In this paper, Six pairs of Radarsat-1 images of a tropical forest area in Malaysia with various beam modes and incident angles were used to generate DEMs using Radargrammetry based on two SAR imaging models; Range-Doppler and Co-linearity condition equations model. By comparing the accuracies of the DEMs generated by the two models, the characters and the performance of these models were evaluated; at the same time, the relationship between DEM accuracy and different stereo combinations were analyzed.
-
Upload
independent -
Category
Documents
-
view
1 -
download
0
Transcript of Elevation modeling using radargrammetry: Case study from Malaysia

12th AGILE International Conference on Geographic Information Science 2009 page 1 of 11 Leibniz Universität Hannover, Germany
Elevation Modeling using Radargrammetry: Case study from Malaysia
Biswajeet Pradhan, Tobias Bolch, Manfred F. Buchroithner Institute of Cartography, Faculty of Forestry, Geo and Hydro-Science
Dresden University of Technology, 01062 Dresden, Germany, Tel: +49-351 463 33099; Fax: +49-351 463 37028
[email protected] (Corresponding author)
ABSTRACT
This paper presents the generation of DEM using six pairs of Radarsat-1 images for part of tropical terrain in Malaysia. The images were acquired with various beam modes and incident angles and used to generate DEMs by means of radargrammetry based on two SAR imaging models: Range-Doppler and Co-linearity condition equations model. First, the physical basis of these two models was assessed, and then, the characters and the performance of these models were evaluated. For the latter the accuracies of the DEMs were assessed using reference data such as digital contour maps. The results of the analysis shows that for all stereo pairs, the accuracy of DEMs by the Range-Doppler model are better than the Co-linearity condition equation model. Finally, the relationship between the DEM accuracy and some important factors, such as orbit, beam mode, spatial resolution, the intersection angle and the impact of terrain, were analyzed. Keywords: Radargrammetry, Radarsat, SAR image, DEM
1. INTRODUCTION
Digital Elevation Model (DEM) has served as a very important source of data which is able to provide useful information about land transformations (Lin and King, 2001). It has been widely used for various GIS applications which require elevation as the main parameter. Conventionally, DEM is generated based on topographical survey. However, this method is extremely time consuming and less efficient when applied to an area which is not easily accessible. Remote sensing technology offers DEM generation using radargrammetry, which is more suitable for tropical areas due to its capability to work on all-day and all-weather, enables scientists to generate accurate DEM with minimum ground survey. Generally, there are three methods for generating DEM using SAR (Synthetic Aperture Radar) imagery (Schmieder and Huber, 2000; Lee and Grandi, 1996; Paquerault et al. 1996; Toutin and Gray, 2000) including StereoSAR and Radarclinometry), InSAR and Polarimetry. RADARSAT-1 offers 35 different beam-mode combinations, with incidence angles ranging from 10 to 59 degrees and spatial resolution varying from 10 to 100 m. In this paper, Six pairs of Radarsat-1 images of a tropical forest area in Malaysia with various beam modes and incident angles were used to generate DEMs using Radargrammetry based on two SAR imaging models; Range-Doppler and Co-linearity condition equations model. By comparing the accuracies of the DEMs generated by the two models, the characters and the performance of these models were evaluated; at the same time, the relationship between DEM accuracy and different stereo combinations were analyzed.

12th AGILE International Conference on Geographic Information Science 2009 page 2 of 11 Leibniz Universität Hannover, Germany
2. STUDY AREA
The selected site for this study covers the areas around Raub and Temerloh in the state of Pahang in Peninsular Malaysia is shown in Figure 1. This site is selected due to the various types of landforms which include flat land, moderate hilly areas and mountainous areas. The Radarsat imagery used in this study are listed in Table 1. The ancillary data include the topographic maps (1: 50,000) and the DEM generated from contour data. Figure 2 depicts the various path-row of the Radarsat images used in this study.
Figure 1: Satellite image map of study area.
Figure 2: Path-row of the Radarsat images in the study area.
RRaauubb
BBeennttoonngg TTeemmeerrlloohh

12th AGILE International Conference on Geographic Information Science 2009 page 3 of 11 Leibniz Universität Hannover, Germany
NO. Beam Orbit Incident angle (°)
Resolution(m) (Range×Azimuth)
Acquisition Date
1 S6 Ascending 45-49 20×27 2005-06-16 W2 Ascending 31-39 25×27 2005-06-06
2 S2 Ascending 30-37 20×27 2005-02-08
S7 Ascending 39-42 19×27 2005-02-10
3 S3 Descending 30-37 25×27 2005-02-10 S5 Descending 36-42 22×27 2005-02-17
4 S5 Ascending 36-42 22×27 2005-02-18 S7 Ascending 39-42 19×27 2005-02-11
5 S1 Descending 20-27 24×27 2005-02-27 S3 Descending 30-37 25×27 2005-02-10
6 F1 Descending 37-41 8.3×8.4 2005-03-13 F4 Descending 43-46 7.3×8.4 2005-02-24
Table 1: The dataset of Radarsat in study area.
3. METHODOLOGY: DEM GENERATION USING RADARGRAMMETRY
SAR imaging model affects the accuracy of the result in Radargrammetry. In this study, the Range-Doppler model (Leberl, 1990; Ming-Jun, 2004) and Co-linearity condition equation model (Konecny and Schuhr, 1988) were selected and compared. The main processing steps to generate Radargrammetry DEM from RASARSAT stereo pairs and the overall methodology adopted in this study is shown in Figure 3.

12th AGILE International Conference on Geographic Information Science 2009 page 4 of 11 Leibniz Universität Hannover, Germany
Figure 3: Schematic representation of methodology.
Range-Doppler Model In the Range-Doppler model, the coordinate of a target on the ground is ),,( ZYX , and
),,( sss ZYX represents the position of the SAR sensor. Equation (1) shows the relationship between these two positions (ground range imagery).
2222 )()()( RZZYYXX sss =−+−+− (1)
Where, R is the slant range between the target and the sensor. As for azimuth direction, the zero Doppler condition is employed, as shown in equation (2).
0)()()( =−+−+− sss ZZVszYYVsyXXVsx (2)
( VszVsyVsx ) are the speed vector of the platform. For StereoSAR, Based on the Range-Doppler model, we can form the four equations listed below,
Stereo images Stereo GCPs DGPS survey Topographic map
Stereo-model set-up Geometric model parameters
Image matching Elevation points
3D Stereo intersection Raw DEM
DEM edit
Final DEM DEM geocode

12th AGILE International Conference on Geographic Information Science 2009 page 5 of 11 Leibniz Universität Hannover, Germany
2 2 2 21 1 1 1
1 1 1 1 1 12 2 2 2
2 2 2 2
2 2 2 2 2 2
( ) ( ) ( ) 0( ) ( ) ( ) 0
( ) ( ) ( ) 0( ) ( ) ( ) 0
s s s
sx s sy s sz s
s s s
sx s sy s sz s
X X Y Y Z Z RV X X V Y Y V Z Z
X X Y Y Z Z RV X X V Y Y V Z Z
⎧ − + − + − − =⎪ − + − + − =⎪⎨ − + − + − − =⎪⎪ − + − + − =⎩
(3)
111111 szsysxsss VVVZYX are the position vectors and speed vector of the left SAR image;
222222 szsysxsss VVVZYX are the position vectors and speed vector of the right SAR image. The coordinate of a target can be retrieved by resolving equation (3).
Co-Linearity Condition Equation Model Konecny brought the Co-linearity condition equation model into SAR imagery in 1988 (Konecny and Schuhr, 1988).
1 2 3'
1 2 3
1 2 3'
1 2 3
( ) ( ) ( )0
( ) ( ) ( )
( ) ( ) ( )( ) ( ) ( )
j i sj j i sj j sjgr x
j i sj j i sj j sj
j i sj j i sj j sjgr y
j i sj j i sj j sj
a X X X a Y Y Y a Z Zx f
c X X X c Y Y Y c Z Z
b X X X b Y Y Y b Z Zy f
c X X X c Y Y Y c Z Z
−Δ − + −Δ − + −⎧= = −⎪ −Δ − + −Δ − + −⎪
⎨ −Δ − + −Δ − + −⎪ = −⎪ −Δ − + −Δ − + −⎩
(4)
iX , iY , iZ is the coordinates of target i on the ground� sjX , sjY , sjZ is the position of sensor at
time j , xf , yf is equivalent focus, ix , iy is the position of target i in slant range image. For each
SAR image, six exterior orientation elements ( sjX , sjY , sjZ , κωϕ ,, ) should be calculated.
4. RESULTS AND DISCUSSION
Ground Control Points (GCP) collection is time consuming and costly, especially for areas that are not easily accessible. Locating GCP(s) in SAR images is much harder compared to optical images. People often expect to get good DEM with as few GCP as possible. To obtain higher accuracy, a GPS field survey was carried out to acquire high accurate GCPs using the Trimble 4000SE high precision GPS system. Different models require different number of GCP(s) and the distribution. Here, the numbers of GCPs used in generating DEM for every pair are listed in Table 2. For the Range-Doppler model, DEM can be generated from a stereo pair totally depending on the orbit data even without any GCP, but as for the Co-linearity condition equation model, at least six well-distributed GCPs are needed to get the exterior orientation elements, in practice, more than 20 GCPs should be used to improve the accuracy. The resolution of the final DEM is 30 meters. Figure 4(a) is the DEM generated from W2/S6, Figure 1(b) is the DEM generated from S2/S7, Figure 4(c), (d) are the relief-shade images of corresponding DEMs.

12th AGILE International Conference on Geographic Information Science 2009 page 6 of 11 Leibniz Universität Hannover, Germany
(a) DEM from W2/S6
(b)DEM from S2/S7
(c) Relief-Shade of DEM from W2/S6
(d) Relief-Shade of DEM from S2/S7
Figure 4: DEM generated from Radarsat images.
Table 2: The number of GCP used for different stereo pairs.
S1/S3 S3/S5 S5/S7 S2/S7 W2/S6 F1/F4 Range-Doppler 5 6 6 7 6 4
Co-linearity 26 33 31 26 17 14

12th AGILE International Conference on Geographic Information Science 2009 page 7 of 11 Leibniz Universität Hannover, Germany
5. ACCURACY ASSESSMENT
The widely-used DEM accuracy evaluation methods are: checkpoints-based, profiles-based, and superimposition of contours back to the stereo model (Ming et al., 1999). In this study, the first two methods were employed. Smaller test areas (26km×43km) which cover the same location were selected from all the six generated DEM. 270 check points were extracted from topographic maps and digital contour data. Root Mean Square Error (RMSE) is used to evaluate the accuracy of DEM, as shown in equation (5),
n
yyRMSE
n
iii∑
=
−= 1
2)ˆ(
(5)
Where, iy and iy are the values of points in DEM and values of check points, respectively. n is the number of samples. Table 3 shows the result of accuracy assessment.
Table 3: Results of DEM accuracy assessment (Unit: meter).
From Table 3, we found that, for the Range-Doppler model, the DEM from W2/S6 and S2/S7 have higher accuracy, and the RMSE values are 24.25 meters and 24.58 meters, respectively. As for the Co-linearity model, S2/S7 is the most suitable combination, and the RMSE is 36.97 meters. Figure 5 shows the RMSE of DEM from different stereo pairs using different models. The profiles of the DEM from different stereo pairs were drawn to give a clearer understanding on the factors which affects the accuracy of DEM. Four profiles were drawn on DEM randomly, but only the profiles of S2/S7 are shown in Figure 6 as an example.
Combination Intersection angle (°) RMSE Mean S.T.D
Co-Linearity Condition
Equation Model
W2/S6 10.0 41.25 1.25 41.23
S2/S7 19.2 36.97 14.31 34.08
S1/S3 10.8 55.85 -16.13 53.47 S3/S5 5.1 78.37 14.56 77.00 S5/S7 7.7 49.07 17.66 45.78 F1/F4 5.8 46.20 -5.93 45.82
Range-Doppler Model
W2/S6 10.0 24.25 0.81 24.23 S2/S7 19.2 24.58 9.11 22.83 S1/S3 10.8 30.42 6.38 29.74 S3/S5 5.1 49.09 14.44 46.92 S5/S7 7.7 39.49 0.50 39.49 F1/F4 5.8 25.41 -0.03 25.41
TOPO N/A 8.20 -4.31 6.98

12th AGILE International Conference on Geographic Information Science 2009 page 8 of 11 Leibniz Universität Hannover, Germany
Figure 5: Comparison of DEM accuracy between different stereo pairs using different SAR imaging
model.
(a)
(b)
(c)
(d)
R-D: Range-Doppler Model ECF: Co-Linearity Condition Equation
Figure 6: Profiles of DEM from S2/S7 in different direction.
Based on Table3, Figure 5 and Figure 6, three major points should be noted:
• For all stereo pairs, the accuracy of DEMs by the Range-Doppler model are better than the Co-
linearity condition equation model;

12th AGILE International Conference on Geographic Information Science 2009 page 9 of 11 Leibniz Universität Hannover, Germany
• From the profiles in Figure 7 we can see that in flat area, the accuracy of DEMs by the Range-Doppler model is better than the Co-linearity condition equation model (Figure 6(a)(b)); but in mountainous areas, the Co-linearity condition equation model is better (figure 6(c)(d));
• The profiles of DEMs from R-D model are always closer to the DEM from contour.
As a result, we can safely say that the Range-Doppler model is better than the Co-linearity condition model on the accuracy of generated DEM.
Figure 7 shows four profiles on all the six generated DEMs , and Figure 8 displays the impact of terrain to DEM accuracy. To conclude clearly, only those DEM by the R-D model were drawn. From these figures, we can understand the relationship between terrain and stereo combination:
(a)
(b)
(c)
(d)
Figure 7: Profiles of DEM from different stereo pairs at different landform.
12th AGILE International Conference on Geographic Information Science 2009 page 10 of 11 Leibniz Universität Hannover, Germany
Impact of Slope on RMSE
20
30
40
50
60
70
80
90
100
0 10 20 30 40 50 60 70 80 90 100
Slope (degree)
RM
SE (m
eter
s)
F1/F4S1/S3S2/S7S3/S5S5/S7W2/S6
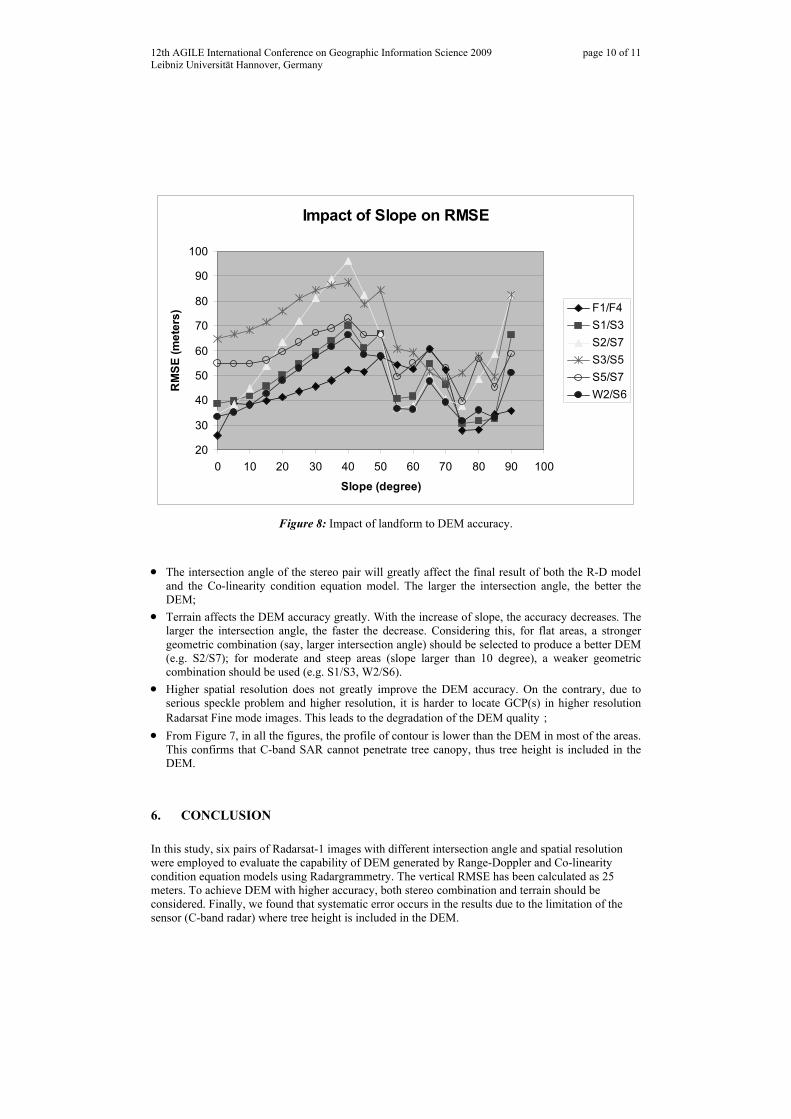
Figure 8: Impact of landform to DEM accuracy.
• The intersection angle of the stereo pair will greatly affect the final result of both the R-D model
and the Co-linearity condition equation model. The larger the intersection angle, the better the DEM;
• Terrain affects the DEM accuracy greatly. With the increase of slope, the accuracy decreases. The larger the intersection angle, the faster the decrease. Considering this, for flat areas, a stronger geometric combination (say, larger intersection angle) should be selected to produce a better DEM (e.g. S2/S7); for moderate and steep areas (slope larger than 10 degree), a weaker geometric combination should be used (e.g. S1/S3, W2/S6).
• Higher spatial resolution does not greatly improve the DEM accuracy. On the contrary, due to serious speckle problem and higher resolution, it is harder to locate GCP(s) in higher resolution Radarsat Fine mode images. This leads to the degradation of the DEM quality;
• From Figure 7, in all the figures, the profile of contour is lower than the DEM in most of the areas. This confirms that C-band SAR cannot penetrate tree canopy, thus tree height is included in the DEM.
6. CONCLUSION
In this study, six pairs of Radarsat-1 images with different intersection angle and spatial resolution were employed to evaluate the capability of DEM generated by Range-Doppler and Co-linearity condition equation models using Radargrammetry. The vertical RMSE has been calculated as 25 meters. To achieve DEM with higher accuracy, both stereo combination and terrain should be considered. Finally, we found that systematic error occurs in the results due to the limitation of the sensor (C-band radar) where tree height is included in the DEM.

12th AGILE International Conference on Geographic Information Science 2009 page 11 of 11 Leibniz Universität Hannover, Germany
ACKNOWLEDGEMENTS
Thanks are due to the Malaysian Centre for Remote Sensing (MACRES) for providing the necessary satellite images and other ancillary data.
BIBLIOGRAPHY
Konecny G., Schuhr W., 1988 Reliability of radar image data [C]. International Archives of Photogrammetry and Remote Sensing, 1988, .XXXII, Part B2.
Leberl F W, 1990 Radargrammetric image processing. Artech House, Norwood, 1990 Lee S J, Grandi G. D., 1996 Measurement of topography using polarimetric SAR images[J]. IEEE
Trans. On Geoscience And remote sensing, 1996, 34 (5), pp. 1266-1277. Lin L Z, Qing Z., 2001 Digital Elevation Model [M]. Wuhan: Wuhan University Press, 2001. Ming-jun L., 2004 Study on generating DEM from Radarsat stereo Images with photogrammetry
methods [D]. Wuhan: Wuhan University. Ming T X, Jian L Z, Lan W., 1999 Discussion on methods for accuracy assessment of DEM generated
from contour line and elevation point[J], Remote Sensing Information, 1999, (3), pp. 7-10 Paquerault S, Maitre J, Marie J., 1996 Radarclinometry for ERS-1 data mapping[J]. IGARSS’96,
1996 (1), pp. 503-505. Schmieder A, Huber R., 2000 Automatic derivation of generalized contour lines for topographic maps
using high-resolution airborne interferometric radar data [C]. International Archives of Photogrammetry and Remote Sensing, 2000, XXXII, Part B1.
Toutin T, Gray L., 2000 State-of-the-art of elevation extraction from satellite SAR data. ISPRS. 2000, 55 (1), pp. 19-33.