Electron energy loss spectroscopy of ZnO nanocrystals with different oxygen vacancy concentrations
7
Electron energy loss spectroscopy of ZnO nanocrystals with different oxygen vacancy concentrations K. Dileep, 1 L. S. Panchakarla, 2 K. Balasubramanian, 1 U. V. Waghmare, 3 and R. Datta 1,a) 1 International Center for Materials Science, Jawaharlal Nehru Center for Advanced Scientific Research, Bangalore-560064, India 2 Chemistry and Physics of Materials Unit, Jawaharlal Nehru Center for Advanced Scientific Research, Bangalore-560064, India 3 Theoretical Sciences Unit, Jawaharlal Nehru Center for Advanced Scientific Research, Bangalore-560064, India (Received 22 November 2010; accepted 13 January 2011; published online 22 March 2011) ZnO nanocrystals with different oxygen vacancy concentrations were characterized by high-resolution electron energy loss spectroscopy (HREELS). ZnO nanocrystals show a decrease in green emission with increasing annealing temperature in an oxygen environment and which significantly quenches in a sample annealed at 400 C. O K and Zn L 3 pre-edge absorption structures of ZnO nanocrystals were studied by HREELS as a function of annealing temperature. Absorption edge peak broadening and variation in pre-edge absorption edge structure of Zn L 3 were observed in experimental electron energy loss spectroscopy spectra with different oxygen defect concentrations. All electron density functional theory (DFT) based (WIEN2k) calculation of electronic density of states and electron energy loss near edge structure were carried out with different oxygen vacancy concentrations and compared with experimental observations. Appearance of additional peaks in pre-edge electron energy loss structure with increasing oxygen vacancy is shown to be due to the oxygen defect states in the bandgap just below the conduction band. V C 2011 American Institute of Physics. [doi:10.1063/1.3555604] I. INTRODUCTION ZnO is an important semiconductor with a wide range of device applications, such as light emitting diodes (LEDs), laser diodes (LDs), transparent conductors, photovoltaics, etc. 1–4 ZnO has a wide bandgap of 3.3 eV at room temper- ature and a large exciton binding energy (60 meV) com- pared to GaN (21 meV). ZnO-based LEDs and LDs have already been demonstrated. 5,6 Transition metal-doped ZnO is a promising system as a dilute magnetic semiconductor for probable application in emerging areas of spintronics. 7 ZnO doped with transitions metal ions such as Mn 2þ and Co 2þ was first reported to be ferromagnetic, 8,9 but later studies have cast serious doubt on this aspect. 10–12 In fact, ZnO nanoparticles themselves exhibit weak ferromagnetism at room temperature. 13 The ferromagnetism is attributed to sur- face defects, probably oxygen vacancies. 14 The bandgap of ZnO (3.3 eV) can be tuned, for example, by alloying with Cd (redshift) and Mg (blueshift). 15 Undoped ZnO shows n-type conductivity, whereas p-type doping remains to be an open issue in ZnO and compensation of p-type carriers by n-types has been reported to be responsible for this difficulty. 16 Besides the usual UV emission from ZnO, defect related green emission has also been reported. 17–20 Chemically syn- thesized ZnO nanocrystals exhibited broad green emission in addition to the expected UV emission band. 14 Green emission was reduced with increasing annealing temperature in oxygen atmosphere and was explained in terms of reduc- tion in oxygen point defects in ZnO lattice. Here we report Zn L 3 and O K pre-edge electron energy loss structure of the same ZnO nanocrystals annealed at different temperatures where green emission is observed to be significantly quenched after annealing at 400 C, in oxygen atmosphere. These experimental results were discussed with the help of WIEN2k-based DFT calculations of electronic density of states (DOS) and electron energy loss near edge spectra (ELNES). Zn K absorption edge appears at 9670 eV, there- fore the Zn L 3 edge was chosen (1020 eV) for both core edge electron energy loss spectroscopy (EELS) experimenta- tion and theoretical calculations to study the change in spec- tral feature considering oxygen point defects in ZnO. The x-ray absorption spectroscopy technique has been widely used to study the defect structure of ZnO. Hsu et al. reported an x-ray absorption near-edge structure (XANES) (Zn K absorption edge) of Co-doped ZnO annealed under different conditions. 21 ZnO film annealed in oxygen shows an increase in p orbital DOS (given by the area under the XANES absorption curve) compared with the sample annealed under the Ar/H 2 condition. The appearance of an extra feature at the pre-edge structure of the Zn K absorption edge was attributed to the increase in oxygen vacancy for samples annealed under Ar/H 2 gas and associated with the highest saturation magnetization among samples annealed under different environmental conditions. Theoretical calcu- lation in real space based on the FEFF 8.2 code also supported the appearance of an extra peak in the Zn K pre-edge struc- ture, corresponding to an increasing number of O atom a) Author to whom correspondence should be addressed. Electronic mail: [email protected]. 0021-8979/2011/109(6)/063523/7/$30.00 V C 2011 American Institute of Physics 109, 063523-1 JOURNAL OF APPLIED PHYSICS 109, 063523 (2011)
-
Upload
independent -
Category
Documents
-
view
1 -
download
0
Transcript of Electron energy loss spectroscopy of ZnO nanocrystals with different oxygen vacancy concentrations

Electron energy loss spectroscopy of ZnO nanocrystals with differentoxygen vacancy concentrations
K. Dileep,1 L. S. Panchakarla,2 K. Balasubramanian,1 U. V. Waghmare,3 and R. Datta1,a)
1International Center for Materials Science, Jawaharlal Nehru Center for Advanced Scientific Research,Bangalore-560064, India2Chemistry and Physics of Materials Unit, Jawaharlal Nehru Center for Advanced Scientific Research,Bangalore-560064, India3Theoretical Sciences Unit, Jawaharlal Nehru Center for Advanced Scientific Research, Bangalore-560064,India
(Received 22 November 2010; accepted 13 January 2011; published online 22 March 2011)
ZnO nanocrystals with different oxygen vacancy concentrations were characterized by
high-resolution electron energy loss spectroscopy (HREELS). ZnO nanocrystals show a decrease in
green emission with increasing annealing temperature in an oxygen environment and which
significantly quenches in a sample annealed at 400 �C. O K and Zn L3 pre-edge absorption
structures of ZnO nanocrystals were studied by HREELS as a function of annealing temperature.
Absorption edge peak broadening and variation in pre-edge absorption edge structure of Zn L3
were observed in experimental electron energy loss spectroscopy spectra with different oxygen
defect concentrations. All electron density functional theory (DFT) based (WIEN2k) calculation of
electronic density of states and electron energy loss near edge structure were carried out with
different oxygen vacancy concentrations and compared with experimental observations.
Appearance of additional peaks in pre-edge electron energy loss structure with increasing oxygen
vacancy is shown to be due to the oxygen defect states in the bandgap just below the conduction
band. VC 2011 American Institute of Physics. [doi:10.1063/1.3555604]
I. INTRODUCTION
ZnO is an important semiconductor with a wide range of
device applications, such as light emitting diodes (LEDs),
laser diodes (LDs), transparent conductors, photovoltaics,
etc.1–4 ZnO has a wide bandgap of �3.3 eV at room temper-
ature and a large exciton binding energy (�60 meV) com-
pared to GaN (�21 meV). ZnO-based LEDs and LDs have
already been demonstrated.5,6 Transition metal-doped ZnO
is a promising system as a dilute magnetic semiconductor for
probable application in emerging areas of spintronics.7 ZnO
doped with transitions metal ions such as Mn2þ and Co2þ
was first reported to be ferromagnetic,8,9 but later studies
have cast serious doubt on this aspect.10–12 In fact, ZnO
nanoparticles themselves exhibit weak ferromagnetism at
room temperature.13 The ferromagnetism is attributed to sur-
face defects, probably oxygen vacancies.14 The bandgap of
ZnO (3.3 eV) can be tuned, for example, by alloying with Cd
(redshift) and Mg (blueshift).15 Undoped ZnO shows n-type
conductivity, whereas p-type doping remains to be an open
issue in ZnO and compensation of p-type carriers by n-types
has been reported to be responsible for this difficulty.16
Besides the usual UV emission from ZnO, defect related
green emission has also been reported.17–20 Chemically syn-
thesized ZnO nanocrystals exhibited broad green emission
in addition to the expected UV emission band.14 Green
emission was reduced with increasing annealing temperature
in oxygen atmosphere and was explained in terms of reduc-
tion in oxygen point defects in ZnO lattice. Here we report
Zn L3 and O K pre-edge electron energy loss structure of the
same ZnO nanocrystals annealed at different temperatures
where green emission is observed to be significantly
quenched after annealing at 400 �C, in oxygen atmosphere.
These experimental results were discussed with the help of
WIEN2k-based DFT calculations of electronic density of
states (DOS) and electron energy loss near edge spectra
(ELNES). Zn K absorption edge appears at �9670 eV, there-
fore the Zn L3 edge was chosen (�1020 eV) for both core
edge electron energy loss spectroscopy (EELS) experimenta-
tion and theoretical calculations to study the change in spec-
tral feature considering oxygen point defects in ZnO.
The x-ray absorption spectroscopy technique has been
widely used to study the defect structure of ZnO. Hsu et al.reported an x-ray absorption near-edge structure (XANES)
(Zn K absorption edge) of Co-doped ZnO annealed under
different conditions.21 ZnO film annealed in oxygen shows
an increase in p orbital DOS (given by the area under the
XANES absorption curve) compared with the sample
annealed under the Ar/H2 condition. The appearance of an
extra feature at the pre-edge structure of the Zn K absorption
edge was attributed to the increase in oxygen vacancy for
samples annealed under Ar/H2 gas and associated with the
highest saturation magnetization among samples annealed
under different environmental conditions. Theoretical calcu-
lation in real space based on the FEFF 8.2 code also supported
the appearance of an extra peak in the Zn K pre-edge struc-
ture, corresponding to an increasing number of O atom
a)Author to whom correspondence should be addressed. Electronic mail:
0021-8979/2011/109(6)/063523/7/$30.00 VC 2011 American Institute of Physics109, 063523-1
JOURNAL OF APPLIED PHYSICS 109, 063523 (2011)

removed from the structure. Muller et al. reported that the O
K edge absorption peak and associated fine structures wash
out with an increasing amount of oxygen vacancy in SrTiO3
thin film.22 The O K absorption edge of bulk ZnO can be
explained by the transition from O 1s to O 2p unoccupied
levels. O 2p states hybridize with Zn 4s states to give
ELNES in the energy range �530�539 eV. From 539 to
�550 eV, the main contribution is from O 2p states hybri-
dized with Zn p states. Above 550 eV is the transition to O
2p�Zn 4d hybridized levels.23 The Zn L3 corresponds to
electronic transitions from Zn 2p3/2 to Zn 3d and 4s states
hybridized with O 2p states.24 The appearance of four peaks
(named A, T, E, TT) in Zn L3 ELNES of w-ZnO was
explained by point-group symmetry in the first coordination
unit. (ZnO4)6� was taken to be in tetrahedral symmetry (Td)
and under this condition Zn 4s gave rise to a1, Zn 4d gave
rise to t2, and e molecular orbitals, respectively. 4p became
t2. Zn 4d and 4p hybridizes to form two t2 molecular orbi-
tals. The four peaks in Zn L3 EELS spectrum were assigned
to electron transitions to these four molecular orbitals of
w-ZnO.25 EELS has the advantage over XANES for its sim-
plicity, experimentation can be easily performed at localized
regions (approximately a few-nanometer region to a single
atomic column) in a transmission electron microscope.
However, quantitative EELS simulation have been very dif-
ficult due to computational difficulty to generate spectra
closely resembling its experimental counterpart. Fingerprint-
ing in EELS is widely used to compare absorption edge
spectra for an element in various compounds to derive any
inferences qualitatively. We have used the WIEN2k-based
TELNES2 program (which is fully relativistic, in a TEM at
300 kV, the speed of the electron is 0.88c, where c is the
speed of light in a vacuum) to calculate EELS spectra of
various oxygen deficient w-ZnO lattice. Relativistic calcula-
tion in EELS is essential for materials that are anisotropic or
have a lower symmetry. WIEN2k describes periodic system
in reciprocal space and orbitals are solved using DFT. These
orbitals are used to calculate an EELS cross section for the
final derivation of ELNES spectra. Core-hole consideration
is very important to quantitatively study ELNES. However,
change in the pre-edge structure in ELNES spectra with
varying oxygen vacancy does not require accurate quantita-
tive estimation of leading peak energy positions and hence
omitted from the present calculations. The calculation using
a large super cell in order to reduce the interaction between
neighboring core-holes renders the calculation computation-
ally highly expensive. However, neglecting core-hole effects
may introduce incorrect relative peak height at the pre-edge
feature, which may not correspond with the experimental
EELS spectra well. The TELNES2 program calculates EELS
spectra nearly 50 eV from the onset of the core absorption
edge fairly well and for higher energy losses up to 100 eV,
the FEFF 9 code is the appropriate choice.26 In the present
report we have studied primarily the pre-edge feature at the
core absorption edge of both experimental and theoretical
spectra.
II. METHODS
A. Experimental details
ZnO nanocrystals were synthesized by a procedure al-
ready described in the literature.14 As synthesized particles
were annealed at 200 and 400 �C in oxygen flow [�500
SCCM (where SCCM denotes cubic centimeters per minute
at standard temperature and pressure)], for 10 h. The photolu-
minescence spectra of the nanocrystals were recorded with a
Perkin–Elmer model LS55 luminescence spectrometer. Elec-
tron energy loss near edge structures were acquired using a
gun monochromator (both in image and diffraction mode) in
a FEI-TITAN3TM 80–300 kV transmission electron micro-
scope operating at 300 kV with an energy resolution better
than 0.18 eV. In order to improve the signal over noise, cam-
era length and energy dispersion scale were reduced to 73
mm and 0.03 eV/pixel, respectively, which reduces the energy
resolution from 0.18 to 0.28 eV, as measured from full-width
at half-maxima of zero loss peak. A Gatan imaging filter en-
trance aperture size of 1 mm was chosen, which ensured high
energy resolution during spectra acquisition. A near edge
structure up to 50 eV from the absorption edge for both O K
FIG. 1. ZnO nanocrystals: (a) as-synthe-
sized at room temperature, (b) annealed
at 200 �C, and (c) annealed at 400 �Cunder oxygen.
FIG. 2. Electron diffraction pattern from three different samples showing no
change in hexagonal wurtzitic structure.
063523-2 Dileep et al. J. Appl. Phys. 109, 063523 (2011)
and Zn L3 edge were acquired for samples with different oxy-
gen vacancy concentrations and emphasis was given to
changes in the features at the onset of the absorption edge.
B. Calculation details
We calculated the DOS and ELNES (with TELNES2 pro-
gram in WIEN2k) with a full potential linear augmented plane
wave basis to study the change in density of states with oxygen
vacancy concentrations and respective ELNES spectra both
for O K and Zn L3 edges. The generalized gradient approxima-
tion was employed with the Perdew-Burke-Ernzenhof (PBE)
functional. Four cases were studied; (i) ZnO with no vacancies,
(ii) 25% O vacancies simulated with a super cell of ZnO (four
Zn, four O, 2� 1� 1 unit cell) with one O atom removed, (iii)
12.5% O vacancies simulated with a super cell of ZnO (eight
Zn, eight O, 2� 2� 1 unit cell) with one O atom removed,
(iv) 6.25% O vacancies simulated with a super cell of ZnO (16
Zn, 16 O, 2� 2� 2 unit cell) with one O atom removed. We
used wurtzite structure with space group P63mc generated
with lattice parameters of a¼ 3.2973 A and c¼ 5.2824 A and
atomic positions given by Zn (2/3, 1/3, 0) and O (2/3, 1/3, u),
where u¼ 0.3775. Lattice parameters of all the structures were
relaxed internally (using the minimization program min_lapw).
The following values were used for various simulation param-
eters: Rmt¼ 2.00 and 1.77 a.u. for Zn and O atoms, respec-
tively, the valence and core states were separated by �6.0 Ry
of energy, and Rk(max)[(Rmt(min)� kmax)]¼ 7.00. We sampled
integration over Brillouin zone with uniform 15� 15� 9 mesh
of k points. We used instrumental broadening of 0.2 eV, col-
lection angle �2.5 mrad, and convergence angle of �0 (paral-
lel illumination) for a meaningful comparison between the
theoretical and experimental spectra.
III. RESULTS AND DISCUSSION
Before we start discussing ELNES spectra of ZnO
with different oxygen vacancy concentrations, we provide
some information of ZnO nanocrystals. Figure 1 shows
HRTEM images from three different ZnO nanocrystals.
The average size of the as-synthesized ZnO nanocrystals at
FIG. 3. Powder x-ray diffraction pattern from three different samples show-
ing no change in hexagonal wurtzitic structure. The fine peaks are not seen
in the case of as-prepared sample due to broadening from small particle size.
FIG. 4. (Color online) Photoluminescence of ZnO nanocrystals of
as-synthesized and annealed at different temperatures.
FIG. 5. (Color online) (a) Experimental
O K edge ELNES and (b) its first deriva-
tive. The pre-edge features are not clear
in this case.
063523-3 Dileep et al. J. Appl. Phys. 109, 063523 (2011)
room temperature (RT), and annealed at 200 and 400 �Care 12 (6 3), 22 (6 5), and 33 (6 5) nm, respectively. Af-
ter annealing, the crystal, have grown in size. ZnO nano-
crystals have wurtzite structure and the crystal structure
remained unaltered upon annealing at various temperatures
as evident from both electron and powder x-ray diffraction
data (Figs. 2 and 3, respectively). Although it is possible
to quantify oxygen occupancy in a given crystal lattice by
HRTEM,27 applying the same methodology to a nanocrys-
talline material form is extremely difficult (as it involves
tilting nanocrystals toward zone axis orientation and they
are not stable for a sufficient time under electron beam ex-
posure). Therefore, we have studied the defect structure in
ZnO through the observation of core absorption edge
ELNES and the emphasis is given to any changes in the
pre-edge feature. From the photoluminescence of three dif-
ferent ZnO nanocrystals (see Fig. 4), one can clearly
observe that green emission is quite intense and broad for
an as-synthesized RT ZnO sample compared to the sample
annealed at 200 �C. Whereas green emission disappeared
significantly for the sample annealed at 400 �C in oxygen,
this suggests that green emission may be related to oxygen
deficiency in ZnO and quenched significantly by annealing
that might have replenished oxygen in the ZnO lattice.
From experimental ELNES spectra and its first derivative
of O K edge (Fig. 5), and Zn L3 edge (Fig. 6) for three dif-
ferent samples, one observes that the fine features in the
spectra are washed out in both O K and Zn L3 with
increasing oxygen vacancy in the lattice structure. Other
appreciable differences in the spectra are labeled. In the O
K spectra, there are no appreciable changes at pre-edge
features as a function of O vacancies, but smearing of the
fine features is observed. The absence of prominent pre-
edge peaks may be because the O atoms come only in the
second coordination shell of any O vacancy. In contrast,
there are clear pre-edge features for the three samples in
the Zn L3 spectra. The four main expected peaks of ZnO
are labeled A, E, T, and TT in Fig. 6. The relative peak
height of b to a is increasing with oxygen vacancy concen-
trations. There are also extra peaks like c, d, etc. that come
up at higher oxygen deficiencies. The change in the pre-
edge structure can be made more prominent from the first
derivative spectra. The ratio of b to a increases marginally
(0.23 – 0.5) with increasing concentrations of oxygen
deficiencies.
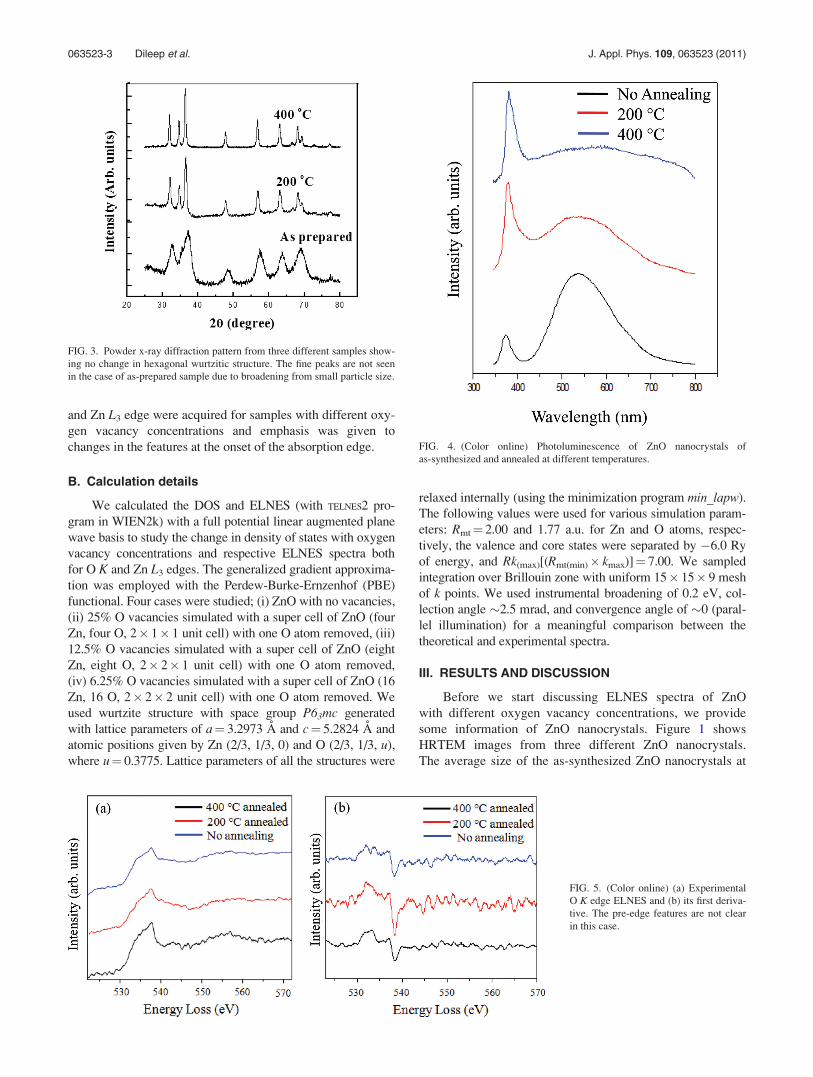
We have compared our experimental spectra with theo-
retical ELNES to get better insight into change in pre-edge
structure with increasing oxygen vacancy defects in terms of
change in the electronic density of states. Figures 7(a) and
7(b) show the theoretical ELNES spectra of O K and Zn L3
edges, respectively, of ZnO with different oxygen vacancy
concentrations (i.e., no vacancy, 6.25%, 12.5%, and 25%).
One interesting feature in these spectra is the appearance of
a pre-edge feature with the oxygen vacancy (VO) introduced
FIG. 6. (Color online) (a) Experimental
Zn L3 edge ELNES and (b) its first deriv-
ative. The pre-edge features are labeled.
FIG. 7. (Color online) Theoretical DFT
calculation of ELNES spectra of (a) O Kedge and (b) Zn L3 edge for various oxy-
gen vacancy concentrations.
063523-4 Dileep et al. J. Appl. Phys. 109, 063523 (2011)

FIG. 8. (Color online) Superposition of ELNES and DOS
for (a)–(d) O K and (e)–(h) for Zn L3 edge.
063523-5 Dileep et al. J. Appl. Phys. 109, 063523 (2011)
in the ZnO lattice. Peaks A and B in both O K and Zn L3
edges arise from p unoccupied levels of O hybridized with
4s levels of Zn. Peak B and additionally peak C become
more prominent with increasing VO. Also, the ratio between
peaks B and A increases with increasing VO concentrations.
One makes a similar observation in the Zn L3 pre-edge struc-
ture. EELS spectrum provides information about the density
of the unoccupied states, which is related to local atomic
environments. Therefore, we compare ELNES of both O Kand Zn L3 with unoccupied partial-DOS and present details
in Fig. 8, plotting both ELNES and DOS in the same graph
to relate ELNES peaks with corresponding DOS. One can
notice that as oxygen vacancy increases from 0% to 25%, all
the partial density of states redistributes in the energy
bandgap. These defect-related donor levels contribute to the
pre-edge peaks in the spectra and the same effect is observed
on both absorption edges.
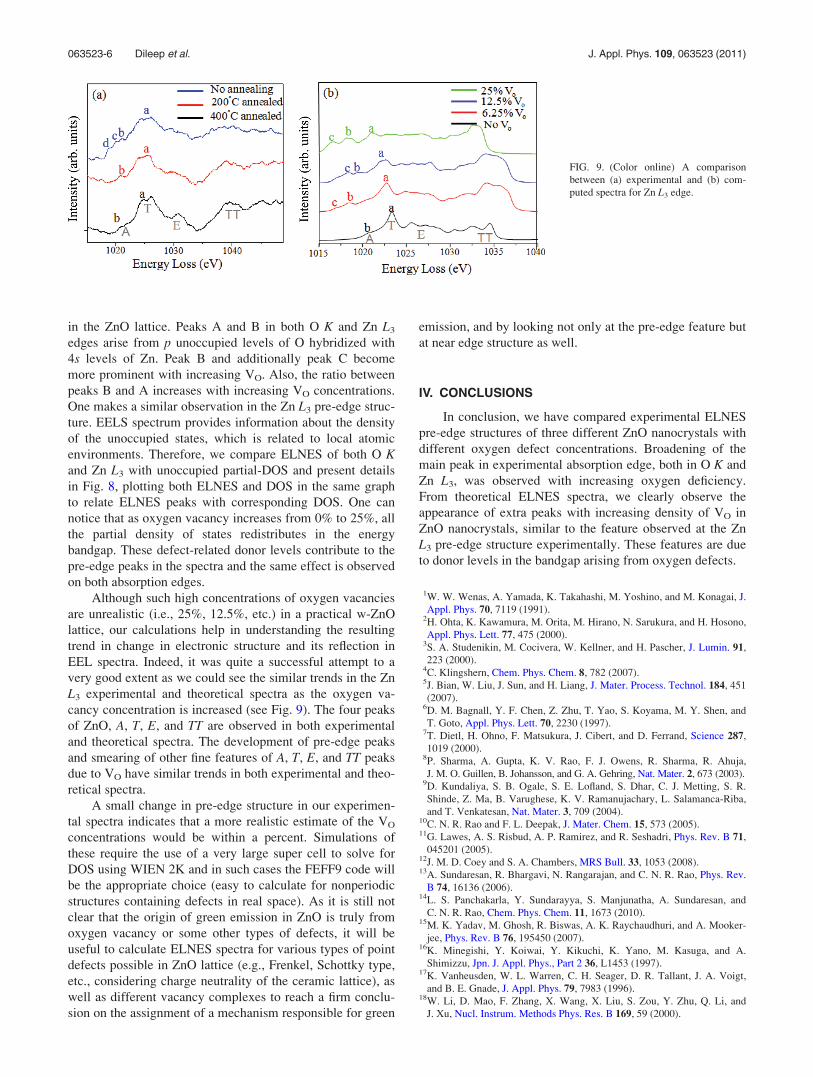
Although such high concentrations of oxygen vacancies
are unrealistic (i.e., 25%, 12.5%, etc.) in a practical w-ZnO
lattice, our calculations help in understanding the resulting
trend in change in electronic structure and its reflection in
EEL spectra. Indeed, it was quite a successful attempt to a
very good extent as we could see the similar trends in the Zn
L3 experimental and theoretical spectra as the oxygen va-
cancy concentration is increased (see Fig. 9). The four peaks
of ZnO, A, T, E, and TT are observed in both experimental
and theoretical spectra. The development of pre-edge peaks
and smearing of other fine features of A, T, E, and TT peaks
due to VO have similar trends in both experimental and theo-
retical spectra.
A small change in pre-edge structure in our experimen-
tal spectra indicates that a more realistic estimate of the VO
concentrations would be within a percent. Simulations of
these require the use of a very large super cell to solve for
DOS using WIEN 2K and in such cases the FEFF9 code will
be the appropriate choice (easy to calculate for nonperiodic
structures containing defects in real space). As it is still not
clear that the origin of green emission in ZnO is truly from
oxygen vacancy or some other types of defects, it will be
useful to calculate ELNES spectra for various types of point
defects possible in ZnO lattice (e.g., Frenkel, Schottky type,
etc., considering charge neutrality of the ceramic lattice), as
well as different vacancy complexes to reach a firm conclu-
sion on the assignment of a mechanism responsible for green
emission, and by looking not only at the pre-edge feature but
at near edge structure as well.
IV. CONCLUSIONS
In conclusion, we have compared experimental ELNES
pre-edge structures of three different ZnO nanocrystals with
different oxygen defect concentrations. Broadening of the
main peak in experimental absorption edge, both in O K and
Zn L3, was observed with increasing oxygen deficiency.
From theoretical ELNES spectra, we clearly observe the
appearance of extra peaks with increasing density of VO in
ZnO nanocrystals, similar to the feature observed at the Zn
L3 pre-edge structure experimentally. These features are due
to donor levels in the bandgap arising from oxygen defects.
1W. W. Wenas, A. Yamada, K. Takahashi, M. Yoshino, and M. Konagai, J.
Appl. Phys. 70, 7119 (1991).2H. Ohta, K. Kawamura, M. Orita, M. Hirano, N. Sarukura, and H. Hosono,
Appl. Phys. Lett. 77, 475 (2000).3S. A. Studenikin, M. Cocivera, W. Kellner, and H. Pascher, J. Lumin. 91,
223 (2000).4C. Klingshern, Chem. Phys. Chem. 8, 782 (2007).5J. Bian, W. Liu, J. Sun, and H. Liang, J. Mater. Process. Technol. 184, 451
(2007).6D. M. Bagnall, Y. F. Chen, Z. Zhu, T. Yao, S. Koyama, M. Y. Shen, and
T. Goto, Appl. Phys. Lett. 70, 2230 (1997).7T. Dietl, H. Ohno, F. Matsukura, J. Cibert, and D. Ferrand, Science 287,
1019 (2000).8P. Sharma, A. Gupta, K. V. Rao, F. J. Owens, R. Sharma, R. Ahuja,
J. M. O. Guillen, B. Johansson, and G. A. Gehring, Nat. Mater. 2, 673 (2003).9D. Kundaliya, S. B. Ogale, S. E. Lofland, S. Dhar, C. J. Metting, S. R.
Shinde, Z. Ma, B. Varughese, K. V. Ramanujachary, L. Salamanca-Riba,
and T. Venkatesan, Nat. Mater. 3, 709 (2004).10C. N. R. Rao and F. L. Deepak, J. Mater. Chem. 15, 573 (2005).11G. Lawes, A. S. Risbud, A. P. Ramirez, and R. Seshadri, Phys. Rev. B 71,
045201 (2005).12J. M. D. Coey and S. A. Chambers, MRS Bull. 33, 1053 (2008).13A. Sundaresan, R. Bhargavi, N. Rangarajan, and C. N. R. Rao, Phys. Rev.
B 74, 16136 (2006).14L. S. Panchakarla, Y. Sundarayya, S. Manjunatha, A. Sundaresan, and
C. N. R. Rao, Chem. Phys. Chem. 11, 1673 (2010).15M. K. Yadav, M. Ghosh, R. Biswas, A. K. Raychaudhuri, and A. Mooker-
jee, Phys. Rev. B 76, 195450 (2007).16K. Minegishi, Y. Koiwai, Y. Kikuchi, K. Yano, M. Kasuga, and A.
Shimizzu, Jpn. J. Appl. Phys., Part 2 36, L1453 (1997).17K. Vanheusden, W. L. Warren, C. H. Seager, D. R. Tallant, J. A. Voigt,
and B. E. Gnade, J. Appl. Phys. 79, 7983 (1996).18W. Li, D. Mao, F. Zhang, X. Wang, X. Liu, S. Zou, Y. Zhu, Q. Li, and
J. Xu, Nucl. Instrum. Methods Phys. Res. B 169, 59 (2000).
FIG. 9. (Color online) A comparison
between (a) experimental and (b) com-
puted spectra for Zn L3 edge.
063523-6 Dileep et al. J. Appl. Phys. 109, 063523 (2011)

19K. Vanheusden, C. H. Seager, W. L. Warren, D. R. Tallant, and J. A.
Voigt, Appl. Phys. Lett. 68, 403 (1996).20S. V. Bhat, S. R. C. Vivekchand, A. Govindraj, and C. N. R. Rao, Solid
State Commun. 149, 510 (2009).21H. S. Hsu, J. C. A. Huang, Y. H. Huang, Y. F. Liao, M. Z. Lin, C. H. Lee,
J. F. Lee, S. F. Chen, L. Y. Lai, and C. P. Liu, Appl. Phy. Lett. 88, 242507
(2006).22D. A. Muller, N. Nakagawa, A. Ohtomo, J. L. Grazul, and H. Y. Hwang,
Nature 430, 657 (2004).
23C. L. Dong, C. Persson, L. Vayssieres, A. Augustsson, T. Schmitt, M. Matte-
sini, R. Ahuja, C. L. Chang, and J.-H. Guo, Phys. Rev. B 70, 195325 (2004).24C. Ton-That, M. R. Phillips, M. Foley, S. J. Moody, and A. P. J. Stampfl,
Appl. Phys. Lett. 92, 261916 (2008).25T. Mizoguchia, M. Yoshiyaa, J. Lia, F. Obaa, I. Tanakab, and H. Adachia,
Ultramicroscopy 86, 363 (2001).26K. Jorissen, Ph.D. thesis, University of Antwerp, Antwerpen, Belgium,
2007.27C. L. Jia, M. Lentzen, and K. Urban, Science 299, 870 (2003).
063523-7 Dileep et al. J. Appl. Phys. 109, 063523 (2011)