CoPt magnetic nanocrystals in the A1/L10 transformation
10
CoPt magnetic nanocrystals in the A1/L10 transformation Arnaud Demortière and Christophe Petit Citation: J. Appl. Phys. 109, 084344 (2011); doi: 10.1063/1.3575333 View online: http://dx.doi.org/10.1063/1.3575333 View Table of Contents: http://jap.aip.org/resource/1/JAPIAU/v109/i8 Published by the American Institute of Physics. Related Articles Self-assembly of single dielectric nanoparticle layers and integration in polymer-based solar cells Appl. Phys. Lett. 101, 063105 (2012) Modification of ultrananocrystalline diamond film microstructure via Fe-coating and annealing for enhancement of electron field emission properties J. Appl. Phys. 112, 033708 (2012) Synthesis and properties of phase-change Ge-Sb nanoparticles J. Appl. Phys. 112, 034308 (2012) Formation of monomer to tetramer Ag nanodots in a vanadium oxide nanomesh on Pd(111) J. Appl. Phys. 112, 034902 (2012) Application of well-defined indium tin oxide nanorods as Raman active platforms Appl. Phys. Lett. 101, 053117 (2012) Additional information on J. Appl. Phys. Journal Homepage: http://jap.aip.org/ Journal Information: http://jap.aip.org/about/about_the_journal Top downloads: http://jap.aip.org/features/most_downloaded Information for Authors: http://jap.aip.org/authors Downloaded 08 Aug 2012 to 146.139.244.63. Redistribution subject to AIP license or copyright; see http://jap.aip.org/about/rights_and_permissions
Transcript of CoPt magnetic nanocrystals in the A1/L10 transformation
CoPt magnetic nanocrystals in the A1/L10 transformationArnaud Demortière and Christophe Petit Citation: J. Appl. Phys. 109, 084344 (2011); doi: 10.1063/1.3575333 View online: http://dx.doi.org/10.1063/1.3575333 View Table of Contents: http://jap.aip.org/resource/1/JAPIAU/v109/i8 Published by the American Institute of Physics. Related ArticlesSelf-assembly of single dielectric nanoparticle layers and integration in polymer-based solar cells Appl. Phys. Lett. 101, 063105 (2012) Modification of ultrananocrystalline diamond film microstructure via Fe-coating and annealing for enhancement ofelectron field emission properties J. Appl. Phys. 112, 033708 (2012) Synthesis and properties of phase-change Ge-Sb nanoparticles J. Appl. Phys. 112, 034308 (2012) Formation of monomer to tetramer Ag nanodots in a vanadium oxide nanomesh on Pd(111) J. Appl. Phys. 112, 034902 (2012) Application of well-defined indium tin oxide nanorods as Raman active platforms Appl. Phys. Lett. 101, 053117 (2012) Additional information on J. Appl. Phys.Journal Homepage: http://jap.aip.org/ Journal Information: http://jap.aip.org/about/about_the_journal Top downloads: http://jap.aip.org/features/most_downloaded Information for Authors: http://jap.aip.org/authors
Downloaded 08 Aug 2012 to 146.139.244.63. Redistribution subject to AIP license or copyright; see http://jap.aip.org/about/rights_and_permissions
CoPt magnetic nanocrystals in the A1/L10 transformation
Arnaud Demortierea) and Christophe Petitb)
Laboratoire des Materiaux Mesoscopiques et Nanometriques (LM2N), UMR CNRS 7070, Universite Pierreet Marie Curie (UPMC), 4 place Jussieu 75252 Paris Cedex 05, France
(Received 11 November 2010; accepted 13 March 2011; published online 27 April 2011)
CoPt magnetic nanocrystals have been synthesized in a range of size from 2 to 4 nm using a
colloidal chemical synthetic method. As-synthesized nanocrystals exhibit an equiatomic
composition and a crystalline phase of type alloy CoPt A1 disordered. The morphology and the
magnetic properties were investigated for different crystal size. In order to reach the crystalline
transition toward the L10 ordered phase, a thermal annealing has been carried out on CoPt
nanocrystals of 4 nm. We showed that the use of HOPG substrate both limits the coalescence
effects and promotes the structural ordering. The modification of the crystalline structure selected
area electron diffraction (SAED) and the magnetic properties (superconducting quantum
interference device) has been studied for different heat-treatment conditions. Ferromagnetic
properties at room temperature were achieved for nanocrystals of 16 nm in average size with a
coercivity of 4 kOe. VC 2011 American Institute of Physics. [doi:10.1063/1.3575333]
I. INTRODUCTION
The magnetic alloy nanocrystals (NCs) are promising
materials due to their strong potential in the development of
catalytic,1 biomedical,2 and magnetic3 applications. In this
last domain, bimetallic alloys such as CoPt, FePt, or CoRh
represent a particularly interesting class of materials for the
improvement of the recording on magnetic storage systems.
The nanometer size, the narrow size distribution and the
alloying effects of these materials could lead to areal density
greater than 1 Tbit/in2.4 Among these nanoalloys, L10-
ordered CoPt NCs are good candidates for future high-density
recording media based on the perpendicular recording
(PMR).5 The L10-ordered phase obtained at equiatomic com-
position presents a high magnetocrystalline anisotropy
(4.9� 107 erg/cm3) and a high coercivity (10 kOe), which
enable to exceed the superparamagnetism barrier at a critical
size around of 5 nm.6 Recently, some progresses have been
achieved in the elaboration of these alloy NCs, using pulsed
laser depositions7,8 or thermal decomposition methods,9,10
with even the observation of a partial in situ transformation of
NCs toward the L10 phase without the need of post-stage
annealing. Chemical routes present the advantage to highly
control of the size, shape and composition of NCs. Moreover,
this bottom-up approach yields to low polydispersity of the
nanocrystal size, which can give rise to phenomena of self-
organization and also, the specific morphologies, such as
rods11 and cubes,12,13 can favor the arrangement of magnetic
easy axes. However, CoPt nanocrystals synthesized by colloi-
dal route have an A1-disordered structure. A thermal anneal-
ing is required to transform into ordered structure with a
tetragonal unit cell having a very large anisotropy.14,15 For
supported nanoparticles, the thermal assistances at high tem-
perature (> 300 �C) can lead to coalescence and sintering
effects, which increase the size, modify the shape and destroy
their organization. Indeed, the coalescence driving force and
the change of shape is the minimization of surface energy by
elimination of interfaces and appearance of grain boundaries
and defects. Thus, the elaboration of well-defined nanopar-
ticles in the L10 ordered phase remains very difficult. Further-
more, the nature of the substrate, the positions of crystals on
the support and the organic shell of nanoparticles can affect
the coalescence effects and the ordering process. The study of
the evolution of magnetic properties of CoPt NCs requires a
good knowledge both of magnetic behavior of as-synthesized
NCs and, the crystalline structure and morphology of annealed
nanoparticles.
This paper deals with general study of structural and
magnetic properties of as-synthesized and annealed CoPt
NCs. The size-dependent properties of Co50Pt50 NCs from 2
to 4 nm have been studied. We have focused on both crystal
morphologies and magnetic behaviors. Then, the post-
annealing treatment of 4 nm CoPt NCs have been carried out
from 350 to 500 �C and with two different types of substrate:
amorphous carbon and HOPG. The crystalline ordering and
the coalescence effects have been investigated. The L10
phase has been characterized by both electron diffraction
and high resolution TEM. Finally, magnetic measurements
showed ferromagnetic properties at room temperature for
NCs of 16 nm.
II. EXPERIMENTAL DETAILS
A. Chemical synthesis
Cobalt-platinum nanocrystal samples have been prepared
using a colloidal approach based on the co-precipitation reac-
tion on a liquid-liquid phase transfer method.16 The metallic
salts of CoCl4(TDA)2 and PtCl6(TDA)2 (6.25� 10�3 M) have
been obtained by phase transfer from aqueous solutions of
CoCl42� and PtCl6
2� and organic solutions (toluene) contain-
ing TDAB (tetrakisdecylammonium bromide) (2 g) using as
transfer agent. After discarding of the aqueous phases, both
a)Electronic mail: [email protected])Electronic mail: [email protected].
0021-8979/2011/109(8)/084344/9/$30.00 VC 2011 American Institute of Physics109, 084344-1
JOURNAL OF APPLIED PHYSICS 109, 084344 (2011)
Downloaded 08 Aug 2012 to 146.139.244.63. Redistribution subject to AIP license or copyright; see http://jap.aip.org/about/rights_and_permissions
metallic salt complexes have been stocked in the toluene me-
dium at room temperature. Then, 10 mL of platinum complex
organic solution [PtCl6(TDA)2] and 10 mL of cobalt complex
organic solution [CoCl4(TDA)2] were added to 20 mL of tolu-
ene. After addition of 1 mL of octylamine (ligand), an aque-
ous solution of reductant NaBH4 (378 mg, 10 mL of H2O)
was introduced into the organic mixture with rapid stirring.
The introduction of the reducing solution have been per-
formed by sequence injection of 10 lL every 10 and 20 s. The
total introduction in once of the reducing agent is defined as
the injection at 0 s. The solution is kept under stirring during
16 h after the end of NaBH4 introduction. This method allows
us to control the kinetics of growth and favor the increase of
the nanocrystal size. Thus, NCs obtained at 0, 10, and 20 s
(injection time) exhibit an average diameter respectively of 2,
3, and 4 nm. This method allows an accurate composition con-
trol around Co/Pt equiatomic position with a narrow distribu-
tion of 6 2%.17 Then, the organic phase was evaporated,
ethanol was added in excess and the nanoparticles were pre-
cipitated by centrifugation. This procedure was repeated
twice, and finally, the nanoparticles were dispersed in 4 mL of
toluene.
B. Thermal treatment
Two different types of substrate have been used to per-
form the thermal treatment. Samples of 2D self-assembled
CoPt NCs were prepared by drop deposition method on the
copper grids of TEM coated respectively by amorphous car-
bon and by HOPG (highly ordered pyrolytic graphite). The
concentration of the colloidal solution has been tuned in
order to obtain a monolayer of NCs (1� 10�3 M). TEM
grids have been stuck in the corner of a glass wafer using a
carbon adhesive. Thus, during the annealing, the main part
of the substrate was kept outside of the support. The samples
have been annealed under nitrogen atmosphere at different
temperature from 350 to 500 �C with a temperature rate of
50 �C/min. and a treatment time of 10 min. After the anneal-
ing, the sample was quickly put out to the oven and kept at
room temperature to cooldown.
C. Transmission electron microscopy
A TEM JEOL 1011 (100 kV) was used to analyze as-
synthesized NCs and post-treated NCs. Electron diffraction
(SAED) has been used to study the crystalline structure. The
local structural analyses have been performed by HRTEM,
before and after annealing, using a JEOL 2010 UHR instru-
ment operated at 200 kV (LaB6). To determine the average
size <D> and the standard deviation r, 500 NCs were meas-
ured. A lognormal distribution was used to describe the size
distribution with the polydispersity index defined as the ratio
r/<D>.
D. Magnetic properties
The magnetic measurements were performed with a
superconducting quantum interference device magnetometer
SQUID. The samples have been prepared on HOPG sub-
strates in the same deposition conditions that TEM samples
to obtain a film of CoPt NCs (monolayer). The thermal treat-
ments have been carried out in the similar condition that for
TEM grids. A magnetic field of 75 G was applied during the
zero field cooling (zfc) and field cooling (fc) measurements.
To obtain the zfc curves, the samples were cooled down
under zero field up to 2.5 K. Then, a magnetic field of 75 G
was applied and the zfc curve was measured to increase the
temperature from 2.5 to 300 K. The fc curves were measured
with the same magnetic field in decreasing the temperature
from 300 to 2.5 K. Magnetic hysteresis loops were recorded
at 3 K with a magnetic field applied parallel to the monolayer
film.
III. COPT NCs IN THE A1 DISORDERED PHASE
A. Structure and morphology of as-synthesized NCs
The colloidal synthetic route used in this study enables
us to prepare samples of Co50Pt50 NCs in three different
sizes: 2, 3, and 4 nm. The control of the average size was
performed by tune of the growth kinetics, which is induced
by increase of the injection time of the reducing agent.16
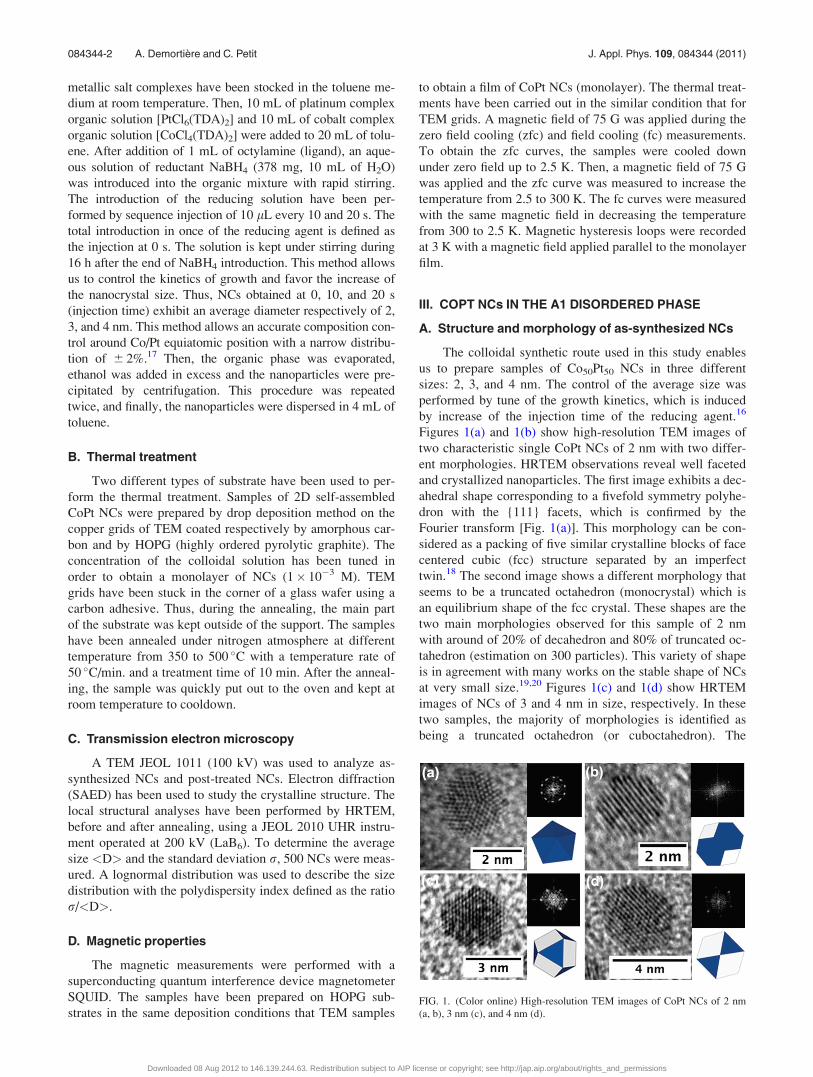
Figures 1(a) and 1(b) show high-resolution TEM images of
two characteristic single CoPt NCs of 2 nm with two differ-
ent morphologies. HRTEM observations reveal well faceted
and crystallized nanoparticles. The first image exhibits a dec-
ahedral shape corresponding to a fivefold symmetry polyhe-
dron with the {111} facets, which is confirmed by the
Fourier transform [Fig. 1(a)]. This morphology can be con-
sidered as a packing of five similar crystalline blocks of face
centered cubic (fcc) structure separated by an imperfect
twin.18 The second image shows a different morphology that
seems to be a truncated octahedron (monocrystal) which is
an equilibrium shape of the fcc crystal. These shapes are the
two main morphologies observed for this sample of 2 nm
with around of 20% of decahedron and 80% of truncated oc-
tahedron (estimation on 300 particles). This variety of shape
is in agreement with many works on the stable shape of NCs
at very small size.19,20 Figures 1(c) and 1(d) show HRTEM
images of NCs of 3 and 4 nm in size, respectively. In these
two samples, the majority of morphologies is identified as
being a truncated octahedron (or cuboctahedron). The
FIG. 1. (Color online) High-resolution TEM images of CoPt NCs of 2 nm
(a, b), 3 nm (c), and 4 nm (d).
084344-2 A. Demortiere and C. Petit J. Appl. Phys. 109, 084344 (2011)
Downloaded 08 Aug 2012 to 146.139.244.63. Redistribution subject to AIP license or copyright; see http://jap.aip.org/about/rights_and_permissions
Fourier transform exhibits the (111) and (200) reflections
corresponding to the A1-disordered phase, respectively at
2.1 and 1.9 A. From 3D graphic representation, the position
and the crystalline facets, {111} (blue) and {100} (white),
can be roughly estimate. Furthermore, in both cases, contrary
to the first sample, the decahedral shape was not observed.
These simple observations seem to show that stable mor-
phologies dependent on the size of NCs.
The classic framework used to understand the morphol-
ogy of crystals has been developed from the theory of
Gibbs�Curie�Wulff.21 This one indicates that the most sta-
ble morphology for fcc NCs (monometallic) is either the
cuboctahedron or the truncated octahedron. Favre et al.22
have shown in a simple calculation of surface tension of
cobalt and platinum (fcc) that the truncated octahedron could
be the most stable shape at 2 nm for CoPt NCs in vacuum.
Here, we show clearly that the evolution of the morphology
is function of the size of NCs. Indeed, the truncated octahe-
dral shape is present for all sizes whereas the decahedral
shape is only observed for the smallest size. Gruner et al.have studied the multiply twinned morphologies of bimetal-
lic FePt and CoPt NCs both in the A1 disordered and L10 or-
dered phase.23 Their ab initio calculations based on the
geometric relaxations on the Born�Oppenheimer surface,
demonstrated that for the smallest cluster the most favorable
morphology is the icosahedron. On the same way, Ferrando
et al. have demonstrated using ab initio simulations in vac-
uum that the size of Pt and CoPt clusters affects theirs mor-
phologies.24,25 However, they have shown that the
decahedral shape is not stable for the larger size of CoPt
nanoalloys.25 Recently, experimental and simulation investi-
gations have shown the effects of temperature on the struc-
ture and morphology of CoPt NCs with the growth at room
temperature of the nonequilibrium icosahedral morphol-
ogy.26 In our case, we observe that the decahedral shape is
stable at 2 nm but not at 4 nm, which is consistent with struc-
tural calculations. It should be noticed that the decahedral
shape and its evolution with size was never observed experi-
mentally for CoPt nanoalloys obtained by colloidal
chemistry.
However, contrary to the theoretical prediction for the
disordered CoPt NCs,27 we did not observe any icosahedral
shape in our samples. In the other side, the growth mecha-
nism should be taking into account in the understanding of
the final stable morphology.28 The syntheses of different
samples have been performed by control of kinetics condi-
tions that can drastically affect the stability of nuclei and
lead to a modification of the shape. Furthermore, it is worth
noticing that this type of synthesis in liquid systems system-
atically implies coating ligands, which interact with the
surfaces of the nuclei during the growth process. This is not
considered in the calculation mentioned above where the
surfaces of the cluster are free. Nevertheless as amine-coat-
ing ligand used here are weakly bound to the NCs29 their
effect on the equilibrium shape is low. Thus our results are
in good agreement, for the largest size, with the theoretical
works on “naked” cluster in vacuum. The relationship
between the size and the morphology of NCs has been
clearly observed but remains hard to understand and control
in the case of colloidal systems, because that depends of sev-
eral crucial parameters such as the kinetics growth or ligand
effects.30
B. Magnetic properties of as-synthesis CoPt NCs
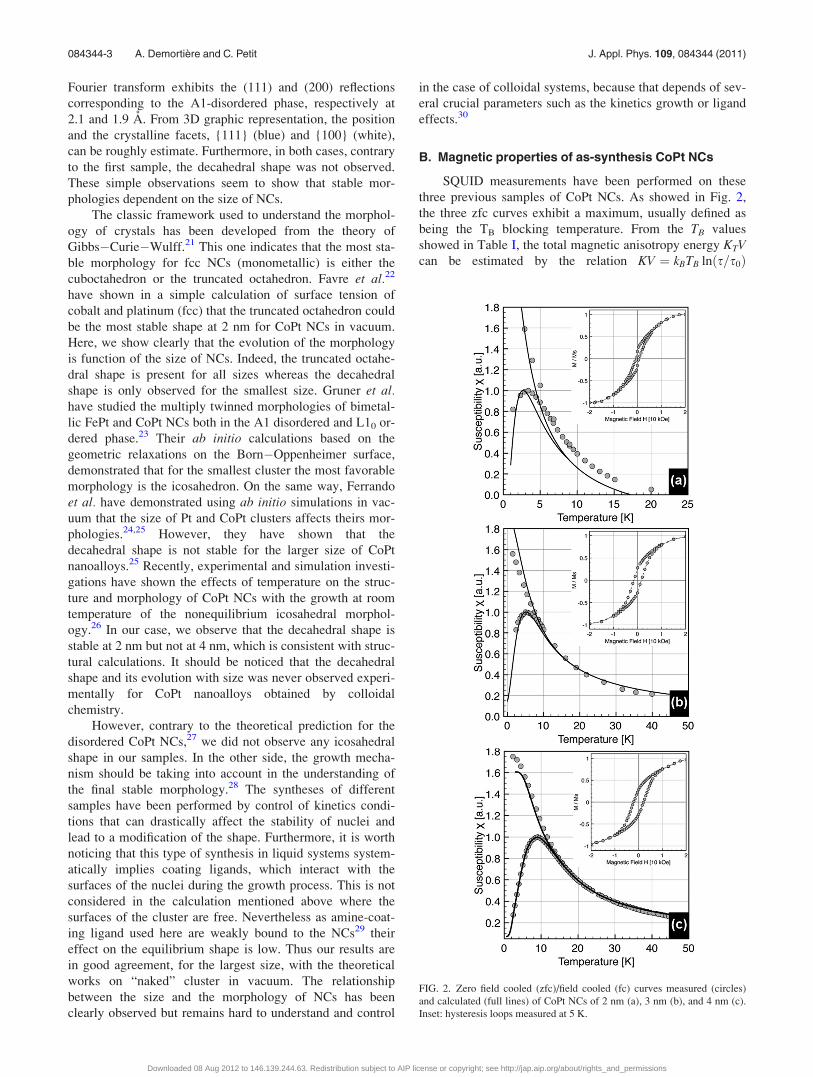
SQUID measurements have been performed on these
three previous samples of CoPt NCs. As showed in Fig. 2,
the three zfc curves exhibit a maximum, usually defined as
being the TB blocking temperature. From the TB values
showed in Table I, the total magnetic anisotropy energy KTVcan be estimated by the relation KV ¼ kBTB lnðs=s0Þ
FIG. 2. Zero field cooled (zfc)/field cooled (fc) curves measured (circles)
and calculated (full lines) of CoPt NCs of 2 nm (a), 3 nm (b), and 4 nm (c).
Inset: hysteresis loops measured at 5 K.
084344-3 A. Demortiere and C. Petit J. Appl. Phys. 109, 084344 (2011)
Downloaded 08 Aug 2012 to 146.139.244.63. Redistribution subject to AIP license or copyright; see http://jap.aip.org/about/rights_and_permissions
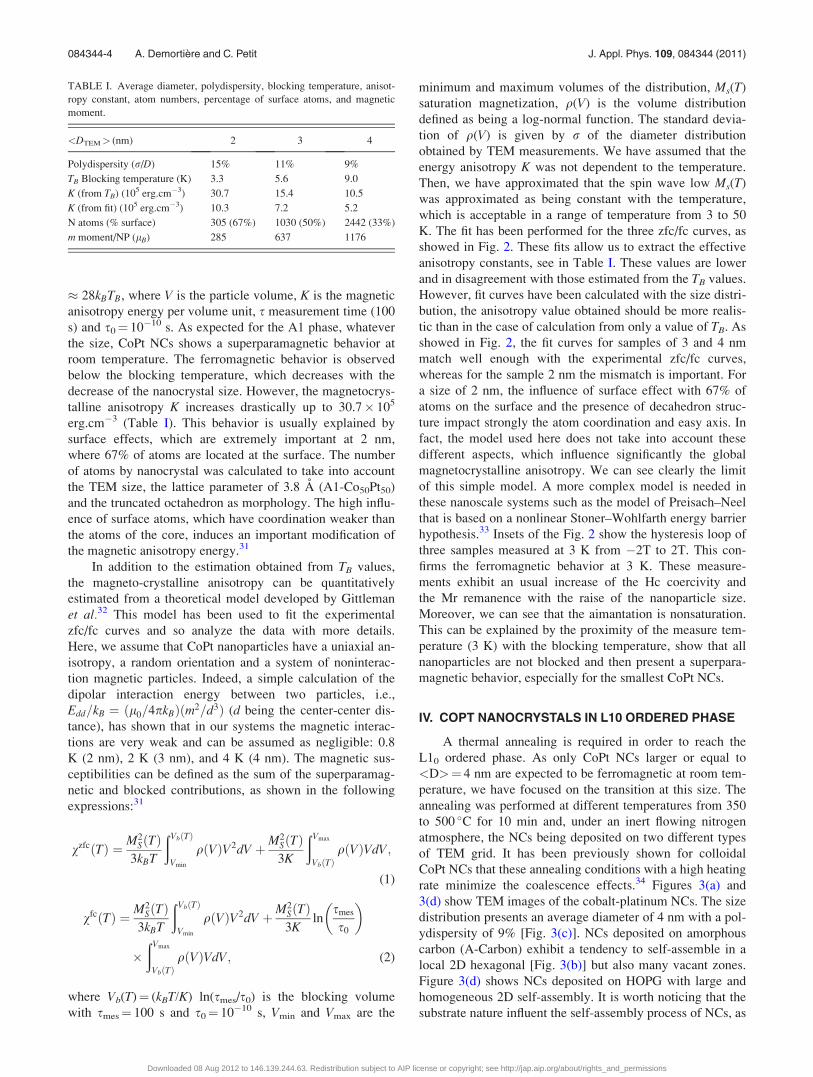
� 28kBTB, where V is the particle volume, K is the magnetic
anisotropy energy per volume unit, s measurement time (100
s) and s0¼ 10�10 s. As expected for the A1 phase, whatever
the size, CoPt NCs shows a superparamagnetic behavior at
room temperature. The ferromagnetic behavior is observed
below the blocking temperature, which decreases with the
decrease of the nanocrystal size. However, the magnetocrys-
talline anisotropy K increases drastically up to 30.7� 105
erg.cm�3 (Table I). This behavior is usually explained by
surface effects, which are extremely important at 2 nm,
where 67% of atoms are located at the surface. The number
of atoms by nanocrystal was calculated to take into account
the TEM size, the lattice parameter of 3.8 A (A1-Co50Pt50)
and the truncated octahedron as morphology. The high influ-
ence of surface atoms, which have coordination weaker than
the atoms of the core, induces an important modification of
the magnetic anisotropy energy.31
In addition to the estimation obtained from TB values,
the magneto-crystalline anisotropy can be quantitatively
estimated from a theoretical model developed by Gittleman
et al.32 This model has been used to fit the experimental
zfc/fc curves and so analyze the data with more details.
Here, we assume that CoPt nanoparticles have a uniaxial an-
isotropy, a random orientation and a system of noninterac-
tion magnetic particles. Indeed, a simple calculation of the
dipolar interaction energy between two particles, i.e.,
Edd=kB ¼ l0=4pkBð Þ m2=d3ð Þ (d being the center-center dis-
tance), has shown that in our systems the magnetic interac-
tions are very weak and can be assumed as negligible: 0.8
K (2 nm), 2 K (3 nm), and 4 K (4 nm). The magnetic sus-
ceptibilities can be defined as the sum of the superparamag-
netic and blocked contributions, as shown in the following
expressions:31
vzfcðTÞ ¼ M2SðTÞ
3kBT
ðVbðTÞ
Vmin
qðVÞV2dV þM2SðTÞ3K
ðVmax
VbðTÞqðVÞVdV;
(1)
vfcðTÞ ¼ M2SðTÞ
3kBT
ðVbðTÞ
Vmin
qðVÞV2dV þM2SðTÞ3K
lnsmes
s0
� �
�ðVmax
VbðTÞqðVÞVdV; (2)
where Vb(T)¼ (kBT/K) ln(smes/s0) is the blocking volume
with smes¼ 100 s and s0¼ 10�10 s, Vmin and Vmax are the
minimum and maximum volumes of the distribution, Ms(T)
saturation magnetization, q(V) is the volume distribution
defined as being a log-normal function. The standard devia-
tion of q(V) is given by r of the diameter distribution
obtained by TEM measurements. We have assumed that the
energy anisotropy K was not dependent to the temperature.
Then, we have approximated that the spin wave low Ms(T)
was approximated as being constant with the temperature,
which is acceptable in a range of temperature from 3 to 50
K. The fit has been performed for the three zfc/fc curves, as
showed in Fig. 2. These fits allow us to extract the effective
anisotropy constants, see in Table I. These values are lower
and in disagreement with those estimated from the TB values.
However, fit curves have been calculated with the size distri-
bution, the anisotropy value obtained should be more realis-
tic than in the case of calculation from only a value of TB. As
showed in Fig. 2, the fit curves for samples of 3 and 4 nm
match well enough with the experimental zfc/fc curves,
whereas for the sample 2 nm the mismatch is important. For
a size of 2 nm, the influence of surface effect with 67% of
atoms on the surface and the presence of decahedron struc-
ture impact strongly the atom coordination and easy axis. In
fact, the model used here does not take into account these
different aspects, which influence significantly the global
magnetocrystalline anisotropy. We can see clearly the limit
of this simple model. A more complex model is needed in
these nanoscale systems such as the model of Preisach–Neel
that is based on a nonlinear Stoner–Wohlfarth energy barrier
hypothesis.33 Insets of the Fig. 2 show the hysteresis loop of
three samples measured at 3 K from �2T to 2T. This con-
firms the ferromagnetic behavior at 3 K. These measure-
ments exhibit an usual increase of the Hc coercivity and
the Mr remanence with the raise of the nanoparticle size.
Moreover, we can see that the aimantation is nonsaturation.
This can be explained by the proximity of the measure tem-
perature (3 K) with the blocking temperature, show that all
nanoparticles are not blocked and then present a superpara-
magnetic behavior, especially for the smallest CoPt NCs.
IV. COPT NANOCRYSTALS IN L10 ORDERED PHASE
A thermal annealing is required in order to reach the
L10 ordered phase. As only CoPt NCs larger or equal to
<D>¼ 4 nm are expected to be ferromagnetic at room tem-
perature, we have focused on the transition at this size. The
annealing was performed at different temperatures from 350
to 500 �C for 10 min and, under an inert flowing nitrogen
atmosphere, the NCs being deposited on two different types
of TEM grid. It has been previously shown for colloidal
CoPt NCs that these annealing conditions with a high heating
rate minimize the coalescence effects.34 Figures 3(a) and
3(d) show TEM images of the cobalt-platinum NCs. The size
distribution presents an average diameter of 4 nm with a pol-
ydispersity of 9% [Fig. 3(c)]. NCs deposited on amorphous
carbon (A-Carbon) exhibit a tendency to self-assemble in a
local 2D hexagonal [Fig. 3(b)] but also many vacant zones.
Figure 3(d) shows NCs deposited on HOPG with large and
homogeneous 2D self-assembly. It is worth noticing that the
substrate nature influent the self-assembly process of NCs, as
TABLE I. Average diameter, polydispersity, blocking temperature, anisot-
ropy constant, atom numbers, percentage of surface atoms, and magnetic
moment.
<DTEM> (nm) 2 3 4
Polydispersity (r/D) 15% 11% 9%
TB Blocking temperature (K) 3.3 5.6 9.0
K (from TB) (105 erg.cm�3) 30.7 15.4 10.5
K (from fit) (105 erg.cm�3) 10.3 7.2 5.2
N atoms (% surface) 305 (67%) 1030 (50%) 2442 (33%)
m moment/NP (lB) 285 637 1176
084344-4 A. Demortiere and C. Petit J. Appl. Phys. 109, 084344 (2011)
Downloaded 08 Aug 2012 to 146.139.244.63. Redistribution subject to AIP license or copyright; see http://jap.aip.org/about/rights_and_permissions

already observed in the case of cobalt or silver NCs.35,36 The
HOPG substrate has a high crystalline surface that favors the
assembly of NCs on the surface compared to A-Carbon. Our
approach here is that the nature of the substrate and the lay-
out of NCs on the substrate can impact the diffusion and coa-
lescence effect during the thermal treatment.
A. Thermal treatment: A1/L10 structural transition andcoalescence effects
The structural ordering, distortion of the self-assembly
and agglomeration of NCs have been observed by TEM and
electron diffraction (SAED). Figures 4 and 5 show TEM
images and SEAD patterns of CoPt NCs annealed at 350,
400, 450, and 500 �C, and respectively deposited on the
TEM grids of ACarbon and HOPG. These analyses show
first that the thermal treatment leads to coalescence and sin-
tering effects, which induces a modification of the size and
shape, as well as a distortion of the monolayer of NCs. The
evolution of nanocrystal size with the annealing temperature
is presented on the Table II. Below 400 �C, TEM images ex-
hibit a low and quasisimilar increase of nanoparticle size for
both substrates. From 450 �C, a strong raise of the average
size is observed, which drastically differs between HOPG
and ACarbon substrates [Figs. 4(c) and 5(c)]. The coales-
cence effects appear weaker by using the HOPG substrate,
FIG. 3. TEM images of CoPt NCs (4 nm) on TEM grid of amorphous car-
bon (a) and HOPG (b).
FIG. 4. (Color online) TEM images and SAED patterns of CoPt NCs on
amorpheous cabone substrate after annealing treatment at 350 �C (a,e),
400 �C (b,f), 450 �C (c,g), 500 �C (d,h).
084344-5 A. Demortiere and C. Petit J. Appl. Phys. 109, 084344 (2011)
Downloaded 08 Aug 2012 to 146.139.244.63. Redistribution subject to AIP license or copyright; see http://jap.aip.org/about/rights_and_permissions
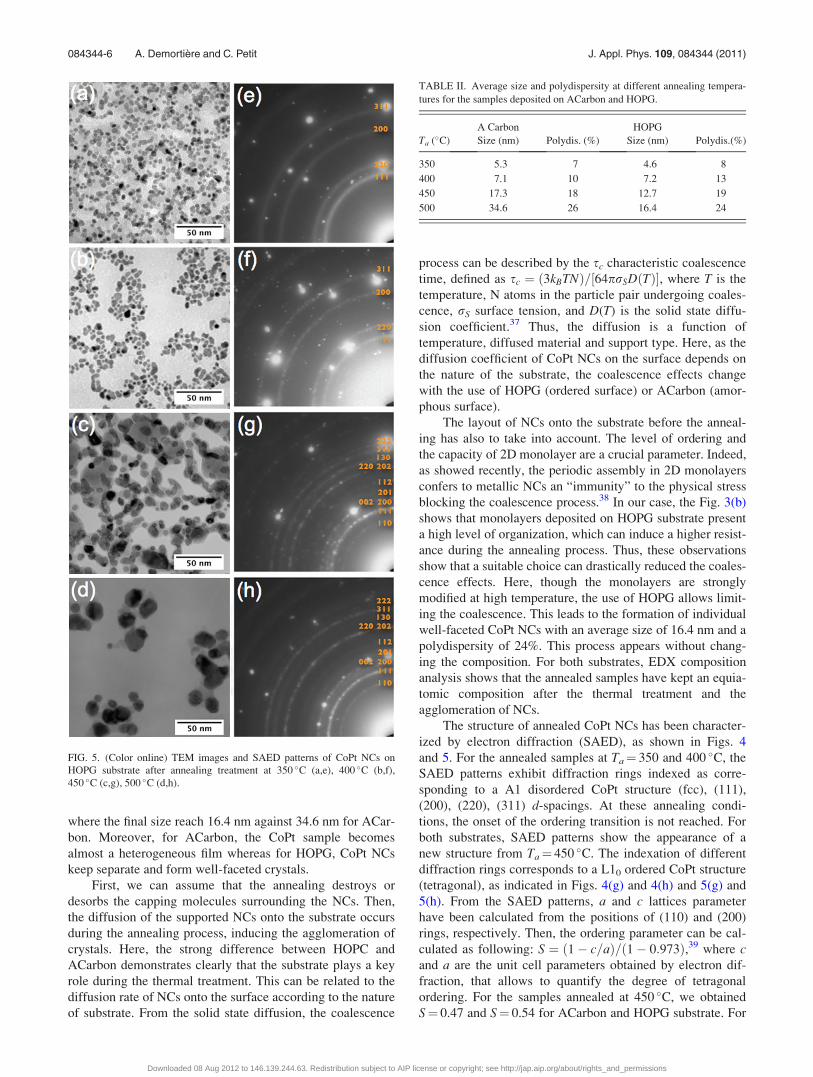
where the final size reach 16.4 nm against 34.6 nm for ACar-
bon. Moreover, for ACarbon, the CoPt sample becomes
almost a heterogeneous film whereas for HOPG, CoPt NCs
keep separate and form well-faceted crystals.
First, we can assume that the annealing destroys or
desorbs the capping molecules surrounding the NCs. Then,
the diffusion of the supported NCs onto the substrate occurs
during the annealing process, inducing the agglomeration of
crystals. Here, the strong difference between HOPC and
ACarbon demonstrates clearly that the substrate plays a key
role during the thermal treatment. This can be related to the
diffusion rate of NCs onto the surface according to the nature
of substrate. From the solid state diffusion, the coalescence
process can be described by the sc characteristic coalescence
time, defined as sc ¼ 3kBTNð Þ= 64prSDðTÞ½ �, where T is the
temperature, N atoms in the particle pair undergoing coales-
cence, rS surface tension, and D(T) is the solid state diffu-
sion coefficient.37 Thus, the diffusion is a function of
temperature, diffused material and support type. Here, as the
diffusion coefficient of CoPt NCs on the surface depends on
the nature of the substrate, the coalescence effects change
with the use of HOPG (ordered surface) or ACarbon (amor-
phous surface).
The layout of NCs onto the substrate before the anneal-
ing has also to take into account. The level of ordering and
the capacity of 2D monolayer are a crucial parameter. Indeed,
as showed recently, the periodic assembly in 2D monolayers
confers to metallic NCs an “immunity” to the physical stress
blocking the coalescence process.38 In our case, the Fig. 3(b)
shows that monolayers deposited on HOPG substrate present
a high level of organization, which can induce a higher resist-
ance during the annealing process. Thus, these observations
show that a suitable choice can drastically reduced the coales-
cence effects. Here, though the monolayers are strongly
modified at high temperature, the use of HOPG allows limit-
ing the coalescence. This leads to the formation of individual
well-faceted CoPt NCs with an average size of 16.4 nm and a
polydispersity of 24%. This process appears without chang-
ing the composition. For both substrates, EDX composition
analysis shows that the annealed samples have kept an equia-
tomic composition after the thermal treatment and the
agglomeration of NCs.
The structure of annealed CoPt NCs has been character-
ized by electron diffraction (SAED), as shown in Figs. 4
and 5. For the annealed samples at Ta¼ 350 and 400 �C, the
SAED patterns exhibit diffraction rings indexed as corre-
sponding to a A1 disordered CoPt structure (fcc), (111),
(200), (220), (311) d-spacings. At these annealing condi-
tions, the onset of the ordering transition is not reached. For
both substrates, SAED patterns show the appearance of a
new structure from Ta¼ 450 �C. The indexation of different
diffraction rings corresponds to a L10 ordered CoPt structure
(tetragonal), as indicated in Figs. 4(g) and 4(h) and 5(g) and
5(h). From the SAED patterns, a and c lattices parameter
have been calculated from the positions of (110) and (200)
rings, respectively. Then, the ordering parameter can be cal-
culated as following: S ¼ ð1� c=aÞ=ð1� 0:973Þ,39 where cand a are the unit cell parameters obtained by electron dif-
fraction, that allows to quantify the degree of tetragonal
ordering. For the samples annealed at 450 �C, we obtained
S¼ 0.47 and S¼ 0.54 for ACarbon and HOPG substrate. For
FIG. 5. (Color online) TEM images and SAED patterns of CoPt NCs on
HOPG substrate after annealing treatment at 350 �C (a,e), 400 �C (b,f),
450 �C (c,g), 500 �C (d,h).
TABLE II. Average size and polydispersity at different annealing tempera-
tures for the samples deposited on ACarbon and HOPG.
A Carbon HOPG
Ta (�C) Size (nm) Polydis. (%) Size (nm) Polydis.(%)
350 5.3 7 4.6 8
400 7.1 10 7.2 13
450 17.3 18 12.7 19
500 34.6 26 16.4 24
084344-6 A. Demortiere and C. Petit J. Appl. Phys. 109, 084344 (2011)
Downloaded 08 Aug 2012 to 146.139.244.63. Redistribution subject to AIP license or copyright; see http://jap.aip.org/about/rights_and_permissions
Ta¼ 500 �C, we obtained S¼ 0.58 and S¼ 0.65, respec-
tively. It is worth noting that this data set is only indicative
values to evaluate the degree of ordering because the estima-
tion of c and a lattice parameter from SAED patterns
remains difficult. Nevertheless, these results show a differ-
ence of the ordering parameter between both used substrates.
The HOPG seems to favor further the ordering compared to
the A-Carbon, keeping in the same time the average size
smaller due to the limited coalescence process. These two
effects are probably related; new investigations are in pro-
gress understand this relationship. For both cases, the onset
of the A1/L10 transition appear from Ta¼ 450 �C and con-
tinue at Ta¼ 500 �C. However, at 500 �C the transition is not
complete, the maximum reached being S¼ 0.65. The order-
ing process is a kinetic process that includes atomic jumps
both on the surface and in the bulk of the NCs. As the coales-
cence effect, the ordering process can be defined by the so
characteristic ordering time, so ¼ k2=Ddiff , where k is the
mean diffusion length and Ddiff is the diffusion coefficient.
From this model, the A1/L10 transition temperature has been
estimated at 550 �C.40 Here, a transition has been observed at
Ta¼ 450 �C. This gap can be explained by the small size of
NCs (4 nm) where the surface is major. Indeed, Buffat et al.shown that the decrease of the nanoparticle size can drasti-
cally modify the thermodynamical conditions, as example
the fusion temperature.41
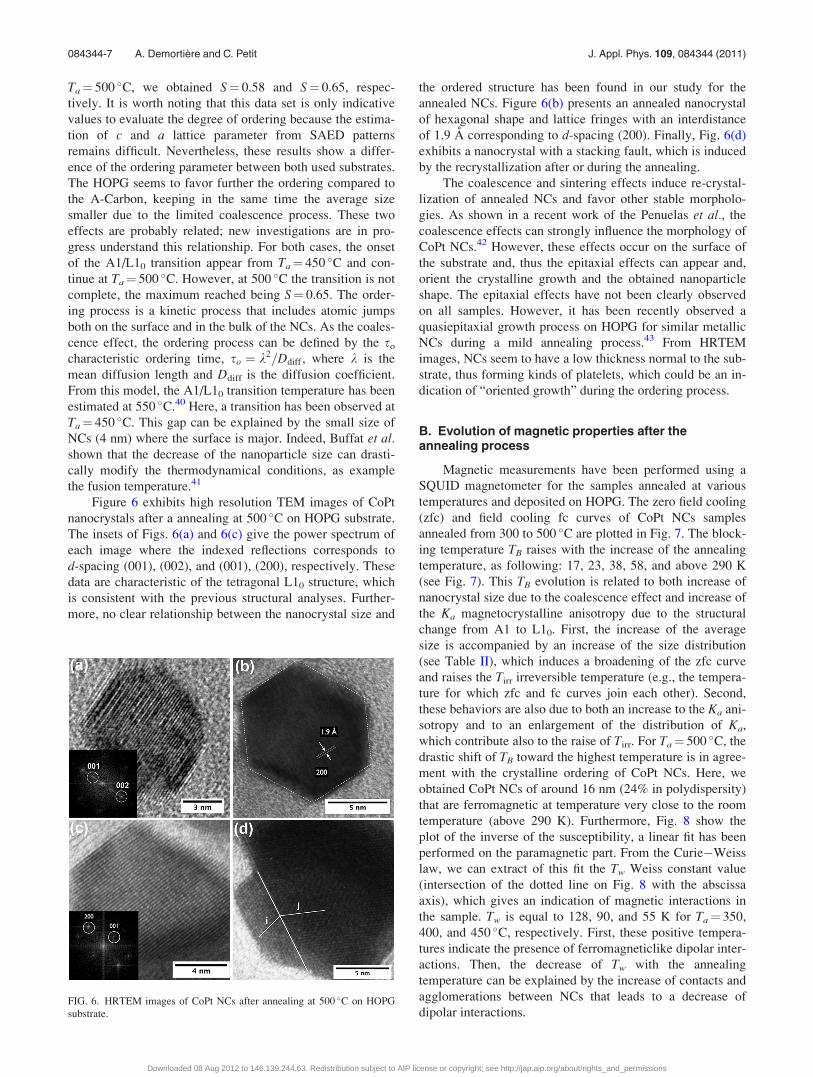
Figure 6 exhibits high resolution TEM images of CoPt
nanocrystals after a annealing at 500 �C on HOPG substrate.
The insets of Figs. 6(a) and 6(c) give the power spectrum of
each image where the indexed reflections corresponds to
d-spacing (001), (002), and (001), (200), respectively. These
data are characteristic of the tetragonal L10 structure, which
is consistent with the previous structural analyses. Further-
more, no clear relationship between the nanocrystal size and
the ordered structure has been found in our study for the
annealed NCs. Figure 6(b) presents an annealed nanocrystal
of hexagonal shape and lattice fringes with an interdistance
of 1.9 A corresponding to d-spacing (200). Finally, Fig. 6(d)
exhibits a nanocrystal with a stacking fault, which is induced
by the recrystallization after or during the annealing.
The coalescence and sintering effects induce re-crystal-
lization of annealed NCs and favor other stable morpholo-
gies. As shown in a recent work of the Penuelas et al., the
coalescence effects can strongly influence the morphology of
CoPt NCs.42 However, these effects occur on the surface of
the substrate and, thus the epitaxial effects can appear and,
orient the crystalline growth and the obtained nanoparticle
shape. The epitaxial effects have not been clearly observed
on all samples. However, it has been recently observed a
quasiepitaxial growth process on HOPG for similar metallic
NCs during a mild annealing process.43 From HRTEM
images, NCs seem to have a low thickness normal to the sub-
strate, thus forming kinds of platelets, which could be an in-
dication of “oriented growth” during the ordering process.
B. Evolution of magnetic properties after theannealing process
Magnetic measurements have been performed using a
SQUID magnetometer for the samples annealed at various
temperatures and deposited on HOPG. The zero field cooling
(zfc) and field cooling fc curves of CoPt NCs samples
annealed from 300 to 500 �C are plotted in Fig. 7. The block-
ing temperature TB raises with the increase of the annealing
temperature, as following: 17, 23, 38, 58, and above 290 K
(see Fig. 7). This TB evolution is related to both increase of
nanocrystal size due to the coalescence effect and increase of
the Ka magnetocrystalline anisotropy due to the structural
change from A1 to L10. First, the increase of the average
size is accompanied by an increase of the size distribution
(see Table II), which induces a broadening of the zfc curve
and raises the Tirr irreversible temperature (e.g., the tempera-
ture for which zfc and fc curves join each other). Second,
these behaviors are also due to both an increase to the Ka ani-
sotropy and to an enlargement of the distribution of Ka,
which contribute also to the raise of Tirr. For Ta¼ 500 �C, the
drastic shift of TB toward the highest temperature is in agree-
ment with the crystalline ordering of CoPt NCs. Here, we
obtained CoPt NCs of around 16 nm (24% in polydispersity)
that are ferromagnetic at temperature very close to the room
temperature (above 290 K). Furthermore, Fig. 8 show the
plot of the inverse of the susceptibility, a linear fit has been
performed on the paramagnetic part. From the Curie�Weiss
law, we can extract of this fit the Tw Weiss constant value
(intersection of the dotted line on Fig. 8 with the abscissa
axis), which gives an indication of magnetic interactions in
the sample. Tw is equal to 128, 90, and 55 K for Ta¼ 350,
400, and 450 �C, respectively. First, these positive tempera-
tures indicate the presence of ferromagneticlike dipolar inter-
actions. Then, the decrease of Tw with the annealing
temperature can be explained by the increase of contacts and
agglomerations between NCs that leads to a decrease of
dipolar interactions.FIG. 6. HRTEM images of CoPt NCs after annealing at 500 �C on HOPG
substrate.
084344-7 A. Demortiere and C. Petit J. Appl. Phys. 109, 084344 (2011)
Downloaded 08 Aug 2012 to 146.139.244.63. Redistribution subject to AIP license or copyright; see http://jap.aip.org/about/rights_and_permissions
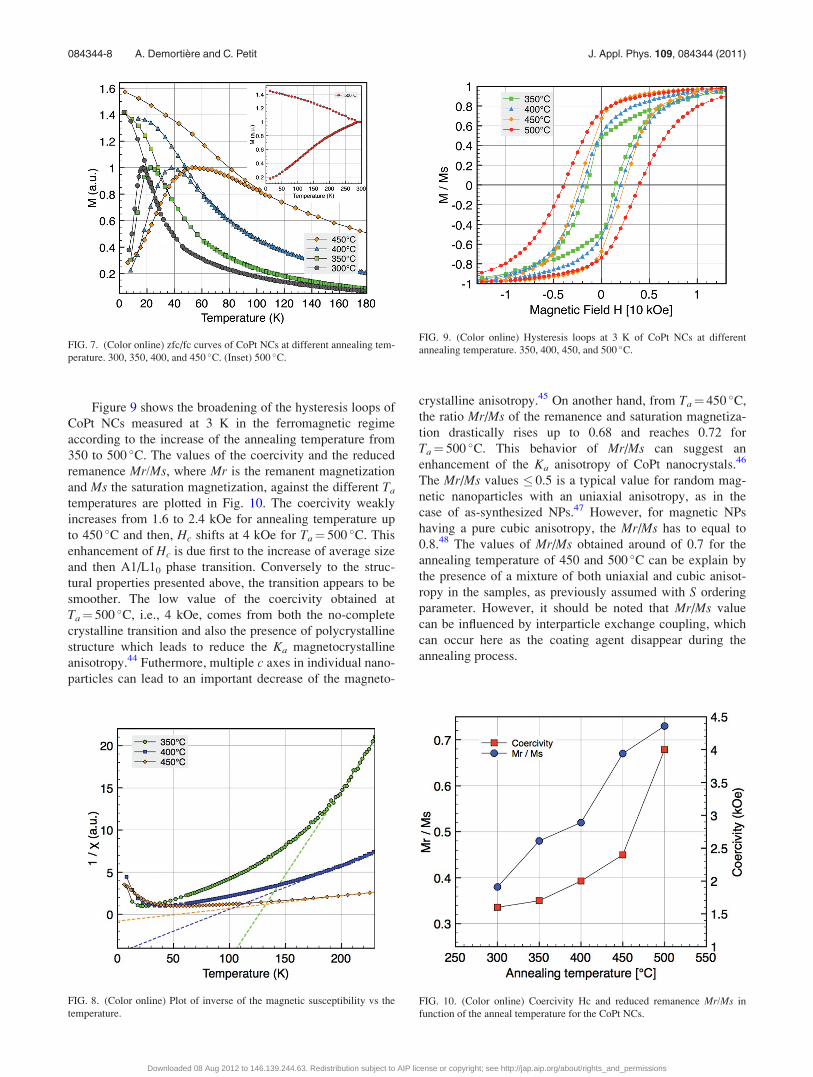
Figure 9 shows the broadening of the hysteresis loops of
CoPt NCs measured at 3 K in the ferromagnetic regime
according to the increase of the annealing temperature from
350 to 500 �C. The values of the coercivity and the reduced
remanence Mr/Ms, where Mr is the remanent magnetization
and Ms the saturation magnetization, against the different Ta
temperatures are plotted in Fig. 10. The coercivity weakly
increases from 1.6 to 2.4 kOe for annealing temperature up
to 450 �C and then, Hc shifts at 4 kOe for Ta¼ 500 �C. This
enhancement of Hc is due first to the increase of average size
and then A1/L10 phase transition. Conversely to the struc-
tural properties presented above, the transition appears to be
smoother. The low value of the coercivity obtained at
Ta¼ 500 �C, i.e., 4 kOe, comes from both the no-complete
crystalline transition and also the presence of polycrystalline
structure which leads to reduce the Ka magnetocrystalline
anisotropy.44 Futhermore, multiple c axes in individual nano-
particles can lead to an important decrease of the magneto-
crystalline anisotropy.45 On another hand, from Ta¼ 450 �C,
the ratio Mr/Ms of the remanence and saturation magnetiza-
tion drastically rises up to 0.68 and reaches 0.72 for
Ta¼ 500 �C. This behavior of Mr/Ms can suggest an
enhancement of the Ka anisotropy of CoPt nanocrystals.46
The Mr/Ms values � 0.5 is a typical value for random mag-
netic nanoparticles with an uniaxial anisotropy, as in the
case of as-synthesized NPs.47 However, for magnetic NPs
having a pure cubic anisotropy, the Mr/Ms has to equal to
0.8.48 The values of Mr/Ms obtained around of 0.7 for the
annealing temperature of 450 and 500 �C can be explain by
the presence of a mixture of both uniaxial and cubic anisot-
ropy in the samples, as previously assumed with S ordering
parameter. However, it should be noted that Mr/Ms value
can be influenced by interparticle exchange coupling, which
can occur here as the coating agent disappear during the
annealing process.
FIG. 7. (Color online) zfc/fc curves of CoPt NCs at different annealing tem-
perature. 300, 350, 400, and 450 �C. (Inset) 500 �C.
FIG. 8. (Color online) Plot of inverse of the magnetic susceptibility vs the
temperature.
FIG. 9. (Color online) Hysteresis loops at 3 K of CoPt NCs at different
annealing temperature. 350, 400, 450, and 500 �C.
FIG. 10. (Color online) Coercivity Hc and reduced remanence Mr/Ms in
function of the anneal temperature for the CoPt NCs.
084344-8 A. Demortiere and C. Petit J. Appl. Phys. 109, 084344 (2011)
Downloaded 08 Aug 2012 to 146.139.244.63. Redistribution subject to AIP license or copyright; see http://jap.aip.org/about/rights_and_permissions
V. CONCLUSIONS
In summary, we have synthesized A1 CoPt NCs of 2, 3,
and, 4 nm of diameter using biphasic chemical method. The
study of the size and the morphology of these NPs has been
carried out by TEM and HR TEM. The size-dependence of
the morphology of NCs has been clearly observed, in partic-
ular at 2 nm with the decahedral shape. In particular, our
results confirm the theoretical calculations showing the pres-
ence of decahedral shape for 2 nm in size CoPt nanoalloys,
which disappears for the largest size. The investigation of
the magnetic properties of these small CoPt NPs has been
shown that the interparticle dipolar interactions are very
weak and the influence of surface effect is significant for
NCs of D � 4 nm. The annealed NPs have been studied in
term of evolution of size, shape, and structure. We demon-
strated that the HOPG substrate is able to limit the coales-
cence effects during the thermal treatment and also favor the
ordering of nanoalloys. The L10 ordering structure has been
observed from an annealing temperature of 450 �C. The esti-
mation of the ordering parameter (S¼ 0.65) suggests that the
crystalline transition is no complete, even for Ta¼ 500 �C.
We obtained the CoPt NPs that are ferromagnetic at room
temperature with an average size of 16 nm. The evolution of
different magnetic parameters has been studied according
the annealing temperature. The annealed NPs present inter-
ested magnetic behaviors, but both the complete A1/L10
transformation was not reached and the coalescence effects
are reduced but remain significant. Others investigations on
annealing method are needed to avoid the lost of homogene-
ity of the size and shape during the A1/L10 transformation in
these monodisperse CoPt NCs.
ACKNOWLEDGMENTS
The authors would like to thank Pierre Bonville and Eric
Vincent, DRECAM/SPEC CEA, Saclay, France, for the use
of their SQUID equipment and fruitful discussions, as well as
Patricia Beaunier, LRS/UPMC, Paris, France, for her help in
the High Resolution TEM. The authors gratefully acknowl-
edge Bernard Barbara, Louis Neel, Grenoble, France, for stim-
ulating discussions.
1W. Chen, J. Kim, S. Sun, and S. Chen, J. Phys. Chem. C 112, 3891 (2008).2Y.-W. Jun, J.-W. Seo, and J. Cheon, Acc. Chem. Res. 41, 179 (2008).3R. Ferrando, J. Jellinek, and R. L. Johnston, Chem. Rev. 108, 845 (2008).4J. Sayama, K. Mizutani, T. Asahi, J. Ariake, K. Ouchi, S. Matsunuma, and
Y. Osaka, J. Magn. Magn. Mater. 287, 239 (2005).5D. Weller and T. McDaniel, Advanced Magnetic Nanostructures(Springer, New York, 2006), p. 295.
6N.I. Vlasova, G.S. Kandaurova, and N.N. Shchegoleva, J. Magn. Magn.
Mater. 222, 138 (2000).7R. K. Rakshit, S. K. Bose, R. Sharma, R. C. Budhani, T. Vijaykumar, S. J.
Neena, and G. U. Kulkarni, J. Appl. Phys. 103, 023915 (2008).8D. Alloyeau, C. Ricolleau, C. Mottet, T. Oikawa, C. Langlois, Y. Le
Bouar, N. Braidy, and A. Loiseau, Nature Mater. 8, 940 (2009).9S. Kang, Z. Jia, S. Shi, D. E. Nikles, and J. W. Harrell, Appl. Phys. Lett.
86, 062503 (2005).
10S. Mourdikoudis, K. Simeonidis, K. Gloystein, M. Angelakeris, C. Dendri-
nou-Samara, I. Tsiaoussis, and O. Kalogirou, J. Magn. Magn. Mater. 321,
3120 (2009).11M. Chen, T. Pica, Y. B. Jiang, P. Li, K. Yano, J. P. Liu, A. K. Datye, and
H. Fan, J. Am. Chem. Soc. 129, 6348 (2007).12S. W. Chou, C. L. Zhu, S. Neeleshwar, C. L. Chen, Y. Y. Chen, and C. C.
Chen, Chem. Mater. 21, 4955 (2009).13A. Demortiere, P. Launois, N. Goubet, P. A. Albouy and C. Petit, J. Phys.
Chem. B 112, 14583 (2008).14F. Tournus, A. Tamion, N. Blanc, A. Hannour, L. Bardotti, B. Prevel, P.
Ohresser, E. Bonet, T. Epicier, and V. Dupuis Phys. Rev. B 77, 144411
(2008).15N. Braidy, Y. Le Bouar, M. Fevre, and C. Ricolleau, Phys. Rev. B 81,
054202 (2010).16A. Demortiere and C. Petit, Langmuir 23, 8575 (2007).17A. Demortiere, R. Losno, C. Petit, and J-P. Quisefit, Anal. Bioanal. Chem.
397, 485 (2010).18I. Lisiecki, A. Filankembo, H. Sack-Kongehl, K. Weiss, M-P. Pileni, and
J. Urban, Phys. Rev. B 61, 4968 (2000).19J.M. Petroski, Z.L. Wang, T. C. Green, and M. A. El-Sayed, J. Phys.
Chem. B 102, 3316 (1998).20Z. L. Wang, J. Phys. Chem. B 104, 1153 (2000).21J.W. Mullin, Crystallization, 4th ed. (Butterworth, Washington, DC,
2001).22L. Favre, V. Dupuis, E. Bernstein, P. Melinon, A. Perez, S. Stanescu, T.
Epicier, J.-P. Simon, D. Babonneau, J.-M. Tonnerre, and J.-L. Hodeau,
Phys. Rev. B 74, 014439 (2006).23M.E. Gruner, G. Rollmann, P. Entel, and M. Farle, Phys. Rev. Lett. 100,
087203 (2008).24F. Baletto and R. Ferrando, Rev. Mod. Phys. 77, 371 (2005).25G. Rossi, R. Ferrando, and C. Mottet, Faraday Discuss. 138, 193 (2008).26J. Penuelas, P. Andreazza, C. Andreazza-Vignolle, H. C. N. Tolentino, M.
De Santis, and C. Mottet, Phys. Rev. Lett. 100, 115502 (2008).27G. Barcaro, R. Ferrando, A. Fortunelli, and G. Rossi, J. Phys. Chem. Lett.
1, 111 (2010).28Y.-W. Jun, J.-H. Lee, J.-S. Choi, and J. Cheon, J. Phys. Chem. B 109,
14795 (2005).29K. Naoe, C. Petit, and M. P. Pileni, Langmuir 24, 2792 (2008).30A. R. Tao, S. Habas, and P. Yang, Small 4, 310 (2008).31A. Demortiere, S. Buathong, B.P. Pichon, P. Panissod, D. Guillon, S.
Begin-Colin, and B. Donnio, Small 6, 1341 (2010).32J. I. Gittleman, B. Abeles, and S. Bozowski, Phys Rev. B 9, 3891 (1974).33I. D. Borcia, M. Cerchez, and Al. Stancu, L. D. Tung, and L. Spinu, J.
Appl. Phys. 93,6823 (2003).34C. Petit, S. Rusponi, and H. Brune, J. Appl. Phys. 95, 4251 (2004).35M.P. Pileni, Y. Lalatonne, D. Ingert, I. Lisiecki, and A. Courty, Faraday
Discuss. 125, 251 (2004).36L. Motte, E. Lacaze, M. Maillard, and M.P. Pileni, Langmuir 16, 3803
(2000).37K. E. J. Lehtinen and M. R. Zachariah, Phys. Rev. B 63, 205402 (2001).38E. Klecha, D. Ingert, M. Walls, and M. P. Pileni, Langmuir 25, 2824
(2009).39M. Chen and D. E. Nikles, J. Appl. Phys. 91, 8477 (2002).40D. Alloyeau, C. Langlois, C. Riccoleau, Y. Le Bouar, and A. Loiseau,
Nanotechnology 18, 375301 (2007).41P. Buffat and J. P. Borel, Phys. Rev. A 13, 2287 (1976).42J. Penuelas, P. Andreazza, C. Andreazza-Vignolle, H. C. N. Tolentino, M.
De Santis, and C. Mottet, Phys. Rev. Lett. 100, 115502 (2008).43A. Courty, A. I. Henry, N. Goubet, and M. P. Pileni, Nature Mater. 6, 900
(2007).44S. Jeong, Y.-N. Hsu, D. E. Laughlin, and M. E. McHenry, IEEE Trans.
Mag. 37, 1299 (2001).45W. Scholz, J. Fidler, T. Schrefl, D. Suess, H. Forster, R. Dittrich, and V.
Tsiantos, J. Magn. Magn. Mater. 272, 1524 (2004).46X. Sun, Z. Y. Jia, Y. H. Huang, J. W. Harrell, D. E. Nikles, K. Sun, and
L. M. Wang, J. Appl. Phys. 95, 6747 (2004).47B. D. Cullity, Introduction to Magnetic Materials (Addison-Wesley, Read-
ing, MA, 1972).48H. Zeng, S. Sun, R. L. Sandstrom, and C.B. Murray, J. Magn. Magn.
Mater. 266, 227 (2003).
084344-9 A. Demortiere and C. Petit J. Appl. Phys. 109, 084344 (2011)
Downloaded 08 Aug 2012 to 146.139.244.63. Redistribution subject to AIP license or copyright; see http://jap.aip.org/about/rights_and_permissions