Electrodeposited polyethylenedioxythiophene with infiltrated gel electrolyte interface: a close...
9
Electrodeposited polyethylenedioxythiophene with infiltrated gel electrolyte interface: a close contest of an all-solid-state supercapacitor with its liquid- state counterpart† Bihag Anothumakkool, a Arun Torris A. T, b Siddheshwar N. Bhange, a Manohar V. Badiger b and Sreekumar Kurungot * a We report the design of an all-solid-state supercapacitor, which has charge storage characteristics closely matching that of its liquid-state counterpart even under extreme temperature and humidity conditions. The prototype is made by electro-depositing polyethylenedioxythiophene (PEDOT) onto the individual carbon fibers of a porous carbon substrate followed by intercalating the matrix with polyvinyl alcohol–sulphuric acid (PVA–H 2 SO 4 ) gel electrolyte. The electrodeposited layer of PEDOT maintained a flower-like growth pattern along the threads of each carbon fiber. This morphology and the alignment of PEDOT led to an enhanced surface area and electrical conductivity, and the pores in the system enabled effective intercalation of the polymer–gel electrolyte. Thus, the established electrode–electrolyte interface nearly mimics that of its counterpart based on the liquid electrolyte. Consequently, the solid device attained very low internal resistance (1.1 U cm 2 ) and a high specific capacitance (181 F g 1 ) for PEDOT at a discharge current density of 0.5 A g 1 . Even with a high areal capacitance of 836 mF cm 2 and volumetric capacitance of 28 F cm 3 , the solid device retained a mass-specific capacitance of 111 F g 1 for PEDOT. This is in close agreement with the value displayed by the corresponding liquid-state system (112 F g 1 ), which was fabricated by replacing the gel electrolyte with 0.5 M H 2 SO 4 . The device also showed excellent charge–discharge stability for 12 000 cycles at 5 A g 1 . The performance of the device was consistent even under wide-ranging humidity (30–80%) and temperature (10 to 80 C) conditions. Finally, a device fabricated by increasing the electrode area four times was used to light an LED, which validated the scalability of the process. 1. Introduction Energy storage devices are inevitable partners for energy har- vesting and converting systems. Among energy storage devices, supercapacitors 1–4 with faster charge–discharge and longer cycling capabilities have been considered one of the most potential candidates for electrochemical storage devices. Supercapacitors store charges at electrode–electrolyte inter- faces and have very high energy storage capacity compared with conventional capacitors. They possess many advantages over Li-ion batteries 3 such as high power density and long cycle life along with an acclaimed environmental friendly nature. This characteristic makes them ideal candidates for portable electronics, hybrid vehicles and smart grid applications. As in batteries, supercapacitors also use liquid electrolytes such as alkali or acid solutions, which makes them heavier and thus imposes restrictions on their usages in integrated electronic devices. Apart from this, possible leakage of corrosive liquid electrolytes demands a high standard of safety encapsulation technology, which raises the cost of the device. Due to these technical hurdles, there is a growing interest in replacing liquid electrolytes from supercapacitors with potential solid counterparts even though lots of technical challenges involve with this switch-over. Supercapacitors based on solid electro- lytes 5 are being considered as potential replacements of the ones based on liquid electrolytes. However, the performances of solid-state supercapacitors are oen inferior to their liquid- state counterparts. Literature analysis reveals that proper design of the electrode–electrolyte interface along with a Physical and Materials Chemistry Division, National Chemical Laboratory, Pune-411008, Maharashtra, India. E-mail: [email protected] b Polymer Science and Engineering Division, National Chemical Laboratory, Pune- 411008, Maharashtra, India † Electronic supplementary information (ESI) available: Methods used for calculating capacitance, energy density and power density. SEM images of various PEDOT-coated carbon paper. Cross-sectional SEM images and elemental mapping of all devices. Detailed cyclic voltammograms and charge–discharge curves of various samples. Detailed impedance analysis of various samples. Gravimetric Ragone plot. Video showing an LED powered by three cells in series. See DOI: 10.1039/c4nr00659c Cite this: Nanoscale, 2014, 6, 5944 Received 5th February 2014 Accepted 30th March 2014 DOI: 10.1039/c4nr00659c www.rsc.org/nanoscale 5944 | Nanoscale, 2014, 6, 5944–5952 This journal is © The Royal Society of Chemistry 2014 Nanoscale PAPER
Transcript of Electrodeposited polyethylenedioxythiophene with infiltrated gel electrolyte interface: a close...
Nanoscale
PAPER
aPhysical and Materials Chemistry Div
Pune-411008, Maharashtra, India. E-mail: kbPolymer Science and Engineering Division
411008, Maharashtra, India
† Electronic supplementary informationcalculating capacitance, energy densityvarious PEDOT-coated carbon paper. Crosmapping of all devices. Detailed cyclic vcurves of various samples. Detailed imGravimetric Ragone plot. Video showinseries. See DOI: 10.1039/c4nr00659c
Cite this: Nanoscale, 2014, 6, 5944
Received 5th February 2014Accepted 30th March 2014
DOI: 10.1039/c4nr00659c
www.rsc.org/nanoscale
5944 | Nanoscale, 2014, 6, 5944–5952
Electrodeposited polyethylenedioxythiophene withinfiltrated gel electrolyte interface: a close contestof an all-solid-state supercapacitor with its liquid-state counterpart†
Bihag Anothumakkool,a Arun Torris A. T,b Siddheshwar N. Bhange,a
Manohar V. Badigerb and Sreekumar Kurungot*a
We report the design of an all-solid-state supercapacitor, which has charge storage characteristics closely
matching that of its liquid-state counterpart even under extreme temperature and humidity conditions. The
prototype is made by electro-depositing polyethylenedioxythiophene (PEDOT) onto the individual carbon
fibers of a porous carbon substrate followed by intercalating the matrix with polyvinyl alcohol–sulphuric
acid (PVA–H2SO4) gel electrolyte. The electrodeposited layer of PEDOT maintained a flower-like growth
pattern along the threads of each carbon fiber. This morphology and the alignment of PEDOT led to an
enhanced surface area and electrical conductivity, and the pores in the system enabled effective
intercalation of the polymer–gel electrolyte. Thus, the established electrode–electrolyte interface nearly
mimics that of its counterpart based on the liquid electrolyte. Consequently, the solid device attained
very low internal resistance (1.1 U cm�2) and a high specific capacitance (181 F g�1) for PEDOT at a
discharge current density of 0.5 A g�1. Even with a high areal capacitance of 836 mF cm�2 and
volumetric capacitance of 28 F cm�3, the solid device retained a mass-specific capacitance of 111 F g�1
for PEDOT. This is in close agreement with the value displayed by the corresponding liquid-state system
(112 F g�1), which was fabricated by replacing the gel electrolyte with 0.5 M H2SO4. The device also
showed excellent charge–discharge stability for 12 000 cycles at 5 A g�1. The performance of the device
was consistent even under wide-ranging humidity (30–80%) and temperature (�10 to 80 �C) conditions.Finally, a device fabricated by increasing the electrode area four times was used to light an LED, which
validated the scalability of the process.
1. Introduction
Energy storage devices are inevitable partners for energy har-vesting and converting systems. Among energy storage devices,supercapacitors1–4 with faster charge–discharge and longercycling capabilities have been considered one of the mostpotential candidates for electrochemical storage devices.Supercapacitors store charges at electrode–electrolyte inter-faces and have very high energy storage capacity compared
ision, National Chemical Laboratory,
, National Chemical Laboratory, Pune-
(ESI) available: Methods used forand power density. SEM images ofs-sectional SEM images and elementaloltammograms and charge–dischargepedance analysis of various samples.g an LED powered by three cells in
with conventional capacitors. They possess many advantagesover Li-ion batteries3 such as high power density and long cyclelife along with an acclaimed environmental friendly nature.This characteristic makes them ideal candidates for portableelectronics, hybrid vehicles and smart grid applications. As inbatteries, supercapacitors also use liquid electrolytes such asalkali or acid solutions, which makes them heavier and thusimposes restrictions on their usages in integrated electronicdevices. Apart from this, possible leakage of corrosive liquidelectrolytes demands a high standard of safety encapsulationtechnology, which raises the cost of the device. Due to thesetechnical hurdles, there is a growing interest in replacingliquid electrolytes from supercapacitors with potential solidcounterparts even though lots of technical challenges involvewith this switch-over. Supercapacitors based on solid electro-lytes5 are being considered as potential replacements of theones based on liquid electrolytes. However, the performancesof solid-state supercapacitors are oen inferior to their liquid-state counterparts. Literature analysis reveals that properdesign of the electrode–electrolyte interface along with
This journal is © The Royal Society of Chemistry 2014
Paper Nanoscale
conductivity of the solid electrolytes has a vital role in deter-mining the performance. Employing solid-electrolyte lm inbetween the electrodes5–9 is an inefficient strategy as it haslimitations in establishing the required interface with theelectrode material. These limitations in the case of lm-basedsolid-state supercapacitors impose increased internal resis-tance and reduced charge storage properties, compared withsimilar liquid-state systems. If solid electrolytes can mimic thediffusive nature of liquid electrolytes, their performances canbe enhanced signicantly. In this context, gel–polymer elec-trolytes10–12 are expected to be potential replacements due totheir inherent ability to inltrate into the pores of the elec-trodes, similar to that of liquid electrolytes, while possessingother advantages in terms of handling and packaging, asexpected from solid-state systems. Especially, due to theircomparable conductivity as that of the liquid electrolytes alongwith higher exibility, gel–polymer electrolytes can be consid-ered effective systems which integrate the key benets of bothliquid and solid electrolytes.13,14
In one of our recent studies,15 we have demonstrated theimportance of porosity in the electrode for establishingenhanced interfacial network in solid-state supercapacitors forachieving high charge-storage properties. However, one chal-lenge we noticed was that at higher mass loading of the elec-troactive material, the performance of the solid-state devicebecomes inferior to its liquid-state counterpart as the polymerinltration is poor under such conditions. This leads to adrastic decrease in the specic capacitance. Thus, there is aneed to develop appropriate strategies for maintaining highspecic capacitance even under high mass loading conditions.To address this issue, we have now adopted a strategy of elec-trodepositing a charge storage material directly onto a porouscarbon current collector, which ensures highly reproduciblecoating of the electro-active material over each ber of theconducting carbon paper backbone. In the literature, manyreports are available on the electro-deposition of various activematerials such as metal oxides16,17 and conducting polymers18,19
directly on carbon substrates. The selected charge storagematerial in the present case is the conducting polymer poly-ethylenedioxythiophene (PEDOT),20 which could be electro-chemically grown on carbon bers from a solution containingits monomer, ethelenedioxythiophene (EDOT). PEDOT hasmany advantages such as high electrical conductivity of >500 Scm�1 and sustainability for a large potential window of 1.2 V,which is higher than that of the other conducting polymerssuch as polyaniline and polythiophene.21 Previous studiesillustrate that PEDOT can show a specic capacitance in therange of 80–180 F g�1,15,22–25 compared with its theoreticalcapacitance of 210 F g�1,21 depending upon the syntheticstrategies adopted. In the present study, the electrodepositedlayer of the material attains a peculiar 3-D ower-likemorphology, which is highly benecial in enhancing the overallarea of the charge storage surface. Along with this, the processhelps the structure to retain pores for solid-electrolyte inltra-tion even under the conditions of high mass loading. Thus, thefabricated, thin all-solid-state supercapacitor gives performancecharacteristics very similar to its liquid-state counterpart.
This journal is © The Royal Society of Chemistry 2014
2. Experimental sectionMaterials
Ethylenedioxythiophene (EDOT) and lithium perchlorate(LiClO4) were purchased from Aldrich Chemicals. Polyvinylalcohol (PVA) (MW 115 000 g mol�1; 98–99 mol% hydrolysed)was supplied by Loba Chemie. Acetonitrile and sulphuric acid(H2SO4) were procured from Rankem Chemicals. EDOT andacetonitrile were distilled before usage. Other chemicals wereused as received without any further purication. Carbon paperhaving a thickness of 0.3 mm was purchased from Toray.Polypropylene membrane with a thickness of 25 mm (Celgard)was used as a separator when a liquid was used as theelectrolyte.
Electrochemical polymerization of EDOT
Polymerization was carried out in a BioLogic SP-300 Potentio-Galvanostat using a 3-electrode system in which carbon paperwas used as the working electrode, Pt was used as the counterelectrode, and Ag/AgCl was used as the reference electrode. Theelectrolyte used was acetonitrile containing 0.1 M LiClO4 assupporting electrolyte and 0.1 M EDOT. Before the experiments,nitrogen was passed through the electrolyte to remove anydissolved oxygen. A 1 cm2 area of carbon paper was keptexposed to electrolyte and remaining part was masked usingKapton adhesive tape. The experiments were carried out inconstant current mode by maintaining 10 mA cm�2 currentdensity. The experiments were repeated for different timedurations of 50, 100, 300, 600, and 1200 s, and the corre-sponding electrodes are named as CP-50, CP-100, CP-300, CP-600, and CP-1200, respectively. Aer completion of the elec-trochemical deposition, the electrodes were washed with anacetonitrile solution and dried under an IR lamp and preservedfor further studies.
Preparation of PVA–H2SO4 solutions and lm
A poly(vinylalcohol)–H2SO4 gel electrolyte solution wasprepared by dissolving 1 g of PVA in 50 ml RB containing 10 mlof de-ionized water at 85 �C with vigorous stirring for 2 h and adrop-wise addition of 1.0 g H2SO4 into the solution under stir-ring at ambient temperature. The viscosity of the obtainedsolution was 0.6 � 105 Pa s.
Electrode preparation and device fabrication
A PVA–H2SO4 aqueous solution was used as the electrolyte formaking solid-state supercapacitors. The solution was coatedonto both surfaces of the carbon paper that was deposited withPEDOT. The coating was done using a K-control coater and thecoated electrodes were dried at 60 �C under vacuum overnight.Approximately 100 mg of PVA–H2SO4 was sufficient for making1 cm2 prototype devices. This procedure was repeated forfacilitating complete impregnation of PVA–H2SO4 gel-plasti-cised polymer within the carbon matrix. Prototype devices weremade by attaching two such electrodes by applying 20 kg cm�2
pressure. Before sandwiching, much care was taken to ensure
Nanoscale, 2014, 6, 5944–5952 | 5945
Nanoscale Paper
that a ne layer of PVA–H2SO4 was formed on one side of eachelectrode to serve as an effective separator between the elec-trodes once they are pressed together. The lm formed inbetween the electrodes will prevent short circuiting by acting asa separator. For making the liquid-state device, two electrodes,which were electrodeposited with PEDOT, were used and wereseparated using a polypropylene membrane, and the device wastested by dipping in 0.5 M H2SO4.
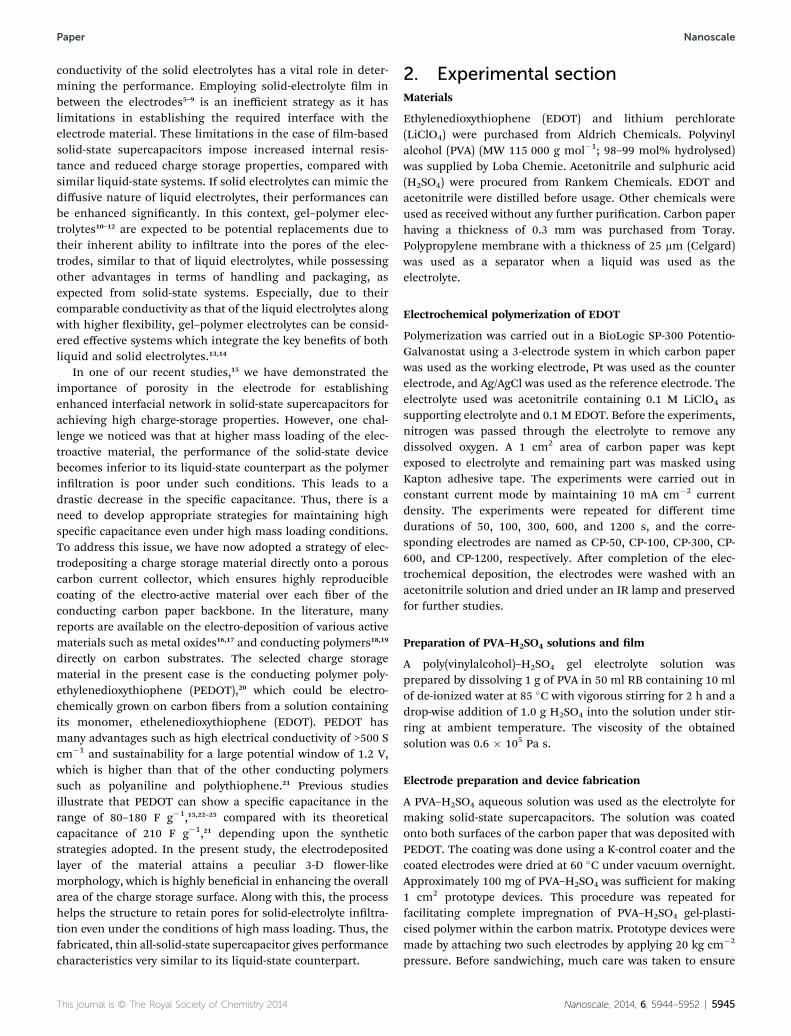
Fig. 1 Schematic representation of the preparation stages involved inthe development of the all-solid-state supercapacitor through elec-tro-deposition of PEDOT onto highly porous carbon paper and theintercalation of PVA–H2SO4 gel–polymer electrolytes into a matrix.
Characterization
Quanta™ Scanning Electron Microscope was used to analyzethe structure andmorphology of the materials. X-ray Diffraction(XRD) measurements were conducted using a Philips X'pert propowder X-ray diffractometer (Cu Ka radiation, Ni lter). Ramananalysis was carried out on Horiba JobinYvon Inverted LabRAMHR800 VIS-NIR using 532 nm solid-state diode laser beams. Allthe electrochemical studies were carried out in a BioLogic SP-300 Potentio-Galvanostat. Metal crocodile clips were used forthe required electrical contacts from the electrodes. The CVmeasurements were taken at different scan rates from 10 to2000 mV s�1 by maintaining a potential window of 1 V. Thecharge–discharge measurement was done at different currentdensities (0.5 to 20 A g�1) in the potential range of 0–1 V. Thecycling stability was tested by the chrono charge–dischargemethod at a current density of 5 A g�1 for 12 000 continuouscycles. The same device was used for checking the long-termstability for three months. Controlled humidity and tempera-ture experiments were carried out by keeping the solid deviceinside an Espec humidity and temperature chamber. Electro-chemical impedance (EIS) analysis was carried out in thefrequency range of 106 to 0.01 Hz against the open circuitpotential with a sinusoidal amplitude of 10 mV (Vrms ¼7.07 mV). All the EIS data were analyzed using EC-Lab SowareV10.19. Three all-solid-state supercapacitors having a 4 cm2
active area and a 3.78 mg cm�2 loading of PEDOT on eachelectrode were connected in a series to get a working potentialof 3 V for lighting a LED.
3. Result and discussion
A schematic representation of the solid-state device and thesynthetic procedure adopted here is represented in Fig. 1. Thisstrategy helps to get a homogeneous and enhanced electrode–electrolyte interface compared with a case where only a solidelectrolyte lm is used. Polyvinyl alcohol–sulphuric acid (PVA–H2SO4) gel electrolyte was used as the solid-electrolyte compo-nent.26–28 The main attraction of the PVA–H2SO4 gel electrolyteapart from its exibility, ambient conductivity (0.14 S cm�1)(Fig. S1a, ESI†) and desirable mechanical properties is its abilityto diffuse into the porous substrate matrix to ensure extendedelectrode–electrolyte interfacial structure. Even with 50% ofH2SO4 in the matrix, PVA lms show a high viscosity of 0.6 �105 Pa s (Fig. S1b, ESI†), attributing to its solid nature. Theporosity of the carbon paper and the freedom to control theviscosity of PVA by means of water further enable easy pene-tration and coating of the PVA–H2SO4 on the surface of PEDOT-
5946 | Nanoscale, 2014, 6, 5944–5952
grown carbon bers. Thus, the effort gives a viable way to theconceptualization of a solid-state supercapacitor possessing aclosely mimicking electrode–electrolyte interfacial structure asthat of its liquid-state counterpart.
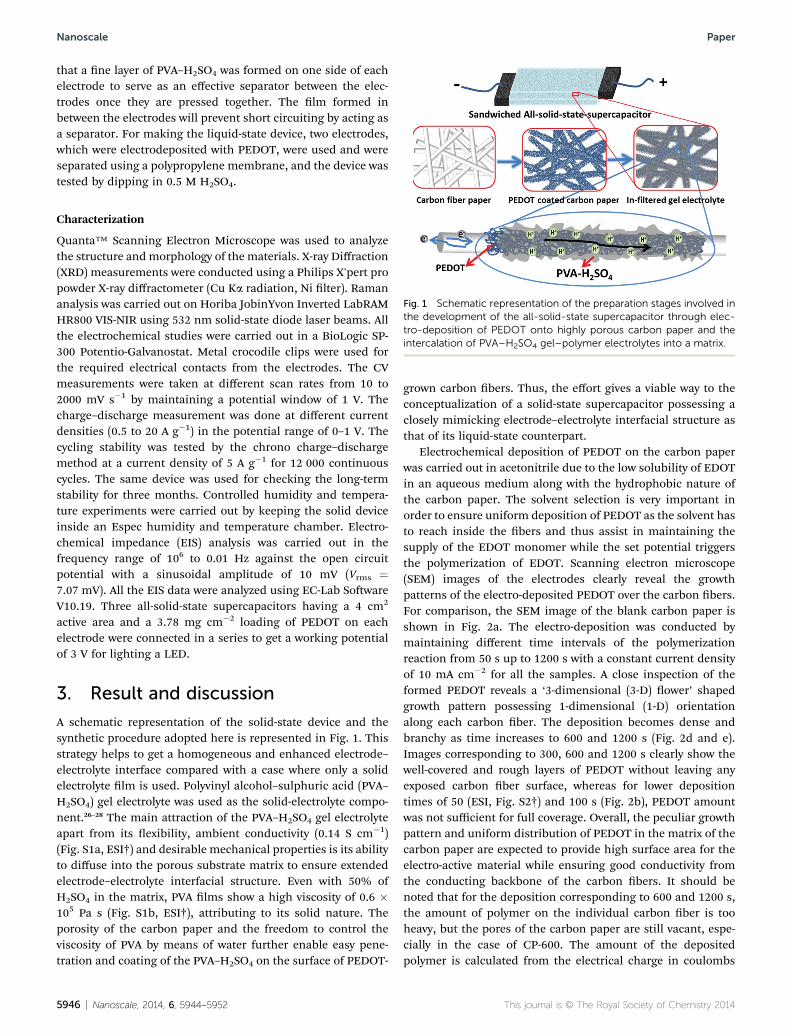
Electrochemical deposition of PEDOT on the carbon paperwas carried out in acetonitrile due to the low solubility of EDOTin an aqueous medium along with the hydrophobic nature ofthe carbon paper. The solvent selection is very important inorder to ensure uniform deposition of PEDOT as the solvent hasto reach inside the bers and thus assist in maintaining thesupply of the EDOT monomer while the set potential triggersthe polymerization of EDOT. Scanning electron microscope(SEM) images of the electrodes clearly reveal the growthpatterns of the electro-deposited PEDOT over the carbon bers.For comparison, the SEM image of the blank carbon paper isshown in Fig. 2a. The electro-deposition was conducted bymaintaining different time intervals of the polymerizationreaction from 50 s up to 1200 s with a constant current densityof 10 mA cm�2 for all the samples. A close inspection of theformed PEDOT reveals a ‘3-dimensional (3-D) ower’ shapedgrowth pattern possessing 1-dimensional (1-D) orientationalong each carbon ber. The deposition becomes dense andbranchy as time increases to 600 and 1200 s (Fig. 2d and e).Images corresponding to 300, 600 and 1200 s clearly show thewell-covered and rough layers of PEDOT without leaving anyexposed carbon ber surface, whereas for lower depositiontimes of 50 (ESI, Fig. S2†) and 100 s (Fig. 2b), PEDOT amountwas not sufficient for full coverage. Overall, the peculiar growthpattern and uniform distribution of PEDOT in the matrix of thecarbon paper are expected to provide high surface area for theelectro-active material while ensuring good conductivity fromthe conducting backbone of the carbon bers. It should benoted that for the deposition corresponding to 600 and 1200 s,the amount of polymer on the individual carbon ber is tooheavy, but the pores of the carbon paper are still vacant, espe-cially in the case of CP-600. The amount of the depositedpolymer is calculated from the electrical charge in coulombs
This journal is © The Royal Society of Chemistry 2014
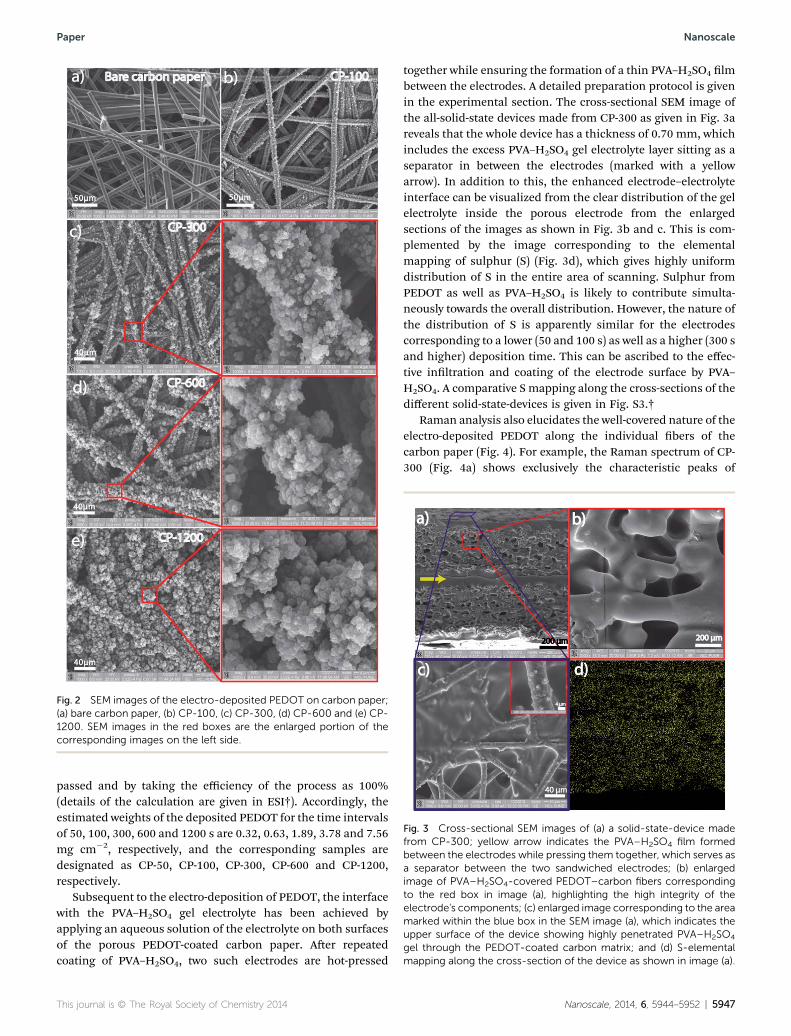
Fig. 2 SEM images of the electro-deposited PEDOT on carbon paper;(a) bare carbon paper, (b) CP-100, (c) CP-300, (d) CP-600 and (e) CP-1200. SEM images in the red boxes are the enlarged portion of thecorresponding images on the left side.
Fig. 3 Cross-sectional SEM images of (a) a solid-state-device madefrom CP-300; yellow arrow indicates the PVA–H2SO4 film formedbetween the electrodes while pressing them together, which serves asa separator between the two sandwiched electrodes; (b) enlargedimage of PVA–H2SO4-covered PEDOT–carbon fibers correspondingto the red box in image (a), highlighting the high integrity of theelectrode's components; (c) enlarged image corresponding to the areamarked within the blue box in the SEM image (a), which indicates theupper surface of the device showing highly penetrated PVA–H2SO4
gel through the PEDOT-coated carbon matrix; and (d) S-elementalmapping along the cross-section of the device as shown in image (a).
Paper Nanoscale
passed and by taking the efficiency of the process as 100%(details of the calculation are given in ESI†). Accordingly, theestimated weights of the deposited PEDOT for the time intervalsof 50, 100, 300, 600 and 1200 s are 0.32, 0.63, 1.89, 3.78 and 7.56mg cm�2, respectively, and the corresponding samples aredesignated as CP-50, CP-100, CP-300, CP-600 and CP-1200,respectively.
Subsequent to the electro-deposition of PEDOT, the interfacewith the PVA–H2SO4 gel electrolyte has been achieved byapplying an aqueous solution of the electrolyte on both surfacesof the porous PEDOT-coated carbon paper. Aer repeatedcoating of PVA–H2SO4, two such electrodes are hot-pressed
This journal is © The Royal Society of Chemistry 2014
together while ensuring the formation of a thin PVA–H2SO4 lmbetween the electrodes. A detailed preparation protocol is givenin the experimental section. The cross-sectional SEM image ofthe all-solid-state devices made from CP-300 as given in Fig. 3areveals that the whole device has a thickness of 0.70 mm, whichincludes the excess PVA–H2SO4 gel electrolyte layer sitting as aseparator in between the electrodes (marked with a yellowarrow). In addition to this, the enhanced electrode–electrolyteinterface can be visualized from the clear distribution of the gelelectrolyte inside the porous electrode from the enlargedsections of the images as shown in Fig. 3b and c. This is com-plemented by the image corresponding to the elementalmapping of sulphur (S) (Fig. 3d), which gives highly uniformdistribution of S in the entire area of scanning. Sulphur fromPEDOT as well as PVA–H2SO4 is likely to contribute simulta-neously towards the overall distribution. However, the nature ofthe distribution of S is apparently similar for the electrodescorresponding to a lower (50 and 100 s) as well as a higher (300 sand higher) deposition time. This can be ascribed to the effec-tive inltration and coating of the electrode surface by PVA–H2SO4. A comparative S mapping along the cross-sections of thedifferent solid-state-devices is given in Fig. S3.†
Raman analysis also elucidates the well-covered nature of theelectro-deposited PEDOT along the individual bers of thecarbon paper (Fig. 4). For example, the Raman spectrum of CP-300 (Fig. 4a) shows exclusively the characteristic peaks of
Nanoscale, 2014, 6, 5944–5952 | 5947
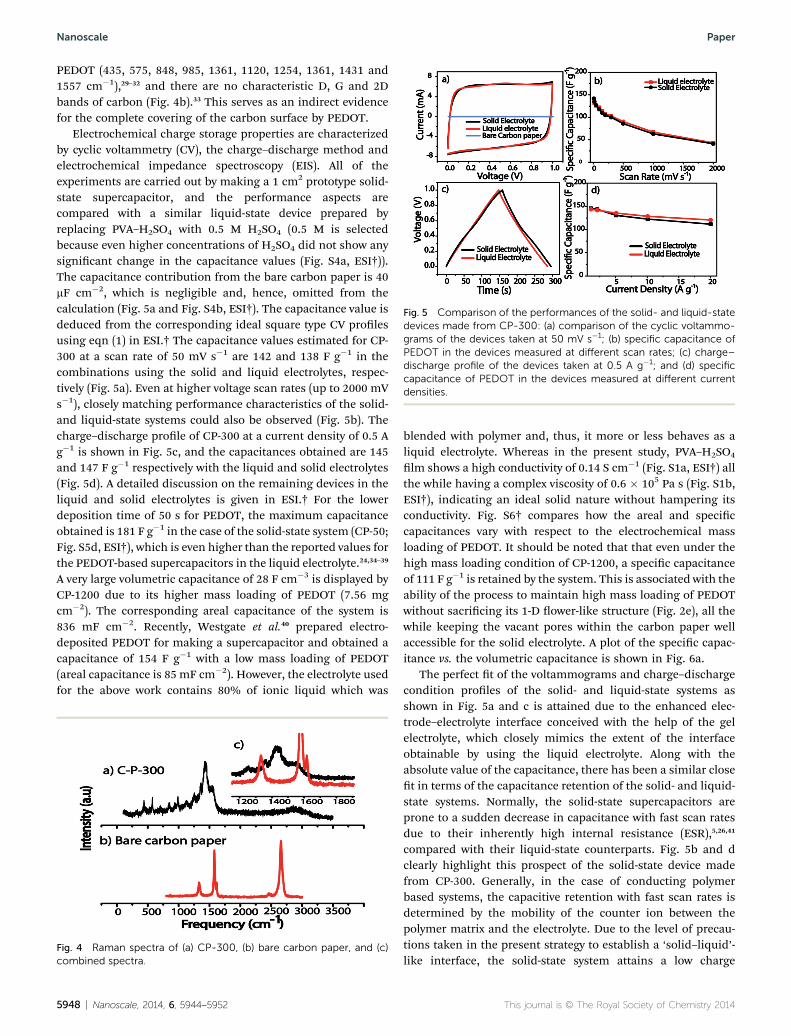
Fig. 5 Comparison of the performances of the solid- and liquid-statedevices made from CP-300: (a) comparison of the cyclic voltammo-grams of the devices taken at 50 mV s�1; (b) specific capacitance ofPEDOT in the devices measured at different scan rates; (c) charge–discharge profile of the devices taken at 0.5 A g�1; and (d) specificcapacitance of PEDOT in the devices measured at different currentdensities.
Nanoscale Paper
PEDOT (435, 575, 848, 985, 1361, 1120, 1254, 1361, 1431 and1557 cm�1),29–32 and there are no characteristic D, G and 2Dbands of carbon (Fig. 4b).33 This serves as an indirect evidencefor the complete covering of the carbon surface by PEDOT.
Electrochemical charge storage properties are characterizedby cyclic voltammetry (CV), the charge–discharge method andelectrochemical impedance spectroscopy (EIS). All of theexperiments are carried out by making a 1 cm2 prototype solid-state supercapacitor, and the performance aspects arecompared with a similar liquid-state device prepared byreplacing PVA–H2SO4 with 0.5 M H2SO4 (0.5 M is selectedbecause even higher concentrations of H2SO4 did not show anysignicant change in the capacitance values (Fig. S4a, ESI†)).The capacitance contribution from the bare carbon paper is 40mF cm�2, which is negligible and, hence, omitted from thecalculation (Fig. 5a and Fig. S4b, ESI†). The capacitance value isdeduced from the corresponding ideal square type CV prolesusing eqn (1) in ESI.† The capacitance values estimated for CP-300 at a scan rate of 50 mV s�1 are 142 and 138 F g�1 in thecombinations using the solid and liquid electrolytes, respec-tively (Fig. 5a). Even at higher voltage scan rates (up to 2000 mVs�1), closely matching performance characteristics of the solid-and liquid-state systems could also be observed (Fig. 5b). Thecharge–discharge prole of CP-300 at a current density of 0.5 Ag�1 is shown in Fig. 5c, and the capacitances obtained are 145and 147 F g�1 respectively with the liquid and solid electrolytes(Fig. 5d). A detailed discussion on the remaining devices in theliquid and solid electrolytes is given in ESI.† For the lowerdeposition time of 50 s for PEDOT, the maximum capacitanceobtained is 181 F g�1 in the case of the solid-state system (CP-50;Fig. S5d, ESI†), which is even higher than the reported values forthe PEDOT-based supercapacitors in the liquid electrolyte.24,34–39
A very large volumetric capacitance of 28 F cm�3 is displayed byCP-1200 due to its higher mass loading of PEDOT (7.56 mgcm�2). The corresponding areal capacitance of the system is836 mF cm�2. Recently, Westgate et al.40 prepared electro-deposited PEDOT for making a supercapacitor and obtained acapacitance of 154 F g�1 with a low mass loading of PEDOT(areal capacitance is 85 mF cm�2). However, the electrolyte usedfor the above work contains 80% of ionic liquid which was
Fig. 4 Raman spectra of (a) CP-300, (b) bare carbon paper, and (c)combined spectra.
5948 | Nanoscale, 2014, 6, 5944–5952
blended with polymer and, thus, it more or less behaves as aliquid electrolyte. Whereas in the present study, PVA–H2SO4
lm shows a high conductivity of 0.14 S cm�1 (Fig. S1a, ESI†) allthe while having a complex viscosity of 0.6 � 105 Pa s (Fig. S1b,ESI†), indicating an ideal solid nature without hampering itsconductivity. Fig. S6† compares how the areal and speciccapacitances vary with respect to the electrochemical massloading of PEDOT. It should be noted that that even under thehigh mass loading condition of CP-1200, a specic capacitanceof 111 F g�1 is retained by the system. This is associated with theability of the process to maintain high mass loading of PEDOTwithout sacricing its 1-D ower-like structure (Fig. 2e), all thewhile keeping the vacant pores within the carbon paper wellaccessible for the solid electrolyte. A plot of the specic capac-itance vs. the volumetric capacitance is shown in Fig. 6a.
The perfect t of the voltammograms and charge–dischargecondition proles of the solid- and liquid-state systems asshown in Fig. 5a and c is attained due to the enhanced elec-trode–electrolyte interface conceived with the help of the gelelectrolyte, which closely mimics the extent of the interfaceobtainable by using the liquid electrolyte. Along with theabsolute value of the capacitance, there has been a similar closet in terms of the capacitance retention of the solid- and liquid-state systems. Normally, the solid-state supercapacitors areprone to a sudden decrease in capacitance with fast scan ratesdue to their inherently high internal resistance (ESR),5,26,41
compared with their liquid-state counterparts. Fig. 5b and dclearly highlight this prospect of the solid-state device madefrom CP-300. Generally, in the case of conducting polymerbased systems, the capacitive retention with fast scan rates isdetermined by the mobility of the counter ion between thepolymer matrix and the electrolyte. Due to the level of precau-tions taken in the present strategy to establish a ‘solid–liquid’-like interface, the solid-state system attains a low charge
This journal is © The Royal Society of Chemistry 2014
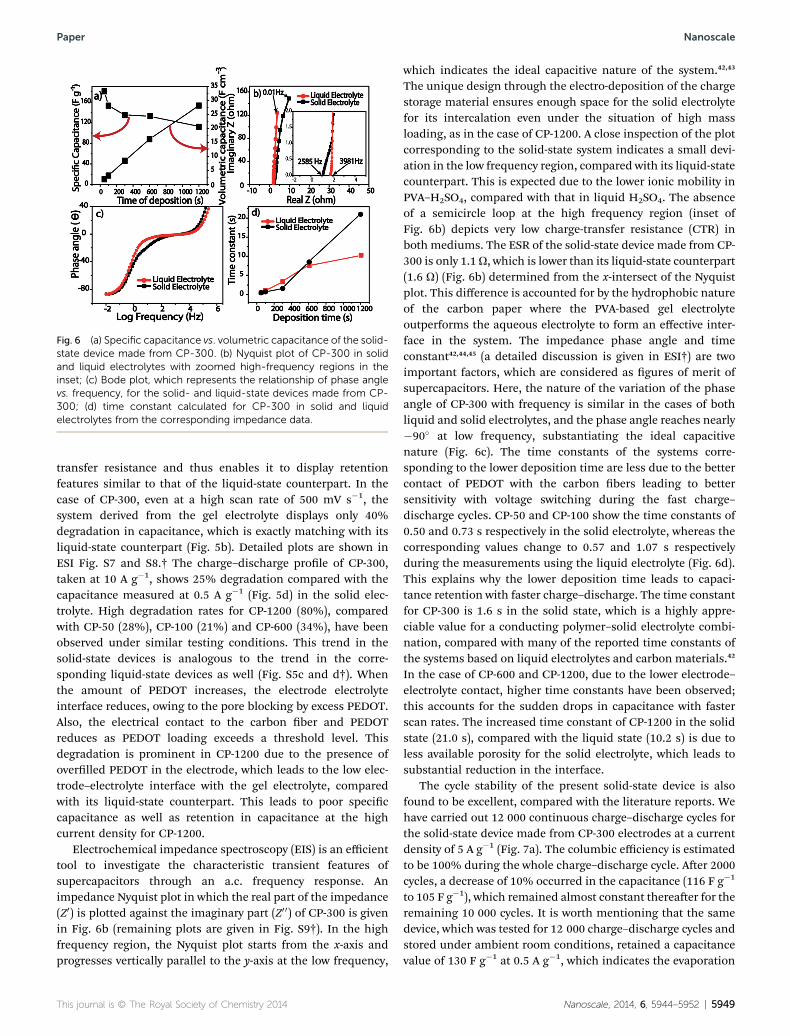
Fig. 6 (a) Specific capacitance vs. volumetric capacitance of the solid-state device made from CP-300. (b) Nyquist plot of CP-300 in solidand liquid electrolytes with zoomed high-frequency regions in theinset; (c) Bode plot, which represents the relationship of phase anglevs. frequency, for the solid- and liquid-state devices made from CP-300; (d) time constant calculated for CP-300 in solid and liquidelectrolytes from the corresponding impedance data.
Paper Nanoscale
transfer resistance and thus enables it to display retentionfeatures similar to that of the liquid-state counterpart. In thecase of CP-300, even at a high scan rate of 500 mV s�1, thesystem derived from the gel electrolyte displays only 40%degradation in capacitance, which is exactly matching with itsliquid-state counterpart (Fig. 5b). Detailed plots are shown inESI Fig. S7 and S8.† The charge–discharge prole of CP-300,taken at 10 A g�1, shows 25% degradation compared with thecapacitance measured at 0.5 A g�1 (Fig. 5d) in the solid elec-trolyte. High degradation rates for CP-1200 (80%), comparedwith CP-50 (28%), CP-100 (21%) and CP-600 (34%), have beenobserved under similar testing conditions. This trend in thesolid-state devices is analogous to the trend in the corre-sponding liquid-state devices as well (Fig. S5c and d†). Whenthe amount of PEDOT increases, the electrode electrolyteinterface reduces, owing to the pore blocking by excess PEDOT.Also, the electrical contact to the carbon ber and PEDOTreduces as PEDOT loading exceeds a threshold level. Thisdegradation is prominent in CP-1200 due to the presence ofoverlled PEDOT in the electrode, which leads to the low elec-trode–electrolyte interface with the gel electrolyte, comparedwith its liquid-state counterpart. This leads to poor speciccapacitance as well as retention in capacitance at the highcurrent density for CP-1200.
Electrochemical impedance spectroscopy (EIS) is an efficienttool to investigate the characteristic transient features ofsupercapacitors through an a.c. frequency response. Animpedance Nyquist plot in which the real part of the impedance(Z0) is plotted against the imaginary part (Z0 0) of CP-300 is givenin Fig. 6b (remaining plots are given in Fig. S9†). In the highfrequency region, the Nyquist plot starts from the x-axis andprogresses vertically parallel to the y-axis at the low frequency,
This journal is © The Royal Society of Chemistry 2014
which indicates the ideal capacitive nature of the system.42,43
The unique design through the electro-deposition of the chargestorage material ensures enough space for the solid electrolytefor its intercalation even under the situation of high massloading, as in the case of CP-1200. A close inspection of the plotcorresponding to the solid-state system indicates a small devi-ation in the low frequency region, compared with its liquid-statecounterpart. This is expected due to the lower ionic mobility inPVA–H2SO4, compared with that in liquid H2SO4. The absenceof a semicircle loop at the high frequency region (inset ofFig. 6b) depicts very low charge-transfer resistance (CTR) inboth mediums. The ESR of the solid-state device made from CP-300 is only 1.1U, which is lower than its liquid-state counterpart(1.6 U) (Fig. 6b) determined from the x-intersect of the Nyquistplot. This difference is accounted for by the hydrophobic natureof the carbon paper where the PVA-based gel electrolyteoutperforms the aqueous electrolyte to form an effective inter-face in the system. The impedance phase angle and timeconstant42,44,45 (a detailed discussion is given in ESI†) are twoimportant factors, which are considered as gures of merit ofsupercapacitors. Here, the nature of the variation of the phaseangle of CP-300 with frequency is similar in the cases of bothliquid and solid electrolytes, and the phase angle reaches nearly�90� at low frequency, substantiating the ideal capacitivenature (Fig. 6c). The time constants of the systems corre-sponding to the lower deposition time are less due to the bettercontact of PEDOT with the carbon bers leading to bettersensitivity with voltage switching during the fast charge–discharge cycles. CP-50 and CP-100 show the time constants of0.50 and 0.73 s respectively in the solid electrolyte, whereas thecorresponding values change to 0.57 and 1.07 s respectivelyduring the measurements using the liquid electrolyte (Fig. 6d).This explains why the lower deposition time leads to capaci-tance retention with faster charge–discharge. The time constantfor CP-300 is 1.6 s in the solid state, which is a highly appre-ciable value for a conducting polymer–solid electrolyte combi-nation, compared with many of the reported time constants ofthe systems based on liquid electrolytes and carbon materials.42
In the case of CP-600 and CP-1200, due to the lower electrode–electrolyte contact, higher time constants have been observed;this accounts for the sudden drops in capacitance with fasterscan rates. The increased time constant of CP-1200 in the solidstate (21.0 s), compared with the liquid state (10.2 s) is due toless available porosity for the solid electrolyte, which leads tosubstantial reduction in the interface.
The cycle stability of the present solid-state device is alsofound to be excellent, compared with the literature reports. Wehave carried out 12 000 continuous charge–discharge cycles forthe solid-state device made from CP-300 electrodes at a currentdensity of 5 A g�1 (Fig. 7a). The columbic efficiency is estimatedto be 100% during the whole charge–discharge cycle. Aer 2000cycles, a decrease of 10% occurred in the capacitance (116 F g�1
to 105 F g�1), which remained almost constant thereaer for theremaining 10 000 cycles. It is worth mentioning that the samedevice, which was tested for 12 000 charge–discharge cycles andstored under ambient room conditions, retained a capacitancevalue of 130 F g�1 at 0.5 A g�1, which indicates the evaporation
Nanoscale, 2014, 6, 5944–5952 | 5949
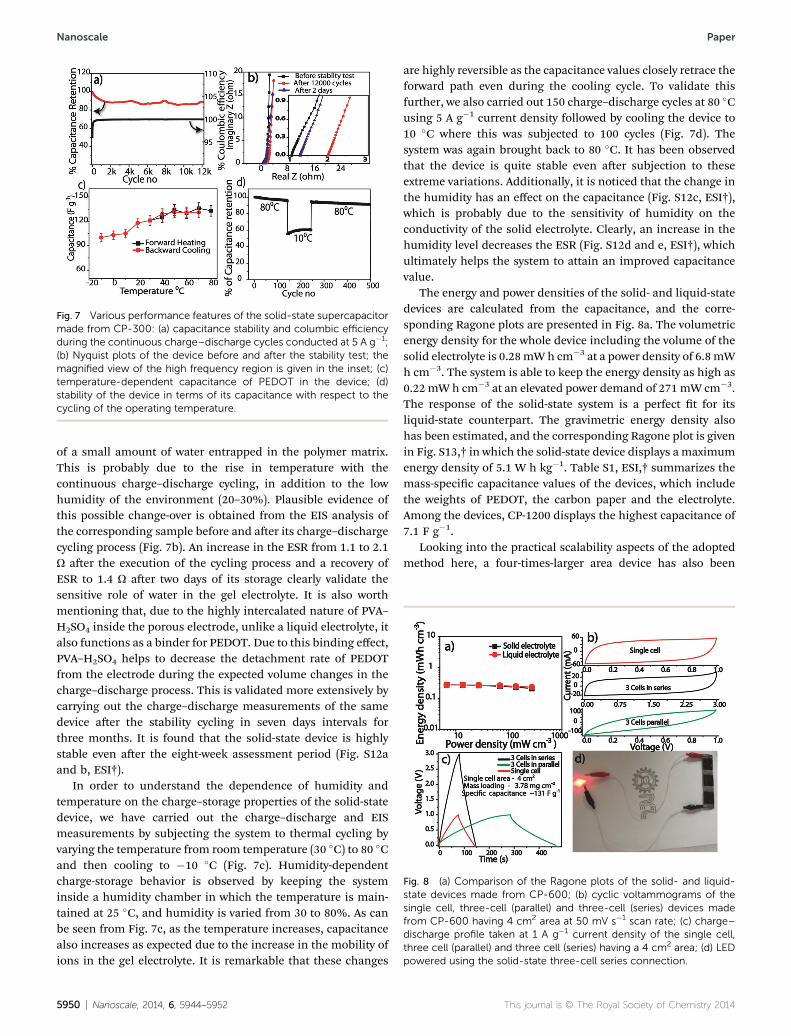
Fig. 7 Various performance features of the solid-state supercapacitormade from CP-300: (a) capacitance stability and columbic efficiencyduring the continuous charge–discharge cycles conducted at 5 A g�1;(b) Nyquist plots of the device before and after the stability test; themagnified view of the high frequency region is given in the inset; (c)temperature-dependent capacitance of PEDOT in the device; (d)stability of the device in terms of its capacitance with respect to thecycling of the operating temperature.
Fig. 8 (a) Comparison of the Ragone plots of the solid- and liquid-state devices made from CP-600; (b) cyclic voltammograms of thesingle cell, three-cell (parallel) and three-cell (series) devices madefrom CP-600 having 4 cm2 area at 50 mV s�1 scan rate; (c) charge–discharge profile taken at 1 A g�1 current density of the single cell,three cell (parallel) and three cell (series) having a 4 cm2 area; (d) LEDpowered using the solid-state three-cell series connection.
Nanoscale Paper
of a small amount of water entrapped in the polymer matrix.This is probably due to the rise in temperature with thecontinuous charge–discharge cycling, in addition to the lowhumidity of the environment (20–30%). Plausible evidence ofthis possible change-over is obtained from the EIS analysis ofthe corresponding sample before and aer its charge–dischargecycling process (Fig. 7b). An increase in the ESR from 1.1 to 2.1U aer the execution of the cycling process and a recovery ofESR to 1.4 U aer two days of its storage clearly validate thesensitive role of water in the gel electrolyte. It is also worthmentioning that, due to the highly intercalated nature of PVA–H2SO4 inside the porous electrode, unlike a liquid electrolyte, italso functions as a binder for PEDOT. Due to this binding effect,PVA–H2SO4 helps to decrease the detachment rate of PEDOTfrom the electrode during the expected volume changes in thecharge–discharge process. This is validated more extensively bycarrying out the charge–discharge measurements of the samedevice aer the stability cycling in seven days intervals forthree months. It is found that the solid-state device is highlystable even aer the eight-week assessment period (Fig. S12aand b, ESI†).
In order to understand the dependence of humidity andtemperature on the charge–storage properties of the solid-statedevice, we have carried out the charge–discharge and EISmeasurements by subjecting the system to thermal cycling byvarying the temperature from room temperature (30 �C) to 80 �Cand then cooling to �10 �C (Fig. 7c). Humidity-dependentcharge-storage behavior is observed by keeping the systeminside a humidity chamber in which the temperature is main-tained at 25 �C, and humidity is varied from 30 to 80%. As canbe seen from Fig. 7c, as the temperature increases, capacitancealso increases as expected due to the increase in the mobility ofions in the gel electrolyte. It is remarkable that these changes
5950 | Nanoscale, 2014, 6, 5944–5952
are highly reversible as the capacitance values closely retrace theforward path even during the cooling cycle. To validate thisfurther, we also carried out 150 charge–discharge cycles at 80 �Cusing 5 A g�1 current density followed by cooling the device to10 �C where this was subjected to 100 cycles (Fig. 7d). Thesystem was again brought back to 80 �C. It has been observedthat the device is quite stable even aer subjection to theseextreme variations. Additionally, it is noticed that the change inthe humidity has an effect on the capacitance (Fig. S12c, ESI†),which is probably due to the sensitivity of humidity on theconductivity of the solid electrolyte. Clearly, an increase in thehumidity level decreases the ESR (Fig. S12d and e, ESI†), whichultimately helps the system to attain an improved capacitancevalue.
The energy and power densities of the solid- and liquid-statedevices are calculated from the capacitance, and the corre-sponding Ragone plots are presented in Fig. 8a. The volumetricenergy density for the whole device including the volume of thesolid electrolyte is 0.28mWh cm�3 at a power density of 6.8 mWh cm�3. The system is able to keep the energy density as high as0.22 mWh cm�3 at an elevated power demand of 271 mW cm�3.The response of the solid-state system is a perfect t for itsliquid-state counterpart. The gravimetric energy density alsohas been estimated, and the corresponding Ragone plot is givenin Fig. S13,† in which the solid-state device displays a maximumenergy density of 5.1 W h kg�1. Table S1, ESI,† summarizes themass-specic capacitance values of the devices, which includethe weights of PEDOT, the carbon paper and the electrolyte.Among the devices, CP-1200 displays the highest capacitance of7.1 F g�1.
Looking into the practical scalability aspects of the adoptedmethod here, a four-times-larger area device has also been
This journal is © The Royal Society of Chemistry 2014
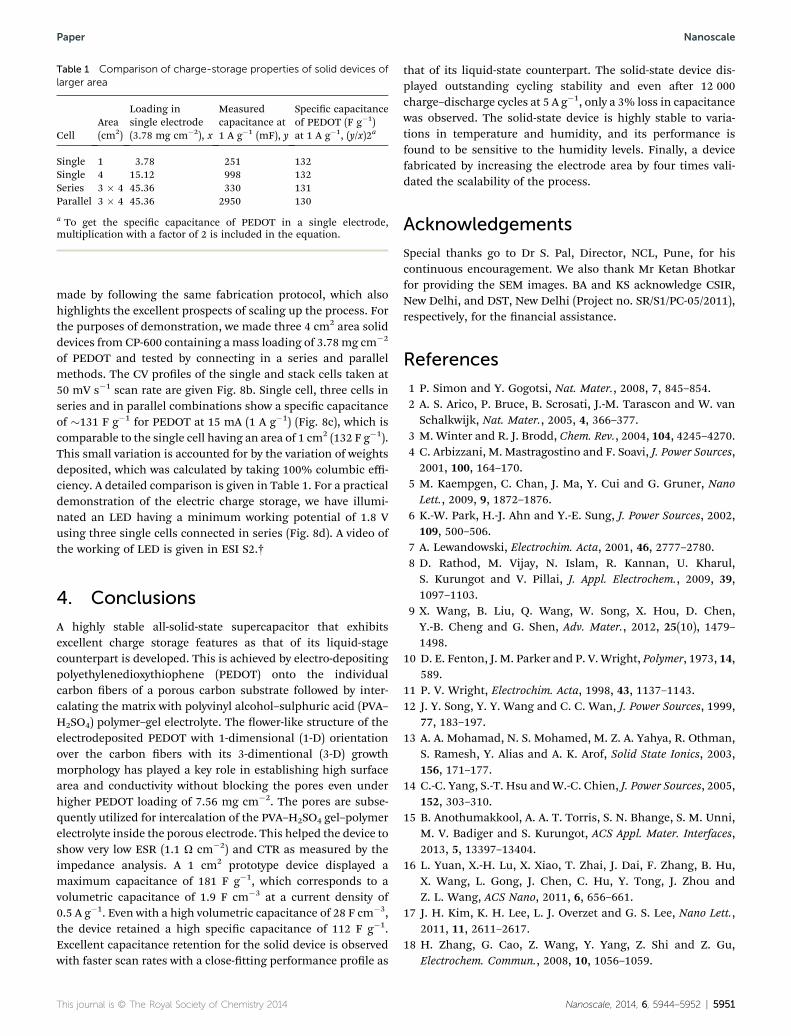
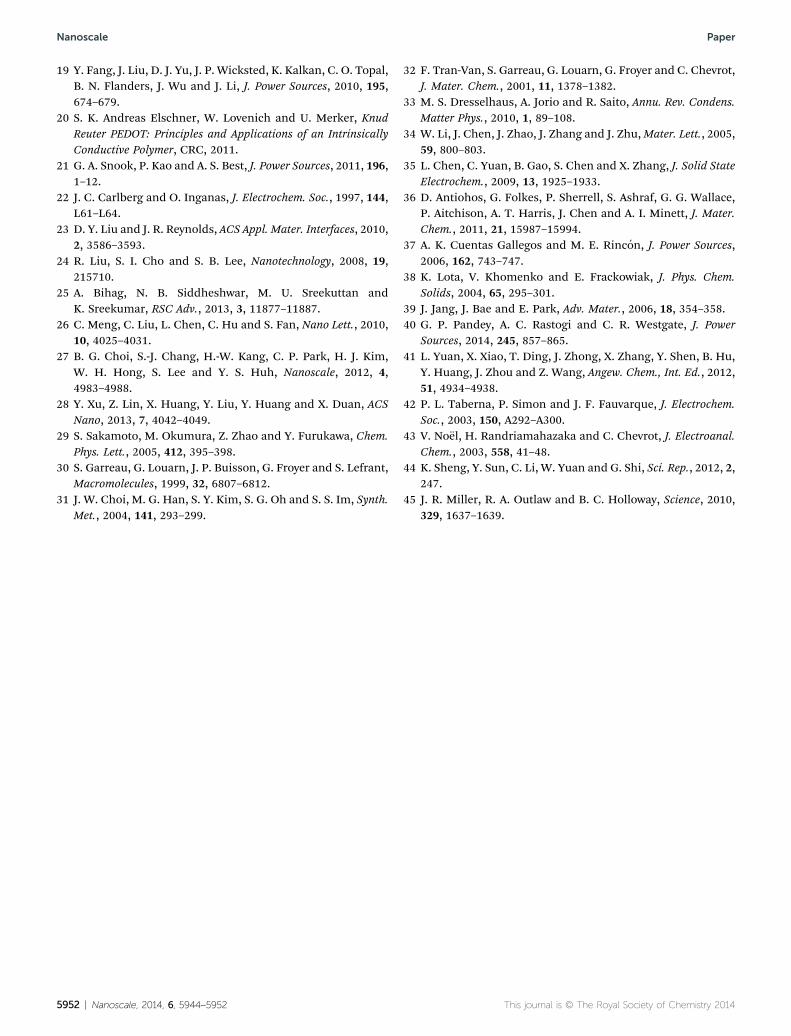
Table 1 Comparison of charge-storage properties of solid devices oflarger area
CellArea(cm2)
Loading insingle electrode(3.78 mg cm�2), x
Measuredcapacitance at1 A g�1 (mF), y
Specic capacitanceof PEDOT (F g�1)at 1 A g�1, (y/x)2a
Single 1 3.78 251 132Single 4 15.12 998 132Series 3 � 4 45.36 330 131Parallel 3 � 4 45.36 2950 130
a To get the specic capacitance of PEDOT in a single electrode,multiplication with a factor of 2 is included in the equation.
Paper Nanoscale
made by following the same fabrication protocol, which alsohighlights the excellent prospects of scaling up the process. Forthe purposes of demonstration, we made three 4 cm2 area soliddevices from CP-600 containing amass loading of 3.78 mg cm�2
of PEDOT and tested by connecting in a series and parallelmethods. The CV proles of the single and stack cells taken at50 mV s�1 scan rate are given Fig. 8b. Single cell, three cells inseries and in parallel combinations show a specic capacitanceof �131 F g�1 for PEDOT at 15 mA (1 A g�1) (Fig. 8c), which iscomparable to the single cell having an area of 1 cm2 (132 F g�1).This small variation is accounted for by the variation of weightsdeposited, which was calculated by taking 100% columbic effi-ciency. A detailed comparison is given in Table 1. For a practicaldemonstration of the electric charge storage, we have illumi-nated an LED having a minimum working potential of 1.8 Vusing three single cells connected in series (Fig. 8d). A video ofthe working of LED is given in ESI S2.†
4. Conclusions
A highly stable all-solid-state supercapacitor that exhibitsexcellent charge storage features as that of its liquid-stagecounterpart is developed. This is achieved by electro-depositingpolyethylenedioxythiophene (PEDOT) onto the individualcarbon bers of a porous carbon substrate followed by inter-calating the matrix with polyvinyl alcohol–sulphuric acid (PVA–H2SO4) polymer–gel electrolyte. The ower-like structure of theelectrodeposited PEDOT with 1-dimensional (1-D) orientationover the carbon bers with its 3-dimentional (3-D) growthmorphology has played a key role in establishing high surfacearea and conductivity without blocking the pores even underhigher PEDOT loading of 7.56 mg cm�2. The pores are subse-quently utilized for intercalation of the PVA–H2SO4 gel–polymerelectrolyte inside the porous electrode. This helped the device toshow very low ESR (1.1 U cm�2) and CTR as measured by theimpedance analysis. A 1 cm2 prototype device displayed amaximum capacitance of 181 F g�1, which corresponds to avolumetric capacitance of 1.9 F cm�3 at a current density of0.5 A g�1. Even with a high volumetric capacitance of 28 F cm�3,the device retained a high specic capacitance of 112 F g�1.Excellent capacitance retention for the solid device is observedwith faster scan rates with a close-tting performance prole as
This journal is © The Royal Society of Chemistry 2014
that of its liquid-state counterpart. The solid-state device dis-played outstanding cycling stability and even aer 12 000charge–discharge cycles at 5 A g�1, only a 3% loss in capacitancewas observed. The solid-state device is highly stable to varia-tions in temperature and humidity, and its performance isfound to be sensitive to the humidity levels. Finally, a devicefabricated by increasing the electrode area by four times vali-dated the scalability of the process.
Acknowledgements
Special thanks go to Dr S. Pal, Director, NCL, Pune, for hiscontinuous encouragement. We also thank Mr Ketan Bhotkarfor providing the SEM images. BA and KS acknowledge CSIR,New Delhi, and DST, New Delhi (Project no. SR/S1/PC-05/2011),respectively, for the nancial assistance.
References
1 P. Simon and Y. Gogotsi, Nat. Mater., 2008, 7, 845–854.2 A. S. Arico, P. Bruce, B. Scrosati, J.-M. Tarascon and W. vanSchalkwijk, Nat. Mater., 2005, 4, 366–377.
3 M. Winter and R. J. Brodd, Chem. Rev., 2004, 104, 4245–4270.4 C. Arbizzani, M. Mastragostino and F. Soavi, J. Power Sources,2001, 100, 164–170.
5 M. Kaempgen, C. Chan, J. Ma, Y. Cui and G. Gruner, NanoLett., 2009, 9, 1872–1876.
6 K.-W. Park, H.-J. Ahn and Y.-E. Sung, J. Power Sources, 2002,109, 500–506.
7 A. Lewandowski, Electrochim. Acta, 2001, 46, 2777–2780.8 D. Rathod, M. Vijay, N. Islam, R. Kannan, U. Kharul,S. Kurungot and V. Pillai, J. Appl. Electrochem., 2009, 39,1097–1103.
9 X. Wang, B. Liu, Q. Wang, W. Song, X. Hou, D. Chen,Y.-B. Cheng and G. Shen, Adv. Mater., 2012, 25(10), 1479–1498.
10 D. E. Fenton, J. M. Parker and P. V. Wright, Polymer, 1973, 14,589.
11 P. V. Wright, Electrochim. Acta, 1998, 43, 1137–1143.12 J. Y. Song, Y. Y. Wang and C. C. Wan, J. Power Sources, 1999,
77, 183–197.13 A. A. Mohamad, N. S. Mohamed, M. Z. A. Yahya, R. Othman,
S. Ramesh, Y. Alias and A. K. Arof, Solid State Ionics, 2003,156, 171–177.
14 C.-C. Yang, S.-T. Hsu andW.-C. Chien, J. Power Sources, 2005,152, 303–310.
15 B. Anothumakkool, A. A. T. Torris, S. N. Bhange, S. M. Unni,M. V. Badiger and S. Kurungot, ACS Appl. Mater. Interfaces,2013, 5, 13397–13404.
16 L. Yuan, X.-H. Lu, X. Xiao, T. Zhai, J. Dai, F. Zhang, B. Hu,X. Wang, L. Gong, J. Chen, C. Hu, Y. Tong, J. Zhou andZ. L. Wang, ACS Nano, 2011, 6, 656–661.
17 J. H. Kim, K. H. Lee, L. J. Overzet and G. S. Lee, Nano Lett.,2011, 11, 2611–2617.
18 H. Zhang, G. Cao, Z. Wang, Y. Yang, Z. Shi and Z. Gu,Electrochem. Commun., 2008, 10, 1056–1059.
Nanoscale, 2014, 6, 5944–5952 | 5951
Nanoscale Paper
19 Y. Fang, J. Liu, D. J. Yu, J. P. Wicksted, K. Kalkan, C. O. Topal,B. N. Flanders, J. Wu and J. Li, J. Power Sources, 2010, 195,674–679.
20 S. K. Andreas Elschner, W. Lovenich and U. Merker, KnudReuter PEDOT: Principles and Applications of an IntrinsicallyConductive Polymer, CRC, 2011.
21 G. A. Snook, P. Kao and A. S. Best, J. Power Sources, 2011, 196,1–12.
22 J. C. Carlberg and O. Inganas, J. Electrochem. Soc., 1997, 144,L61–L64.
23 D. Y. Liu and J. R. Reynolds, ACS Appl. Mater. Interfaces, 2010,2, 3586–3593.
24 R. Liu, S. I. Cho and S. B. Lee, Nanotechnology, 2008, 19,215710.
25 A. Bihag, N. B. Siddheshwar, M. U. Sreekuttan andK. Sreekumar, RSC Adv., 2013, 3, 11877–11887.
26 C. Meng, C. Liu, L. Chen, C. Hu and S. Fan, Nano Lett., 2010,10, 4025–4031.
27 B. G. Choi, S.-J. Chang, H.-W. Kang, C. P. Park, H. J. Kim,W. H. Hong, S. Lee and Y. S. Huh, Nanoscale, 2012, 4,4983–4988.
28 Y. Xu, Z. Lin, X. Huang, Y. Liu, Y. Huang and X. Duan, ACSNano, 2013, 7, 4042–4049.
29 S. Sakamoto, M. Okumura, Z. Zhao and Y. Furukawa, Chem.Phys. Lett., 2005, 412, 395–398.
30 S. Garreau, G. Louarn, J. P. Buisson, G. Froyer and S. Lefrant,Macromolecules, 1999, 32, 6807–6812.
31 J. W. Choi, M. G. Han, S. Y. Kim, S. G. Oh and S. S. Im, Synth.Met., 2004, 141, 293–299.
5952 | Nanoscale, 2014, 6, 5944–5952
32 F. Tran-Van, S. Garreau, G. Louarn, G. Froyer and C. Chevrot,J. Mater. Chem., 2001, 11, 1378–1382.
33 M. S. Dresselhaus, A. Jorio and R. Saito, Annu. Rev. Condens.Matter Phys., 2010, 1, 89–108.
34 W. Li, J. Chen, J. Zhao, J. Zhang and J. Zhu,Mater. Lett., 2005,59, 800–803.
35 L. Chen, C. Yuan, B. Gao, S. Chen and X. Zhang, J. Solid StateElectrochem., 2009, 13, 1925–1933.
36 D. Antiohos, G. Folkes, P. Sherrell, S. Ashraf, G. G. Wallace,P. Aitchison, A. T. Harris, J. Chen and A. I. Minett, J. Mater.Chem., 2011, 21, 15987–15994.
37 A. K. Cuentas Gallegos and M. E. Rincon, J. Power Sources,2006, 162, 743–747.
38 K. Lota, V. Khomenko and E. Frackowiak, J. Phys. Chem.Solids, 2004, 65, 295–301.
39 J. Jang, J. Bae and E. Park, Adv. Mater., 2006, 18, 354–358.40 G. P. Pandey, A. C. Rastogi and C. R. Westgate, J. Power
Sources, 2014, 245, 857–865.41 L. Yuan, X. Xiao, T. Ding, J. Zhong, X. Zhang, Y. Shen, B. Hu,
Y. Huang, J. Zhou and Z. Wang, Angew. Chem., Int. Ed., 2012,51, 4934–4938.
42 P. L. Taberna, P. Simon and J. F. Fauvarque, J. Electrochem.Soc., 2003, 150, A292–A300.
43 V. Noel, H. Randriamahazaka and C. Chevrot, J. Electroanal.Chem., 2003, 558, 41–48.
44 K. Sheng, Y. Sun, C. Li, W. Yuan and G. Shi, Sci. Rep., 2012, 2,247.
45 J. R. Miller, R. A. Outlaw and B. C. Holloway, Science, 2010,329, 1637–1639.
This journal is © The Royal Society of Chemistry 2014