Electrochemical Characterization of Chemically Synthesized Polythiophene Thin Films: Performance of...
11
DOI: 10.1002/elan.201400284 Electrochemical Characterization of Chemically Synthesized Polythiophene Thin Films: Performance of Asymmetric Supercapacitor Device B. H. Patil, [a] S. J. Patil, [a] and C. D. Lokhande* [a] 1 Introduction Among all energy storage devices, supercapacitor gath- ered the attention for applications that demand high power levels [1]. Supercapacitors bridge the gap between the conventional capacitors and batteries. Among all the supercapacitive materials investigated, conducting poly- mers are the most promising as they possess redox pseu- docapacitance in addition to double-layer capacitance. Conducting polymers offer the advantages of low produc- tion cost compared with noble metal oxides and high charge storage capacity compared with activated carbons [2]. Conducting polymers generally offer three important properties: (i) high specific capacitance, due to the in- volvement of whole polymer mass in the charging pro- cess; (ii) high conductivity in the doped state and (iii) fast charge/discharge electron-transfer kinetics [3]. The con- ducting polymers such as polyaniline (PANI) [4], polypyr- role (PPy) [5] and polythiophene (PT) [6] have showed supercapacitor properties. Among these, PT is important to its environmental stability, high electrical conductivity and electrochemical properties. The stability of PT in the oxidized form, its high conductivity and an interesting electrochemical behavior allows this material to use as a electrode material for electrochemical supercapacitors [7]. PT has been synthesized in the bulk as well as in thin film form by different physical and chemical methods. Fu et al. [8] reported the specific capacitance 110 F g 1 for the electrodeposited PT thin film. Earlier, we have re- ported the maximum specific capacitance of 252 F g 1 for PT thin film deposited by successive ionic layer adsorp- tion and reaction (SILAR) method [6]. In the literature, polythiophene is synthesized using dif- ferent methods such as chemical, electrochemical, ultra- sonic assisted electrochemical, photoelctrochemical and template synthesis using non-aqueous medium. The at- mospheres like argon, nitrogen, etc. are used for the syn- thesis of polythiophene because, the presence of inert sulfur atom in thiophene increases the oxidation potential and has poor stability in air, which makes the preparation of polythiophene more difficult. However, in present work, polythiophene is easily synthesized using simple chemical method in air atmosphere and in an aqueous medium. Also, there are no reports on the pure polythio- phene based asymmetric supercapacitor devices. In the literature, the asymmetric devices are fabricated using the derivatives of polythiophene than the pure polythiophene. In the present work, for the first time, chemical synthesis of PT thin films is carried out from aqueous bath at room temperature (300 K). This synthesis route does not in- volve any expensive apparatus. The microstructure as well as electrochemical properties of PT electrode is in- vestigated. The electrochemical properties of the PT elec- trode are evaluated using cyclic voltammetry (CV), galva- nostatic charge-discharge and electrochemical impedance spectroscopic (EIS) techniques. Further, the performance evaluation of asymmetric supercapacitor PT/graphite device is carried out. [a] B. H. Patil, S. J. Patil, C. D. Lokhande Thin Film Physics Laboratory, Department of Physics, Shivaji University Kolhapur-416004 (M. S.) India tel. + 91 231 2609225, fax: + 91 231 26092333 *e-mail: [email protected] Abstract : Polythiophene (PT) thin films have been pre- pared by chemical bath deposition (CBD) method at room temperature (300 K) via oxidative polymerization of thiophene using ammonium peroxodisulfate (APS) as an oxidizing agent. Globular particulates of PT are depos- ited on the stainless steel and glass substrates. The mor- phology and chain structure of PT are studied using scan- ning electron microscopy (SEM) and Raman spectrosco- py techniques, respectively. The electrochemical behavior of PT electrode is studied using cyclic voltammetry and galvanostatic charge discharge studies. PT thin film shows maximum specific capacitance of 300 F g 1 at 5 mV s 1 in 0.1 M LiClO 4 /PC electrolyte. The asymmetric device formed with PT and graphite shows supercapaci- tive properties useful in the power applications. Keywords: Conducting polymers · Polythiophene · Thin films · Supercapacitor www.electroanalysis.wiley-vch.de # 2014 Wiley-VCH Verlag GmbH & Co. KGaA, Weinheim Electroanalysis 2014, 26, 1 – 11 &1& These are not the final page numbers! ÞÞ Full Paper 1 1 2 2 3 3 4 4 5 5 6 6 7 7 8 8 9 9 10 10 11 11 12 12 13 13 14 14 15 15 16 16 17 17 18 18 19 19 20 20 21 21 22 22 23 23 24 24 25 25 26 26 27 27 28 28 29 29 30 30 31 31 32 32 33 33 34 34 35 35 36 36 37 37 38 38 39 39 40 40 41 41 42 42 43 43 44 44 45 45 46 46 47 47 48 48 49 49 50 50 51 51 52 52 53 53 54 54 55 55 56 56 57 57 58 58
-
Upload
independent -
Category
Documents
-
view
0 -
download
0
Transcript of Electrochemical Characterization of Chemically Synthesized Polythiophene Thin Films: Performance of...

DOI: 10.1002/elan.201400284
Electrochemical Characterization of ChemicallySynthesized Polythiophene Thin Films: Performance ofAsymmetric Supercapacitor DeviceB. H. Patil,[a] S. J. Patil,[a] and C. D. Lokhande*[a]
1 Introduction
Among all energy storage devices, supercapacitor gath-ered the attention for applications that demand highpower levels [1]. Supercapacitors bridge the gap betweenthe conventional capacitors and batteries. Among all thesupercapacitive materials investigated, conducting poly-mers are the most promising as they possess redox pseu-docapacitance in addition to double-layer capacitance.Conducting polymers offer the advantages of low produc-tion cost compared with noble metal oxides and highcharge storage capacity compared with activated carbons[2]. Conducting polymers generally offer three importantproperties: (i) high specific capacitance, due to the in-volvement of whole polymer mass in the charging pro-cess; (ii) high conductivity in the doped state and (iii) fastcharge/discharge electron-transfer kinetics [3]. The con-ducting polymers such as polyaniline (PANI) [4], polypyr-role (PPy) [5] and polythiophene (PT) [6] have showedsupercapacitor properties. Among these, PT is importantto its environmental stability, high electrical conductivityand electrochemical properties. The stability of PT in theoxidized form, its high conductivity and an interestingelectrochemical behavior allows this material to use asa electrode material for electrochemical supercapacitors[7]. PT has been synthesized in the bulk as well as in thinfilm form by different physical and chemical methods. Fuet al. [8] reported the specific capacitance 110 Fg�1 forthe electrodeposited PT thin film. Earlier, we have re-ported the maximum specific capacitance of 252 Fg�1 forPT thin film deposited by successive ionic layer adsorp-tion and reaction (SILAR) method [6].
In the literature, polythiophene is synthesized using dif-ferent methods such as chemical, electrochemical, ultra-sonic assisted electrochemical, photoelctrochemical and
template synthesis using non-aqueous medium. The at-mospheres like argon, nitrogen, etc. are used for the syn-thesis of polythiophene because, the presence of inertsulfur atom in thiophene increases the oxidation potentialand has poor stability in air, which makes the preparationof polythiophene more difficult. However, in presentwork, polythiophene is easily synthesized using simplechemical method in air atmosphere and in an aqueousmedium. Also, there are no reports on the pure polythio-phene based asymmetric supercapacitor devices. In theliterature, the asymmetric devices are fabricated using thederivatives of polythiophene than the pure polythiophene.In the present work, for the first time, chemical synthesisof PT thin films is carried out from aqueous bath at roomtemperature (300 K). This synthesis route does not in-volve any expensive apparatus. The microstructure aswell as electrochemical properties of PT electrode is in-vestigated. The electrochemical properties of the PT elec-trode are evaluated using cyclic voltammetry (CV), galva-nostatic charge-discharge and electrochemical impedancespectroscopic (EIS) techniques. Further, the performanceevaluation of asymmetric supercapacitor PT/graphitedevice is carried out.
[a] B. H. Patil, S. J. Patil, C. D. LokhandeThin Film Physics Laboratory, Department of Physics,Shivaji UniversityKolhapur-416004 (M. S.) Indiatel. +91231 2609225, fax: +91231 26092333*e-mail: [email protected]
Abstract : Polythiophene (PT) thin films have been pre-pared by chemical bath deposition (CBD) method atroom temperature (300 K) via oxidative polymerizationof thiophene using ammonium peroxodisulfate (APS) asan oxidizing agent. Globular particulates of PT are depos-ited on the stainless steel and glass substrates. The mor-phology and chain structure of PT are studied using scan-ning electron microscopy (SEM) and Raman spectrosco-
py techniques, respectively. The electrochemical behaviorof PT electrode is studied using cyclic voltammetry andgalvanostatic charge�discharge studies. PT thin filmshows maximum specific capacitance of 300 Fg�1 at5 mVs�1 in 0.1 M LiClO4/PC electrolyte. The asymmetricdevice formed with PT and graphite shows supercapaci-tive properties useful in the power applications.
Keywords: Conducting polymers · Polythiophene · Thin films · Supercapacitor
www.electroanalysis.wiley-vch.de � 2014 Wiley-VCH Verlag GmbH & Co. KGaA, Weinheim Electroanalysis 2014, 26, 1 – 11 &1&
These are not the final page numbers! ��
Full Paper1 12 23 34 45 56 67 78 89 9
10 1011 1112 1213 1314 1415 1516 1617 1718 1819 1920 2021 2122 2223 2324 2425 2526 2627 2728 2829 2930 3031 3132 3233 3334 3435 3536 3637 3738 3839 3940 4041 4142 4243 4344 4445 4546 4647 4748 4849 4950 5051 5152 5253 5354 5455 5556 5657 5758 58

2 Experimental
2.1 Synthesis of PT Thin Films
PT thin films have been synthesized by simple and inex-pensive chemical bath deposition (CBD) method. 0.3 Mthiophene is dissolved in 50 mL double distilled water(DDW) and then 0.3 M ammonium peroxodisulfate(APS) is added as an oxidant in the above solution. Tothis, the ultrasonically cleaned glass and stainless steelsubstrates are dipped vertically. The chemical polymeri-zation started on the substrate and after 48 h, brown col-ored PT thin films are deposited on the surface of thesubstrate. The films are thoroughly washed with DDW toremove any residual left.
2.2 Characterization Techniques
The PT thin films are characterized by Fourier transformraman (FT-Raman) spectroscopy and scanning electronmicroscopy (SEM) techniques. The surface morphologyof the synthesized PT is visualized using a JEOL-6360scanning electron microscope. The optical properties areinvestigated within the wavelength range 300–750 nmusing UV�Vis�NIR spectrophotometer. For measuringthickness of PT films, a conventional weight differencemethod is used. The resistivity of film is measured by twopoint probe measurement technique. The electrochemicalsupercapacitive performance of the PT electrode is stud-ied using cyclic voltammetry (CV) and galvanostaticcharge�discharge measurements with Potentiostat (263 AEG & G Princeton Applied Research) and forming anelectrochemical cell comprising platinum as a counterelectrode and saturated calomel electrode (SCE) as a ref-erence electrode in 0.1 M LiClO4/PC electrolyte. The PT/graphite based supercapacitive device is fabricated usingPT as positive electrode and graphite rod as negativeelectrode and its electrochemical properties are tested.
3 Results and Discussion
3.1 Reaction Mechanism
The polymerization of thiophene takes place by the reac-tion of monomer with radical cation formed by oxidationof existing polymer [9, 10]. Roncali et al. [11] reportedthe mechanism of formation of PT by chemical method.Thiophene monomer reacts with oxidant (APS) to formthe cationic radical. The polymerization of PT occursfrom the reaction of the monomer with the radical cationgenerated from the oxidation of the existing polymer. Itis obvious that the dissolved species (monomers or shortoligomer chains) must oxidize in order to form the cationradicals [12]. The first step is a one-electron oxidation ofthe monomer to form the cation radical. The second stepis a coupling reaction of two cation radicals to producedihydro-dimer dication that leads the formation of thedimer. The dimer is oxidized again and couples with an-other oxidized segment. In the propagation step, reoxida-tion, coupling and deprotonation continue to produceoligomers and at the end of the reaction, PT chain forms[13,14]. During polymerization, it is observed that, thebath color changes from white to colorless and colorlessto brown. At the beginning of the reaction, thiophenemonomer prepares the micelles in the water where poly-merization starts. When the 0.3 M APS solution is addeddrop wise in the monomer bath, the bath becomes thecloudy white. After 24 h, solution color changes to brownfollowed by colorless. The photograph of the change incolor of PT solution is shown in Figure 1.
After complete polymerization of thiophene, the browncolored PT thin film is formed on the substrate surface.The reaction mechanism for the formation of PT is shownin Scheme 1 [15]:
3.2 Thickness Study
Thickness of PT thin film is determined by weight differ-ence method using sensitive microbalance with the rela-
Fig. 1. The photograph of change in solution color during polymerization of PT.
www.electroanalysis.wiley-vch.de � 2014 Wiley-VCH Verlag GmbH & Co. KGaA, Weinheim Electroanalysis 2014, 26, 1 – 11 &2&
These are not the final page numbers! ��
Full Paper1 12 23 34 45 56 67 78 89 9
10 1011 1112 1213 1314 1415 1516 1617 1718 1819 1920 2021 2122 2223 2324 2425 2526 2627 2728 2829 2930 3031 3132 3233 3334 3435 3536 3637 3738 3839 3940 4041 4142 4243 4344 4445 4546 4647 4748 4849 4950 5051 5152 5253 5354 5455 5556 5657 5758 58

tion, t=Dm/(A1) where, Dm is weight of the film on thesubstrate in grams, A is the deposited area of the film incm2, 1 is the density of the deposited material (1 =1.06 g/cc) in bulk form. Thickness is the most important parame-ter, which alters the properties of the material due to sur-face phenomena [16]. Figure 2 shows the variation ofthickness with the deposition time. It is observed that asthe deposition time increases the film thickness increasesand it again decreases. The rate of increase in the thick-ness is nonlinear, which may be attributed to the growthby nucleation and coalescence process. More nucleationsites contribute to coagulation during the growing proce-dure. Furthermore, slight decrease in film thickness ob-served could be attributed to the formation of outerporous layer and the film which may develop stress tocause deformation, resulting in peeling off the film afterthe film reaches at maximum thickness [17]. The termi-nated thickness at which highest amount of PT depositedon the substrate is 0.56 mm for 48 h. This optimized filmthickness is used for further characterization.
3.3 FT- Raman Study
FT-Raman spectrum recorded over 450–2000 cm�1 of PTthin film is shown in Figure 3. The well defined peaks at671, 1187, 1494, 1670 and 1942 cm�1 are in good agree-ment with previously reported Raman spectrum of PTthin film [18]. The peak at 1494 cm�1 is attributed to theC=C ring stretching of the neutral PT [19]. The peak at671 cm�1 is due to ring deformation at C�S�C of oxidizedPT [20]. The band of C�C stretching appeared at1187 cm�1. The peak at 1670 cm�1 is due to the thiophenering vibration [21]. FT-Raman study confirmed the for-mation of PT by chemical method.
3.4 Morphological Study
Figure 4 shows SEM images of PT thin film at two differ-ent magnifications; (a) � 5000 and (b) �15 000. Globularparticulate of PT distributed over the entire surface is ob-served from the SEM images [22]. The formation of glob-ular particulates on the substrate surface is due to the ho-
Scheme 1.
Fig. 2. The variation of thickness of PT thin film with deposi-tion time. Fig. 3. The FT-Raman spectrum of chemically synthesized PT.
www.electroanalysis.wiley-vch.de � 2014 Wiley-VCH Verlag GmbH & Co. KGaA, Weinheim Electroanalysis 2014, 26, 1 – 11 &3&
These are not the final page numbers! ��
Full Paper1 12 23 34 45 56 67 78 89 9
10 1011 1112 1213 1314 1415 1516 1617 1718 1819 1920 2021 2122 2223 2324 2425 2526 2627 2728 2829 2930 3031 3132 3233 3334 3435 3536 3637 3738 3839 3940 4041 4142 4243 4344 4445 4546 4647 4748 4849 4950 5051 5152 5253 5354 5455 5556 5657 5758 58

mogenous nucleation of the PT. This type of morphologyis more useful for electrolyte penetration for charge-dis-charge processes of redox supercapacitor. Monnin et al.[23] observed the raspberry-like morphology of the elec-trophoretically deposited PT thin film.
3.5 Electrical Resistivity Study
The conductivity mechanism of conducting polymer is dif-ferent than that of covalent solids. In case of PT, p-bond-ing of the p-orbital that make up each five member aro-matic thiophene ring. When these rings line up in thesame plane the orbital overlap can be said to extend overmany rings, with the conjugation length defined as theextent of this overlap. If the coplanar backbone is twistedthe conjugation length is greatly reduced. Thus, the conju-gation length determines the separation between adjacentenergy levels, this is called as band gap, with undisturbedp-bonding representing a filled valence band and emptyp*-antibonding orbital representing the conduction band.Therefore, to produce electrical conduction in the poly-mer an electron must be excited from the valence to theconduction band by disturbing the p-bonds. This can bedone by oxidization or reduction with an appropriatecounter ion [24–26]. The presence of alternating singleand double bonds along the polymer chain that allowsthe delocalization and movement of carriers along thebackbone [27]. When the p-system in the polymer is par-tially oxidized or reduced, the conductivity increases byseveral orders of magnitude. Variation of electrical resis-tivity of PT film is studied in the temperature range of300 to 600 K (Figure 5) by two probe resistivity measure-ment technique. The room temperature electrical resistiv-ity of 5.37 Wcm is observed for PT thin film.
3.6 Optical Studies
Optical study (Figure 6) reveals the formation of polaronsand bipolarons in the PT chain [28]. The absorption peakis observed around 400–500 nm. The lowest energy thatcan be absorbed in an undoped polymer film reflects theedge of the optical band gap which corresponds to a one-
electron picture with an electron transition from HOMOto LUMO (shown in Figure 7). This peak position in theabsorption spectrum confirms the longer conjugational
Fig. 4. The SEM images of PT thin film at (a) � 5000 and (b) � 10000 magnifications.
Fig. 5. The graph of variation of electrical resistivity with tem-perature for PT thin film.
Fig. 6. The graph of (ahv)2 vs. hn for PT thin film. Inset: Ab-sorbance of PT.
www.electroanalysis.wiley-vch.de � 2014 Wiley-VCH Verlag GmbH & Co. KGaA, Weinheim Electroanalysis 2014, 26, 1 – 11 &4&
These are not the final page numbers! ��
Full Paper1 12 23 34 45 56 67 78 89 9
10 1011 1112 1213 1314 1415 1516 1617 1718 1819 1920 2021 2122 2223 2324 2425 2526 2627 2728 2829 2930 3031 3132 3233 3334 3435 3536 3637 3738 3839 3940 4041 4142 4243 4344 4445 4546 4647 4748 4849 4950 5051 5152 5253 5354 5455 5556 5657 5758 58

length of PT [29]. The optical band gap, taken as theinter section of the line tangent to the band edge with thex-axis, is 3.7 eV. These values match those of electro-chemically and chemically polymerized PT [30]. It is wellknown that the optical property of a material is closelyassociated with its electronic structure. Short conjugationgives blue-shifted emission and long conjugation givesred-shifted emission from the polymer as shown inFigure 7.
3.7 Electrochemical Studies
Nanostructured conducting polymers have been widelyused in the energy storage materials for supercapacitorapplication. This is mainly due to the electrolytes that candiffuse and access the redox active sites more easily inthe conducting polymer nanostructured matrices than incompact counter parts [31].
3.7.1 Scan Rate Study
Generally, cyclic voltammetry (CV) is an advantageoustechnique for electrochemical analysis in terms of investi-gating the redox characteristics of polymers. Figure 8ashows the CV curves of PT in 0.1 M LiClO4/PC electro-lyte with different scanning rates. The CV curves displaynearly rectangular in shape due to fast redox processes inthe PT, indicating their good supercapacitive performan-ces [32]. The redox peaks observed in the CV curve aredue to the transition between neutral, polaron, bipolaron
and metallic states of the PT [33]. The observed oxidationand reduction peaks are broad. This is due to the reor-ganization of the polymer chain that occurs with ionmovement into/out of the PT chain [34]. The specific ca-pacitance can be calculated appropriately by integratingthe full CV curve. From Figure 8b, it is observed that asthe scan rate increases the specific capacitance decreases.The specific capacitance observed for PT thin film is300 Fg�1 at 5 mVs�1 scan rate. This is attributed to theporous morphology of the PT, which improves the abilityof the electrolyte to soak into PT electrode and decreasethe electrode polarization [35]. In the reduction process,Li+ ions are inserted in the polymer electrode as well asin the oxidation process; insertion of anion (ClO�4 ) fromthe electrolyte takes place.
Reduction process:
PTþ e� þ Liþ $ PT� þ Liþ ð1Þ
Oxidation process:
PTþ ClO�4þ $ PTþ þ ClO�4 þ e� ð2Þ
3.7.2 Galvanostatic Charge�Discharge Study
Galvanostatic charge�discharge measurement is common-ly used to test the performance of supercapacitor. Fig-ure 8c shows the galvanostatic charge-discharge curves ofPT film at current densities of 0.03, 0.1 and 0.3 mAcm�2
between +0.2 and �1.4 V/SCE in 0.1 M LiClO4/PC elec-
Fig. 7. The schematic for optical study in conducting polymers.
www.electroanalysis.wiley-vch.de � 2014 Wiley-VCH Verlag GmbH & Co. KGaA, Weinheim Electroanalysis 2014, 26, 1 – 11 &5&
These are not the final page numbers! ��
Full Paper1 12 23 34 45 56 67 78 89 9
10 1011 1112 1213 1314 1415 1516 1617 1718 1819 1920 2021 2122 2223 2324 2425 2526 2627 2728 2829 2930 3031 3132 3233 3334 3435 3536 3637 3738 3839 3940 4041 4142 4243 4344 4445 4546 4647 4748 4849 4950 5051 5152 5253 5354 5455 5556 5657 5758 58

trolyte. It is found that the charging curves are not exact-ly symmetrical to the discharging curves. The initial sharpchange in potential with time, during charging and dis-charging process may be due to the ohmic loss whicharose from the internal resistance of the cell [36]. The dis-charging curves shows typical two voltage stages as +0.2to �0.4 V/SCE and �0.4 to �1.4 V/SCE. The formerstage with relatively short discharge duration is ascribedto electrochemical double layer (EDL) capacitance andlatter stage with large discharge duration is associatedwith faradic capacitance. Low internal resistance is ofgreat importance in energy storing devices since lessenergy will be consumed to produce unwanted heatduring charging/discharging processes [31].
3.7.3 Cyclic Stability Study
Figure 8d shows the CV curves of PT films for the firstcycle and after 1000 cycles which indicates excellent cy-clability and rate capability of PT cathode. Pt film shows
87% cyclic stability in LiClO4/PC electrolyte. This is at-tributed to the porous morphology of the PT, which im-proves the ability of the electrolyte to soak into PT elec-trode and decreases the electrode polarization [35]. Thedecrease in capacitance observed after 1000 cycles maybe due to the doping and undoing of conducting polymerwhich undergo volume change and hence are bound toundergo mechanical degradation which results in capaci-tance decay [37].
3.7.4 Electrochemical Impedance Study
In the Nyquist impedance plot (Figure 9), the imaginarypart of impedance is plotted as a function of the realcomponent in the frequency range from 10 mHz to100 kHz at 0 V biasing potential in LiClO4/PC electrolyte,of PT thin film. At high frequency end, where the spec-trum intercepts real axis denotes the solution resistance.Generally impedance spectrum contains a small semicircle at high frequency end followed by 458 slope in mid-
Fig. 8. (a) The CV curves of PT thin film in 0.1 M LiClO4/PC electrolyte with different scan rate, (b) The graph of specific capaci-tance vs scan rate, (c) The galvanostatic charge- discharge curves of PT film at current densities 0.03, 0.1 and 0.3 mA cm�2 and (d)Electrochemical stability of PT thin film in 0.1 M LiClO4/PC electrolyte at 100 mV s�1 scan rate.
www.electroanalysis.wiley-vch.de � 2014 Wiley-VCH Verlag GmbH & Co. KGaA, Weinheim Electroanalysis 2014, 26, 1 – 11 &6&
These are not the final page numbers! ��
Full Paper1 12 23 34 45 56 67 78 89 9
10 1011 1112 1213 1314 1415 1516 1617 1718 1819 1920 2021 2122 2223 2324 2425 2526 2627 2728 2829 2930 3031 3132 3233 3334 3435 3536 3637 3738 3839 3940 4041 4142 4243 4344 4445 4546 4647 4748 4849 4950 5051 5152 5253 5354 5455 5556 5657 5758 58

frequency region which is due to the Warburg diffusionresistance, and a vertical spike at low frequency [38]. Thesmall semicircle at high frequency might be due to diffu-sion effect of the electrolyte in the electrodes. The Rct
value for PT thin film is observed as 10 W and the middlefrequency of the spectrum revealed the electrode/electro-lyte interface processes. The non-vertical slope of the im-
pedance plot at low frequency of electrochemical capaci-tor is due to: 1) the microporosity and redox propertiesof PT; 2) the low mobility of the ions inside the electrodeor the combination of both. Inset of Figure 9 shows a gen-eral electrical equivalent circuit that may be used tomodel the electrochemical processes which occur in con-ductive polymer films [40,49]. In this circuit, Rs (1 W)represents the solution resistance and the element Cdl isthe double layer capacitance.
3.8 Device Fabrication and Performance Evaluation
3.8.1 Asymmetric Device Fabrication
Asymmetric device is prepared using PT film on the flexi-ble stainless steel foil of dimension 4 �4 cm2 as a positiveelectrode and graphite as a negative electrode. 0.1 MLiClO4/PC solution is used as an electrolyte. The fabrica-tion of asymmetric supercapacitor device based on PT/graphite electrode was carried out at lab scale. The pho-tograph of the formation of the asymmetric device isshown in Figure 10, which contains flexible stainless steelcoated with PT, cylindrical plastic container, graphite rodand 0.1 M LiClO4/PC electrolyte. For the fabrication ofasymmetric device, flexible film is rolled around thegraphite rod and inserted in the cylindrical plastic con-tainer and 0.1 M LiClO4/PC electrolyte is filled in theplastic container and then the cell is sealed.
Fig. 9. The Nyquist impedance plot for PT thin film in the fre-quency range from 10 mHz to 100 kHz. Inset: Equivalent circuitdiagram.
Fig. 10. The photograph of the process for formation of the asymmetric supercapacitor device of PT/graphite.
www.electroanalysis.wiley-vch.de � 2014 Wiley-VCH Verlag GmbH & Co. KGaA, Weinheim Electroanalysis 2014, 26, 1 – 11 &7&
These are not the final page numbers! ��
Full Paper1 12 23 34 45 56 67 78 89 9
10 1011 1112 1213 1314 1415 1516 1617 1718 1819 1920 2021 2122 2223 2324 2425 2526 2627 2728 2829 2930 3031 3132 3233 3334 3435 3536 3637 3738 3839 3940 4041 4142 4243 4344 4445 4546 4647 4748 4849 4950 5051 5152 5253 5354 5455 5556 5657 5758 58

3.8.2 Performance Evaluation of the AsymmetricSupercapacitor Device
3.8.2.1 Scan Rate Study
Figure 11a shows CV curves of PT/graphite asymmetricsupercapacitor device at 5, 10, 20, 50 and 100 mVs�1 scanrates. The curves show the ideal rectangular shape due tothe supercapacitor behavior of the device. PT/graphiteasymmetric device shows both EDLC and pseudo capaci-tive behavior. From Figure 11b it is observed that with in-crease in scan rate specific capacitance decrease from 17to 5 Fg�1 due to the presence of inner active sites thatcannot sustain the redox transitions which is possible dueto diffusion effect of ions within the electrodes [41]. Themaximum value of the specific capacitance of 17 Fg�1 iscalculated at 5 mVs�1 scan rate.
3.8.2.2 Galvanostatic Charge�Discharge Study
Galvanostatic charge-discharge study of PT/graphiteasymmetric device is carried out at different current den-sities. From Figure 11c, it is observed that the discharging
time decreases with increases in the current density, thismay be due to the enhancement of insufficient active ma-terial involved in the redox reaction under highest currentdensities [42]. The values of specific energy and specificpower are calculated using the formulae given below
SE ¼ Q� ðDV=WÞ ¼ I� t� ðDV=WÞ ð3Þ
SP ¼ SE=t ¼ I� ðDV=WÞ ð4Þ
The maximum value of specific energy and specificpower is 11.43 Wh kg�1and 1.14 kW kg�1, respectively for0.1 mAcm�1 current density. Figure 11d shows theRagone plot for PT/graphite asymmetric supercapacitordevice. From Ragone plot, it is observed that asymmetricdevice shows the specific energy and specific power in therange of supercapacitor. Therefore, this device may beused for high power applications.
Fig. 11. (a) CV curves of PT/graphite asymmetric supercapacitor device at 5, 10, 20, 50 and 100 mV s�1 scan rates, (b) The graph ofvariation of specific capacitance with scan rate of the PT device, (c) Galvanostatic charge-discharge and (d) Ragone plot of PT/graph-ite asymmetric device.
www.electroanalysis.wiley-vch.de � 2014 Wiley-VCH Verlag GmbH & Co. KGaA, Weinheim Electroanalysis 2014, 26, 1 – 11 &8&
These are not the final page numbers! ��
Full Paper1 12 23 34 45 56 67 78 89 9
10 1011 1112 1213 1314 1415 1516 1617 1718 1819 1920 2021 2122 2223 2324 2425 2526 2627 2728 2829 2930 3031 3132 3233 3334 3435 3536 3637 3738 3839 3940 4041 4142 4243 4344 4445 4546 4647 4748 4849 4950 5051 5152 5253 5354 5455 5556 5657 5758 58
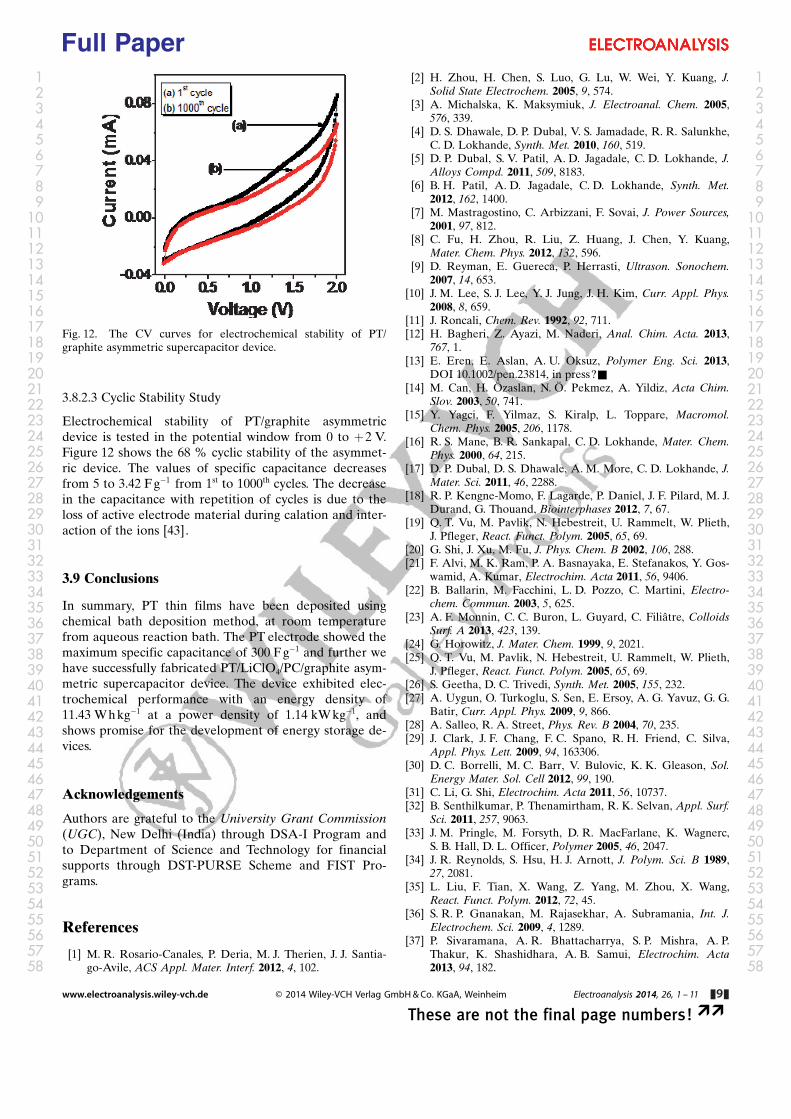
3.8.2.3 Cyclic Stability Study
Electrochemical stability of PT/graphite asymmetricdevice is tested in the potential window from 0 to +2 V.Figure 12 shows the 68 % cyclic stability of the asymmet-ric device. The values of specific capacitance decreasesfrom 5 to 3.42 Fg�1 from 1st to 1000th cycles. The decreasein the capacitance with repetition of cycles is due to theloss of active electrode material during calation and inter-action of the ions [43].
3.9 Conclusions
In summary, PT thin films have been deposited usingchemical bath deposition method, at room temperaturefrom aqueous reaction bath. The PT electrode showed themaximum specific capacitance of 300 F g�1 and further wehave successfully fabricated PT/LiClO4/PC/graphite asym-metric supercapacitor device. The device exhibited elec-trochemical performance with an energy density of11.43 Whkg�1 at a power density of 1.14 kW kg�1, andshows promise for the development of energy storage de-vices.
Acknowledgements
Authors are grateful to the University Grant Commission(UGC), New Delhi (India) through DSA-I Program andto Department of Science and Technology for financialsupports through DST-PURSE Scheme and FIST Pro-grams.
References
[1] M. R. Rosario-Canales, P. Deria, M. J. Therien, J. J. Santia-go-Avile, ACS Appl. Mater. Interf. 2012, 4, 102.
[2] H. Zhou, H. Chen, S. Luo, G. Lu, W. Wei, Y. Kuang, J.Solid State Electrochem. 2005, 9, 574.
[3] A. Michalska, K. Maksymiuk, J. Electroanal. Chem. 2005,576, 339.
[4] D. S. Dhawale, D. P. Dubal, V. S. Jamadade, R. R. Salunkhe,C. D. Lokhande, Synth. Met. 2010, 160, 519.
[5] D. P. Dubal, S. V. Patil, A. D. Jagadale, C. D. Lokhande, J.Alloys Compd. 2011, 509, 8183.
[6] B. H. Patil, A. D. Jagadale, C. D. Lokhande, Synth. Met.2012, 162, 1400.
[7] M. Mastragostino, C. Arbizzani, F. Sovai, J. Power Sources,2001, 97, 812.
[8] C. Fu, H. Zhou, R. Liu, Z. Huang, J. Chen, Y. Kuang,Mater. Chem. Phys. 2012, 132, 596.
[9] D. Reyman, E. Guereca, P. Herrasti, Ultrason. Sonochem.2007, 14, 653.
[10] J. M. Lee, S. J. Lee, Y. J. Jung, J. H. Kim, Curr. Appl. Phys.2008, 8, 659.
[11] J. Roncali, Chem. Rev. 1992, 92, 711.[12] H. Bagheri, Z. Ayazi, M. Naderi, Anal. Chim. Acta. 2013,
767, 1.[13] E. Eren, E. Aslan, A. U. Oksuz, Polymer Eng. Sci. 2013,
DOI 10.1002/pen.23814, in press?&[14] M. Can, H. �zaslan, N. �. Pekmez, A. Yildiz, Acta Chim.
Slov. 2003, 50, 741.[15] Y. Yagci, F. Yilmaz, S. Kiralp, L. Toppare, Macromol.
Chem. Phys. 2005, 206, 1178.[16] R. S. Mane, B. R. Sankapal, C. D. Lokhande, Mater. Chem.
Phys. 2000, 64, 215.[17] D. P. Dubal, D. S. Dhawale, A. M. More, C. D. Lokhande, J.
Mater. Sci. 2011, 46, 2288.[18] R. P. Kengne-Momo, F. Lagarde, P. Daniel, J. F. Pilard, M. J.
Durand, G. Thouand, Biointerphases 2012, 7, 67.[19] Q. T. Vu, M. Pavlik, N. Hebestreit, U. Rammelt, W. Plieth,
J. Pfleger, React. Funct. Polym. 2005, 65, 69.[20] G. Shi, J. Xu, M. Fu, J. Phys. Chem. B 2002, 106, 288.[21] F. Alvi, M. K. Ram, P. A. Basnayaka, E. Stefanakos, Y. Gos-
wamid, A. Kumar, Electrochim. Acta 2011, 56, 9406.[22] B. Ballarin, M. Facchini, L. D. Pozzo, C. Martini, Electro-
chem. Commun. 2003, 5, 625.[23] A. F. Monnin, C. C. Buron, L. Guyard, C. Fili�tre, Colloids
Surf. A 2013, 423, 139.[24] G. Horowitz, J. Mater. Chem. 1999, 9, 2021.[25] Q. T. Vu, M. Pavlik, N. Hebestreit, U. Rammelt, W. Plieth,
J. Pfleger, React. Funct. Polym. 2005, 65, 69.[26] S. Geetha, D. C. Trivedi, Synth. Met. 2005, 155, 232.[27] A. Uygun, O. Turkoglu, S. Sen, E. Ersoy, A. G. Yavuz, G. G.
Batir, Curr. Appl. Phys. 2009, 9, 866.[28] A. Salleo, R. A. Street, Phys. Rev. B 2004, 70, 235.[29] J. Clark, J. F. Chang, F. C. Spano, R. H. Friend, C. Silva,
Appl. Phys. Lett. 2009, 94, 163306.[30] D. C. Borrelli, M. C. Barr, V. Bulovic, K. K. Gleason, Sol.
Energy Mater. Sol. Cell 2012, 99, 190.[31] C. Li, G. Shi, Electrochim. Acta 2011, 56, 10737.[32] B. Senthilkumar, P. Thenamirtham, R. K. Selvan, Appl. Surf.
Sci. 2011, 257, 9063.[33] J. M. Pringle, M. Forsyth, D. R. MacFarlane, K. Wagnerc,
S. B. Hall, D. L. Officer, Polymer 2005, 46, 2047.[34] J. R. Reynolds, S. Hsu, H. J. Arnott, J. Polym. Sci. B 1989,
27, 2081.[35] L. Liu, F. Tian, X. Wang, Z. Yang, M. Zhou, X. Wang,
React. Funct. Polym. 2012, 72, 45.[36] S. R. P. Gnanakan, M. Rajasekhar, A. Subramania, Int. J.
Electrochem. Sci. 2009, 4, 1289.[37] P. Sivaramana, A. R. Bhattacharrya, S. P. Mishra, A. P.
Thakur, K. Shashidhara, A. B. Samui, Electrochim. Acta2013, 94, 182.
Fig. 12. The CV curves for electrochemical stability of PT/graphite asymmetric supercapacitor device.
www.electroanalysis.wiley-vch.de � 2014 Wiley-VCH Verlag GmbH & Co. KGaA, Weinheim Electroanalysis 2014, 26, 1 – 11 &9&
These are not the final page numbers! ��
Full Paper1 12 23 34 45 56 67 78 89 9
10 1011 1112 1213 1314 1415 1516 1617 1718 1819 1920 2021 2122 2223 2324 2425 2526 2627 2728 2829 2930 3031 3132 3233 3334 3435 3536 3637 3738 3839 3940 4041 4142 4243 4344 4445 4546 4647 4748 4849 4950 5051 5152 5253 5354 5455 5556 5657 5758 58

[38] K. Kotz, M. Carlen, Electrochim. Acta 2000, 45, 2483.[39] R. N. Vyas, B. Wang, Int. J. Mol. Sci. 2010, 11, 1956.[40] P. Najafisayar, M. E. Bahrololoom, Electrochim. Acta 2013,
114, 462.[41] G. S. Gund, D. P. Dubal, B. H. Patil, S. S. Shinde, C. D. Lo-
khande, Electrochim. Acta 2013, 92, 205.[42] A. D. Jagadale, V. S. Kumbhar, D. S. Dhawale, C. D. Lo-
khande, Electrochim. Acta 2013, 98, 32.
[43] S. B. Kulkarni, A. D. Jagadale, V. S. Kumbhar, R. N. Bu-lakhe, S. S. Joshi, C. D. Lokhande, Int. J. Hydrogen Energy,2013, 38, 4046.
Received: June 4, 2014Accepted: July 2, 2014
Published online: && &&, 2014
www.electroanalysis.wiley-vch.de � 2014 Wiley-VCH Verlag GmbH & Co. KGaA, Weinheim Electroanalysis 2014, 26, 1 – 11 &10&
These are not the final page numbers! ��
Full Paper1 12 23 34 45 56 67 78 89 9
10 1011 1112 1213 1314 1415 1516 1617 1718 1819 1920 2021 2122 2223 2324 2425 2526 2627 2728 2829 2930 3031 3132 3233 3334 3435 3536 3637 3738 3839 3940 4041 4142 4243 4344 4445 4546 4647 4748 4849 4950 5051 5152 5253 5354 5455 5556 5657 5758 58

FULL PAPERS
B. H. Patil, S. J. Patil,C. D. Lokhande*
&& –&&
Electrochemical Characterization ofChemically SynthesizedPolythiophene Thin Films:Performance of AsymmetricSupercapacitor Device
www.electroanalysis.wiley-vch.de � 2014 Wiley-VCH Verlag GmbH & Co. KGaA, Weinheim Electroanalysis 2014, 26, 1 – 11 &11&
These are not the final page numbers! ��
Full Paper1 12 23 34 45 56 67 78 89 9
10 1011 1112 1213 1314 1415 1516 1617 1718 1819 1920 2021 2122 2223 2324 2425 2526 2627 2728 2829 2930 3031 3132 3233 3334 3435 3536 3637 3738 3839 3940 4041 4142 4243 4344 4445 4546 4647 4748 4849 4950 5051 5152 5253 5354 5455 5556 5657 5758 58