Electrical conductivity of cellular Si∕SiC ceramic composites prepared from plant precursors
22
Electrical conductivity of cellular Si/SiC ceramic composites prepared from plant precursors Debopriyo Mallick, a) Omprakash Chakrabarti, a)* Dipten Bhattacharya, b) Manabendra Mukherjee, c) Himadri S. Maiti, b) and Rabindranath Majumdar d) a) Non-oxide Ceramics and Composites Division, Central Glass and Ceramic Research Institute, Kolkata 700 032, India b) Electroceramics Division, Central Glass and Ceramic Research Institute, Kolkata 700 032, India c) Surface Physics Division, Saha Institute of Nuclear Physics, Kolkata 700 064, India d) Department of Chemical Technology, University of Calcutta, Kolkata 700 009, India Electrical conductivity (σ dc ) of the cellular Si/SiC ceramic composites has been measured over a temperature range 25-1073 K while the thermoelectric power (S) has been measured over 25-300 K. Remarkably, these cellular compounds developed through biomimetic route – where the ceramic system grows within a plant bio-template retaining the imprint of structural intricacies of the native templates – are found to exhibit excellent mechanical, thermal, and electrical properties quite comparable to or even better than those of the systems prepared through conventional ceramic route. The electrical conductivity, measured parallel (σ ║ ) and perpendicular (σ ⊥ ) to the growth axes of the native plants, depicts nearly temperature-independent anisotropy (σ ⊥ /σ ║ ) of the order ~2 while the thermoelectric power is nearly isotropic. The charge conduction across the entire temperature regime is found to follow closely the variable range hopping (VRH) mechanism. The conductivity anisotropy appears to be driven primarily by the unique microcellular morphology of the bio-templates which can be exploited in many electrical applications. PACS Numbers: 72.80.Ng, 71.38.-k _________________________________________________ *Corresponding author; electronic mail: [email protected]
-
Upload
independent -
Category
Documents
-
view
2 -
download
0
Transcript of Electrical conductivity of cellular Si∕SiC ceramic composites prepared from plant precursors

Electrical conductivity of cellular Si/SiC ceramic composites prepared from plant precursors
Debopriyo Mallick,a) Omprakash Chakrabarti,a)* Dipten Bhattacharya,b) Manabendra Mukherjee,c) Himadri S. Maiti,b) and Rabindranath Majumdard)
a)Non-oxide Ceramics and Composites Division, Central Glass and Ceramic Research Institute, Kolkata 700 032, India b)Electroceramics Division, Central Glass and Ceramic Research Institute, Kolkata 700 032, India c)Surface Physics Division, Saha Institute of Nuclear Physics, Kolkata 700 064, India d)Department of Chemical Technology, University of Calcutta, Kolkata 700 009, India
Electrical conductivity (σdc) of the cellular Si/SiC ceramic composites has been measured over a
temperature range 25-1073 K while the thermoelectric power (S) has been measured over 25-300
K. Remarkably, these cellular compounds developed through biomimetic route – where the
ceramic system grows within a plant bio-template retaining the imprint of structural intricacies of
the native templates – are found to exhibit excellent mechanical, thermal, and electrical properties
quite comparable to or even better than those of the systems prepared through conventional
ceramic route. The electrical conductivity, measured parallel (σ) and perpendicular (σ⊥) to the
growth axes of the native plants, depicts nearly temperature-independent anisotropy (σ⊥/σ) of
the order ~2 while the thermoelectric power is nearly isotropic. The charge conduction across the
entire temperature regime is found to follow closely the variable range hopping (VRH)
mechanism. The conductivity anisotropy appears to be driven primarily by the unique
microcellular morphology of the bio-templates which can be exploited in many electrical
applications.
PACS Numbers: 72.80.Ng, 71.38.-k _________________________________________________ *Corresponding author; electronic mail: [email protected]

I. INTRODUCTION
The studies of electrical properties of silicon carbide (SiC) ceramics and
composites have tremendous scientific significance and have been proved to be of
practical interests as well. SiC materials are long known to be used as high-temperature
electric heaters. They are also employed to advantages in resistance thermometers and in
thermoelectric power generation targeting various applications such as space technology,
local communication, small batteries, refrigeration etc. Such applications involve
materials that are developed or in the process of being developed following conventional
means of material synthesis using synthetic raw SiC powders. Recently efforts are afoot
to synthesize SiC based single-phase or composite materials following an innovative
biomimetic route using naturally grown plants or pre-processed bio-structures as
precursors. Requirement of cheap plants as precursors of renewable nature and of local
source, possibility of easy shape making during green fabrication, possibility of
mimicking unique microcellular features of native plant morphology into SiC ceramic
microstructures, low temperature ceramization etc. make such processing increasingly
attractive for commercial exploitation. Intensive investigations are presently being carried
out to examine various aspects of material processing and characterization of biomorphic
or cellular SiC materials1-4. Although, some preliminary investigations have been
undertaken to study the electrical properties of biomorphic SiC ceramics at low5 as well
as at high temperatures6, no report exists as yet on detailed electrical and thermal
conduction mechanisms over a wider temperature range.
In this backdrop, the aim of the present investigation is to study the electrical
transport mechanism of cellular Si/SiC ceramic composites, synthesized from bamboo,
over a wide temperature range 25-1073 K, for conduction in directions parallel and
perpendicular to the growth axis of the precursor bio-template. We have also studied the
thermoelectric power over 25-300 K. The local chemical environment has also been
studied using x-ray photoelectron spectroscopy (XPS). Our aim is to explore the
possibility of application of these cellular Si/SiC composites for designing heaters or
power generation circuits with complicated multi-channel network structure having
preferential current flow.
Bamboo has been selected as the native plant precursor (or bio-template) for the
growth of the ceramic Si/SiC composites, as it has many interesting structural features7.
Additionally, possibility of value addition to bamboo plants through their successful
transformation to SiC based ceramic materials of attractive electrical properties for
commercial exploitation, creates an important motive for undertaking the present
investigation.
II. EXPERIMENTAL 2.1. Material synthesis
Cellular Si/SiC ceramics were prepared from bamboos of Indian origin following
the procedure described elsewhere.4 The selected specimen (species: Dendrocalamus
Stricuts) is the most common bamboo in India; the specimen used in the present study is
of the Western Ghat origin. Precursor samples were collected from lower part of the
culms, which were erect and of nearly solid cylindrical forms (major constituents (wt %):
α-cellulose= 34.5%, Hemicellulose= 20.5%, lignin=26.0%, Moisture =8.0%, Ash=7.4%
(SiO2=6.66%)) Cylindrical shapes (of diameter 30.5 mm and, height 45 mm.) were cut
from native bamboo plants, dried at 70oC for 48 h, pyrolyzed by heating at around 800oC
in a self–generated atmosphere in an electrically heated furnace followed by heat
treatment at around 1600oC under vacuum for 4 h in a carbon tube furnace and finally
infiltrated and reacted with molten Si (99.4% w/w) under vacuum at 1600oC for 0.5 h in
the same carbon tube furnace to yield cellular Si/SiC ceramics.4 The bio-carbonaceous
preforms from native bamboo were characterized in terms of pyrolysis weight loss,
shrinkage, and microstructure; the Si-infiltrated biocarbon preforms were tested for
density, porosity, presence of crystalline phases, phase transitions, and also
microstructure.
2.2. Measurement of electrical properties
Measurement of low temperature electrical resistivity was carried out from 25 to
300 K by standard four-probe dc technique in a closed cycle cryocooler. The bar shaped
specimens of width 2.1-2.6 mm and thickness 1.6-1.8 mm were used. Measurement of
thermoelectric power (TEP) was carried out over 25-300 K. For TEP-measurement, two
Pt-Pt/Rh thermocouples were attached to both ends of the bar-shaped samples and one
end was heated by a Mn-wire heater to generate temperature gradient of the order 3-5 K;

the TEP is obtained from the slope of the thermoelectric force to the temperature
difference.
High temperature electrical resistivity was measured over 300-1073 K in a tubular
furnace under flowing argon. In this case also four-probe technique was employed for the
measurement. High quality Pt wire and paste was used for making the voltage probes and
current leads. All the contacts were cured overnight at ~1273 K. The samples were cut
into small bars with 3.0-3.3 mm width and 3.0-3.2 mm thickness. Measurements of all
the electrical properties were made in directions parallel and perpendicular to growth axis
of native bamboo precursors.
2.3. X-ray photoelectron spectroscopy (XPS) study
The XPS core-level spectra were taken with an Omicron Multiprobe (Omicron
nanotechnology GmbH., UK) spectrometer fitted with an EA 125 hemispherical analyzer.
A monochromated Al-Kα x-ray source operating at 150W was used for the experiments.
The analyzer pass energy was kept fixed at 20 eV for all the scans. In order to remove the
surface contaminations, the samples were sputtered with 3 keV argon ions for 30 min
prior to the measurements. For quantitative analysis, background of the data was removed
using Shirley method and FHI sensitivity factors were used for the calculations.

III. RESULTS AND DISCUSSION
3.1. Materials property evaluation and microstructure characterization of cellular
Si/SiC
Bamboo has many distinguishing structural features7 — on the macro-scale
bamboo is cylinder and in the present case, it is a solid cylinder; on the meso-scale it has
a non-linear gradient structure comprising of vascular bundles oriented along the growth
axis of bamboo plant thin-walled cells, the walls of which are formed by biopolymers
such as cellulose, lignin etc; on the micro-scale bamboo bust fibers are hollow tubes
composed of several concentric layers and each layer is reinforced with helically wound
cellulose micro fibrils. During pyrolysis, decomposition of biopolymers takes place
causing loss in weight and dimensional shrinkages and the results are presented in Table
I. Skeletal carbon preforms retains structural integrity and micro-cellular features of
native bamboo plant as shown in Fig. 1(a,b); the microstructure is highly anisotropic —
in transverse direction to the growth axis, multiplicity of hollow channels of varying
diameters originating from tracheidal pores is visible; tubular channel morphology is seen
to be preserved in longitudinal direction to the growth axis. Morphological anisotropy
appears to have caused difference in pyrolytic shrinkage in different directions (Table I).
Spontaneous infiltration of the porous skeletal carbon preform derived from
bamboo plant took place when it was brought into contact with silicon melt under
vacuum. Carbon preform got fully infiltrated and reacted throughout into dense structure

with complete retention of the macroscopic structural integrity. In the case of Si
infiltrated specimen the shrinkages were found to be very low and varied marginally in
directions parallel and perpendicular to plant growth axis. Si-infiltrated pyrolyzed
bamboo exhibited low density with negligibly small porosity. The material property data
are presented in Table I. The XRD-scan from a Si infiltrated pyrolyzed bamboo is shown
in Fig. 2. β-SiC and Si are the major crystalline phases present. Additional presence of α-
SiC and carbon can also be noticed.
Assuming (i) complete infiltration of Si melt into the systemic pores of the carbon
preforms and stoichiometric reaction between C and Si, (ii) no dimensional change and
(iii) no loss of materials during ceramization, the material properties can be determined
by the following empirical equation. For ideally dense duplex Si/SiC ceramic composites,
the ceramic density can be given as:
dCeram= VSiC dSiC + VSidSi = dSi + 1.038 dCB(dSiC – dSi) (1)
where VSiC and VSi are the fractional volumes of SiC and Si present in the duplex Si/SiC
ceramic composites and VSiC = ( dCBMSiC)/( dSiCMC) = 1.038 dCB , dCB and MC being the
density of carbon preform and molecular weight of carbon (12 g/ mole), dSiC and MSiC
the density and molecular weight of SiC (40 g/ mole) respectively and dSi the density of
Si. For an average carbon density of 0.47 gm/cc (as measured for bamboo carbon),
equation (1) gives a ceramic density of 2.759 gm/cc. Based on this value and the ceramic
density obtained in the present study, the relative density can be computed to be 94.95 %,
predicting a porosity value of 5.05%. The difference between the predicted and
experimental values of porosity may be due to loss of some carbon caused by

biopolymeric decomposition during Si infiltration run. Ignoring the presence of pores and
other phases in the duplex Si/SiC ceramics, the volume % of Si and SiC-phases may be
computed from the experimental density value as 67 and 33% respectively.
During microscopic examination under reflected light microscope (RLM), Si melt
infiltrated pyrolyzed bamboo sample showed that the microstructural features of the
initial native preform were well preserved during transformation into ceramic structures
(Fig. 1c,d). The appearance of dense microstructure was common in both the longitudinal
and transverse direction to growth axis. During investigation under SEM, the presence of
the major phases of Si and SiC could be confirmed by EDX analysis. Occasional
presence of a third phase as deep black spots could be noticed which was likely to be
pores and/or residual carbon. In the direction transverse to the growth axis, the pyrolyzed
bamboo originally showed tracheidal porous channels with diameter in the range of 2 to
50 µm and such pores are seen to be nearly completely filled with solidified Si after
processing. The carbon of the pyrolyzed preform converts to SiC and the residual Si fills
the pore interiors. In longitudinal direction to the growth axis, tubular channels were seen
to be filled with Si with the cell wall converted to SiC.
3.2. Electrical properties of cellular Si/SiC
A systematic investigation has been carried out to examine the dc resistivity of
cellular Si/SiC ceramic composites synthesized from bamboo plant, with an aim to
understand the mechanism of charge transport. The variation of dc resistivity as a

function of temperature across a range 25-1073 K has been plotted in ln(ρ/T) versus
(1/Tγ) format (where γ is related to the dimensionality) in Fig. 3 for directions
longitudinal and transverse to the growth axis of native plant. All the curves show more
or less similar trends — electrical conductivity increases with temperature. The value of
electrical resistivity at any temperature is comparable to what is reported in Si/SiC
system prepared through ceramic route.8 There are few interesting features in the entire
set of resistivity vs. temperature patterns: (i) nearly temperature-independent anisotropy
in resistivity ρ/ρ⊥ ~ 2; (ii) cross-over in ρ vs. T pattern at distinct points (T*) where no
signature of phase transition could be observed by differential thermal analysis (DTA)
study; (iii) compliance with variable range hopping (VRH) scenario as against normal
small polaron hopping scenario; (iv) T* is ~256 K for longitudinal direction while ~162
K for transverse direction. The positive thermoelectric power (S) signifies that the charge
carriers are holes. The hole concentration does not change much depending on the
direction of charge conduction with respect to the growth axis of the bio-template. We
attempt to rationalize these features in the light of microstructures of the cellular Si/SiC
system.
It is interesting to note that the ρ versus T patterns conform to Mott’s VRH
scenario where ρ is given by9
γ
ρρ ⎟⎠⎞
⎜⎝⎛=
TTT 0
0 exp. (2)

where the exponent γ is related to the dimensionality (d) of the system by γ = (d+1)-1
relation; ρ0 and T0 are constants which, within the framework of VRH model, are given
by
)(1 220
0Fph ENRe υσ
ρ== (3)
)(
3
0FB ENk
T λα= (4)
41
)(89
⎟⎟⎠
⎞⎜⎜⎝
⎛=
FB ETNkR
πα (5)
where λ is a constant, α (= 1/rp) is the inverse of radius of the polaron (rp), N(EF) is the
density of states at the Fermi level, υph is the phonon frequency, and R is the average
hopping distance. The activation (EA) [Ref. 10] and the hopping energies (W) are given
by
γ
ρ−
⎥⎥⎥⎥
⎦
⎤
⎢⎢⎢⎢
⎣
⎡
⎟⎠⎞
⎜⎝⎛
⎟⎠⎞
⎜⎝⎛
= 1.1
lnT
Td
Td
kE BA (6)
)(4
33
FENRW
π= (7)
Fitting of the experimentally observed ρ versus T patterns with Eq. (2) over a certain
temperature range, yields the parameters EA(T), W, rp, R, and N(EF) for specific
temperature range as well as for both the directions of the current flow with respect to the
growth axis of the bio-template. The values of these parameters have been listed in
Table-II; λ is taken to be 18.1 while υph is considered 1015 [Ref. 11]. The temperature
dependence of the activation energy EA(T) is shown in Fig. 4. The fitting of the ρ versus
T patterns is shown in Fig. 3. In Figs. 3a-d, we show the fitting with simple small polaron
conduction [ρ = ρ0Texp(E/kBT)] and VRH conduction models with γ = ½, 1/3, and ¼.
Close comparison reveals that ρ versus T patterns – for both longitudinal and transverse
directions – fit precisely the 3D-VRH model with γ = ¼. In the case of other models,
fitting can be done only over a narrow temperature range and, therefore, several
crossovers could be noticed. This indicates that these models are not valid for explaining
the observed ρ versus T patterns across the entire temperature range. In the case of VRH
model with γ = ¼, on the other hand, only a single crossover at T* could be noticed. This
is an important observation.
We now turn our attention to the thermoelectric power (S) versus temperature
patterns. Along both the directions S is found to be increasing with temperature over 25-
300 K. Since, Si/SiC composite exhibits semiconducting resistivity pattern over 25-300
K, we employ the standard Heike model in order to estimate the charge carrier
concentration (c) participating in heat conduction. According to the model, S is given
by12
⎥⎦
⎤⎢⎣
⎡ −=)(
)(1lnTc
TcekS B (8)
In Fig. 5, we show the variation in c(T) with S. Expectedly, in the both cases the variation
is found to be nearly identical. The fraction of the charge carriers participating in the heat
conduction is progressively decreasing with the increase in temperature. As a result, with
the increase in temperature the thermoelectric power is increasing. At room temperature,

the charge carrier concentration is estimated to be 3.96×1022 cm-3 and 4.03×1022 cm-3 for
longitudinal and transverse directions, respectively.
The study of microstructure both in directions longitudinal and transverse to the
template growth axis reveals that Si/SiC composite forms a bit complicated network
structure, retaining the cellular array feature of the template (Fig. 1). The fibrous wire
type of structure along the growth axis is connected through multiple channels along the
transverse direction. The current carrying cross-section differs between longitudinal and
transverse directions as the cross-sectional area of each of the tubes of the vascular
bundle along the growth axis is always smaller than the net surface to surface contact
area perpendicular to the growth axis. This current carrying cross-sectional anisotropy
which results from morphological anisotropy influences the electrical conduction and
gives rise to the anisotropy of nearly 2.
We have examined the local chemical environment along and perpendicular to the
growth axis by x-ray photoelectron spectroscopy (XPS). In Fig. 6, we show the
corresponding spectra. In both the directions, the system is composed of Si, SiC, and C;
some oxygen is also present in association with Si and C.13 The atom fraction (%) of Si
and C in the constituent phases is varying from 44-24-0-32 and 0-19-50-32 to 34-22-0-44
and 0-16-52-32 for longitudinal to transverse directions respectively. Therefore the
composition basically appears to be nearly similar in both the directions. The resistivity
anisotropy results primarily from morphological anisotropy.

It is interesting to note that ρ vs. T follows 3D-VRH model with γ = ¼ as against
conventional band semiconductor or small polaron conduction scenario. The VRH model
is normally found applicable in – structurally or electronically – disordered systems.9 In
Si/SiC composites, prepared through conventional route, small polaron hopping
conduction describes the resistivity patterns.8 Quite apparent then, that because of
network type structure composed of strands of different dimensions and interfaces
between remnants of template and Si/SiC, structural disorder develops in cellular Si/SiC
systems which gives rise to a switch in charge conduction mechanism. The small polaron
parameters such as polaron radius and hopping distance (Table-II) are found to be
consistent with those estimated for other such disordered electronic systems.14-17
It has been observed that there is a crossover in resistivity pattern at a certain
temperature T*; T* is ~162 and 256 K for directions transverse and longitudinal to the
template growth axis. The transition appears to be gradual as opposed to sharp. Low
temperature DTA study across T*, with a detailed structural analysis can reveal the
reason behind the crossover. This is beyond the scope of the present paper and will be
attempted in a future work.
IV. SUMMARY In summary, we report the electrical resistivity and thermoelectric power of the cellular
Si/SiC composites developed from bio-templates over a wide temperature range. The
values of these parameters are in excellent agreement to what has been observed in such
composites developed from conventional ceramic processes. The electrical resistivity is

found to be moderately anisotropic (with anisotropy ~2) whereas the thermoelectric
power turns out to be isotropic. The electrical conduction mechanism appears to be
following variable range hopping (VRH) scenario both along the direction of growth of
the bio-template and perpendicular to it. Because of easy maneuverability of the bio-
template structures, complicated designs of electrical heater or power generators for
electronic circuitry can be developed using such cellular Si/SiC composites developed via
biomimetic routes.
ACKNOWLEDGMENTS We thank P. Mandal of Saha Institute of Nuclear Physics, Kolkata, India for the low
temperature resistivity and thermoelectric power measurements. We also thank Director,
CG&CRI for giving permission to publish this paper. This work is supported by
Department of Science and Technology (DST), Government of India (fund sanction no.
SR/S3/ME/20/2003-SERC-Engg.).
1C.E. Byrne and D.E.Nagle, Mat. Res. Innovat. 1, 137 (1997). 2P. Greil, T. Lifka, and A. Kaindl, J. Eur. Ceram. Soc. 18, 1961 (1998). 3E. Vogli, H. Sieber, and P. Greil, J. Eur. Ceram. Soc. 22, 2663 (2002). 4O.P. Chakrabarti, H.S. Maiti, and R. Majumdar, J. Mater. Sci. 39, 4715 (2004).
5T.S. Orlova, B.I. Smirnov, A.R. de Arellano-Lopez, J.Martinez-Fernandez, and R. Sepulveda, Phys. Solid State 47, 220 (2005). 6A.I. Shelykh, B.I. Smirnov, T.S. Orlova, I.A. Smirnov, A.R. de Arellano-Lopez, J.Martinez-Fernandez, and F.M. Varela-Feria, Phys. Solid State 48, 229 (2006). 7S.H.Li, Q.Y.Zeng, Y.L.Xiao, S.Y.Fu, and B.L.Zhou, Mater. Sci. Engg. C3, 125 (1995). 8B.North and K.E.Gilchrist, Am. Ceram. Soc.Bull. 60, 549 (1981). 9N.F.Mott and E.A.Davis, Electronic process in non-crystalline materials, 2nd Ed., (Clarendon Press, Oxford, 1979). 10R.Singh, A.K.Narula, R.P.Tandon, A. Mansingh, S.Chandra, J.Appl.Phys. 79, 1476 (1996). 11See, for example, C. Ang, J.R. Jurado, Z. Yu, M.T. Colomer, J.R. Frade, and J.L. Baptista, Phys. Rev. B 57, 11858 (1998). 12See, for example, W. Kishibae, K. Tssutsui, and S. Maekawa, Phys. Rev. B 62, 6869 (2000). 13C.G. Pantano, A.K. Singh, and H. Zhang, J. Sol-Gel Sci. Technol. 14, 7 (1999). 14F. Thevenot, J.Eur. Ceram. Soc. 6, 205 (1990). 15D. Emin in AIP Conference Proceedings 140, edited by D. Emin, T. Aselage, C.L. Beckel, I.A. Howard, and C. Wood (AIP, New York, 1986) pp. 189. 16A. Kaur, R. Singh, K.L. Yadav, and D. Bhattacharya, J. Macromol. Sc. 41, 1369 (2004). 17R. Singh, A. Kaur, K.L. Yadav, and D. Bhattacharya, Curr. Appl. Phys. 3, 235 (2003).
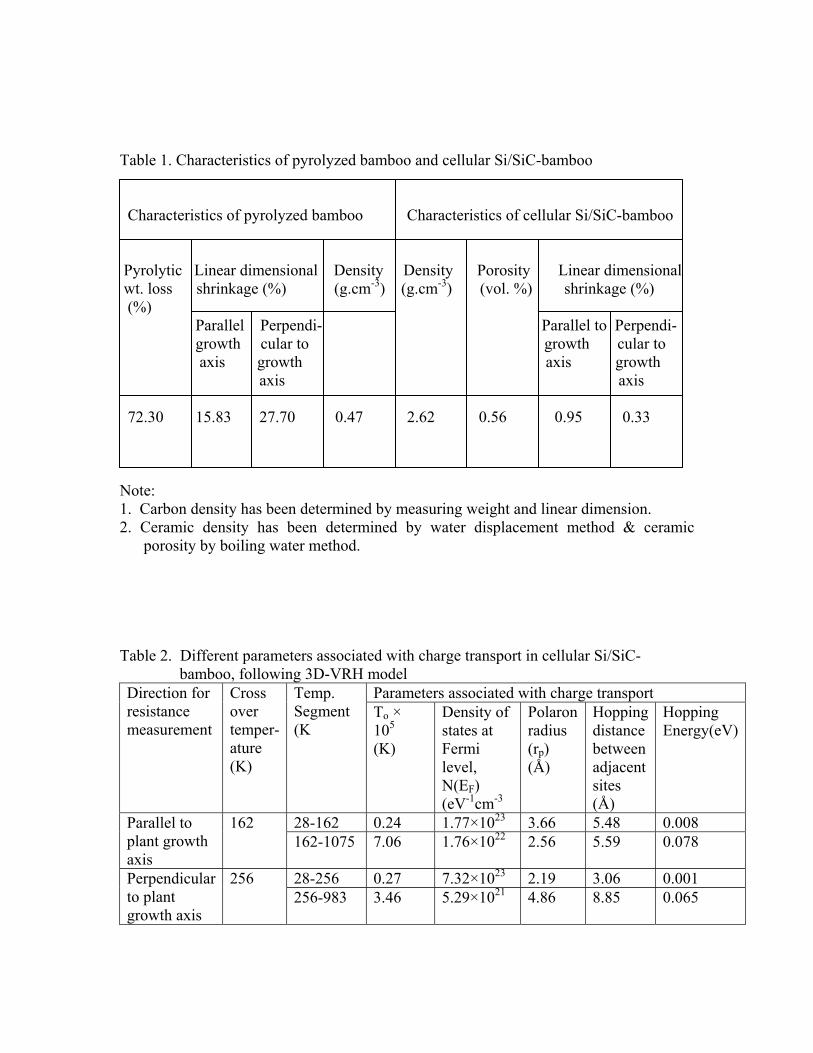
Table 1. Characteristics of pyrolyzed bamboo and cellular Si/SiC-bamboo Characteristics of pyrolyzed bamboo Characteristics of cellular Si/SiC-bamboo Pyrolytic Linear dimensional Density Density Porosity Linear dimensional wt. loss shrinkage (%) (g.cm-3) (g.cm-3) (vol. %) shrinkage (%) (%) Parallel Perpendi- Parallel to Perpendi- growth cular to growth cular to axis growth axis growth axis axis 72.30 15.83 27.70 0.47 2.62 0.56 0.95 0.33 Note: 1. Carbon density has been determined by measuring weight and linear dimension. 2. Ceramic density has been determined by water displacement method & ceramic
porosity by boiling water method. Table 2. Different parameters associated with charge transport in cellular Si/SiC-
bamboo, following 3D-VRH model Parameters associated with charge transport Direction for
resistance measurement
Cross over temper-ature (K)
Temp. Segment (K
To × 105 (K)
Density of states at Fermi level, N(EF) (eV-1cm-3
Polaron radius (rp) (Å)
Hopping distance between adjacent sites (Å)
Hopping Energy(eV)
28-162 0.24 1.77×10²³ 3.66 5.48 0.008 Parallel to plant growth axis
162 162-1075 7.06 1.76×10²² 2.56 5.59 0.078
28-256 0.27 7.32×10²³ 2.19 3.06 0.001 Perpendicular to plant growth axis
256 256-983 3.46 5.29×10²¹ 4.86 8.85 0.065
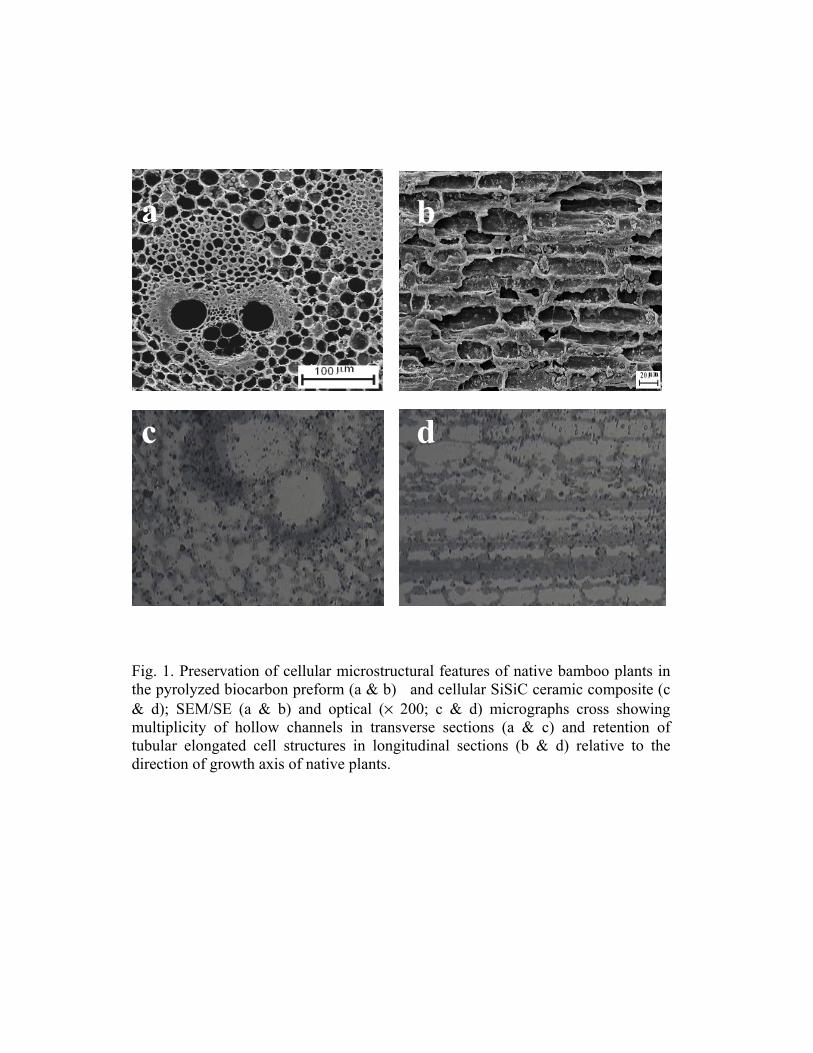
Fig. 1. Preservation of cellular microstructural features of native bamboo plants in the pyrolyzed biocarbon preform (a & b) and cellular SiSiC ceramic composite (c & d); SEM/SE (a & b) and optical (× 200; c & d) micrographs cross showing multiplicity of hollow channels in transverse sections (a & c) and retention of tubular elongated cell structures in longitudinal sections (b & d) relative to the direction of growth axis of native plants.
a b
c d

0 10 20 30 40 50 60 70 80
0
100
200
300
400
500
600
C
Siβ-SiC
α-SiC
Inte
nsity
(A.U
.)
2θ
Fig.2. XRD scan of cellular Si/SiC-bamboo showing the presence of Si and β-SiC as the major crystalline phases.
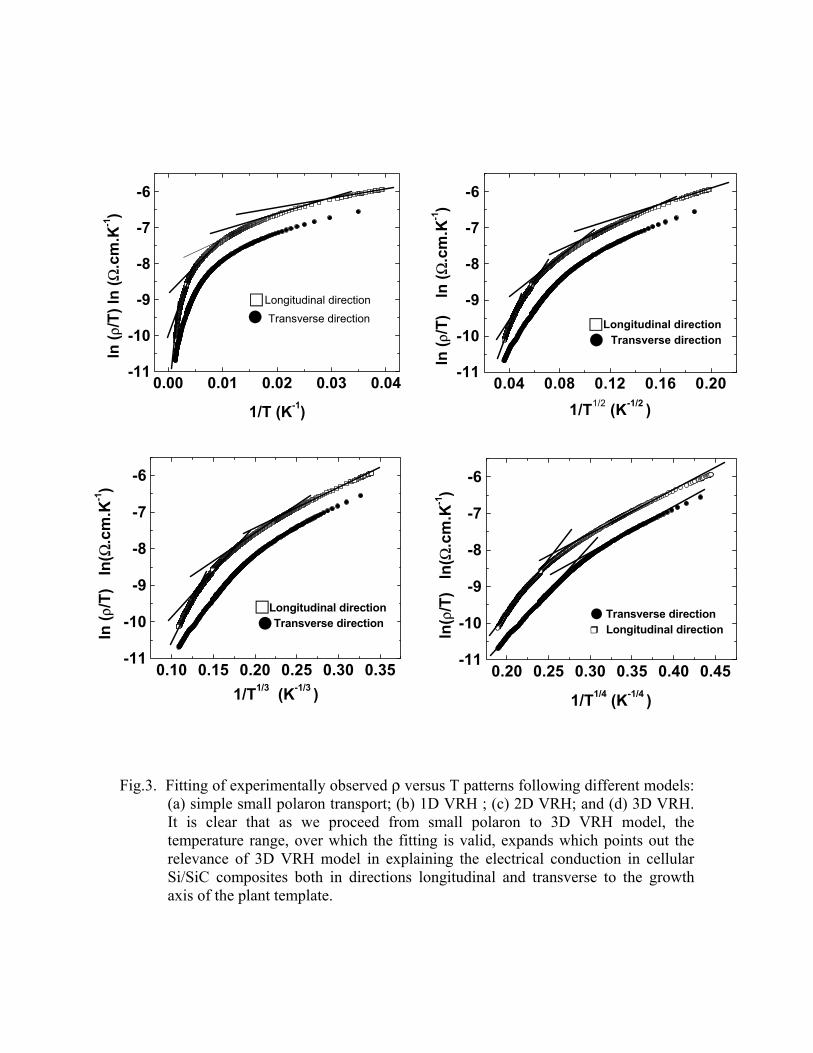
Fig.3. Fitting of experimentally observed ρ versus T patterns following different models:
(a) simple small polaron transport; (b) 1D VRH ; (c) 2D VRH; and (d) 3D VRH. It is clear that as we proceed from small polaron to 3D VRH model, the temperature range, over which the fitting is valid, expands which points out the relevance of 3D VRH model in explaining the electrical conduction in cellular Si/SiC composites both in directions longitudinal and transverse to the growth axis of the plant template.
0.00 0.01 0.02 0.03 0.04-11
-10
-9
-8
-7
-6
Longitudinal directionTransverse direction
ln (ρ
/T) l
n (Ω
.cm
.K-1)
1/T (K-1)
0.04 0.08 0.12 0.16 0.20-11
-10
-9
-8
-7
-6
Longitudinal directionTransverse direction
ln (ρ
/T)
ln
(Ω.c
m.K
-1)
1/T1/2 (K-1/2 )
0.10 0.15 0.20 0.25 0.30 0.35-11
-10
-9
-8
-7
-6
Longitudinal directionTransverse direction
ln (ρ
/T)
ln(Ω
.cm
.K-1)
1/T1/3 (K-1/3 )0.20 0.25 0.30 0.35 0.40 0.45
-11
-10
-9
-8
-7
-6
ln(ρ
/T)
ln(Ω
.cm
.K-1)
1/T1/4 (K-1/4 )
Transverse direction Longitudinal direction
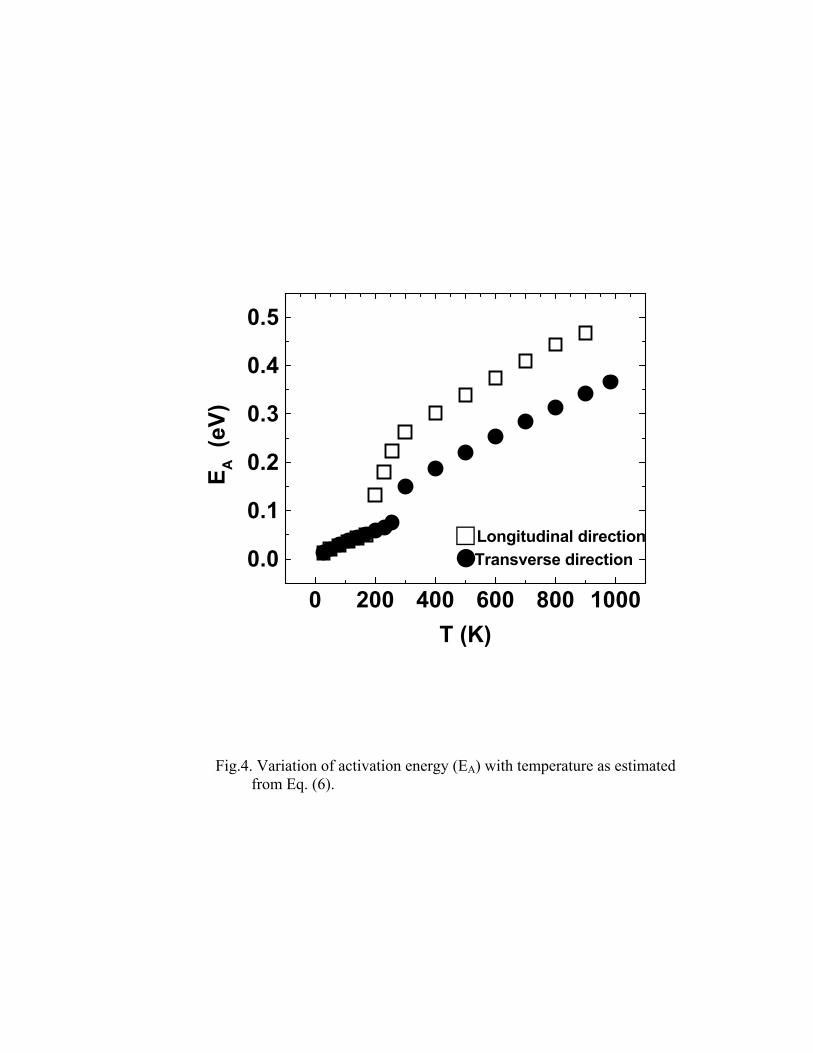
Fig.4. Variation of activation energy (EA) with temperature as estimated
from Eq. (6).
0 200 400 600 800 1000
0.0
0.1
0.2
0.3
0.4
0.5
Transverse directionLongitudinal direction
EA
(eV)
T (K)

Fig.5. Temperature dependence of thermoelectric power of cellular Si/SiC ceramic composites synthesized from bamboos in direction parallel (a) and perpendicular (b) to the plant growth axis; variation in charge carrier concentration with thermoelectric power in directions parallel (c) and perpendicular (d) to plant growth axis.
50 100 150 200 250 300 350
15
20
25
30
35
40
Ther
moe
lect
ric p
ower
(µV
K-1)
T (K)
(a)
50 100 150 200 250 300 350
10
15
20
25
30
35
Ther
moe
lect
ric P
ower
(µV
K-1)
T (K)
(b)
0.39 0.40 0.41 0.42 0.43 0.44 0.45 0.46
15
20
25
30
35
40
Ther
moe
lect
ric p
ower
(µVK
-1)
Charge carrier concentration (c)
(c)
0.40 0.42 0.44 0.46 0.48
10
15
20
25
30
35Th
erm
oele
ctric
Pow
er (µ
VK-1)
Charge Carrier Concentration (c)
(d)

Fig.6. (color online) Si2p and C1s XPS spectra for the longitudinal and transverse
directions.
96 98 100 102 104 106 108
0
500
1000
1500
2000
2500
3000
3500
280 282 284 286 288 290
0
500
1000
1500
2000
2500
3000
3500
Si2p (Longitudinal)
Cou
nts
BindingEnergy (eV)
Data Fit Si SiC Si-O-C
BindingEnergy (eV)
Data Fit SiC C Si-O-C
C1s (Longitudinal)
98 100 102 104 106
0
500
1000
1500
2000
2500
3000
3500
280 282 284 286 2880
1000
2000
3000
4000
5000
6000
7000
8000Si2p (Transverse)
Cou
nts
BindingEnergy (eV)
Data Fit Si SiC Si-O-C
BindingEnergy (eV)
Data Fit SiC C Si-O-C
C1s (Transverse)