Electric and Magnetic Field (EMF) Modeling Analysis for the ...
26
Electric and Magnetic Field (EMF) Modeling Analysis for the Dartmouth and Westport Reliability Project Prepared for Eversource 1 NSTAR Way Westwood, MA 02090 July 18, 2018 NSTAR Electric Company d/b/a Eversource Energy D.P.U. 19-46 Petition Exhibit L Page 1 of 26
-
Upload
khangminh22 -
Category
Documents
-
view
0 -
download
0
Transcript of Electric and Magnetic Field (EMF) Modeling Analysis for the ...
Electric and Magnetic Field (EMF) Modeling Analysis for the Dartmouth and Westport Reliability Project
Prepared for
Eversource 1 NSTAR Way Westwood, MA 02090
July 18, 2018
NSTAR Electric Company d/b/a Eversource Energy D.P.U. 19-46
Petition Exhibit L Page 1 of 26
i
Table of Contents
Page
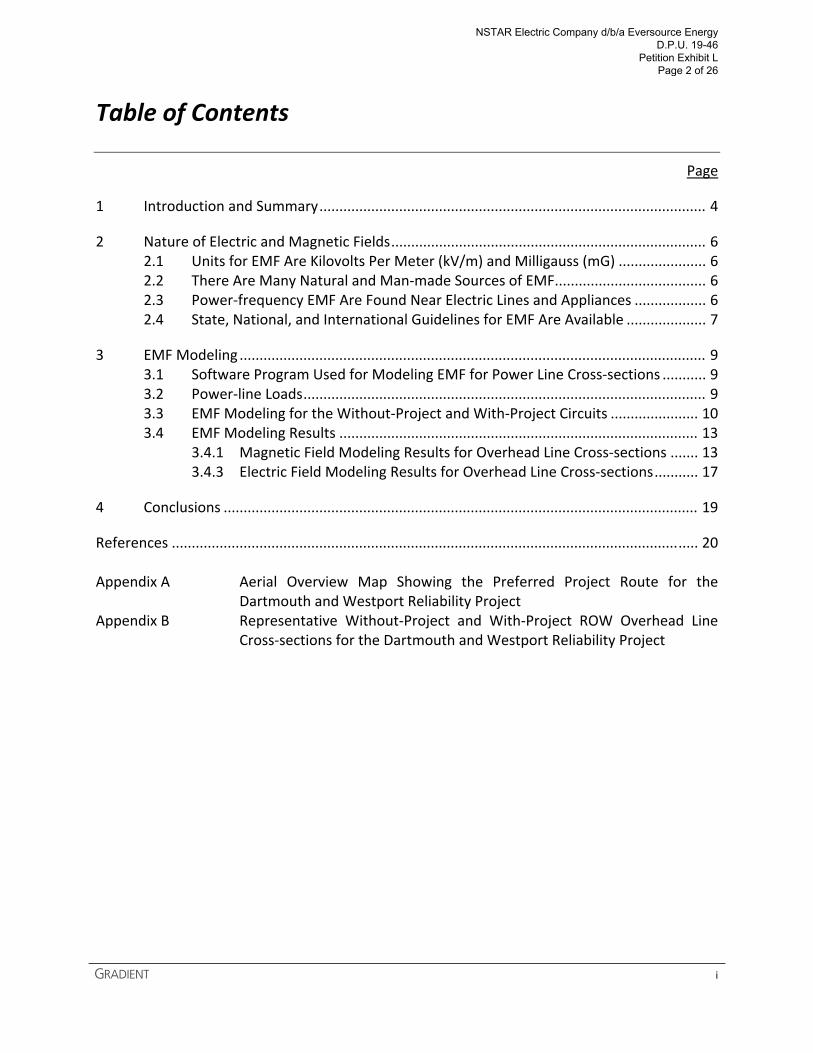
1 Introduction and Summary ................................................................................................. 4
2 Nature of Electric and Magnetic Fields ............................................................................... 6 2.1 Units for EMF Are Kilovolts Per Meter (kV/m) and Milligauss (mG) ...................... 6 2.2 There Are Many Natural and Man‐made Sources of EMF ...................................... 6 2.3 Power‐frequency EMF Are Found Near Electric Lines and Appliances .................. 6 2.4 State, National, and International Guidelines for EMF Are Available .................... 7
3 EMF Modeling ..................................................................................................................... 9 3.1 Software Program Used for Modeling EMF for Power Line Cross‐sections ........... 9 3.2 Power‐line Loads ..................................................................................................... 9 3.3 EMF Modeling for the Without‐Project and With‐Project Circuits ...................... 10 3.4 EMF Modeling Results .......................................................................................... 13
3.4.1 Magnetic Field Modeling Results for Overhead Line Cross‐sections ....... 13 3.4.3 Electric Field Modeling Results for Overhead Line Cross‐sections ........... 17
4 Conclusions ....................................................................................................................... 19
References .................................................................................................................................... 20 Appendix A Aerial Overview Map Showing the Preferred Project Route for the
Dartmouth and Westport Reliability Project Appendix B Representative Without‐Project and With‐Project ROW Overhead Line
Cross‐sections for the Dartmouth and Westport Reliability Project
NSTAR Electric Company d/b/a Eversource Energy D.P.U. 19-46
Petition Exhibit L Page 2 of 26
ii
List of Tables
Table 1.1 Modeled Edge‐of‐ROW Magnetic Field Values at Two System Loads for Three
Representative Overhead Cross‐sections of the Dartmouth and Westport Reliability Project
Table 1.2 Modeled Edge‐of‐ROW Electric Field Values for the Dartmouth and Westport Reliability Project
Table 2.1 60‐Hz EMF Guidelines Established by Health and Safety Organizations
Table 2.2 State EMF Standards and Guidelines for Transmission Lines
Table 3.1 Modeled Without‐Project and With‐Project Electric Current (A) and Voltages (kV) by Load Scenario for 115‐kV Transmission Lines in ROW #144 Between the Cross Road and Fisher Road Substations
Table 3.2 Modeled Without‐Project and With‐Project Electric Current (A) and Voltages (kV) by Load Scenario for 13.2‐kV Distribution Lines in ROW #144 Between the Cross Road and Fisher Road Substations
Table 3.3 Summary of Without‐Project and With‐Project Modeled Peak Edge‐of‐ROW and Within‐ROW Magnetic Field Values by Overhead Cross‐section and Load Scenario
Table 3.4 Summary of Without‐Project and With‐Project Modeled Peak Edge‐of‐ROW and Within‐ROW Electric Field Values for the Representative Overhead Line Cross‐sections
NSTAR Electric Company d/b/a Eversource Energy D.P.U. 19-46
Petition Exhibit L Page 3 of 26

iii
List of Figures
Figure 3.1 Schematic of the Conductor and Phase Configuration for the Proposed #111 115‐kV
Transmission Line
Figure 3.2 Schematic of the Conductor and Phase Configuration for the Existing #109 115‐kV Transmission Line
Figure 3.3 Schematic of the Conductor and Phase Configuration for the Existing #525 and #531 13.2‐kV Distribution Lines in ROW #144
Figure 3.4 Cross Road Substation to State Road Cross‐section: Without‐Project and With‐Project Modeled Magnetic Field Values at Projected Non‐emergency Summer Peak 2018 Load Level and Average 2018 Load Level
Figure 3.5 State Road to UMass Dartmouth Campus Cross‐section: Without‐Project and With‐Project Modeled Magnetic Field Values at Projected Non‐emergency Summer Peak 2018 Load Level and Average 2018 Load Level
Figure 3.6 UMass Dartmouth Campus to Fisher Road Substation Cross‐section: Without‐Project and With‐Project Modeled Magnetic Field Values at Projected Non‐emergency Summer Peak 2018 Load Level and Average 2018 Load Level
Figure 3.7 Without‐Project and With‐Project Modeled Electric Field Values for the Representative Overhead Line Cross‐sections
NSTAR Electric Company d/b/a Eversource Energy D.P.U. 19-46
Petition Exhibit L Page 4 of 26
4
1 Introduction and Summary
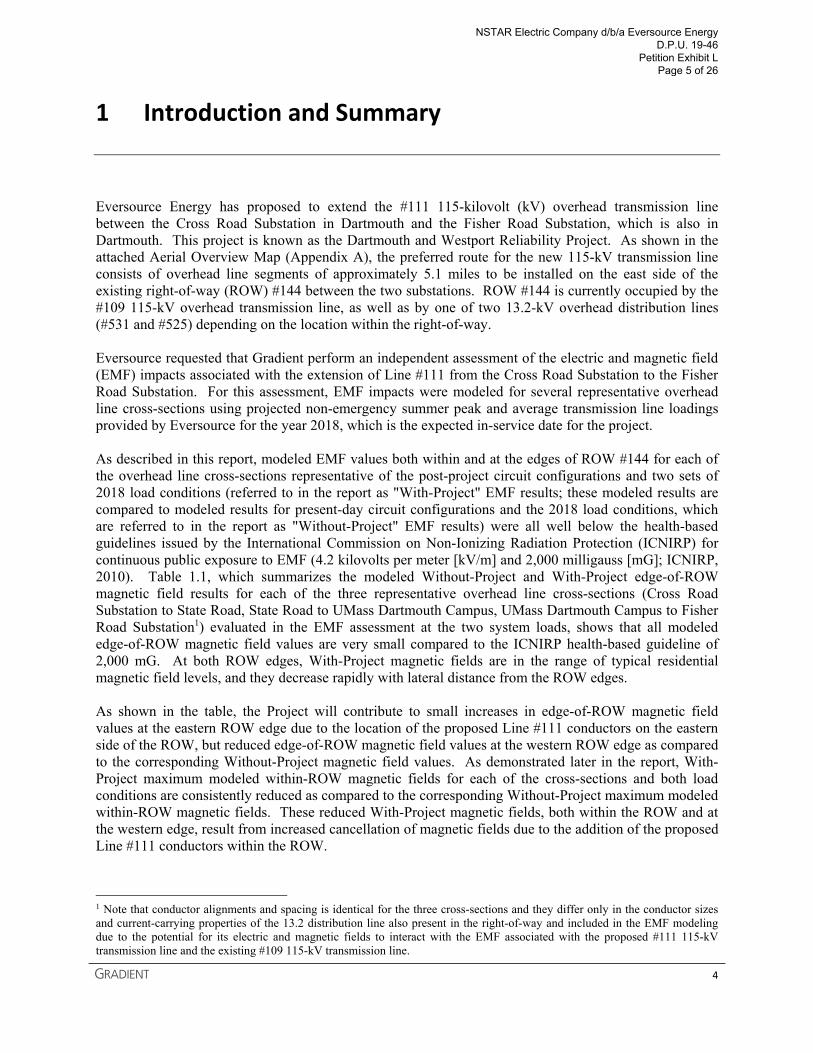
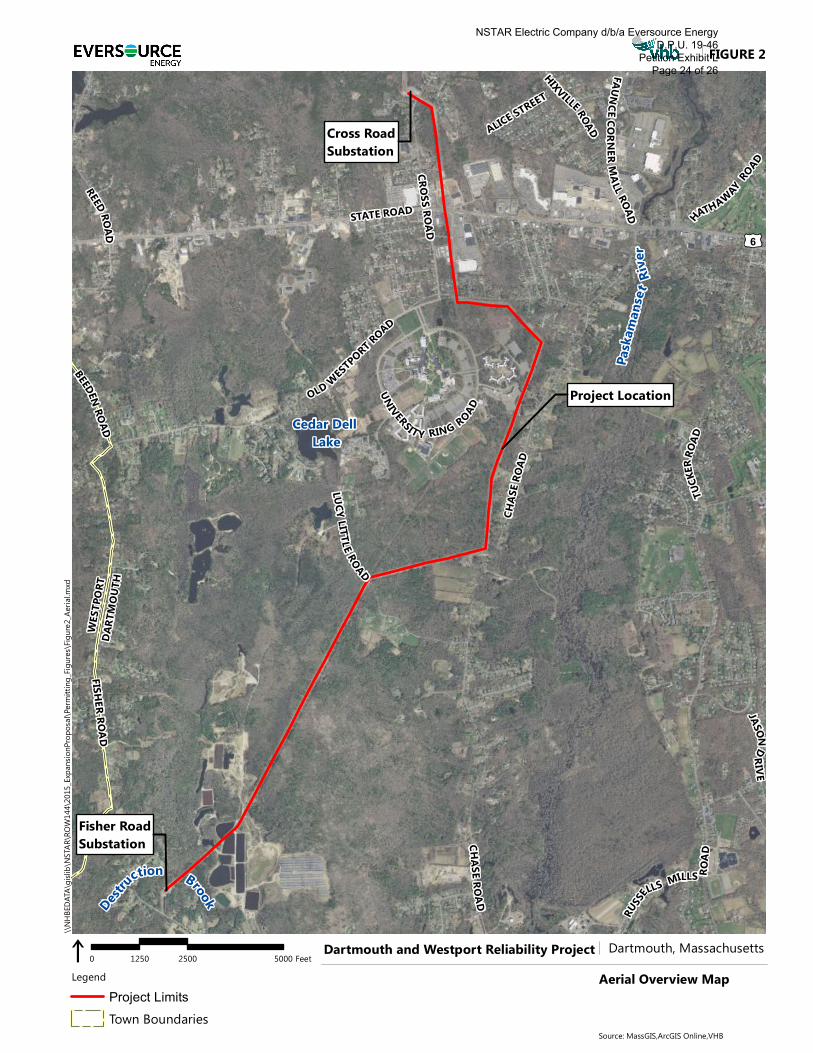
Eversource Energy has proposed to extend the #111 115-kilovolt (kV) overhead transmission line between the Cross Road Substation in Dartmouth and the Fisher Road Substation, which is also in Dartmouth. This project is known as the Dartmouth and Westport Reliability Project. As shown in the attached Aerial Overview Map (Appendix A), the preferred route for the new 115-kV transmission line consists of overhead line segments of approximately 5.1 miles to be installed on the east side of the existing right-of-way (ROW) #144 between the two substations. ROW #144 is currently occupied by the #109 115-kV overhead transmission line, as well as by one of two 13.2-kV overhead distribution lines (#531 and #525) depending on the location within the right-of-way. Eversource requested that Gradient perform an independent assessment of the electric and magnetic field (EMF) impacts associated with the extension of Line #111 from the Cross Road Substation to the Fisher Road Substation. For this assessment, EMF impacts were modeled for several representative overhead line cross-sections using projected non-emergency summer peak and average transmission line loadings provided by Eversource for the year 2018, which is the expected in-service date for the project. As described in this report, modeled EMF values both within and at the edges of ROW #144 for each of the overhead line cross-sections representative of the post-project circuit configurations and two sets of 2018 load conditions (referred to in the report as "With-Project" EMF results; these modeled results are compared to modeled results for present-day circuit configurations and the 2018 load conditions, which are referred to in the report as "Without-Project" EMF results) were all well below the health-based guidelines issued by the International Commission on Non-Ionizing Radiation Protection (ICNIRP) for continuous public exposure to EMF (4.2 kilovolts per meter [kV/m] and 2,000 milligauss [mG]; ICNIRP, 2010). Table 1.1, which summarizes the modeled Without-Project and With-Project edge-of-ROW magnetic field results for each of the three representative overhead line cross-sections (Cross Road Substation to State Road, State Road to UMass Dartmouth Campus, UMass Dartmouth Campus to Fisher Road Substation1) evaluated in the EMF assessment at the two system loads, shows that all modeled edge-of-ROW magnetic field values are very small compared to the ICNIRP health-based guideline of 2,000 mG. At both ROW edges, With-Project magnetic fields are in the range of typical residential magnetic field levels, and they decrease rapidly with lateral distance from the ROW edges. As shown in the table, the Project will contribute to small increases in edge-of-ROW magnetic field values at the eastern ROW edge due to the location of the proposed Line #111 conductors on the eastern side of the ROW, but reduced edge-of-ROW magnetic field values at the western ROW edge as compared to the corresponding Without-Project magnetic field values. As demonstrated later in the report, With-Project maximum modeled within-ROW magnetic fields for each of the cross-sections and both load conditions are consistently reduced as compared to the corresponding Without-Project maximum modeled within-ROW magnetic fields. These reduced With-Project magnetic fields, both within the ROW and at the western edge, result from increased cancellation of magnetic fields due to the addition of the proposed Line #111 conductors within the ROW.
1 Note that conductor alignments and spacing is identical for the three cross-sections and they differ only in the conductor sizes and current-carrying properties of the 13.2 distribution line also present in the right-of-way and included in the EMF modeling due to the potential for its electric and magnetic fields to interact with the EMF associated with the proposed #111 115-kV transmission line and the existing #109 115-kV transmission line.
NSTAR Electric Company d/b/a Eversource Energy D.P.U. 19-46
Petition Exhibit L Page 5 of 26
5
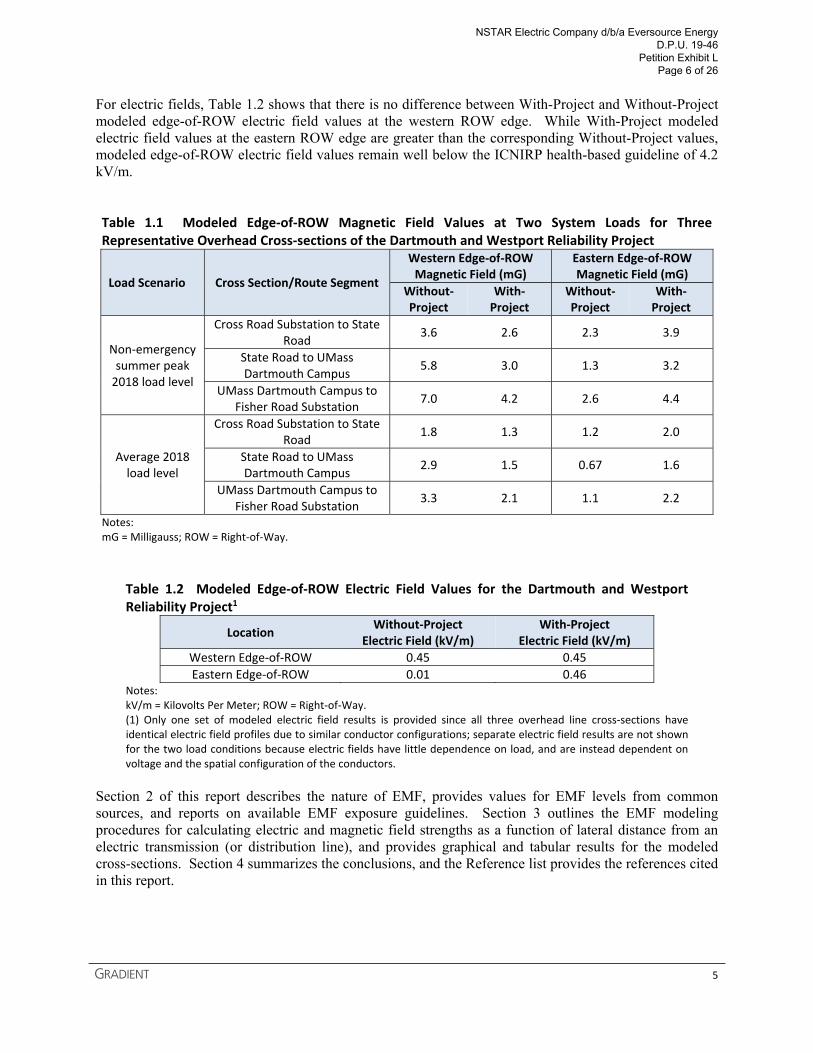
For electric fields, Table 1.2 shows that there is no difference between With-Project and Without-Project modeled edge-of-ROW electric field values at the western ROW edge. While With-Project modeled electric field values at the eastern ROW edge are greater than the corresponding Without-Project values, modeled edge-of-ROW electric field values remain well below the ICNIRP health-based guideline of 4.2 kV/m. Table 1.1 Modeled Edge‐of‐ROW Magnetic Field Values at Two System Loads for Three Representative Overhead Cross‐sections of the Dartmouth and Westport Reliability Project
Load Scenario Cross Section/Route Segment
Western Edge‐of‐ROW Magnetic Field (mG)
Eastern Edge‐of‐ROW Magnetic Field (mG)
Without‐Project
With‐Project
Without‐Project
With‐Project
Non‐emergency summer peak 2018 load level
Cross Road Substation to State Road
3.6 2.6 2.3 3.9
State Road to UMass Dartmouth Campus
5.8 3.0 1.3 3.2
UMass Dartmouth Campus to Fisher Road Substation
7.0 4.2 2.6 4.4
Average 2018 load level
Cross Road Substation to State Road
1.8 1.3 1.2 2.0
State Road to UMass Dartmouth Campus
2.9 1.5 0.67 1.6
UMass Dartmouth Campus to Fisher Road Substation
3.3 2.1 1.1 2.2
Notes: mG = Milligauss; ROW = Right‐of‐Way.
Table 1.2 Modeled Edge‐of‐ROW Electric Field Values for the Dartmouth and Westport Reliability Project1
Location Without‐Project
Electric Field (kV/m) With‐Project
Electric Field (kV/m)
Western Edge‐of‐ROW 0.45 0.45
Eastern Edge‐of‐ROW 0.01 0.46 Notes: kV/m = Kilovolts Per Meter; ROW = Right‐of‐Way. (1) Only one set of modeled electric field results is provided since all three overhead line cross‐sections have identical electric field profiles due to similar conductor configurations; separate electric field results are not shown for the two load conditions because electric fields have little dependence on load, and are instead dependent on voltage and the spatial configuration of the conductors.
Section 2 of this report describes the nature of EMF, provides values for EMF levels from common sources, and reports on available EMF exposure guidelines. Section 3 outlines the EMF modeling procedures for calculating electric and magnetic field strengths as a function of lateral distance from an electric transmission (or distribution line), and provides graphical and tabular results for the modeled cross-sections. Section 4 summarizes the conclusions, and the Reference list provides the references cited in this report.
NSTAR Electric Company d/b/a Eversource Energy D.P.U. 19-46
Petition Exhibit L Page 6 of 26

6
2 Nature of Electric and Magnetic Fields
All matter contains electrically charged particles. Most objects are electrically neutral because positive and negative charges are present in equal numbers. When the balance of electric charges is altered, we experience electrical effects, such as the static electricity attraction between a comb and our hair or drawing sparks after walking on a synthetic rug in the wintertime. Electrical effects occur both in nature and through our society's use of electric power (generation, transmission, consumption).
2.1 Units for EMF Are Kilovolts Per Meter (kV/m) and Milligauss (mG)
The electrical tension on utility power lines is expressed in volts or kilovolts (1 kV = 1,000 V). Voltage is the "pressure" of the electricity and can be envisioned as analogous to the pressure of water in a plumbing system. The existence of a voltage difference between power lines and ground results in an "electric field," usually expressed in units of kilovolts per meter (kV/m). The size of the electric field depends on the voltage, the separation between lines and ground, and other factors. Power lines also carry an electric current that creates a "magnetic field." The units for electric current are amperes (A) and are a measure of the "flow" of electricity. Electric current can be envisioned as analogous to the flow of water in a plumbing system. The magnetic field produced by an electric current is usually expressed in units of gauss (G) or milligauss (mG) (1 G = 1,000 mG). Another unit for magnetic field levels is the microtesla (μT) (1 μT = 10 mG). The size of the magnetic field depends on the electric current, the distance to the current-carrying conductor, and other factors.
2.2 There Are Many Natural and Man‐made Sources of EMF
Everyone experiences a variety of natural and man-made EMF. EMF levels can be slowly varying or steady (often called "direct current" or "DC fields"), or can vary in time (often called "alternating current" or "AC fields"). When the time variation of interest corresponds to that of power line currents (i.e., 60 cycles per second), the fields are called "60-hertz (Hz)" EMF. Man-made magnetic fields are common in everyday life. For example, many childhood toys contain magnets. Such permanent magnets generate strong, steady (DC) magnetic fields. Typical toy magnets (e.g., "refrigerator door" magnets) have fields of 100,000-500,000 mG. On a larger scale, the Earth's core also creates a steady DC magnetic field that can be easily demonstrated with a compass needle. The size of Earth's magnetic field in the northern US is about 550 mG (over 100 times smaller than fields generated by "refrigerator door" magnets).
2.3 Power‐frequency EMF Are Found Near Electric Lines and Appliances
Electric power transmission lines, distribution lines, and electrical wiring in buildings carry AC currents and voltages that change size and direction at a frequency of 60 Hz. These 60-Hz currents and voltages create 60-Hz EMF nearby. The size of the magnetic field is proportional to the line current, and the size of the electric field is proportional to the line voltage. The EMF associated with electrical wires and electrical equipment decrease rapidly with increasing distance away from the electrical wires.
NSTAR Electric Company d/b/a Eversource Energy D.P.U. 19-46
Petition Exhibit L Page 7 of 26
7
When EMF derives from different wires that are in close proximity, or adjacent to one another, the size of the net EMF produced will be somewhere in the range between the sum of EMF from the individual sources and the difference of the EMF from the individual sources. EMF may partially add, or partially cancel, but generally, because adjacent wires are often carrying current in opposite directions, the EMF produced tends not to be additive. EMF in the home arise from electric appliances, indoor wiring, grounding currents on pipes and ground wires, and outdoor distribution or transmission circuits. Inside residences, typical baseline 60-Hz magnetic fields (away from appliances) range from 0.5-5.0 mG. Higher 60-Hz magnetic field levels are found near operating appliances. For example, can openers, mixers, blenders, refrigerators, fluorescent lamps, electric ranges, clothes washers, toasters, portable heaters, vacuum cleaners, electric tools, and many other appliances generate magnetic fields of size 40-300 mG at distances of 1 foot (NIEHS, 2002). Magnetic fields from personal care appliances held within half a foot (e.g., shavers, hair dryers, massagers) can produce average fields of 600-700 mG. At school and in the workplace, lights, motors, copy machines, vending machines, video-display terminals, pencil sharpeners, electric tools, electric heaters, and building wiring are all sources of 60-Hz magnetic fields.
2.4 State, National, and International Guidelines for EMF Are Available
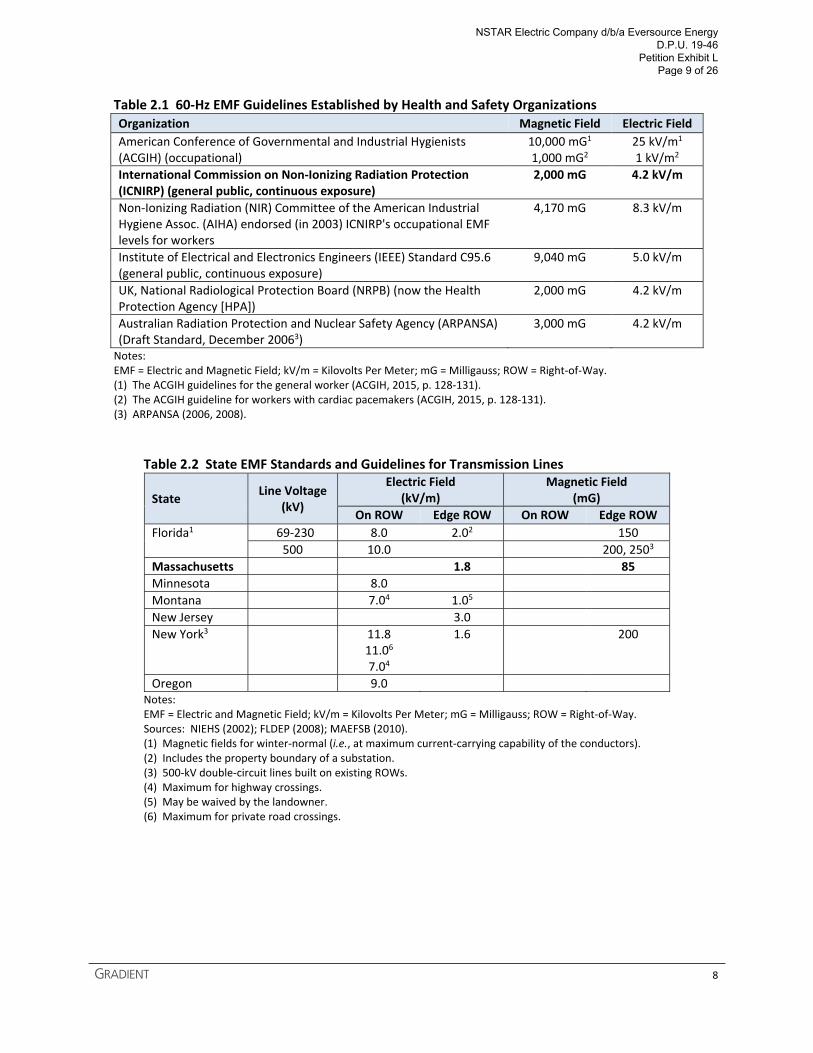
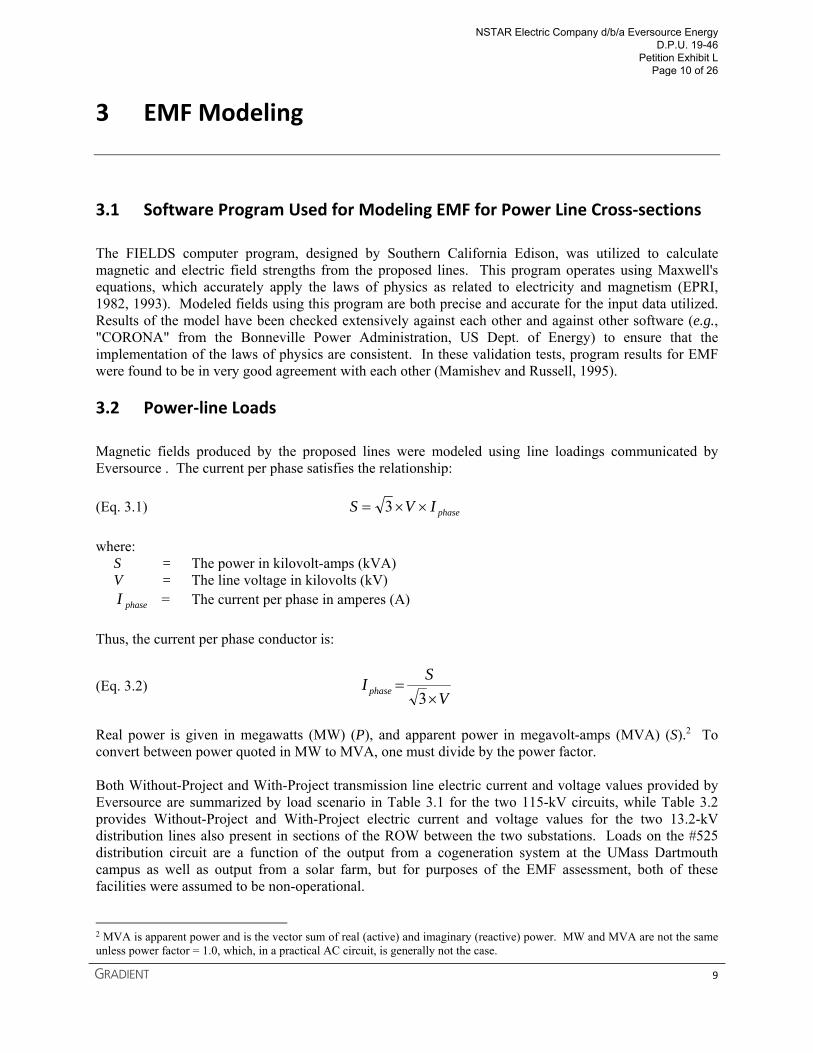
The US has no federal standards limiting occupational or residential exposure to 60-Hz EMF. Table 2.1 shows guidelines suggested by national and international health organizations that are designed to be protective against any adverse health effects. The limit values should not be viewed as demarcation lines between safe and dangerous levels of EMF, but rather, levels that assure safety with an adequate margin of safety to allow for uncertainties in the science. As part of its International EMF Project, the World Health Organization (WHO) has conducted comprehensive reviews of EMF health effects research and existing standards and guidelines, with the WHO website for the International EMF Project (WHO, 2018) noting that, "The main conclusion from the WHO reviews is that EMF exposures below the limits recommended in the ICNIRP international guidelines do not appear to have any known consequence on health." Table 2.2 lists guidelines that have been adopted by various states in the US. State guidelines are not health-effect based and have typically been adopted to maintain the status quo for EMF on and near transmission line ROWs.
NSTAR Electric Company d/b/a Eversource Energy D.P.U. 19-46
Petition Exhibit L Page 8 of 26
8
Table 2.1 60‐Hz EMF Guidelines Established by Health and Safety Organizations
Organization Magnetic Field Electric Field
American Conference of Governmental and Industrial Hygienists (ACGIH) (occupational)
10,000 mG1 1,000 mG2
25 kV/m1 1 kV/m2
International Commission on Non‐Ionizing Radiation Protection (ICNIRP) (general public, continuous exposure)
2,000 mG 4.2 kV/m
Non‐Ionizing Radiation (NIR) Committee of the American Industrial Hygiene Assoc. (AIHA) endorsed (in 2003) ICNIRP's occupational EMF levels for workers
4,170 mG 8.3 kV/m
Institute of Electrical and Electronics Engineers (IEEE) Standard C95.6 (general public, continuous exposure)
9,040 mG 5.0 kV/m
UK, National Radiological Protection Board (NRPB) (now the Health Protection Agency [HPA])
2,000 mG 4.2 kV/m
Australian Radiation Protection and Nuclear Safety Agency (ARPANSA) (Draft Standard, December 20063)
3,000 mG 4.2 kV/m
Notes: EMF = Electric and Magnetic Field; kV/m = Kilovolts Per Meter; mG = Milligauss; ROW = Right‐of‐Way. (1) The ACGIH guidelines for the general worker (ACGIH, 2015, p. 128‐131). (2) The ACGIH guideline for workers with cardiac pacemakers (ACGIH, 2015, p. 128‐131). (3) ARPANSA (2006, 2008).
Table 2.2 State EMF Standards and Guidelines for Transmission Lines
State Line Voltage
(kV)
Electric Field (kV/m)
Magnetic Field (mG)
On ROW Edge ROW On ROW Edge ROW
Florida1 69‐230 8.0 2.02 150
500 10.0 200, 2503
Massachusetts 1.8 85
Minnesota 8.0
Montana 7.04 1.05
New Jersey 3.0
New York3 11.8 11.06 7.04
1.6 200
Oregon 9.0 Notes: EMF = Electric and Magnetic Field; kV/m = Kilovolts Per Meter; mG = Milligauss; ROW = Right‐of‐Way. Sources: NIEHS (2002); FLDEP (2008); MAEFSB (2010). (1) Magnetic fields for winter‐normal (i.e., at maximum current‐carrying capability of the conductors). (2) Includes the property boundary of a substation. (3) 500‐kV double‐circuit lines built on existing ROWs. (4) Maximum for highway crossings. (5) May be waived by the landowner. (6) Maximum for private road crossings.
NSTAR Electric Company d/b/a Eversource Energy D.P.U. 19-46
Petition Exhibit L Page 9 of 26
9
3 EMF Modeling
3.1 Software Program Used for Modeling EMF for Power Line Cross‐sections
The FIELDS computer program, designed by Southern California Edison, was utilized to calculate magnetic and electric field strengths from the proposed lines. This program operates using Maxwell's equations, which accurately apply the laws of physics as related to electricity and magnetism (EPRI, 1982, 1993). Modeled fields using this program are both precise and accurate for the input data utilized. Results of the model have been checked extensively against each other and against other software (e.g., "CORONA" from the Bonneville Power Administration, US Dept. of Energy) to ensure that the implementation of the laws of physics are consistent. In these validation tests, program results for EMF were found to be in very good agreement with each other (Mamishev and Russell, 1995).
3.2 Power‐line Loads
Magnetic fields produced by the proposed lines were modeled using line loadings communicated by Eversource . The current per phase satisfies the relationship:
(Eq. 3.1) phaseIVS 3
where:
S = The power in kilovolt-amps (kVA) V = The line voltage in kilovolts (kV)
phaseI = The current per phase in amperes (A)
Thus, the current per phase conductor is:
(Eq. 3.2) V
SI phase
3
Real power is given in megawatts (MW) (P), and apparent power in megavolt-amps (MVA) (S).2 To convert between power quoted in MW to MVA, one must divide by the power factor. Both Without-Project and With-Project transmission line electric current and voltage values provided by Eversource are summarized by load scenario in Table 3.1 for the two 115-kV circuits, while Table 3.2 provides Without-Project and With-Project electric current and voltage values for the two 13.2-kV distribution lines also present in sections of the ROW between the two substations. Loads on the #525 distribution circuit are a function of the output from a cogeneration system at the UMass Dartmouth campus as well as output from a solar farm, but for purposes of the EMF assessment, both of these facilities were assumed to be non-operational. 2 MVA is apparent power and is the vector sum of real (active) and imaginary (reactive) power. MW and MVA are not the same unless power factor = 1.0, which, in a practical AC circuit, is generally not the case.
NSTAR Electric Company d/b/a Eversource Energy D.P.U. 19-46
Petition Exhibit L Page 10 of 26
10
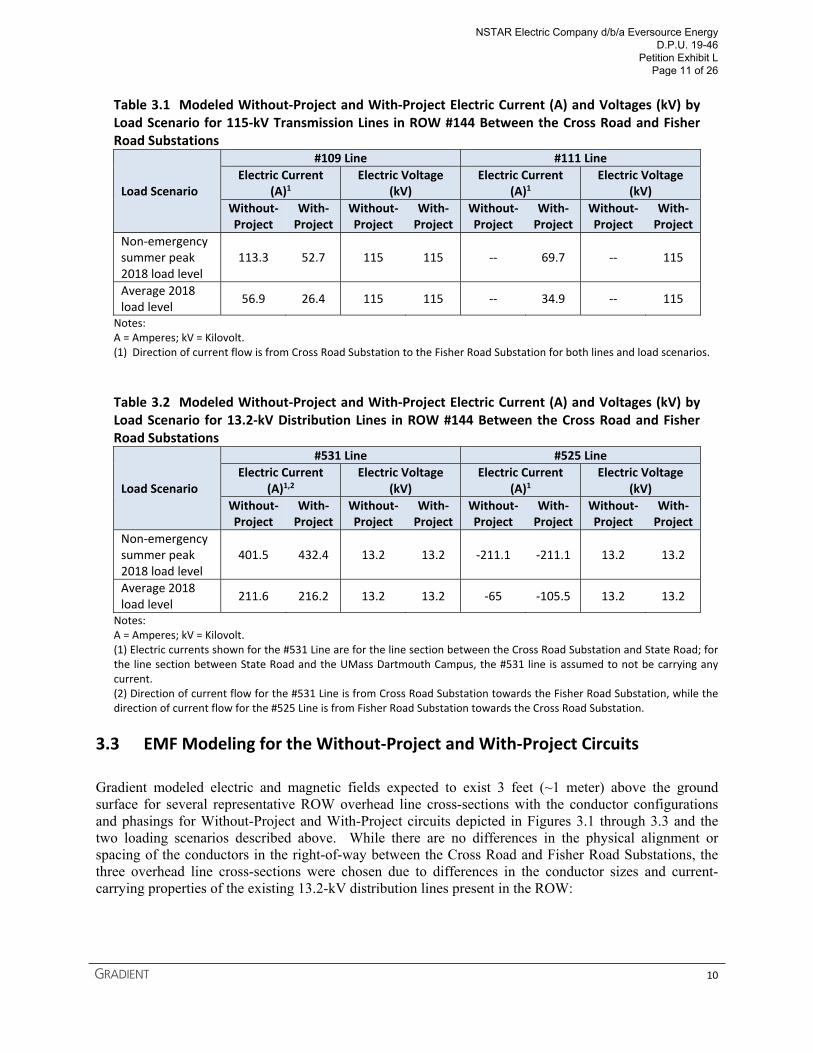
Table 3.1 Modeled Without‐Project and With‐Project Electric Current (A) and Voltages (kV) by Load Scenario for 115‐kV Transmission Lines in ROW #144 Between the Cross Road and Fisher Road Substations
Load Scenario
#109 Line #111 Line
Electric Current (A)1
Electric Voltage (kV)
Electric Current (A)1
Electric Voltage (kV)
Without‐Project
With‐Project
Without‐Project
With‐Project
Without‐Project
With‐Project
Without‐Project
With‐Project
Non‐emergency summer peak 2018 load level
113.3 52.7 115 115 ‐‐ 69.7 ‐‐ 115
Average 2018 load level
56.9 26.4 115 115 ‐‐ 34.9 ‐‐ 115
Notes: A = Amperes; kV = Kilovolt. (1) Direction of current flow is from Cross Road Substation to the Fisher Road Substation for both lines and load scenarios.
Table 3.2 Modeled Without‐Project and With‐Project Electric Current (A) and Voltages (kV) by Load Scenario for 13.2‐kV Distribution Lines in ROW #144 Between the Cross Road and Fisher Road Substations
Load Scenario
#531 Line #525 Line
Electric Current (A)1,2
Electric Voltage (kV)
Electric Current (A)1
Electric Voltage (kV)
Without‐Project
With‐Project
Without‐Project
With‐Project
Without‐Project
With‐Project
Without‐Project
With‐Project
Non‐emergency summer peak 2018 load level
401.5 432.4 13.2 13.2 ‐211.1 ‐211.1 13.2 13.2
Average 2018 load level
211.6 216.2 13.2 13.2 ‐65 ‐105.5 13.2 13.2
Notes: A = Amperes; kV = Kilovolt. (1) Electric currents shown for the #531 Line are for the line section between the Cross Road Substation and State Road; for the line section between State Road and the UMass Dartmouth Campus, the #531 line is assumed to not be carrying any current. (2) Direction of current flow for the #531 Line is from Cross Road Substation towards the Fisher Road Substation, while the direction of current flow for the #525 Line is from Fisher Road Substation towards the Cross Road Substation.
3.3 EMF Modeling for the Without‐Project and With‐Project Circuits
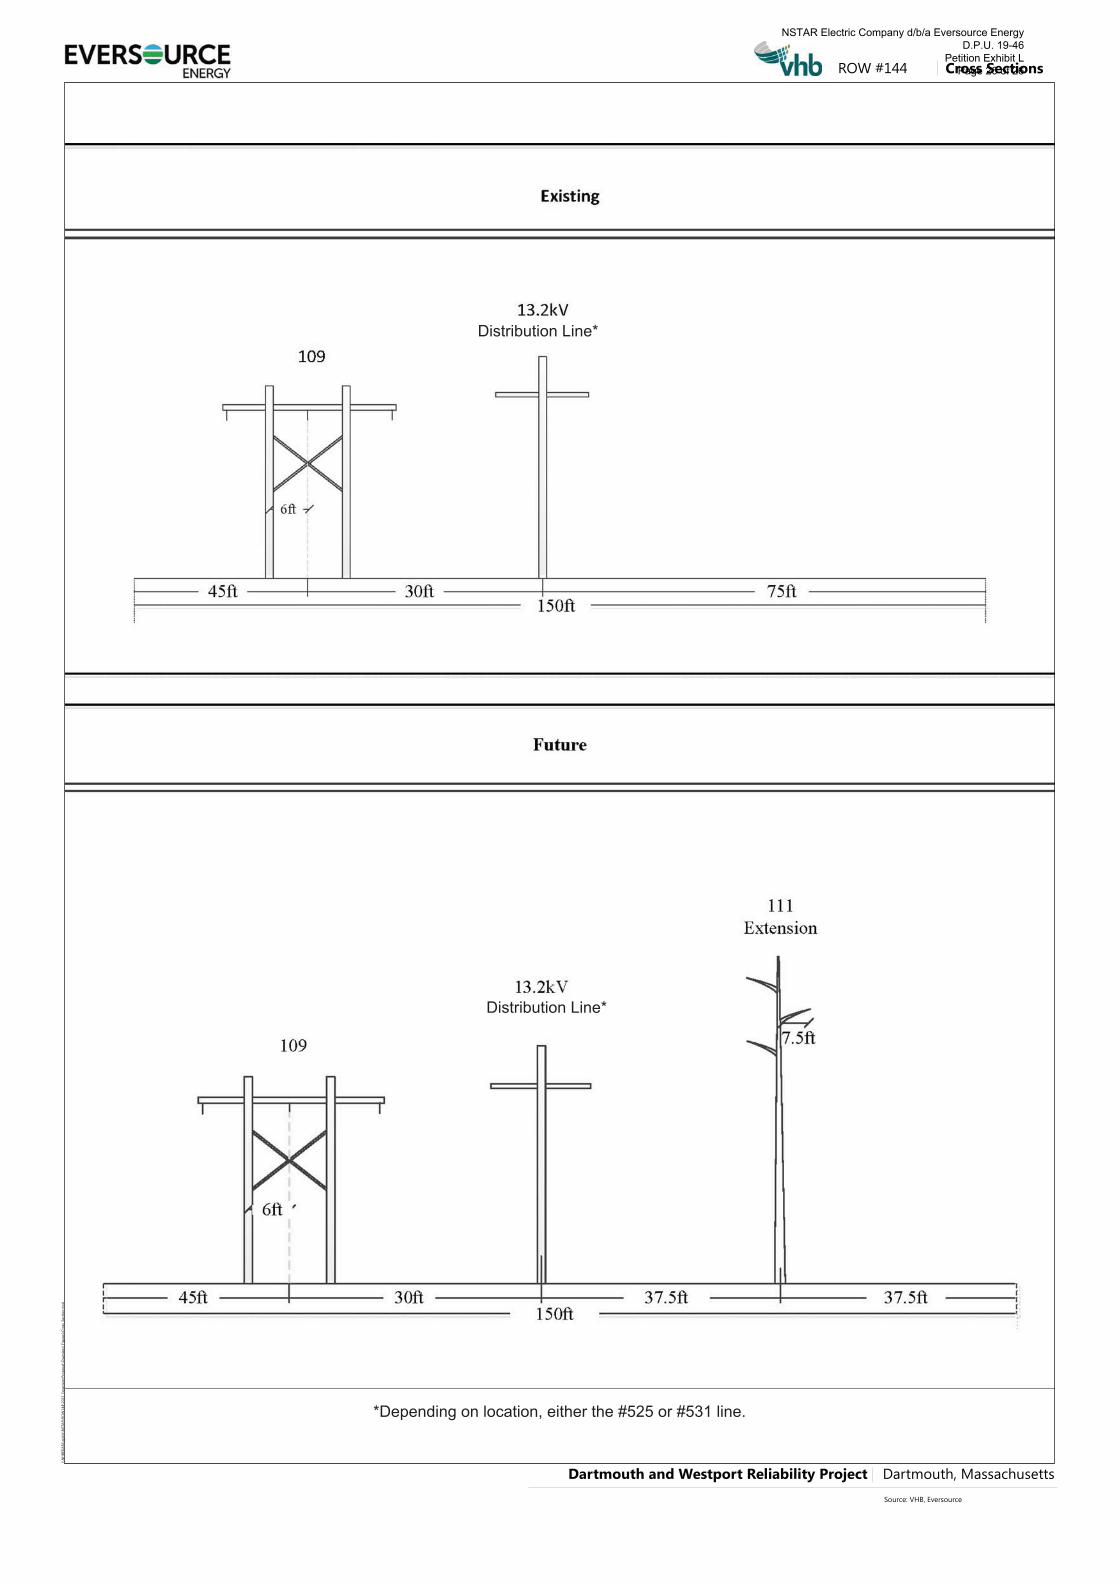
Gradient modeled electric and magnetic fields expected to exist 3 feet (~1 meter) above the ground surface for several representative ROW overhead line cross-sections with the conductor configurations and phasings for Without-Project and With-Project circuits depicted in Figures 3.1 through 3.3 and the two loading scenarios described above. While there are no differences in the physical alignment or spacing of the conductors in the right-of-way between the Cross Road and Fisher Road Substations, the three overhead line cross-sections were chosen due to differences in the conductor sizes and current-carrying properties of the existing 13.2-kV distribution lines present in the ROW:
NSTAR Electric Company d/b/a Eversource Energy D.P.U. 19-46
Petition Exhibit L Page 11 of 26
11
1. Cross Road Substation to State Road Cross-section, which represents the segment where the #531 13.2-kV line is present in the ROW and current is flowing from the substation towards State Road;
2. State Road to UMass Dartmouth Campus Cross-section, which represents the segment where the #531 13.2-kV line is present in the ROW, but is not carrying any current; and
3. UMass Dartmouth Campus to Fisher Road Substation Cross-section, which represents the segment where the #525 13.2-kV line is present in the ROW and current is flowing from the substation towards the UMass Dartmouth Campus.
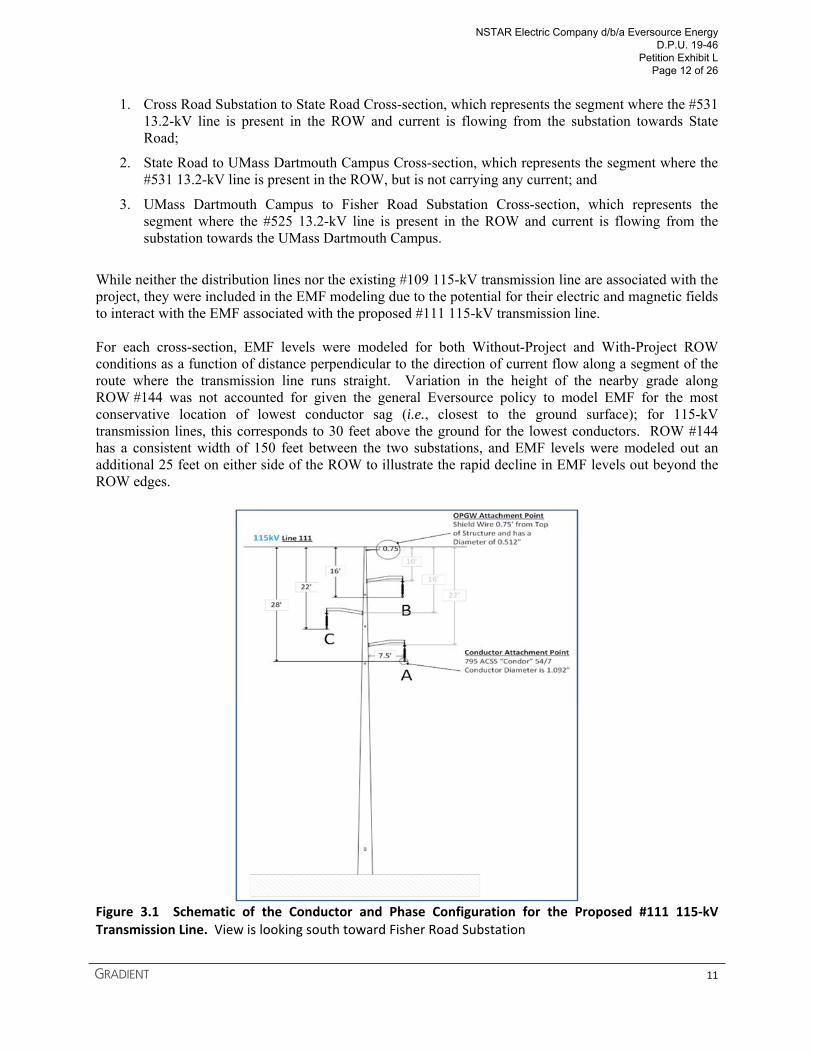
While neither the distribution lines nor the existing #109 115-kV transmission line are associated with the project, they were included in the EMF modeling due to the potential for their electric and magnetic fields to interact with the EMF associated with the proposed #111 115-kV transmission line. For each cross-section, EMF levels were modeled for both Without-Project and With-Project ROW conditions as a function of distance perpendicular to the direction of current flow along a segment of the route where the transmission line runs straight. Variation in the height of the nearby grade along ROW #144 was not accounted for given the general Eversource policy to model EMF for the most conservative location of lowest conductor sag (i.e., closest to the ground surface); for 115-kV transmission lines, this corresponds to 30 feet above the ground for the lowest conductors. ROW #144 has a consistent width of 150 feet between the two substations, and EMF levels were modeled out an additional 25 feet on either side of the ROW to illustrate the rapid decline in EMF levels out beyond the ROW edges.
Figure 3.1 Schematic of the Conductor and Phase Configuration for the Proposed #111 115‐kV Transmission Line. View is looking south toward Fisher Road Substation
NSTAR Electric Company d/b/a Eversource Energy D.P.U. 19-46
Petition Exhibit L Page 12 of 26
12
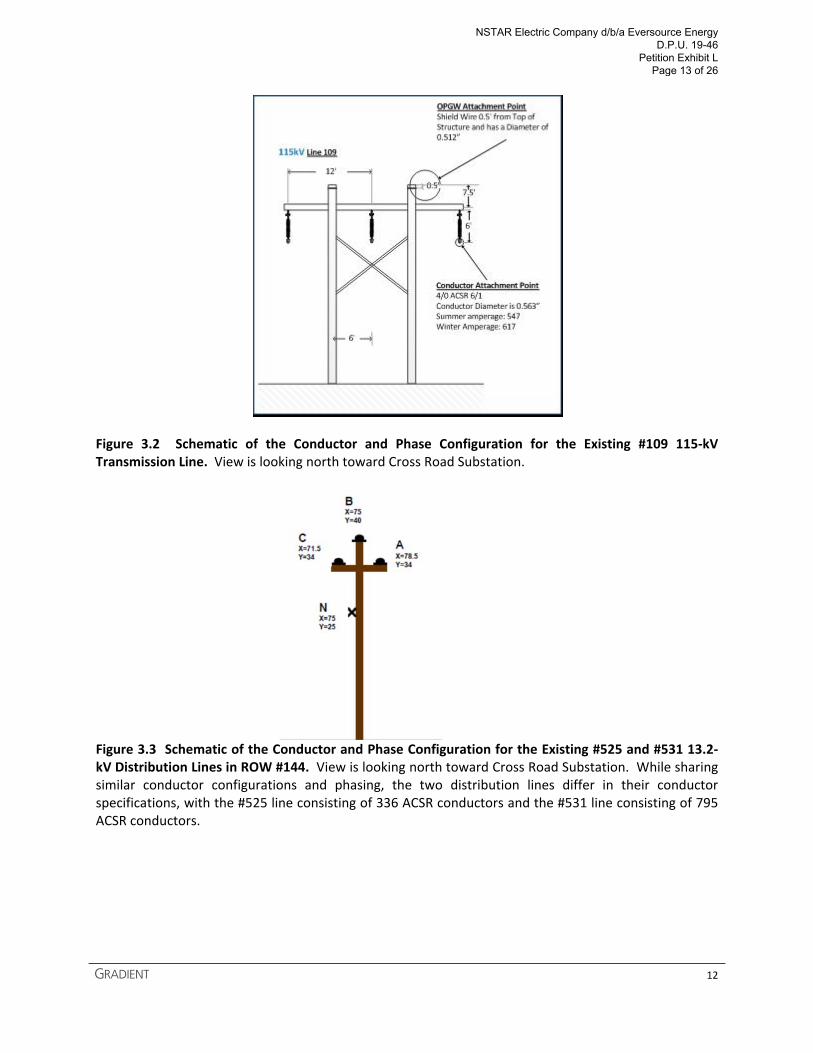
Figure 3.2 Schematic of the Conductor and Phase Configuration for the Existing #109 115‐kV Transmission Line. View is looking north toward Cross Road Substation.
Figure 3.3 Schematic of the Conductor and Phase Configuration for the Existing #525 and #531 13.2‐kV Distribution Lines in ROW #144. View is looking north toward Cross Road Substation. While sharing similar conductor configurations and phasing, the two distribution lines differ in their conductor specifications, with the #525 line consisting of 336 ACSR conductors and the #531 line consisting of 795 ACSR conductors.
NSTAR Electric Company d/b/a Eversource Energy D.P.U. 19-46
Petition Exhibit L Page 13 of 26

13
3.4 EMF Modeling Results
3.4.1 Magnetic Field Modeling Results for Overhead Line Cross‐sections
Detailed results of the magnetic field modeling for the Without-Project and With-Project overhead transmission line cross-sections are summarized in Table 3.3 and Figures 3.4-3.6. As reflected in this table and the figures, With-Project magnetic field values for the overhead transmission line cross-sections all fall below the health-based guideline of the ICNIRP for continuous public exposure to magnetic fields (2,000 mG; ICNIRP, 2010), both at the ROW edges and within ROW #144. Moreover, both the table and figures show that With-Project maximum-modeled within-ROW magnetic field values are less than the corresponding Without-Project maximum-modeled within-ROW value for each of the three cross-sections. Specifically, for the non-emergency summer peak 2018 load level modeling scenario, the With-Project maximum-modeled within-ROW magnetic field values ranged from 7.3-19.5 mG for the three overhead line cross-sections, as compared to the Without-Project maximum-modeled within-ROW magnetic field values of 17.7-23.6 mG. Similarly, for the average 2018 load level modeling scenario, the With-Project maximum-modeled within-ROW magnetic field values ranged from 3.7-9.7 mG for the three overhead line cross-sections and were thus less than the Without-Project maximum-modeled within-ROW magnetic field values of 8.9-12.2 mG. As shown in the table and figures, the Project will contribute to small increases in edge-of-ROW magnetic field values at the eastern ROW edge, but reduced edge-of-ROW magnetic field values at the western ROW edge as compared to the corresponding Without-Project magnetic field values. For both With- and Without-Project modeling results, predicted magnetic fields at the ROW edges are within the range of typical residential magnetic fields, and they will continue to decrease rapidly with increased distance away from the ROW edges.
Table 3.3 Summary of Without‐Project and With‐Project Modeled Peak Edge‐of‐ROW and Within‐ROW Magnetic Field Values by Overhead Cross‐section and Load Scenario
Load Scenario Cross Section/ Route Segment
Western Edge‐of‐ROW Magnetic Field (mG)
Eastern Edge‐of‐ROW Magnetic Field (mG)
Within‐ROW Maximum Magnetic Field (mG)
Without‐Project
With‐Project
Without‐Project
With‐Project
Without‐Project
With‐Project
Non‐emergency
summer peak 2018 load level
Cross Road Substation to State Road
3.6 2.6 2.3 3.9 23.6 19.5
State Road to UMass Dartmouth Campus
5.8 3.0 1.3 3.2 17.7 7.3
UMass Dartmouth Campus to Fisher Road
Substation 7.0 4.2 2.6 4.4 18.8 9.2
Average 2018 load level
Cross Road Substation to State Road
1.8 1.3 1.2 2.0 12.2 9.7
State Road to UMass Dartmouth Campus
2.9 1.5 0.67 1.6 8.9 3.7
UMass Dartmouth Campus to Fisher Road
Substation 3.3 2.1 1.1 2.2 9.1 4.6
Notes: mG = Milligauss; ROW = Right‐of‐Way.
NSTAR Electric Company d/b/a Eversource Energy D.P.U. 19-46
Petition Exhibit L Page 14 of 26
14
(a)
Distance from Center of ROW (ft)
-100 -50 0 50 100
Ma
gne
tic F
ield
(m
G)
0
5
10
15
20
25
Pre-Project FieldPost-Project FieldPost-Project ConductorPre-Project Conductor
ROW Edges
(b)
Distance from Center of ROW (ft)
-100 -50 0 50 100
Mag
netic
Fie
ld (
mG
)
0
5
10
15
20
25Pre-Project FieldPost-Project FieldPost-Project ConductorPre-Project Conductor
ROW Edges
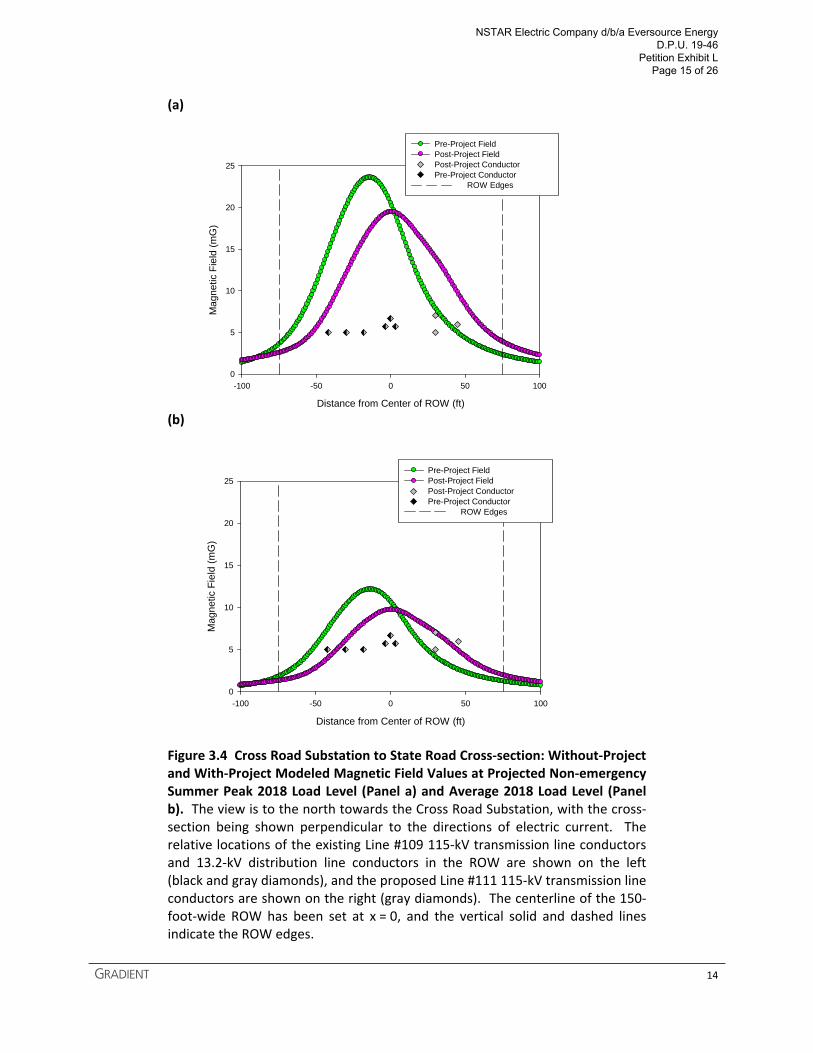
Figure 3.4 Cross Road Substation to State Road Cross‐section: Without‐Project and With‐Project Modeled Magnetic Field Values at Projected Non‐emergency Summer Peak 2018 Load Level (Panel a) and Average 2018 Load Level (Panel b). The view is to the north towards the Cross Road Substation, with the cross‐section being shown perpendicular to the directions of electric current. The relative locations of the existing Line #109 115‐kV transmission line conductors and 13.2‐kV distribution line conductors in the ROW are shown on the left (black and gray diamonds), and the proposed Line #111 115‐kV transmission line conductors are shown on the right (gray diamonds). The centerline of the 150‐foot‐wide ROW has been set at x = 0, and the vertical solid and dashed lines indicate the ROW edges.
NSTAR Electric Company d/b/a Eversource Energy D.P.U. 19-46
Petition Exhibit L Page 15 of 26
15
(a)
Distance from Center of ROW (ft)
-100 -50 0 50 100
Mag
ne
tic F
ield
(m
G)
0
5
10
15
20
25
Pre-Project FieldPost-Project FieldPost-Project ConductorPre-Project Conductor
ROW Edges
(b)
Distance from Center of ROW (ft)
-100 -50 0 50 100
Ma
gne
tic F
ield
(m
G)
0
5
10
15
20
25Pre-Project FieldPost-Project FieldPost-Project ConductorPre-Project Conductor
ROW Edges
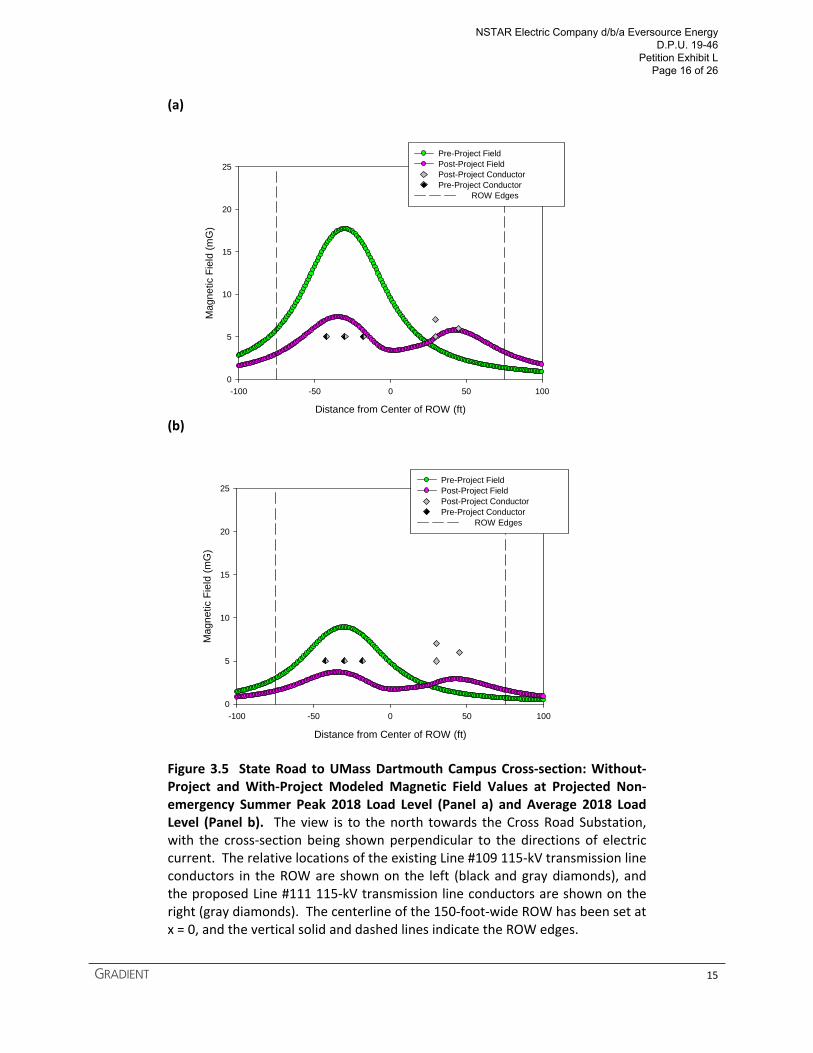
Figure 3.5 State Road to UMass Dartmouth Campus Cross‐section: Without‐Project and With‐Project Modeled Magnetic Field Values at Projected Non‐emergency Summer Peak 2018 Load Level (Panel a) and Average 2018 Load Level (Panel b). The view is to the north towards the Cross Road Substation, with the cross‐section being shown perpendicular to the directions of electric current. The relative locations of the existing Line #109 115‐kV transmission line conductors in the ROW are shown on the left (black and gray diamonds), and the proposed Line #111 115‐kV transmission line conductors are shown on the right (gray diamonds). The centerline of the 150‐foot‐wide ROW has been set at x = 0, and the vertical solid and dashed lines indicate the ROW edges.
NSTAR Electric Company d/b/a Eversource Energy D.P.U. 19-46
Petition Exhibit L Page 16 of 26
16
(a)
Distance from Center of ROW (ft)
-100 -50 0 50 100
Mag
ne
tic F
ield
(m
G)
0
5
10
15
20
25 Pre-Project FieldPost-Project FieldPost-Project ConductorPre-Project Conductor
ROW Edges
(b)
Distance from Center of ROW (ft)
-100 -50 0 50 100
Mag
ne
tic F
ield
(m
G)
0
5
10
15
20
25Pre-Project FieldPost-Project FieldPost-Project ConductorPre-Project Conductor
ROW Edges
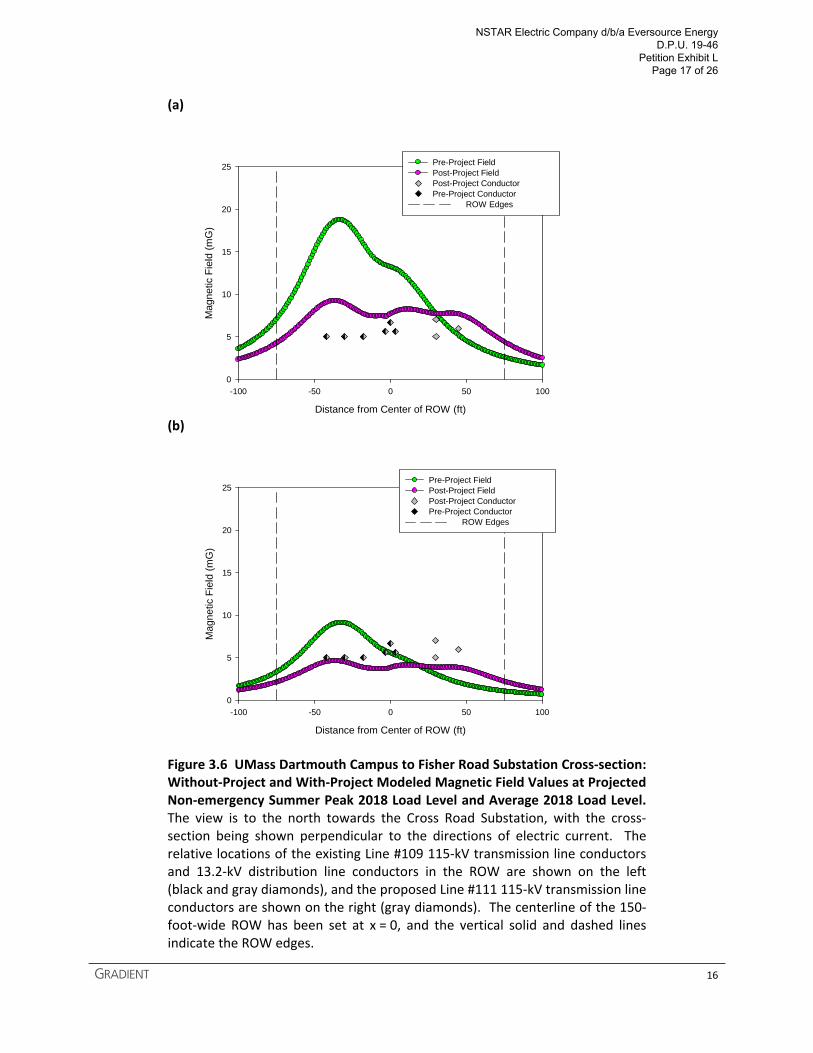
Figure 3.6 UMass Dartmouth Campus to Fisher Road Substation Cross‐section: Without‐Project and With‐Project Modeled Magnetic Field Values at Projected Non‐emergency Summer Peak 2018 Load Level and Average 2018 Load Level. The view is to the north towards the Cross Road Substation, with the cross‐section being shown perpendicular to the directions of electric current. The relative locations of the existing Line #109 115‐kV transmission line conductors and 13.2‐kV distribution line conductors in the ROW are shown on the left (black and gray diamonds), and the proposed Line #111 115‐kV transmission line conductors are shown on the right (gray diamonds). The centerline of the 150‐foot‐wide ROW has been set at x = 0, and the vertical solid and dashed lines indicate the ROW edges.
NSTAR Electric Company d/b/a Eversource Energy D.P.U. 19-46
Petition Exhibit L Page 17 of 26
17
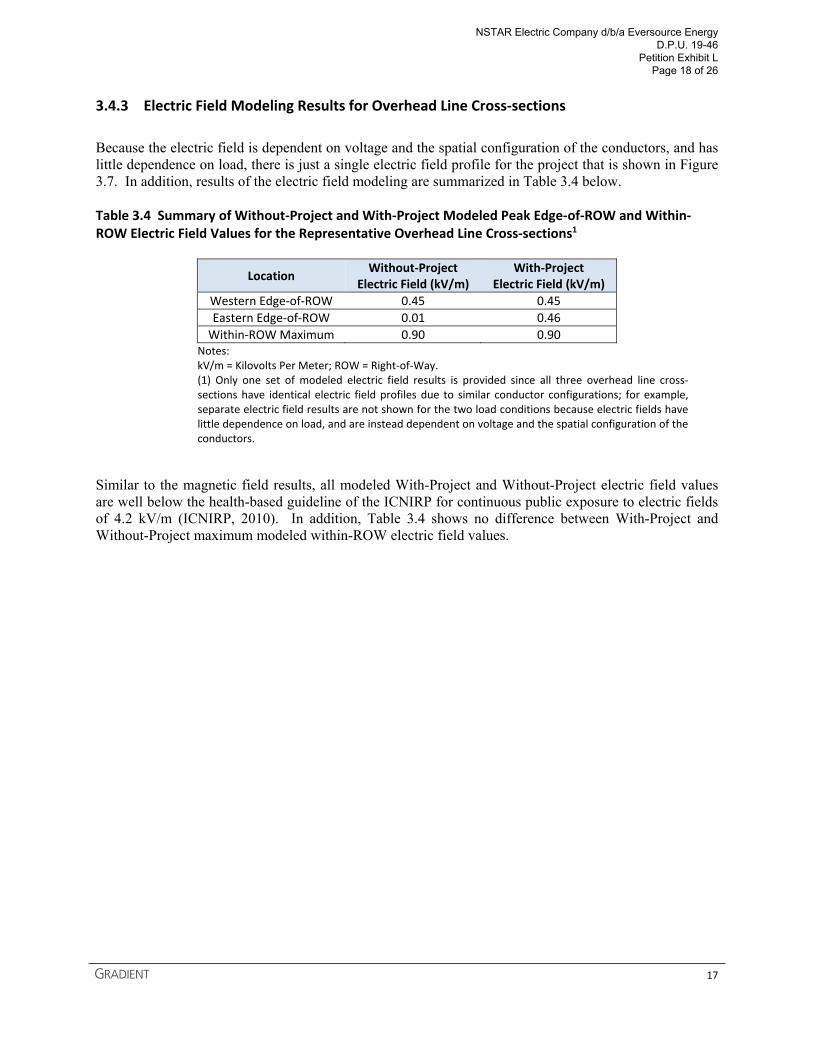
3.4.3 Electric Field Modeling Results for Overhead Line Cross‐sections
Because the electric field is dependent on voltage and the spatial configuration of the conductors, and has little dependence on load, there is just a single electric field profile for the project that is shown in Figure 3.7. In addition, results of the electric field modeling are summarized in Table 3.4 below. Table 3.4 Summary of Without‐Project and With‐Project Modeled Peak Edge‐of‐ROW and Within‐ROW Electric Field Values for the Representative Overhead Line Cross‐sections1
Location Without‐Project
Electric Field (kV/m) With‐Project
Electric Field (kV/m)
Western Edge‐of‐ROW 0.45 0.45
Eastern Edge‐of‐ROW 0.01 0.46
Within‐ROW Maximum 0.90 0.90 Notes: kV/m = Kilovolts Per Meter; ROW = Right‐of‐Way. (1) Only one set of modeled electric field results is provided since all three overhead line cross‐sections have identical electric field profiles due to similar conductor configurations; for example, separate electric field results are not shown for the two load conditions because electric fields have little dependence on load, and are instead dependent on voltage and the spatial configuration of the conductors.
Similar to the magnetic field results, all modeled With-Project and Without-Project electric field values are well below the health-based guideline of the ICNIRP for continuous public exposure to electric fields of 4.2 kV/m (ICNIRP, 2010). In addition, Table 3.4 shows no difference between With-Project and Without-Project maximum modeled within-ROW electric field values.
NSTAR Electric Company d/b/a Eversource Energy D.P.U. 19-46
Petition Exhibit L Page 18 of 26
18
Distance from Center of ROW (ft)
-100 -50 0 50 100
Ele
ctric
Fie
ld (
kV/m
)
0.0
0.2
0.4
0.6
0.8
1.0
1.2
Pre-Project FieldPost-Project FieldPre-Project ConductorPost-Project Conductor
ROW Edges
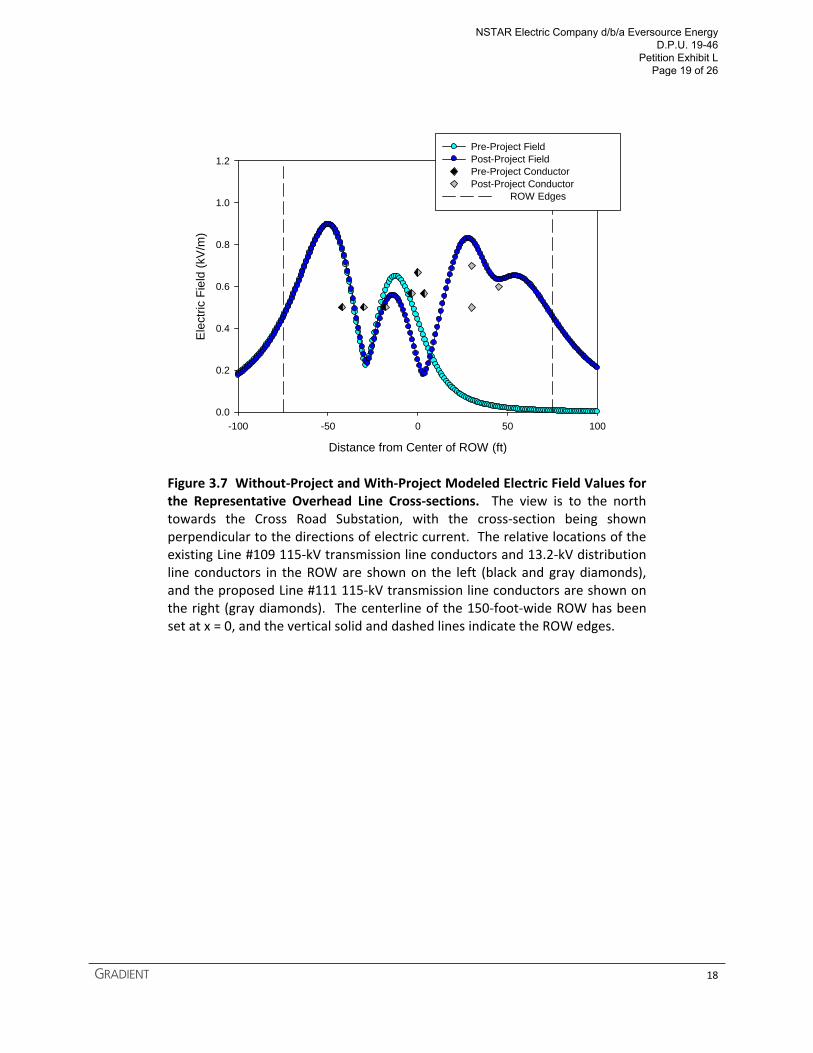
Figure 3.7 Without‐Project and With‐Project Modeled Electric Field Values for the Representative Overhead Line Cross‐sections. The view is to the north towards the Cross Road Substation, with the cross‐section being shown perpendicular to the directions of electric current. The relative locations of the existing Line #109 115‐kV transmission line conductors and 13.2‐kV distribution line conductors in the ROW are shown on the left (black and gray diamonds), and the proposed Line #111 115‐kV transmission line conductors are shown on the right (gray diamonds). The centerline of the 150‐foot‐wide ROW has been set at x = 0, and the vertical solid and dashed lines indicate the ROW edges.
NSTAR Electric Company d/b/a Eversource Energy D.P.U. 19-46
Petition Exhibit L Page 19 of 26

19
4 Conclusions
Using the FIELDS model, Gradient calculated the EMF levels at 3 feet (~1 meter) above the ground surface for representative cross-sections of ROW #144 between the Cross Road and Fisher Road Substations in Dartmouth where the new 115-kV overhead Line #111 extension is to be constructed. Both With-Project and Without-Project circuit configurations were modeled, which included the additional overhead 115-kV transmission line (Line #109) and 13.2-kV distribution lines (Lines #525 and #531) also present in the ROW. EMF modeling was performed using projected non-emergency summer peak and average transmission line loadings provided by Eversource for the year 2018, which is the expected in-service date for the project. As discussed above, the With-Project maximum modeled electric and magnetic field levels predicted within and at the edges of ROW #144 all fall well below accepted health-based guidelines for allowable public exposure to electric and magnetic fields (4.2 kV/m and 2,000 mG, respectively; ICNIRP, 2010).
NSTAR Electric Company d/b/a Eversource Energy D.P.U. 19-46
Petition Exhibit L Page 20 of 26
20
References
American Conference of Governmental Industrial Hygienists (ACGIH). 2015. "2015 TLVs and BEIs: Threshold Limit Values for Chemical Substances and Physical Agents and Biological Exposure Indices." ACGIH. ACGIH Publication No. 0115. 252 pp.
Australian Radiation Protection and Nuclear Safety Agency (ARPANSA). 2006. "Radiation Protection Standard; Exposure Limits for Electric & Magnetic Fields – 0 Hz to 3 kHz (Draft)." 163p., December 7.
Australian Radiation Protection and Nuclear Safety Agency (ARPANSA). 2008. "Forum on the Development of the ELF Standard." 1p., June 12. Accessed at http://www.arpansa.gov.au/news/events/ elf.cfm.
Commonwealth of Massachusetts, Energy Facilities Siting Board (MAEFSB). 2010. "Final decision [re: Petitions of Western Massachusetts Electric Co. for approval to construct and operate transmission facilities and lines, and related matters]." EFSB 08-2; DPU 08-105; DPU 08-106. 166p., September 28. Accessed at http://www.env.state.ma.us/dpu/docs/siting/efsb08-2/08-105/08-106/92810efsbord.pdf.
Electric Power Research Institute (EPRI). 1982. "Transmission Line Reference Book. 345-kV and Above, 2nd Edition." Transmission Engineering, General Electric Co. EL-2500, EPRI.
Electric Power Research Institute (EPRI). 1993. "Transmission Cable Magnetic Field Management." Power Technologies, Inc. Wilmerding, Pennsylvania. EPRI TR102003, EPRI.
Florida Dept. of Environmental Protection (FLDEP). 2008. "Electric and Magnetic Fields." Rule 62-814, F.S.C. 13p., June 1.
IEEE Power Engineering Society. 1995a. "IEEE Standard Procedures for Measurement of Power Frequency, Electric and Magnetic Fields from AC Power Lines." Institute of Electrical and Electronics Engineers, Inc. IEEE Std. 644-1994, March 7.
IEEE Power Engineering Society. 1995b. "IEEE Recommended Practice for Instrumentation: Specifications For Magnetic Flux Density and Electric Field Strength Meters – 10 Hz to 3 kHz." Institute of Electrical and Electronics Engineers, Inc. IEEE Std. 1308-1994, April 25.
International Commission on Non-Ionizing Radiation Protection (ICNIRP). 2010. "ICNIRP Guidelines for limiting exposure to time-varying electric and magnetic fields (1 Hz to 100 Hz)." Health Phys. 99(6):818-836. doi: 10.1097/HP.0b013e3181f06c86.
Mamishev, AV; Russell, BD. 1995. "Measurement of magnetic fields in the direct proximity of power line conductors." IEEE Trans. Power Deliv. 10(3):1211-1216. doi: 10.1109/61.400898.
National Institute of Environmental Health Sciences (NIEHS). 2002. "Questions and Answers about EMF Electric and Magnetic Fields Associated with the Use of Electric Power." 65p., June.
NSTAR Electric Company d/b/a Eversource Energy D.P.U. 19-46
Petition Exhibit L Page 21 of 26
21
World Health Organization (WHO). 2018. "Electromagnetic fields (EMF): Standards and guidelines." Accessed on July 18, 2018 at http://www.who.int/peh-emf/standards/en/.
NSTAR Electric Company d/b/a Eversource Energy D.P.U. 19-46
Petition Exhibit L Page 22 of 26
Appendix A
Aerial Overview Map Showing the Preferred Project Route for the Dartmouth and Westport Reliability Project
NSTAR Electric Company d/b/a Eversource Energy D.P.U. 19-46
Petition Exhibit L Page 23 of 26
Project Location
Fisher RoadSubstation
Cross RoadSubstation
Cedar Dell Lake
Pask
aman
setRiv
er
Destruction Brook
HATHAWAYROAD
HIXVILLEROADSTATE ROAD
FAUNCECORNERMALL ROAD
RUSSE
LLS MILLS ROAD
OLD WESTPORT ROAD
ALICE STREET
FISHER ROAD
JASOND
RIVE
LUCY LITTLE ROAD
BEEDENROAD
CROSS ROAD
TUCK
ERRO
AD
REED ROAD
CHASE ROAD
CHAS
E ROA
D
UNIVERSIT Y RING ROAD
£¤6
DART
MOU
TH
WES
TPOR
T
FIGURE 2
Source: MassGIS,ArcGIS Online,VHB
i 0 2500 50001250 Feet
\\NHB
EDAT
A\gis
lib\N
STAR
\ROW
144\2
015_
Expa
nsion
Propo
sal\P
ermitti
ng_Fi
gures
\Figu
re2_A
erial.
mxd
LegendProject LimitsTown Boundaries
Aerial Overview MapDartmouth and Westport Reliability Project Dartmouth, Massachusetts
NSTAR Electric Company d/b/a Eversource Energy D.P.U. 19-46
Petition Exhibit L Page 24 of 26
Appendix B
Representative Without‐Project and With‐Project ROW Overhead Line Cross‐sections for the Dartmouth and Westport Reliability Project
(view is looking north toward Cross Road Substation)
NSTAR Electric Company d/b/a Eversource Energy D.P.U. 19-46
Petition Exhibit L Page 25 of 26
\\N
HBE
DAT
A\g
islib
\NST
AR\
ROW
144\
2015
_Exp
ansi
onPr
opos
al\O
vers
ized
_Fig
ures
\Cro
ss_S
ectio
n.m
xd
Cross SectionsROW #144
Dartmouth and Westport Reliability Project Dartmouth, MassachusettsSource: VHB, Eversource
Distribution Line*
Distribution Line*
*Depending on location, either the #525 or #531 line.
NSTAR Electric Company d/b/a Eversource Energy D.P.U. 19-46
Petition Exhibit L Page 26 of 26