Eight Malaysian Firms to Invest RM12b in India - MITI
19
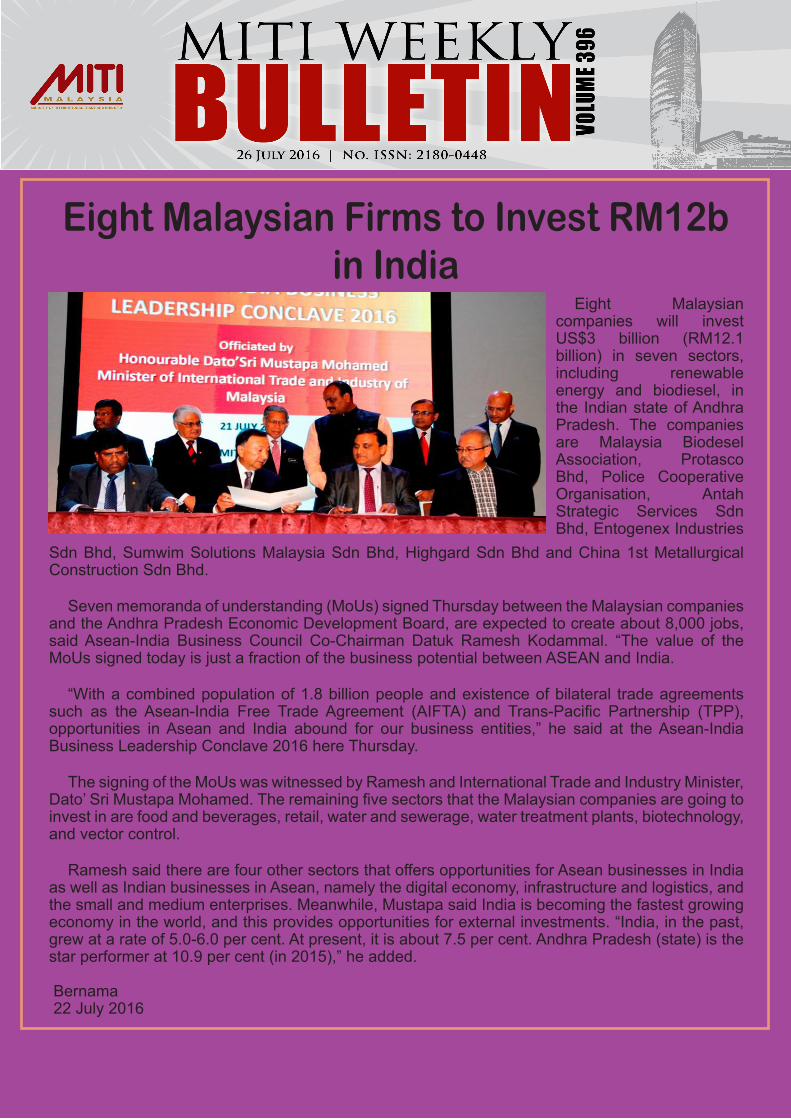
Eight Malaysian Firms to Invest RM12b in India Sdn Bhd, Sumwim Solutions Malaysia Sdn Bhd, Highgard Sdn Bhd and China 1st Metallurgical Construction Sdn Bhd. Seven memoranda of understanding (MoUs) signed Thursday between the Malaysian companies and the Andhra Pradesh Economic Development Board, are expected to create about 8,000 jobs, said Asean-India Business Council Co-Chairman Datuk Ramesh Kodammal. “The value of the MoUs signed today is just a fraction of the business potential between ASEAN and India. “With a combined population of 1.8 billion people and existence of bilateral trade agreements such as the Asean-India Free Trade Agreement (AIFTA) and Trans-Pacific Partnership (TPP), opportunities in Asean and India abound for our business entities,” he said at the Asean-India Business Leadership Conclave 2016 here Thursday. The signing of the MoUs was witnessed by Ramesh and International Trade and Industry Minister, Dato’ Sri Mustapa Mohamed. The remaining five sectors that the Malaysian companies are going to invest in are food and beverages, retail, water and sewerage, water treatment plants, biotechnology, and vector control. Ramesh said there are four other sectors that offers opportunities for Asean businesses in India as well as Indian businesses in Asean, namely the digital economy, infrastructure and logistics, and the small and medium enterprises. Meanwhile, Mustapa said India is becoming the fastest growing economy in the world, and this provides opportunities for external investments. “India, in the past, grew at a rate of 5.0-6.0 per cent. At present, it is about 7.5 per cent. Andhra Pradesh (state) is the star performer at 10.9 per cent (in 2015),” he added. Bernama 22 July 2016 Eight Malaysian companies will invest US$3 billion (RM12.1 billion) in seven sectors, including renewable energy and biodiesel, in the Indian state of Andhra Pradesh. The companies are Malaysia Biodesel Association, Protasco Bhd, Police Cooperative Organisation, Antah Strategic Services Sdn Bhd, Entogenex Industries
-
Upload
khangminh22 -
Category
Documents
-
view
2 -
download
0
Transcript of Eight Malaysian Firms to Invest RM12b in India - MITI
Eight Malaysian Firms to Invest RM12b in India
Sdn Bhd, Sumwim Solutions Malaysia Sdn Bhd, Highgard Sdn Bhd and China 1st Metallurgical Construction Sdn Bhd.
Seven memoranda of understanding (MoUs) signed Thursday between the Malaysian companies and the Andhra Pradesh Economic Development Board, are expected to create about 8,000 jobs, said Asean-India Business Council Co-Chairman Datuk Ramesh Kodammal. “The value of the MoUs signed today is just a fraction of the business potential between ASEAN and India.
“With a combined population of 1.8 billion people and existence of bilateral trade agreements such as the Asean-India Free Trade Agreement (AIFTA) and Trans-Pacific Partnership (TPP), opportunities in Asean and India abound for our business entities,” he said at the Asean-India Business Leadership Conclave 2016 here Thursday.
The signing of the MoUs was witnessed by Ramesh and International Trade and Industry Minister, Dato’ Sri Mustapa Mohamed. The remaining five sectors that the Malaysian companies are going to invest in are food and beverages, retail, water and sewerage, water treatment plants, biotechnology, and vector control.
Ramesh said there are four other sectors that offers opportunities for Asean businesses in India as well as Indian businesses in Asean, namely the digital economy, infrastructure and logistics, and the small and medium enterprises. Meanwhile, Mustapa said India is becoming the fastest growing economy in the world, and this provides opportunities for external investments. “India, in the past, grew at a rate of 5.0-6.0 per cent. At present, it is about 7.5 per cent. Andhra Pradesh (state) is the star performer at 10.9 per cent (in 2015),” he added.
Bernama 22 July 2016
Eight Malaysian companies will invest US$3 billion (RM12.1 billion) in seven sectors, including renewable energy and biodiesel, in the Indian state of Andhra Pradesh. The companies are Malaysia Biodesel Association, Protasco Bhd, Police Cooperative Organisation, Antah Strategic Services Sdn Bhd, Entogenex Industries

Consumer Price Index (CPI) Malaysia
Source: Department of Statistics, Malaysia
+2.7%
Jan - June 2016114.4
Jan - June 2015111.4
Inflation Rate for Main Groups, January - June 2016/January - June 2015
Year - on - Year
+0.2%June 2016
114.8
May 2015114.6
Month - on - Month
Food & Non-Alcoholic
Beverages+4.3%
Alcoholic Beverages &
Tobacco+21.9%
Clothing & Footwear
+4.3%
Housing, Water, Electricity, Fas &
Other Fuels+2.7%
Furnishings, Household Equipment & Routine Household
Maintenance+3.3%
Health
+3.3%Transport
-4.1%Communication
-0.6%
Recreation Services & Culture
+2.0%Education
+2.3%
Restaurants & Hotels+3.5%
Miscellaneous Goods & Services
+3.9%
+1.6%June 2016
114.8
June 2015113.0

Source: Department of Statistics, Malaysia
Inflation Rate for Food, January - June 2016/January - June 2015
Rice, Bread & Other Cereals
+1.3%
Meat+2.5%
Fish & Seafood
+7.6%Milk & Eggs
+0.7%Oils & Fats+0.6%
Fruits+6.3%
Vegetables+10.2%
+2.7%
Sugar, Jam, Honey, Chocolate & Confectionery
Food Products+5.9%
Food at Home +4.7%
Food away from Home +4.3%
Inflation Rate
by State, June 2016/June 2015
2.3%
2.0%
2.0%
1.8%
1.5%
1.4%
1.3%
1.2%
1.1%
1.1%
1.1%
0.7%
0.1%
Johor
Pulau Pinang
Kuala Lumpur
Selangor & Putrajaya
Melaka
Negeri Sembilan
Pahang
Kelantan
Kedah & Perlis
Terengganu
Sarawak
Perak
Sabah & Labuan
0
1
2
3
4
5
6
7
Jan
Feb
Mar
Apr
May Jun
Jul
Aug Se
pO
ctN
ovD
ec Jan
Feb
Mar
Apr
May Jun
Jul
Aug Se
pO
ctN
ovD
ec Jan
Feb
Mar
Apr
May Jun
Jul
Aug Se
pO
ctN
ovD
ec Jan
Feb
Mar
Apr
May Jun
Jul
Aug Se
pO
ctN
ovD
ec Jan
Feb
Mar
Apr
May Jun
Jul
Aug Se
pO
ctN
ovD
ec Jan
Feb
Mar
Apr
May Jun
2011 2012 2013 2014 2015 2016
Inflation Rate (%)Monthly Food Inflation, January 2011 - June 2016
Food At Home Food - Away From Home

Producer Price Index for Local Production, May 2016
Source: Department of Statistics, Malaysia
Note: The Producer Price Index (PPI) for local production measures the average change in the prices of com modities charged by domestic producers of an industry

Travel time in car from KL CBD via North South Expressway assuming speeds of 85 km/h
Immigration Expressway to SG CBD
KL CBD toKL Sentral
Waiting time for train
KL city centre to HSR station
Travel time in train (assuming double tracking upgrades)
Immigra-tion
RTS system to SG CBD
KL CBD toKLIA airport
Departure process and waiting
Travel time in plane
Arrival process
Airport toSG CBD
Waiting time
Travel time in train Arrival process
HSR Station toSG CBD
240 mins 30 mins 30 mins
15 mins 15 mins 215 mins 40 mins15 mins
45 mins 55 mins 60 mins 30 mins 30 mins
15 mins 15 mins 90 mins 15 mins 15 mins
and You’‘
High Speed Rail (HSR), Malaysia-SingaporeHS
R Pr
ojec
t
Source: http://www.spad16.primuscore.com/land-public-transport/rail/upcoming-projects/high-speed-rail and http://www.myhsr.com.my/project.php

Buku kecil TPPA di dalam versi PDF boleh di muat turun melalui pautanhttp://fta.miti.gov.my/miti-fta/resources/MITI_TPPA.pdf

International Repor t
Source: National Bureau of Statistics, China
GDP Growth
7.47.5
7.17.2
7.0 7.06.9
6.86.7 6.7
Q12014
Q22014
Q32014
Q42014
Q12015
Q22015
Q32015
Q42015
Q12016
Q22016
Growth Y-o-Y
1H2016: US$5.08 trillion, +6.7%Inflation Rate (CPI)
1.41.6
2.0
1.6
1.31.5
1.61.8
2.3 2.3 2.3
2.01.9
0.0
0.30.5
0.1
-0.3
0.0
0.5 0.5
1.6
-0.4
-0.2
-0.5
-0.1
Jun-15 Jul-15 Aug-15 Sep-15 Oct-15 Nov-15 Dec-15 Jan-16 Feb-16 Mar-16 Apr-16 May-16 Jun-16
Inflation Rate
Y-o-Y M-o-M
1H2016: +2.1%
Fixed-Asset Investment
1H2016: US$3,856 billion, +9.0%
Industrial ProductionJune 2016: +6.2%
China Economic Indicators
Malaysia’s Trade with China, January 2015 - May 2016
Trade 1H2016Total Trade: US$1.661b, -3.3%* Total Exports: US$955b, -2.1%* Total Imports: US$705b, -4.7%*
Major Exports: i. Electronics - US$546.4b, -2.5%*ii. High-tech Products - US$264.6b, -2.3%*iii. Clothing & accessories - US$69.3b, +0.6%*
Major Imports: i. Electronics - US$341.5b, -1.4%*ii. High-tech Products - US$228.9b, -0.3%*iii. Integrated Circuit - US$97.6b, +3.6%*
Jan Feb Mar Apr May Jun Jul Aug Sep Oct Nov Dec Jan Feb Mar Apr May2015 2016
Exports 6.4 5.8 8.3 8.1 8.1 9.7 9.4 9.4 9.1 9.2 9.8 8.4 6.5 6.5 7.8 6.7 7.1Imports 10.9 8.7 8.9 9.8 10.8 11.2 11.3 10.6 12.0 11.8 11.5 11.9 11.7 8.9 10.0 10.8 12.0Total Trade 17.4 14.5 17.2 17.9 18.8 20.9 20.6 20.0 21.0 21.0 21.3 20.3 18.2 15.4 17.8 17.6 19.1
0
5
10
15
20
25
RM b
illio
n
Source : Department of Statistics, Malaysia

US$182.4 billion0.2%*
US$223.5 billion1.5%*
Trade DeficitUS$37.4 billion
Source: U.S. Bureau of Economic Analysis
Trade in Goods and Services
Trade Surplusi. South & Central America : US$2.9 billionii. Hong Kong : US$1.6 billioniii. Australia : US$0.9 billion
Trade Deficiti. China : US$29.0 billionii. EU : US$13.4 billioniii. Japan : US$4.7 billion
Balance of Trade in Goods by Selected Countries
Malaysia’s Trade with US, January 2015 - May 2016
Source : Department of Statistics, Malaysia
US Trade Performance May 2016
Note: * month-on-month growth
Jan Feb Mar Apr May Jun Jul Aug Sep Oct Nov Dec Jan Feb Mar Apr May2015 2016
Exports 5.9 4.9 6.1 5.9 5.4 5.8 6.1 6.6 6.6 7.3 6.1 7.1 6.3 5.9 6.8 6.6 6.4Imports 4.2 3.6 5.2 4.3 4.0 5.0 4.6 4.5 4.9 5.5 4.6 4.9 4.5 4.7 4.8 4.5 4.7Total Trade 10.1 8.5 11.3 10.3 9.4 10.8 10.7 11.1 11.5 12.8 10.7 12.0 10.8 10.7 11.6 11.1 11.1
0
2
4
6
8
10
12
14
RM b
illion

Number and Value of Preferential Certificates of Origin (PCOs)Number of Certificates (Provisional data)
Source: Ministry of International Trade and Industry, Malaysia
AJCEP: ASEAN-Japan Comprehensive Economic Partnership (Implemented since 1 February 2009) ACFTA: ASEAN-China Free Trade Agreement (Implemented since 1 July 2003) AKFTA: ASEAN-Korea Free Trade Agreement (Implemented since 1 July 2006)
AANZFTA: ASEAN-Australia-New Zealand Free Trade Agreement(Implemented since 1 January 2010)
AIFTA: ASEAN-India Free Trade Agreement (Implemented since 1 January 2010)
ATIGA: ASEAN Trade in Goods Agreement (Implemented since 1 May 2010)
MICECA: Malaysia-India Comprehensive Economic Cooperation Agreement (Implemented since 1 July 2011)MNZFTA: Malaysia-New Zealand Free Trade Agreement (Implemented since 1 August 2010)MCFTA: Malaysia-Chile Free Trade Agreement (Implemented since 25 February 2012)
MTFTA: Malaysia-Turkey Free Trade Agreement (Implemented since 1 August 2015)
MAFTA: Malaysia-Australia Free Trade Agreement (Implemented since 1 January 2013)
MPCEPA: Malaysia-Pakistan Closer Economic Partnership Agreement (Implemented since 1 January 2008)MJEPA: Malaysia-Japan Economic Partnership Agreement (Implemented since 13 July 2006)
29 May 5 Jun 12 Jun 19 Jun 26 Jun 3 Jul 10 Jul 17 JulAANZFTA 99 77 81 84 81 98 25 115AIFTA 141 104 141 120 121 212 44 193AJCEP 58 56 64 56 74 95 60 59
0
50
100
150
200
250
RM
mill
ion
29 May 5 Jun 12 Jun 19 Jun 26 Jun 3 Jul 10 Jul 17 JulATIGA 918 1,187 968 1,280 751 986 211 782ACFTA 474 494 861 576 499 480 275 693AKFTA 303 311 138 287 240 258 91 632
0
200
400
600
800
1,000
1,200
1,400
RM
mill
ion
29 May 5 Jun 12 Jun 19 Jun 26 Jun 3 Jul 10 Jul 17 JulMICECA 32.12 41.79 36.00 41.06 39.03 52.99 22.49 45.60MNZFTA 0.37 0.24 0.24 0.02 0.14 0.38 0.22 0.02MCFTA 48.19 9.77 8.20 10.44 6.89 10.07 1.90 11.32MAFTA 37.05 101.83 33.66 38.50 36.15 41.80 14.20 39.27
0
20
40
60
80
100
120
RM m
illio
n29 May 2016 5 Jun 2016 12 Jun 2016 19 Jun 2016 26 Jun 2016 3 Jul 2016 10 Jul 2016 17 Jul 2016
AANZFTA 874 684 848 807 722 870 237 1,009
AIFTA 597 636 795 625 542 656 245 676
AJCEP 216 196 197 207 151 287 70 213
ATIGA 4,489 4,932 4,438 4,585 3,981 4,286 1,339 4,135
ACFTA 1,514 1,525 1,491 1,584 1,327 1,610 482 1,621
AKFTA 911 868 945 909 911 951 249 1,053
MICECA 315 339 300 329 296 344 152 332
MNZFTA 9 9 8 3 8 13 3 4
MCFTA 45 61 56 65 51 52 16 65
MAFTA 423 397 332 394 440 442 147 412
MJEPA 774 876 709 777 834 988 242 917
MPCEPA 137 181 137 185 130 124 27 130
GSP 106 120 116 134 103 147 30 128
MTFTA 198 235 187 247 172 305 112 214
29 May 5 Jun 12 Jun 19 Jun 26 Jun 3 Jul 10 Jul 17 JulMJEPA 115 145 97 137 188 159 48 170MPCEPA 23 83 40 121 41 20 3 51GSP 20 21 18 19 25 27 6 22MTFTA 88 95 167 211 75 83 36 130
0
50
100
150
200
250
RM m
illio
n
Value of Preferential Certificates of Origin
Notes: The preference giving countries under the GSP scheme are Liechtenstein, the Russian Federation, Japan, Switzerland, Belarus, Kazakhstan and Norway.

http://online.wsj.com/mdc/public/page/2_3023-cashprices.html?mod=topnav_2_3023
Source : Bank Negara Malaysia
16.0
19.4
12.0
13.0
14.0
15.0
16.0
17.0
18.0
19.0
20.0
21.0
18 M
ar24
Mar
1 Ap
r8
Apr
15 A
pr22
Apr
29 A
pr6
May
13 M
ay20
May
27 M
ay3
Jun
10 Ju
n17
Jun
24 Ju
n30
Jun
8 Ju
l15
Jul
22 Ju
l
US$/Oz Silver
980.0
1,094.0
800.0
850.0
900.0
950.0
1000.0
1050.0
1100.0
1150.0
18 M
ar24
Mar
1 Ap
r8
Apr
15 A
pr22
Apr
29 A
pr6
May
13 M
ay20
May
27 M
ay3
Jun
10 Ju
n17
Jun
24 Ju
n30
Jun
8 Ju
l15
Jul
22 Ju
l
US$/Oz Platinum
Source : http://www.gold.org/investments/statistics/gold_price_chart/
Gold Prices, 18 March - 21 July 2016
Silver and Platinum Prices, 18 March - 22 July 2016
40.3
42.5
32.0
34.0
36.0
38.0
40.0
42.0
44.0
46.0
18 M
ar
24 M
ar
1 Ap
r
8 Ap
r
15 A
pr
22 A
pr
29 A
pr
6 M
ay
12 M
ay
19 M
ay
26 M
ay
2 Ju
n
9 Ju
n
16 Ju
n
23 Ju
n
30 Ju
n
7 Ju
l
14 Ju
l
21 Ju
l
US$/Gram Gold
Malaysian Ringgit Exchange Rate withJapanese Yen and Thai Baht
10.00
10.50
11.00
11.50
12.00
12.50
2.50
2.70
2.90
3.10
3.30
3.50
3.70
3.90
4.10
Jan Feb Mar Apr May Jun Jul Aug Sep Oct Nov Dec Jan Feb Mar Apr May Jun
2015 2016
JPY100 = RM THB100 = RM
100 THB = RM 11.57
100 JPY = RM 3.88

Commodity
Crude Petroleum
(Brent) (per bbl)
Crude Palm Oil (per MT)
Sugar (per lbs.)
Rubber SMR 20(per MT)
Cocoa SMC 2
(per MT)
Coal(per MT)
Scrap Iron HMS
(per MT)
22 July 2016 (US$) 45.7 685.0 19.6 1,306.0 2,161.6 43.5 200 (high)
180 (low)
% change* 4.0 4.6 1.5 1.0 0.7 unchanged unchangedunchanged
2015i 36.9 - 66.8 616.9 13.2 1,364.3 2,077.0 49.9 239.6
2014i 59.5 - 114.8 823.3 16.6 1,718.3 2,615.8 59.8 370.0
Commodity Prices
Notes: All figures have been rounded to the nearest decimal point * Refer to % change from the previous week’s price i Average price in the year except otherwise indicated n.a Not availble
Sources: Ministry of International Trade and Industry Malaysia, Malaysian Palm Oil Board, Malaysian Rubber Board, Malaysian Cocoa Board, Malaysian Iron and Steel Industry Federation, Bloomberg and Czarnikow Group.
Highest and Lowest Prices, 2015/2016
Lowest (US$ per bbl)
Highest(US$ per bbl)
Crude Petroleum(Brent)
(22 July 2016)US$45.7 per bbl
201515 May 2015: 66.8
201518 Dec 2015: 36.9
201610 June 2016: 50.5
201615 Jan 2016: 28.9
Lowest (US$ per MT)
Highest(US$ per MT)
Crude Palm Oil (22 July 2016)
US$685.0 per MT
201516 Jan 2015: 701.0
20154 Sep 2015: 500.5
20168 Apr 2016: 725.5
201615 Jan 2016: 545.5
Steel Bars(per MT)
RM1,780 – RM1,930
Average Domestic Prices, 15 July 2016
Billets(per MT)
RM1,350 – RM1,400

Sources: Ministry of International Trade and Industry Malaysia, Malaysian Palm Oil Board, Malaysian Rubber Board, Malaysian Cocoa Board, Malaysian Pepper Board, Malaysian Iron and Steel Industry Federation, Bloomberg and Czarnikow Group, World Bank.
Commodity Price Trends
718.5
712.5707.0
713.0
693.0
701.5
708.5 710.5
704.5700.0
655.0
685.0
620
640
660
680
700
720
740
29 Apr 6 May 13 May 20 May 27 May 3 Jun 10 Jun 17 Jun 24 Jun 30 Jun 15 Jul 22 Jul
US$
/mt
Crude Palm Oil
2,202.6
2,120.0
2,098.1
1,961.0
2,049.92,060.2
2,125.0 2,122.7
2,089.92,075.8
2,147.32,161.6
1,800
1,850
1,900
1,950
2,000
2,050
2,100
2,150
2,200
2,250
29 Apr 6 May 13 May 20 May 27 May 3 Jun 10 Jun 17 Jun 24 Jun 30 Jun 15 Jul 22 Jul
US$
/mt
Cocoa
16.3
15.7
16.717.1
17.5
18.8
19.7 19.9
19.2
20.3
19.319.6
12.0
13.0
14.0
15.0
16.0
17.0
18.0
19.0
20.0
21.0
29 Apr 6 May 13 May 20 May 27 May 3 Jun 10 Jun 17 Jun 24 Jun 30 Jun 15 Jul 22 Jul
US$
/lbs
Sugar
1,504.5
1,451.0
1,412.5
1,287.51,263.0
1,281.5
1,226.01,242.0
1,278.0
1,314.01,293.5 1,306.0
900
1,000
1,100
1,200
1,300
1,400
1,500
1,600
29 Apr 6 May 13 May 20 May 27 May 3 Jun 10 Jun 17 Jun 24 Jun 30 Jun 15 Jul 22 Jul
US$
/mt
Rubber SMR 20
7,591
7,286 7,267
7,853
7,148 7,063
7,296
6,742
6,940
7,029
6,963
7,008
6,900
7,088
7,113
7,281
6,917 6,851 6,839
5,000
5,500
6,000
6,500
7,000
7,500
8,000
8,500
Jan Feb Mar Apr May Jun Jul Aug Sep Oct Nov Dec Jan Feb Mar Apr May Jun Jul
2015 2016
USD
/ to
nne
Black Pepper
* until 22 July 2016
45.9
44.7
46.2
47.8
49.3
48.649.1
48.047.6
48.3
45.446.0
44.2
48.1
45.4
47.8
48.7
49.349.6
50.5
49.2
48.4
49.7
46.8
47.6
45.7
40
42
44
46
48
50
52
29 Apr 6 May 13 May20 May27 May 3 Jun 10 Jun 17 Jun 24 Jun 30 Jun 8 Jul 15 Jul 22 Jul
US$
/bbl
Crude Petroleum
Crude Petroleum (WTI)/bbl Crude Petroleum (Brent)/bbl

Sources: Ministry of International Trade and Industry Malaysia, Malaysian Palm Oil Board, Malaysian Rubber Board, Malaysian Cocoa Board, Malaysian Pepper Board, Malaysian Iron and Steel Industry Federation, Bloomberg and Czarnikow Group, World Bank.
Commodity Price Trends
240.0
260.0
290.0300.0
330.0340.0
320.0
300.0
280.0270.0
230.0
200.0210.0
240.0
280.0 280.0
300.0
320.0
300.0
280.0
260.0250.0
220.0
180.0
100
150
200
250
300
350
8 Apr 15 Apr 22 Apr 29 Apr 6 May 13 May 23 May 30 May 6 Jun 10 Jun 24 Jun 15 Jul
US$
/mt
Scrap Iron
Scrap Iron/MT (High) Scrap Iron/MT(Low)
48.148.0
48.1 48.1 48.148.0
43.743.5 43.5 43.5 43.5 43.5 43.5
43.0
44.0
45.0
46.0
47.0
48.0
49.0
29 Apr 6 May 13 May20 May27 May 3 Jun 10 Jun 17 Jun 24 Jun 30 Jun 8 Jul 15 Jul 22 Jul
US$
/mt
Coal
68.0
63.0
58.0
52.0
60.0
63.0
52.0
56.0
57.0
53.0
47.0
41.042.0
47.0
56.0
61.0
55.0
52.0
38.0
43.0
48.0
53.0
58.0
63.0
68.0
73.0
Jan Feb Mar Apr May Jun Jul Aug Sep Oct Nov Dec Jan Feb Mar Apr May Jun
2015 2016
US$
/dm
tu
Iron Ore
1,815
1,818
1,774
1,819
1,804
1,688
1,640
1,548
1,590
1,516
1,468
1,497
1,481
1,531
1,531
1,571 1,551
1,591
1,400
1,450
1,500
1,550
1,600
1,650
1,700
1,750
1,800
1,850
Jan Feb Mar Apr May Jun Jul Aug Sep Oct Nov Dec Jan Feb Mar Apr May Jun
2015 2016
US$
/ to
nne
Aluminium
5,831
5,729
5,940 6,042
6,295
5,833
5,457
5,127
5,217 5,216
4,800
4,639
4,472 4,599
4,954
4,873
4,695 4,633
4,000
4,500
5,000
5,500
6,000
6,500
Jan Feb Mar Apr May Jun Jul Aug Sep Oct Nov Dec Jan Feb Mar Apr May Jun
2015 2016
US$
/ to
nne
Copper
14,849 14,574
13,756
12,831
13,511
12,825
11,413
10,386 9,938
10,317
9,244
8,708 8,507 8,299
8,717
8,879 8,660
8,906
7,000
8,000
9,000
10,000
11,000
12,000
13,000
14,000
15,000
16,000
Jan Feb Mar Apr May Jun Jul Aug Sep Oct Nov Dec Jan Feb Mar Apr May Jun
2015 2016
US$
/ to
nne
Nickel

Success StoryThere is a growing need for education and training in Malaysia to help strengthen the local talent and qualifications. Without constant improvement provided by the related parties, industries in Malaysia will remain stagnant.
RANACO group of companies, established in 1984, is recognized as being amongst the pioneer industry player in the maritime and oil & gas industry of Malaysia. Helmed by Captain Dr. Ramlan bin Ramli, RANACO steered to cater the needs of the professionals in this industry. As the International Maritime Organization (IMO) introduced more legislations to regulate the shipping and maritime industry, Captain Dr. Ramlan realized that there was an urgent need to provide appropriate education and training to improve and enhance the competency levels of the players in the industry.
Now, Ranaco Education & Training Institute (RETI), which ia a branch under the RANACO Group, caters to the growing need for allied professionals in the field of maritime, safety, offshore, logistics and hospitality.The remarkable growth that the company has seen was tremendous. Starting fom a mere 15 students during their first of operation in 2004, the institute now sees more than 2,5000 students as of 2013. RETI is the only private college on the East Coast that offers diploma and degree-level training in the span of services that also includes marine engineering, oil and gas, accountancy, and management. Up to date, RETI has a total of twelve diploma programmes and one degree qualification.
The company offers many extra benefits over other competitors. One of it is the qualification it goves out to students. Not only do students receive RETI-certified credentials, they also enjoy the perks of being recognised by the industries’ big players such as PETRONAS, Department of Occupational Safety & Health (DOSH) and the government’s marine department. During their time in training, students will be attached to working enviornments to obtain valuable experience in their related fields of study. RETI furnishes its classes with a myriad of equipment, boasting facilities such as ship simulators, engine room, warehouse services, marine operation and ship maintenance workshops.
With everything going for the institute, RETI managing director, Captain Dr. Ramlan Ramli said that the institution also had its fair share of trials. “The main problem is the inadequate space for our classes. An alternative is to rent a new building to place our students, but that will incur high costs.” Fortunately, in mid-2014, RETI has undertaken a big construction project of building that could carry a maximum capacity of 10,000 students at any given time. RETI also hopes that with this larger capacity, it can focus on providing more executive diploma, degree and long-distance programmes, in hopes of perpetuating the stream of qualified students enterimg the workforce.
Leveraging on the company’s expansion plans, Ramlan said that business should aim to conquer global markets and get international recognition. “Keep planning ahead, and always find ways to stay ten steps ahead of the competitors.”
Ranaco Education & Training Institute (Kijal Campus)No PO. Box 63, Bandar Baru Kijal,24100 Kemaman, Terengganu, MalaysiaPhone: +609-8593800 Fax: +609-8593805
Ranaco Education & Training Institute (Chukai Campus)Kawasan Perindustrian Jakar II,24000 Kemaman, Terengganu, MalaysiaPhone: +609-8503160 Fax: +609-8584623
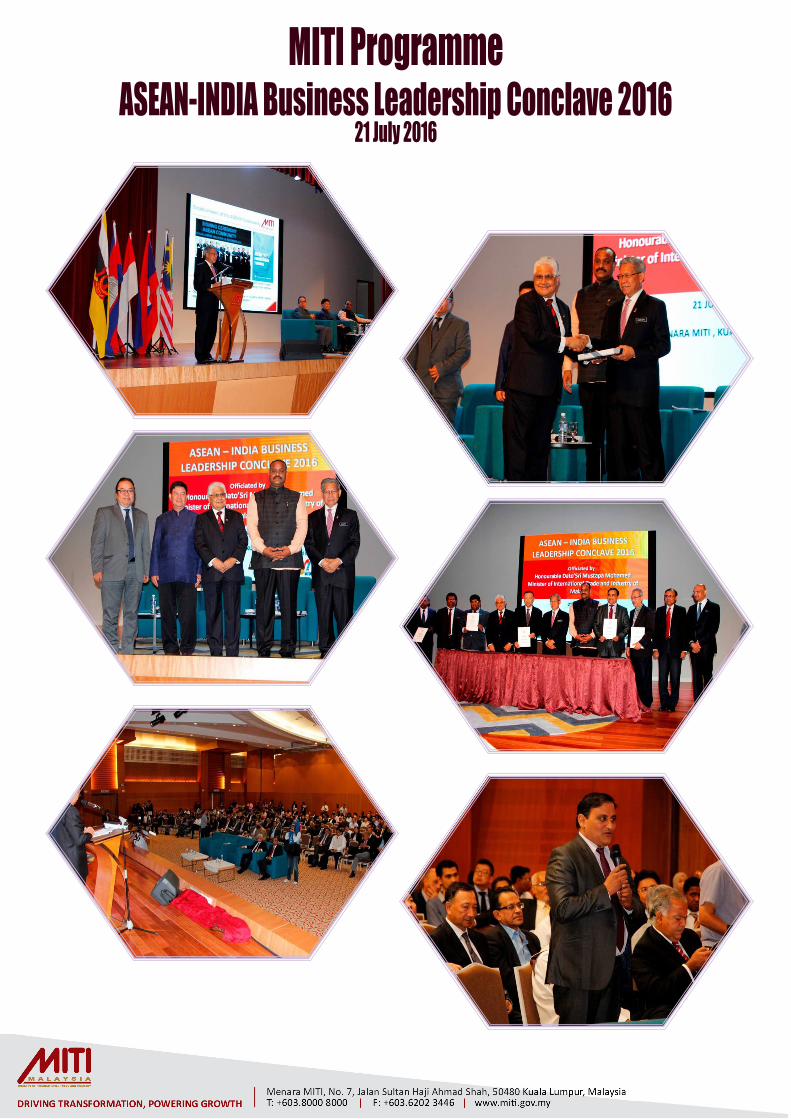
MITI ProgrammeASEAN-INDIA Business Leadership Conclave 2016
21 July 2016

MITI ProgrammeMajlis Jamuan Raya Keluarga MiTi

Majlis Jamuan Raya Keluarga MiTi

Announcement
Benefits of Economic CensusEntrepreneurs, Companies & Business
Industry Associations & Chamber of Commerce
Government To Update Economic Indicators
• To identify industrial structure and product trends
• To monitor changing patterns and growth trends for future investment
• To make business planning and decisions
• To gauge their business perfomance
• To compare their business operations to industry norms
• Rebasing of indices i.e. Gross Domestic Product (GDP) and Index of Industrial;
• Compilation of
Supply & Use Table (SUT), Input-Output Table (I-O), Tourism Satellite Account (TSA), Information & Communication Technology Satellite Account and System of Environmental – Economic Accounting (SEEA);
• Development of SME’s profile.
• To identify new sources of growth to the economy;
• To formulate national economy programmes; and
• To assess the implementation of the national development policy such as The Economic Transformation Programme, Eleventh Malaysia Plan and Small and Medium Enterprise (SME) Masterplan 2012 -2020.
• To understand more about industrial structure;
• To share information about the industry with their members;
• To assist business in marketing and investment planning.
Source : Department of Statistics, Malaysia
Sitti Amyrah Johari03-6200 [email protected]
Designation : Legal Advisor Division : Legal OfficeJob Description : To provide legal advice in the areas of MITI administration
Azlina Abdul Ghani03-6200 [email protected]
Designation : Legal Advisor Division : Legal OfficeJob Description : To provide legal advice in the areas of MITI administration
@ YOUR SERVICE
MITI Weekly Bulletin (MWB) Mobile Apps
MITI MWB APPs is now available for IOS, Android and Windows platforms. MWB APPs can be download from Gallery of Malaysian Government Mobile APPs (GAMMA) at the link: http://gamma.malaysia.gov.my/#/appDetails/85
Comments &
Suggestions
Dear Readers,
Kindly click the link below for any comments in this issue. MWB reserves the right to edit and republish letters as reprints.
http://www.miti.gov.my/index.php/forms/form/13