economic review 2019 - Invest Kerala
583
-
Upload
khangminh22 -
Category
Documents
-
view
2 -
download
0
Transcript of economic review 2019 - Invest Kerala


ECONOMIC REVIEW 2019GOVERNMENT OF KERALA
State Planning Board, Thiruvananthapuram, Kerala, India January 2020
Volume One

Economic Review 2019Kerala State Planning Board, Thiruvananthapuram, Kerala, India
Design & Layout : C-DIT, www.cdit.orgIllustrations : Illyas S

iii Economic Review 2019
The year 2019 has been a year of subdued growth and investment. The global economy is in slowdown. Global growth is projected at 3.9 per cent, the lowest level since 2008-09. As a whole, rising trade barriers, uncertainty surrounding trade and geopolitics, and low productivity growth have resulted in this sluggish growth. Growth in 2019 has been lower than in 2018 in major economies, including India, Brazil, Mexico, Russia, and South Africa. The recent national estimates of growth also indicate an economic slowdown. National growth has recorded one of its lowest levels. The estimated growth in real GDP in 2019-20 is 5 per cent, much lesser than the growth rate of 6.8 per cent recorded in 2018-19.
The quick estimate of growth in 2018-19 shows that the Kerala economy grew at 7.5 per cent (at constant prices). The growth was 7.3 per cent in 2017-18. The growth in 2018-19 was mainly due to the growth in secondary sector, which recorded a growth of 8.8 per cent (at constant prices). The tertiary sector grew at 8.4 per cent in the same year. A positive growth rate has been recorded despite the problems faced by the State over the last two years. These include extreme rainfall events and consequent floods and landslides over two consecutive years, and severe shortage of resources after the implementation of Goods and Services Tax.
Kerala took the crisis following the floods and landslides as an opportunity to rebuild in such a way as to ensure climate resilience and better standards of living for the citizens of the State. The Economic Review 2019 documents the efforts undertaken by the Government to rebuild the State. A new section, Rebuild Kerala Initiative, has been introduced this year. The Rebuild Kerala Initiative is a commitment of the Government to develop climate resilient infrastructure, improved conditions of living and new major development projects that ensure that people and assets are able to withstand the onslaught of future disasters. In fact, the major focus of the Plan in 2019-20 was to
FOREWORD

iv Kerala State Planning Board
rebuild the livelihoods lost in the floods and landslides. As part of this effort, the State Planning Board formulated a Livelihood Development Package for different sectors.
The Government is committed to providing the people with health care and education of the best quality. The Aardram Mission has upgraded the primary health centres to family health centres and helped in creation of new medical infrastructure in Government hospitals at different levels. As a result of the efforts by the Government in school education, there has been a shift of school pupils from private to Government and aided institutions. The efforts of the Government in health and education have been substantial; for this reason, this years’ theme chapter is on achievements in health and education.
The policy of the Government of Kerala is to invest in people, ensure social justice to all, and encourage productive forces in the economy. Among the States of India, Kerala tops again in the achievement of Sustainable Development Goals. Kerala tops the index in achievement of goals related to health and industry, innovation, and infrastructure.
The Government has streamlined the decentralised planning system by speeding up the Plan formulation process, thereby augmenting the time available for implementation of Plans. District Resource Centres have now began to work to improve the quality of Plans.
The Economic Review 2019 includes information on policies and programmes of the Government departments. It discusses the performance of various departments and the issues to be addressed in coming years. The sections in this year’s Review have been slightly re-arranged to make it more thematic. The major achievements in sectors have been highlighted in the relevant sections.
As in previous years, the Review is presented in two volumes. Volume I covers the policies, programmes, and achievements of Government departments and Volume II provides the corresponding datasets. Economic Review 2019 is published in English and Malayalam. A digital version will be uploaded at the State Planning Board website www.spb.kerala.gov.in.
ThiruvananthapuramJanuary 22, 2020

v Economic Review 2019
KERALA AT A GLANCE
KERALA’S ECONOMIC AND SOCIAL INDICATORS – A QuICK LOOK
DISTRICTS – AN OVERVIEW
LIST OF TAbLES
LIST OF bOxES
LIST OF FIGuRES
ChApTER 1 KERALA ECONOMy 011.1 Recent Trends in Macro-Economic Aggregates 03
1.2 Demographic Profile 12
1.3 Indicators of Poverty 16
1.4 Role of Financial Institutions in Development Initiatives 20
1.5 State Finances 27
1.6 Plan Outlay 2018-19 38
ChApTER 2 EDuCATION AND hEALTh: ExTENDING pubLIC ACTION 41ChApTER 3 AGRICuLTuRE AND ALLIED SECTORS 59
3.1 Agriculture 61
3.2 Co-operation 78
3.3 Livestock 82
3.4 Fisheries 94
3.5 Water Resources 102
3.6 Forestry and Wild Life 109
3.7 Environment 114
3.8 Food Security and Public Distribution System 122
ChApTER 4 MANuFACTuRING SECTOR 1294.1 Kerala’s Industrialisation 131
4.2 Manufacturing Sector 136
4.3 Public Sector Undertakings 140
CONTENTS
vi Kerala State Planning Board
4.4 Micro Small and Medium Enterprises 152
4.5 Food Processing 162
4.6 Traditional Industries 164
ChApTER 5 SERVICE SECTOR 189 5.1 Information Technology 191
5.2 Scientific Services and Research 204
5.3 Tourism 220
5.4 External Trade 229
5.5 Service Sector 239
5.6 Outreach to Public 246
ChApTER 6 huMAN DEVELOpMENT 2496.1 Education 251
6.2 Medical and Public Health 273
6.3 Impact of Changing Demographic Profile 292
ChApTER 7 LAbOuR AND EMpLOyMENT 3017.1 Labour and Labour Welfare 303
7.2 Employment 315
7.3 Skill Development 326
ChApTER 8 INITIATIVES FOR SOCIAL INCLuSION 3338.1 Gender and Development 335
8.2 Welfare of Scheduled Castes, Scheduled Tribes, Other Backward Classes, Minorities, and Forward Communities
351
8.3 Social Security Measures 368
ChApTER 9 ART, CuLTuRE AND SpORTS 3859.1 Art and Culture 387
9.2 Sports and Youth Affairs 393
ChApTER 10 KERALA DIASpORA 399ChApTER 11 INFRASTRuCTuRE 375
11.1 Transport 411
11.2 Energy 452
11.3 Communication 477
11.4 Drinking Water 481
11.5 Housing 487
11.6 Rebuild Kerala Initiative 494
11.7 Kerala Infrastructure Investment Fund Board 505
ChApTER 12 LOCAL GOVERNMENTS AND DECENTRALISED pLANNING 509GLOSSARy 537AbbREVIATIONS 541

vii Economic Review 2019
Kerala’s Gross State Domestic Product (GSDP) at constant (2011-12) prices registered a growth rate of 7.5 per cent in 2018-19 (Q) compared to 7.3 per cent in 2017-18(P). At current prices, the GSDP grew at 11.4 per cent in 2018-19(Q) as against 10.5 per cent in 2017-18 (P). The growth rate of Gross State Value Added (GSVA) at basic prices in constant (2011-12) prices was 7.5 per cent in 2018-19(Q), higher than the growth of 6.8 per cent in 2017-18(P). At current prices, the growth of GSVA was 10.5 per cent in 2018-19 (Q) as against 11.1 per cent in 2017-18 (P).
As per the quick estimates, the per capita GSDP at constant (2011-12) prices in 2018-19 was ₹1,61,374 as against the provisional estimate of ₹1,50,922 in 2017-18, recording a growth rate of 6.9 per cent in 2018-19. At current prices, the per capita GSDP in 2017-18 was ₹2,25,484 registering a growth rate of 10.9 per cent over the previous year’s estimate of ₹2,03,396.
According to quick estimates for 2018-19, per capita income of Kerala is ₹1,48,078. The corresponding national average (for 2018-19) is ₹93,655. In other words, average income per person in Kerala was approximately 1.6 times the Indian average in 2018-19.
Kerala’s GSVA grew at relatively fast rates during the period from 2016-17 to 2018-19 despite the many setbacks faced by the State and despite the growing signs of recession in the national economy. The sectors that contributed to this fast growth are fishing and aquaculture, manufacturing, trade, hotels and restaurants, social services mainly education and health, public services and professional services.
In 2018-19, the contribution from primary, secondary and tertiary sectors to the GSVA at constant prices (2011-12) was 9.3 per cent, 28.1 per cent and 62.6 per cent
KERALA AT A GLANCE
viii Kerala State Planning Board
respectively. At current prices, the primary, secondary and tertiary sectors contributed 11.11 per cent, 25.2 per cent, and 63.7 per cent respectively to the GSVA.
Among the sectors, the highest growth was in the secondary sector with 8.8 per cent growth at constant (2011-12) prices followed by tertiary sector (8.4 per cent). The growth in secondary sector was mainly due to a spurt in the manufacturing sector. However, the growth in primary sector was negative (-1.43 per cent), mainly due to a major slowdown in mining and quarrying sector. At current prices, the tertiary sector grew at 12.4 per cent, secondary sector at 11.4 per cent and the primary sector at -0.6 per cent.
The agriculture and allied sector growth declined to (-) 0.5 per cent in 2018-19 from a growth rate of 1.7 per cent in 2017-18. Food crops comprising rice, tapioca and pulses accounted for 10.15 per cent of the total cropped area in 2018-19 while cash crops (cashew, rubber, pepper, coconut, cardamom, tea and coffee) constituted 62.1 per cent. The area under crops like rubber, coffee, tea and cardamom was 27.7 per cent of the total cropped area.
The key initiatives undertaken by the Department of Agriculture in 2019-20 for the improvement of agricultural sector included integrated food crop production programme focusing on increasing rice production and self-sufficiency in vegetable production, holistic development of coconut sector through Keragramams, production and distribution of quality planting materials, and comprehensive fallow land cultivation with people’s participation. Efforts were also undertaken towards modernisation and establishment of labs, establishing institutional mechanism for marketing, strengthening extension activities, Agricultural Technology Management Agency (ATMA) plus model of extension, rejuvenation of spices economy, quality control of agricultural inputs and outputs and effective programmes for soil and root health management, crop health management covering pests and disease surveillance. Also measures were taken for promotion of organic farming and safe food production, crop insurance, establishment and strengthening of Agro Service Centres (ASCs) for improved service delivery and revival package for pepper in Wayanad.
As per the 20th Livestock Census (2019), the livestock population in the State was 38.36 lakh. It is 1.34 per cent less as compared to previous Census of 2012. The reason for decline is the reduction in the population of other animals especially domestic dogs, rabbit, donkey and elephants by 14.69 per cent. The poultry population of Kerala as per the 20th Livestock Census is 298.18 lakh, which accounts for 3.5 per cent of the total poultry population in the country. It registered 25 per cent increase over the 19th Livestock Census. Growth rate of poultry population in Kerala is higher than the growth rate recorded at the national level (16.81 per cent). Kerala ranks 9th among states in poultry population of the country.
As per the latest finding of India State of Forest Report, Forest Survey of India, 2019, there has been an increase in forest cover by 823 sq km in Kerala. The total forest cover as per 2019 assessment is 21, 144 sq km, 54.42 per cent of geographical area. As per 2017 report, the forest cover in the State was 20, 321 sq km.
ix Economic Review 2019
The manufacturing sector of Kerala grew at 11.2 per cent at constant prices (2011-12) in 2018-19 compared to 3.7 per cent in the previous year. The share of manufacturing sector to GSVA in Kerala at constant and current prices in 2018-19 was 13.2 per cent and 10.8 per cent respectively. The total turnover of State PSU’s under Industries Department in 2018-19 was ₹3,442.74 crore, an increase of 17.9 per cent from 2017-18. The Government of Kerala is committed to the development and rejuvenation of PSUs. Professional managers have been appointed to oversee the operations of PSUs. A permanent Public Enterprises Selection Board has been set up for selecting a cadre of top managers in a transparent manner. As regards, Micro, Small and Medium Enterprises (MSME), 13,826 new MSME units started operations in Kerala in 2018-19 with a total investment of ₹1,321.94 crore, and generated employment for 49,068 persons. Two new schemes, namely, ‘Assistance to Rebuild Flood affected MSMEs’ and ‘Interest Subvention to Flood affected MSME Units’ were introduced in 2019-20 for providing assistance to units affected by the floods.
In the field of Information Technology, the State has made significant advancements. Kerala’s internet penetration rate at 54 per cent is the second highest in the country. Kerala is the first State to make internet access a basic right. The State has been recipient of several awards in 2019 such as SKOCH Award 2019 for the e-procurement project, Digital India Awards 2019 for initiatives carried out in the State for providing a comprehensive web and mobile based services to its citizens, Tech Sabha Award 2019 for co-ordinating flood damage assessment survey process in Kerala and Governance Now Digital Transformation Awards 2019 for the projects such as K- Fi- Digital Infra, Kerala State Portal and m- Keralam mobile app. The Startup ecosystem in the State is very promising. Kerala was ranked as the top performing State in the Startup ranking by Department for Promotion of Industry and Internal Trade, Government of India.
A total number of 1.67 crore tourists (foreign and domestic) visited the State in the year 2018 indicating 5.93 per cent increase over previous year which shows that the sector rebounded quickly after the floods of 2018. The year 2018 witnessed 0.42 per cent growth in foreign tourist arrivals and 6.35 per cent growth in domestic tourist arrivals over 2017 in the State. There was 8.60 per cent increase in total revenue from the tourism industry in 2018.
As per the School Education Quality Index (SEQI) of NITI Aayog, Kerala recorded an impressive performance in education by securing 82.17 per cent score and secured the top position. As per the report, the State scored 100 per cent in terms of the transition of students from primary to secondary classes and 95.4 per cent in inclusive education. There is an increase in the enrolment of students in 2019-20 to 37.17 lakh from 37.03 lakh in 2018-19. The hi-tech school project in schools has been successfully implemented.
The health sector has witnessed significant transformation in the past few years. As per the Report on Performance of States in Health Outcomes Index (2019) released by NITI Aayog, Kerala ranks at the top in terms of overall performance with an overall

x Kerala State Planning Board
score of 74.01. Kerala is the only State in the country where the data base of 2.58 crore rural people has been collected and stored as electronic records.
Skill development is an area of priority for the Government. Skill Registry is a mobile application developed by Kerala Academy for Skills Excellence in cooperation with Industrial Training Department, Kudumbashree and Panchayat department. The app enables the people to directly avail the services of skilled workforce for their daily household and commercial needs. Entrepreneur Development Club has been constituted in all ITIs in the State to inculcate an entrepreneurial culture among the youth. The Department has taken steps to upgrade 10 ITIs to international standards.
The Kerala Volunteer Youth Action Force has been formed with the aim of preparing youth volunteers to deal with natural disasters. The idea for this volunteer force emerged from the exemplary role played by the youth in rescue and relief efforts during the floods. 2,000 youths have been trained and volunteer force has been set up in all 14 districts. The Kerala State Youth Welfare Board has been able to set up collection centres in 14 districts under the aegis of the Kerala Voluntary Youth Action Force to provide essential items to disaster affected persons.
The Local Governments have streamlined the planning process by completing the plan formulation process in time. The plan formulation process for 2019-20 was completed by December 2018. This provided more time for implementation of Plan projects. District Resource Centres have started to work to improve the quality of Plans. The new set of guidelines introduced in the 13th Plan promotes e-tendering in the execution of public works so as to ensure transparency in the system. This has resulted in substantial increase in tender savings to the tune of ₹239.60 crore in 2017-18 and ₹212.23 crore in 2018-19. The Government has also initiated efforts to improve the disaster preparedness in the State and has directed all local governments to prepare local disaster management plans. The Disaster Management Plans are proposed to be prepared by Local Governments during January – March 2020 which will be integrated with the Annual Plan 2020-21.
Mission Reconnect 2018 launched by Kerala State Electricity Board Limited during floods 2018 repaired 16,158 Distribution Transformers, reconstructed 1735 Distribution Transformer Stations, restored 25.60 lakh service connections, reconstructed 5275.80 km Distribution lines including one lakh damaged poles, replaced three lakh single phase energy meters and fifty thousand three phase energy meter and effected 720 single point connections damaged in floods in 21 days.
The State experienced two consecutive floods and landslides in 2018 and 2019. The State received rainfall of 951.4 mm as against 426.7 mm recording an excess of 123 per cent in August 2019, due to the influence of low-pressure area and depression formed over the Bay of Bengal and strengthening of Monsoon winds. The devastating flood and landslides in 2019 affected 1,030 villages in the State. It damaged 1,967 houses fully,19,297 houses severely and 2.16 lakh houses partially (flood hit and cleaned), damaged 3,900.17 km of roads, 95 bridges, 91 school buildings, 61 primary health centres and 283 anganwadis in the State.

xi Economic Review 2019
The Government through its Rebuild Kerala Initiative intends to build a green and resilient Kerala. The Rebuild Kerala Development Programme (RKDP) envisages a sector based as well as cross cutting approach in policy formulation, institutional arrangements, and prioritised projects for an effective and efficient rebuilding of the State. The sectors covered are Integrated Water Resource Management, Water Supply, Sanitation, Urban, Roads and Bridges, Transportation, Forestry, Agriculture, Animal Husbandry and Dairy Development, Fisheries, Livelihoods and Land.
The Government of Kerala is making efforts to encourage economic growth and promote social and economic development in the State despite the challenges imposed by natural calamities and resource constraints.

xii Kerala State Planning Board
Sl. No.
Item Units 1960-61 1970-71 1980-81 1990-91 2000-01 2010-11 2016-17 2017-18 2018-19
1 Geographical Area
Sq.Km. 38856.7 38864 38863 38863 38863 38863 38863 38863 38863
Administrative Setup
2 Revenue Divisions
No. 21 21 21 21
3 Districts No. 9 10 12 14 14 14 14 14 14
4 Taluks No. 55 56 58 61 63 63 75 75 75
5 Villages No. 1326 1331 1364 1452 1532 1664 1664 1664
6 Towns No. 92 88 106 197 159 520 520 520 520
Population as per Census 1951 1961 1971 1981 1991 2001 2011
7 Total (in 000s) 13549 16904 21347 25454 29099 31844 33406
8 Males (in 000s) 8362 10588 12609 14289 15469 16027
9 Females (in 000s) 8542 10760 12885 14810 16373 17379
10 Rural (in 000s) 14351 17880 20682 21618 23574 17471
11 Urban (in 000s) 2552 3467 4771 7018 8267 15935
12 Scheduled Castes
(in 000s) 1422 2002* 2549 2887 3124 3040
13 Scheduled Tribes
(in 000s) 208 193* 261 321 364 485
14 Density of Population
No. Per Sq.Km.
435 549 655 749 819 860
15 Literacy Rate Percentage 55 60 70 90 90 94
16 Sex Ratio Females per 1000 males
1022 1016 1032 1036 1058 1084
17 Urban Population
Percentage 15 16 19 24 26 48
GSDP - at constant prices 1960-61 1970-71 1980-81 1990-91 2000-01 2009-10 2016-17 2017-18 2018-19
18 GSDP ₹Crore 462 1255 3823 12195 63715 180812 485301.54 520578.51 559411.96
19 Primary Sector (GSVA)
₹Crore 241 653 1682 4756 14017 15966 45936.94 47171.30 46495.43
KERALA’S ECONOmIC AND SOCIAL INDICATORS – A QuICK LOOK

xiii Economic Review 2019
20 Secondary Sector (GSVA)
₹Crore 68 163 841 3171 14017 38249 123289.49 128990.72 140332.64
21 Tertiary Sector (GSVA)
₹Crore 153 439 1300 4268 35680 126597 266144.63 288980.73 313253.12
22 Percapita Income ₹ 276 594 1508 4207 19951 47360 141396 150922 161374
Agriculture 1960-61 1970-71 1980-81 1990-91 2000-01 2009-10 2016-17 2017-18 2018-19
23 Net Area Sown '000 Ha. 1923 2171 2180 2247 2206 2079 2015 2040 2044
24 Gross Cropped Area
‘000 Ha. 2349 2933 2885 3020 3022 2669 2584 2579 2568
25 Gross Irrigated Area
‘000 Ha. 381 385 460.3 458 497 540 489.111
26 Gross Irrigated Area to Gross Cropped Area
Percentage 13 13 15 18 19 21 19.04
Gross area under principal cropes 1960-61 1970-71 1980-81 1990-91 2000-01 2012-13 2016-17 2017-18 2018-19
27 Paddy '000 Ha. 779 875 802 559 347 197 171 189 198
28 All Pulses ‘000 Ha. 44 40 34 23 3 2 2 0.95
29 Sugarcane Harvested Area
‘000 Ha. 9 8 8 8 3 2 1 0.4 1.01
30 Rubber ‘000 Ha. 133 188 238 384 474 545 540 551 551
31 Tea ‘000 Ha. 40 37 36 35 37 30 30 30 36.47
32 Coconut ‘000 Ha. 501 719 651 870 926 798 781 760 760.9
33 Arecanut 54 86 61 65 102 98 95 95.7
34 Groundnut ‘000 Ha. 16 15 9 13 0.7 0.4 0.11 0.19
35 Pepper ‘000 Ha. 100 12 108 169 202 85 85 85 82.7
36 Cardamom ‘000 Ha. 29 47 56 67 41 42 39 39 38.8
37 Ginger ‘000 Ha. 12 12 13 14 12 5 5 4 3.27
Production of Principal Crops 1960-61 1970-71 1980-81 1990-91 2000-01 2012-13 2015-17 2017-18 2018-19
38 Rice '000 tonnes
1068 1298 1272 1087 751 509 436 521 578.2
39 All Pulses ‘000 tonnes 18 13 22 17 3 2 2 2.05
40 Sugarcane ‘000 tonnes 38 38 48 52 28 17 11 5 10.6
41 Rubber ‘000 tonnes 24 88 140 308 560 800 540 541 540.7
42 Tea ‘000 tonnes 39 43 48 63 69 63 62 62 60.76
43 Coconut In million nuts
3220 3981 3008 4232 5536 5799 5379 5230 5299
44 Arecanut ‘000 tonnes 8 13 11 13 118 117 109 99.9
45 Groundnut ‘000 tonnes 14 16 8 10 10 9 0.5 0.1 0.24
46 Pepper ‘000 tonnes 27 25 29 47 61 46 34 38 36.2
47 Cardamom ‘000 tonnes 1 1 3 3 10 17 18 11.5
48 Ginger ‘000 tonnes 11 20 32 46 42 22 20 19 15.1
Live Stock Census 1977 1982 1987 1996 2003 2007 2012 2019
49 Total Livestock in lakh 53 56 55 56 35 36 27 38.36
50 Total Poultry in lakh 152 185 308 139 127 243 298
Forest 1960-61 1970-71 1980-81 1990-91 2000-01 2011-12 2016-17 2017-18 2018-19
51 Forest Area '000 Ha. 1056 1056 1082 1082 1082 1082 1131 1152 1152

xiv Kerala State Planning Board
Factories 1971 1981 1991 2001 2011 2012 2017 2017-18 2018-19
52 Working Factories
No. 3024 9106 13255 18554 19676 20473 22998 23335 24254
53 Employees No. 206839 300515 368738 436410 644606 644802 678058 698679 726195
54 Employees per lakh population
No. 969 1181 1267 1370 1930 1930 1976 2026 2095
Electricity 1970-71 1980-81 1990-91 2000-01 2009-10 2011-12 2016-17 2017-18 2018-19
55 Total Generation Mu 2126 5242 5491 7656 6495 8351 4380 5474.4 7626.3
56 Total Consumption
Mu 2869 5282 10319 12878 16182 20038 21159.19 21750.2
57 Industrial Consumption
Mu 2025 2697 3784 4002 4926 5260 5648.31 5820.5
58 Agricultural Consumption
Mu 125 288 350 225 286 322 346.0 337.6
59 Domestic Consumption
Mu 409 1621 4688 5931 7706 10281 10574.8 10846.3
Education 1970-71 1980-81 1990-91 2000-01 2009-10 2012-13 2016-17 2017-18 2018-19
60 Primary Schools No. 9437 9605 9682 9714 9828 9737 9861 9852 9841
61 Enrolment '000s 4156 4284 4402 3637 3015 2545 2398 2384 2428
62 High Schools No. 1199 1971 2451 2596 2814 2890 3021 3119 3120
63 Enrolment '000s 1310 1498 1611 1443 1426 1365 3681 3704
Health 1970-71 1980-81 1990-91 2000-01 2009-10 2011-12 2016-17 2017-18 2018-19
64 Hospitals No. 553 746 1199 1319 1254 1255 1463# 1470 1470
65 No. of Beds No. 21777 32447 38726 38242 37021 37388 56257# 56596 56793
Vital statistics (Demographic Status ) 1970-71 1980-81 1990-91 2001 2009 2010 2011 2017##
66 Birth Rate per 1000 population
32 26 20 16 15 15 15 14.2
67 Death Rate per 1000 population
9 6 6 7 7 7 7 6.8
68 Infant Mortality Rate
per 1000 population
61 37 21 11 12 14 13 10
Transport 1970-71 1980-81 1990-91 2000-01 2010-11 2011-12 2016-17 2017-18 2018-19
69 Railway Route Length
Kms. 892 921 988 1148 1257 1257 1257 1257 1257
70 Total Road Length Kms. 18037 94145 128403 125835 151652 244373 218942 229349** 31812.106
71 Motor Vehicles '000s 86234 195000 648000 2111885 6072019 8048673 11030037 12042691 13334984
Local Governments 1990-91 2000-01 2006-07 2007-08 2008-09 2010-11 2016-17 2017-18 2018-19
72 District Panchayats
No. 14 14 14 14 14 14 14 14
73 Block Panchayats
No. 152 152 152 152 152 152 152 152
74 Grama Panchayats
No. 983 990 999 999 999 978 941 941 941
75 Municipalities No. 58 53 53 53 53 60 87 87 87
76 Corporations No. 3 5 5 5 5 5 6 6 6
# Modern Medicine and Ayush included:##SRS 2019 May*Base year 2011-12**excludes LSGD non pucca road

xv Economic Review 2019
Sl.No. Items TVM KLM PTA ALP KTM IDK EKM
1 Area (sq Km) 2192 2491 2637 1414 2208 4358 3068
2Forest Cover (sq. Km) *
1327 1356 1830 68 967 3139 1273
3Population 2011 ( in Lakh)
33.01 26.35 11.97 21.28 19.75 11.09 32.82
Rural 15.3 14.48 10.66 9.8 14.09 10.56 10.47
Male 7.25 6.81 5 4.65 6.93 5.27 5.18
Female 8.05 7.67 5.66 5.15 7.16 5.29 5.29
Percentage Decadal Growth (2001-2011)
-28.6 -31.7 -4 -34.2 -14.8 -1.4 -35.7
Urban 17.72 11.87 1.32 11.48 5.66 0.51 22.34
Male 8.57 5.66 0.62 5.48 2.76 0.25 11.01
Female 9.15 6.21 0.7 6 2.9 0.26 11.33
Percentage Decadal Growth (2001-2011)
62.3 154.8 6.3 84.8 88.6 -9.6 51.3
Density 1508 1061 452 1504 895 255 1072
Fishermen Population, in number
164883 123100 2073 167794 24420 691 133387
SC population as % of Total Population
11.3 12.5 13.7 9.5 7.8 13.1 8.2
ST population as % of Total Population
0.8 0.4 0.7 0.3 1.1 5.0 0.5
4 Literacy Rate (2011)
Male 94.2 95.8 97.7 97.9 97.2 94.8 97.1
Female 90.9 91.9 96.3 94.8 95.7 89.6 94.3
DISTRICTS – AN OVERVIEW
xvi Kerala State Planning Board
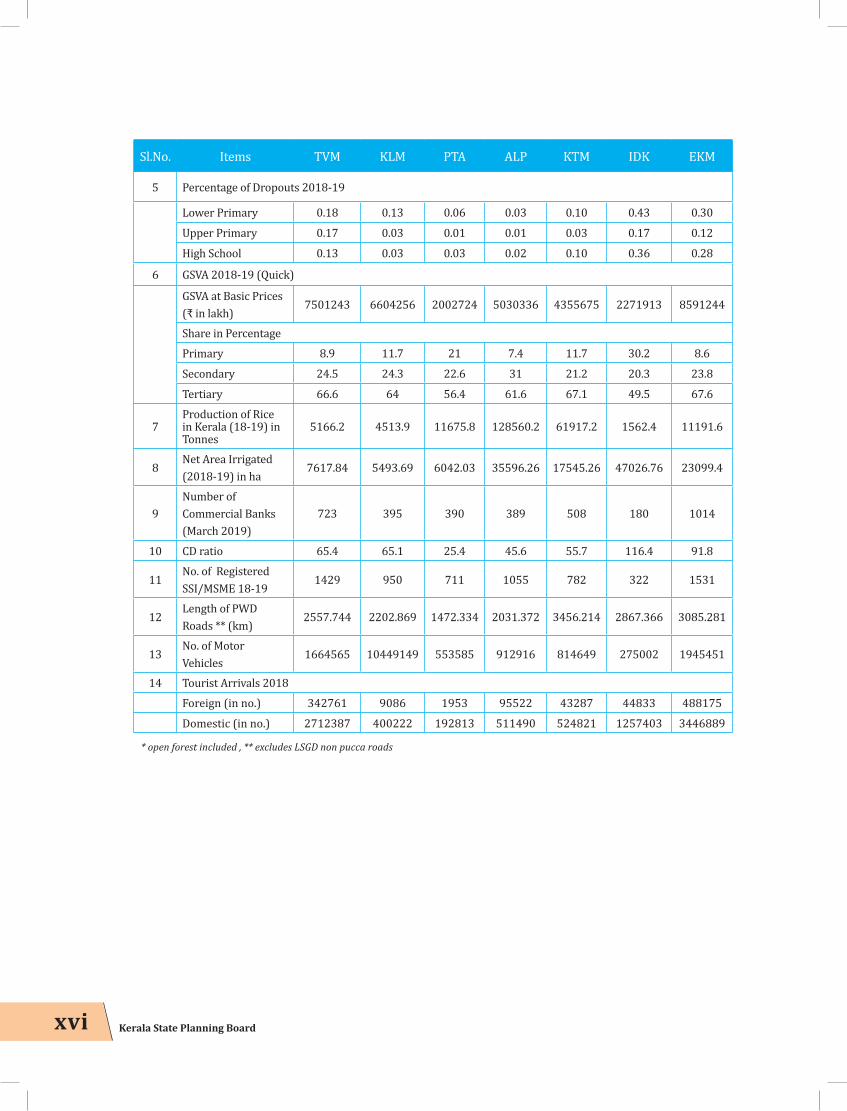
Sl.No. Items TVM KLM PTA ALP KTM IDK EKM
5 Percentage of Dropouts 2018-19
Lower Primary 0.18 0.13 0.06 0.03 0.10 0.43 0.30
Upper Primary 0.17 0.03 0.01 0.01 0.03 0.17 0.12
High School 0.13 0.03 0.03 0.02 0.10 0.36 0.28
6 GSVA 2018-19 (Quick)
GSVA at Basic Prices (₹ in lakh)
7501243 6604256 2002724 5030336 4355675 2271913 8591244
Share in Percentage
Primary 8.9 11.7 21 7.4 11.7 30.2 8.6
Secondary 24.5 24.3 22.6 31 21.2 20.3 23.8
Tertiary 66.6 64 56.4 61.6 67.1 49.5 67.6
7Production of Rice in Kerala (18-19) in Tonnes
5166.2 4513.9 11675.8 128560.2 61917.2 1562.4 11191.6
8Net Area Irrigated (2018-19) in ha
7617.84 5493.69 6042.03 35596.26 17545.26 47026.76 23099.4
9Number of Commercial Banks (March 2019)
723 395 390 389 508 180 1014
10 CD ratio 65.4 65.1 25.4 45.6 55.7 116.4 91.8
11No. of Registered SSI/MSME 18-19
1429 950 711 1055 782 322 1531
12Length of PWD Roads ** (km)
2557.744 2202.869 1472.334 2031.372 3456.214 2867.366 3085.281
13No. of Motor Vehicles
1664565 10449149 553585 912916 814649 275002 1945451
14 Tourist Arrivals 2018
Foreign (in no.) 342761 9086 1953 95522 43287 44833 488175
Domestic (in no.) 2712387 400222 192813 511490 524821 1257403 3446889
* open forest included , ** excludes LSGD non pucca roads
xvii Economic Review 2019
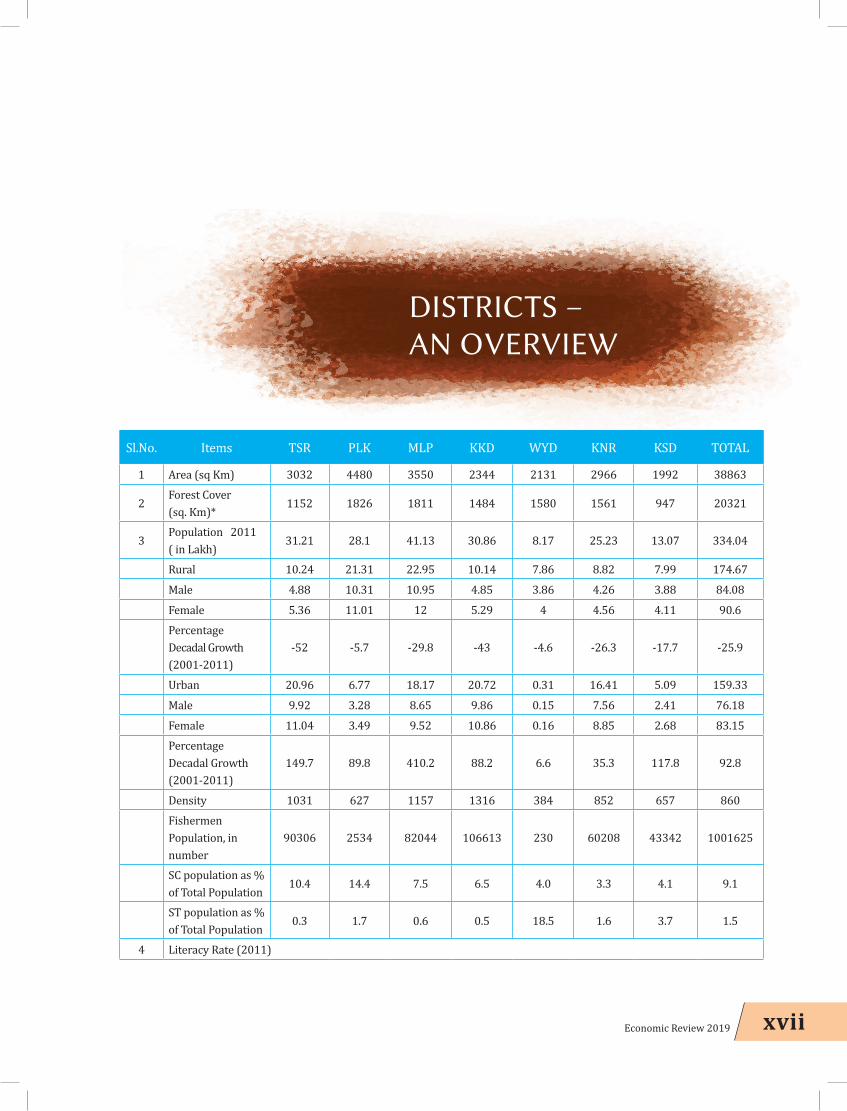
DISTRICTS – AN OVERVIEW
Sl.No. Items TSR PLK MLP KKD WYD KNR KSD TOTAL
1 Area (sq Km) 3032 4480 3550 2344 2131 2966 1992 38863
2Forest Cover (sq. Km)*
1152 1826 1811 1484 1580 1561 947 20321
3Population 2011( in Lakh)
31.21 28.1 41.13 30.86 8.17 25.23 13.07 334.04
Rural 10.24 21.31 22.95 10.14 7.86 8.82 7.99 174.67
Male 4.88 10.31 10.95 4.85 3.86 4.26 3.88 84.08
Female 5.36 11.01 12 5.29 4 4.56 4.11 90.6
Percentage Decadal Growth(2001-2011)
-52 -5.7 -29.8 -43 -4.6 -26.3 -17.7 -25.9
Urban 20.96 6.77 18.17 20.72 0.31 16.41 5.09 159.33
Male 9.92 3.28 8.65 9.86 0.15 7.56 2.41 76.18
Female 11.04 3.49 9.52 10.86 0.16 8.85 2.68 83.15
Percentage Decadal Growth (2001-2011)
149.7 89.8 410.2 88.2 6.6 35.3 117.8 92.8
Density 1031 627 1157 1316 384 852 657 860
Fishermen Population, in number
90306 2534 82044 106613 230 60208 43342 1001625
SC population as % of Total Population
10.4 14.4 7.5 6.5 4.0 3.3 4.1 9.1
ST population as % of Total Population
0.3 1.7 0.6 0.5 18.5 1.6 3.7 1.5
4 Literacy Rate (2011)

xviii Kerala State Planning Board
Male 96.98 92.27 95.78 97.57 92.84 97.54 93.93 96.1
Female 93.85 84.99 91.55 93.16 85.94 93.57 86.13 92.1
Sl.No. Items TSR PLK MLP KKD WYD KNR KSD TOTAL5 Percentage of dropouts 2018-19
Lower Primary 0.05 0.22 0.04 0.07 0.12 0.05 0.12 0.12
Upper Primary 0.03 0.07 0.08 0.05 0.20 0.02 0.12 0.07
Higher Secondary 0.15 0.12 0.15 0.05 1.54 0.13 0.25 0.17
6 GSVA 2018-19 (Quick)
GSVA at Basic Prices ( ₹ in lakh)
6918888 4931638 6983367 6069055 1388534 4980788 2401479 70031141
Share in Percentage
Primary 8.1 14.5 9.3 7.8 20.2 9.5 19.6 11.1
Secondary 24.1 25.4 23.2 29.2 19.7 30.3 26.5 25.2
Tertiary 67.8 60.1 67.5 63 60.1 60.2 53.9 63.7
7Production of Rice in Kerala (18-19) in Tonnes
69453.2 215284.7 26983.5 3438.8 22340.3 11143.6 5024.2 578255.6
8Net Area Irrigated (2018-19) in ha
67490.96 80215.32 27474 4584.49 13782.28 12513.84 55914.46 404396.59
9Number of Commercial Banks (March 2019)
751 439 453 453 123 386 226 6430
10 CD ratio 58.8 66.8 58.6 76.9 138.8 54.6 78 65.6
11No. of Registered SSI/MSME 18-19
1676 1991 1036 1195 244 681 223 13826
12Length of PWD Roads ** (km)
2064.216 2184.693 2680.152 2454.647 1029.314 2265.242 1460.662 31812.106
13No. of Motor Vehicles
1361561 904345 1210721 1227317 206476 826010 383237 13334984
14 Tourist Arrivals 2018
Foreign (in No:s) 11333 1967 17610 18388 11607 5763 4122 1096407
Domestic (in No.s) 2497278 509883 565914 1052783 888141 768038 276599 15604661
* open forest included , ** excludes LSGD non pucca roads

xix Economic Review 2019
LIST OF TABLES
Sl.No. Item PageTable 1.1.1 State Domestic Product and per capita income of Kerala 4Table 1.1.2 Gross National Income, Gross Domestic Product and per capita income at
2011-12 prices and current prices, all India, in ₹ crore 5
Table 1.1.3 Shares of different sectors in Gross Value Added and employment, Kerala and India, 2017-18
8
Table 1.1.4 District-wise distribution of Gross State Value Added 8Table 1.1.5 District-wise per capita Gross State Value Added at basic price, constant prices,
2011-129
Table 1.1.6 All India inflation rates (per cent) based on CPI(General) and CFPI 9Table 1.2.1 District-wise distribution of the population in different age groups-2011 15Table 1.3.1 Proportion of poor in India and in Kerala, 1973-74 to 2011-12 16Table 1.4.1 Banking group-wise branch network in Kerala 20Table 1.4.2 Banking group-wise details of SC/ST advances as on March 2019, ₹ in crore 23Table 1.4.3 Performance of co-operative sector, in ₹ crore 25Table 1.4.4 Financial performance of KSFE for the last five years, in ₹ crore 26Table 1.4.5 Overall business position of KSFE for the last five years, in ₹ crore 26Table 1.5.1 Financial indications for Government of Kerala 28Table 1.5.2 Major deficit indicators, in ₹ crore 28Table 1.5.3 Central transfers, in ₹ crore 32Table 1.5.4 Trends in revenue expenditure, in ₹crore 33Table 1.5.5 Trend in capital outlay, in ₹ crore 35Table 1.5.6 Details of Government debts, in ₹ crore 36Table 1.5.7 Composition of borrowings of the Government, in per cent 36Table 1.5.8 Outstanding guarantees, in ₹ crore 36

xx Kerala State Planning Board
Table 1.6.4 Annual Plan 2018-19 and 2019-20 sector-wise outlay, comparative statement 39Table 2.1.1 Selected indicators achievements in social spheres, Kerala and India, 2015-16 43Table 2.1.2 New students who sought admission in public funded schools in Kerala, from
2016-17 to 2019-2046
Table 2.1.3 Enrolment in higher education in Kerala, 2018-19 50Table 2.1.4 Details of additional posts created under Aardram Mission 53Table 2.1.5 Post creation in District/General/Taluk hospitals during 2017-18 55Table 3.1.1 Share of agriculture and allied sectors in GVA/GSVA National and State level,
constant prices 2011-1261
Table 3.1.2 Commodity and crop-wise consumption of indigenous pesticides, chemical and bio, 2017-18 and 2018-19 MT, technical grade
69
Table 3.1.3 Credit flow to agriculture sector in 2017-18, in ₹ crore 76Table 3.3.1 Livestock and poultry population in India, in million 83Table 3.3.2 Livestock and poultry population in Kerala, in lakh population 84Table 3.6.1 Details of incidents of human-animal conflict reported and compensation paid
in 2018-19111
Table 3.6.2 Details of damages and loss on account of heavy rains and floods in August 2018, in ₹ crore
113
Table 3.6.3 Details of damages and loss on account of heavy rains and floods in August 2019, in ₹ crore
113
Table 3.8.1 Category-wise distribution of food grains under NFSA, as on November 2019 124Table 3.8.2 Subsidy spent by GoK for various card holders, in ₹ lakh 125Table 4.1.1 Structure and relative size with respect to employment and value added:
shares of industries in total factory sector of Kerala and shares of Kerala’s industries in total by the respective industries in India, 2016-17
132
Table 4.1.2 Employment in selected major industries, Kerala and India, 2016-17, in numbers
134
Table 4.2.1 Revenue from minerals, in ₹ crore 138Table 4.3.1 State PSUs under Industries Department: Plan fund allocation, turnover and
net profits, in ₹crore144
Table 4.3.2 Key financial parameters of KSIDC, in ₹ crore 146Table 4.3.3 Plan outlay and expenditure, KSIDC, in ₹ crore 147Table 4.3.4 Key financial parameters of KINFRA, in ₹ crore 148Table 4.3.5 Plan outlay and expenditure, KINFRA, in ₹ crore 149Table 4.4.1 Estimated number of MSMEs, Activity Wise 152Table 4.4.2 Year-wise details of new MSME units started in Kerala under each subsector 155Table 4.4.3 Plan outlay and expenditure of village and small enterprises Annual Plan 2018-
19 and 2019-20, in ₹ crore156
Table 4.6.1 Outlay and expenditure for major schemes in handloom sector, in ₹ lakh 168Table 4.6.2 Production, sales and employment generation in Khadi and Village Industries
sector, Kerala and India173

xxi Economic Review 2019
Table 4.6.3 Production, sales, employment and wages in Khadi and Village Industries in Kerala
174
Table 4.6.4 Fund allocated to and expenditure incurred by Khadi andVillage Industries Board in Kerala, in ₹ lakh
174
Table 4.6.5 No of coir co-operative societies in Kerala 179Table 4.6.6 Operating status of coir co-operative societies 180Table 4.6.7 Coir production and turn over in Kerala 182Table 4.6.8 Production of cashew nut in selected countries, from 2017-18 and 2018-19, in
1000 Metric Tonnes184
Table 4.6.9 Plan outlay and expenditure of Government agencies in 2018-19 and 2019-20, in ₹ crore
185
Table 4.6.10 Sales turnover CAPEX, in ₹ crore 186Table 5.1.1 Plan outlay and expenditure, ₹ in crore 192Table 5.1.2 Technopark’s contribution to the State economy 197Table 5.1.3 Land available with Technopark 197Table 5.1.4 Land available with Infopark 200Table 5.2.1 Profile of RCC in 2018-19 at a glance 212Table 5.2.2 New cases registered in RCC during the last 5 years from 2014-15 to 2018-19 212Table 5.2.3 New cases registered in RCC during 2017-18 and 2018-2019. speciality clinic-
wise213
Table 5.2.4 Cases registered in speciality clinics, gender-wise, 2017-18 and 2018-19 214Table 5.2.5 System-wise distribution of cancer patients by gender, in per cent 215Table 5.2.6 Number of cases referred to RCC in 2017-18 and 2018-19 215Table 5.2.7 Central and State Government schemes, 2017-18 and 2018-19 216Table 5.2.8 Details of cancer detection 218Table 5.2.9 Outlay and expenditure of Science and Technology sector, 2014-15 to 2018-19,
in ₹ crore218
Table 5.3.1 Month-wise Foreign Tourist Arrivals (FTAs) in India and Kerala in 2017 and 2018, in number
221
Table 5.3.2 Month-wise arrival of domestic tourists in Kerala in 2017, 2018 and 2019 224Table 5.3.3 Total revenue generated from tourism, Direct and Indirect, in Kerala from 2009
to 2018, in ₹ crore226
Table 5.3.4 State Plan outlay and expenditure, 2013-14 to 2018-19, in ₹ crore 227Table 5.4.1 Cargo handled at Cochin Port from 2016-17 to 2018-19, Quantity in lakh MT 230Table 5.4.2 Export of marine products in India and Kerala 2011-12 to 2018-19, quantity in
MT and value in ₹ crore231
Table 5.4.3 Export of cashew kernels, Kerala and India, 2011-12 to 2018-19, in ₹ crore 234Table 5.4.4 Export of tea from Kerala ports and India, 2012-13 to 2018-19, quantity on MT,
₹ in lakh236
Table 5.4.5 Export of spices, India and Kerala, from 2013-14 to 2018-19, quantity in MT and value in ₹ lakh
237
Table 6.1.1 Status of Special Literacy Programmes- 2018-19 253

xxii Kerala State Planning Board
Table 6.1.2 Number of persons who enrolled in higher secondary and 10th equivalency courses
253
Table 6.1.3 Proportion of SC/ST students in schools-2019-20 256Table 6.1.4 Stage-wise drop-out ratio in schools 256Table 6.1.5 District-wise dropout ratio in 2018-19 257Table 6.1.6 Enrolment of students in srts and science colleges 263Table 6.1.7 Percentage of SC/ST students in higher education 264Table 6.1.8 B.Tech result, 2019 271Table 6.1.9 Pass percentage of SC/ST B.Tech students, 2019 271Table 6.1.10 Percentage SC/ST students in Polytechnics 272Table 6.2.1 Department-wise outlay and expenditure, Annual Plan 2015-20, ₹ in lakhs 273Table 6.2.2 Prevalence of communicable diseases in Kerala 276Table 6.2.3 Major achievements of the drugs control department in 2018-19 279Table 6.2.4 Major achievements of the Commissionerate of Food Safety in 2018-19 and
2019-20, August 2019286
Table 6.2.5 Details of the Government, aided, and unaided colleges affiliated under various streams, number as on October 2019
287
Table 6.2.6 Age composition of senior citizens in Kerala, in numbers 288Table 6.3.1 Age composition of senior citizens in Kerala , in numbers 293Table 6.3.2 Marital status of Kerala’s senior citizens 293Table 7.2.1 Public sector employment, women participation in 2018-2019 321Table 8.1.1 Literacy at different levels 338Table 8.1.2 Enrolment of girls and boys at different levels, 2019-20 339Table 8.1.3 Health status of women in India and Kerala 339Table 8.1.4 Indicators of maternal care 340Table 8.1.5 Life style health indicators 340Table 8.1.6 Employment in the organised sector 343Table 8.1.7 Distribution of women employees among different levels of Government 344Table 8.1.8 Financial inclusion through NHGs, 2019 345Table 8.1.9 Joint liability groups and micro enterprises under kudumbashree 345Table 8.1.10 Women’s participation in decision making 346Table 9.2.1 List of major stadiums in Kerala, by use and seating capacity 394Table 10.1.1 International migrants, 1970 to 2019 401Table 11.1.1 Outlay and expenditure in the transport sector in the Annual Plan 2018-19 and
2019-20, expenditure up to September 2019, in ₹ lakh413
Table 11.1.2 Department-wise outlay and expenditure of the road transport sector in Annual Plan 2018-19 and Annual Plan 2019-20, in ₹ lakh
414
Table 11.1.3 Agency-wise distribution of State roads in Kerala in 2017-18 and 2018-19 414Table 11.1.4 National Highways (NH) in Kerala 415Table 11.1.5 Present Status of Coastal Highway 416

xxiii Economic Review 2019
Table 11.1.6 List of completed and on-going projects with State fund, 2018-19, in ₹ crore 419Table 11.1.7 Works progressing under Challenge Fund, in ₹ crore 420Table 11.1.8 Scheme-wise outlay and expenditure of Motor Vehicles Department in 2018-19
and 2019-20, expenditure up to September 2019, in ₹ lakh424
Table 11.1.9 Accident trend in Kerala in 2010-2019 426Table 11.1.10 Scheme-wise outlay and expenditure from 2017-18 to 2019-20, in ₹ lakh 428Table 11.1.11 Details of electric vehicles registered 429Table 11.1.12 Major initiatives of KRDCL project in 2018-19 430Table 11.1.13 Technical/design specifications of Thiruvananthapuram-Kasaragod Semi High
Speed Rail431
Table 11.1.14 Details of Kochi Metro, in ₹ crore 431Table 11.1.15 Water Metro-Funding pattern, ₹ in crore 433Table 11.1.16 Traffic handled at major ports, in ‘000 tonnes 436Table 11.1.17 Details of operating ports in India 437Table 11.1.18 Traffic handled in non-major ports in India in ‘000 tonnes 438Table 11.1.19 Traffic handled in non-major ports in Kerala in ‘000 tonnes 438Table 11.1.20 Traffic handled in non-major ports in Karnataka in ‘000 tonnes 438Table 11.1.21 Traffic handled in non-major ports in Tamil Nadu in ‘000 tonnes 438Table 11.1.22 Passenger handled, in ‘00 number 439
Table 11.1.23 Selected State-wise capacity utilisation at non-major ports in India in 2018-19, in million tonnes
439
Table 11.1.24 Cochin Shipyard Limited, basic details, in ₹ crore 440
Table 11.1.25 Financial progress, ₹ in crore 441
Table 11.1.26 Status of port construction, Up to October 31, 2019 441
Table 11.1.27 Details of inspection conducted for KIV Implementation 443
Table 11.1.28 Number of vessels registered in Kerala 443
Table 11.1.29 Details of incentive programmes by KMB/Port Department, in ₹ 444
Table 11.1.30 Cargo traffic movement in National Waterways 447
Table 11.1.31 Present status of West Coast Canal 449
Table 11.1.32 Scheme-wise review from 2017-18 to 2019-20 ₹ in lakh 450
Table 11.2.1 All India installed capacity as on October 31, 2019 453
Table 11.2.2 All India installed capacity as on October 31, 2019 454
Table 11.2.3 Outlay and expenditure in the Annual Plan 2018-19 and Annual Plan 2019-20, in ₹ lakh
454
Table 11.2.4 KSEBL internal generation 456
Table 11.2.5 Ongoing hydro power projects in the State 456
Table 11.2.6 Comparison of energy wheeled through open access at Kerala periphery in finanacial year 2019 with that of previous years
457
Table 11.2.7 The progress of State Government funded projects 465
Table 11.2.8 Outlay and expenditure of ANERT in 2018-19 and 2019-20, in ₹ lakh 469

Table 11.2.9 Outlay and expenditure of EMC in 2018-19 and 2019-20, in ₹ lakh 472
Table 11.2.10 Outlay and expenditure of Electrical Inspectorate in 2018-19 and 2019-20 in ₹ lakh
473
Table 11.4.1 Achievements of Jalanidhi – II 485
Table 11.5.1 Advances outstanding in housing sector as on March 2019 491
Table 11.6.1 Estimation of damage consequent to floods, 2018, in ₹ crore 495
Table 11.6.2 Estimation of damage/relief consequent to floods, 2019, in ₹ lakh 498
Table 11.6.3 Details of assistance given to reconstruct damaged houses in floods as on December 5, 2019, in ₹ crore
499
Table 11.6.4 Details of loan sanctioned under the scheme ‘Ujjeevani’ as on June 2019, in ₹ lakh
500
Table 11.6.5 Details as accorded to RKDP schemes as on December 10, 2019, in ₹ crore 503
Table 11.6.6 Details of in-principle approval as on December 6, 2019, in ₹ crore 503
Table 11.7.1 Status of KIIFB approved projects, Department-wise 507
Table 12.1.1 Share of productive sector expenditure in the total expenditure under normal share of general sector funds of Local Governments 2018-19, in ₹ crore
516
Table 12.2.2 Distribution of Development Fund for different tiers of Local Governments 2018-19, in ₹ lakh
518
Table 12.1.3 Annual Plan 2018-19, share of production sector expenditure in the normal share of general sector, ₹ in crore
522
Table 12.1.4 Expenditure for Special Sector Plan 2018-19 523
Table 12.1.5 Physical achievements of DAY-NRLM 533

xxv Economic Review 2019
Sl.No. Item PageBox 1.3.1 Sustainable Development Goals (SDGs) index of States in India 18
Box 1.4.1 KSFE Pravasi Chitty 26Box 2.1.1 Highlights of Kerala’s achievements in education 45Box 2.1.2 Little KITEs IT Clubs 47Box 2.1.3 ‘Hamari Malayalam’ (Our Malayalam) 48Box 3.3.1 20th Livestock Census 82Box 3.3.2 20th Livestock Census – Kerala 84Box 3.3.3 Bhoomika – GIS based mapping as a tool for Animal Resource
Management System91
Box 3.3.4 Regional Comprehensive Economic Partnership (RCEP) 92Box 3.5.1 On-going major and medium irrigation projects — interventions of the
Technical Committee104
Box 3.5.2 “A Special Package for Post Flood Kuttanad” prepared by State Planning Board
106
Box 3.5.3 Adoption of Micro Irrigation Techniques for Improved Irrigation Efficiency
108
Box 4.3.1 PSUs contribution for launching of Chandrayaan-2 Mission 142Box 4.3.2 Major activities and ongoing projects by KSIDC 146Box 4.3.3 International Conference and Exposition on Coconut Development,
Kozhikode148
Box 4.3.4 Ongoing Projects of KINFRA 150Box 4.4.1 Expert Committee on Micro, Small and Medium Enterprises 153Box 4.4.2 Skill development and training institutes in Kerala 158Box 4.6.1 Malabar Crafts Mela 2019 165Box 4.6.2 Achievements 170Box 4.6.3 Achievements of coir sector in Kerala in 2018-19 183
LIST OF BOXES

xxvi Kerala State Planning Board
Box 5.1.1 Academic programmes of IIITM-K 196Box 5.2.1 Institute of Advanced Virology 205Box 5.2.2 Global strategy towards the elimination of cervical cancer as a public
health problem, WHO 2019211
Box 5.3.1 Champions Boat League 227Box 5.6.1 Major achievements of Department of Information and Public Relations
(I&PRD), 2018-19247
Box 6.1.1 NITI Aayog Report 2019 252Box 6.1.2 School WIKI by KITE 259Box 6.1.3 Science Parks in schools — Project of Samagra Siksha Kerala 261Box 6.1.4 State Assessment and Accreditation Centre (SAAC) 265Box 6.1.5 Pattanam Archaeological Research 266Box 6.1.6 ASAP with NISH and Social Justice Department 269Box 6.1.7 Centre of Excellence in System, Energy, and Environment 270Box 7.2.1 Employability Centre 324Box 7.3.1 Group Insurance Scheme 328Box 7.3.2 Noon Meal programme for ITI Trainees 329Box 7.3.3 Skill Registry 330Box 8.1.1 Gender mainstreaming and gender equality strategy – approach and
principles of UNDP336
Box 8.1.2 SARANYA: Self-employment scheme for the registered unemployed widows, deserted, divorced, unmarried, and unwedded mother
342
Box 8.1.3 Help Desks for Women 348Box 8.1.4 Gender Snapshot 2019 of Sustainable Development Goals Worldwide 350Box 8.2.1 Food Craft Institute, Palakkad 355Box 8.2.2 Financial assistance for seeking jobs abroad 355Box 8.2.3 LIFE Mission and Housing Scheme for Scheduled Castes 356Box 8.2.4 Handholding cell and Mobile App 356Box 8.2.5 Online web portal of Gadhika products 357Box 8.2.6 Major physical achievements in the education sector in 2018-19 360Box 8.3.1 National Award-2019 for the empowerment of persons with disabilities 371Box 8.3.2 Scheme for transgenders 375Box 9.2.1 Jimmy George Fitness Centre 395Box 9.2.2 Details of three centres functioning under Elite Scheme 397Box 9.2.3 Kerala Voluntary Youth Action Force 398Box 10.1.1 Data and information on migration and migrants 403Box 11.1.1 Major initiatives of PWD, Roads and Bridges, in 2018-19 417Box 11.1.2 Major activities of RICK in 2018-19 421Box 11.1.3 Slowdown in auto sector sales 424Box 11.1.4 Major internal indicators of KSRTC in 2018-19 427
xxvii Economic Review 2019
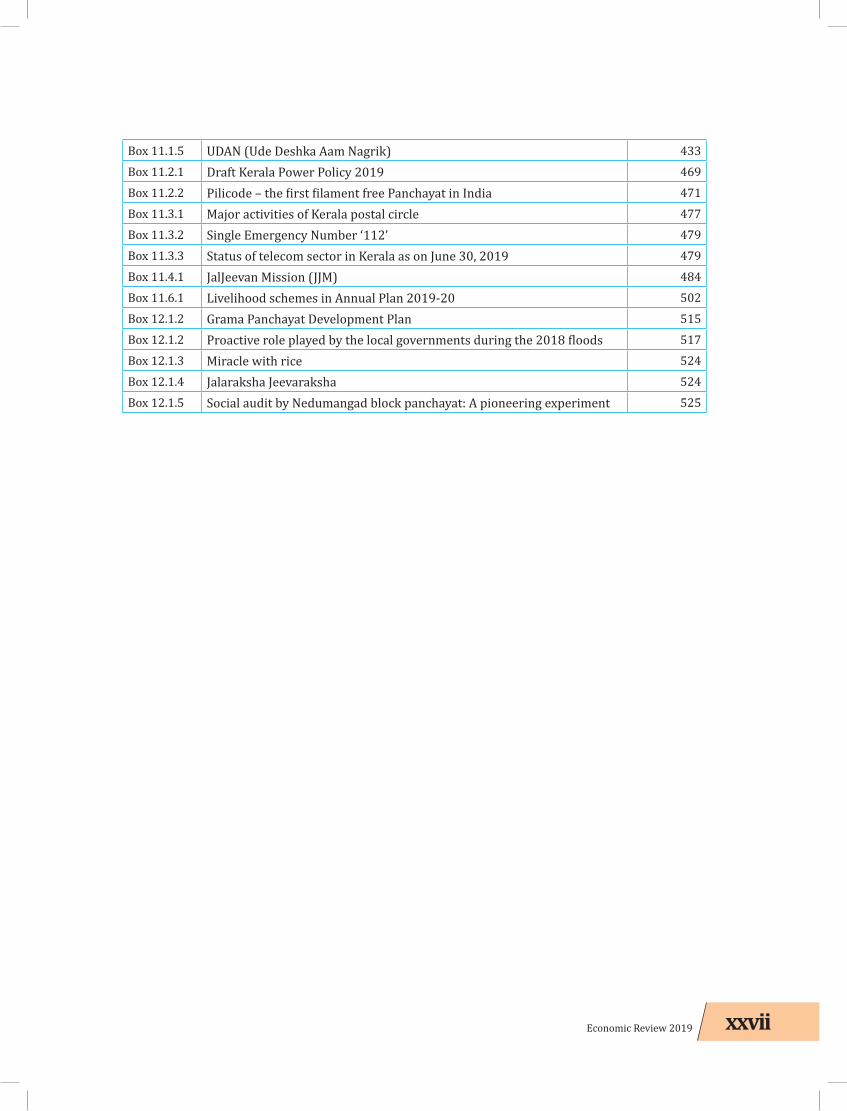
Box 11.1.5 UDAN (Ude Deshka Aam Nagrik) 433Box 11.2.1 Draft Kerala Power Policy 2019 469Box 11.2.2 Pilicode – the first filament free Panchayat in India 471Box 11.3.1 Major activities of Kerala postal circle 477Box 11.3.2 Single Emergency Number ‘112’ 479Box 11.3.3 Status of telecom sector in Kerala as on June 30, 2019 479Box 11.4.1 JalJeevan Mission (JJM) 484Box 11.6.1 Livelihood schemes in Annual Plan 2019-20 502Box 12.1.2 Grama Panchayat Development Plan 515Box 12.1.2 Proactive role played by the local governments during the 2018 floods 517Box 12.1.3 Miracle with rice 524Box 12.1.4 Jalaraksha Jeevaraksha 524Box 12.1.5 Social audit by Nedumangad block panchayat: A pioneering experiment 525


xxix Economic Review 2019
Sl.No. Item PageFigure 1.1 .1 Annual rates of growth of GSVA for Kerala and GVA for India, both at constant
2011-12 prices, in per cent3
Figure 1.1 .2 Per capita NSDP and per capita NDP at constant 2011-12, prices in ₹ 7Figure 1.1 .3 Price received and price paid by farmers 10Figure 1.2.1 Population in Kerala 12Figure 1.2.2 Rural and urban population in Kerala 13Figure 1.2.3 Proportion of child population in Kerala, per cent 13Figure 1.4.1 Growth of bank deposit in Kerala from 2010-2019 21Figure 1.4.2 Share of agricultural advances as on March 2019 22Figure 1.4.3 District-wise distribution of deposits and credit of scheduled commercial
banks in Kerala as on March 201924
Figure 1.5.1 Proportion of State revenue receipts 29Figure 1.5.2 Source-wise State own tax revenue in 2018-19 30Figure 1.5.3 Net sharable union tax as per Finance Commission recommendation 31Figure 1.5.4 Trend of flexible and tied fund transfer from Central Government 31Figure 1.5.5 Proportion of interest, pension, salary, subsidies and LSGD devolution in
revenue expenditure33
Figure 1.5.6 Trend of interest , pension, salaries and subsidies in revenue expenditure 34Figure 1.5.7 Trends in the components of capital expenditure 35Figure 2.1.1 Trend of schools enrolment since 1989-90 45Figure 2.1.2 Sex-wise and caste-wise proportion of students in graduate courses 49Figure 3.1.1 Southwest monsoon rainfall received from June 1 to September 30, 2019 62Figure 3.1.2 Northeast monsoon rainfall received from October 1 to December 31, 2019 63Figure 3.1.3 Land use pattern of Kerala 2018-19 64Figure 3.1.4 Season-wise area and production of rice in Kerala, 2016-17 to 2018-19 65Figure 3.1.5 Agriculture advances in Kerala from 2013-14 to 2018-19 75
LIST OF FIGuRES
xxx Kerala State Planning Board
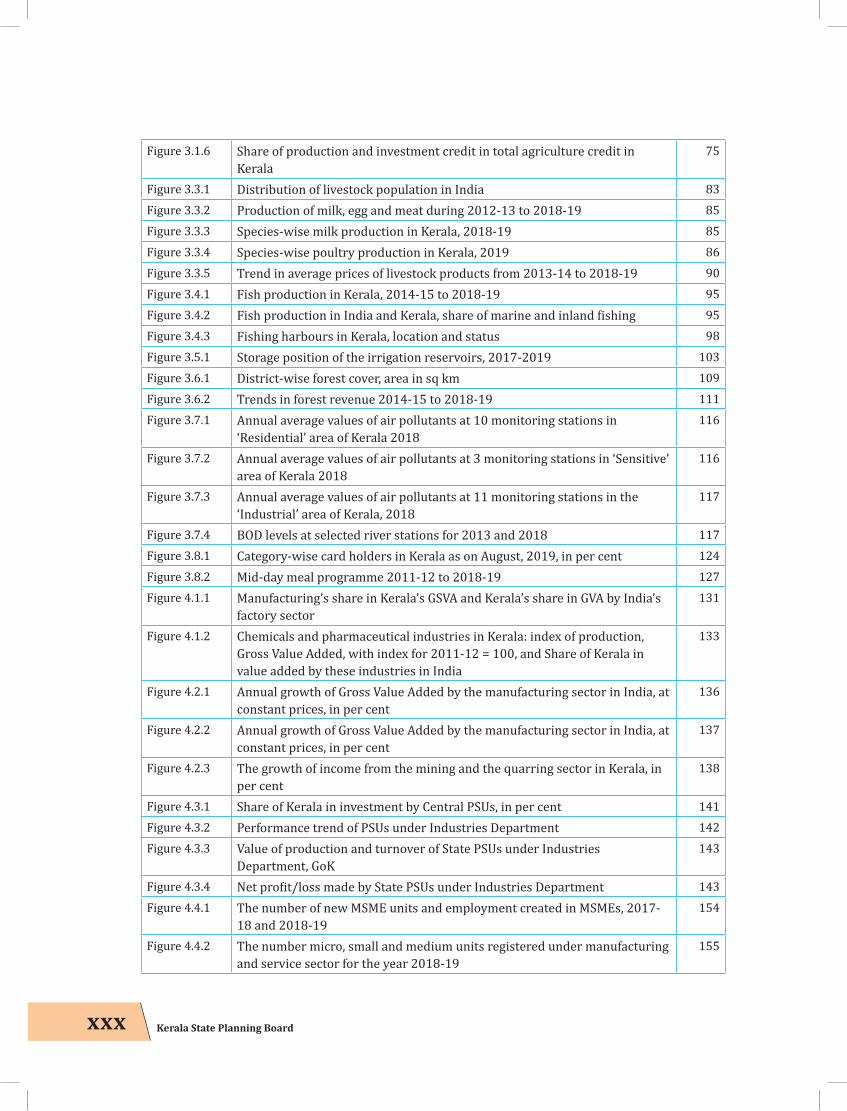
Figure 3.1.6 Share of production and investment credit in total agriculture credit in Kerala
75
Figure 3.3.1 Distribution of livestock population in India 83Figure 3.3.2 Production of milk, egg and meat during 2012-13 to 2018-19 85Figure 3.3.3 Species-wise milk production in Kerala, 2018-19 85Figure 3.3.4 Species-wise poultry production in Kerala, 2019 86Figure 3.3.5 Trend in average prices of livestock products from 2013-14 to 2018-19 90Figure 3.4.1 Fish production in Kerala, 2014-15 to 2018-19 95Figure 3.4.2 Fish production in India and Kerala, share of marine and inland fishing 95Figure 3.4.3 Fishing harbours in Kerala, location and status 98Figure 3.5.1 Storage position of the irrigation reservoirs, 2017-2019 103Figure 3.6.1 District-wise forest cover, area in sq km 109Figure 3.6.2 Trends in forest revenue 2014-15 to 2018-19 111Figure 3.7.1 Annual average values of air pollutants at 10 monitoring stations in
‘Residential’ area of Kerala 2018116
Figure 3.7.2 Annual average values of air pollutants at 3 monitoring stations in ‘Sensitive’ area of Kerala 2018
116
Figure 3.7.3 Annual average values of air pollutants at 11 monitoring stations in the ‘Industrial’ area of Kerala, 2018
117
Figure 3.7.4 BOD levels at selected river stations for 2013 and 2018 117Figure 3.8.1 Category-wise card holders in Kerala as on August, 2019, in per cent 124Figure 3.8.2 Mid-day meal programme 2011-12 to 2018-19 127Figure 4.1.1 Manufacturing’s share in Kerala’s GSVA and Kerala’s share in GVA by India’s
factory sector131
Figure 4.1.2 Chemicals and pharmaceutical industries in Kerala: index of production, Gross Value Added, with index for 2011-12 = 100, and Share of Kerala in value added by these industries in India
133
Figure 4.2.1 Annual growth of Gross Value Added by the manufacturing sector in India, at constant prices, in per cent
136
Figure 4.2.2 Annual growth of Gross Value Added by the manufacturing sector in India, at constant prices, in per cent
137
Figure 4.2.3 The growth of income from the mining and the quarring sector in Kerala, in per cent
138
Figure 4.3.1 Share of Kerala in investment by Central PSUs, in per cent 141Figure 4.3.2 Performance trend of PSUs under Industries Department 142Figure 4.3.3 Value of production and turnover of State PSUs under Industries
Department, GoK143
Figure 4.3.4 Net profit/loss made by State PSUs under Industries Department 143Figure 4.4.1 The number of new MSME units and employment created in MSMEs, 2017-
18 and 2018-19154
Figure 4.4.2 The number micro, small and medium units registered under manufacturing and service sector for the year 2018-19
155
xxxi Economic Review 2019
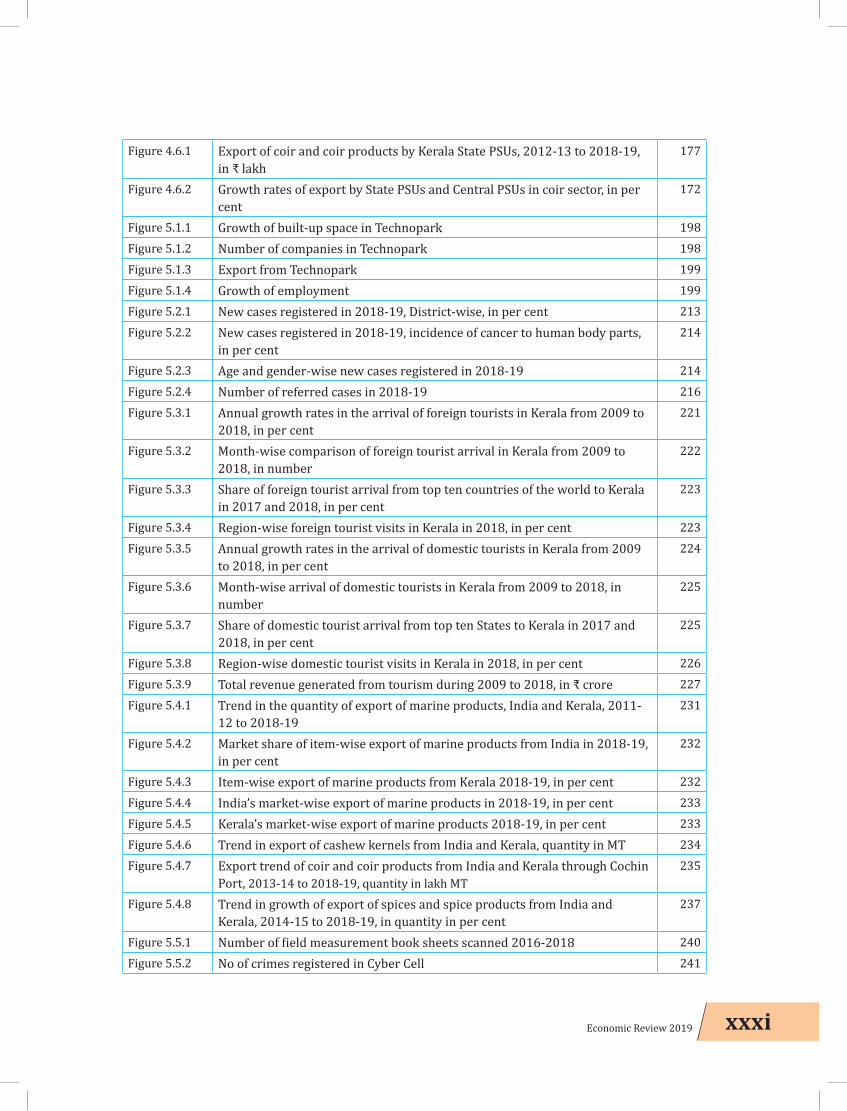
Figure 4.6.1 Export of coir and coir products by Kerala State PSUs, 2012-13 to 2018-19, in ₹ lakh
177
Figure 4.6.2 Growth rates of export by State PSUs and Central PSUs in coir sector, in per cent
172
Figure 5.1.1 Growth of built-up space in Technopark 198Figure 5.1.2 Number of companies in Technopark 198Figure 5.1.3 Export from Technopark 199Figure 5.1.4 Growth of employment 199Figure 5.2.1 New cases registered in 2018-19, District-wise, in per cent 213Figure 5.2.2 New cases registered in 2018-19, incidence of cancer to human body parts,
in per cent214
Figure 5.2.3 Age and gender-wise new cases registered in 2018-19 214Figure 5.2.4 Number of referred cases in 2018-19 216Figure 5.3.1 Annual growth rates in the arrival of foreign tourists in Kerala from 2009 to
2018, in per cent221
Figure 5.3.2 Month-wise comparison of foreign tourist arrival in Kerala from 2009 to 2018, in number
222
Figure 5.3.3 Share of foreign tourist arrival from top ten countries of the world to Kerala in 2017 and 2018, in per cent
223
Figure 5.3.4 Region-wise foreign tourist visits in Kerala in 2018, in per cent 223Figure 5.3.5 Annual growth rates in the arrival of domestic tourists in Kerala from 2009
to 2018, in per cent224
Figure 5.3.6 Month-wise arrival of domestic tourists in Kerala from 2009 to 2018, in number
225
Figure 5.3.7 Share of domestic tourist arrival from top ten States to Kerala in 2017 and 2018, in per cent
225
Figure 5.3.8 Region-wise domestic tourist visits in Kerala in 2018, in per cent 226Figure 5.3.9 Total revenue generated from tourism during 2009 to 2018, in ₹ crore 227Figure 5.4.1 Trend in the quantity of export of marine products, India and Kerala, 2011-
12 to 2018-19231
Figure 5.4.2 Market share of item-wise export of marine products from India in 2018-19, in per cent
232
Figure 5.4.3 Item-wise export of marine products from Kerala 2018-19, in per cent 232Figure 5.4.4 India’s market-wise export of marine products in 2018-19, in per cent 233Figure 5.4.5 Kerala’s market-wise export of marine products 2018-19, in per cent 233Figure 5.4.6 Trend in export of cashew kernels from India and Kerala, quantity in MT 234Figure 5.4.7 Export trend of coir and coir products from India and Kerala through Cochin
Port, 2013-14 to 2018-19, quantity in lakh MT235
Figure 5.4.8 Trend in growth of export of spices and spice products from India and Kerala, 2014-15 to 2018-19, in quantity in per cent
237
Figure 5.5.1 Number of field measurement book sheets scanned 2016-2018 240Figure 5.5.2 No of crimes registered in Cyber Cell 241

xxxii Kerala State Planning Board
Figure 6.1.1 Management-wise number of schools in the State-2019-20 254Figure 6.1.2 Management-wise and section-wise enrolment of students 255Figure 6.1.3 Sex-wise proportion of students in degree courses 263Figure 6.1.4 Percentage of SC/ST students in degree and PG courses 264Figure 6.3.1 Inmates in the old age homes under Social Justice Department and
registered welfare institutions296
Figure 7.1.1 A comparison of average daily wage rates of male and female agricultural workers in Southern States, in December 2018
304
Figure 7.1.2 The average daily wage rate of non-agricultural workers in rural Kerala 304Figure 7.1.3 Annual Report Periodic Labour Force Survey (PLFS2017-18), GoI, Ministry
of Statistics and Programme Implementation 306
Figure 7.1.4 Worker Population Ratio, in per cent, according to usual status (ps+ss) for Southern States and All India, Age group 15-59
306
Figure 7.1.5 Person-days lost due to strikes, in number 308Figure 7.1.6 Person-days lost due to lockouts, in number 308Figure 7.1.7 Person-days lost due to lay off, in number 309Figure 7.1.8 Number of working factories in Kerala 309Figure 7.1.9 Employment details in factories, Kerala 309Figure 7.1.10 Industrial disputes, 2014-2015 to 2018-2019 310Figure 7.1.11 Rate of industrial settlements 310
Figure 7.1.12 Number of ESI Dispensaries 311
Figure 7.1.13 The distribution of migrant workers from different States 312
Figure 7.1.14 District-wise inter-State migrant workers in Kerala 313
Figure 7.1.15 Casual workers receiving paid leave and social security, in per cent 313Figure 7.2.1 Unemployment Rate, in per cent, according to usual status (ps+ss) for
persons of age 15 years and above of different general education level for each State/UT, in per cent
316
Figure 7.2.2 Unemployment Rate, in per cent, according to usual status (ps+ss) for persons of age 15 years and above of different general education level for each State/UT
317
Figure 7.2.3 Unemployment rate, in per cent, among the youth, 15 to 29 years, in Kerala and India as per usual status (ps+ss)
318
Figure 7.2.4 Employment in the organised sector in Kerala, in lakh 319Figure 7.2.5 Distribution of employment in public sector 320Figure 7.2.6 Major sectoral distribution of employment in the organised sector, March
2019, in per cent320
Figure 7.2.7 Job seekers in Kerala, lakh persons 322Figure 7.2.8 Job seekers in Kerala, qualification wise,lakh persons 322Figure 7.2.9 District wise Job seekers in Kerala as on 31-07-2019, Status of Men and
Women322
Figure 7.2.10 Placement through Employment Exchanges, Kerala 325
xxxiii Economic Review 2019
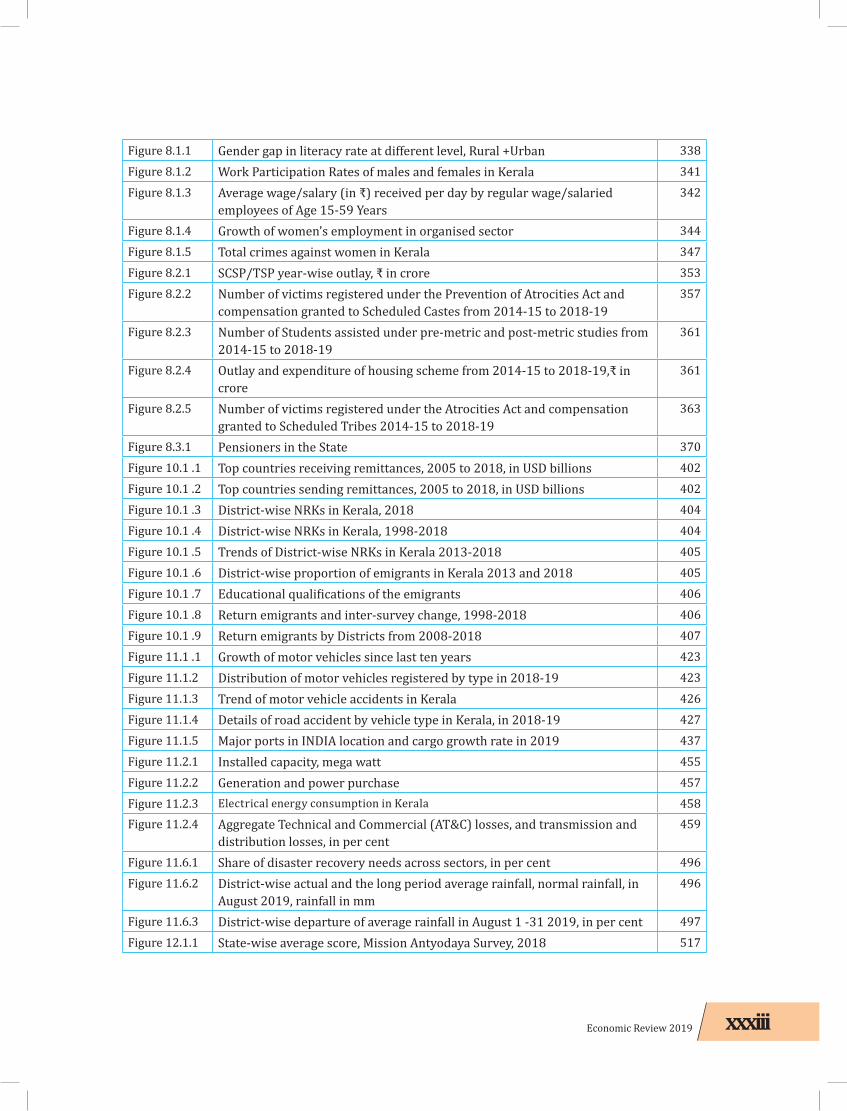
Figure 8.1.1 Gender gap in literacy rate at different level, Rural +Urban 338Figure 8.1.2 Work Participation Rates of males and females in Kerala 341Figure 8.1.3 Average wage/salary (in ₹) received per day by regular wage/salaried
employees of Age 15-59 Years342
Figure 8.1.4 Growth of women’s employment in organised sector 344Figure 8.1.5 Total crimes against women in Kerala 347Figure 8.2.1 SCSP/TSP year-wise outlay, ₹ in crore 353Figure 8.2.2 Number of victims registered under the Prevention of Atrocities Act and
compensation granted to Scheduled Castes from 2014-15 to 2018-19 357
Figure 8.2.3 Number of Students assisted under pre-metric and post-metric studies from 2014-15 to 2018-19
361
Figure 8.2.4 Outlay and expenditure of housing scheme from 2014-15 to 2018-19,₹ in crore
361
Figure 8.2.5 Number of victims registered under the Atrocities Act and compensation granted to Scheduled Tribes 2014-15 to 2018-19
363
Figure 8.3.1 Pensioners in the State 370Figure 10.1 .1 Top countries receiving remittances, 2005 to 2018, in USD billions 402Figure 10.1 .2 Top countries sending remittances, 2005 to 2018, in USD billions 402Figure 10.1 .3 District-wise NRKs in Kerala, 2018 404Figure 10.1 .4 District-wise NRKs in Kerala, 1998-2018 404Figure 10.1 .5 Trends of District-wise NRKs in Kerala 2013-2018 405Figure 10.1 .6 District-wise proportion of emigrants in Kerala 2013 and 2018 405Figure 10.1 .7 Educational qualifications of the emigrants 406Figure 10.1 .8 Return emigrants and inter-survey change, 1998-2018 406Figure 10.1 .9 Return emigrants by Districts from 2008-2018 407Figure 11.1 .1 Growth of motor vehicles since last ten years 423Figure 11.1.2 Distribution of motor vehicles registered by type in 2018-19 423Figure 11.1.3 Trend of motor vehicle accidents in Kerala 426Figure 11.1.4 Details of road accident by vehicle type in Kerala, in 2018-19 427Figure 11.1.5 Major ports in INDIA location and cargo growth rate in 2019 437Figure 11.2.1 Installed capacity, mega watt 455Figure 11.2.2 Generation and power purchase 457Figure 11.2.3 Electrical energy consumption in Kerala 458Figure 11.2.4 Aggregate Technical and Commercial (AT&C) losses, and transmission and
distribution losses, in per cent459
Figure 11.6.1 Share of disaster recovery needs across sectors, in per cent 496Figure 11.6.2 District-wise actual and the long period average rainfall, normal rainfall, in
August 2019, rainfall in mm496
Figure 11.6.3 District-wise departure of average rainfall in August 1 -31 2019, in per cent 497Figure 12.1.1 State-wise average score, Mission Antyodaya Survey, 2018 517

xxxiv Kerala State Planning Board
Figure 12.1.2 Share of various sources in the total expenditure of Local Governments 519Figure 12.1.3 Expenditure performance of various Local Government against amount
released520
Figure 12.1.4 Category-wise expenditure of Local Governments against release in 2018-19 520Figure 12.1.5 The share of various sectors in the total expenditure incurred by the Local
Governments in 2018-19 521
Figure 12.1.6 Sub sector-wise productive sector expenditure incurred by the Local Governments in 2018-19
521
Figure 12.1.7 Sub sector-wise expenditure share of service sector in 2018-19, in per cent 522Figure 12.1.8 Sub sector-wise expenditure share of infrastructure sector in 2018-19, in
per cent523

KERALA ECONOMY
01C H A P T E R

1. Theory of Credit and Macro-Economic Stability, National Bureau of Economic Research (NBER), Working Paper. Number 22837, November 2016.2. The Theory of Credit and Macro-Economic Stability, National Bureau of Economic Research (NBER), Working Paper. Number 22837, November 2016.

3Chapter 1, Kerala Economy
KERALA ECONOMY1.1 Recent Trends in Macro-Economic Aggregates
1. Theory of Credit and Macro-Economic Stability, National Bureau of Economic Research (NBER), Working Paper. Number 22837, November 2016.2. The Theory of Credit and Macro-Economic Stability, National Bureau of Economic Research (NBER), Working Paper. Number 22837, November 2016.
01C H A P T E R
Figure 1.1 .1 Annual rates of growth of GSVA for Kerala and GVA for India (both at constant 2011-12 prices), in per cent
Source:Department of Economics and Statistics (for Kerala) and National Accounts Statistics (for India)
Kerala is a relatively rich Indian State. According to quick estimates for 2018-19, per capita income of Kerala is ₹1,48,078. The corresponding national average (for 2018-19) is ₹93,655. In other words, average income per person in Kerala was approximately 1.6 times the Indian average in 2018-19. Among big Indian States, Kerala is one of the leading ones with respect to per capita incomes, along with Haryana, Gujarat, Karnataka, Maharashtra and Tamil Nadu.
Trends in Kerala’s Economic Growth
The quick estimate of Gross State Domestic Product (GSDP) at constant (2011-12) prices is ₹5,59,41,196 lakh in 2018-19 as against the provisional estimate of ₹5,20,57,851 lakh in
2017-18, registering a growth rate of 7.5 per cent in 2018-19 compared to 7.3 per cent in 2017-18. At current prices, the GSDP is estimated at ₹7,81,65,326 lakh (quick estimate) in 2018-19 as against the provisional estimate of ₹7,01,57,738 lakh in 2017-18, showing a growth rate of 11.4 per cent.
The quick estimate of Gross State Value Added (GSVA) at constant (2011-12) prices is ₹5,00,08,120 lakh in 2018-19 as against the provisional estimate of ₹4,65,14,275 lakh in 2017-18, leading to a growth rate of 7.5 per cent in 2018-19 compared to 6.8 per cent in 2017-18. Details are given in Table 1.1.1 and Figure 1.1.1

4 Economic Review 2019, Kerala State Planning Board
Kerala’s Economy, and the National and Global Economic Context
It is notable that the growth of GSVA (at constant 2011-12 prices) in Kerala improved from 6.8 per cent in 2017-18 to 7.5 per cent in 2018-19. This improvement in GSVA growth in Kerala occurred during a period of general slowdown in economic growth at the national as well as at the global level. The growth of Gross Value Added (GVA) at constant (2011-12) prices in India fell from 7.9 per cent in 2016-17 to 6.9 per cent in 2017-18, and still further to 6.6 per cent in 2018-19. The global economy is also facing a slowdown. According to the World Economic Outlook, October 2019, International Monetary Fund, global growth is projected at 3.2 per cent for 2019, it is lowest since 2008-09.
According to data from the Central Statistics Office (CSO), Ministry of Statistics and Programme Implementation (MoSPI), India’s Gross National Income (GNI) at 2011-12 prices is estimated at ₹139.32 lakh crore in 2018-19, as against the previous year’s estimate of ₹130.34 lakh crore. In terms of growth rates, the gross
national income has increased 6.9 per cent in 2018-19, compared to 7.2 per cent in 2017-18. The Gross Value Added (GVA) at basic constant (2011-12) prices for 2018-19 is estimated at ₹129.06 lakh crore, a 6.6 per cent growth over the GVA for 2017-18 at ₹121.04 lakh crore. The GDP at constant (2011-12) prices for 2018-19 is estimated at ₹140.77 lakh crore, 6.8 per cent growth over ₹131.79 lakh crore in 2017-18. Details are given in Table 1.1.2.
India’s GVA at current prices is estimated at ₹171.99 lakh crore in 2018-19, compared to ₹154.82 lakh crore in 2017-18, an increase of 11.1 per cent. India’s GDP at current prices in 2018-19 is estimated at ₹190.10 lakh crore, showing a growth rate of 11.2 per cent over the estimates of GDP for 2017-18 at ₹170.95 lakh crore. The per capita GDP in real terms (at 2011-12 prices) in 2018-19 is estimated at ₹1,05,688 as against ₹1,00,151 in 2017-18, registering an increase of 5.5 per cent. The per capita GDP at current prices is estimated at ₹1,42,719 in 2018-19 as against ₹1,29,901 for the previous year, showing a growth of 9.9 per cent.
Table 1.1.1 State Domestic Product and per capita income of KeralaIncome, in ₹ lakh Growth Rate, in %
2016-17 2017-18 (P) 2018-19 (Q) 2017-18 (P) 2018-19 (Q)
Gross State Domestic Product
a) At Constant (2011-12) prices 4,85,30,154 5,20,57,851 5,59,41,196 7.3 7.5
b) At Current prices 6,34,88,640 7,01,57,738 7,81,65,326 10.5 11.4
Net State Domestic Product
a) At Constant (2011-12) prices 4,43,61,530 4,77,27,475 5,13,32,180 7.6 7.6
b) At Current prices 5,70,59,076 6,32,72,713 7,07,54,223 10.9 11.8
Gross State Value Added (GSVA) at basic prices
a) At Constant (2011-12) prices 4,35,37,107 4,65,14,275 5,00,08,120 6.8 7.5
b) At Current prices 5,70,24,819 6,33,65,119 7,00,31,142 11.1 10.5
Per capita GSDP
a) At Constant (2011-12) Prices 1,41,396 1,50,922 1,61,374 6.7 6.9
b) At Current Prices 1,84,979 2,03,396 2,25,484 10.0 10.9
Per capita NSDP
a) At Constant (2011-12) Prices 1,29,251 1,38,368 1,48,078 7.1 7.0
b) At Current Prices 1,66,246 1,83,435 2,04,105 10.3 11.3
Source: Department of Economics and Statistics P: Provisional Estimate, Q: Quick Estimate

5Chapter 1, Kerala Economy
The details of India’s GDP, NDP, GNI and NNI at current and constant (2011-12) prices from 2012-13 to 2018-19 with percentage change over the previous year are given in Appendix 1.1.1, 1.1.2, 1.1.3 and 1.1.4. The sector-wise distribution of GVA at the basic constant (2011-12) prices and current prices with percentage change over the previous year is given in Appendix 1.1.5 and 1.1.6.
Global Economic Scenario
The major factors behind the slowdown in global economic growth in 2019 include the heightened tensions between the US and China in trade and technology, rising trade barriers, prolonged uncertainty on Brexit, as well as structural factors such as low productivity growth and ageing of population in developed parts of the world. There has been a slowdown in global final demand, notably in fixed investment. The slowdown in global manufacturing activity, which began in early 2018, has continued, reflecting weak business spending (machinery and equipment) and consumer purchases of durable goods, such as cars. These developments suggest that investment and consumption spending by firms and households will continue to be slow in growth. Particularly worrying for Kerala are the geoploitical and economic crises in the Gulf countries.
India’s Economic Growth Trajectory
The Indian economy was growing at very fast rates from the middle of the 2000s, powered mainly by a boom in investment. However, this phase of fast economic growth came to an end by 2011-12. Investment or gross capital formation as per cent of GDP declined in India from 39.0 per cent in 2011-12 to 32.3 per cent in 2017-18. The demonetisation of high-value currency notes in November 2016 was a major blow to the country’s economy, especially for production and consumption in the informal and rural sectors. The crisis in the banking sector (with high levels of non-performing assets) and the problems associated with the implementation of the Goods and Services Tax (GST) regime in 2017 worsened India’s economic problems. According to Government of India’s Economic Survey 2018-19, a major factor responsible for the deceleration in India’s economic growth in 2018-19 was the slowdown in agricultural growth, partly resulting from a contraction in food prices. There has been a recession in the manufacturing sector too, mainly in the automobile industry. Other factors included the slow growth of private final consumption expenditure, arising from weak rural demand, and the problems in the non-banking financial companies (NBFCs).
Table 1.1.2 Gross National Income, Gross Domestic Product and per capita income at 2011-12 prices and current prices, all India, in ₹ crore
Sl. No Item
At 2011-12 Prices At Current Prices
2016-17 2017-18 2018-19 (PE) 2016-17 2017-18 2018-19
(PE)
1 GVA at basic prices 1,13,18,972 1,21,04,165(6.9)
1,29,06,936(6.6) 1,39,35,917 1,54,82,715
(11.1)1,71,99,815
(11.1)
2 Gross National Income (GNI) 1,21,53,754 1,30,34,121(7.2)
1,39,32,287(6.9) 1,51,85,986 1,69,10,192
(11.4)1,88,16,538
(11.3)
3 Net National Income (NNI) 1,07,72,800 1,15,31,159(7.0)
1,23,29,646(6.9) 1,35,95,261 1,51,28,474
(11.3)1,68,37,219
(11.3)
4 Gross domestic product (GDP) 1,22,98,327 1,31,79,857(7.2)
1,40,77,586(6.8) 1,53,62,386 1,70,95,005
(11.3)1,90,10,164
(11.2)
5 Net domestic product (NDP) 1,09,17,373 1,16,76,896(7.0)
1,24,74,945(6.8) 1,37,71,661 1,53,13,286
(11.2)1,70,30,846
(11.2)
6 Per capita Gross Domestic Product (₹) 94,675 1,00,151
(5.8)1,05,688
(5.5) 1,18,263 1,29,901(9.8)
1,42,719(9.9)
7 Per capita Net domestic product (₹) 84,044 88,730
(5.6)93,655
(5.5) 1,06,017 1,16,362(9.8)
1,27,859(9.9)
Note: The figures in parenthesis shows the percentage change over the previous year. PE- Provisional Estimate Source: Central Statistics Office.
6 Economic Review 2019, Kerala State Planning Board
Kerala’s Economy: Moving Ahead Despite the Setbacks
Kerala’s economic growth was slow and significantly slower than the Indian average for three years from 2013-14 to 2015-16. The rates of growth of GSVA (at constant 2011-12 prices) in Kerala were 4.3 per cent, 3.8 per cent and 5.3 per cent respectively for the years 2013-14, 2014-15 and 2015-16 respectively. Kerala’s economic growth staged a revival in 2016-17, with GSVA growth accelerating to 7.1 per cent in that year (Figure 1.1.1).
Kerala’s economy has faced a number of setbacks over the last two years. The State had been hit by Cyclone Ockhi in 2017, and by severe floods resulting from unusually heavy rains in 2018 and again in 2019. The economic crisis in the Gulf countries has adversely affected Kerala economy, with a number of emigrant workers returning to the State and with a slowdown in remittance flows. Despite such setbacks, GSVA in Kerala grew at the rates of 6.8 per cent and 7.5 per cent respectively in 2017-18 and 2018-19 (Figure 1.1.1).
The growth of value added in agriculture and allied sectors in Kerala continued to remain slow or negative for most of the period between 2011-12 and 2018-19. The rates of growth were 1.7 per cent and -0.5 per cent in 2017-18 and 2018-19 respectively. However, within the category of sectors allied to agriculture, fishing and aquaculture experienced a sharp revival, registering annual rates of growth of 11.1 per cent and 6.6 per cent in 2017-18 and 2018-19 respectively.
The growth of value added in the construction sector in Kerala had slowed down to 4 per cent in 2017-18 but improved to 6.3 per cent in 2018-19. Growth had been slow in transport and communication sectors as well as in financial services in 2017-18 and 2018-19.
At the same time, the manufacturing sector registered an impressive performance with
respect to growth of value added. The annual rates of value added growth were 18.2 per cent, 3.7 per cent, and 11.2 per cent respectively in 2016-17, 2017-18 and 2018-19. The share of manufacturing in total GSVA of Kerala was only 9.8 per cent in 2014-15 but rose to 13.2 per cent by 2018-19. According to Government of India’s Annual Survey of Industries, Kerala’s share in total value added by India’s factory sector improved from 1.2 per cent in 2014-15 to 1.6 per cent in 2016-17. The turnaround in performance of State public sector units in the chemicals and electrical sector, fresh investments in petroleum refining, and a new impetus to the manufacture of electronic components were some of the highlights of the improved performance of Kerala’s industrial sector from 2016-17. The growth of value added in Kerala had been fast in trade and repair services and in hotels and restaurants. These service sectors together registered rates of growth of 13.3 per cent and 7.0 per cent respectively in 2017-18 and 2018-19. Fast rates of value added growth were recorded also in professional services, public administration, social services and other services. To sum up, Kerala’s GSVA grew at relatively fast rates during the period from 2016-17 to 2018-19 despite the many setbacks faced by the State and despite the growing signs of recession in the national economy. The sectors that contributed to this fast growth are fishing and aquaculture, manufacturing, trade, hotels and restaurants, social services mainly education and health, public services and professional services.
The details of the sectoral distribution of GSVA in the last three years are given in Appendix 1.1.7 and 1.1.8. GSDP with percentage change over the previous year during the last three years is given in Appendix 1.1.9 and the details of GSVA, NSVA at constant and current prices from 2011-12 to 2017-18 are given at Appendix 1.1.10, 1.1.11, 1.1.12, and 1.1.13.

7Chapter 1, Kerala Economy
Per Capita State Income
As per the quick estimates, the per capita GSDP at constant (2011-12) prices in 2018-19 was ₹1,61,374 as against the provisional estimate of ₹1,50,922 in 2017-18, recording a growth rate of 6.9 per cent in 2018-19. At current prices, the per capita GSDP in 2017-18 was ₹2,25,484 registering a growth rate of 10.9 per cent over the previous year’s estimate of ₹2,03,396. At constant (2011-12) prices, the quick estimates of per capita NSDP in 2018-19 was ₹1,48,078 as against the provisional estimate of ₹1,38,368 in 2017-18, recording 7.0 per cent growth in 2018-19. Figure 1.1.2 shows that between 2012-13 and 2018-19, the per capita NSDP at constant prices was higher than the per capita NSDP at all India level.
Sector-wise Distribution of Value Added and Employment
The structure of the economy and the workforce in Kerala are noticeably different from the structure in the rest of India. Agriculture and allied activities employed 41.8 per cent of India’s total workforce even in 2017-18. However, in Kerala, there has been a large-scale withdrawal of workers from agriculture over the years, with the share of the workforce in agriculture and allied activities declining to only 16.7 per cent by 2017-
18. The share of agriculture and allied activities in gross value added was 9.5 per cent and 14.9 per cent respectively in Kerala and India. The share of manufacturing in gross value added was only 12.8 per cent in Kerala, compared to 18.0 per cent in India as a whole (Table 1.1.3).
At the same time, the contribution by construction and the services sectors to the economy are bigger in Kerala than in the rest of India. In 2017-18, the share of the construction sector to gross value added was 13.8 per cent and 8.0 per cent respectively in Kerala and India. The services sector accounted for 62.1 per cent of the gross value added and 51.9 per cent of the total workforce of Kerala in 2017-18. At the national level, the share of the service sector to gross value added and employment were 53.9 per cent and 32.8 per cent respectively (Table 1.1.3).
District-Wise GSVA
District-wise distribution of GSVA at the basic price at current prices shows that Ernakulam District continues to have the highest income of ₹85,91,244 lakh in 2018-19 as against ₹77,58,753 lakh in 2017-18, registering a growth rate of 10.7 per cent. At constant (2011-12) prices, this amounts to ₹62,69,955 lakh in 2018-
Figure 1.1 .2 Per capita NSDP and per capita NDP at constant 2011-12, prices in ₹
Source:Source: Central Statistics Office and Department of Economics and StatisticsNSDP- Net State Domestic Product, NDP- Net Domestic Product

8 Economic Review 2019, Kerala State Planning Board
Table 1.1.4 District-wise distribution of Gross State Value Added
Sl. No District Name
Gross State Value Added at Basic Price (₹ in Lakh)At Current Prices At Constant Prices
2017-18 2018-19 Growth Rate (%)
2017-18 2018-19 Growth Rate (%)(P) (Q) (P) (Q)
1 Thiruvananthapuram 68,60,408 75,01,243 9.3 50,50,184 53,47,078 5.882 Kollam 59,32,117 66,04,256 11.3 42,96,672 46,44,785 8.103 Pathanamthitta 1831381 20,02,724 9.4 13,38,893 14,25,005 6.434 Alappuzha 4532823 50,30,336 11.0 33,80,831 36,29,056 7.345 Kottayam 3904445 43,55,675 11.6 29,73,145 32,20,789 8.336 Idukki 2159335 22,71,913 5.2 15,22,850 15,68,060 2.977 Ernakulam 7758753 85,91,244 10.7 58,20,772 62,69,955 7.728 Thrissur 6234512 69,18,888 11.0 45,79,874 49,48,265 8.049 Palakkad 4518165 49,31,638 9.2 32,62,142 34,85,618 6.85
10 Malappuram 6274462 69,83,367 11.3 45,37,636 49,07,469 8.1511 Kozhikode 5436088 60,69,055 11.6 39,80,744 43,26,172 8.6812 Wayanad 1264498 13,88,534 9.8 8,86,200 9,50,619 7.2713 Kannur 4473118 49,80,788 11.4 33,17,553 36,02,808 8.6014 Kasaragod 2185015 24,01,479 9.9 15,66,780 16,82,440 7.38
GSVA 63365118 7,00,31,141 10.5 4,65,14,276 5,00,08,119 7.51Source: Department of Economics and Statistics, (P: Provisional Q: Quick)
Table 1.1.3 Shares of different sectors in Gross Value Added and employment, Kerala and India, 2017-18
Sectors
Shares in Gross Value Added Shares in employment
Kerala (GSVA)
India (GVA) Kerala India
Agriculture, livestock, forestry and fishing 9.5 14.9 16.7 41.8Mining and quarrying 0.7 3.0 0.2 0.4Primary 10.2 17.9 16.9 42.2Manufacturing 12.8 18.0 11.8 12.8Electricity, gas, water supply and other utility services 1.1 2.2 0.4 0.7Construction 13.8 8.0 18.9 11.6Secondary 27.7 28.2 31.1 25.1Trade, repair, hotels and restaurants 17.5 12.6 17.7 12.6Transport, storage, communication and services related to broadcasting 7.7 6.5 11.1 6.2
Financial, real estate and professional services 21.1 21.9 7.1 3.6Public Administration and other services 15.8 12.9 16.0 10.4Tertiary 62.1 53.9 51.9 32.8
100.0 100.0 100.0 100.0Sources: Department of Economics and Statistics (for GSVA of Kerala) and National Accounts Statistics (for GVA of India) and Periodic Labour Force Survey (PLFS) carried out by India’s Central Statistical Office in 2017-18 for data on employment.
19 compared to ₹58,20,772 lakh in 2017-18. The District-wise GSVA details are given Table 1.1.4.
District-Wise Per Capita Income (GSVA)
The analysis of District-wise per capita income reveals that Ernakulum District continues
to stands first with the per capita income of ₹1,83,258 at constant (2011-12) prices in 2018-19 against ₹1,71,072 in 2017-18. The District-wise per capita income with corresponding rank and growth rate is given in Table 1.1.5.

9Chapter 1, Kerala Economy
Table 1.1.5 reveals that the Districts of Kottayam, Kannur, Kollam, Alappuzha, Thrissur, Ernakulam, and Kozhikode had a higher growth than the State average growth rate in per capita income in 2018-19. However, the Districts of Idukki, Thiruvananthapuram, Kasaragod, Malappuram, Palakkad, Pathanamthitta, and Wayanad showed lower per capita income growth compared to the State average growth. District-wise and sectoral distribution of GSVA from 2015-16 to 2017-18 at current and constant (2011-12) prices are given in Appendix 1.1.14, 1.1.15, 1.1.16, 1.1.17, 1.1.18 and 1.1.19.
INFLATION – RECENT TRENDS
Inflation trend in the country
National economy seems to be in a transition trend of inflation from stable and low level to a variable and increasing of inflation. An agreed inflation rate by Reserve Bank of India and Central Government under inflation mechanism is the range between 2 to 6 per cent with a
median rate of 4 per cent. For the last two financial years, inflation was not at all a threat for our economy, even if, global energy commodity prices reached its record high of 22.1 per cent of average inflation in 2018-19. In India, there was a declining trend in headline inflation based on the Consumer Price Index (CPI) over the last five years. However, now the rate is above the median term target of 4 per cent. In 2014-15, Consumer Price Index – Combined (CPI-C) was 5.9 percentage. This reduced to 3.4 per cent in 2018-19. Currently, on point to point basis i.e., current month over same month of last year shows that CPI (General) has increased from 2.33 per cent in November 2018 to 5.54 percentage in November 2019. Similarly, the Consumer Food Price Index (CFPI) has also increased from -2.61 per cent to double digit rate of 10.01 per cent for the corresponding period. Increase of CPI and CFPI is attributed to increase in inflation rate of Vegetables, Pulses and Products and Meat and Fish by 35.99 per cent, 13.94 per cent and 9.38 per cent respectively (Table 1.1.6).
Table 1.1.5 District-wise per capita Gross State Value Added at basic price, constant prices, 2011-12Sl.No. District 2017-18 (P) ₹ Rank 2018-19 (Q) ₹ Rank Growth Rate
(%)1 Thiruvananthapuram 150942 4 159489 5 5.72 Kollam 161014 2 173725 2 7.93 Pathanamthitta 114026 10 121725 10 6.84 Alappuzha 157984 3 169434 3 7.35 Kottayam 149535 5 161818 4 8.26 Idukki 138945 7 143329 7 3.27 Ernakulam 171072 1 183258 1 7.18 Thrissur 142206 6 152905 6 7.59 Palakkad 110861 12 117618 12 6.1
10 Malappuram 101641 14 108547 14 6.811 Kozhikode 123286 9 133056 9 7.912 Wayanad 105216 13 112346 13 6.813 Kannur 127598 8 137929 8 8.114 Kasaragod 113599 11 120985 11 6.5
State 134851 144259 7.0P: Provisional Q: Quick Source: Department of Economics and Statistics
Table 1.1.6 All India inflation rates (per cent) based on CPI (General) and CFPI
IndicesNovember 2019(Provisional) October 2019 (Final) November 2018(Final)
Rural Urban Combined Rural Urban Combined Rural Urban Combined
CPI (General) 5.27 5.76 5.54 4.29 5.11 4.62 1.71 3.12 2.33CFPI 8.83 12.26 10.01 6.42 10.47 7.89 -2.40 -3.04 -2.61
Source: MoSPI, National Statistical Office, Press Release December 12, 2019

10 Economic Review 2019, Kerala State Planning Board
Price Level in Kerala
The WPI for agriculture commodities in Kerala in food crops has increased to 9771.34 in July 2019 from 9702.48 in 2018. The increase in prices of food crops prices is attributed to rise in prices of vegetables and fruits. Among the food crops, the prices of rice, and condiments and spices have decreased by 3.7 per cent and 2 per cent respectively. Similarly, the WPI of non-food items have also decreased by 10.7 per cent from 9023.64 in 2018 to 8062.53 in July 2019. Of which, the price of oil and oilseeds decreased to 9786.61 in July 2019 from 11187.08 in 2018. Altogether, the WPI of all crops has decreased by 3.2 per cent as compared with the previous year. The WPI of all items during the period from 2013 to 2019 is given in Appendix 1.1.20. The month-wise WPI of agriculture commodities in Kerala shows that index of food items has decreased to 9672.64 in July 2019 from 9959.71 in June 2018, while the index of non-food items declined to 7428.77 in July 2019 from 8986.27 in June 2018. The month-wise WPI of agriculture commodities in Kerala in 2018 and 2019 (upto July 2019) is given in Appendix 1.1.21, and 1.1.22.
Consumer Price Index (CPI)
The annual average CPI (Base 2011-12=100) in Kerala was estimated at 165 in 2019 against
157 in 2018. The variation in per cent in 2019 over the previous year is 5.28. CPI of selected centres shows that the highest rate of inflation was registered in Malappuram (7.74 per cent) followed by Thrissur (7.59 per cent) and Alappuzha (6.92 per cent) in 2019. The lowest rate of inflation in per cent was registered in Punalur at 3.95 per cent. The annual average CPI and percentage variation of selected centres are shown in Appendix 1.1.23.
Retail Prices
While analysing the retail prices of essential commodities from January 2019 to September 2019, the price of rice-matta, black gram, black gram without husk, and with husk has increased. The monthly retail prices of certain essential commodities in the State are given in Appendix 1.1.24.
Parity Index
Parity index estimates the income and expenditure of the farmers from their cultivation. From 2007 onwards, cultivation cost has exceeded the revenue of the farmers. In 2019 (up to July) parity index has been estimated at 60.29 against 62.50 in 2018. In 2017, the index of price paid by the farmers was 13620.25 and the index of prices received by the farmers was only
Figure 1.1 .3 Price received and price paid by farmers
Source:Department of Economics and Statistics, GoK
11Chapter 1, Kerala Economy
8862.25. The parity index was 65.08. In 2018 and 2019, the index of price received by farmers was 8892.50 and 8973.57 against their farm expenses index of 14203.92 and 14937.71 respectively. These indicate that the farmers are distressed heavily and the major reasons are the high cost of farm input, exorbitant transportation cost, and steep hike in the wages of labourers. The yearly average price received and paid by farmers is shown in Appendix 1.1.25 and Figure 1.1.3.
Wages
Average daily wage rate of skilled workers in the agriculture sector has increased in 2018-19 over the previous years. Daily wage rates of carpenters and masons have increased to ₹861.92 and ₹866.58 in 2018-19 from ₹841.17 and ₹834.83 in 2017-18 respectively. The daily wage rate of a carpenter has increased by 2.4 per cent in 2018-19 and that of a mason has increased by 3.8 per cent in 2018-19. The average daily wage rate of skilled workers in the agriculture sector from 2007-08 to 2018-19 is given in Appendix 1.1.26.
The average daily wage rates of male unskilled workers in 2006-07 were ₹179.01 and female unskilled workers was ₹123.96. After a decade, the wage rate has changed significantly with the wage of male workers by 286.9 per cent to ₹692.6 in 2018-19. On the other hand, the female workers’ wage rate has also risen by 303.83 per cent and reached ₹500.58. While analysing the wage rate among the male and female workers, gender disparities are discernible. The average daily wage rates of unskilled workers in the agriculture sector from 2006-07 to 2018-19 is given in Appendix 1.1.27.
The GoK has taken several measures to contain price rise in the State like fixing procurement price for paddy and a mechanism for timely procurement. The intervention in the market for providing commodities to consumers at fair prices is done with the help of co-operative institutions like Supplyco and Consumerfed. This is a major relief for the poor and fixed income groups, especially during festival seasons.
Besides, the State Government offers substantial budgetary support to the PDS.
The volatility in the trend of global fuel prices and rupee exchange rate could be major factors shaping inflationary expectation in the immediate future. Substantial demand-side interventions are beyond the scope of a State Government in the present division of constitutional powers. States can intervene mainly in the supply side subject to their resource constraint. Kerala is one such State which has been making consistent supply-side interventions to control prices of essential commodities.

12 Economic Review 2019, Kerala State Planning Board
1.2 Demographic Profile
Population in India
The total population size as per 2011 Census in India is 1,21,08,54,977 as against 1,02,86,18,821 as per 2001 Census. As per the 2011 Census figures there were 62,32,70,258 males and 58,75,84,719 females and the population density in the country was 382 persons per square kilometres. The sex ratio in the country in 2011 was 943 females per thousand males. In the rural area it accounts to 949 and in the urban region it was 929. The child population in the country in 2011 in the age group 0-6 was 16,45,15,253 and the child sex ratio in the age group 0-6 was 918 females per thousand males
Population Profile of the State
As per the Census of India 2011, the population of Kerala was 3,34,06,061 or 2.76 per cent of India’s population. Out of the State’s total population, 52 (1,60,27,412) per cent are women and 47.9 per cent are men (1,73,78,649) (Figure 1.2.1).During the period, the rural population was 1,74,71,135 and the urban population constitutes 1,59,34,926. The details are given in the Figure 1.2.2.
Population Growth
The decadal growth rate of Kerala’s population was 4.9 per cent, the lowest among the Indian
Figure 1.2.1 Population in Kerala
Source: Census 2001, 2011

13Chapter 1, Kerala Economy
States. Among the Districts of the State, Malappuram has the highest growth rate (13.4 per cent), and Pathanamthitta has the lowest growth rate (-3.0 per cent). Idukki also has seen a decline in population with a negative growth rate (-1.8 per cent). The growth rate of population is lower in six southern Districts (Idukki, Kottayam, Alappuzha, Kollam, Pathanamthitta and Thiruvananthapuram) than in other Districts of the State.
Child Population
The Census data shows an absolute decline in the number of children (0-6 years) in the State. Kerala’s total child population in 2011 was 34,72,955 (10.3 per cent of total population) as against 37,93,146 (11.9 per cent of the total population) as per the 2001 Census data. At the all India level, child population as per 2011 census was 13.5 per cent while it was 15.9 per
Figure 1.2.2 Rural and urban population in Kerala
Source: Census 2001, 2011
Figure 1.2.3 Proportion of child population in Kerala, in per cent
Source: Census 2001, 2011

14 Economic Review 2019, Kerala State Planning Board
cent as per Census 2001. The Census 2011 data also reveals that the child population as a proportion of the total population is below the national average for Tamil Nadu (9.5 per cent), Karnataka (11.2 per cent) and Andhra Pradesh (10.2 per cent). Figure 1.2.3 presents the District-wise picture of proportion of child population in Kerala as per Census data of 2001 and 2011. The highest proportion of child population was in Malappuram District and the lowest proportion was in Pathanamthitta District. A decreasing trend in the proportion of child population is seen in all Districts of the State (Appendix 1.2.1). The southern Districts of Kerala witnessed 2 per cent decline except for Kollam, in which there was a decline of 1 per cent in the proportion of child population, while the northern Districts in Kerala showed 1 per cent decline in the proportion of child population. But Wayanad District had a decline of 2 per cent.
Urbanisation
The share of urban population in Kerala was 47.7 per cent of the total population, representing a decadal increase of 21.74 per cent between 2001 and 2011. As many as 1,59,34,926 persons in the State were living in urban areas. The rural population was 1,74,71,135. Ernakulam is the District in which the proportion of urban population to total population is the highest (68 per cent). The share of urban population is lowest in Wayanad (3.9 per cent).
Literacy
Kerala has the highest proportion of literate persons in the population among the Indian States. The effective literacy rate is 93.91 per cent as per Census 2011. In Kerala, 96.02 per cent men and 91.98 per cent of women are literate as against 82.14 per cent of men and 65.46 per cent of women at the all India level. Among Districts, Kottayam tops in literacy with 97.2 per cent followed by Pathanamthitta with 96.5 per cent. Lowest literacy rates are in Wayanad and Palakkad with 89 per cent and 89.3 per cent respectively. Even the lowest literacy rate of
Wayanad (89 per cent) is higher than the national average. As compared to 2001, the literacy rate of all the Districts has improved (Appendix 1.2.1).
Sex Ratio
The sex ratio (number of females per thousand males) of Kerala according to Census 2011 is 1,084 and has improved by 26 points since 2001. It increased from 1,032 to 1,036 from 1981 to 1991. The sex ratio of Tamil Nadu is 996, of Karnataka is 973, of Andhra Pradesh is 993 and at all India level is 943.
Among the Districts, Kannur has the highest sex ratio (1,136) followed by Pathanamthitta (1,132). Idukki has the lowest sex ratio (1,006). The sex ratio of Ernakulum is 1,027. All the Districts have sex ratio above 1,000. In 2001, only Wayanad had a ratio below 1,000 (994). The difference between the lowest (Idukki, 1,006) and highest (Kannur, 1,136) is 130 points. Details are given in Appendix 1.2.2.
Child Sex Ratio (0-6 Years)
In Kerala according to 2001 Census the child sex ratio was 960 and it slightly increased to 964 in as per the 2011 Census data. It was 960 in 2001. The child sex ratio in Tamil Nadu is 943, Karnataka 948, Andhra Pradesh 939 and the all India average is 919. Among Districts, Pathanamthitta has the highest child sex ratio (976) followed by Kollam (973) and Kannur (971). Thrissur has the lowest ratio (950), and Alappuzha is just above with a ratio of 951. The difference between the lowest and highest is 26 points. All Districts have a ratio below 1,000. When analysing the decadal change, the highest increase is in Kollam (13) followed by Kozhikode (10). The decadal change in other Districts is below 10. Thrissur (-)8, Idukki (-)5 and Alappuzha (-)5 have a negative decadal change in child sex ratio (Appendix 1.2.2).
Density of Population
Kerala’s density of population as per 2011 Census is 860 persons per sq. km. While the density

15Chapter 1, Kerala Economy
of population in Tamil Nadu is 555, Karnataka 319, Andhra Pradesh 308, and that of India is 382. Thiruvananthapuram is the most densely populated District (1,508) while, Idukki is the least densely populated District (255). The density of population increased in all Districts between the Census of 2001 and 2011, other than in Pathanamthitta and Idukki. Details are given in Appendix 1.2.1.
Age Group Distribution
The proportion of the population in the age group of 0 – 14 years has declined from 43 per cent in 1961 to 23.4 per cent in 2011 in Kerala. Due to increasing life expectancy and availability of health facilities, the proportion of the population in the old age group (60 years and above) is showing an increasing trend from 5 per cent in 1961 to 12.7 per cent in 2011.
If this trend continues, the addition to the working age group of population (15-59) will decrease in the near future, as the proportion of the population in the age group of 0-14 is declining. The increasing proportion of the old age group (60 and above) would place higher social security obligations on the Government.
District-Wise Age Group Distribution
District-wise distribution of population among different age group as per 2011 census is given in Table 1.2.1. The State has 63.9 per cent of its population in the working age group of 15-59, 23.4 per cent and 12.7 per cent in 0-14 age and 60 and above age groups respectively. Among Districts, Idukki has the highest per cent of the working population (66 per cent) while Malappuram has the lowest (61.4 per cent). In the age group of 60 and above Pathanamthitta has the highest per cent (17.9 per cent), while Malappuram has the lowest per cent (8.4 per cent). At the same time, Malappuram has the highest proportion of the population, in the 0 –14 group at 30.2 per cent, while Pathanamthitta has a proportion of 19.4 per cent.
If the actual number is taken, Malappuram has the highest number both in 0-14 and 15-59 group (12.4 lakh and 25.2 lakh). While the Ernakulam District has the highest number of people in the elderly group of 60 and above. Wayanad has the lowest number in all age groups, as the District has the least number of total population.
Table 1.2.1 District-wise distribution of the population in different age groups-2011
Unit
Numbers in Different Age Group in total District population
% of Different Age Group in total District population
0-14 15-59 60+ 0-14 15-59 60+
1 Kasaragod 3,42,696 8,35,111 1,29,568 26.2 63.9 9.92 Kannur 5,94,411 16,06,593 3,21,999 23.6 63.7 12.83 Wayanad 2,12,246 5,26,414 78,760 26.0 64.4 9.64 Kozhikode 7,49,692 19,72,762 3,63,839 24.3 63.9 11.85 Malappuram 12,41,491 25,26,407 3,45,022 30.2 61.4 8.46 Palakkad 6,78,192 17,95,096 3,36,646 24.1 63.9 12.07 Thrissur 6,88,592 20,01,050 4,31,558 22.1 64.1 13.88 Ernakulam 6,93,215 21,35,689 4,53,484 21.1 65.1 13.89 Idukki 2,47,338 7,32,193 1,29,443 22.3 66.0 11.710 Kottayam 4,13,849 12,47,065 3,13,637 21.0 63.2 15.911 Alappuzha 4,46,279 13,57,100 3,24,410 21.0 63.8 15.212 Pathanamtitta 2,32,670 7,50,202 2,14,540 19.4 62.7 17.913 Kollam 5,83,023 17,00,534 3,51,818 22.1 64.5 13.314 Thiruvananthapuram 7,07,280 21,60,992 4,33,155 21.4 65.5 13.1
Kerala 78,30,974 2,13,47,208 42,27,879 23.4 63.9 12.7Source: Census 2011
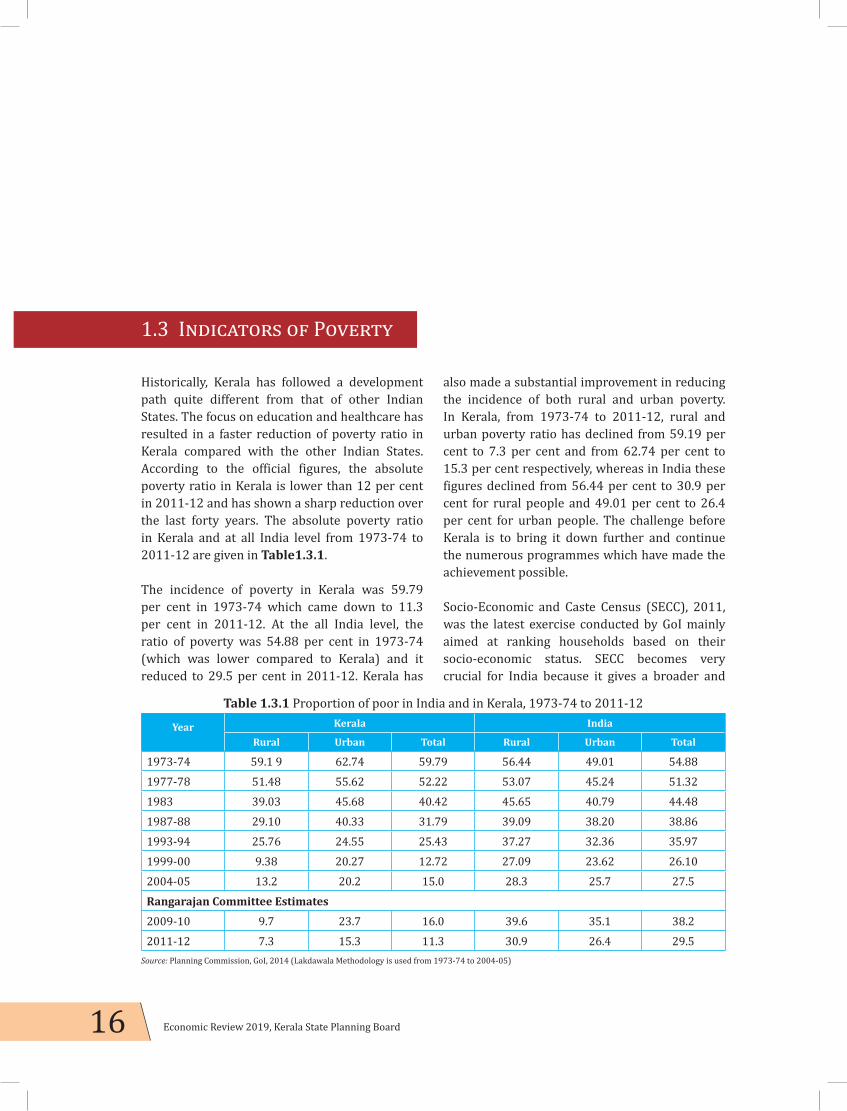
16 Economic Review 2019, Kerala State Planning Board
1.3 Indicators of Poverty
Historically, Kerala has followed a development path quite different from that of other Indian States. The focus on education and healthcare has resulted in a faster reduction of poverty ratio in Kerala compared with the other Indian States. According to the official figures, the absolute poverty ratio in Kerala is lower than 12 per cent in 2011-12 and has shown a sharp reduction over the last forty years. The absolute poverty ratio in Kerala and at all India level from 1973-74 to 2011-12 are given in Table1.3.1.
The incidence of poverty in Kerala was 59.79 per cent in 1973-74 which came down to 11.3 per cent in 2011-12. At the all India level, the ratio of poverty was 54.88 per cent in 1973-74 (which was lower compared to Kerala) and it reduced to 29.5 per cent in 2011-12. Kerala has
also made a substantial improvement in reducing the incidence of both rural and urban poverty. In Kerala, from 1973-74 to 2011-12, rural and urban poverty ratio has declined from 59.19 per cent to 7.3 per cent and from 62.74 per cent to 15.3 per cent respectively, whereas in India these figures declined from 56.44 per cent to 30.9 per cent for rural people and 49.01 per cent to 26.4 per cent for urban people. The challenge before Kerala is to bring it down further and continue the numerous programmes which have made the achievement possible.
Socio-Economic and Caste Census (SECC), 2011, was the latest exercise conducted by GoI mainly aimed at ranking households based on their socio-economic status. SECC becomes very crucial for India because it gives a broader and
Table 1.3.1 Proportion of poor in India and in Kerala, 1973-74 to 2011-12
Year Kerala India
Rural Urban Total Rural Urban Total
1973-74 59.1 9 62.74 59.79 56.44 49.01 54.881977-78 51.48 55.62 52.22 53.07 45.24 51.321983 39.03 45.68 40.42 45.65 40.79 44.481987-88 29.10 40.33 31.79 39.09 38.20 38.861993-94 25.76 24.55 25.43 37.27 32.36 35.971999-00 9.38 20.27 12.72 27.09 23.62 26.102004-05 13.2 20.2 15.0 28.3 25.7 27.5Rangarajan Committee Estimates2009-10 9.7 23.7 16.0 39.6 35.1 38.22011-12 7.3 15.3 11.3 30.9 26.4 29.5
Source: Planning Commission, GoI, 2014 (Lakdawala Methodology is used from 1973-74 to 2004-05)

17Chapter 1, Kerala Economy
dynamic definition of poverty. SECC estimates a deprivation index based on seven criteria. According to the SECC (2011) data, out of the 76.99 lakh households in Kerala, 63.19 lakh (82.08 per cent) live in rural areas. Of this, 10.32 per cent are SC households and 1.63 per cent are ST households. Out of the total rural households, 19.16 lakh (30.33 per cent) rural households are deprived. The highest deprivation rate is in Palakkad (42.33 per cent) followed by Thiruvananthapuram (38.36 per cent) and Wayanad (36.33 per cent) Districts. And the lowest deprivation rate is in Ernakulam (20.30 per cent), Kottayam (23.02 per cent) and Kannur (24.25 per cent) Districts. Out of the total rural SC and ST households, 57.66 per cent of SC households and 61.68 per cent of ST households are included under the deprived category. District-wise details of the percentper cent of deprived rural households in Kerala against their total number of rural household across different categories are given in Appendix 1.3.1.
While considering the different indicator-wise deprivation rates among the rural households in Kerala, the highest deprivation was recorded in the indicator, ‘landless households deriving major part of their income from manual casual labour’ (18.86 per cent) followed by ‘SC/ST household’ (7.11 per cent) and ‘female-headed households with no adult male member between age 16 to 59’ (3.65 per cent) respectively. The lowest deprivation was reflected in the indicator, ‘disabled member and no able-bodied adult member’ (0.19 per cent) followed by the indicator ‘only one room with kucha walls and kucha roof’ (1.43 per cent) and ‘no literate adult above 25 years’ (1.81 per cent). District-wise details of the percentper cent of deprived rural households based on the deprivation index are given in Appendix 1.3.2.
According to the SECC data, the main breadwinner of the 70.75 per cent of the rural households in Kerala earns less than ₹5,000 per month, while at all India level, the corresponding share was 74.52 per cent. This ratio was the highest in Wayanad (79.67 per cent), followed
by Malappuram (75.55 per cent) and Palakkad (74.38 per cent) Districts. The ratio was the lowest in Ernakulam (64.37 per cent), followed by Kottayam (64.46 per cent) and Pathanamthitta (64.66 per cent) Districts.
In Kerala, 50.61 per cent and 10.26 per cent of the rural households depend on manual casual labour and cultivation as their most important source of household income. At the all India level, the corresponding shares are 51.18 per cent and 30.10 per cent respectively. District-level data about the source of household income show that, in the case of manual casual labour, the highest rate is in Malappuram (65.05 per cent) and the lowest rate is in Pathanamthitta (31.71 per cent). In the case of cultivation, the highest rate is in Idukki (32.49 per cent) and the lowest rate is in Alappuzha (4.86 per cent).
In Kerala, the factors such as land reforms, the spread of education and health care, decentralisation, pension schemes, public distribution system, Kudumbashree programmes, and the implementation of the Plan schemes have played an effective role in reducing the poverty ratio in rural and urban areas. Even though Kerala is better off than most other States in India in terms of average poverty estimates, there are still several pockets of deprivation in the State. Poverty in Kerala is mainly concentrated in some social categories and groups such as SCs, STs, fisherfolk, potters and artisans. It points to the need for actions focussed on these groups under different central and State schemes and redesigning livelihood programmes in these areas to reduce poverty from the State. The SC development department, ST development department and the fisheries department are implementing several poverty reduction/livelihood programmes for uplifting people in these communities. Though the extent of poverty has been reduced, focused action to alleviate deprivation among marginalised sections is the urgent task of the State.
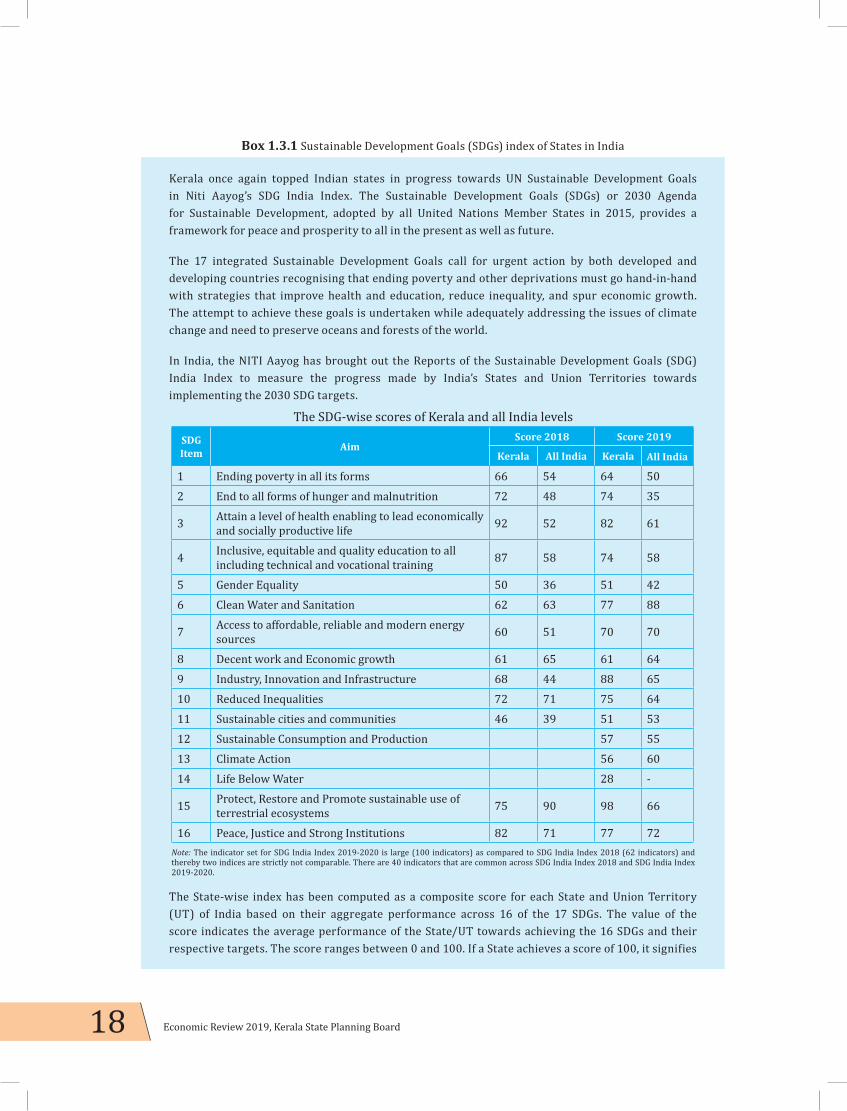
18 Economic Review 2019, Kerala State Planning Board
Box 1.3.1 Sustainable Development Goals (SDGs) index of States in India
Kerala once again topped Indian states in progress towards UN Sustainable Development Goals in Niti Aayog’s SDG India Index. The Sustainable Development Goals (SDGs) or 2030 Agenda for Sustainable Development, adopted by all United Nations Member States in 2015, provides a framework for peace and prosperity to all in the present as well as future.
The 17 integrated Sustainable Development Goals call for urgent action by both developed and developing countries recognising that ending poverty and other deprivations must go hand-in-hand with strategies that improve health and education, reduce inequality, and spur economic growth. The attempt to achieve these goals is undertaken while adequately addressing the issues of climate change and need to preserve oceans and forests of the world.
In India, the NITI Aayog has brought out the Reports of the Sustainable Development Goals (SDG) India Index to measure the progress made by India’s States and Union Territories towards implementing the 2030 SDG targets.
The State-wise index has been computed as a composite score for each State and Union Territory (UT) of India based on their aggregate performance across 16 of the 17 SDGs. The value of the score indicates the average performance of the State/UT towards achieving the 16 SDGs and their respective targets. The score ranges between 0 and 100. If a State achieves a score of 100, it signifies
The SDG-wise scores of Kerala and all India levels
SDG Item Aim
Score 2018 Score 2019
Kerala All India Kerala All India 1 Ending poverty in all its forms 66 54 64 502 End to all forms of hunger and malnutrition 72 48 74 35
3 Attain a level of health enabling to lead economically and socially productive life 92 52 82 61
4 Inclusive, equitable and quality education to all including technical and vocational training 87 58 74 58
5 Gender Equality 50 36 51 426 Clean Water and Sanitation 62 63 77 88
7 Access to affordable, reliable and modern energy sources 60 51 70 70
8 Decent work and Economic growth 61 65 61 649 Industry, Innovation and Infrastructure 68 44 88 6510 Reduced Inequalities 72 71 75 6411 Sustainable cities and communities 46 39 51 5312 Sustainable Consumption and Production 57 5513 Climate Action 56 6014 Life Below Water 28 -
15 Protect, Restore and Promote sustainable use of terrestrial ecosystems 75 90 98 66
16 Peace, Justice and Strong Institutions 82 71 77 72Note: The indicator set for SDG India Index 2019-2020 is large (100 indicators) as compared to SDG India Index 2018 (62 indicators) and thereby two indices are strictly not comparable. There are 40 indicators that are common across SDG India Index 2018 and SDG India Index 2019-2020.

19Chapter 1, Kerala Economy
Source: SDG India Index, Baseline Report, 2018 and SDG India Index Report, 2019-20, www.niti.gov.in
that the State has achieved the national target set for 2030. On the other hand, if a State achieves a score of 0, it signifies that the State was the worst performer.
The SDG Index Score 2019 for Sustainable Development Goals 2030 ranges between 50 and 70 for States and between 59 and 70 for UTs. Among the States and the UTs, Kerala and Chandigarh are respectively the front runners with a score of 70. Kerala ranks first in SDGs concerning ‘health’ and ‘industry, innovation and infrastructure’ and ranks second in ‘education’ and ‘gender equality’.

20 Economic Review 2019, Kerala State Planning Board
1.4 Role Of Financial Institutions In Development Initiatives Financial institutions play an important role in the social and economic development of a country. A developed and robust financial system is crucial to the smooth functioning of the economy. In a World Bank study (the World Development Report, 1989), the role of financial institution is defined as follows, “A financial system provides services that are essential in a modern economy.... Access to a variety of financial instruments enables economic agents to pool, price, and exchange risk. Trade, the efficient use of resources, saving, and risk-taking are the cornerstones of a growing economy.”
Spread of Banking – All India and State level
As per State Level Bankers Committee (SLBC) data, the total number of bank branches in Kerala as on March 2019 is 7,421 including public sector commercial banks, private sector commercial banks, regional rural banks, small
finance banks and co-operative banks. Of the total number of bank branches only 6.5 per cent are in rural areas. 62.4 per cent of the total bank branches are in semi urban areas and the balance 31.1 per cent are in urban areas. The spread of banks, category-wise in Kerala is shown in the Table 1.4.1. As per SLBC report, Kerala has a total of 6,284 scheduled commercial bank branches (which includes only public sector commercial banks, regional rural banks and private sector commercial banks) as on March 2019 as against 6,256 bank branches as on March 2018, which shows a hike of 0.5 per cent. The total number of branches of Kerala Gramin Bank increased to 633 in March 2019 from 630 in March 2018. As per RBI Quarterly statistics, March 2019, total number of bank branches all over India is 1,41,756. Uttar Pradesh has the largest number of banks followed by Maharashtra and Tamil Nadu. Kerala has the largest number of bank branches (4,592) among the semi-urban areas in the country (Appendix 1.4.1).
Table 1.4.1 Banking group-wise branch network in KeralaSl. No
Banking Group Number of Branches
Rural Semi-urban Urban Total Per centage
1 Public Sector Commercial Banks 140 2401 885 3426 46.172 Regional Rural Bank – Kerala Gramin Bank 52 542 39 633 8.533 Private Sector Commercial Banks 139 1564 522 2225 29.984 Small Finance Banks 34 82 26 142 1.915 Co-Operative Banks 117 38 840 995 13.41Total 482 4627 2312 7421 100
Source: State Level Bankers Committee, Kerala, March 2019

21Chapter 1, Kerala Economy
Deposits
As per SLBC data, the total bank deposits (includes deposits of Commercial Banks, Regional Rural Banks and Small Finance Banks) in Kerala as on March 2019 is ₹4,93,562 crore as against ₹4,47,235 crore in March 2018. The total bank deposits in March 2019 comprises ₹3,03,507 crore domestic deposits and ₹1,90,055 crore NRI deposits. Domestic deposits which constitute 61.5 per cent of total deposits of the State has increased by 9.45 per cent while the NRI deposits which constitute 38.5 per cent has increased by 11.83 per cent. The growth of bank deposits in Kerala is shown in Figure 1.4.1 and (Appendix 1.4.2).
Deposits in Scheduled Commercial Banks
As per RBI data, the total bank deposits in all scheduled commercial banks (including public sector banks, private sector banks, foreign banks, regional rural banks (RRBs) and small finance banks) in Kerala in March 2019 increased to ₹4,95,741 crore(12.6 per cent)as compared to ₹4,40,361 crore in March 2018. Maharashtra has the highest share of deposits (20.30 per cent) in the country. The share of deposits in scheduled
commercial banks in Kerala to the total deposits in the country as on March 2019 is 3.95 per cent (Appendix 1.4.3). As per RBI data the total deposits at the end of March 2019 in the country increased by 9.4 per cent than previous year.
NRI deposits
The money that migrants send home is important not only to their families but also to their country’s balance of payments. According to the data furnished by SLBC, the total NRI deposit in public sector banks in Kerala as on March 2019 was ₹93,321.3 crore and in private sector banks was ₹95,046.65 crore. The inflow of NRI deposits increased by 11.83 per cent from ₹1,69,944 crore in March 2018 to ₹1,90,055 crore in March 2019. Domestic deposits grew by 9.45 per cent in March 2019 to ₹3,03,507 crore as against ₹2,77,291 crore in March 2018. State Bank of India is in the first position with 30.25 per cent share of NRI deposits among the public and private sector banks. The percentage share of the NRI deposit in public sector banks is 49 per cent and that in private sector banks is 50 per cent. Among public sector commercial banks, State Bank of India has the highest NRI deposit base of ₹56,987.47 crore (Appendix 1.4.4).
Figure 1.4.1 Growth of bank deposit in Kerala from 2010 to 2019
Source: State Level Bankers Committee Report, March 2019

22 Economic Review 2019, Kerala State Planning Board
Advances
As on March 2019, the commercial banks and co-operative banks in Kerala disbursed ₹3,80,619 crore as advances which is 13.7 per cent higher than March 2018 as per SLBC data. All Commercial banks including public sector commercial banks, private sector commercial banks, RRBs and Small Finance Banks (SFB) together disbursed ₹3,29,900 crore as advances at the end of March 2019. Out of this, the advances of public sector commercial banks, private sector commercial banks, RRBs and Small Finance Banks were ₹1,78,031 crore, ₹1,31,185 crore, ₹17,897 crore and ₹2,786 crore respectively.
As per quarterly RBI report 2018-19 the major State-wise advances financed by scheduled commercial banks are given in the (Appendix 1.4.5).
Advances for Agricultural Purpose
As per SLBC report total advances through commercial banks, RRBs, SFBs and co-operative banks for agricultural purpose as on March 2019 reached ₹89,383 crore which shows a hike of
16.7 per cent as compared to previous year. The per centage of agricultural advance to total advance is 23.5 per cent. Share of agricultural advances of various banks as on March 2019 is shown in Figure 1.4.2.
Advances to SCs/STs and Weaker Section
As per SLBC data, on March 2019, an amount of ₹5710.8 crore and ₹1306.3 crore was disbursed to Scheduled Caste (SC) and Scheduled Tribe (ST) persons respectively in the State by various banks as against ₹5,457 crore and ₹1,348core as on March 2018. Compared to the previous year, there is around 5 per cent increase in the advances given to Scheduled Caste whereas is a 3 per cent decrease in the advances given to Scheduled Tribe persons. The bank group-wise advances given to SC and ST are given in Table 1.4.2.
As per SLBC data, in March 2019, ₹77,474 crore has been disbursed to weaker sections in the State which shows a 13 per cent increase as compared to March 2018 (₹68,434 crore).
Figure 1.4.2 Share of agricultural advances as on March 2019
Source:SLBC Report March 2019

23Chapter 1, Kerala Economy
Housing loans
As per SLBC data (March 2019), banks in Kerala including commercial banks and co-operative banks sanctioned ₹36,025 crore to 7,51,634 beneficiaries as housing loan against ₹39,829 crore to 7,06,734 beneficiaries in March 2018. There is a 9.6 per cent decline in total housing loan sanctioned. As on March 2019, public sector banks disbursed ₹19127.2 crore to 3,05,832 beneficiaries, RRBs disbursed ₹2,809 crore to 56,827 beneficiaries, private sector commercial banks disbursed ₹5405.7 crore to 70,335 beneficiaries, small finance banks disbursed ₹43.78 crore to 14,222 beneficiaries and co-operative banks disbursed ₹8,638.9 crore to 3,04,418 beneficiaries. The major share of housing loans are disbursed through public sector commercial banks (53 per cent) followed by co-operative banks (24 per cent); but the number of beneficiaries remains same (41 per cent).
Educational Loan
It is observed that as on March 2019, ₹9,896.6 crore was sanctioned to 3,32,432students as educational loan. As per the SLBC data, public sector commercial banks disbursed ₹7,782 crore to 2,43,432 students, which accounts for 79 per cent of the total educational loan provided. RRBs disbursed ₹783.3 crore to 27,176 students, private sector commercial banks disbursed ₹1,260.6 crore to 43,360 students, SFBs disbursed ₹14.74 crore to 16,083students and co-operative banks disbursed ₹56 crore to
2,381 students in March 2019. Out of the total educational loan provided, 14 per cent is Non-Performing Asset (NPA).
Credit-Deposit Ratio
According to the RBI quarterly statistics, the credit-deposit (CD) ratio of scheduled commercial banks at the end of March 2019 increased to 78.18 per cent from 75.64 per cent in March 2018. Among the major States, Andhra Pradesh has the highest CD ratio (121.84 per cent) followed by Tamil Nadu (109.72 per cent) and Maharashtra (106.47 per cent).
As on March 2019, the CD Ratio of scheduled commercial banks in Kerala increased to 65.61 per cent from 63.90 per cent in the previous year (Appendix 1.4.6). The total deposits in scheduled commercial banks in Kerala increased to ₹4,95,741 crore as on March 2019 from ₹4,40,361 crore as on March 2018 and total credit also increased to ₹3,25,280 crore as on March 2019 from ₹2,81,384 crore as on March 2018.
The CD Ratio of public sector banks in India as on March 2019 is 72.85 per cent. It was 71.07 per cent in March 2018. Among the States, Andhra Pradesh has the highest CD Ratio (126.32 per cent) followed by Maharashtra (112.32 per cent) and Telangana (109.78 per cent). The CD Ratio of public sector banks in Kerala shows a slight increase from 61.86 per cent to 64.93 per cent in March 2019. (Appendix 1.4.7)
Table 1.4.2 Banking group-wise details of SC/ST advances as on March 2019, in ₹ crore
Sl.No BankSC Advances ST Advances
Number Amount Number Amount
1 Public Sector Commercial Banks 302382 4915.48 65879 1064.032 RRB 36872 220.71 19475 115.423 Private Sector Commercial Banks 47754 243.71 3618 40.114 Small Finance Banks 111459 204.38 32160 54.915 Co-Operative Banks 9885 126.5 2704 31.85 Total banking sector 508352 5710.78 123836 1306.32
Source: State Level Bankers Committee, Kerala, March 2019

24 Economic Review 2019, Kerala State Planning Board
District-wise Analysis of Banking Statistics
The District-wise analysis of banking statistics in Kerala by RBI reveals that Ernakulam has the highest number of branches (1,014) followed by Thrissur (751) and Thiruvananthapuram (723). The lowest number of branches is in Wayanad (123). In Kerala, Wayanad has the highest CD ratio (138.82 per cent) and Pathanamthitta has the lowest (25.47 per cent) (Appendix 1.4.8).District-wise distribution of deposits and credit of scheduled commercial banks in Kerala as on March 2019 is shown in Figure 1.4.3.
Co-operative banking sector in Kerala
The Kerala State Co-operative Bank (KSCB) being the central financing agency acts as the lender of last resort to the District Co-operative Banks (DCBs). Besides this, the Bank finances the Apex Cooperative Institutions and extends direct credit to individuals. The KSCB provides assistance in the form of Short Term Credit, Medium Term Credit and Long Term Credit for the constituents
as per their requirements. Also it acts as a central balancing centre to absorb surplus funds of DCBs, PACS and other Cooperative institutions. According to SLBC data for March 2019, out of a total of 7,421 bank branches 995 branches are in the co-operative banking sector. Of the total 995 branches in the co-operative sector 117 are in rural, 38 are in semi-urban area and 840 are in urban area.
The total deposits of commercial, RRBs, SFBs and Co-operative Banks as on March 2019 was ₹5,63,702 crore. The deposits of co-operative banks as on March 2019 were ₹70,139 crore, which is 12.44 per cent of the combined deposits of commercial banks and co-operatives. The total advances from both commercial banks and co-operatives in the State was ₹3,80,619 crore in March 2019. Of this the share of cooperatives is ₹50,719 crore which accounts for 13.3 per cent of the total advances of commercial and co-operative banks in the State. The total agricultural advances from commercial and co-operative banks in the State as on March 2019 was ₹89,383 crore and the share of co-
Figure 1.4.3 District-wise distribution of deposits and credit of scheduled commercial banks in Kerala as on March 2019
Source: Reserve Bank of India -Quarterly statistics on Deposits and Credit of Scheduled Commercial Banks, March 2019

25Chapter 1, Kerala Economy
operatives is ₹8,580 crore (9.6 per cent). The volume of total banking business in the State was ₹8,49,631 crore in March 2018 which increased to ₹9,44,321 crore in March 2019 (Table 1.4.3).
Non-Banking Financial Institutions/Companies
Non-banking financial companies (NBFCs) are entities or institutions that provide certain bank-like and financial services but do not hold a banking license. NBFCs are not subject to the banking regulations and oversight by federal and State authorities adhered to by traditional banks. Investment banks, mortgage lenders, money market funds, insurance companies, hedge funds, private equity funds, etc., are examples of NBFCs. These organisations play a crucial role in the economy, offering their services in urban as well as rural areas, mostly granting loans allowing for growth of new ventures. NBFCs also provide a wide range of monetary advices like chit-reserves and advances.
Kerala State Financial Enterprise (KSFE)
Kerala State Financial Enterprise (KSFE), a fully owned Government Miscellaneous Non-Banking Finance Company (MNBC), was incorporated in
1969 primarily with the objective of safeguarding interest of the general public by protecting them from fly-by-night operators along with bringing about order and discipline in chit industry, providing a safe and secure alternative to investors and promoting chit industry in an organised manner. Chitty happens to be one of the most appropriate financial instrument for mobilising household savings for the purpose of capital formation. In the year 2012, as per the order of Hon’ble Supreme Court, KSFE switched over to Chit Fund Act (CFA) 1982, and all chitties commenced after 2012 are steered under the Act, which is more consumer protective.
At present, in addition to the Head Office at Thrissur, KSFE has 13 regional offices and 577 branches. Total deposits as on March 2019 was ₹12,548 crore and advances as ₹5,705.12 crore. Chitty sala as on March 2019 amounted to ₹1,817.13 crore and the number of chitty subscribers increased to 17,61,972 in March 2019 from 16,73,313 in March 2018. The financial performance of KSFE for the last five years is shown in Table 1.4.4.
The overall business position of KSFE for the last five years is shown in Table 1.4.5.
Table 1.4.3 Performance of co-operative sector, in ₹ crore
Sl. No. ParameterMarch, 2019 Share of
co-operative to Total (%)
Co-operative Sector
Commercial Banks+ RRBs+ SFBs Total
1 Branches 995 6426 7421 132 Total Deposits 70140 493562 563702 123 Total Advances 50719 329900 380619 134 Total Business 120859 823462 944321 135 Priority sector advances 33778 172940 206718 166 % Priority sector advances 67% 52% 54%7 Agriculture Advances 8580 80803 89383 108 % Agriculture Advances 17% 24% 23%9 MSME Advances 1474 54446 55921 310 % MSME Advances 3% 17% 15%11 CD Ratio 72.31 66.84 67.52
Source: State Level Bankers Committee, Kerala 2019

26 Economic Review 2019, Kerala State Planning Board
Table 1.4.4 Financial performance of KSFE for the last five years, in ₹ crore
Sl. No Particulars
March 31, 2015
March 31, 2016
March 31, 2017
March 31, 2018 March 31,
2019 (Audited) (Audited) (Audited) (Audited)
1 Foreman Commission 684 746 792 841 9402 Total Income 1546 1750 1966 2162 2473.613 Total Expenditure 1343 1596 1732 1906 2351.144 Profit before tax 203 154 234 256 122.475 Reserve and surplus 425 440 476 620 8546 Share capital 20 50 100 100 100
Source: Report from KSFE, 2019
Kerala Financial Corporation (KFC)
Kerala Financial Corporation (KFC) incorporated under the State Financial Corporations Act of 1951, plays a major role in the development and industrialisation of Kerala. Now KFC has 16 Branch Offices with its Head Quarters at Thiruvananthapuram and Zonal Offices at Kozhikode, Ernakulam and Thiruvananthapuram. The Corporation is the first PSU in Kerala and
first SFC in India to initiate Corporate Social Responsibility activity. As part of its Corporate Social Responsibility, KFC has set up KFC-CARE (Centre for Assistance and Rehabilitation) to rehabilitate and serve the marginalised sections of the community. Net profit of KFC increased to ₹17.7 crore as on March 2018-19 from ₹8.3 crore as on March 2017-18. Net NPA decreased to 1.82 per cent in 2018-19 from 2.03 per cent in 2017-18.
Table1.4.5 Overall business position of KSFE for the last five years, in ₹ crore
Sl.No SchemesMarch 31,
2015March 31,
2016 March 31,
2017 March 31,
2018 March 31,
2019
(Audited) (Audited) (Audited) (Audited)
1 Chitty Sale (Monthly) 1321 1433 1520 1645 18172 Advances i Gold loan 820 743 782 710 899ii RCL/FDL 922 1251 1693 1875 1826iii NCL/PBL 1074 1244 1569 1683 1746iv NHFS 185 366 646 899 1088v Car loan/consumer vehicle loan 17 11 38 37 74Others 305 327 54 19 22
Total advances 3323 3942 4782 5223 5705 Source: Report from KSFE, 2019
Box 1.4.1 KSFE Pravasi Chitty
KSFE has already launched Pravasi Chitty for the Non-residents of Kerala. Funds generated through Pravasi Chitty is mobilised through KIIFB for investment in various projects undertaken by Government of Kerala. Subscription for Pravasi Chitty started in the month of October 2018 and first auction was conducted in the month of November 2018. Pravasi Chitty was initially launched in UAE.It will be extended to other Emirates/Gulf Cooperation Council (GCC) countries in the ensuing years.
Source: Report from KSFE, 2019

27Chapter 1, Kerala Economy
1.5 State Finances
In our federal set up a State has to balance aspirational policy choices by considering potential creation of revenue within the legislative framework and adhere to the fiscal responsibility legislations. Kerala is committed to the welfare of its people. The Government has been taking all efforts in promoting social and economic development in the State. However, the major constraint in implementing these policies has been shortage of financial resources.
The fiscal space of States in India is constrained due to several factors. The implementation of GST has further limited the manovering space to raise resources through taxes. Besides, there has been a delay in receipt of GST compensation from the Central government. About 30 per cent of the total revenue of the State Government comes from loans or grants from the Central Government. This has been affected due to changes in funding pattern of Centrally Sponsored Schemes (CSS) since 2015-16. In schemes where 25 per cent of cost was met by State earlier, now 40 per cent of the cost is borne by the State. As pointed out at the outset the problem of resources is further aggravated as the State is bound by the Fiscal Responsibility Act (FRA) under which it cannot borrow more than 3 per cent of its GSDP. Based on the borrowing limit of 3 per cent of the State Gross Domestic Product, Kerala was granted a borrowing limit of ₹24,915 crore as loans in 2019-20. But by the end of the year, Central Government reduced ₹5,325 crore from the budgeted amount. In effect, only
₹19,590 crore can be raised in 2019-20. In the last quarter of financial year 2019-20, approval to borrow only ₹1,920 crore has been granted as against a request of ₹4908 crore.
The State Government has taken consistent efforts for fiscal consolidation since 2016-17 by trying to improve tax collection and rationalising expenditure. But the fiscal consolidation process was impeded by factors beyond its control. Demonetisation of ₹500 and ₹1000 notes by Government of India in 2016-17 and implementation issues in Goods and Service Taxes in 2017-18 have affected the State’s resource mobilisation efforts. Demonetisation exacerbated the macro economic problems of State. The purchasing power and economic activities in the State, particularly in the traditional sectors such as cashew, coir, handloom, fisheries and other cash crops, suffered a lot due to the currency shortage.
Natural calamities like Ockhi cyclone and the floods of 2018 and extreme rainfall events of 2019 resulted in the loss of lives, livelihoods and destruction of roads, houses and other infrastructure. The productive sectors of the economy, including agriculture, industries, and tourism, have suffered substantial losses. This affected the revenue potential of the State. Not only did it affect resource mobilisation, it resulted in additional expenditure to meet the needs of rebuilding the State and reviving the productive sectors of the economy. Additional borrowing

28 Economic Review 2019, Kerala State Planning Board
limits and grants were requested from the Centre. The GST Council has been approached for avoiding delay in release of compensation for loss of revenue arising out of implementation of GST.
Despite of all these setbacks it is noteworthy that the State has attained top position in its progress towards UN Sustainable Development Goals as measured by NITI Aayog through SDG India Index. This indicates the quality of expenditure set apart for key social services like education, and health. GoK has also promoted accelerated investment in infrastructure for ensuring sustainable growth in the economy.
The financial indicators for the State are given in Table 1.5.1. The Balance from current revenue (BCR), the excess of government revenue over expenditure, has been negative for the past few years. The BCR further worsened to (-) ₹7525 in 2018-19 (-) from ₹4156 crore in 2017-18. The ratio of capital outlay to capital receipts has slightly improved to 0.36 in 2018-19. Major deficit indicators of the State for the period from 2011-12 to 2019-20 (BE) is shown in Table 1.5.2. Revenue Deficit and Fiscal Deficit in 2018-19 have decreased slightly when compared to 2017-18. However, the present fiscal stress
Table 1.5.1 Financial indicators for Government of Kerala, in ₹ crore
Particulars 2011-12 2012-13 2013-14 2014-15 2015-16 2016-17 2017-18 2018-19 2019-20BE
Balance fromCurrent Revenue(BCR)
-5449 -4973 -6917 -9533 -1322 -5253 -4156 -7525 1772
Interest ratio 0.17 0.16 0.17 0.17 0.16 0.16 0.18 0.18 0.15Capital Outlay/Capital Receipts
0.31 0.29 0.25 0.23 0.42 0.38 0.32 0.36 0.67
Return of investment ratio 0.016 0.016 0.018 0.012 0.013 0.013 0.015 0.016
OutstandingGuarantees(Including interest)
0.22 0.22 0.20 0.19 0.18 0.21 0.21 0.29
Revenue ReceiptsAssets/Liabilities
0.40 0.40 NA NA NA NA NA NA
Source: Finance Department, GoK
Table 1.5.2 Major deficit indicators, in ₹crore
YearRevenue Deficit Fiscal Deficit Primary Deficit
GSDPAmount % to GSDP Amount % to GSDP Amount % to GSDP
2011-12 8034.26 2.21 12814.77 3.52 -6521.17 -1.79 364047.882012-13 9351.45 2.27 15002.47 3.64 7797.66 1.89 412313.002013-14 11308.56 2.43 16944.13 3.64 8678.74 1.87 465041.212014-15 13795.96 2.69 18641.72 3.64 8872.13 1.73 512564.052015-16 9656.81 1.73 17818.46 3.19 6707.61 1.20 557946.512016-17 15484.59 2.51 26448.35 4.29 14331.85 2.32 617034.662017-18 16928.21 2.41 26837.41 3.83 11717.48 1.67 701577.382018-19 17461.92 2.23 26958.30 3.45 10210.37 1.31 781653.262019-20 BE 8770.29 1.00 26290.58 3.00 9089.30 1.04 875514.00
Source: Finance Department, GoK
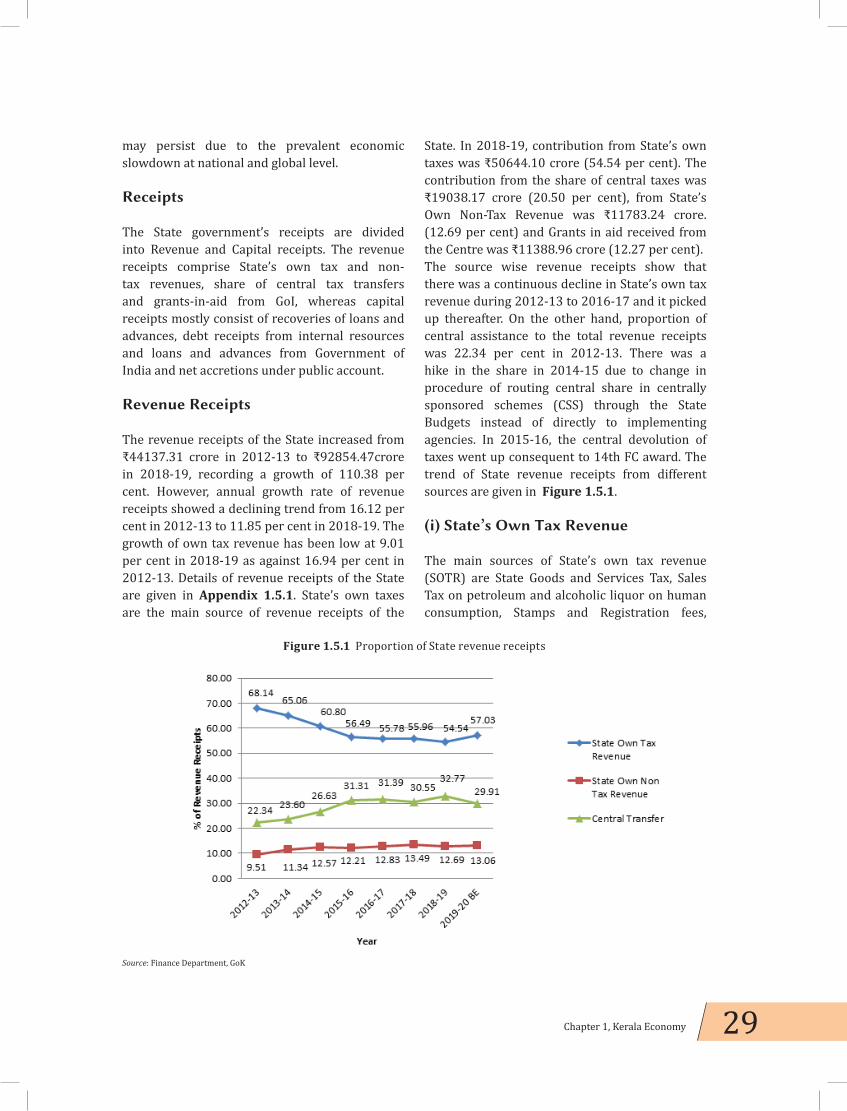
29Chapter 1, Kerala Economy
may persist due to the prevalent economic slowdown at national and global level.
Receipts
The State government’s receipts are divided into Revenue and Capital receipts. The revenue receipts comprise State’s own tax and non-tax revenues, share of central tax transfers and grants-in-aid from GoI, whereas capital receipts mostly consist of recoveries of loans and advances, debt receipts from internal resources and loans and advances from Government of India and net accretions under public account. Revenue Receipts The revenue receipts of the State increased from ₹44137.31 crore in 2012-13 to ₹92854.47crore in 2018-19, recording a growth of 110.38 per cent. However, annual growth rate of revenue receipts showed a declining trend from 16.12 per cent in 2012-13 to 11.85 per cent in 2018-19. The growth of own tax revenue has been low at 9.01 per cent in 2018-19 as against 16.94 per cent in 2012-13. Details of revenue receipts of the State are given in Appendix 1.5.1. State’s own taxes are the main source of revenue receipts of the
State. In 2018-19, contribution from State’s own taxes was ₹50644.10 crore (54.54 per cent). The contribution from the share of central taxes was ₹19038.17 crore (20.50 per cent), from State’s Own Non-Tax Revenue was ₹11783.24 crore. (12.69 per cent) and Grants in aid received from the Centre was ₹11388.96 crore (12.27 per cent).The source wise revenue receipts show that there was a continuous decline in State’s own tax revenue during 2012-13 to 2016-17 and it picked up thereafter. On the other hand, proportion of central assistance to the total revenue receipts was 22.34 per cent in 2012-13. There was a hike in the share in 2014-15 due to change in procedure of routing central share in centrally sponsored schemes (CSS) through the State Budgets instead of directly to implementing agencies. In 2015-16, the central devolution of taxes went up consequent to 14th FC award. The trend of State revenue receipts from different sources are given in Figure 1.5.1.
(i) State’s Own Tax Revenue
The main sources of State’s own tax revenue (SOTR) are State Goods and Services Tax, Sales Tax on petroleum and alcoholic liquor on human consumption, Stamps and Registration fees,
Figure 1.5.1 Proportion of State revenue receipts
Source: Finance Department, GoK

30 Economic Review 2019, Kerala State Planning Board
State Excise Duties, Motor Vehicle Tax and Land Revenue. In 2012-13, it was 68.14 per cent of total revenue wherein it declined to 54.54 per cent in 2018-19 in the back drop of general economic slowdown and other external and internal factors which influenced the State’s economy. Details of SOTR is given in Appendix 1.5.2.
The receipt from State’s own tax revenue in 2018-19 was ₹50644.10 crore. State Goods and Services Tax constitutes the major share of State’s Own Tax resource. In 2018-19 receipts from State Goods and Services Tax (₹21014.71 crore) contributed 41.49 per cent of the total SOTR, followed by 37.96 per cent from Sales Tax (₹19225.76 crore), 7.32 per cent from Taxes on Vehicles (₹3708.61 crore), 7.29 per cent from Stamp duties and registration fees (₹3693.17 crore), 4.98 per cent from State Excise Duties (₹2521.4 crore), and 0.4 per cent from Land Revenue (₹202.78 crore) and 0.55 per cent (277.68) from other sources. Figure 1.5.2 shows the source wise State own tax revenue in 2018-19.
(ii) State’s Own Non-Tax Revenue Gross receipts under State Lotteries are the major source of Non Tax revenue of the State
which constitutes 78.63 per cent of total non-tax revenue and 20.99 per cent of total revenue receipts of the State. Other main sources of State’s own Non-Tax Revenue (SONTR) are sale proceeds of forest produces and receipts in the form of fees and fines from various social developmental services. In 2018-19, ₹11783.24 crore was realised as SONTR, recording growth of 5.21 per cent over 2017-18 (₹11199.61 crore). In 2018-19 receipts from State Lotteries was ₹9264.66 crore recording a growth rate of 2.55 per cent, compared to 2017-18 (₹9034.16 crore). This was followed by receipts of ₹1058.53 crore from Social Developmental Services and ₹287.21 crore from the sale proceeds of forest produces. Details of State own non tax revenue is given in Appendix 1.5.3.
(iii) Central Resource Transfers Two major components of central devolution are share of taxes and grants as recommended by the Finance Commissions (FC) and grants disbursed by the Central Government. Within Central Devolution, share of Taxes to be devolved is based on the formula recommended by the FC as mandated in Article 280 of the Constitution. The FC also recommends grants-in-aid under Article 275 of the constitution to bridge post tax devolution revenue deficits. Moreover, the
Figure 1.5.2 Source-wise State own tax revenue in 2018-19
Source: Finance Department, Government of Kerala

31Chapter 1, Kerala Economy
FC also devolves sector specific grants. But the 14th FC did away with the sector specific grants except for Local Governments and for disaster response. The tax devolution and revenue deficit grants form the flexible part of Central resource transfer. The other components like central share in CSS are tied grants over which State have no flexibility in spending.
As per the recommendations of the 14th Finance Commission the share of the States on the net tax proceeds of Union Government during the period from 2016-17 to 2019-20 is 42 per cent.
The share pattern during the award period of the Twelfth and the Thirteenth Finance Commissions was 30.5 per cent and 32 per cent respectively. The State of Kerala is entitled for 2.5 per cent of net shareable union tax proceeds during the 14th FC period as against the 2.34 per cent in the 13th FC award period. Figure 1.5.3 shows the trend of net shareable tax proceeds based on different Finance Commission recommendations. The major policy shift in the 14th FC period was to give more flexibility to the State to utilise central funds in accordance with the priorities of the State. However, it is seen that the share of central
Figure 1.5.3 Net shareable union tax as per Finance Commission recommendation, in per cent
Source: Finance Department, GoK
Figure 1.5.4 Trend of flexible and tied fund transfer from Central Government
Source: Finance Department, GoK

32 Economic Review 2019, Kerala State Planning Board
taxes and duties (flexible fund) with Grant in aid and other receipt from centre for Plan and Non Plan, is decreasing. This dilutes the spirit of Co-operative Federalism of the country. Figure 1.5.4 shows the share of flexi and tied fund received from central government.
In 2018-19, total central transfers to the State were ₹30427.13crore against ₹25360.92 crore in 2017-18. During this period, the share of central taxes and duties was ₹19038.17 crore witnessing a growth rate of 13.10 per cent compared to that in 2017-18. In 2018-19, the State received ₹11388.96 crore as Grant in aid from the centre. ₹2884 crore received as compensation for loss of revenue arising out of the implementation of the GST is the reason for increase of grant in aid in 2018-19. Details of central transfer given in Table 1.5.3.
Expenditure Expenditure of State includes three components viz revenue expenditure, capital expenditure and expenditure on loan disbursements. Between 2012-13 and 2018-19, total expenditure comprising plan and non-plan expenditure increased from ₹59228.18 crore to ₹120069.82 crore. Out of the total expenditure o f ₹120069.82 crore in 2018-19, non-plan and plan expenditure stood at ₹98071.87 crore (81.68 per cent) and ₹21997.95 crore (18.32 per cent) respectively.
Revenue Expenditure Revenue expenditure involves both development and non-development expenditure. Development expenditure includes expenditure on Education, Health, Agriculture, Animal Husbandry, Industries, Labour and Employment etc. Non-development expenditure comprises interest payment, pension payment and others. Details of revenue expenditure are given in Table 1.5.4. The revenue expenditure of the State mainly comprises expenditure on salaries, pension, debt services, devolution to the Local Governments, social security pensions and subsidies. The operational and maintenance cost for the completed projects and programmes are also classified under the revenue account. Grants provided by the State to meet salaries and pension liabilities of employees in the Universities and State autonomous bodies and also the pension liabilities of employees of Panchayat Raj Institutions are classified as revenue expenditure. Major portion of revenue expenditure devolved to the LSGIs is utilised for the creation of capital assets at local body level.
Expenditure on social and economic services together constitutes developmental expenditure. Funds devolved to Local Governments for expansion and development and maintenance of assets are also reckoned as developmental
Table 1.5.3 Central Transfers, in ₹crore
Year
Share in Central Taxes and Duties
Grant-in-aid and other receipts from Centre for Plan and Non-plan
Total Transfers
Amount Annual Growth Rate Amount Annual Growth
Rate Amount Annual Growth Rate
2012-13 6840.65 14.19% 3021.53 -18.54% 9862.18 1.68%2013-14 7468.68 9.18% 4138.21 36.96% 11606.89 17.69%2014-15 7926.29 6.13% 7507.99 81.43% 15434.28 32.98%2015-16 12690.67 60.11% 8921.35 18.82% 21612.02 40.03%2016-17 15225.02 19.97% 8510.35 -4.61% 23735.37 9.82%2017-18 16833.08 10.56% 8527.84 0.21% 25360.92 6.85%2018-19 19038.17 13.10% 11388.96 33.55% 30427.13 19.98%2019-20 BE 22797.61 19.75% 11702.43 2.75% 34500.04 13.39%
Source: Finance Department, GoK
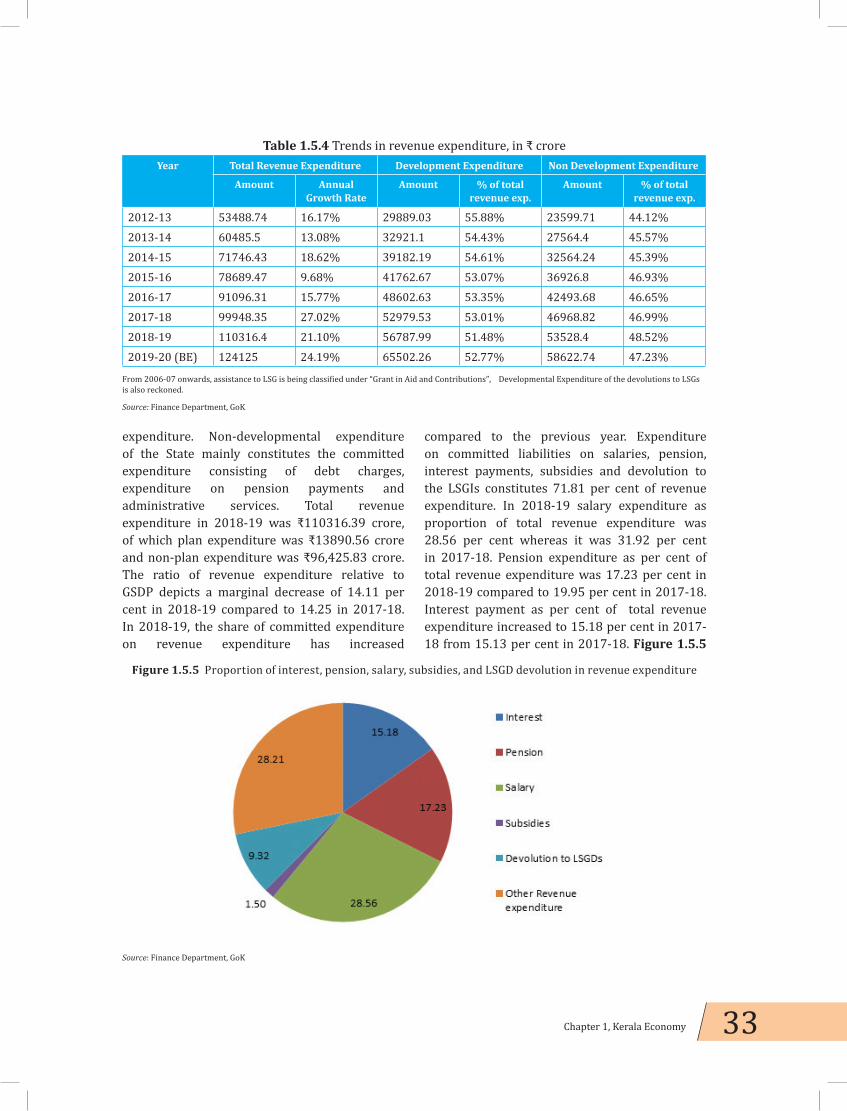
33Chapter 1, Kerala Economy
expenditure. Non-developmental expenditure of the State mainly constitutes the committed expenditure consisting of debt charges, expenditure on pension payments and administrative services. Total revenue expenditure in 2018-19 was ₹110316.39 crore, of which plan expenditure was ₹13890.56 crore and non-plan expenditure was ₹96,425.83 crore. The ratio of revenue expenditure relative to GSDP depicts a marginal decrease of 14.11 per cent in 2018-19 compared to 14.25 in 2017-18. In 2018-19, the share of committed expenditure on revenue expenditure has increased
compared to the previous year. Expenditure on committed liabilities on salaries, pension, interest payments, subsidies and devolution to the LSGIs constitutes 71.81 per cent of revenue expenditure. In 2018-19 salary expenditure as proportion of total revenue expenditure was 28.56 per cent whereas it was 31.92 per cent in 2017-18. Pension expenditure as per cent of total revenue expenditure was 17.23 per cent in 2018-19 compared to 19.95 per cent in 2017-18. Interest payment as per cent of total revenue expenditure increased to 15.18 per cent in 2017-18 from 15.13 per cent in 2017-18. Figure 1.5.5
Table 1.5.4 Trends in revenue expenditure, in ₹ crore Year Total Revenue Expenditure Development Expenditure Non Development Expenditure
Amount Annual Growth Rate
Amount % of total revenue exp.
Amount % of total revenue exp.
2012-13 53488.74 16.17% 29889.03 55.88% 23599.71 44.12%2013-14 60485.5 13.08% 32921.1 54.43% 27564.4 45.57%2014-15 71746.43 18.62% 39182.19 54.61% 32564.24 45.39%2015-16 78689.47 9.68% 41762.67 53.07% 36926.8 46.93%2016-17 91096.31 15.77% 48602.63 53.35% 42493.68 46.65%2017-18 99948.35 27.02% 52979.53 53.01% 46968.82 46.99%2018-19 110316.4 21.10% 56787.99 51.48% 53528.4 48.52%2019-20 (BE) 124125 24.19% 65502.26 52.77% 58622.74 47.23%
From 2006-07 onwards, assistance to LSG is being classified under “Grant in Aid and Contributions”, Developmental Expenditure of the devolutions to LSGs is also reckoned.
Source: Finance Department, GoK
Figure 1.5.5 Proportion of interest, pension, salary, subsidies, and LSGD devolution in revenue expenditure
Source: Finance Department, GoK

34 Economic Review 2019, Kerala State Planning Board
shows the proportion of committed expenditure of the government on revenue expenditure in 2018. Figure 1.5.6 shows the trend of interest, pension, salaries and subsidies in revenue expenditure.
The revenue expenditure grew to ₹110316.39 crore in 2018-19 as against ₹99948.35 crore in 2017-18. Distribution of the third and the fourth instalments of the arrears of the 10th pay revision and pension revision was the main reason for the hike in revenue expenditure in 2017-18. Other factors that contributed for higher revenue expenditure are government’s priority to impart quality services in health and education sectors and market intervention activities of the government. Details of Revenue expenditure is given in Appendix 1.5.4.
Capital Expenditure Traditionally, share of capital expenditure in total expenditure has been low. The deficit in resources is the major impediment in financing infrastructure projects in the State. Government has therefore adopted alternative policy for financing major infrastructural projects for the sustainable development of the State economy. Alternative development model initiated by the
government have already begun to show positive signs in attracting long term investment in capital projects. Details of capital expenditure and total expenditure are given in the Appendix 1.5.5.
The share of government spending on capital projects in various sectors has increased during recent years. The capital outlay of the State in 2018-19 was ₹7430.54 crore and in 2017-18 it was ₹8748.87 crore. Capital outlay - GSDP ratio has decreased to 0.95 per cent in 2018-19 from 1.25 per cent in 2017-18. Public Works continued to remain the major segment of capital outlay with 26.92 per cent of the total capital outlay in 2018-19 followed by, Agriculture and allied activities (7.32 per cent), Industries and Labour (3.72 per cent) and Irrigation (3.66 per cent). A trend in capital outlay is given in the Table 1.5.5.
Economic Services like Agriculture, Irrigation, and Industries are the dominant components of capital expenditure in the State. In 2017-18, economic services constitute 69 per cent of the total capital expenditure in the State. In 2019-20 (BE) it increased to 75 per cent. The second major component is social sector encompassing education and public health. Figure 1.5.7 shows the trend in the components of capital outlay in the State.
Figure 1.5.6 Trend of interest, pension, salaries, and subsidies in revenue expenditure
Source: Finance Department, GoK

35Chapter 1, Kerala Economy
Debt Profile Borrowings which are repayable and on which interest accrues are classified as debt. Debt of the State comprises of internal debt, loans and advances from the Central Government and liabilities on account of Small Savings and Provident Fund Deposits etc. During the last five years market borrowings and accretions in Small Savings and Provident Fund Deposits are the main sources of the State Government to finance the fiscal deficit. Outstanding debt liabilities of the State in 2018-19 were ₹2,35,631.50 crore. The annual growth rate of debt decreased to
the level of 11.80 per cent in 2018-19 from 13.04 per cent in 2017-18. The Debt-GSDP ratio in 2018-19 was 30.15 per cent, lower than the 2017-18 level (30.69 per cent). The ratio of debt in terms of revenue receipts stood at almost same (253.76 per cent) as the level of previous year (253.87 per cent).
The share of internal debt in the total debt liabilities of the State comes to 64.1 per cent in 2018-19. Outstanding debt under internal debt increased to ₹150991.03 crore in 2018-19 from ₹135500.53 crore in 2017-18. The growth rate of internal debt in 2018-19 was 11.43 per cent. The
Table 1.5.5 Trend in capital outlay, in ₹crore
Year Irrigation Agriculture and Allied Services
Industries, Labour and
Employment
Public Works Others Total
2012-13 340.60 192.11 273.95 2142.92 1653.71 4603.292013-14 342.39 210.62 342.24 1549.43 1849.65 4294.332014-15 270.24 355.90 260.22 1578.94 1789.29 4254.592015-16 526.23 473.08 334.94 2924.26 3241.53 7500.042016-17 674.83 555.62 516.79 3001.88 5376.83 10125.952017-18 544.49 629.83 548.06 2595.57 4430.92 8748.872018-19 271.78 543.95 276.74 2000.48 4337.58 7430.532019-20(BE) 547.71 463.23 587.72 3627.62 11043.10 16269.38
Source: Finance Department, GoK
Figure 1.5.7 Trends in the components of capital expenditure
Source: Budget Document, GoK

36 Economic Review 2019, Kerala State Planning Board
liabilities under small savings, Provident Fund etc. comes to 32.85 per cent of the total liabilities in 2018-19. The outstanding liabilities under loans and advances from the Centre at the end of 2018-19 were ₹7243.41 crore. The gross and net retention of debt in 2018-19 was ₹24189.08 crore and ₹7282.09 crore respectively. Details
of government debt are given in the Table 1.5.6. Composition of government borrowings are given in the Table 1.5.7. Details of Outstanding guarantees are given in the Table 1.5.8. Appendix 1.5.6 shows the debt profile of the State.
Table 1.5.6 Details of Government debts, in ₹ crore
Year Internal Debt Growth Rate
Small Savings, Provident
Fund, Others Growth
Rate
Loans and advances
from Central Government
Growth Rate Total Growth
Rate
2012-13 65628.41 18.47% 31310.65 13.34% 6621.78 3.54% 103560.84 15.82%2013-14 76804.35 17.03% 35542.51 13.52% 6662.21 0.61% 119009.07 14.92%2014-15 89067.91 15.97% 39307.29 10.59% 7065.05 6.05% 135440.25 13.81%2015-16 102496.26 15.08% 47639.36 21.20% 7234.71 2.40% 157370.33 16.19%2016-17 118268.72 15.39% 60571.00 27.14% 7614.14 5.24% 186453.86 18.48%2017-18 135500.53 14.57% 67777.83 11.90% 7483.99 -1.71% 210762.35 13.04%2018-19 150991.03 11.43% 77397.06 14.19% 7243.41 -3.21% 235631.50 11.80%2019-20 (BE) 175976.05 16.55% 79047.87 2.13% 9435.37 30.26% 264459.29 12.23%
Source: Finance Department, GoK
Table 1.5.7 Composition of borrowings of the Government, in per cent
Year Internal Debt Small Savings, Provident Fund, Others
Loans and advances from Central Government
2012-13 63.4 30.2 6.42013-14 64.5 29.9 5.62014-15 65.8 29.0 5.22015-16 65.1 30.3 4.62016-17 63.4 32.5 4.12017-18 64.3 32.2 3.62018-19 64.1 32.8 3.12019-20 (BE) 66.5 29.9 3.6
Source: Finance Department, GoK
Table 1.5.8 Outstanding Guarantees, in ₹ croreYear Maximum Amount Guaranteed Amount outstanding
2011-12 11332.11 8277.442012-13 11482.25 9099.52013-14 12275.21 9763.362014-15 13123.3 11126.872015-16 13712.77 12438.522016-17 20204.1 16245.552017-18 25104.33 17356.472018-19 46795.99 26834.65
Source: Finance Department, GoK
37Chapter 1, Kerala Economy
As taking up the challenge of building a new Kerala is the most significant aim of the government, the State has limitations to reach the fiscal consolidation road map within a short span of time. However, strenuous efforts have to be continued to mobilise resources, prioritise expenditure and to continue the development efforts of the State.

38 Economic Review 2019, Kerala State Planning Board
1.6 Plan Outlay 2019-20
Consequent to the inception of National Institution for Transforming India (NITI) Aayog at the Centre, Government of India did away with the Five-Year Plans. But, Government of Kerala has resolved to proceed with the Five-Year Plan and Annual Plans. The State Planning Board has formulated the 13th Five-Year Plan (2017-22).
The Annual Plan 2019-20 was the third year of the 13th Five-Year Plan. Unwanted or non-productive programmes have been discarded and in view of better coherence, schemes of same common nomenclatures were merged. New schemes have been incorporated on a priority basis as announced in the Budget.
In the Annual Plan 2019-20 the aggregate outlay was ₹39,782.17 crore which includes the State Plan of ₹30,610 crore and Central assistance of ₹9,172.17 crore. The total State Plan outlay for 2019-20 at ₹30,610 crore reflected an increase of 5 percent over the outlay of ₹29,150 crore for 2018-19. Out of the State Plan outlay ₹7,500 crore was earmarked for assistance to Local Governments and the remaining ₹23,110 crore was for State sector schemes. ₹3,002.84 crore was allocated to Special Component Plan (SCCP) and ₹866.26 crore was to Tribal Sub Plan (TSP). An amount of ₹1,643.30 crore was proposed for major infrastructure development projects. ₹3,891.71 crore of State Plan outlay was exclusively earmarked for the benefit of girls/women, which includes ₹5.00 crore for the Trans Gender community. In 2019-20 the total
allocation of resources intended for benefiting children was ₹1,781.52 crore. The sector-wise comparative statement on the outlays of Annual Plan 2018-19 and 2019-20 are given in Table 1.6.1. Digitalisation of Monitoring Mechanism
Plan Space – District Roll out
As a measure to strengthen the Plan monitoring and evaluation mechanism in the State, a software called “PLANSPACE – System For Analysis And Concurrent Evaluation” was developed by the State Planning Board with the technical support of IIITM-K. It is web based online management information system that can monitor and evaluate the progress of implementation of each and every Plan scheme across all departments in the State on a real time basis.
The system captures the relevant details about a Plan scheme/project, its various components, physical/financial progress and implementation status at different levels and generated dynamic, customised reports for various stakeholders. By providing real time information, the system acts as a supporting tool for the Government, State Planning Board, Head of departments, Secretaries and various departments to facilitate and improve the planning and decision making process

39Chapter 1, Kerala Economy
Table 1.6.1 Annual Plan 2018-19 and 2019-20 sector-wise outlay - comparative statement
Sl.No Sector
2018-19 2019-20 percentage increase/
decrease over 2018-19
Outlay CSS Aggregate Outlay CSS Aggregate
1 2 3 4 5 6 7 8 9
IAgricultureand alliedActivities
1,750.80 405.68 2,156.4 1,748.70 379.46 2,128.16 -1.31
II Rural Development 1,183.10 3,278.05 4,461.15 1,690.65 4,282.83 5,973.48 33.90
III Special areaProgrammes 420.68 420.68 283.33 12.00 295.33 -29.79
IVIrrigationand floodControl
557.03 101.57 658.6 517.71 38.03 555.74 -15.62
V Energy 1,784.11 1,784.11 1781.45 0.00 1,781.45 -0.15
VI Industry and Minerals 979.81 979.81 978.69 0.00 978.69 -0.11
VII Transport 1,801.37 1801.37 1,711.16 0.00 1,711.16 -5.00
VIII
Science,Technologyand Environment
1,096.55 154.25 1,250.80 1,074.44 115.56 1,190.00 -4.86
IXGeneralEconomicServices
2,604.97 96.05 2,701.02 2,571.09 91.17 2,662.26 -1.43
X Social Services 9,879.39 4,026.39 13,905.77 9,660.08 4,217.12 13,877.20 -0.19
XI GeneralServices 92.2 36 128.2 92.70 36.00 128.70 0.39
Total-I to XI 22,150.00 8,097.99 30,247.99 22,110 9,172.17 31,282.17 3.42XII LSGD 7,000 7,000 7,500 7,500 7.14XIII RKI 1,000 1,000Grand Total 29,150.00 8,097.99 37,247.99 30,610 9,172.17 39,782.17 6.81
With a view to strengthen the District Level Plan Monitoring System, Planspace has been rolled out to all the Districts in the State in 2015-16. The system enables implementing officers at District and sub-District levels to directly feed in data into the system, thus further enhancing its accuracy and timeliness. The integration of District level data to State level was done in 2017-18.
Planspace has widened its scope of activity to online Plan Submission for departments
from 2014-15 onwards. The departments, after deliberations within their organizations, prepare Plan for every forth coming financial year and submit that to the State Planning Board for further deliberations in connection with the preparation of Annual Plan for the State. The Planspace has provided templates for departments to submit their annual Plan proposals online from 2014-15 onwards. In 2019-20, further features were added in the Planspace to enable the State Planning Board to
40 Economic Review 2019, Kerala State Planning Board
carry out its Plan formulation activities through online, in continuation of the Plan submitted by the departments. The improvements in online Plan Submission has been made so as to capture the objectives, output and outcome of every Plan schemes submitted by the departments.
EDUCATION AND HEALTH: EXTENDING
PUBLIC ACTION
02C H A P T E R


43Chapter 2, Education and Health: Extending Public Action
EDUCATION AND HEALTH: EXTENDING PUBLIC ACTION
02C H A P T E R
Kerala’s achievements in the social spheres — particularly in land reforms, education, and health — have attracted attention from policymakers and academics worldwide. With respect to education, Kerala has the highest levels in India of literacy, school enrolment, and retention for all children and separately for boy and girl pupils, pupils from the Scheduled Castes and Tribes, and rural and urban pupils. In respect of the main indicators of health outcomes – for example, life expectancy at birth, infant mortality, and maternal mortality – Kerala’s achievements are the best in India and drew international attention.
According to data from the National Family Health Survey (NFHS) 2015-16, infant mortality rate (per 1000 live birth) was 5 in rural Kerala. In comparison, infant mortality rates were 67 in rural Uttar Pradesh, 39 in rural Gujarat, and 46 in rural India as a whole. As per the NFHS data, 70.5 per cent of all women in rural Kerala in the age group of 15 to 49 years had completed 10
years or more of schooling. The corresponding proportions were 23.1 per cent in rural Gujarat, 32.6 per cent in rural Maharashtra, 42.9 per cent in rural Tamil Nadu and 27.3 per cent in rural India as a whole (Table 2.1.1). Kerala has been, and remains, the most important example in independent India of the power of public action to improve the well-being of the people and to transform social, political, and cultural conditions in a State.
The Thirteenth Five Year Plan recognized the continued importance of public action in the spheres of education and health, and thereby, in consolidating and deepening the gains Kerala has made in the area of human development. Kerala is entering a new phase with respect to the demands on its educational and health systems. The Approach Paper to the Thirteenth Plan pointed out that public institutions in Kerala must cope up with the changing educational and health needs of a modern society and with the changing demographic structure in Kerala.
Table 2.1.1 Selected indicators achievements in social spheres, Kerala and India, 2015-16 Rural Urban
Kerala India Kerala India
Infant and child mortality (per 1000 live births) 5 46 6 29Women (aged 15-49 years) with 10 or more years of schooling, in % 70.5 27.3 74.1 51.5
Women (aged 15-49 years) who are literate, in % 97.3 61.5 98.4 81.4
Sex ratio at birth for children born in the last five years (females per 1000 males) 1032 927 1062 899
Households using improved sanitation facility, in % 97.5 36.7 98.7 70.3
Source: National Family Health Survey 2015-16

44 Economic Review 2019, Kerala State Planning Board
The Thirteenth Five-Year Plan is committed to restoring the centrality of the public sphere in health and education in Kerala. It aims to create people-friendly systems of health and education, systems on which the people rely and have confidence.
The Government laid out a clear road map in 2016 for building a new Kerala through the four Missions, which included missions for health and education. Today the State Government is investing in new-generation public schools throughout Kerala, with the objective of making the best possible school education available to every child in the State. Government of Kerala has launched schemes to transform the quality of the public sector in health, to improve access and affordability with respect to health care, to expand insurance coverage, and to expand facilities for public health and sanitation. The Haritha Kerala Mission of the State Government aims to enhance cleanliness and environmental health of Kerala’s water systems, and to institute scientific waste management systems in the State. This chapter seeks to review the progress made in the fields of education and public health over the last three years.
EDUCATION
General Education
The main objective of the “Public Education Protection Mission” launched by the Government has been to raise the quality of teaching and learning in schools in the State. The focus has been on the development of school infrastructure as well as enrichment of academic and social aspects of school education. The mission has managed to bring together a wide range of persons, including teachers, parents, alumni, and people’s representatives, towards the goal of creating high quality public educational institutions across the State. One of the first steps taken by the government was to adopt four aided schools (which included Malaaparambu School), which were facing the threat of closure, mainly on account of the commercial interests of certain school managements.
The programme to revive public education in Kerala has led to a huge improvement in enrolment in government and government-aided schools in Kerala. Compared to the previous years, around 1,56,565 new students sought admission in government and government-aided schools in Kerala during the academic year 2017-18. The corresponding numbers were 1,85,971 for the year 2018-19 and 1,63,558 for the year 2019-20 (Table 2.1.2). Such a phenomenon has occurred for the first time in the field of general education in Kerala after the academic year 1991-92 (Figure 2.1.1).
IT-Enabled Education
The high-tech school project aims to ensure IT-enabled education facilities for children in classes VIII to XII. As part of this project, the government supplied 59772 laptops, 43525 multimedia projects, 41789 mounting kits, 41878 HDMI cable, 40616 face plate, 23104 screens, 42739 USB speakers, 4714 DSLR cameras, 4545 LED 42” televisions and 4720 full HD web cams. The beneficiaries were 4752 Government schools in the High School, Higher Secondary and Vocational Higher Secondary streams. Broadband connectivity has been provided to 13980 government and aided schools, including 9941 primary and upper primary schools. In order to set up computer labs in all primary and upper primary schools in the State, an amount of Rupees 292 crore has been granted.
‘Samagra’ e-Resource Portal, a platform to enhance leaning and communication in Hi-Tech classrooms, has been developed. Digital resources for classes 1 to 12, numbering 31031, have been made available in the Samagra resource portal: the resources include 5482 videos, 8271 images, 6476 interactives, 10026 other files and 776 audios. Samagra portal also contains 5.5 lakhs of micro/unit plans and 8.89 lakhs macro plans prepared by teachers. The largest Student IT Network in the Country, “Little KITEs” IT ClubS, has been established in 2060 schools, with 115344 students as its members.

45Chapter 2, Education and Health: Extending Public Action
KITE’s Open Online course (KOOL), an online training programme, has been set up to provide training to teachers, without interrupting that regular working hours in schools. ‘Sametham’ portal provides basic information regarding the schools of the State, including their physical infrastructure and governance mechanisms, approved classes, details of student in each class, and details of teachers and non-teaching staff, to the general public.
Improvement in School Infrastructure
141 schools are raised as the centres of excellence and they are included in KIIFB with an allocation of Rs 5 crore for each school. An amount of Rs 3 Crore is allocated to the project for revamping the basic facilities and 395 schools were included in the project. 446 schools are included in the project to develop the basic facilities for which Rs 1 crore each was allocated.
Figure 2.1.1 Trend of schools enrolment since 1989-90
Source: Director of General Education, 2019
Box 2.1.1 Highlights of Kerala’s recent achievements in education
Total number of students enrolled in schools in Kerala from Standards 1 to 10 was 37.2 lakh in 2019-20. Of these, 31.4 per cent or 11.7 lakh students were enrolled in government schools, 58.1 per cent or 21.6 lakh students in aided schools, and the remaining 10.5 per cent or 3.9 lakh students in unaided schools. Between 2016-17 and 2019-20, the proportion of students enrolled in government schools increased by one percentage point, from 30.4 per cent to 31.4 per cent.
In 2018-19, there were 3.2 lakh students enrolled for higher education programmes (both graduate and postgraduate programmes) in colleges of Kerala in the Arts, Science and Commerce streams. Out of these, 68 per cent or 2.2 lakh students were females. Also, 15 per cent of these students (numbering 48,503) belonged to the Scheduled Castes and Tribes (Scheduled Castes and Tribes, together, accounted for 10.94 per cent of Kerala’s population in 2011).
Of the students who were enrolled in government and aided colleges in Kerala in 2018-19 for engineering graduate degrees, 41.3 per cent were women. Among students who were enrolled for engineering postgraduate degrees in such colleges, 64.9 per cent were women (Table 2.1.3).

46 Economic Review 2019, Kerala State Planning Board
A project to give special recognition to the legacy schools which cross around 200 years is developed. Special financial support is provided to the 150 year old heritage schools. Financial support is also given to 106 higher secondary, 27 VHSE and 181 LP/UP schools in order to improve their infrastructure facilities.
141 RMSA schools are upgraded as Government Schools thereby creating additional posts to settle the scarcity of the teaching and non-teaching staff. The construction of the buildings of 52 RMSA schools have been completed ,with the aid of NABARD , by utilising an amount of 104 crore rupees. Steps are being taken to modernize school libraries and laboratories.
Wiping out Illiteracy
Since Kerala has already achieved universal literacy, recently Kerala State Literacy Mission Authority (KSLMA) has entered into new avenues with focussed and specialised literacy programmes viz., environmental literacy, literacy of SC/ST, literacy programmes for migrant workers, literacy for transgender etc, which are more relevant in the context of Kerala.
Various programmes like ‘Aksharalaksham’ to wipe out illiteracy, ‘Aksharasagaram’ for the coastal regions, ‘Samagra’ for the SC category, ‘Navachetana’ for ST category, ‘changathi’ for migrant labourers from other states, ‘Samanwaya’ for transgenders have been implemented.
Table 2.1.2 New students who sought admission in public funded schools in Kerala, from 2016-17 to 2019-20
Management Standards Total I to X
I II III IV Total (I-IV) V-VII VIII-X I-X
From 2016-17 to 2017-18
Government 5703 3629 3615 2641 15588 5475 38789 59852
Government-aided 6495 6474 6296 5934 25199 58670 12844 96713
Grand Total 12198 10103 9911 8575 40787 64145 51633 156565
From 2017-18 to 2018-19
Government 5784 5815 5603 5729 22931 12229 35484 70644
Aided 4294 8623 8546 7723 29186 67483 18658 115327
Grand Total 10078 14438 14149 13452 52117 79712 54142 185971
From 2018-19 to 2019-20
Government -168 5578 5483 5330 16223 12616 36376 65215
Aided -3222 7626 7742 7266 19412 63312 15619 98343
Grand Total -3390 13204 13225 12596 35635 75928 51995 163558
Source: Directorate of General Education, 2019
47Chapter 2, Education and Health: Extending Public Action
Environmental, constitutional and renaissance values related to democratic educational programmes are being organised as a part of Social literacy programmes.
Education beyond Text Book
In order to give awareness on the bio diversity, agriculture and the environmental issues, Bio-diversity parks have been set up to materialise the concept of ‘Campus a text book’. Bio diversity parks started functioning in 12,000 schools in the State.
The project of setting up the Art, Sports and Cultural Parks is on track with a view to provide a favourable condition to improve the infrastructure facilities that match the Art and Sports education and thereby making the schools basic centres of health-mental-cultural development.
‘SITAR’ an innovative programme is also developed for the students who excel in a particular area of interest and thereby providing
them chance to receive learning experience in many of the professional educational centres in and across the state and country.
Enhancement of Academic Excellence
Measures have been taken to distribute the text books efficiently and in a time bound manner. The text books are printed in 3 volumes so as to reduce the weight of the text books. All the text books for respective academic year are supplied to the schools before the closing date of previous academic year.
Sradha, a programme to support the students from class 3 to class 8, who require additional academic support, has been initiated. 2,60,877 students benefitted out of this scheme last year. As part of sraddha, a special focus on mathematics has been envisaged by providing “operational mathematical skills” to the students who have not attained minimum essentials in mathematics.
Box 2.1.2 Little KITEs IT Clubs
The project, Little KITEs IT Clubs, is an initiative by KITE to instil genuine interest and creativity among students, by providing training in animation, cyber safety, Malayalam computing, electronic hardware, Internet over Things (IoT) devices, and 3D character modelling. With approximately 1.25 lakh student members in over 2060 schools, Little KITEs is the largest ICT network of students in the country. Over 50000 students have been trained in specific areas as part of this initiative. In August 2019, KITE conducted a two-day residential State-level Camp for 1143 Little KITEs, who were champions in the sub-district wise camps where as many as 13440 student members competed. Through Little KITEs, students are trained in Internet of Things (IoT) devices, Blender (FOSS based 3D computer graphics software), Character Rigging (creating 3D models of, for instance, dining table, glass and fruit basket), and 3D animation (solar system, flight of birds). Students themselves designed the characters and created animation for them. They were also given trainin in Mobile App development (torch app, QR Code scanner), electronic voting machines using Raspberry Pi electro brik, IoT device model which enabled operating lights and fans in a network using sound signals and text messages, development of light applications using App Inventor and PyQt servers for creating server, client programmes required for this purpose etc. As part of the Little KITES, Digital Magazines of over 2000 schools have been made available online, which can be viewed from the ‘Digital Magazine’ link in School Wiki portal (www.schoolwiki.in) or through the webportalwww.dm18.kite.kerala.gov.in.
Source: KITE, 2019
48 Economic Review 2019, Kerala State Planning Board
Talent Lab is set up to ripen and identify the various inherent talents in the students. With an intention to develop the creativity of the students, Creative School Project is set up under the leadership of SSA. Ideal Lab Project is set forth to make arrangements for labs in schools which meet an international standard. These labs are set up in four different zones.
SSK has designed several novel learning activities for school children with a view to address learning gaps which are identified in National Achievement Survey of previous year. Focusing on this agenda, several programmes like “Malayalathilakkam” (to enrich the talents of the students in Malayalam language), “Hello English” (to enhance the English language skills in the students), “Sureeli Hindi” (to nurture the Hindi language) have been implemented by the general education department under the Learning Enhancement Programme of SamagraShiksha Kerala. These activities improved the language learning capacity of students and they have the opportunity to acquire knowledge and
communication skills in at least three languages. ‘Kunjuvayana, Kunjezhuthu’ programme is been prepared to attain the mother tongue proficiency in the learners of class I, II and III. The NAS report of previous year had raised concerns that primary students across the country were not achieving the basic learning outcomes and skills in Mathematics before reaching higher classes. Against this backdrop, in schools of Kerala, SSK has implemented the programme “GanithaVijayam” for primary students that firms up mathematical concepts.
‘Sastrayanam’ project is instituted for students who have an extraordinary aptitude in science. ‘Sasthrajalakam’ has been framed for the students who has special fondness to science subjects. ‘Sastrapadham’ is being organised by SSK to inculcate the science aptitude and awareness for the plus one students. Science parks are also set up by SSK for Upper Primary school students.
‘Teacher Transformation Course’ for higher secondary teachers is being conducted in various
Box 2.1.3 ‘Hamari Malayalam’ (Our Malayalam)
Changathi is Kerala State Literacy Mission Authority’s exclusive programme for the migrant workers to make them competent in reading and writing in Malayalam. The project was launched by Hon. Chief Minister of Kerala Sri. PinaraiVijayan on 12th December 12, 2016 in Perumbavur municipality, Ernakulam district, a town with largest migrant labour population in the State. For this programme KSLMA has prepared a text book titled as ‘Hamari Malayalam’ (Our Malayalam) and the lessons of the human rights, Constitutional values, rights of the workers and necessity of a healthy and hygienic living are incorporated in this text book. The book has been designed in such a way that migrant laborers can interact with local people freely and fluently in their daily life. For identifying the migrant workers, a survey was conducted in Perumbavur Municipality and 3211 workers were identified. The classes have been started and 432 migrant workers have registered for ‘Changathi’. Classes are being conducted in 27 batches at various places including madrassa halls, factories, library halls and other public places. On the basis of the success of the programme in Perumbavur, KSLMA has extended the project to all Districts. For the second phase of the programme, one local body from each district has been identified and surveys are being conducted in those selected local bodies. As the second phase of programme, the programme also aims at improving the literacy standards of migrants in Hindi with a view to helping them to adopt a healthy lifestyle. Special committees have been formed in the selected local bodies to reach out to the migrants and enrol them in the programme. This special initiative of the State Government is expected to be beneficial for around 25 lakh workers, who migrated to the State from different parts of the country.
Source: KSLMA
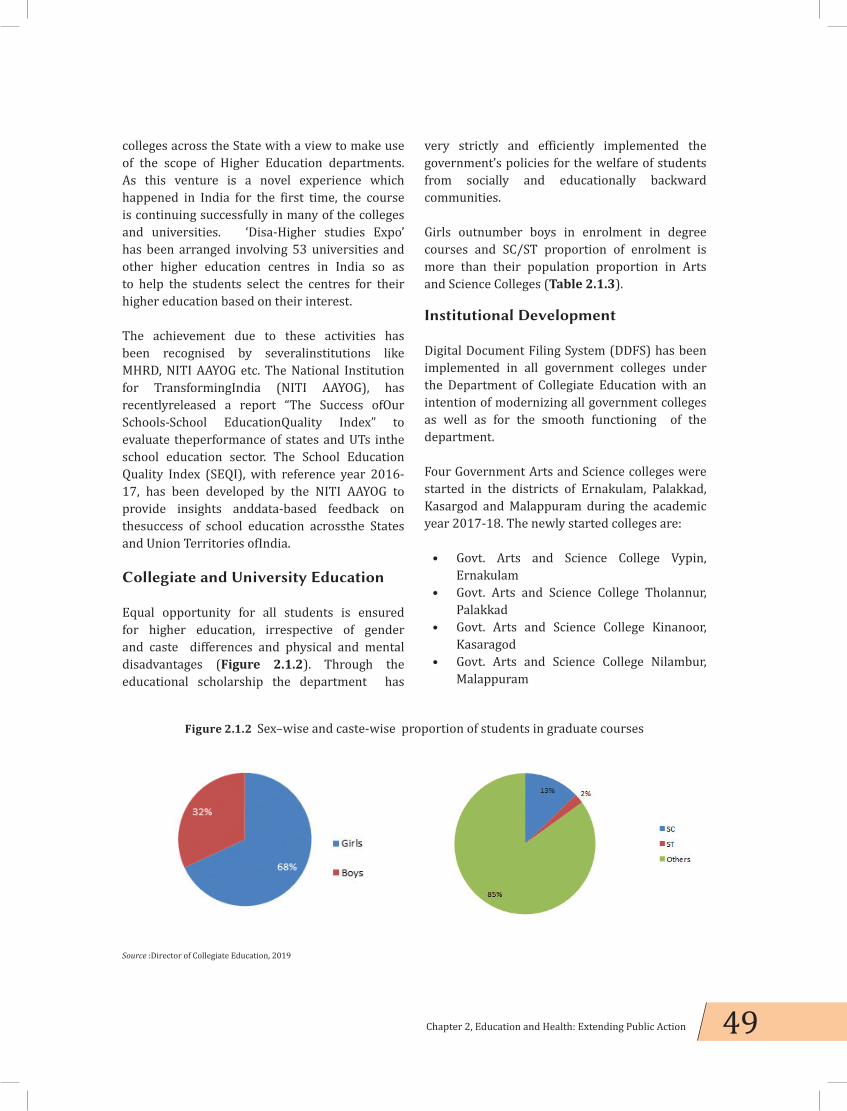
49Chapter 2, Education and Health: Extending Public Action
colleges across the State with a view to make use of the scope of Higher Education departments. As this venture is a novel experience which happened in India for the first time, the course is continuing successfully in many of the colleges and universities. ‘Disa-Higher studies Expo’ has been arranged involving 53 universities and other higher education centres in India so as to help the students select the centres for their higher education based on their interest.
The achievement due to these activities has been recognised by severalinstitutions like MHRD, NITI AAYOG etc. The National Institution for TransformingIndia (NITI AAYOG), has recentlyreleased a report “The Success ofOur Schools-School EducationQuality Index” to evaluate theperformance of states and UTs inthe school education sector. The School Education Quality Index (SEQI), with reference year 2016-17, has been developed by the NITI AAYOG to provide insights anddata-based feedback on thesuccess of school education acrossthe States and Union Territories ofIndia.
Collegiate and University Education
Equal opportunity for all students is ensured for higher education, irrespective of gender and caste differences and physical and mental disadvantages (Figure 2.1.2). Through the educational scholarship the department has
very strictly and efficiently implemented the government’s policies for the welfare of students from socially and educationally backward communities.
Girls outnumber boys in enrolment in degree courses and SC/ST proportion of enrolment is more than their population proportion in Arts and Science Colleges (Table 2.1.3).
Institutional Development
Digital Document Filing System (DDFS) has been implemented in all government colleges under the Department of Collegiate Education with an intention of modernizing all government colleges as well as for the smooth functioning of the department.
Four Government Arts and Science colleges were started in the districts of Ernakulam, Palakkad, Kasargod and Malappuram during the academic year 2017-18. The newly started colleges are:
• Govt. Arts and Science College Vypin, Ernakulam
• Govt. Arts and Science College Tholannur, Palakkad
• Govt. Arts and Science College Kinanoor, Kasaragod
• Govt. Arts and Science College Nilambur, Malappuram
Figure 2.1.2 Sex–wise and caste-wise proportion of students in graduate courses
Source :Director of Collegiate Education, 2019
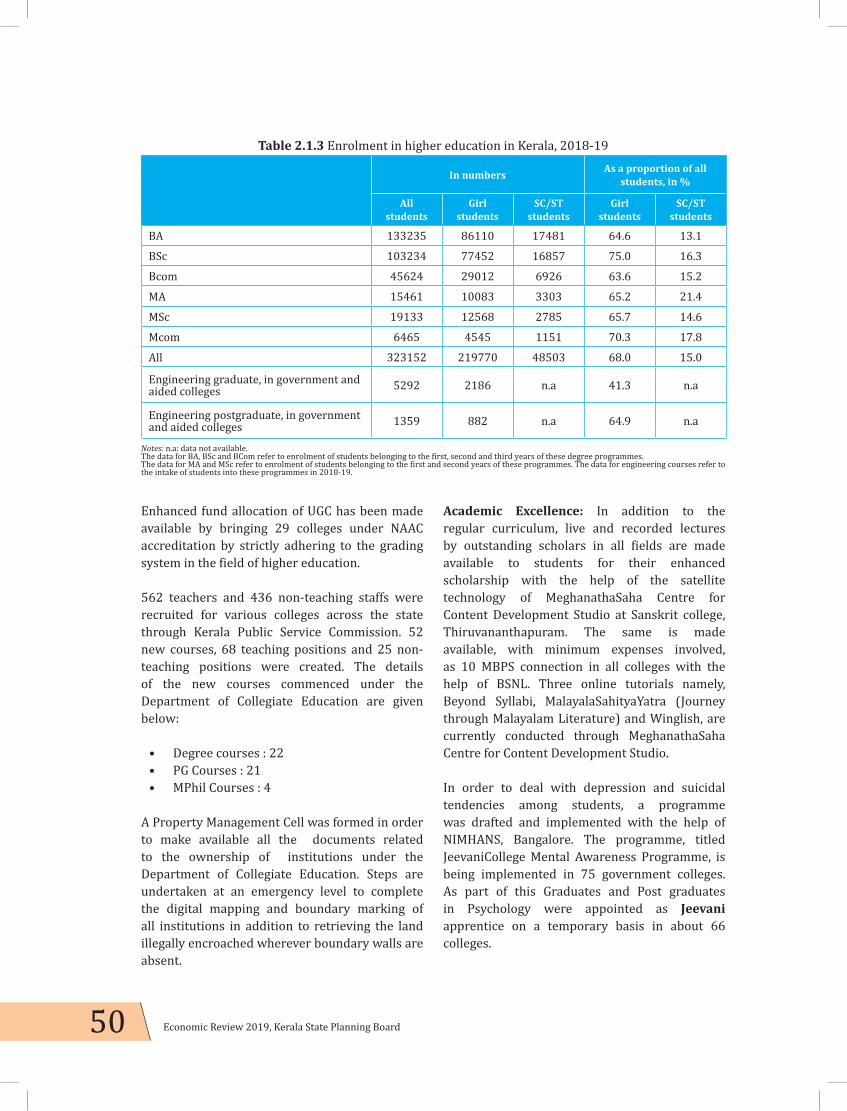
50 Economic Review 2019, Kerala State Planning Board
Enhanced fund allocation of UGC has been made available by bringing 29 colleges under NAAC accreditation by strictly adhering to the grading system in the field of higher education.
562 teachers and 436 non-teaching staffs were recruited for various colleges across the state through Kerala Public Service Commission. 52 new courses, 68 teaching positions and 25 non-teaching positions were created. The details of the new courses commenced under the Department of Collegiate Education are given below:
• Degree courses : 22• PG Courses : 21• MPhil Courses : 4
A Property Management Cell was formed in order to make available all the documents related to the ownership of institutions under the Department of Collegiate Education. Steps are undertaken at an emergency level to complete the digital mapping and boundary marking of all institutions in addition to retrieving the land illegally encroached wherever boundary walls are absent.
Academic Excellence: In addition to the regular curriculum, live and recorded lectures by outstanding scholars in all fields are made available to students for their enhanced scholarship with the help of the satellite technology of MeghanathaSaha Centre for Content Development Studio at Sanskrit college, Thiruvananthapuram. The same is made available, with minimum expenses involved, as 10 MBPS connection in all colleges with the help of BSNL. Three online tutorials namely, Beyond Syllabi, MalayalaSahityaYatra (Journey through Malayalam Literature) and Winglish, are currently conducted through MeghanathaSaha Centre for Content Development Studio.
In order to deal with depression and suicidal tendencies among students, a programme was drafted and implemented with the help of NIMHANS, Bangalore. The programme, titled JeevaniCollege Mental Awareness Programme, is being implemented in 75 government colleges. As part of this Graduates and Post graduates in Psychology were appointed as Jeevani apprentice on a temporary basis in about 66 colleges.
Table 2.1.3 Enrolment in higher education in Kerala, 2018-19
In numbers As a proportion of all students, in %
All students
Girl students
SC/ST students
Girl students
SC/ST students
BA 133235 86110 17481 64.6 13.1
BSc 103234 77452 16857 75.0 16.3
Bcom 45624 29012 6926 63.6 15.2
MA 15461 10083 3303 65.2 21.4
MSc 19133 12568 2785 65.7 14.6
Mcom 6465 4545 1151 70.3 17.8
All 323152 219770 48503 68.0 15.0
Engineering graduate, in government and aided colleges 5292 2186 n.a 41.3 n.a
Engineering postgraduate, in government and aided colleges 1359 882 n.a 64.9 n.a
Notes: n.a: data not available.The data for BA, BSc and BCom refer to enrolment of students belonging to the first, second and third years of these degree programmes. The data for MA and MSc refer to enrolment of students belonging to the first and second years of these programmes. The data for engineering courses refer to the intake of students into these programmes in 2018-19.

51Chapter 2, Education and Health: Extending Public Action
Technical Education
The Government of Kerala has initiated variousschemes for strengthening the technical education scenario in the state to achieve national eminence. The department of technical education is entrusted with the implementation of these activities aimed to produce technocrats with social commitment along with improving the academic standards. Along with the modernization of the curricula for diploma and certificate courses, the department also takes care to train students to be able to try their niche in entrepreneurship/startup ventures.
Institutional Development
There are 9 Government Engineering Colleges, 45 Government Polytechnic Colleges, 3 Fine Arts Colleges and 39 Technical High Schools under the department. The general improvement in infrastructural facilities of the class rooms, sufficient hostel accommodation, procurement of state of the art equipmentsfor the laboratories,provision for state of the art facilities like digital / E-libraries, promotion of research facilities and facility for co-curricular/ extracurricular activities, and land acquisition are being done to elevate the institutions to the highest plane of excellence, so that the institutions could churn out quality professionals.
During the last two years, focus is given to waste water management, drinking water facilities, Rain water harvesting, non- conventional energy generation initiatives, energy conservation and research in other areas of social relevance.
• Inauguration of New Buildings- Architecture Block and Hostel block at College of Engineering Thiruvananthapuram, New buildings at CPT-Thiruvananthapuram, GPC-Cherthala, GPC-Kalamassery, GPC- Meppady, GPC-Kaduthuruthy and WPC-Kalamassery and New Building at THS, Adimali.
• Rain water harvesting system at Govt. Engineering College, Palakkad is under the process of realization, ensuring ground
water recharging for the entire area.• Solar Power plants are established
at College of Engineering Thiruvananthapuram, Govt. Engineering College, Kannur, Govt. Engineering College, Thrissur as part of the non conventional energy initiatives of the Directorate.
Research and other Academic Initiatives
Re-usable Building system at Rajiv Gandhi Institute of Technology, Kottayam, Centre for Bamboo Technology at Govt. Engineering College, Barton Hill, Rural Technology Development Centre at Govt. Engineering College, Kannur and Transportation Research Centre and Product Design and Development Centre at College of Engineering, Trivandrum, are some of the research and application initiatives undertaken by the department.
The Directorate of Technical Education has started to establish Interdisciplinary Research Centers in all Govt. Engineering Colleges in specific areas identified by the host institution, in a phased manner. The centres are envisaged to act as platforms to facilitate and promote interdisciplinary research among the faculty members, so as to emerge with quality research outputs useful for the society. As a pilot project in this direction, College of Engineering, Trivandrum has started work on launching a student satellite. A nodal Centre for Robotics and AI is set up at Government Engineering College, Thrissur.Centre of Excellence in Systems, Energy and Environment is under the process of setting up in GCE Kannur.
To expose students to the latest development in technology and to improve the teaching-learning process through hands - on training, the department had set up Production and Training Centres, Material Testing Centres and Robotic Laboratories at various institutions.
Entrepreneurial initiatives are channeled through the Technology Business Incubation Centres

52 Economic Review 2019, Kerala State Planning Board
functioning at all Government Engineering Colleges and selected Government Polytechnic Colleges and also encouraged through collaboration with Kerala Start-up mission.
Care is taken to train the teachers to keep their knowledge level up to date and to encourage them to pursue higher studies.In connection with this, an Academic Staff College and Internal Quality Assurance Centre under the Directorate has started functioning in 2018-19.
The service of student volunteers is extended to the society through the indigenous “Punarjjani” scheme, under NSS Technical Cell. The NSS volunteers from all the institutions under Technical cell put enormous work in flood relief activities in various parts of the state.
Inorder to conduct survey of damages caused by the floods in august 2018, based on the directions given by the Government, 55,000 volunteers from the technical institutions in the state were mobilized through a dedicated web portal designed for this purpose by the Directorate of Technical Education. The service of 31000 student volunteers from Polytechnic colleges and Engineering Colleges were provided by DTE, as per the request from the LSGD, who had successfully completed the survey of around 2 lakh houses in the format given by the Chief Engineer, LSGD within the given time frame.
• Nine Patent Applications filed by faculty and students and one patent has been awarded.
• The process of forming Robotic clubs at all Govt. Technical High Schools in the state is in the final stage. This dedicated workspace is aimed to expose the students to latest technology trends at school level. Realized projects will have a separate competition in the state level science and technology fair for Technical High Schools.
• Advance fabrication labs are under the process of setting up at selected Govt. Polytechnic Colleges, to acquaint students with state of the art equipments
(3D printers, robotics and electronics development tools, IoT, etc) and to bring latest technology to Diploma level education in the state.
• Govt. Polytechnic College, Palakkad had signed MoU with Kerala Startup Mission for setting up a Mini-Fablab in the campus.
HEALTH
State Health Policy
The GoK constituted a 17 member panel headed by Dr B Ekbal, Member, State Planning Board to draft a new health policy for the State. The Committee held sittings in different Districts to get the opinions and suggestions from the common man regarding their needs in the health sector and held consultations with all the experts, professionals and people who are closely associated with the health sector before finalising the draft. The committee laid emphasis on strengthening the primary health sector of the State, which would play a pivotal role in detection of the diseases and the need for strengthening disease surveillance at the grass root level to prevent the spreading of epidemics. Apart from strengthening the treatment facilities, the committee looked into the need for giving thrust for disease prevention. The policy envisages establishing a publicly funded, free, universal and comprehensive health care system, bringing infant, child and maternal mortality to levels in developed countries and to increase the healthy life expectancy of the population. The draft report is submitted to the Government for further action.
Aardram Mission
The Aardram Mission has been launched in the health sector to make government hospitals people-friendly by improving their basic infrastructure and capacity to provide services. Many of the government hospitals are overcrowded with patients. But they can be made people-friendly to a large extent by ensuring quality health care with minimal waiting time

53Chapter 2, Education and Health: Extending Public Action
for outpatient medical checkup and other investigation facilities. This would also enable to provide adequate attention to inpatient services. Aardram Mission will be implemented in three stages in government medical college hospitals, district hospitals, taluk hospitals and primary health centres (PHCs). The conversion of PHCs as family health centres (FHCs) with adequate supply of drugs and assured treatment protocols would ensure better health among people and enhance their trust in the public health system. The mission aims to improve the efficiency of service and facilities in the government hospitals with a view to extend treatment at a reasonable cost, time and satisfaction. Following are the major objectives of the mission.
1. Patient friendly transformation of the outpatient (OP) wings of medical college hospitals and other Government hospitals.
2. Standardisation of the district and taluk level hospitals.
3. Developing the PHCs into FHCs in a phased manner.
4. Ensuring protocol based treatment guidelines in the management of patients in hospitals.
Family Health Centers
In the first phase Government identified 170 PHCs covering all 14 districts for developing into Family Health Centers in 2017-18. Additional posts of one medical officer, two staff nurses and one lab technician each were created and postings were done with the result that there will be a minimum of 3 doctors and 4 nurses in the FHCs. Details of additional posts created under Aardram Mission is given in the Table 2.1.4.
160 FHCs are already made functional and the rest is progressing. In the second phase in 2018-19, 504 PHCs were selected for developing into FHCs in which 44 are completed and works are progressing in other PHCs in different stages. Transformation of the PHCs into FHCs has evoked encouraging community response. In third phase, 220 PHCs has been selected for developing as FHCs.
Service delivery of these institutions in terms of clinical care and public health activities have been augmented and outpatient care is provided in the afternoon upto 6.00 PM. Through the implementation of e-Health project it is expected to further develop individual patient care Plan and family health Plan based on family health register data. Registration procedure for e-Health services has already been initiated. Ward and panchayat level health plan focusing on preventive, promotive and rehabilitative health care services would be developed in association with panchayats and with public participation. A new health volunteer system called Arogyasena is being launched as part of Aardram mission. Public health interventions focusing on the reorganisation of the primary health care system based on the epidemiological needs of the Kerala society especially combating the challenge of non-communicable diseases is a focus area of the programme. Treatment guidelines for 53 common medical conditions to be managed at PHC level have been prepared and made available for Medical Officers.
Training status
Revised job responsibilities and FHC transformation guidelines have already been
Table 2.1.4 Details of additional posts created under Aardram MissionCategory First Phase Second Phase
Medical Officer 170 400Staff Nurse 340 400Pharmacist 150 0Lab Technician 170 200Total 830 1000
Source :Directorate of Health Service

54 Economic Review 2019, Kerala State Planning Board
prepared and module based trainings have been initiated for major categories of staff. Providing comprehensive and continuous training for all category staff is the policy of thegovernment in the context of the mission to ensure quality of service delivery. To achieve this, SHSRC Kerala has been entrusted with the responsibility of training. Three types of training are ongoing viz. Team Building training, Concept based training and Skill training.
Aswasam clinics
Aswasam Depression management in Primary Care was started in 170 Family Health Centres across the State. Health workers and staff nurses were trained in screening using PHQ9 and psychological first aid, while doctors were trained in diagnosis and management of depression at Primary Care. Referral Protocol for cases to be seen by DMHP psychiatrist is included in the programme. SWAAS clinics started in 178 Family Health Centres and 39 Sub Districts / District Hospitals. Number of COPD diagnosed from august 2018 to September 2019 was 13126 and Number of Asthma diagnosed 8011.
Kerala COPD Prevention and Control Program – SWAAS
Chronic Obstructive Pulmonary Disease (COPD) is one of the leading causes of mortality and morbidity worldwide. Kerala has taken the bold step of formulating COPD prevention and control programme in the country for the first time and the official declaration of the programme was done by the Honourable Minister for Health and Family welfare on February 7, 2017. SWAAS programme is implemented from Family Health Centre level onwards in Kerala as part of Aardram Mission. Proper training has been given to the medical and paramedical staff of all the FHCs.. The objectives of the Kerala COPD prevention and control programme would be identification of COPD in the early stages of the diseases, develop a structured programme for COPD diagnosis and treatment and develop a system for generating information on disease burden of COPD which
will aid in further planning and strategizing for COPD.
Patient friendly transformation of the outpatient wings of Government hospitals
Considering the fact that medical college hospitals and district level hospitals are larger institutions providing outpatient care for a large number of patients every day, patient friendly transformation of the outpatient wings of these hospitals were taken as a priority item under Aardram Mission. Outpatient transformation with adequate OP registration counter, patient waiting area, adequate seating facility, token system with other amenities like drinking water, toilet facilities, public address system, information education and communication arrangements and signage systems are being incorporated. Support of patient care coordinators for larger institutions on a temporary basis would also be provided. For ensuring quality medical care, OP computerisation, providing adequate facilities in the consultation rooms and a guideline based case management are planned. These are being implemented in government medical college hospitals and at district level hospitals.
People friendly OP transformation of General/District /Taluk Hospitals
There are a total of 18 General hospitals and 18 District hospitals in the state. Out of this only 17 institutions have been selected for OP transformation (one hospital each in 11 districts and two hospitals from Kannur, Kasargod and Wayanad districts). The construction work of 7 hospitals has been completed.The work in other hospitals is progressing well. Out of the total 86 taluk hospitals, 75 institutions are selected for standardization in a phased manner. Post creation in District/General/Taluk hospitals during 2017-18 is given in the Table 2.1.5.

55Chapter 2, Education and Health: Extending Public Action
New initiatives taken in Medical Colleges
Aardram Mission is aimed to provide patient friendly and quality care services to the outpatient wing of Medical Colleges. As a first step Medical Colleges at Trivandrum, Paripally, Alappuzha, Kottayam, Ernakulam, Thrissur, Malappuram and Kozhikode were selected for the implementation of OPD Transformation .Presently the works in 8 Medical Colleges has been completed. The main components of the projects are to make online registration so that patient need not spend more time at hospital, constructing new OP waiting areas, providing drinking water facilities, renovation/ reconstruction of toilet blocks, OP rooms for all departments, proper signage’s to different services, TV and display board, airport Chairs, PA system, providing air conditioners in OP rooms, providing ramp, etc.
Aardram People’s Health Campaign
Aardram Peoples Health Campaign was launched on 18th November 2019. Following the state level launch district level and LSG level launching of the campaign have been started in all districts. This state-wide campaign will be implemented locally under the leadership of respective LSG and Heath & Family Welfare Department with active involvement of Missions, line departments / agencies, NGOs, CBOs etc. Local level implementation of the campaign starts from the ward level under the leadership of expanded Ward Health Sanitation and Nutrition
Committee (WHSNC). At the Panchayath / Block / Urban area level it will be under the leadership of expanded Arogya Jagratha Committee. District level implementation will be through the coordination of LSG level committees, existing District Health and Family Welfare Society, district Aardram Task force headed by District Panchyath President, District Collector and DMO (Health). Minister in charge of the district, MP and MLA of the districts would be the chief patrons of the district level committees. At the state level, leadership and guidance for the campaign will be given by Nava Kerala Karma Padhadthi Committee Chaired by Hon’ble Chief Minister along with other Hon’ble ministers and other members. State level Implementation committee is functioning under the leadership of Hon’ble Minister for Health as Chairperson and Principal Secretary (Heath) as Vice Chairperson. Following are the five areas of focus in this people’s campaign:
1. Preventive & promotive health and improvement in health seeking behaviour.
2. Healthy Food3. Exercise & physical activity promotion4. Mental health and de-addiction (Alcohol,
smoking and substance abuse)5. Cleanliness and waste disposal
Nipah Virus Disease outbreak in Kerala
The disease surveillance system has been functioning extremely well in Kerala, with a robust mechanism for early recognition of any communicable disease of epidemic potential,
Table 2.1.5. Post creation in District/General/Taluk hospitals during 2017-18Category Number
Super Specialists 14Specialists & Casualty Medical Officers 252Staff Nurse 197Lab Technician 84Paramedical Staff 344Total 891
Source : Directorate of Health Service

56 Economic Review 2019, Kerala State Planning Board
with speedy response to control and prevent its spread. This aspect has been proved once again with the incident of detection in the Districts of Kozhikode and Malappuram and prompt response to the first ever Nipah virus disease outbreak in the State which started in May 2018. This has been appreciated by various experts in the field of communicable disease surveillance and control, including GoI and World Health Organisation (WHO).
All contacts of the confirmed/probable cases including the health care providers of various health facilities were listed out, monitored for their health status daily, samples were tested in probable cases, and continuously monitored till they came out of the maximum incubation period. Central surveillance unit and Ministry of Health and Family Welfare were informed on a daily basis the sequence of events. Expert teams from Delhi, Chennai, Pune and Manipal reached the District for onsite assistance and evaluation of activities. The observations to identify the possible source of infection were on par with the experience on Nipah outbreaks in Malaysia and Bangladesh, as well as north eastern parts of West Bengal, where the prominent reservoir hosts were fruit eating bats.
The disease was previously reported from Asian countries like Malaysia and Bangladesh from 1998 onwards and also recurrent outbreaks have been reported from parts of West Bengal in India from 2001 onwards. But in South India, this was the first instance, and Kerala’s disease surveillance system could detect the outbreak in shortest possible time. The outbreak response activities undertaken by Kerala’s health system contained the outbreak in a shortest time of 10 days, though we lost very precious 16 lives during the period. The administrative leadership, the political commitment, community’s cooperation and the health systems resilience have contributed to this remarkable outbreak response.
In May 30, 2019 received information on a probable Nipah Virus disease from a private
tertiary care hospital (Aster Medicity Hospital) from Ernakulam. The case was subsequently confirmed from National Institute of Virology Pune appropriate response action was taken. Numbers of suspect cases were 7 and all tested negative. No death reported during the period affecting Nipah Virus disease.
Health system response in flood in Kerala
The impact of the floods on the health system is multi-fold. It presents varied and considerable health challenges, often lasting for years after the disaster. The contamination of water from mixing of sewage, other waste materials and rodent secretions, water logging, crowding of displaced population in shelters, lack of proper nutrition and sanitation increase the risk of communicable diseases in the after-math of a flood. Outbreaks of water-borne diseases like diarrhoea, cholera, hepatitis A and leptospirosis have been reported from such events in both developing and developed countries. The disaster was way beyond the health system preparedness and resources, as the scale of the disaster was unlike any other in the past 90 years. The magnitude of flood was also wide scale with 13 out of the 14 Districts in the State affected by floods. Health care institutions themselves suffered complete/partial destruction and loss of equipment and supplies. The health department worked in co-ordination with the rescue efforts at all levels. Primary response of the health system was on limiting the morbidity and mortality during and after the disaster through co-ordinated action with the rescue and relief teams. To co-ordinate the health system efforts in the situation, a 24x7 Disaster Control Room was set up at the Directorate of Health Services. The risk of injuries, various communicable diseases and mental health problems in the affected population were assessed by the public health team with the assistance of supporting agencies. Communicable diseases like Water-borne diseases (acute diarrhoeal diseases, hepatitis A, hepatitis E, leptospirosis etc), mosquito bone diseases etc. were anticipated, considering

57Chapter 2, Education and Health: Extending Public Action
the extent of the floods but no outbreak occurred, except for a few cases of leptospirosis occurred, which too was far below the scenario anticipated. This points to the effectiveness of the preventive measures taken. Problems arising due to loss of medical records and discontinuation of treatment including dialysis and chemotherapy were identified and measures taken to minimise the same. Health care needs of vulnerable groups including children, women, elderly and patients on palliative care were also forecasted. In the post flood period, the areas of action included cleaning, prevention of water-borne diseases, prevention of food poisoning, control of leptospirosis, prevention of other communicable diseases, control of mosquito-borne diseases, control of non-communicable diseases, psychological issues, other anticipated health issues, behavioural change communication, disease surveillance and reporting, legal interventions, and other supporting activities carried out. Public health activities in the flood after-math comprised of monitoring and evaluation of the public health situation, risk assessment including outbreak-prediction, identification of possible solutions and requirements and assisting in the implementation of the necessary actions with inter-sectoral co-ordination.


AGRICULTURE AND ALLIED SECTORS
03C H A P T E R


61Chapter 3, Agriculture and Allied Sectors
AGRICULTURE AND ALLIED SECTORS3.1 Agriculture
03C H A P T E R
Agricultural performance is subject to year to year fluctuations because of vagaries of nature as well as price volatility. The agricultural sector in Kerala has undergone significant structural changes in the form of decline in share of Gross State Domestic Product indicating a shift from the agrarian economy. The natural disaster that hit the State in the form of floods and landslide wreaked havoc, affecting agricultural sector the most. Crops were most heavily affected, contributing to 88 per cent of the total loss and damage to the sector.
Trends in Growth Rate
Agriculture is a pivotal sector for the economy to achieve the Sustainable Development Goals (SDG) of no poverty, zero hunger, good health and wellbeing. With decline in the size of land
holdings in agriculture, State has to focus on production, productivity and profitability to attain the SDG targets and sustainability in agriculture.
At national level, the share of agriculture, forestry and fishing sector in GVA has shown decline over the years from 17.8 per cent in 2012-13 to 14.9 per cent in 2017-18. The share of crops in GVA declined from 11.5 per cent in 2012-13 to 8.7 per cent in 2017-18. However, the importance of agriculture for the livelihood of the rural population and food security of large masses is significant in the economy.
The agriculture sector in Kerala has been facing challenges with regard to its growth. According to the data from the Directorate of Economics and Statistics (DES), the annual growth rate (GSVA at
Table 3.1.1 Share of agriculture and allied sectors in GVA/GSVA National and State level, constant prices 2011-12
Year Share of Agriculture and allied sectors in Total GVA (India) (%)
Share of Agriculture and allied sectors in GSVA (Kerala) (%)
2013-14 17.7 12.37
2014-15 16.5 11.92
2015-16 15.4 10.74
2016-17 15.2 9.96
2017-18 14.9 9.48 (P)
2018-19 n. a. 8.77(Q)
Note: (P) Provisional, (Q) Quick n. a. not availableSource: National Accounts Statistics 2019, GoI; Directorate of Economics and Statistics, GoK

62 Economic Review 2019, Kerala State Planning Board
constant 2011-12 prices) of agriculture and allied activities (including crop, livestock, forestry and logging and fishing and aquaculture) was (-)6.31 per cent in 2013-14, 0.02 per cent in 2014-15, (-)5.10 per cent in 2015-16 and (-)0.65 per cent in 2016-17. The sector witnessed a growth of 1.72 per cent in 2017-18. But the growth declined to (-)0.52 per cent in 2018-19. The all India growth rate of agriculture and allied sectors was 5.6 per cent, (-)0.2 per cent, 0.6 per cent, 6.3 per cent and 5.0 per cent in 2013-14, 2014-15, 2015-16, 2016-17 and 2017-18 respectively. The share of Agriculture and allied sectors in total GSVA (at constant 2011-12 prices) of the State has witnessed a secular decline from 12.37 per cent in 2013-14 to 8.77 per cent in 2018-19. Details are provided in Table 3.1.1.
Monsoon 2019
The pre monsoon rainfall received in the State from March 1, 2019 to May 31, 2019 was normal with a departure of (-) 56 per cent from the normal. The actual rainfall received during the period was 169.1 mm. All the Districts except Wayanad recorded deficient rainfall. The percentage departure from normal was highest in Alappuzha and Kasargod (-)77per cent, Kannur
(-)76 per cent and Kozhikode (-)75 per cent Districts.
The actual rainfall received in Kerala during the southwest monsoon season (June 1 to September 30, 2019) was 2,300.2 mm as against the normal rainfall of 2,038.7 mm which was 12.8 per cent departure from the normal. During the previous southwest monsoon (2018) Kerala had received an actual rainfall of 2,515.7 mm. Eleven Districts in the State received normal rainfall in 2019, while Thiruvananthapuram, Palakkad and Kozhikode Districts received excess rainfall. Kozhikode District received the highest rainfall (Figure 3.1.1).
During the northeast monsoon season 2019 (October 1 to December 31, 2019) the State received 638.3 mm of rainfall as against 492.7 mm of normal rainfall which was excess with a percentage departure of 29.6 per cent from the normal. Eleven Districts in Kerala received excess rainfall during this season except Thiruvananthapuram, Kollam and Idukki which recorded normal rainfall. Percentage departure from the normal was highest in Kasaragod District (83 per cent) followed by Kannur and Ernakulam Districts and both showed a deviation
Figure 3.1.1 Southwest monsoon rainfall received from June 1 to September 30, 2019
Source: Indian Meteorological Department

63Chapter 3, Agriculture and Allied Sectors
of 62 per cent and 56 per cent from the normal rainfall respectively (Figure 3.1.2). District-wise rainfall distribution in the State in 2019 is given as Appendix 3.1.1.
Floods 2018
In the month of August 2018, the State of Kerala received very heavy rainfall, which led to unprecedented flooding throughout the State. Crops were most heavily affected, contributing to 88 per cent of the total loss and damage to the sector. The total effect of Kerala floods on Agriculture and Allied sector (crops. livestock and fisheries) is ₹7,154 crore. Estimated production losses in the crop sub sector are at ₹3,558 crore across 89.6 thousand hectares which is 4.44 per cent of the net cropped area. The monsoon caused significant loss in banana accounting for 40 per cent of total crop losses, followed by pepper (19 per cent) and paddy (14 per cent). About 36.74 per cent of the net cropped area of Wayanad and 17.59 per cent of that in Alappuzha was damaged. Perennial and annual crops, such as banana, coconut, arecanut, pepper and coffee were the most impacted. Seasonal crops, such as rice, vegetable, tapioca and other tuber crops also suffered significant losses.
Damages to the crop sector have been estimated at ₹2,722 crore, representing 91.5 per cent of total damage to the agriculture sector. About 30,945 ha of perennial crops were destroyed with pepper, arecanut, banana, and coconut being the worst.
Soil was also severely affected by rains and debris slides in Wayanad and Idukki, Kozhikode and Kannur. The damage to soil is estimated at ₹320.2 crore, with Wayanad District being the worst of due to landslides (Kerala Post Disaster Needs Assessment – Floods
and Landslides, August, 2018).
Land Use
Kerala has witnessed major changes in its land use pattern over the years. The major change being the shift from cultivation of food crop to nonfood crops and increase in area under nonagricultural use. Changes in land use and cropping pattern in Kerala pose a challenge not only to food security but also to the ecological sustainability of the State. An analysis of changes in land use pattern over a period helps us to comprehend the present scenario of agricultural land utilisation. Data on land use pattern for the year 2018-19 is given in Appendix 3.1.2.
Figure 3.1.2 Northeast monsoon rainfall received from October 1 to December 31, 2019
Source: Indian Meteorological Department

64 Economic Review 2019, Kerala State Planning Board
As per the land use data of 2018-19, out of a total geographical area of 38.86 lakh ha, total cultivated area is 25.68 lakh ha (66 per cent) and the net area sown is 20.44 lakh ha (53 per cent). Land put to non-agricultural use stands at 12 per cent and forest area is 28 per cent. The cultivable waste and current fallow constituted 2 and 1 per cent respectively which is lower than 3 per cent and 2 per cent in 2017-18.
As compared to 2017-18, there is a decline in area under barren and uncultivated land, fallow other than current fallow and current fallow by 5.6 per cent, 8 per cent and 0.1 per cent respectively. The net area sown increased by 0.2 per cent.
The total cropped area and area-sown more than once declined by 0.4 per cent and 3 per cent respectively. This decline in total cropped area and area sown more than once may be due to the deluge that hit the State in 2018-19. The land put to non-agricultural uses has increased by 3 per cent. The land use pattern is shown in Figure 3.1.3.
The total number of operational holdings in the State has increased from 6,831 thousand in
2010-11 to 7,583 thousand in 2015-16 showing an increase of 11 per cent. The average size of operational holding has declined to 0.18 ha. in 2015-16 as compared to 0.22 ha in 2010-11 Appendix 3.1.3.
Cropping Pattern
The diverse topographic, climatic and soil related conditions in Kerala enable its people to cultivate both cash crops and food crops. Data regarding the area, production and productivity of important crops grown in Kerala are shown in Appendix 3.1.4.
Food crops comprising rice, tapioca and pulses accounted for just 10.15 per cent of the total cropped area in 2018-19 while cash crops (cashew, rubber, pepper, coconut, cardamom, tea and coffee) constituted 62.1 per cent. The area under crops like rubber, coffee, tea and cardamom was 27.7 per cent of the total cropped area.
Coconut occupies the largest area with 29.6 per cent coverage followed by rubber with 21.5 per cent. Rice comes third with 7.7 per cent of the total cropped area. The food crops recorded
Figure 3.1.3 Land use pattern of Kerala, 2018-19
Source: Directorate of Economics and Statistics

65Chapter 3, Agriculture and Allied Sectors
decline in area in 2018-19 except for rice which showed an increase of 4.7 per cent. Among other major crops, except for coconut, arecanut, tea and other plantains, all other crops recorded a declining trend in area under cultivation. The increase in area under coconut is 0.06 per cent. Tea recorded the highest increase in area with 20.8 per cent over 2017-18. The area under coffee and rubber remained the same.
Crop-Wise Analysis
Rice
Rice is the major food crop cultivated in the State occupying 7.7 per cent of the total cultivated area. On analysing the area under cultivation for the last 10 years, the area under paddy cultivation was highest in 2009-10 recording an area of 2.34 lakh ha with a production of 5.98 lakh tonnes. The area and production of paddy in 2018-19 has declined by 15 per cent and 3.5 per cent respectively compared to 2009-10.The productivity of rice had shown an all-time increase of 2,920 kg per ha over the last ten years which is 14 per cent increase over 2009-10.
The area under paddy cultivation in Kerala in 2018-19 was 1.98 lakh ha which is 4.7 per cent increase over 2017-18. The production and productivity, increased by 10.9 per cent (5.78
lakh tonnes) and 5.9 per cent (2920 kg/hectres)respectively compared to 2017-18 Appendix 3.1.5.
There are three main rice growing seasons in the State: (a) Virippu season/Autumn season/First crop season, which starts in April-May and extends up to September-October; (b) Mundakan season/Winter season/Second crop season, which starts in September-October and extends up to December-January; and (c) Puncha season/Summer season/Third crop season, which starts in December-January and extends up to March-April. Season-wise trends reveal that the area under Virippu and Mundakan has increased and Punja crop area has declined over the previous year (Figure 3.1.4). But the increase in area under Virippu crop is not reflected in its production showing a decline of 31.5 per cent over 2017-18. Mundakan and Puncha crop showed an increasing trend in production and productivity compared to 2017-18. The productivity of Puncha was the highest among the three seasons and 2018-19 recorded the highest yield over the last three years. Mundakan crop is prominent in the State (Appendix 3.1.6). While Puncha crop is dominant in Alappuzha District, Mundakan and Virippu crop is prominent in Palakkad District Appendix 3.1.8.
Figure 3.1.4 Season-wise area and production of rice in Kerala, 2016-17 to 2018-19
Source: Directorate of Economics and Statistics

66 Economic Review 2019, Kerala State Planning Board
Palakkad, Alappuzha, Thrissur and Kottayam accounted for about 80 per cent of the total area of rice in the State, their individual shares being 39 per cent, 19.5 per cent, 11.1 per cent and 11.2 per cent respectively. These Districts contributed 82 per cent of the total rice production in the State. Palakkad and Alappuzha Districts stood first and second with respect to area and production of rice in the State. But with respect to productivity, Pathanamthitta and Alappuzha hold the first and second position with an increase of 28 per cent and 14 per cent over 2017-18. Kottayam District recorded the highest increase in paddy area of 27 per cent with 25 per cent increase in production The productivity declined by 1.7 per cent. The highest increase in paddy production of 32 per cent was recorded in Pathanamthitta District with just 2.6 per cent increase in area indicating the rise in productivity in the District. A decline in productivity was recorded in Kottayam, Idukki, Ernakulam, Thrissur, Kannur and Kasargod Districts in 2018-19 compared to 2017-18 with highest decline of 17 per cent in Idukki District Appendix 3.1.7.
The interventions to promote paddy cultivation in the State include assistance to undertake fallow land cultivation, upland cultivation, conversion of single crop to double crop and promotion of specialty rice. The key initiatives in 2018-19 include input assistance @ ₹5,500/ha and production incentive @ ₹1,000/ha/season, for an area of 1,36,450 ha through Corporation, Municipality and Grama Panchayats.
Coconut
Although coconut is one of the principal crops, its cultivation in the State has not been encouraging over the years. An increase in production of 1.32 per cent is recorded in the State in 2018-19 over 2017-18. Among the major coconut producing States in the country, Kerala stands first with respect to area and production, but in productivity it is fifth, next to Andhra Pradesh, Tamil Nadu, West Bengal and Karnataka (Coconut Development Board Statistics 2017-18).
Coconut, cultivated in 7.61 lakh ha occupies 29.6 per cent of the gross cropped area. Compared to the area under coconut cultivation in 2009-10, a 2.2 per cent decline has been observed during the last decade in the State. The decline in production was 6.5 per cent during the last decade indicating the comparatively low per hectare productivity of coconut in the State. A marginal increase in area, production and productivity to the tune of 0.06 per cent, 1.32 per cent and 1.25 per cent respectively has been observed in 2018-19 compared to 2017-18 Appendix 3.1.9.
The major constraints in coconut farming in the State are high labour cost, shortage of skilled labour, non-remunerative price and lack of promotional programmes for marketing coconut products. Prevalence of root wilt disease, poor management and prevalence of senile and unproductive palms, especially in the southern region are the other concerns. The Coconut Development programmes in the State is directed towards integrated development of holdings aimed at maximising income from unit area through better agro management practices and promotion of multi species cropping and farming system. Keragramam is one such programme being undertaken for the integrated management of coconut gardens on cluster basis and replanting to replace senile and diseased palms. Massive replanting of root wilt palms by elite palms and elimination of senile palms by replanting and under planting, setting up of nurseries for production of quality seedlings and their subsequent distribution required for increasing productivity is targeted to be achieved through the initiative of the Coconut Development Council. The shortage of quality seedlings for replacing the old, senile and unproductive palms and for new planting can be overcome through farmer participatory approach by establishing more nucleus seed gardens in farmer fields. The isolated attempts of production of dwarf coconut seedlings and hybrids need to be scaled up substantially with the support of research and development institutions.

67Chapter 3, Agriculture and Allied Sectors
Entrepreneurial ventures for the production of value-added products like desiccated coconut, beverages, shell based products, coconut cream and Neera has to be promoted with appropriate tie up with credit and marketing agencies.
Pepper
Pepper production in India in 2018-19 is estimated at 62.14 thousand tonnes compared to 70.87 thousand tonnes in 2017-18 (United Planters Association of Southern India (UPASI) Annual Report, 2018-19) which is a decline of 12.3 per cent. Accordingly, Kerala contributes 58 per cent of the national production in 2018-19 with 36,218 tonnes. This is 4.57 per cent decline in production over 2017-18 Appendix 3.1.4.
There has been a rallying in pepper price since 2011 and it increased consistently upto 2016. But this trend was reversed since 2017 as the prices declined to ₹529.59 per kg and further dipped to ₹392.42 per kg in the year 2018. The decline in pepper prices was largely on account of imports of pepper. (UPASI Annual Report 2018-19).
In order to revive spices development in the State, pepper rehabilitation programme through decentralised pepper nurseries, establishment of new pepper gardens, and revitalisation of existing gardens are being carried by the Department of Agriculture, GoK. Integrated pepper development in Idukki, assistance for area expansion, support to secondary and micro nutrients, soil ameliorants and revitalisation of pepper samithies are the key initiatives to promote pepper production in the State.
Cashew
India stood next to Vietnam in cashew production in 2017. The production of raw cashew nuts declined from 817 thousand metric tonnes in 2017-18 to 742 thousand metric tonnes in 2018-19. However, the area under cashew cultivation recorded an increase from 1,062 thousand hectares to 1,105 thousand hectares in the respective years. The decline in production was reported to be due to low night temperature for
prolonged period which resulted in reduced fruit setting and ultimately reduce production.
Among the cashew growing States in India, Maharashtra stands first in production contributing a share of 28 per cent followed by Andhra Pradesh contributing to 14 per cent. Kerala stands fifth in cashew production contribuiting 11.17 per cent of the total cashew production in the country. (Directorate of Cashewnut and Cocoa Development, CEPCI).
In the last one decade in Kerala, there has been a continuous and considerable decline in both area and production of cashew. The production which stood at 35.82 thousand metric tonnes in 2009-10 declined to 15.64 thousand metric tonnes in 2018-19, with a decline in the area from 48.97 thousand hectares to 38.78 thousand hectares during the same period. Productivity of the crop which was around 731 kg per hectare in the 2009-10 also showed a decline to 403 kg per hectare in 2018-19 seriously affecting the prospects of the crop. The area and production declined by 2.3 per cent and 39 per cent respectively in 2018-19 compared to 2017-18 (Appendix 3.1.10).
Plantation Crops
Plantation crops are high value commercial crops of great economic importance and play a vital role in the Indian economy, in view of their export and employment generation potential and capacity for poverty alleviation, particularly in rural sector. Each of the four plantation crops of South India has its distinct characteristics and economic problems.
Kerala has a substantial share in the four plantation crops of rubber, tea, coffee and cardamom. These four crops together occupy 7.11 lakh ha, accounting for 27.7 per cent of the total cropped area in the State (Appendix 3.1.4). Kerala’s share in the national production of rubber is 84 per cent, cardamom 89 per cent, coffee 20.2 per cent and tea 4.5 per cent in the year 2018-19 Appendix 3.1.11.

68 Economic Review 2019, Kerala State Planning Board
Rubber
India became the fifth largest producer of natural rubber (NR) in 2018 with a share of 4.8 per cent of world production. India holds third rank in productivity in the world in 2018, succeeding Vietnam and Thailand. The production of NR in India in the year 2018-19 was 6.51 lakh tonnes, registering a decline of 6.2 per cent compared to 6.94 lakh tonnes produced a year ago. The tapped area in the year was only 70 per cent of the tappable area. The country has consumed 12,11,940 tonnes of NR in 2018-19, which is 9 per cent more from the quantity of 11,12,210 tonnes consumed in 2017-18. The country imported 5.82 lakh tonnes of NR in 2018-19 as compared to 4.69 lakh tonnes imported in the previous year with 24 per cent increase. Annual average price for domestic RSS 4 grade rubber for the year 2018-19 was ₹125.95 per kg compared to ₹129.80 per kg in 2017-18 (Appendix 3.1.12, 3.1.13, and 3.1.14).
Rubber occupies the second largest area in the State next to Coconut with 21 per cent of the gross cropped area. No considerable change with respect to area and production is observed in the State in 2018-19 compared to 2017-18 (Appendix 3.1.11). Adverse weather especially, impact of the excessive rains and floods, the consequent high level of incidence of Abnormal Leaf Fall disease, lack of skilled labourers, grower’s reluctance in harvesting or poor maintenance of trees in response to the low NR prices are the major constraints in rubber production in the State.
Coffee
Domestic coffee production for the year 2018-19 was estimated at 319.5 thousand tonnes with Arabica production of 95,000 tonnes (29.7 per cent) and Robusta at 224.5 thousand tonnes (70.3 per cent). This represents an increase in production of 3.5 thousand tonnes compared to 316 thousand tonnes in 2017-18.
With respect to Kerala, the production of coffee registered a decline from 66,465 metric tonnes in 2017-18 to 64,676 metric tonnes in 2018-19 with no change in area (Appendix 3.1.11). The productivity of the crop in terms of bearing area in Kerala is 761 kg/ha (Coffee Board, 2018). Among the coffee producing States, Kerala stands second next to Karnataka in the country.
Tea
India is the second largest producer of tea in the world. The Tea Board had revised the production figures in 2011 by bringing within the net all segments of tea producers, both organised and unorganised, especially North India, many of whom were not reporting their crop production details earlier. This helped India in reaching the 1 billion mark.
The domestic tea production in 2018-19 was 1,350.04 million kg which is higher by 24.99 million kg of 2017-18. Tea production has recorded an increase of 12.50 per cent in 2018-19, compared to 2013-14 Appendix 3.1.15. The total realisation of tea export in 2018-19 was ₹5,506.84 crore with unit value of ₹216.38 per kg which is higher by 8.73 per cent and 9.61 per cent respectively over 2017-18.
Kerala accounts for 4.5 per cent of the total domestic production of tea in the country. Even though the area under tea has increased by 20.7 per cent in 2018-19, the production of tea in the State has declined by 2.36 per cent compared to 2017-18.
Cardamom
India is the second largest producer of cardamom and plays an important role in the international trade due to the unique aroma and flavour of Indian cardamom. The output of cardamom is dependent on the prevailing climatic conditions as the cardamom plant requires intermittent spells of rains and good sunshine during the growth stage. Cardamom production in India in 2018-19 estimated at 12.95 thousand tonnes

69Chapter 3, Agriculture and Allied Sectors
which is a decline of 7.7 thousand tonnes compared to 2017-18. In 2018-19, the prices of cardamom had increased by ₹514.02 per kg to reach ₹1,477.28 per kg compared to ₹963.26 per kg in the previous year (Source: UPASI Annual report 2018-19).
Kerala holds the major share in cardamom production contributing to 89.07 per cent of the total domestic production. The cardamom production in the State has declined by 37 per cent in 2018-19 compared to 2017-18 recording 11,535 metric tonnes. This decline in production can be attributed to the huge loss incurred due the floods that hit the State in 2018-19 Appendix 3.1.11.
Consumption of Fertilisers and Pesticides
The total indigenous pesticide consumption in 2018-19 is 1,194.06 metric tonnes with chemical pesticides being 517.3 metric tonnes and bio-pesticides being 676.76 metric tonnes. The highest pesticide usage, both chemical and bio is in vegetables. Even though the total pesticide usage both chemical and bio decreased in 2018-19, the usage of chemical pesticide in paddy and vegetables has increased compared to 2017-18 Table 3.1.2.
The consumption of nitrogenous fertilisers has decreased considerably in 2018-19 compared
to 2017-18 with 28 kg/ha contributing to 40 per cent of the total nitrogen, phosphorus and potassium fertilisers. The consumption of phosphorus and potassium was 15 kg/ha and 26 kg/ha respectively together contributing 59 per cent of total consumption in 2018-19 Appendix 3.1.16.
Collective Farming through Kudumbasree
Collective farming is an important area of Kudumbasree, which aims at food security both at household and community level. The major crops cultivated are paddy, vegetables, banana, pineapple and tubers. In 2018-19, the area brought under cultivation of paddy was 13,690 ha, vegetables 10,333 ha, banana 15,329 ha and other crops was 14,732 ha. On comparing with the area covered in 2017-18, the area under paddy and banana has increased while the area under vegetables declined. Details of area covered in 2018-19 are given in Appendix 3.1.17.
Major Achievements of Department of Agriculture 2018-19
In the Annual Plan 2018-19, out of ₹744.42 crore earmarked for the Department of Agriculture under the State Plan, the expenditure incurred was ₹621.03crore (83.4 per cent). The key
Table 3.1.2 Commodity and crop-wise consumption of indigenous pesticides, chemical and bio, 2017-18 and 2018-19 MT, technical grade
Commodity Crop Chemical Pesticides Biopesticides Total
2017-18 2018-19 2017-18 2018-19 2017-18 2018-19
Cereals Paddy 37.15 66.24 153.37 94.86 190.52 161.09Vegetables 110.98 137.58 394.95 201.99 505.94 339.57Spices 59.76 48.71 156.23 79.71 215.99 128.42Coconut Coconut 139.93 113.06 228.99 116.49 368.91 229.54Arecanut Arecanut 20.45 15.80 48.60 21.75 69.05 37.55Banana Banana 155.14 135.91 185.90 161.97 341.04 297.88TOTAL 523.42 517.3 1,168.04 676.76 1,691.46 1,194.06
Source: Department of Agriculture, Kerala
70 Economic Review 2019, Kerala State Planning Board
achievements of the Department of Agriculture in 2018-19 were the following:
• For rice development, assistance was given for sustaining rice cultivation in 1.83 lakh ha through group farming and for specialty rice cultivation in 907.89 ha. Production incentive, @ ₹1,000/ha/season cultivated, was provided for an area of 1,36,450 ha in 2018-19 through Corporation, Municipality and Grama Panchayats.
• The activities for establishment of the modern seed bank for the conservation of traditional and other varieties of crops by Kerala Agricultural University at the KAU main campus, Vellanikkara and at Regional Agricultural Research Station, Pattambi is initiated. As a part of germplasm conservation 139 germplasm accessions of Cowpea (Vigna unguiculata), 362 nos. of traditional rice varieties were procured. Seed multiplication of 20 purified accessions is being carried out in Farmers participatory mode and molecular characterisation of the germplasm is in progress. Traditional varieties of paddy and millets were promoted in an area of 383.758 ha.
• For coconut development, the Department established 77 Keragramams, 10 coconut nurseries and 407 organic manure production units, established and extended irrigation facilities to 1,179 ha. 2,53,108 WCT, 9,853 dwarf and 45,064 hybrid coconut seedlings were produced. Plant protection activities were undertaken for 2,37,370 palms in 13,444 ha of coconut gardens.
• Coconut Development Council was constituted in 2018 with a vision for comprehensive development of coconut sector within a period of 10 years from 2018 to 2028 with major objectives of increasing the area under coconut cultivation from 7.81 lakh ha to 9.25 lakh ha, increasing the productivity from 6,889 nuts per ha to 8,500 nuts per ha, new planting in 1.44 lakh ha and rejuvenation of 3 lakh ha existing gardens in the State.
• For vegetable development, 786.938 ha of fallow land was brought under vegetable cultivation. Vegetable cultivation was undertaken in 82,166.855 ha with a production of 12.12 lakh metric tonnes. Mini-drip/Wick Irrigation established in 1,590 units, which covered an area of 10.54 hectare.
• For pepper development, 24 lakh disease free rooted pepper cuttings and 14,825 bush pepper seedlings were produced for distribution to farmers. Area under pepper was expanded to 640.27 ha and 34 pepper development samithies were revitalised. Consequent to the floods 668.48 ha of pepper were rehabilitated.
• Produced 8.43 lakh vegetable seedlings, 2461 tonnes vegetable seeds, 2,32,529 kg paddy seed, 4.3 lakh tissue culture banana, 42787 banana suckers, 8019 ornamental plants and 1.16 lakh cashew grafts in the various departmental farms.
• 50 new Plant Health Clinics were established in addition to the existing 202 for monitoring pest and disease attack through 2020 surveillance plots.
• 27 new eco-shops were established in addition to the existing 139 eco-shops and also direct markets at District headquarters, municipalities and corporations to facilitate marketing of organic products from organic clusters.
Key Initiatives of the Department of Agriculture 2019-20
For sustainable agricultural growth, it is necessary to concentrate on efficient resource management, climate resilient farming practices and application of ICT. In this line, the State has been concentrating on promoting programmes like good agricultural practices for safe to eat food, organic farming, Hi-tech farming, soil test-based management, ICT application for crop surveillance, soil fertility management, pest and disease management, market linkage and mechanisation. With the objective of providing income security to farmers industry-based development of agriculture sector through

71Chapter 3, Agriculture and Allied Sectors
value addition is being promoted. Agricultural credit facilities, crop insurance coverage, market intervention for price stabilisation and farmer pension are the other farmer friendly programmes supported by the State.
Schemes formulated for 2019-20 mainly aimed at attaining self-sufficiency in vegetable production and increasing production of rice, millets, pulses and tubers. The key initiatives of the Department of Agriculture in 2019-20 for the improvement of agricultural sector included integrated food crop production programme focusing on increasing rice production and self-sufficiency in vegetable production, holistic development of coconut sector through Keragramams, production and distribution of quality planting materials, comprehensive fallow land cultivation with people’s participation, modernisation and establishment of labs, institutional mechanism for marketing, strengthening extension activities, Agricultural Technology Management Agency (ATMA) plus model of extension, rejuvenation of spices economy, quality control of agricultural inputs and outputs and effective programs for soil and root health management, crop health management covering pests and disease surveillance, promotion of organic farming and safe food production, crop insurance, establishment and strengthening of Agro Service Centres (ASCs) for improved service delivery and revival package for pepper in Wayanad.
As part of Coconut Mission, it is aimed to revive the coconut wealth of Kerala through a campaign of replanting and maintenance; to enhance productivity of coconut; and to ensure forward linkages with agro-industry. In the context of damage caused by floods in Kuttanad region, a new scheme for development of agriculture sector in Kuttanad is included. Arecanut package for promoting arecanut cultivation and strengthening of IT infrastructure of the department to ensure transparency and efficient functioning are other new initiatives envisaged. Activities in integration with Haritha Keralam will also be undertaken.
Crop Insurance Schemes
In Kerala, majority of the agricultural producers are small farmers and agriculture is heavily dependent on the weather. The uncertainty of weather makes agriculture a highly risky venture. Thus the uncertainty of crop yields is one of the basic risks that every farmer has to face. As crop production is affected by the vagaries of nature and damages occur due to droughts, floods, attacks of pests and diseases, crop insurance can play a vital role in sustaining farms income. Major agricultural crops namely coconut, banana, rubber, black pepper, arecanut, cardamom, cashew, pineapple, coffee, ginger, tea, tapioca, turmeric, cocoa, groundnut, sesamum, vegetables, nutmeg, clove, betel leaf, pulses, tuber crops, sugarcane, tobacco, paddy, mango and millets are covered.
In 2018-19, under the restructured crop insurance scheme 2,42,238 farmers were enrolled and an amount of ₹292.8 lakh disbursed to 26,555 farmers insured under the scheme.
Under Restructured Weather Based Crop Insurance Scheme (RWBCIS), in Kharif 2018 season, 19,103 farmers were insured covering an area of 13,469ha. The crops notified were paddy, arecanut, pepper, ginger, sugarcane, turmeric, cardamom, pineapple, banana and nutmeg. In addition to this mango, potato, cabbage, carrot, garlic, French bean, Yard long bean, snake gourd and bitter gourd were notified in Rabi season and 22,025 farmers were insured covering an area of 14,626 ha.
In 2018-19, the State Government had notified the scheme Prime Ministers Fasal Bima Yojana (PMFBY) covering the crops such as paddy, banana, tapioca and plantain. Under this scheme, 7,281 farmers were insured covering an area of 6,958 ha and an amount of ₹9 crore paid as claims in Kharif 2018 season, and 8,743 farmers were insured covering 8,176 ha in Rabi 2018 (Department of Agriculture, GoK).

72 Economic Review 2019, Kerala State Planning Board
State Horticulture Mission (SHM)
The SHM was formed in 2005 to implement the programme of the National Horticulture Mission, a Centrally Sponsored Scheme, which has been restructured as the Mission for Integrated Development of Horticulture from 2014-15 onwards. The main objective of the mission is a holistic development of the horticulture sector covering fruits, mushroom, medicinal plants, spices, flowers, aromatic and plantation crops. The crops identified for development under the mission are mango, banana, pineapple, pepper, ginger, turmeric, nutmeg, cashew, cocoa and flower crops. Bee keeping, vegetable seed production and mushroom cultivation area also included. The important programmes under the mission include production and productivity improvement, post-harvest management and marketing.
State Horticulture Mission Kerala is the nodal agency to channelise funds received from MIDH scheme to support individuals and institutions in expanding the area under horticulture crops and providing assistance for infrastructure development for value addition, processing, storage and marketing.
In 2018-19, a total amount of ₹18.54 crore was released to SHM including State share and Central share and the total expenditure incurred was ₹28.18 crore including the spill over funds. The components undertaken in this mission are establishment of nurseries for production and distribution of quality seeds and planting material, establishment of new gardens, rejuvenation of existing plantations, protected cultivation, organic farming, horticulture mechanisation, technology dissemination and bee keeping. The important programmes included under post-harvest management are establishment of integrated packhouses, sorting and grading units, cold storage and market development.
In 2018-19, a special package under MIDH scheme for an amount of ₹93.39 crore was
approved for flood mitigation including area expansion of crops and bee keeping components. The crops covered were fruit crops like strawberry, banana, pineapple, vegetables, spices, betel vine, cashew and cocoa.
Vegetable and Fruit Promotion Council, Kerala (VFPCK)
Vegetable and Fruit Promotion Council, Kerala (VFPCK) formed in 2001, has been implementing various schemes in fruits and vegetable sector with the financial assistance from State and Central Governments. Its mandate is to support commercial fruit and vegetable growers in Kerala in various farm operations from seed to marketing in a sustainable way. The major activities of the council are technology support to farmers, participatory technology trials, formation of self-help groups (SHGs), promotion of Participatory Guarantee System (PGS) for organic certification, campaigns/training/capacity building programmes, production of quality seeds and planting materials, participatory credit and insurance support, group marketing and Haritha Nagari programmes for the promotion of vegetable cultivation in urban areas.
In 2018-19, VFPCK has inducted 6,011 new farmers and formed 160 new SHGs thereby increasing the database of farmers to 2,00,294 and SHG’s to 9,868. With respect to production of planting material 98.70 metric tonnes of seeds, 7.02 lakh tissue culture plantlets and 46 lakh vegetable seedlings through hi-tech plug nursery were produced and distributed. Regional Centre for Organic Farming has accepted VFPCK as the Regional Council for Organic Certification. Organic Certificate has been awarded to 33 farmers. Council distributed 1 crore vegetable seed packets as part of Onathinu Orumuram Pachakkari under Haritha Nagari scheme. To revive vegetable cultivation consequent to the floods, 7.5 lakh seed kits were distributed. Credit disbursement to the tune of ₹70.11crore under Kissan Credit Card (KCC) at affordable interest rate were extended to farmers. A total of 41.99

73Chapter 3, Agriculture and Allied Sectors
lakh banana plants and 509 ha of vegetables were covered under crop insurance scheme.
VFPCK has been designated as the State Nodal Agency for Agri Export Promotion from Kerala and as part of these, 15 clusters have been identified in 12 Districts for facilitating Agri export promotion through clusters.
Trading of 83,280 metric tonnes of fruits and vegetables for ₹246.38 crore was conducted through Swashraya Karshaka Samithies.
As part of market intervention to control price hike in vegetables during Onam season, 150 vegetable retail markets were organised all over the State providing vegetables at 30 per cent reduced price.
A system of branding for VFPCK products and services named Thalir started functioning at Kadappakkada, Kollam in addition to one at Kottarakkara. Other details of the sector are given in Appendix 3.1.18, 3.1.19, 3.1.20, 3.1.21 and Appendix 3.1.22.
Agriculture Research and Education
Agricultural research and education in Kerala is spearheaded by the Kerala Agricultural University. The Kerala Agricultural University at present, has a network of eight Colleges, six Regional Agricultural Research Stations, 17 Research Stations and four Instructional Farms spread throughout the length and breadth of the State. The thirty one ICAR supported All India Co-ordinated Research Projects/All India Network Project implemented at various Colleges/research stations also have a significant role in the technology development and national testing of technologies and genotypes developed by Kerala Agricultural University.
Major achievements• Three cropping model have been
developed by KAU, viz, rice-rice model (Mundakan-Punja), rice-rice model (Virippu-Mundakan) and rice-pulses/vegetable model as part of ‘Operation Kole Double’ envisaging double cropping in Kole lands of Thrissur, initially in around 3800 acres. The newly released short duration rice variety of KAU Manuratna is being widely adopted for additional cropping in Kole lands.
• Standardisation of technology for value added products of coconut like Neera (Inflorescence sap) Nata-De-Coco, Yoghurt, coconut water wine and coconut water vinegar.
• A technical document, “Revisiting Nutrient Management Prescriptions for Kerala State”, was prepared and submitted to the Department of Agricultural Development and Farmers’ Welfare recommending to revisit the nutrient management prescriptions for the different soil types of Kerala and the crops grown in these soils, considering the heterogeneity of soils occurring in the State.
• Soil fertility management protocol for the various agro ecosystems was suggested based on which State Government has initiated steps for policy decisions on the fertiliser mixtures to be traded in the State.
• Released a technical document on “Good Agricultural Practices for Crops”.
• Distribution of traditional rice varieties of Malabar region to the farming community for field level conservation
• Development of KAU SMART BIOBIN’ a low cost technology for the management of bio solid kitchen waste in households
• IPR Cell facilitated receipt of GI registration of Marayoor Jaggery and Tirur Vettila.
• Production and sale of seeds and seedlings of fruits and vegetables hybrids, improved and local varieties including tissue culture plants of Banana and Orchids, could earn a revenue of ₹24 crore in the current year.

74 Economic Review 2019, Kerala State Planning Board
• Farm Advisory and Diagnostic Services were offered through Eighteen Multi-Disciplinary Diagnostic Team (MDDT) field visits, direct interaction, phone calls and e-mails.
• Launched an innovative interface programme called Mukhamukam (Monthly Agro Clinic and Farm Advisory Conclave) enabling the farming community to interact directly with an interdisciplinary team of scientists
• Flood rehabilitation programmes of KAU.
Preliminary assessment of the losses to agricultural sector due to the August 2018 floods was carried out by Multi-disciplinary team of scientists and District specific interventions on soil and crop health management were proposed. Advisories on post flood management of crops were prepared and made available for wider circulation among the press, radio and social media. A series of 10 spot videos on post flood management of crops were released in social media. A 24x7 help desk at the Communication Centre, Mannuthy responded to queries of farmers on crop damages, soil fertility, nutrient management and incidence of pests and diseases.
• KAU initiated R-ABI (RKVY-RAFTAAR-Agribusiness Incubator) Project with thrust on value addition in food processing sector. Forty innovative agripreneurs were selected under two programmes categories viz. RAISE (Realising and Augmenting Innovations for Startup Enterprises), a launch pad for Agripreneurship and PACE (Promotion of Agriculture through Commercialisation and Entrepreneurship), a launch pad for Agri Startups and trained intensively in agripreneurship development.
Finance to Agriculture
Since independence, credit occupies an important place in the policy framework for development
of agriculture in India. There is an increasing need to invest in agriculture due to a drastic rise in global population and changing preferences of growing middle class in emerging markets towards higher value agricultural products. Estimates suggest that the demand for food will increase by 70 per cent by 2050 and at least $80 billion annual investments will be needed (World
Bank,2019). In terms of RBI’s Direction on Priority Sector Lending-Targets and Classification, a target of 40 per cent of Adjusted Net Bank Credit (ANBC) or Credit Equivalent amount of Off-Balance Sheet Exposures (OBE), whichever is higher, has been set for lending to the priority sector by domestic scheduled commercial banks and foreign banks with 20 and above branches. Within this, a sub-target of 18 per cent of ANBC or Credit Equivalent amount of OBE, whichever is higher, has been prescribed to all domestic Scheduled Commercial Banks, including Small Finance Banks, for lending to Agriculture.
In Kerala, advances to agriculture sector had increased significantly in the last five year period. The figures for the 12th Five-Year Plan reveal that it has risen from ₹42,891 crore in 2013-14 to ₹67,089.43 crore in 2017-18. Out of the total agriculture credit disbursement in 2017-18, ₹43,432.69 crore was disbursed by commercial banks, ₹10,217 crore by RRB and ₹13,438.79 crore by co-operative banks (Table 3.1.3). It shows that commercial banks continue to play a predominant role in the advance of credit in agriculture and allied activities (Figure 3.1.5). There has been considerable increase in agriculture credit flow from ₹54,270 crore in 2016-17 to ₹67,089 crore in 2017-18 and ₹71,632 crore in 2018-19.
Investment Credit
As regards the breakup of total agriculture credit to production and investment credit, it can be seen that the share of investment credit has increased to 37.7 per cent of the total credit from 14.03 cent in the beginning of the 12th Plan period (Figure 3.1.6 and Appendix 3.1.23). This is definitely a positive development given

75Chapter 3, Agriculture and Allied Sectors
the fact that share of investment credit had been consistently declining over the years. The skewed ratio in favour of short term crop loan or production credit over the last several years has resulted in low investment in capital/productivity enhancing assets. Hence, a segmentation approach could be adopted in credit delivery whereby the segment-/sector-specific credit requirements are assessed and differential rates of interest are enabled through subvention (keeping in view the net income
per unit from a particular segment/sector/activity), to support activities that are critical but not picking up (State focus Paper, NABARD-2019-20). In 2017-18, ₹18,847 crore was disbursed as investment credit in the State which includes – Commercial banks ₹11,720.6 crore, Co-operative banks ₹4,932.3 crore and RRBs ₹2,193.72 crore. In 2018-19, ₹71,632 crore was disbursed as total agricultural credit in the State – ₹44,597 crore as production credit and ₹27,035 crore as investment credit. Banks need to ensure
Figure 3.1.5 Agriculture advances in Kerala from 2013-14 to 2018-19
Source: SLBC, 2019
Figure 3.1.6 Share of production and investment credit in total agriculture credit in Kerala
Source: SLBC, 2019

76 Economic Review 2019, Kerala State Planning Board
that agricultural term credit is dispensed to facilitate capital formation in agricultural sector (Figure 3.1.6 and Appendix 3.1.24 and 3.1.25).
Agency-wise flow of total agricultural credit in 2017-18 shows that, commercial banks have disbursed the largest amount of credit (65 per cent) followed by co-operatives (21.5 per cent) and the rest by RRBs. Year on year, there has been a slight increase in the share of commercial banks as well as co-operatives in the total agricultural credit disbursed while the share of RRBs have fallen. The data shows that the share of investment credit in total agriculture credit is very low. The fragmented land holding is one of the major reasons for low investment credit flow in Kerala.
Kissan Credit Card (KCC)
KCC is an effective credit delivery tool for providing hassle-free timely and adequate credit. As per the reports available with State Level Bankers Committee (SLBC), 5,44,512 Kisan Credit Cards(KCCs) with an amount of ₹7,754.03 crore have been issued in 2017-18 in the State. As per the revised guidelines for KCC, the KCC should be a smart card cum debit card which could be used in the ATMs/Hand held Swipe Machines etc. RuPay has come out with its RuPay KCC,
which leverages the benefits of both KCC and RuPay. Unlike normal KCC which serves only as an identity card and facilitates recording of transactions on an ongoing basis, RuPay KCC is actually a smart card that can be used at the nearest ATM/PoS for withdrawing cash. At present issuance of RuPay KCC is on a pilot stage in Kerala Appendix 3.1.27.
Long Term Rural Credit Fund (LTRCF)
As the share of long term investment credit in agriculture is declining over the years, hampering the asset creation in agriculture activities and having an adverse effect on productivity in agriculture, GoI has set up a “Long Term Rural Credit Fund” with NABARD for providing long term refinance support for investment credit in agriculture activities exclusively for Cooperative Banks and Regional Rural Banks (RRBs) at a concessional rate of interest. All State Cooperative Banks, State Co-operative Agriculture Development Banks(SCARDBs) and RRBs which are eligible to avail refinance facilities from NABARD, subject to their satisfying the eligibility criteria, are eligible for LTRCF. Automatic Refinance Facility will be extended without any upper ceiling of refinance quantum, bank loan or total financial outlay for all projects under agriculture sector. Given the post-flood
Table 3.1.3: Credit flow to agriculture sector in 2017-18, in ₹ crore
Sl No
Agency Name
Crop Loan Term Loan Total Agriculture loan
Targ
et
Ach.
%
Achi
evem
ent
Targ
et
Ach.
%
Achi
evem
ent
Targ
et
Ach.
%
Achi
evem
ent
1 Commercial Banks 23890.57 31712.08 132.74 8325.39 11720.61 140.78 32216 43432.69 134.82
2 Co-operatives 13848.25 8506.49 61.43 5884.43 4932.3 83.82 19732.7 13438.79 68.1
3 Regional Rural Banks 4777.74 8024.22 167.95 1356.45 2193.72 161.73 6134.19 10217.94 166.57
Total 42516.56 48242.79 113.47 15566.3 18846.63 121.07 58082.8 67089.42 115.51
Source: State Focus Paper 2019-20
77Chapter 3, Agriculture and Allied Sectors
recovery scenario in the State, the disbursements under Long-Term Rural Credit Fund set up in NABARD with a view to enhancing capital formation in agriculture, increased by 14 per cent over 2017-18 to reach ₹1,348 crore in 2018-19. NABARD has also sanctioned ₹1,500 crore as ST(SAO)refinance to Kerala State Cooperative Bank in 2018-19.
Assistance from NABARD
NABARD, since inception, has prioritised its strategies for facilitating credit flow to rural infrastructure sector to fulfill its mission of rural prosperity through credit and related services. From the year 1995 onwards, NABARD is funding rural infrastructure projects through its flagship programme of Rural Infrastructure Development Fund (RIDF). In Kerala, projects worth a total financial outlay of ₹11,206 crore involving RIDF loan of ₹9,353 crore has been assisted. The normative allocation for Kerala for Tranche XXIV is ₹900 crore. Under NABARD Infrastructure Development Assistance (NIDA), a disbursement of ₹100 crore was made to Kerala Infrastructure Investment Fund Board (KIIFB), taking the total assistance provided to KIIFB, thus far, to ₹200.80 crore. The disbursement under Food Processing Fund (FPF) to GoK for the Mega Food Park project by KINFRA during the year was ₹11.34 crore, thereby enabling utilisation to the extent of 100 per cent of the loan sanctioned to the project in 2015-16. The tranche-wise sanction and disbursement under RIDF are shown in Appendices 3.1.26 and 3.1.28. NABARD joined hands with the GoK in imparting a fresh lease of life in the flood-affected areas. Additional allocation of ₹400 crore was made to the State government under their flagship credit product, Rural Infrastructure Development Fund (RIDF) for rebuilding the infrastructure of the State, besides enhancing the limit to the Cooperative Banks for borrowing under Short-Term Seasonal Agricultural Operations by additional ₹400 crore.
Despite the increase in the credit flow, one of the major issues is the outreach of adequate credit to the needy in time. The credit flow to the sector
has been distorted by indiscriminate issue of agriculture gold loans without reckoning the end use of such credit. The ability of credit to induce agricultural GDP growth is limited in the State due to various reasons. Hence, adequate attention should be given to building other capabilities required to promote agricultural growth such as productivity enhancement, expansion of infrastructure, higher public expenditure on agriculture and allied services, effective extension services, export competitiveness etc. In addition climate change risks also increases the need for higher investments in agriculture sector.

78 Economic Review 2019, Kerala State Planning Board
Co-operation
Cooperatives are a powerful economic and social force, present in all sectors of the economy. The cooperative movement accounts for 10 per cent of the world’s employed population. There is a resurgence of interest in the cooperative development model as a way to achieve socially inclusive sustainable development. The co-operative sector has been playing a distinct and significant role in promoting equitable socio-economic development in the country. The development strategies of cooperatives in India also coincide with the remodeling of cooperatives globally, as the United Nations and International Labor Organisation have hailed cooperatives as a viable alternative in the wake of growing inequality across the world. The resilience of cooperative enterprises to the recent financial and economic crises has added to the appeal for cooperatives as democratically owned and controlled form of business, rooted in communities. At a time when inclusive growth is being promoted for alleviating socio-economic disparities, co-operatives are the best organisations to achieve this objective.
At present, there are 15,761 co-operative societies in Kerala, functioning under the administrative control of Registrar of Co-operative Societies out of which 11,994 are working satisfactorily. Out of these, majority are consumer co-operatives (3,863) followed by credit co-operatives (3,350) and women co-operatives (931). In addition, there are marketing, housing, health and SC/ST co-
operatives, but nearly half of them are either dormant or in loss. Details of the various types of co-operative societies are given in Appendices 3.2.1 and 3.2.2.
Credit Co-operatives As on March 2019, the short term co-operative credit structure (STCCS) in the country comprises 93,367 Primary Agricultural Credit Societies (PACS), 370 District co-operative Banks (DCBs) and 33 State co-operative Banks (SCBs). The long term credit structure includes 13 State Co-operative Agriculture Rural Development banks (SCARDBs) with 673 branches and 601 Primary Co-operative Agriculture and Rural Development Banks (PCARDBs).
The credit co-operative societies are the most vibrant and viable ones in the State. The co-operative credit structure in the State comprises short term, medium term and long term credit. The short term and medium term agricultural credit structures mainly comprise the Kerala State Cooperative Bank (KSCB) at the apex level and 14 DCBs. Besides, there are 1,643 PACS at the grassroots level. These co-operatives are basically self-governing institutions with total accountability to the borrower members and in whose management they have a say. Apart from development activities, PACS take up a plethora of relevant social sector works. In addition to the three-tier co-operative banking, there is a well developed network of Urban Co-operative Banks

79Chapter 3, Agriculture and Allied Sectors
(UCBs) in the State. Apart from the PACS, there are 1,119 Employees Co-operative Societies for catering to the credit needs of employees in the State.
In the case of long-term credit, Kerala SCARDB (KSCARDB) is at the apex level while the 78 Primary Co-operative Agricultural Rural Development Banks (PCARDB) form the lower level. KSCARDB is playing an important role in promoting capital formation in agriculture and rural sectors in the State through its long term investment loans. The survival of KSCARDB and affiliated PCARDBs in the long run depends on their ability to raise funds at reasonable cost that permits financing of farmers and other rural sections at affordable interest rates and in offering a complete range of credit and financial services to them.
The basic feature of cooperative banking system is the larger reliance on resources mobilised locally and a lesser and lesser dependence on higher credit institutions. The efficiency of the co-operative credit movement rests with the PACS functioning at the grass root levels. There are 1,643 societies functioning in the State with a membership of 2.62 crore. During the period under review, the share capital of the societies has increased from ₹2,049.06 crore to ₹2,428.74 crore. The deposits during 2018-19 have increased from ₹88,824.91 crore to ₹95,477.89 crore, while the loans issued has increased from ₹76,539.19 crore to ₹76,643.52 crore. Out of the total loans issued, the share of agriculture loans comes to around 13.5 per cent. While short term loan for agriculture has decreased, both medium term and long term loans have shown an upward trend during the period. Selected indicators and credit operations of PACS are given in Appendices 3.2.3, 3.2.4 and 3.2.5.
Consumer Co-operatives
A consumer co-operative is a cooperative business owned by its customers for their mutual benefit. Consumer Co-operatives play an important role in providing consumer goods,
medicines, stationary items at subsidised rates to the consumers and help them from the exploitation of the private retailers. In the State, Consumer co-operatives act as the principal agencies in the public distribution system by providing essential and consumer articles to the general public at a reasonable rate, than the rate prevailing in the open market. The organisational set up under the consumer co-operative segment consists of the Kerala State Cooperative Consumer Federation (KSCCF) at the State or apex level, with 14 District wholesale stores and 4,638 primary consumer stores at base level. The KSCCF makes bulk procurements and supplies these to District wholesale stores, department stores named Triveni and primary stores. The District whole sale stores and primary stores in turn cater to the needs of the consumer through their own outlets, super markets, and departmental stores. As on March 31, 2019 a total of 4638 consumer co-operatives societies are registered in the State of which 3863 co-operatives societies are working. Triveni super markets are an important segment under consumer co-operatives intended to save the public from the exploitation of middlemen by supplying items such as food and groceries, cosmetics, household and electrical, and textiles. There are 184 Triveni units and 45 Mobile Triveni units are functioning in the State along with floating Triveni super stores for supplying essential items to the public.
The Neethi Scheme started as per directions of Government of Kerala in 1998 is being successfully implemented through 1,000 odd selected PACS in all the Districts of Kerala for the distribution of consumer goods at the lowest prices, especially in rural areas. Neethi medical stores were started for providing medicines at subsidised rates. Consumerfed procures and distributes medicines at whole sale rates as per the requirement of the Neethi medical stores. At present there are 96 Neethi Medical Stores directly run by Federation in addition to the 600 odd stores run by primary co-operative societies.

80 Economic Review 2019, Kerala State Planning Board
Deposit Mobilisation Campaign by Co-operative Sector
The deposits of co-operative sector under the co-operation department crossed ₹2,00,000 crore in 2019. The total deposit as on March 31, 2019 was ₹2,06,967 crore. ₹7,255 crore was achieved during the deposit mobilisation campaign as deposit against the target of ₹5,000 crore. Year wise target and achievement is given in Appendix 3.2.6.
Achievements in 2018-19
CARe Kerala
In the wake of devastating flood of August 2018, the co-operative department has formulated a project CARe Kerala (Co-operative Alliance to Rebuild Kerala) to provide relief and rehabilitation of flood affected people. Three schemes were included in the project, CARe Home, CARe loan and CARe Grace. The most important scheme under the project is CARe home. Under this scheme houses are being constructed to the flood affected people who possess suitable land for the house construction, with the cooperation and support of cooperative institutions. Under this scheme each house has to be built at a cost of rupees five lakh, which include the amount allotted to the beneficiaries from State Disaster Response Fund (SDRF). Upto October 1, 2019, 1,834 houses were completed out of 2,152 sanctioned houses.
Paddy Procurement through Co-operatives
Palakkad District is selected as pilot project for Paddy Procurement through Co-operatives. For this purpose a Co-operative society named “Palakkad Paddy Procurement Processing and Marketing Cooperative Society Ltd No. P 1449 (PAPCOS)” was registered on January 29, 2019 in Palakkad District. It has 26 Service co-operative Banks of Palakkad District as its members. The society has a paid up share capital of ₹7.8 crore. The main objective of the society is to help
the farmers in Palakkad District by procuring paddy as soon as it is harvested and making the payment at the time of procurement itself.
Muttathe Mulla
Muttathe Mulla is a new scheme introduced in 2018 to protect the common people from private money lenders. An amount of ₹119.83 crore has been disbursed upto May 31, 2019 to Kudumbasree units through co-operative societies. In the financial year 2018-19, ₹1,000 lakh was provided in the Budget for the scheme Agricultural Production Cost Relief Scheme (APCR) which provides 5 per cent interest relief on agricultural loans taken from Co-operative Credit Societies.
Kerala Bank
There has been a significant change in rural co-operative credit structure all over the world and the Government of Kerala has taken a policy decision to convert the present three tier short-term cooperative credit structure within the State into a two tier structure. The decision of the Government to convert the three tier structure into a two tier set up, by merging all the 14 District Cooperative Banks with Kerala State Co-operative Bank and transforming it into a full service technology driven universal bank with the objective of providing better services to the customers including farmers, small traders, and general public. Membership of Kerala Bank is limited to Primary Agricultural Credit Societies and Urban Co-operative Banks. The new Bank to be formed by amalgamating all 14 DCB’s with KSCB will be a full service universal bank in the co-operative sector. After fulfilling the 19 conditions stipulated by RBI, the final application for approval was submitted by Government to RBI through NABARD on March 29, 2019. The Reserve Bank of India has granted final approval for formation of Kerala Bank by merging District Co-operative Banks with Kerala State co-operative Bank.
81Chapter 3, Agriculture and Allied Sectors
Support by National Cooperative Development Corporation National Co-operative Development Corporation (NCDC), a statutory organisation established by the Government of India under an act of Parliament, is given the function of planning and promoting programmes for the production, processing, marketing, storage, export and imports of agricultural produce and notified commodities and for distribution of agricultural production requisites through co-operatives. NCDC has emerged as a developmental and promotional financing institution for the co-operative sector in the country. It has disbursed a cumulative financial assistance of ₹7,938.70 crore for various co-operative development projects as on 31 March 2019. Of this ₹1,845.54 crore is through State Government and ₹6,093.16 crore is via direct funding. Also, out of the ₹7,665.08 crore, ₹1,628.49 crore comes under long term loan and only ₹69.35 crore comes under subsidy. The amount given as working capital was ₹6,240.86 crore. Types of NCDC Assistance are shown in Appendix 3.2.7. Sanctions and release of NCDC funds to Kerala for 2018-19 was ₹367.54crore and ₹273.62crore respectively. There has been a drastic reduction in the sanction and release amount by NCDC in 2018-19 when compared to 2017-18. Details of NCDC assistance are given in Appendices 3.2.8 and 3.2.9.

82 Economic Review 2019, Kerala State Planning Board
3.3 Livestock
Animal Husbandry and dairying plays a pivotal role in national economy and socio economic development of the country. It also contributes to the rural economy by augmenting family income and generating gainful employment in the rural sector particularly among the landless labourers, small and marginal farmers, weaker sections and women.
Contribution to the National and State Economy
Livestock plays an important role in Indian economy. About 20.5 million people depend upon livestock for their livelihood. Livestock contributed 16 per cent to the income of small farm households as against an average of 14 per cent for all rural households and provides
livelihood to two-third of rural community. It also provides employment to about 8.8 per cent of the population in India. Livestock sector contributes 4.11 per cent to GDP and 25.6 per cent to total Agriculture GDP.
In Kerala, the livestock sector is a prominent and one of the fastest growing sector of rural economy. The share of livestock in Gross State Value Added (GSVA) at constant prices from agriculture sector is above 27 per cent, slightly higher than national level scenario. It has shown a marginal increase from 27.1 per cent in 2017-18 to 27.2 per cent in 2018-19. Though GSVA at constant prices from the sector has increased in absolute numbers, its share in total GSVA of the State has declined marginally from 2.57 per cent in 2017-18 to 2.39 per cent in 2018-19.
Box 3.3.1 20th Livestock Census
The Livestock Census is conducted across the country periodically since 1919. It usually covers all domesticated animals and head counts of these animals are taken. 19th livestock censuses were conducted in participation with State Governments and UT Administrations. The 20th Livestock Census was launched in the month of October 2018, and the data were collected online for the first time.
The Animal Husbandry Departments of States/UTs were entrusted to conduct the field operations. The data were collected and scrutinised mostly by para-veterinarians and veterinarians. In this whole Census operations more than 80,000 field staff were deployed and training was conducted at various levels starting from “All India Training Workshop for Trainers” at Delhi, followed by State, District level trainings. Besides training, training manual, tutorial video, online e-learning classes etc., has been arranged. The 20th Livestock Census was carried out in about 6.6 lakh villages and 89 thousand urban wards across the country covering more than 27 crore Households and Non-Households
Source: All India Livestock Census 2019
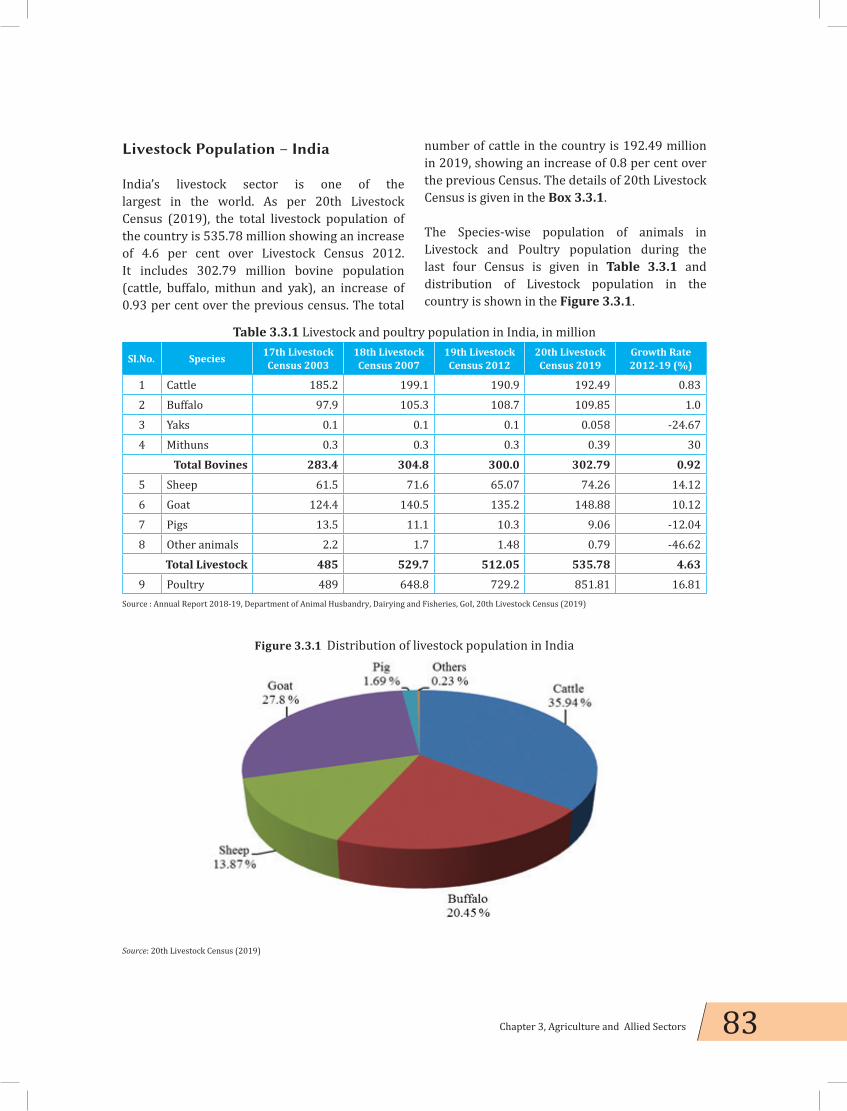
83Chapter 3, Agriculture and Allied Sectors
Table 3.3.1 Livestock and poultry population in India, in million
Sl.No. Species 17th Livestock Census 2003
18th Livestock Census 2007
19th Livestock Census 2012
20th Livestock Census 2019
Growth Rate 2012-19 (%)
1 Cattle 185.2 199.1 190.9 192.49 0.832 Buffalo 97.9 105.3 108.7 109.85 1.03 Yaks 0.1 0.1 0.1 0.058 -24.674 Mithuns 0.3 0.3 0.3 0.39 30
Total Bovines 283.4 304.8 300.0 302.79 0.925 Sheep 61.5 71.6 65.07 74.26 14.126 Goat 124.4 140.5 135.2 148.88 10.127 Pigs 13.5 11.1 10.3 9.06 -12.048 Other animals 2.2 1.7 1.48 0.79 -46.62
Total Livestock 485 529.7 512.05 535.78 4.639 Poultry 489 648.8 729.2 851.81 16.81
Source : Annual Report 2018-19, Department of Animal Husbandry, Dairying and Fisheries, GoI, 20th Livestock Census (2019)
Livestock Population – India
India’s livestock sector is one of the largest in the world. As per 20th Livestock Census (2019), the total livestock population of the country is 535.78 million showing an increase of 4.6 per cent over Livestock Census 2012. It includes 302.79 million bovine population (cattle, buffalo, mithun and yak), an increase of 0.93 per cent over the previous census. The total
number of cattle in the country is 192.49 million in 2019, showing an increase of 0.8 per cent over the previous Census. The details of 20th Livestock Census is given in the Box 3.3.1.
The Species-wise population of animals in Livestock and Poultry population during the last four Census is given in Table 3.3.1 and distribution of Livestock population in the country is shown in the Figure 3.3.1.
Figure 3.3.1 Distribution of livestock population in India
Source: 20th Livestock Census (2019)

84 Economic Review 2019, Kerala State Planning Board
As per 20th Livestock Census (2019), the livestock population in the State was 38.36 lakh. It is 1.34 per cent less as compared to previous Census of 2012. The reason for decline is the reduction in the population of other animals especially domestic dogs, rabbit, donkey and elephants (which form the majority share) by 14.69 per cent. The poultry population of Kerala as per 20th Livestock Census is 298.18 lakh, which accounts for 3.5 per cent of the total poultry population in the country. It registered 25 per cent increase over the 19th Livestock Census. Growth rate of poultry population in Kerala is higher than the growth rate recorded at the national level (16.81 per cent). Kerala ranks 9th among States in poultry population of the country. Details of species-wise livestock and poultry population in Kerala is shown in the Table 3.3.2.
Major Livestock Products in Kerala
Milk, meat and egg are the major livestock products in the State. The production of meat, milk and egg has shown a marginal decrease of 1.57 lakh MT, 25.49 lakh MT and 229.17 crore respectively. The production of these three livestock products during 2012-13 to 2018-19 is shown in Figure 3.3.2.
Milk Production
India continued to be the largest milk producing country in the world. At the national level, the milk production has increased from 17.63 crore tonnes in 2017-18 to 18.77 crore tonnes in 2018-19 registering a growth of 6.47 per cent, sustaining the trend over the past three decades. The per capita availability of milk has been increasing in India over the years and increased to 375 gm in 2017-18. The highest per capita
Box 3.3.2 20th Livestock Census – Kerala
The 20th cattle census in Kerala was conducted in February 2019, enumerated by the livestock inspectors of Animal Husbandry department. Apart from the rest of the country where village wards are the basic unit of enumeration, in Kerala, the Panchayat wards in rural areas and municipal/corporation wards in urban areas were the basic units of enumeration. Census was conducted in 15,962 rural Panchayat wards and 3527 municipal/corporation wards. As many as 15 types of animals, eight types of fowls, stray dogs stray cattle etc., were enumerated and breed-wise enumeration was carried out in all wards. Slaughter house details were also collected. Fisheries statistics were incorporated in the 20th cattle census which was not a feature in the previous census.
Source: 20th Livestock Census-Kerala
Table 3.3.2 Livestock and poultry population in Kerala, in lakh population
Species 2012 2019 per cent variation from 2012 to 2019
Cattle 13.28 13.42 1.02Buffalo 1.02 1.01 -0.71Sheep 0.01 0.01 0Goat 12.46 13.59 9.07Other animals 12.11 10.33 -14.69Total Livestock 38.88 38.36 -1.34Poultry 238.45 298.18 25.05Total 277.34 336.54 21.35
Source: Animal Husbandry Department, GoK 2019

85Chapter 3, Agriculture and Allied Sectors
availability is in Punjab (1120 gm per day). The highest producer of milk is Uttar Pradesh with 16.5 per cent of total milk production in the country, followed by Rajasthan (12.7 per cent). The species-wise milk production shows that nearly 35 per cent of total milk production is contributed by indigenous buffaloes followed by 26 per cent by cross bred cattle. The indigenous cattle contribute 11 per cent of the total milk production.
Out of 25.49 thousand MT of milk produced in Kerala, majority share is produced by cross bred cows (93.82 per cent). Indigenous cows produced only 1,975 MT of milk (0.08 per cent). The production of milk from goat is 1.21 lakh MT (4.7 per cent). The rest is contributed by non-descript cattle, indigenous buffalo and non-descript buffalo. Details of species-wise milk production in Kerala in 2018-19 is provided in the Figure 3.3.3.
Figure 3.3.2 Production of milk, egg and meat during 2012-13 to 2018-19
Source: Animal Husbandry Department, GoK 2019
Figure 3.3.3 Species-wise milk production in Kerala, 2018-19
Source: Animal Husbandry Department, GoK 2019

86 Economic Review 2019, Kerala State Planning Board
Egg Production
Poultry development is one of the important activities of livestock sector. Egg production in the country has increased substantially since 2000-01. Total egg production in India has increased from 9520 crore in 2017-18 to 10,332 crore in 2018-19, registering a growth of 8.53 per cent. Similarly, there has been a steady increase in per capita availability of eggs since 2000-01. It has increased to 74 eggs per annum in 2017-18. The largest producer of egg is Andhra Pradesh which produces 18.7 per cent of total egg production in the country closely followed by Tamil Nadu (18.3 per cent) and Telangana (13.3 per cent). Other States that contributed more than 5 per cent of the country’s egg production were West Bengal, Haryana and Kerala. The highest per capita availability of egg in Andhra Pradesh (346 eggs per annum) followed by Tamil Nadu (246), Haryana (209), Punjab (180) and West Bengal (79) which are significantly higher than the national average. The improved fowl breeds contribute 73.06 per cent of the production of egg and 11.83 per cent is from indigenous fowls. The indigenous duck and improved duck breeds contribute 0.91 per cent and 0.26 per cent respectively with respect to total egg production.
The production of egg in Kerala has witnessed drastic changes during the 12th Five Year Plan period. The total egg production in the State was at 224 crore eggs in the year 2012-13, then continued to rise over the period and reached at 250 crore eggs in the year 2014-15. Since then, it declined to 244 crore in 2015-16 and further to 234 crore in 2016-17. In 2017-18, the total eggs produced increased to 234.8 crore but in 2018-19 it again declined to 229.2 crore. Kerala ranks 10th among States of India in egg production. The per capita egg availability has fallen to 69 eggs per annum in 2016-17, further to 65 eggs per annum in 2017-18 and 63 eggs per annum in 2018-19. About 73.06 per cent of the total eggs produced in the State is from improved fowl and around 21.75 per cent is from desi fowl. The contribution of desi duck and improved duck to the total egg production of the State is 2.6 per cent and 2.58 per cent respectively. 79.38 per cent of eggs produced in the State come from backyard poultry. Commercial poultry contributes very small share, warranting emphasis on backyard poultry in future. For backyard poultry, the average yield per year for desi fowls and desi ducks are 137 eggs and 159 eggs per year. With regard to improved fowls, the average yield is 218 eggs per year. Species-wise poultry production in Kerala is shown in the Figure 3.3.4.
Figure 3.3.4 Species-wise poultry production in Kerala, 2019
Source: Animal Husbandry Department, GoK 2019

87Chapter 3, Agriculture and Allied Sectors
Meat Production
Meat production has witnessed a steady increase since 2007-08 in the country. The total meat production in India increased from 77 lakh tonnes in 2017-18 to 81 lakh tonnes in 2018-19 reporting a growth rate of 5.19 per cent. The largest producer of meat in the country is Uttar Pradesh producing 17 per cent of the total meat followed by West Bengal and Maharashtra each contributing 11 per cent and 10 per cent to the meat production. The species-wise meat contribution shows that nearly 50 per cent of meat production in the country is contributed by poultry. Maharashtra, Tamil Nadu and West Bengal are the largest producers of poultry meat in the country. Buffaloes and goats contribute 19 per cent and 14 per cent respectively to the total meat production in India. In Kerala, meat production shows a stagnant level of 4.69 lakh MT during the previous two years and declined to 4.57 MT in 2018-19 showing a negative growth of 2.56 per cent. Kerala is the 8th largest meat producing State in the country contributing 5.6 per cent of meat produced in India. Milk Marketing
Kerala is one of the States, which gives highest price for milk to the farmers in the country. The demand for milk is increasing day by day and the sale of Kerala Co-operative Milk Marketing Federation (MILMA) milk showed a decline in the current year. In 2018-19, a total of 6,802 lakh litres of milk was procured by the dairy co-operative societies in the State of which, 4,561 lakh litres were sent to the dairies and 2,215 lakh litres were marketed locally by the societies. The average milk poured per day by Anand Pattern Co-operative Societies (APCOS) in the year 2018-19 increased to 1528 MT against the previous year average of 1318 MT. The procurement/day/society in 2018-19 increased to 501 litres from 484 litres in 2017-18. The procurement of milk by Kerala Co-operative Milk Marketing Federation
(KCMMF) showed decrease of 3,563.30 lakh litres and the sale of 3,734.77 lakh litres in 2018-19. Except in Ernakulam, Palakkad and Wayanad, sales of milk exceeded procurement. The shortfall between milk procurement and sales was met by arranging milk mostly from State Milk Federations of Karnataka, Tamil Nadu and purchase of skimmed milk powder. Details on procurement and sale of milk by different dairies of KCMMF, performance of KCMMF and milk procured by APCOS are shown in Appendices 3.3.1, 3.3.2 and 3.3.3. The price revision and price spread of milk from 2010 onwards is given in Appendices 3.3.4 and 3.3.5 respectively. Feed and Fodder Base
In Kerala, special focus has been given to fodder and feed production to support the development of the livestock sector considering the wide gap in the availability of these two critical inputs. The Dairy Development Department is the nodal agency for fodder development activities in the State. Under the scheme, production and conservation of fodder in farmer fields and dairy co-operatives, commercial and massive fodder production in barren lands and wastelands has been initiated. The lands which are fertile yet remain underutilised under the ownership of progressive farmers, other individuals, LSGDs, PSUs etc., are to be selected and intensive fodder cultivation activities to be taken up. In the year 2018-19, fodder cultivation was taken up for 2235 Ha of land, 3.57 lakh metric tonnes of additional production ensured and 391.7 lakh fodder root slips/stem cuttings were supplied. Besides, assistance has been provided to farmers for Azolla cultivation, mechanisation of fodder cultivation and harvesting, irrigation facilities etc. The total production of cattle feed in 2018-19 is 3.61 lakh metric tonnes as against 3.53 lakh metric tonnes in 2017-18. The details of production, procurement, and supply of feed and fodder are shown in Appendices 3.3.6, 3.3.7 and 3.3.8 respectively.

88 Economic Review 2019, Kerala State Planning Board
Breeding Support
Kerala Livestock Development Board (KLDB) is involved in the production and distribution of frozen semen in the State. The semen production declined in 2018-19 to 19.99 lakh from 30.16 lakh doses in 2017-18. Though distribution inside the State decreased to 13.78 lakh doses in the current year to 14.41 lakh doses in the previous year, the distribution outside the State increased to 5.34 lakh doses from 2.95 lakh doses during the period. Details of production and distribution of Frozen Semen in Kerala are shown in Appendix 3.3.9. KLDB is developing a new software application for herd book registration electronically in association with IIITMK, so that the data could be synched with similar applications of Animal Husbandry department and Dairy development department.
The number of artificial insemination (AI) centres in the State in 2018-19 was 2,515. The number of inseminations done was 11.19 lakh and calving recorded was 2.91 lakh. The average number of inseminations needed for producing one calf is four (4). The details of Artificial Inseminations conducted and Recording Calving are shown in Appendix 3.3.10. Major activities of KLDB are given in Appendix 3.3.11. Special Livestock Breeding Programme (SLBP) The calf rearing programme by subsidising cattle feed for rearing cattle up to 32 months along with health cover and insurance has been under implementation since 1976 onwards. In 2006-07, the scheme was extended to buffalo calves also as a measure to curtail the drastic reduction in the buffalo population. Enrolment of buffalo calves shows a decreasing trend and no buffalo calves were enrolled between 2014-15 and 2017-18. The number of calves enrolled under the programme in 2017-18 was 83,196 as against 45,070 in 2018-19. Year-wise details of calves enrolled under Special Livestock Breeding Programme from 2008-09 onwards are shown in Appendix 3.3.12.
Animal Health Care
Animal Husbandry Department provides veterinary care mainly through 14 District Veterinary Centres, 50 Veterinary Polyclinics, 215 Veterinary Hospitals, 885 Veterinary Dispensaries, 38 regional Animal Husbandry Centres, 1359 Veterinary Sub Centres, 9 Mobile Veterinary Hospitals, 7 Mobile Farm Aid Units and one Motor Boat Veterinary Hospital. Effective and timely action was taken by the Animal Husbandry Department in liaison with respective administrations and Local Governments to eradicate contagious diseases. Mass campaign vaccination programmes like foot and mouth disease control programme, rabies free Kerala vaccination programme and Assistance to States for Control of Animal Diseases (ASCAD) poultry vaccinations are being conducted regularly. Details of outbreaks, attacks and death of major contagious diseases of animals in Kerala for the period from 2012-13 to 2018-19 are given in Appendix 3.3.13.
Emergency Veterinary Service during night hours
The service of a veterinary doctor is available only in the day time and it is difficult to get the service during odd hours of the day. Hence, a project was formulated to provide the expert veterinary care at block level from 6 pm to 6 am. The service of a registered veterinary practitioner is provided on contract basis. The unit is functioning under the direct supervision of one identified veterinary institution of the block area. Medicines are made available to them. Emergency night veterinary service was established in 105 selected blocks of the State up to 2018-19 and to be extended to 125 blocks in 2019-20.
Gosamrudhi – Comprehensive Livestock Insurance Scheme
A Comprehensive Livestock Insurance Scheme ‘ Gosamrudhi’ was introduced in 2017-18. The objective of the programme is management of

89Chapter 3, Agriculture and Allied Sectors
risk and uncertainties by providing protection mechanism to the farmers against any eventual loss of their animals due to death or permanent total disability resulting in total loss of production or infertility through insurance coverage. The maximum insured values of animal is ₹50,000. The premium rate is around 3 per cent of the cost of the animal and the subsidy rate towards premium is 50 per cent and 70 per cent for SCs/STs. One time insurance of an animal up to a maximum period of three years will be provided. The United Insurance Company was selected for implementing the scheme. In 2018-19, a total number of 28,225 animals were insured under the programme.
Production of Vaccine in Institute of Animal Health and Veterinary Biologicals, Palode
The Institute of Animal Health and Veterinary Biologicals, Palode is the sole agency engaged in the production and distribution of animal vaccine in Kerala. The production details of vaccines manufactured in the Institute are given in Appendix 3.3.14. In 2018-19, the production of poultry vaccine was 199.83 lakh doses and livestock vaccine by 6.22 lakh doses. Production of poultry vaccine increased by 8.57 per cent and livestock vaccine by 64.12 per cent compared to the previous year. Number of vaccinations done in 2018-19 was 23.95 lakh for livestock and 66.19 lakh for poultry. Compared to previous year, vaccination to cattle increased by 18.13 per cent and poultry by 62.63 per cent respectively. Anti-Rabies Vaccinations done on dogs increased from 1.98 lakh in 2017-18 to 2.07 lakh in 2018-19. Details are provided in the Appendix 3.3.15.
Kerala Veterinary and Animal Science University, Pookode, Wayanad
The Kerala Veterinary and Animal Science University has been established in the State with headquarters at Pookode, Wayanad for the development of education, research and extension in the Animal husbandry and Dairy development sectors. The Veterinary
and Animal Science faculty has been delinked from the Kerala Agricultural University for the establishment of the new University. The college of Veterinary and Animal Sciences at Mannuthy and Pookode in Wayanad, and College of Dairy Science and Technology at Mannuthy are the educational institutions of the University. The research stations and farms involved in Animal Husbandry research and support would be part of the University. The major objective of the institution is to promote livestock economy of the State by fostering quality professionals in the areas of veterinary, animal husbandry and dairy and assist in the implementation of research outcomes in field conditions.
Prices
Average price of important inputs and products of livestock sector for the last six years is presented in Appendix 3.3.16 and all the products except groundnut cake recorded an increase in prices during the period. The price of chicken broiler increased by 3.83 per cent and that of chicken (desi) was negligible compared to the previous year. The average price of mutton increased by 5.9 per cent and beef by 10.69 per cent, the rise being highest in the case of beef. Compared to 2017-18, the price of fowl-white egg increased by 4.16 per cent and brown egg by 1.08 per cent and duck egg by 3.47 per cent in 2018-19. The price of cow milk increased by 2.03 per cent and buffalo milk by 9.73 per cent in 2018-19. On the input side, in 2018-19, the price of straw increased by 12.04 per cent and grass by 6.12 per cent. Compared to the previous year, the price of ground nut cake decreased by 1.38 per cent, coconut cake by 9.97 per cent and gingerly oil cake by 6.36 per cent increase in 2018-19. The increase in the price of inputs is a serious threat to dairy farming and hence the possibility of indigenous source of feeds is to be explored. The trend in average prices of livestock products from 2013-14 to 2018-19 is shown in the Figure 3.3.5.

90 Economic Review 2019, Kerala State Planning Board
Figure 3.3.5 Trend in average prices of livestock products from 2013-14 to 2018-19Meat Egg
Milk Feeds
Source : Animal Husbandry Department GoK, 2019
Physical Achievements in 2018-19
• Emergency veterinary service during night hours at block level service provided in 125 (20 new) blocks of the State
• Under the Comprehensive Livestock Development Programme, ‘Gosamrudhi’, 28,225 livestock insured
• Enrolled 83,554 new calves under Govardhini and SLBP schemes and second year assistance for 35,070 calves enrolled in previous year was given. A total of 1,18,624 calves were benefitted
• Under the poultry rearing scheme through school children, five birds each were given to a total of 65,200 students
• Established 200 goat artificial insemination centres in association with KLDB
• In the department farms 35.84 lakh chicks, 53.88 lakh eggs, 2491 piglets 722 rabbit kits were produced
• Established 140 commercial goatery units and 387 backyard goat rearing units
• Under interest subvention scheme, an amount of ₹251.27 lakh expended and 6,291
farmers benefitted• In Alappuzha and Kollam Districts, 995
male calf fattening units established• Training was given to 8,558 farmers
through Livestock Management Training Centre
• As per SDRF norms an amount of ₹2,467 lakh provided as compensation to 39,163 flood affected farmers
The livestock sector has emerged as a vital sector for ensuring a more inclusive and sustainable agriculture system. Major challenges of animal husbandry sector are breed improvement while preserving diverse genetic resources, shortage of feed and fodder, effective control of animal diseases and dissemination of technology, skills and quality services to farmers for improving productivity, which need to addressed on priority basis. Productivity across various livestock species is a major issue especially in case of dairy animals. Therefore, it is essential to strengthen the existing breeding farms of small ruminants for ensuring availability of good breeding stock at field level to support the scientific rearing with high quality feed and fodder and other inputs.

91Chapter 3, Agriculture and Allied Sectors
Dairy Development
India ranks first among the world’s milk producing nations since 1998 and has the largest bovine population in the world. Milk production in India during the period 1950-51 to 2017-18, has increased from 17 million tonnes to 176.4 million tonnes. FAO reported 1.46 per cent increase in world milk production from 800.2 million tonnes in 2016 to 811.9 (Estim) million tonnes in 2017. The per capita availability of milk in the country which was 130 gram per day in 1950-51 has increased to 374 gram per day in 2017-18 as against the world estimated average consumption of 294 grams per day in 2017. This represents sustained growth in the availability of milk and milk products for our growing population.
Dairying has become an important secondary source of income for millions of rural families and assumed the most important role in providing employment and income generating
opportunities particularly for marginal and women farmers. Most of the milk is produced by animals reared by small, marginal farmers and landless labours. Of the total milk production in India, about 48 per cent of milk is either consumed at the producer level or sold to non-producers in the rural area. The balance 52 per cent of the milk is marketable surplus available for sale to consumers in urban areas. Out of marketable surplus it is estimated that about 40 per cent of the milk sold is handled by the organised sector (i.e. 20 per cent each by Co-operative and Private Dairies) and the remaining 60 per cent by the unorganised sector.
About 16.6 million farmers has been brought under the ambit of about 1,85,903 village level Dairy Co-operative Societies (DCS) up to March 2018. Despite the slump in world market and better procurement prices by dairy cooperatives along with decrease in procurement volume by major private players led to increase in milk collection by dairy cooperatives by about 11
Box 3.3.3 Bhoomika – GIS based mapping as a tool for Animal Resource Management System
Animal Husbandry Department has developed GIS based mapping of farmers “Bhoomika” to build a geospatial data base of farmers engaged in animal husbandry activities for effective management and monitoring of health, breeding, production, risk and disaster management, and human resource management. The institutions coming under the purview of the Department has been brought under the geo mapping system. It has been estimated that about 25 lakh households are involved in animal husbandry activities in the State and the Department could cover 4.8 lakh farmers involved in cattle/buffalo rearing till November 2019 and the process is continuing. ‘Bhoomika’ was developed in association with Indian Institute of Information Technology, Kerala (IIITMK) through which the geographical location of farmers can be captured. The app is available in Google Play store for download.
The data collection was done at farmers’ doorstep by the field level livestock Inspectors of Animal Husbandry Department and verified by local Veterinary Officers. A web portal was also developed simultaneously for analysing and generating different types of reports using the captured data. An Animal Resource Management Portal (ARMS) is also concurrently managed by the Department, which has been integrated with the GIS Portal. The geospatial data base provides a real time method to represent disease information on live maps and helps in disease control and surveillance activities. The tool was effectively utilised for disease surveillance during NIPAH outbreak and also for immediate containment vaccination during outbreak of diseases such as foot and mouth diseases for effective control.
Source: Animal Husbandry Department, GoK, 2019

92 Economic Review 2019, Kerala State Planning Board
per cent. The dairy cooperatives have procured daily average of milk about 475.6 lakh Kg per day (LKgPD) in 2017-18 as compared to 428.7 lakh Kg procured in 2016-17. The sale of liquid milk reached to 349.6 Lakh Litre per day (LLPD) in 2017-18 recording a growth of 6 per cent as compared to 331 LLPD marketed in 2016-17. Women members of DCS are also being encouraged to assume leadership roles. As on March 31, 2018, the total number of women in dairy cooperatives across the country was 4.9 million in 32,092 women DCS which is 29.5 per cent of total farmers. The prime objective of Department of Dairy Development of Kerala comprehensive and sustainable Dairy development of the State with well-being of dairy farmers, consumers and other stakeholders and act as the nodal agency for fodder development activities in the State. The Department has 162 dairy extension service units, 14 quality control units, a State Dairy lab which has NABL accreditation for testing milk and milk products, cattle feed and water, three Regional Dairy Labs, Mobile Quality Control Units, Five Diary Training Centres, one State Fodder farm, 3673 dairy co-operative societies and 3.41 lakh registered farmers. In the year 2018-19, 6.80 lakh MT milk was produced by DCS
(18.64 lakh litre per day) while the estimated milk production in the State is around 28 lakh MT. Physical Achievements in 2018-19
• Comprehensive Dairy Insurance Scheme launched and 20,162 enrolment has already been made. Online registration of 3.48 lakh dairy farmers completed in the State
• As part of Stragic Research and Extension Plan (SREP), four elite dairy farmers were assisted for establishing commercial dairy farm with 20 milch animal each
• Fodder cultivation was taken up in 2235 Ha of land, 3.57 lakh metric tonnes of additional production was ensured.
• Massive Fodder cultivation was implemented in 67 Ha of barren land in selected Panchayats.
• Assisted 12,92 dairy farmers for construction/renovations of scientific cattle shed
• Completed online registration of 3.48 lakh dairy farmers throughout the State
• Under the Special Rehabilitation Programme for flood affected dairy farmers of the State, 3000 milch cows were distributed and 1500 farmers were assisted in a need based manner and 630 farmers
Box 3.3.4 Regional Comprehensive Economic Partnership (RCEP)
RCEP is a proposed free trade agreement in the Asia-Pacific region between the ten member States of the Association of Southeast Association Nations (ASEAN) (Brunei, Cambodia, Indonesia, Laos, Malaysia, Myanmar, Philippines, Singapore, Thailand and Vietnam) and their six FTA partners (Australia, China, India, Japan, New Zealand, and South Korea). The objective of RCEP agreement is to achieve a modern, comprehensive, high quality, and mutually beneficial economic partnership agreement among the ASEAN member States and its FTA partners. The RCEP pact covers trade in goods and services, and also investments, economic – technical cooperation, competition and intellectual property rights. It is the biggest free trade agreement with 40 per cent of global commerce and 35 per cent GDP involving 16 countries, home 3.6 billion people or half the population of the world. The RCEP negotiations were launched by ASEAN and six other countries during the 21st ASEAN summit and India has seen its trade deficit with most countries rising manifold after an FTA was operationalised. India decided not to join the RCEP. India wanted a key clause to be included in the pact for auto – trigger mechanism as a shield against sudden and significant import surge from countries.
Source: State Planning Board

93Chapter 3, Agriculture and Allied Sectors
were assisted for construction/renovation of cattle shed.
Government is giving special focus on fodder and feed production to support development of the livestock sector and bridge the gap in the demand and supply of feed and fodder. Deficiency of feed and fodder results in low productivity. Hence, it is essential to promote more investment for augmenting feed and fodder resources through technologies viz, cultivation of improved varieties, silage making etc. Climate change has become major threat and is impacting livestock productivity and also food security of most vulnerable rural population. Climate Smart Livestock farming should be on the top of agenda for future initiatives on livestock development.

94 Economic Review 2019, Kerala State Planning Board
3.4 Fisheries Development
Fisheries are an important sector in the National and the State economies. The sector makes vital contribution to GDP and employment; and catalyses growth in a number of industries. It is a source of cheap and nutritious food and also earns foreign exchange for the economy.
According to the ‘The State of World Fisheries and Aquaculture 2018-Meeting the sustainable development goals’ published by Food and Agriculture Organisation (FAO), among the countries in the world, India ranks second in inland waters captured fish production and sixth in marine captured fish production. India is the second largest producer of fish and also second largest aquaculture nation in the world after China (Annual Report 2018-19, Department of Animal Husbandry,
Dairying and Fisheries, GoI). The total fish production in India in 2017-18 was 125.90 lakh tonnes with a contribution of 89.02 lakh tonnes from inland sector and 36.88 lakh tonnes from marine sector. Growth rate of total fish production in 2017-18 was 10.14 per cent. Inland fish production constitutes 71 per cent of the total fish production in the country and annual growth rate of production has also been high. The growth rate was 14.05 per cent in 2017-18. Over years, the share of marine fisheries has decreased in India’s total fish production. It was 29 per cent in 2017-18. Though marine fish production has increased during the recent years, the growth rate is low during the last three years. Growth rate of marine fish production in 2017-18 was 1.73 per cent (Handbook on Fisheries Statistics 2018, Department of Fisheries, GoI).
Fisheries engage over 160 lakh people at the primary level and many more along the value chain. In 2017-18 the volume of fish and fish products exported was 13,77,243.70 tonnes worth ₹45,106.90 crore. The export of Marine Fish products has registered growth of 21.35 per cent (Quantity) and 19.11 per cent (Value) in 2017-18.
Fisheries sector has witnessed administrative changes in GoI in 2019. Fisheries now has a dedicated department namely Department of Fisheries. A new ministry namely the Ministry of Fisheries, Animal Husbandry and Dairying has also been carved out from the Ministry of Agriculture and Farmers Welfare.
In the case of total fish production in 2017-18, Kerala was ranked 10th among fish producing States in India. Kerala was ranked 5th in the case of marine fish production. However, the State does not feature in the top 10 inland fish producing States in 2017-18 (Source: Handbook on Fisheries
Statistics 2018, Department of Fisheries, GoI).
The total fish production in Kerala in 2018-19 was 8.01 lakh tonnes, of which Marine fish production was 6.09 lakh tonnes and Inland fish production was 1.92 lakh tonnes. Details are provided in Appendix 3.4.1. Year wise details of fish production in Kerala are provided in Figure 3.4.1.
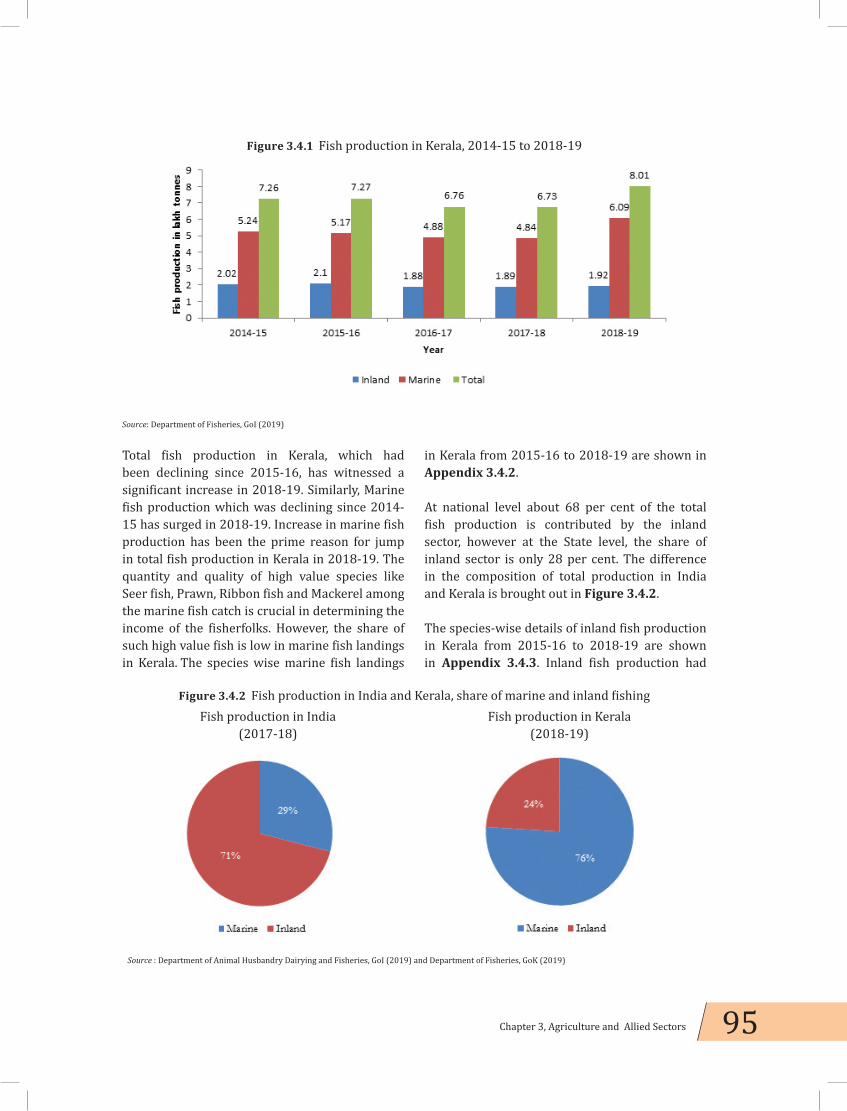
95Chapter 3, Agriculture and Allied Sectors
Total fish production in Kerala, which had been declining since 2015-16, has witnessed a significant increase in 2018-19. Similarly, Marine fish production which was declining since 2014-15 has surged in 2018-19. Increase in marine fish production has been the prime reason for jump in total fish production in Kerala in 2018-19. The quantity and quality of high value species like Seer fish, Prawn, Ribbon fish and Mackerel among the marine fish catch is crucial in determining the income of the fisherfolks. However, the share of such high value fish is low in marine fish landings in Kerala. The species wise marine fish landings
in Kerala from 2015-16 to 2018-19 are shown in Appendix 3.4.2.
At national level about 68 per cent of the total fish production is contributed by the inland sector, however at the State level, the share of inland sector is only 28 per cent. The difference in the composition of total production in India and Kerala is brought out in Figure 3.4.2. The species-wise details of inland fish production in Kerala from 2015-16 to 2018-19 are shown in Appendix 3.4.3. Inland fish production had
Figure 3.4.1 Fish production in Kerala, 2014-15 to 2018-19
Source: Department of Fisheries, GoI (2019)
Figure 3.4.2 Fish production in India and Kerala, share of marine and inland fishingFish production in India
(2017-18)Fish production in Kerala
(2018-19)
Source : Department of Animal Husbandry Dairying and Fisheries, GoI (2019) and Department of Fisheries, GoK (2019)

96 Economic Review 2019, Kerala State Planning Board
improved during the period 1999-2000 to 2015-16. A fall in production was witnessed in 2016-17. However, inland fish production has increased marginally during the last two years. According to the Handbook on Fisheries Statistics 2018, Department of Fisheries, GoI, inland fisheries resources of Kerala constitute 6.6 per cent of inland fisheries resources of India. However, the share of Kerala in total inland fish production is only about 1.7 per cent. States with smaller inland water resource endowment like Assam, Bihar, Haryana, Chhattisgarh and Uttar Pradesh have shown better inland fish production. Kerala has scope to improve the utilisation of its resources in Inland fishing.
Population of Kerala is 334 lakh according to Census 2011 and the fisherfolk population in 2018-19 is estimated to be around 3.1 per cent of Census population. They reside in 222 marine fishing villages and 113 inland fishing villages of the State. The fisherfolk population of the State for 2018-19 is estimated as 10.39 lakh. Out of this, 8 lakh belong to marine sector while 2.39 lakh belong to inland sector. Alappuzha (1.93 lakh) is the District with largest fisherfolk population, followed by Thiruvananthapuram (1.72 lakh) and Ernakulam (1.38 lakh). Wayanad is the District with the lowest Fisherfolk population. The District wise details of fisherfolk are given in Appendix 3.4.4.
The number of active fish workers in the State in 2018-19 was 2,42,954 of which 88 per cent (2,13,058) were males. Thiruvananthapuram District had the largest number of active fish workers, followed by Alappuzha and Malappuram. Active fish workers are those fish workers who are engaged in fishing for their livelihood and are registered with Kerala Fishermen’s Welfare Fund Board. In 2018-19, the number of allied workers in fisheries in Kerala was 84,483 of which 80 per cent (67,757) were women. Their number was highest in the District of Alappuzha, followed by Kollam and Ernakulam. Allied workers are those engaged in fishery related activities for livelihood and are registered with Kerala Fishermen’s Welfare Fund Board.
Fisheries and aquaculture contributes 10.3 percentage of the Gross State Value Added (GSVA at constant prices 2018-19 (Q)) from the primary sector. The GSVA of the State has been growing over years, but the share of primary sector has been declining. Though the share of other components of primary sector like crops, livestock, and forestry in GSVA has declined, the share of fisheries sector has remained around 1 per cent of GSVA. Details regarding the contribution of fisheries sector in GSVA are given in Appendix 3.4.5.
An analysis of the figures of District wise fish production in Kerala shows that the District of Kollam is the leading producer of marine fish followed by Ernakulam and Kannur. These 3 Districts together contribute around 72 per cent of the total marine fish production in the State. Alappuzha and Kottayam are the leading inland fish producing Districts, followed by Thrissur and Ernakulam. In the case of total fish production, the leading producer is the District of Kollam followed by Alappuzha and Ernakulam respectively. Details are provided in Appendix 3.4.6.
Kerala has made vital contributions in the export of marine products from the country. In 2018-19, export of marine products from Kerala was 1,83,064 tonnes valued at ₹6014.70 crore. Quantity and value of exports of marine products from Kerala has been increasing since 2015-16. However, the share of Kerala in the total export of marine products from India is falling, in terms of value, over the years. The share of Kerala in the total export of marine products from India in terms of quantity has increased marginally in 2018-19. Details are provided in Appendix 3.4.7.
Key Initiatives in 2019-20
Inland fish production is an area which holds promise for future in Kerala. Insufficient availability of good quality fish seeds has been identified as a major problem. To increase the production of good quality fish seeds, it is required to strengthen the existing hatcheries,

97Chapter 3, Agriculture and Allied Sectors
nurseries, fish farms and construct new units to the existing infrastructure. In 2019-20, an amount of ₹109.05 crore is allocated for inland fisheries, which includes ₹74.20 crore specifically for Aquaculture. An amount of ₹13 crore is provided to enhance sea safety and improve sea rescue operations.
In order to address the relative economic and social backwardness of the fishing community, the Government of Kerala had initiated a new scheme ‘Basic infrastructural facilities and human development of fisherfolk’ in 2015-16. The outlay to the scheme is ₹119.60 crore in 2019-20 of which ₹10 crore is provided exclusively for rehabilitation of fish workers who stay within 50 metres from the coast, and are vulnerable to sea erosion. Provision for purchase of land and construction of house is built into the scheme.
Performance Review of Annual Plan 2018-19
The total outlay under State Plan for Fisheries and Coastal Area Development in 2018-19 was ₹502.65 crore. Total expenditure reported is ₹344.20 crore, which is about 68.5 per cent of the State Plan outlay. The outlay on CSS schemes was ₹42.64 crore and the expenditure during this period was ₹10.45 crore (24.52 per cent). CSS schemes included a scheme receiving NCDC Assistance where the outlay was ₹12 crore and expenditure was ₹5.78 crore (48 per cent).
Major Developmental Programmes
The Plan schemes of State Government under Fisheries sector in 2018-19 is broadly classified into the following :
1. Marine fisheries development 2. Inland fisheries development3. Blue Revolution – CSS Scheme4. Extension, Training and service delivery 5. Modernisation of markets and value
addition6. Social Security to fisherfolks 7. NABARD Assisted RIDF8. Development of Fishing Harbours and
management – includes CSS components
9. Scheme for the Fisheries University10. Coastal Area Development
In the public sector, 11.82 crore fish seed was produced in the State, in the facilities available with Fisheries Department, ADAK, FIRMA, and Matsyafed. 2312 patrolling trips were conducted in sea, 404 rescue operations were undertaken and 3353 persons were rescued from sea, in the year 2018-19. A total of 597 patrolling trips were also conducted in inland water bodies of the State. 500 handheld GPS phones were provided to fish workers.
Aquatic animal health labs were developed in Kozhikode, Malappuram and Wayanad. 6 fish markets at Mannarkkad, Chembukavu, Irinjalakkuda, Mavelikkara, Anchal, and Mallappally were modernised. 3 mobile fish marts were introduced under the scheme ‘Andhippacha’. 140 children were provided coaching for competitive examinations and 14 students were adopted for their complete education. Education aid was given to 12,830 students.
As a part of addressing issues prevailing in the housing sector of fisherfolks, assistance is provided to them for construction of new houses. 942 fisherfolks received the assistance in 2018-19. Financial support is also provided for purchase of land to fish workers who are ready to relocate to areas beyond 50 metres from the coast. 380 fisherfolks received assistance for purchase of land and construction of house.
Harbour Engineering Department and Fishing Harbours
The Government of Kerala has so far completed construction work of 15 fishing harbours and the works of another 9 are progressing. Thalai fishing harbour in Kannur District was commissioned on May 18, 2018. Chettuva Fishing Harbour in Thrissur District was commissioned on February 25, 2019. The completed fishing harbours are Vizhinjam, Thankassery, Neendakara, Kayamkulam, Thottappally, Munambam, Chettuva, Ponnani,

98 Economic Review 2019, Kerala State Planning Board
Beypore, Puthiyappa, Chombal, Thalai, Moplabay, Azheekal and Cheruvathoor. The on-going fishing harbour works are Muthalapozhy, Chethi (I and II), Arthungal (II), Chellanam (I and II), Thanur, Koyilandi, Vellayil, Manjeswaram and Kasargode. The location of Fishing Harbours in Kerala and their status are provided in Figure 3.4.3. In 2018-19, Plan support was extended for construction of fishing harbours like Arthungal, Vellayil, Thanoor, Manjeswaram, and Koyilandi; and Munakkakadavu Fish Landing Centre. In addition to these, funds were provided for completion and operationalisation of Chettuva,
Cheruvathur and Thalai fishing harbours. Support was provided for Management of Fishing Harbours. In order to keep the fishing harbours operational throughout the year, support was also provided for carrying out capital repairs and maintenance dredging. In 2018-19, ₹29.10 crore was provided exclusively for fishing harbours under the State Plan. Expenditure incurred was ₹13 crore.
Construction of fishing harbours was previously undertaken with the help of State funds, funds from central government (50 per cent and 75 per cent CSS), fund under central schemes like
Figure 3.4.3 Fishing harbours in Kerala, location and status
Source: Harbour Engineering Department,GoK (2019)
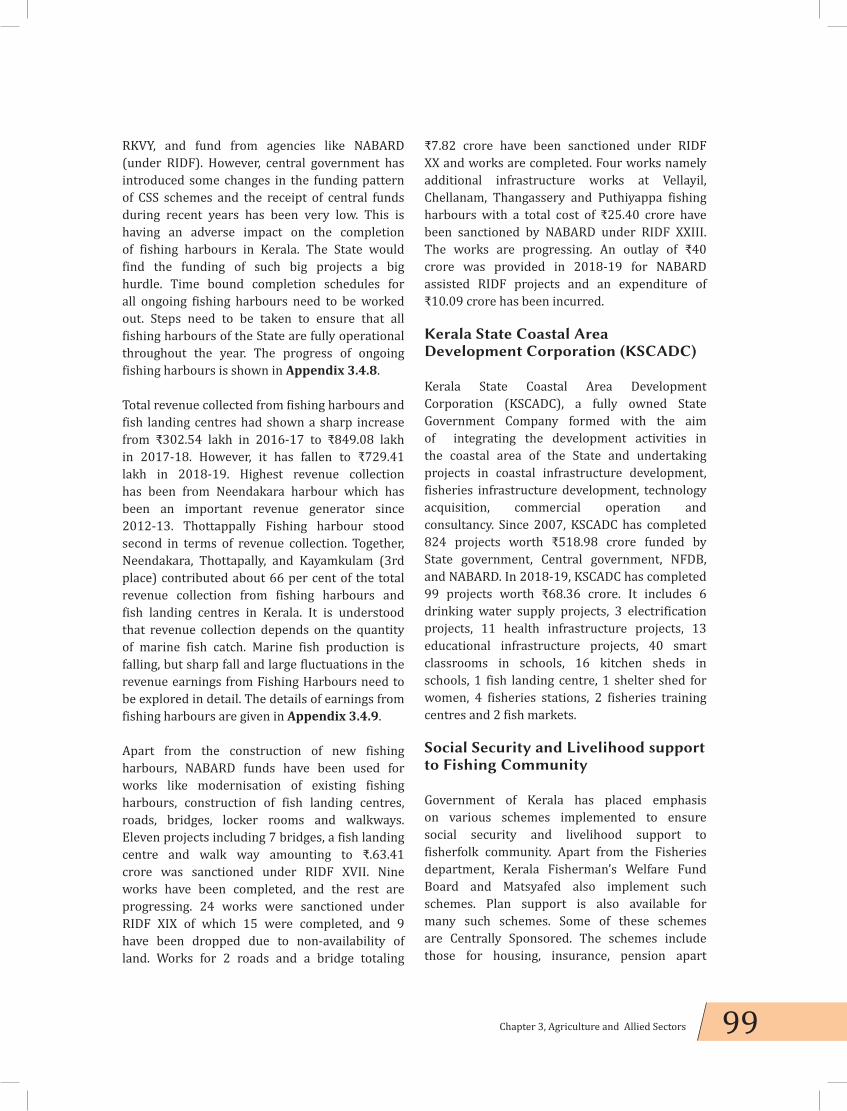
99Chapter 3, Agriculture and Allied Sectors
RKVY, and fund from agencies like NABARD (under RIDF). However, central government has introduced some changes in the funding pattern of CSS schemes and the receipt of central funds during recent years has been very low. This is having an adverse impact on the completion of fishing harbours in Kerala. The State would find the funding of such big projects a big hurdle. Time bound completion schedules for all ongoing fishing harbours need to be worked out. Steps need to be taken to ensure that all fishing harbours of the State are fully operational throughout the year. The progress of ongoing fishing harbours is shown in Appendix 3.4.8.
Total revenue collected from fishing harbours and fish landing centres had shown a sharp increase from ₹302.54 lakh in 2016-17 to ₹849.08 lakh in 2017-18. However, it has fallen to ₹729.41 lakh in 2018-19. Highest revenue collection has been from Neendakara harbour which has been an important revenue generator since 2012-13. Thottappally Fishing harbour stood second in terms of revenue collection. Together, Neendakara, Thottapally, and Kayamkulam (3rd place) contributed about 66 per cent of the total revenue collection from fishing harbours and fish landing centres in Kerala. It is understood that revenue collection depends on the quantity of marine fish catch. Marine fish production is falling, but sharp fall and large fluctuations in the revenue earnings from Fishing Harbours need to be explored in detail. The details of earnings from fishing harbours are given in Appendix 3.4.9.
Apart from the construction of new fishing harbours, NABARD funds have been used for works like modernisation of existing fishing harbours, construction of fish landing centres, roads, bridges, locker rooms and walkways. Eleven projects including 7 bridges, a fish landing centre and walk way amounting to ₹.63.41 crore was sanctioned under RIDF XVII. Nine works have been completed, and the rest are progressing. 24 works were sanctioned under RIDF XIX of which 15 were completed, and 9 have been dropped due to non-availability of land. Works for 2 roads and a bridge totaling
₹7.82 crore have been sanctioned under RIDF XX and works are completed. Four works namely additional infrastructure works at Vellayil, Chellanam, Thangassery and Puthiyappa fishing harbours with a total cost of ₹25.40 crore have been sanctioned by NABARD under RIDF XXIII. The works are progressing. An outlay of ₹40 crore was provided in 2018-19 for NABARD assisted RIDF projects and an expenditure of ₹10.09 crore has been incurred.
Kerala State Coastal Area Development Corporation (KSCADC)
Kerala State Coastal Area Development Corporation (KSCADC), a fully owned State Government Company formed with the aim of integrating the development activities in the coastal area of the State and undertaking projects in coastal infrastructure development, fisheries infrastructure development, technology acquisition, commercial operation and consultancy. Since 2007, KSCADC has completed 824 projects worth ₹518.98 crore funded by State government, Central government, NFDB, and NABARD. In 2018-19, KSCADC has completed 99 projects worth ₹68.36 crore. It includes 6 drinking water supply projects, 3 electrification projects, 11 health infrastructure projects, 13 educational infrastructure projects, 40 smart classrooms in schools, 16 kitchen sheds in schools, 1 fish landing centre, 1 shelter shed for women, 4 fisheries stations, 2 fisheries training centres and 2 fish markets.
Social Security and Livelihood support to Fishing Community
Government of Kerala has placed emphasis on various schemes implemented to ensure social security and livelihood support to fisherfolk community. Apart from the Fisheries department, Kerala Fisherman’s Welfare Fund Board and Matsyafed also implement such schemes. Plan support is also available for many such schemes. Some of these schemes are Centrally Sponsored. The schemes include those for housing, insurance, pension apart

100 Economic Review 2019, Kerala State Planning Board
from those which enable fisherfolks to earn livelihood on a continuous basis. 2.42 lakh fisherfolks benefitted from Group Accident Insurance Scheme. Additionally, 84,483 allied workers also benefitted from this Scheme. Old age pension was provided to 52,558 fisherfolks. Number of beneficiaries under the scheme ‘Pension for wives of deceased fishermen’ was 9,074. A total of 1,72,272 fisherfolks in marine fisheries and 24,143 fisherfolks in inland fisheries were provided support during the ‘off season’ under the ‘Saving cum Relief Scheme’. Details of such schemes implemented by the Fisheries department and KFWFB are provided in Appendix 3.4.10 and 3.4.11 respectively. The State has been able to provide greater assistance to the fishing community, and expand the social security net over the years. Matsyafed
Matsyafed is an apex federation of 656 primary level Fishermen Development Welfare Co-operative Societies, of which 335 are in marine sector, 199 are in inland sector and 122 are women co-operative societies. The total membership in these societies is more than 4.64 lakh. The authorised share capital of the federation is ₹150 crore. Matsyafed has organised self-help groups (SHGs) within the fishing community and has developed among them, the habit of savings. By providing micro finance and interest free loans, Matsyafed has made an impact in the area of micro credit. In 2018-19, micro finance support was provided to SHGs which have benefitted 27,887 beneficiaries. 13,018 fisherwomen were provided interest free loans. Matsyafed has also been successful in enabling the fisherfolk have access to vital fishing inputs. There were 48 beneficiaries in 2018-19. 200 fisherfolks were provided assistance for modernising the traditional crafts. The achievement of various programmes implemented by Matsyafed is given in Appendix 3.4.12.
Society for Assistance to Fisherwomen (SAF) and Women Empowerment
Society for Assistance to Fisherwomen (SAF) is an agency established to enable the overall development and empowerment of fisherwomen in the State. It extends financial, technological and managerial support to fisherwomen to organise group activity, start micro enterprises and run the businesses in a sustainable manner. In order to promote alternative livelihood activities especially for development of micro enterprises among fisherwomen, assistance was provided to 1,002 beneficiaries. Capacity building training was provided to 3,693 new beneficiaries and 1,404 existing members. Support was provided to 144 groups for technology improvement in their units. 195 fisherwomen benefitted from the Theeranaipunya scheme, which seeks to equip fisherwomen below the age of 30 for future. The achievement of various programmes implemented by SAF is given in Appendix 3.4.13.
In the 11th Five Year Plan, marine fisheries sector achieved growth especially in the area of infrastructure development. The 12th Plan strategy was to ensure sustainable growth of fish and fisheries for nutrition, food security and economic growth by ensuring proper utilisation of infrastructure created in the previous Plan. Special emphasis was given to conservation and management of inshore fishery resources, enhancement of offshore marine fish production, maximum utilisation of harvested fish and value addition. The 13th Five Year Plan places emphasis on a) nutritional security through enhancing fish production, and b) poverty reduction among fisherfolk by ensuring distribution of production benefits to the community on a sustainable and equitable basis.
Climate change and degradation of environment pose significant challenges to the sector. Moreover, fisheries in Kerala is recovering from two natural disasters, namely cyclone Ockhi (November 2017) and floods (August 2018) which had adversely affected this sector during
101Chapter 3, Agriculture and Allied Sectors
the recent past. However, the resource base of the State offers ample scope for growth of fisheries. The marine sector has started reaping the benefits of conservation and management measures initiated during the past two years. Aquaculture especially in the Inland waters offers new opportunities for the future. An active role and contribution from LSGIs can bring a revolutionary change in this direction. To ensure sustainability of fisheries, resource conservation and elimination of harmful fishing practices need greater emphasis. With innovative financing, adoption of technological advances and expansion of extension services; the sector can be expected to do well and be a sunrise sector in the coming years.

102 Economic Review 2019, Kerala State Planning Board
3.5 Water Resources
It is known that agriculture sustains society while irrigation sustains agriculture. Judicious utilisation of water resources through appropriate conservation and management assumes critical importance in sustaining life support systems and also enhancing productivity, augmenting profits in agriculture in an ecologically sustainable manner. Expanding agriculture, growing industrialisation, increasing population and rising standards of living have increased our water demands. Declining per capita water availability and failure to manage the water resources effectively have contributed to India’s water crisis. With the limitations on the availability of water resources, sustainable water management acquires importance. NITI Aayog’s Composite Water Management Index (CWMI) points out that (a) Kerala has restored 95 per cent of the irrigation potential of identified water bodies and (b) Kerala utilises 80 per cent of its irrigation potential.
Need for Improved Water Management
The floods of 2018 and 2019 have necessitated increased focus on improving the safety and operational performance of selected dams including their periodical inspection as well as hydrological review. It focuses on the need of developing irrigation through heavy investment for improved flood management, multi-purpose dams and creation of locally distributed storage structures. An integrated reservoir operations
system is essential for improved management and use of water.
Water Resources Information System (WRIS) supports the strengthening of national and sub national water information centres. This will be done with web enabled water resources information systems through standardisation of databases and products from various data sources. This facilitates timely and integrated water resources information for effective planning. Data sources include real time data acquisition networks, remote sensing data, topographical maps etc.
National Hydrology Project, a 100 per cent Central Sector Scheme (CSS), intends activities such as Real Time Data Acquisition System, discharge measurement, State Water Resources Information Systems (SWRIS), Purpose driven studies and Reservoir operation systems. In 2018-19, ₹1.63 crore was expended against the Annual Work Plan for ₹9.30 crore.
Dam Rehabilitation and Improvement Project (DRIP), a World Bank funded scheme, is being implemented since 2012. The rehabilitation/upgrading of sixteen projects of Irrigation department viz; Malampuzha, Neyyar, Peechi, Walayar, Kuttiyadi, Kanjirapuzha, Chimoni, Malankara, Kallada, Pothundy, Vazhani, Meenkara, Chulliyar, Pazhassi, Periyar and Moolathara regulator are being taken up under the scheme. The Phase I of DRIP will come to an
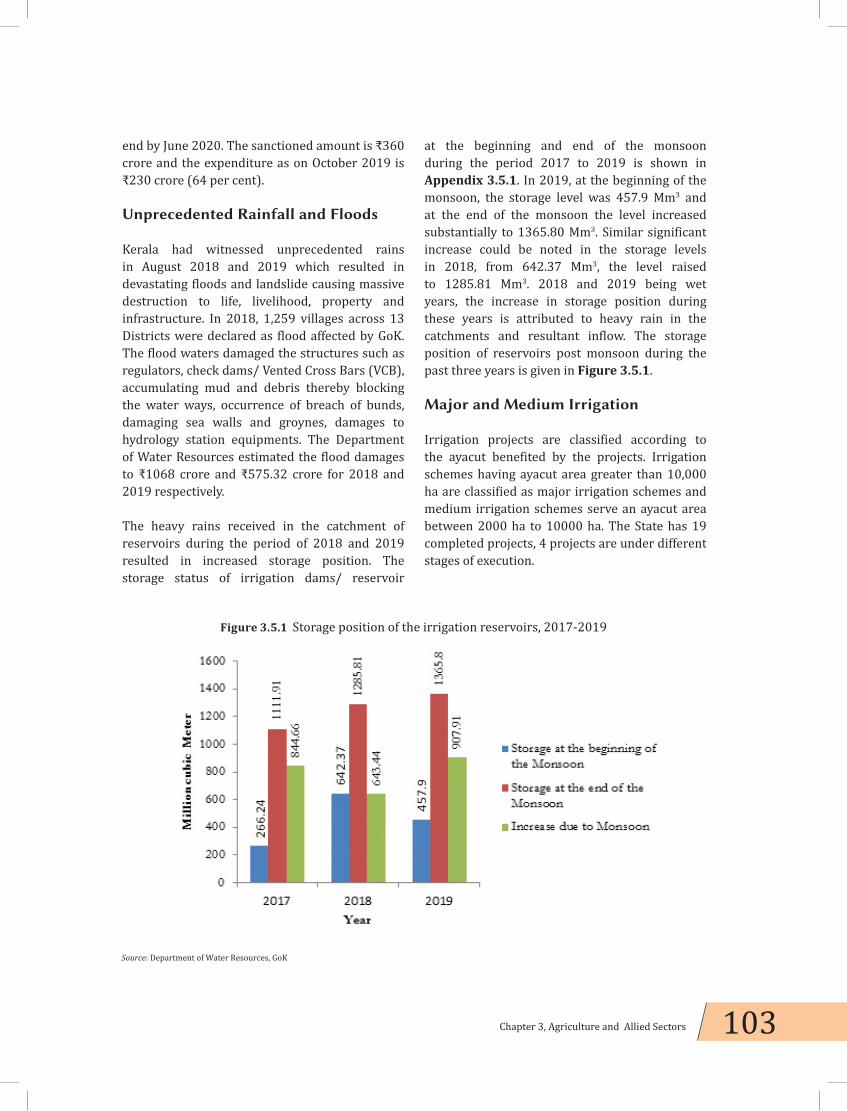
103Chapter 3, Agriculture and Allied Sectors
end by June 2020. The sanctioned amount is ₹360 crore and the expenditure as on October 2019 is ₹230 crore (64 per cent).
Unprecedented Rainfall and Floods
Kerala had witnessed unprecedented rains in August 2018 and 2019 which resulted in devastating floods and landslide causing massive destruction to life, livelihood, property and infrastructure. In 2018, 1,259 villages across 13 Districts were declared as flood affected by GoK. The flood waters damaged the structures such as regulators, check dams/ Vented Cross Bars (VCB), accumulating mud and debris thereby blocking the water ways, occurrence of breach of bunds, damaging sea walls and groynes, damages to hydrology station equipments. The Department of Water Resources estimated the flood damages to ₹1068 crore and ₹575.32 crore for 2018 and 2019 respectively.
The heavy rains received in the catchment of reservoirs during the period of 2018 and 2019 resulted in increased storage position. The storage status of irrigation dams/ reservoir
at the beginning and end of the monsoon during the period 2017 to 2019 is shown in Appendix 3.5.1. In 2019, at the beginning of the monsoon, the storage level was 457.9 Mm3 and at the end of the monsoon the level increased substantially to 1365.80 Mm3. Similar significant increase could be noted in the storage levels in 2018, from 642.37 Mm3, the level raised to 1285.81 Mm3. 2018 and 2019 being wet years, the increase in storage position during these years is attributed to heavy rain in the catchments and resultant inflow. The storage position of reservoirs post monsoon during the past three years is given in Figure 3.5.1.
Major and Medium Irrigation
Irrigation projects are classified according to the ayacut benefited by the projects. Irrigation schemes having ayacut area greater than 10,000 ha are classified as major irrigation schemes and medium irrigation schemes serve an ayacut area between 2000 ha to 10000 ha. The State has 19 completed projects, 4 projects are under different stages of execution.
Figure 3.5.1 Storage position of the irrigation reservoirs, 2017-2019
Source: Department of Water Resources, GoK

104 Economic Review 2019, Kerala State Planning Board
Status of irrigation projects under implementation
The status of implementation of the four continuing irrigation projects is given in Appendix 3.5.2. The progress of implementation of these four projects is detailed below.
Muvattupuzha Valley Irrigation Project (MVIP)
Muvattupuzha Valley Irrigation Project, started with an initial estimate cost of ₹20.86 crore, has a Right Bank Main Canal (RBMC -28.339 km) and Left Bank Main Canal (LBMC-37.1 km). The branches of RBMC and LBMC have a total length of 57.154 km, while the distributaries have a total length of 213 km.
Ninety three per cent of the length of branch canal is completed. Madakkathanam, Anicadu, Edayar and Karikkode (1st reach) distributaries are in progress. The completion of Ezhuthonippadam aqueduct over railway line at Ch.18275 between Kuruppunthura and Ettumanoor railway station benefitted an ayacut of 902 ha land. Similarly, the completion
of Kurumulloor distributary enabled water distribution to Pennarthodu, thereby reducing salinity intrusion in the area and also made possible the cultivation in Upper Kuttanad. The completion of Elanji and Madakkathanam distributaries helped in irrigating 298 ha and 126 ha respectively. The financial expenditure upto March 2019 is ₹1051.58 crore and the gross physical achievement is 32,724 ha. The project is targeted to be commissioned by March 2020.
Idamalayar Irrigation Project (IIP)
Idamalayar irrigation project commenced in 1981 with an estimated cost of ₹17.85 crore. Main canal works were completed for the full length of 32.278 km. The length of the Low Level Canal (LLC) is limited upto 15th km, in that stretch there are two bottlenecks – MC road crossing and Railway crossing. By adopting the push through mechanism, the works of MC road crossing could be completed successfully within a year, thereby enabling water distribution till Ch.13879.5 m in LLC. Having deposited ₹3.06 crore to the railway department, work is expected to start by January. The process of laying sluices at LLC in two locations have been initiated (a) at Ch.12250
Box 3.5.1 On-going Major and Medium Irrigation Projects - interventions of the Technical Committee
Perceiving the necessity of examining the implementation delay in Muvattupuzha, Idamalayar, Karapuzha and Banasurasagar Irrigation projects, a five member Technical Committee was constituted by State Planning Board in 2017. The Committee having analysed the issues that obstruct the speedy implementation, had identified and prioritised the works for facilitating the completion/ commissioning of these projects.
These four projects, commenced in 70s and 80s were continuing with time and cost over runs. Major breakthrough in work progress could be achieved by the timely interventions / monitoring by this Technical Committee. All these four are in various stages of progress as per the observations and the time frame scheduled by the Technical Committee.
Areas of immediate thrust are : 1. Commissioning of Muvattupuzha Valley Irrigation Project at the earliest without further delay2. Solving the long lasting issue in the main canal of Banasurasagar project3. Expanding the capacity of Karapuzha reservoir to its full level. 4. Make the low level canal water through, to the approved scope, by completing MC road crossing and railway crossing works of Idamalayar project
Source: Technical Committee on the ongoing Major and Medium Irrigation Projects in Kerala, KSPB, 2018

105Chapter 3, Agriculture and Allied Sectors
mtr to Chuttupadam which will irrigate 100 ha and (b)at Ch.3000 mtr to Cheruchalpuncha which benefits 80 ha. The social impact study for acquiring land for the construction of flush escape is completed and ₹8.00 lakh is already deposited for LA process. This will help to irrigate the padasekharams on either side of Manjalithodu and also to control salinity intrusion. The financial expenditure upto March 2019 is ₹475.45 crore and the gross physical achievement is 3098 ha.
Karapuzha Irrigation Project (KIP)
Karapuzha Irrigation Project, a medium irrigation project in Kabini sub basin was started with an estimate of ₹7.60 crore and was partially commissioned on 20th June 2010.
Rectification of the breach in RBMC between Ch.7673 m and 7888m had been completed. This would enable water distribution possible upto the tail end i.e. Ch.8805 m, benefiting an ayacut of 44.47 ha. The required land for the construction of Ponginithodi, Arimula, Vallipetta, Cheekkallur and Manivayal distributaries off taking from the Right Bank canal system are in possession of the department. Fixing the hydraulic particulars of these canals has been carried out presently. Almost all the rectification works in LBMC were carried out in 2018-19, and by rectifying a major breach at Ch4800m, occurred due to floods, the entire LBMC upto tail end Ch.16740m can be made operational. The financial expenditure up to March 2019 is ₹328.014 crore. The total CCA created is 601 ha and the corresponding irrigation potential is 938 ha.
Banasurasagar Irrigation Project (BSP)
Banasurasagar Irrigation project, in the Karamanthodu basin, envisages irrigating an area of 2800 ha (net) agriculture land for the second and third crops in two taluks of Wayanad District. It consists of a main canal having a length of 2.73 km and two branch canals-Padinjarathara (9.030 km) and Venniyode (5.390 km). In 2018-19, steps were taken to tender the restoration works of flood damages in the main canal and Venniyode
branch canal in addition to the main canal protection works, Venniyode branch canal works including covered flume and CD works (Ch.570 m to 1715 m), construction works of Kappumkunnu distributary etc. The financial expenditure as on March 2019 is ₹60.66 crore.
Flood Management Programmes in Kuttanad
Kuttanad is a water centric ecosystem which is a flood plain of five rivers-Achencovil, Pamba, Manimala, Meenachil and Moovattupuzha which opens into a web of larger and smaller water ways and canals with many permanent and temporary links. (A special Package for Post Flood Kuttanad, 2019, Kerala State Planning Board)
The flood water that flows along the agrarian land results in extended flooding for several days. Lack of sufficient direct outlets to sea for proper flood water disposal, salinity intrusion during summer season, ecological degradation of wet land, heavy maintenance cost of outer bunds etc are some of the difficulties faced in that region. Floods in the years 2018 and 2019 resulted in breached bunds across the region leading to flooding of houses, destruction of paddy cultivation, uprooting of coconut palms, damages to motorthara and connected constructions etc.
Out of the four schemes approved by GoI under Flood Management Programme – KEL I and II are completed. Under KEL III and KEL IV, the completed works are 48 and 9 nos respectively. The modernisation works of Thanneermukkom bund has achieved 95 per cent as on August 2019. Completion of mechanical works of 3rd stage, replacing the 52 shutters of 1st and 2nd stage with stainless steel shutters, completion of 20 feet lock gate works, removal of earthen bund, completion of pile and slab works in the Puthanarayiram padasekharam in D block are some of the achievements. The up-to-date expenditure of the works being implemented under Flood management programmes in Kuttanad is ₹696.36 crore (including Central and State share).

106 Economic Review 2019, Kerala State Planning Board
Box 3.5.2 “A Special Package for Post Flood Kuttanad” prepared by State Planning Board
A holistic approach to resurrect Kuttanad was highly the need of the hour in the light of the floods of 2018 and 2019 that struck the region drastically. The report prepared by State Planning Board has covered various aspects which help to address the well-being and livelihood of the people of Kuttanad.
Water management of Kuttanad region is a core area which requires attention. The report focuses on the innovative as well as conventional approaches that needs to be adopted for the improved water management practices of the region.
Hierarchical Classification of water systems • Primary system comprising of the lower reaches of five rivers flowing to Kuttanad• Secondary system with heavily entangled system of larger canals in the region• Tertiary system with small and very small canals immediately adjacent to padasekharams
Technique of Compartmentalisation: By implementing compartmentalisation (dividing larger areas into smaller ones), the surface area vulnerable to flooding gets reduced , which helps in reducing the flood damages.
Concept of “ Room for River” • Room for Vembanad and Room for Pamba• Allow maximum space for the natural flow of water so that higher water levels could be effectively managed while flooding• Preserving the existing surface area of Vembanad Lake, the shrinkage of the lake being a reason for the acuteness of Kuttanad floods.
Provision of free flow of water by unblocking the water ways• Construction of strong outer bunds to padasekharams• Declogging/desilting drainage channels/canals• Scientific construction of bridges and approach roads
Improving the efficiency of Thottappally spillway by• Widening the leading channel• Preventing the formation of sand bar near sea, which obstructs the flow of flood water through the sea mouth.
Completion of AC canal• Phase 2 ( Onnamkara to Nedumudy) • Phase 3 ( Nedumudy to Pallathuruthy)
Source: A Special Package for Post Flood Kuttanad, KSPB, 2019
Irrigation Status
Source wise net irrigated area in 2018-19 is shown in Appendix 3.5.3 and 3.5.4. The net irrigated area continues to expand over the period from 2016-17 to 2018-19. From 3.77
lakh ha in 2016-17, it increased to 3.92 lakh ha (2017-18) and to 4.04 lakh ha (2018-19). The main sources of irrigation are small stream, pond, well, bore well, lift, and minor irrigation. Wells provide irrigation to 1.24 lakh ha, whereas all other sources together (bore well, lift and minor

107Chapter 3, Agriculture and Allied Sectors
irrigation, rivers, lakes, etc.) irrigates 1.47 lakh ha.
The gross irrigated area has declined from 5.39 lakh ha (2017-18) to 4.89 lakh ha (2018-19). Details of gross irrigated area and the crops benefitted are shown in Appendix 3.5.5 and 3.5.6. In 2018-19, 1.59 lakh ha of coconut was irrigated followed by paddy with 1.54 lakh ha.
Even though coconut is the most irrigated crop, the extent of increase in area under irrigation is nominal i.e., the irrigated area has risen from 1.58 lakh ha (2017-18) to 1.59 lakh ha (2018-19). This should be viewed in tune with the area under coconut cultivation which continued to remain the same at 7.60 lakh ha during 2017-18 and 2018-19. But, the extent of irrigated area under paddy cultivation, the second most irrigated crop, shows a steep increase from 1.31 lakh ha (2016-17) to 1.45 lakh ha (2017-18) and to 1.54 lakh ha (2018-19). This increase in the irrigated area may be due to the increase in area under paddy cultivation.
Acknowledging the fact that the net irrigated area reflects an increasing trend over the years, the decline in the gross irrigated area from 5.39 lakh ha (2017-18) to 4.89 lakh ha (2018-19) also needs to be cited. It may be inferred that this decline may be either due to non provision of irrigation facilities for the second crop or because of the absence of second crop itself. The decline in the total cropped area from 25.79 lakh ha (2017-18) to 25.68 lakh ha (2018-19) underlines the above point.
Minor Irrigation
Minor Irrigation schemes have a Cultivable Command Area (CCA) upto 2000 ha. Schemes having ayacut area of 50 ha or above are classified as Minor Irrigation Class I and schemes that benefit ayacut less than 50 ha as Minor Irrigation Class II. The 13th Five Year Plan emphasises on the shift of focus from Major and Medium Irrigation to Minor Irrigation schemes. Accordingly, significant increase in outlay was
provided for MI schemes during the first three years of 13th Five Year Plan. However, the ayacut benefitted out of Minor Irrigation schemes is declining over the period from 2016-17 to 2018-19. Through various MI Class I, Class II, Lift Irrigation, NABARD assisted MI schemes, 13531.70 ha had benefitted in 2016-17. Later it continued to decline to 8006.64 ha (2017-18) and to 3388.05 ha (2018-19). The severe fall in the physical achievement in 2018-19 is due to the damages caused to LI structures in the floods of 2018. Details of physical achievements of Minor Irrigation schemes from 2016-17 to 2018-19 is given in Appendix 3.5.7.
NABARD has been providing loan assistance under Rural Infrastructure Development Fund (RIDF) through Phase I to XXV since 1995-96. RIDF I to XVII have been closed and the woks under RIDF XVIII to XXV are in progress. Under various tranches, 1339 projects have been completed. Details are given in Appendix 3.5.8.
Ground water development
The Groundwater estimation in the State is being done jointly by State Groundwater Department and Central Ground water Board. Under the scheme Investigation and development of Ground water resources, in 2018-19, investigation was carried out for 1884 dug wells and 9088 drilled wells. Ground water department prevents the over exploitation of ground water and ensures equitable distribution of resources. 1171 permits were issued in 2018-19. Details are given in Appendix 3.5.9.
As per the data on Dynamic Ground Water Resources of Kerala (2017), the total annual Ground water recharge of the State is 5769.23 MCM and the net annual Ground water availability is 5211.75 MCM. The existing gross Ground water draft for irrigation is 1220.57 MCM and the existing ground water draft for all uses is 2652.77 MCM. The stage of Ground water development of our State is 51.27 per cent. Kasaragod continues to lead the list with 79.64 per cent. The stage of Ground water development

108 Economic Review 2019, Kerala State Planning Board
is least for Wayanad District with 24.51 per cent. Details are given in Appendix 3.5.10.
Performance of Irrigation Sector in 2018-19 and 2019-20
The outlay for the sector was ₹557.03 crore and ₹517.71 crore in 2018-19 and 2019-20 respectively. Even though increased focus was given to Minor Irrigation schemes during 13th Five Year Plan period, Major and Medium Irrigation continued to grab the major share of the outlay. Outlay and expenditure details of the sector are shown in Appendix 3.5.11.
Box 3.5.3 Adoption of Micro Irrigation Techniques for Improved irrigation efficiency
Water is becoming increasingly scarce resource that is limiting agricultural productivity and profitability in many developing and developed economies. A study by the International Water Management Institute (IWMI) shows that around 50 per cent of the increase in demand for water by the year 2025 can be met by increasing the effectiveness of irrigation. In India, almost all the easily possible and economically viable irrigation water potential has already been developed, but the demand for water for different sectors has been growing continuously. Moreover, the water use efficiency in the agricultural sector, which still consumes over 80 per cent of water, is only in the range of 30-40 per cent in India, indicating that there is considerable scope for improving the water use efficiency.
One of the demand management mechanisms to improve water use efficiency is the adoption of micro irrigation such as drip and sprinkler. Above all, there is substantial yield difference in flood irrigated and micro-irrigated fields, as scientific and field evidence reveals. As the cropping pattern decides the adoption and suitability of drip irrigation, widespread adoption of micro irrigation can be promoted in the agro ecological regions of the State where crops like coconut, banana and vegetables are common.
Micro Irrigation aims at maximum water use efficiency at the farm level. In Kerala, the adoption of Micro Irrigation systems is necessitated due to the seasonal variations in rain causing drought like situation, thus preventing even life saving irrigation to crops especially plantation crops. Moreover, in Kerala, the productivity of most of the crops, especially plantation crops, is low compared to other states because of low efficiency of irrigation or due to lack of irrigation facilities. Micro Irrigation assumes more relevance in this context. Department of Water Resources along with the Department of Agriculture and Haritha Keralam Mission is in the process of adopting Community Micro Irrigation facility for cash crops and horticultural crops. This process was initiated in 2019 through Micro Irrigation project at Karadippara in Kozhinjampara Grama Panchayat of Palakkad District.
Source: Kerala State Planning Board

109Chapter 3, Agriculture and Allied Sectors
3.6 Forestry And Wildlife
Figure 3.6.1 District-wise forest cover, area in sq km
Source: FSI 2019
Rapid changes in the social and economic conditions and the increasing vulnerabilities caused by climate change has compelled to discard the “ business-as-usual” approach in managing forests and tree resources of the State. The precarious situation with regard to water supply which is worsening due to climate change related events affirm the need of stable supply of clean water to be the most important function of forestry in the State. Thus, “Water for a Thirsty Kerala” emerges as the core theme of forest management.
The recorded forest area of the State is about 29.65 per cent of the State’s geographical area. However, the actual forest area including those outside reserved forests and trees outside forests
will be much more. Forest Survey of India (FSI) 2019 assessment shows that the total area under forests, including plantations is 21144 sq km which is 54.42 per cent of the State’s geographical area. This shows that the forest cover of Kerala increased by 2.12 per cent from the 2017 assessment. On examining category-wise, very dense forests occupy 9.15 per cent, moderately dense forests 44.96 per cent and open forests 45.88 per cent of the forest cover. As per 2019 FSI assessment, forest cover has increased by 823 sq km in comparison to 2017 assessment, the main reason being the extent of commercial plantation outside forest area.
District-wise details on forest cover in Kerala is in Appendix 3.6.1. The total geographic
110 Economic Review 2019, Kerala State Planning Board
area of the State is 38,852 sq km The area of very dense, moderate dense and open forests are 1,935 sq km, 9,508 sq km and 9,701 sq.km respectively. Idukki leads in forest cover (3,151 sq km) followed by Palakkad (2,084 sq km) and Malappuram is closely behind with 1,981 sq km Figure 3.6.1. In terms of the percentage of forest land to geographic area, Wayanad and Pathanamthitta leads with 74 per cent.
Management of Natural Forests
Protection of forests from encroachments and fire, rehabilitation of degraded forests areas and protection of fragile ecosystem, consolidation of forests, participatory forest management, river bank protection etc are the activities implemented under forest management. Major activities taken up in 2018-19 were survey of forest boundaries, forest protection and regeneration of denuded forests. As part of boundary consolidation to prevent encroachments, 700 km of forest boundary was consolidated by constructing 14,618 permanent cairns in 2018-19. Protection of forests from fire was carried out mainly by undertaking fire lines and engaging fire protection watchers. 3,092.12 km of fire lines were created and 93,043 fire protection watchers were engaged.
Improving productivity of plantations
Forest plantations could be classified into hardwood, softwood, bamboo and reeds, plantation crops and mixed plantations. Among hardwood species, teak continues to occupy the major area, around 49 per cent of the total plantation area. However, the productivity of teak plantations is around 2 m3/year against the expected yield of 5 m3/year. In 2018-19, hardwood species were newly planted in 1494 ha, and were maintained in 1228.42 ha. Further, industrial raw materials were newly raised in 1555.12 ha and maintained in 1347.55 ha whereas it was 403.95 ha and 306.25 ha respectively for non wood forest species. Species-wise area under forest plantation is given in Appendix 3.6.2.
Human Animal Conflict Resolution
Despite the proactive measures of the department in mitigating the problems of human animal conflicts, it continues unresolved. Extreme damages are caused by wild elephants and wild boars. Various measures that were adopted include digging elephant proof trenches, creating elephant proof walls, constructing solar powered electric fences. Details of the major preventive structures constructed in 2018-19 to mitigate human wildlife conflicts – solar fencing (798.36 km), elephant proof trench wall (147.52 km), elephant proof wall (22.68 km), stone pitched trench(0.26 km), and kayyala (164.46 km).
In spite of these preventive measures, it is alarming to note that the number of incidents of human animal conflict is increasing year by year. In 2018-19, 7,890 incidents were reported whereas it was only 7,229 in 2017-18. Among the incidents, damages to crop and property is the highest, with 6631 cases. ₹11.15 crore was paid as compensation to the victims of wildlife attack in 2018-19.Details are given in Table 3.6.1.
Jana Jagratha Samithies are constituted by Government in areas prone to human wildlife conflicts. 204 Jana Jagratha Samithies have been constituted so far, which comprises of local self-government authorities, local people and forest officials. The samithies are entrusted to look after human animal conflicts reported in their jurisdiction, suggest effective preventive measures and create awareness among local people.
Scheduled Tribes and other Traditional Forest Dwellers (Recognition of Forest Right) Act, 2006
The Forest Rights Act 2006 envisages recognition of Rights of forest dependent communities. Scheduled Tribes Development Department is the Nodal agency in the State for the implementation of Forest Rights Act.The implementation process in the State is done through 511 GramaSabhas, 14 Sub divisional committees and 12 District

111Chapter 3, Agriculture and Allied Sectors
level committees. As per August 2019 data, titles issued under individual rights, community rights and development rights are 25848, 174 and 466 numbers respectively. Details on Individual rights are given in Appendix 3.6.3.
Major Forest Produce and revenue from forests
Sandalwood production leads among the forest produce with 98,834.30 kg followed by honey (39,021.25 kg) and timber (30,345.68 Cum). Even though the honey production declined from
41,729 kg (2017-18) to 39,021.25 kg (2018-19), the production of sandalwood, timber and bamboo showed an increasing trend. Sandalwood production increased to 98,834.30 kg in 2018-19 against 81,169.02 kg in 2017-18. Similarly, production of timber increased from 28,818.29 Cum (2017-18) to 30,345.68 Cum (2018-19), whereas bamboo production showed an upward trend from 7130.43 MT (2017-18) to 25447.89 MT(2018-19). Production of major forest produce in 2017-18 and 2018-19 is given in Appendix 3.6.4.
Table 3.6.1 Details of incidents of human-animal conflict reported and compensation paid in 2018-19
IncidentsSnake
Bite(in nos)
Elephant attack
(in nos)
Wild Boar attack
(in nos)
Wild Gaur
attack(in nos)
Tiger Attack
(in nos)
Leopard Attack
(in nos)
Others(in nos)
TotalIncidents(in nos)
Compensationpaid
(in ₹)
Human Death 123 17 5 0 0 0 1 146 2,42,66,000
Human Injured 541 46 169 1 0 0 8 765 2,58,42,862
Cattle Death 11 29 24 3 125 104 52 348 88,38,825
Crop Damage and Property Loss
0 4,063 1,230 52 0 0 1,286 6,631 5,25,55,467
Total 675 4,155 1,428 56 125 104 1,347 7,890 11,15,03,154
Source: Forest and Wildlife Department, GoK
Figure 3.6.2 Trends in forest revenue, 2014-15 to 2018-19
Source: Forest and Wildlife Department, GoK
112 Economic Review 2019, Kerala State Planning Board
Trends in revenue from timber and other forest products from the period 2014-15 to 2018-19 is given in Appendix 3.6.5. The revenue from forest products and other receipts continued to increase from 2016-17 onwards, from ₹239.51 crore (16-17) to ₹251.07 crore (17-18) to ₹273.08 crore (18-19). Timber contributes the major share, revenue from timber has risen from ₹234.55 crore (17-18) to ₹259.05 crore (18-19) See Figure 3.6.2.
In 2018-19, the share of forestry and logging in total GSVA at basic prices was 0.87 per cent whereas it was 0.94 per cent in 2017-18. Similarly, the share of primary sector in GSDP has also decreased from 9.06 per cent (2017-18) to 8.31 per cent (2018-19). Contribution of forestry sector in GSVA is shown in Appendix 3.6.6.
Bio diversity conservation and Protected Area Management
Conservation of wildlife and biodiversity is gaining more importance these days. The Wildlife wing manages 3213.237 sq km of forests under its protected area network which includes National Parks, Wildlife sanctuaries and Community Reserve. Details given in Appendix 3.6.7. All the protected areas of the State are managed according to the approved management plan and tiger conservation plan. Wildlife census is conducted in the forest area including the protected areas.
Achievements in Wildlife Management
As per the evaluation report published by the National Tiger Conservation Authority (NTCA) in 2018, Periyar and Parambikulam tiger reserves were ranked 1st and 7th positions respectively.
A programme for rejuvenating the lost millet varieties, once popularly cultivated by tribals, was implemented at Thayannankudy tribal settlement in Chinnar wildlife sanctuary. This helped in rejuvenating 26 different varieties of lost millets and the programme was recognised
nationally with “ Plant Genome Savior Award for Community 2018”.
Management of captive elephants in Kerala is covered under Captive Elephant Rules 2012. As on 31.03.2019, there are 515 captive elephants in the State, which are being used mainly for festival processions and other religious functions. An online web portal system for monitoring selected captive elephants was implemented in 2018-19, through which 96 selected elephants are being monitored on fortnightly basis.
Social Forestry
Haritha Keralam scheme was started with the objective of greening Kerala by distributing seedlings free of cost to schools, higher educational institutions, planting in public land etc. Through phase X of Haritha Keralam, 78.15 lakh seedlings were supplied in 2018-19. Details of seedlings distributed through social forestry is given in Appendix 3.6.8. Under Vazhiyora Thanal Programme, 17,456 seedlings were planted in 2018-19.
With the objective of encouraging farmers to grow more trees and produce timber in private lands, cash incentives are being provided. Scheme is implemented through individual farmers, VSS, EDC, Kudumbasree units, SHGs, farmer cooperatives, and NGOs. ₹3.10 lakh was given as incentives to farmers in 2018-19.
Floods of 2018 and 2019
Post Disaster Needs Assessment Report (PDNA) of 2018 states that 342 landslides (debris flow/rock slides and landslips) occurred in the revenue department marked land extents. Majority of landslides were in the fringes of the forest. Forest fragmentation was a major contributing factor to the landslides. Destabilisation of slopes due to cutting and creation of escarpments more than 3 m for construction purposes, construction of check dams on steep slopes, quarrying in vulnerable areas etc aggravated the vulnerability. Most of the forest area suffered
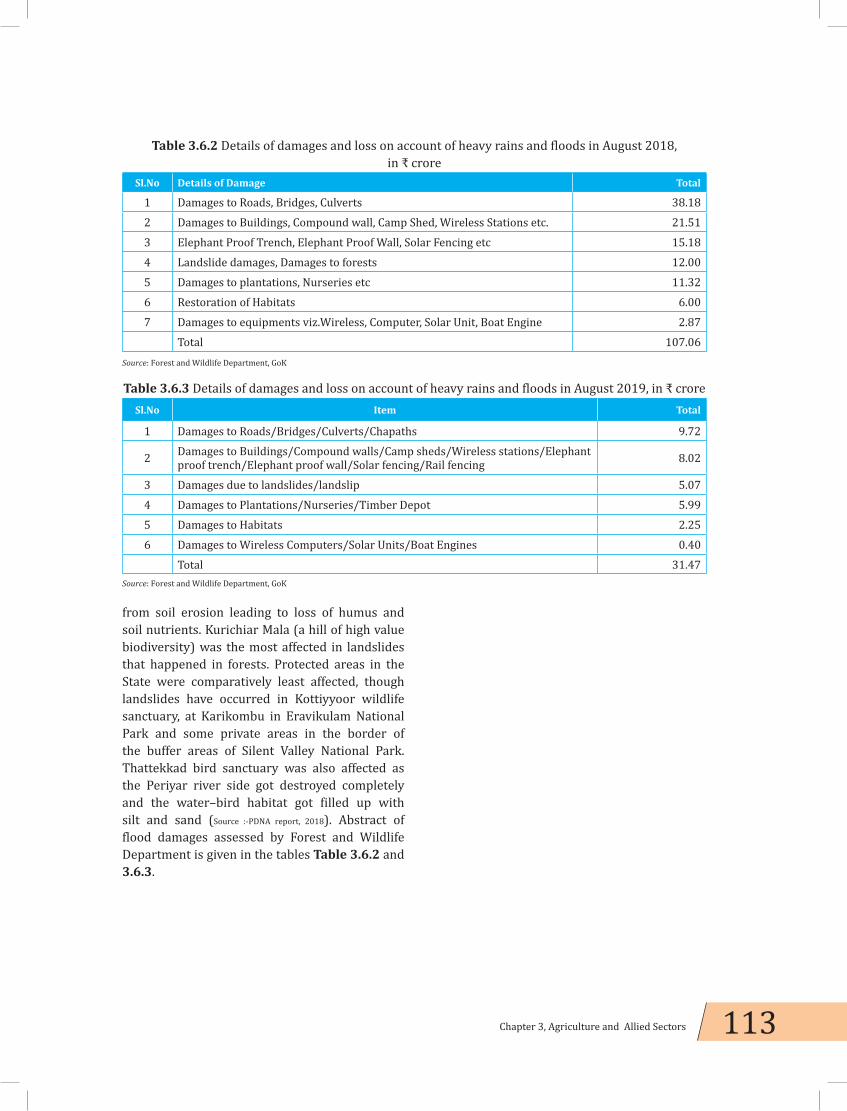
113Chapter 3, Agriculture and Allied Sectors
from soil erosion leading to loss of humus and soil nutrients. Kurichiar Mala (a hill of high value biodiversity) was the most affected in landslides that happened in forests. Protected areas in the State were comparatively least affected, though landslides have occurred in Kottiyyoor wildlife sanctuary, at Karikombu in Eravikulam National Park and some private areas in the border of the buffer areas of Silent Valley National Park.Thattekkad bird sanctuary was also affected as the Periyar river side got destroyed completely and the water–bird habitat got filled up with silt and sand (Source :-PDNA report, 2018). Abstract of flood damages assessed by Forest and Wildlife Department is given in the tables Table 3.6.2 and 3.6.3.
Table 3.6.2 Details of damages and loss on account of heavy rains and floods in August 2018, in ₹ crore
Sl.No Details of Damage Total
1 Damages to Roads, Bridges, Culverts 38.182 Damages to Buildings, Compound wall, Camp Shed, Wireless Stations etc. 21.513 Elephant Proof Trench, Elephant Proof Wall, Solar Fencing etc 15.184 Landslide damages, Damages to forests 12.005 Damages to plantations, Nurseries etc 11.326 Restoration of Habitats 6.007 Damages to equipments viz.Wireless, Computer, Solar Unit, Boat Engine 2.87
Total 107.06Source: Forest and Wildlife Department, GoK
Table 3.6.3 Details of damages and loss on account of heavy rains and floods in August 2019, in ₹ croreSl.No Item Total
1 Damages to Roads/Bridges/Culverts/Chapaths 9.72
2 Damages to Buildings/Compound walls/Camp sheds/Wireless stations/Elephant proof trench/Elephant proof wall/Solar fencing/Rail fencing 8.02
3 Damages due to landslides/landslip 5.074 Damages to Plantations/Nurseries/Timber Depot 5.995 Damages to Habitats 2.256 Damages to Wireless Computers/Solar Units/Boat Engines 0.40
Total 31.47Source: Forest and Wildlife Department, GoK

114 Economic Review 2019, Kerala State Planning Board
3.7 Environment
Kerala is situated between 8 o 8’ and 18 o 48’ North latitude and 74 o 4’ to 77 o 50’ East longitude, along the windward side of the Western Ghats of Indian Peninsula. The State is located in the tropical region of Indian Peninsula and extends to an area of about 38863 sq km, which accounts for about 1.2 per cent of the total geographical area of the country. Almost 78 per cent of the total land area of the State is under agriculture and dwelling, and the remaining 22 per cent of the land is under forests and forest plantations. The shift in land use pattern, overexploitation of natural resources, air and water pollution, climate change and its consequences are showing their adverse changes in our environment, biodiversity and human life. In the last few years, the State has experienced the impact of climatic vulnerabilities like shortfalls in monsoon, extreme warm weather and rise in frequency of natural disasters like cyclones and extremely heavy rainfall.
Climate change
Climate is a decisive factor affecting the livelihood of the people as a whole. The global temperature has been rising at 0.9 degree celsius over the 1901-2012 period, which is mainly attributed to anthropogenic activities (IPCC 2013). Further the latest report of IPCC (2018) on the ‘Impacts of Global Warming’ indicates that we could cross the 1.5 degree mark as early as 2030. The rainfall pattern in India shows great variation, unequal seasonal and geographical distribution
and frequent departures from the normal. The report of IPCC (2018) makes a specific mention that India would be one of countries worst hit by climate change with the consequences like decline in crop yields, unprecedented climatic extremities, and increase in incidence of poverty by 2050. Given that a sizeable part of population who are not well to do, live in areas prone to climatic shifts and are engaged in occupations that are highly climate-sensitive, future climate change is bound to have significant implications on their livelihood.
The entire Kerala State is classified as one meteorological sub division for climatologically purposes. The actual rainfall received in Kerala during last southwest monsoon season (June 1 to September 30, 2018) was 2,515.7 mm as against the normal rainfall of 2,039.7 mm showing (+)23 per cent departure from normal. Out of the 14 Districts, seven Districts received normal rainfall and the other seven Districts received excess rainfall. The highest rainfall of 3,794 mm was recorded in Idukki District showing (+)67 per cent departure from the normal, whereas the lowest rainfall of 1,023.7 mm was recorded in Thiruvananthapuram District showing departure of (+)17 per cent from the normal. In 2018, Kerala experienced one of the worst floods in the last nine decades, due to frequent heavy rain spells and several extremely heavy rain events, especially during the first half of August. Most noticeable feature of rainfall distribution in August, 2018 was the large spatial variability

115Chapter 3, Agriculture and Allied Sectors
with excess rainfall recording 196 per cent. The total annual rainfall varies from 360cm in the extreme northern parts to 180cm in the southern parts. The State is highly vulnerable and susceptible to climatic variations on account of its high population density, dependency on climate sensitive sectors like agriculture, fisheries and forest. Kerala State Action Plan on Climate Change has found 4 climate change hotspots in the State namely Alappuzha, Palakkad, Wayanad and Idukki Districts with more vulnerability to natural disaster such as flood and drought while impacting human life as well as biodiversity.
According to IMD, during the last 43 years, an increase in average temperature by 0.6 degree Celsius is noticed all over Kerala. Under the projected climate change scenario, the temperature is likely to increase to 20C by 2050 and sea level would rise by 100 to 200 mm over the next 100 years. Coastal region would be vulnerable to climate change and anticipated risks. The high dependency on climate sensitive sectors like agriculture, fisheries, forest, water resources and health make the State vulnerable to climate change causing drastic changes in the development process of the State(SAPCC 2014).
Environment Quality
Environmental pollution is a major concern in Kerala. A large number of environmental issues continue to demand attention, ranging from river pollution by sewage, waste generated by urban and rural settlements, intense noise pollution etc. Such a wide range of issues demand concretive attention by regulatory authorities. The Kerala State Pollution Control Board (KSPCB) with the mandate to prevent and control the water and air pollution and maintain and restore the wholesomeness of water, air, soil and environment has strengthened its initiatives for generating baseline data and periodical monitoring of the air and water quality.
Air Quality Monitoring
The Kerala State Pollution Control Board is monitoring ambient air quality at 34 locations in the State. The locations fall under the categories of industrial, commercial, residential and sensitive. Of the 34 stations, 28 come under National Ambient Air Quality Monitoring Programme (NAMP) and 6 under State Ambient Air Quality Monitoring Programme (SAMP). Sulphur dioxide, Nitrogen Oxides and Respirable Suspended Particulate Matter (class 10 micron size) (RSPM) is monitored regularly. 24-hour ambient air quality monitoring is conducted with a sampling frequency of two days/week. The Board had started PM 2.5 monitoring at 13 stations in Alappuzha (1), Ernakulam (6), Palakkad (2), Kozhikode (2), Wayanad (1) and Kannur (1) in 2018. Under the ambit of National Ambient Air Quality Programme 4 stations- Thiruvalla in Pathanamthitta (Residential), Kalpetta in Wayanad (residential) and Peringandor in Thrissur (Industry) has been set up in the year 2018 and BEML, Palakkad (Industrial) under the ambit of State Ambient Air Quality Monitoring Programme. Furthermore, Kuttippadam in Ernakulam has been reassigned under NAMP which was previously under SAMP. The monitoring and method of analysis are according to the National Ambient Air Quality Standards (NAAQS).
Among the 10 monitoring stations selected for measuring the annual average concentration of SO2, oxides of Nitrogen and RSPM in residential and respectively, the levels were within the permissible limit in all the districts except Kozhikode and Ernakulam where RSPM is nearing the limit (Figure 3.7.1). In the sensitive category, air quality is well within the limits in Wayanad and Thiruvananthapuram. In the industrial category, out of the 11 monitoring stations, Ernakulam District alone exceeded the limits, slightly with respect RSPM values. The SO2 and NOx were well within the limits in all Districts (Figure 3.7.2). Continuous Ambient Air Quality Monitoring Stations(CAAQMS) has been established one each at Thiruvananthapuram,
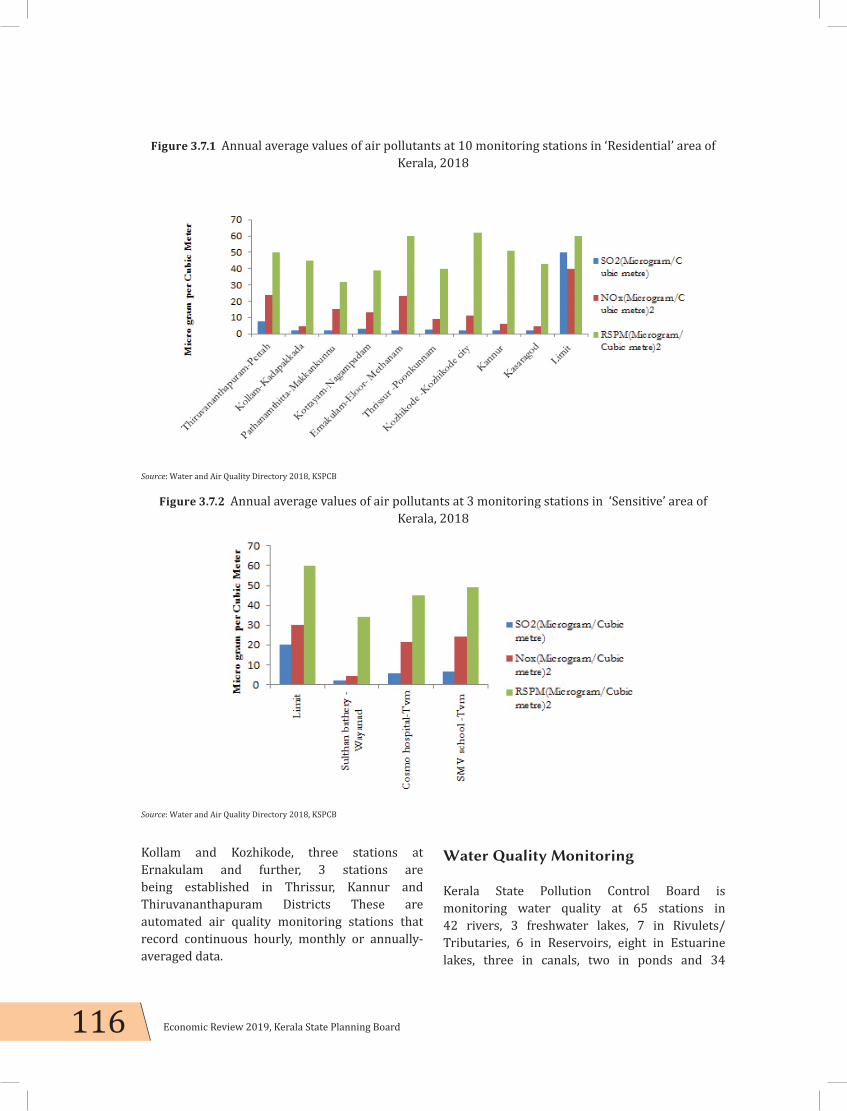
116 Economic Review 2019, Kerala State Planning Board
Kollam and Kozhikode, three stations at Ernakulam and further, 3 stations are being established in Thrissur, Kannur and Thiruvananthapuram Districts These are automated air quality monitoring stations that record continuous hourly, monthly or annually-averaged data.
Water Quality Monitoring
Kerala State Pollution Control Board is monitoring water quality at 65 stations in 42 rivers, 3 freshwater lakes, 7 in Rivulets/Tributaries, 6 in Reservoirs, eight in Estuarine lakes, three in canals, two in ponds and 34
Figure 3.7.1 Annual average values of air pollutants at 10 monitoring stations in ‘Residential’ area of Kerala, 2018
Source: Water and Air Quality Directory 2018, KSPCB
Figure 3.7.2 Annual average values of air pollutants at 3 monitoring stations in ‘Sensitive’ area of Kerala, 2018
Source: Water and Air Quality Directory 2018, KSPCB

117Chapter 3, Agriculture and Allied Sectors
stations in Groundwater. Central Pollution Control Board has evolved a concept of Designated Best Use (DBU) to define the level of wholesomeness of the different water bodies to be maintained or restored, according to the primary use of water body.
Based on the monitoring data generated during the year 2018, classification of river stretches has been done as per CPCB criteria. Among the water bodies monitored, Pookode lake in Wayanad
District is the only one satisfying the ‘Class A’ criteria. The major problem associated with river water is the bacterial contamination and 80 per cent of the water bodies monitored under National Water Quality Monitoring Programme (NWMP) and State Water Quality Monitoring Programme (SWMP) fall into B or C category, only because of the increased bacterial population. The quality of well water monitored under NWMP shows the presence of Coliform bacteria in small counts.
Figure 3.7.3 Annual average values of air pollutants at 11 monitoring stations in the ‘Industrial’ area of Kerala, 2018
Source: Water and Air Quality Directory 2018, KSPCB
Figure 3.7.4 BOD levels at selected river stations for 2013 and 2018
Source: Water and Air Quality Directory 2018, KSPCB
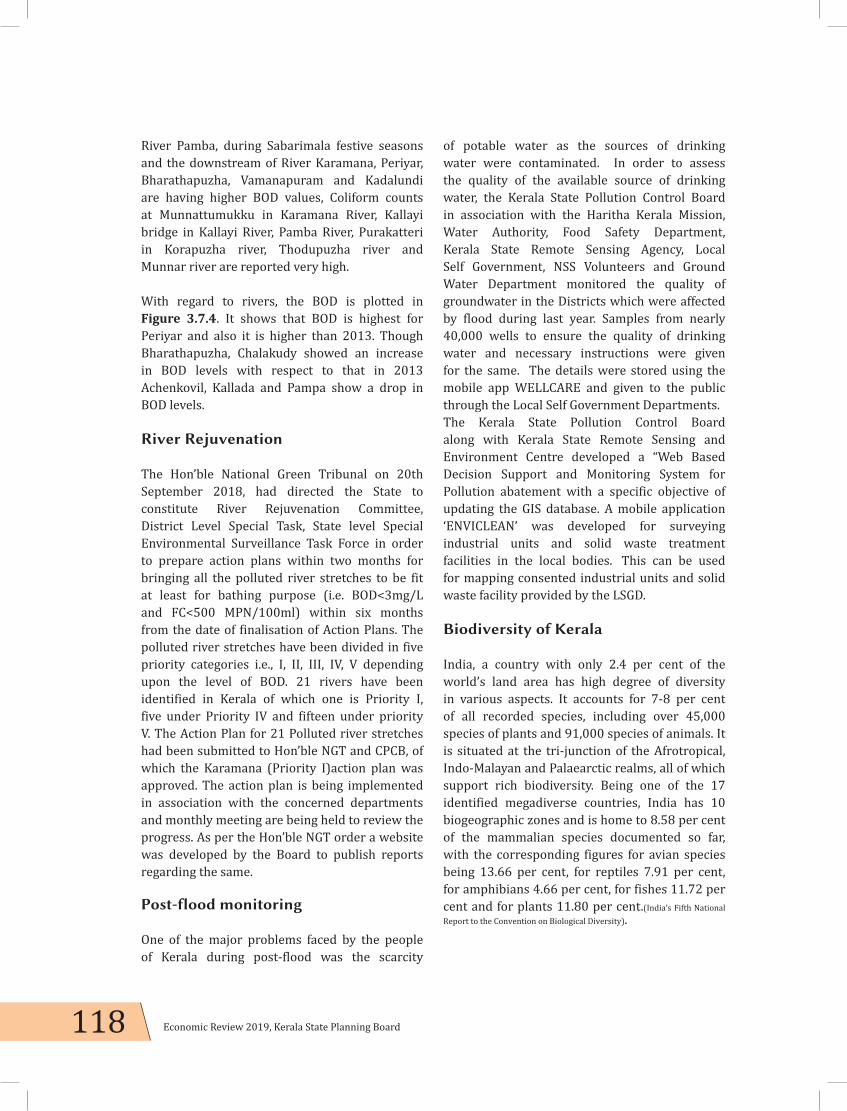
118 Economic Review 2019, Kerala State Planning Board
River Pamba, during Sabarimala festive seasons and the downstream of River Karamana, Periyar, Bharathapuzha, Vamanapuram and Kadalundi are having higher BOD values, Coliform counts at Munnattumukku in Karamana River, Kallayi bridge in Kallayi River, Pamba River, Purakatteri in Korapuzha river, Thodupuzha river and Munnar river are reported very high.
With regard to rivers, the BOD is plotted in Figure 3.7.4. It shows that BOD is highest for Periyar and also it is higher than 2013. Though Bharathapuzha, Chalakudy showed an increase in BOD levels with respect to that in 2013 Achenkovil, Kallada and Pampa show a drop in BOD levels.
River Rejuvenation
The Hon’ble National Green Tribunal on 20th September 2018, had directed the State to constitute River Rejuvenation Committee, District Level Special Task, State level Special Environmental Surveillance Task Force in order to prepare action plans within two months for bringing all the polluted river stretches to be fit at least for bathing purpose (i.e. BOD<3mg/L and FC<500 MPN/100ml) within six months from the date of finalisation of Action Plans. The polluted river stretches have been divided in five priority categories i.e., I, II, III, IV, V depending upon the level of BOD. 21 rivers have been identified in Kerala of which one is Priority I, five under Priority IV and fifteen under priority V. The Action Plan for 21 Polluted river stretches had been submitted to Hon’ble NGT and CPCB, of which the Karamana (Priority I)action plan was approved. The action plan is being implemented in association with the concerned departments and monthly meeting are being held to review the progress. As per the Hon’ble NGT order a website was developed by the Board to publish reports regarding the same.
Post-flood monitoring
One of the major problems faced by the people of Kerala during post-flood was the scarcity
of potable water as the sources of drinking water were contaminated. In order to assess the quality of the available source of drinking water, the Kerala State Pollution Control Board in association with the Haritha Kerala Mission, Water Authority, Food Safety Department, Kerala State Remote Sensing Agency, Local Self Government, NSS Volunteers and Ground Water Department monitored the quality of groundwater in the Districts which were affected by flood during last year. Samples from nearly 40,000 wells to ensure the quality of drinking water and necessary instructions were given for the same. The details were stored using the mobile app WELLCARE and given to the public through the Local Self Government Departments.The Kerala State Pollution Control Board along with Kerala State Remote Sensing and Environment Centre developed a “Web Based Decision Support and Monitoring System for Pollution abatement with a specific objective of updating the GIS database. A mobile application ‘ENVICLEAN’ was developed for surveying industrial units and solid waste treatment facilities in the local bodies. This can be used for mapping consented industrial units and solid waste facility provided by the LSGD.
Biodiversity of Kerala
India, a country with only 2.4 per cent of the world’s land area has high degree of diversity in various aspects. It accounts for 7-8 per cent of all recorded species, including over 45,000 species of plants and 91,000 species of animals. It is situated at the tri-junction of the Afrotropical, Indo-Malayan and Palaearctic realms, all of which support rich biodiversity. Being one of the 17 identified megadiverse countries, India has 10 biogeographic zones and is home to 8.58 per cent of the mammalian species documented so far, with the corresponding figures for avian species being 13.66 per cent, for reptiles 7.91 per cent, for amphibians 4.66 per cent, for fishes 11.72 per cent and for plants 11.80 per cent.(India’s Fifth National Report to the Convention on Biological Diversity).

119Chapter 3, Agriculture and Allied Sectors
Kerala with 1.2 per cent of India‘s landmass harbours 25.69 per cent of flowering plant species and 26.59 per cent of Pteridophytes recorded in India. Vertebrate diversity of Kerala is represented by 1,847 species in 330 families and 81 orders with Fishes (freshwater and marine) the most diverse group of vertebrates (905 species), followed by birds (500 species), reptiles (173 species), amphibians (151 species) and mammals (118 species). (13th Plan Working Group Report on Biodiversity)
Biodiversity hotspots sites support nearly 60 per cent of the world’s plant, bird, mammal, reptile, and amphibian species, with a very high share of endemic species. Western Ghats, one of the globally identified four biodiversity spots in India stretches along the eastern side of Kerala is rich in biodiversity. Out of the thirty nine places inscribed in the UNESCO World Heritage Sites of 2012 based on the outstanding universal value and high levels of endemism, 19 are located in Kerala. Of terrestrial vertebrates 36 per cent are endemic to Western Ghats and Kerala. Out of the amphibians comprising 90 per cent endemic species, 66 per cent have home in the Western Ghats, while 24 per cent are endemic to Kerala. Of 1,847 vertebrates of Kerala, 205 (approximately 11per cent) species are listed as threatened in the International Union for Conservation of Nature (IUCN) Red List of Threatened Species. Among this, 23 are categorised as Critically Endangered, 90 are Endangered and 92 are Vulnerable.
Promoting Sustainable utilisation and Benefit Sharing - Access and Benefit Sharing (ABS)
Access and benefit-sharing (ABS) refers to the way in which genetic resources may be accessed, and how the benefits that result from their use are shared between the people or countries using the resources (users) and the people or countries that provide them (providers). ABS is a resource mobilising strategy for generating local finances for conservation of marine bio resources. The key achievements in this field are:
1. For the first time in Kerala ABS agreement signed with four companies and the funds accrued through this will be used for the conservation of Biodiversity
2. Awareness programs held for companies utilising bio-resources commercially.
3. State Biodiversity Fund Rules for effective utilisation and accounting of the accrued funds prepared and submitted to Government for notification. A meeting was held with 35 industries of Kerala who are utilising bio resources on a commercial scale to create awareness among them about the provisions of ‘Access and Benefit Sharing’ Act and Rules.
Impact of flood/ landslides on Biodiversity
KSBB in association with BMCs conducted a Rapid Impact Assessment of flood/ landslides on Biodiversity. The objective of the process was to lay the foundation for a recovery and ecosystem based reconstruction process at local level. It is for the first time in India that such an assessment of impact of natural disasters on Biodiversity was conducted at LSG level incorporating community perspectives of the effect on Biodiversity and Ecosystems. The report submitted to Government included impact on species both flora and fauna and ecosystems. About 771 different landscapes including riverine, forest, plantations and agricultural fields were affected. About 287 varieties of agricultural crops were affected. Most of the impacts on biodiversity are due to changes in the habitats, inundation for a longer period and displacement of animals during the flood. Changes have occurred in distribution patterns, all of which will have long term impact on ecological processes.
Major initiatives and activities of the Departments
Article 48 A of the Constitution of India, under Part IV, Directive Principles of State Policy, authorises that “The State shall endeavor to

120 Economic Review 2019, Kerala State Planning Board
protect and improve the environment and to safeguard the forests and wild life of the country.” Accordingly, Environmental Management Agency, Kerala was constituted in 2007, which was subsequently transformed into the Directorate of Environment and Climate Change in 2010. The GoK implements several regulatory and promotional measures for environmental protection and conservation mainly through the Environment Department. Major thrust was given on the environment management ensuring a balanced approach towards economic development and cleaner environment. Besides environment management, programmes implemented by different institutions like Kerala State Pollution Control Board and Kerala State Bio diversity Board are being coordinated by the Environment Department. State Environmental Impact Assessment Authority (SEIAA), Kerala Coastal Zone Management Authority (KCZMA), State Wetland Authority Kerala (SWAK), Kerala Centre for Integrated Coastal Zone Management (KCICM) are other agencies responsible for enforcement and enactment of various provisions on environment.
In order to encourage environmental protection activities, the DoECC established eco-clubs, named Bhoomithrasena in colleges across the State in all Districts. These clubs have undertaken environmental protection activities in their surrounding areas. Other activities include eco-restoration of wetlands, promoting research and development in environmental sciences, climate change environment management and related engineering and technology. The other major initiatives in the financial year 2018-19 by the Directorate of Environment and Climate Change are a) continuation of project to mitigate drought in Vadakarapathy Panchayath, Palakkad District by adopting soil and water conservation measures, b) preparation of the draft Coastal Zone Management Plan (CZMP) of ten coastal Districts in the State and c) revision of State action plan on climate change d) started a GIS based vulnerability assessment project-in-depth assessment and mapping of mangrove habitat
in northern Kerala. The MOEFCC approved the project for Integrated Coastal Zone Management with a project cost of ₹280 crore and revised the State Share as 20 per cent of the project cost. The Director, Environment and Climate Change (DOECC) has been appointed as Project Director.
The Kerala State Biodiversity Board has prepared 959 People Biodiversity Registers (PBR). Biodiversity Management Committees (BMC) was reconstituted in 2018-19, and 28 BMCs were empowered to function as model BMC to take up biodiversity conservation. For the first time in Kerala ABS agreement signed with four companies. Kerala Biodiversity museum established at Vallakadavu opened for public. Completed Marine Biodiversity Register of Thiruvananthapuram coast. Pollution control board procured 3 surveillance vans for Kollam, Alappuzha and Thrissur. Around 40,000 wells in flood affected areas were monitored to ensure drinking water quality. PM 2.5 sampler installed at 19 Air Quality Monitoring stations and four additional stations for ambient Air Quality Monitoring started. A study titled “Study on impact of heavy flood in the environmental characteristics of Vembanad Backwaters” was conducted in collaboration with CUSAT.
Haritha Keralam Mission
The Haritha Keralam Mission has three sub-missions, namely; (i) sanitation and waste processing, (ii) water conservation and (iii) agricultural development. Within the three years of its initiation, Haritha Keralam Mission has undertaken innovative and diversified projects and campaigns. The main focus areas of the Haritha Keralam Mission are:
• To formulate methods for various levels of coordination of Plans of Local Governments (LGs) and other departments to address the major issues in each District.
• To ensure scientific, efficient and technical advice to Local Governments in order to attain practical and effective technical facilities.

121Chapter 3, Agriculture and Allied Sectors
• Provide leadership and to conduct activities that ensure peoples participation and social inclusion for creating ‘Haritha Keralam’.
Some of the major interventions under the sub-mission sanitation and waste processing from 2017-18 to 2018-19 are detailed below.
The ‘freedom from waste campaign’ started on August 15, 2017, has created a strong foundation for sanitation and waste processing by the local governments (LGs). By providing basic requirements for source level treatment of waste such as Material Collection Facility (MCF), Resource Recovery Facility (RRF), Haritha Karma Sena, household source level treatment plants, community composting units etc., waste processing has got the importance it deserves so that sustainable and clean environment is created and maintained. The Green Protocol has become a part of social life and implemented in 3,703 offices and institutions in the State, District and Block level.
45 per cent of bio waste in the State is treated scientifically through source level treatment of waste. Source level treatment of waste system was set up in 31.19 lakh houses. 1,320 industrial institution level biogas plants, 97 community level biogas plants and 2,020 community level composting units were installed. Haritha Karma Sena is formed in 1,033 LGs with the participation of 32,003 members. ‘Zero waste on ground’ project initiated at 170 wards in 17 Municipalities. 9,708 tonne plastic waste and 17,397 tonne e-waste were collected and handed over for recycling. 2,350 scrap merchants were registered in LGs. 37 harithasahaya institutions were started functioning to give technical support for waste management facilities of LGs.
According to the data provided by Suchitwa Mission, Material Collection Facility (MCF) centers and Resource Recovery Facility (RRF) centers have been functioning in 674 and 128 LGs respectively from 2017-18 to 2019-20 (as on September 30, 2019).
The State has been experiencing increasing pressure on environment and natural resources over the last several decades despite a number of policies and regulations. The State also come to grips with the combined effects of climate change, pollution, population pressure, unscientific land utilisation etc. The recent two annual monsoon seasons have aggravated these issues faced by the ecology and environment of the State. Hence conserving the environment and biodiversity by taking into account the high population density of the State requires considerable efforts. Kerala as a recognised biodiversity hotspot, has the advantage of widespread awareness of biodiversity potential and local knowledge of biodiversity. By utilising the social and developmental achievements in the State, a co-ordinated effort of all stakeholders and more efficient civil society participation in environment management will effectively address environment governance challenges.

122 Economic Review 2019, Kerala State Planning Board
3.8 Food Security and Public Distribution System
Food security implies ensuring adequate access to food, both in quality and quantity terms. According to the UN Committee on World Food Security, food security is said to exist when all people, at all times, have physical, social, and economic access to sufficient, safe and nutritious food to meet their dietary needs and food preferences for an active and healthy life. In order to achieve the concept of zero hunger, the UNO declared its aim to end all forms of hunger and malnutrition by 2030, making sure all people–especially children–have sufficient and nutritious food. The UN General Assembly, on July 6, 2017, included two indicators for monitoring SDG Target 2.1: the prevalence of undernourishment and prevalence of moderate or severe food insecurity based on the Food Insecurity Experience Scale (FIES). People experiencing moderate food insecurity face uncertainties about their ability to obtain food and have been forced to reduce, at times in the year, the quality and/or quantity of food they consume due to lack of money or other resources. People facing severe food insecurity, on the other hand, have likely run out of food, experienced hunger and, at the most extreme, gone for days without eating, putting their health and well-being at grave risk.
As per the report of State of Food Security and Nutrition in the World 2019, the number of undernourished people in the world has increased to an estimated 821.6 million in 2018. Out of this, 513.9 million live in Asian countries. The report also estimates that 26.4 per cent
(2,013.8 million people) of the world population were exposed to moderate or severe food insecurity in 2018. Out of this, 9.2 per cent of the world population (704.3 million people) were exposed to severe food insecurity in 2018.
The incidence of poverty in India is estimated at 26.93 crore in 2011-12 (Planning Commission 2012). Further, the calorie and protein intake of a large number of people in India, especially in rural areas, is far below the normal level. As per the report of State of Food Security and Nutrition in the World 2019(FAO, 2019), the number of undernourished people in India is estimated at 194.4 million which is around 14.5 per cent in total population.
National Food Security Act, 2013
In order to ensure adequate access to food in both quality and quantity terms to the people suffering from food insecurity, GoI enacted the National Food Security Act (NFSA), 2013. The objective of the Act is to provide food and nutritional security in human life cycle approach by ensuring access to adequate quantity of quality food at affordable prices to people. Under the NFSA-2013, the State Government shall be responsible for implementation and monitoring of the schemes of various ministries and departments of the Central Government in accordance with the guidelines issued by the latter for ensuring food security to the targeted beneficiaries of the State.

123Chapter 3, Agriculture and Allied Sectors
The State has an elaborate well established universal rationing system that reaches every nook and corner. Informal rationing was introduced in 1964 which was primarily focussed on urban areas and subsequently extended to rural areas. Then statutory rationing was started in the State with effect from October 24, 1965. In 1997, the State introduced Targeted Public Distribution System keeping in pace with revised Public Distribution System (PDS) policy of GoI.
The entire scenario of public distribution system has undergone a radical transformation with the introduction of NFSA 2013 in the State. The State started NFSA implementation with effect from November 1, 2016. Under the NFSA, end to end computerisation of the entire chain of the PDS has been planned with the objectives of reducing leakages, improving targeting and reducing cost of distribution. It also involves introduction of electronic point of sale (e-pos) at the Authorised Retail Distributors (ARD), supply chain management from the FCI to the ARD level, biometric authentication for retail and wholesale transactions, providing decision support systems in a GIS-based graphics interface to ensure an effective, responsive, transparent, efficient and corruption-free PDS. The entire ration card data were digitalised in the State and as on November 2019, 33.0 lakh applications were processed. Moreover, Aadhaar seeding of 94.0 per cent of beneficiaries were completed in the State as on November 2019. The State has also started Grievance Redressal Portal where in people can submit their grievances online.
As mandated in the NFSA, ‘priority and ‘non-priority’ ration cards were issued to the card holders in the State. Installation of e-pos machines in ARDs which is a part of NFSA operations was completed. GIS fitted vehicles for transporting food grains was implemented.
Supplyco has been entrusted with the implementation of the doorstep delivery of rationed articles under the PDS in Kerala. The food grains allocated to the State either through Food Corporation of India (FCI) or from Compact Multi Roller (CMR) mills have to be lifted from
respective godowns and delivered at the doorstep of the Fair Price Shops (FPS) after storage at interim godowns. At present the Corporation has started NFSA intermediary godowns in all 75 Taluks in the State for storage of food grains lifted from FCI depots/CMR Mills. The Corporation has also hired 223 godowns with 15.0 lakh sqft area which can store about 2.5 lakh MT of food grains. Due to switching over to NFSA operations, the operations in the existing 11 sub depots have been converted as NFSA godowns.
Distribution of Ration Cards
GoI enacted the Essential Commodities Act 1955 for regulating by licences, permits, prices storage, transport, distribution, disposal, acquisition, use or consumption of, any essential commodity. The State started the Public Distribution System (PDS) in 1965. The timely lifting of commodities allocated from the central pool and ensuring the effective distribution of the same through ration shops is the major responsibility of the PDS. Kerala made pioneering achievements in the implementation of a universal rationing system, much before NFSA 2013 was enacted.
The number of ration card holders in the State increased from 81.1 lakh in 2018-19 to 86.0 lakh in 2019-20 (as on August 2019). Out of this, 36.6 lakh cards come under NFSA and 49.4 lakh come under non NFSA. The NFSA section includes 5.8 lakh AAY cards and 30.8 lakh priority cards. The non-NFSA section includes 23.5 lakh on priority subsidy group and 25.8 lakh on non-priority non subsidy group. With the introduction of NFSA in Kerala, four types of ration cards with different colour codes for households came into existence. The yellow colour code represents the AAY card, pink colour represents priority cards, blue colour represents-priority subsidy card and the white colour represent the non-priority non-subsidy cards (Figure 3.8.1). In addition to this, there were 928 ration permits for institutions in 2019-20 (as on August 2019). These permits are issued to institutions/organisations which work in the area of humanitarian aid and charity. They get food grains at subsidised rates.

124 Economic Review 2019, Kerala State Planning Board
There are 1.5 crore beneficiaries under NFSA and 2.0 crore beneficiaries under Non-NFSA in the State. Details of the number of cardholders and quantity of food grains available to each category are given in Table 3.8.1 and Category-wise card holders and subsidy amount spent by GoK for distribution of food grains in 2018-19 are given in Appendix 3.8.1.
Subsidy Spent by GoK for Various Card Holders
An amount of ₹32,717.8 lakh was spent on various card holders as subsidy in 2018-19 as against ₹47,372.1 lakh spent in 2017-18. Details are shown in Table 3.8.2. A total of 34.9 per cent of subsidy was spend for priority card holders
Figure 3.8.1 Category-wise card holders in Kerala as on August, 2019, in per cent
Source: Civil Supplies Department
Table 3.8.1 Category-wise distribution of food grains under NFSA, as on November 2019
Sl No Category No. of Ration Cards Rice Wheat Fortified Atta
1 AAY 5,84,203 30 kg/Month (free of Cost)
5kg/Month (free of cost)
2 Priority 30,82,786 4 kg/Member/Month (₹2.00/kg)
1 kg/Member/Month (₹2.00/kg)
3 Non Priority (Subsidy)
23,50,331 2 kg/Member/Month (₹4.00/kg)
2 or 3 kg/Month (₹17.00/kg)
4 Non Priority (Non-Subsidy)
25,80,746 ₹10.90/kg as per the availability of Stock
2 or 3 kg/Month (₹17.00/kg)
5 Annapoorna 5,726 10 kg/month (free of cost)
Source: Civil Supplies Department
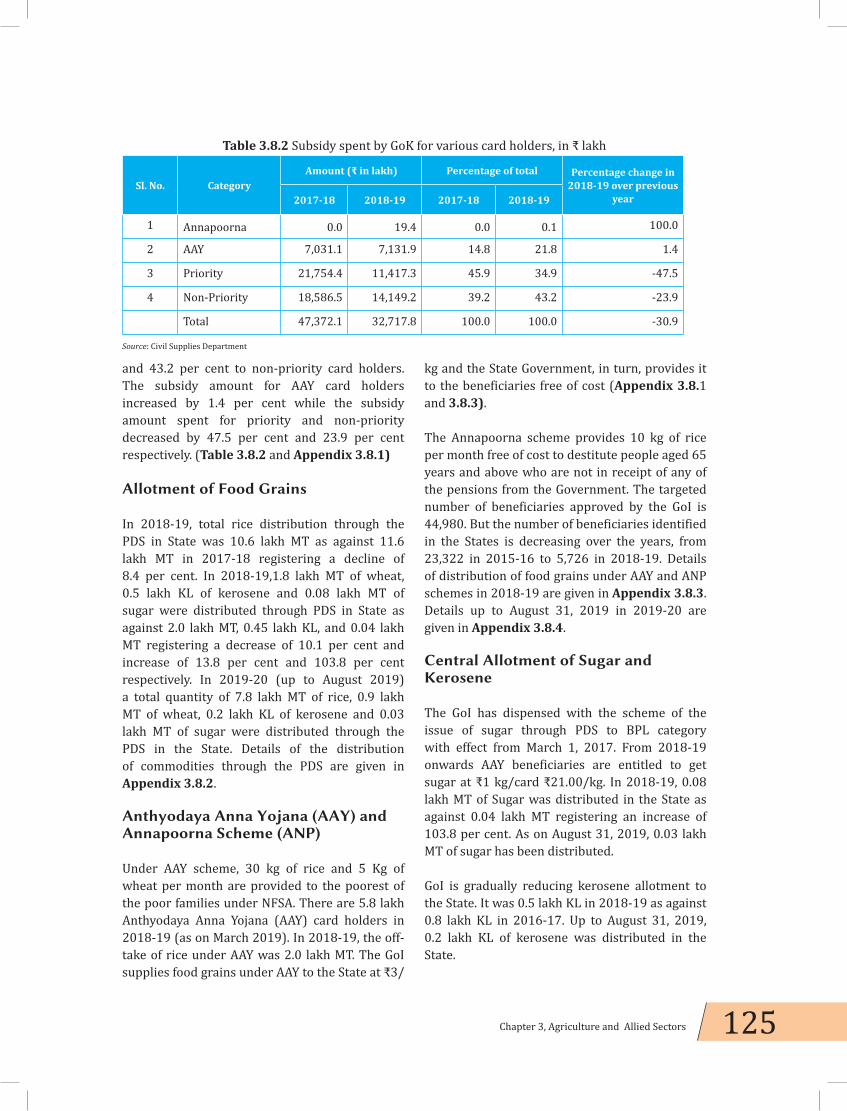
125Chapter 3, Agriculture and Allied Sectors
and 43.2 per cent to non-priority card holders. The subsidy amount for AAY card holders increased by 1.4 per cent while the subsidy amount spent for priority and non-priority decreased by 47.5 per cent and 23.9 per cent respectively. (Table 3.8.2 and Appendix 3.8.1)
Allotment of Food Grains
In 2018-19, total rice distribution through the PDS in State was 10.6 lakh MT as against 11.6 lakh MT in 2017-18 registering a decline of 8.4 per cent. In 2018-19,1.8 lakh MT of wheat, 0.5 lakh KL of kerosene and 0.08 lakh MT of sugar were distributed through PDS in State as against 2.0 lakh MT, 0.45 lakh KL, and 0.04 lakh MT registering a decrease of 10.1 per cent and increase of 13.8 per cent and 103.8 per cent respectively. In 2019-20 (up to August 2019) a total quantity of 7.8 lakh MT of rice, 0.9 lakh MT of wheat, 0.2 lakh KL of kerosene and 0.03 lakh MT of sugar were distributed through the PDS in the State. Details of the distribution of commodities through the PDS are given in Appendix 3.8.2.
Anthyodaya Anna Yojana (AAY) and Annapoorna Scheme (ANP)
Under AAY scheme, 30 kg of rice and 5 Kg of wheat per month are provided to the poorest of the poor families under NFSA. There are 5.8 lakh Anthyodaya Anna Yojana (AAY) card holders in 2018-19 (as on March 2019). In 2018-19, the off-take of rice under AAY was 2.0 lakh MT. The GoI supplies food grains under AAY to the State at ₹3/
kg and the State Government, in turn, provides it to the beneficiaries free of cost (Appendix 3.8.1 and 3.8.3).
The Annapoorna scheme provides 10 kg of rice per month free of cost to destitute people aged 65 years and above who are not in receipt of any of the pensions from the Government. The targeted number of beneficiaries approved by the GoI is 44,980. But the number of beneficiaries identified in the States is decreasing over the years, from 23,322 in 2015-16 to 5,726 in 2018-19. Details of distribution of food grains under AAY and ANP schemes in 2018-19 are given in Appendix 3.8.3. Details up to August 31, 2019 in 2019-20 are given in Appendix 3.8.4.
Central Allotment of Sugar and Kerosene
The GoI has dispensed with the scheme of the issue of sugar through PDS to BPL category with effect from March 1, 2017. From 2018-19 onwards AAY beneficiaries are entitled to get sugar at ₹1 kg/card ₹21.00/kg. In 2018-19, 0.08 lakh MT of Sugar was distributed in the State as against 0.04 lakh MT registering an increase of 103.8 per cent. As on August 31, 2019, 0.03 lakh MT of sugar has been distributed.
GoI is gradually reducing kerosene allotment to the State. It was 0.5 lakh KL in 2018-19 as against 0.8 lakh KL in 2016-17. Up to August 31, 2019, 0.2 lakh KL of kerosene was distributed in the State.
Table 3.8.2 Subsidy spent by GoK for various card holders, in ₹ lakh
Sl. No. CategoryAmount (₹ in lakh) Percentage of total Percentage change in
2018-19 over previous year2017-18 2018-19 2017-18 2018-19
1 Annapoorna 0.0 19.4 0.0 0.1 100.0
2 AAY 7,031.1 7,131.9 14.8 21.8 1.4
3 Priority 21,754.4 11,417.3 45.9 34.9 -47.5
4 Non-Priority 18,586.5 14,149.2 39.2 43.2 -23.9
Total 47,372.1 32,717.8 100.0 100.0 -30.9
Source: Civil Supplies Department

126 Economic Review 2019, Kerala State Planning Board
District-Wise Distribution of Food Grains
In 2018-19, the off take of AAY rice was highest in Thiruvananthapuram District with 21,445.3 MT followed by Malappuram with 18,645.5 MT. Off take rice to Priority Household (PHH) was highest in Malappuram District with 85,935.5 MT followed by Thiruvananthapuram with 62,241.4 MT in 2018-19. In the case of PHH, Malappuram had the highest off take of wheat with 21,232.7 MT followed by Thiruvananthapuram with 15,241.8 MT. Details are given in Appendix 3.8.3, 3.8.4, 3.8.5, and 3.8.6.
Kerala State Civil Supplies Corporation (Supply-co)
An effective public distribution system is essential for controlling undue rise in prices especially in prices of food grains and other essential commodities. In addition to the public distribution system through ration shops, the State ensures market intervention through Supplyco, second line of the PDS the State. It was set up in 1974 to provide food security in the State. The system ensures the distribution of essential items through FPS and Supplyco outlets in the State. Supplyco is mandated to control the prices of 13 essential commodities by distributing it at subsidised prices.
Supplyco has its headquarters in Kochi and operates through 5 regional offices, 56 depots and 1,100 plus retail outlets. Details of the outlets opened are given in Appendix 3.8.7. Its remit includes retailing of Fast Moving Consumer Goods (FMCG), more than 6,000 items; the consumers will get a price benefit from 5.0 per cent to 30.0 per cent from MRP and on an average 10.0 per cent less than open market price. Supply co conducts special fairs in order to check undue rises in prices during festival seasons, retailing of medicines through State-run medical stores, procurement of paddy, processing and distribution of wheat and its products, acting as a dealer of petroleum products like kerosene, petrol, diesel and LPG and also acting as a nodal
agency in implementing the programmes of the GoI in the State such as starting of Micro Biology Laboratory and Food Processing Units. In 2018-19, 19 Maveli stores, 28 supermarkets, 2 People’s bazaar and 17 Maveli super stores were opened by the Supplyco (Appendix 3.8.7).
Supplyco has been entrusted with the implementation of doorstep delivery of rationed articles under PDS in the State. At present the Corporation has started NFSA intermediary godowns in all 75 Taluks in the State for storage of food grains lifted from FCI depots/CMR Mills.
Mid-Day Meal Programme
The Mid-day Meal Programme in schools is implemented in the State with the financial support of the State Government and Central assistance. The programme was introduced in 1995 by the Ministry of Human Resources Development (MoHRD), GoI, to provide nutritional support to primary school going children and to boost universalisation of primary education by increasing enrolment, retention and attendance.
Supplyco is entrusted with the responsibility of providing commodities to the Mid-Day Meal Programme in the State. The required quantity of rice is taken from the FCI. The Corporation supplied 5.0 lakh quintal of rice and 2.8 lakh quintal of special rice benefiting 26.6 lakh students in 2018-19 as against 4.8 lakh quintal of rice and 2.2 lakh quintal of special rice supplied in 2017-18. The total food grains supplied to Mid-Day Meal Programme was increased from 7.0 lakh quintal in 2017-18 to 7.8 lakh quintal in 2018-19 and the number of students benefitted was increased from 24.9 lakh to 26.6 lakh.
The number of students benefiting from the Mid-Day Meal Programme is given in Figure 3.8.2 and the details of the supply of food grains from 2011-12 to 2018-19 are shown in Appendix 3.8.8.

127Chapter 3, Agriculture and Allied Sectors
Figure 3.8.2 Mid-day meal programme, 2011-12 to 2018-19
Source: Civil Supplies Department


MANUFACTURINGSECTOR
04C H A P T E R

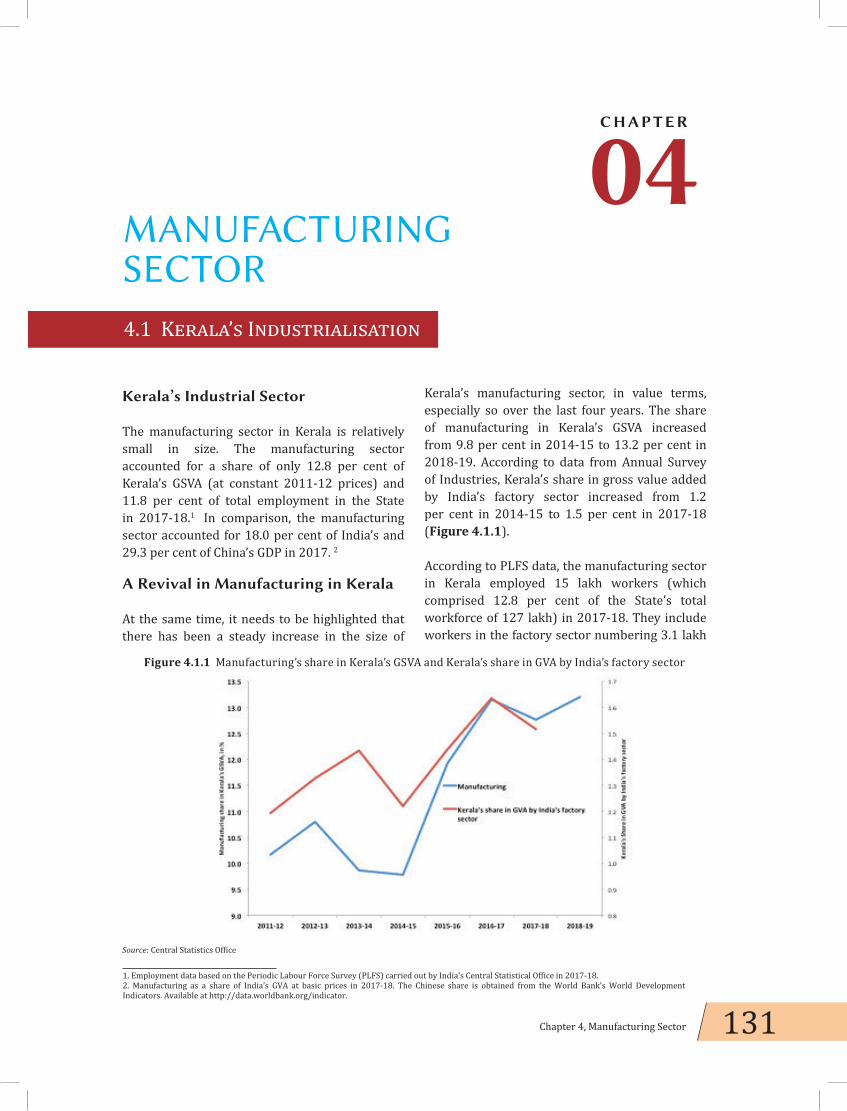
131Chapter 4, Manufacturing Sector
MANUFACTURINGSECTOR4.1 Kerala’s Industrialisation
1. Employment data based on the Periodic Labour Force Survey (PLFS) carried out by India’s Central Statistical Office in 2017-18.2. Manufacturing as a share of India’s GVA at basic prices in 2017-18. The Chinese share is obtained from the World Bank’s World Development Indicators. Available at http://data.worldbank.org/indicator.
04C H A P T E R
Kerala’s Industrial Sector
The manufacturing sector in Kerala is relatively small in size. The manufacturing sector accounted for a share of only 12.8 per cent of Kerala’s GSVA (at constant 2011-12 prices) and 11.8 per cent of total employment in the State in 2017-18.1 In comparison, the manufacturing sector accounted for 18.0 per cent of India’s and 29.3 per cent of China’s GDP in 2017. 2
A Revival in Manufacturing in Kerala
At the same time, it needs to be highlighted that there has been a steady increase in the size of
Kerala’s manufacturing sector, in value terms, especially so over the last four years. The share of manufacturing in Kerala’s GSVA increased from 9.8 per cent in 2014-15 to 13.2 per cent in 2018-19. According to data from Annual Survey of Industries, Kerala’s share in gross value added by India’s factory sector increased from 1.2 per cent in 2014-15 to 1.5 per cent in 2017-18 (Figure 4.1.1).
According to PLFS data, the manufacturing sector in Kerala employed 15 lakh workers (which comprised 12.8 per cent of the State’s total workforce of 127 lakh) in 2017-18. They include workers in the factory sector numbering 3.1 lakh
Figure 4.1.1 Manufacturing’s share in Kerala’s GSVA and Kerala’s share in GVA by India’s factory sector
Source: Central Statistics Office

132 Economic Review 2019, Kerala State Planning Board
in 2017-18. The factory sector is almost identical with the organised manufacturing sector. The factory sector comprises factories that employ more than 10 workers and operate with the aid of electric power (as well as factories that employ more than 20 workers without the aid of electric power). Annual Survey of Industries (ASI) published by the Government of India’s Ministry of Statistics and Programme Implementation (MOSPI) is the main source of data on the factory sector.
Workers in traditional industries, importantly coir, cashew and handloom, form a substantial share of Kerala’s manufacturing workforce. A few resources-based industries accounted for 42.3 per cent or 1.35 lakh workers out of the 3.1 lakh workers in Kerala’s factory sector (in 2016-17). These industries are food products and beverages (cashew processing is a major component of this), beedi manufacturing, and textiles (which include coir processing and handlooms) (Table 4.1.1). At the same time, there has been
Table 4.1.1 Structure and relative size with respect to employment and value added: shares of industries in total factory sector of Kerala and shares of Kerala’s industries in total
by the respective industries in India, 2016-17
IndustriesShares in Kerala’s total factory sector Kerala’s Shares in India
Employment Value added Employment Value added
Food Products and beverages (10, 11) 30.5 11.9 5.3 1.4
Tobacco products (12) 4.8 0.3 3.3 0.2
Textiles (13) 6.9 2.9 1.4 0.6
Garments (14) 2.6 1.5 0.7 0.7
Footwear (15) 2.7 1.6 2.2 2.0
Wood and wood products (16) 2.6 0.9 9.0 2.8
Paper and paper products (17) 1.1 0.4 1.4 0.3
Printing and reproduction of recorded media(18) 1.9 4.8 3.8 5.9
Refined petroleum products (19) 4.2 12.1 8.7 1.0
Chemical products and pharmaceuticals (20, 21) 6.6 19.2 1.4 1.2
Rubber and plastics products (22) 7.2 10.5 3.3 2.7
Other non-metallic mineral products (23) 6.0 4.7 1.8 1.0
Basic metals (24) 1.5 1.2 0.5 0.2
Fabricated metal products (25) 1.5 0.7 0.7 0.2
Electronic, computer and optical Products (26) 4.2 5.2 6.0 2.3
Electrical Equipment (27) 1.6 1.6 1.0 0.4
Machinery and equipment (28) 0.8 0.7 0.3 0.1
Motor vehicles (29) 0.1 0.1 0.0 0.0
Other transport equipment (ships and boats (30) 1.6 3.5 1.6 1.5
Furniture, jewellery, medical and dental instruments, toys (31, 32) 2.4 10.0 1.8 5.6
All Industries 100 100 2.1 1.0Note: Figures in brackets refer to the divisions (in two digits) to which each of these industries belong according to National Industrial Classification (NIC) – 2008. Source: Annual Survey of Industries data on persons engaged and gross value added.

133Chapter 4, Manufacturing Sector
a substantial reduction over the years in the size of the workforce engaged in traditional industries in Kerala. This is because of structural problems faced by some of these industries (such as cashew) as well as the withdrawal of younger generation of educated workers from industries characterised by low wages.
At the same time, it is notable that a new set of modern industries are growing in size in Kerala. The top industries in Kerala with respect to value added are chemicals, refined petroleum products, rubber and plastic products, electronic products, and pharmaceuticals and medicinal botanical products. Bharat Petroleum Corporation Limited’s (BPCL)-Kochi Refinery has been undergoing a major expansion of its refining and petrochemical production capabilities and this holds great promise for the chemical and allied industries in Kerala. Between 2011-12 and 2016-17, value added by refined petroleum products increased by eight times in Kerala. In fact, growth of value added by manufacturing sector as a whole as well a number of industries including chemicals, garments, pharmaceuticals, furniture, jewellery and medical instruments was much faster in Kerala compared to the corresponding national averages.
Turnaround in Performance of Public Sector Units
Kerala has a number of State and Central public sector units engaged in diverse areas of manufacturing, mainly chemicals, engineering and electronics. Some of the PSUs in the State, such as Travancore Cochin Chemicals (TCC) and Keltron, have been pioneers in the country in their respective fields of production (caustic soda and electronics respectively). However, the performance of many of the PSUs in Kerala has been rather lacklustre during the recent times. A major highlight of the improved performance of Kerala’s manufacturing sector from 2016-17 onwards is a turnaround in the performance of some of these PSUs, engaged mainly in the production of chemicals and electrical machinery.
Kerala Minerals and Metals Limited (KMML), Travancore Titanium Products (TTP) Limited, Travancore-Cochin Chemicals Limited (TCC) and Transformers and Electricals Kerala (TELK) Limited were some of the major PSUs, which sharply improved their performance from 2016-17 onwards. All the above-referred PSUs except KMML had registered losses in 2015-16, but all the four PSUs made substantial profits in 2016-
Figure 4.1.2 Chemicals and pharmaceutical industries in Kerala: index of production, gross value added, with index for 2011-12 = 100, and share of Kerala in value added by these industries in India
Source: Annual Survey of Industries

134 Economic Review 2019, Kerala State Planning Board
Table 4.1.2 Employment in selected major industries, Kerala and India, 2016-17, in numbers
Industries Kerala India Kerala’s share in India
Rubber products (221) 15506 210679 7.4
Refined petroleum products (192) 13203 130938 10.1
Chemical products (201, 202) 11036 761630 1.4
Manu of electronic components (261) 10263 83890 12.2
Pharmaceuticals, medicinal chemical and botanical products (210) 10154 679891 1.5
Footwear (152) 8498 265036 3.2
Garments (141) 8384 778319 1.1
Plastic products (222) 7450 489824 1.5
Printing and services related to printing (181) 6177 160407 3.9
Ships and boats (301) 4320 17967 24.0
Electric motors, transformers and generators (271) 3548 200804 1.8
Medical and dental instruments and supplies (325) 3207 60762 5.3
Furniture (310) 3151 70189 4.5
17. Kerala State Drugs and Pharmaceuticals (KSDP) Limited, which turned profitable by 2017-18, has been going through a significant phase of modernisation and capacity expansion. Figure 4.1.2 shows that, by 2015-16, value added in chemicals and pharmaceutical industries in Kerala had declined to 73 per cent only of the corresponding value in 2011-12, However, in 2016-17, value added by these industries improved sharply to 187 per cent of the 2011-12 level.
New Opportunities in Modern Industries
Another positive aspect is the emergence of a few new modern industries in the State. The number of workers engaged in the manufacture of electronic components in Kerala rose from 2930 only in 2012-13 to 10263 by 2016-17. Workers engaged in the manufacture of medical and dental instruments and supplies increased from 1023 only in 2012-13 to 3207 in 2016-17 (Table 4.1.2).
After its expansion, BPCL-Kochi Refinery’s refining capacity is expected to increase from
the current 9.5 million metric tonnes per annum (MMTPA) to 15 MMTPA. Some of the products of BPCL-Kochi Refinery, such as propylene and ethylene, are key ingredients for a wide range of downstream industries in the areas of petrochemicals and specialty chemicals, including plastics, polymers, fibers, and personal and home care products. The State government has taken steps to set up a petrochemical complex at Kochi, which is likely to attract large private investments in the above-referred areas.
There is great potential in Kerala for the growth of pharmaceuticals, biotechnology, life sciences, and medical-equipment manufacturing industries. This is partly on account of the large demand within the State for medicines and healthcare products. These industries will also have much to gain from the large numbers of hospitals, doctors and nurses in Kerala.
Kerala has the potential to build a large electronics hardware manufacturing sector. The State should build on the unique advantages of the IT sector in the State and also make good use of the skill sets of its professionally qualified workforce. Globally, there is now a growing

135Chapter 4, Manufacturing Sector
integration between the IT and electronic sectors and between software and hardware production. With IT sector itself going through fundamental changes, it is important that Kerala turn its attention to diversifying into hardware manufacturing as well.
Modernising the Traditional Sectors
The government is taking steps to modernise the traditional industries in the State, including coir, cashew and handloom. As already noted, these industries continue to employ a substantial part of the State’s total workforce. Modernisation of traditional industries will include (but not limited to) mechanisation of production processes in these industries. Moreover, with modernisation, Kerala’s traditional industries will strive to diversify into new products (such as geo-textiles in the coir sector), and evolve effective marketing and distribution strategies. Rather than displacing workers (a strategy involving mechanisation alone may result in this), modernisation will lead to overall expansion of the industry and the creation of greater value addition per worker.
The State government has engaged handloom cooperative societies in Kerala to supply cloth for the School Uniform Scheme of the Government. Handloom workers and leaders of cooperative societies have agreed that the School Uniform Scheme has helped to revive the sector to some extent. Many workers who had left handloom weaving because of lack of opportunities have returned to work in this sector.
It is clear that in handlooms and other traditional sectors, both technological and organisational innovations are needed to increase productivity, improve wages, and at the same time, avoid job losses. The promotion of handlooms should be done along with measures for improvement of value added per worker. Handlooms should be encouraged to work on products/areas where it can create a niche market (such as high design furnishings or sarees). Handloom cooperatives should work with design institutions so that
they can come up with innovative designs and marketing strategies. Another option would be a tie up between handloom weaving societies and the tourism sector.
In Kerala, there is very high potential for growth in the garment sector. Kerala has a large and sophisticated market for all types of garments. In addition to the large home market, garment firms in Kerala can also take advantage of the demand for Kerala-specific designs from a sizeable export market comprising non-resident Keralites. The other advantage is the large availability in Kerala of skilled workers and professionals in the garment and fashion sector. The industry should work closely with fashion and design institutes in Kerala. The garment sector should take good advantage of online marketing strategies.
Kerala is yet to take advantage of its huge potential in the food and beverages sectors. There are enormous possibilities in the State in the storage, processing and value addition of vegetables, fruits, fish and meat. There exists huge potential, in particular, for the processing of coconut, jackfruit, banana, pineapple, and tapioca. Wood and bamboo based industries can also be developed in selected regions of the State. A relatively large market for food and agro-based products exists within Kerala However, a good part of this domestic demand is met by imports from other Indian States and countries. Kerala’s industries, especially food and agro-based industries, can tap into this domestic market. The growth of traditional, food and agro-based industries and of tourism can go hand in hand in Kerala, feeding on each other to create a globally recognised niche for the State in these sectors. Kerala can learn lessons from countries such as Thailand, Malaysia and Vietnam in successfully combining agriculture, agro-based industries and tourism.

136 Economic Review 2019, Kerala State Planning Board
4.2 Manufacturing Sector
A strong and diversified manufacturing sector is a crucial pillar for the economy, for domestic production, exports and employment growth. As per the provisional data from the Central Statistics Office (CSO), the growth of India’s manufacturing sector has been estimated at 6.9 per cent in 2018-19 as against the previous year’s growth rate of 5.9 per cent. The year-on-year growth of Gross Value Added (GVA) by the manufacturing sector in India as per provisional estimates, at constant prices from 2014-15 to 2018-19 is exhibited in Figure 4.2.1.
Manufacturing Sector in Kerala
As per quick estimates of Kerala’s Gross State Value Added (GSVA) for 2018-19 by Department of Economics and Statistics, the manufacturing sector of Kerala grew at 11.2 per cent at constant prices (2011-12) in 2018-19 compared to 3.7 per cent in the previous year. The shares of manufacturing sector to GSVA in Kerala at constant and current prices in 2018-19 were 13.2 per cent and 10.8 per cent respectively. The growth of manufacturing sector in Kerala from 2014-15 to 2018-19 is given in Appendix 4.2.1.
Figure 4.2.1 Annual growth of gross value added by the manufacturing sector in India, at constant prices, in per cent
Source: Central Statistics Office

137Chapter 4, Manufacturing Sector
The trend in growth rate of GSVA of manufacturing sector in Kerala (at constant prices) for the period from 2014-15 to 2018-19 is shown in Figure 4.2.2.
The growth of GSVA by the manufacturing sector was 2.9 per cent in 2014-15, 28.4 per cent in 2015-16, 18.2 per cent in 2016-17, 3.7 per cent in 2017-18 and 11.2 per cent in 2018-19.
As per data from the Annual Survey of Industries (ASI), GoI on the organised manufacturing sector, there were 6507 operating factories in Kerala in 2016-17. Fixed capital invested in these factories in Kerala was estimated at ₹47,845.5 crore. The total output and Net Value Added (NVA) in these factories in Kerala in 2016-17 were ₹1,39,427.2 crore and ₹20,479.6 crore respectively. The net income of the organised manufacturing sector in Kerala is ₹18,636.8 crore and the profit earned in 2016-17 is ₹10,436.8 crore.
Mining Sector in Kerala
The contribution of mining and quarrying sector to Gross State Value Added (GSVA) of Kerala at constant prices is estimated at ₹2,622.9 crore
in 2018-19. It shows a decline of 14.6 per cent compared to the previous year. The share of mining and quarrying in GSVA at constant prices decreased from 0.6 per cent in 2017-18 to 0.5 per cent in 2018-19.
The growth of income from the mining and quarrying sector in Kerala at constant prices (2011-12) from 2014-15 to 2018-19 is depicted in Figure 4.2.3.
The growth rate of income from mining and quarrying sector in Kerala at constant price has been fluctuating over the years. After registering a growth of 60.8 per cent in 2014-15, it declined to (–)67.9 per cent in 2015-16. In 2016-17, income from mining and quarrying sector grew to 45.5 per cent, which again declined to 18.9 per cent in 2017-18 and then to a negative growth rate of 14.6 per cent in 2018-19.
In 2018-19, nine mining leases for major minerals, 103 quarrying leases for minor minerals, and 1289 dealers’ license were granted. In this period, there were 169 registered metal crusher units in Kerala and one prospecting license was granted for minor and major
Figure 4.2.2 Annual growth of gross value added by the manufacturing sector in Kerala, at constant prices, in per cent
Source: Directorate of Economics and Statistics, GoK

138 Economic Review 2019, Kerala State Planning Board
minerals. In Kerala, in 2018-19 the total area covered by mining leases as on September was 104.6 hectares, which is only for granite building stone.
Mineral wise Production and Revenue Collection 2018-19
The Government gets revenue from minerals mainly by way of royalty. About 95 per cent of the revenue comes from minor minerals and rest from major minerals. In 2017-18, an amount of ₹152 crore was received as revenue from minerals and it increased to ₹171.3 crore (12.7 per cent) in 2018-19. Of this, ₹5.4 crore was received from major minerals and ₹165.9 crore from minor minerals. In 2018-19, the highest revenue received among major minerals was
from Ilmenite (₹2 crore) followed by Zircon (₹1.6 crore). Among minor minerals, granite building stone contributes the highest (₹119.9 crore) followed by Laterite (building) (₹12.3 crore) in 2018-19. The revenue from minerals during the last 5 years is shown in Table 4.2.1.
In 2018-19, 461.4 lakh tonnes of major and minor minerals were produced in Kerala. Among major minerals Ilmenite topped the list with 1.3 lakh tonnes followed by limestone (1 lakh tonnes). Among minor minerals, the highest production was from granite building stone (353.1 lakh tonnes) followed by ordinary earth (62.8 lakh tonnes). The production of and royalty received from minerals in the State in 2018-19 is given in Appendix 4.2.2.
Table 4.2.1 Revenue from minerals, in ₹ croreSl No Year Major Minerals Minor Minerals Total
1 2014-15 13.9 56.7 70.62 2015-16 13.4 126.3 139.73 2016-17 6.4 132.3 138.74 2017-18 8.5 143.5 152.05 2018-19 5.4 165.9 171.3
Source: Mining and Geology Department
Figure 4.2.3 The growth of income from the mining and the quarring sector in Kerala, in per cent
Source: Directorate of Economics and Statistics, GoK

139Chapter 4, Manufacturing Sector
District Wise analysis of Revenue Collected from Major/Minor Minerals
District wise analysis of revenue collection for the year 2018-19 shows that Ernakulum District had the highest collection of ₹30.7 crore (17.95 per cent of total revenue) followed by ₹18.0 crore (10.5 per cent) in Thiruvananthapuram and ₹16.8 crore (9.8 per cent) in Palakkad. The least revenue collection of ₹1.9 crore (1.1 per cent) was from Wayanad. The District-wise collection of revenue from major and minor minerals is furnished in Appendix 4.2.3.
Implementation of e-governance projects
The Kerala Online Mining Permit Awarding Services (KOMPAS) is an online system which is implemented through the National Informatics Centre. It is implemented in all Districts. As on September 2019, a total of 63.2 lakh e-passes were generated and printed. So far, 50,191 vehicles have been enrolled in KOMPAS portal.
Mineral Based Industries in Kerala
Some of the industries based on minerals are Indian Rare Earths Ltd, Kerala Minerals and Metals Ltd, Malabar Cements, Travancore Cements Ltd, Kundara Ceramics, English Indian Clays Ltd, and Kerala Clays and Ceramic Products Ltd. The major industries based on minor minerals are stone crushers, units of production of manufactured sand, brick factories as well as tile factories. Due to recent spurt in infrastructure development, a number of granite building stone crushers as well as sand production units have come up in the State.
Mining and quarrying are important economic activities, although the impact they may have on the environment needs to be closely monitored. The Government is therefore diligent in adopting and implementing regulations to moderate the negative impacts of mining operations. Modern technologies and practices have, to a great extent, reduced the risks associated with mining and quarrying to the environment and economy.

140 Economic Review 2019, Kerala State Planning Board
4.3 Public Sector Undertakings
Public Sector Undertakings (PSU), both at the Central and State level, have played an important role in the industrialisation and the overall development of the country. They were set up with the objective of helping the country achieve self-sufficiency in manufacturing and technology and were intended to achieve commanding heights in the Indian economy. PSUs have been key and strategic actors in the nation’s economy producing essential goods and services and maintaining a dominant market position. However, since the 1990s, economic reforms in India have been emphasising a greater role for markets and the Central Government has been following a disinvestment in the PSUs. However, contrary to the Central Government policies, the GoK aims to strengthen the public sector, run PSUs professionally, and help them earn profits and contribute to the larger development of the industrial sector and the economy.
Central Public Sector Undertakings
As on March 31, 2018, there were 339 PSUs under the administrative control of various ministries/departments of GoI. In 2017-18, 184 central PSUs in India generated a combined profit of ₹1.6 lakh crore while there were 71 sick central PSUs in the economy, which incurred a combined loss of ₹31,261 crore.
Central Sector Investment
The aggregate real investment in Central PSUs in India, measured in terms of ‘gross blocks’, increased from ₹17.7 lakh crore in 2016-17 to ₹19.9 lakh crore in 2017-18, registering a growth of 12.1 per cent over the previous year. The investment by central PSUs in Kerala in terms of gross block grew by 5.2 per cent from ₹44,921 crore in 2016-17 to ₹47,234 crore in 2017-18. The State’s share in total investment by central PSUs slightly declined from 2.5 per cent in 2016-17 to 2.4 per cent in 2017-18 (Public Enterprises Survey 2017-18). Among Indian States, Maharashtra was ranked first with respect to shares in investment by central PSUs (with a share of 8.5 per cent) followed by Tamil Nadu (share of 6.6 per cent) and Uttar Pradesh (6.5 per cent). Details of central sector investment in Kerala from 2013-14 to 2017-18 are given in Appendix 4.3.1 and central sector investment in selected States as on March 31, 2018 are given in Appendix 4.3.2.
Kerala’s share in investment by central PSUs from 2013-14 to 2017-18 is illustrated in Figure 4.3.1. It may be seen that the share of Kerala’s investment started increasing from 2013-14 onwards and then shows a slight decline in 2017-18.

141Chapter 4, Manufacturing Sector
Joint Stock Companies
There were 32,329 Joint Stock Companies in Kerala as on March 2019, of which 30,401 (94 per cent) were private limited companies and 1,928 (6 per cent) were public limited companies. In 2018-19, 4716 companies were newly registered (4,525 Private Limited and 191 public limited). The numbers of companies wound up/dissolved/struck off/amalgamated in 2018-19 were 2,837. Three public limited companies were converted to private limited companies and 3 companies were converted from private limited to public limited companies. Total number of Government companies as on March 2019 was 162. Details of joint stock companies working in Kerala are given in Appendix 4.3.3.
State Public Sector Undertakings In Kerala, State PSUs play a crucial role in the development of the economy, especially in the manufacturing sector. PSUs consist of State Government companies and Statutory Corporations established to carry out activities of commercial nature. As per the report of the Comptroller and Auditor General of India on PSUs in Kerala, there were 130 PSUs as on March 31,
2017. Out of the 130 Government companies, 115 (111 Government companies and 4 statutory corporations) are currently working while 15 are non-working. As per the latest finalised accounts, the working PSUs in Kerala registered a combined turnover of ₹26,463.3 crore which was equivalent to 4 per cent of State’s GSDP ie the total investment as on March 31, 2017 in 130 PSUs was ₹27,106.9 crore. An analysis of the latest finalised accounts of all working PSUs in the State revealed that the total profits generated by 45 Public Sector Undertakings was ₹382.8 crore whereas the total losses incurred by 64 Public Sector Undertakings was ₹2,216 crore, resulting a net loss of ₹1,833.2 crore. Two working Public Sector Undertakings registered neither profits nor losses.
State Public Sector Undertakings under Industries Department
Under Industries Department, GoK, there are 42 PSUs, of which 7 are in the chemical sector, 4 in electrical sector, 6 in engineering sector, 3 in electronic sector, 11 in textile sector, 2 in ceramic sector, 6 in traditional sector, 1 in wood based sector and 2 in development sector.
Figure 4.3.1 Share of Kerala in investment by Central PSUs, in per cent
Source: Public Enterprises Survey 2017-18

142 Economic Review 2019, Kerala State Planning Board
Performance of State PSUs under Industries Department in 2018-19
• Total Turnover: ₹3,442.74 crore (increased by 17.9 per cent from 2017-18)
• Profit making units decreased to 12 from 13 in 2017-18 with a total profit of ₹241.2 crore. (Figure 4.3.2)
• Loss making units increased to 30 from 28 in 2017-18 with a total loss of ₹232.94 crore
• Overall profits of Industrial PSU’s in 2018-19 was ₹8.26 crore
Encouraging Trends in PSUs performance is shown in Box 4.3.1. Performance trend of 42 State PSUs under the Industries department from 2014-15 to 2018-19 is depiicted in Figure 4.3.2.
The combined value of production and turnover of 42 State PSUs under the Industries department from 2014-15 to 2018-19 are shown in Figure 4.3.3.
Box 4.3.1 PSUs contribution for launching of Chandrayaan-2 Mission
Five PSUs under the Industries Department viz Kerala Minerals and Metals Ltd (KMML), KELTRON, Steel and Industrial Forging (SIFL), Kerala Automobiles (KAL) and Small Industries Development Corporation (SIDCO), have been partners in the project that led to the historic launching of Chandrayaan-2, the India’s second lunar exploration mission.
• KMML supplied titanium sponge metal to the mission. • Keltron did the testing and fabrication packages to the Integrated Structural Measurement
Unit (ISMU), Navigational Guidance Control Packages (NGCP) used in the launch vehicle GSLV MK III M1 for the Chandrayan – 2; the electromechanical sub assembly fabrication of packages- winding, potting, magnetising, screening and assembly of Brushless DC (BLDC) Motor Rotor & Stepper Motor; Electrical integration of Momentum Wheel assembly, Reaction Wheel and Micro Reaction Wheel Assembly
• SIFL supplied titanium liners for propeller tank, binocular body for separation system, principal shaft equilibrium regulator body, titanium alloy gas bottles
• SIDCO manufactured the Piston nose cone, cylinder nose cone• KAL supplied 25 items like brackets, spacer blocks, harness bridge, vent valve interface plates.
Source: RIAB
Figure 4.3.2 Performance trend of PSUs under Industries Department*
*Excluding KINFRASource: Public Sector Restructuring and Internal Audit Board
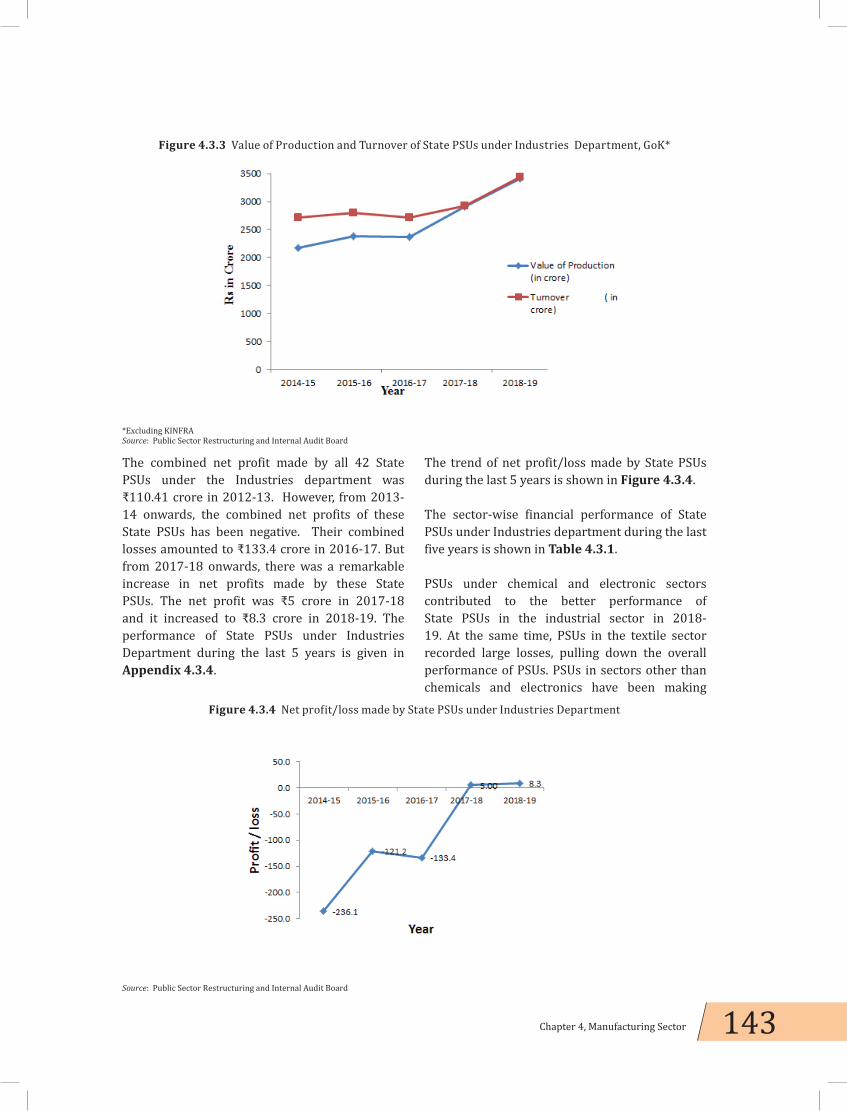
143Chapter 4, Manufacturing Sector
The combined net profit made by all 42 State PSUs under the Industries department was ₹110.41 crore in 2012-13. However, from 2013-14 onwards, the combined net profits of these State PSUs has been negative. Their combined losses amounted to ₹133.4 crore in 2016-17. But from 2017-18 onwards, there was a remarkable increase in net profits made by these State PSUs. The net profit was ₹5 crore in 2017-18 and it increased to ₹8.3 crore in 2018-19. The performance of State PSUs under Industries Department during the last 5 years is given in Appendix 4.3.4.
The trend of net profit/loss made by State PSUs during the last 5 years is shown in Figure 4.3.4.
The sector-wise financial performance of State PSUs under Industries department during the last five years is shown in Table 4.3.1.
PSUs under chemical and electronic sectors contributed to the better performance of State PSUs in the industrial sector in 2018-19. At the same time, PSUs in the textile sector recorded large losses, pulling down the overall performance of PSUs. PSUs in sectors other than chemicals and electronics have been making
Figure 4.3.3 Value of Production and Turnover of State PSUs under Industries Department, GoK*
*Excluding KINFRASource: Public Sector Restructuring and Internal Audit Board
Figure 4.3.4 Net profit/loss made by State PSUs under Industries Department
Source: Public Sector Restructuring and Internal Audit Board

144 Economic Review 2019, Kerala State Planning Board
Table 4.3.1 State PSUs under Industries Department: Plan fund allocation, turnover and net profits, in ₹ crore
Items 2014-15 2015-16 2016-17 2017-18 2018-19 2019-20(as on September 2019)
Chemicals (7 units)
Plan fund allocation 19.0 19.1 19.7 19.5 28.2 15.3
Turnover 1127.6 1153.6 1266.6 1401.9 1595.9 696.5
Net profit -46.2 13.0 28.2 223.3 189.1 -1.3
Textile (8 units)
Plan fund allocation 20.3 29.7 34.8 23.8 22.2 20.5
Turnover 138.7 96.3 82.3 133.9 157.3 82.2
Net profit -85.2 -72.3 -73.9 -90.9 -94.2 -56.4
Engineering (6 units)
Plan fund allocation 13.7 6.0 12.9 25.9 30.5 9.4
Turnover 131.9 121.4 116.6 125.8 154.2 74.7
Net profit -25.2 -33.7 -31.9 -44.8 -42.7 -21.4
Electronics (3units)
Plan fund allocation 7.0 1.5 2.8 2.7 10.6 0
Turnover 368.5 484.8 452.4 480.2 542.6 242.9
Net profit -14.1 13.4 -17.51 3.8 9.6 -5.3
Electrical (4 units)
Plan fund allocation 12.0 18.5 15.5 17.9 32.9 5.5
Turnover 360.0 398.2 424.0 393.4 565.1 231.8
Net profit -62.7 -47.3 -17.9 -34.2 -20.4 -21.9
Traditional and wood based (7 units)
Plan fund allocation 32.5 14.0 4.9 7.1 7.5 4.5
Turnover 131.7 146.7 139.7 128.1 136.3 42.1
Net profit -21.7 -20.9 -22.1 -30.1 -21.8 -7.3
Ceramic (2 units)
Plan fund allocation 2.0 2.0 4.9 4.9 16.2 3.0
Turnover 15.2 5.5 4.7 5.3 8.2 6.0
Net profit -6.5 -10.9 -10.9 -13.7 -9.0 -4.6
Development (3 units in 2014-2017 and 2 after 2017)
Plan fund allocation - - 5.5 - - 1.0
Turnover 444.1 393.2 235.2 252.4 283.1 68.5
Net profit 25.4 37.6 12.7 -8.4 -2.3 -9.2
Source:- RIAB

145Chapter 4, Manufacturing Sector
losses. Policy attention is needed to improve the productivity and turnover of State PSUs.
The total value of production in the 42 State PSUs under the Industries department increased from ₹2,909.8 crore in 2017-18 to ₹3,405.7 crore in 2018-19, registering a growth of 17 per cent. Turnover of these State PSUs also increased by 17.9 per cent in 2018-19 compared to its previous year. Details of PSU-wise turnover and profit/loss in 2018-19 and 2019-20 (as on September 2019) are shown in Appendix 4.3.5.
The increased dependency on budgetary support even for continuing with regular operations of PSUs was a major concern during the 12th Five-Year Plan period. However, from the last year of the Twelfth Five Year Plan period (2016-17) onwards, major initiatives for strengthening and revamping of PSUs under the Industries department are being undertaken.
Future Plans
PSUs need transformation from purely profit-making ventures to institutions that create an enabling environment for high technology enterprises, in private and public sector. There is need to increase the linkages between PSUs and the State’s economy. For this, raw material should be procured as much as possible from the State itself and measures will be taken to help and support the development of ancillary and downstream industries.
GoK is committed to the development and rejuvenation of PSUs. Professional managers have been appointed to oversee the operations of PSUs. A permanent Public Enterprises Selection Board has been set up for selecting a cadre of top managers in a transparent manner. Convergence and mergers of PSUs manufacturing similar products will be undertaken to bring about efficiency in their operations.
Public Sector Restructuring and Internal Audit Board (RIAB) RIAB, which is functioning under the Industries
department, is the agency for undertaking reform initiatives in State PSUs. RIAB has been playing a major role in the rejuvenation and revival of PSUs under the Industries department. Major responsibilities of the agency include performance planning and monitoring of PSUs, enterprise reconstruction, capacity building, recruitments in PSUs, and governance advisory support to State PSUs.
Industrial Promotion and Infrastructure Development Agencies
The main industrial financing agencies in the State are Kerala State Industrial Development Corporation (KSIDC) and Kerala Financial Corporation (KFC). In addition to industrial financing, KSIDC promote and facilitate physical and social infrastructure required for industrial growth in the State. KINFRA has been focusing on industrial infrastructure development.
Kerala State Industrial Development Corporation (KSIDC)
KSIDC is a wholly owned company of the GoK, established in 1961, for the promotion and development of medium and large- scale units in the State. KSIDC initiated major industrial and infrastructure projects, which are strategically important for Kerala’s economic development. KSIDC also plays a vital role in the State by financing and promoting private industrial projects, spearheading investment promotion initiatives, creating sector-specific industrial infrastructure and ecosystem, and nurturing entrepreneurship and start-ups. As the nodal agency for foreign and domestic investment in Kerala, KSIDC provides comprehensive support for investors, helping them access various incentives and schemes, and facilitating constant interaction between the Government and the industrial sector.
The authorised share capital of KSIDC is ₹400 crore. The paid up share capital of the Corporation is ₹301.24 crore which is fully subscribed by the Kerala Government.

146 Economic Review 2019, Kerala State Planning Board
Besides financing several industrial units and implementing various mega projects, KSIDC had also taken up many activities. The major activities and ongoing projects initiated by KSIDC are shown in Box.4.3.2.
Financial Status
The Corporation in 2017-18 has reported a net profit of ₹ 33.61 crore. Certain key financial parameters of KSIDC for the past three years are given in Table 4.3.2.
Industrial Financing by KSIDC
The Corporation has so far promoted more than 750 projects in the State with an investment outlay of ₹50,000 crore. These were projects
with the potential to generate upto one lakh employment opportunities. In 2018-19, KSIDC sanctioned projects worth of ₹316.4 crore, with direct term loan assistance of ₹120.7 crore. These projects are expected to generate employment for 859 persons directly and indirectly. The Corporation achieved ₹64.4 crore of disbursements, and a total amount of ₹85.5 crore was recovered by way of principal and interest. The operating profit of the Corporation in 2018-19 was ₹42.6 crore. Currently there are 23 projects under various stages of implementation with a total investment of ₹2,565.1 crore, which would create employment for around 1,759 persons. The physical and financial performance of KSIDC in 2018-19 and 2019-20 (as on September 2019) is given in Appendix 4.3.6.
Table: 4.3.2 Key financial parameters of KSIDC, in ₹ croreParticulars 2015-16 2016-17 2017-18
Net Worth 684.6 611.3 633.9Capital Employed 296.1 345.4 296.3Turnover 63.6 47.9 52.1Total expenditure 13.7 13.7 18.5Employee Expenses 9.0 9.1 10.3Net Profit/Loss (+/-) 50.0 34.5 33.6Audit Status Audit up-to-date
Source: BPE Review 2017-18
Box 4.3.2 Major activities and ongoing projects by KSIDC
• Financial assistance and support to medium and large-scale industries• Investment promotion in Kerala• Providing support for industrial infrastructure development, including in Industrial Growth
Centres• Promoting Ease of Doing Business (EoDB) in Kerala• Providing support for various start-up initiatives• Entrepreneur support through mentoring• Angel/seed fund scheme• Electronic Hardware Park at Kochi • Life Science Park – for promoting private industries and R&D institutions in the life sciences
sector.• Second phase of Light Engineering Industrial Park, Palakkad.• Industrial Growth Centres• Business Incubators• Medical devices Park (Med Spark)
Source: KSIDC

147Chapter 4, Manufacturing Sector
The Plan outlay for and expenditure by KSIDC from 2015-16 to 2019-20 are shown in Table 4.3.3. Major Promotional Activities of KSIDC
KSIDC has been engaged in a number of activities to facilitate and promote private investment. The major promotional activities are:
Ease of Doing Business (EoDB)
The Department of Industrial Policy and Promotion (DIPP), GoI, has been ranking States annually based on the reform masures taken to improve EoDB. KSIDC has carried out a study on the reforms needed to improve EoDB in Kerala, especially reforms in the existing Rules and Acts relating to clearance procedures for starting an industrial unit in Kerala. Based on the recommendation of the study report; amendments to seven Acts have been approved by the State Cabinet. The State Legislature passed the Kerala Investment Promotion and Facilitation Act 2018.
Kerala Single Window Interface for Fast and Transparent Clearance (KSWIFT)
State Government has introduced the ‘Single Window Clearance System’ to ease the setting up of industrial projects in the State. KSIDC is the nodal agency for the scheme and National Informatics Centre (NIC) has been engaged for the development of online clearance mechanism
and online common application form. KSWIFT will be the platform for all future transactions with the Government on the issue of granting licences and approvals in a time bound manner. Presently, the services of 15 Departments/ Agencies are being made available in KSWIFT.
Angel Fund/Seed Fund
KSIDC has also initiated a special finance assistance scheme known as “Angel Fund/Seed Fund” to promote entrepreneurship among the youth of the State. It aims to support scientific, technological and innovative projects promoted by young entrepreneurs, which are commercially viable. As on September 2019, KSIDC has sanctioned seed fund assistance to 100 innovative start-ups for an amount of ₹ 20.9 crore.
Land available with KSIDC
The total land available with KSIDC is 1483.2 acres. Of this, land available for industrial development purposes was 1,132 acres. Out of the land available for industrial purposes, 691.4 acres have already been allotted to industrial units. The remaining land is still available with KSIDC for allotment to industrial units. Details of allotment of land in KSIDC Industrial Parks as on September 2019 is shown in Appendix 4.3.7.
Kerala Industrial Infrastructure Development Corporation (KINFRA)
KINFRA was setup in 1993 with the objective of building industry-specific infrastructure
Table: 4.3.3 Plan outlay and expenditure, KSIDC, in ₹ croreSl. No Year Outlay Expenditure %
1 2015-16 74.0 29.1 39.32 2016-17 87.5 75.5 86.33 2017-18 96.3 171.7 178.44 2018-19 134.4 77.5 57.75 2019-20* 116.0 10.1 8.7
Source: Budget Estimate
*Expenditure as on November, 2019
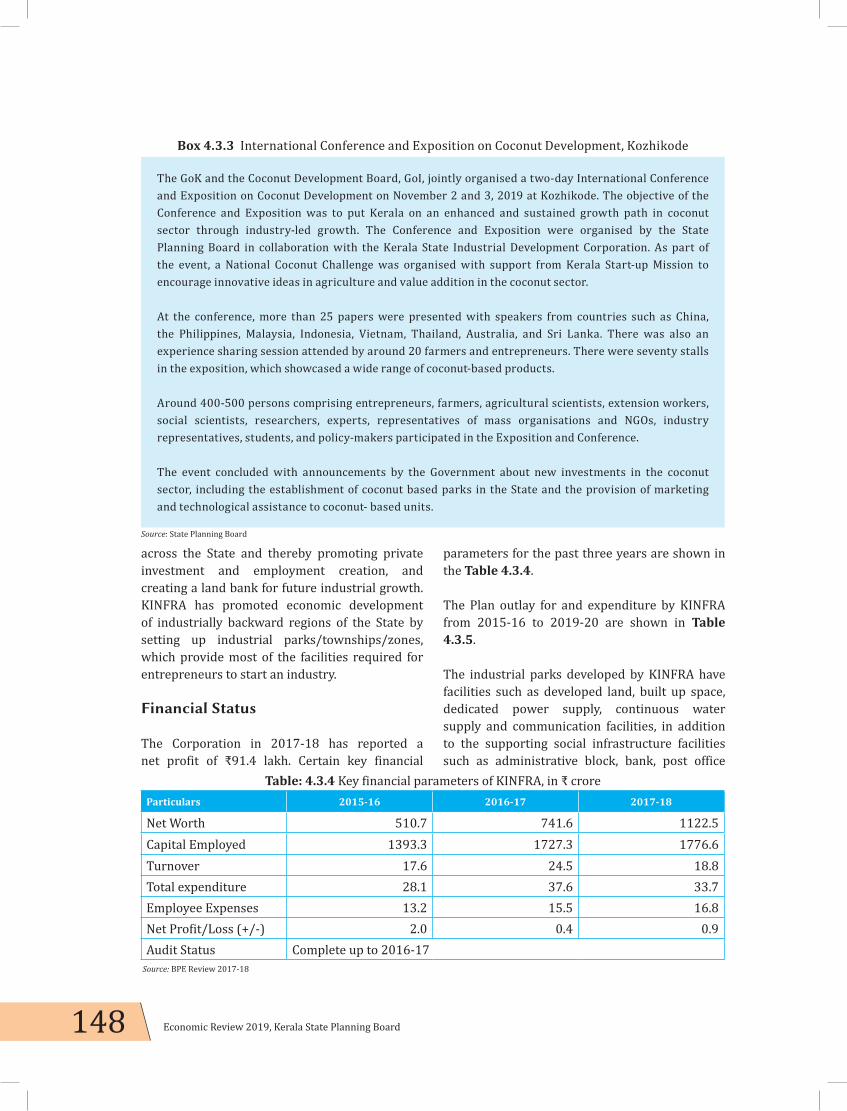
148 Economic Review 2019, Kerala State Planning Board
across the State and thereby promoting private investment and employment creation, and creating a land bank for future industrial growth. KINFRA has promoted economic development of industrially backward regions of the State by setting up industrial parks/townships/zones, which provide most of the facilities required for entrepreneurs to start an industry.
Financial Status
The Corporation in 2017-18 has reported a net profit of ₹91.4 lakh. Certain key financial
parameters for the past three years are shown in the Table 4.3.4.
The Plan outlay for and expenditure by KINFRA from 2015-16 to 2019-20 are shown in Table 4.3.5.
The industrial parks developed by KINFRA have facilities such as developed land, built up space, dedicated power supply, continuous water supply and communication facilities, in addition to the supporting social infrastructure facilities such as administrative block, bank, post office
Box 4.3.3 International Conference and Exposition on Coconut Development, Kozhikode
The GoK and the Coconut Development Board, GoI, jointly organised a two-day International Conference and Exposition on Coconut Development on November 2 and 3, 2019 at Kozhikode. The objective of the Conference and Exposition was to put Kerala on an enhanced and sustained growth path in coconut sector through industry-led growth. The Conference and Exposition were organised by the State Planning Board in collaboration with the Kerala State Industrial Development Corporation. As part of the event, a National Coconut Challenge was organised with support from Kerala Start-up Mission to encourage innovative ideas in agriculture and value addition in the coconut sector.
At the conference, more than 25 papers were presented with speakers from countries such as China, the Philippines, Malaysia, Indonesia, Vietnam, Thailand, Australia, and Sri Lanka. There was also an experience sharing session attended by around 20 farmers and entrepreneurs. There were seventy stalls in the exposition, which showcased a wide range of coconut-based products.
Around 400-500 persons comprising entrepreneurs, farmers, agricultural scientists, extension workers, social scientists, researchers, experts, representatives of mass organisations and NGOs, industry representatives, students, and policy-makers participated in the Exposition and Conference.
The event concluded with announcements by the Government about new investments in the coconut sector, including the establishment of coconut based parks in the State and the provision of marketing and technological assistance to coconut- based units.
Source: State Planning Board
Table: 4.3.4 Key financial parameters of KINFRA, in ₹ croreParticulars 2015-16 2016-17 2017-18
Net Worth 510.7 741.6 1122.5Capital Employed 1393.3 1727.3 1776.6Turnover 17.6 24.5 18.8Total expenditure 28.1 37.6 33.7Employee Expenses 13.2 15.5 16.8Net Profit/Loss (+/-) 2.0 0.4 0.9Audit Status Complete up to 2016-17
Source: BPE Review 2017-18
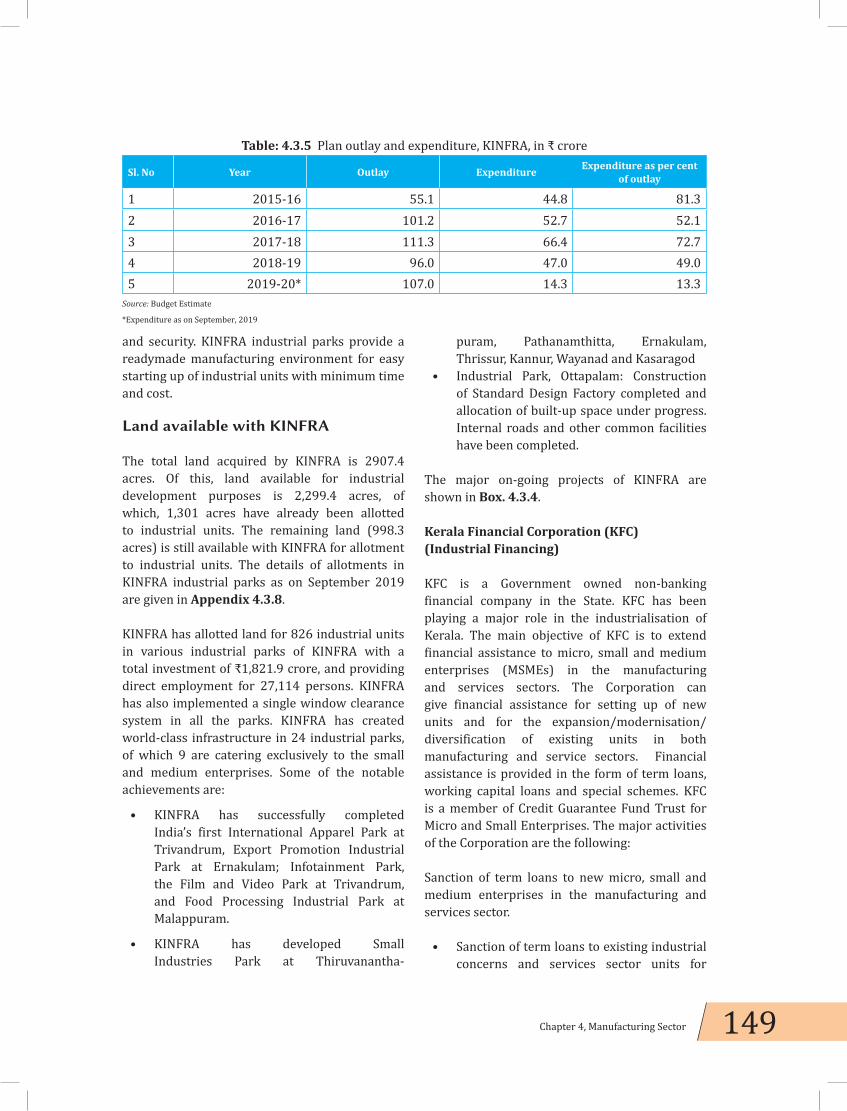
149Chapter 4, Manufacturing Sector
and security. KINFRA industrial parks provide a readymade manufacturing environment for easy starting up of industrial units with minimum time and cost.
Land available with KINFRA
The total land acquired by KINFRA is 2907.4 acres. Of this, land available for industrial development purposes is 2,299.4 acres, of which, 1,301 acres have already been allotted to industrial units. The remaining land (998.3 acres) is still available with KINFRA for allotment to industrial units. The details of allotments in KINFRA industrial parks as on September 2019 are given in Appendix 4.3.8.
KINFRA has allotted land for 826 industrial units in various industrial parks of KINFRA with a total investment of ₹1,821.9 crore, and providing direct employment for 27,114 persons. KINFRA has also implemented a single window clearance system in all the parks. KINFRA has created world-class infrastructure in 24 industrial parks, of which 9 are catering exclusively to the small and medium enterprises. Some of the notable achievements are:
• KINFRA has successfully completed India’s first International Apparel Park at Trivandrum, Export Promotion Industrial Park at Ernakulam; Infotainment Park, the Film and Video Park at Trivandrum, and Food Processing Industrial Park at Malappuram.
• KINFRA has developed Small Industries Park at Thiruvanantha-
puram, Pathanamthitta, Ernakulam, Thrissur, Kannur, Wayanad and Kasaragod
• Industrial Park, Ottapalam: Construction of Standard Design Factory completed and allocation of built-up space under progress. Internal roads and other common facilities have been completed.
The major on-going projects of KINFRA are shown in Box. 4.3.4.
Kerala Financial Corporation (KFC) (Industrial Financing)
KFC is a Government owned non-banking financial company in the State. KFC has been playing a major role in the industrialisation of Kerala. The main objective of KFC is to extend financial assistance to micro, small and medium enterprises (MSMEs) in the manufacturing and services sectors. The Corporation can give financial assistance for setting up of new units and for the expansion/modernisation/diversification of existing units in both manufacturing and service sectors. Financial assistance is provided in the form of term loans, working capital loans and special schemes. KFC is a member of Credit Guarantee Fund Trust for Micro and Small Enterprises. The major activities of the Corporation are the following:
Sanction of term loans to new micro, small and medium enterprises in the manufacturing and services sector.
• Sanction of term loans to existing industrial concerns and services sector units for
Table: 4.3.5 Plan outlay and expenditure, KINFRA, in ₹ crore
Sl. No Year Outlay Expenditure Expenditure as per cent of outlay
1 2015-16 55.1 44.8 81.32 2016-17 101.2 52.7 52.13 2017-18 111.3 66.4 72.74 2018-19 96.0 47.0 49.05 2019-20* 107.0 14.3 13.3
Source: Budget Estimate
*Expenditure as on September, 2019

150 Economic Review 2019, Kerala State Planning Board
expansion/modernisation/diversification.• Sanction of working capital loans to meet
working capital requirements of industrial/service enterprises under special schemes.
• Special schemes for financial assistance to civil contractors.
• Special scheme for financial assistance for producing feature film and TV serials.
• Special scheme for modernisation, up gradation and expansion of existing cinema theatres and establishment of new multiplexes.
• Special scheme for purchase of lab equipments/waste management.
• Scheme for Funding Venture Debt for IT Hardware and Software Enterprises.
• Scheme for Financing Working Capital Requirements of Start-ups for Executing Purchase Orders.
In 2018-19, the operating profit of KFC increased by 53.5 per cent to ₹31 crore and the net profit by 113 per cent to ₹17.7 crore. The Corporation sanctioned financial assistance amounting to ₹1,645 crore in 2018-19 as against ₹723.9 corers in the previous year. An amount of ₹815.8 crore was disbursed in 2018-19 as against ₹300.2 crore in 2017-18. The total recovery in 2018-19 was ₹900 crore compared to ₹944.7 crore in 2017-18. The challenging economic situation along with demonetisation and implementation of GST
aggravated slowdown tendencies in 2017-18 and 2018-19 for all financial and other institutions. The changes in the Government policies and other external factors affected business in certain sectors. Performance of KFC during the last five years is given in Appendix 4.3.9. The details of loan operations and industry-wise classification of loans in 2018-19 of KFC are shown in Appendix.4.3.10 and Appendix 4.3.11 respectively.
Way forward
The challenge before the State Government is to offer gainful employment to the youth of the State. To meet this challenge the Government aims to create an enabling environment for Knowledge based Technology Entrepreneurship in the State. There are approximately 2 lakh youngsters coming out of technical education institutions every year in the State. Many of these young professionals can become entrepreneurs. Kerala Government seeks to create a new generation of job providers rather than job seekers. Poor marketing, support infrastructure and absence of focus on local resource based enterprises are the major challenges facing the industrial sector in Kerala.
The vision of the Government is to transform Kerala into an investor friendly destination
Box 4.3.4 Ongoing projects of KINFRA
• Industrial water supply project, Palakkad• KINFRA integrated industrial and textile park, Palakkad• Construction of Standard Design Factory, Koratty, Thrissur• Water supply and road works for Infopark, Smart city and KEPIP• Industrial Park, Mattannur, Kannur• Global Ayurveda Village, Thiruvananthapuram• Green field electronic park, Ernakulam• Food and spices Park Muttom, Idukki• Special Economic Zone for Animation/IT/ITES in KINFRA Film and Video Park, Kazhakuttam• Export Incubation Hub at KINFRA Techno Industrial Park (KTIP), Kakkanchery• Advanced Technology and Industrial Park, Puzhakkal, Thrissur• Defence Park, Ottapalam• Mega food Park, Palakkad
Source: KINFRA
151Chapter 4, Manufacturing Sector
through inclusive, eco-friendly and sustainable economic growth, with a focus on the creation of employment opportunities. Adoption of new technologies in various stages of production, design and marketing are needed to increase the productivity in this sector.

152 Economic Review 2019, Kerala State Planning Board
4.4 Micro, Small and Medium Enterprises (MSMEs)
Micro, Small and Medium Enterprises (MSMEs) sector has emerged as a vibrant and dynamic sector of the Indian economy. MSMEs constitute a major source of employment outside agriculture, with relatively low level of capital per employee.
Micro, Small and Medium Enterprises (MSMEs) are amongst the strongest drivers of economic development, innovation and employment. The sector contributes about 45 per cent to manufacturing output, more than 40 per cent of exports and over 28 per cent of the GDP, while creating employment for about 111 million people. The MSME sector in India is exceedingly heterogeneous in terms of size of the enterprises and variety of products and services, and levels of technology employed. The growth of the MSME sector is crucial as the National Manufacturing Policy envisages an increase in the share of the manufacturing sector in GDP from the current 16 per cent to 25 per cent by the end of 2022. (Source: Report of the expert committee on Micro, Small and Medium enterprises, RBI, 2019)
Micro, Small and Medium Enterprises (MSMEs) in India
As per the 73rd round of NSS data for 2015-16, there were 633.88 lakh unincorporated non agricultural MSMEs in the country engaged in different economic activities (196.65 lakh in Manufacturing, 230.35 lakh in Trade, 206.85 lakh in Other Services and 0.03 lakh in Non-captive Electricity Generation and Transmission) excluding those MSMEs registered under Factories Act, 1948. Table 4.4.1 shows the distribution of MSMEs activity wise. 31 per cent MSMEs were found to be engaged in manufacturing activities, while 36 per cent were in trade and 33 per cent in other services. Again, out of an estimated 633.88 lakh of MSMEs, 324.88 lakh MSMEs (51.25 per cent) were in rural areas and 309 lakh MSMEs (48.75 per cent) were in the urban areas.
Table 4.4.1 Estimated number of MSMEs, activity wise
Activity CategoryEstimated number of Enterprises (in lakh)
Share (per cent)
Rural Urban Total
Manufacturing 114.14 82.50 196.65 31Trade 108.71 121.64 230.35 36Other Services 102.00 104.85 206.85 33Electricity 0.03 0.01 0.03 0All 324.88 309.00 633.88 100
Source: GoI, Ministry of Micro, Small and Medium Enterprises

153Chapter 4, Manufacturing Sector
Among Indian States, Uttar Pradesh had the largest number of estimated MSMEs (89.99 lakh) with a share of 14.20 per cent of all MSMEs in the country. Kerala comes eleventh (23.79 lakh) with a share of 3.75 per cent (Source: Annual Report 2018-19, GoI, Ministry of Micro, Small and Medium Enterprises).
MSME-SAMPARK – This digital platform, launched in June 2018, allows interaction between job seekers and recruiters (MSMEs). As on March 31, 2019 a total of 35,819 job seekers and 5060 recruiters were registered on the SAMPARK portal, and 2124 jobs were offered through this portal.
My MSME
This is a web based application module, which helps the enterprises to take benefits
of various schemes of Government. The Office of Development Commissioner (MSME) has launched this module. This has also been converted in to a mobile app.
MSME Sector in Kerala
Kerala has a relatively high share of MSMEs in the country. Kerala, with its excellent connectivity, communication network, availability of highly skilled human resources, and relatively good industrial infrastructure, is highly suited for the growth of the MSME sector. The MSME sector helps in industrialisation of rural and backward areas, and provides employment to youth and socially disadvantaged groups such as SC, ST, women and physically challenged persons. In order to strengthen the sector, the GoK has come up with Kerala Investment Promotion and Facilitation Ordinance, 2017
Box 4.4.1 Expert Committee on Micro, Small and Medium Enterprises
The GoI and RBI have taken several initiatives and measures to address the issues faced by MSMEs. However, the sector remains informal and vulnerable to structural and cyclical shocks, at times with persistent outcomes. Further, an increasingly globalised world, marked by competition and innovation is posing newer and varied challenges to the MSMEs. The increasing stress in the sector is a matter of concern and therefore, it was felt imperative that a comprehensive review should be undertaken of the entire MSME ecosystem along with global best practices for suggesting measures for a holistic development of the sector. For this, an all-inclusive approach was necessary to be adopted with special focus on appropriate policy and institutional interventions, accelerating incubation and enabling formalisation, addressing infrastructural bottlenecks, facilitating capacity building, enabling access to risk capital, credit and technological interventions for improving underwriting standards and delivery, supporting market linkage and tie-up with public procurement platforms. Towards this end, RBI constituted an Expert Committee under the Chairmanship of Shri U K Sinha on December 5, 2018 to propose long term solutions, for the economic and financial sustainability of the MSME sector. The committee held 15 meetings as well as consultations with industry associations and State Governments across the country, and submitted its report on June 18, 2019. Some of the major recommendations are: i) The Committee recommends a more focused engagement of SIDBI with State Governments for MSME development and promotion. Banks need to ensure that all applications accorded in principal approval are disposed of within a period of 7-10 days. ii) at the apex level a National Council for MSMEs should be set up under the Chairmanship of the Prime Minister with the Ministers for MSME, Commerce and Industry, Textiles, Food Processing being members. The States should have a similar State Council for MSMEs. (iii) a review of the State Financial Corporation (SFC)Act for enhancing the role of States so that more operational freedom is given to SFCs. (iv) The data banks created by the DICs should be strengthened. Proper collection of statistics on the requirements of entrepreneurs should be undertaken by DICs.
Source: www.rbi.com

154 Economic Review 2019, Kerala State Planning Board
to avoid delays in granting various licences, permissions, approvals and clearances required under the various enactments and making the State investor friendly. The Kerala Investment Promotion and Facilitation Act, 2017 envisages mandatory approval within a period of 30 days if applications are submitted with necessary documents.
The Directorate of Industries and Commerce (DIC) acts as a facilitator for the growth of the MSME and traditional industrial sectors in Kerala. The agencies under the Directorate are: Directorate of Handloom and Textiles, which aims at evolving policies for the promotion and development of handloom and textile sector in the State; Directorate of Coir Development, which is the implementing agency for all policy decisions of the GoK related to coir industry; and Khadi and Village Industries Board, which is vested with the responsibility of organising and promoting Khadi and Village Industries in the State.
Role of MSME in State Economy
According to Directorate of Industries and Commerce, 15,468 new MSME units were started in Kerala in 2017-18 with a total investment of ₹1,249.61 crore, and generated employment for 51,244 persons. In 2018-19, 13,826 new
MSME units were started with an investment of ₹1,321.94 crore and generated employment for 49,068 persons. The number of new MSME units and employment created for the last two years is shown in Figure 4.4.1 below. Udyog Aadhar Memorandum (UAM) in the State
Under the UAM scheme, which was notified in September 2015 under section 8 of the MSME Development Act 2006, MSME entrepreneurs need to file an online entrepreneurs’ memorandum to instantly get a unique Udyog Aadhaar Number (UAN).
In Kerala, DIC discontinued the practice of filing EM Part II from September 18, 2015, and in its place, started online registration in Udyog Aadhar. As on March 31, 2019, the total number of Udyog Aadhar Memorandums filed was 56,019,(all registered units are not functional) which included UAMs for micro, small medium manufacturing units of 49,444, 6,288 and 2,87 numbers respectively (totalling 56,019 numbers, which represented a 1.65 per cent increase over the corresponding number for 2017-18). In addition, there were 40,465 UAMs filed in the service sector including 34,065, 6,200 and 200 micro, small and medium units respectively ( which was an increase of 114.78 per cent over
Figure 4.4.1 The number of new MSME units and employment created in MSMEs, 2017-18 and 2018-19
Source: Directorate of Industries and Commerce

155Chapter 4, Manufacturing Sector
2017-18, (Source: Directorate of Industries and Commerce). The details are given in Appendix 4.4.1 and Figure 4.4.2.
Performance of the Sector
According to DIC, 13,826 new MSME units (which was 12 per cent less than 2017-18) started operations in Kerala in 2018-19,with a total investment of ₹1,321.94 crore, and generated
employment for 49,068 persons. The highest number of new units were started in Palakkad with 1,991 numbers generating 7,183 jobs, followed by Thrissur with 1,676 new MSME units generating 4,691 jobs and Ernakulam with 1,531 MSME units with 6,132 jobs. Kasaragod had the lowest number with 223 new MSME units, generating employment for 940 persons. The details are given in Appendix 4.4.2.
Table 4.4.2 Year-wise details of new MSME units started in Kerala under each subsector
Sl. No. Name of subsector 2015-16 2016-17 2017-18 2018-192019-20
(up to 30/09/19)
TOTAL
No of units1 Agro and Food- based 2388 2395 2553 2712 1238 112862 Textiles and Garments 1910 1695 1947 1858 898 8308
3 General /mechanical/light Engineering 2003 1606 2001 1533 621 7764
4 Service Activities 3134 3057 3679 3259 2009 151385 Wood Products 891 775 871 644 280 34616 Cement Products 385 344 469 329 141 16687 Printing and Allied 366 322 392 348 162 15908 Paper Products 190 158 163 192 80 7839 Information Technology 349 263 316 294 116 133810 Others 4243 3098 3077 2657 1251 14326 Total 15859 13713 15468 13826 6796 65662
Source: Directorate of Industries and Commerce
Figure 4.4.2 The number micro, small and medium units registered under manufacturing and service sector for the year 2018-19
Source: www.udyogaadhar.gov.in and Directorate of Industries and Commerce

156 Economic Review 2019, Kerala State Planning Board
The year wise/subsector wise details of MSME units started from 2015-16 to 2019-20 (up to September 30,2019 ) is given in the Table 4.4.2 below.
The trend of growth of sub sector wise MSME units over the last four years shows that there is steady increase in the numbers of agro and food based MSME units from 2388 units in 2015-16 to 2712 units in 2018-19 (an increase of 13 per cent). The number of service related MSME units increased from 3,134 in 2015-16 to 3,259 in 2018-19 (an increase of 3.85 per cent). Based on above details, it is observed that, nearly one third of the units started every year are in “others” category (which covers units making plastic containers, gold ornaments, rubber products, handicrafts).
In 2018-19, the highest number of MSME units were started in the services sector, followed by agro and food based industries, “others” category (which covers units making plastic containers, gold ornaments, rubber products, handicrafts products), textile and garments.
State Budget (2019-20)
In Kerala, the MSME sector has consistently been registering higher growth rates compared to other sub sectors in the industrial sector.
In the State Budget for 2019-20, an outlay of ₹449.27 crore was provided for Village and Small Enterprises and the expenditure up to October 31, 2019 was ₹136.70crore (30.43 per cent). In the Annual Budget 2019-20, an amount of ₹182.87 crore was provided under the MSME Sector. The details are given Table 4.4.3. Due importance was also given to gender Budgeting. Five new schemes viz., interest subvention on deferred land cost investments to entrepreneurs in industrial areas/parks, assistance to Rebuild flood affected MSMEs, interest subvention to Flood affected MSMEs, Permanent exhibition cum marketing complex , and bamboo propagation and promotion have been taken up in the year 2019-20.
Major State Plan Schemes and achievements
In 2019-20, State Government implemented various schemes successfully for improving the industrial environment of the State through development of industrial infrastructure, promotion of entrepreneurship, and by providing skill development. Following are the major schemes and achievements.
Table: 4.4.3 Plan outlay and expenditure of village and small enterprises Annual Plan 2018-19 and 2019-20, in ₹ crore
Sl. No. Sector/ Sub sector Annual Plan (2018-19) Annual Plan (2019-20)
6.1 Village and Small Enterprises Outlay Expenditure OutlayExpenditure
(as on October 31, 2019)
i Small-scale Industries 151.06 90.66 163.89 39.68ii Commerce 4.40 3.96 15.43 0.47iii Handicrafts 4.55 3.51 3.55 0.65
Sub Total (MSME) 160.01 98.13 182.87 40.34iv Handloom and Power loom 70.92 43.13 56.01 18.52v Coir industry 141.08 127.47 141.51 77.84vi Khadi and Village Industries 18.60 10.66 14.43 5.31vii Cashew Industry 54.45 36.78 54.45 5.00
Total(Village and Small enterprises) 445.06 316.17 449.27 147.01
Source: Budget 2018-19 and 2019-20 and Plan space

157Chapter 4, Manufacturing Sector
1. Industrial Infrastructure Development Schemes/Programmes
These schemes intend to promote development of infrastructure in the industrial parks, estates, Development Areas (DAs)/Plots (DPs), including roads, power, water, and facilities for waste management. Also provisions are there to develop new multi-storied industrial buildings (SDF’s), industrial parks, and common facility centres for clusters.
a. Improving infrastructure in existing Development Plots/Areas
The Directorate of Industries and Commerce (DIC) develop infrastructure facilities for small- scale industries in the State. At present, there are 39 Development Area/Development Plots under DIC, having a total area of 2,424.85 acre. A total of 2,217 units are functioning in these DA/DPs in 2018-19 compared to 2,205 units in the previous year. In 2018-19, an amount of ₹1,470 lakh has been released for creating/improving infrastructural facilities in 16 existing Development Area/Plot. Total employment provided through these DAs/DPs in 2018-19 are 35,292 and income generated is ₹6,52037.86 lakh. The details are given in Appendix 4.4.3.
b. Construction of Multi-storied Industrial Estates
Industrial land is very scarce in the State of Kerala. In order to accommodate more industries in the same industrial area, multi-storied constructions with more floor area are inevitable. In 2018-19, preliminary steps were taken for the construction of Multipurpose trade facilitation centre at Alappuzha with an estimated cost of ₹978 lakh. Works on three Standard Design Factories (SDF) at Puzhakkalpadom Phase I (86 per cent) and II (73 per cent) and Punnapra (48 per cent) are going on and expected to be completed in 2020-21. An
outlay of ₹36.66 crore was provided for the scheme for the year 2018-19.
c. Mini Industrial Estates
As on March 31, 2019, there were 96 mini industrial estates with 857 SSI units; in them 740 working units in these estates provided employment to 3,623 persons. The details are given in Appendix 4.4.4.
d. Industrial Estates under SIDCO
Kerala Small Industries Development Corporation (SIDCO) provides infrastructure facilities such as land, work shed, water, distribution of scarce raw material to the units in the small scale sector. There are 17 major industrial estates, which comprise 880 working units, under the administrative control of SIDCO. These working units provide employment to nearly 7,762 workers (as on March 31,2019). Besides, there are 36 mini industrial estates and 7 industrial parks (source: http://www.keralasidco.com) under SIDCO in which about 1,548 employees are working in 335 working units all over the State. The total turnover in 2018-19 of SIDCO was ₹3.10 crore. Details of industrial estates under SIDCO are given in Appendix 4.4.5, 4.4.6 and 4.4.7.
e. Industrial Cluster Development
Industrial clusters have an important role in the promotion of small and medium-sized enterprises mainly due to their inclusiveness, technology absorption, efficiency improvement, and availability of common resources. The Ministry of Micro, Small and Medium Enterprises (MSMEs) adopted the cluster approach as a key strategy for enhancing the productivity and competitiveness as well as capacity building of small enterprises.

158 Economic Review 2019, Kerala State Planning Board
The State has already adopted the cluster development approach for industrialisation to reap the benefits of agglomerations through transformation of the traditional systems of activities or industrial Districts to new networks ready for competition and innovation. The State supports cluster development through MSME-DI, GoI, Thrissur and Kerala Bureau of Industrial Promotion (K-BIP). The common facility centres, which are in various stages of development in the State, are in the areas of wood, plywood, furniture, rubber, textile, rice mill, plastic, printers, ethnic food, agriculture implements and general engineering. The activities for setting up Common Facility Centres (CFCs) in Wood Furniture Cluster, Thaliparamba, Kannur was completed and commissioned on December, 2018 with a total cost of ₹1164.74 lakh. Setting up of CFCs in Wood Furniture Cluster, Chevoor, Thrissur and in Plywood Cluster, Ernakulam are progressing (Source: Kerala Bureau of Industrial Promotion). Ministry of MSME under the Scheme Micro Small Enterprises Cluster Development
Programme (MSE-CDP) is assisting 19 Cluster CFC in Kerala. MSME-DI, Thrissur is actively engaged in the promotion and development of clusters in the State in close liaison with the State Government and other stakeholders. The machinery and equipments for offset printing cluster Kannur was purchased. A new cluster consortium was formed by All Kerala Steel Furniture manufacturers Association Ernakulum under MSE-CDP Scheme (Source: Annual Report 2018-19, MSME Development Institute, Thrissur).
2. Capacity building programmes
The scheme intends to promote entrepreneurial/ industrial promotional activities and skill development training for micro, small and medium enterprises. Under the scheme an outlay of ₹8 crore was provided in 2018-19, and the following major programmes were carried out.
• Conducted 28 Entreprenuership Development Programmes at 14 Districts. Through which 488 new units were
Box 4.4.2 Skill Development and Training Institutes in Kerala
Source:MSME Development Institute, (MSME-DI), Thrissur, GoI, Kerala Academy of Skill excellence (KASE) and Kerala Institute of Labour and Employment (KILE)
MSME Development Institute, (MSME-DI), Thrissur, GoI
The institute under the Ministry of MSME, GoI provides techno-economic and managerial consultancy services to the MSME sector in Kerala and the Union Territory of Lakshadweep. It also conducts various training programmes viz. Industrial Motivation Campaigns, Entrepreneurship Skill Development Programme (ESDP), and Skill Development Programmes (SDPs). In 2019-20 (up to August 31, 2019), a course on Skill Development Programme was undertaken and 27 persons were trained.
Kerala Academy of Skill excellence (KASE)
GoK has setup three Kaushal Kendras under KASE at Kollam, Kozhikode and Palakkad to provide career guidance, industrial training to young workers and improving their employability.
Kerala Institute of Labour and Employment (KILE)
Constituted by GoK, KILE is an institute for training and research on labour and allied subjects. In 2018-19 various programmes were conducted by KILE including training, workshops, seminars and publications. The beneficiaries through these programmes were 6,593.In 2019-20, 3 training programmes were conducted (as on August 31, 2019) and the beneficiaries are 554.

159Chapter 4, Manufacturing Sector
started, with an investment of ₹2,281 lakh and generating 1,820 employment opportunities.
• Conducted Taluk level investors meet at 14 Districts. Through which 993 new units were started, with an investment of ₹4,773 lakh and generating 3,153 employment opportunities.
• 327 Entrepreneurship Development Clubs have been set up in educational institutions to promote entrepreneurship among students.
a. Promoting Entrepreneurship and Skill Development
Promotion of local entrepreneurship is important for the creation of sustainable consumption and production systems. The details of Skill Development and Training Institutes in Kerala are shown in Table 4.4.4. MSME-Development Institute (MSME-DI), Thrissur, GoI has conducted 8 courses in 2018-19, benefitting 5,992 potential entrepreneurs. In 2019-20 (up to August 31, 2019), 1,279 persons were benefitted from the skill development programmes. Details are given in Appendix 4.4.8.
3. Development of Commerce
a. Promotional Events/Exhibitions- Achievements of the MSME sector in 2018-19
The Directorate of Industries and Commerce conducted/participated in 31 Exhibitions/ Fairs/Expos inside Kerala with 834 stalls in 2018-19 and generated an income of ₹2.91crore. Three exhibitions were held in most Districts of Kerala, while the maximum number of stalls, 262, was put up in Kannur District. Details are given in Appendix 4.4.9. Following are the major promotional activities undertaken by the Department of Industries and Commerce in 2018-19.
• In 2018-19, the Department conducted 30 industrial exhibitions at District level. A total of 614 MSME units participated in these exhibitions, showcasing their products.
• 31,731 number of people participated in various Industrial Promotion Programmes in 14 Districts and 14,818 employment opportunities created.
• 132 MSME units participated in 6 national/international industrial expos.
• With the objective of assisting the handicraft sector, a Craft Mela was organised at Kannur from February 24- March 9, 2019, which facilitated the artisans to sell their products and share experiences. In this crafts mela, 211 artisans from 22 States participated. 12.5 lakh persons visited and generated a trade volume of ₹425 lakh.
b. Commerce Mission
In 2018, the State Government constituted the Commerce Mission with an aim to provide assistance MSMEs, start-ups and traditional industries with marketing and branding of their products as well as with sourcing quality input materials at fair prices from national/international markets.
c. Permanent Exhibition cum Marketing Complex (Kerala Mart)
The objective of this scheme, which was launched in 2019-20, is to create a permanent exhibition cum marketing facility for the MSME sector. The proposed MART can help augment sales, showcase products and brands, and act as a marketing platform with strong national and international networks to enhance economic activities in MSME sector. This will help the MSME sector in the State.
160 Economic Review 2019, Kerala State Planning Board
4. Industrial Incentive Schemes
a. Entrepreneur Support Scheme (ESS)
The scheme intends to provide extensive support to MSMEs and give onetime support to entrepreneurs, especially women and persons belonging to SC and ST community. An outlay of ₹55 crore was provided for ESS scheme in 2018-19 and assistance was given to 1,118 entrepreneurs. In 2019-20, up to October, an amount of ₹23.61crore provided to 390 entrepreneurs.
b. Package for Rural Industries-Prime Minister’s Employment Generation Programme (PMEGP)
‘Prime Minister’s Employment Generation Programme (PMEGP)’ is a credit linked subsidy scheme at the national level, which aims to generate employment opportunities by setting up micro-enterprises in the non-farm sector in rural as well as urban areas. In 2018-19, the banks sanctioned 2,831 applications and provided Margin Money of ₹5,437.45 lakh. The comparable figures for 2017-18 were 1,307 applications and ₹2,433 lakh respectively. Banks sanctioned more number of applications in Ernakulam District with 331 numbers, followed by Thrissur with 312 and Thiruvananthapuram with 300 numbers. Details are given in Appendix 4.4.10.
c. Interest subvention on deferred land cost investments to entrepreneurs in industrial areas/parks
It is a new scheme, taken up in 2019-20. The objective of the scheme is to make the Government Industrial estates /parks more investor friendly to new entrepreneur attracting more investments and creating employment. The scheme envisages
deferring a portion of the investment burden in land cost to a new entrepreneur by taking over the interest burden on the land cost for a specific period in industrial estates /parks promoted by DIC/SIDCO/KSIDC/KINFRA.
5. Industrial Financing in MSME Sector
a. State Level Bankers’ Committee (SLBC)
As per the State Level Banker’s Committee (SLBC) report, the outstanding bank credit by the commercial banks in Kerala to various sectors increased to ₹2,86,783 crore at the end of March 2018 as against ₹2,56,075 crore in the previous year, an increase of 11.99 per cent. The outstanding flow of credit to the MSME sector in March 2018 was ₹47,201 crore, an increase of 19.77 per cent, compared to ₹39,408 crore in March 2017. The status of flow of credit to various sectors is given in Appendix 4.4.11.
b. The Small Industries Development Bank of India (SIDBI)
The Government encourages SIDBI to refinance credit institutions, which provide unsecured loans, at reasonable interest rates, to borrowers based on their transaction history. Till March 31, 2019, aggregate loans of ₹6,672 Cr had been sanctioned to 3,489 MSMEs (Source: SIDBI, Working
Report 2019).
Industrial Co-operative Societies
In Kerala, the total number of working industrial co-operative societies as on March 31, 2019 was 394. Kannur has the larger number of working societies with 91 numbers. Out of 394 societies, 93 Societies were registered by women. The details are given in Appendix 4.4.12. In 2018-19, 16 societies were registered.

161Chapter 4, Manufacturing Sector
Departmental interventions on rebuild flood affected MSMEs
In order to rebuild flood affected MSMEs, two new schemes, namely, ‘Assistance to Rebuild Flood affected MSMEs’ and ‘Interest Subvention to Flood affected MSME Units’ were introduced in 2019-20. Also to rebuild cashew factories/units a new scheme, ‘Revival of small and medium scale cashew factories/units in rebuilding lost livelihoods’ was also introduced. Industries and Commerce Department in collaboration with IT mission conducted a mobile application survey across the flood affected areas, including MSMEs and shops. As per the survey, a loss of ₹2,040 crore has been assessed for 5,355 MSMEs and 16,061 shops across Kerala. Under the Ujeevana revival scheme as on July 15, 2019 loans amounting to ₹96.76 crore have been sanctioned by the banks for restructuring units (Source: Directorate of Industries and Commerce).
Issues and challenges in the sector
The contribution of the sector in the economy is currently constrained due to several challenges affecting growth of the sector. Some of the major ones are:
• Policy and institutional interventions- The challenges include: Formulation of targeted policies in the areas of infrastructure development, modernisation, technology adoption, building backward and forward linkage, credit gap reduction and ensuring timely payments to MSMEs.
• Accelerating growth and enabling formalisation –There is a need to nurture and support innovative business ideas and shape them into enterprises, and this way create a favourable eco system for MSMEs. This can be achieved with support from entrepreneurial development and incubation centres .Utilisation and reach of various schemes, including schemes for credit support, have been constrained due to a number of reasons. Promoting formalisation and digitisation amongst MSMEs and encouraging them to register in UAM has remained a challenge.
• Addressing infrastructural bottlenecks – Inadequate availability of basic amenities such as worksheds, tool rooms, product testing laboratories, electricity, rural broadband and innovation hubs is acting as a deterrent to the growth of the sector. There have been only a few MSME clusters which provide good infrastructure facilities
• Facilitating access to credit and risk capital – Due to their informal nature, MSMEs lack access to formal sources of credit. Banks face challenges in credit risk assessment of MSMEs owing to lack of financial information. Very few MSMEs are able to attract equity support and venture capital financing.
• Enabling market linkage and tie-ups with public procurement platforms– MSMEs face the twin challenge of limited access to quality raw material and market for finished product. Tie ups with public sector units can help their growth.

162 Economic Review 2019, Kerala State Planning Board
4.5 Food Processing
In India, the food processing sector has emerged as a high growth and high-profit sector due to its immense potential for value addition.Food processing has an important role to play in linking Indian farmers to consumers in the domestic and international markets. The Ministry of Food Processing Industries (MoFPI) is making all efforts to encourage investments across the value chain. The industry engages approximately 1.85 million people in around 39,748 registered units (Source: Annual report 2018-19, Ministry of Food Processing
Industries, GoI).
Food processing in India covers fruit and vegetables, plantations, grain processing, spices, milk and dairy products, meat and poultry, fisheries, non-alcoholic and alcoholic beverages, as well as other consumer product groups such as confectionery, chocolates, cocoa products, soya-based products, mineral water and high protein foods.
The food and grocery market in India is the sixth largest in the world. Also food and grocery retail market in India constitutes almost 65 per cent of the total retail market in India.
The Indian food processing industry is one of the largest industries in India with respect to production, consumption, export and future potential for growth. During the last 5 years ending 2017-18, food processing sector has been growing at an average annual growth rate (AAGR) of around 8.41 per cent as compared to around
3.45 per cent in Agriculture at 2011-12 Prices. The value of processed food exports in 2018-19 was of the order of US $35.30 Billion accounting for about 10.69 per cent of India’s total exports. The value of import of processed food in 2018-19 was US$19.32 Billion which was 3.95 per cent of India’s total imports (US$ 514.03 Billion). (Source: Annual Report 2018-19, Ministry of Food processing Industries, GoI)
According to the latest Annual Survey of Industries (ASI) for 2016-17, the total number of persons engaged in registered food processing sector was 18.54 lakh. Unregistered food processing sector provides employment to 51.11 lakh worker as per the NSSO 73rd Round, 2015-16 and constitutes 14.18 per cent of employment in the unregistered manufacturing sector.
Food Processing Industry in Kerala
Kerala accounts for nearly 20 per cent of the country’s total food exports. Kerala has been traditionally strong in spices, marine products, cashews, coconuts, cocoa, coffee and tea and fruits like banana and pine apple.
Kerala Industrial Infrastructure Development Corporation (KINFRA) has been playing a proactive role for the promotion of food processing industry in the State. KINFRA functions as nodal agency for the Ministry of Food Processing Industries, GoI and also the nodal agency of the State for implementing “Assistance to States for developing Export Infrastructure and

163Chapter 4, Manufacturing Sector
Allied Activities (ASIDE), Ministry of Commerce and Industries. KINFRA has set up a number of food based parks across the State.
KINFRA Food Processing Park, Kakkancherry, Malappuram
The KINFRA Food Processing Park at Kakkancherry, Malappuram District, set up in an area of 72 acres, has 41 working units. In 2018-19, the park has attracted investment of ₹14,041.86 lakh and created 1,378 number of jobs.
Food and Spices Park, Muttam, Idukki
This project is located in 15 acres of land at Muttam, Idukki District, to be implemented under MSME-Cluster Development Programme (MSME-CDP), Ministry of MSME, GoI. It envisages full-fledged common infrastructure facilities for food and spices and its allied activities. GoI has accorded “in-principle approval for the project’’. Total project cost is ₹12.5 crore, out of which ₹6 crore will be assistance from GoI.
KINFRA Mega Food Park, Palakkad
Ministry of Food Processing Industries (MOFPI), GoI has approved the proposal from KINFRA for setting up a Mega Food Park in 79 acres at Kanjikode, Palakkad in accordance with the Mega Food Park Scheme (MFPS). The estimated project cost is ₹119.02 crore. The assistance provided by the Ministry of Food processing Industries is ₹50 crore. Under the project, KINFRA has undertaken site development including development works such as providing roads, drainage, water supply, electricity supply. In addition to the Central processing centre at Palakkad, KINFRA has undertaken the setting up of four primary processing centres (PPCs) at Muzhuvanoor, Koratty, Kakkanjery and Kalpetta in line with requirements of Mega Food Park Scheme.
Details of KINFRA food processing units in parks are given in Appendix 4.5.1.
KSIDC Mega Food Park, Alappuzha
KSIDC is developing a Mega Food Park at Industrial Growth Centre Pallippuram, Cherthala, focusing the sea food processing sector, with grant assistance from Ministry of Food Processing Industries (MOFPI), GoI under the Mega Food Park Scheme. The park will cater to marine food processing sector with common infrastructure facilities such as cold storage, standard design factory, ice plant etc. The project is expected to bring an investment of ₹350 crore within 3 years. As of now, about 42 acres has been allotted to different Seafood/Food processing and allied units at the park. (Source: www.ksidc.org)
Implementation of Food safety system through NCHC
National Centre for HACCP Certification (NCHC) associated with K-BIP is in the process of auditing, certification and recertification of various food processing and allied units in Kerala and outside the State. National Centre for HACCP Certification (NCHC) in association with Kerala Commissionerate of Food Safety organises awareness programmes on Food Safety.

164 Economic Review 2019, Kerala State Planning Board
4.6 Traditional Industries
Handicraft sector
The handicraft sector contributes to export growth while preserving the country’s cultural heritage and provides employment to a large number of artisans. However, it suffers from weaknesses such as the unorganised nature of the industry, low levels of education of workers, low capital base, poor exposure to new technologies, absence of market intelligence, and poor institutional framework. Series of efforts have been taken by the Government to redress these problems, and the sector has witnessed good growth in 2017-18 in terms of product development, domestic sales, and exports.
In India, the handicrafts sector employs 68.86 lakh artisans, out of which 30.25 lakh are male and 38.61 lakh are female artisans. The export of handicrafts from India in 2016-17 was ₹34,394.30 crore and ₹31038.52 crore in 2015-16. The sector grew at 10.8 per cent per annum (Source: Annual Report 2017-18, Ministry of Textiles, GoI).
Handicraft industry in Kerala
Handicraft industry is one of the traditional industries of Kerala. Kerala has the tradition of making beautiful handicrafts with ivory, bamboo, palm leaves, seashells, wood, coconut shells, clay, cloth, coir, metals, stone, lacquer ware, and so on. Many old handicraft classics can be seen in palaces, old heritage homes and museums across the State. A vast majority of the traditional
artisans belong to socially and economically backward classes.
Importance of Handicraft Industry
Kerala State Handicrafts Apex Co-operative Society (SURABHI), Handicrafts Development Corporation of Kerala (HDCK), and Kerala Artisans Development Corporation (KADCO) are the major agencies for the promotion of the handicraft industry in Kerala.
Kerala State Handicrafts Apex Co-operative Society (SURABHI)
SURABHI is the apex Organisation of primary handicrafts co-operatives established with a view to uplift the artisans by marketing their products and supporting them through the welfare schemes of GoK and GoI. There are 46 Co-operative societies under SURABHI. There are 11 showrooms under SURABHI inside and outside Kerala. The turnover of the society in 2018-19 was ₹208.58 lakh. The Apex society received an amount of ₹50.00 lakh in 2018-19 as assistance from the State Government. This was primarily used for conducting design development Workshops, training programmes, exhibitions and for the repair works of the showrooms. SURABHI made a profit of ₹1.75 lakh from 2 exhibitions and turnover of ₹208.58 lakh in the year 2018-19. The total employment provided during the period was 30,000. Details are given in Appendix 4.6.1.

165Chapter 4, Manufacturing Sector
Handicrafts Development Corporation of Kerala (HDCK)
Handicrafts Development Corporation of Kerala (HDCK) is engaged in procuring and marketing handicraft products, and thereby ensuring fair returns to artisans. HDCK’s show room includes Sree Moolam Shashtyabdapurthi Memorial Institute (SMSMI) in Thiruvananthapuram and Kairali emporia spread across State and other major locations in India. At present, it is having a network of 19 such sales emporia other than SMSMI. Apart from marketing, HDCK is supporting artisans through welfare schemes of GoK and GoI and has been running a Common Facility Service Centre (CFSC) at Thiruvananthapuram for artisans who engage in development of wood crafts. Establishment of Common Facility Service Centres and Assistance to Apex Organisation in the Handicrafts Sector are the Plan schemes implemented through HDCK. In 2018-19, Corporation has targeted a sales turnover of ₹2000 lakh , but it could achieve only a total sales of ₹1,262.25 lakh.The major reason for not achieving the targeted sale is the introduction of GST and floods during the Onam season. HDCK conducted 60 exhibitions across India, 9 skill Development Programmes for artisans and distributed free tool kits to artisans to improve their productivity. Total turnover of the Corporation in 2018-19 was ₹1,262.25 lakh, which was ₹60 lakh more that of previous year. Details are given in Appendix 4.6.2.
The Kerala Artisans Development Corporation (KADCO)
Kerala State Artisans Development Corporation Ltd was incorporated in 1981, as a fully owned Kerala Government company registered under Companies Act, 1956. The main objective of the Corporation is the upliftment of indigenous artisans in Kerala including carpenters, goldsmiths, blacksmiths and those engaged in pottery, masonry, work using copper/bronze and other handicraft work. The identification of different types of artisans and promotion of the crafts undertaken by them is the primary objective of KADCO.
Bamboo Industry
Bamboo is a highly useful renewable and eco-friendly resource which has several applications. It is widely used in environment protection, as a nutrient food, high-value construction material, and in about 1,500 other applications. It is estimated that about 2.5 billion people use bamboo in one form or the other at the global level. Advanced research activities are being taken up to utilise bamboo for efficient fuel generating system.
In Kerala, 28 species of bamboo are found. Bamboos from Kerala forests are being supplied mainly for the pulp and rayon units under concessional rates. It is estimated that there are about one lakh people in the State dependent on bamboo for their livelihood. A unique feature
Box 4.6.1 Malabar Crafts Mela 2019
On behalf of the Department of Industries and Commerce, Kerala Bureau of Industrial Promotion in association with District Industries Centre, Kannur and Directorate of Handloom and Textiles organised the 7th edition of ‘Malabar Crafts Mela’ at Police Ground, Kannur from February 24 to March 9, 2019. The products exhibited in the fest were sarees, silk sarees, textiles, ornaments, paintings, handicrafts, khadi cloths, bags, chappals, fancy products, wood crafts, bamboo and related products. There were in total 151 traditional huts displaying the handicrafts products. In this crafts mela, 211 artisans from 22 States participated, 12.5 lakh persons visited and generated a trade volume of ₹425 lakh.
Source: Directorate of Industries and Commerce
166 Economic Review 2019, Kerala State Planning Board
of Kerala is that 67.3 per cent of the extracted bamboo comes from home gardens rather than from forests. The weaving sector artisans around Angamaly region is supported by the State Bamboo Corporation. Recent data from the Panchayats indicate that from the early seventies onwards there has been a great drain in the number of artisans from the sector to semi-skilled and unskilled jobs in the tertiary sectors like construction etc.(Source: www.keralabamboomission.org).
The Kerala State Bamboo Mission
Kerala State Bamboo Mission (KSBM) being the Bamboo Development Agency (BDA) of the State was constituted in the year 2003 with the aim to adopt a focused approach to revitalise the Bamboo Sector, promoting value addition, enhancing income generation and alleviating poverty. The interventions initiated by KSBM through K-BIP includes promotion of bamboo cultivation, creation of new designs for innovative products in the handicrafts sector, appropriate skill development ,and promotion of bamboo based modern industries supported by technology adaptation and development.
The Kerala State Bamboo Corporation
The Kerala State Bamboo Corporation is an undertaking established in 1971, for the welfare, development and upliftment of traditional bamboo workers in the State of Kerala. The main objectives of the Corporation are to develop and promote industries based on bamboo, reed, cane and ratton, to undertake manufacture and trading of bamboo based products, and provide financial, technical and other assistance to the traditional bamboo workers. The Corporation is serving about 10000 bamboo workers in Kerala. A majority of these workers are poor and belong to socially and economically backward, SC/ST Communities.
The main activities of the Corporation include the collection of good quality of reeds from Government forests and distribution of these reeds to traditional bamboo weavers at a
subsidised rate on credit basis, and also the procurement of woven mats from the weavers. The main products of the corporation are bamboo mats, bamboo ply, flattened bamboo boards, bamboo flooring tile, bamboo furniture and handicraft items. As part of encouraging more the drop workers into mat weaving, Kerala State Bamboo Corporation has started training programmes in making bamboo mats and handicraft items.
Problems/issues in the sector
The major issue that faces the sector are:
• Shortage of skilled workers in the sector such as bamboo
• Rules relating to cutting of and procuring bamboo from forests.
• Absence of a proper supply chain (for bamboo)
• Shortage of working capital and credit for artisans/NGOs/MSMEs
• Limited entrepreneurship, insufficient skill development programmes and lack of modernisation in designs and products.
• Lack of awareness about technology, designs and developing tools.
• Standardisation and packaging technology• Inadequate marketing facilities/
handholding support for forward and backward linkages
Way forward
Kerala’s industrial sector needs to take advantage of global best practises and attract more investors, educated and skilled work force. Emphasis should be given to the practice of ethical manufacturing, focused in value addition and in harmony with the environment. Focus should be given to tap the huge potential of knowledge based industries such as IT, computer hardware and bio technology. Kerala needs to create an eco-system where economic activities can be undertaken in a socially and environmentally responsible manner.

167Chapter 4, Manufacturing Sector
TEXTILE INDUSTRY
The textiles sector is one of the oldest industries in India. Sectors such as handlooms, handicrafts and power looms are a major source of employment for millions of people in rural and semi-urban areas. This industry contributes 7 per cent of industrial output in value terms, 2 per cent of India’s GDP and 15 per cent of the country’s export earnings. The overall textile exports stood at US$ 39.2 billion in 2018 and US$ 31.65 billion in FY19 (up to January 2019).It is expected to increase to US$ 82.00 billion by 2021 (India Brand Equity Foundation, 2019).
Handloom and Power loom Industry in India
The sales of handloom products in India amounted to ₹582.93 crore as on October 31, 2018. 1,185 handloom product registrations have been issued under 122 product categories. Power looms contribute around 70 per cent of the total jobs in the textile industry, employing around 6.5 million people. Within India, the powerloom industry is the largest in Maharashtra with approximately 8 lakh power looms, while Tamil Nadu and Gujarat occupy the second and third positions with about 5 lakh and 4 lakh power looms respectively. The power loom industry produces a large variety of fabrics including grey and printed fabrics, dyed fabrics, cotton fabrics, mixes of cotton and synthetics. Apart from the US and the EU, which account for about two-thirds of India’s textile exports, China, the UAE, Vietnam, Sri Lanka, Saudi Arabia, the Republic of Korea, Bangladesh, Turkey, Pakistan, and Brazil are some of the major markets for these exports.
Kerala Handloom Sector
The handloom sector in Kerala stands second to the coir sector in providing employment among the traditional industries of the State. The handloom industry in the State is mainly concentrated in Thiruvananthapuram and Kannur District and in some parts of Kozhikode, Palakkad, Thrissur, Ernakulam, Kollam and
Kasaragod Districts. The industry is dominated by the Co-operative sector which covers 96 per cent of the total looms. The remaining 4 per cent per cent of handlooms units are owned by private entrepreneurs. The Co-operative sector consists of factory type and cottage type societies. There were 624 registered Primary Handloom Weavers Co-operative Societies in the State of which 183 were factory type and 441 were Handloom Weavers Co-operative Societies. Of these 339 were working. Details are given in Appendix 4.6.3 and 4.6.4.
The total number of handlooms in the State for the year 2017-18 was 17,070 and for the year 2018-19 it was 17,317. Production of handloom cloth was 38.97 million meter in 2017-18 and 30.27 million meter in 2018-19. Value of production was ₹134.96 crore in 2017-18 and ₹121.85 crore in 2018-19. Total productivity was 2,282.9 million meter per loom in 2017-18 and 1,747.99 million meter per loom in 2018-19. Total number handloom weavers in Kerala was 1,3789 and the number of women employed was 10,815, employment generated was 40.68 man days for the year 2018-19. Total turnover in 2018-19 was ₹102.60 crore. Details are given in Appendix 4.6.8.
The major varieties produced in the handloom sector of the State are dhothis, furnishing material, bed sheets, shirting, saree and lungi. Considering the traditional value and heritage, the following products of the State are registered under the Geo Indication Act of India.
1. Balaramapuram Sarees and Fine cotton Fabrics
2. Kasaragod Sarees3. Kuthampully Sarees4. Chendamangalam Dhothi5. Cannannore Home Furnishings
Performance of the Handloom Sector
The total Plan outlay for and expenditure in the Handloom sector in the Annual Plan 2018-19 were ₹7,092 lakh and ₹4,313.09 lakh (60.82 per cent) respectively. The total outlay provided in

168 Economic Review 2019, Kerala State Planning Board
the Annual Plan 2019-20 was ₹5,601 lakh and the expenditure was ₹1,906.37 lakh (34.04 per cent). Outlay and expenditure for major schemes in the Annual Plan 2018-19 and 2019-20 is given in Table 4.6.1.
Directorate of Handlooms and Textiles and Agencies in Handloom Sector
The Directorate of Handlooms and Textiles, Kerala has the overall responsibility to support the areas of infrastructure, marketing, human resource development, conservation and preservation of traditional skills and products, finance, design input, raw material supply, modernisation, welfare programmes, price stability to equip the segment to compete with the global environment.
Kerala State Handloom Weaver’s Co-operative Society (HANTEX)
HANTEX was registered in 1961, as the apex body of handloom co-operatives established for distribution of required inputs to primary co-operative societies. Currently, HANTEX comprises 518 primary co-operative societies as members Out of this, 180 are engaged in production and procurement processes with most modern infrastructure to produce hand crafted fabrics, garments, furnishings, made-ups, sarees and traditional wears in tune and harmony with eco-friendly norms for internal and export market. Hantex collects the yarn, chemicals and dyes from
NHDC with Government subsidy and distribute among the members
Currently, there are 98 sales outlets and 4 regional offices to coordinate the activities in Kerala. All the production, collection activities are regulated through the 7 production centres. The processing house, garment unit, weaving factories and pattern weaving factories are directly controlled and managed by HANTEX.
Hantex (KSHWCS Ltd), was formed by amalgamating the three central co-operative societies, the Kerala State Handloom Weavers’ Society of Malabar area headquaters at Kozhikode, Central Handloom and Handicraft Marketing Co-operative Society with the headquarters at Thrissur and Sri.Moolam Central Handloom Weavers Co-operative Society. There are around 450 handloom societies as members of the Hantex. Members of the Hantex are limited only to primary handloom societies and spinning co-operatives.The registered office is in Thiruvananthapuram District in Kerala. Hantex operates trade fairs and exhibition in major cities of the State during festival seasons like Onam, Christmas and Vishu.
HANTEX achieved a sale of ₹3,049 lakh in 2018-19. HANTEX distributed raw materials including yarn worth ₹1,706 lakh for various Government departments. For Hantex, paid up capital was ₹6,554.72 lakh in 2018-19. Income through sale of products was ₹3,049.32 lakh in 2018-
Table 4.6.1 Outlay and expenditure for major schemes in handloom sector, in ₹ lakh
Sl.No SchemesAnnual Plan 2018-19 Annual Plan 2019-20
Outlay Expenditure per cent Outlay Expenditure per cent
1Modernisation of Handloom co-operative societies and promotion of value added products
1200 210.68 17.56 715.75 114.78 16.04
2 Training and Skill Development Programme 200 146.51 73.26 200 5.51 2.76
3 Capital Support Schemes 450 179 39.7 408.2 113 27.68
4 Incentive and Welfare Schemes 118 103.06 87.33 118 55.29 55.3
Note: *Expenditure includes Supplementary Demand for Grants (SDGs)Source: Plan Space

169Chapter 4, Manufacturing Sector
19. Grants, MDA, interest, processing charges etc. was ₹19.25 lakh in 2018-19. Net loss in the year 2017-18 was (-) 390.13 lakh and (-) 845.16 lakh in 2018-19.Details of HANTEX are given in Appendix 4.6.3.
Co-operative Sector
The co-operative sector consists of factory type and cottage type societies. In the sector total number of co-operatives societies is 624 in 2018-19.Of which factory type is 183 numbers and Cottage type is 441 numbers. Details given in Appendix 4.6.4 .
The value of production in 2018-19 was ₹94.05 crore, total turnover ₹79.96 crore, number of weavers 12545, employment generated is 37.01 man days in lakh, number of women employed is 9732. All the figures are reduced when compared to the previous financial year (Appendix 4.6.8).
Power loom Sector
In the year 2018-19, an amount of ₹81.42 lakh had been provided for modernisation of four power loom co-operatives. After the modernisation of looms, productivity and wages received by workers have increased. One weaver can attend to 8 looms after modernisation compared to only 2 looms previously. In the power loom sector, production of cloth in 2018-19 was 64.4 lakh meters, value of production ₹627.52 lakh and productivity 6177.61 meter per loom and total turnover ₹407.67 lakh. The total number of power loom in the State was 1036 in 2018-19. Number of women employed increased to 453 in 2018-19. Total production of cloth increased to 64.4 lakh meters and value of production to ₹627.52 lakh in 2018-19. Productivity decreased from 6482.84 meter per loom in 2017-18 to 6177.61 meter per loom in 2018-19. Total turnover was ₹407.67 lakh in 2018-19. Details given in Appendix 4.6.9.
Textile Sector-Spinning Mills
The textile sector spinning mills industry in Kerala comprises units in the public sector as well as in the co-operative sector. There are 13 spinning mills, which are run jointly by the public and co-operative sector. Due to various reasons consequent to globalisation, spinning industry in India has been facing deep crisis and textile spinning mills in Kerala in public and co-operative sectors have been incurring severe losses.
Government of Kerala (GoK) procures cotton for the entire textile sector in the State through a centralised purchase system managed professionally by a committee comprising RIAB, TEXFED KSTC and managing directors’ of the individual spinning mills. Sale of yarn produced by these mills, carried out through a depot system, is being monitored by the same committee. As a result raw material costs have been brought down and the sector’s performance has improved.
Government constituted an Expert Committee to study the crisis prevailing in the mills and the Committee recommended modernisation of five Co-operative Spinning Mills in the State. The Government approved the modernisation of Malappuram Co-operative Spinning Mills, Cannanore Co-operative Spinning Mills, Priyadarshini Co-operative Spinning Mills and Quilon Co-operative Spinning Mills. The first phase of modernisation of Malappuram Co-operative spinning mill and Kannur Co-operative spinning mill have been completed. Second phase of modernisation of these mills have started.
A notable achievement of the Government in the spinning sector that the newly set up spinning mills at Uduma, Pinarayi and Komalapuram have become operational due to the State Government efforts. Another achievement has been the performance of Malabar, Trivandrum and Kannur Spinning Mills including the export of yarn from these mills (6.59 Lakh meter) to Thailand, China,
170 Economic Review 2019, Kerala State Planning Board
Srilanka, Burma and other countries. Spinning mills in Kerala supplied of 18.46 lakh kilogram of Yarn to School uniform Programme in 2018-19.
Kerala State Handloom Development Corporation (Hanveev)
Hanveev, which was incorporated in 1968, for the welfare and development of traditional weavers in the unorganised sector. It is engaged in the manufacturing and marketing of wide range of handloom products. At present, Hanveev has 49 own showrooms, 3 exclusive agency showrooms and 34 production centres. The corporation also conducts exhibitions during festival seasons and also participates in expos conducted at the national and international level. Total sales turn over for the financial year 2018-19 was ₹1,713.60 lakh (provisional), meeting a loss of ₹(-)743.3 lakh with accumulated loss of ₹10187.73 lakh. Details of Hanveev given in Appendix 4.6.5 and Appendix 4.6.6.
Indian Institute of Handloom Technology (IIHT) Kannur
Indian Institute of Handloom Technology was established in 1987 in the name of Institute of Handloom and Textile Technology (IHTT). Now, the IHTTs is amalgamated to the IIHT which is working on the guidelines of Indian Institute of Handloom Technologies (IIHTs), Ministry of Textiles and GoI.
IIHT’s technical support system improved the quality control of the handloom sector. The handloom directorate is the key player in this project for monitoring and maintaining a time bound supply chain system with high level of efficiency during the project period. Details of achievements given in Box4.6.2.
Kerala State Textile Corporation Limited (KSTC)
KSTC, a GoK undertaking, was incorporated in 1972 with the main objective of setting up and running textile mills in the State. The Corporation has four mills and one research and testing centre. The mills under KSTC are, Prabhuram mills, Kottayam Textiles, Edarikkode Textiles, and Malabar Spinning and Weaving Mills. Two other units, Sitaram Textiles and Trivandrum Spinning Mills Limited are now under the administrative control of KSTC. In addition to the above, Corporation has under its fold a research and testing division (CARDT – Centre for Applied Research and Development in Textiles), located at Balaramapuram, Thiruvananthapuram.
Kerala State Co-operative Textile Federation Limited (TEXFED)
TEXFED was established in 1992 as a body to plan, assist and supervise the setting up and management of co-operative textile units in Kerala. TEXFED is the apex body of co-operative
Box 4.6.2 Achievements
Handlooms:
a. School Uniform-Since 2016-17, 98 lakh meters of handloom fabric woven. 74 lakh meter converted to uniforms and distributed to school children,₹124.80 lakh given as wage to 5200 weavers and almost the same number of allied workers up to September 2019.
b. 1,300 number of new persons trained and engaged as weavers, 1,390 weaver who left the field return to weaving, 15 primary handloom weavers societies restarted functioning during the same period.
c. Rebate dues of ₹68.94 crore released to handloom co-operatives, branded products produced under “Handloom Surakhsha Scheme” and weaving started in the 3 central Jails of the State in the previous financial year.
d. Chendamangalam Handloom village, which was damaged during the 2018 floods, has been revived and is undergoing modernisation.
Source: www.rbi.com

171Chapter 4, Manufacturing Sector
spinning mills and Integrated Powerloom Co-operative Societies in the State. It integrates all the segments of the textile industry including spinning, weaving, processing and garmenting. There are seven co-operative spinning mills as members of TEXFED. Five of them are administered by the State Government and two by elected boards.
Major Projects and Programmes Implemented for the Development of Handloom Sector in the Year 2018-19
Schemes that were initiated during the previous Plan period such as Government share participation in Hantex, Hanveev and PHWCS, marketing and export promotion scheme, distribution of quality raw materials for weavers and Training and skill Development continued along with the schemes that were introduced in the 12th Plan period. The ongoing schemes are
1. Kerala Handloom School uniform Project2. Skill development training in weaving for
new comers3. Self- employment scheme in Handloom
sector4. Motivation to weavers and allied workers
(production incentive)5. Assistance for value addition, High value
added product, production.6. Business Incubation Centre for handloom
societies.
Kerala Handloom School uniform Project-The project started with the supply of uniform material to lower primary school in the Government sector and has been implemented under the patronage of Directorate of Handloom and Textiles, keeping Hanveev, Hantex and DIC as key players. This project energised all direct and indirect stakeholders in the handloom sector.Workers have benefitted from higher days of employment and better wages.
Modernisation of Handloom Co-operative Societies and Promotion of Value Added Products
Assistance under the scheme is given for producing innovative, high value and value added products, modernisation of pre-loom and post-loom facilities to develop brand equity, improving marketing skills of persons working in show rooms and for the renovation of showrooms. Assistance is also being given for showroom renovation of Hantex and Hanveev. Out of the total amount of ₹1200 lakh provided in the Budget for 2018-19 under this programme, ₹210.68 lakh was utilised for revitalisation and strengthening. Assistance for Work shed, assistance to 7 PHWCS, 224 weavers, assistance to dye house modernisation to 6 PHWCS were given in the year 2018-19.
Skill up-gradation training for handloom weavers
Objective of the scheme is to develop inherent artistic skills of traditional weavers for bringing out handloom products with unique designs and greater scope for value addition As per this scheme, three to six months training is imparted to talented weavers (in which at least 50 per cent of them will be women) from different parts of the State to develop new designs to qualify as master weavers. Further this fund can be utilised as State Share for Integrated Skill Development of Government of India (GoI). Skill development training was given for weavers in 2018-19.
Share Participation to HANVEEV and HANTEX The scheme aims to provide Government share Participation to Hanveev and Hantex in the ratio of 2:3 for strengthening their capital base and making them eligible for more cash credit facilities from financial institutions. The outlay provided for revival, modernisation, diversification shall be utilised based on feasible/viable project proposals. An amount of ₹80.00 lakh and ₹120.00 lakh were provided
172 Economic Review 2019, Kerala State Planning Board
for HANVEEV and HANTEX, respectively in the year 2018-19.Hantex was able to sell products for an amount of ₹27.90 crore and the various Government department was able to sell textile products for ₹8.3 crore and thread for ₹1.64 crore. Total loss reported was ₹8.45crore.
Weavers/Allied workers motivation programme
The scheme Weavers/allied workers motivation programme, intends to motivate weavers/allied workers to improve productivity by providing attractive incentives. Nearly 4314 weavers benefited from this programme. As per the scheme ₹150/- (average) will be given to individual weavers per day. An amount of ₹500.00 lakh was allocated and full amount expended in the year 2018-19.
Contributory thrift fund
As per this scheme of Contributory thrift fund, assistance is provided to the weavers for meeting their medical expenses, expenses on marriage and children’s education, and expenses on purchase of house sites and building and repair of houses. An amount of ₹100.00 lakh was provided in the financial year 2018-19 and ₹99.95 lakh utilised with 50 per cent of the fund beneficiaries being women. As per the scheme, minimum 8 per cent of wages is recovered from weaver and equal percentage is contributed by Government. The scheme covered 3808 weaver beneficiaries in the year 2018-19.
Issues/ Challenges
• Shortage of working capital and difficulty in procuring raw materials are among the challenges faced by the sector.
• Mills involved in spinning and weaving in Kerala have been facing problems of both demand and supply. Out-dated machinery, stiff competition, high cost of raw material, low productivity, decreasing profits and lack of working capital are also issues of
concern for the textile sector in Kerala. A majority of textile spinning mills in the State are over 25 years old and they use obsolete technologies and equipment. Partial modernisation was attempted in certain units, but it was not at par with the industry standards.
Way forward
• Given that there is a large market for clothing in Kerala, the State has the potential to emerge as a major player in the various segments with in the entire value chain of the textile industry (from spinning to garments)
• The focus should be on greater value creation within the State Direct marketing of handloom and clothing products through Government owned showrooms will be a significant step forward.
• Problems related to marketing, lack of finance, poor access to raw material, out-dated technologies and absence of fabric processing facilities are some of the problems faced by the power loom industry in Kerala. Lack of awareness among the weavers about the facilities made available to them by the Government is also a problem.
• The textile sector needs to find ways to attract the young and educated in Kerala to this sector, as entrepreneurs or as workers.
Conclusion
The GoK has taken several measures for the modernisation of the textile sector, while at the same time ensuring the interests of workers engaged in the handloom and powerloom co-operatives. Newer product and marketing strategies and innovation in various areas are critical for the future success of the sector.

173Chapter 4, Manufacturing Sector
KHADI AND VILLAGE INDUSTRIES
Khadi and Village Industries Sector in India
Khadi and village industries have the potential to create employment for rural artisans with a very low capital investment. Khadi and Village Industries Commission (KVIC), GoI is a statutory organisation tasked with the role of promoting the production and sale of Khadi. There are a total of 2,632 Khadi institutions in the country, which employ a total of 4.95 lakh artisans, a majority of whom (over 80 per cent) are women. Khadi and Village Industries production (including polyvasthra and solar vasthra) in India have grown from ₹48081.41 crore in 2017-18 to ₹58218.48 crore in 2018-19 (provisional).Similarly, sales of khadi goods have shown growth from ₹59182.43 crore in 2017-18 to ₹74328.81 crore in 2018-19 (provisional). Employment generation in khadi and village industries sector increased from ₹140.36 lakh in 2017-18 to ₹146.98 lakh in 2018-19 (provisional ) (Source: Annual Report: 2018-19, Ministry of Micro, Small and Medium Enterprises, GoI). Kerala’s share in production, sales and employment in Khadi and Village Industries in India has been smaller than Kerala’s share in India’s population (see Table 4.6.2).
Khadi and Village Industries Sector in Kerala
Total employment in khadi and village Industries in Kerala declined from 1.08 lakh in 2014-15 to 1.05 lakh in 2015-16. It remained at 1.06 lakh in 2017-18 and 1.07 lakh in 2018-19 (up to December 31, 2018). Production increased during the period, but sales of the sector within the State showed a downward trend. Introduction of minimum wages and implementation of support and production incentives helped the growth of the khadi sector. Market for khadi has considerably increased. Modernisation of production and introduction of improved techniques and practices also helped the growth in khadi Sector.
Kerala Khadi and Village Industries Board (KKVIB)
KKVIB is a statutory body under the department of Industries and Commerce vested with the responsibility of organising, developing and promoting Khadi and Village Industries in Kerala. In 2018-19, fully owned units of KKVIB in Kerala produced goods valued at ₹63.15 crore. The Board had implemented various schemes under State Plan including Special Employment Generation Programme (SEGP) (Entegramam), Prime Minister’s Employment Generation Programme (PMEGP) of KVIC. The Board had
Table 4.6.2 Production, sales and employment generation in Khadi and Village Industries Sector, Kerala and India
YearProduction
(₹crore)
Kerala’s share in per cent
Sales (₹crore)
Sales (₹crore) Kerala’s Share inPer cent
Cumulative Employment
(in lakh Person)Kerala’s Share inPer cent
India Kerala India Kerala India Kerala
1 2 3 4 5 6 7 8 9 102014-15 27569.4 136.4 0.5 33135.9 170.0 0.5 134.3 1.1 0.82015-16 34490.2 160.4 0.5 41894.6 161.3 0.4 137.8 1.1 0.82016-17 42631.09 172.08 0.5 52138.21 163.76 0.4 136.40 1.06 0.82017-18 48081.41 183.95 0.38 59182.43 276.35 0.46 140.36 1.06 0.752018-19 (up to December 31, 2018)
58218.48 179.20 0.30 74328.81 268.39 0.36 146.98 1.07 0.72
Source: Annual Report 2018-19, Ministry of Micro, Small and Medium Enterprises, GoI and Khadi and Village Industries Board, Kerala
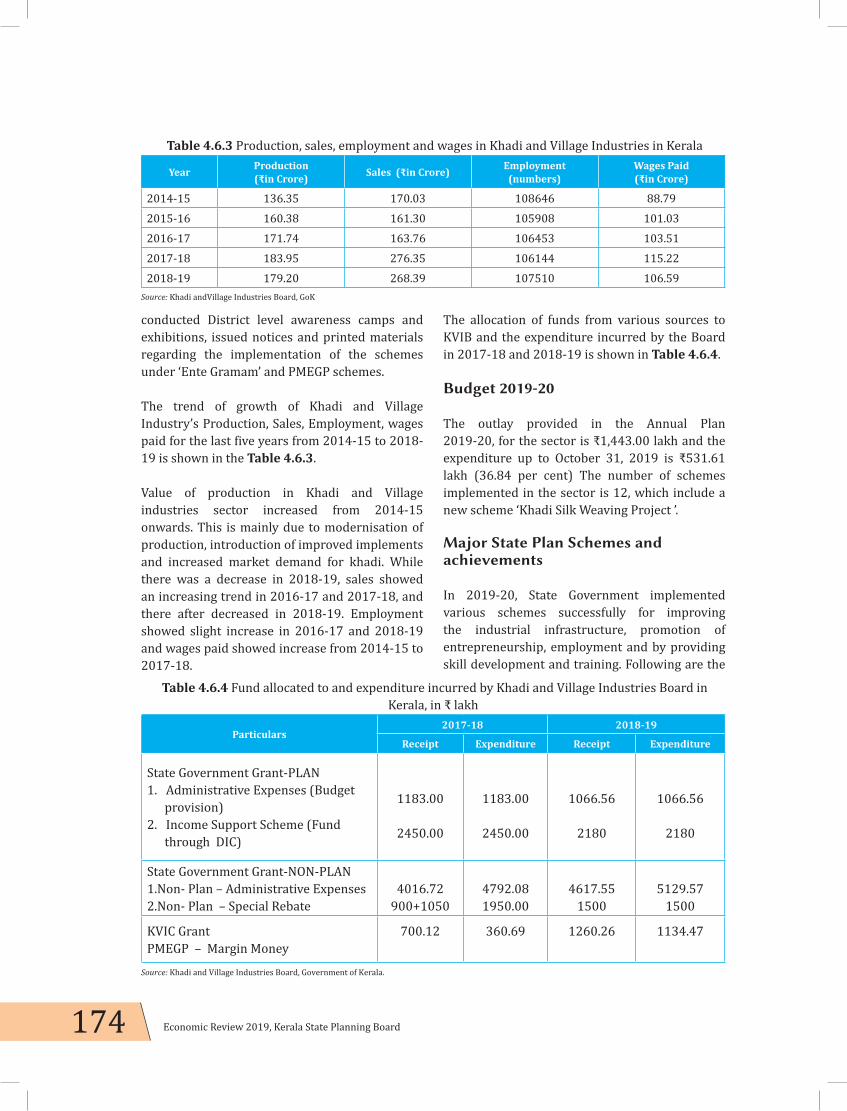
174 Economic Review 2019, Kerala State Planning Board
conducted District level awareness camps and exhibitions, issued notices and printed materials regarding the implementation of the schemes under ‘Ente Gramam’ and PMEGP schemes.
The trend of growth of Khadi and Village Industry’s Production, Sales, Employment, wages paid for the last five years from 2014-15 to 2018-19 is shown in the Table 4.6.3.
Value of production in Khadi and Village industries sector increased from 2014-15 onwards. This is mainly due to modernisation of production, introduction of improved implements and increased market demand for khadi. While there was a decrease in 2018-19, sales showed an increasing trend in 2016-17 and 2017-18, and there after decreased in 2018-19. Employment showed slight increase in 2016-17 and 2018-19 and wages paid showed increase from 2014-15 to 2017-18.
The allocation of funds from various sources to KVIB and the expenditure incurred by the Board in 2017-18 and 2018-19 is shown in Table 4.6.4.
Budget 2019-20
The outlay provided in the Annual Plan 2019-20, for the sector is ₹1,443.00 lakh and the expenditure up to October 31, 2019 is ₹531.61 lakh (36.84 per cent) The number of schemes implemented in the sector is 12, which include a new scheme ‘Khadi Silk Weaving Project ’.
Major State Plan Schemes and achievements
In 2019-20, State Government implemented various schemes successfully for improving the industrial infrastructure, promotion of entrepreneurship, employment and by providing skill development and training. Following are the
Table 4.6.4 Fund allocated to and expenditure incurred by Khadi and Village Industries Board in Kerala, in ₹ lakh
Particulars2017-18 2018-19
Receipt Expenditure Receipt Expenditure
State Government Grant-PLAN1. Administrative Expenses (Budget provision)2. Income Support Scheme (Fund through DIC)
1183.00
2450.00
1183.00
2450.00
1066.56
2180
1066.56
2180
State Government Grant-NON-PLAN1.Non- Plan – Administrative Expenses2.Non- Plan – Special Rebate
4016.72900+1050
4792.081950.00
4617.551500
5129.571500
KVIC GrantPMEGP – Margin Money
700.12 360.69 1260.26 1134.47
Source: Khadi and Village Industries Board, Government of Kerala.
Table 4.6.3 Production, sales, employment and wages in Khadi and Village Industries in Kerala
Year Production (₹in Crore) Sales (₹in Crore) Employment
(numbers) Wages Paid (₹in Crore)
2014-15 136.35 170.03 108646 88.792015-16 160.38 161.30 105908 101.032016-17 171.74 163.76 106453 103.512017-18 183.95 276.35 106144 115.222018-19 179.20 268.39 107510 106.59
Source: Khadi andVillage Industries Board, GoK

175Chapter 4, Manufacturing Sector
Major schemes and achievements.
I. Industrial Infrastructure development schemes /programmes
a. Expansion and Modernisation of Sliver Project at Ettukudukka in Kannur District
The scheme intends to enhance the production of sliver products by developing the existing sliver project at Etukudukka in Kannur District. It aims to supply quality sliver at affordable price required for the spinners in the departmental production centres.
b. Establishment and Strengthening of Departmental Village Industries Units
The scheme is intended to strengthen the activities under departmental village industries units, which includes maintenance of Khadi Industrial Complex, Ernakulam, handmade paper unit Kizhakkambalam, Ernakulam, setting up of new paper bag manufacturing units at Pappinissery in Kannur, Kulathoor in Kottayam and Ollarikara in Thrissur. In 2018-19, by utilising an amount of ₹22 lakh, department renovated readymade garments unit at Payyannur Khadi centre.
c. Strengthening and Modernisation of Departmental Khadi Production Centres
Upgradation of the existing work sheds in Khadi production centres and technological upgradation are envisaged under the scheme. As part of the infrastructure development, construction of work-shed, common service facilities for women workers, pre-loom processing units, revitalisation of departmental spinning/weaving centres/production centres, Research and Development (R&D) are undertaken under this scheme.
d. Development of Bee keeping Industry
This scheme aims to promote bee-keeping activities by supplying bee boxes with colony at subsidised rate to motivate bee keepers. It also imparts training in bee keeping. In 2018-19, department installed partial components of modern honey processing unit at Balussery in Kozhikode.
e. Khadi Gramam Programme
The scheme envisages the establishment of 3,000 Charkhas and 2,000 Looms at household levels in selected grama Panchayats on a cluster mode providing employment to 5,000 people, mostly women or those belonging to disadvantaged sections during the 13th Plan period.
f. Computerisation of Khadi Board Offices.
The scheme envisages full-fledged computerisation of Khadi Board Offices including e-filing and tracking of files and online monitoring system, based on an IT Master Plan prepared in consultation with IT Department. In 2018-19, board purchased 75 Computers, 14 printers, computer tables and chairs.
II. Industrial Incentive Schemes
a. Production /Festival Incentive to Khadi Spinners and Weavers
The objective of the scheme is to provide production incentive to Khadi spinners and weavers and festival incentive to Khadi artisans, based on annual production and sales turnover in the sector/ institutions, linking value addition in products and corresponding employment generations. In 2018-19, production and festival incentives were provided to 13,000 khadi artisans as part of the scheme.

176 Economic Review 2019, Kerala State Planning Board
b. Special Employment Generation Programme
It proposes to provide margin money subsidy to small entrepreneurs and traditional artisans through bank linked projects, based on appraisal of the project and approved guidelines by Industries and Commerce Department. In 2018-19, the Department provided margin money to 53 units, and helped the creation of 98 new employment opportunities.
c. Prime Minister’s Employment Generation Programme (PMEGP)
Under the Prime Minister’s Employment Generation Programme (PMEGP), Government subsidy will be credited to the bank accounts of micro enterprises. In 2018-19, 407 projects were taken up and ₹1,124.41 lakh was disbursed as margin money grant, and 3,774 employment opportunities were created. Total production and sales under PMEGP were ₹10,316.97 lakh and ₹13,333.76 lakh respectively. KVIB implemented the scheme as ‘Ente Gramam’ in 2018-19. The total project cost for the programme in 2018-19 was ₹980.14 lakh. The programme helped the creation of 391 units and generation of employment for 1,243 people. The details of District- wise achievement under self-employment generation programme for the year 2018-19 is provided in Appendix.4.6.10.
Village Industries sector in Kerala
Goods worth ₹585.40crore was produced through the aided units of the KVIB and goods worth ₹727.09 crore were sold, thereby providing employment to 1,44,463 persons (including PMEGP and REGP). The production, sales and wages paid and employment generated by KKVIB in 2017-18 and 2018-19 is provided in Appendix 4.6.11. District wise details of departmental sales outlets and
sales under KVIB for 2017-18 and 2018-19 is provided in Appendix 4.6.12.
Marketing 2018-19
The KVIB has 182 sales outlets for khadi and village goods. This includes 43 Khadi Grama Soubhagya (including mobile sales van) units, 51 Khadi Soubhagya units and 88 Grama Soubhagya (GS Depot). The Board conducted Onam Melas during Onam in 2018 and 2019. Sales through Onam Melas 2018 and 2019 were ₹26.07 crore and ₹24.27 crore respectively.Actual sales were less than the targeted sales during these two years due to heavy rain fall. District-wise sales achievements for the year 2018-19 (Up to March 31, 2019) are given in Appendix 4.6.13.
Constraints and Strategies of Khadi and Village Industry
In the khadi sector, no power is used for production. This is one of the major constraints to the khadi industry sector for improving productivity and raising the wages of artisans. Research and development activities need to be undertaken for increasing productivity of traditional charkhas and looms. Another important problem is that the market potential of khadi and other traditional products are constrained by their quality. Competition from spurious Khadi products and shortage of working capital are the other constraints faced by the Khadi industry.
Way forward
To promote niche products under khadi and village industries, Government is planning to introduce innovative programmes by engaging prominent designers or design institutions. To encourage and sustain the sector, automation will be implemented in line with the principles of Khadi, so as to ease the drudgery and increase productivity. Special efforts are taken to improve marketing and branding of Khadi products. Schemes will be formulated in association with local self-Government Institutions for promoting the sector. Rebate in the Khadi sector will be paid

177Chapter 4, Manufacturing Sector
promptly for khadi products made in Kerala. All these steps are expected to improve the wages received by artisans in the sector.
COIR INDUSTRY
Coir industry is making different utility products such as floor mat, door mat, coir yarn etc. India produces 60 per cent of the total global supply of white fibre. Sri Lanka produces 36 per cent of the total global supply of brown fibre. In India the industry is concentrated in Tamil Nadu and Kerala.
India accounts for more than two-thirds of the global production of coir and coir products. Kerala is the home of Indian coir industry, particularly white fibre, accounting for 61 per cent of coconut production and over 85 per cent of coir products. Coir is the premier traditional industry in Kerala, employing nearly 1.5 lakh coir workers, of which 80 per cent are women. Coir Industry is a key sector directly influencing the country’s economy with export earnings touching ₹2000 crore, while domestic revenue is double of the export revenue. The entire processes in coir industry can be segregated into three major segment viz. fibre extraction, spinning and products sector. The fibre extraction and spinning segments are mostly concentrated in
the co-operative sector while the manufacturing segment is mostly running in factory mode.
Being an agro-based rural industry providing sustenance to lakh of families in the State, revitalising the coir sector is crucial. Directorate of Coir Development, GoK is implementing a comprehensive revival and transformational package for Coir Industry in the State as part of the ‘2nd Reorganisation of Coir Industry’. By this programme efforts were taken to mechanise the coir sector and protect the wages of labourers at the same time. The total allotment for the package comes around ₹1300 crore.
The development activities in coir sector are being taken up by coir department and through its line agencies. The welfare activities of workers are implemented through Kerala State Coir Workers Welfare Fund Board.
Export of coir and coir products
The export of coir and coir products from India in 2018-19 was 9,64,046.4 MT valued at 2,72,804.57 lakh as against 10,165,64 MT valued at ₹2,53,227.84 lakh in 2017-18. Coir pith, coir fibre, tufted mat, handloom mat, geo textiles, coir yarn, curled coir, handloom matting and rubberised coir constitute the major export items
Figure 4.6.1 Export of coir and coir products by Kerala State PSUs, 2012-13 to 2018-19, in ₹ lakh
Source: Directorate of Coir Development, GoK

178 Economic Review 2019, Kerala State Planning Board
of the industry over the years. India exports14 coir products to different parts of the world.
The details of export of coir and coir products during last 5 years by public sector undertakings in Kerala are given in Appendix 4.6.14 and Figure 4.6.1.
The export of coir and coir products by PSUs in Kerala shows a positive trend from 2012-13 to 2017-18. As compared to the previous year, export shows a hike of about 8.14 per cent in 2017-18 while it declined by7.55 per cent in 2018-19. Figure 4.6.2 provides a comparison of the growth of export of coir products by PSUs of Kerala and at the national level. In 2018-19, India exported 9,64,046.42 MT coir products for ₹2,72,804.57 lakh to 117 countries by 610 exporters.
Women empowerment
Most of the coir units in the country are located in rural areas and the workers belong to economically and socially weaker sections of the Society. It is estimated that 80 per cent of the workforce in this sector are women and hence the industry contributes significantly to women
empowerment.
Central Government Initiatives
The Central Government Schemes are Coir UdhyamiYojana, Science and Technology and Coir VikasYojana comprising of components like Skill Upgradation, Quality Improvement Scheme and Mahila Coir Yojana, Export Market Promotion and Domestic Market Promotion. Government is also implementing the Scheme of Funds for Regeneration of Traditional Industries (SFURTI) for development of Coir Clusters. Under the ASPIRE Scheme of the Ministry of Micro, Small and Medium Enterprises (MSME), Coir Board is in the process of establishing Livelihood Incubation Centres in various parts of the country, which will provide training and handholding support to new entrepreneurs of coir sector (Coir Board, Ministry of MSME,
GoI).
Coir Board is implementing the Central Sector Scheme of Export Market Promotion with a view to improve the export performance of Indian Coir Sector through various export market promotion activities such as sponsoring delegations, participation in seminars and conferences, organising participation in international fairs
Figure 4.6.2 Growth rates of export by State PSUs and Central PSUs in coir sector, in per cent
Source:Coir Board Statistics and Directorate of Coir Development

179Chapter 4, Manufacturing Sector
and undertaking publicity abroad, extending financial assistance to Micro, Small and Medium Enterprises and Exporters, presenting Coir Industry Awards on an annual basis to recognise the outstanding performance in the areas of export, domestic trade, R&D, functioning of units and societies etc.
Coir sector in Kerala
Directorate of Coir Development and Agencies in Kerala Coir Sector
The Directorate acts as a facilitator for the promotion of coir industry in the State. Kerala State Coir Corporation, Foam Mattings (India) Ltd., COIRFED, National Coir Research and Management Institute (NCRMI), Kerala State Coir Machinery Manufacturing Company, Kerala State Coir Workers Welfare Fund Board are the important agencies functioning for the promotion of coir industry. Coir Board at Cochin is an autonomous body established by the GoI under the Coir Industry Act (45), in 1953 for the development of coir industry.
1. Coirfed-The Kerala State Co-operative Coir Marketing Federation Ltd. (Coirfed)
The Kerala State Co-operative Coir Marketing Federation Ltd. (Coirfed) is the apex federation of primary coir co-operative societies, which
are spread all over Kerala. The main objective of the federation is the procurement of the entire product of the member societies and marketing the same through its sales outlets throughout the country and thereby providing fair wages and subsistence to the poor coir workers of Kerala. At present Coirfed has two factories engaged in the manufacturing of value added products – One producing rubberised coir products and the other rubber backed coir mats. Coirfed have 4 defibering Units. In the financial year 2018-19, an amount of ₹327.54 lakh has been sanctioned for various projects submitted by Coirfed.
2. Co-operatives in Coir Sector
Coir co-operative societies play substantial role in collecting husk, defibering and producing varieties of coir products in Kerala. There are 1147 co-operatives registered in the coir sector as on March 31, 2019 as against 1139 in the previous year Details of the coir co-operative societies are shown in Appendix 4.6.15. The activities of coir co-operative societies are shown in Appendix 4.6.16.
Coir Co-operative Societies in Kerala
As on March 31, 2019 there were 1147 co-operative societies exist in Kerala. Out of this 263 were under liquidation. There were 595 working societies in 2019. Between 2018-19,the number of working units decreased among all types of
Table 4.6.5 Number of coir co-operative societies in Kerala Sl.No Type of Society 2018 2019 Change
1 Primary co-operative society 553 536 -172 manufacturing society 43 40 -33 small scale producers co-operative societies 56 50 -64 Husk Procurement and Distribution societies 8 3 -55 Fibre Societies 66 74 86 ICDP Societies 69 69 07 Samyojitha CVCS 148 112 -36
Sub Total 943 884 -59Societies under liquidation 196 263 67 Total 1139 1147 8
Source: Directorate of Coir Development

180 Economic Review 2019, Kerala State Planning Board
societies except fibre societies. Details are in Table 4.6.5.
Operating Status
The number of profit making societies in 2018 was 189 out of all 611 working societies. It increased to 222 in the year 2019. On the other side, the number of loss making societies decreased from 422 in 2018 to 403 in 2019. Table 4.6.6 shows that the number of dormant societies have dwindled and liquidation process is getting expedited.
Yarn Sector
The number of workers in the coir yarn sector was 1.10 lakh 2018-19. Coir co-operative societies purchased 118.9 lakh numbers of husk for a value of ₹177.61 lakh in 2017-18 and it increased to 204.00 lakh numbers for ₹312.59 lakh in 2018-19. Fibre purchase also increased from 24,051 tonnes to 25,234 tonnes. The quantity of yarn produced by primary co-operative societies increased from 12,071 in 2017-18 tonnes to 27,585 tonnes in 2018-19.
Mats and Mattings
There were 536 Coir co-operative Societies in Kerala as on March 31, 2019, up from 553 societies in March 31, 2018. Even though, the number of societies decreased by 17, number
of working societies increased to 396 in 2019 from 388 in 2018 and profit making societies increased to 123 in 2019 from 103 in 2018. The number of dormant societies decreased to 73 in 2019 from 106 in 2018 and number of loss making societies decreased from 285 in 2018 to 273 in 2019.
Manufacturing Societies (Mats and Mattings)
As on March 31, 2019, there were 40 manufacturing societies producing mats and mattings. The number was 43 in 2018. At the same time, the number of profit making societies increased from 8 to 12 and loss making societies decreased from 19 to 24.
Husk procurement and distribution societies
The case of husk procurement and distributing societies is to be specially noticed. The number of working units decreased from 6 in 2018 to 2 in 2019 and the two units are in loss.
The fibre societies (de-fibering mills) show positive signs. Total number of working societies which was 15 in 2018 increased to 21 in 2019. More over in 2015, no fibre societies were reported as profit making, but 11 units became profit making in 2019. But there exist 43 dormant units in this sector. The status of ICDP (Integrated Coir Development Project) societies and Samyojitha Coir Vyavasaya Co-operative
Table 4.6.6 Operating status of coir co-operative societiesSl.No Operating Status 2018 2019 Change
1 Working units 611 595 -16a) Units in profit 189 222 33b) Units in loss 422 403 -192 New units not started working 130 114 -163 Dormant units 202 145 -57
Sub Total 943 884 -594 Units under liquidation 196 263 67
Total 1139 1147 8Source: Coir Directorate

181Chapter 4, Manufacturing Sector
Societies (SCVCS) are more or less same in 2019 as of 2018.
Small Scale Producers Co-operative Societies
The number of small scale co-operative societies decreased from 56 in 2018 to 50 in 2019. Though number of profit making units remain the same in 2018 and 2019, the number of loss making units increased slightly from 21 in 2018 to 22 in 2019.
3. Kerala State Coir Corporation
The Kerala State Coir Corporation Limited was established in 1969 to cater to the needs of Small Scale Coir Manufacturers by providing them manufacturing and marketing opportunities. Over the years Kerala State Coir Corporation is supporting the sector by procuring the produce of Small Scale Producers, which they cannot sell it in the market. Kerala State Coir Corporation has production facilities in its 3 units in Kerala. Establishment of one more unit in Adoor is in progress. Kerala State Coir Corporation has vast infrastructure in terms of land and building. Kerala State Coir Corporation is implementing the Purchase Price Stabilisation Scheme (PPSS) in the Coir Sector. The Kerala State Coir Corporation directly procures coir products from small scale producers, mats and mattings co-operatives and thereby reducing the influence of middlemen in the business.
4. Foam Mattings (India) Limited
Foam Mattings (India) Limited was incorporated in 1978 with the objective of promotion, manufacture and marketing of a wide range of environmentally friendly products, including coir, jute and sisal products with a wide range of door mats, mattings, carpets, rugs, coir geo-textiles, car mats and other environmental friendly products. FOMIL caters to the needs of domestic and international markets. Company has state-of-the-art manufacturing facility such as Latex Backing Plant, Modern Dye House, Fully Automatic Power Loom etc. and its spare capacity is utilised for
undertaking job works of other export. The latex backing plant has a capacity up to 3.3 million sq. m of matting 4 metre width, per annum on three shift basis. The company has a modern Dye house, power loom and matting plant mainly to cater the needs of export.
Research and Development
5. National Coir Research and Management Institute
The National Coir Research and Management Institute of Kerala is set up to strengthen the research and development activities of Coir Sector with a view to enable the industry to produce more value added products and new design of products to sustain an upper hand for Kerala in the domestic and in the international market. In the financial year 2018-19, an amount of ₹522.25 lakh has been sanctioned for various projects of NCRMI. The Central Research Institute has implemented research activities under 5 project heads: i) Modernisation of production processing of coir, ii) Development of machinery and equipment, iii) Product Development and Diversification of coir and coir pith, iv) Development of environment friendly technology, vi) Technology transfer Incubation testing and service facilities vii) technology transfer, incubation testing and service facilities. Areas of research include microbiology, chemistry, engineering, extension, product diversification.
Mechanisation and Production
6. Kerala State Coir Machinery Manufacturing Company Ltd.Chungam
KSCMMC has been set up in Alappuzha to provide the machinery needed for the coir sector in Kerala, and the company was commissioned on February 2014. Company provides coir machinery such as electronic ratts, automated spinning machines, defibering machines, integrated coir processing units, willowing

182 Economic Review 2019, Kerala State Planning Board
machines and allied machines required for coir industry. The main aim behind the setting up of the coir machinery factory is to speed up the mechanisation in the coir sector in Kerala.
Performance of Schemes and Programmes in Coir Sector
Coir yarn production generated ₹120 crore worth demand for geo textiles and supplied ₹43 crore worth products as on date. Production of coir products touched 103.5 crore during April-September 2019 period with 27 per cent growth compared to April- September 2018.
The total production in the sector is increasing at 25 per cent per annum. The value of the products also increased in the period of 2016-17 to 2018-19. Details given in Table 4.6.7.
In 2017-18, the Budget allocation was ₹12,812 lakh and expenditure was ₹9,875.39 lakh (77.08 per cent). In 2018-19, the total outlay of coir directorate was ₹14,108 lakh and expenditure was ₹12,943.3 (91.74 per cent). The total outlay provided in the Annual Plan 2019-20 for the coir sector is ₹14,151 lakh and the expenditure incurred up to November 2019 was ₹9,114.90 lakh (64.41 per cent).
1. Mechanisation and infrastructure development of coir industry
This scheme intends to meet the global demand for diversified coir products of higher quality and to withstand the price competition from other fibre products. It is essential to modernise and enhance the productivity in coir industry. An amount of ₹6,077.00 lakh is provided in
the Budget 2018-19 for the above activities. An amount of ₹25.78 lakh was provided to coir projects for the purpose of husk collection programme and an amount of ₹104.96 lakh was provided to infrastructure assistance for societies under Infrastructure Development Scheme. ‘De-fibering’ machines for 75 numbers with 44 HP capacity were installed in co-operative societies under 9 coir project area and managerial subsidy were given to 451 societies in 2018-19.
2. Marketing, publicity and propaganda, trade exhibition and assistance for setting up showrooms
The objective of the scheme is to popularise the activities in the coir sector and to strengthen marketing efforts for overall development of the sector. The outlay proposed is for attending and organising trade fairs including Coir Kerala, support to be provided to coir co-operatives, coir PSUs and other institutions/department in the coir sector for participation in trade fairs/exhibitions and buyer seller meet, conducting studies, seminars/awareness camps/ workshops and for giving awards and scholarship in the coir sector. An amount of ₹970 lakh was provided in the Budget 2018-19 for the above activities.
3. Production and marketing incentive
The Scheme is meant for providing assistance to promote production, marketing and exports PVC and rubberised coir products and Geo textiles by the Primary Coir Co-operative Societies, Mats and Matting Co-operative Societies, Apex Societies and Public Sector Undertakings, viz, Kerala State
Table 4.6.7 Coir production and turn over in Kerala
Year Production (in tonnes) Rate of growth Value (in ₹ crore) Rate of growth
2015-16 7882.04 97.992016-17 9979.39 26% 105 7.15%2017-18 12496.1 25% 115 9.5%2018-19 15700 25% 153.19 33.2%
Source: Coir Development Department

183Chapter 4, Manufacturing Sector
Coir Corporation and Foam Mattings (India) Ltd. A portion of the amount can be utilised for promotion and marketing of heritage products and for sustainable production. Assistance was based on actual sales turnover of the institutions with respect to input/output, employment generated/value addition on products. An amount of ₹400.00 lakh is provided in the Budget 2018-19 for above activities. The scheme was successful in providing incentive to 524 societies in 2018-19.
4. Marketing Development Assistance
The scheme is for publicity, opening of new showrooms, renovation of existing outlets; go down, market study and market strategies. An amount of ₹800 lakh has been released to 26 Coir Matt and Matting Societies, Coir Corporation, Foam Mattings (India) Ltd and COIRFED for the year 2018-19.
5. Price Stabilisation Scheme for the sale of Coir and Coir Products
Price Fluctuation Fund Scheme is intended to stabilise the price of coir fibre, yarn and coir products. This is aimed to make the COIRFED,
FOMIL and KSCC capable to procure the products from co-operatives giving price at par with the production cost and compensates the loss, if any, while selling it at market prices. The benefit of the scheme is that the prices can be sold at market conditions, at competitive prices and at optimum level. An amount of ₹4500.00 lakh is provided in the Budget 2018-19 for the above activities. ₹59.41 crore has been given to Coirfed and Coir Corporation.
6. Coir Geo Textile Programme
The comprehensive Coir Geo Textiles Development Programme includes implementing model projects, creation of awareness programmes on the use of Geo Textiles as a standard engineering material, and strengthening of R&D. Assistance has been given to Coirfed, Kerala State Coir Co-operatives (KSCC), Foam Mattings India Limited (Fomil), Alappuzha Coir Cluster Development Society (ACCDS), National Coir Research and Management Institute (NCRMI), Public Works Department, Irrigation Department, Local Self- Government Institutions and other agencies for implementation of various Geo-textiles activities in their respective areas, based on projects with specific outcomes. An
Box 4.6.3 Achievements of coir sector in Kerala in 2018-19
• Re-organisation of coir industry (2nd phase) with efforts to modernise the coir sector including mechanisation, maintaining the wage level, specialisation, procurement with direct State Government intervention was initiated.
• Automatic spinning machines having spinning capacity of 55-60 kg/hour with automatic feeders is produced in machine factory.
• 115 defibering mills with capacities to process 4000 to 8000 husks per 8 hour shift, is working in the State.
• The Government has initiated steps to establish 150 geo-textile weaving looms in the State.• 75 DF machines with 44 HP capacity were installed in co-operative societies under 9 coir
project areas.• New scheme introduced for providing DF machines to private entrepreneur at 50 per cent
subsidy.• Skill up gradation training in spinning Vaikkam Coir in Electronic Ratts were imparted to 400
women workers in coir co-operative societies.• An amount of ₹1,12.29 crore were distributed as pension to coir workers.• ₹22.64 crore were distributed to coir workers under Income Support Assistance (ISS)scheme

184 Economic Review 2019, Kerala State Planning Board
amount of ₹100.00 lakh is provided in the Budget 2018-19 for the above activities. In 2018-19, 10 orientation programmes were conducted. It is estimated that there will be a demand of 3.5 lakh tonnes in the sector.
Challenges and the way forward
The traditional coir sector is faced with the problem of low wages. Raw material shortage is another challenge faced by the industry. Coir industry, one of the oldest industries in Kerala, requires a revamping and modernisation of its production and organisation. Active Government intervention is needed in the modernisation of technologies and in controlling market-driven price fluctuations. With better technologies, the coir sector in Kerala should be able to introduce more diversified products and access new markets.
CASHEW INDUSTRY
Cashew is considered a wonder nut in the international market. Ivory Coast, Benin and Guinea Bissau are the largest cashew producers in the world. Vietnam, Brazil and East Africa are the other major sources of production. Cashew was first introduced in India in Goa from where it spread to other parts of the country. W-240, W-320 and W-450 are some of the popular grades of cashew produced in India.
Cashew Production in India In India, cashew is being grown in an area of 10.27 lakh hectares with a total production of 7.25 lakh MT of raw nuts and productivity of 706 kg/ha. The major areas of cultivation of cashew in India are in Kerala, Karnataka, Goa and Maharashtra along the West Coast, as well as in Tamil Nadu, Andhra Pradesh and Orissa along the East Coast and to some extent in the States of West Bengal, Chhattisgarh, Gujarat, Jharkhand and the North Eastern States. In India the production of cashew is the highest in the State of Maharashtra followed by Andhra Pradesh and Orissa. Productivity of cashew cultivation is the highest in Maharashtra(1262 kg/ha). India a major exporter of cashew kernels and earns a sizeable amount of foreign exchange, to the tune of ₹5500 crore per annum. India exports cashew kernels to more than 60 countries, mainly to USA, UAE, Netherlands, Saudi Arabia and Japan. A total of 1.19 lakh MT of cashew kernels were exported to these countries in addition to other by-products like Cashew Nut Shell Liquid, Cardanol etc.
At present, more than 3900 processing units are functioning in India in organised and unorganised sector with a processing capacity of 16.43 lakh MT per year. The domestic production is almost 50 per cent of the demand and hence India depends heavily on import of raw nut from
Table 4.6.8 Production of cashew nut in selected countries, from 2017-18 and 2018-19, in 1000 Metric Tonnes
Country2017-18 2018-19 (Estimate)
Total Supply Total Supply
Cote d’lvoire 673.24 745Guinea – Bissau 225 250Nigeria 180 200Benin 110 110India 817.04 800Vietnam 300.1 340Cambodia 90 120Brazil 100 100Indonesia 80 85
Source: International Nuts and Dried fruit, World nut and dried fruit Congress, 2018, Spain

185Chapter 4, Manufacturing Sector
Asian and African countries to bridge the gap (DCCD Kochi, 2019).
Cashew Industry in Kerala
The cashew industry is a major traditional agro-based industry in Kerala. The cashew processing factories are located in the Southern District of Kollam which has earned the title ‘cashew capital of the world’. The sector employs around 300,000 workers and 90 per cent of the total workforce are women.
The production of raw cashew nuts in Kerala is only about 80,000 tonnes a year and the demand for raw cashew nuts in the State is about 800,000 tonnes a year. The production of cashew in Kerala has not increased to meet the demand. Thus there is a gap in demand and supply of raw cashew nuts in Kerala. The GoK has created Special Purpose Vehicle (SPVs) for cashew nut procurement in order to tackle the problem as well as to increase the area under cashew cultivation and improve productivity per hectare (DCCD, India,2019).In Kerala the production of cashew slightly increased from 80.12 MT in 2013-14 to 82.89 MT in 2018-19. Both area under cultivation of cashew and total production increased. Kerala is ahead of Tamil Nadu with respect to area and production of raw cashewnut (Appendix 4.6.17).
Nature and Scope of cashew cultivation in Kerala
The decline in area is attributed to the pressure on land and the existing land ceiling laws and the
continued denial of plantation status to cashew. At the same time, Kerala has vast areas of cashew plantations which have not been replanted. A major reason for the low levels of productivity of cashew cultivation is the fact that nearly 70 per cent of the cashew trees in the State are aged, local varieties, which start yielding late in the season. Climate change effects such as the coincidence of excessive rainfall and high relative humidity have also been a factor. Shift to more profitable cash crops mainly rubber has brought down the area under cashew cultivation in Kerala. Unlike rubber, cashew is not treated as a plantation crop.
Role and Responsibilities of Agencies involved
Kerala State Cashew Development Corporation (KSCDC), Kerala State Cashew Workers Apex Co-operative society (CAPEX), are the two Government agencies involved in the processing of cashew in the State. Kerala State Agency for the Expansion of Cashew Cultivation (KSACC), Cashew, Cashew Export Promotion Council of India (CEPCI), Directorate of Cashew and Cocoa Development (DCCD) are the other agencies involved in cashew promotion.
Kerala State Cashew Workers Apex Industrial Co-operative Society Ltd. (CAPEX)
CAPEX was set up in 1984 to work as an apex society at Kollam to take care of the operations of 10 primary co-operative societies under GoK. Its major function includes procurement and
Table 4.6.9 Plan outlay and expenditure of Government agencies in 2018-19 and 2019-20, in ₹ crore
Sl. No. Agency 2018-19
2019-20
Outlay Exp % Outlay Exp %
1 KSCDC 2150 3388 157.58 1650 500 30.302 CAPEX 850 1761 207.18 250 0 03 KSACC 715 579.41 81.04 515 0 04 KCB 1730 950 54.91 3030 0 0
Total 5445 6678.41 122.65 5445 500 9.18Source: Accounts and Plan Space, State Planning Board

186 Economic Review 2019, Kerala State Planning Board
marketing. It procures raw nuts, distributes the same to the primary societies and gets them processed, and markets the kernels. These are done with the aim of bringing down the processing costs and providing continuous employment and fair wages to the workers. 10 CAPEX factories employ close to 5,000 workers. More than 90 per cent of the workers are women and they belong to disadvantaged sections of society. CAPEX possesses the capacity to process 18,000 MT of raw cashew nuts per annum.
CAPEX managed to provide ‘continuous employment’ to more than 4,000 workers and staff for 190 days in 2018-19. In the year 2019-20, a total number of 120 working days have already been given as on 30-9-2019 (1-4-2019 to 30-9-2019). CAPEX factories have been continuously working with raw cashew nuts (RCN) procured through M/s Kerala Cashew Board Ltd leading to some improvement in productivity. Modernisation and partial mechanisation in 10 CAPEX factories and packing centres are going on. Sales turn over in 2018-19 was ₹76.81 crore and the same in the current financial year up to 30-9-2019 comes to ₹43.10 crore (1-4-2019 to 30-9-2019).Details given in Appendix 4.6.18. The sale, export and turnover of CAPEX are given in Table 4.6.10.
Kerala State Cashew Development Corporation (KSCDC)
Kerala State Cashew Development Corporation Ltd. (KSCDC) was formed in 1969 as a company fully owned by the GoK. The Kerala Cashew
Board is formed to meet the Raw Cashew Nut (RCN) requirement of KSCDC and is receiving continuous supply of RCN (Raw Nut Cashew) from Kerala Cashew Board. With the introduction of cutting machines the processing of RCN per day has been increased to around 100 MT from 83 MT. KSCDC is marketing its ‘value added products’ which have better margins and has received large response from customers. KSCDC has also started outlets to increase the sales.
In the financial year 2018-19 workers were given employment for 136 days. KSCDC has processed 9312 MT of raw cashew nuts and approx. 2558 MT of cashew kernels were produced in 2018-19. KSCDC has achieved a turnover of ₹132.27 crore in the financial year 2018-19. Details given in Appendix 4.6.19.
Kerala State Agency for the Expansion of Cashew Cultivation (KSACC)
KSACC was constituted by the GoK in 2007 to promote cashew cultivation and to adopt innovative technologies. KSACC started the project ‘Cultivation of Organic Cashew and Establishment of Raw Nut Bank’ from the period 2007-08. In the financial year, 2018-19 agency distributed 5,89,600 number of grafts (2980 ha) and 4,00,000 numbers (1600 ha) grafts up to 30th September 2019 to farmers/plantation under various components of the scheme.
Table 4.6.10 Sales turnover CAPEX, in ₹ croreYear Domestic
SalesExport Sales
Total Turnover
2013-14 42.31 21.17 63.482014-15 59.46 14.40 73.862015-16 59.07 14.65 73.722016-17 26.27 19.58 45.852017-18 81.55 5.32 86.872018-19 76.50 NIL 76.50Total 345.16 75.12 420.28
Source: CAPEX, Kollam

187Chapter 4, Manufacturing Sector
Kerala Cashew Board (KCB)
KCB was created in 2017 by the State Government as a special purpose vehicle of private limited company with an equity contribution of 49 per cent by the State Government and balance 51 per cent by KSCDC, CAPEX and similar other agencies and individuals in order to procure and import raw cashew, supply to domestic processors at fair prices and promote scientific cultivation of cashew. KCB started its operation by importing 3,000 tonnes of RCN from the African country Guinea-Bissau, which involved a business activity of ₹40 crore.
The cost of raw cashew nuts procured through KCB in September-October 2018 was ₹132.50/kg, thus benefiting from the downward trend in raw cashew nut prices. The presence and intervention of KCB has started yielding positive results in terms of reasonable prices for raw cashew nuts, to benefit the industry. In 2018-19, KCB has imported 12,523 MT of RCN and supplied to KSCDC and CAPEX thus meeting 84 per cent of its target entered into MoU with Cote d’Ivoire for direct import of RCN on G to G basis. MoU with Republic of Senegal is under consideration of that Government.
Cashew Export Promotion Council of India (CEPCI)
CEPCI established by GoI, aims to promote the export of cashew kernels and cashew nut oil liquid. The Council serves as an intermediary between importers of cashew kernels and exporters who are members of the council. It undertakes numerous activities, such as organising global buyer-seller meets and providing support to cashew processors and exporters for improving infrastructure. There are 238 registered cashew exporters in India as members of CEPCI. In that, more than 200 exporters are based in Kollam.
Directorate of Cashewnut and Cocoa Development (DCCD)
DCCD is the subordinate office of the Department of Agriculture, Co-operation and Farmers Welfare of the GoI. It is the nodal agency for accelerating cashew and cocoa development programmes in the country. A total of 54,98,000 cashew grafts were produced and distributed from DCCD. Under new plantation development programme an additional area of 27,490 ha have been brought with clones of High Yielding Varieties with financial assistance under MIDH/RKVY in 2018-19. Major Issues/ Challenges
Cashew production in Kerala faces problems such as relative shortage of raw nuts at competitive prices, higher processing costs in Kerala compared to its competitors in the cashew industry, adapting modern processing technologies. The challenges to cashew cultivation in Kerala include the pressure on land and the land ceiling laws, incidence of fungal diseases, lack of farmer’s interest in cashew plantation, especially given the possibility of better returns from other crops such as rubber, and slow spread of high yielding cashew varieties and cultivation of techniques in the State. The cashew industry in Kerala requires the assistance of modern technologies in processing and value addition. Re-opening private sector factories that had been closed is a priority for the Government. The Kerala’s cashew industry should try to seek new markets as well as preserve the identity of ‘Kerala Cashew’ in the national and international markets.


SERVICE SECTOR
05C H A P T E R

191Chapter 5, Service Sector
SERVICE SECTOR5.1 Information Technology
05C H A P T E R
Information and Communication Technology sector has been playing an important role in the development of the State, since the 9th Five Year Plan. Realising its potential and critical importance, the State Government has made earnest efforts to create a sound and world class infrastructure for the sector and to develop the State’s digital technology capacities and resources. This has enabled the State to be at the forefront in implementing information and communication technology projects, e-governance initiatives, e-literacy programmes and in the creation of basic IT infrastructure facilities.
In a path-breaking initiative, the Government of Kerala has declared access to internet as a basic right and has taken immediate steps to implement the right through the Kerala Fibre Optic Network (KFON) project that aims to eventually provide internet connectivity to every household in the State. 2 million BPL households are to be provided connectivity free of charge. The early implementation of the KFON project has the potential to assist in taking the economic development of the State to a new level, especially in the assistance it would provide to the rapid modernisation and development of the State’s human resources. The project itself is an innovative collaboration through the pooling of the resources of the Kerala State Electricity Board (KSEB) and the State’s public sector, Kerala State Information Technology Infrastructure Ltd. (KSITL), especially in guaranteeing the necessary
last-mile connectivity for eventual full coverage, while collaboration with various service providers would provide the link to the national and global internet.
The major agencies involved in the implementation and promotion of Information Technology related activity in the State are Kerala State Information Technology Mission (KSITM), Indian Institute for Information Technology and Management – Kerala (IIITM-K), Technopark, Infopark, Cyberpark, Kerala State Information Technology Infrastructure Ltd. (KSITIL), International Centre for Free and Open Source Software (ICFOSS), Kerala Start-up Mission (KSUM) and Centre for Development of Imaging Technology (C-DIT).
The State Government envisages expansion of IT industry in the State in a manner that benefits all the districts in the State. A hub and spoke model has been planned. Thiruvananthapuram (Technopark), Kochi (Infopark) and Kozhikode (Cyberpark) will act as hubs and the remaining districts will be the spokes. Performance of IT Sector in Kerala
• According to the Internet And Mobile Association of India(IAMAI) report, titled ‘India Internet 2019’, Kerala’s Internet penetration rate is the second highest in the country (54 per cent), with Delhi NCR topping the list with 69 per cent

192 Economic Review 2019, Kerala State Planning Board
penetration. The report also notes that Kerala, Tamil Nadu and Delhi have the highest proportion of female internet users.
• Kerala is the first State to make Internet Access a Basic Right. Kerala Fibre Optic Network (K-FON) project was initiated by Government of Kerala for providing free internet connectivity to 20 lakhs economically backward households.
• The E district Kerala, a lighthouse project in India, has touched the 4 crore mark with respect to issuing various certificates to the citizens through Akshya Centres.
• The revamped Kerala Spatial Data Infrastructure Portal was launched by the Hon’ble Chief Secretary. Kerala become the first State in the country to start Geo Tagging of Government Offices. KSDI has more than 300 beneficiaries including users from 39 Government Departments.
• Wi-Fi hotspots were established in 1,888 locations across the State and the average unique users per day are 32,000. Per day data consumption is more than 6 TB.
• About 190 lakh sq.ft built up space, ₹4,982.1 crore investment, ₹20,623.6 crore
Table 5.1.1 Plan outlay and expenditure, in ₹ crore
Sl NoName of Department/ Scheme
Annual Plan 2017-18 Annual Plan 2018-19Annual Plan
2019-20
Outlay Exp. (%) Outlay Exp. (%) Outlay
1 Kerala State IT Mission 147.5 67.3 45.6 147.5 104.9 71.1 144.1
2 Technopark 84.0 111.8 133.1 84.0 23.3 27.7 84.0
3 Infopark 67.1 54.5 81.2 67.1 33.6 50.1 67.05
4 Cyber Park 25.7 0.7 2.7 25.7 7.1 27.6 22.69
5Indian Institute of Information Technology and Management-Kerala (IIITM-K)
52.0 48.5 93.3 65.5 7.0 11.0 15.50
6 Kerala Startup Mission 80.0 24.6 30.7 80.0 44.2 55.3 80.00
7 Kerala State IT Infrastructure Ltd 55.6 15.3 27.5 52.4 24 45.8 148.00
8Indian Institute of Information Technology-Kottayam
22.5 22.5 100 24.5 6.3 25.7
9 C-dit 10.0 0.0 0.0 6.0 5.1 85.0 7.0
10International Centre for Free and Open Source Software
5.0 5.0 100 5.0 7.5 150.0 6.0
11 Hardware Mission 30.0 6.1 20.3 0.0
Total 549.3 350.1 63.7 587.6 269.1 45.8 574.38
Source: Budget Estimate

193Chapter 5, Service Sector
turnover and 1,00,558 employment created through 825 companies operating in the three IT Parks.
• 2,716 Akshaya Centres are functioning across the State giving employment to 7,577 persons.
• Under the banner of Kerala Start Up Mission and several of its sector-specific partner organisations, there are presently more than 2,200 registered start-ups, more than 3.15 lakh square feet of incubation space and more than 230 Innovation and Entrepreneurship Development Cells.
• Kerala ranked as the top performing State in Department for promotion of Industry and Internal Trade’s (DPIIT’s) State Startup ranking.
• Availability of Resources for Startups is more than ₹1,000 crore through Fund of Fund Scheme.
• IIITM-K established 10 Research Centres, 65 Research papers published in National/ International Journals.
• Completed ten GIS based web application/portal projects for various Departments and six other projects are under development stage.
• Three Android based GIS mobile applications has been developed and deployed.
• Conducted various GIS based workshops for Government Departments, Schools, Universities and Colleges in addition to provisioning of internship facility for students.
Government of Kerala provided an amount of ₹587.6 crore in the budget 2018-19, for the development of core IT infrastructure, ITeS, e-governance activities and incentivising investment in the sector, which is 7 per cent higher than the previous year and the expenditure incurred was ₹269.1 crore (45.8 per cent). In 2019-20, the outlay earmarked for the sector was ₹574.4 crore. The details of Plan outlay and expenditure for the last 3 years are given in Table 5.1.1.
Kerala State Information Technology Mission (KSITM)
Kerala State IT Mission is an autonomous nodal IT implementation agency of the Department of Information Technology, Government of Kerala which provides managerial and technical support to various initiatives of the Department. KSITM performs diverse roles including, enactment of ICT related policies, development of guidelines and standards for e-governance, ICT facilitation for the Government entities, provide end to end support and guidance to State Departments in digitisation efforts, act as a bridge between Government and industry, undertake Capacity Building initiatives and bridge the digital divide, establish and sustain common IT Infrastructure and take up various e-Governance initiatives. The focus activity is delivering the best of the digital services to the citizens keeping in mind “Citizen First” approach. As a result of these proactive policies and projects, Kerala achieved major progress in the transformational journey towards “Digital State”. Some of the remarkable achievements are shown below.
• Kerala declared as the 1st digital State in the country by GoI in 2016
• Hi-Speed Rural Broadband Network was first commissioned in India at Idukki
• First State in the country to issue over 4 crore e-Certificates.
• 100 per cent of the Grama Panchayats are connected through optical fibre network
Key Accomplishments of KSITM In the present world, e-governance is an important tool for good governance by achieving transparency, reliability, and accountability in rendering services. Kerala has been a forerunner in e-governance and mobile governance by promoting and developing core infrastructure and e-literacy programmes.
K-Fi/Public Wi-Fi: K-Fi is a free Wi-Fi project that aims to establish 2,000 Wi-Fi hotspots across the State to provide free internet to the citizens of

194 Economic Review 2019, Kerala State Planning Board
the State. Out of which, Wi-Fi hotspots have been established in 1888 locations across the State and the average unique users per day are 32,000. Per day data consumption is more than 6 TB. Installation of Wi-Fi hotspots at selected coastal sites and the remaining sites are in progress.
E-Office aims to conduct office procedures electronically thereby transforming Government offices to paperless offices and bringing out the benefits of digital communication that ultimately leads to faster decision making. E-office has been implemented in all 54 departments in Secretariat, 46 Directorates, 14 Collectorates, 12 RDOs. The Government has decided to roll out e-Office upto grass root level in Taluks and Village Offices and Panchayats in coming years. E- file movement per month is more than 8 lakh. At the National level, most of the other States utilise e- office for end to end file flow. Further Central Government Ministries rely upon e- office for e- filing. It provides transparent information like current status and location of the file.
Core infrastructure for e-governance in the State consists of Kerala State Wide Area Network (KSWAN), Secretariat wide Area Network (SECWAN), State Data Centre and State Service Delivery Gate way (SSDG). KSWAN is the backbone of the State Information Infrastructure (SII), connecting Thiruvananthapuram, Kochi and Kozhikode extending to 14 districts and 152 Blocks Panchayats and 63 Mini Civil Stations/ revenue towers across the State. Around 3,700 offices of Government Departments are connected to KSWAN through Wireless and a larger number through leased lines and LAN. All the Grama Panchayats of Thiruvananthapuram District are connected through the National Information Infrastructure (NII) pilot project by integrating KSWAN with National Optical Fibre Network. Around 500 offices including Akshaya Centres were connected as part of the NII pilot project in Thiruvananthapuram. State Data Centres (SDCs) are the heart of e-governance framework of the State, hosting various applications and websites of the Government entities and provisioning associated services.
e-District, a State Mission Mode project under Digital India, targets delivery of high volume citizen services provided by the district administration, at Taluk or Village level, through back-end computerisation to enable online availability of these services through Common Service Centres (CSC) and State portal. Some of the major services availed through e-district project are:
• Implemented 25 Revenue Certificate Services across the State
• RTI and Public Grievance Services• Online utility bill payment systems enabled
in e-District portal• Various services of other Departments are
also online/getting integrated with the e-District Portal
M-Keralam, the unified mobile application which will bring together all the services rendered by different Government Departments under one umbrella. Currently, the app is providing 101 services of 18 Departments of the State.
e-Government Procurement (e-GP) is being implemented in the State, 53 Government Departments and 216 PSUs/Autonomous Bodies/Government agencies are utilising the common e-Procurement system. 1,764 offices (under various Government Departments and Government Bodies) have been mapped into the e-Procurement system. 2,17,827 tenders were floated using this platform in last two years and the total value of tenders thus floated is ₹56,228 crore. The number of officials got trained in last two years is 4,984.
Friends Janaseva Kendras have been established in all the 14 district headquarters. In 2018-19, an amount of ₹148.1 crores revenue for the Government was collected. The Government is also planning to make all services currently available through Akshaya also to be made available to Friends without service charges. It is a single window ‘no queue’ integrated remittance centre, where the citizens have the opportunity to pay all taxes and other dues to the Government,
195Chapter 5, Service Sector
under one roof, at no extra cost. On an average, 1,000-1,050 people visit each centre every day.
Akshaya is an innovative project launched on November 18, 2002 to bridge the digital divide. It works on public private participation mode. In the initial stages, the objective of the project was to make at least one person in a family e-literate. Gradually focus of Akshaya shifted to citizen service centric mode.
• 2,716 Akshaya Centres are functioning across the State giving employment to 7,577 persons.
• More than 1,700 Akshaya Centre act as banking Kiosks for different banks.
• 5.5 million citizens got enrolled under UID through Akshaya Centers.
Enrolment under UID through Akshaya is 92.7 per cent against the national average of 62 per cent. Akshaya is also a premier agency in UID enrolment having generated 75 per cent of total UIDs in Kerala. The details of Akshaya centres in Kerala are furnished in Appendix 5.1.1.
Kerala State Spatial Data Infrastructure (KSDI) is a mechanism to provide geo-spatial data sharing at all levels of Government, the commercial sector, the non-profit sector, and academia. The major achievements of the project in the last two years are as follows.
• KSDI Geo Portal is upgraded using Erdas Apollo 2016 webserver with new features
• KSDI collected data from 20 departments with more than 400 layers in various file formats and after quality checking , uploaded 59 seamless layers.
• Presently, KSDI has more than 300 beneficiaries including users from 39 Government Departments.
Government of Kerala was assigned as the State registrar for Aadhaar enrolment by UIDAI. Electronics and IT Department of Kerala was approved as the nodal Department and KSITM was approved as the nodal agency for
Aadhaar enrolment in the State. Akshaya Project under KSITM acts as the Enrolment agency and conducts Aadhaar enrolment through the Akshaya Centres. In addition, UIDAI has approved KSITM as the Authentication User Agency and e-KYC User Agency. Aadhaar based services like Digilocker are also being rolled out to departments. At present, there are about 900 Permanent Enrolment Centres, 500 Child Enrolment Centres and 1,450 Update Centres by Akshaya CSCs to facilitate Aadhaar Enrolment and changes to details in Aadhaar.
A State Level Workshop on DigiLocker was conducted by Kerala State IT Mission with the support of National e-Governance Divison, (NeGD) of Ministry of Electronics and Information Technology MeitY for “Achieving Paperless Governance and Rapid Implementation of DigiLocker”. DigiLocker service is currently integrated in Kerala with the following Departmental e-governance initiatives:
• Revenue Department (e-District project – revenue certificates).
• Food and Civil Supplies Department – Ration Card
• Pareeksha Bhavan – SSLC• Labour Department for CHIAK – Health
Insurance Card• Higher Secondary Education – Plus two
certificate• Motor Vehicle Department – Driving
Licence and Vehicle Registration• Registration Department – Land Deed• Directorate of Vocational Higher Secondary
Education • Scheduled Tribe Development Department• National Employment Service• Animal Husbandry Department
AWARDS and ACCOLADES
• SKOCH Award 2019: Order of Merit for the year 2019 for its prestigious e- procurement project.
• SKOCH Award 2018: Order of Merit was conferred to KSITM for its key e-

196 Economic Review 2019, Kerala State Planning Board
governance projects like Akshaya, CERT-K and KSDI
• Digital India Awards 2019: The award was conferred to Kerala for the set of exemplary initiatives carried out in the State for providing a comprehensive web and mobile based services seamlessly to its citizens.
• Tech Sabha Award 2019: For co-coordinating flood damage assessment survey process in Kerala.
• Governance Now Digital Transformation Awards 2019: This award was conferred to KSITM for the projects K- Fi- Digital Infra, Kerala State Portal and m-Keralam mobile app, centralised procurement rate contract system- Kerala.
Indian Institute of Information Technology and Management – Kerala (IIITM-K)
The Indian Institute of Information Technology and Management – Kerala was set up in 2000 as a premier institution of excellence in Science, Technology and Management. It emphasises quality education to students and develops professionals and leaders of high calibre imbued with values of entrepreneurship, ethics and social responsibility. The institute focuses on education, research, development and training in basic and applied information technology and management. The Academic Programmes of the institute are given in Box 5.1.1.
There are four specialised Post Graduate Programmes (M.Sc.) being offered by the Institute in Computer Science with specialisation in Cyber
Security, Machine Intelligence, Data Analytics, and Geospatial Analytics. Along with the above four specialised courses, the Institute also offers M.Phil Ecological Informatics, M.Phil Computer Science and PG Diploma in E-Governance. The M.Phil and MSc degree are awarded by Cochin University of Science and Technology (CUSAT) and post graduate diploma by Directorate of Technical Education, GoK.
Placement Records
The Pass outs from IIITM-K hold commendable positions in internationally reputed IT companies such as JFWTC-General Electric, Accenture, Amdocs, Siemens Ernst and Young, ARS Software, Allianz Cornhill, IBM, IBS, Infosys, Tata Elxsi, Tata Consultancy Services, UST Global Technology, and Wipro.
Research and Development
IIITM-K is also involved in Research and Development in the following areas:
• Theoretical Computer Science• Machine Intelligence• Medical Image Computing• Information Security• Computational Linguistics• Computational Sciences and High
Performance Computing• GIS and Remote Sensing• Information Systems, Services and
Management• Networks, Grid and Cloud Computing
Box 5.1.1 Academic programmes of IIITM-K
• Masters Programme• M-Phil Programme• Phd Programme• Post graduate Diploma Programme

197Chapter 5, Service Sector
• Educational Technologies• E-Governance• Ecological Informatics
IIITM-K Campus
The new campus of the Institute at Technocity is in completion phase and shall facilitate and promote studies, research and incubation in Information Technology and its application domains. The fully completed campus would have total built up area of 48,161 sq metre. 95 per cent of works in Academic block and hostel building are completed. It is expected that the functioning of IIITM-K will shift from Technopark to new campus in 2020.
Technopark
Technopark was set up as an autonomous organisation fully owned by Government of Kerala to create global standard infrastructure and to provide total support required for development of high technology industries. It was formally dedicated to the Nation on November 18, 1995. Since then Technopark has been growing steadily both in size and employees strength. With the commissioning of Phase III, Technopark will become the largest IT Park in
India with 380 acres of land, 9.7million sq.ft built up area. Technopark through its companies, currently provides direct employment to 60,000 IT employees and offers an indirect employment for another 1,50,000 persons. With the launch of Technocity project in Kazhakuttam, the largest integrated IT Township in 424 acres of land, the Kazhakuttam-Kovalam (NH 66) has become the first IT Corridor in Kerala. Technopark has charted out an ambitious target of creating 50,000 new jobs by 2021. Technopark’s Contribution to the State Economy is shown in Table 5.1.2. Details of growth and physical achievements of Technopark are given in Appendix 5.1.2 and 5.1.3 respectively.
Land available with Technopark
Technopark has 5 campuses which is spread over 770 acres under various phases of development. The details of extent of land in its 5 campuses are shown in Table 5.1.3.
Growth of Built up Space in Technopark
Technopark currently owns 20 IT buildings within the campus. The built up space in the Technopark has increased from 72 lakh sq feet
Table 5.1.2 Technopark’s contribution to the State economy
ParticularsAchievements2016-17
Achievements2017-18
Achievements2018-19
Total turnover (₹crore.) 12000 14000 14000Total export (₹crore) 5000 6452 7000Total investment (₹crore) 4970 4970 4979Total Employment (Nos) 52,746 56,000 60,000No of Companies ( Nos) 370 400 410Total land (Acres) 760 760 770.2Total built up space (Lakh sq.ft). 93 97 97
Source: Technopark
Table 5.1.3 Land available with Technopark
Phases Phase I Phase II Phase III Technocity Technopark, Kollam
Area, in acres 199.6 86 90.1
424.0 (Of which 34 acres marked as non- processing area) 4.4
Source: Technopark

198 Economic Review 2019, Kerala State Planning Board
in 2015-16 to 97 lakh sq. ft in 2018-19. Out of which Technopark has created 32.8 lakh sq.ft area for industrial modules and total built up space completed by companies is 64.2 lakh sq.ft. The growth of built up space in the Technopark is shown in Figure 5.1.1.
Companies in Technopark
There has been an increase in the number of the companies working in Technopark during the last
5 years. In 2014-15, there were 355 companies in Technopark. It increased to 410 in 2018-19 and remains the same as on August 31, 2019. The number of companies in Technopark from 2014-15 to 2018-19 is shown in Figure 5.1.2 .
Growth in Export from Technopark
Export from Technopark increased from ₹5,100 crore in 2014-15 to ₹6,450 crore in 2017-18. In 2018-19, it increased to ₹7,000 crore which is
Figure 5.1.1 Growth of built-up space in Technopark
Source: Technopark
Figure 5.1.2 Number of companies in Technopark
Source: Technopark

199Chapter 5, Service Sector
8.5 per cent increase over the previous year. The trend in export from Technopark during the last five years is depicted in Figure 5.1.3.
Growth of Employment in Technopark
The growth of Technopark can also be analysed in terms of employment generated during the last five years. The employment generated increased from 47,100 in 2014-15 to 60,000 in 2018-19 and
it remains the same as on August 31, 2019. The growth of employment generation for the last five years is shown in Figure 5.1.4.
In Technopark Phase III, Embassy Taurus project construction started and is in full swing. It envisages to create a world-class business infrastructure in Technopark with a total investment of ₹1,500 crore in two phases. On completion, Taurus downtown is expected to
Figure 5.1.3 Export from Technopark
Source: Technopark
Figure 5.1.4 Growth of employment
Source: Technopark

200 Economic Review 2019, Kerala State Planning Board
generate 35,000 direct employment and about 75,000 indirect employment.
Technocity
Technopark has acquired 424 acres of land at Pallipuram for its Technocity project. Work on basic infrastructure has commenced and land allotted to TCS, Nissan, Suntech, KASE and IIITM - K.
Future plans in Technocity
• Construction of 2 million sq. ft. building by Technopark is in full swing and is expected to be completed by the end of 2019.
• TCS has planned to build a 8 million sq. ft world class training centre having training facility for 16,000 trainees by investing around ₹3,600 crores in the 97 acres.
• Suntech has also started construction of 1 million sq. ft IT building with an investment of ₹300 crores expecting to provide employment to 2500 people.
• IIITM-K has started their initial building consisting of management building and hostel in their 10 acre of land.
Awards and Accolades
• Technopark had won the Kerala State Renewable Energy Award 2018 in the category of Public Institutions for the installation of Solar Power Plant at rooftop of Phase III IT building (Ganga-Yamuna towers). It is the largest Roof Top Solar in any IT Building in Kerala.
• Ganga-Yamuna twin tower IT building at Phase III has been awarded “IGBC’s LEED India Gold Rating”.
• Technopark was awarded “Certificate of Excellence”- Vajra 2017 for the overall performance in Labour Relations and
Compliance from Department of Labour and Skills, Government of Kerala on October 15, 2018.
Infopark
Infopark, Kochi is the second largest IT hub in Kerala with spokes at Cherthala and Thrissur. The objective of Infopark is creation of state-of-the-art infrastructure facilities such as space for IT/ITeS companies, supply of power, water and connectivity. Since its inception in 2004, Infopark and its co-developers created over 80 lakhs sq.ft. built up space and have provided employment to over 40,000 IT Professionals through 392 IT companies who have taken space in its Parks.
Land available with Infopark
Infopark has 5 campuses which is spread over 323 acres under various phases of development. The details of extent of land in its 5 campuses are shown in Table 5.1.4. In case of Infopark TBC, a built up partly fitted space of 25,845 sq.ft at Kaloor international Stadium was taken over from KSITM in the year 2013. Infopark undertook necessary balance fit outs, modifications/rectifications in the fitted out space and now the facility is mainly used for providing office space for startup companies. The physical achievements of Infopark are furnished in Appendix 5.1.4.
Cyberpark Cyberpark was established in the lines of Technopark in Trivandrum and Infopark in Kochi based on a hub and spoke model. It was set up to bridge the IT infrastructure gap along the west coast starting from Kochi to Kasaragod. The objective of Cyberpark is to provide cost effective and top of the line infrastructure to
Table 5.1.4 Land available with InfoparkPhases Phase I Phase II Thrissur Cherthala TBC, Kaloor
Area, in acres 100.86 125 30 66 25,845 sq.ft of built up space under the lease of KSITM owned by GCDA
Source: Technopark

201Chapter 5, Service Sector
the IT/ITeS investors and thereby encouraging, promoting and boosting the export of software/software services and creating employment opportunities in Malabar region. It is the responsibility of Cyberpark to interface between Government and Industry interact with potential investors, strengthening the IT/ ITes base, holding promotional campaigns, developing human resources fot IT and ITeS. Kerla State IT Infrastructure Limited (KSITIL) holds the ownership of the entire area of 43 acres of land at Kozhikode Cyberpark. The major achievements of Cyber Park are shown below.
• First IT Building “Sahya”(2.88 lakh sq. ft.) completed and started operation. Spaces have been allotted for 23 companies.
• Total investment of ₹3.12 crore with a total turnover of ₹16.78 crore including exports worth ₹14.95 crore.
• Twenty three companies started operation in SEZ and created around 560 direct employments.
• Cyber park in association with Internet and Mobile Association of India (IAMAI) established app incubation hub, first of its kind in Kerala.
• Twenty four Start up companies operational in Cyber Park and thereby created 127 number of IT employments.
The physical achievements of Cyberpark are given in Appendix 5.1.5.
Kerala State IT Infrastructure Ltd (KSITIL)
KSITIL is a public limited company formed for the creation of the infrastructure for IT/ITeS in the State. The company leverages the valuable land assets owned by the Government and through viable financial models, generates funds for building the IT Infrastructure in the State in a Private Public Participation model.
The business model of the company is to acquire land and develop basic infrastructure facilities like electricity, water, road and compound wall
in the area, obtain SEZ status and other such Government approvals that may be required and then allot land to private developers for development of either IT SEZ or IT parks. Some of the highlighted projects of KSITIL are as follows:
1. Skill Delivery Project, Kerala: SDPK is a prestigious project assigned to KSITIL by Government of Kerala. The objective of the project is to bridge the gap between students and industry. SDPK consists of a virtual platform with teleconferencing system being installed in all the 150 engineering colleges and 3 studios, which are being setup as part of the project. As part of the project GoK is setting up Hi-Tech classroom with a minimum seating capacity of 60 students.
2. Kerala Fibre Optic Network (KFON): KFON, a State-wide optical fibre network capable of providing Hi-speed connec tivity to all Government and educational institutions, offer free internet to 20 lakh economically backward families and subsidised internet for others by leveraging KFON Infrastructure. It shall act as the perfect platform for the State to pioneer in IoT and other emerging technologies like artificial intelligence, and block chain and give impetus to innovation and entrepreneurship.
International Centre for Free and Open Source Software (ICFOSS)
Government of Kerala established ICFOSS as an international centre in collaboration with Free Software Organisations in India and abroad to promote development and application of free software and free knowledge. It is a nodal agency in all matters relating to free and open source software including consultancy, research and development, academics, studies and service, training, publishing, certification, international co-operation and collaboration. ICFOSS has carried out so many FOSS-based Training programmes, Workshops, Seminars, Research Programmes, Projects, Malayalam

202 Economic Review 2019, Kerala State Planning Board
Computing activities, Student Internships and projects, Summer Camps, Faculty Development Programmes, and Fellowship programmes. The major achievements of ICFOSS in 2018-19 are the following:
• 20 faculty development programmes for teachers, 25 student training programmes, 6 training programmes for Professionals and SMEs, 10 Scilab training programmes, Student project works, Internships, and Fellowship programmes are conducted.
• Launched Assistive Technology products such as T- Slide Mouse, Flip-Mouse and on- Screen Malayalam Keyboard
• FOSS cell co-ordinators meet up has been conducted and 45 co-ordinators attended.
• Training to Government Employees on FOSS Solutions and Malayalam Computing in 62 batches and 1700 employees participated.
Kerala Startup Mission (KSUM)
Kerala Startup Mission (KSUM) is the nodal agency of Government of Kerala for implementing the entrepreneurship development and incubation activities in the State. Kerala Start up Mission, formerly known as ‘Technopark Technology Business Incubator’ is India’s first successful non academic business incubator. It started operations in 2007.
The objective of the Mission is to identify and develop entrepreneurial talents among youth and students in Kerala, address the technology based entrepreneurship development requirements in the traditional sectors of Kerala, build appropriate training programmes suitable for Kerala’s socio-economic culture, identify market niche for technology products and services, interfacing and networking among academic, R and D institutions, industries and financial institutions, establishing a platform for speedy commercialisation of the technologies developed in the institutes to reach the end-users.
Under the banner of KSUM and several of its sector-specific partner organisations, there are
presently more than 2,200 registered start-ups, more than 3.2 lakh sq.ft. of incubation space, more than 230 Innovation and Entrepreneurship Development Cells (IEDC), all of which are evenly distributed across various districts and cities such as Kochi, Trivandrum and Calicut. Many of these facilities also house advanced labs that focus on sectors such as hardware, biotechnology, electronics and advanced computing. KSUM Achievements-2019
• Kerala ranked as the top performing State in DPIIT’s State Startup ranking.
• Home to one of India’s largest innovation hub of 1.8 lakh sq.ft - the Integrated Startup Complex
• Established centers of excellence in AR/VR with global tech giant Unity
• Established the BRINC Hardware Accelerator
• Established XR Accelerator in collaboration with Unity
• Incubation infrastructure for niche sectors such as cancer research, spacetech, biotech
• Established Space Technology Application Development Ecosystem (STADE)
• Establishing Super Fab Lab at Kochi• Conducted 32 fab workshops imparting
digital fabrication expertise to more than 250 participants.
• 47 funded Startups in the State, out of which 13 are funded in 2019.
• 316 start ups build through IEDCs.• More than 40 incubators in the State.• More than 4 accelerators in the State.• 1.8 lakh sq ft space to startups in Integrated
Startup Complex, Kochi• 13 per cent Women Startups in Kerala• 30 Women Startups registered with
KSUM
Awards and Recognition
• Ranked World’s No 1 Public Business Accelerators by UBI World Rankings
• Awarded “TOP PERFORMER” State in State wise ranking by Startup India 2018

203Chapter 5, Service Sector
• SKOCH Award for Top Women Entrepreneurship Support
• SKOCH Award for Top Ranking Digital Economy Projects in India in 2018.
• Chief Minister’s award for best policy implementation - 2018
• M/s Agrima received best incubatee award by ISBA in 2018. The company has also rated as the top most wanted apps by Google.
• M/s Buildnext received best graduated Startup award by ISBA in 2019
• M/s Genrobotics selected in Top 50 Startups emerging Startup by IIT Mumbai.
Centre for Development of Imaging Technology (C-DIT)
C-DIT has been functioning as an Information and Communication Technologies (ICT) solutions provider in the Government sector. The major programmes undertaken by C-DIT are:
• Reorganisation of Chief Minister’s Public Grievance Redressal system and Distress Relief Fund assistance mechanism into an integrated online portal www.cmo.kerala.gov.in
• Design and development of software for conducting online examination and on screen evaluation of written answer sheets for Kerala Public Service Commission
• Digitisation of old manuscripts and documents for State Archives and Registration departments
• Design, hosting and maintenance of over 200 Government websites and social media platforms MIS/ERP systems for various Government departments
• In the wake of the recent flood disaster in the State, C-DIT maintains the online fund collection portal for State Government which is developed and deployed last year during flood disaster in the State.
Way Forward
To stay competitive as an IT destination, the IT sector in Kerala must significantly enhance the value addition it brings to the State economy. It must attract investment in emerging areas in the IT sector and not rely solely on established IT/ITES activities. As the Indian IT sector as a whole grapples with issues of the changing focus and emerging issues within the global IT sector, Kerala must also keep pace with these changes. At the same time, the considerable advances that have been made in the digital empowerment of the population and the spread of IT awareness and use must continue to be built upon and developed with further investment in appropriate infrastructure that will continue to serve the State’s needs over a period of time and not risk early obsolescence.
Though information technology infrastructure sector has achieved a remarkable progress in the State in the hub and spoke model, a proper unified mechanism has to be evolved for the integration of the sector. The State also lags behind in creating research and development infrastructure for establishing a knowledge economy. ICT enabled education, research and development and innovations in the sector needs to be identified and promoted to strengthen the State economy. Moreover, the thrust of Government in infrastructure development, human resource development and overall economic development will open up large opportunities for the meaningful use of Information Technology. Physical connectivity of the State with major cities in India and abroad has to be improved. Kerala has a strong infrastructure and human resource strength to adopt digital facilities. We need to leap forward attracting substantial investment in IT sector and identify and promote young entrepreneurs through Startups.

204 Economic Review 2019, Kerala State Planning Board
5.2 Scientific Services and Research
India is one amongst the top ranking countries in basic research and science. The Department of Science and Technology (DST), GoI is the nodal department to promote new areas of science and technology (S&T) and to strengthen national capacity in science, technology and innovation in the country. The department provides research and development support to scientists of various institutions and disciplines to strengthen national S&T capacity and capability through a competitive mode to scientists. It also supports implementation of several planned initiatives focused on enabling the Indian S&T community for increasing its scientific and technological outputs in term of quality and quantity.
The Department of Science and Technology, GoK plays the key role in promotion of science and technology in the State. The department helps to identify and implement programmes to achieve excellence in Science and Technology and to provide service to the society at large. The State of Kerala has been a pioneer in State-level efforts to promote science and technology, alongside the role of the Central Government.
The mission of the State’s Department of Science and Technology includes capacity building within the academic and research institutions in the State, carry out research and development through R&D centres, identification and facilitation of projects and programmes in the biotechnology sector, conservation and sustainable use of biological resources, augmentation of laboratory and scientific
infrastructure in educational institutions and research centres, nurturing young talents and promoting them to take up projects, activities, research and development in the field of science and technology, promoting innovation at the grass root level and development of rural technology for the benefit of the masses, development of incubator for translational research, technology transfer and pilot scale development of industrial application and high priority areas of research, conservation, protection and management of physical environment and ecosystems, through R&D and management action plan. Various schemes and programmes implemented in the sector contribute in benefiting researchers in enhancing their capabilities to improve the quality of research output and motivating talented youth to higher academics and research in science.
The development of science and technology in the State faces important challenges despite the high levels of educational achievement, and the general awareness among the population on the importance of science. One significant challenge is the rapid improvement of the quality of science education and scientific research in the State. Despite important achievements by scientists in Kerala in the institutions located in the State, much can still be done. Second, there is significant scope to enhance the quality of scientific institutions in the State such that these institutions become the institutions of choice for study and research for young scientists from all over the country. There is a pressing

205Chapter 5, Service Sector
need to develop centres of excellence in various disciplines in the State. In this respect, close collaboration between the Central Government scientific and educational institutions and the State-run institutions can be beneficial and mutually supportive. Third, while an important focus of the State-level investment in science and technology is to do with promoting income enhancing and employment generating activities in the State and provide S&T support to the State’s development, it is also important to develop the general excitement and inspiration of cutting edge science in the State-run institutions, not all of which may have an immediate development-oriented motivation. Fourth, there is an increasingly pressing need to provide appropriate scientific and technological advice and support to environment related issues in which there is considerable interest and concern in the State. In the absence of balanced scientific advice and inputs, decision making in this area will be guided by subjective criteria that can cause considerable difficulties for the development agenda of the State. The quantum and quality of scientific research in this area has ample room to develop to respond adequately to the level of environmental concern
and awareness in the public sphere in Kerala. Fifth, developing closer collaboration between work in science and technology and the efforts in innovation and startups could provide important economic benefits.
The two major institutions in the Science and Technology sector in the State are the Kerala State Council for Science, Technology and Environment (KSCSTE) and the Regional Cancer Centre (RCC), Thiruvananthapuram.
I. Kerala State Council for Science, Technology and Environment (KSCSTE)
KSCSTE is an autonomous body under the Department of Science and Technology, GoK. It is governed by the State Council (SC) with the Chief Minister of Kerala as the President and an Executive Council (EC), chaired by the Executive Vice President of KSCSTE. Presently, there are seven full-fledged Research and Development (R&D) centres, two emerging research centres and three grant-in-aid institutions under the umbrella of KSCSTE.
Box 5.2.1 Institute of Advanced Virology
The Institute of Advanced Virology established in 2019 in the Bio 360 Life Sciences Park, Thonnakkal, Thiruvananthapuram by the GoK Plan is envisioned as an institute of global standards networking Global Virology Institutes with most modern laboratories focusing research, diagnosis and management of emerging and re-emerging infectious viral diseases. Its vision is to harness the best and eliminate the worst of viruses for a better human life and to work as a centre of excellence in collaboration with international institutions for training and education in the context of research covering basic science and translational research, providing sufficient scientific inputs to enable the prevention and control of viral infections. Its mission is to develop state-of-the-art infrastructure, skilled scientific and technical personnel, and services and products in virology to serve local, national and global needs. The institute with a total project cost of ₹202.00 crore is aimed to work for industrial transfer/facilitation of technology and Kerala State Industrial Development Corporation will be a partner in providing land and infrastructure. The construction of campus at Thonnakkal, Thiruvananthapuram, spread over 25 acres of land is in two phases, Phase I and Phase II consisting of Phase 1 A Prefab building (25,000 sq.ft.) of 2 floors housing Administrative block, Bio labs, Common Instrumentation room, Bio-safety level facilities and Diagnostic facilities and Phase IB main building (78,000 sq.ft.) of 3 floors with Administrative block, Bio labs, Bio safety level facilities and functional division. As on September 30, 2019, civil construction of Phase I A building has been completed and Phase I B is in progress.
206 Economic Review 2019, Kerala State Planning Board
The main objective of KSCSTE is to plan and formulate science, technology and innovation policy pertaining to the development of the State. The council promotes and activates programmes for increasing the stock of knowledge in science, and fine tunes policies which are significant and for the sustained development of humanity. The council prepares the road map for development through scientific research and innovation in technologies.
(A) Schemes and Programmes of KSCSTE
The schemes and programmes of the Council are aimed at the development of high quality science education system in the State. With a view to identify and implement programmes to achieve excellence in S&T within the state and to provide service to the society at large, the Council is implementing various schemes and programmes focusing science popularisation and promotion, research and development, ecology and environment, technology development and transfer, biotechnology development, school level promotional activities and science programmes for women.
Achievements of Schemes and Programmes of KSCSTE
1.Human Resource Development in Science and Technology Science Research Scheme (SRS)
It is one of the flagship activities of the Council operating under the Science and Technology Promotion Division (STDP) of the Council. SRS aims towards the promotion of R&D activities in the State both in fundamental and applied research. Under the scheme, research projects in emerging areas of science and engineering are supported by providing financial assistance for implementation. Research projects are supported in University departments, colleges and R&D institutions. In 2018-19, 11 new projects were granted, and 6 patents filed, 247 papers in refereed journals and 271 papers in conference/seminars were published from supported
projects under this programme. Also 31 PhDs were awarded and 75 persons were trained and 22 best paper/poster awards were given in conferences under SRS.
KSCSTE Emeritus Scientist Scheme
The objective of the scheme is to tap knowledge and to provide support to superannuated outstanding scientists to pursue research in their respective field of specialisation and to utilise their talent and experience in addressing important issues at the State level. In 2018-19, 8 candidates were selected for the scheme, 17 conference/seminars were conducted, 9 papers were published in refereed journals from supported projects under the programme and one PhD was awarded. In 2019-20(up to September), 9 papers were published in refereed journals, 17conference/seminars were conducted and one Ph.D. was awarded under the programme.
Student Project
Under this project, financial support is given to the students of University departments and colleges in the State to conduct scientific projects and in 2018-19, 213 M.Sc./M.Tech projects were sanctioned in subjects like Pharmaceutics, Ayurveda, Physics, Chemistry and Geology.
Scheme for Promotion of Young Talents in Science (SPYTis)
The programme is for giving awards for the students of Class VIII-IX for doing a science project (SPYTisI) and for giving financial assistance to those students who have innovative ideas in science and technology and enrolled in polytechnic colleges and undergraduate courses in colleges for conducting projects (SPYTisII). In the year 2018-19, financial assistance was sanctioned to 176 degree/school level projects based on themes such as organic farming, lifestyle diseases, water pollution and environment conservation.

207Chapter 5, Service Sector
Crafting Young Scientists for Tomorrow (CRYSTAL) CRYSTAL is the programme to identify students’ talents in science at an early nurturing them and the target group is state level winners of National Science Congress. In 2018-19, training was provided to 30 students at different R&D institutions of the State.
KSCSTE Research Fellowships
In 2018-19, 18 PhDs were awarded under the programme and number of publications is 60. In 2019-20 (as on September 30, 2019), there were 24 publications and 1 Ph.D was awarded.
KSCSTE Post-Doctoral Fellowship
With the objective of attracting doctorate holders to remain in Science and Technology, to motivate PhD holders to pursue research and to develop career as scientists, to motivate fellowship recipients and impart the skills needed for them to become lifelong learners and to develop technical and leadership skills, KSCSTE gives Post-Doctoral fellowships. 8 candidates were selected for Post-Doctoral Fellowship, 9 papers in refereed journals, 17 papers in Conference/Seminars were published under the programme in 2018-19 and one Ph.D was awarded. As on September 30, 2019, the number of papers published is 15 in refereed journals and 19 in Conference/Seminars.
2. Infrastructure Development in S&T
In order to provide sufficient infrastructure facilities in universities, colleges and schools for the promotion of scientific activities and augmenting research, the Council has been providing financial assistance for the creation of lab and related facilities in the institutions. Selective Augmentation of Research and Development (SARD) and Sastraposhini are the two schemes implemented by the Council for this purpose. SARD is envisaged to create facilities in colleges and Universities for augmenting research
in specified areas. Under this programme, grants will be paid for strengthening the laboratory infrastructure by procuring equipments and also for its maintenance. So far, 62 science post graduate laboratories and research institutions in the State have been augmented. 31 papers were published under this programme. Sastraposhini scheme aims to establish model science laboratories in physics, chemistry and biology to create a better ambience in high schools. In 2018-19, 12 schools were selected for implementing this scheme.
3.Technology Development & Transfer
Engineering and Technology Programmes (ETP)
ETP intends to encourage and promote research talents for the implementation of high quality research projects in the emerging areas of Engineering and Technology. The scheme is instituted for the faculty of engineering colleges and scientists of R&D institutions in the State. In 2018-19, 4 projects were sanctioned under the programme.
Rural Technology Programme (RTP)
RTP scheme is instituted for the purpose of providing assistance in the form of grants to promote and support the traditional rural technology and upgrade them, so that it could be perfected for wider applications and employment generations and to reduce the drudgery of the rural households. The main objectives of this scheme are to encourage and promote grass root innovators and individuals to support them so as to perfect their innovative ideas in rural technology sector and provide technical support to raise their innovations to an enterprise level. In 2018-19, one project was supported under the programme.
Biotechnology Development
The various programmes taken up for promoting biotechnology development include Young

208 Economic Review 2019, Kerala State Planning Board
Investors Programme in Biotechnology, Industry Linked Biotechnology Research Scheme, Biotechnology Innovations for Rural Development, Biotechnology Training and Workshop Programme, Post-Doctoral Fellowship, Biotechnology Young Entrepreneur Award, Kerala Biotechnology Re-entry Fellowships and Biotechnology Education Programme. In 2018-19, 17 papers were published in peer reviewed journals under this programme and number of book chapters is 4, presentations in national/international conferences is 7 and number of awards is 2.
4.Ecology and Environmental Programmes
Programmes on ecology and environment focus on environmental conservation, pollution mitigation and awareness creation. In 2018-19, 4 papers were published, one Ph.D was awarded and environment management training was given to 18 institutions under various ecology and environment programmes.
5. Support for Women in Science
In Kerala, though the State has the highest women literates, their representation in science research is very low. In order to provide a support system to attract and retain women and girls in science and encourage them to take up science as a career, the women scientists division at KSCSTE has initiated several schemes and programmes to increase their participation in science, technology, engineering, agriculture and medicine. These programmes facilitated re-entry of women having career break. The important programmes carried out by the Council in this area are as follows.
1. Back to Lab Research Fellowship Programme – 11 back to lab projects were sanctioned under the programme in 2018-19 of which 7 were post-doctoral fellowships and 4 were research fellowship projects. The total number of research publication from the supported projects was 48 and number of Ph.Ds. was 8.
2. Awareness Programme on “Technological advances in transforming women’s lives”- 7 programmes were sanctioned under the project and about 600 to 700 women participants had benefited from the programme on technological advances in sectors such as energy management in household, food and nutrition, soil and water conservation, organic farming etc.
3. Project on Preparation of database of ‘Women in Science in Kerala’ – 2,918 registrations (as on March 30, 2018) were made in the online directory which is developed for obtaining base-line data on the status of women in various sectors of Science in the State.
STARS (Students with Talent and Aptitude for Research in Science)
1. Prathibha Scholarship Scheme – New online portal for receiving application for the scholarship has been launched and 100 students were selected for the scholarship.
2. SPEED (Student Programme for Excellence in Experimental Design) – In 2018-19, a five day residential science camp for Prathibha scholars was organised at Indian Institute of Science Education Research (IISER).
6. Science Popularisation
Kerala Young Scientists Awards were given to three scientists in 2018-19.
(B) R&D centres under KSCSTE
The KSCSTE also drives the research and development efforts of the R&D Centres and offers assistance for the creation of physical infrastructure and procurement of scientific infrastructure through development and selective augmentation of R&D activities. There are seven R&D centres under the Council which conducts research and development activities in specific mandated domains. They
209Chapter 5, Service Sector
are: Kerala Forest Research Institute (KFRI), National Transportation Planning and Research Centre (NATPAC), Centre for Water Resources Development and Management (CWRDM), Jawaharlal Nehru Tropical Botanic Garden and Research Institute (JNTBGRI), Kerala School of Mathematics (KSoM), Srinivasa Ramanujan Institute for Basic Sciences (SRIBS) and Malabar Botanical Garden and Institute for Plant Sciences (MBGIPS).
Kerala Forest Research Institute (KFRI)
KFRI is envisioned as a centre of excellence in tropical forestry to provide scientific support for decision making on matters related to forestry, with particular emphasis on conservation, sustainable utilisation and scientific management of natural resources. Working in collaboration with the forest department and other stakeholders, the institute continues to play a key role in improving the science foundation of forest management.
Achievements
• Conducted historical review of ecological and development trajectory of various sectors in high ranges of southern western ghats.
• Restoration and reassessment of selected IUCN listed endangered trees in western ghats
• Published 3 research papers and conducted 5 trainings
National Transportation Planning and Research Centre (NATPAC)
NATPAC undertakes research and consultancy works in the fields of traffic engineering and transportation planning, highway engineering, public transport system, alternate options for transport system, transport energy, inland water transport, tourism planning and rural roads. It is the only R&D centre in the country which works on all modes of transport. The activities of NATPAC range from surveying to preparation
of techno economic studies, feasibility analysis, detailed project reports for infrastructure development projects involving multi-modal system of transportation covering road, rail, water, ports/harbours and airports.
Achievements
• Carried out 25 research projects and 15 externally funded projects.
• Developed a traffic growth rate model for national highways in the State.
• Conducted study on the impact of duration of flooding on different layers of flexible pavements of flood prone roads in Kerala.
• Prepared regional transportation development plan for various Districts in the State.
• Conducted study on the effect of vehicle type in the saturation flow at signalised intersections.
• Devised a system for emergency vehicle priority for the operation of ambulances.
• Prepared reports on investigation of major accident spots, causative analysis and mitigation measures.
• Completed study on failure of roads in Kuttanad region.
Centre for Water Resources Development and Management (CWRDM)
CWRDM is a premier R&D institution in the water sector under KSCSTE. It provides research inputs for water resources development and management, especially in the humid tropic areas and has expertise in tackling different problems pertaining to watershed development, wetland management, water management for agriculture, forest and urban hydrology, estuarine management, groundwater development, water quality management, water related environmental issues and irrigation and drainage issues. Presently, CWRDM has 9 scientific divisions and 3 sub-centres.

210 Economic Review 2019, Kerala State Planning Board
Achievements
• Completed study on analysis of climatic parameters in Kozhikode.
• Identified community based water supply schemes in different local bodies with the objective of evaluation of impact of such schemes in the State.
• Initiated steps for developing an integrated management plan for use of ecosystem service in the Kuttanad region.
• Developed regional flood frequency model using L moments with the purpose of regionalising the river basins of the State and developing flood frequency relations for each region.
Jawaharlal Nehru Tropical Botanic Garden and Research Institute (JNTBGRI)
JNTBGRI undertakes research programmes for the sustainable utilisation of resources. The institute is currently conserving more than 4000 species of flowering plants and about 300 species of non-flowering angiosperms, which is the highest number of plant species conserved among the botanic gardens in Asia. The institute has an extension centre viz., Saraswathy Thangavelu Centre at Puthenthope, Thiruvananthapuram where the Bioinformatics Centre is established. The GoI has recognised the JNTBGRI as a national centre of excellence.
Achievements
• Competed Ethno botanical survey in the coastal areas of selected Panchayats in Thrissur for the systematic documentation of ethno-medico botanically important plant species used for food and medicine by different tribal communities in the District.
• Community Agro Biotech Resource Centre of JNTBGRI conducted training programme for 300 rural women on medicinal plant cultivation and production of value added products from locally available plant resources with the objective of
disseminating appropriate technologies to rural population for economic upliftment and income generation.
• Identified 3 new species from Western Ghats as part of survey, exploration and documentation of floristic wealth of the State.
• Selected 10 medicinal plants based on traditional information for validation of anti-dengue virus activities and identified nine small molecules of drug value against dengue virus.
• Published 7 journal articles and 2 book chapters filed 1 patent and produced 1 Ph.D.
Kerala School of Mathematics (KSoM)
KSoM was established in 2009 as a joint venture between KSCSTE, GoK and Department of Atomic Energy (DAE), GoI for carrying out advanced learning and research in Mathematics. In 2018-19, KSoM imparted training to Maths Olympiads and maths talent search, organised summer/refresher trainings and orientation programmes to college teachers and conducted national/international workshops and seminars.
Srinivasa Ramanujan Institute for Basic Sciences (SRIBS)
SRIBS is a capacity building institute envisaged for research, teaching and learning in basic sciences. The main objective of the institute is to formulate and implement programmes for capacity building of young faculty members, researchers and post graduate students in contemporary areas of sciences. The institute has organised colloquia, seminars, workshops benefitting students, teachers and researchers in various areas of science. 5 academic programmes were conducted in 2018-19 in which there were about 50 participants across the State.
Malabar Botanical Garden and Institute of Plant Sciences (MBGIPS)
MBGIPS is an institution of KSCSTE dedicated to the conservation and research on aquatic

211Chapter 5, Service Sector
plant diversity, lower group plants, endangered plants of the erstwhile Malabar Region, as well as disseminating knowledge on various facets of plant sciences. In 2018-19, steps were initiated for establishing aquatic bio park in MBGIPS and as part of digitisation of plant database of MBGIPS, 1632 entries were recorded in the plants database.
II. Regional Cancer Centre (RCC), Thiruvananthapuram
Globally, about 1 in 6 deaths is due to cancer and the disease was responsible for about 96 lakh deaths in 2018. Approximately, 70 per cent of the deaths from cancer occur in low and middle income countries. Tobacco use is the most important risk factor of the disease and is responsible for about 22 per cent of cancer death.
In India, estimated number of people living with cancer disease is around 22.7 lakh and total number of deaths in the country in 2018 was 7.84 lakh, of which 4.13 lakh were men and 3.71 lakh were women. Oral cancer is the most common cancer in the country among men which accounts for 16 per cent of all cancers and breast cancer is the most common type affect women that accounts for 14 per cent of all cancers as 1 in 28 women is likely to develop breast cancer during her lifetime.
In Kerala, RCC, Thiruvananthapuram carries out innovative and pioneering work in cancer control, treatment, research and training. In 2018-19, a total number of 15,627 new cases and 2,58,838 review cases were registered in the centre. Of the new cases registered, 7,569 were male (48 per cent) and 8,058 were women (52 per cent).
RCC, Thiruvananthapuram is one of the top rated comprehensive cancer centres in the country offering diagnostic and treatment facilities for cancer. Its main objective is to undertake basic, applied and statistical research in various specialities of oncology. It undertakes basic, translational and clinical research and disseminates knowledge.
It is rated amongst the top three of the 28 RCCs in the country and maintains a working relationship with international bodies such as the WHO, International Agency for Research on Cancer (France), International Atomic Energy Agency (Vienna), National Cancer Institute (USA), Institute for Cancer Research (UK), University of Leeds (UK), Health Research Foundation (Japan) and a host of other reputed organisations.
Over the past thirty eight years, RCC has been able to contribute significantly to the increasing needs of cancer care of the people of the State of Kerala and adjoining areas of Tamil Nadu and
Box 5.2.2 Global strategy towards the elimination of cervical cancer as a public health problem, WHO 2019
• Cervical Cancer is the fourth most common cancer among women around the world. WHO strategy towards elimination of cervical cancer calls for a comprehensive, population based approach to put all countries on the path to the elimination of cervical cancer, covering the period 2020-2030.
• An approach that will enable countries to reach 2030 global targets for key interventions that in turn will lead to elimination of cervical cancer as a public health problem.
• Proposed targets : • 90 per cent of girls fully vaccinated with Human Papilloma Virus (HPV) vaccine by 15
years of age• 70 per cent of women are screened with a high-precision test at 35 and 45 years of age.• 90 per cent of women identified with cervical disease receive treatment and care
Source: World Health Organisation

212 Economic Review 2019, Kerala State Planning Board
Karnataka providing state-of-the-art diagnostic and treatment facilities at the lowest possible cost. In addition, RCC is committed to cancer control activities among the public, human resource generation in various specialities of oncology as well as cancer research expected to result in new treatments for cancer.
In addition to RCC, there are two other cancer centres, namely, Malabar Cancer Centre and Cochin Cancer Research Centre. The details of these two centres are covered in the Health section of this Review.
RCC-Profile
The vision of RCC is to emerge as a global leader in cancer control. In 2018-19, 15,627 new cases were registered in RCC and the number of daily average patient visit was 915. Table 5.2.1 provides the profile of the RCC in 2018-19.
Cases Registered in RCC
The details regarding cases registered in RCC during the last 10 years show that the number of new cases is increasing every year. The total number of registered cases during the period 2014-15 to 2018-19 is 80,356. In 2018-19, 15,627 new cases were registered which was 5 per cent lower than previous year. In 2017-18, the number was 16,443. New cases registered during the last 5 years are given in Table 5.2.2.
Out of the total 15,627 new cases registered in 2018-19, 13,487cases (86 per cent) were reported from within the State and rest of the numbers were from other states and outside the country. Out of 13,487 cases, more numbers were reported from Thiruvananthapuram and least number from Wayanad. Figure 5.2.1 represents number of new cases registered in the Districts of Kerala.
Table 5.2.1 Profile of RCC in 2018-19 at a glanceNew Cases Registered 15,627Review Cases Registered 2,58,838In-patient Admissions 11,568Radiotherapy 7,071Brachytherapy 1,766Surgical Procedures 5,756Endoscopic Procedures 2,969Chemotherapy Administered 11,939Bone Marrow Transplantations 37Cancer Detection Programmes 430Cancer Education Programmes 218Ongoing Research Projects 179
Source: Regional Cancer Centre, Thiruvananthapuram
Table5.2.2 New cases registered in RCC during the last 5 years from 2014-15 to 2018-19Year No. of new cases registered
2014-15 15,9892015-16 16,0422016-17 16,2552017-18 16,4432018-19 15,627Total 80,356
Source: Regional Cancer Centre, Thiruvananthapuram

213Chapter 5, Service Sector
Cases Registered in Speciality Clinics
The highest per cent of new cancer cases registered were Chest and Gastrointestinal clinics (3,763 cases) in 2018-19 followed by Gynaec, Genitourinary and Others (2,960 cases) and Head and neck speciality clinic (2,569 cases). The number of new cases registered in speciality clinics in 2017-18 and 2018-19 shown in Table 5.2.3.
Figure 5.2.2 gives the incidence of cancer to human body parts detailed as per cent of new patients registered in speciality clinics in 2018-19.
Cases Registered (Age and Gender-wise)
The details of age and sex-wise number of new cases registered in 2018-19 reveals that people in the age group of 55-64 (27.14 per cent) are more prone to cancer diseases (27.69 per cent of male and 26.59 per cent of female). Figure 5.2.3 illustrates age and sex-wise new cancer patients registered for treatment in RCC in 2018-19.
Gender-wise New Cases Registered in Speciality Clinics
Out of the total male cases registered in 2018-19, about 34.12 per cent were registered in chest and
Table 5.2.3 New cases registered in RCC during 2017-18 and 2018-2019,speciality clinic-wiseSl. No Clinic 2017-18 2018-19
1 Haematological, Lymphoreticular, bone and soft tissue sarcoma 2,359 2,382
2 Head and Neck 2,637 2,5693 Breast and Central Nervous System 2,710 2,5584 Gynaec, Genitourinary and Others 2,860 2,6905 Chest and Gastrointestinal 3,947 3,7636 Paediatric 602 5377 Thyroid 1,328 1,128Total 16,443 15,627
Source: Regional Cancer Centre, Thiruvananthapuram
Figure 5.2.1 New cases registered in 2018-19, District-wise, in per cent
Source: Regional Cancer Centre, Thiruvananthapuram

214 Economic Review 2019, Kerala State Planning Board
Figure 5.2.2 New cases registered in 2018-19, incidence of cancer to human body parts, in per cent
Source: Regional Cancer Centre, Thiruvananthapuram
Figure 5.2.3 Age and gender-wise new cases registered in 2018-19
Source: Regional Cancer Centre, Thiruvananthapuram
Table 5.2.4 Cases registered in speciality clinics, gender-wise, 2017-18 and 2018-19
Sl.No Clinic2017-18 2018-19
Male Female Male Female
1 Haematolymphoreticular, bone and soft tissue sarcoma
1,391 966 1,387 1,005
2 Head and Neck 1,958 678 1,948 6183 Breast and Central Nervous System 235 2,475 248 2,3094 Gynaec, Genitourinary and Others 954 1,909 879 1,8085 Chest and Gastrointestinal 2,783 1,164 2,598 1,1626 Paediatric 325 277 303 2347 Thyroid 271 1,057 206 922
Total 7,917 8,526 7,569 8,058Source: Regional Cancer Centre, Thiruvananthapuram

215Chapter 5, Service Sector
gastrointestinal clinic. In the case of females, out of the total cases registered, 28.65 per cent were registered in breast and central nervous system clinic. Details are given in Table 5.2.4.
System-wise Distribution of Cancer Patients
The system-wise percentage distribution of
cancer patients show that irrespective of gender disparity in certain type of cancers, the incidence of oral cavity and pharynx cancer and cancers to respiratory system mostly affects men than women. Breast and Reproductive system cancers are mostly seen in women. Details are shown in Table 5.2.5.
Table 5.2.6 Number of cases referred to RCC in 2017-18 and 2018-19
Sl.No. DistrictNo. of cases referred
2017-18 2018-19
1 Thiruvananthapuram 3,902 4,0132 Kollam 2,937 3,0143 Pathanamthitta 895 8304 Alappuzha 1,045 9925 Kottayam 622 5446 Idukki 331 3237 Ernakulam 629 6058 Thrissur 1,006 8739 Palakkad 1,036 90610 Malappuram 908 21111 Kozhikode 320 75112 Wayanad 88 7213 Kannur 259 21314 Kasaragod 164 140
Source: Regional Cancer Centre, Thiruvananthapuram
Table 5.2.5 System-wise distribution of cancer patients by gender, in per cent
SystemMale Female
N=6,639 N=6,884
Brain and Nervous System 3.2 1.5Oral Cavity and Pharynx 21.7 6.8Thyroid 2.9 12.9Respiratory System 17 4.3Breast 0.3 29Oesophagus and Stomach 8.1 3.4Other Digestive Organs 14.1 7.7Urinary Tract 3.8 0.8Reproductive System 6.2 18.9Bone, Conn. tissue and Skin 3.4 2.5Leukaemia and Myeloma 9.4 7.1Lymphoma 6.2 3.4
All Others 3.7 2.2Source: Regional Cancer Centre, Thiruvananthapuram

216 Economic Review 2019, Kerala State Planning Board
Table 5.2.7 Central and State Government schemes, 2017-18 and 2018-19
Scheme
Patients enrolled (new cases)
Total no.of people benefited
Amount spent(in crore)
2017-18 2018-19 2017-18 2018-19 2017-18 2018-19
Central Government SchemesPrime Minister’s Relief Fund 220 432 1,156 1,542 1.94 3.44Health Minister’s Rashtriya Arogya Nidhi (RAN)
2,054 2,074 0.18
Health Minister’s Discretionary Fund 1 7 15 18 0.01 0.0011Indian Cancer Society 4 119 238 1,428 0.78 1.63Health Minister’s Cancer Patient Fund (HMCFP-CSR Scheme)
36 42 37 81 0.25 0.44
State Government SchemesCancer Suraksha Scheme 542 472 4,928 5,389 6.7 5.78Chis Plus 6,017 7,635 33,159 40,780 16.87 19.55Karunya Benevolent Fund 4,425 6,162 21,664 27,686 32.36 41.59Sukrutham 2,270 175 8,310 8,489 17.92 2.07Thalolam 8 8 91 99 0.03 0.03Scheduled Tribe Patient Fund 27 23 330 354 0.19 0.19Snehasanthwanam for Endosulfan Victim
8 10 44 53 0.01 0.07
Total 13,595 14,966 72,026 86,565 77.23 73.20Source: Regional Cancer Centre, Thiruvananthapuram
Figure 5.2.4 Number of referred cases in 2018-19
Source: Regional Cancer Centre, Thiruvananthapuram
Referral System
RCC is a tertiary level referral hospital and patients to which patients are referred from other Government and private hospitals. As in the previous year, most of the cases in 2018-19 were referred from Thiruvananthapuram (25.68
per cent) followed by Kollam (19.29 per cent) and the least number of cases were referred from Wayanad (0.46 per cent). The number of cases referred from Thiruvananthapuram in 2018-19 was 4,013 and 3,902 cases were referred in 2017-18. Details are given in Table 5.2.6.

217Chapter 5, Service Sector
In addition to this, 1,924 cases in 2018-19 were referred from Tamil Nadu, 5 from Karnataka, 10 from Lakshadweep and 161 from other Indian States and 40 persons from Maldives were also referred. In the previous year, the numbers of cases were 1,975 from Tamil Nadu, 9 from Karnataka, 10 from Lakshadweep and 118 from Maldives. Figure 5.2.4 presents number of referred cases from within the State, outside State and international cases.
Central and State Government Schemes
Both Central and State Governments have initiated various schemes to ensure free or subsidised treatment for cancer patients. Details are given in Table 5.2.7.
Major Initiatives of RCC in 2018-19
In addition to the Government supported schemes, RCC provides support to patients and families through various other schemes as detailed below:
1. Free Drug Bank – The Free Drug Bank functions according to specific guidelines and is monitored by a committee constituted by the Director, RCC. The drug bank provided full or partial help to 3,108 patients during the reporting period and 3,440 patients were supported during the previous year.
2. Free Food (‘Akshayapathram’) – Free food was provided to 6,923 patients belonging to vulnerable socio-economic groups during the report period and 6750 patients in 2017-18 with the support of many philanthropic organisations.
3. Support for Paediatric patients – ‘Prathyasa’, a voluntary group working in collaboration with paediatric oncology division gives financial and psychosocial support to children and their families.
4. Indian Cancer Society Support Scheme – RCC was selected as one of the five cancer centres across India for receiving
financial support from the Indian Cancer Society for treatment of cancer. In 2018-19, 238 patients including 119 new patients received support through the scheme.
Human Resource Development
1. International School of Colposcopy – 21 doctors were given one-week hands on training and 101 BSc (MLT) students and 21 nurses were given one day orientation programme on low cost Cervical Screening Strategies such as pap smear VIA, VILI and Colposcopy.
2. Trainer-Trainee Programmes – A total number of 4,192 people were trained in 2018-19 through trainer-trainee programmes conducted for health care providers which included doctors, post graduate medical students and paramedical staff from governmental and non-governmental institutions, Community Volunteers like NSS and ASHA workers, NCC Cadets, Jail Warders etc. In 2017-18, the number of people trained was 4,272. As in the previous year, out of the total people trained in 2018-19 more than 50 per cent were community volunteers.
3. House Surgeon’s Training Programme – A total number of 104 house surgeons participated in the training programme for House Surgeons of Government Medical College and Government Dental College, Thiruvananthapuram on cancer prevention and control.
Cancer Control Activities
Early cancer detection
In 2018-19, 4,829 persons attended the early cancer detection clinic of RCC. As a result, 708 cancers and 343 pre-cancers were detected.
Cancer Outreach Programmes
A total number of 115 cancer detection camps were conducted in various parts of the State
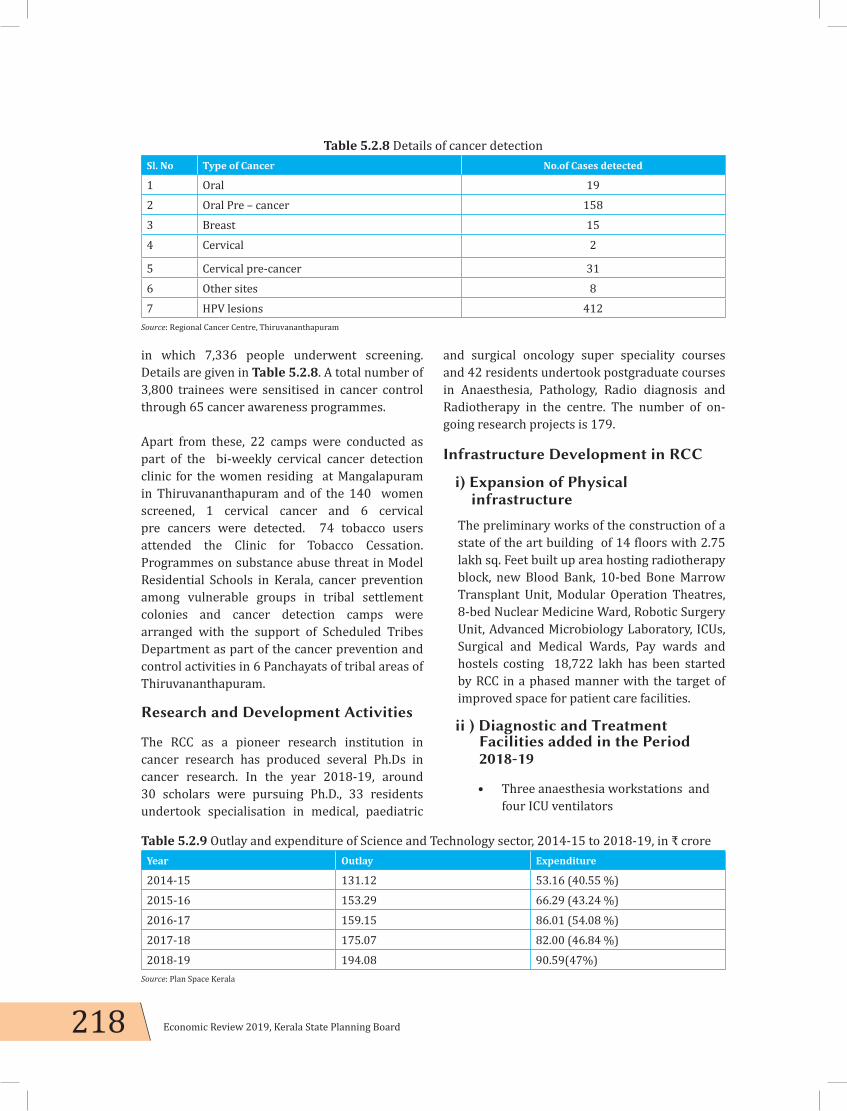
218 Economic Review 2019, Kerala State Planning Board
in which 7,336 people underwent screening. Details are given in Table 5.2.8. A total number of 3,800 trainees were sensitised in cancer control through 65 cancer awareness programmes.
Apart from these, 22 camps were conducted as part of the bi-weekly cervical cancer detection clinic for the women residing at Mangalapuram in Thiruvananthapuram and of the 140 women screened, 1 cervical cancer and 6 cervical pre cancers were detected. 74 tobacco users attended the Clinic for Tobacco Cessation. Programmes on substance abuse threat in Model Residential Schools in Kerala, cancer prevention among vulnerable groups in tribal settlement colonies and cancer detection camps were arranged with the support of Scheduled Tribes Department as part of the cancer prevention and control activities in 6 Panchayats of tribal areas of Thiruvananthapuram.
Research and Development Activities
The RCC as a pioneer research institution in cancer research has produced several Ph.Ds in cancer research. In the year 2018-19, around 30 scholars were pursuing Ph.D., 33 residents undertook specialisation in medical, paediatric
and surgical oncology super speciality courses and 42 residents undertook postgraduate courses in Anaesthesia, Pathology, Radio diagnosis and Radiotherapy in the centre. The number of on-going research projects is 179.
Infrastructure Development in RCC
i) Expansion of Physical infrastructure
The preliminary works of the construction of a state of the art building of 14 floors with 2.75 lakh sq. Feet built up area hosting radiotherapy block, new Blood Bank, 10-bed Bone Marrow Transplant Unit, Modular Operation Theatres, 8-bed Nuclear Medicine Ward, Robotic Surgery Unit, Advanced Microbiology Laboratory, ICUs, Surgical and Medical Wards, Pay wards and hostels costing 18,722 lakh has been started by RCC in a phased manner with the target of improved space for patient care facilities.
ii ) Diagnostic and Treatment Facilities added in the Period 2018-19
• Three anaesthesia workstations and four ICU ventilators
Table 5.2.8 Details of cancer detectionSl. No Type of Cancer No.of Cases detected
1 Oral 192 Oral Pre – cancer 1583 Breast 154 Cervical 2
5 Cervical pre-cancer 316 Other sites 87 HPV lesions 412
Source: Regional Cancer Centre, Thiruvananthapuram
Table 5.2.9 Outlay and expenditure of Science and Technology sector, 2014-15 to 2018-19, in ₹ croreYear Outlay Expenditure
2014-15 131.12 53.16 (40.55 %)2015-16 153.29 66.29 (43.24 %)2016-17 159.15 86.01 (54.08 %)2017-18 175.07 82.00 (46.84 %)2018-19 194.08 90.59(47%)
Source: Plan Space Kerala

219Chapter 5, Service Sector
• Integrated Bipolar & Ultrasonic Cutting & Coagulation Units
• Digital Radiography and Fluroscopy system
• Supersonic USG machine with Elastography
• Fourier-Transform Infrared Spectrometer
Outlay and Expenditure of Science and Technology Sector
The details of outlay and expenditure of Science and Technology sector from 2014-15 to 2018-19 are given in Table 5.2.9.
Way Forward
The advancement in Science and Technology coupled with liberalisation of the economy and progressive globalisation has brought in new challenges to the Science Technology sector. New technologies to position Kerala among top States in basic research/technology needs to be developed by focusing technology driven agriculture development and developing new technologies for research and development in energy and technology business incubators. An agency for state level planning and promotion of Science and technology, KSCSTE shall explore the possibility of promoting and supporting private industrial research.
As per the reports of WHO, between 30-50 per cent of cancers can currently be prevented by avoiding risk factors, adopting preventive strategies and disease burden can be reduced through early detection and treatment. The decrease in number of new cases registered in RCC in 2018 compared to 2017 shows that the impact of efforts made by the institution in cancer control activities and improvement of treatment facilities available there. The role of upcoming cancer institutes/other hospitals engaged in cancer treatment and technologies available will also enable the State in reducing disease burden in future.

220 Economic Review 2019, Kerala State Planning Board
5.3 Tourism
Tourism sector creates employment, brings in incomes and opens society to the rest of the country and the world. A feature of the sector is its interconnection with other spheres of development. Tourism industry in Kerala is featured by its world renowned brand, consistent growth, diverse products and presence of local enterprises.
International tourist arrivals across the world reached a total of 140 crore in the year 2018 which is 6 per cent higher than that in 2017. With this remarkable growth in recent years, the 140 crore mark has been reached two years ahead of UNWTO’s long term forecast of 2010 and this was the ninth consecutive year of sustained growth in the arrival of international tourists. Europe recorded (+) 6 per cent, Asia and Pacific (+) 6 per cent, America (+ 3) per cent, Africa (+7) per cent and Middle East (+) 10 per cent growth in international arrivals in 2018. France is in the top position in the list of most visited countries in the world in 2018 (8.94 crore visitors) (Source: United
Nations World Tourism Organisation).
In India, the number of foreign tourist arrivals crossed 1 crore mark in 2017 and the sector contributed 6.88 per cent to nation’s GDP and had a 12 per cent share of jobs in the total employment figures of the country. In 2018, 93 lakh tourists visited India up to November 30, 2018.
Kerala is an internationally recognised tourist destination and one of the most popular tourist destinations in India. The tourism industry
promotes ecologically sustained tourism. The State is actively promoting tourism in domestic and international markets. Public spending in Kerala focuses on infrastructure development, marketing, human resource development, publicity and hospitality.
A total number of 1.67 crore tourists (foreign and domestic) visited the State in the year 2018 indicating 5.93 per cent increase over previous year which shows that the sector rebounded quickly after the floods of 2018. The year 2018 witnessed 0.42 per cent growth in foreign tourist arrivals and 6.35 per cent growth in domestic tourist arrivals over 2017 in the State. There was 8.60 per cent increase in total revenue from the tourism industry in 2018 (Source: Department of Tourism,
GoK)
Tourist Arrivals
Foreign Tourists
The number of foreign tourists who visited the country from January 2018 to November 30, 2018 was 93.67 lakh, 5.63 per cent higher than the tourist arrivals for the period January 2017 to November 2017. The share of Kerala in country’s tourism in 2017 was 10.73 per cent, which is lower than that of 2016. It was 11.79 per cent in 2016. A total number of 10.96 lakh foreign tourists visited the State in 2018 as compared to 10.91 lakh in the previous year. Figure 5.3.1 reveals the trends in the arrival of foreign tourists in Kerala during the period 2009-2018.

221Chapter 5, Service Sector
From 2009 to 2013 and in 2015, the growth rate in Kerala with respect to foreign tourist arrivals was higher than that of India. It was lower than the national average in 2014, 2016 and 2017. The State has been witnessing a declining growth rate after 2010. In 2010, the growth rate was 18.31 per cent, which dropped to 5.86 per cent by 2015 and further to 0.42 per cent in 2018. The number of foreign tourists who visited Kerala in 2018 was 10,96,407 as against 10,91,870 foreign tourists in 2017. As on September 30, 2019, 8,19,975 foreign tourists visited the State. Appendix 5.3.1 shows the national and State foreign tourist arrivals and annual growth rate from 2009 onwards.
Seasonality in Foreign Tourist Arrivals
The month-wise analysis of foreign tourist arrival in India indicates that up to November 2018, the maximum number of foreign tourists arrived in the month of February followed by January. But in the previous year, the maximum number of foreign tourists arrived in the country in December followed by November. Month-wise foreign tourist arrival in India and Kerala in 2017 and 2018 is given in Table 5.3.1.
In 2018, around 15 per cent of the total foreign tourists visited the State in January followed
Table 5.3.1 Month-wise Foreign Tourist Arrivals (FTAs) in India and Kerala in 2017 and 2018, in number
Sl.No. MonthNo. of FTAs in 2017 No. of FTAs in 2018
India Kerala India Kerala
1 January 9,64,109 1,50,808 10,47,948 1,67,9802 February 9,31,025 1,35,089 10,52,766 1,52,0033 March 8,85,936 1,07,141 10,25,830 1,20,7114 April 7,17,899 82,633 7,49,477 85,4935 May 6,22,408 49,073 6,06,043 45,4276 June 6,63,470 44,040 6,81,279 36,7467 July 7,79,309 72,552 8,06,255 68,8688 August 7,19,129 73,736 7,84,814 60,1219 September 79,964 54,700 7,19,121 44,76910 October 8,66,976 79,957 8,81,763 73,26311 November 9,97,738 1,07,028 10,12,128 99,27112 December 11,67,840 1,35,113 NA 1,41,755
Source: Ministry of Statistics, GoI and Department of Tourism, Kerala
Figure 5.3.1 Annual growth rates in the arrival of foreign tourists in Kerala from 2009 to 2018, in per cent
Source: Department of Tourism, GoK

222 Economic Review 2019, Kerala State Planning Board
by February (around 14 per cent) and in 2017, January witnessed maximum number of foreign tourist arrivals in the State followed by December. The lowest foreign tourist traffic in 2018 was registered for the month of June (3.35 per cent) and this trend has been continuing for the last 11 years. In 2019 (up to September 30, 2019), January witnessed maximum foreign tourist visits followed by February and the month of June occupies last position in terms of tourist arrivals. Figure 5.3.2 depicts the month-wise comparison of foreign tourist arrival in Kerala from 2009 to 2018.
Source Market of Foreign Tourist Arrivals
In 2018 United Kingdom, with a percentage share of 18.35 per cent remains at the top of list of the countries from where foreign tourists come to the State. USA occupied the second position with an 8.80 per cent share. In 2017 also, these two countries remained at the top two positions. In 2018, France (7.95 per cent) and Germany (6.03 per cent) contributed the next major shares of foreign tourist’s arrivals. These two countries were in 3rd (France 6.92 per cent) and 4th (Germany 5.73 per cent) position in the previous year also. Appendix 5.3.2 gives the share of
major international source markets of Kerala Tourism in 2017, 2018 and in 2019 (up to June 30, 2019) and Figure 5.3.3 illustrates the share of foreign tourist arrival to Kerala from top ten countries in 2017 and 2018.
Foreign Tourist Arrival – District-Wise
For the last few years, the two Districts which recorded largest foreign tourist arrivals in the State are Ernakulam and Thiruvananthapuram. In 2018, 4, 88,175 foreign tourists visited Ernakulam and 4,53,973 visited the District in 2017.
In the case of Thiruvananthapuram, 3,42,761 foreign tourists visited the District in 2018 as against 4,20,719 in 2017. The number of foreign tourists who visited these two Districts in 2019 (up to September 30, 2019) was 3,68,437 (Ernakulam) and 1,97,884 (Thiruvananthapuram). The Districts with least number of foreign tourist arrivals were Pathanamthitta (1,953) and Palakkad (1,967) in 2018. The scenario is the same in 2019. But in 2017, Kasaragod (1,115) was the District that recorded least number of foreign tourist arrivals in the State. Details are given in Appendix 5.3.3.
Figure 5.3.2 Month-wise comparison of foreign tourist arrival in Kerala from 2009 to 2018, in number
Source: Department of Tourism, GoK
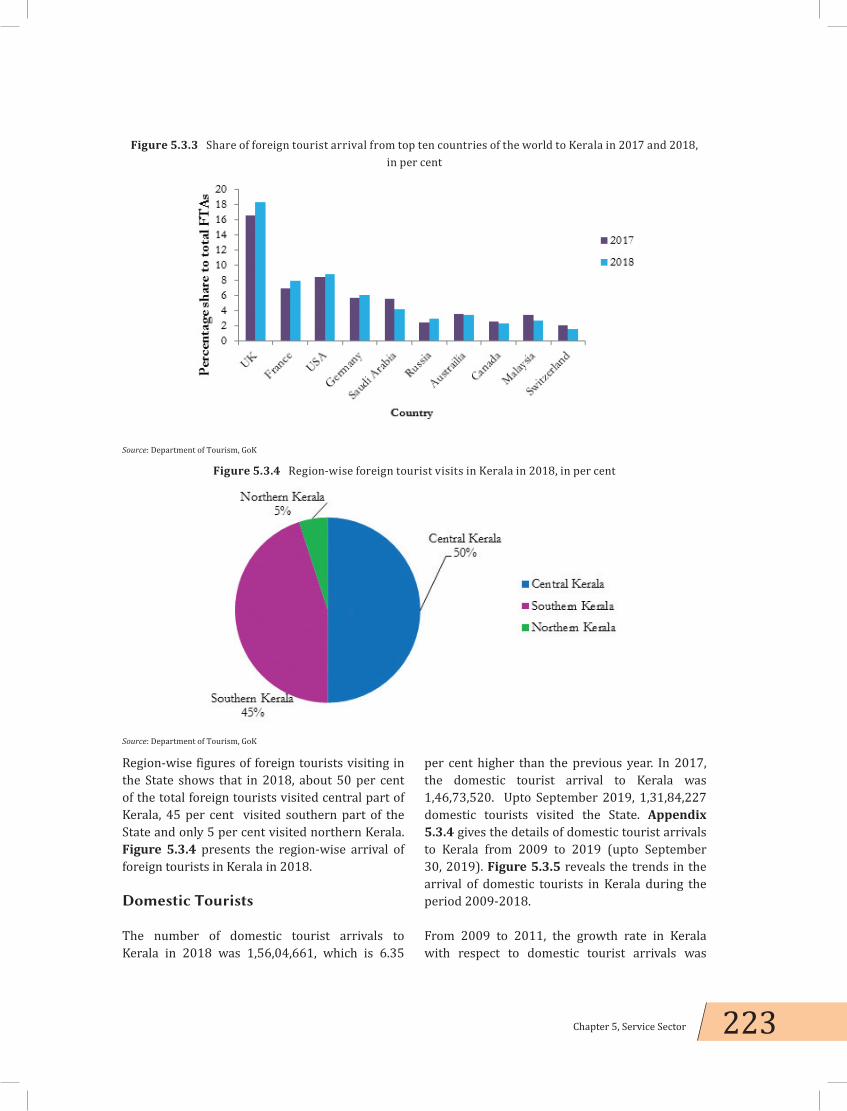
223Chapter 5, Service Sector
Region-wise figures of foreign tourists visiting in the State shows that in 2018, about 50 per cent of the total foreign tourists visited central part of Kerala, 45 per cent visited southern part of the State and only 5 per cent visited northern Kerala. Figure 5.3.4 presents the region-wise arrival of foreign tourists in Kerala in 2018. Domestic Tourists
The number of domestic tourist arrivals to Kerala in 2018 was 1,56,04,661, which is 6.35
per cent higher than the previous year. In 2017, the domestic tourist arrival to Kerala was 1,46,73,520. Upto September 2019, 1,31,84,227 domestic tourists visited the State. Appendix 5.3.4 gives the details of domestic tourist arrivals to Kerala from 2009 to 2019 (upto September 30, 2019). Figure 5.3.5 reveals the trends in the arrival of domestic tourists in Kerala during the period 2009-2018.
From 2009 to 2011, the growth rate in Kerala with respect to domestic tourist arrivals was
Figure 5.3.3 Share of foreign tourist arrival from top ten countries of the world to Kerala in 2017 and 2018, in per cent
Source: Department of Tourism, GoK
Figure 5.3.4 Region-wise foreign tourist visits in Kerala in 2018, in per cent
Source: Department of Tourism, GoK

224 Economic Review 2019, Kerala State Planning Board
increasing and then began to decrease. The State had been witnessing a steady growth rate during 2012-2014. In 2015, the growth rate was 6.59 per cent, which dropped to 5.67 per cent in 2016. But the year 2017 recorded 11.39 per cent growth in the arrival of domestic tourists in the State which dropped again in 2018 and reached 6.35 per cent.
Seasonality in Domestic Tourists Arrivals
The month-wise data on the arrival of domestic tourists in Kerala in 2018 shows that the
highest inflow of tourists was for the month of December and the lowest was in the month of June. A similar trend was visible in the previous year also. In 2019, (as on September 30, 2019) the month of May recorded maximum number of foreign tourist arrivals. Details are given in Table 5.3.2.
Figure 5.3.6 portrays the month-wise arrival of domestic tourists in Kerala from 2009 to 2018.
Figure 5.3.5 Annual growth rates in the arrival of domestic tourists in Kerala from 2009 to 2018, in per cent
Source: Department of Tourism, GoK
Table 5.3.2 Month-wise arrival of domestic tourists in Kerala in 2017, 2018 and 2019
Sl. No. MonthNo. of Domestic Tourists Arrival
2017 2018 2019(upto September 30)
1 January 1,221,074 14,22,483 15,15,5512 February 1,034,563 12,26,778 13,35,6653 March 1,014,877 12,28,451 13,39,2524 April 1,213,252 14,70,552 16,13,2575 May 1,338,330 15,94,332 18,18,9866 June 1,027,361 10,84,238 13,41,4967 July 1,083,162 11,76,994 14,30,5088 August 1,138,533 9,95,577 13,21,1759 September 1,188,959 11,19,445 14,68,33710 October 1,379,190 12,81,028 -11 November 1,401,610 13,64,805 -12 December 1,632,609 16,39,978 -
Total 1,46,73,520 1,56,04,661 1,31,84,227Source: Department of Tourism, GoK
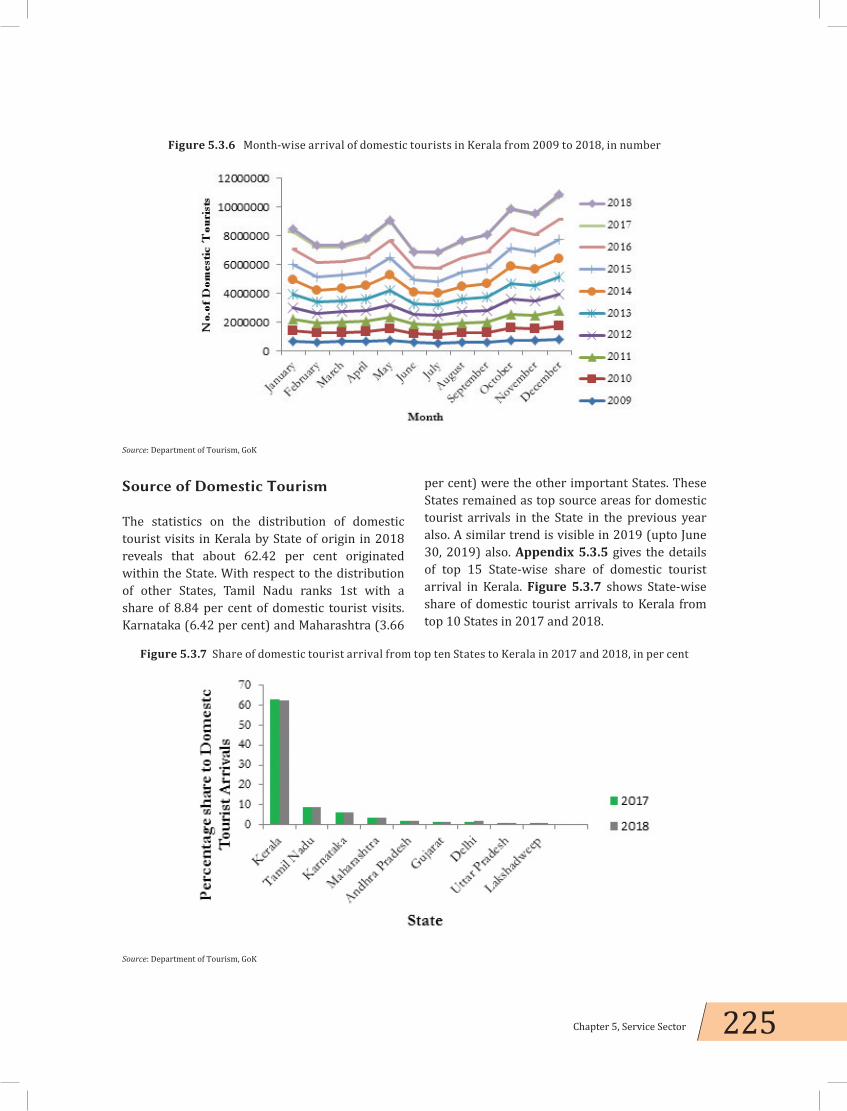
225Chapter 5, Service Sector
Figure 5.3.6 Month-wise arrival of domestic tourists in Kerala from 2009 to 2018, in number
Source: Department of Tourism, GoK
Source of Domestic Tourism
The statistics on the distribution of domestic tourist visits in Kerala by State of origin in 2018 reveals that about 62.42 per cent originated within the State. With respect to the distribution of other States, Tamil Nadu ranks 1st with a share of 8.84 per cent of domestic tourist visits. Karnataka (6.42 per cent) and Maharashtra (3.66
per cent) were the other important States. These States remained as top source areas for domestic tourist arrivals in the State in the previous year also. A similar trend is visible in 2019 (upto June 30, 2019) also. Appendix 5.3.5 gives the details of top 15 State-wise share of domestic tourist arrival in Kerala. Figure 5.3.7 shows State-wise share of domestic tourist arrivals to Kerala from top 10 States in 2017 and 2018.
Figure 5.3.7 Share of domestic tourist arrival from top ten States to Kerala in 2017 and 2018, in per cent
Source: Department of Tourism, GoK

226 Economic Review 2019, Kerala State Planning Board
District-Wise Arrivals of Domestic Tourists
Regarding the District-wise domestic tourist arrivals in Kerala, Ernakulam and Thiruvananthapuram were the leading Districts in 2018. In 2017, Ernakulam and Thissur were in the top position. In 2019 (up to September 30, 2019), Ernakulam and Thiruvananthapuram are the leading Districts in domestic tourist arrivals. Pathanamthitta attracts the lowest number of domestic tourists. Details are given in Appendix 5.3.6.
Region-wise details show that more number of domestic tourists visited central parts of Kerala in 2018, 2017 and in 2019(upto June 30, 2019).
Figure 5.3.8 illustrates region-wise domestic tourist visits in Kerala in 2018.
Accommodation Units in Kerala
The total number of tourist accommodation units in the State as on June 30, 2019 is 7,022 with, 88,773 numbers of rooms. Alappuzha is the District having highest number of accommodation units (1,173) and Kasaragod District has the lowest number (85) of accommodation units. Details are shown in Appendix 5.3.7.
Economic Impact of Tourism
The foreign exchange earnings from tourism in the year 2018 was ₹8,764.46 crore and domestic
Table 5.3.3 Total revenue generated from tourism, Direct and Indirect, in Kerala from 2009 to 2018, in ₹ crore
Year Total Revenue generated (Direct and Indirect) Percentage change
2009 13231.00 0.762010 17348.00 31.112011 19037.00 9.732012 20430.00 7.312013 22926.55 12.222014 24885.44 8.542015 26689.63 7.242016 29658.56 11.122017 33383.68 12.562018 36258.01 8.60
Source: Department of Tourism, GoK
Figure 5.3.8 Region-wise domestic tourist visits in Kerala in 2018, in per cent
Source: Department of Tourism, GoK

227Chapter 5, Service Sector
tourist earnings was ₹19,474.62 crore. Details are given in Appendix 5.3.8. Total revenue including direct and indirect means in 2018 was ₹36258.01 crore showing an increase of 8.6 per cent over 2017. Details are shown in Table 5.3.3.
Figure 5.3.9 presents total revenue generated from tourism in Kerala from 2009 to 2018.
State Plan Outlay and Expenditure
The details of Plan outlay and expenditure of tourism sector during the period 2013-14 to 2018-19 are given in Table 5.3.4. The utilisation of outlay, though high is showing a downward trend since 2014-15.
Figure 5.3.9 Total revenue generated from tourism during 2009 to 2018, in ₹ crore
Source: Department of Tourism, GoK
Table 5.3.4 State Plan outlay and expenditure, 2013-14 to 2018-19, in ₹ croreYear Outlay Expenditure
2013-14 189.23 189.78 (100%)2014-15 206.65 192.17 (93%)2015-16 223.04 203.63 (91.29%)2016-17 311.56 285.76 (91.72%)2017-18 342.73 308.32 (90%)2018-19 379.00 289.31(76 %)
Source: Plan Space Kerala
Box 5.3.1 Champions Boat League
As part of a novel venture to protect and promote the tradition of the land, Kerala Tourism has launched the Champions Boat League to be conducted at 12 different venues across Kerala. The main objectives of the event are conservation and promotion of Kerala’s traditional festivals, to create an annual event to be marketed as a Tourism product and to showcase Kerala Backwaters to the world. It has been conceived on the model of the Indian Premier League (IPL) to transform the State’s legendary and historically-significant ‘Vallamkali’ (snake boat races) into a world-class sporting event.
Source: Department of Tourism, GoK
228 Economic Review 2019, Kerala State Planning Board
Major Achievements
• Awards and Acclaims • Pacific Asia Travel Association (PATA)
Award for Women Empowerment, Travel Advertisement Broadcast Media and for Website (2019).
• MCUBE 2019 Digital Award• DIGIES 2019 Digital Award• FOXGLOBE Awards 2018-19 for Best
Digital Brand for video campaign (All India and South India region)
• PATA Gold Awards 2018 for Travel Advertisement Print Media, Travel Poster – Biennale Poster and for Best Honey moon Destination in India
• DAS GOLDENE STADTTOR Award 2018 for Biennale Poster and Print Campaign
• Lonely Planet Travel Award for Best Destination for Families 2018
• World Travel Mart Gold Award (2018) for (i) Best in Responsible Tourism and (ii) Managing Success in Tourism
• National Tourism Award (2018) for Wayanad Responsible Tourism Project under the Category Best RT Project
• Outstanding Achievement Award for RT Mission in Indian Responsible Tourism Awards –IRTA (2018)
• Tourism Development in North Malabar
Small and Medium Industries Leveraging Experiential Tourism (SMiLE) project of Bekal Resorts Development Corporation (BRDC) to promote and facilitate tourism based small and medium entrepreneurial ventures resulted in achieving 93 entrepreneurs of which 28 per cent are women entrepreneurs, 50 units with accommodation for 400 tourists/day resulted in 59 per cent increase in foreign tourists arrival in North Malabar over 2017 and 9 per cent increase in domestic tourists arrival in 2018.
• Human Resource development through KITTS
• Launched online Job Portal• 94 per cent of PG, 80 per cent of UG
and 8 per cent of Diploma students got placement
• University of Kerala has sanctioned B. Com (Travel and Tourism)
• Diploma and certificate courses on Adventure Tourism is being launched in 2019-20
• Conducted 17 training programmes (11,809 participants of which 7,645 i.e., 65 per cent are women)
• Training for tribal community: 5 women initiated Ethnic Restaurants and another group of 12 women members earn ₹4,000-6,000 per month.
• Assessment of carrying capacity of selected 25 ecotourism sites in Kerala – Completed in 4 sites
• Responsible Tourism Mission: 8,442 units started of which 5,740 are women lead/owned units, 17,332 direct and 25,508 indirect beneficiaries, 26 experiential tour packages and income generated– ₹4.89 crore
Way Forward
Kerala, being a State with rich historical and cultural traditions needs to focus on ensuring safe and eco-friendly tourism destinations that offer visitors world class recreation facilities. Another important area of concern is the development and popularising of lesser known tourist destinations in the State. The sector is facing competition from neighbouring States and countries like Sri Lanka and other Asian countries. The State needs qualified personals with for delivering high quality services in the industry. It is essential to explore and utilise the full scope of tourism for encouraging the development of non-traditional tourist destinations and products. The number of tourism establishments and service providers needs to be developed.

229Chapter 5, Service Sector
5.4 External Trade
External Trade in India
According to the Trade and Development Report 2019 of United Nations Conference on Trade and Development (UNCTAD), world trade is in deceleration mode. The average growth in the volume of world exports and imports has slowed to 2.8 per cent in 2018 and is projected to slow further in 2019. The prospects for global economy are currently shrouded in a fog of international trade tensions and geopolitical disputes.
As per the statistics published by the Ministry of Commerce and Industry (MoCI), GoI, India’s merchandise exports in 2018-19 was US $ 330.1 billion registering a growth of 8.6 per cent in dollar terms as against US $303.5 billion in 2017-18. Service exports in 2018-19 were US $204.8 billion as against US $174.8 billion in 2017-18 recording a positive growth of 8.8 per cent. India’s overall exports (merchandise and services combined) in 2018-19 were US $534.8 billion, exhibiting a positive growth of 11.75 per cent as against $ 478.3 billion in 2017-18.
India’s overall exports (merchandise and services combined) in April-October 2019-20 are estimated to be US $310.2 billion, exhibiting a positive growth of 1.5 per cent over the same period in 2018-19. Out of this, merchandise and service exports are estimated to be US $ 185.9 billion and US $124.3 billion with a negative
growth of 2.2 per cent and a positive growth of 7.6 per cent respectively.
Overall imports in April-October 2019-20 are estimated to be US $359.7 billion, exhibiting a negative growth of 4.6 per cent over the same period in 2018-19. Out of this, merchandise imports are estimated to be US $280.7 billion and service imports US $79.0 billion registering a negative growth of 8.4 per cent and a positive growth of 11.6 per cent respectively.
India’s merchandise exports in October 2019 were US $26.4 billion, as compared to US $26.7 billion in October 2018, recording a negative growth of 1.11 per cent. In October 2019, major commodity groups showing positive growth in exports over the corresponding month of last year are electronic goods (38.4 per cent), drugs and pharmaceuticals (12.6 per cent), gems and jewellery (6.0 per cent), engineering goods (1.2 per cent), and organic and inorganic chemicals (0.9 per cent).
India’s merchandise imports in October 2019 were US $37.4 billion which was 16.3 per cent lower in dollar terms over US $44.7 billion in October 2018. Major commodity groups of import showing negative growth in October 2019 over the corresponding month of last year are petroleum, crude and products (-31.7 per cent), coal, coke and Briquettes (-28.7 per cent) transport equipments (-14.7 per cent) electronic

230 Economic Review 2019, Kerala State Planning Board
goods (-8.5 per cent), machinery, electrical and non-electrical (-0.5 per cent).
External Trade in Kerala
In 2018-19, Cochin Port handled a total traffic, coastal and foreign, of 320.2 lakh MT, as compared to 291.4 lakh MT in 2017-18, registering a lower growth rate of 9.9 per cent as against 16.5 per cent in the previous year. Out of this, coastal traffic was 109.4 lakh MT in 2018-19 as against 86.6 lakh MT in 2017-18 recording a higher growth rate of 26.4 per cent as against 22.3 per cent in the previous year. But foreign traffic grew only by 2.9 per cent in 2018-19 as against 14.2 per cent in 2017-18. Total foreign traffic was 210.8 lakh MT in the 2018-19 as against 204.8 lakh MT in 2017-18. (Table 5.4.1)
Total export, both coastal and foreign, through Cochin Port was aggregated to 66.5 lakh MT in 2018-19 as against 57.8 lakh MT in 2017-18 recording a lower growth of 15.0 per cent compared to 21.4 per cent in the previous year. Out of this, coastal export accounts for 40.2 lakh MT in 2018-19 as against 27.4 lakh MT 2017-18 recording a growth of 46.8 per cent as against record growth of 93.1 per cent in the previous year. Tea, coffee, cashew kernels, seafood, coir products and spices are the major items of export through Cochin port. Details are given in Appendix 5.4.1.
Total import traffic, both costal and foreign, through Cochin port rose to 253.8 lakh MT in 2018-19 as against 233.6 lakh MT in 2017-18 registering a lower growth rate of 8.6 per cent compared to 15.4 per cent in the previous year. Out of total import traffic, coastal imports traffic
was 69.2 lakh MT in 2018-19 as against 59.2 lakh MT in 2017-18 registering much higher growth rate of 17.0 per cent as against of 4.6 per cent in the previous year. Foreign imports traffic was 184.5 lakh MT in 2018-19 as against 174.4 lakh MT in 2017-18 recording a lower growth rate of 5.8 per cent as against 19.5 per cent in 2017-18. Fertilisers and raw materials, iron, steel and machinery and miscellaneous items including Petroleum, Oil, and Lubricants (POL) were the major items of import in 2018-19. Food grains and newsprint were not imported through Cochin Port in 2017-18. Details of major items of import through Cochin port are given in Appendix 5.4.2.
Export of Marine Products
Though Indian marine products export touched a new high of 13.8 lakh MT and earned ₹45,106.9 crore in 2017-18 as against 11.3 lakh MT valued ₹37,870.9 crore in 2016-17, recording a growth of 21.3 per cent in quantity and 19.1 per cent in value, the year 2018-19 witnessed sharp decline in growth rate by registering 1.1 per cent and 3.3 per cent as compared to the previous year, in terms of quantity and value respectively. In 2018-19, India exported 13.9 lakh MT valued ₹46,589.4 crore of marine products. Export of marine products from Kerala also witnessed decline in growth rate in 2018-19. Kerala exported 1.8 lakh MT valued ₹6014.7 crore of marine products in 2018-19 as against 1.78 lakh MT valued ₹5,919.0 crore in 2017-18 recording a growth of 2.5 per cent and 1.6 per cent in terms of volume and value respectively (Table 5.4.2 and Figure 5.4.1).
Growth of export of marine products from India and Kerala has continued its fluctuating trend in 2018-19 also. The growth export of marine
Table 5.4.1 Cargo handled at Cochin Port from 2016-17 to 2018-19, quantity in lakh MTTraffic Export Import Total
2016-17 2017-18 2018-19 2016-17 2017-18 2018-19 2016-17 2017-18 2018-19
1 2 3 4 5 6 7 8 9 10Coastal 14.2 27.4 40.2 56.6 59.2 69.2 70.7 86.6 109.4Foreign 33.4 30.4 26.3 145.9 174.4 184.5 179.3 204.8 210.8Total 47.6 57.8 66.5 202.5 233.6 253.8 250.1 291.4 320.2
Source: Cochin Port Trust

231Chapter 5, Service Sector
products from India was 7.7 per cent in terms of quantity in 2012-13, declined to 6.0 per cent in 2013-14, slightly went up to 6.9 per cent in 2014-15, again went down to a negative growth of 10.0 per cent in 2015-16 and rose to 20.0 per cent in 2016-17, again to 21.3 per cent in 2017-18 and declined to 1.1 per cent in 2018-19. Kerala’s marine exports also witnessed the fluctuating trend recording a growth of 6.9 per cent in 2012-13, a negative growth of 0.4 per cent in 2013-14, a positive growth of 0.6 per cent in 2014-15, then rose 6.7 per cent in 2016-17 and again to 12.3 per cent in 2017-18, but declined to 2.5 per cent in 2018-19 in terms of quantity.
The share of Kerala in Indian export of marine products witnessed a slight increase in 2018-19 compared to previous year as against declining trend in the last several years. It was 18.1 per cent in 2011-12, decreased to 15.8 per cent in 2015-16, 14.0 per cent in 2016-17, 13.0 per cent in 2017-18 and slightly increased to 13.1 per cent in 2018-19 in terms of quantity
Frozen shrimp continued as top export item of marine products from India in 2018-19 with a market share of 44.1 per cent in quantity and 68.26 per cent in value, followed by frozen fish with a share of 24.3 per cent in quantity and 10.6
Table 5.4.2 Export of marine products in India and Kerala 2011-12 to 2018-19, quantity in MT and value in ₹ crore
Year India Kerala Kerala’s share (%)
Quantity Value Quantity Value Quantity Value
2011-12 8,62,021 16,597.2 1,55,714 2,988.3 18.1 18.02012-13 9,28,215 18,856.3 1,66,399 3,435.9 17.9 18.22013-14 9,83,756 30,213.3 1,65,698 4,706.4 16.8 15.62014-15 10,51,243 33,441.6 1,66,754 5,166.1 15.9 15.42015-16 9,45,892 30,420.8 1,49,138 4,644.4 15.8 15.32016-17 11,34,948 37,870.9 1,59,141 5,008.5 14.0 13.22017-18 13,77,244 45,106.9 1,78,646 5,919.0 13.0 13.12018-19 13,92,559 46,589.4 1,83,064 6,014.7 13.1 12.9
Source: Marine Products Export Development Agency (MPEDA)
Figure 5.4.1 Trend in the quantity of export of marine products, India and Kerala, 2011-12 to 2018-19
Source: The Marine Products Export Development Agency (MPEDA)

232 Economic Review 2019, Kerala State Planning Board
per cent in value. India exported frozen shrimp to the tune of 6.1 lakh tonnes valued ₹31800.51 crore registering a growth of 8.5 per cent in terms of quantity and 3.0 per cent in terms of value in 2018-19 (Appendix 5.4.3). Figure 5.4.2 depicts market share of item-wise export of marine products from India in 2018-19.
In 2018-19, marine products exports from Kerala was 1.8 lakh MT valued ₹6014.7 crore registering a growth of 2.5 per cent and 1.6 per cent in terms of quantity and value as against 1.78 lakh MT valued ₹5,919.0 crore in 2017-18. Frozen shrimps maintained its position as a major item
in the export basket accounting for 35.5 per cent in quantity and 50.6 per cent for earnings and recording a growth of 2.5 per cent in quantity and 4.1 per cent in value in 2018-19, followed by frozen fish and squid. Figure 5.4.3 shows the market share of item-wise exports of marine products from Kerala in 2018-19.
In 2018-19 the largest market for India’s marine products were Southeast Asia (4.5 lakh MT), USA (2.8 lakh MT), China (2.3 lakh MT) and European Union (1.7 lakh MT) followed by Japan (0.8 lakh MT), Middle East (0.6 lakh MT), and other countries (1.3 lakh MT). Major markets of India’s
Figure 5.4.2 Market share of item-wise export of marine products from India in 2018-19, in per cent
Source: The Marine Products Export Development Agency (MPEDA)
Figure 5.4.3 Item-wise export of marine products from Kerala 2018-19, in per cent
Source: The Marine Products Export Development Agency (MPEDA)

233Chapter 5, Service Sector
marine products and their share are depicted in Figure 5.4.4.
The largest market for Kerala’s marine products were Southeast Asia (70,489 MT), European Union (48,064 MT) China (17,105 MT), USA (1,580 MT), and followed by Middle East (9,020 MT), Japan (6,632 MT) and other countries (16,073 MT). Major markets of Kerala’s marine products and their share are depicted in Figure 5.4.5.
Export of Cashew
Export of cashew kernels from India was 66,693 MT valued ₹4,434.0 crore as against 84,352 MT
valued ₹5,871.0 crore achieved in 2017-2018 recording a negative growth of 20.9 per cent in volume and (-)24.5 per cent in terms of value. India exported cashew kernels mainly to U.A.E, USA, Netherlands, Japan, Saudi Arabia, Germany, Spain, France, and Kuwait.
The export of cashew kernels from Kerala also declined to 29,062 MT valued ₹1,892.6 crore in 2018-19 as against 36,930 MT valued ₹2,580.4 crore in 2017-18 registering a decline of 21.3 per cent in volume and 26.7 per cent in value. The trend in export of cashew kernels from India and Kerala is depicted in Figure 5.4.6.
Figure 5.4.4 India’s market-wise export of marine products in 2018-19, in per cent
Source: The Marine Products Export Development Agency (MPEDA)
Figure 5.4.5 Kerala’s market-wise export of marine products 2018-19, in per cent
Source: The Marine Products Export Development Agency (MPEDA)
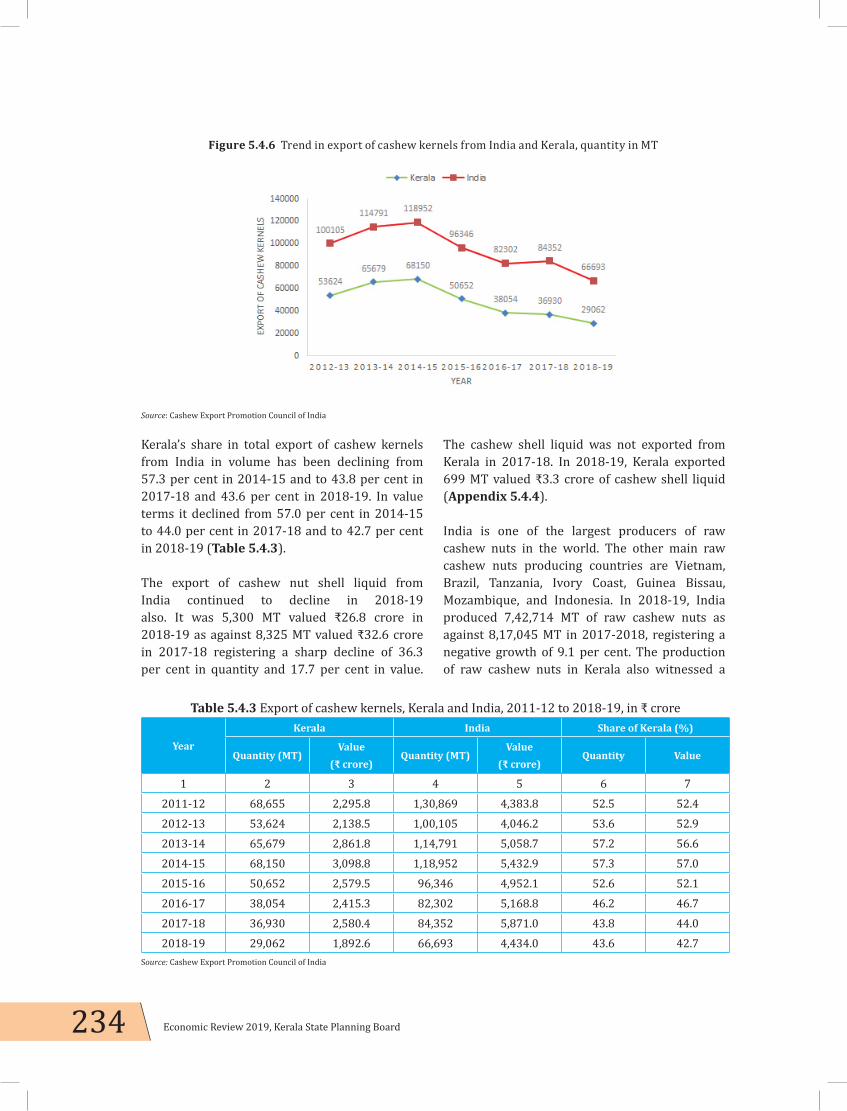
234 Economic Review 2019, Kerala State Planning Board
Kerala’s share in total export of cashew kernels from India in volume has been declining from 57.3 per cent in 2014-15 and to 43.8 per cent in 2017-18 and 43.6 per cent in 2018-19. In value terms it declined from 57.0 per cent in 2014-15 to 44.0 per cent in 2017-18 and to 42.7 per cent in 2018-19 (Table 5.4.3).
The export of cashew nut shell liquid from India continued to decline in 2018-19 also. It was 5,300 MT valued ₹26.8 crore in 2018-19 as against 8,325 MT valued ₹32.6 crore in 2017-18 registering a sharp decline of 36.3 per cent in quantity and 17.7 per cent in value.
The cashew shell liquid was not exported from Kerala in 2017-18. In 2018-19, Kerala exported 699 MT valued ₹3.3 crore of cashew shell liquid (Appendix 5.4.4).
India is one of the largest producers of raw cashew nuts in the world. The other main raw cashew nuts producing countries are Vietnam, Brazil, Tanzania, Ivory Coast, Guinea Bissau, Mozambique, and Indonesia. In 2018-19, India produced 7,42,714 MT of raw cashew nuts as against 8,17,045 MT in 2017-2018, registering a negative growth of 9.1 per cent. The production of raw cashew nuts in Kerala also witnessed a
Figure 5.4.6 Trend in export of cashew kernels from India and Kerala, quantity in MT
Source: Cashew Export Promotion Council of India
Table 5.4.3 Export of cashew kernels, Kerala and India, 2011-12 to 2018-19, in ₹ crore
Year
Kerala India Share of Kerala (%)
Quantity (MT)Value
(₹ crore)Quantity (MT)
Value(₹ crore)
Quantity Value
1 2 3 4 5 6 72011-12 68,655 2,295.8 1,30,869 4,383.8 52.5 52.42012-13 53,624 2,138.5 1,00,105 4,046.2 53.6 52.92013-14 65,679 2,861.8 1,14,791 5,058.7 57.2 56.62014-15 68,150 3,098.8 1,18,952 5,432.9 57.3 57.02015-16 50,652 2,579.5 96,346 4,952.1 52.6 52.12016-17 38,054 2,415.3 82,302 5,168.8 46.2 46.72017-18 36,930 2,580.4 84,352 5,871.0 43.8 44.02018-19 29,062 1,892.6 66,693 4,434.0 43.6 42.7
Source: Cashew Export Promotion Council of India

235Chapter 5, Service Sector
decline in 2018-19. It was 82,889 MT in 2018-19 as against 88,180 MT in 2017-18 recording a decline of 6.0 per cent.
In 2018-19, India exported 11,378 MT of raw cashew nuts worth ₹143.5 crore as compared to 5,521 MT worth ₹65.6 crore in 2017-18 recording a growth of 106.1 per cent in volume and 118.6 per cent in value. Kerala was not exported raw cashew nut in 2018-19.
India imported 8,35,463 MT of raw cashew nuts valued ₹10,929.3 crore in 2018-19 as against the import of 6,49,050 MT valued ₹8,850.0 crore in 2017-18 recording an increase of 28.7 per cent in volume and 23.5 per cent in value. Out of the total import of raw cashew nuts into India, Kerala’s share was 43,341 MT valued ₹622.4 crore in 2018-19 as against 63,508 MT valued ₹895.6 crore in 2017-18.
Export of Coir and Coir Products
In 2018-19, India exported 9,64,046 MT valued ₹2,72,804.6 crore of coir and coir products from India as against 10,16,564 MT valued ₹2,53,227.8 crore in 2017-18 registering a negative growth of 5.2 per cent in terms of quantity and an increase of 7.7 per cent in terms of value. Export of coir
pith, handloom mats, coir geo-textiles, coir yarn and curled coir registered growth, while products like coir fibre, tufted mats, handloom matting, rubberised coir, coir other sorts, coir rope and power loom matting and power loom mats showed decline in 2018-19. In 2018-19, export of coir pith with 5.7 lakh MT worth ₹1, 23,208.5 crore, constituted 58.8 per cent of total export of coir products in terms of quantity from the country. Similarly, coir fibre with an export of 3.0 lakh MT valued ₹60,164.1 crore constituted to 31.0 per cent of coir and coir products export. In 2018-19 2,25,463 MT of coir and coir products were exported through Cochin Port as against 2, 46,708 MT in 2017-18. Export trend of coir and coir products from India and Kerala is given the Figure 5.4.7.
Leading market of coir and coir products of India in 2018-19 was China with 3, 54,268 MT valued ₹715.06 crore, USA with 1, 22,221 MT valued ₹601.3 crore, Netherland 96,982 MT valued ₹248.4 crore, South Korea 75,186 MT valued ₹142.5 crore, and UK 22,192 MT valued ₹117.4 crore.
Major market of India’s coir yarn in 2018-19 was Netherlands with 1,344 MT valued ₹11.9 crore followed by Italy accounting 928 MT valued
Figure 5.4.7 Export trend of coir and coir products from India and Kerala, through Cochin Port, 2013-14 to 2018-19, quantity in lakh MT
Source: Coir Board and Cochin Port Trust
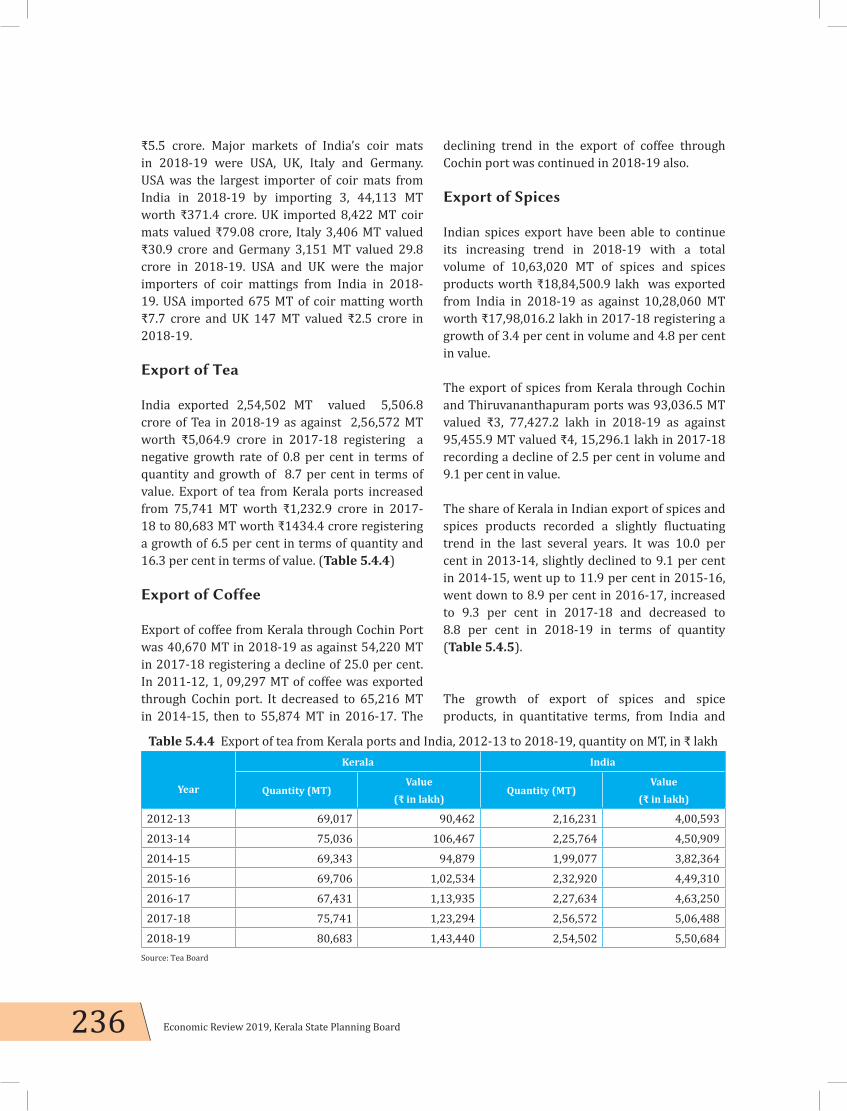
236 Economic Review 2019, Kerala State Planning Board
₹5.5 crore. Major markets of India’s coir mats in 2018-19 were USA, UK, Italy and Germany. USA was the largest importer of coir mats from India in 2018-19 by importing 3, 44,113 MT worth ₹371.4 crore. UK imported 8,422 MT coir mats valued ₹79.08 crore, Italy 3,406 MT valued ₹30.9 crore and Germany 3,151 MT valued 29.8 crore in 2018-19. USA and UK were the major importers of coir mattings from India in 2018-19. USA imported 675 MT of coir matting worth ₹7.7 crore and UK 147 MT valued ₹2.5 crore in 2018-19.
Export of Tea
India exported 2,54,502 MT valued 5,506.8 crore of Tea in 2018-19 as against 2,56,572 MT worth ₹5,064.9 crore in 2017-18 registering a negative growth rate of 0.8 per cent in terms of quantity and growth of 8.7 per cent in terms of value. Export of tea from Kerala ports increased from 75,741 MT worth ₹1,232.9 crore in 2017-18 to 80,683 MT worth ₹1434.4 crore registering a growth of 6.5 per cent in terms of quantity and 16.3 per cent in terms of value. (Table 5.4.4)
Export of Coffee
Export of coffee from Kerala through Cochin Port was 40,670 MT in 2018-19 as against 54,220 MT in 2017-18 registering a decline of 25.0 per cent. In 2011-12, 1, 09,297 MT of coffee was exported through Cochin port. It decreased to 65,216 MT in 2014-15, then to 55,874 MT in 2016-17. The
declining trend in the export of coffee through Cochin port was continued in 2018-19 also.
Export of Spices
Indian spices export have been able to continue its increasing trend in 2018-19 with a total volume of 10,63,020 MT of spices and spices products worth ₹18,84,500.9 lakh was exported from India in 2018-19 as against 10,28,060 MT worth ₹17,98,016.2 lakh in 2017-18 registering a growth of 3.4 per cent in volume and 4.8 per cent in value.
The export of spices from Kerala through Cochin and Thiruvananthapuram ports was 93,036.5 MT valued ₹3, 77,427.2 lakh in 2018-19 as against 95,455.9 MT valued ₹4, 15,296.1 lakh in 2017-18 recording a decline of 2.5 per cent in volume and 9.1 per cent in value.
The share of Kerala in Indian export of spices and spices products recorded a slightly fluctuating trend in the last several years. It was 10.0 per cent in 2013-14, slightly declined to 9.1 per cent in 2014-15, went up to 11.9 per cent in 2015-16, went down to 8.9 per cent in 2016-17, increased to 9.3 per cent in 2017-18 and decreased to 8.8 per cent in 2018-19 in terms of quantity (Table 5.4.5).
The growth of export of spices and spice products, in quantitative terms, from India and
Table 5.4.4 Export of tea from Kerala ports and India, 2012-13 to 2018-19, quantity on MT, in ₹ lakh
Year
Kerala India
Quantity (MT)Value
(₹ in lakh)Quantity (MT)
Value(₹ in lakh)
2012-13 69,017 90,462 2,16,231 4,00,5932013-14 75,036 106,467 2,25,764 4,50,9092014-15 69,343 94,879 1,99,077 3,82,3642015-16 69,706 1,02,534 2,32,920 4,49,3102016-17 67,431 1,13,935 2,27,634 4,63,2502017-18 75,741 1,23,294 2,56,572 5,06,4882018-19 80,683 1,43,440 2,54,502 5,50,684
Source: Tea Board

237Chapter 5, Service Sector
Kerala registered fluctuating trend for the last several years. The growth of export of spices and spice products from India was 9.4 per cent in volume in 2014-15. It registered a negative growth of 5.7 per cent in 2015-16, went up to 12.4 per cent in 2016-17 and decreased to 3.4 per cent in 2018-19.
Kerala’s export of spices and spice products, in quantitative terms, also recorded a fluctuating growth. It was 0.2 per cent in 2014-15, rose to 22.7 per cent in 2015-16, went down to a negative growth rate of 15.6 per cent in 2016-17, went up to 13.1 per cent in 2017-18 and recorded a negative growth of 2.5 per cent 2018-19, Figure 5.4.8 depicts the trend in growth of export of spices and spice products from India and Kerala.
As far as individual spices are concerned, a total volume of 2,097 MT of cardamom (small) valued ₹273.2 crore was exported from Kerala through Cochin and Thiruvananthapuram ports in 2018-19 as against 4,434 MT valued ₹497.8 crore in 2017-18, registering an decrease of 52.7 per cent in volume and 45.1 per cent in value. Export of chilli increased from 22,895 MT valued 363.4 crore in 2017-18 to 23,122 MT valued ₹418.0 crore registering a growth of 1.0 per cent in volume and 15.0 per cent in terms of value. In 2018-19, export of pepper was 12,504 MT valued ₹517.6 crore as against 15,168 MT valued ₹732.8 crore in 2017-18 registering a negative growth of 17.6 per cent in volume and 29.4 per cent in value. Export of chilli, turmeric, coriander, cumin, celery, fennel, fenugreek, other seed spices, other
Table 5.4.5 Export of spices, India and Kerala, from 2013-14 to 2018-19, quantity in MT and value in ₹ lakh
Year
Kerala India Kerala’s share (%)
Quantity (in MT)
Value (₹ lakh)
Quantity (in MT)
Value (₹ lakh)
Quantity Value
1 2 3 4 5 6 7
2013-14 81,412.6 3,25,339.9 8,17,250.0 13,73,539.3 10.0 23.72014-15 81,555.3 3,28,534.0 8,93,920.0 14,89,967.5 9.1 22.12015-16 1,00,076.0 3,90,518.1 8,43,255.0 16,23,823.0 11.9 24.12016-17 84,418.8 4,27,120.1 9,47,790.0 17,81,223.6 8.9 24.02017-18 95,455.9 4,15,296.1 10,28,060.0 17,98,016.2 9.3 23.12018-19 93,036.5 3,77,427.2 10,63,020.0 18,84,500.9 8.8 20.0
Source: Spices Board
Figure 5.4.8 Trend in growth of export of spices and spice products from India and Kerala, 2014-15 to 2018-19, in quantity, in per cent
Source: : Spices Board
238 Economic Review 2019, Kerala State Planning Board
miscellaneous spices and mint products showed an increase in volume during the period of review compared to previous year. In the case of value added products export of curry powder/mixture in 2018-19 was 9,388 MT valued ₹220.1 crore as against 9,936 MT valued ₹213.8 crore in 2017-18 registering a decline of 5.5 per cent in volume and an increase of 3.0 per cent in value. A total volume of 8,127 MT of spice oils and oleoresins valued ₹1671.2 crore was exported in 2018-19 as against 9,076 MT valued ₹1718.9 crore of previous year registering a negative growth of 10.5 per cent in volume and 2.8 per cent in value.

239Chapter 5, Service Sector
5.5 Service Sector
Public Services
1. Survey and Land Records
The Department of Survey and Land Records has been constituted for completing the re-survey process of the entire land holdings in the State within a stipulated period. Along with this, the department also works on land management, digitisation of land survey records, survey of land for facilitating distribution of pattayam (ownership deed of land), forest land survey and survey of land for special projects. The department had completed re-survey of land in 906 villages till 2019, with the re-survey work of 758 villages remaining to be completed. In the period of four years (2016-2019), digitisation of FMB in 381 villages were completed. Details of resurvey from 2016 to 2019 (upto August 31, 2019) are given in Appendix 5.5.1.
The department also acts as the authority on re-survey appeals and LA (Land Acquisition) appeals. The District Collector takes final decision on the recommendation of District survey superintendent on such appeals. In the year 2018, the District offices have finalised 5,66,220 cases (86.9 per cent) out of 6,51,274 appeals on re-survey. It also finalised 2 cases out of 199 appeals received on LA. Details are shown in Appendix 5.5.2.
The Survey department imparts training to IAS officers, officials of revenue department,
officials of survey department, officials of forest department etc. Details are shown in Appendix 5.5.3.
Digitisation of Land Records
The Survey department is entrusted with work of the digitisation of Survey records. 184 block maps were prepared in 2017. Details are given in Appendix 5.5.4. The existing land records are scanned and kept it in digital form. In 2016, 2017 and 2018, the number of Field Measurement Book (FMB) scanned are 3,34,682, 65,402, and 24,020 respectively. During this period, most number of FMB was scanned in Palakkad District (1,07,568) and least number of FMB were scanned in Kozhikode District (5,401). Figure 5.5.1 shows the District-wise details of FMB scanned in three years.
2. Registration Department
The mandate of Registration department is to facilitate registration of documents. The department had successfully implemented e-payment system for the collection of registration fee. In 2018, the department collected a total of ₹3,27,170.8 lakh as document registration fee. Out of this, ₹2,77,026 lakh is for sale conveyance which is the major component. Details of document registered and fee collected are given in Appendix 5.5.5 and Appendix 5.5.6. The department also started digitisation of old documents.
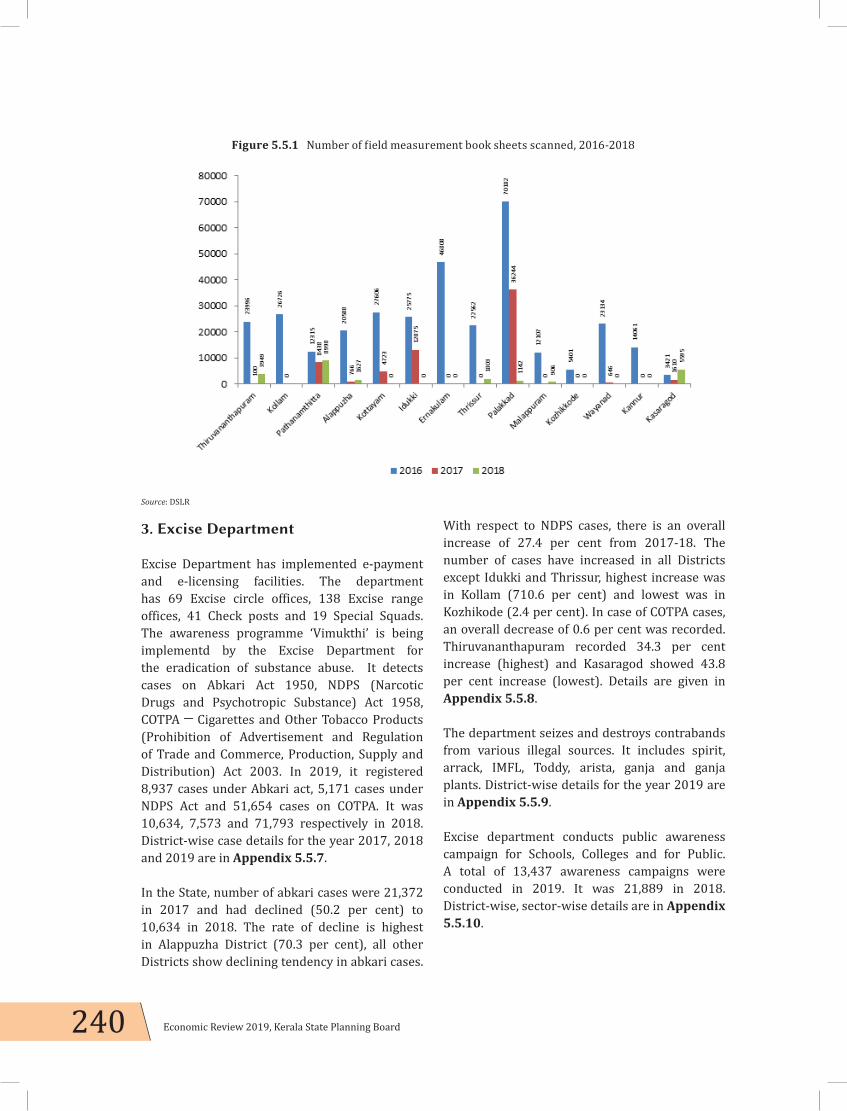
240 Economic Review 2019, Kerala State Planning Board
3. Excise Department
Excise Department has implemented e-payment and e-licensing facilities. The department has 69 Excise circle offices, 138 Excise range offices, 41 Check posts and 19 Special Squads. The awareness programme ‘Vimukthi’ is being implementd by the Excise Department for the eradication of substance abuse. It detects cases on Abkari Act 1950, NDPS (Narcotic Drugs and Psychotropic Substance) Act 1958, COTPA ─ Cigarettes and Other Tobacco Products (Prohibition of Advertisement and Regulation of Trade and Commerce, Production, Supply and Distribution) Act 2003. In 2019, it registered 8,937 cases under Abkari act, 5,171 cases under NDPS Act and 51,654 cases on COTPA. It was 10,634, 7,573 and 71,793 respectively in 2018. District-wise case details for the year 2017, 2018 and 2019 are in Appendix 5.5.7.
In the State, number of abkari cases were 21,372 in 2017 and had declined (50.2 per cent) to 10,634 in 2018. The rate of decline is highest in Alappuzha District (70.3 per cent), all other Districts show declining tendency in abkari cases.
With respect to NDPS cases, there is an overall increase of 27.4 per cent from 2017-18. The number of cases have increased in all Districts except Idukki and Thrissur, highest increase was in Kollam (710.6 per cent) and lowest was in Kozhikode (2.4 per cent). In case of COTPA cases, an overall decrease of 0.6 per cent was recorded. Thiruvananthapuram recorded 34.3 per cent increase (highest) and Kasaragod showed 43.8 per cent increase (lowest). Details are given in Appendix 5.5.8.
The department seizes and destroys contrabands from various illegal sources. It includes spirit, arrack, IMFL, Toddy, arista, ganja and ganja plants. District-wise details for the year 2019 are in Appendix 5.5.9.
Excise department conducts public awareness campaign for Schools, Colleges and for Public. A total of 13,437 awareness campaigns were conducted in 2019. It was 21,889 in 2018. District-wise, sector-wise details are in Appendix 5.5.10.
Figure 5.5.1 Number of field measurement book sheets scanned, 2016-2018
Source: DSLR

241Chapter 5, Service Sector
4. Police Department
Police Department is an important agency of State Government with the main duty of maintaining law and order along with crime investigation. The department has different wings such as General Executive Wing, Crime Branch, Armed Police, State Crime Record Bureau, Training Wing, Special Branch and 11 specialised wings. The specialised wings include Forensic Division, Women Cell, Traffic Police, Watch and Ward, Highway Police, Coastal Police, Temple Police, Tourism Police, Mounted Police, Dog Squad, and Police Band. The General Executive Wing in working among people and it has a Head Quarter in Thiruvananthapuram, North and South Zones, four police ranges and 19 police Districts.The State Government implement several Plan schemes through police department. The department implements gender sensitive schemes. It has 14 Pink control rooms and 18 Counselling Centres. There are 566 Nirbhaya Voluntaries Working along with police department. Details are in Appendix 5.5.11. The department works along with people through community policing schemes. All the 481 police stations are now converted as Janamaithri police stations during the period under report. There are 5,438 men and 1,528 women in Janamaithri Suraksha Samithi. Details are in Appendix 5.5.12.
The Student Police Cadet (SPC) Project is a school-based initiative by Kerala Police, implemented jointly by the Departments of Home and Education, and supported by departments of Transport, Forest, Excise and Local Self-Government. The project trains high school students to respect the law, practice discipline and civic sense, and develop empathy for vulnerable sections of society. It also strengthens commitment towards family, community, and the environment, enabling them to resist negative tendencies such as substance abuse, deviant behaviour, intolerance, and other social evils. The Project was launched on August 2, 2010 in 127 high schools/higher secondary schools across Kerala. Presently, there are 58,689 cadets in 701 schools in which SPC was implemented. Out of 701 schools, 409 are Government schools, 268 are aided schools and 24 are unaided schools. Details are in Appendix 5.5.13 and 5.5.14.
The NRI cell of police registered 15 cases in 2017-18. Details are given in Appendix 5.5.15. The Cyber and high tech enquiry cell had registered 1,790 cases in 2018-19 up to October 2019, which was 1,170 in 2017-18. Figure 5.5.2 shows the increasing trend of cybercrimes reported during the period 2013-14 to 2018-19.
Social media abuse, Online cheating, Cyber offences done through Smart phones, Hacking
Figure 5.5.2 Number of crimes registered in Cyber Cell
*Up to 30.08.2019Source: Police Department

242 Economic Review 2019, Kerala State Planning Board
of Bank Accounts and e-mail ids, Creation, publishing and sharing of child pornography etc. are the major cyber-crime cases reported during the period under report. Details are given in Appendix 5.5.16.
4. Public Services (Jails)
Prisoners can be reformed as good citizens only if an appropriate atmosphere enabling them to live a life of dignity is created in prisons. It is essential to develop a sense of dignity among the prisoners and thereby send them to the society as a good citizen. Hence the prison administration should be aimed at ensuring the return of the offender to the society not only as a law abiding citizen, but also as one who is able to lead a well adjusted and self-supportive life. The basic duty and responsibility of prisons department is to provide safe custody of all persons committed to jails. All persons admitted to the jail are entitled to hygienic living conditions, adequate food, clothing and medical care, as envisaged in the law. Rehabilitation of prisoners requires more importance and is a psycho sociallogical process of re-educating and restraining those who commit crimes. The ultimate aim is to reintegrate offenders into society so that they can live a dignified life.
In Kerala, the jail infrastructure consists of 55 jails including 3 Central prisons. The Central prisons are at Kannur, Viyyur and Thiruvananthapuram. The present authorized capacity of all the jails is 7200. As on August 2019, there were 7,287 prisoners, of whom 158 are women. Modernisation of Prisons and Welfare of Prisoners are the two major schemes implemented by the Prison department. Borstal School is situated at Thrikkakkara, Ernakulam, accommodating 60 inmates. There are 400 prisoners under the age group of 18-21. The mission of the department is to make all efforts to ensure that the prisoners become reformed and self-sustainable individuals with acceptable social behaviour on release after their completion of sentence.
Services Provided by Prisons Department
Kerala Prisons Department is rendering services to protect the following rights of prisoners subject to the provisions of law. Right to:
a) ToLlive with human dignityb) Adequate diet, health and medical care,
hygienic living conditions and proper clothing
c) Communication with family members, friends, legal advisors and other persons
d) Access to legal service and legal aide) Protection against unlawful aggression on
his/her person or against imposition of ignominy in any manner not authorised by law
f) Protection against unreasonable discrimination
g) Protection against punishment or hardship except through procedure established by law and
h) do with due opportunity of defense;i) Pursuing his/her religious faithj) Protection against labour not authorised by
law or in excess of the prescribed period or without payment of wages at the prescribed rate
k) Enjoyment of fundamental rights under chapter III of the Constitution of India in so far as they do not become incapable of enjoyment following conviction and confinement; and
l) Effective training in socially meaningful vocation
m) Release on due date
Legal Framework
The legal and regulatory framework for the Probation system is based on 1958 Probation of Offenders Act, Kerala Borstal School Act, 1961, and the Kerala Probation of Offenders Rules 1960. As there is no State policy for probation, the legal and regulatory framework is based on the previous approach followed by the Prison Department which handled this matter earlier.

243Chapter 5, Service Sector
Later, the responsibility shifted to Social Welfare Department, as it was felt that probation was not only an approach of non-institutional correction and control, but also one of the welfare and care of the offender. Now, a draft State policy for probation and the legal and regulatory framework is submitted to Government for approval.
The Kerala Prisons and Correctional Services (Management) Act, 2010
This Act is to provide for the safe custody, correction, reformation, welfare and rehabilitation of prisoners and management of prisons and correctional services in the State and for related matters.
The Kerala Borstal School Act, 1961
An act to make provision for the establishment and regulation of borstal schools in the State for the detention and training of adolescent offenders. Borstal school means corrective institution where adolescent offenders are given such industrial or agricultural training and other instructions, and subjected to such disciplinary and ethical influences which would facilitate their reformation and the prevention of crime. It is the institution meant for housing adolescent offenders between the age of 18-21 for better rehabilitation and reformation.
The Probation of Offenders Act, 1958
This act includes the provisions for the release of offenders on probation or after due admonition and for matters therewith. When any person is found guilty of having committed an offence punishable under sections of the Indian Penal Code, or any offence punishable with imprisonment for not more than two years, or with fine, or with both, under the Indian Penal Code, or any other law, and no previous conviction is proved against him and the court by which the person is found guilty is of opinion that, having regard to the circumstances of the case including the nature of the offence, and the
character of the offender, it is expedient so to do, then, notwithstanding anything contained in any other law for the time being in force, the court may, instead of sentencing him to any punishment or releasing him on probation of good conduct release him after due admonition.
Kerala Probation of Offenders Rules 1960
Following the Probation of Offenders Act, 1958, Kerala Probation of Offenders Rules 1960 came into force to exercise the powers conferred by the PO Act. This makes the provisions for the institutional arrangements and functional frameworks in the State for implementation of the Act. Probation Service is the way in which prisoners are allowed to live in society while retaining the punishment.
State Institute of Correctional Administration (SICA)
This is the institution meant for imparting training to personnel of the department, preference being given to correctional treatment to cope up with the modern trends in the field. State Institute of Correctional Administration is situated at Poojappura, Thiruvananthapuram.
Probation
Probation is a universally accepted, effectively tried out, widely practiced non institutional method to be used by Judiciary at their discretion to treat and rehabilitate a good variety of selected offenders, especially young or first time offenders, without sending them to prison. It is a non-institutional treatment method designed to facilitate the social re-adjustment of offenders. It developed as an alternative to imprisonment. Probation is a method of dealing with specially selected offenders and consists of the conditional suspension of punishment while the offender is placed under the personal supervision of the probation officer and given individualised treatment. The object of probation is the ultimate re-establishment of the offenders
244 Economic Review 2019, Kerala State Planning Board
in the community. Probation helps to reduce recidivism, including incidence of sexual offences, and reduce other crimes. It also helps to reduce over crowding of prisons and thereby provides a cost effective method of dealing with selected offenders.
Plan Schemes for the Welfare Activities of the Prisoners
Modernisation of Prisons
As part of providing better atmosphere to prisoners, various modernization programmes are being implemented under this scheme. Construction of building for prisons, Sub jails, Kitchen blocks, Weaving block and Borstal school, and other infrastructure works are the activities undertaken for improving the development in prisons.
Welfare of Prisoners
The scheme envisages projects for various welfare activities, projects for improving security of jails, vocational training to inmates, organization of jail welfare day, re-orientation course and State level seminars, continuing education programme/yoga class, installation of CCTV surveillance system, and productive projects such as working in dairy farm and goat farm. Details of prisoners in jails are given in Appendix 5.5.17.
Assistance to After Care and Follow-up Services and Victim Rehabilitation implemented by Social Justice Department
It is the policy of the government to release the prisoners prematurely based on their good behaviour and efforts to reform. As part of this, financial assistance is provided to ex-convicts, probationers, ex-inmates, dependent of indigent convicts. Also there are other assistance provided such as skill development training for victims of violence, educational assistance for the children of prisoners, aftercare follow up and financial
assistance for setting up of self-employment units or for facilitating placements. The social justice department provides ₹15,000 grant to released prisoners for starting livelihood activities.As part of the scheme, self employment assistance was given to 65 numbers of ex-convicts/Probationers. Financial assistance was given to 36 dependents of convicts for self-employment in 2018-19.
Educational Assistance to Children of Prisoners
Once persons are lodged in jail, it is their families that suffer the most in many cases. Due to lack of money, their children might be denied education at a very early age itself. This might have adverse repercussions later. Therefore, the government has initiated such a project that aims at bringing these children into the main stream of the society. The monthly assistance (10 months) given is ₹300 for 1st to 5th Std, ₹500 for 6th to 10th Std., ₹750 for 11th and 12th Std and ₹1,000 for Degree/Professional course. Educational assistance was given to 280 children of prisoners during 2018-19.
Major Achievements in 2019
• The department received sanction for establishment of retail outlet of Indian Oil Corporation Ltd. at the premises of Central Prison and Correctional Homes Thiruvananthapuram/Viyyur/ Kannur and Open Prison and Correctional Home, Cheemeni.
• Various vocational training programmes were conducted to train prisoners in knowledge and skills which would strengthen their will to work. These also provide opportunities for the inmates to engage themselves in fruitful pursuits during the term of their sentence in jails and enable them to follow a vocation on release from the jails enabling them to earn livelihood after their release from prison. The trainings are imparted in areas such as beautician course, driving, tailoring, fashion designing, electrical hardware, building

245Chapter 5, Service Sector
construction, food processing, bakery food making, plumping, screen printing, organic farming, computer hardware assembling, lift operation, vocational training given for making wooden type of soft dolls in Open prison, Nettukaltheri and soft doll making in Women prisons.
• Three new jails constructed under 13th Finance Commission Award started functioning. District Jail, Idukki started functioning in November 2018. High security prison started functioning in July 2019 and District Jail, Palakkad was inaugurated in July 2019
• The online delivery of food items prepared in Central prisons Thiruvananthapuram/Viyyur in tie-up with ‘Swiggy’, and ‘Uber’ has been started.
• The department extended its helping hand to the flood affected area during the flood in 2018 and in 2019, by providing food, and water from the food unit of jails.
• The department started a mission “Jail Jyothi” to ensure total literacy to prisoners with the support of State Literacy Mission and provides facilities for continuing education and higher education to the inmates.

246 Economic Review 2019, Kerala State Planning Board
5.6 Outreach to Public
The Information and Public Relations Department is the nodal agency of the GoK to disseminate information to the public through various media on government policies, programmes, schemes, initiatives and achievements. Also feedbacks on the public opinion are being given to the Government so as to maintain a communication flow between the state Government and its public.
The department has initiated new strategies to popularize government policies and activities by using new media and other technological advancements including mobile journalism and internet radio. The department has given thrust on its campaigns for Rebuild Kerala Initiatives and the Four Missions of the Government. Outdoor Publicity, Enhancement of Information Centres at district level and Strengthening of Social Media Cell are being given due importance to reach out to the public.
The details of the major achievements of the department in 2018-19 are summarised in Box 5.6.1.
Various schemes implemented by the Public Relations Depatrment are detailed below as follows.
Visual Media
Visual Media Division includes News Wing, Programme Production, Audio-Video
Documentation and Electronic Media Marketing. Distribution of video news clippings to television channels, social media, production and distribution of advertisements (audio and video), production of documentaries and short films, documentation and archiving and production of Chief Minister’s weekly interactive television programme – Naam Munnottu (telecast on Doordarsan and eleven private channels) are done through this division. It undertakes the production, telecast and broadcast works of weekly television and radio programmes. And they include telecast of Navakeralam and Priyakeralam on Doordarsan and Janapatham radio program (All India Radio, all stations in Kerala).
Web and New Media
The Web and New Media division of I&PRD undertakes the content management of government web portal – www.kerala.gov.in. This bilingual (English and Malayalam) portal provides information on Cabinet members, their portfolios and contact details, responsibilities, services and contact details of various government. departments, directorates, boards, companies and corporations. This portal is also the gateway to more than 40 e-services of the government. For those interested in the demography, geographical, socio-cultural, economic and historic aspects of the State, the portal serves as a handy online reference. www.kerala.gov.in is also a repository of

247Chapter 5, Service Sector
documents and public can search and download government orders, Cabinet decisions, CMDRF orders, notifications, circulars, application forms, policy documents, publications, acts and rules, reports and tenders. It also comes with options for the public to rate the performance of government departments and can access work reports pertaining to best practices by various government departments. Daily government press releases and announcements also feature as part of the portal. Various government publications are also made available through this portal. Annually, the Web and New Media division publishes the results of SSLC, Higher Secondary and Vocational Higher Secondary
through the government web portal and the official website of I&PRD. Web and New Media division also manages the social media accounts of I&PRD like Twitter, Facebook and YouTube which were effectively used during the devastating flood in August 2018 for reaching out to people with timely updates and news on various government interventions to address the situation.
Media Relations
Press release section of the department is issuing the news reports of government functions and other official notifications regularly to the media.
Box 5.6.1 Major achievements of Department of Information and Public Relations (I&PRD), 2018-19
1. Conducted Exhibitions and various programmes in 13 Districts in connection with the 2nd anniversary celebrations of the Government, Special Campaign on completion of 1,000 days of the Government, Special Programmes in connection with 82nd anniversary of Temple Entry Proclammation and Constitution Day Programmes in Schools.
2. Live streaming of major events through PRD Live. Developed 3 mobile apps - PRD Live, Feed and Media Handbook. Formation of Government Social Media Cell.
3. Broadcast of weekly TV programmes, Nam Munnot (CMs interaction) through 12 Channels. YouTube channel has also been setup for NaamMunnott Broadcast of weekly TV shows, Navakeralam and PriyaKeralam. Priyakeralam has been restructured and now it has become an in-house initiative. Released more than 8,000 video footages for media. Nipah awareness video and explanatory video of rebuild.kerala.gov.in Rebuild Kerala Initiative were the special initiatives of this period.
4. Conducted online video contest ‘Mizhiv’ and it produced 264 videos on government welfare measures. Conducted Video Documentary Fest. Established Video digital archives at headquarters HQ. Started “visual history of Kerala’’, project to document the history of Kerala. “Janapadham” weekly radio programme has been shifted to FM channels of AIR.
5. World famous, Pulitzer Prize winner, Photographer Nick Ut was brought to Kerala. The eminent photographer documented various places. A Photo Archiving system has been launched in the Directorate.
6. Started issuing Press Releases in Other languages. 7. PRD live mobile registered high hits during examination and election results.8. Free advertisement could be arranged in TV, Radio and Theatre of various Indian States, about
CMDRF during flood days. Participated in Pravasi Bharatiya Diwvas PBD at Varanasi and exhibited Rebuild Kerala initiatives and publicised CMDRF.
9. Published books on Flood, Governmentt Policies, welfare Schemes, CMs Speeches on Renaissance, Constitution, SC verdict on Sabarimala Case, Progress Reports and Government Achievements. Kerala Calling, Janapadham Magazines are now available on web and Facebook.
Source: Public Relations Department, Gok

248 Economic Review 2019, Kerala State Planning Board
Convening press meets, providing better facilities to media reporters for easy reporting are the major activities coming under media relations wing. The scrutiny wing of the department is now scrutinizing the print and visual media on various government policies, programmes and other important issues related to government.
Publications
Publications of reference books, magazines, newsletters, pamphlets are being done by the editorial wing of Publication division. Circulation wing also functions under this division.
Advertisement
IPRD is the official agency for the release of Government advertisements. Advertisement division issues various Departmental advertisements to media and disburses advertisement charges. Production of print and visual advertisements is also done by this division. Other functions include fixing of the government rate for advertisements in print, electronic and online media and maintaining the media list.
Outdoor Publicity and Culture
The outdoor publicity division organizes various awareness programmes and campaigns in the State and district levels as well as outside the State, for giving adequate publicity to Government policies and initiatives. Exhibitions, seminars, workshops, social media and multimedia campaigns, art and cultural forms are used for these purposes.
Research and Reference
The Research and Reference (R&R) wing regularly maintains registers of newspapers and periodicals published in the State as per the directions in the Press and Registration of Books Act PRB Act . The Department started an in-depth training for capacity building, focusing on the new trends and various aspects of Public
Relations like PR Matrix, Crisis Communication, Campaign Planning etc and new technological evolutions like Mobile Journalism (MoJo), Branding, Infographics etc.
Kerala Media Academy
The Kerala Media Academy is the only autonomous institution working under this department. Kerala Media Academy, which was earlier known as Kerala Press Academy was renamed by Government of Kerala during 2014. The main objectives of the Media Academy is to promote and co-ordinate the study and research in the field of journalism, to organise training courses, workshops and seminars, to publish books & periodicals, to institute media awards, to grant fellowships for conducting advanced research in journalism etc. The Institute of Communication, the subsidiary institute of Kerala Media Academy, is conducting four courses on media and more than 100 students are studying in these courses.

HUMAN DEVELOPMENT
06C H A P T E R


251Chapter 6, Human Development
HUMAN DEVELOPMENT6.1 Education
06C H A P T E R
Education is universally accepted as the most important institution to guarantee equality and social justice. The question of accessibility of education – geographically, socially and economically – is important in a country like India with a highly heterogeneous society where large sections of the population still live in the margins and are deprived of basic amenities. Kerala, known for its high social development indicators, has done remarkably well for making education universal and inclusive within its territories. The State has adopted commendable measures to address the needs and requirements of children in all segments with a special attention to marginalised and vulnerable sections.
Serious attempts have been made to make education more inclusive and multifaceted. Specifically designed programmes, with professional expertise and assistance, are being implemented to address the requirements of children with disabilities. Likewise, special focus on extracurricular activities in the areas of sports and arts has been given, though they need further improvements in terms of coverage and scientific assistance. “Pothu Vidyabhyasa Samrakshana Yajnam” (Education Mission) specifically contemplates on bringing holistic changes in the system to meet the varying demands of all stakeholders of school education.
The reforms under Education Mission do not only focus on improving infrastructural facilities
but also ensure that all the students in Kerala acquire the knowledge and skill on par with their peers in other parts of the world. One remarkable intervention during the last three years in school education in the State is the expansion of ICT enabled education, and huge investment – in terms of money and the efforts – made in this direction. It had a positive impact on the students and on the process of teaching and learning. Classrooms, curriculum and pedagogy have been upgraded in line with technological and other transitions.
The government measures adopted in Kerala to improve the efficacy of its education have made public education more popular in the State as compared to the private education. In the last three years, the State has witnessed an increasing tendency among parents to switch their children’s education from private schools to government and government aided schools. There has been a good start to quality enhancement in the public schools of Kerala and it is reflected in the latest NITI Aayog Report, the main high lights of which are given in Box 6.1.1.
Literacy
The spread of literacy has played a significant role in the social and economic development of the State. The status of high human development of the State is attributed to the literacy and education in the State. The increased democratisation, rights consciousness and civic

252 Economic Review 2019, Kerala State Planning Board
awareness in the State are highly attributed to the high level of literacy for decades. As regards literacy, Kerala ranks first in the country with literacy rate of 93.91 per cent closely followed by Lakshadweep (92.28 per cent) and Mizoram (91.58 per cent) (Census of India, 2011). Kerala’s literacy rate, which was only 47.18 per cent in 1951, has almost doubled by 2011. The male, female literacy gap which was 22 per cent point in 1951 has narrowed down to 4.41 per cent in 2011. Kerala holds the first place in the country in female literacy with 92 per cent and Rajasthan records the lowest female literacy rate (52.66 per cent) (Census of India, 2011). Literacy rate of the State from 1951 to 2011 is shown in
Appendix 6.1.1. Variation in literacy rate among the Districts of Kerala is not significant. While Pathanamthitta District (96.93 per cent) reports the highest literacy rate in the State followed by Kottayam (96.4 per cent) and Alappuzha (96.26 per cent), Palakkad District has the lowest literacy rate in the State (88.49 per cent). Literacy rate by sex for Districts in 2001 and 2011 are given in Appendix.6.1.2.
Kerala State Literacy Mission Authority (KSLMA) has been implementing innovative programmes in the field of literacy and continuing education. Literacy is not merely the ability to read and write, but in broad sense it is the basic awareness
Box 6.1.1 NITI Aayog Report 2019
• The School Education Quality Index (SEQI), with reference year 2016- 17, has been developed by the NITI Aayog to provide insights and data-based feedback on the success of school education across the States and Union Territories of India. Developed through a collaborative process including key stakeholders of MHRD and World Bank, the index consists of critical indicators that assess the delivery of quality education of the country.
• These indicators are classified under two categories, namely, (i) Outcomes (ii) Governance Processes aiding Outcomes. First category of Outcome is further divided into four domains, namely, (a) Learning outcomes (b) Access outcomes (c) Infrastructure outcomes and (d) Equity outcomes. The second category, governance processes aiding Outcomes, includes the support system necessary for learning to take place like training, availability of teachers, attendance of both teachers and students, administrative adequacy etc.
• According to the report, Kerala recorded impressive performance by securing 82.17 per cent score and secured the top position. Rajasthan and Karnataka followed the State in the overall performance rankings while Uttar Pradesh remains at the bottom position with 48.4 per cent in overall performance among 20 large States.
• As per the report, the State scores 100 per cent in terms of the transition of students from primary to secondary classes and data shows that Kerala tops, by securing 95.4 per cent, in Inclusive education.
• In the Governance Processes Aiding Outcomes category, Kerala has the highest score of 79.0 per cent while Jharkhand comes in last with a score of 21.0 per cent.
• Karnataka, Rajasthan, Kerala and Andhra Pradesh have the highest scores on the Outcomes category, mainly due to their strong performance on Learning Outcomes. Uttar Pradesh, Punjab and Jammu and Kashmir have the lowest Outcomes category scores.
• The report considered the results of National Achievement Survey, 2017 in order to assess the performance in the category of learning outcomes. Kerala has done fairly well in terms of learning outcomes as compared to other States and UTs, however, the State needs to improve the performance of students in various disciplines like Language, Social Science, and Mathematics according to NAS score.
Source: NITI Aayog, 2019

253Chapter 6, Human Development
of how to lead a healthy and progressive social life. Keeping this in mind, KSLMA has launched social literacy programmes in the field of health, environment, gender, renaissance of Kerala, Constitution of India and e-learning. KSLMA conducts focussed and specialised literacy programmes for SC/ST, migrant workers, transgender etc, which are more relevant in the context of Kerala. The adult learners under literacy and continuing education are the direct beneficiaries of these programmes. In the year 2018-19 around 15,00,000 people benefitted under these programmes.
In 2018-19 a special literacy programme for 2,000 slums was launched for focussing the marginalised sections. The most backward slum/s in a local body recommended by the President/Chair person of that particular LSG was selected for the programme. Presently, more than 45,000 learners are benefitting from this programme.
Changathi: The exclusive programme, launched in 2016 is for migrant workers for making them competent in reading and writing. Now the programme has been widely extended to
all Districts and specially designed text book ‘Hamari Malayalam’ has been well accepted by the migrant workers. This special initiative of the State Government is expected to be beneficial for around 25 lakh workers, who migrated to the State from different parts of the country. In 2018-19, the programme was implemented in 14 local bodies and 2,256 migrant workers became literate.
Number of persons who have passed literacy examination through various special literacy programmes is given in Table 6.1.1.
The number of people who attended 7th standard equivalency examination has been increasing for the last two years. Because of the focussed efforts of KSLMA, Preraks could identify the needy persons and enroll them into various levels of equivalency programmes. KSLMA is taking efforts to bring a large number of persons back to studies and to enrol them in 10th and Higher Secondary equivalency courses (Table 6.1.2). The details on the number of people benefited from Equivalency programme of Kerala State Literacy Mission-2019 is given in Appendix 6.1.3.
Table.6.1.1 Status of Special Literacy Programmes, in 2018-19Sl.No. Name of the Programme No. of persons passed
1 Special literacy Programme for Complete Literacy (Aksharalaksham) 212392 Special Project for Scheduled tribe (Attapadi) 2553
3 Special Project for Scheduled tribe (Wayanad) 43094 Literacy Programme for migrant Labourers (Changathi) 2256
5Special Literacy/ Equivalency Programme for Scheduled Caste (Navachethana) 1756
6 Special Project for continuing education for Transgender (Samanyaya) continuing
7 Environment Literacy Programme
More than 10 lakh people participated in various programmes
Source: KSLMA
Table 6.1.2 Number of persons who enrolled in higher secondary and 10th equivalency coursesCourse Year Female Male Transgender SC ST Differently abled Total
Higher Secondary 2018 19702 14052 39 9308 1331 288 337932019 19792 12842 36 7779 1220 454 32670
10th 2018 15225 21263 40 8925 1620 354 365282019 15567 18460 29 7786 1381 748 34056
Source: KSLMA

254 Economic Review 2019, Kerala State Planning Board
It is seen that out of the total number of persons benefitting these programmes, SC-ST population constitutes a major portion. Because of the special efforts of KSLMA for the last two years to include transgenders into the programmes, a total number of 65 transgenders could benefit the 10th and higher secondary equivalency programmes in 2019. Likewise, a significant participation of differently abled persons can also be seen. Elementary Education
There were 12,961 schools in Kerala in 2018-19; 4,695 (36.22 per cent) government schools, 7,216 (55.68 per cent) aided schools and 1,050 (8.10 per cent) unaided schools. More government schools are functioning in lower primary (LP) section than upper primary (UP) or high school (HS) sections. Aided schools outnumber government schools in all sections.
Malappuram District has the largest number of schools (1561) in the State followed by Kannur (1308) and Kozhikode (1281). Malappuram also has the largest number of government (553) and unaided schools (201) in the State. But the largest number of aided schools is functioning in Kannur District (963). Details of District-
wise, management wise and stage-wise number of schools in Kerala in 2018-19 are given in Appendix 6.1.4.
There are 1,500 schools in the State which are offering syllabi other than the one prescribed by the State government. These include 1288 CBSE schools, 162 ICSE schools, 36 Kendriya Vidyalaya and 14 Jawahar Navodayas. One Jawahar Navodaya Vidyalaya school is functioning in all the Districts. District-wise details of schools with syllabi other than State syllabus in the year 2019-20 are given in Appendix 6.1.5.
Physical infrastructure and facilities in Government Schools
Most of the Government Schools in Kerala are functioning in pucca buildings. Own buildings have to be constructed for 84 government schools which are now working in rented buildings. District-wise details of government schools having building facilities are given in Appendix 6.1.6. Local Self Government Institutions (LSGIs) and programmes like Sarva Shiksha Abhiyan (SSA) have contributed much to the overall development and improvement of physical infrastructure and common facilities in government schools in the State. It is seen that
Figure 6.1.1 Management-wise number of schools in Kerala, in 2019-20
Source: Directorate of General Education

255Chapter 6, Human Development
99.77 per cent of government schools have access to drinking water and 100 per cent have urinals/latrine facilities. But the coverage and quality of these facilities have to be examined. District–wise details of government schools having drinking water/latrines/urinal facilities in Kerala in 2018-19 are given in Appendix 6.1.7.
Enrolment of Students
There is an increase in the enrolment of students in 2019-20 to 37.17 lakh from 37.03 lakh in 2018-19. The increase is more prominent in the enrolment in LP section. The stage-wise enrolment of students in schools in Kerala from 2013-14 to 2019-20 are given in Appendix 6.1.8. Details of management-wise and standard wise enrolment of students in schools in 2019-20 are given in Appendix 6.1.9. In all sections, the students in private aided schools outnumber students in government and unaided schools (Figure 6.1.2). District-wise stage-wise and sex-wise enrolment of students in schools in the State in 2019-20 is given in Appendix 6.1.10. Except in LP section in Thrissur District, boys outnumber girls in all sections and Districts.
During these three years, a positive change happened in terms of enrolment of students in Government and Government
Aided School. Due to the impact of ‘PothuVidyabhyasaSamrakshanaYajnam’ a flow from unaided schools to public schools is seen and 1,63,558 number of students has enrolled additionally in 2019-20 (see chapter 2 for more details).
It is to be noted that due to the demographic reason, naturally the student’s enrolment has to decrease as Kerala is the State where the population growth rate is only 4.9 per cent in 2011. Hence, the increase in enrolment to the public schools is because of flow from unaided schools as well as people’s preference of government or aided schools for the new admission.
Enrolment of Girls in Schools
Girls constitute 48.96 per cent of the total student enrolment in schools. Boys outnumber girls in all the Districts. But the gender gap is very narrow in Kerala in terms of enrolment.
Strength of Scheduled Caste and Scheduled Tribe Students
In 2019-20, Scheduled Caste (SC) students constitute 10.31 per cent of total students in the State. The percentage of SC students in
Figure 6.1.2 Management-wise and section-wise enrolment of students
Source: Directorate of General Education

256 Economic Review 2019, Kerala State Planning Board
government schools, private aided schools and private unaided schools are 13.06 per cent, 9.95 per cent, and 4.06 per cent respectively. It is seen that the percentage of SC and ST students in government schools is higher than that of private aided and private unaided schools (Table 6.1.3).
ST students constitute 1.98 per cent of total enrolment in schools in the year 2019-20. The percentage of ST students in government schools, private aided schools and private unaided schools are 3.70 per cent, 1.32 per cent, and 0.47 per cent respectively in 2019-20. The standard-wise strength of SC/ST students in the State in 2019-20 is given in Appendix 6.1.11. It can be inferred from appendix that out of the total number of SC/ST students in the State, only 4.1 per cent of SC and 2.5 per cent of ST students are enrolled in private unaided schools. The rest are admitted in government and private aided schools. Out of the total ST students, 58.8 per cent is enrolled in government schools
Dropout rate
Kerala has achieved the distinction of having the lowest dropout rate of school students among the Indian States. In the year 2018-19, dropout ratio among school students in Kerala was 0.12 per cent. As per the MHRD report on Educational
Statistics at a Glance, 2018, the all India average dropout rate of primary students is 4.13 per cent while it is 4.03 per cent in upper primary and 17.06 per cent in secondary levels. The dropout ratios in lower primary stage and high school stages are higher compared to that of the UP stage. Dropout rate is highest among high school students. It can also be seen from the Table 6.1.4 that drop-out ratio of high school has declined from 0.33 per cent in 2016-17 to 0.17 per cent in 2018-19. The decline is seen at all stages of school.
Among the Districts, Idukki has the highest dropout ratio in the lower primary (0.43per cent) section. Wayanad has the highest dropout ratio in the upper primary (0.20 per cent) sections followed by Idukki (0.17 per cent). In high school section, Wayanad has the highest ratios with 1.54 per cent followed by Idukki (0.36 per cent) and Ernakulam (0.28 per cent) respectively. District-wise/stage-wise dropout ratio in schools in 2018-19 is given in Appendix.6.1.12.
The dropout ratio of SC-ST students has significantly declined over these years. Dropout ratio of ST students is still higher than that of students from other category (Table 6.1.5). Drop-out ratio among SC students in Kerala in 2018-19 has declined to 0.12 per cent from 0.26
Table 6.1.3 Proportion of SC/ST students in schools, 2019-20Management Others SC ST
Government 83.25 13.06 3.70Private Aided 88.73 9.95 1.32Private Unaided 95.47 4.06 0.47Total 87.71 10.31 1.98
Source: Directorate of General Education
Table 6.1.4 Stage-wise drop-out ratio in schools
2016-17 2017-18 2018-19
Total 0.22 0.16 0.12
L.P 0.2 0.15 0.12
U.P. 0.11 0.1 0.07
H.S. 0.33 0.22 0.17Source: Directorate of General Education

257Chapter 6, Human Development
per cent in 2016-17 and that of ST students has declined to 1.29 per cent from 2. 27 per cent.
District-wise and management-wise details of drop out among SC and ST students in Kerala in 2018-19 are given in Appendix 6.1.13 and 6.1.14. The dropout ratio of ST students in Malappuram and Thrissur is higher than that of all Kerala average. Likewise, the situation of SC students in Kasaragod and Idukki has to improve much to reach at the level of all Kerala average.
Number of Teachers The number of school teachers in Kerala including Teachers Training Institute (TTI) teachers in 2018-19 was 1,62,627. Out of this 97,772 (60.12 per cent) teachers are working in aided schools and 14,266 (8.77 per cent) teachers are working in private unaided schools. The remaining 50,589 (31.11 per cent) teachers are working in government schools. 51.03 per cent of total teachers in the State are teaching in high schools, 24.74 per cent in upper primary schools, 23.89 per cent in lower primary schools and the remaining 0.34 per cent in TTI’s. 74.73 per cent of total teachers in the State constitute women.
Stage-wise and management-wise number of teachers in Kerala in 2018-19 is given in Appendix 6.1.15.
Schools with Less Number of Students
In 2018-19, the total number schools with average strength of less than 25 students were 996 and out of these 382 were government schools and 614 were in the aided sector. There were 37 government lower primary schools having average number of students with less than 10 while the number of schools in this category was 84 in aided sector. District-wise analysis shows that highest number of schools with less number of students was in Pathanamthitta (215) followed by Kottayam (118), Kannur (103), and Alappuzha (103). The highest number of schools with less students in aided sector is Pathanamthitta (154) followed by Kannur (90). In the government sector, Pathanamthitta has the largest (61) number of schools with less number of students followed by Alappuzha (52). Lower primary schools constitutes large chunk of the schools with less number of students. Among the government schools with less number of students, majority are (94.50 per cent) are lower
Table.6.1.5 District-wise dropout ratio in 2018-19District SC ST Others Total
Thiruvananthapuram 0.12 0.22 0.11 0.13Kollam 0.07 0.20 0.05 0.06Pathanamthitta 0.02 0.11 0.03 0.03Alappuzha 0 0 0.02 0.02Kottayam 0.10 0.04 0.07 0.08Idukki 0.40 0.99 0.21 0.33Ernakulam 0.17 1.88 0.20 0.24Thrissur 0.13 3.24 0.05 0.08Palakkad 0.06 0.59 0.12 0.14Malappuram 0.15 3.59 0.06 0.09Kozhikode 0.05 0.11 0.05 0.06Wayanad 0.17 2.11 0.10 0.62Kannur 0.23 0.74 0.04 0.07Kasaragod 0.44 0.27 0.13 0.16Total 0.12 1.29 0.08 0.12
Source: Directorate of General Education

258 Economic Review 2019, Kerala State Planning Board
primary schools. In the aided sector also 87.95 per cent of uneconomic schools is from lower primary section. District wise details of schools with less number of students in the State in 2018-19 are given in Appendix 6.1.16.
Kerala Infrastructure and Technology for Education (KITE)
KITE (Kerala Infrastructure and Technology for Education), a Government of Kerala enterprise set up to foster ICT enabled education in the State schools as well as for upgradation of physical infrastructure in schools is transforming the State run schools by giving it a whole new dimension. Capacity Building, Content Development, Hardware Deployment, eGovernance and Support and VICTERS Channel have been the focus areas of KITE. Through the implementation of ₹493.50 Cr Hi- Tech school project, KITE has made 45,000 Hi-Tech Classrooms (Standard 8 to 12) in 4,752 Government and Aided schools in the State. The project was completed in a record time of within a year and is a result of a collaborative and dedicated effort of professionals and academicians working in KITE. Through focussed interventions, KITE has ensured ICT infrastructure upgradation, academic excellence through Capacity Building, ICT learning environment, Monitoring and Support systems and eGovernance in the educational system. Besides equipping each Hi-Tech classrooms with Laptops, Multimedia Projectors, Sound system, Networking, KITE has also facilitated Samagra Resource Portal as part of Content Development, which has over 28,000 digital resources for all classes from Standard 1 to 12, which is been used in every Hi-Tech classroom. These digital resources include 4,700 videos, 7,502 pictures, 677 audios, 5,704 interactive and 9,229 other files. Using internet as a channel, it enables democratization of education to its most effective level. It also provides academic administration using basic data, field level monitoring and improvement plans through matrix collection, analytics, insight reports etc. A holistic approach of education is materialized through Samagra, which also provides Content
Delivery Network (CDN). With 1,42,915 teachers as registered users, over 5.43 lakh Unit Plans and 8.68 lakh Micro plans till date, the application has received over 8 crore page views. Being made of a FOSS platform, the application enables content sharing, editing and re-distribution unrestricted. KITE has also tied-up with Khan Academy and mGuruEdulabs for content development processes for specific classes.
KITE has also made available High Speed Broadband Connectivity in all schools by roping in two Public sector undertakings BSNL and RailTel. All teachers in the State are empowered with ICT skills equipping them to take the classes effectively and with ease by making use of the ICT facilities provided by KITE in their classrooms. In a process to expand the Hi-Tech facilities to Primary section, KITE is now implementing the ₹292 Cr Hi- Tech Lab Project for LP and UP schools, benefiting 9941 Primary schools in the State.
Through content specific ICT training programmes, KITE has imparted various ICT training for lakhs of teachers in the Kerala schools through its Master Trainer network spanned State wide. The Master Trainers themselves are School teachers deputed in KITE on working arrangement, a strategy which was proven effective in ICT enabled learning environment. In 2019 so far, KITE has imparted ICT trainings for 18,390 Higher Secondary teachers, 20,589 High School teachers, 35,938 Upper Primary teachers and 44,252 Primary teachers.
The Little KITEs IT Clubs is an initiative by KITE to instil genuine interest and creativity among students, by providing specific training in Animation, Cyber Safety, Malayalam Computing, Hardware, Electronics, Internet over Things (IoT) devices, 3D character modelling etc. With over 1.25 student members in over 2,060 schools, Little KITEs is the largest ICT network of students in the Country. Over 50,000 students have been trained in specific areas as part of this initiative.

259Chapter 6, Human Development
Box 6.1.2 School WIKI by KITE
School Wiki (www.schoolwiki.in) is a unique initiative by Kerala Infrastructure and Technology for Education (KITE), erstwhile IT@School, set-up to foster a culture of collaborative learning among students. The unique portal which was launched in 2009, features individual pages for over 15,000 schools in Kerala, which gives a bird’s eye view on the schools’ elementary data, historical references, infrastructure, renowned Alumni, School websites, School Map, Blogs, Class Magazines, supporting images and videos. As on date, School Wiki has 20,425 articles, 29,654 users and over 6,78,659 updations. Made completely in Malayalam, School Wiki features educational contents made by students, teachers, alumni, and public. The portal provides a platform for students, teachers and schools to showcase their areas of excellence. The portal also features the entire set of literary works of students from State Kalolsavam from 2017 onwards.
School Wiki has been prepared using Wikimedia Foundation’s Wikemedia software with the goal of facilitating Collaborative content development and its sharing. SchoolWiki also hosts various educational contents prepared by the students as well as teaching materials collaboratively developed by the teachers. The aim of School Wiki is to bring out collaborative data building and to generate more interest among students to learn Malayalam and to generate more contents in various subjects. The portal has multiple levels of monitoring to ensure updation of only appropriate contents. Some of the features include searching of articles alphabetically, facility to display pictures in Wikicomments directly, Wiki Editor, School Mapping using of Open Street Map, facility to search in Malayalam and English languages etc. In addition to these, School Wiki also has specific extensions such as prettyURL, Upload Wizard, Editcounts, Checkuser, Gadgets and Thanks. SchoolWiki has been designed in such a way that schools can register into the portal using their school codes and upload their contents in their respective space provided under their District. Students, Teachers and even schools are encouraged to create their own ICT contents which form educational resources for the larger learning populace. Through SchoolWiki, these efforts of the students and teachers get a boost in terms of connecting with hundreds of other students and schools, contribute to the collective learning outcomes thereby enhancing the quality in student learning.
In 2019, KITE facilitated the uploading of Digital Magazines of over 2,000 schools in SchoolWiki. The magazines are prepared using Libre Office word processor which is a complete FOSS (Free and Open Source Software) based application. It is the first time ever in India that digital magazines are made available in a public domain in such a large scale. As part of Onam Celebrations of the year, selected pictures of images of Pookalams (Floral Designs) as well as their Digital versions of 2010 schools, created using the Hi-Tech classroom facilities were also uploaded in the School Wiki portal. SchoolWiki is envisaged as the largest comprehensive digital repository of schools- which is first of its kind in the world.
Source: KITE, 2019

260 Economic Review 2019, Kerala State Planning Board
Through the implementation of Hi-Tech school programme, funded by KIIFB (Kerala Infrastructure Investment Fund Board), KITE has provided 59,772 Laptops, 43,525 Multimedia Projectors, 23,104 Projector Screens along with 41,789 numbers of Projector Mounting Kits, HDMI Cables and Faceplates and 42,739 USB Speakers to 4,752 schools. The procurement of ICT equipments to schools was undertaken through the eTender portal of the State Government, strictly adhering to the guidelines stipulated in Store Purchase Manual. All the technical aspects of the projects undertaken by KITE is monitored by the Government appointed Technical Committee, which comprises of senior technical experts from various government institutions. Online system for distribution, complaint management portal supported by Call Center facility are also set-up by KITE. All equipments supplied by KITE carries a 5 year comprehensive warranty. Technical expertise has also been imparted at the District and school level to handle issues effectively. Periodical IT audits in schools ensure proper upkeeping and usage of equipments as envisaged by the Government.
KITE had also implemented several eGovernance initiatives within Education Department in the previous years, such as SAMPOORNA School Management Software, Online Transfer and Posting of Teachers, Noon Meal Distribution system, Scholarships etc. The Government had mandated that any data collection from public schools should be undertaken through Sampoorna alone. This year KITE developed the SAMETHAM School data bank application which details the ready-to-know information of schools with details such as infrastructure, teaching and non-teaching staff, students details (without any personal information) etc. In 2019, KITE developed SAMANWAYA, a web-based software and online system for approval of appointments of teachers of aided schools and staff fixation of all teachers under General Education Department. The new system enables transparent and efficient approval process of appointment of teachers in aided schools, thereby eradicating corruption and time consumption.
Various support mechanisms have also been implemented by KITE, which include a Web-portal and Call Center facility for ICT equipment’s complaint management from schools. Hardware Clinics are conducted periodically to repair faulty ICT equipments in schools. Through the eWaste disposal drive conducted in collaboration with Clean Kerala company, a massive 731 tonnes of eWaste has been disposed from schools and educational offices in Kerala, for proper disposal through scientific methods.
KITE also runs VICTERS educational channel, which is telecast 24/7 from February 2019 onwards. VICTERS has become the most sought educational channel by the students and parents. The channel airs a plethora of educational video contents, systematically developed and vetted, including regional, national and international contents. Educational video contents which are subject wise, pedagogy related, exam oriented, career specific, health are developed by the in house production crew of VICTERS.
Samagra Shiksha, Kerala (SSK)
Samagra Shiksha - an overarching programme for the school education sector came into existence after the Union Budget, 2018-19 which proposed to treat school education holistically without segmentation from pre-nursery to Class 12. It subsumes the three existing schemes of Sarva Shiksha Abhiyan (SSA), Rashtriya Madhyamik Shiksha Abhiyan (RMSA) and Teacher Education (TE). Samagra Shiksha, Kerala has been implementing several programmes with the broader goal of improving school effectiveness measured in terms of equal opportunities for schooling and equitable learning outcomes.
All the activities by the SSK are undertaken in order to achieve the broader objectives of PothuVidyabhyasaSamrakshanaYajnam and to bridge the academic lacuna for ensuring age appropriate education as envisaged in the Right to Education Act.

261Chapter 6, Human Development
Focussing on this agenda, several programmes under the broad categories of Rastriya Avishkar Abhiyan (special programme for mathematics and science), Biodiversity Gardens, Inclusive education of the differently abled children, Bhoumam (programme for social science), Jwala (theater activities for girls), Self Defence, Vocational Education and Pre-Education are being implemented. “Malayalathilakkam”, “Hello English”, “Sureeli Hindi” has been implemented under the Learning Enhancement Programme of SamagraShiksha Kerala and these activities improved the language learning capacity of students
Higher Secondary Education
Higher secondary courses were introduced in the State in 1990-91 to reorganize the secondary level of education in accordance with National Education Policy. There were 2,077 Higher Secondary Schools (HSS) in 2019 in the State. Out of these 839 (40.4 per cent) are Government schools, 858 (41.3per cent) are aided schools and the remaining 380 (18.3per cent) are Unaided and technical schools. Among the Districts Malappuram has the largest number of HSS (248) in the State followed by Ernakulam (209) and Thrissur (203) respectively.
Box 6.1.3 Science Parks in schools — Project of Samagra Siksha Kerala
Samagra Shiksha, Kerala has setup ‘Science Parks’ in schools in classes V, VI, VII in the State for making the learning of science interesting, engaging and enjoyable for learners. Instead of merely learning from the science text books, the experiments in the Science Park enable learners to investigate, develop observation skills, record observations, structure, organise and communicate information, hypothesise, collect and analyse data and draw relevant inferences. Hands-on and minds-on learning activities through experiments are used to reinforce and extend what the students have been reading in the text and what they have learned through class discussions.
Samagra Shiksha Kerala has set up 681 Science Parks in 14 Districts since November 2019. In the academic year 2019-20, 681 more Science Parks have been sanctioned in schools. In the current year Samagra Shiksha has decided to scale up the use of Science Parks for classes IX and X in the secondary stage. In every Science Park, the District team has prepared more than 70 equipment and experiments based on the curriculum and syllabus for classes V to VIII.
The project was implemented with the help of select teachers and technical experts from polytechnic colleges. The ‘Science Park’ equipment and materials were produced from low cost materials like wood, PVC pipes, metal strips, metal plates, rubber tubes, corks, metal wires etc. A sum of ₹30, 000/- has been spent for setting up a Science Park in a school. The experiments in the science park cover areas in science such as pressure, light, motion, inertia, rotational motion, electricity, friction, magnetism, conductivity, heat, reflection, images, mixing of colours, astronomy, solar system, earth, moon and sun and models in biology.
Some of the equipment and experiments set up in the science lab include U-Tube manometer, depth and pressure, sprinkler, magic water tank, magic balloon, tornado, Bernoulli principle, simple pendulum, resonance bar, centrifuge, circuits, thermal expansion, multiple reflection, kaleidoscope, periscope, mini solar system, day and night etc. The State also organised training for teachers in facilitating learners for using the equipments and experiments in the Science Park.
Source: SSK, 2019

262 Economic Review 2019, Kerala State Planning Board
There are 7,249 batches of higher secondary classes in 2019. The enrolment in HSS was 3,84,128. Malappuram had the largest number of batches (1067) with an enrolment of 59,068 students. District-wise and Management-wise number of HSS and number of batches are given in Appendix 6.1.17 and District wise enrolment of students in HSS are given in Appendix 6.1.18.
The pass percentage of students in higher secondary courses has increased from 76.56 per cent in 2017-18 to 84.28 per cent in 2018-19. The details are given in Appendix 6.1.19. The pass percentage of SC and ST students in Higher Secondary schools has increased in 2018-19 compared to 2017-18. The pass percentage of SC students increased from 63.51 per cent to 66.30 per cent and ST students from 62.22 per cent to 65.71 per cent in 2018-19. Details are given in Appendices 6.1.20 and 6.1.21.
Vocational Higher Secondary Education
Vocational higher secondary education was introduced in the State in 1983-84. Vocational higher secondary education in the State imparts education at plus two levels with the objective of achieving self/wage/direct employment as well as vertical mobility. There are 389 Vocational Higher Secondary Schools (VHSS) in the State with a total of 1,101 batches. Out of these 261 are in the Government sector and 128 in the Aided sector. Kollam (52) followed by Thiruvananthapuram (41) has the largest number of Vocational Higher Secondary Schools in the State. District wise details of VHSS and courses in 2019-20 are given in Appendix. 6.1.22.
The percentage of students eligible for higher education in VHS examination in 2019 March is 80.1 per cent (including those who appeared for SAY examination). The number of students who appeared and those who passed Vocational Higher Secondary examination from 2010 to 2019 and the results of school going students (2012-2019) are given in Appendices 6.1.23 and 6.1.24.
University and Higher Education
There are 14 State universities functioning in Kerala. Out of these, four universities viz. Kerala, Mahatma Gandhi, Calicut and Kannur are general in nature and are offering various courses. Sree Sankaracharya University of Sanskrit, Thunchath Ezhuthachan Malayalam University, Cochin University of Science and Technology, Kerala Agricultural University, Kerala Veterinary and Animal Science University, Kerala University of Health Sciences, Kerala University of Fisheries and Ocean Studies, Kerala Technological University offer specialized courses in specified subject areas. Besides these, the National University of Advanced Legal Studies (NUALS) established in 2005 and a Central University incepted in Kasargod District are also functioning in the State.
Arts and Science Colleges
There are 229 arts and science colleges in the State comprising of 163 private aided colleges and 66 government colleges. Apart from these, various un-aided/self- financing arts and science colleges are also functioning in the State with the affiliation of universities. In 2018-19, Ernakulam and Thiruvananthapuram (26 ) had the largest number of arts and science colleges in the State followed by Kottayam (24). Thiruvananthapuram and Kozhikkode have the largest number of government colleges (10) in the State. District-wise number of arts and science colleges in the State in 2018-19 is given in Appendix 6.1.25. The details of self-financing and autonomous colleges in the State is given in Appendix 6.1.26.
Enrolment of Students
Total number of students enrolled in various arts and science colleges (excluding unaided colleges) under the four general universities in Kerala in 2018-19 is 3.28 lakh. Of this, 2.2 lakh (68 per cent) are girls.

263Chapter 6, Human Development
Out of the total students enrolled for degree courses, 47.2 per cent are enrolled for B.A degree courses, 36.6 per cent enrolled for B.Sc and 16.2 per cent enrolled for B.Com degree courses. Girls constitute 68 per cent of total enrolment for degree courses. Gender- wise distribution of enrolment reveals boys’ proportion in B.Com course is higher than B.Sc and B.A.
Education
27 subjects are offered for BA degree courses. Among the subjects, English followed by
Economics has the largest number of enrolment of students. 31 subjects are offered for B.Sc course and Physics followed by Mathematics has the largest number of student enrolment. Details of enrolment of students in arts and science colleges for BA, BSc and B.Com are given in Figure 6.1.3 and in Appendices 6.1.27 to 6.1.29. 20,974 students are admitted to post graduate course in the State in 2018-19. 66.2 per cent of those enrolled in PG courses are girls. Details of enrolment of students in arts and science colleges for M.A, M.Sc and M.Com courses are given in Appendices. 6.1.30 to 6.1.32.
Table 6.1.6 Enrolment of students in arts and science colleges
Course Total Girls Boys per cent of Girls
B. A. 133235 86110 47125 64.6
B.Sc. 103234 77452 25782 75
B.Com. 45624 29012 16612 63.6
Total 282093 192574 89519 68.3
M.A. 15461 10083 5378 65.2
MSc. 19133 12568 6565 65.7
M.Com 6465 4545 1920 70.3
Total 41059 27196 13863 66.2
Grand Total 323152 219770 103382 68.0Source: Directorate of Collegiate Education
Figure 6.1.3 Sex-wise proportion of students in degree courses
Source: Directorate of Collegiate Education

264 Economic Review 2019, Kerala State Planning Board
Scheduled Caste /Scheduled Tribe Students
The enrolment of Scheduled Caste (SC) students in degree and post graduate course in the State is 41,547. SC students constitute 12.9 per cent of total students in 2018-19. The number of Scheduled Tribe (ST) students enrolled for courses in arts and science colleges in 2018-19 is 6,956. Enrolment of SC and ST students in arts and science colleges in Kerala in 2018-19 is given in Figure 6.1.4 and in Appendix 6.1.33. The enrolment of SC-ST students has increased in 2018-19 from 2017-18. The number of SC students in arts and science colleges has increased from 40,609 to 41,547 and
ST students from 6,601 to 6,956. It is also seen that the enrolment is increasing over the last few years and the proportion of SC-ST students’ enrolment is higher than that of their population proportion.
Scholarships
Central and State sector scholarships of 13 types are given to students. Various scholarships including post metric scholarships (63,718), District Merit Scholarship (20,423), Kerala State Suvarna Jubilee Scholarship (4,500) and Central Sector Scholarships (7,218) were given in 2018-19. The details of scholarships offered from 2014-15 to 2018-19 are given in Appendix 6.1.34.
Figure 6.1.4 Percentage of SC/ST students in degree and PG courses
Source: Directorate of Collegiate Education
Table 6.1.7 Percentage of SC/ST students in higher educationCourse Total % of SC % of ST % of others
B. A. 100 10.6 2.5 86.9
B.Sc. 100 15.4 1.0 83.6
B.Com. 100 13.4 1.8 84.8
Total 100 12.8 1.8 85.4
M.A. 100 15.6 5.8 78.6
MSc. 100 11.4 3.2 85.4
M.Com 100 13.4 4.4 82.2
Total 100 13.3 4.4 82.3
Grand Total 100 12.9 2.2 84.9 Source: Directorate of Collegiate Education
265Chapter 6, Human Development
Teachers
The number of teachers in arts and science colleges in the State in 2018-19 was 10,145, out of whom 56.6 per cent constitutes women. University-wise number of teachers in arts and science colleges from 2014-15 to 2018-19 is given in Appendix 6.1.35. 3,605 (35.9 per cent) teachers in arts and science colleges in the State have Ph.D degree. Details are given in Appendix 6.1.36. A total of 2,933 Guest Lecturers were working in arts and science colleges of the State in 2019. Details are given in Appendix. 6.1.37.
Kerala State Higher Education Council
By recognizing the importance of State-level planning and co-ordination for the effective implementation of national level policies in higher education, the National Policy on Education, 1986 suggested that State Council of Higher Education should be set up in all States. Accordingly, the Government of Kerala setup a Higher Education Commission in 2006 under the chairmanship of Dr. K N Panikkar for making recommendations for constituting a Higher Education Council and Kerala State Higher Education Council came into existence on March
Box 6.1.4 State Assessment and Accreditation Centre (SAAC)
State Assessment and Accreditation Centre (SAAC) of Kerala has been formed under the aegis of Higher Education Council, invoking sub section 2- n (iv) of section 4 of the Kerala State Higher Education Council Act,2007, subsequently modified by the Kerala State Higher Education Council (Amendment) Act,2018. The major functions of SAAC are:
• Assess and assign State level accreditation and grades to universities, government and aided colleges, autonomous colleges and self-financing colleges of Kerala, objectively and transparently, using a set of global, national and State specific parameters.
• Rank the higher education institutions of the State, employing metrics of Kerala Institutional Ranking Framework.
• Enhance and ensure the readiness of the higher education institutions of the State to go for NAAC accreditation and grading.
• Impart training and guidance to undergo for national level accreditation.• Sensitize the universities and colleges about the changes taking place internationally and to bring
in complete harmony with the shifting paradigms across the world.• Apply State specific parameters evolved from concepts like equity, social inclusiveness, and
community/development linkage for measuring academic excellence.• Instill higher education policies and Plans of the State to the institution network and academic
community.
SAAC- Vision Statement: To stimulate and promote the horizontal and sustainable development of all higher education institutions of Kerala by employing transparent and methodical measuring means having global, national, State level, regional and local bearing, with prime focus on quality, excellence, competency, adaptability, inclusiveness and social/development linkage.
Mode of Assessment Proposed for SAAC: SAAC proposes to adopt a multi-level, integrated approach in assessing institutions. Once the assessment process is over, an institution will be awarded three fold points/grades and a specific rank in State Institution Ranking Frame Work.
Source: Kerala Higher Education Council
266 Economic Review 2019, Kerala State Planning Board
Box 6.1.5 Pattanam Archaeological Research
Pattanam archaeological site (N. Lat. 10°09.434’; E. Long. 76°12.587’) is located in the Vadakkekara village of Paravur Taluk, about 25 km north of Kochi in the Ernakulam District of Kerala, India. This is a coastal site located in the delta of the Periyar River and is now about 4 km from the Arabian Sea coast. The KCHR undertook nine seasons of excavations at the site of Pattanam from 2007to 2015. The nine seasons of excavations have unearthed a large volume and an array of artefacts belonging to different cultures and cultural periods. The site yielded evidences of contact with different parts of the Indian Ocean littoral and the subcontinent, in the form of ceramic classes (including sherds of amphorae, Turquoise Glazed Pottery, Torpedo Jars, Indian Rouletted Ware and Black and Red Ware) , botanical evidence and other artefacts such as semi-precious stone beads. The site also yielded remains of built structures, a canoe, storage jars, ring wells and toilet features. The chronology of the Pattanam site starts from circa 500 BCE. The Early Historic period (3rd century BCE to 5th century BCE) seems to be the most active phase of the site. The site gives important insights into the past of the region during this period, where evidences of the kind has been absent till date.
With the nine seasons of excavations a major phase of the work there is complete. And interim reports have been published. Currently, the KCHR is focusing on the post-excavation studies at Pattanam by supporting and conducting such studies. KCHR has a fully functional office and an exhibition space of the artefacts unearthed at Pattanam which is frequented by visitors. Under the aegis of this project KCHR has initiated steps to develop a research campus at the archaeological site of Pattanam with the support of the Muziris Heritage Project. The research campus will have an interpretation centre, artefact depository and research, laboratory and library facilities for scholars. The KCHR also initiated steps to start new short courses like Epigraphy at this campus.
Source: KCHR
16, 2007. The Council is the principal higher education policy input provider of the State and it strives to bring about equity, access and excellence in higher education sector. The major responsibilities of the Council are:
• Act as an agency for formulating higher education policies of the State.
• Render advice to the government, universities and other institutions of higher education in the State.
• Co-ordinate the activities of various agencies of higher education in the State.
• Initiate new concepts and programmes in higher education.
• Provide common facilities in higher education without impinging upon the autonomy of other institutions of higher education.
The major activities and achievements of the Council over the periods can be summed up as:
• Restructuring of Under Graduate Education (Introduction of Choice Based Credit and Semester System)
• Implementation of Higher Education Scholarship Scheme for the meritorious students in Arts and Science Colleges
• Implementation of Cluster of Colleges Scheme
• Implementation of Erudite Scheme (Scheme formulated to arrange opportunity to the students and teachers of the State to interact with internationally renowned academicians and Nobel Laureates)
• Publication of the journal, Higher Education for the Future.
• Preparation and submission of reports on various issues pertaining to higher education sector.

267Chapter 6, Human Development
Kerala Council for Historical Research (KCHR)
KCHR is an autonomous academic institution, established in 2001, committed to scientific research in archaeology, history and social sciences. It is a recognized research centre of the University of Kerala and has academic affiliations with and has bilateral academic and exchange agreements with leading universities and research institutes in India and abroad. KCHR is to publish a comprehensive volume on the scientific history of Kerala from pre-historic to the present times.
A sustainable/historical tourism project is conceived in the Kodungallur-Paravur zone and KCHR is identified as the nodal agency to provide technical assistance. From 2006-07 onwards KCHR has successfully undertaken the multi-disciplinary excavation at Pattanam. The excavation has yielded significant evidences for re-conceptualizing the early history of Kerala.
Kerala State Skill Development Project and Additional Skill Acquisition Programme (ASAP)
Additional Skill Acquisition Programme (ASAP), part of the State Skill Development Project (SSDP),was launched in 2012 jointly by the Higher and General Education Departments It aims at tackling the problem of educational unemployment by introducing market-relevant foundation training, vocational training and career counseling alongside the general curriculum at the higher secondary and under graduate levels. ASAP has delivered quality skill training in the State to 2,01,409 students from more than 1,100 Higher Secondary Schools and Arts and Science Colleges. ASAP’s success have led it to community skilling and towards futuristic skilling. The conducive environment set by ASAP has scaled up students employability and honed their professional skills.
Trainers Training Academy (TTA): The Trainers Training Academy (TTA) is a novel initiative of ASAP. It was established by ASAP to address the scarcity of competent trainers in the skill development initiatives in Kerala as well as in India. TTA has started functioning from September 2016, and initially its operations were mainly focused on the trainers training programmes of ASAP. With the competence TTA has acquired, it now has the capability to design customized training modules for different entities and has the scope to become a beacon in the skilling scenario of the entire nation.
She Skills: This is an initiative from ASAP to provide skill training on industry relevant skill courses as per NSQF standards to women/girl candidates above the age of 15 years in skill courses of their choice and to complete the training in a stipulated time of 3 months. Candidates above the age of 15 years with a minimum qualification of 10th pass are eligible for enrolment. A total of 192 batches were formed across Kerala and more than 5,000 women are getting trained under this scheme
State Internship Portal: ASAP has started the State Internship Portal to create a State level platform to offer internship to any candidate between the age group of 14-25 with the active involvement of Industries, Institutions and Government Departments. It aims at 1) Creation of network of industries, 2) Develop a large pool of professional mentors and 3) Create a network of interns across the State.
SMILE Camps: Skill Mentorship for Innovative Life Experience (SMILE) was designed for 10th standard completed students across the State in the year 2015-2016 to inculcate confidence, to develop communication, technical and vocational skills and to make them aware of opportunities to earn a living. As a career orientation program, it lays emphasis on gaining experiences through skill training from the most relevant industry partners, experience sharing sessions by practitioners as well as getting opportunities to earn meaningful confidence in facing the society.

268 Economic Review 2019, Kerala State Planning Board
ASAP in association with Higher Secondary Education, implemented career orientation programme for higher secondary students in Agriculture, Media and Automobile sectors for SMILE Programme in 2015 and in 2016 the programme was initiated for the 10th appeared students.
Skill Development Centres: ASAP has established 121 SDCs across the State in government higher secondary schools and colleges. The classrooms of such selected institutions are refurbished as smart classrooms and labs equipped with computers of latest configuration. The SDCs are based on a hub and spoke model of training and each one is connected to nearly 10 educational institutions in its nearby area. While students undergo one extra hour of training on generic skills in their own institutions during regular working days, they assemble in the nearest SDC for industry-relevant training during weekends and public holidays.
Community Skill Parks: To propel itself into community skilling, ASAP is setting up multi skill training centres across Kerala called Community Skill Parks (CSPs) aiming to provide Skills for the community for a better livelihood and stronger economy. CSPs are designed to be world class training centres that offer state of the art courses suiting the changing industry demands. A total of 17 CSPs are to be implemented in the State out of which 9 of them are already operational, while the construction works of the remaining 8 CSPs are in the initial phase.
Advanced Skill Development Centres (ASDC): Technology is fast changing, innovation happens every second in this technology driven world. To keep pace with these technological advancements and to level the skill gap prevailing in the Industry, ASAP has entered futuristic skilling by setting up Advanced Skill Development Centres (ASDC) in Engineering Colleges and Polytechnics.
• Training in futuristic technologies – AI, ML and Data Analytics
• Assessment and certification by Continuing Centre for Education, IIT Madras.
• Hands on training and Compulsory Internship.
• Industry orientation to Polytechnic and Engineering students.
• Advanced technological courses became more approachable.
National Qualification Register (NQR): ASAP has acquired expertise and competence to develop Skill Qualifications as per National Skills Qualification Framework (NSQF). Over the last two years, ASAP has developed five NSQF Qualifications that are now available in the National Qualifications Register (NQR) and for which ASAP is the awarding body. With this ASAP has entered the domain of skill course curriculum development. ASAP qualifications in the NQR are:
• Communicative English Trainer (NSQF Level 6)• Junior Correspondent Course (NSQF Level 5)• Assistant Offset Printing Operator (NSQF Level 4)• Air Cargo Management Executive (NQF Level 6)• Certificate Course in Hi Tech Farm
Management (NSQF Level 6)
Community Colleges: Community colleges are vibrant hubs of aspiration, learning and workforce training. They open their doors to everyone willing to enter and provide affordable skill training to the local community. Under this scheme Polytechnics will act as community colleges to offer futuristic courses based on the needs and aspirations of the public. The purpose of skill development is to create skilled and knowledge based manpower by empowering the learners technically so that they can earn their sustainable livelihood. All courses are NSQF aligned and interested candidates can register for the courses of their interest.
Rashtriya Uchathaar Shiksha Abhiyan (RUSA)
The key objectives of RUSA are to improve access, equity and quality in higher education through planned development of higher education at the State level. Objectives include creating new

269Chapter 6, Human Development
academic institutions, expanding and upgrading the existing ones, developing institutions that are self-reliant in terms of quality education, professionally managed, and characterized by greater inclination towards research and provide students with education that is relevant to them as well nation as whole.
Under RUSA I, an amount of ₹170 crore was approved and out of this, ₹146.97 crore was released in total. ₹88.1 crore was released as Central share and corresponding State share was ₹58.7 crore. As part of this first phase of RUSA, infrastructure grant to 6 universities and 26 colleges, faculty improvement and equity initiatives were approved.
Under RUSA II, an amount of ₹355 crore has been approved. Of this, Central share of ₹93.8 crore and corresponding State share of ₹82.5 crore have been released so far. A RUSA model degree college, 6 Autonomous colleges, 112 colleges for infrastructure grants and 2 universities for Research, Innovationa and Quality improvement
have also been approved under the same.
Technical Education
Technical education aims at human resource development by way of application of technology for the benefit of the society, in terms of improving the quality of life, enhancing industrial productivity and improvising technologies for the overall development of the community. Technical education imparts education to young generation enabling them to contribute to the sustainable development and improvement of quality of life of the society.
Directorate of Technical Education is the nodal department for technical education in the State. The details of technical institutions under the administrative and financial control of Directorate of Technical Education is given in Appendix 6.1.38.
Box 6.1.6 ASAP with NISH and Social Justice Department
Association with National Institute for Speech and Hearing (NISH): ASAP has joined hands with the National Institute of Speech and Hearing (NISH) for providing various skill courses as well as foundation courses to the students of NISH. ASAP has provided Animator skill course and CAD designer skill course under this programme. Batches were formed in the NISH campus in Trivandrum and two institutions of Calicut namely, Rahmaniya VHSS and HSS Kolathara. ASAP has been offering Foundation Module (Communicative English and IT Skills) to hearing impaired students through the specially trained Skill Development Executives at NISH campus.
Association with Social Justice Department: ASAP has been providing training to the inhabitants of institutions under the Social Justice Department. The residents of Government Childrens Home Kottayam were successfully trained in Plumbing Apprentice Programme in the year 2015 and along with that, they were also provided training in the foundation module of ASAP. Similarly in 2016 inmates of Government MahilamandiramKottayam were provided with Assistant Beauty Therapist and students of Government Childrens’ Home Thalassery has trained in Assistant Fashion Designer along with the foundation module of ASAP. Currently, ASAP Foundation module is being offered at Government Mahilamandiram Kozhikode, Boys Home Kozhikode, Girls Home Kozhikode and Government Childrens Home Kottayam.
Source: ASAP

270 Economic Review 2019, Kerala State Planning Board
Engineering Colleges
There are 179 engineering colleges in the State with a sanctioned intake of 51,764 in 2019. Out of these engineering colleges 167 (93.3 per cent) are self-financing colleges (unaided), 9 (5.0 per cent) are government colleges and 3 (1.7 per cent) are private aided colleges. Largest number of the unaided engineering colleges are functioning in Ernakulum (32) followed by Thiruvananthapuram (25). There is no government engineering college in Kollam, Pathanamthitta, Alappuzha, Ernakulam, Malappuram and Kasaragod Districts. The District-wise and management-wise details of engineering colleges and sanctioned intake are given in Appendix 6.1.39. The sanctioned intake of government colleges in 2019 was 3,340 (6.5 per cent), aided colleges 1,843 (3.6 per cent) and unaided colleges 46,581 (89.9 per cent).
Of the engineering colleges in Kerala, the largest number of branch wise seats was in Electrical and Electronics (16,120) followed by Mechanical Engineering (10,315), Computer Science (9,384) and Civil Engineering (9,255). Branch-wise
distribution of seats in engineering colleges in 2019-20 is given in Appendix 6.1.40. The proportion of girls’ annual intake was 38.9 per cent in 2019-20. 1368 students have been admitted in government and aided engineering colleges for post graduate courses in 2019-20. Girl students constitute 64.3 per cent of total students in government and aided engineering colleges studying for post graduate courses. Details are given in Appendix 6.1.41 and 6.1.42.
Academic Excellence in Engineering Colleges
The academic excellence in government engineering colleges is high and appreciable and this was due to the high pass percentage and increasing placement of students in reputed firms.
Government aided colleges performed better than others with 75.8 pass percentage followed by government engineering colleges with 73.5 per cent (Table 6.1.8). The pass percentage of government self-financing colleges (65.1 per cent) is above the private self-financing
Box 6.1.7 Centre of Excellence in System, Energy and Environment
The Centre of Excellence in System, Energy and Environment (CESEE), set up at GCE, Kannur in 2018-19, strives to provide technical, techno-economic and environmentally compatible solutions to the following societal problems which requires urgent attention of the engineering fraternity in Kerala, i.e., 1) waste management, 2) energy shortage and 3) other related environmental issues. CESEE acts as a nodal agency interlinking academia, research centres, implementing agencies and local bodies for the development of sustainable technologies for the effective transfer of appropriate technology specifically directed for management of environment and energy resources. One of the major highlights of the initiatives by the centre is the ‘Carbon neutral Meenangadi’ which is being extended to ‘Carbon neutral Wayanad program’, undertaken by forming a research consortium combining team from TU Delft, Netherlands and MSSRF Wayanad. Clean cooking initiative is another major initiative of the centre, undertaken in collaboration with eminent combustion experts from IISc Bangalore. The centre also conducts conferences, workshops, trainings, public interactions, consultancy and other academic activities throughout the year in diverse topics in the interdisciplinary domain of systems, energy and environment. One of the major events in this direction was the International Conclave on ‘Climate Mitigation, Adaptation and Resilience – Engineering Perspectives’ conducted in March 2019, with academicians and scientists from national as well as international Institutions as participants.
Source: Directorate of Technical Education, Kerala

271Chapter 6, Human Development
engineering colleges which secured 63.4 per cent. Compared to boys, girls performed better with pass percentage of 61.42. It is to be noted that though the registered number of boys are more than girls, the passed number of boys are less than girls. It is disturbing that the pass percentage of SC/ST students (36 per cent and 44.6 per cent respectively) is far below the State average and the figure is little bit better in government and government aided colleges. Only 26.1 per cent of registered ST students in private self-financing colleges could pass the B Tech examination (Table 6.1.9).
The placement record of the students in various government institutions is also relatively high. A large number of students are also being qualified for higher studies through competitive examinations like GATE, CAT etc. Most of the students get placement in multinational firms like WIPRO, MAHINDRA, TCS, and BOSCH etc. Details
of visiting faculty programmes and placement details of students of various government engineering colleges in 2019-20 are given in Appendix 6.1.43 and 6.1.44.
Polytechnics and Technical High Schools
There are 45 government polytechnics and 6 private aided polytechnics in Kerala. The annual intake of students in government polytechnics and private aided polytechnics in 2019-20 are 10,644 and 1,422 respectively. The total number of students in government polytechnics in the year 2019-20 is 29,597 and that of private aided polytechnics is 4,376. Details of annual intake and student strength in polytechnics for the year 2015-16 to 2019-20 are given in Appendices 6.1.45 and 6.1.46. Details of trade-wise annual sanctioned intake in polytechnics of the State in 2019-20 are given in Appendix 6.1.47. Student
Table 6.1.9 Pass percentage of SC/ST B.Tech students, 2019
Management
SC ST
Registered Students
Passed Students
Pass Percentage
Registered Students
Passed Students
Pass Percentage
Government 236 89 37.7 27 15 55.6Private Aided 120 68 56.7 13 7 53.9Government Autonomous 160 47 29.4 2 1 50.0Private Self Financing 485 156 32.16 23 6 26.1Total 1001 360 36.0 65 29 44.6
Source: Kerala Technological University, 2019
Table 6.1.8 B.Tech result, 2019
Management
Boys Girls Total
Registered Students
Passed Students
Pass Percentage
Registered Students
Passed Students
Pass Percentage
Registered Students
Passed Students
Pass Percentage
Government 2054 1428 69.5 1223 979 80.1 3277 2407 73.5
Private Aided 1296 910 70.2 607 533 87.8 1903 1443 75.8
Government Autonomous 2453 1306 53.2 2357 1823 77.3 4810 3129 65.1
Private Self Financing 13963 6246 44.73 9798 8818 67.54 23761 15064 63.4
Total 19766 9890 50 13985 12153 86.9 33751 22043 65.3
Source: Kerala Technological University, 2019

272 Economic Review 2019, Kerala State Planning Board
intake is highest in the trade of Computer Engineering (2020) followed by Electronics Engineering (2010), Mechanical Engineering (1670) and Civil Engineering (1340).
Girls constitute 28.3 per cent of the total strength in polytechnics while their proportion in government and aided polytechnics are 29.2 per cent and 22.3 per cent respectively. Total number of teachers working in polytechnics of the State is 1512. The proportion of female teachers is also less and their proportion is 38.6 per cent. In aided polytechnics, female teachers constitute 28.3 per cent while the respective proportion in government sector is 40.6 which is comparatively high (Appendix 6.1.48).
Details of number of students and teachers in polytechnics are given in Appendix 6.1.48. Number of SC/ST students and SC/ST teachers in polytechnics in the reporting year are given in Appendix 6.1.49. It is seen that the percentage of SC/ST students is low in government as well as in aided polytechnics.
Thirty nine Government technical high schools are functioning in the State. Total number of students in technical high schools in the year 2019-20 is 7843, and 582 teachers are working in technical high schools during this period. Women teachers constitute 28.9 per cent of teachers in technical high schools. Number of students and teachers in technical high schools in 2015-16 to 2019-20 are given in Appendix 6.1.50. Compared to the previous year, the percentage of SC students in technical high schools has declined from 11.7 per cent to 10.9 per cent and the proportion of ST students is 0.8. Details are given in Appendices 6.1.51 and 6.1.52.
As per All India Survey on Higher Education, 2015-16 conducted by MHRD, the gross enrolment ratio in higher education in the State is only 30.8 per cent which is much lower than the neighbouring States. Though there may be under estimation due to non-participation in the Survey, it is a fact that many of the students in Kerala go to other States for higher education and the number of students comes to Kerala from outside is very negligible. This poses the question of quality of higher education in the State. Hence the higher education in Kerala has to be made capable of meeting the increasing opportunities generated by the market. For meeting the needs, the State has to introduce various industry based and innovative courses at higher education level. In order to ensure the quality of higher education, serious and focussed attempts have to be taken to ensure that the number of arts and science colleges with accreditation of National Assessment and Accreditation Council (NAAC) and engineering colleges with accreditation of National Board of Accreditation (NBA) has to be increased. Likewise, the possibility of collaboration with foreign universities and national level renowned institutions can also be explored.
Table.6.1.10 Percentage SC/ST students in Polytechnics
Type of Institution
2017-18 2018-19 2019-20
SC ST Others Total SC ST Others Total SC ST Others Total
Government 6.9 0.7 92.4 100 7.1 1.0 91.9 100 8.0 1.1 91.0 100
Private (Aided) 5.1 0.5 94.4 100 4.6 0.5 94.9 100 5.1 0.5 94.4 100
Total 6.6 0.7 92.7 100 6.8 1.0 92.3 100 7.6 1.0 91.4 100Source: Directorate of Technical Education

273Chapter 6, Human Development
6.2 Medical and Public Health
Kerala’s health sector has been a model for other States of India. The State has made significant gains in health indices such as high life expectancy, low infant mortality rate, birth rate, and death rate. The health standards in the State are comparable with countries of the developed world. The State must ensure that these gains are sustained. Besides, the State also needs to address problems of lifestyle diseases (Non Communicable Diseases) like diabetes, hypertension, coronary heart disease, cancer and geriatric problems. Increasing incidences of communicable diseases like chikungunya, dengue, leptospirosis, swineflu etc. are also major cause of concern. Besides, there are new threats to the health scenario of the State, like mental
health problems, suicide, substance abuse and alcoholism, adolescent health issues and rising number of road traffic accidents. The health status of the marginalised communities like Scheduled Tribes, and fish workers is also poor compared to that of the general population. To tackle these, concerted and committed efforts with proper inter sectoral co-ordination is essential.
Health Indicators of Kerala
Comparative figures of major health and demographic indicators at the State and National level are given in Table 6.2.1.
Table 6.2.1 Demographic, socio-economic and health profile of Kerala as compared to India
Sl. No. Indicators Kerala India
1 Total population (in crore) (Census 2011) 3.34 121.062 Decadal Growth (per cent) (Census 2011) 4.90 17.73 Sex Ratio (Census 2011) 1084 9434 Child Sex Ratio (Census 2011) 964 9195 Birth Rate # 14.2 20.26 Death Rate # 6.8 6.3
Male 7.7 6.7Female 6.0 5.9
7 Natural Growth Rate # 7.3 13.9
8 Infant Mortality Rate # 10 33Male 9 32Female 10 34

274 Economic Review 2019, Kerala State Planning Board
9 Neo Natal Mortality Rate* 5 2310 Perinatal Mortality Rate* 11 2311 Child Mortality Rate* 2 912 Under 5 mortality Rate* 12 3713 Early Neo-natal Mortality Rate* 4 1814 Late Neo-natal Mortality Rate* 1 515 Post Neo-natal Mortality Rate* 4 1016 Crude Death Rate* 6.8 6.317 Death Rate*
(a) Children (0-4) 2.4 11.7(b) Children (5-14) 0.3 1.8(c) Persons (15-59) 20.2 32.1(d) persons (60 and above) 77.1 54.5(e)Per cent of death receiving medical attention*
Government 42.2 28.9
Private 36.3 18.1Qualified profes-sional
15.5 33.2
Untrained/others 6.0 19.818 Still Birth Rate* 7 5
Crude Birth Rate* 14.2 20.219 Total Fertility Rate* 1.7 2.220 General Fertility Rate* 49.8 72.421 Total Marital Fertility Rate* 5.0 4.7
General Marital Fertility Rate* 71.6 110.322 Gross Reproduction Rate* 0.8 1.023 Percentage of live births by type of
medical attention received by moth-ers*
Government 44.9 54.0Private 54.8 27.8Qualified profes-sional
0.2 9.9
Untrained/others 0.1 8.224 Female mean age at effective marriage*
(a) Below 18 16.9 16.7(b) 18-20 19.2 19.2(c) Above 21 24.8 23.9(d) All age 23.2 22.1
25 Couple Protection Rate ## 31.8 40.426 Maternal Mortality Ratio** 42 12227 Expectancy of Life at Birth*** 75.2 69
Male 72.5 67.8Female 77.8 70.4
Source: # SRS 2019May/* SRS Statistical Report 2017/ **Special Bulletin on MMR 2015-17/***SRS Life Table 2013-17/ ## Family Welfare Statistics in India 2011

275Chapter 6, Human Development
Performance in Health Outcomes Index – Niti Aayog
NITI Aayog has released the Performance of States in Health Outcomes Index in June 2019 (Healthy States Progressive India ─ Report on the Ranks of States and Union Territories). It captures overall performance of States in health along with annual improvements in outcomes, governance and processes using different indicators to rank the states. States have been ranked in three categories larger States, smaller States and Union Territories to allow for better comparability. The overall objective of the index is to highlight the top performers and States that are making significant improvements. Kerala ranks at the top in terms of overall performance with an overall score of 74.01. However with respect to annual incremental progress, it ranks at the bottom (16th among 21 larger states). This is because it has already made significant progress in health outcomes and therefore there are only marginal improvements. Among the larger States, Kerala, Andhra Pradesh, and Maharashtra are the top three States in terms of overall performance while Haryana, Rajasthan and Jharkhand are the top three States in terms of incremental performance.
National Quality Assurance Standards (NQAS)
Even though NQAS was started in the year 2013, Kerala was not able to accredit many institutions with NQAS because of certain check points in the NQAS check list which were not suitable for Kerala. The State took initiatives to customize the NQAS check list according to Kerala standards with the help of National Health Systems Resource Centre and checklist was customised according to Kerala conditions in November 2017. The checklist customisation was done by removing some items irrelevant to Kerala conditions and by adding Palliative care into the check list. After customizing the check list, Kerala has made tremendous progress in NQAS accreditation. 55 institutions from the State have already completed national level certification.
Aardram Mission
The Aardram Mission has been launched in the health sector to make Government hospitals people-friendly by improving their basic infrastructure and services. Government hospitals can be made people-friendly to a large extent by ensuring quality health care with minimal waiting time for outpatient medical checkup and other investigation facilities. This would also enable to provide adequate attention to inpatient services. Aardram Mission is being implemented in three stages in Government medical college hospitals, District and taluk hospitals and Primary Health Centres (PHCs). The mission aims to improve the efficiency of service and facilities in the Government hospitals with a view to extend treatment at a reasonable cost, time and satisfaction. Details are given in Chapter 2.
e-Health Project
The e-Health Project targets to link health institutions all over Kerala. The project aims to build a database of individual medical records easily accessible to the medical practitioners. It includes unique patient identification in different settings and exchange of data between different health care delivery units at primary, secondary and tertiary level across State. This could avoid the repeated medical tests and can thereby reduce out of pocket expenses arising out of rush to clinics and labs. The scheme is being implemented in all the fourteen Districts of Kerala with Thiruvananthapuram as the pilot District.
Niti Aayog has appreciated the e-health project of the State. Kerala is the only State in the country where the data base of 25861482 rural people has been collected and stored as electronic records.

276 Economic Review 2019, Kerala State Planning Board
Sustainable Development Goals (SDGs): Targets Set by Kerala
The GoK has declared the short and medium term targets to be achieved by the State in the health sector. The SDG framework specifically SDG 3, set by the United Nations, was chosen as the reference frame for these goals so that targets finalised by Kerala would be aligned to national and international targets. Targets announced by the UN were examined by the working groups for their relevance to the State and were adapted to suit the State’s current epidemiological status and capacity. In addition to the targets listed in the UN documents, Kerala has included targets in dental, ophthalmic and palliative care as they are considered important in the State. The working groups also recommended key strategies to achieve these targets. A survey will evaluate the performance of the State in 2021 to assess the baseline values against which to measure progress towards achievement of the targets.
Health Sector Financing during Plan Periods
Health has been a major area of allocation in the State Budget in the past years. Government healthcare expenditure has been showing a steady increase in recent years. Kerala invests approximate five per cent of its total State Plan outlay on health care excluding the contribution of LGs and other line departments. The outlay earmarked for the implementation of schemes during 12th Five Year Plan was ₹3,31,888 lakh(BE). The total expenditure reported during the Plan period was ₹3,00,600.50 lakh (90.57 per cent). During the first year of 13th Five Year Plan (2017-18) an amount of ₹1,31,495 lakh was allotted for health sector. Of which 89.42 per cent has been expended. Second year (2018-19) outlay was fixed at ₹1,41,930 lakh and 73.24 per cent expended. Third year (2019-20) outlay was fixed at ₹1,40,594 lakh and 36.49 per cent expended up to October 2019. Department-
Table 6.2.2 Department-wise outlay and expenditure, Annual Plan 2015-20, ₹ in lakhs
Department
Annual Plan
2015-16
Annual Plan
2016-17
Annual Plan
2017-18
Annual Plan
2018-19
Annual Plan
2019-20
(Expenditure Up to October)
Outlay%
Exp.Outlay
%
Exp.Outlay
%
Exp.Outlay
%
Exp.Outlay
%
Exp.
Health Services
32,216 67.86 52,174 113.30 72,402 97.74 78,921 84.23 78329 43.38
Medical Education
26,699 89.69 39,388 77.56 47,009 82.25 49,414 56.47 48425 26.34
Indian Systems of Medicine
2,670 93.85 3,412 94.06 4,320 81.56 4,820 70.10 4755 40.79
Ayurveda Medical Education
2,567 94.60 3,364 55.50 4,600 48.51 5,060 50.82 4975 24.46
Homoeopathy 1,440 91.26 1,983 76.26 2,300 88.37 2,700 100 2660 30.16Homoeo Medical Education
945 93.78 990 24.30 864 42.98 1,015 100 1000 43.62
Total 66,537 79.65 1,01,311 95.24 1,31,495 89.42 1,41,930 73.24 140594 36.49Source: Plan Space

277Chapter 6, Human Development
wise Plan outlay and expenditure during the last four Annual Plan period and total outlay and expenditure upto October 2019 (2019-20) is given in Table 6.2.2.
Major Health Problems in Kerala
Communicable Diseases
Kerala is witnessing an increasing burden of communicable and non-communicable diseases. Although the State has been successful in controlling a number of communicable diseases earlier, the emergence of dengue, chikungunya, leptospirosis, malaria, hepatitis, H1N1, in recent years has led to considerable morbidity and mortality. Instances of vector borne diseases like dengue, malaria, Japanese encephalitis, scrub typhus etc. have seen a marked increase in many Districts. Water borne infections like different kinds of diarrhoeal diseases, typhoid and hepatitis are showing persistence in many Districts. Cholera has surfaced in many Districts after few years of relative low incidence. Vaccine preventable diseases like diphtheria and whooping cough are yet to be eliminated despite years of effort.
Dengue
Dengue fever, which surfaced in Kerala as early as 1998, has now become the single largest of the vector borne diseases. Till 2015, the disease was more prevalent in Districts like Thiruvananthapuram, Kollam, Kottayam, Pathanamthitta, Kozhikode and Malappuram. But in 2017, all the Districts reported Dengue in large numbers. Districts located at higher altitudes were having low prevalence, but all others showed high incidence. The main reason for this wide spread distribution is believed to be due to the changes in the environmental factors causing proliferation of the dengue vector-Aedes mosquitoes. These mosquitoes, which in the earlier days were seen more in rural settings, have now spread to urban areas also. Details of cases and death from 2015 to 2019 October are given in Table 6.2.3.
Leptospirosis
Leptospirosis is another emerging public health challenge faced by the State. Considered as a rare disease in the early 1980’s, it has now spread to all Districts. In 2012-13 a major epidemic of the disease occurred, affecting most of the northern Districts, following which the disease has become endemic in Kerala. The disease is initially a rodent borne infection, spread through urine of the infected rodents, and the consequent contamination of the environment is the factor responsible for the disease. Over the years, the disease has been reported in many domestic animals like cows, dogs, pigs etc. and thus has become an occupational risk for those engaged in agriculture works. People, who have been involved in cleaning of stagnant canals and drains were reported to have contracted the disease. More recently the mortality due to leptospirosis is also on the rise, and joint efforts of veterinary and animal husbandry departments are essential for effective control of this disease.
Out of the 1098 leptospirosis cases reported in 2015, 43 deaths were reported. The number of cases increased to 1,710 with 35 deaths in 2016. In 2017, a total of 1,408 cases were confirmed resulting in 80 deaths. In 2018, there were 2079 cases and 99 deaths reported. In 2019, there were 611 cases and 26 deaths reported upto August 2019. District-wise number of patients treated and death reported affecting Leptospirosis during 2018-19 and 2019-20 (up to August 31) are given in Appendix 6.2.1.
Chikungunya
Chikungunya is a newcomer among the vector borne infections. This disease believed to have originated in the remote islands in Arabian Sea in 2005-06 spread rapidly over whole of Kerala within the next two years, affecting more than 80per cent of our population. Fortunately, the disease is fading out, and has resulted in life long immunity for the affected population, a blessing in disguise. The past two years have seen only sporadic cases in Kerala, annual total being less
278 Economic Review 2019, Kerala State Planning Board
than 200 cases and no deaths. Here again the vector responsible for disease transmission is the Aedes mosquitoes. Since both dengue and chikungunya are transmitted by same mosquito, and also since the same mosquitoes are responsible for transmission of the potential threat of Zika virus disease and Yellow fever, the State should be vigilant in future.
In 2018, 76 cases were reported in which 38 were from Thiruvananthapuram District and 32 from Thrissur District. In 2019 (upto August) 30 cases reported in which 14 from Thiruvananthapuram District and 10 from Idukki District. A total of 29,35,627 viral fever cases were reported in Kerala in 2018. In 2019 (upto August), the number of reported cases are 19,06,006. The details of District-wise patients treated for chikungunya and viral fever during 2018 and 2019 (upto August) is given in Appendix 6.2.2.
Malaria
Malaria, another vector borne disease, transmitted by Anopheles mosquitoes has been a major public health challenge for our country for the past many decades. Various national programs targeting its elimination have met with limited success. Though Kerala had eliminated the disease in early 1970s, Malaria has now reemerged as a public health challenge. The problem is recently aggravated due to the presence of large scale population movement from malaria endemic States. Proportion of falciparum malaria, the more severe form of the disease is slowly on the rise in Kerala. Though elimination of indigenous form of Malaria has been included in the SDG targets by the State, the issues in its fulfillment are many. Rapid urbanisation, extensive infrastructure development in many Districts, uncontrolled construction works in urban area, and climate related changes in life cycle of mosquitoes are all big hurdles in the attainment of the SDG goals. Annual cases of malaria in Kerala are less than 2,000 and the number of deaths reported is also very low, but the major issue here is
the increase in foci of indigenous malaria. Thiruvananthapuram, Kollam, Kozhikode, Malappuram, and Kannur Districts have pockets of indigenous malaria over the past few years. Kasaragod District is persistently having high number of malaria, over many years, because of its proximity to the highly endemic Districts of Karnataka. Movement of fishermen along the western coast of our State is a potential threat for spread of malaria along the coastal Districts. The incidence of malaria in 2017 is 1,194 and two deaths were reported. In 2018, number of cases was 908 and no death was reported. In 2019 upto October, 342 cases reported and one death was reported. Details of cases and death due to communicable diseases from 2015 to 2019 October are given in Table 6.2.3.
Japanese Encephalitis (JE)
This is a form of encephalitis, an inflammatory disease of brain and its coverings, and is also a mosquito borne infection. Due to the presence of large paddy fields, Kerala is also at risk of this disease, as the virus responsible for the disease is spread by Culex mosquitos, which bred abundantly in water logged areas like paddy fields. The peculiar nature of the Culex mosquito to breed in contaminated water also, increases the potential threat in other areas as well. Role of migratory birds in transmission of JE is an extra risk for Kerala, because our State has many attractive sanctuaries for migratory birds. But since there is an effective vaccine against JE, we can be optimistic in its control programme, by strengthening the JE vaccination. Details of cases and death from 2015 to 2019 October are given in Table 6.2.3.
Water borne diseases
The main reason for waterborne diseases is attributed to the unavailability of safe drinking water in many parts of the District especially in tribal and coastal areas. Unhygienic drinking water sources like wells, pump houses, water supplied through tanker lorry, leaks in public water supply pipes and the consequent mixing

279Chapter 6, Human Development
of foul water with drinking water, dumping of wastes including sewage in water sources, use of commercial ice in preparation of cool drinks, habit of unsafe water in preparation of welcome drinks etc. are some reasons for spread of water borne diseases. Health Department is implementing a programme called “Jagratha” from November 2017 for prevention and control of communicable diseases. There was a considerable decrease in typhoid from 2015. Details of cases and death of water borne diseases like Acute Diarrhoeal Diseases (ADD), typhoid, Hepatitis, etc. from 2015 to 2019 October are given in Table 6.2.3.
HIV/AIDS
Kerala State Aids Control Society is the pioneer organisation in the State working with the objective of controlling the spread of HIV as well as strengthening the State’s capacity to respond to HIV/AIDS. The society was formed to implement the National Aids Control Programme in the State.
The prevalence rate of the State has declined from 0.21 per cent in 2008-09 to 0.13 in 2010-11 and 0.05 per cent in 2017. In Kerala, the prevalence of HIV/AIDS is 0.41 per cent (4.95
Table 6.2.3 Prevalence of communicable diseases in Kerala, from 2015 to 2019
Year 2015 2016 2017 2018 2019 (Up to October)
Disease Cases Death Cases Death Cases Death Cases Death Cases DeathDengue Fever 4114 29 7218 21 21993 165 4090 32 2370 12Malaria 1549 4 1540 3 1194 2 908 0 342 1Confirmed Chikungunya 152 0 124 0 54 0 76 0 30 0
Japanese Encephalitis (JE)
0 0 1 0 1 0 5 2 7 0
Leptospirosis 1098 43 1710 35 1408 80 2079 99 611 26Hepatitis – A 1980 10 1351 10 988 24 1369 5 979 3Cholera 1 0 10 0 8 1 9 0 7 0Typhoid 1772 0 1668 2 314 1 109 0 23 0ADD (Diar-rhoea) 467102 4 493973 14 463368 8 540814 12 390345 5
Scrub Typhus 1149 15 633 3 340 5 400 6 348 7Kala Azar 4 0 2 0 0 0 6 1 3 0Kysanur Forest Disease 102 11 9 0 0 0 0 0 8 2
H1N1 900 80 22 1 1411 76 823 50 835 43
Fever OP 2676842 26 264131118
341796876
293562763
190600636
IP 96189 80049 109974 59983 39384
Diarrheal Diseases - - 326517 10
Enteric fever - - 1192 0Measles 1589 2 870 3 508 1 190 0 79 1Chickenpox 19152 13 12698 1 27856 20 30154 17 21208 16
Source: Directorate of Health Services

280 Economic Review 2019, Kerala State Planning Board
per cent in 2011) among injecting drug users (IDU) which is 6.26 per cent at national level. It is 0.23 per cent (0.36 per cent in 2011) among men having sex with men (MSM) which is 2.69 per cent at national level and 0.10 per cent (0.73 per cent in 2011) among Female Sex Workers (FSW) which is 1.56 per cent in India in 2017. In transgender, HIV prevalence rate in Kerala is 0.16 per cent which is 3.14 per cent at national level. HIV prevalence among migrants in India is 0.51 per cent.(Source: Kerala State AIDS Control Society)
Prevalence of major communicable diseases
A comparative analysis of the prevalence of major communicable diseases is given in Table 6.2.3.
Non-Communicable Diseases (NCD)
Common non-communicable diseases causing great threat to a healthy life are diabetes, hypertension, cardio vascular diseases, cancer and lung diseases. Unless interventions are made to prevent and control non-communicable diseases, their burden is likely to increase substantially in future, due to ageing population and changes in life style. Considering the high cost of medicines and longer duration of treatment, this constitutes a greater financial burden to low income groups. Rampant modernisation and urbanisation, drastic lifestyle changes, heavy dependency on alcohol and tobacco, affinity for white collar jobs, unhealthy eating patterns, low priority for physical exertion, high levels of stress in all strata of population are some of the reasons contributing to the prevalence of non-communicable diseases in the State.
In India, it is estimated that 42 per cent of total death are due to NCDs. In Kerala, the situation is more serious as more than 52 per cent of the total death between the productive age group of 30 and 59 is due to NCD. Hypertension, diabetes mellitus, cardio vascular diseases, stroke and cancer are the major non communicable diseases seen in Kerala. Studies show that 27 per cent of
Kerala adult males are having diabetes mellitus compared to 15 per cent at national level. 19 per cent of adult female population is diabetic compared to 11 per cent in India. Genetic predisposition, dietary habits and sedentary lifestyle are considered to be the reason for this phenomenon. 40.6 per cent of adult males and 38.5 per cent of adult females are hypertensive compared to 30.7per cent and 31.9per cent at national level. Incidents of obesity, hyper lipedemia, heart attack and stroke are also high. Cancer mortality is extremely high in males in Kerala compared to national average. In a recent survey conducted by Achutha Menon Centre for Health Science Studies, Thiruvananthapuram, the NCD scenario in the State has further worsened. The survey reveals that one out of three has hypertension and one out of five has diabetes. The study also revealed that the level of normalcy attained for blood sugar and blood pressure even after early detection and management is significantly low compared to the standards.
Kerala COPD Prevention and Control Program –SWAAS
Chronic Obstructive Pulmonary Disease (COPD) is one of the leading causes of mortality and morbidity worldwide. As per the ‘Global Burden of Diseases’ (Institute for Health Metrics and Evaluation (IHME) at the University of Washington) estimates for India, COPD is the second leading cause of mortality in India. Recently the NCD program has included COPD and Chronic Kidney Disease among the priority NCDs in India. Assuming that the National estimates for Asthma and COPD reflect the situation in Kerala too, the number of COPD cases in Kerala is estimated to be 5,30,000 and the number of Asthma patients among adults is estimated to be 4,80,000. SWAAS is a specific public health program for COPD in Kerala which is implemented from Family Health Centres (FHC) level as part of Aardram Mission. SWAAS clinics started in 178 Family Health Centres and 39 Sub Districts/District Hospitals. Number of COPD diagnosed from August 2018 to September 2019 was 13,126 and Number of Asthma diagnosed was 8,011.
281Chapter 6, Human Development
Cancer
Cancer is a major non communicable disease in Kerala. Every year, 35,000 new cases of cancer are getting detected in Kerala. Nearly 1 lakh people are under treatment for cancer disease annually. Apart from Medical Colleges, Regional Cancer Centre, Malabar Cancer Centre and Cochin Cancer and Research Centre are the major hospitals in Government sector which offer treatment for cancer patients. Apart from these institutions all the major Government hospitals provide cancer treatment. Delay in early detection, huge treatment cost, minimal treatment centres and lack of awareness contribute to high mortality of the disease.
Malabar Cancer Centre
Malabar Cancer Centre, Kannur an autonomous centre under the GoK, has been established with the aim of providing oncological care to the people of north Kerala. The Centre has bed strength of 203 and many latest facilities for the treatment of cancer patients. In 2018-19, a total of 1,821 in patients and 32,610 out patients were treated in Malabar Cancer Centre in which new cases is 1,811. The average number of new cases detected every year in the centre is 4,146.
Cochin Cancer Research Centre (CCRC)
Growing concerns over the alarming increase in rates of cancer incidence together with the need of a dedicated tertiary cancer care and research centre in Government sector in central Kerala necessitated the birth of Cochin Cancer Research Centre. CCRC is a society registered under Societies Act. The Centre has bed strength of 20.Average number of new cases detected every year is 1,000. Number of outpatients treated in 2017-18 was 5,012 and new cases was 1,028 and in 2018-19 outpatients were 8,011 and new cases were 1,483 (upto August 31, 2019).
Regional Cancer Centre (RCC)
RCC, Thiruvananthapuram is the premier comprehensive dedicated centre for diagnosis, treatment and control of cancer in Kerala. RCC is rated amongst the top 28 RCCs in the country and maintains a working relationship with international bodies. Daily average patient visits in RCC are 915. Over the past thirty eight years, RCC has been able to contribute significantly to the increasing needs of cancer care to the people of Kerala and adjoining areas of Tamil Nadu and Karnataka at the lowest possible cost. Daily average patient visits in the hospital are 915. In 2018-19, 15,627 new cases 2,58,838 review cases and 11,568 in-patient admissions were done in RCC.
Mental Health
As per Census of India 2011, 0.20 per cent of the population of Kerala suffers from mental illness and 0.20 per cent suffers from mental retardation compared to a national average of 0.06 per cent and 0.12 per cent respectively. Although Kerala reports higher levels of mental illness compared to all India, less importance is given to the field of mental health in Kerala. A mental health policy was approved by the State Government in May 2013. The policy suggests that the treatment for mental illness should start from the Primary Health Centres (PHCs) making the mental hospitals and the department of Psychiatric Medicines as referral centres by upgrading them.
In Kerala, three mental health centres are functioning with bed strength of 1,366. District mental health programme is functioning in all the Districts with a total of 10,000 out patients per month. Rehabilitation facilities are offered through these centres. Lack of awareness, attitude of general public, neglect of family members and lack of proper follow up etc. are the major problems noticed. State Government has started 26 day care homes and 506 cured mentally ill patients are being given day care.

282 Economic Review 2019, Kerala State Planning Board
District Mental Health Programme (DMHP)
DMHP is functioning in all the 14 Districts of the State. Thiruvananthapuram District achieved successful integration of mental health care facilities into primary care by 2014. Now mental health clinics are being conducted in all PHCs and Community Health Centres (CHCs) in the District by trained doctors of the concerned institutions and medicines are made available to patients from their nearest PHCs. Efforts are on to scale it up to the whole State. Around 17,000 patients are receiving treatment every month, from DMHPs in the State. Other activities include information education and communication (IEC) activities for general public to create awareness and reduce stigma, training for doctors, nurses, pharmacists and health workers for integration of mental health into primary care and targeted interventions like substance abuse prevention, suicide prevention, geriatric mental health and stress management. Day care centres were started for mentally ill in remission under Comprehensive Mental Health Scheme. Now 26 day care centres are functioning in the State under the scheme. School mental health Programmes is implemented in the State in association with National Health Mission (NHM).
Indian Institute of Diabetes
The Indian Institute of Diabetes (IID), at Thiruvananthapuram is an autonomous institution under the Government of Kerala. It is the only institution under the Government offering services exclusively for Diabetes Mellitus and its complications. IID made operational in the year 2001, functions with main centre at Pulayanarkotta near Akkulam in Thiruvananthapuram city and one sub centre at Public Health Laboratory Campus, Thiruvananthapuram. The major activities of this institute are to investigate the genetic basis of diabetes, to provide adequate training for physicians and paramedical staff, provides research support to develop novel methods of treatment, endow academic chairs in diabetes,
and organize state-of-the-art conferences in India on various aspects of the disease. Total bed strength of the IID is 40. Average number of new cases detected every year is between 7,600. Out Patient treated in 2018-19 was 49,970, IP was 316 and new cases were 7,962.
Modern Medicine
In Kerala modern medical services are offered by the Directorate of Health Services (DHS) and the concerned education sector is dealt by the Directorate of Medical Education (DME).
Health Care Institutions under DHS
At present there are 1,286 health institutions with 38,018 beds and 5,510 doctors under Health Services Department consisting of 568 PHCs, 114 (24*7) PHCs, 170 FHCs, 224 CHCs, 86 taluk headquarters hospitals, 18 District hospitals, 18 general hospitals 3 mental health hospitals, 8 women and children hospitals, 3 leprosy hospitals, 18 TB clinics, 5 other specialty hospitals and 51 other hospitals. PHCs are institutions providing comprehensive primary care services including preventive care and curative care. CHCs and taluk level institutions form the basic secondary care institutions. District hospitals, general hospitals and maternity hospitals provide specialty services and some super speciality services. In the 13th Five Year Plan, focus will be on the implementation of the speciality cadre in all health care institutions up to the level of community health centres and modernisation of the functioning of the PHCs as FHCs. The bed population ratio is 880 and the average doctor bed ratio is 6.9. Category-wise major medical institutions and beds in Kerala, details of IP, OP cases, major and minor surgeries conducted and Medical and Para medical personnel under DHS in 2019 are given in Appendix 6.2.3, 6.2.4 and 6.2.5.

283Chapter 6, Human Development
Financial Protection against Catastrophic Health Care Expenditure
Rashtriya Swasthya Bima Yojana (RSBY) was a health insurance scheme, sponsored by the GoI, for providing free and quality inpatient care to the families falling below poverty line (BPL) in the society. This was introduced in 2008-2009 in all the 14 Districts of Kerala. The scheme promises inpatient treatment facility upto ₹30,000 on paperless, cashless and floater basis to a maximum of five members in a family, for a period of one year through selected public and private hospitals with a prefixed medical and surgical rates for treatment in general ward. RSBY does not cover outpatient treatment cases. Minimum period of 24 hour inpatient treatment is required for getting the benefit under the scheme. More than 1,100 surgical procedures with prefixed rates are included in the benefit package. GoI pays 60 per cent of the premium and the State pays the remaining 40 per cent. The annual insurance premium is fixed through a tender process. Three important features of RSBY are (i) there is no age limit for joining the scheme; (ii) it covers existing diseases; and (iii) a transport allowance of ₹100 is being paid in cash to the patient at the time of discharge from the hospital. Maximum transportation allowance payable in a year is restricted to ₹1,000. It has a component to pay the wages foregone as well. As the BPL population according to the definition adopted by the State is more than that of the Planning Commission estimate by 10 lakh, the State Government has formulated its own Scheme for catering to the needs of the additional 10 lakh population. These two schemes are being jointly run under the banner Comprehensive Health Insurance Scheme (CHIS). A special purpose vehicle by name CHIAK (Comprehensive Health Insurance Agency, Kerala) has been formed and entrusted with the task of running the schemes. The beneficiaries have to pay only ₹30 as registration fee. The scheme has been implemented in the State since October, 2008. This scheme has now been subsumed into the new scheme named Karunya Arogya Suraksha Padhati (KASP).
Comprehensive Health Insurance Scheme (CHIS) The non-RSBY population is divided into two categories: (a) those belonging to the BPL (poor) list of the State Government but not to the list as defined by the GoI and (b) APL families that belong neither to the State Government list nor to the list prepared as per the guidelines of GoI. In the case of the families belonging to the category (a), the beneficiaries will have to pay ₹30 per annum per family as beneficiary contribution for Smart Card. Under CHIS, a family can avail of in-patient benefit upto ₹30,000 as in the case of RSBY. In 2014-15, the Government brought the members of the various welfare fund boards and its pensioners, all Scheduled Caste and Scheduled Tribe population and families engaged in fishing and workers of various unorganised sectors under CHIS net.
In addition to RSBY and CHIS, the State Government has also introduced another scheme called CHIS Plus. Under this scheme, the RSBY-CHIS BPL families are eligible for an additional ₹70,000 treatment benefit for patients of cardiology, neurology, oncology etc. The two schemes together cover a sizeable proportion of the population in the State. This scheme has now been subsumed into the new scheme named Karunya Arogya Suraksha Padhati (KASP).The progress of the RSBY / CHIS is presented in Appendix 6.2.6. The number of families covered has steadily increased to reach 41.41 lakh by 2019-20. Financial protection in the form of RSBY / CHIS offered the option of using services of the private sector by all those enrolled in the scheme. Interestingly, instead of the proportion of users of private institutions increasing over the years, the share of the Government hospitals in the total has steadily increased. This is presented in Appendix 6.2.7.
A new scheme for providing tertiary care treatment with a benefit package of maximum ₹70,000 for critical illness like cancer, cardiac and renal failure to all the RSBY and CHIS card holder families was designed in 2010-2011.
284 Economic Review 2019, Kerala State Planning Board
The scheme, named as CHISPLUS, was launched by the middle of February 2011.The coverage of CHISPLUS has been extended in 2012 by including diseases relating to liver, brain and treatment of accident trauma care. The scheme is implemented through all the five Government medical colleges in the State, Regional Cancer Centre, Thiruvananthapuram, Malabar Cancer Centre and all Government District hospitals, general hospitals, and taluk hospitals. The scheme is monitored by CHIAK with the help of software developed by Keltron. CHIS Plus scheme, implemented through a non-insurance route, has benefited 6,11,863 patients till 2019-20 (31 August 31, 2019) with a total claim of ₹523.92 crore. This scheme has now been subsumed into the new scheme named Karunya Arogya Suraksha Padhati (KASP). The details are presented in Appendix 6.2.8.
Karunya Benevolent Fund (KBF)
The Karunya Benevolent Fund (KBF) scheme was started in February, 2012 by the Government of Kerala to give financial assistance to the members of families from financially backward sections for the treatment of certain chronic diseases. Every family whose annual income is below ₹3 lakhs as per the Ration Card irrespective of their APL Status can avail for financial assistance under this scheme. However, this income limit is not imposed on the treatment of haemophilia. Every family can avail financial assistance upto ₹3 lakhs for the treatment of kidney diseases and upto ₹2 lakhs for other prescribed diseases. One or more people can benefit from the same ration card subject to the limit prescribed above. There is no limit however on the amount of financial assistance given for the treatment of haemophilia patients. The scheme was implemented till 2018 through the Department of State Lotteries. Now it is being implemented by CHIAK.
Ayushman Bharat – National Health Protection Scheme
GoI launched a new Centrally Sponsored Scheme Ayushman Bharat –National Health Protection
Scheme attached in the Ministry of Health and Family Welfare. The scheme comprising of two interrelated components viz. Health and Wellness Centres (HWCs) and Pradhan Mantri Jan Arogya Yojana (PM-JAY). PM-JAY has the benefit cover of ₹5 lakh per family per year. The target beneficiaries of the proposed scheme is expected to be 10 crore families belonging to poor and vulnerable population based on Socio Economic Caste Census (SECC) database. This scheme will subsume the on-going CSS-RSBY and the Senior Citizen Health Insurance Scheme (SCHIS). Main features of the programme are given below.
1. This cover will take care of almost all secondary care and most of tertiary care procedures. To ensure that nobody is left out there will be no cap on family size and age in the scheme. The benefit cover will also include pre and post hospitalisation expenses. All pre-existing conditions will be covered from day one of the policy. A defined transport allowance per hospitalisation will also be paid to the beneficiary.
2. Beneficiary covered under the scheme will be allowed to take cashless benefits from any public/private empanelled hospitals across the country.
3. To control costs, the payments for treatment will be done on package rate basis. For beneficiaries, it will be a cashless, paper less transaction. Keeping in view the State specific requirements, States will have the flexibility to modify these rates within a limited bandwidth.
4. The scheme proposes to ensure appropriate integration with the existing health insurance/protection schemes of various Central Ministries/Departments and State Governments (at their own cost). States will be free to choose the modalities for implementation.
5. States would need to have State Health Agency (SHA) to implement the scheme. States will have the option to use an existing State Nodal Agency to implement the scheme and act as SHA. At the District level

285Chapter 6, Human Development
also, a structure for implementation of the scheme will need to be set up.
GoK has decided to implement Pradhan Mantri Jan Arogya Yojana (PM-JAY). Accordingly, State has decided to converge all the government sponsored health insurance schemes viz. Rashtriya Swasthya Bima Yojana (RSBY), Comprehensive Health Insurance Scheme (CHIS), Senior Citizen Health Insurance Scheme (SCHIS), Karunya Benevolent fund (KBF), etc. and formulated a new scheme called Karunya Arogya Suraksha Padhathi (KASP). The Central government has fixed premium ceiling is ₹1052 for each family and 60 per cent of that will be given to the state as Central share. That means the Central government provides ₹631.2 for each enrolled AB-PMJAY (RSBY) family. About 366 hospitals are so far empanelled, which includes 189 private hospitals and 177 Public hospitals.
Arogyakiranam
Arogyakiranam is one of the flagship health programs of the GoK. The program provides free treatment and related medical services to all patients from birth to 18 years, as an entitlement. Expenses covered by this entitlement include costs incurred for OP registration, investigations, drugs/implants/materials used in treatment and procedures. The fund for coverage of treatment expenditure was allotted to Districts, to be maintained as corpus fund, from which all expenses were debited. In 2018-19 the scheme has benefitted 68,48,360 out patients and 1,54,681 inpatients.
National Health Mission (NHM)
The GoI has launched the NHM which includes two sub missions NUHM and NRHM. NHM has five financing components to the States, namely (i) NRHM/RCH Flexi-pool, (ii) NUHM Flexi-pool(iii) Flexible pool for communicable diseases, (iv)Flexible pool for non-communicable diseases including injury and trauma and (v) Infrastructure Maintenance. Under the infrastructure maintenance component, support
has been given over several Plan periods, to States to meet salary requirement of Schemes viz. Direction and Administration (Family Welfare Bureaus at State and District level), Sub Centres, Urban Family Welfare Centres, Urban Revamping Scheme (Health Posts), ANM/LHV Training Schools, Health and Family Welfare Training Centres, and Training of Multi-Purpose Workers (Male).
NHM is implemented in the State for the development of health institutions with Central Government funding. 40 per cent of the total fund is given to the NHM by the State Government as State share. NHM supports the Health Services Department, Directorate of Medical Education and AYUSH Departments. National Rural Health Mission aims to provide accessible, affordable and accountable quality health services to the poorest households in the remote rural regions. Under NRHM, the focus is on a functional health system at all levels, from the village to the District. There are 83 urban PHCs under NHM. Total GoI release to the State in 2015-16 was ₹302.56 crore, in 2016-17, ₹451.74 crore, in 2017-18 it was ₹496. 72crore and in 2018-19 it was 845.66 crore.
Pradhan Manthri Swasthya Suraksha Yojana (PMSSY)
PMSSY is a GoI supported scheme to improve infrastructure facilities and technology in Government Medical College, Thiruvananthapuram (Phase I) and Kozhikode and Alappuzha (Phase III) with a total outlay of ₹150 crore each, of which ₹30 crore is the State share. The project for Government Medical College, Thiruvananthapuram (Phase I) has almost completed and the rest are ongoing in 2019-20.
State Institute of Medical Education and Technology (SI-MET)
SI-MET was established in the State in 2008 to promote medical education and research. There are four nursing colleges functioning under SI-

286 Economic Review 2019, Kerala State Planning Board
MET with an annual intake of 340 students. A total of 1027 students are studying in the Nursing Colleges of SI-MET as on October 2019.
Public Health Laboratories
At present there are 9 Public Health Labs in the State. There is State public health Lab at Thiruvananthapuram, Regional Public Health Labs at Ernakulam, Kozhikode, Pathanamthitta, Kannur, and Public Health Labs at Alappuzha, Malappuram, Wayanad and Kollam. Technical Guidance and material supply to all the PH labs are provided by Director State Public Health and Clinical Lab. Approximately 1,400-1,500 patients attend the laboratories every day for various lab investigations. Approximately 11,000 lab tests are performed every day. The New Born Screening (NBS) Programme started in March 2013 and was extended to all the delivery conducting hospitals in September 2017. The blood samples of Newborns are tested through State Public Health and Clinical Laboratory, Thiruvananthapuram and Three Regional Laboratories, Ernakulam, Kozhikode and Kannur. The Screening test done for four selected disorders namely Congenital Hypothyroidism, Congenital Adrenal Hyperplasia, Phenyl Ketonuria and G6PD deficiency. Director State PH Lab is the state Nodal officer for NBS programme of Kerala. As of March 2019, total number of samples received in four PH Labs comes to a total of 4,61,663 babies.
Child Development Centre (CDC)
Child Development Centre (CDC) established by the GoK is an autonomous centre of excellence in early child care and education, adolescent
care and education, pre-marital counseling, women’s welfare and other related fields to reduce childhood disability through novel scientific initiatives and create a generation of prospective and responsive parenthood through healthy children and adolescents. The number of patients treated in 2016-17 was 15,230, 2017-18 it is 16,756 and 2018-19 was 36,654 (August 2019). Only out-patient services are available and there is no facility for admitting patients. Training programmes, conferences and community extension programme conducted for 55,986 participants in 2018-19.
Drugs Control Department
The responsibility of the drugs control department is to ensure the availability of quality drugs to the public and see that the market is free from counterfeit, spurious and substandard drugs and no drugs are sold at a price higher than the retail price marked on the container. The department has 6 Regional Offices, 11 District Offices, 4 ayurveda wing offices and 3 drugs testing laboratories. NABL accredited drug testing laboratories are functioning at Thiruvananthapuram and Ernakulam with an analytical capacity of 11,500 samples per annum. Establishment of two more laboratories at, Pathanamthitta and Kozhikode is in progress. Major achievements of the department in 2018-19 are given in Table 6.2.4.
Commissionerate of Food Safety Kerala
Food Safety and Standards Authority of India has been established under the provisions of Food Safety and Standards Act, 2006 as a statutory
Table 6.2.4 Major achievements of the drugs control department in 2018-19Number of inspections conducted 15,958Number of prosecutions initiated 72Number of sale licences suspended as deterrent measure 243Number of samples tested 8,871Number of new manufacturing licenses issued (Allopathy And Cosmetics) 18Number of new Blood Bank licenses issued 7
Source: Drugs Control Department
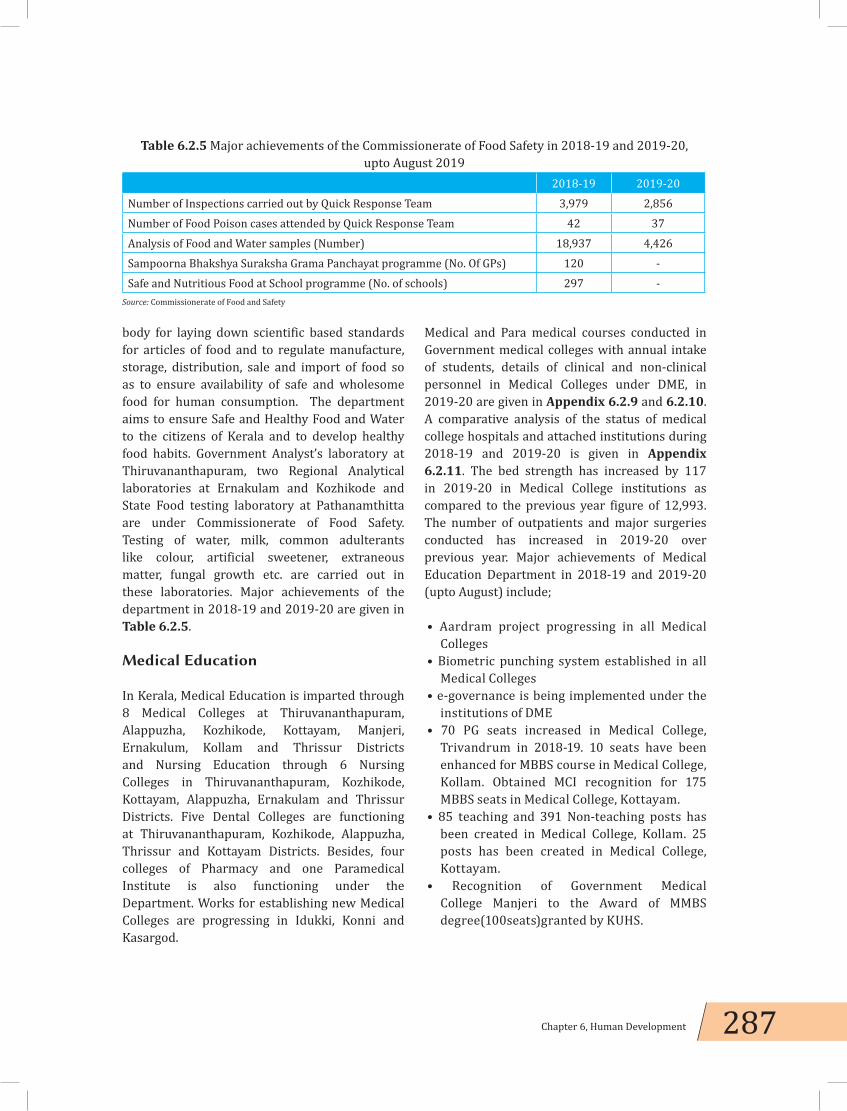
287Chapter 6, Human Development
body for laying down scientific based standards for articles of food and to regulate manufacture, storage, distribution, sale and import of food so as to ensure availability of safe and wholesome food for human consumption. The department aims to ensure Safe and Healthy Food and Water to the citizens of Kerala and to develop healthy food habits. Government Analyst’s laboratory at Thiruvananthapuram, two Regional Analytical laboratories at Ernakulam and Kozhikode and State Food testing laboratory at Pathanamthitta are under Commissionerate of Food Safety. Testing of water, milk, common adulterants like colour, artificial sweetener, extraneous matter, fungal growth etc. are carried out in these laboratories. Major achievements of the department in 2018-19 and 2019-20 are given in Table 6.2.5.
Medical Education
In Kerala, Medical Education is imparted through 8 Medical Colleges at Thiruvananthapuram, Alappuzha, Kozhikode, Kottayam, Manjeri, Ernakulum, Kollam and Thrissur Districts and Nursing Education through 6 Nursing Colleges in Thiruvananthapuram, Kozhikode, Kottayam, Alappuzha, Ernakulam and Thrissur Districts. Five Dental Colleges are functioning at Thiruvananthapuram, Kozhikode, Alappuzha, Thrissur and Kottayam Districts. Besides, four colleges of Pharmacy and one Paramedical Institute is also functioning under the Department. Works for establishing new Medical Colleges are progressing in Idukki, Konni and Kasargod.
Medical and Para medical courses conducted in Government medical colleges with annual intake of students, details of clinical and non-clinical personnel in Medical Colleges under DME, in 2019-20 are given in Appendix 6.2.9 and 6.2.10. A comparative analysis of the status of medical college hospitals and attached institutions during 2018-19 and 2019-20 is given in Appendix 6.2.11. The bed strength has increased by 117 in 2019-20 in Medical College institutions as compared to the previous year figure of 12,993. The number of outpatients and major surgeries conducted has increased in 2019-20 over previous year. Major achievements of Medical Education Department in 2018-19 and 2019-20 (upto August) include;
• Aardram project progressing in all Medical Colleges
• Biometric punching system established in all Medical Colleges
• e-governance is being implemented under the institutions of DME
• 70 PG seats increased in Medical College, Trivandrum in 2018-19. 10 seats have been enhanced for MBBS course in Medical College, Kollam. Obtained MCI recognition for 175 MBBS seats in Medical College, Kottayam.
• 85 teaching and 391 Non-teaching posts has been created in Medical College, Kollam. 25 posts has been created in Medical College, Kottayam.
• Recognition of Government Medical College Manjeri to the Award of MMBS degree(100seats)granted by KUHS.
Table 6.2.5 Major achievements of the Commissionerate of Food Safety in 2018-19 and 2019-20, upto August 2019
2018-19 2019-20Number of Inspections carried out by Quick Response Team 3,979 2,856Number of Food Poison cases attended by Quick Response Team 42 37Analysis of Food and Water samples (Number) 18,937 4,426Sampoorna Bhakshya Suraksha Grama Panchayat programme (No. Of GPs) 120 -Safe and Nutritious Food at School programme (No. of schools) 297 -
Source: Commissionerate of Food and Safety
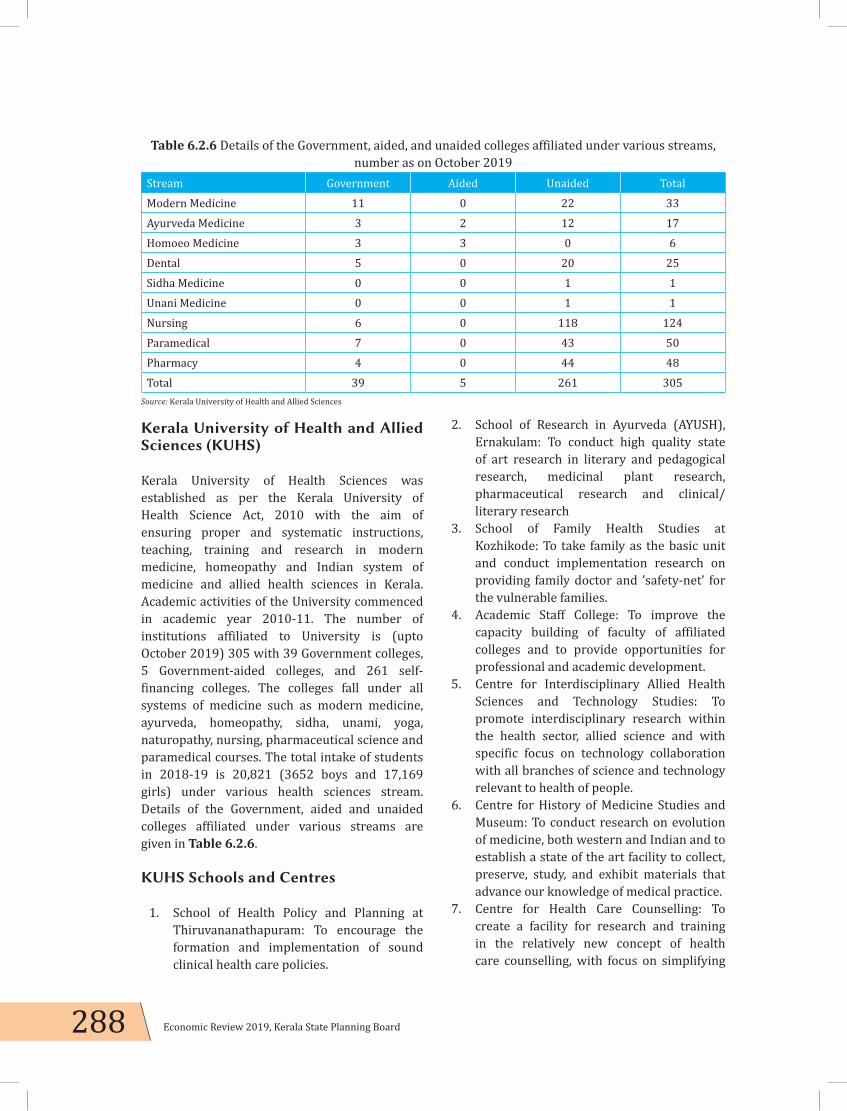
288 Economic Review 2019, Kerala State Planning Board
Kerala University of Health and Allied Sciences (KUHS)
Kerala University of Health Sciences was established as per the Kerala University of Health Science Act, 2010 with the aim of ensuring proper and systematic instructions, teaching, training and research in modern medicine, homeopathy and Indian system of medicine and allied health sciences in Kerala. Academic activities of the University commenced in academic year 2010-11. The number of institutions affiliated to University is (upto October 2019) 305 with 39 Government colleges, 5 Government-aided colleges, and 261 self-financing colleges. The colleges fall under all systems of medicine such as modern medicine, ayurveda, homeopathy, sidha, unami, yoga, naturopathy, nursing, pharmaceutical science and paramedical courses. The total intake of students in 2018-19 is 20,821 (3652 boys and 17,169 girls) under various health sciences stream. Details of the Government, aided and unaided colleges affiliated under various streams are given in Table 6.2.6.
KUHS Schools and Centres
1. School of Health Policy and Planning at Thiruvananathapuram: To encourage the formation and implementation of sound clinical health care policies.
2. School of Research in Ayurveda (AYUSH), Ernakulam: To conduct high quality state of art research in literary and pedagogical research, medicinal plant research, pharmaceutical research and clinical/literary research
3. School of Family Health Studies at Kozhikode: To take family as the basic unit and conduct implementation research on providing family doctor and ’safety-net’ for the vulnerable families.
4. Academic Staff College: To improve the capacity building of faculty of affiliated colleges and to provide opportunities for professional and academic development.
5. Centre for Interdisciplinary Allied Health Sciences and Technology Studies: To promote interdisciplinary research within the health sector, allied science and with specific focus on technology collaboration with all branches of science and technology relevant to health of people.
6. Centre for History of Medicine Studies and Museum: To conduct research on evolution of medicine, both western and Indian and to establish a state of the art facility to collect, preserve, study, and exhibit materials that advance our knowledge of medical practice.
7. Centre for Health Care Counselling: To create a facility for research and training in the relatively new concept of health care counselling, with focus on simplifying
Table 6.2.6 Details of the Government, aided, and unaided colleges affiliated under various streams, number as on October 2019
Stream Government Aided Unaided TotalModern Medicine 11 0 22 33Ayurveda Medicine 3 2 12 17Homoeo Medicine 3 3 0 6Dental 5 0 20 25Sidha Medicine 0 0 1 1Unani Medicine 0 0 1 1Nursing 6 0 118 124Paramedical 7 0 43 50Pharmacy 4 0 44 48Total 39 5 261 305
Source: Kerala University of Health and Allied Sciences

289Chapter 6, Human Development
the technical knowledge into a language understandable by the client, imparted in the context of their perceived needs, thus improving the communication line between the professional and the client.
8. Centre for Basic Science Research and Bioethics: To foster studies in basic sciences as well as ethical, health-related topics through research, educational and clinical activities working in unison, so as to improve the standard of health care research.
9. Centre for studies on Health of Young Adults: To assess the burden and etiology of academic, lifestyle, mental health and reproductive health issues of young adults (15-24 years).
10. Centre for Disability Management Studies: To create a facility for need assessment of persons with disability, desk review of available publications, facility survey in KUHS affiliated institutions, capacity building of health care providers, collating evidence base for prevention, early intervention, remedial teaching, rehabilitation and community support services available and evaluation of governmental programs for disabled for formulating better policy directives.
11. Centre for Gerontological Studies: To promote research in (i) ‘healthy ageing’ concept and quality of life, (ii) all domains of geriatric health and its determinants and (iii) Community based services including Palliative Care initiatives in Kerala.
12. Centre for Studies in Medical Simulation: To develop a world-class simulation-based learning environment where health science education is enhanced through simulation technology, innovation and research.
Indian System of Medicine (ISM)
Ayurveda is a science dealing not only with treatment of some diseases but also a complete way of life. The department of Indian system of medicine renders medical aid to the people through the network of ayurveda, sidha, unami,
visha, netra and naturopathy institutions. Specialty hospitals such as mental hospital (1), panchakarma (1), nature cure (1), siddha (1), visha (3), and marma (1) are functioning under this department. At present there are 130 hospitals and 817 dispensaries under the department. Total bed strength of these hospitals is 3,154. The State Medicinal Plants Board co-ordinates matters relating to cultivation, conservation, research and development and promotion of medicinal plants in the State. List of major institutions and District-wise distribution of institutions, beds and patients under ISM department during 2017-18 and 2018-19 is given in Appendix 6.2.12.
Special projects were implemented by the ISM department in 2018-19 in addition to the normal medical treatment. They are Balamukulam, Ritu, Prasadam, Koumarashtoulyam, Drishti, Jeevani, Punarnava, Karalrogamukthi, Snehadhara, Geriatric Care, Yoga, Sports Medicine, Panchakarma, Ksharasutra, Manasikam, koumarabhrithyam, prosoothithantra, sickle cell, Nirvisha, sidha, kshemajanani and ayushyam. Details are given in Appendix 6.2.13.
AYUSH (Ayurveda, Yoga and Naturopathy, Siddha, Unani and Homoeopathy)
GoI has set up two regulatory bodies to set standards of medical education. The Central Council of Indian Medicine (CCIM) under Indian Medicine Central Council (IMCC) Act, 1970 regulates educational institutions and practitioners in respect of ayurveda, unani and sidha systems of medicines. The Central Council of Homoeopathy (CCH) under Homoeopathy Central Council Act, 1973 regulates educational institutions and practitioners in respect of Homoeopathy system of medicines. At present Yoga and Naturopathy, being drugless systems, are not regulated.
National AYUSH Mission
Department of AYUSH, Ministry of Health and Family Welfare, GoI has launched National AYUSH

290 Economic Review 2019, Kerala State Planning Board
Mission (NAM). The basic objective of NAM is to promote AYUSH medical systems through cost effective AYUSH services, strengthening of educational systems, facilitate the enforcement of quality control of ayurveda, sidha, unani and homeopathy drugs and medicinal plants. The funding pattern is 60:40 by Centre and State. GoK started the Ayush department in the State on August 8, 2015.GoI release in 2016-17 was ₹858.63 lakhs and in2017-18 it was ₹2,096.20 lakhs. In 2018-19 GOI released an amount of ₹2597.84lakh.
Ayurveda Medicine Manufacturing – OUSHADHI
OUSHADHI is the largest manufacturer of ayurvedic medicines functioning in India in the public sector. It is one among the few profit making public sector undertakings. Oushadhi is the exclusive supplier of ayurvedic medicines to Government Hospitals and dispensaries of Ayurveda department. In Kerala, Oushadhi supplies medicines to State ISM department at 30per cent less than the market price and ISM Department supplies this medicine to the poor patients in the State free of cost. The company also caters to the demand of the public through a network of 845 exclusive agencies spread in and outside the State. The profit of the firm after tax in 2018-19 was ₹1915.54 lakhs.
Ayurveda Colleges
There are 3 Government Ayurveda colleges situated at Thiruvananthapuram, Thrippunithura and Kannur having bed strength of 1,311.Total number of inpatients treated in 2017-18 was 9,747 and outpatients treated were 4,20,879. It is 9,958 and 5,06,883 respectively in 2018-19. Panchakarma hospital and women and children hospital are also functioning under the Government Ayurveda college, Thiruvananthapuram. There are two aided Ayurveda colleges, 12 self-financingayurvedacolleges, one self-financing siddha college, one self-financing Unani college and 6paramedical self-financing colleges for
imparting medical education in the State. Annual intake of students for UG Degree is 1,080, PG Degree is 186 and Paramedical Courses is 450.
HOMOEOPATHY
There are 669 homeopathic dispensaries, 14 District hospitals, 17 taluk hospitals, 2 ten-bedded hospitals and one hospital with total bed strength of 1000 under homeopathy department in the State. In addition, Kerala State Homoeopathic Co-operative Pharmacy (HOMCO) Alappuzha, a medicine manufacturing unit is also functioning under the directorate of homeopathy. HOMCO is running in profit for the last 20 years. In 2018-19, net profit of HOMCO amounts to ₹96.58 crore. District-wise distribution of institutions, beds and patients treated under homeopathic department during 2018 and 2019 is given in Appendix 6.2.14.
Homoeo Medical Education
Homoeo medical education is imparted through two Government homeopathic medical colleges, at Thiruvananthapuram and Kozhikode. In addition to this, 3 aided colleges and one unaided college are functioning under this Department. Total bed strength of the Government homeopathic medical college at Thiruvananthapuram is 118 and the patient treated in 2018-19 in IP was 1,123 and OP was 1,13,137. Total bed strength of the Homeopathic Medical college at Kozhikode is 100 and the patient treated in 2018-19 in IP was 1,564 and OP was 1,49,067. Annual intake of students and courses in the six Homoeo Medical Colleges are given in Appendix 6.2.15.
Immunisation Coverage
Immunisation is one of the most successful and cost effective health interventions and prevents debilitating illness, disability and death from vaccine preventable diseases such as diphtheria, hepatitis A and B, measles, mumps, pneumococcal disease, polio, rotavirus diarrhoea, tetanus etc. The coverage of

291Chapter 6, Human Development
immunisation programmes in Kerala during five years from 2015-16 is given in Appendix 6.2.16.
The Way Ahead
The State aims to make the best possible preventive, curative, and palliative care available in the public sphere. The main objective of the Government is to establish a people-friendly state sector in health care. The thrust of the 13th Five Year Plan policy is to transform the quality of the public sector in health, to improve access and affordability with respect to health care, to expand insurance coverage, to expand facilities for public health and sanitation, and, in general, to put into place schemes and programmes that are intended to tackle the health issues that confront contemporary Kerala.

292 Economic Review 2019, Kerala State Planning Board
6.3 Impact of Changing Demographic Profile
Population ageing is an inevitable and irreversible demographic reality that is associated with improvements in health and medical care, as well as decline in fertility. We are aware that populations around the world are rapidly ageing. Both civil society and Government need to respond to changing demographic profiles. While ageing presents a challenge in terms of increased demand for primary health care and long-term care, requires a larger and better trained pool of care providers and intensifies the need for age-friendly infrastructure, yet, these investments can enable the older people to also contribute in many ways – whether it be within their family, to their local community (e.g. as volunteers or within the formal or informal workforce) or to society more broadly. WHO has declared 2020-2030 as The Decade of Healthy Ageing.
Families will have to provide financial and psychological resources to take care of the elderly. Loneliness is one of the major features of nuclear families and it is important that adequate care is taken of the elderly family members against problems such as loneliness and deprivation. Since the proportion of ageing population of Kerala is larger than other States of India, the State has a special responsibility in preventing physical, financial and mental abuses against the elderly. The elderly should be made familiar with their rights, backed by legislation to enable them to resist and take remedial steps against the abuses they face.
Demographic Transition in Kerala
Three key demographic changes — declining fertility, reduction in mortality and increasing survival at older ages — contribute to population ageing, reflected in a shift in the age structure from young to old. With longevity and declining fertility rates, the population of older persons (60 years and above) is globally growing faster than the general population. Kerala, which has achieved below replacement level fertility much earlier than other Indian States, has the highest proportion of elderly among Indian States (12.6 per cent of the population as per Census 2011).The State is currently passing through the most critical stage of demographic transition as a result of fertility and mortality changes, and consequent age structure transition. One of its important consequences is ageing of the population as reflected in the relative increase in the number of aged persons. This has substantial implications on Kerala’s socio-economic situation.
Demographic Transition - A Comparison of Kerala and the All India Context
As already mentioned, Kerala is ageing faster than the rest of India. In 1961, its 60 plus population, which was 5.1 per cent of the total was just below the national level of 5.6 per cent. Since 1980, Kerala has overtaken the rest of India and in 2001 the proportion of old age population rose to 10.5 per cent as against all India average

293Chapter 6, Human Development
of 7.5 per cent. By 2011, 12.6 per cent of the Kerala population is past 60 years, compared to the all India average of 8.6 per cent. By 2015 population data show that, it increased to 13.1 per cent in Kerala against the all India average of 8.3 per cent (SRS Statistical Report 2015). Currently, 48 lakh people (projected figures of population in 2018) of Kerala are 60 years and above; 15 per cent of them are past 80 years, the fastest growing group among the old. Women outnumber men among the 60 plus and among them, majority are widows. Kerala has got the highest life expectancy at birth of 72.5 years and 77.8 years for males and females respectively as per the SRS Report 2013-17. Generally, life expectancy among women is higher than men at the all-India level also, however, it is much higher in Kerala. General improvement in health care facilities is one of the main reasons for continuing increase in proportion of population of senior citizens. Men marrying women a few years younger is another cause for the high proportion of widows among the old. It is a worrisome revelation that, National Sample Survey (NSS) 2015 has found that 65 per cent of the aged population is affected by morbidity.
A large proportion of old age people in Kerala are widows. As per Census 2011, among the old age
in the range of 60-69, 23 per cent are widows and among those above 70 years it is 43.06 per cent. By 2025, about 20 per cent of our population would be elderly and the consequent demand on the social security system would be substantial. The age composition of Kerala’s senior citizens is given in Tables 6.3.1. The marital status of Kerala’s Senior Citizens is given Table 6.3.2.
The figures for currently married among the 60 plus population is misleading. While for 88.9 per cent of the men in age group 60 plus their wives are alive, for women the per cent is only 37.8. This means that for an overwhelming majority of men their wives are alive at older ages. Men marry wives several years younger and when they enter the age of 60, their wives will be much younger (may be in their late fifties).
Kerala Disability Census 2015
Among the disabilities affecting aged persons, locomotor disability stands top with 43 per cent and multiple disabilities stands second with 13 per cent (Disability Census 2015).Persons suffering from Alzheimer’s disease were 35,041. In Kerala, number of senior citizens having disabilities and living in institutions is 4,260, out of which 2,352 are female and 1,908 are male. In
Table 6.3.1 Age composition of senior citizens in Kerala , in numbers
Age composition Total Men Women
Total population 33406061 16027412 17378649
Total old age population 4193393 1853595 2309798
60-69 2416805 (58%) 1114368 (60%) 1272437 (55%)
70-79 1234739 (29%) 534879 (29%) 699860 (30%)
80 plus 541849 (13%) 204348 (11%) 337501 (15%)Source: Census of India, 2011
Table 6.3.2 Marital status of Kerala’s senior Citizens
Total Men Women
Never married 2.6 1.8 3.3Currently married 60.8 88.9 37.8Widowed 35.7 8.8 57.0Others 0.9 0.5 1 .9Without partner 39.2 11.1 62.2
Source: Census of India, 2011

294 Economic Review 2019, Kerala State Planning Board
this, there are 570 persons who are more than 80 years old. Number of households in which, all members are senior citizens is 4,32,953 which is 5.27 per cent of total households.
Increasing Old Age Dependency
Old Age Dependency Ratio is defined as the number of persons in the old age group 60 plus to that of the age group 15-59. The Old Age Dependency Ratio of India as per 2011 census is 142 and in Kerala it is 196, which is due to higher life expectancy at birth. The old age dependency ratio shows an increasing trend in Kerala and is highest among Indian States (Elderly in India 2016, Ministry of Statistics and Programme Implementation, GoI). It increased from 166 in 2001 to 196 in 2011. This implies that the responsibility of supporting the larger section of old age people is higher on the working age population, in terms of shelter, daily living, health expenditure and care giving in Kerala.
Senior Citizens as Experienced Human Resource
The retirement age for the State Government servants in Kerala is 56 years and in most of the public sector undertakings it is 60. Ageing lowers working life of persons. In Kerala, the retired Government staff get pension which helps them to have some financial security. Meaningful deployment of this experienced human power has the potential not only to enhance economic activity, but also help to keep the elderly busy, giving them a feeling of social relevance. But for those people who have no such job or other unorganised sector workers, there is no pension after retirement. Some of the elderly people, including disabled, widows get only a nominal amount as pension and it does not help to cover even their medical and other essential requirements. In future, ensuring a secure, dignified and productive life is a major challenge of the Government.
Nutritional Considerations for the Elderly
The number of individuals aged 60 years and above which is increasing is a group most vulnerable to many health risks including those from a nutrient poor diet. Healthy aging is not only to increase years of life but also, and importantly, to extend healthy active years. A significant number of elderly fail to get the amount and types of food necessary to meet essential energy and nutrient needs. Ageing population in developing countries is currently facing malnutrition due to an inadequate dietary intake and at the same time it is being observed that their diets are becoming higher in fats, animal products, refined foods and low in fiber, contributing to rapidly increasing prevalence of obesity and type 2 diabetes. Dietary interventions for the elderly therefore require urgent attention.
Health
Although Kerala has a very good health care system, it also has the highest morbidity. The 71st Round of National Sample Survey on Morbidity (January-June 2015) showed that while a total of 89 persons out of 1,000 persons surveyed reported ill during a 15 days period of survey all over India, the number reported from Kerala was 310 out of 1,000. Among the 60 plus population, this was 276 for India and 646 for Kerala. Kerala has the largest incidence of Non Communicable Diseases (NCDs) in India. The State is considered to be the diabetes capital of India. The Registrar General of India’s Report on Medical Certification of Cause of Death 2015, revealed that while in India only 3.4 per cent people died due to diabetes in 2015, it was 9.6 per cent for Kerala, the highest among Indian states. The cases of hypertension and cardio vascular diseases are not different. These may be treated as the factors reducing life span and affecting quality of life of the elderly. While these are general problems affecting all age groups in Kerala, it has a higher adverse impact on the old who are a more vulnerable group in matters of health.
295Chapter 6, Human Development
Government’s Role in Welfare of Aged
Since independence, the Government has been committed to supporting the old people in our society with certain welfare oriented interventions. The year 1999 was declared by the UN as the International Year of Older Persons followed by the GoI which on January 13, 1999, approved the National Policy for Older Persons for accelerating welfare measures and empowering the elderly in ways beneficial to them. Maintenance and Welfare of Parents and Senior Citizens Act, 2007 provides legal sanctions to the rights of the elderly. In addition to constitutional provisions for old age security, old age pension, establishing old age homes, expanding geriatric services, liberalising housing policy for elders have also been undertaken.
Ministry of Social Justice and Empowerment
The Ministry of Social Justice and Empowerment, GoI, as the name suggests, is to ensure equitable treatment to such sections of society which suffer social inequalities, exploitation, discrimination and injustice. The Social Defense Division of the Ministry mainly caters to the requirements of senior citizens, besides victims of alcoholism and substance abuse, transgender persons and beggars/destitutes. The Ministry develops and implements Acts, Policies and Programmes for welfare of senior citizens in collaboration with State Governments/Union Territory administrations to ensure that senior citizens may lead a secured, dignified and productive life.
National Policy on Senior Citizens, 2011
National policy recognises the rich experience of old persons and hence rightly considers them as important human resource, assures dignified life in their last phase, assures physical and financial security, health care, shelter and acknowledges the need for affirmative action by the Government, especially for the elder women and rural poor. The policy envisaged State support
to ensure financial and food security, health care, shelter and other needs of older persons, equitable share in development, protection against abuse and exploitation, and availability of services to improve the quality of life.
The Maintenance and Welfare of Parents and Senior Citizens Act, 2007
The Maintenance and Welfare of Parents and Senior Citizens Act, 2007 was enacted in December 2007, inter alia, to ensure need based maintenance for parents and senior citizens and their welfare. The Act provides for Maintenance of Parents/senior citizens by children/relatives as obligatory and justiciable through Tribunals, Revocation of transfer of property by senior citizens in case of negligence by relatives, Penal provision for abandonment of senior citizens, Establishment of Old Age Homes for Indigent Senior Citizens, protection of life and property of senior citizens and adequate medical facilities for Senior Citizens.Recently the Ministry of Social Justice and Empowerment, GoI, has finalised the Maintenance and Welfare of Senior Citizens (Amendment) Bill, 2018, expanding the ambit of social security for senior citizens by including distant relatives also responsible for their upkeep, increased the fine and imprisonment for abandoning parents and done away with the cap of ₹ 10,000 for maintenance. New clauses have been introduced which would make it mandatory to set standards for senior citizens care centres and multi-service day care centres.
Vayoshreshta Samman Award for the Aged
As part of recognizing the efforts made by eminent senior citizens and institutions involved in rendering distinguished services for the cause of elderly persons, the Ministry of Social Justice and Empowerment provides Vayoshreshta Samman Award to senior citizens, organisations and Panchayats. October 1st of every year is celebrated all over the world as International Day of the elderly by organising a series of programmes and facilitating distinguished senior

296 Economic Review 2019, Kerala State Planning Board
citizens with the Vayoshreshta Samman. This is to recognise the services rendered by the elderly, to sensitize the society about their problems and needs and to reiterate the Government’s commitment towards their cause.
Department of Social Justice
The Department of Social Justice in Kerala and Kerala Social Security Mission provides social security for the aged through a network of organisations, residential institutions and schemes. The attempt has been to follow a policy of healthy ageing defined “as the process of developing and maintaining the functional ability that enables wellbeing in older age”. Functional ability is about having the capabilities that enable all people to be and do what they have reason to value (WHO). This includes a person’s ability to:meet their basic needs;
• to learn, grow and make decisions;• to be mobile;• to build and maintain relationships; and• to contribute to society.
State’s Old Age Policy, 2013
The policy envisages the responsibility of the society in the wellbeing of all the aged people of above 60 years of age in the State. Along with
the love and respect to the aged people, special consideration may be given for their health and financial status. The elderly are to be provided with appropriate livelihood activities for being a respectable member of the society. The policy also includes the various schemes for the welfare of the aged people.
Institutions for elderly care in Kerala
There are 16 Government Old Age Homes functioning under the control of Social Justice Department. Out of which 11 homes were transferred to Local Self Governments and funds are also being routed through Local Self Government. There are 630 Old Age homes registered under Orphanages and Other Charitable Homes Act, 1960 which are functioning according to the provisions of the State Government rules and regulations. Sayamprabha Homes are day care centres. The day care centres functioning under the Local Self Government Department are upgraded by providing some extra facilities to senior citizens such as care provider, yoga classes, meditation classes, entertainment facilities, furnitures, and wheel chairs. Now 82 day care centres are running as Sayamprabha Homes of which 2 centres are functioning as Model Sayamprabha Homes (Multi Service Day Care Center for Elderly). These day care centres
Figure 6.3.1 Inmates in the old age homes under Social Justice Department and registered welfare institutions
Source: Social Justice Directorate

297Chapter 6, Human Development
will provide the most required services and help to provide a barrier free platform in their time of need. These day care facilities will offer an opportunity for the senior citizens to mingle with their own age group and provide solace to elderly who suffer loneliness, especially during daytime.
Old Age Homes and Day Care Centres are maintained for the care and protection of senior citizens having nobody to look after. The persons seeking admission in these institutions need to submit their application to the Superintendent of the institution. Confirmation of the admission shall be made after getting the enquiry report of the District Probation Officer.
In Kerala, the culture of sending elderly persons to Old Age Home is fast developing. The number of inmates in the old age homes (under Social Justice Department and Registered Welfare Institutions) was 17,499 in 2015-16. It has increased to 19,149 in 2016-17, 27,272 in 2017-18 and 28,029 in 2018-19.
Kerala Maintenance and Welfare of Senior Citizens Rules, 2008
Under these Rules the senior citizens or parents who are unable to maintain herself or himself can apply for maintenance to the Maintenance Tribunal. The Revenue Divisional Officers (RDO) are appointed as the Presiding Officers of Maintenance Tribunal under the Act for each sub-division. District collectors are appointed as Presiding Officers of Appellate Tribunal for each District, and District Welfare Officers are designated as Maintenance Officers for each District.
Schemes of the Central Government
Rashtriya Vayoshri Yojana (RVY)
As per the data from Census 2011, the population of senior citizens in India is 10.38 crore, out of which 1.13 crore persons are above the age of 80 years. More than 70 per cent of the population of senior citizens lives in rural areas of the country.
Around 5.2 per cent of the senior citizens suffer from various age related disabilities. Increased life expectancy and advancements in health care, have resulted in rising proportion of elderly in Indian population. The number of elderly population will increase to around 17.3 crore by 2026. The RVY scheme provides physical aids and life assistance devices for senior citizens suffering from age related disabilities/infirmities, who belong to Below Poverty Line (BPL) category. The Scheme aims to address disability/infirmity low vision, hearing impairment, loss of teeth and locomotor disability.
Integrated Programme for Senior Citizens
The main objective of this Central sector scheme is to improve the quality of life of the older persons by providing basic amenities like shelter, food, medical care and entertainment opportunities. It aims to achieve productive and active ageing through providing support to Government/Non-Governmental Organisations/Panchayati Raj Institutions etc.
National Old Age Pension Scheme
The Indira Gandhi National Old Age Pension Scheme (IGNOAPS) is a non-contributory old age pension scheme that covers Indian citizens who are 60 years and above and live below the poverty line. The IGNOAPS beneficiaries aged 60-75 receive a monthly pension of ₹1200. Those 75 years and above receive a higher monthly pension amount of ₹1,500. IGNOAPS is presently handled by Local Governments, along with all social security pensions. In 2018-19, the amount utilised from Central share is ₹222 crore and that from State share is ₹5,269.79 crore. The Local Governments receive the application, process them and distribute the pension under the scheme.
Reservation in Public Transport System
Ministry of Shipping, Road Transport and
298 Economic Review 2019, Kerala State Planning Board
Highways, GoI has directed to provide reservation of two seats in front row of the buses of the State Road Transport Undertakings for senior citizens. This is implemented in all transport buses in Kerala. Senior citizens with Indian citizenship, who are over 60, are eligible for 50 per cent discount on economy fare for domestic travel by air. Men over the age of 60, and women over the age of 58 are eligible for 40 per cent and 50 per cent discount respectively in train fares.
Schemes of the Government of Kerala
Age Friendly Panchayat
This scheme is implemented by Social Justice Department of Kerala as a new initiative under the State Old Age Policy, 2013. Converting all the Panchayats in the State into age-friendly Panchayats for ensuring good health, participation and assuring quality of life to the Senior Citizens are the objective of the programme.
Vayomithram
Kerala Social Security Mission is implementing this programme in 6 Municipal Corporations and 85 Municipalities and one block of all the 14 Districts. The Vayomithram project provides health care and support to elderly above the age of 65 years residing in the State. The project mainly provides free medical checkup and treatment through mobile clinics. It also provides palliative care, ambulance facilities, counselling and help desk for the old age persons. The project is implemented with the participation of Local Governments. Vayomithram provides medicines free of cost by conducting mobile clinics on a ward basis in the area. Each mobile unit comprises Medical Officer, Staff Nurse and Junior Public Health Nurse (JPHN). Palliative care service is provided for the bed ridden patients in the project area. Special trained nurses and JPHNs are available for the service. Vayomithram co-ordinators provide help desk service to the needy old age persons in the area. Cancer detection camps, dental care camps, recreation
programmes, are organised for the elderly every year. In 2018-19, the number of beneficiaries of the project was 2,69,416. It has been decided to extend this project to all Block Panchayats in the State. The aim is to start one Vayomithram unit in each Block every District. It is also proposed to start ‘Ayurmithram’ in 6 corporations, for providing ayurvedic treatment to the elderly.
Vayoamrutham
The Social Justice Department with the support of Indian System of Medicine department implements this initiative in Government Old age homes for the treatment of inmates who are suffering from various health problems. Majority of cases treated are for ailments such as diabetes, asthma, skin diseases, arthritis, eye and ear diseases. Health support given includes palliative care and counseling for the bedridden. As part of this scheme, Ayurvedic treatment is being provided to the inmates belonging to all the Government Old Age Homes functioning under Social Justice Department. The inmate will be provided with the service of a medical officer and an attender. A total of 786 inmates of government old age homes have been provided Ayurveda treatment through this scheme in 2018-19.
Mandahasam
Mandahasam is an initiative by Social Justice Department for giving free set of teeth for the senior citizens. The scheme aims to reduce nutritional, physical and mental problems faced by the elderly people after loss of their teeth. The department has prepared a list of dental colleges and dental treatment centres from where the beneficiaries could avail of treatment. It would also ensure the quality of artificial tooth and quality treatment by setting standards and norms. Senior citizens who fall in BPL category would be eligible for the benefit under this scheme. One beneficiary would get maximum financial assistance of ₹5,000 for fixing the teeth. Assistance has been provided to 1301 old age people through this scheme in 2018-19.

299Chapter 6, Human Development
Sayamprabha– Comprehensive Scheme for Senior Citizens
Sayamprabha project is a new initiative of Social Justice Department that provides day care facilities in co-operation with Local Governments along with other welfare activities and building awareness of the different contexts in which abuse can arise and the different forms it can take. Various programmes are implemented for the welfare of Old age Persons under this scheme. Vayosangamam, Mandahaasam, Vayomadhuram, awareness in active and healthy Aging, making infrastructure and offices age friendly etc. are some of the activities.
Vayomadhuram
Kerala has the largest number of diabetes patients in India. Based on the recent studies conducted by ICMR (Indian Council of Medical Research), 19.4 per cent people have diabetes in Kerala. Among the oldage population of Kerala, 80 per cent suffer from diabetes. With the intention of an old age friendly State, the Social Justice Department under GoK has introduced a new initiative titled “Vayomadhuram” which provides glucometers freely to elderly diabetic persons coming under BPL category. Under this scheme, the department will provide glucometers to 14,000 diabetic old age persons.


LABOUR AND EMPLOYMENT
07C H A P T E R


303Chapter 7, Labour And Employment
LABOUR AND EMPLOYMENT7.1 Labour and Labour Welfare
07C H A P T E R
Kerala has followed a rights-based approach that is sensitive to the changing needs of the labour market. The policy initiatives of the Government seek the overall growth and development of the industry and the individual worker. Workers in Kerala have been protected through the constant intervention of the Government on the right to work, right against discrimination, prohibition of child labour, social security, protection of wages, redressal of grievances, right to organise and form trade unions, collective bargaining and participation in management. It is an accepted fact that the labour laws and labour welfare schemes implemented by the State are much wider in scope than that of other parts of the country. The Government is of the view that every employee/worker be a member of a Welfare Board and get lifelong social security. Currently, around 29 labour welfare boards exist in the State, of which 16 are under the Labour Commissionerate.
Kerala has been facing many challenges in the labour sector in terms of unemployment and underemployment, low rate of productive employment creation, inadequate levels of skill creation and training, low level of labour force participation and lesser worker-population ratio. On the whole, the State needs to create additional employment opportunities and employment-intensive growth and for which the labour force has to move from low-value-added to high-value-added activities. The State aims to achieve job induced growth in the economy to
create new jobs in both urban and rural Kerala, a unified and consolidated legislation for social security schemes, re-prioritisation of allocation of funds to benefit vulnerable workers, long-term settlements based on productivity, labour law reforms in tune with the times, amendments to Industrial Disputes Act, 1947 and revamping of curriculum and course content in Industrial Training Institutes (ITIs). Monitoring and evaluation have also been considered integral to labour reforms against the backdrop of increasing inter-State and international migration.
Daily Wage Rate
Compared to other parts of the country, reported wage rate of workers in both agricultural and non-agricultural sectors in Kerala is higher. Average daily wage rate of agricultural and non-agricultural workers in India published by Labour Bureau, GoI shows that for male and female general agricultural workers in rural Kerala, it is ₹758.52 and ₹544.72 respectively in December 2018. The national average of the wage rate for this category of workers is only ₹288.24 and ₹238.43. The wage rate in Kerala is more than 200 per cent higher than the national wage rate. Figure 7.1.1 given below shows the average wage rate of male and female agricultural workers in the rural area in Kerala compared to the national average and the Southern States.

304 Economic Review 2019, Kerala State Planning Board
Even though the wage rates of agricultural labourers in rural Kerala are higher than the wages in other parts of the country, the wage disparity among the male and female workers is noticeable. The male-female wage gap among the rural workers engaged in sowing and other works is around 70 per cent. Further, the wide disparity in male-female wage rates is an indication of the fact that the perception of gender equality is far from reality.
The average daily wage rates are much higher than the minimum wages in Kerala that attract in-migrants into the State, especially from States where wage rates are very low. The average daily wage rate of non-agricultural workers in rural Kerala in December 2019 is shown in Figure 7.1.2.
Figure 7.1.1 A comparison of average daily wage rates of male and female agricultural workers in southern States, in December 2018
Source: Labour Bureau, Ministry of Labour and Employment, GoI
Figure 7.1.2 The average daily wage rate of non-agricultural workers in rural Kerala
Source: Labour Bureau, Ministry of Labour and Employment, GoI

305Chapter 7, Labour And Employment
Composition of Workers
The labour community in Kerala mainly consists of those who are engaged in the informal sector (loading and unloading, casual work, construction work, brick making self-employment etc.), traditional industries (coir, cashew, handloom, beedi etc.,), manufacturing sector (small, medium and large industries), IT industry, units in export promotion zones and those who are seasonally employed.
Measurement of Labour Force
In a country where the majority of the workers are employed in the unorganised sector and pursuing multiple activities, estimating labour force and its derivatives by a single approach is a difficult task. In such cases, no single measure is appropriate to estimate the labour force parameters precisely. As per International practice, Labour Force related parameters can be estimated for both longer reference period and current or shorter reference periods. Accordingly, based on longer reference period, Labour Force related parameters may be derived by the following two different approaches.
i) Usual Principal Status (UPS) Approach
The major time criterion based on the 365 days is used to determine the activity pursued by a person under the usual principal status approach. Accordingly, the major time spent by a person (183 days or more) is used to determine whether the person is in the labour force or out of the labour force. A person found unemployed under this approach reflects chronic unemployment. The usual principal status approach estimates are derived for a moving reference period of the last twelve months.
ii) Usual Principal and Subsidiary Status (UPSS) Approach
The other important approach to measure the labour force parameters is the Usual Principal and Subsidiary Status Approach. This approach
is a hybrid one which takes into consideration both the major time criterion and a shorter time period (30 days or more in any economic activity). Thus a person who has worked even for 30 days or more in any economic activity during the reference period of the last twelve months is considered as employed under this approach. In this approach, the reference period is the same as taken in the usual principal status approach (UPS). This approach is also called the Usual Status approach.
(Source: 5th Annual Employment and Unemployment Survey of Labour
Bureau, GoI)
Labour Force
Labour force, or in others words, the ‘economically active’ population, refers to the population which supplies or seeks to supply labour for production and, therefore, includes both ‘employed’ and ‘unemployed’ persons.
Labour Force Participation Rate (LPR):
The situation of the labour force in Kerala can be gauged from the indicators such as LFPR, WPR, daily wage rage and trend in industrial relations. Low-level LFPR is the perpetual characteristic of Kerala labour market among Indian States. Apart from a slight increase of LFPR in the urban region, labour force participation has been constant over the last two years.
LFPR is defined as the percentage of persons in the labour force in the population.
LFPR = (No.of employed persons+ No. of Unemployed persons)/Total Population×100
Figure 7.1.3 Labour Force Participation Rate in per cent according to usual status (principal status+subsidiary status) in Southern States and all india (Age group 15-29 year)
It is evident from the figure that, the Labour Force Participation Rate in Kerala according to

306 Economic Review 2019, Kerala State Planning Board
the age group 15-29 is not better when compared to all india level both in rural and Urban areas.
Worker Population Ratio (WPR):
WPR is an indicator used for analysing the employment situation and knowing the proportion of the population actively
contributing to the production of goods and services in the economy.
WPR defined as the percentage of employed persons in the population
WPR = No. of employed Persons/Total Population×100
Figure 7.1.3 Annual Report Periodic Labour Force Survey (PLFS2017-18), GoI, Ministry of Statistics and Programme Implementation
Source: Labour Bureau, Ministry of Labour and Employment, GoI
Figure 7.1.4 Worker Population Ratio, in per cent, according to usual status (ps+ss) for southern States and All India, age group 15-59
Source: Annual Report PLFS2017-18, GoI, Ministry of Statistics and Programme Implementation
307Chapter 7, Labour And Employment
Figure 7.1.4 shows that, the Worker Population Ratio (WPR) in the age group 15-59 the status of Kerala is not in an appreciable position, when compared to the other Southern States. All India rate is also higher than that of Kerala.
Work Participation Rate for women
As per Census 2011, the Work Participation Rate for women is 25.51 per cent as compared to 25.63 per cent in 2001. The Worker Population Rate (WPR) for women in rural areas is 35.1 per cent as compared to 17.5 per cent in urban areas based on 4th Annual Employment Unemployment Survey (2013-14) and same is 30.2 per cent in rural area and 14.8 per cent in urban area under 5th Annual Employment Unemployment Survey (2015-16) under Usual Principal and Subsidiary Status (UPSS) Approach. As per 4th and 5th Annual Employment Unemployment Survey launched by Labour Bureau in December 2013 and April 2015, the overall Female Labour Force Participation Rate under Usual Principal and Subsidiary Status (UPSS) Approach has decreased from 31.1 per cent to 27.4 per cent.
Industrial Relations
Healthy relations between employer and employee are the key to sustained industrial development. The responsibility of the Labour Department is to aid and maintain a harmonious balance between the labourers and management to maintain a conducive atmosphere for achieving the objective of industrial growth and prosperity in the State.
Definitions in Industrial Disputes Act, 1947
Strike: Section 2(q) of the Act defines the term ‘strike’ as cessation of work by a body of persons employed in any industry acting in combination or a concerted refusal, or a refusal under a common understanding of any number of persons who are or have been so employed to continue to work or to accept employment.
Lockout: Lockout, as defined in section 2(1), means the temporary closing of a place of employment, or the suspension of work, or the refusal by an employer to continue to employ any number of personnel employed by him.
Layoff: As per section 2(KKK) of the Act, ‘Lay Offs’ means the failure, refusal or inability of an employer on account of shortage of coal, power or raw materials or the accumulation of stocks or the breakdown of machinery or natural calamity or for any other connected reason to give employment to a workman whose name is borne on muster rolls of his industrial establishment and who has not been retrenched.
(Source: Statistics on Industrial Disputes, closure, retrenchments and layoffs
in India in the year 2013, Labour Bureau, Ministry of Labour, GoI)
The intensity of labour strikes in the State has reduced significantly over the years. The person-days lost due to strikes in the State for the year 2019 (up to July) is 1.32 lakh against 2.21 lakh in the year 2015. Figure 7.1.5 shows the person-days lost due to strikes in Kerala. Details are provided in Appendix 7.1.1.
Person-days Lost Due to Lockout
Person-days lost due to lockout shows an increasing trend over the year 2016 and 2017. In the year 2016, total person-days lost due to lockout was 5.26 lakh, which increased to 6.08 lakh in 2017 and again declined to 5.93 lakh in 2018. The person-days lost due to lockout in 2019 (up to July) to 3.75 lakh. Figure 7.1.6 shows the details of person-days lost due to the lockout in Kerala. Details are provided in Appendix 7.1.2.
Person-days Lost Due to Lay Off
The person-days lost due to the layoff was 68.33 thousand in 2014 which increased to 4.24 lakh in 2016 and to 5.28 lakh in 2017. It declined in 2018 to 4.73 lakh and. It is 2.91 lakh in 2019 (up to July). Figure 7.1.7 shows the trend of person-days lost due to lay off in Kerala. The details are given in Appendix 7.1.3.

308 Economic Review 2019, Kerala State Planning Board
This is despite the fact that for the last ten years, the number of working factories in the State has steadily increased. Details are provided in Appendix 7.1.4. A number of factories working in the State in 2015 were 21,850. It has increased to 24,254 in 2019. Subsequently, the average daily employment creation in these factories increased from 6.88 lakh in 2015 to 6.98 lakh in 2018. Figurers 7.1.8 and 7.1.9 show the number of working factories and employment details in Kerala. Details of industrial accidents are given in Appendix 7.1.5.
Industrial Disputes
Providing a platform for raising grievances and settlement of the issues between employee and employer is an essential requirement for ensuring harmonious labour relations in the State. Industrial Disputes Act of 1947, provides the legal framework for the same though it applies only to the organised sector. It also regulates lay off and retrenchment. The number of disputes pending at the beginning of the year
Figure 7.1.5 Person-days lost due to strikes, in number
Source: Labour Commissionerate, GoK
Figure 7.1.6 Person-days lost due to lockouts, in number
Source: Labour Commissionerate, GoK

309Chapter 7, Labour And Employment
Figure 7.1.7 Person-days lost due to lay off, in number
Source: Labour Commissionerate, GoK
Figure 7.1.8 Number of working factories in Kerala
Source: Factories and Boilers Department, GoK
Figure 7.1.9 Employment details in factories, Kerala
Source: Factories and Boilers Department, GoK
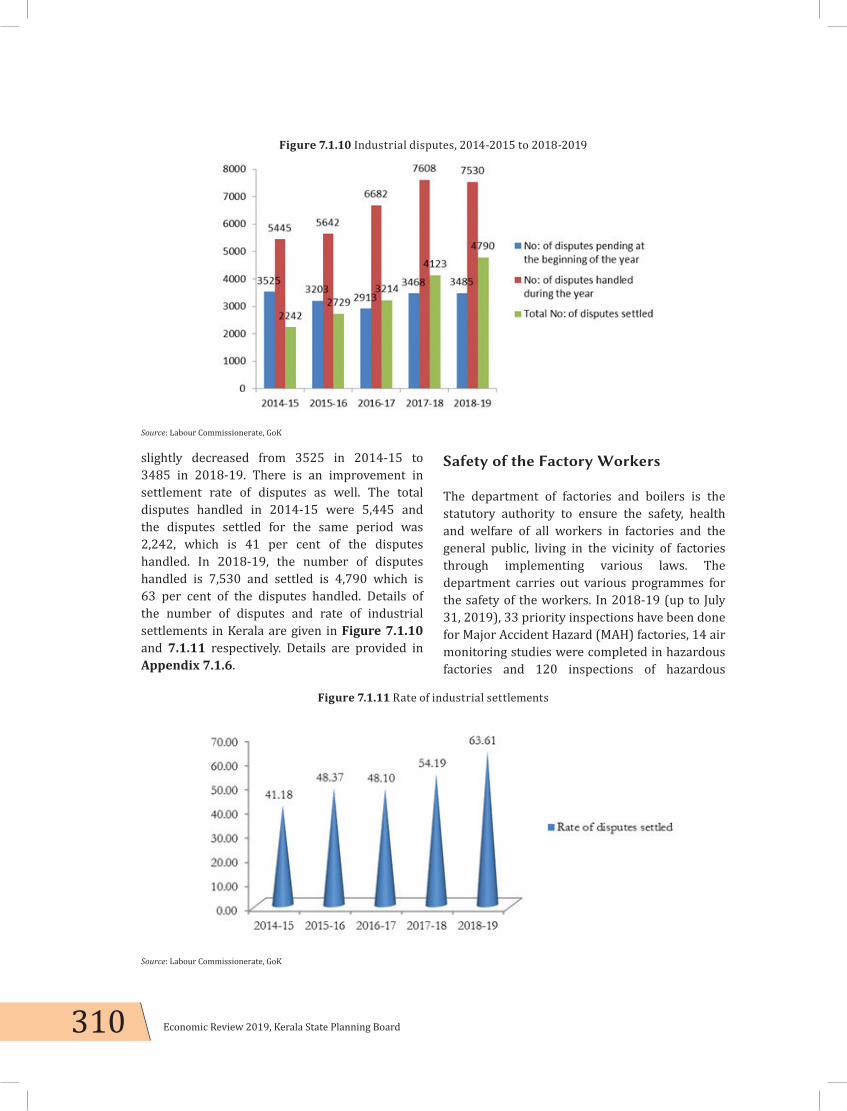
310 Economic Review 2019, Kerala State Planning Board
slightly decreased from 3525 in 2014-15 to 3485 in 2018-19. There is an improvement in settlement rate of disputes as well. The total disputes handled in 2014-15 were 5,445 and the disputes settled for the same period was 2,242, which is 41 per cent of the disputes handled. In 2018-19, the number of disputes handled is 7,530 and settled is 4,790 which is 63 per cent of the disputes handled. Details of the number of disputes and rate of industrial settlements in Kerala are given in Figure 7.1.10 and 7.1.11 respectively. Details are provided in Appendix 7.1.6.
Safety of the Factory Workers
The department of factories and boilers is the statutory authority to ensure the safety, health and welfare of all workers in factories and the general public, living in the vicinity of factories through implementing various laws. The department carries out various programmes for the safety of the workers. In 2018-19 (up to July 31, 2019), 33 priority inspections have been done for Major Accident Hazard (MAH) factories, 14 air monitoring studies were completed in hazardous factories and 120 inspections of hazardous
Figure 7.1.10 Industrial disputes, 2014-2015 to 2018-2019
Source: Labour Commissionerate, GoK
Figure 7.1.11 Rate of industrial settlements
Source: Labour Commissionerate, GoK
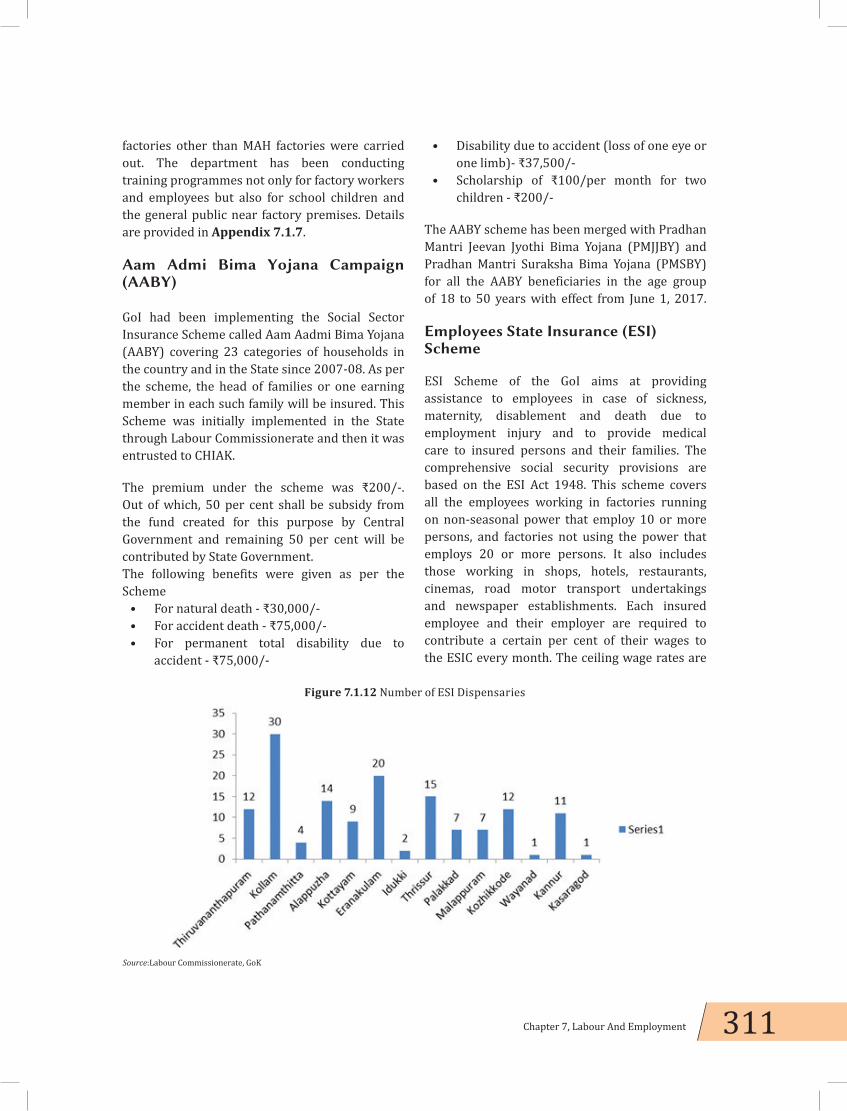
311Chapter 7, Labour And Employment
factories other than MAH factories were carried out. The department has been conducting training programmes not only for factory workers and employees but also for school children and the general public near factory premises. Details are provided in Appendix 7.1.7.
Aam Admi Bima Yojana Campaign (AABY)
GoI had been implementing the Social Sector Insurance Scheme called Aam Aadmi Bima Yojana (AABY) covering 23 categories of households in the country and in the State since 2007-08. As per the scheme, the head of families or one earning member in each such family will be insured. This Scheme was initially implemented in the State through Labour Commissionerate and then it was entrusted to CHIAK. The premium under the scheme was ₹200/-. Out of which, 50 per cent shall be subsidy from the fund created for this purpose by Central Government and remaining 50 per cent will be contributed by State Government. The following benefits were given as per the Scheme
• For natural death - ₹30,000/-• For accident death - ₹75,000/-• For permanent total disability due to
accident - ₹75,000/-
• Disability due to accident (loss of one eye or one limb)- ₹37,500/-
• Scholarship of ₹100/per month for two children - ₹200/-
The AABY scheme has been merged with Pradhan Mantri Jeevan Jyothi Bima Yojana (PMJJBY) and Pradhan Mantri Suraksha Bima Yojana (PMSBY) for all the AABY beneficiaries in the age group of 18 to 50 years with effect from June 1, 2017. Employees State Insurance (ESI) Scheme
ESI Scheme of the GoI aims at providing assistance to employees in case of sickness, maternity, disablement and death due to employment injury and to provide medical care to insured persons and their families. The comprehensive social security provisions are based on the ESI Act 1948. This scheme covers all the employees working in factories running on non-seasonal power that employ 10 or more persons, and factories not using the power that employs 20 or more persons. It also includes those working in shops, hotels, restaurants, cinemas, road motor transport undertakings and newspaper establishments. Each insured employee and their employer are required to contribute a certain per cent of their wages to the ESIC every month. The ceiling wage rates are
Figure 7.1.12 Number of ESI Dispensaries
Source:Labour Commissionerate, GoK

312 Economic Review 2019, Kerala State Planning Board
Figure 7.1.13 The distribution of migrant workers from different States
Source: Labour Commissionerate, GoK
revised from time to time. The ESI Scheme runs like most of the social security schemes. It is a self-financing health insurance scheme and the contributions are raised from covered employees and their employers as a fixed per cent of wages. The payments are to be made on a monthly basis. The number of ESI Dispensaries and Hospitals are given in Appendix 7.1.8 and Figure 7.1.12.
Migrant Workers
The recent trend in the employment sector in the State shows a large inflow of migrant worker from other States such as West Bengal, Bihar, Odisha, Uttar Pradesh, Chhattisgarh, Jharkhand etc. besides the neighbouring St ates. Working conditions of the inter-State migrant workers are dealt under the Inter-State Migrant Workmen Regulation of Employment and Conditions of Service Act, 1979. As per the provisions of the Act, the contractor has to obtain a recruitment license from the State from where the workers are recruited (original State) and an employment license from the State where they are employed (recipient State). Accordingly, the contractor and the principal employer become liable for ensuring the provisions envisaged in the
enactment as an immediate employer and the principal employer respectively. But usually, these workers cannot be brought under the purview of the enactment due to lack of statutory ingredients required to attract the ambit of the enactment such as an intermediary third party/contractor between the principal employer and the workmen. These workers are compelled to live in groups in unhygienic conditions near their working place without proper health facilities.
The number of migrant workers has increased to 3,93,281 as on July 31, 2019 from 2,85,849 in 2018 (as on July 31, 2018). In Kerala, the highest numbers of migrants are from West Bengal. The distribution of migrant workers from different States in shown in Figure 7.1.13. The State-wise break up details are provided in Appendix 7.1.9. Ernakulam has the highest concentration of migrant workers in the State. District-wise inter-State migrant workers in Kerala is shown in Figure 7.1.14.
Workers Availing of Social Security
Social security plays a vital role in the economic and social livelihood of every worker. A worker
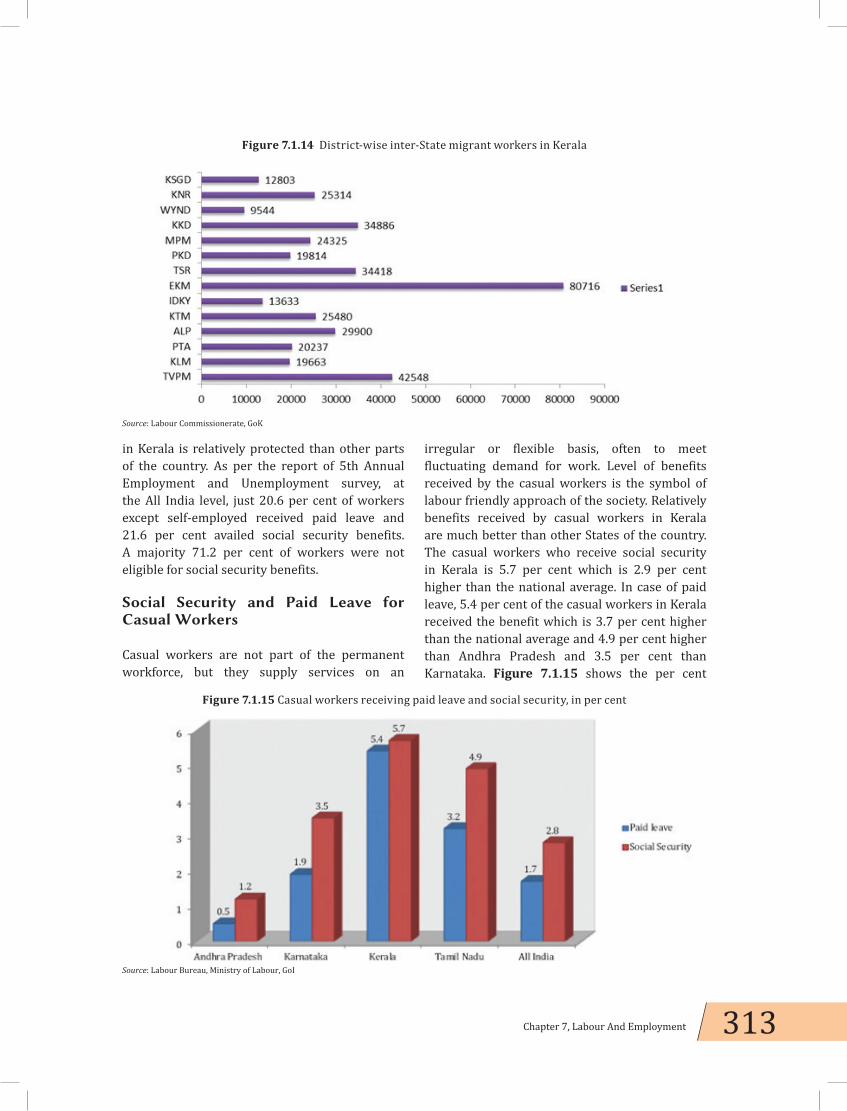
313Chapter 7, Labour And Employment
in Kerala is relatively protected than other parts of the country. As per the report of 5th Annual Employment and Unemployment survey, at the All India level, just 20.6 per cent of workers except self-employed received paid leave and 21.6 per cent availed social security benefits. A majority 71.2 per cent of workers were not eligible for social security benefits.
Social Security and Paid Leave for Casual Workers
Casual workers are not part of the permanent workforce, but they supply services on an
irregular or flexible basis, often to meet fluctuating demand for work. Level of benefits received by the casual workers is the symbol of labour friendly approach of the society. Relatively benefits received by casual workers in Kerala are much better than other States of the country. The casual workers who receive social security in Kerala is 5.7 per cent which is 2.9 per cent higher than the national average. In case of paid leave, 5.4 per cent of the casual workers in Kerala received the benefit which is 3.7 per cent higher than the national average and 4.9 per cent higher than Andhra Pradesh and 3.5 per cent than Karnataka. Figure 7.1.15 shows the per cent
Figure 7.1.14 District-wise inter-State migrant workers in Kerala
Source: Labour Commissionerate, GoK
Figure 7.1.15 Casual workers receiving paid leave and social security, in per cent
Source: Labour Bureau, Ministry of Labour, GoI

314 Economic Review 2019, Kerala State Planning Board
of casual workers received paid leave and social security in Kerala and other parts of South India.
Given the changing employment landscape of the State, the role of the Labour Department is critical to ensure the long-term employer-employee relationship. The issues confronting the vulnerable sections of the labour force are to be addressed through effective implementation of labour laws and focused welfare policies. A realisation has dawned upon all the stakeholders those most vulnerable sections of the labour resources viz., women, migrant worker and the vast mass of labour working in the unorganised sector need special attention.

315Chapter 7, Labour And Employment
7.2 Employment
Unemployment Situation – Global and Indian perspective
According to the “World Employment and Social Outlook Trends 2019”, International Labour Organisation (ILO), the global unemployment levels fell one percentile to a steady 5 per cent in 2018, the lowest figures since the economic crisis that wreaked havoc on labour markets. The unemployment rates were anticipated to fall further to 4.9 per cent this year, which is expected to hold steady into 2020 despite the fact that the number of jobless in real terms is estimated to rise from 172 million to 174 million in that time as the labour market expands.
The ILO, which is celebrating its 100th anniversary in 2019, lamented the fact that it had taken nine years to recover from the shock of the 2007-08 global financial crisis. While the number of jobs was generally increasing worldwide, the quality of those jobs was not necessarily improving. Gender continued to present a real issue. The poor quality of many jobs also manifests itself in the fact that, in 2018, more than one quarter of workers in low and middle-income countries were living in extreme or moderate poverty. The much lower labour force participation of women, which stood at 48 per cent, compared with 75 per cent for men, means that around three in five of the 3.5 billion people in the global labour force were men.
Global unemployment among young people stood at 11.8 per cent. In line with a stable aggregate unemployment rate, the outlook for men, women and young people with regard to opportunities on the job market is also very stable. The youth participation in the labour market has been declining steadily for the last 25 years, highlighting the factor that more young people were pursuing higher studies than entering the labour market.
The unemployment situation in India has also worsened. The GoI recently released the Periodic Labour Force Survey (PLFS) 2017-18 Report. This Report is based on survey conducted by NSSO from July 2017 to June 2018. The survey was spread over 12,773 FSUs (7,014 villages and 5,759 urban blocks) covering 1,02,113 households (56,108 in rural areas and 46,005 in urban areas) and enumerating 4,33,339 persons (2,46,809 in rural areas and 1,86,530 in urban areas). Estimates of the labour force indicators are presented in this Report based on the usual status (ps+ss) approach and current weekly status approach adopted in the survey for classification of the population by activity statuses. The reference period for usual status (ps+ss) approach is 1 year and for current weekly status approach, it is 1 week.
Many articles have appeared since, comparing the 2017-18 unemployment rate based on PLFS with the 2011-12 unemployment rate from the Employment-Unemployment Survey (EUS)

316 Economic Review 2019, Kerala State Planning Board
of the National Sample Survey Organisation (NSSO), arriving at alarming conclusions that unemployment in India has worsened between 2011-12 and 2017-18.
NSSO has computed unemployment rate every 4-5 years since 1972-73. These data are computed separately for men and women, in urban and rural areas, using two different sets of questions. One set is based on the usual status of employment, and the other on the current weekly status.
Based on the usual status question, male unemployment in rural areas in the nine NSSO rounds from 1972 to 2011 was between 1.2 per cent and 1.8 per cent, that is, always below 2 per cent. For the first time in the last 47 years, in 2017-18, based on the PLFS survey, the unemployment rate crossed the 2 per cent mark. The increase was not by a small margin, but by a factor of three. The PLFS rural male unemployment rate in 2017-18 was 5.8 per cent.
Based on the current weekly status, male unemployment in rural areas in the nine NSSO rounds from 1972 to 2011 was between 3 per cent and 4.2 per cent. Again, in 2017-18, based on the PLFS survey, the unemployment rate was
more than double, the highest unemployment rate in about half a century. PLFS current weekly status of unemployment in 2017-18 was 8.8 per cent.
Unemployment Rate
Unemployment rate (UR) is defined as the percentage of unemployed persons in the labour force and is measured in terms of Usual Status (ps+ss), Weekly Status and Daily Status. This gives the unutilised portion of the labour force. According to the Periodic Labour Force Survey (PLFS) conducted by NSSO, GoI from July 2017 to June 2018, the Unemployment under usual status (ps+ss) for persons of age 15 years and above of different general education level rate among the major States, Kerala has the highest (UR) of 11.4 per cent as against the all India level of 6.0 per cent (Figure 7.2.1). In the usual status (ps+ss), unemployment rate was 5.3 per cent among males and 3.8 per cent among females in rural areas, while the rates were 7.1 per cent among males and 10.8 per cent among females in urban areas. The corresponding unemployment rate in Kerala was 10.0 per cent among males and 19.6 per cent among females in rural areas, while the rates were 6.6 per cent among males and 27.4 per cent among females in urban areas. Among
Figure 7.2.1 Unemployment Rate, in per cent, according to usual status (ps+ss) for persons of age 15 years and above of different general education level for each State/UT, in per cent
Source: PLFS report, 2017-18, GoI

317Chapter 7, Labour And Employment
all States, small States like Nagaland, Manipur, Goa have a higher unemployment rate than India(Appendix 7.2.1).
As per the Usual Status (ps+ss) approach for persons of age 15 years and above, the lowest unemployment rate of 0.4 per cent is estimated in Dadra and Nagar Haveli (UT). Among the States, the lowest unemployment rate is estimated in Meghalaya (1.6 per cent). The other major States, which have lower UR than the all India average (6 per cent) are Chhattisgarh (3.3 per cent), Sikkim (3.5 per cent), Gujarat (4.8 per cent), Karnataka (4.8 per cent), Madhya Pradesh (4.3 per cent) Andhra Pradesh (4.5 per cent) and West Bengal (4.6 per cent).
For educated (highest level of education secondary and above) rural males and rural females of age 15 years and above, unemployment rates in usual status (ps+ss) were 10.5 per cent and 17.3 per cent respectively. For educated males of age 15 years and above in urban areas, the unemployment rate was 9.2 per cent and among the educated females of age 15 years and above in the urban areas, the unemployment rate was 19.8 per cent in 2017-18. For education level of Higher Secondary and Above the Unemployment rates of
all India level is 11.4 per cent and Kerala it is 19.8 per cent (Appendix 7.2.2).
In Current Weekly Status (CWS), for persons of age 15 years and above, the unemployment rate was 8.7 in India both male and female and the corresponding unemployment rate of Kerala was 14.8. For the rural urban classification in all India level, the unemployment rate was 8.7 per cent among males and was 7.5 per cent among females in rural areas while the rates were 8.7 per cent among males and 12.7 per cent among females in urban areas. The corresponding unemployment rate in Kerala was 9.1 per cent among males and was 23.5 per cent among females in rural areas while the rates were 10.9 per cent among males and 29.8 per cent among females in urban areas (Appendix 7.2.3).
The male and female unemployment rate in Kerala in rural and urban areas as measured by Usual Status (ps+ss) and CWS approaches are found to be generally much higher than all India average. The Unemployment Rate (UR) of Kerala under Usual Status (ps+ss) approach is 11.4. Female unemployment, particularly in rural areas, is a matter of concern in Kerala. However, the female Labour Force Participation Rate
Figure 7.2.2 Unemployment Rate, in per cent according to usual status (ps+ss) for persons of age 15 years and above of different general education level for each State/UT
Source: PLFS report, 2017-18, GoINote: The estimates based on usual status considering principal and subsidiary statuses together is called as unemployed in usual status (ps+ss). The estimate of unemployed in current weekly status (CWS)gives an average picture of unemployment in a short period of 7 days during the survey period.

318 Economic Review 2019, Kerala State Planning Board
(LFPR) in Kerala is estimated at 31.9 per cent which is higher than the all India level of 25.3 per cent (Appendix 7.2.4). As per the PLFS report, the UR is lower in rural areas as compared to urban areas (Figure 7.2.2).
Unemployment Rates of the Youth
Persons aged 15-29 years, are considered as the youth. The youths in India share nearly 27 to 28 per cent of the total population. Productive employment of youth is an essential factor for economic development. The unemployment rates among the youth is measured at the all-India level in PLFS (2017-18) and the last three quinquennial rounds of NSSO. It is seen that in 2011-12, the unemployment rate among the youth was much higher compared to that in the overall population. It is seen that over the period from 2004-05 to 2011-12, the unemployment rate among the rural male youth ranged between 3.9 to 5 per cent which rose to 17.4 per cent in 2017-18 while the unemployment rate among the rural female youth ranged between 4.2 per cent to 4.8 per cent between 2004-05 and 2011-12 which rose to 13.6 per cent in 2017-18. The unemployment rate among the urban male youth
ranged between 7.5 to 8.8 per cent between 2004-05 and 2011-12 which rose to 18.7 per cent in 2017-18 while the unemployment rate for urban female youth ranged between 13.1 per cent to 14.9 per cent during 2004-05 and 2011-12 which rose to 27.2 per cent in 2017-18.
In Kerala, the youth accounts for around 23 per cent of the State’s population. As per the survey report, the UR among the youth in Kerala is much higher as compared to that of the overall population and it reveals the severity of the unemployment problem among the youth in Kerala. The UR of the youth is 32.5 per cent for rural areas and 41.5 per cent for urban areas. Similarly, the UR among the female youth is also much higher than that of the male youth. Area-wise UR data shows that 61.7 per cent of the female is unemployed in a rural area as against the male of 20.5 per cent (Figure 7.2.3). Youth unemployment is prevalent in Kerala because young people lack adequate skills, work experience etc. in emerging areas. In order to face the challenges, the ongoing programmes for skill development and employment generation are to be made effective use of to equip the youth for finding better employment opportunities.
Figure 7.2.3 Unemployment rate, in per cent among the youth, 15 to 29 years, in in Kerala and India as per usual status (ps+ss)
Source: PLFS report, 2017-18, GoI

319Chapter 7, Labour And Employment
Employment in the Organised Sector
In Kerala, employment in the organised sector has remained more or less stagnant, showing only a marginal increase from 10.8 lakh in 2012 to 12.4 lakh in 2019 (March 31, 2019).
The organised sector comprises private and public sectors and it is noteworthy that private sector employment is slowly increasing since 2012 onwards. In 2019, out of 12.5 lakh persons employed in the organised sector 5.6 lakh (44.8 per cent) are in the public sector and 6.9 lakh (55.2 per cent) are in the private sector. (Appendix 7.2.5 and Figure 7.2.4)
Within the public sector employment 46.7 per cent are employed in State Government and 10.7 per cent are in Central Government, 23.5 per cent are in State quasi institutions, 4.4 per cent in LSGI and 14.6 per cent are in Central quasi institutions. (Figure 7.2.5 and Appendix 7.2.6).
Data on District-wise employment as on March 2019 reveals that Ernakulam and Wayanad are the two Districts which respectively accounted for the highest and lowest employment. Total organised sector employment in Ernakulum
District is 2.6 lakh persons, which accounted for 20.9 per cent of the total employment of the State. Whereas in Wayanad the employment under organised sector is 0.4 lakh persons, which accounted for 2.8 per cent of the total employment (Appendix 7.2.7). In Kerala, men outnumbered women in public sector employment where as in the private sector employment women and men are almost in equal number. The share of males is 65.4 per cent of public sector employment while that of women is 34.6 per cent of total private sector employment in 2017-18. Thiruvananthapuram and Idukki are the two Districts which respectively accounted for the highest and lowest women participation in public sector employment. In Thiruvananthapuram 31,083 women are employed in public sector followed by Ernakulam (23,039),Thrissur (21,934) and Kollam (18,912).Where as in Idukki, 3,403 women are employed in public sector followed by Kasargode(6,909), Kozhikode (6,338), and Pathanamthitta(8,252). Women participation in the public sector employment is shown in Table.7.2.1.
Recent statistics on industry-wise distribution of workers in organised sector in Kerala indicates that the dependence on service sector continues
Figure 7.2.4 Employment in the organised sector in Kerala, in lakh
Source: Directorate of Employment, GoK, 2019

320 Economic Review 2019, Kerala State Planning Board
Figure 7.2.5 Distribution of employment in public sector
Source: Directorate of Employment, GoK, 2019
Figure 7.2.6 Major sectoral distribution of employment in the organised sector, March 2019, in per cent
Source: Directorate of Employment, GoK, 2019

321Chapter 7, Labour And Employment
to rise whereas the dependence on agriculture continues to decline. Employment in agriculture, relative to other sectors has fallen while the share of employment in manufacturing and education has risen. (Appendix 7.2.8, 7.2.9 and Figure 7.2.6)
Employment in Unorganised Sector Unorganised sector plays a crucial role in the Indian economy in terms of employment and its contribution to the Gross Domestic Product, savings and capital formation. More than 90 per cent of workforce and nearly 50 per cent of the Gross Domestic Product is attributable to this sector. A high proportion of socially and economically weaker sections of society are engaged in the unorganised economic activities in India and Kerala. As per the PLFS 2017-18 report published by GoI, based on usual status (ps+ss) approach, it is estimated that self employed workers in Kerala constituted 40.7 per cent of the total workers, while the share of regular wage/salaried employee was 24.7 per cent and that of casual labour 34.6 per cent.
Employees of enterprises belonging to the unorganised sector have lower job security, poorer chances of upward mobility, and no paid holidays, lower protection against employers and indulgence in unfair or illegal practices. In Kerala, Directorate of Employment is the nodal department entrusted with the responsibility to take measures to reduce instances of unfair practices existing in the unorganised sector. In recent years, the Kerala Government has initiated several measures to provide social security to workers in the unorganised sector.
Employment Exchanges and their Services
Registered Job Seekers
According to live register of employment exchanges in Kerala, the total number of job seekers as on December 31, 2012 was 43.3 lakh. But it has now declined to 37.5 lakh as on July 31, 2019, a reduction of about 5.84 lakh. Details of job seekers for various years are given in Appendix 7.2.10 and Figure 7.2.7.
Contrary to the all India scenario, women job seekers are found to be more in the live registers in Kerala. Of the total job seekers, 63.3 per cent are women. Number of illiterate persons in the live register is 855. Distribution of job seekers by educational level indicates that only 8.2 per cent have qualification below SSLC. About 91.5 per cent of the job seekers are in the category of qualifications having SSLC and above (Figure 7.2.8 and Appendix 7.2.11).
The number of professional and technical job seekers as on July 31,2019 is 2.87 lakh. Data reveals that ITI certificate holders, Diploma holders and Engineering together constitute 69.2 per cent of the total professional and technical job seekers. There are 44,638 registered engineering graduates and 8,588 medical graduates (Appendix 7.2.12).The District-wise job seekers in Kerala is shown in Figure 7.2.9.
Thiruvananthapuram District ranks first in the number of job seekers in general and professional/technical categories as on 31-
Table 7.2.1 Public sector employment, women participation in 2018-2019Sl.No Branch No. of Women Employed Share (%)
1 State Government 105004 542 State Quasi Government Sector 39218 203 Centre Government 14594 84 Centre Quasi Government Sector 25828 135 Local Self Government Institutions 9163 5
Total 193807 100Source: Directorate of Employment, GoK, 2019

322 Economic Review 2019, Kerala State Planning Board
Figure 7.2.7 Job seekers in Kerala, lakh persons
Source: Directorate of Employment, GoK, 2019
Figure 7.2.8 Job seekers in Kerala, qualification wise, lakh persons
Source: Directorate of Employment, GoK, 2019
Figure 7.2.9 District-wise Job seekers in Kerala as on July 31, 2019, Status of Men and Women
Source: Directorate of Employment, GoK, 2019

323Chapter 7, Labour And Employment
07-2019. The total number of job seekers in Thiruvananthapuram District is 5.5 lakh; of which 3.5 lakh are women and 2.0 lakh men. The second largest number of job seekers is in Kozhikode District with 3.8 lakh persons. The lowest number of job seekers registered in Kasaragod District with 0.9 lakh (95,002 persons). (Appendix 7.2.13).
Kaivalya
Kaivalya was introduced as a holistic frame work for achieving the goals of social inclusion and equality of opportunity for all citizens with disabilities. Kaivalya was introduced by Employment department of GoK in 2016. The primary objective of the scheme is to create a social and physical environment favouring accessibility, integration and full participation of persons with disabilities. Special employment exchange for differently abled have been established at Thiruvananthapuram, Neyyattinkara, Kollam, Kottayam, Ernakulam and Kozhikode. Kaivalya comprises of the following 4 components;
1. Vocational and Career Guidance 2. Capacity Building3. Training for Competitive Examinations4. Self Employment Ventures
An amount of ₹100.00 lakh was spent in 2017-18 for implementing the above activities benefitting 703 persons. In 2018-19 an amount of ₹110.00 lakh has been sanctioned for implementing above activities.
Self Employment Schemes
Three self employment schemes are implemented through the Employment Exchanges in Kerala.
1. Kerala Self Employment Scheme for the Registered Unemployed’ (KESRU)– KESRU is being implemented since 1999 and is intended for unemployed persons in the live register between the age 21-50 years with annual family income not
exceeding Rs one lakh. Preference will be given to those with professional or technical qualifications, graduate women and beneficiaries of unemployment dole scheme. Bank loan up to ₹1.00 lakh with a 20 per cent subsidy is given for self employment ventures. In 2018-19, an amount of ₹1.45 crore was allotted to 389 beneficiaries.
2. Multi-Purpose Service Centers/Job Clubs (MPSC/JC)-This is a group oriented self-employment scheme for development of enterprises in the unorganised sector. Bank loan up to ₹10 lakh with a maximum of ₹2 lakh as subsidy is given for starting self-employment group ventures of 2 to 5 members, who are unemployed persons in the live registers in the age group of 21-45 years. The scheme is incorporated with Credit Guarantee Scheme. In 2018-19 an amount of ₹10 crore was allotted to 67 Job Clubs.
3. Saranya – Employment Scheme for the Destitute Women aims at uplifting the most vulnerable sections among women in the State, namely widows, divorced, deserted, spinsters above the age of 30 and unwed mothers of Scheduled Tribe. Under this scheme interest free bank loan upto ₹50,000 with a 50 per cent subsidy (maximum ₹25,000) is given for starting self-employment ventures. In 2018-19, an amount of ₹17.20 crore was allotted to 3546 beneficiaries.
Unemployment Assistance
The GoK had introduced an unemployment assistance scheme in 1982. Under the scheme, unemployed youths remaining in the live registers for over three years (physically challenged two years) after attaining the age of 18 and having passed SSLC (For SC/ST and physically challenged, candidate need to have only appeared for SSLC examination) and having annual family income below ₹12,000
324 Economic Review 2019, Kerala State Planning Board
Box 7.2.1 Employability Centre
The GoK has taken a substantial step by converting the Employment Exchanges into ‘Centers of Skill and Employability Development’ (Employability Centre) for identifying the skill sets of youth registered in the Employability centres. These skills are identified using psychometric tests and the selected persons are provided the skills with necessary training inputs so as to equip them to be placed directly in to the Workforce. For high-end courses the candidate will be referred to VTP (Vocational Training Providers) or other institutions. Ten Employability Centers have started functioning along with District Employment Exchanges at Kollam, Alappuzha, Kottayam, Ernakulam, Palakkad, Kozhikode, Kannur, Thrissur, Malappuram and Kasargod. Out of 37,507 registered persons, 35,519 were assessed, 31,001 were trained and 9,474 were offered job.
Career Development Centre (CDC)
Career Development centre (CDC) is the new initiative of National Employment Service (Kerala) Department, GoK in 2016-17 for rural youth. The centre is envisaged as a place where individuals can obtain authentic solutions for all kinds of career issues faced by them. The main objective of this centre is to help the students in rural area in acquiring necessary knowledge and training based on the latest trends and current developments happening in the education and employment sectors. The centre adopts the latest technologies and appropriate tools in Career Management to address the issues of individuals. The ultimate goal of these centres is to link the students with meaningful work, giving them support to shape and manage their careers by building key ingredients necessary for their transformation to become complete professionals. The Career Development Centers are functioning with the technical support of KASE. In 2018-19, the Department started two Career Development Centres at Palode in Thiruvananthapuram and Kayamkulam in Alappuzha District. Five Career Development Centres are functioning under the Department.
Model Career Centre
As per the Central Government policy to transform all the Employment Exchanges into Career Centres, National Employment Service Department has taken initiative to set up Model Career Centre at University Employment Information and Guidance Bureau, Thiruvananthapuram. It is a joint venture of the Directorate General of Employment and Training, Ministry of Labour and Employment, GoI and the Department of National Employment Service (Kerala). The Centre will act as a one-stop solution centre for all assistance needed to the aspiring youths to find out suitable career according to their qualifications and skill set. It provides a variety of employment related services under one roof to job aspirants at free of cost. The Centre now endeavours increased focus on career counselling as a key activity to enable our aspiring youths to pursue the right career choices according to their aptitude and skill. Activities performed by this centre includes partnering with industry, candidate engagement, job and skill mapping and conducting placement drives/job fairs.
Source: Directorate of Employment, GoK, 2019
and personal income below ₹100 per month are eligible for unemployment assistance of ₹120 per month up to the age of 35 years of age. With the enactment of the Kerala Panchayat Raj Act
and Kerala Municipality Act, the unemployment assistance scheme was transferred to Rural and Urban Local Governments since 1998. Under the scheme, the eligible candidates shall submit

325Chapter 7, Labour And Employment
their application for unemployment allowance in the prescribed form to the local government. The Welfare Standing Committee at the Local Governments may finalise the list of candidates based on the eligibility criteria. In 2018 an amount of ₹8.3 crore was disbursed to 1,48,305 beneficiaries as unemployment assistance and ₹13.5 crore to 4,210 beneficiaries as self employment assistance. In the current financial year an amount of Rs 11.7 crore was disbursed to 1,22,035 beneficiaries as unemployment assistance and ₹10.5 crore to 2,498 beneficiaries as self employment assistance as on September 2019. (Appendix 7.2.14)
Niyukthi – 2019
Niyukthi is the recruitment drive organised by the National Employment Service department with a view to provide employment opportunities to the educated and talented unemployed youth in the private sector. Niyukthi 2019 was organised in Thiruvananthapuram, Ernakulam and Palakkad in the months of January and February 2019.In this mega event, 24,302 jobseekers and 294 employers participated. Out of 18,156 vacancies reported, 9,276 jobs were offered and 3,551 placements were provided.
Placement through Employment Exchanges in Kerala
The total placement through Employment Exchanges in Kerala has been declining since 2010. The placement through employment exchanges in Kerala since 2005 is given in the Figure 7.2.10.
Figure 7.2.10 Placement through employment exchanges in Kerala
Source: Directorate of Employment, GoK, 2019

326 Economic Review 2019, Kerala State Planning Board
7.3 Skill Development
Skills and knowledge are the driving forces of economic growth and social development in a country. India currently faces a severe shortage of well-trained, skilled workers. It is estimated that only 2.3 per cent of the workforce in India has undergone formal skill training as compared to 52 per cent in USA, 68 per cent in the UK, 75 per cent in Germany, 80 per cent in Japan and 96 per cent in South Korea. Large sections of the educated workforce have little or no job skills, making them largely unemployable. Therefore, India must focus on scaling up skill training efforts to meet the demands of employers and drive economic growth.
Realising the importance, more than 20 Ministries/Departments run 70 plus schemes for skill development in the country. The National Skill Development Mission launched by the Ministry of Skill Development and Entrepreneurship on July 15, 2015, aims to create convergence across sectors and States in terms of skill training activities. Besides consolidating and coordinating skilling efforts, it also aims to expedite decision making across sectors to achieve skilling at scale with speed and standards.
Skill development is a critical factor for human resource development and productivity improvement in the economy. Improved skills not only transform the economy but also drive social development. States with better levels of skills adjust more effectively to the challenges
and opportunities posed in the world of work. Despite Kerala possessing highly literate human resource, the skill of the labour force needs to be upgraded substantially. The structural transformation of the State’s economy has not generated enough employment opportunities in the emerging sectors. As a result, Kerala faces one of the highest unemployment rates in India. The State Government aims to create a skilled and technically qualified workforce who can contribute to the growth and development of both the State and nation, by providing quality training to achieve the national goal of 50 crore skilled persons by 2022. Based on the population of increasing matriculates passing out in Kerala, 1.5 to 2 lakh skilled human power per year has to be trained annually to reach the national target. Potentially, the target group for skill development comprises all those in the labour force, including those entering the labour market for the first time, those employed in the organised sector and those working in the unorganised sector.
Craftsman Training
The Craftsman Training Scheme was introduced by the GoI in 1950 to ensure a steady flow of skilled workers in different trades for the domestic industry, to raise quantitatively and qualitatively the industrial production by systematic training, to reduce unemployment among the educated youth by providing them employable training. National Council for Vocational Training (NCVT) is the apex

327Chapter 7, Labour And Employment
authority in the country in the implementation of the scheme. As per the scheme National Trade Certificate (NTC) is issued to the trainee who completes the training in a particular trade and passes the All India Trade Test. There are about 85 trades in which seats have been allocated for Craftsman Training with a total seat capacity of 54060 (Government ITIs – 35772 and other institutes (SCDD/STDD, and Private ITI s)-18288). The details of ITIs and its trade and enrolment are given in Appendix 7.3.1, 7.3.2, 7.3.3, 7.3.4, 7.3.5, 7.3.6, 7.3.7, and 7.3.8.
Apprenticeship Training
The Apprenticeship Training scheme is being conducted as per the provisions mentioned in the Apprentices Act 1961. Apprentices Act, 1961 was enacted with the objectives to regulate the programme of training of apprentices in the industry so as to confirm to a standard syllabi, period of training, skill sets etc. and to utilise the facilities available in industry for imparting practical training with a view to meeting the requirements of skilled manpower for the industry. Apprenticeship is a contract between an apprentice and an employer to provide a stipend fixed as per the Apprentices Act 1961. The Central/State Government acts as the third party in contract, regulating and monitoring the process.
Recently GoI introduced National Apprentice Promotion Scheme (NAPS).Through this scheme, Central Government should reimburse the 25 per cent of stipend as reimbursement to the Establishments.
Apprenticeship training in Kerala is both a Central and State Initiative. National Apprenticeship Certificate (NAC) is issued to those who complete the apprenticeship training in an organisation and passes the National Apprenticeship Trade Test. Apprenticeship schemes in the State are implemented through office of the State Apprenticeship Advisor,and Assistant Apprenticeship Advisor in 14 Districts. There are 81 trades in which seats have been
located for Apprenticeship Training.
No of seats located : 7796No of seats Utilised : 2691No of Establishments located : 2208Govt: 899, Private: 1309) No of Establishments utilised : 1229(Govt: 660, Private: 569)
Around 2000 students are certified every year under this scheme. Sector accounts for more than 50 per cent of apprenticeship placements in the State.
Industrial Training Institutes
There are 99 Industrial Training Institutes and Private ITIs are functioning in the State. A total of 35,772 seats are available in these ITIs, 30 per cent of seats are reserved for Women candidates. 14 women ITIs are functioning in the State in Government sector.
Skill Updating Institute for Industrial Training (SUIT) – Kerala, Kazhakkuttom
Skill Updating for Industrial Training – Kerala, was started in 1999 at Kazhakkuttom, Thiruvananthapuram, to update the skill and knowledge of Instructional Staff and others in pace with technical developments. The institute is headed by an officer of the rank of Additional Director of the department. The activities of this institute include, assessing the Training Needs Assessment(TNA) and preparation of course design, research in new methods of teaching, Skill Updating programs of technical staff, soft skill training, training programmes under State training policy at IMG, off campus training programmes, monitoring of virtual class training, and coordinating DLP training of Directorate General of Employment and Training (DGE and T).
328 Economic Review 2019, Kerala State Planning Board
India Skills-Kerala 2018
Inspired from the resounding success of skill competition named Skill Fiesta 2016, the Department opened up the stage for ‘Battle of Skills’ – this time with more vigour and more colour. Titled ‘IndiaSkills Kerala 2018’, the skill competition was held in April 29, 30, and 31 at Marine Drive, Cochin. The winners of State-level competition represented the State at the national skill competition ‘IndiaSkills 2018’,and got 9 Medals (Gold Medal 2,Silver Medal 5, and Bronze 2). Themedal winners were qualified for participating in World Skills, Kazan 2019. Two Medallion for excellence were bagged by Mr. Mohammed Rabith, atrainee of Govt.ITI Areekode in Wall and Floor tiling and Mr. Nithen Prem in 3D Game Art.
ISO Certification
Quality has been the hallmark of our Industrial Training Institutes. Various innovative techniques are introduced in trainings. The target is to ensure result oriented performance by our institutes. These initiatives of the department are recognised by awarding ISO certification to 34 ITIs.
The ISO Certified ITIs are the following.
ITI (W) Kozhikode, ITI Ettumanoor, ITI Mala, ITI (W) Kalamassery, ITI Kozhikode, ITI Kalpetta, ITI Kannur, ITI (W) Kazhakkuttom, ITI Attingal, ITI Chnneerkkara, ITI Kalamassery, ITI (W)
Chalakudy, ITI Areacode, ITI Chengannur, ITI Dhanuvachapuram, ITI Chackai, ITI Kollam ITI Kollam (W), ITI Pallickathode, ITI Kattppana, ITI Chalakkudy, ITI Malampuzha, ITI Kannur(W), ITI Kasaragode, ITI Arayanadu, ITI Chathannoor, ITI Malayinkil, ITI Pallipadu, ITI Attappady, ITI Kayyur, ITI Koilandy, ITI Nilambur, ITI Kuzhalmannam, ITI Madayi.
Innovative Steps implemented by the Department in 2019-20
E-Office With the vision of creating a paperless office with timely action and better service, the Department implements E-Office system in the State Directorate and all Offices in Trivandrum and Kozhikode Districts. Steps are being taken to implement e-office system in Kannur, Ernakulam, and Kollam.
Development of Websites for ITIs
The Department has developed separate websites for all the Government ITIs in the State according to the guidelines of DGE&T. It provides information about the institutes, courses, admission details, faculty, services, specialties, consultancy and its future plans to all stakeholders.
Green Protocol
Department implemented Green Protocol in State Directorate and sub offices.
Box 7.3.1 Group Insurance Scheme
Around 30,000 trainees were trained in various schemes through Government ITIs in a year. Practical based training is the hallmark of craftsman training scheme. Trainees were trained with heavy and sophisticated machineries in the workshops of the institutes and at factories during implant training. Trainees are therefore prone to dangerous hazards throughout their training period. Hence, a Group Insurance Scheme was introduced for the trainees in the Financial Year 2018-19.
The department continued the insurance Programme in 2019-20.The sum assured for each trainee will be 3 Lakh. 30,523 trainees will be benefited by the scheme in 2019-20. The scheme is implemented through the New India Assurance Company Ltd.

329Chapter 7, Labour And Employment
Technical Exchange Programme
Department introduced Technical Exchange Programme for ITI Trainees. In the financial Year 2018-19, 57 trainees got 4 week training in ITE-Singapore.
NaipunyaKarmasena
The NaipunyaKarmasena was formed by the Department to rectify the Electrical, Plumbing, Carpentry issues that emerged after the floods. Besides ITI trainees a team of officials having Technical knowledge also participated in the activities.
Major Milestones in 2019
• Participated in India Skills – Kerala 2018, India Skills –National, World Skill –Kazan.
• Department introduced Group Insurance for ITI Trainees.
• Job Fair was conducted in three regions for getting placement, 10218 Trainees were short listed and 3011 trainees got placement.
• Department took steps to upgrade 10 ITIs into International standard through funds from KIIFB. The selected ITIs are ITI Dhanuvachapuram, ITI Kollam, ITI Chegannor, ITI Ettumjnoor, ITI Kattapana, ITI Chalakkudy, ITI Malampuzha, ITI Koyilandi, ITI Kannur, and I TI Kayyur.
• Placement cell were formed in all ITIs and 3353 trainees got placement.
• ED Club were constituted in all ITIs in the
State to inculcate Entrepreneurial culture among youth and equip them with the skills, techniques to act as torch – bearers of enterprise for the new generation with the help of District Industries Centre.
• Introduced grading system for ITI s • Got NCVT Affiliation for 575 units in various
trades. • Introduced Green Campus project in 14
selected ITIs with the support of Haritha Kerala Mission.
Kerala Academy of Skills Excellence (KASE)
With the objective of skilling the young workforce of Kerala and elevating their skills to global standards for employment in India and abroad, the GoK has set up Kerala Academy for Skills Excellence (KASE), a non-profit company as the nodal agency for facilitating and coordinating various skill development initiatives of the State. KASE also provides accreditation to the courses conducted by various skill training institutions, subject to adherence of accreditation conditions, through a high level committee of experts constituted for the purpose. KASE is designated as the State Skill Development Mission to function as the nodal body for the convergence of all skill initiatives of the State. KASE is implementing a centrally sponsored scheme called Pradhan Mantri Kaushal Vikas Yojana (PMKVY).
Pradhan Mantri Kaushal Vikas Yojana (2016-2020) is a modified and improved version of
Box 7.3.2 Noon Meal programme for ITI Trainees
In order to provide protein rich noon meal to the trainees, the department implemented noon meal programme to the trainees of 14 Women ITI’s in 2018-19 .The scheme was implemented in following ITIs - ITI Kazhakuttom,ITIPrasala, ITI Kollam, ITI Mezhuveli, ITI Chengannur, ITI Changanassery, ITIKalamassery, ITIChalakudy, ITIMalampuzha, ITIKozhikode, ITIThazhekode, ITiKannur, ITINenmeni,ITI west Eleri. 2,969 trainees are benefitted by this scheme. The department has continued this scheme in 2019-20.Changanassery, ITIKalamassery, ITIChalakudy, ITIMalampuzha, ITIKozhikode, ITIThazhekode, ITiKannur, ITINenmeni, ITI west Eleri. 2,969 trainees are benefitted by this scheme. The department has continued this scheme in 2019-20.

330 Economic Review 2019, Kerala State Planning Board
PMKVY 2015-2016. It is the flagship outcome-based Skill Training Scheme of the Ministry of Skill Development and Entrepreneurship (MSDE). This Skill Certification Scheme aims to enable and mobilise a large number of Indian youth to take up skill training and become employable and earn their livelihood.
PMKVY 2.0 has two components: Centrally Sponsored Centrally Managed (CSCM) and Centrally Sponsored State Managed (CSSM). National Skill Development Corporation (NSDC) is the implementing agency of the (CSCM) Component of PMKVY and KASE being the State Skill Development Mission of GoK is the implementing agency of the Centrally Sponsored
Box 7.3.3 Skill Registry
Skill Registry is a mobile application developed so that people can avail the services of skilled workforce for the daily household and commercial needs directly. Skilled laborers can register as Service Providers and those who require their services can register as Customers at www.keralaskillregistry.comor from https://play.google.com/store/apps/details?id=com.klystrontech.skillregistry. The app has been developed by KASE (Kerala Academy for Skills Excellence) in cooperation with Industrial Training Department, Kudumbashree and Panchayat department. The application provides an opportunity for skilled laborers to find day to day jobs and making them capable to find their daily work by themselves. Skilled laborers who are not certified or professionally trained will also be considered on producing a declaration certificate by the Panchayat. This also acts as a platform for the customers to find their daily job requirements without any intermediaries. Major Services in 24 service sectors namely AC, Washing Machine, Refrigerator, Oven, Fan/Iron Box, Computer, Mixer and Grinder Service And Repair, Electrician, Plumber, Carpenter, Painter, Coconut Climber, Day Care-Child Care In Home, Driver, Gardening and Landscaping, Geriatric Care-In Home/Hospitals, Grass Cutting, Home Cleaning, House Keeping, House Maid, Laundry & Ironing, Masonry-Small Construction Work/Renovation/Compost Pit/Ring Work, Mobile Beauty Parlor-Services at Home, Santhwanam - Health Check -Up at Home (Sugar, Cholesterol, BP), and Television Repair and Installation has been included in the mobile application. The application is currently in operation only in Thiruvananthapuram district.It will be extended to other districts gradually. The current status of Skill Registry Mobile Application is as follows
Registered Service Providers 744Pending service providers for approval 233Approved Service Providers 334Total customers registered 2589 Total Service orders 71Total Services available 24
Components of PMKVY 2.0:
1. Short Term Training 2. Recognition of Prior Learning 3. Special ProjectsConsidering the peculiar demographic characteristics of the State of Kerala, unique skilling models have been adopted by KASE with industry tie-ups and placement linkages. KASE associates with industrial partners or prospective employers or entrepreneurs through the iSTEP (International Skill Training and Employability Programme), a single window initiative to associate with the skill development mission of GoK. iSTEP is open to any sectors of the industry, where the skill gap is identified by the stake holders.
331Chapter 7, Labour And Employment
State Managed (CSSM) Component of PMKVY in Kerala.The following are the objectives of this Scheme:
• To encourage and promote Skill Development for the youth throughout the country by aligning itself with the Common Norms guidelines.
• Enable and mobilise a large number of youth to take up industry designed quality skill training, become employable and earn their livelihood.
• Increase productivity of the existing workforce, and align skill training with the actual needs of the country.
• Encourage standardisation of the certification process and put in place the foundation for creating a registry of skills.
• Benefit 10 million youth over the period of four years (2016-2020).
Sports And Management Research Institute, Thiruvananthapuram
Synergians Society through its division Sports & Management Research Institute is engaged in training programs such as PG Diploma in Sports Management, Certified Sports Manager, Advanced Diploma in Sports Business and Advanced Diploma in Sports Engineering.
Total number of candidates trained till date is 44, out of which 27 have been placed. 14 students are currently undergoing training.


INITIATIVES FOR SOCIAL INCLUSION
08C H A P T E R


335Chapter 8, Initiatives For Social Inclusion
INITIATIVES FOR SOCIAL INCLUSION
8.1 Gender and Development
08C H A P T E R
“Mainstreaming a gender perspective is the process of assessing the implications for women and men of any planned action, including legislation, policies or programmes, in all areas and at all levels. It is a strategy for making women’s as well as men’s concerns and experiences an integral dimension of the design, implementation, monitoring and evaluation of policies and programmes in all political, economic and societal spheres so that women and men benefit equally and inequality is not perpetrated. The ultimate goal is to achieve gender equality” (Strategy for Gender Equality and the Empowerment of Women, 2018-21 of United Nations Vienna Office)
The empowerment and autonomy of women and the improvement of their political social, economic and health status is a highly important end in itself. The full participation and partnership of both women and men are required in productive and reproductive life, including shared responsibilities for the care and nurturing of children and maintenance of the household (UNFPA, 1994). In most regions of the world, discrimination against women remains a bitter reality and the power relations that hinder healthy and fulfilling lives of women act at many levels of society, from the most personal to the highly public. Questions involving the status of women and prevailing gender disparities have become the main themes of discussion and action in recent decades. Governments and policymakers have begun to recognise
the demands for basic rights of women and transgender. In order to achieve gender equality, the society requires the policies and programmes that improve women’s access to education, livelihood and resources, recognise, reduce and redistribute their responsibilities with regard to domestic and ‘care’ work, remove the obstacles to their participation in public life, and enhance gender consciousness in society through effective programmes of awareness on a massive scale.
In India, there exists a wide gender inequality measured in terms of all the Gender Indices (GI) developed by UNDP. The Gender Development Index GDI value of India is 0.829 (registering a fall of 0.012 index values from last year and deviation of 0.112 from the world average) with low equality in human development achievements between women and men. The GDI measures gender gaps in human development achievements by accounting for disparities between women and men in the same three basic dimensions of human development-health, knowledge and living standards. In terms of Gender Inequality Index (GII), India is ranked low (122nd rank) with the GII value 0.501, while our neighbouring countries like China and Sri Lanka are 36th (0.163) and 86th (0.38) rank. The Gender Inequality Index (GII) measures gender inequalities in three important aspects of human development-a) reproductive health, measured by maternal mortality ratio and adolescent birth rates, b) empowerment, measured by proportion of parliamentary seats occupied by females and
336 Economic Review 2019, Kerala State Planning Board
Box 8.1.1 Gender mainstreaming and gender equality strategy — approach and principles of UNDP
UNDP approach to gender mainstreaming is a dual one: UNDP supports the empowerment of women and girls through targeted gender-specific interventions and addresses gender concerns in developing, planning, implementing and evaluating all policies and programmes. Gender mainstreaming approach of UNDP is based on the following core principles:
a. Human rights This strategy pursues a human rights-based approach to development and the programme design as well as all phases of the programme are based on the realisation of the human rights of women and men.
b. Women and men active agents of change Development Goals can only be achieved when all people have opportunities to achieve their aspirations and fulfil their potential and when their knowledge and contributions are valued and mobilised. It views all women and men as active agents of change and thus focuses on ensuring that those marginalised and left behind are empowered and have the agency to make decisions over their lives and participate in the development of their Societies.
c. “Leaving no one behind” UNDP commits to support partners to address multiple and intersecting forms of discrimination, such as those based on poverty, geographic location, migration, identity, ethnicity, age, race, religion, disability and other characteristics.
d. Transforming gender and power relations Transforming gender and power relations is essential for achieving gender equality and sustainable development. UNDP will pursue initiatives that accelerate structural transformations for gender equality and remove the institutional, societal, political and legal barriers hindering its achievement.
e. Engaging men and boys In alignment with the ‘He for She’ initiative, the United Nations global solidarity movement for gender equality, men and boys are to be engaged as allies in closing gender gaps and in empowering women and girls but also to address discriminatory attitudes and practices and oppressive forms of masculinity that impact both women and men.
f. Contextualisation Recognising that UNDP works in partnership with Governments and in a range of country contexts, UNDP will follow a contextualised and country-driven approach.
g. Innovation Technological innovations, from mobile banking applications to new clean energy, can eliminate structural and societal barriers that prevent women from accessing financial and other services and break traditional patriarchal supply chains of information, resources and power.
Source: UNDP, 2019

337Chapter 8, Initiatives For Social Inclusion
proportion of adult females and males aged 25 years and older with at least some secondary education, and c) economic status, expressed as labour market participation measured by labour force participation rate of female and male population ages 15 years and older.
India (108) maintains a stable ranking this year in the Global Gender Gap Report but its gap is directionally larger with a 33 per cent gap yet to be bridged. The Global Gender Gap Report benchmarks 149 countries on their progress towards gender parity across four thematic dimensions: Economic Participation and Opportunity, Educational Attainment, Health and Survival, and Political Empowerment. In addition, this year’s edition studies skills gender gaps related to Artificial Intelligence (AI).
India records improvements in wage equality for similar work, succeeds in fully closing its tertiary education gender gap for the first time, and keeps the primary and secondary education gaps closed for the third year running. However, it continues to rank third-lowest in the world on Health and Survival, remaining the world’s least improved country on this sub-index over the past decade. In fact, India actually widens the gender gap on this sub-index this year. We find that there is a significant gender gap among AI professionals. Only 22 per cent of AI professionals globally are female, compared to 78 per cent who are male. Interestingly India is at the average level (The Global
Gender Gap Report 2018).
In terms of the latest measure of ‘life-course gender gap’ also India’s position is at the bottom. The life-course gender gap is measured by indicators of health, education, labour market and work, seats in parliament, time use and social protection which indicate choices and opportunities over the life course – childhood, adulthood, youth and older age.
Compared to the other Indian States, women in Kerala enjoy a better position in several aspects, especially related to health and education status. The development policy of the State has been
more sensitive to gender equality in terms of human development as reflected in the much lower gender gap in basic capabilities, such as education and health. Hence Kerala has accomplished good results in several gender indicators. With regards to the GII components, the indicators of maternal mortality rate, adolescent birth rates and proportion of adult females with secondary education are impressive in Kerala as also the ratio of women to men for Kerala which is 1,084, much higher compared to the national figure of 940 (Census 2011). But the indicators of labour market participation and proportion of parliamentary seats occupied by females show that Kerala’s performance is poor and is below all India average. Women constitute 52 per cent of the total population in Kerala. Children aged 0-14 years represent 23.44 per cent of the total population in Kerala, 48.91 per cent of whom are girls. In contrast to the national average of 11 per cent, 22 per cent of all households in Kerala are female-headed. District-wise per cent share of the female population to the total population as per census 2011 given in Appendix 8.1.1.
Literacy and Education
High female literacy rate in Kerala can be considered as the basis of ‘take-off’ for the socio-cultural development achieved by Kerala women. Kerala is at the top among the Indian States with a female literacy rate of 92 per cent though a small gender gap exists (Census, 2011). It is also seen that the gender gap in Kerala has narrowed during the last 6 decades (for more details please see chapter 6 Education-Appendix 6.1.1).
As per the 75th NSSO round, the literacy rate of women has further increased in Kerala (Table 8.1.1). But women in Kerala, as well as India, lag behind men in terms of computer literacy and basic internet knowledge (Figure 8.1.1). As per Table 8.1.1, the gender gap in terms of the computer and internet literacy is more prominent in rural areas.
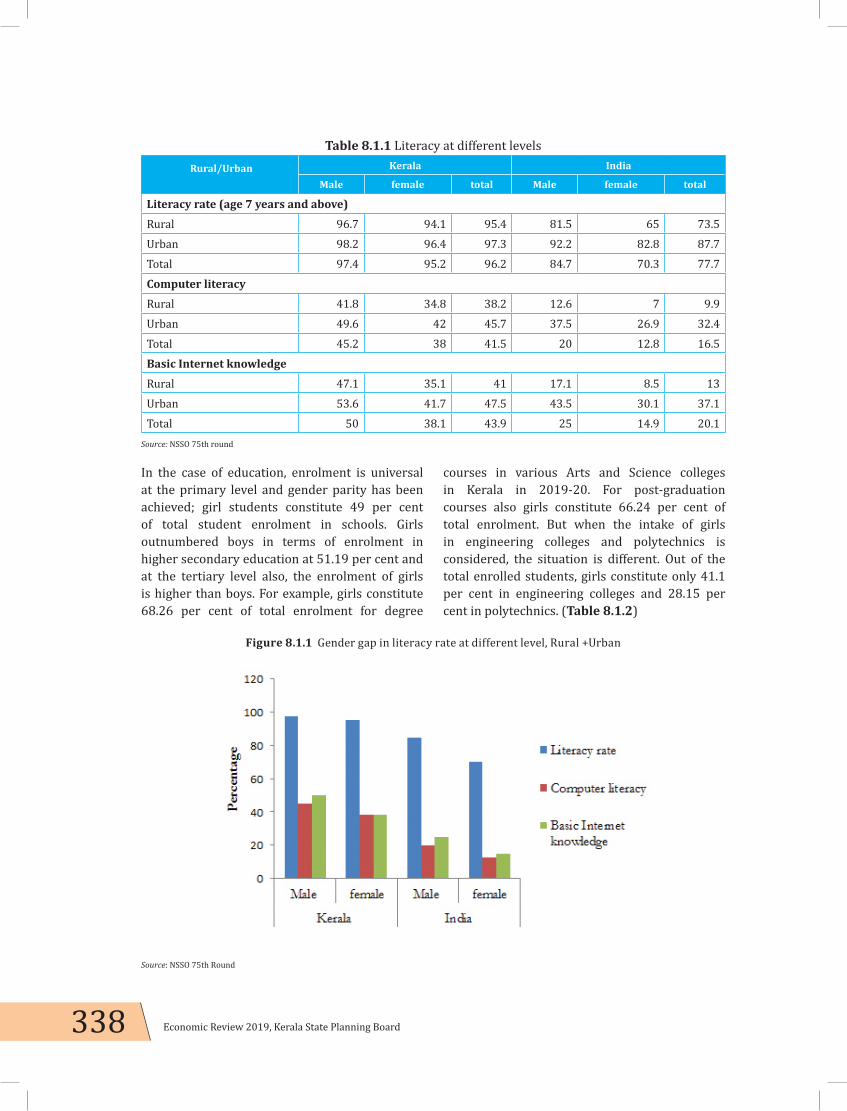
338 Economic Review 2019, Kerala State Planning Board
In the case of education, enrolment is universal at the primary level and gender parity has been achieved; girl students constitute 49 per cent of total student enrolment in schools. Girls outnumbered boys in terms of enrolment in higher secondary education at 51.19 per cent and at the tertiary level also, the enrolment of girls is higher than boys. For example, girls constitute 68.26 per cent of total enrolment for degree
courses in various Arts and Science colleges in Kerala in 2019-20. For post-graduation courses also girls constitute 66.24 per cent of total enrolment. But when the intake of girls in engineering colleges and polytechnics is considered, the situation is different. Out of the total enrolled students, girls constitute only 41.1 per cent in engineering colleges and 28.15 per cent in polytechnics. (Table 8.1.2)
Table 8.1.1 Literacy at different levels Rural/Urban
Kerala India
Male female total Male female total
Literacy rate (age 7 years and above)Rural 96.7 94.1 95.4 81.5 65 73.5Urban 98.2 96.4 97.3 92.2 82.8 87.7Total 97.4 95.2 96.2 84.7 70.3 77.7Computer literacyRural 41.8 34.8 38.2 12.6 7 9.9Urban 49.6 42 45.7 37.5 26.9 32.4Total 45.2 38 41.5 20 12.8 16.5Basic Internet knowledgeRural 47.1 35.1 41 17.1 8.5 13Urban 53.6 41.7 47.5 43.5 30.1 37.1Total 50 38.1 43.9 25 14.9 20.1
Source: NSSO 75th round
Figure 8.1.1 Gender gap in literacy rate at different level, Rural +Urban
Source: NSSO 75th Round
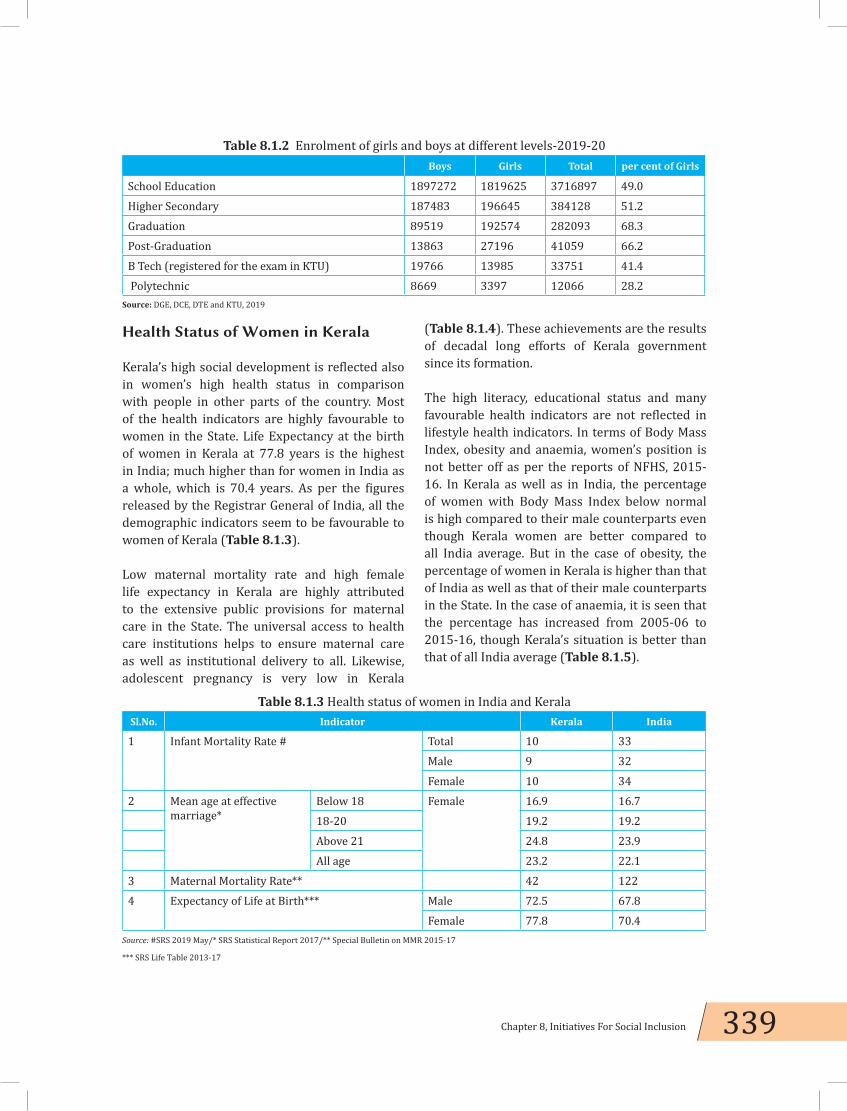
339Chapter 8, Initiatives For Social Inclusion
Health Status of Women in Kerala
Kerala’s high social development is reflected also in women’s high health status in comparison with people in other parts of the country. Most of the health indicators are highly favourable to women in the State. Life Expectancy at the birth of women in Kerala at 77.8 years is the highest in India; much higher than for women in India as a whole, which is 70.4 years. As per the figures released by the Registrar General of India, all the demographic indicators seem to be favourable to women of Kerala (Table 8.1.3).
Low maternal mortality rate and high female life expectancy in Kerala are highly attributed to the extensive public provisions for maternal care in the State. The universal access to health care institutions helps to ensure maternal care as well as institutional delivery to all. Likewise, adolescent pregnancy is very low in Kerala
(Table 8.1.4). These achievements are the results of decadal long efforts of Kerala government since its formation.
The high literacy, educational status and many favourable health indicators are not reflected in lifestyle health indicators. In terms of Body Mass Index, obesity and anaemia, women’s position is not better off as per the reports of NFHS, 2015-16. In Kerala as well as in India, the percentage of women with Body Mass Index below normal is high compared to their male counterparts even though Kerala women are better compared to all India average. But in the case of obesity, the percentage of women in Kerala is higher than that of India as well as that of their male counterparts in the State. In the case of anaemia, it is seen that the percentage has increased from 2005-06 to 2015-16, though Kerala’s situation is better than that of all India average (Table 8.1.5).
Table 8.1.2 Enrolment of girls and boys at different levels-2019-20 Boys Girls Total per cent of Girls
School Education 1897272 1819625 3716897 49.0Higher Secondary 187483 196645 384128 51.2Graduation 89519 192574 282093 68.3Post-Graduation 13863 27196 41059 66.2B Tech (registered for the exam in KTU) 19766 13985 33751 41.4 Polytechnic 8669 3397 12066 28.2
Source: DGE, DCE, DTE and KTU, 2019
Table 8.1.3 Health status of women in India and KeralaSl.No. Indicator Kerala India
1 Infant Mortality Rate # Total 10 33Male 9 32Female 10 34
2 Mean age at effective marriage*
Below 18 Female 16.9 16.718-20 19.2 19.2Above 21 24.8 23.9All age 23.2 22.1
3 Maternal Mortality Rate** 42 1224 Expectancy of Life at Birth*** Male 72.5 67.8
Female 77.8 70.4Source: #SRS 2019 May/* SRS Statistical Report 2017/** Special Bulletin on MMR 2015-17
*** SRS Life Table 2013-17

340 Economic Review 2019, Kerala State Planning Board
Table 8.1.5 Life style health indicatorsIndicators India Kerala
NFHS-4 (2015-16)
NFHS-3 (2005-06)
NFHS-4 (2015-16)
NFHS-3 (2005-06)
Urban Rural Total Total Urban Rural Total Total
Anaemic (15-49 years) per cent
Non-pregnant women(<12g/dl)
51 54.4 53.2 55.2 36.7 33 34.7 32.8
Pragnant women (<11g/dl)
45.8 52.2 50.4 57.9 22.7 22.5 22.6 33.8
All women 50.8 54.3 53.1 55.3 36.3 32.6 34.3 32.8Blood sugar level per cent
High (>140mg/dl) 6.9 5.2 5.8 na 8.4 9 8.7 naVery high (>160mg/dl)
3.6 2.3 2.8 na 4.8 4.8 4.8 na
Hypertension (15-49 years)per cent
Slightly above normal (systolic 140-159mm of Hg)
7.3 6.5 6.7 na 4.8 6.1 5.5 na
Moderately high (systolic 160-179mm of Hg)
1.6 1.3 1.4 na 0.6 1 0.8 na
Very high (systolic >180mm of Hg)
0.7 0.7 0.7 na 0.6 0.5 0.5 na
Body Mass Index (BMI)per cent
Below normal (BMI <18.5 kg/m2)
15.5 26.7 22.9 35.5 9.1 10.2 9.7 18
Overweight (BMI >25 kg/m2)
31.3 15 20.6 12.6 33.5 31.5 32.4 28.1
Source: NFHS, 2015-16
Table 8.1.4 Indicators of maternal care
Indicators
India Kerala
NFHS-4 (2015-16)
NFHS-3 (2005-06)
NFHS-4 (2015-16)
NFHS-3 (2005-06)
Urban Rural Total Total Urban Rural Total Total
Adolescent pregnancy 5 9.2 7.9 16 2.7 3.2 3 5.8Mothers with Antenatal Check-ups 69.1 54.2 58.6 43.9 96.1 94.2 95.1 91.9Institutional Births (per cent) 88.7 75.1 78.9 38.7 99.8 99.9 99.8 99.3Mother and Child Protection (MCP) card holder (per cent)
87.7 90 89.3 na 82 86.1 84.2 na
Total Fertility Rate (children per women)
1.8 2.4 2.2 2.7 1.6 1.6 1.6 1.9
Full Antenatal Care (per cent) 31.1 16.7 21 11.6 63 59.5 61.2 66.7Mothers received post natal care (per cent)
71.7 58.5 62.4 34.6 87.6 89.6 88.7 84.6
Delivery by caesarean (per cent) 28.2 12.8 17.2 8.5 37.1 34.6 35.8 30.1Anaemic adolescent (per cent) 50.8 54.3 53.1 55.3 36.3 32.6 34.3 32.8Experienced violence during pregnancy (per cent)
3.4 4.1 3.9 na 0.9 1.6 1.2 na
Source: NFHS, 2015-16

341Chapter 8, Initiatives For Social Inclusion
Participation in Economy
Though in terms of many developmental indicators, women of Kerala perform better than their male counterparts; the outcome is not favourable to women in terms of economic participation. As per the 68th Round of NSSO (for the year 2011-12), a wide gap between male and female Labour Participation Rates (LPRs) (principal and subsidiary status) is seen in the State. While the State average is 40.3 per cent, female LPR (per 100 persons) in Kerala is 24.8 per cent and that of male is 57.8 per cent. Consequently, the difference between male and female LPR in Kerala is very high. Disaggregating by region, we find that the labour force participation rate of women in rural Kerala has kept lower than that of India since 1993-94, but a slight better change happened in 2011-12. But in urban areas, labour force participation of Kerala women is better than that of their counterparts at the all India level (Appendix 8.1.2).
The gender gap in levels of employment is also brought out by the female work participation rates (WPR) (Appendix 8.1.2) and while the male WPRs in urban areas show a mild upward
trend or constancy, there is a declining trend in female WPRs; that Kerala women have a higher participation rate in urban areas vis-a-vis all India is also seen. The gender difference in WPR of India and Kerala is seen in Figure 8.1.2.
Inequality in Wage Rates
In terms of wages and remuneration, significant gender inequality exists in the State as well as at national level. The prevalence of inequality in the wage rates among men and women especially in unorganised and agricultural work have been detailed in the section Labour Welfare of Chapter 7. The gender disparity in wage rate is prevalent not only in informal or unorganised sector but also in regular or salaried employment. This is well explained in Figure 8.1.3.
Economic empowerment and social empowerment are complementary to each other. The economic empowerment of women is attained when they become an integral part of labour force and be gainfully employed without having to bear the full burden of household and care responsibilities. It is necessary that this is recognised, and efforts are to be taken to
Figure 8.1.2 Work Participation Rates of males and females in Kerala
Source: Various Reports of NSSO
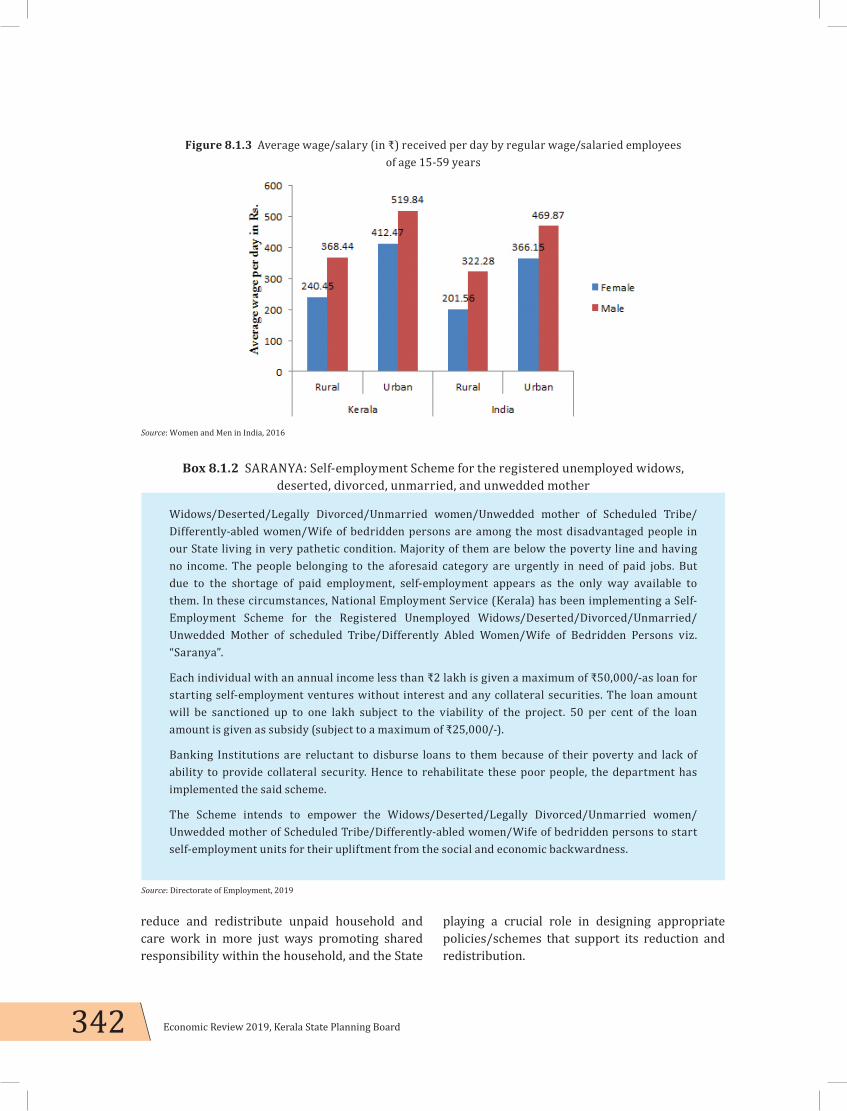
342 Economic Review 2019, Kerala State Planning Board
Figure 8.1.3 Average wage/salary (in ₹) received per day by regular wage/salaried employees of age 15-59 years
Source: Women and Men in India, 2016
Box 8.1.2 SARANYA: Self-employment Scheme for the registered unemployed widows, deserted, divorced, unmarried, and unwedded mother
Widows/Deserted/Legally Divorced/Unmarried women/Unwedded mother of Scheduled Tribe/Differently-abled women/Wife of bedridden persons are among the most disadvantaged people in our State living in very pathetic condition. Majority of them are below the poverty line and having no income. The people belonging to the aforesaid category are urgently in need of paid jobs. But due to the shortage of paid employment, self-employment appears as the only way available to them. In these circumstances, National Employment Service (Kerala) has been implementing a Self-Employment Scheme for the Registered Unemployed Widows/Deserted/Divorced/Unmarried/Unwedded Mother of scheduled Tribe/Differently Abled Women/Wife of Bedridden Persons viz. “Saranya”.
Each individual with an annual income less than ₹2 lakh is given a maximum of ₹50,000/-as loan for starting self-employment ventures without interest and any collateral securities. The loan amount will be sanctioned up to one lakh subject to the viability of the project. 50 per cent of the loan amount is given as subsidy (subject to a maximum of ₹25,000/-).
Banking Institutions are reluctant to disburse loans to them because of their poverty and lack of ability to provide collateral security. Hence to rehabilitate these poor people, the department has implemented the said scheme.
The Scheme intends to empower the Widows/Deserted/Legally Divorced/Unmarried women/Unwedded mother of Scheduled Tribe/Differently-abled women/Wife of bedridden persons to start self-employment units for their upliftment from the social and economic backwardness.
Source: Directorate of Employment, 2019
reduce and redistribute unpaid household and care work in more just ways promoting shared responsibility within the household, and the State
playing a crucial role in designing appropriate policies/schemes that support its reduction and redistribution.
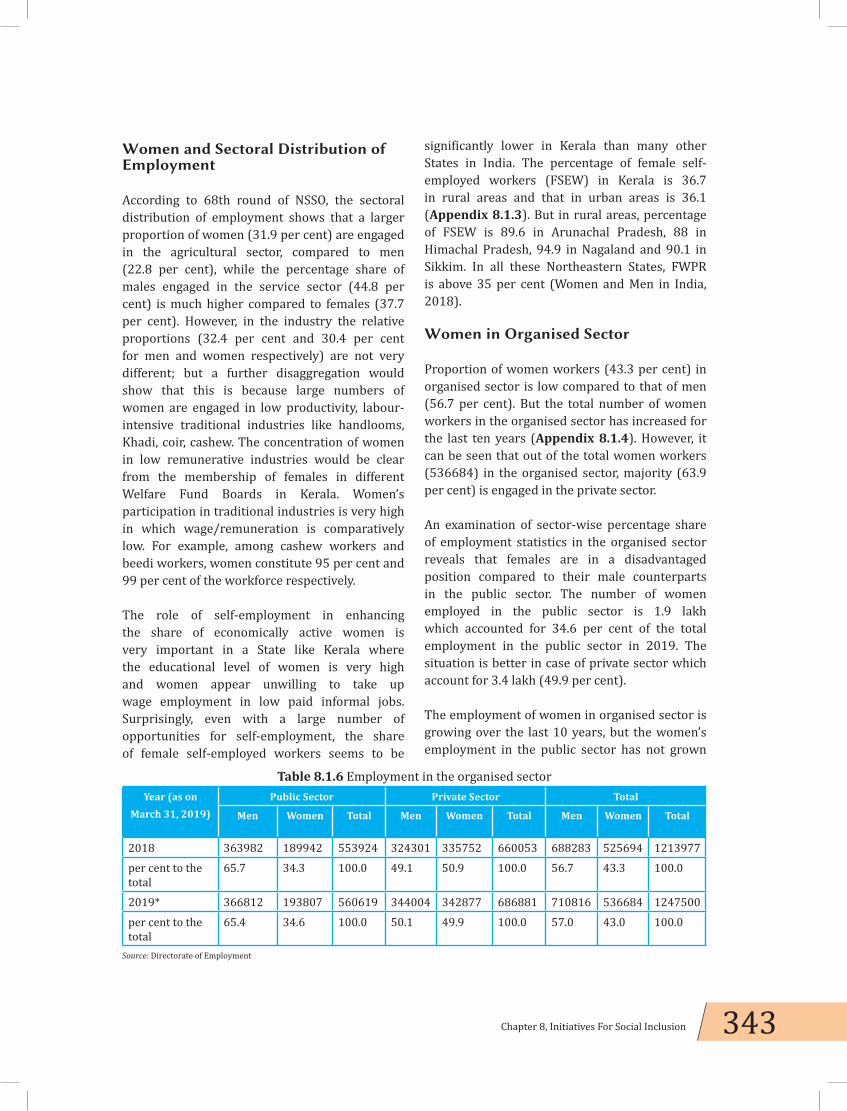
343Chapter 8, Initiatives For Social Inclusion
Women and Sectoral Distribution of Employment
According to 68th round of NSSO, the sectoral distribution of employment shows that a larger proportion of women (31.9 per cent) are engaged in the agricultural sector, compared to men (22.8 per cent), while the percentage share of males engaged in the service sector (44.8 per cent) is much higher compared to females (37.7 per cent). However, in the industry the relative proportions (32.4 per cent and 30.4 per cent for men and women respectively) are not very different; but a further disaggregation would show that this is because large numbers of women are engaged in low productivity, labour-intensive traditional industries like handlooms, Khadi, coir, cashew. The concentration of women in low remunerative industries would be clear from the membership of females in different Welfare Fund Boards in Kerala. Women’s participation in traditional industries is very high in which wage/remuneration is comparatively low. For example, among cashew workers and beedi workers, women constitute 95 per cent and 99 per cent of the workforce respectively.
The role of self-employment in enhancing the share of economically active women is very important in a State like Kerala where the educational level of women is very high and women appear unwilling to take up wage employment in low paid informal jobs. Surprisingly, even with a large number of opportunities for self-employment, the share of female self-employed workers seems to be
significantly lower in Kerala than many other States in India. The percentage of female self-employed workers (FSEW) in Kerala is 36.7 in rural areas and that in urban areas is 36.1 (Appendix 8.1.3). But in rural areas, percentage of FSEW is 89.6 in Arunachal Pradesh, 88 in Himachal Pradesh, 94.9 in Nagaland and 90.1 in Sikkim. In all these Northeastern States, FWPR is above 35 per cent (Women and Men in India, 2018).
Women in Organised Sector
Proportion of women workers (43.3 per cent) in organised sector is low compared to that of men (56.7 per cent). But the total number of women workers in the organised sector has increased for the last ten years (Appendix 8.1.4). However, it can be seen that out of the total women workers (536684) in the organised sector, majority (63.9 per cent) is engaged in the private sector.
An examination of sector-wise percentage share of employment statistics in the organised sector reveals that females are in a disadvantaged position compared to their male counterparts in the public sector. The number of women employed in the public sector is 1.9 lakh which accounted for 34.6 per cent of the total employment in the public sector in 2019. The situation is better in case of private sector which account for 3.4 lakh (49.9 per cent).
The employment of women in organised sector is growing over the last 10 years, but the women’s employment in the public sector has not grown
Table 8.1.6 Employment in the organised sectorYear (as on
March 31, 2019)
Public Sector Private Sector Total
Men Women Total Men Women Total Men Women Total
2018 363982 189942 553924 324301 335752 660053 688283 525694 1213977per cent to the total
65.7 34.3 100.0 49.1 50.9 100.0 56.7 43.3 100.0
2019* 366812 193807 560619 344004 342877 686881 710816 536684 1247500per cent to the total
65.4 34.6 100.0 50.1 49.9 100.0 57.0 43.0 100.0
Source: Directorate of Employment

344 Economic Review 2019, Kerala State Planning Board
(Figure 8.1.4 and Appendix 8.1.4). The increase in the organised sector employment of women is contributed by the increase in employment in the private sector.
An examination of the distribution of public sector employment of women in different types of government organisations reveals that the proportion of women is high in State government employment followed by the Local Self Government (LSG) department.(Table 8.1.7)
The District-wise employment of women in different types of government organisations is given in Appendix 8.1.5. The number of women working under Central Government is high (3602) in Thiruvananthapuram District, but the proportion of women to men is high in Kottayam District (50.4 per cent) followed by Kollam District (48.7 per cent). The number of women workers under State Government is high in
Thiruvananthapuram, but the proportion to men is high in Kozhikode.
Economic Participation of Women through Kudumbashree
Financial inclusion through Neighbourhood Groups (NHGs)
Financial inclusion is the process of including the disadvantaged and low income earning category into the financial services at affordable cost. Kudumbashree has played an important role in the financial inclusion of poor women and has enhanced the financial status of less privileged women through its thrift and credit programmes. Internal loan is given to the deserving members from the pooled small regular savings (thrift) of neighbourhood groups. Neighbourhood Groups (NHGs) are the primary units of the Kudumbashree community organisation. Ten to
Figure 8.1.4 Growth of women’s employment in organised sector
Source: Directorate of Employment
Table 8.1.7 Distribution of women employees among different levels of governmentType of government Total Women per cent to the total
Central Govt 59924 14594 24.4State Govt 262046 105004 40.1Central Quasi 82154 25828 31.4State Quasi 131597 39218 29.8LSGI 24898 9163 36.8Total 560619 193807 34.6
Source: Directorate of Employment

345Chapter 8, Initiatives For Social Inclusion
twenty women from a neighbourhood form an NHG. The internal loans help the NHG members to meet the immediate financial needs and unexpected contingencies without formalities. The function of thrift and credit is the basic activity of the Kudumbashree NHGs and the amount of affordable weekly thrift amount is decided by the NHG collectively. Likewise, the loan amount and priority of disbursement are according to the discretion of NHG and loan is repaid at the weekly meeting of NHG. Though NHG is autonomous and has a discretionary role in financial activities, each and every NHG is bound to act in accordance with the Kudumbashree bylaw. The activities are to be reported to the Area Development Society (ADS) and Community Development Society (CDS). The total thrift collected by NHGs in 2018-19 was more than ₹410.7 Crore and the internal loan generated out of this thrift amount comes more than four times of the thrift amount (Table8.1.8).
Kudumbashree members in Income Generation Activities
The major income generation activities under Kudumbashree are Joint Liability Groups (JLGs) and enterprises. Nearly 3.9 lakh women are
involved in various income generation activities of Kudumbashree. (Table 8.1.9)
Joint Liability Groups (JLGs) under Kudumbashree are collective farming groups of women with 4-10 members. More than 3 lakh of women farmers are actively involved in farming and they are cultivating in more than 5 thousand acres of land. This is a substantial achievement at a time when men are increasingly moving away from cultivation and cultivable land (including paddy fields) are converted for other purposes.
Collective farming under Kudumbashree was started in 2008 as Lease Land Farming groups with the objective of livelihood to women and conversion of fallow land into cultivable land thereby contributing to food security. But after two decades of activities, this project has achieved more than the objectives of food security and livelihood. It has become a way for economic and social empowerment through collectivism. The project is a successful example of integration of projects and agencies/departments. Most of the women involved in collective farming activities had the experience in farming as wage earners, workers or helpers to their husbands/parents. This project has
Table 8.1.8 Financial inclusion through NHGs, 2019No of NHGs 291507No of NHG Members (in Lakh) 43.9Amount of Thrift (in Crore) 410.7No of Bank linked NHGs 79458Total Disbursement Amt.(in Crore) 4131.9Internal Loan (in Crore) 2059.5
Source: Kudumbashree
Table 8.1.9 Joint Liability Groups and Micro Enterprises under KudumbashreeJoint Liability Groups (JLGs) under KudumbashreeNo. of JLGs 62527No of JLG members 330516Total area cultivated (in Ha) 54084Area of Fallow land cultivated (in acres) 5324.9Women Enterprises under KudumbashreeNo of Enterprises 21365No. of Women in enterprises 57149
Source: Kudumbashree
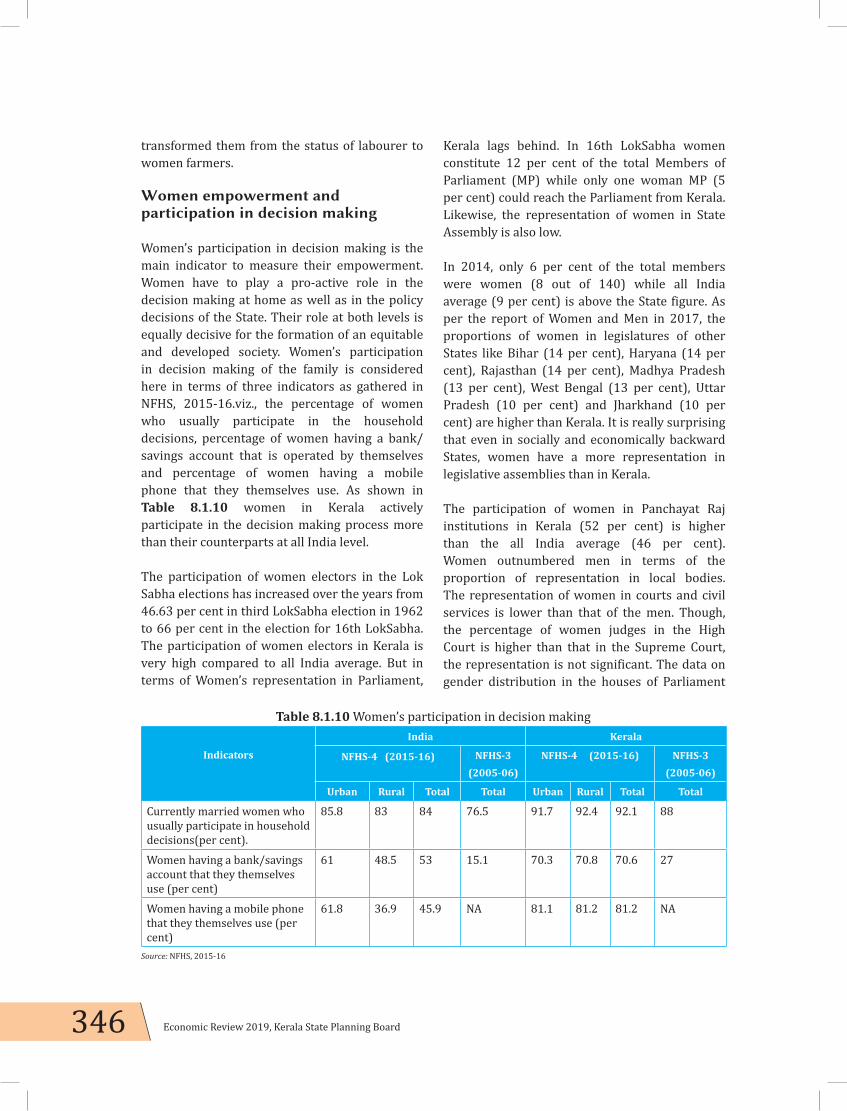
346 Economic Review 2019, Kerala State Planning Board
transformed them from the status of labourer to women farmers.
Women empowerment and participation in decision making
Women’s participation in decision making is the main indicator to measure their empowerment. Women have to play a pro-active role in the decision making at home as well as in the policy decisions of the State. Their role at both levels is equally decisive for the formation of an equitable and developed society. Women’s participation in decision making of the family is considered here in terms of three indicators as gathered in NFHS, 2015-16.viz., the percentage of women who usually participate in the household decisions, percentage of women having a bank/savings account that is operated by themselves and percentage of women having a mobile phone that they themselves use. As shown in Table 8.1.10 women in Kerala actively participate in the decision making process more than their counterparts at all India level.
The participation of women electors in the Lok Sabha elections has increased over the years from 46.63 per cent in third LokSabha election in 1962 to 66 per cent in the election for 16th LokSabha. The participation of women electors in Kerala is very high compared to all India average. But in terms of Women’s representation in Parliament,
Kerala lags behind. In 16th LokSabha women constitute 12 per cent of the total Members of Parliament (MP) while only one woman MP (5 per cent) could reach the Parliament from Kerala. Likewise, the representation of women in State Assembly is also low.
In 2014, only 6 per cent of the total members were women (8 out of 140) while all India average (9 per cent) is above the State figure. As per the report of Women and Men in 2017, the proportions of women in legislatures of other States like Bihar (14 per cent), Haryana (14 per cent), Rajasthan (14 per cent), Madhya Pradesh (13 per cent), West Bengal (13 per cent), Uttar Pradesh (10 per cent) and Jharkhand (10 per cent) are higher than Kerala. It is really surprising that even in socially and economically backward States, women have a more representation in legislative assemblies than in Kerala.
The participation of women in Panchayat Raj institutions in Kerala (52 per cent) is higher than the all India average (46 per cent). Women outnumbered men in terms of the proportion of representation in local bodies. The representation of women in courts and civil services is lower than that of the men. Though, the percentage of women judges in the High Court is higher than that in the Supreme Court, the representation is not significant. The data on gender distribution in the houses of Parliament
Table 8.1.10 Women’s participation in decision making
Indicators
India Kerala
NFHS-4 (2015-16) NFHS-3 (2005-06)
NFHS-4 (2015-16) NFHS-3 (2005-06)
Urban Rural Total Total Urban Rural Total Total
Currently married women who usually participate in household decisions(per cent).
85.8 83 84 76.5 91.7 92.4 92.1 88
Women having a bank/savings account that they themselves use (per cent)
61 48.5 53 15.1 70.3 70.8 70.6 27
Women having a mobile phone that they themselves use (per cent)
61.8 36.9 45.9 NA 81.1 81.2 81.2 NA
Source: NFHS, 2015-16

347Chapter 8, Initiatives For Social Inclusion
and State Assemblies throw light to the fact that the ‘political participation’ of women in strategic decision-making processes is very low.
Crimes against Women
Contrary to the high social development including high educational level, crimes against women continue to be a major threat in Kerala. While on the one hand we want women to come out of their homes and take up employment, on the other it is important that we ensure their safety. Greater efforts are required in this direction, to enable women to take up gainful economic activities outside the home. ‘Cruelty by husband/relatives’ still constitutes a major component in crime against women. As per the crime statistics of India in 2016, majority of cases under crimes against women were reported under cruelty by husband or his relatives (32.6 per cent) followed by assault on women with intent to outrage her modesty (25.0 per cent), kidnapping and abduction of women (19.0 per cent) and Rape (11.5 per cent). Uttar Pradesh reported 14.5 per cent (46072 out of 329067 cases) of total cases of crimes against women followed by West Bengal (9.6 per cent) (33052 cases) in 2016. Delhi UT reported the highest crime rate (159.9).
The total number of crimes in Kerala has decreased since 2016 (Figure8.1.5). The details
of crimes against women in Kerala has been given in Appendix 8.1.6.
Lesbian, gay, bisexual and transgender (LGBT) people in Kerala
Kerala has been at the forefront of addressing LGBT issues among the Indian States. Kerala is the first State in India which declared a Transgender Policy in 2015. GoK has issued a rights-based State Policy for Transgenders within a clear results framework. In addition, consistent with the 2014 Supreme Court judgement, the policy allows for the self-identification of a person as a Transgender. The Policy also recommends the establishment of District-level TG Boards that can register TGs and issue identification cards.
The survey conducted by the Social Justice Department on TGs reveals that they are unable to acquire even basic capabilities essential to a life of well-being and dignity. Hence, interventions for the inclusion of TGs cannot be limited to merely economic measures. The Supreme Court judgments have given some space to remedy certain of the issues of TGs. By decriminalising Section 377 of IPC, Supreme Court recognised all non-normative sexual orientations as legal through its recent historic verdict in 2018.
Figure 8.1.5 Total crimes against women in Kerala
Source: Crimes Records Bureau,Kerala

348 Economic Review 2019, Kerala State Planning Board
Various schemes for the welfare of TGs are being implemented by various departments especially by Social Justice Department (of which the schemes of Social Justice Department have been given in Chapter 8 of this Review). Apart from these, Kerala State Literacy Mission Authority (KSLMA) has initiated special literacy programme for TGs and they have joined the 4th, 7th, 10th and 12th equivalency programme of KSLMA. In 2018-19, 65 persons have passed the 10th and 12th equivalency programmes. Likewise, schemes/programmes aiming the welfare of LGBTs have been initiated under Health and Family Welfare Department. The facilities for free sex-reassignment surgeries have been established in Kottayam medical college.
A programme, viz, Nisarga has been started by Directorate of Homeopathy for counseling and medication for transgender.
Gender Budgeting
Strengthening of Gender Budgeting (GB) is essential since policies and programmes have a differential impact on women and men given their socially ascribed roles – men being perceived as the breadwinners and women as homemakers. Gender-Responsive Budgets recognise the economic significance of women’s unpaid work in the household which tends to be neglected in macro development policy and the need for public investment in these activities.
Box 8.1.3 Help Desks for Women
Pink Police Patrol: Pink police patrol car was deployed by the Kerala Police in Thiruvananthapuram, Kochi, and Kozhikode with the prime objective of extending assistance to women, children and senior citizens in distress. Each vehicle will be led by a woman police officer and will have two other women police personnel. They are deployed in areas where there is a high presence of women, they function from 8 am to 8 pm. They can be contacted at the toll-free number 1515. The patrol cars are equipped with GPS tracking devices as well as cameras installed on the front and rear sides of the vehicles. The camera will relay visuals to the city police control room continuously and will enable those concerned to deploy additional forces to various areas whenever necessary.
Snehitha help desk: It is a 24-hour working gender help desk. This was started in 2013 in three Districts namely Malappuram, Ernakulam, and Thiruvananthapuram. The main aim of the centre is to provide help and support to those women and children who are in distress and provide a voice to their issues and concerns, and to prevent, protect and prevail over domestic violence through advocacy, empowerment and social change. It also looks to enhance the socio-economic status of the young. Snehitha provides immediate help, shelter, counselling, motivation and legal assistance to the victim of violence. It is run by Kudumbashree.
24/7 Women Information and assistance centre: The 181 women helpline in the State is envisioned to create an infrastructure for the support of women at all times and for varied purposes with the principle of efficiency and continuous feedback mechanisms as its core functioning. The help line service as envisioned by the Ministry of Women and Child Development, GoI, is an emergency response system alone for women in distress. Mithra Help line (181) was launched in Kerala on March 27, 2017, and is presently functioning successfully as a 24/7 accessible and emergency response service for women in need. This has gained public recognition for rendering prompt and judicious services by the skilled Mithra Call Response Team together with the pro-active support of the police, medical and legal system.
Source: Department of Women and Child Department and Kudumbashree
349Chapter 8, Initiatives For Social Inclusion
The Gender Budget Statement is an important tool for bringing together all information regarding allocations for women. It is now considered as an instrument to address gender inequality and reallocate the resources in favour of women. It serves as a reporting mechanism and provides an indication of funds flowing to women. It is a major step in strengthening inclusive growth.
Gender aware planning was introduced in the State of Kerala at the time of 9th Plan itself with the inclusion of Women Component Plan (WCP) in local bodies’ Annual Plan and by making it mandatory. With the devolution of 35-40 per cent of funds from the State to the Local Self-Government Institutions (LSGIs), the first form of Gender Budgeting was seen in the State in 1996 where each Panchayat was directed to prepare a chapter on the status of women in their development Plan document. WCP was introduced in 9th Plan wherein 10 per cent of the Plan outlay of the local bodies had to be set apart for needs of women or women-specific projects and all other projects should be subjected to a gender lens.
To institutionalise the process of Gender Budgeting, the Gender Budget Statement had been introduced in the Union Budget 2005-06. Kerala has been consciously attempting to ‘mainstreaming gender’ through Gender Budgeting as an integral part of the planning process since the 11th Plan. Gender Budgeting in Kerala has (through a process of learning) taken a much more expansive view on women’s lives and roles they play not only in terms of their potential as paid workers but more importantly through their ‘invisibilised’, unpaid work in social reproduction. However, it was only in 2017-18 that the first Gender Budget document for the State Plan was released aggregating resources earmarked for girls/women across departments.
The thrust areas in the Annual Plan 2019-20 continue to be the economic, social and political empowerment of women with a greater focus on creating an enabling environment for women
in the domain of public employment. With this in mind the approach in the Plan is to enhance, every year, allocations for women’s wage employment, self-employment and livelihoods, skill development, special facilities at the workplace, child care, working women’s hostels, ensuring their security at the workplace and protecting them from violence at home and in the public domain.
It is found that in 2019-20, ₹1421.6 crore has been provided for women-specific schemes and an amount of ₹2470.11crore is available for women in composite schemes. Including both Parts A and B a total of`₹3891.71 crore is for girls/women, which is 16.9 per cent of State Plan outlay, 6.2 per cent in Part A and 10.7 per cent in Part B (excluding local governments), a reasonable increase over the last two years. This includes an amount of Rs 5crore allocated for Mazhavillu, scheme for transgender for providing a Helpline, establishing a cell in the Social Justice Department directorate for organising activities, financial assistance for vocational training/skill development for self-employment/regular employment, pension for the destitute above 60 years, scholarships, continuing literacy programme and short-stay homes.
World wide progress on the Sustainable Development Goals – The Gender Snapshot
In order to review the progress on the implementation of the 2030 Agenda for Sustainable Development and its 17 SD goals, Heads of different countries gathered at UN Headquarters in New York on September 24 and 25, 2019. In order to disclose those discussions, UN Women and the UN Department of Economic and Social Affairs have released “Progress on the Sustainable Development Goals: The gender snapshot 2019”. This publication brings together the latest available evidence on gender equality across all 17 Goals, underscoring the progress made as well as the action still needed to accelerate progress.

350 Economic Review 2019, Kerala State Planning Board
Box 8.1.4 Gender Snapshot 2019 of Sustainable Development Goals Worldwide
Sl. No
Sustainable Development Goal
Gender Snapshot
1 No Poverty More women than men live in poverty. Women and girls are 4 per cent more likely than men and boys to live in extreme poverty.
2 Zero Hunger Food insecurity affects more women than men. Globally, Women had a 10 per cent higher risk of experiencing food insecurity than men in 2018.
3 Good Health and well being
Access to skilled birth attendance is strongly associated with wealth and urban residence. In 2017, nearly 3 lakh women died from compli-cations related to pregnancy and childbirth.
4 Quality Education An estimated 15 million girls and 10 million boys of primary school age are out of school. Illiteracy rates are highest among woman in the poorest households.
5 Gender Equality Women spend 3 times more as many hours as men each day in unpaid care and domestic work.Women comprised 39 per cent of the workforce in 2018 but held only 27 per cent of managerial positions. Worldwide, only 1 in 4 parliamentary seats are held by women.
6 Clean water and Sanita-tion
Women and girls are responsible for water collection in 80 per cent of households.
7 Affordable and Clean Energy
In 2017, an estimated 3 billion people worldwide lacked clean cooking fuels and technologies. Girls using solid fuels for cooking spend 18 hours a week compared to 5 hours in households using clean fuels.
8 Decent Work and Eco-nomic Growth
The labour force participation rate of women aged 25 to 54 is 55 per cent versus 94 per cent for men in the same age group
9 Industry, Innovation and Infrastructure
Globally, less than 1 in 3 of all Research Positions are held by women.
10 Reduced Inequalities Unfavourable family reunification policies for migrant women more vulnerable.
11 Sustainable Cities and Communities
More women than men live in slum-like conditions.
12 Responsible consumption and production
13 Climate action The lack of disaggregated data in the environment domain affects the development and implementation of effective policies to address gender-environment nexus.
14 Life below water Women are not typically included in decisions on the management of coastal and marine resources, limiting this access.
15 Life on land Globally while more employed women than man are working in agri-culture, forestry and fisheries, only 13.8 per cent of landholders are women.
16 Peace, Justice and Strong Institution
3 in 4 human trafficking victims are women and girls.
17 Partnerships for the Goals
Increased mobilisation of financial resources for gender equality is urgently needed.
Source: United Nations Population Fund, 2019

351Chapter 8, Initiatives For Social Inclusion
8.2 Welfare of Scheduled Castes, Scheduled Tribes, Other Backward Classes, Minorities, and Forward Communities
The Constitution of India makes special provision to facilitate the development and upliftment of the people of the Scheduled Castes, Scheduled Tribes, and other historically oppressed sections of society. As far as the State of Kerala is concerned, struggles for justice, especially those against the caste system and untouchability, are an inseparable part of the movements that led to the formation of modern Kerala. Guided by the Constitution and the legacy of the struggles for justice, the Government of Kerala has implemented several measures for the development of the Scheduled Castes, Scheduled Tribes, and other victims of sectional deprivation. Despite these measures, there is still a distance to be covered to ensure comprehensive socio-economic development for the Scheduled Caste and Scheduled Tribe populations. Along with measures to ensure security and social dignity, a concerted effort is required to ensure land and housing, education, skill development, employment generation, and food security for the Scheduled Caste and Scheduled Tribe populations of the State. According to data from the Census of India, the share of people of the Scheduled Castes in the population of Indian in 2011 was 16.6 per cent, and the share of people of the Scheduled Tribes in the Indian population in 2011 was 8.6 per cent. In 2001, the population of people of the Scheduled Castes in Kerala was 31,23,941. There were 68
specified Scheduled Castes, and the share of Scheduled Castes in the total population was 9.81 per cent. In 2011, the Scheduled Caste population declined to 30,39,573 persons 9.10 per cent. (The decline was because some Scheduled Castes were reclassified as Scheduled Tribe.) The Scheduled Caste population in the State is concentrated in Palakkad, Thiruvananthapuram, Kollam, Thrissur, and Malappuram districts. Communities such as Vedar, Nayadi, Kalladi, Arundhathiar/Chakkiliar are identified as vulnerable communities among Scheduled Castes, and their population is concentrated in Palakkad, Malappuram, Kollam, and Idukki districts. The share of these castes among all Scheduled Castes is 3.65 per cent. The Scheduled Tribe population according to the Census 2001 was 3,64,189 persons or 1.14 per cent of the total population. Because of the reclassification of certain Scheduled Castes as Scheduled Tribes (mentioned above), the population of Scheduled Tribes increased to 4,84,839 persons. The highest concentration of Scheduled Tribes is in Wayanad District (31.24 per cent) followed by Idukki (11.51 per cent), Palakkad (10.10 per cent) and Kasargod (10.08 per cent). According to the Report on the Socio-Economic Status of Scheduled Tribes of Kerala (2008) of the Scheduled Tribes Development Department, there are 1,07,965 tribal families residing in 4,762 hamlets in Kerala. About 11 per cent (540) of the tribal habitats are situated
352 Economic Review 2019, Kerala State Planning Board
within the reserve forests and 20 per cent (948) are in the immediate vicinity of reserve forests.
District-wise details of Scheduled Castes and Scheduled Tribes population are given in Appendix 8.2.1 and 8.2.2. A comparative picture of literacy and sex ratio of Scheduled Caste and Scheduled Tribe population in Kerala with National-level is in Appendix 8.2.3. The work participation rate of people of Scheduled Castes and Scheduled Tribes are given in Appendix 8.2.4. In Kerala, as per Rule 14(a) of the Kerala State and Subordinate Service Rules 1958, 10 per cent representation (8 per cent for Scheduled Castes, 2 per cent for Scheduled Tribes) is reserved to Scheduled Castes and Scheduled Tribes in Gazetted, Non-Gazetted and Last Grade categories in the Government departments. According to a report of January 1, 2019, an annual review of 53 departments and agencies out of 86 departments and agencies showed that the total representation of people from Scheduled Castes and Scheduled Tribes in public service was reported as 10.38 per cent. Of this, 7.92 per cent were from Scheduled Castes and 2.46 per cent were from the Scheduled Tribes. Details of representation of the Scheduled Caste and Scheduled Tribe employees in government service is given in Appendix 8.2.5.
There are 83 communities included in the list of OBCs in Kerala. According to the Census of 2011, the people of religious minorities constituted 44.99 per cent of the total population of the State. (26.56 per cent Muslims, 18.38 per cent Christians, and 0.06 per cent others.)
Development Programmes for Scheduled Castes and Scheduled Tribes
The State Government allocates a portion of State Plan outlay annually for the development of Scheduled Castes and Scheduled Tribes in the Scheduled Caste Sub Plan (SCSP) fund and Tribal Sub Plan (TSP) fund. The share of these resources in the Plan exceeds the share of the people of the Scheduled Caste and Scheduled Tribe in the
population. At present, 9.81 per cent of total State Plan outlay is allocated for the welfare of Scheduled Castes and 2.83 per cent for Scheduled Tribes. Out of this, a certain percentage of funds are allocated to local governments for implementation of schemes under decentralised planning and the remaining to the Scheduled Caste and Scheduled Tribe Development departments.
The total Plan provision set apart for the development of Scheduled Castes and Scheduled Tribes in 2018-19 was ₹2,859.62 crore and ₹826.19 crore. In 2019-20, ₹3,002.84 crore was allocated to the Scheduled Caste Development and ₹866.26 crore to Scheduled Tribes. Year-wise details of allocation from 2014-15 to 2019-20 for Scheduled Caste and Scheduled Tribe Development are given in Appendix 8.2.6 and in Figure 8.2.1. Development of Scheduled Castes
The State Government allocates Plan funds to the Scheduled Caste Development Department and local governments to implement Plan schemes. Besides this, the Central government allocates funds for the implementation of Centrally Sponsored Schemes. An amount of ₹2,859.62 crore was allocated for the welfare of Scheduled Castes in 2018-19. Out of this, an amount of ₹1,570.36 crore was allocated to the Scheduled Caste Development Department and ₹1,289.26 crore to local self-governing bodies. The Scheduled Caste Development Department spent ₹1,148.10 crore out of the budgeted outlay of ₹1,570.36 crore (73 per cent). Scheme-wise outlay and expenditure of welfare of Scheduled Castes for the years 2018-19 and 2019-20 (as on September 30, 2019) and the physical targets and achievements are given in Appendix 8.2.7 and 8.2.8.
Most Scheduled Caste colonies are concentrated in low-lying areas that are ecologically highly sensitive areas and are subject to flood and other natural calamities. When compared to the population of the State as a whole, the Scheduled

353Chapter 8, Initiatives For Social Inclusion
Caste population in Kerala is faced with several relative levels of deprivation. These deprivations include landlessness and houselessness, livelihood insecurity, low income, limited economic opportunities, lack of access to credit, difficulty in getting access to higher studies and adequate job opportunities, drop-outs after secondary stage education, poor performance in higher education and professional courses, poor health conditions, and lack of proper infrastructure in habitats. For addressing the major challenges before people of the Scheduled Castes, the Scheduled Caste Development Department is focusing their activities towards educational development programmes, social development programmes, economic development programmes, cultural development programmes, and legal services.
Educational Development Programmes
The provision of education of high quality is essential in this sector. In addition to the general educational facilities, educational facilities are also provided to the Scheduled Castes through various institutions under the Scheduled Caste
Development Department. At present, there are 85 nursery schools, 9 model residential schools, 44 Industrial Training Institutes, 87 pre-matric hostels, 17 post-matric hostels, 4 pre-examination training centres, a community college in Vadakkancherry, and a Medical College in Palakkad functioning under the control of the Scheduled Caste Development Department. Various educational schemes are also implemented by the Scheduled Caste Development Department for improving pre-matric and post-matric studies, technical education, Model Residential Schools, and self-financing colleges.
Educational assistance such as lumpsum grants, stipends, pre-matric and post-matric scholarships, book grants, merit awards, gold medals, apprenticeship, remedial coaching for students in the subjects they are weak, medical/engineering entrance coaching, tuition facilities in Model Residential Schools, and assistance for studying in other States and abroad are provided to the students. At the beginning of each academic year, primary educational aid of ₹2,000 per student is given to the students from 1st to 8th standard to purchase bags, umbrellas, and
Figure 8.2.1 SCSP/TSP year-wise outlay, ₹ in crore
Source: Source: Budget documents
354 Economic Review 2019, Kerala State Planning Board
uniforms. In 2018-19, primary education aid was provided to 2,98,246 students. For the students in high school and higher secondary classes from families with annual income up to ₹1.00 lakh, ₹3.00 lakh is given for an additional study room (padanamuri) to their houses. In 2018-19; 5,127 padanamuri were constructed. Educational assistance is also provided to engineering students, who receive ₹5,000 annually, and to medical students who receive ₹10,000 annually. A boarding grant up to ₹4,500 per month for private accommodation is also provided to students. Apart from this, tuition fees are reimbursed to students in unaided institutions. The pre-matric scholarship was received by 37,000 students in 2018-19. Lumpsum grants, stipends, tuition fees, and examination fees are also provided to the students in the parallel colleges. The pass percentage in Model Residential Schools is more than 90 per cent, and in the Government Medical College, Palakkad, the pass percentage is 72 per cent. For motivating students and parents, career orientation programmes were conducted at higher secondary level in all districts.
The Government of India provides pre-matric scholarship to students in 9th and 10th Classes from families with an annual income of not more than ₹2.00 lakh. For promoting post-matric education, Government of India provides post-matric scholarship to students from families with annual income up to ₹2.50 lakh. Assistance was availed by 1,36,525 post-matric students in 2018-19.
Under the new scheme “Additional State Assistance to Post-matric Studies’ launched in 2018-19, the State Government provides assistance to students (irrespective of income levels), who do not receive any kind of scholarship from the Government of India. In 2018-19, financial assistance was given to 11 students to study abroad and to 827 students to study in States other than Kerala. Medical/engineering entrance coaching to 900 students and remedial coaching to 600 B.Tech students were provided. Financial assistance was given to
1,749 students to buy laptop computers and to 341 medical students to buy stethoscopes.
Economic Development Programmes
The Scheduled Caste Development Department undertakes income-generating programmes that include self-employment schemes, job oriented training programmes, assistance to seek jobs abroad, support for exhibiting and selling products, and the Ambedkar village development scheme.
Under the self-employment scheme, individuals and self-help groups were provided one-third of the loans taken as subsidy for undertaking self-employment ventures. In 2018-19; 297 entrepreneurs availed of the self-employment subsidy. Details of persons benefited under Self-employment scheme in 2018-19 and 2019-20 are given in Appendix 8.2.9. In order to create more employment opportunities among Scheduled Caste youths, the Scheduled Caste Development Department conducts various skill development training programmes. In the year 2018-2019, 1,665 Scheduled Caste youths participated in skill development training programmes and 1,028 trainees gained job placements in India and abroad. In 2019-20, Scheduled Caste Development Department provided skill development training programmes over a wide range of skills including panchakarma therapy, Ayurveda nursing, Ayurveda pharmacy, spa therapy, geriatric assistance, yoga instruction, fabric and textile design, food and beverage management, solar panel installation and repair, mural painting and glass art, industrial electronics, server administration and networking, industrial machine operation, travel and tourism, HVAC, pipe fabrication, digital marketing, retail management, designing and garment technology, graphics and web designing, and airline customer service.
In order to find a market for products manufactured by the entrepreneurs of the Scheduled Castes and Scheduled Tribes, the Scheduled Caste and Scheduled Tribe

355Chapter 8, Initiatives For Social Inclusion
Development departments and the Kerala Institute for Research Training and Development Studies for Scheduled Castes and Scheduled Tribe (KIRTADS) conducts product exhibition and sale known as ‘Gadhika’ twice in a year.
For the holistic development of Scheduled Caste colonies, Scheduled Caste Development Department launched a new scheme viz, ‘Ambedkar Village Development Scheme’, in Scheduled Caste colonies where more than 30 Scheduled Caste families live. Under this scheme, ₹1.00 crore is provided to each colony for undertaking development activities including provision of drinking water, toilet and sanitation, waste management, road connectivity, electrification, construction of land protection wall, irrigation, playground and community hall and renovation of houses, financial support for income-generating activities, assistance for protection and renovation of burial grounds inside the colony or situated adjacent to the colony. In 2018-19 and 2019-20, ₹100.00 crore was allocated for the scheme.
Social Development Programmes
The major social development schemes implemented for the welfare of Scheduled Castes
include providing land and housing, development programmes for vulnerable communities, marriage assistance, health care schemes, and Valsalyanidhi. Land to landless scheme benefited 3,887 families in 2018-19 and 1,078 families in 2019-20 (upto September 30, 2019). Details of houses constructed by Scheduled Caste Development Department from 2014-15 to 2019-20 is given in Appendix 8.2.10 and details of land provided to Scheduled Caste families from 2017-18 to 2019-20 are given in Appendix 8.2.11.
Under the housing scheme, LIFE Mission has undertaken the construction of new houses and spillover works implemented by Scheduled Caste Development Department from 2012-13 to 2017-18. From 2018-19 onwards, the Department continued maintenance activities, completed incomplete houses, and undertook additional works for the completion of houses under PMAY programme.
The heavy rainfall in August 2018 significantly affected the low-lying regions inhabited by the people belonging to the Scheduled Castes. It resulted in the complete collapse of 2,632 houses and partially collapse of 11,223 houses. In 2018-19, assistance was provided to rebuild 245
Box 8.2.1 Food Craft Institute, Palakkad
In 2018-19, a Food Craft Institute was started in Palakkad District by the Tourism Department in association with the Scheduled Caste and Scheduled Tribe Development departments. It provides training in Hotel Management to students from Scheduled Caste, Scheduled Tribe and other categories. After the training, jobs are ensured to the candidates in various institutions under the Tourism Department.
Source: Scheduled Caste Development Department
Box 8.2.2 Financial assistance for seeking jobs abroad
Scheduled Caste Development Department provides financial assistance upto ₹1.00 lakh for unemployed Scheduled Caste youths for seeking jobs abroad. Assistance is mainly for meeting expenses such as job visa, passport, and travel charges. Beneficiaries should be within the age group of 20-50 years with annual income family limit of below ₹2.50 lakh. Passport, visa and the job agreement with the foreign employer should be submitted for availing the benefits of the scheme. In 2018-19, 318 Scheduled Caste youths have been placed abroad.
Source: Scheduled Caste Development Department
356 Economic Review 2019, Kerala State Planning Board
houses damaged in the flood. Of this, 83 houses were completed in the year. Financial assistance of ₹5,000 per family was distributed to 83,872 flood-affected Scheduled Caste families. To address the problems faced by the vulnerable communities among Scheduled Castes, a special package was initiated in the State Plan Scheme in 2018-19 which includes integrated colony development, completion of spillover houses, Samuhikapadanamuri, skill development training, employment, and special tuition.
Financial assistance of ₹75,000 for the marriage of Scheduled Caste girls was distributed to 7,291 Scheduled Caste families. In 2018-19; 83 per cent of the amount budgeted for the scheme was spent, and in 2019-20; 66 per cent of expenditure was incurred till September 30, 2019. For
improving the health status of the marginalised communities, ‘Healthcare Scheme’ was initiated in 2018-19. Under this scheme, 30,844 persons availed assistance and 483 medical camps were organised. In 2018-19; ₹50.00 crore was allocated for the scheme and expenditure incurred was 82 per cent. In 2019-20; ₹60.00 crore was allocated and 32 per cent expenditure was incurred up to September 30, 2019. In the insurance-linked social security scheme called “Valsalyanidhi”, 2,825 Scheduled Caste girls registered in 2018-19. For improving the social status of Scheduled Caste colonies, Vinjanwadis are functioning with a facilitator and provides facilities such as libraries, reading rooms, computer with internet facilities, newspapers, journals and periodicals, and necessary furniture. At present,
Box 8.2.3 LIFE Mission and Housing Scheme for Scheduled Castes
According to the estimates of the LIFE Mission, there are 75,355 houseless people from the Scheduled Castes in Kerala. Among them, 20,796 families own land and rest of them are landless. Housing assistance of ₹4.00 lakh per family was given to 9,526 families who own land. Among this, 3,122 families completed the construction works. Mission offers two options to the landless, one is to avail the assistance of ₹2.25 lakh for 3 cents in Grama Panchayath, ₹4.5 lakh in Municipalities, and ₹6.00 lakh in Corporation to purchase habitable land. The second option is to avail dwelling units constructed by the Mission in 28 towers across the State. The Mission has completed the work of 4,154 incomplete houses sanctioned earlier under various Central and State housing schemes.
Source: Scheduled Caste Development Department
Box 8.2.4 Handholding cell and Mobile App
One of the outstanding achievements of the Scheduled Caste Development Department with respect to the measures undertaken for the welfare of the people of Scheduled Castes in 2018-19 was the creation of a ‘handholding cell’ to equip the Scheduled Caste youths through awareness programmes. A mobile application has been created in connection with the activities of the Cell for providing information and guidelines for the people of Scheduled Castes at their fingertips. The Scheduled Caste beneficiaries registered in this application will get information regarding higher education, job opportunities, and welfare schemes of the department. It also helps in clearing doubts and in downloading application forms of various welfare schemes. At present, there are 2,810 Scheduled Caste youths registered as users in this application. Through the mobile application, 2,399 queries have been received and all valid queries were cleared. The cell conducted 24 awareness campaigns for Scheduled Caste youths and also organised a two-day workshop for the kitchen staff in the post-matric/pre-matric hostels regarding cleanliness and hygiene. The handholding cell also serves as a monitoring cell to ensure that the beneficiaries get the advantages of various scheme and projects.
Source: Scheduled Caste Development Department

357Chapter 8, Initiatives For Social Inclusion
there are 143 Vinjanwadis throughout the State. To encourage and to ensure the safety of the Scheduled Caste women working in distant areas, the department initiated a new scheme in 2018-19 to construct working women’s hostels in all districts. In the first phase, it was proposed to construct working women’s hostels in Thiruvananthapuram, Ernakulam and Kozhikkode districts and at present, the construction work in Thiruvanathapuram District is nearing completion. Cultural Development Programmes
To encourage the cultural activities of the people of Scheduled Castes, Nadankalamela or Gadhika fair is organised by the Scheduled Caste Development Department. Department publishes a journal called ‘Padavukal’ which includes features and articles illustrating the status of
the historically oppressed sections, stories and poems, and details of schemes implemented by the State and the Central Government. For promoting artistic talents among students, ₹10,000 is given as cash award to ‘A’ grade winners in State-level School Kalolsavam. In 2018-19; 319 students received cash awards. Dr Ambedkar media award of ₹30,000 is given for the best report writers. In 2018-19, a literary workshop namely ‘Ranthal-2018’ was organised to provide guidance to writers, and 48 Scheduled Caste youths participated in the programme.
Legal services
The Constitution of India has ensured reservation in elections to the Loksabha, State Legislative Assemblies, Local Governments and in Government jobs. According to Article 17 of the Constitution of India, ‘untouchability’ is abolished
Box 8.2.5 Online web portal of Gadhika products
In 2018-19, Scheduled Caste Development Department launched a new initiative named “Gadhika” through Amazon Online Portal. This facilitated the marketing of the products made by the Scheduled Caste entrepreneurs and created a platform to find business all around the world. Variety of Handicrafts and traditionally used utensils are marketed through the online portal. At present, nearly 20 items are marketed through the online marketing platform. Details of products on Gadhika Amazon portal is given in Appendix 8.2.12.
Source: Scheduled Caste Development Department
Figure 8.2.2 Number of victims registered under the Prevention of Atrocities Act and compensation granted to Scheduled Castes from 2014-15 to 2018-19
Source: Scheduled Castes Development Department

358 Economic Review 2019, Kerala State Planning Board
and its practice is forbidden. The enforcement of any disability arising out of ‘untouchability’ is punishable in accordance with the law. The protection of Civil Rights Act, 1955 and the Scheduled Caste and Scheduled Tribe (Prevention of Atrocities) Act, 1989 was enacted and enforced to prevent offences against the people of the Scheduled Castes and Scheduled Tribes. The Act prescribes punishment for the enforcement of any disability arising from the preaching and practice of ‘untouchability’ and prevents atrocities against the people of Scheduled Castes and Scheduled Tribes. The Special Court, Scheduled Caste Protection Cell, and Special Police Stations have been formed for the trial in such cases, and to ensure the provision of relief and rehabilitation to the victims of atrocities. Number of crimes registered under Scheduled Caste and Scheduled Tribe (Prevention of Atrocities) Act, 1989 and compensation granted to the people of Scheduled Castes for the last five years is given in Appendix 8.2.13 and Figure 8.2.2.
The number of victims reported in 2014-15 was 351. It increased to 397 in 2017-18 and to 981 in 2018-19. The incidence of crime committed against Scheduled Castes shows an increasing trend over the last five years. This problem has to be seriously addressed.
Corpus Fund (Critical Gap Filling)
The Scheduled Caste Development Department allocates a portion of its outlay as a corpus fund in the Budget annually for filling critical gaps identified in the Scheduled Caste Sub Plan schemes. Corpus fund is intended to provide funds for addressing any critical gap in the Scheduled Caste Sub Plan provision made under various schemes on a project basis with an emphasis on basic needs, economic development, and human resource development.
In 1996-97, a portion of Scheduled Caste Plan outlay was allocated for the scheme called, “Intensive Habitat Development Programme” meant for filling the critical gaps in completing
the schemes. Unfortunately, the scheme did not work effectively as intended due to the absence of a project-based approach and lack of reallocation of resources to the required areas. To rectify this, a project-based approach was adopted in the implementation of schemes and was funded by the corpus fund. From the year 2002-03 onwards, a portion of Scheduled Caste Plan outlay was allocated as a corpus fund under Scheduled Caste Sub Plan. From the corpus fund, two-third of the amount was allocated to districts based on Scheduled Caste population. From the 12th Five Year Plan onwards, one-third of the corpus fund was allocated to districts. The administrative sanction for schemes up to ₹25.00 lakh can be accorded at the districts by the District-Level Committee for the Scheduled Castes and Scheduled Tribes. The schemes sanctioned under corpus fund in 2018-19 includes water supply schemes, construction of road and protection wall, electricity connection, and drainage.
In 2018-19, ₹100.00 crore was allotted for the scheme. Outlay and expenditure under the scheme from 2014-15 to 2019-20 are given in Appendix 8.2.14.
Pooled Fund
The pooled fund is intended to implement special projects for the benefit of the Scheduled Castes by any Government departments, institutions, agencies, or NGOs. The departments and agencies furnish projects to the State Planning Board for scrutiny. After the vetting by the State Planning Board, the proposals are forwarded to Scheduled Caste Development Department and then placed before State-Level/Special Working Group for approval. Outlay and expenditure under the scheme from 2014-15 to 2019-20 are given in Appendix 8.2.15.
Special Central Assistance to Scheduled Caste Sub Plan (SCA to SCSP) The Special Central Assistance to Scheduled Caste Sub Plan (SCA to SCSP) is provided by the
359Chapter 8, Initiatives For Social Inclusion
Government of India to the States to mainly undertake economic development programmes for the people of the Scheduled Castes. It helps to fill the gaps which are not met from the Central, State and local government Plans. Out of the total funds received under SCA to SCSP, 75 per cent of the fund is distributed to the District Collectors on the basis of Scheduled Caste population in the districts. Rest of the 25 per cent is kept with the Director, Scheduled Caste Development Department. Activities that can be taken up under SCA to SCSP include assistance to Scheduled Caste families for viable income-generating activities, through a mix of institutional finance and subsidy. The outlay and expenditure details of SCA to SCSP from 2014-15 to 2019-20 (as on September 30, 2019) are given in Appendix 8.2.16.
Development of Scheduled Tribes
The concept of the Tribal Sub Plan (TSP) was introduced for the development of Scheduled Tribe population in the Fifth Five Year Plan (1974-75). The objective of the Tribal Sub Plan was to ensure special care to Scheduled Tribes through a Sub Plan approach. Since 1983-84, the strategy has undergone changes and it has been decentralised to the District level. After the 73rd and 74th Constitutional amendments, the local governments have been entrusted with specified responsibilities related to the development and welfare of Scheduled Tribes. Due to the typical settlement pattern, cultural practices, and traditional identities, the Scheduled Tribe populations are consolidated in clusters and are concentrated in the interior forest and adjoining areas. Considering this, the strategy of Tribal Sub Plan was to protect Tribal people and ensure Tribal development. The State Government allocates Plan funds almost equivalent to nearly two times the share of the Scheduled Tribes in the total population of the State. The Tribal Sub Plan provision in the Budget is for the exclusive development of Scheduled Tribes. In 2018-19 and 2019-20, about 2.83 per cent of the State Plan outlay was provided under Tribal Sub Plan even though the population proportion was 1.45 per cent.
The major sources of fund for Scheduled Tribe Development Department are the State plan allocation, funds under the Tribal Sub Plan components of Centrally Sponsored Schemes, Special Central Assistance to Tribal Sub Plan (SCA to TSP), Grant under Article 275 (1) of the Constitution, other allocation for schemes implemented by Ministry of Tribal Affairs, and Institutional finance. The total State Plan provision set apart for the development of the Scheduled Tribes in 2018-19 was ₹826.19 crore. Out of this, an amount of ₹632.59 crore was allocated to the Scheduled Tribe Development Department and an amount of ₹193.60 crore was provided as grant-in-aid to local governments. Under 50 per cent and 100 per cent Centrally Sponsored Schemes, the anticipated Central share was ₹15.75 crore and ₹122.16 crore respectively. In addition to this, ₹10.00 crore was anticipated as SCA to TSP. Details of financial achievements are given in Appendix 8.2.17 and physical achievements of the schemes implemented by the department in 2018-19 and 2019-20 (as on September 30, 2019) are given in Appendix 8.2.18.
The major challenges faced by the Scheduled Tribe Development Department are problems related to land, house, unemployment, access to clean drinking water, lack of connectivity, and malnutrition. Schemes implemented by Scheduled Tribe Development Department for the welfare of Scheduled Tribes are classified as educational programmes, housing, health, socio-economic upliftment, and legal protection measures.
Educational programmes
Provision of full access to the best educational facilities at all levels is one of the thrust areas of the 13th Plan. Major educational programmes implemented by the Scheduled Tribe Development Department include peripatetic education to vulnerable tribes, tutorial scheme, gothrasarathi, gothrabandhu, samuhika padanamuri, and incentives and assistance to students. There are 13 nursery schools, 10 kindergarten, 3 balavadi, 1 vikasvadi, 3 balavinjan
360 Economic Review 2019, Kerala State Planning Board
kendram, 7 peripatetic education centers for Particularly Vulnerable Tribal Groups, 20 model residential schools, 22 single teacher schools, 106 pre-matric hostels, 9 post-matric hostels, 12 training centers, 2 vocational training centers, and one Industrial Training Institute functioning under the Scheduled Tribe Development Department.
Peripatetic centres and single teacher schools are functioning for imparting lower primary education to Particularly Vulnerable Tribal Groups and other tribal students in certain isolated settlements, and the teachers are expected to visit the settlements and provide education. Hostel accommodation is provided to students when they reach the 2nd and 3rd standard. Special coaching is given to the high school and higher secondary students through the tutorial scheme. Under gothrasarathi scheme, transportation facilities are arranged for students residing in interior forest and inaccessible regions. The language issues faced by the children from the tribal communities are addressed through gothrabandhu scheme where a teacher from the tribal community is appointed to mentor primary school students. In community study centre, 30 students were accommodated with a facilitator and facilities such as computers, internet, LED TVs, furniture and reading materials are provided. To protect the orphans
among Scheduled Tribes, special assistance of ₹1000 per month is given to the caretakers. Lumpsum grants, stipends, scholarships, boarding charges, and tuition fees for students in self-financing colleges are also provided. Under ‘Ayyankali Memorial Talent Search Development Scheme’, 200 excellent students in 5th Standard are selected and assistance provided to them up to 10th standard.
Number of students availed pre matric and post matric assistance from 2014-15 to 2018-19 is shown in Figure 8.2.3.
An amount of ₹196.06 crore was provided to Scheduled Tribes Development Department for the education sector as a whole in 2018-19. Of this, ₹159.03 crore (81 per cent) was spent. In 2019-20; ₹179.39 crore was allotted and ₹58.80 crore was spent upto September 30, 2019. (Appendix 8.2.19, 8.2.20, 8.2.21 and 8.2.22)
Housing
Under the housing scheme, construction of new houses for homeless with land, and housing complexes for the homeless without land are undertaken through LIFE Mission. Apart from the State Plan support, housing scheme also makes use of the assistance from Kerala Urban and Rural Development Finance Corporation Ltd. (KURDFC)
Box 8.2.6 Major physical achievements in the education sector in 2018-19
• Appointed 241 teachers from tribal communities in Wayanad District and 26 in Attappady to mentor primary school students under Gothrabandhu scheme.
• Started 150 community study centres in 11 districts. • Financial assistance provided to 624 orphans.• 435 students obtained assistance to purchase laptop computers.• Entrance coaching provided to 177 students. • The pre-matric scholarship was received by 12,121 students and 16,245 students obtained post-
matric scholarships.• Assistance was given to 1200 students under Ayyankali Memorial Talent Search Development
scheme.• The special incentive was obtained by 880 brilliant students.• Lumpsum grant was provided to 87,292 students, 79,631 students availed stipend, and 6,769
students availed pocket money.
Source: Scheduled Tribe Development department

361Chapter 8, Initiatives For Social Inclusion
by availing loan from Housing and Urban Development Corporation Limited (HUDCO). The provisions allocated by the local governments from their Tribal Sub Plan funds are also used.
Of the 12,256 houses undertaken for the Scheduled Tribe families through LIFE Mission, 5,454 houses were completed in 2017-18 and 4,101 houses were completed in 2018-19. In 2018-19; 100 per cent of fund allocated was utilised under the housing scheme. Outlay and expenditure of housing scheme and number of houses constructed from 2014-15 to 2019-
20 is given in Appendix 8.2.23 and Appendix 8.2.24 and financial achievements are shown in Figure 8.2.4.
Health
The major health care schemes implemented for the welfare of the people of Scheduled Tribes include Comprehensive Tribal Health Care, assistance for sickle cell anaemia patients, Janani Janma Raksha, and financial assistance to Tribal healers. There are 4 midwifery centres, 16 mobile medical units, 17 Ayurveda dispensary,
Figure 8.2.3 Number of Students assisted under pre-metric and post-metric studies from 2014-15 to 2018-19
Source: Scheduled Tribe Development Department
Figure 8.2.4 Outlay and expenditure of housing scheme from 2014-15 to 2018-19,₹ in crore
Source: Scheduled Tribe Development Department

362 Economic Review 2019, Kerala State Planning Board
one Ayurveda hospital and 5 Out Patient (OP) clinics functioning under Scheduled Tribe Development Department. Comprehensive Tribal Health Care programme is a major scheme and it is implemented through hospitals and health care institutions. Provision of Tribal Relief Fund for persons affected by various diseases and natural calamity, health education programmes, de-addiction campaigns in selected tribal hamlets, and nutrition rehabilitation campaigns are also part of comprehensive tribal health care programme. Assistance from the Distress Relief fund was received by 30,500 beneficiaries. Assistance provided to the sickle cell anaemia patients was enhanced from ₹2000 to ₹2500 in 2018-19, and 744 patients received assistance.
In 2018-19, Scheduled Tribe Development Department launched a new programme – tribal paramedics – where persons trained in general nursing and midwifery courses were appointed in Scheduled Tribe colonies to create health awareness and to provide health service. For addressing the nutritional issues of mother and child, the department implements the scheme namely ‘Janani Janma Raksha’. Under this scheme, ₹1000 per month is given to the mother from the third month of pregnancy to the month when the child attains one year. Assistance under the scheme was enhanced from ₹1000 to ₹2000 and assistance was received by 11,880 beneficiaries. Financial assistance was also provided to traditional tribal healers at ₹10,000 per person to 280 tribal healers. In 2018-19, out of the budgeted amount of ₹42.81 crore, ₹42.39 crore (99.03 per cent) was spent on programmes under the health sector. In 2019-20, 45.37 per cent expenditure was incurred upto September 30, 2019. Details of Health Programme from 2014-15 to 2019-20 is shown in Appendix 8.2.25.
Socio-Economic Programmes
Habitat development schemes are implemented for improving housing facilities, connectivity, protection from wild animals, providing social infrastructure, and marketing arrangements. To improve the socio-economic status of
Scheduled Tribes, Scheduled Tribe Development Department implemented ‘Ambedkar Settlement Development scheme’ which includes provision of infrastructure facilities, economic activities, additional wage employment under MGNREGS, nutritious food and other basic facilities to women and children, spillover works under the Ambedkar settlement development scheme, hamlet development scheme, and P K Kalan family benefit scheme. Under P K Kalan family benefit scheme, 74 scattered families were provided assistance in terms of housing, infrastructure and livelihood in 2018-19. The scheme, “Resettlement of Landless Tribal People (TRDM)” provides land to landless, infrastructure facilities such as housing, drinking water, roads, electricity, construction of the compound wall along the forest boundary to protect the life and property of resettled families, self-employment programmes, and provision of health care. Through this scheme, 15.42 acres land was distributed to 26 families. District-wise details of land distributed from 2014-15 to 2018-19 are given in Appendix 8.2.26.
The scheme named “Additional wage employment under MGNREGS” ensures 200 workdays of employment to the people of the Schedules Tribe community every year. Additional wage employment under MGNREGS was provided to 23,096 Scheduled Tribe families. Under the “Special Programme for Adiyas, Paniyas, Particularly vulnerable tribal group, and Tribes living in forest” re-habilitation packages, health, food support, economic development, employment to Scheduled Tribe population living in or near the forest areas, and destitute homes are included. Social workers are engaged in tribal welfare sector as facilitators and they render services such as counselling, arranging conferences, increasing resources, conducting awareness camps against the consumption of drugs, alcohol, tobacco and other social evils. Department provides training in hospitality, management, IT-related subjects, industrial and technical topics, and motor driving to higher secondary and graduate students, along with career development and orientation classes. In
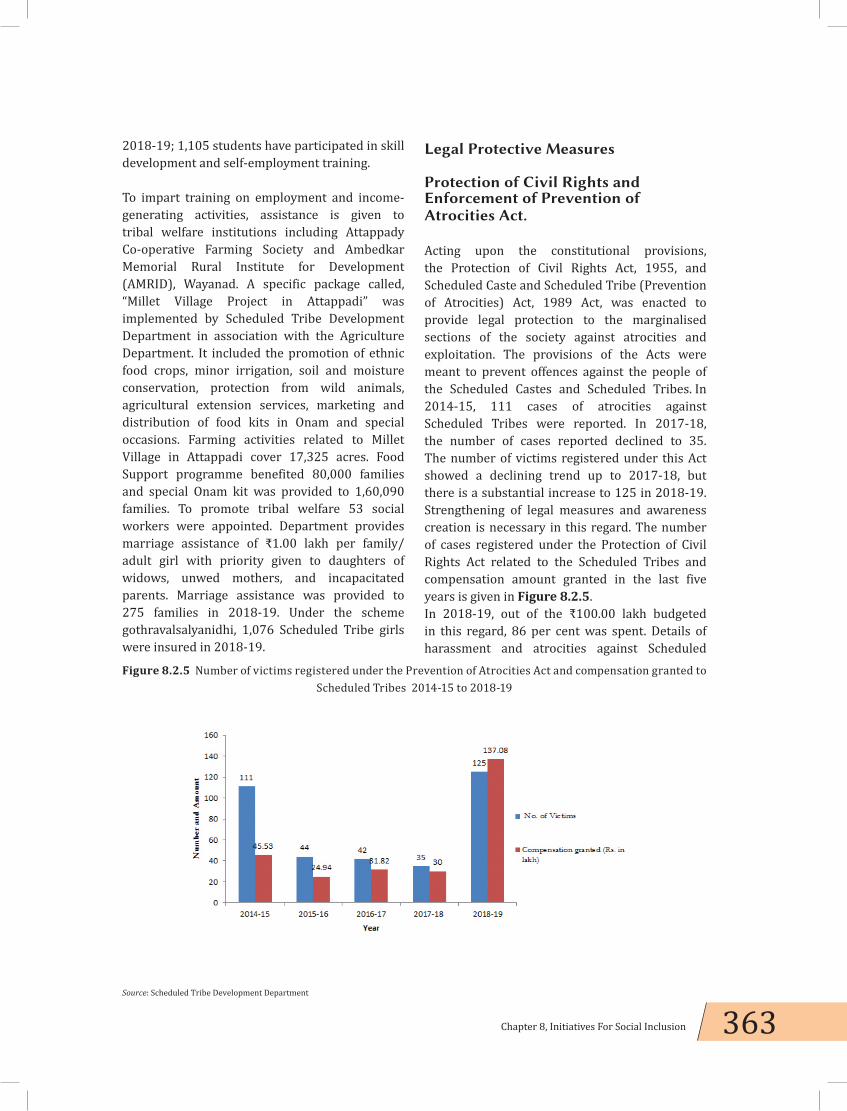
363Chapter 8, Initiatives For Social Inclusion
2018-19; 1,105 students have participated in skill development and self-employment training.
To impart training on employment and income-generating activities, assistance is given to tribal welfare institutions including Attappady Co-operative Farming Society and Ambedkar Memorial Rural Institute for Development (AMRID), Wayanad. A specific package called, “Millet Village Project in Attappadi” was implemented by Scheduled Tribe Development Department in association with the Agriculture Department. It included the promotion of ethnic food crops, minor irrigation, soil and moisture conservation, protection from wild animals, agricultural extension services, marketing and distribution of food kits in Onam and special occasions. Farming activities related to Millet Village in Attappadi cover 17,325 acres. Food Support programme benefited 80,000 families and special Onam kit was provided to 1,60,090 families. To promote tribal welfare 53 social workers were appointed. Department provides marriage assistance of ₹1.00 lakh per family/adult girl with priority given to daughters of widows, unwed mothers, and incapacitated parents. Marriage assistance was provided to 275 families in 2018-19. Under the scheme gothravalsalyanidhi, 1,076 Scheduled Tribe girls were insured in 2018-19.
Legal Protective Measures
Protection of Civil Rights and Enforcement of Prevention of Atrocities Act.
Acting upon the constitutional provisions, the Protection of Civil Rights Act, 1955, and Scheduled Caste and Scheduled Tribe (Prevention of Atrocities) Act, 1989 Act, was enacted to provide legal protection to the marginalised sections of the society against atrocities and exploitation. The provisions of the Acts were meant to prevent offences against the people of the Scheduled Castes and Scheduled Tribes. In 2014-15, 111 cases of atrocities against Scheduled Tribes were reported. In 2017-18, the number of cases reported declined to 35. The number of victims registered under this Act showed a declining trend up to 2017-18, but there is a substantial increase to 125 in 2018-19. Strengthening of legal measures and awareness creation is necessary in this regard. The number of cases registered under the Protection of Civil Rights Act related to the Scheduled Tribes and compensation amount granted in the last five years is given in Figure 8.2.5.In 2018-19, out of the ₹100.00 lakh budgeted in this regard, 86 per cent was spent. Details of harassment and atrocities against Scheduled
Figure 8.2.5 Number of victims registered under the Prevention of Atrocities Act and compensation granted to Scheduled Tribes 2014-15 to 2018-19
Source: Scheduled Tribe Development Department

364 Economic Review 2019, Kerala State Planning Board
Tribes in Kerala from 2014-15 to 2019-20 are given in Appendix 8.2.27.
Corpus Fund
An amount of ₹45.00 crore was provided in 2018-19 for undertaking various development activities as a corpus fund and the amount spent during the period was ₹40.54 crore (90 per cent). In 2019-20, ₹58.00 crore was allotted and 20.86 per cent of expenditure incurred upto September 30, 2019. The components of the corpus fund include self-employment, skill development, water supply and sanitation, communication facilities, footbridges, technology transfer, improvement of education, and health care. Outlay and expenditure under Corpus fund from 2014-15 to 2019-20 (up to September 30, 2019) is given in Appendix 8.2.28, and District-wise details of 2018-19 and 2019-20 are given in Appendix 8.2.29.
Special Central Assistance to Tribal Sub Plan (SCA to TSP)
The Special Central Assistance to Tribal Sub Plan is released by Government of India in addition to State Plan funds and is meant for undertaking programmes of education, health, and employment cum income generation activities beneficial to Scheduled Tribes families. The outlay and expenditure under SCA to TSP from 2014-15 to 2019-20 (up to September 30, 2019) is given in Appendix 8.2.30.
Kerala Institute for Research Training and Development Studies for Scheduled Caste and Scheduled Tribe (KIRTADS)
The institute was established in 1970 as Tribal Research and Training Centre (TR and TC). It has been later named as the Kerala Institute for Research Training and Development Studies for Scheduled Caste and Scheduled Tribe (KIRTADS). The institute conducts research and study on Scheduled Caste and Scheduled Tribe populations of the State.
Anthropological investigation in case of doubts regarding the social status of communities as and when requested by the Scheduled Caste Development Department, Scheduled Tribe Development Department, Revenue Divisional Officers, Tahsildars, and District Collectors were also been undertaken by the institution. In 2018-19; 923 cases regarding Scheduled Caste status and 249 cases regarding Scheduled Tribe status were filed. Of these, 801 cases regarding Scheduled Castes and 234 cases regarding Scheduled Tribes were settled. In 2019-20; 722 Scheduled Caste related and 185 Scheduled Tribe related cases were filed so far. Details are given in Appendix 8.2.31.
The training wing of KIRTADS coordinates and conducts a large number of programmes to promote Tribal Development. This wing also conducts orientation programmes, capacity building programmes, empowerment programmes, and educational programmes. The institute also undertakes Adikalagramam programme which includes traditional dance and music of the Scheduled Caste and Scheduled Tribe communities of the State. The scheme-wise outlay and expenditure of KIRTADS is given in Appendix 8.2.32.
Kerala State Development Corporation for Scheduled Castes and Scheduled Tribes
The Kerala State Development Corporation for Scheduled Castes and Scheduled Tribes Limited implements various income-generating and other welfare programmes designed to suit the needs and aspirations of entrepreneurs from Scheduled Caste and Scheduled Tribe communities. The schemes being implemented by the Corporation can be broadly grouped as sole lending scheme, schemes implemented in association with the National Scheduled Caste Finance and Development Corporation (NSFDC), and schemes implemented by National Scheduled Tribes Finance and Development Corporation (NSTFDC).

365Chapter 8, Initiatives For Social Inclusion
Income-generating activities of the Corporation includes multipurpose unit loan, transport scheme, loan to start-up entrepreneurs, loan to the rehabilitation of returning emigrants, foreign employment loan, micro-credit finance loan, laghuvyavasaya loan, women empowerment programme, Mahilasamridhi Yojana, and loan for animal husbandry. In 2018-19, Corporation disbursed an amount of ₹2967.17 lakh to 5,486 Scheduled Caste and 336 Scheduled Tribe beneficiaries for income-generating schemes. In 2019-20, assistance has been given to 1,895 Scheduled Caste and 133 Scheduled Tribe beneficiaries upto September 30, 2019. Scheme-wise details of physical and financial achievements of the Corporation are given in Appendix 8.2.33.
Welfare of Other Backward Classes
Guided by the Article 340 of the Indian Constitution and the recommendations of Mandal Commission Report, State Government started a separate department – Backward Communities Development Department – in November 2011 to look after the welfare of socially and educationally backward classes of the society. The department implements various schemes, including educational schemes for Other Backward Classes (OBCs) as well as Other Eligible Communities students.
To restore the livelihood of backward classes due to deluge, two new components were introduced in 2019-20. One is the skill and semi-skill development and income generation for people in flood-affected areas, and the other is assistance for livelihood and restoration of traditional working-class communities in flood-affected areas were introduced in the year 2019-20 with an outlay of ₹1.5 crore. OBC educational schemes include post-matric scholarship and pre-matric scholarship. In 2018-19, a total of 1,20,466 OBC students benefited from post-matric scholarship and 1,79,850 students received pre-matric scholarship. Through the OEC educational assistance scheme, 2,24,430 students benefited from post-matric assistance and 2,76,328
students received pre-matric assistance. Other social welfare schemes include employability enhancement programme, overseas scholarship scheme, job training in the automobile industry, assistance to traditional occupations, and construction of hostels. To protect the traditional occupations, a scheme named ‘Renovation of traditional Barbershop’ was initiated from 2016-17 onwards to bring traditional barbers into the modern scenario. In 2018-19; 752 persons benefited from the scheme. Through the scheme, ‘Skill Development Training and Toolkit Grant for traditional Craftsmen’, 2,484 persons got the training and received toolkit.
In 2018-19, Backward Classes Department spent ₹304.26 crore against the Budget provision of ₹172.70 crore. A total amount of ₹158.90 crore was allocated to the Backward Classes Development Department in 2019-20. Of which, ₹92.40 crore was allocated by State Government (including State share of Centrally Sponsored Schemes) and remaining amount of ₹66.50 crore is anticipated from the Central Government. The expenditure incurred up to September 30, 2019, is ₹62.70 crore (39.46 per cent). Scheme-wise outlay, expenditure, and the physical achievements of the department in 2018-19 and 2019-20 (up to September 30, 2019) are given in Appendix 8.2.34 and 8.2.35.
Kerala State Backward Classes Development Corporation (KSBCDC)
Kerala State Backward Classes Development Corporation (KSBCDC) act as the major State-level channelising agency of national financial agencies. The Corporation provides financial assistance at a lower rate of interest to the members of Backward Communities living below poverty line. KSBCDC also utilises the State Government assistance and its own fund reserves to implement various welfare schemes and provides assistance such as marriage assistance, vidhyasree loan, foreign employment loan, and suvarnasree loan. The Corporation has disbursed loan worth ₹475.52 crore in 2018-19 benefiting 46,719 persons, of which 37,445 are women

366 Economic Review 2019, Kerala State Planning Board
(80.15 per cent). As on September 30, 2019, an amount of ₹202.75 crore was distributed among 12,054 persons in 2019-20.
The source-wise expenditure and the physical achievements of the Corporation in 2018-19 and 2019-20 (up to September 30, 2019) are given in Appendix 8.2.36.
Kerala State Development Corporation for Christian Converts from Scheduled Caste and the Recommended Communities
Kerala State Development Corporation for Christian converts from Scheduled Caste and the Recommended Communities was incorporated in 1980 under the Indian Companies Act 1956. The main objective of the Corporation is to promote the social, educational, cultural, and economic upliftment of the Christians converts from Scheduled Castes and the Recommended Communities in a comprehensive manner for ameliorating their living conditions. The source of finance for the Corporation is the share capital, assistance and grants sanctioned by the Government of Kerala on an annual basis, and the loan assistance from NBCFDC. Major schemes implemented by the Corporation include agricultural land purchase, self-employment, housing, cash incentive to students, marriage loan, agriculture and allied sector assistance, and small business and educational loan. Details of year-wise disbursement of State Government-assisted loan schemes from 2013-14 to 2019-20 (as on September 30, 2019) are given in Appendix 8.2.37. The scheme-wise details of physical and financial achievements of the Corporation are given in Appendix 8.2.38.
Welfare of Minorities
According to the Census figures over a period of ten years from 2001 to 2011, the percentage of the minority population in Kerala increased from 43.84 per cent to 44.99 per cent. According to the National Minority Commission Act 1992, Muslims, Christians, Buddhist, Sikh, Parsi were
included in the list of religious minorities, and the Jain community was also included in 2014. Minority Welfare Department was formed in the State in 2012 to address the social and economic backwardness of minority communities, and to implement Justice Rajindar Sachar Committee and Paloli Muhammed Kutty Committee Reports. The major schemes implemented by the Minorities Welfare Department are educational assistance, drinking water scheme, housing scheme for divorcees, widows, and abandoned women from the minority communities, pre-marital counselling centres, and Minority Research Institute for the welfare of the minorities.
An amount of ₹73.46 crore (69.46 per cent) was spent from the Budget provision of ₹105.75 crore including Central assistance in 2018-19. A total amount of ₹63.75 crore was allocated by the State Government for the welfare of minorities in 2019-20 of which ₹10.00 crore is the State share of Centrally Sponsored Schemes. An amount of ₹15.00 crore is anticipated as 60 per cent Centrally Sponsored Schemes in 2019-20 with respect to Pradhan Manthri Jan Vikas Kariakram. Scheme-wise outlay and expenditure and the physical achievements of the department in 2018-19 and 2019-20 (upto September 30, 2019) are given in Appendix 8.2.39 and 8.2.40.
Kerala State Minorities Development Finance Corporation Limited
The Kerala State Minorities Development Finance Corporation is a fully owned Government company incorporated on March 22, 2013, with an intention of looking into the welfare of minority communities such as Muslim, Christian, Buddhists, Jains and Sikhs. The main schemes implemented by the Corporation are self-employment loan, business development loan, education loan, visa loan, Pravasi loan, employees multi-purpose loan and housing loan for madrassa teachers and others. The State Government has so far allotted ₹56.93 crore towards share capital of the Corporation. The corporation received ₹57.05 crore from National

367Chapter 8, Initiatives For Social Inclusion
Minorities Development Finance Corporation as financial assistance for implementing their various loans and schemes.
An amount of ₹15.00 crore has been provided as share capital contribution to the Corporation in 2018-19. The financial and physical achievements of the Corporation are given in Appendix 8.2.41.
Welfare of Forward Communities
According to the Census of 2011, “forward communities” include 168 communities, of which 19 communities are Christians. The Government of Kerala constituted the “Kerala State Welfare Corporation for Forward Communities Limited” on November 8, 2012, to serve the income poor sections among the forward communities.
The major activities supported by the Corporation are scholarships, coaching assistance, term loan assistance, skills and entrepreneurship development, and renovation of dilapidated agrahara and houses. Corporation provides financial assistance for marriage of economically weaker sections among the forward communities. In 2018-19, an amount of ₹12.60 crore (30 per cent) was spent out of the Budget provision of ₹42.00 crore. An amount of ₹42.00 crore was allocated to Corporation in the year 2019-20 for various programmes. The scheme-wise outlay and expenditure and the physical achievements of the Corporation in 2018-19 and 2019-20 (up to September 30, 2019) are given in Appendix 8.2.42.
Way Forward
Article 46 of the Constitution of India states that, ‘the State shall promote with special care the educational and economic interests of the weaker sections of the people, and, in particular, of the Scheduled Castes and the Scheduled Tribes, and shall protect them from social injustice and all forms of exploitation’. The goal is to create a society in which everyone enjoys social and economic empowerment, and can lead a life of dignity. Although untouchability has been
abolished by law, caste-based discrimination in social, religious, economic, and political spheres against the Scheduled Castes and Scheduled Tribes persist. Awareness should be created among the population of the State regarding the goals of the Constitution, and the values of social reform movement in Kerala. Measures should be undertaken to spread awareness among the Scheduled Caste and Scheduled Tribe population about the various schemes implemented by the Government of India, Government of Kerala, and local government bodies for the welfare of the people of the Scheduled Castes and Scheduled Tribes. Education, health care, credit facilities, and job oriented training, should be made available to the people of Scheduled Caste and Scheduled Tribe communities. Strict monitoring mechanisms should be framed and put in place to ensure that the benefits of welfare schemes reach the people of the Scheduled Castes and Scheduled Tribes. Through such steps, the socio-economic conditions of the disadvantaged and marginalised sections of society can be improved and it will significantly empower sections of the people who have historically been the victims of social oppression.
368 Economic Review 2019, Kerala State Planning Board
8.3 Social Security Measures
Social security is a human right and is defined as the set of policies and programmes designed to reduce and prevent poverty and vulnerability throughout the life cycle. It plays a key role in achieving sustainable development and promoting social justice. The policies for social security are vital elements of national development strategies to reduce poverty and vulnerability across the life cycle and support inclusive and sustainable growth by raising household incomes, fostering productivity and human development, boosting domestic demand, facilitating structural transformation of the economy and promoting decent work. Touching the lives of all for ensuring their wellbeing is the basic rule of good governance and development. Targeted interventions are required for the upliftment of people in any disadvantaged position. With growing evidence of increasing income/asset inequalities across the world, the need for public provisioning of basic goods and services assumes critical significance. According to ILO report 2017-19, nations should provide for a social protection floor to all its citizens, from birth to old age, in need, complemented by contributory social insurance schemes that provide increased levels of protection.
Social security measures aim to support and empower its target groups through programmes of educational, economic and social development, and rehabilitation wherever necessary. The two aspects of social security are a) “protection” denoting protection against a fall in living
standards due to lack of work, ill health, accidents and b) “promotion” focusing on enhanced living conditions, helping people to overcome persistent disabilities because of deprivation.
It is important to ensure comprehensive coverage, identify the need for new interventions if there are critical gaps in coverage, avoid duplications and overlapping in Government schemes to achieve the targets of Sustainable Development Goals (SDGs).
Kerala has been acclaimed for its several achievements in providing social security measures for vulnerable groups like persons with disabilities, aged people or senior citizens, women and children in difficult circumstances. In Kerala, the Departments of Social Justice, and Women and Child and its allied agencies are involved in providing social security. The departments and agencies envision a caring and equitable society and their major activities are enumerated in Appendix 8.3.1.
Categorisation of Social Security Programmes in Kerala
The social security programmes in Kerala can be categorised into two: A. Institutional Care and B. Social Assistance Programmes.
A. Institutional Care
In the State, Government, as well as NGOs and other voluntary organisations, provide

369Chapter 8, Initiatives For Social Inclusion
institutional care to the disadvantaged sections of the population. The Social Justice Department (SJD) is the nodal department for the implementation of social security schemes in the State. In 2017-18, in order to give meaningful thrust to the activities aimed at welfare and empowerment of women and children, a separate department of Women and Child Development (WCD) was formed by bifurcating the SJD. This department acts as a nodal agency for matters pertaining to women and children and implements State and Central schemes. SJD addresses the needs of people with disabilities, senior citizens and transgenders. There are 29 welfare institutions and 2 vocational training centres under the aegis of SJD for the care, protection and rehabilitation of disabled and senior citizens. Of which, 16 are for senior citizens and 15 for disabled. There are 44 welfare institutions functioning under the WCD for the care, protection and rehabilitation of children and women. Out of this, 28 institutions are for children and 16 for women. Through institutional care and support, SJD and WCD have provided rehabilitation services to more than 2100 persons in different categories and more than 52,000 persons are benefited every year through the registered institutional support. However, the number of occupants is less compared to the sanctioned strength of inmates for certain categories of institutions. As against the total sanctioned strength of 91,042 inmates in the registered welfare institutions, the occupants were 52,559 in 2018-19. This is about 58 per cent of the total sanctioned strength of inmates. Among the welfare institutions under the departments, the number of inmates is higher than sanctioned strength in Old Age Home, AshaBhavan, PratheekshaBhavan and PrathyasaBhavan, Vocational Training Centre and After Care Home for Adolescents, Nirbhaya shelter homes (renamed as Women and Children Homes) but much less in foundling homes (homes for abandoned children). However, it is a major concern that the State does not have adequate care institutions/assisted living homes for children with intellectual disabilities (Autism, Cerebral Palsy, Multiple Disabilities and Mental
Retardation)except one in Kozhikode. All these necessitate an integrated policy framework and careful planning for establishing new institutions different from those in the past. The District-wise coverage of beneficiaries in major welfare institutions run by SJD and WCD is given in Appendix 8.3.2 and that of registered welfare institutions in Appendix 8.3.3.
B. Social Assistance Programmes
Social assistance programmes aim to reduce poverty and vulnerability among the people having little or no regular means of subsistence. Various social assistance programmes are listed below. Details on welfare of senior citizens are given in Chapter 6 of this Review.
Social Security Pension Schemes through Local Governments
The major pension schemes implemented by the State Government are pension for the aged, pension for persons with disabilities, pension for the widowed, pension for unmarried women above 50 years and pension for agriculture workers, of which old-age pension, disability pension and widow pension are getting central assistance also. From April 2015, the disbursement of pensions is being done at the State level through the newly introduced Direct Benefit Transfer (DBT) system. As on September, 2019, there are 46.85 lakh pensioners in the State. The highest number of pensioners are recipients of old-age pension (51.44 per cent) followed by those with widow pension (28.50 per cent) (Figure 8.3.1).
Among the Districts, Thiruvananthapuram is on top with highest number of beneficiaries and Wayanad has the least number of beneficiaries. The District-wise coverage is given in Appendix 8.3.4.
Welfare of Persons with Disabilities (PwDs)
Differently-Abled is often described in terms of lack of normal functioning of physical, mental

370 Economic Review 2019, Kerala State Planning Board
or psychological processes. It is also defined as learning difficulties or difficulties in adjusting socially, which interfaces with a person’s normal growth and development. Such persons also face difficulty in obtaining access to good quality basic and higher education. In the words of Prof. Stephen Hawking, “People with disabilities are vulnerable because of the many barriers we face: attitudinal, physical, and financial. Addressing these barriers is within our reach and we have a moral duty to do so... But most important, addressing these barriers will unlock the potential of so many people with so much to contribute to the world.”
As being discussed globally, overcoming disability should no more be viewed merely from the welfare prism but recognised as a human rights and development issue. From being passive beneficiaries of doles, the disabled have to be considered as citizens who can be equal stakeholders in development. The State accepts a rights-based comprehensive life cycle approach to the services for persons with disabilities which has been given due importance in the 13th Five-Year Plan. The scheme is ANUYATHRA along with other interventions, formerly known as State Initiative on Disabilities. This includes prevention initiatives, early screening, early intervention through District Early Intervention Centres (DEICs) and other health and social sector institutions, education support through special anganwadis, Buds Schools, Model Child
Rehabilitation Centres, Special Schools, inclusive education and vocational training, Community based rehabilitation and assisted living projects among others. While schools admit students with disabilities, appropriate mechanisms have to be put in place to make them inclusive. Teachers, in general, need to be sensitised to the needs of such students. Special education training needs to be more practice-based like nursing training attached to hospitals. Special attention should be given to cognitive disability. Diversity in cognitive disability should be emphasised. Individual care Plan formulation and follow up shall be another major initiative. This requires convergence of services, resources and institutions.
In Kerala, a Statewide Census of PwDs was undertaken by the Kerala Social Security Mission in 2015, the first of its kind in India, covering 22 types of disabilities. As per the survey, 7.94 lakh people equivalent to 2.32 per cent of the total population of the State are disabled, of whom, females constitute 44.57 per cent, Transgender persons 0.15 per cent, Scheduled Castes 10.93 per cent and Scheduled Tribes 2.15 per cent. The highest number of disabled persons is in Malappuram District (12.15 per cent) followed by Kozhikode (9.89 per cent) and the lowest in Wayanad District (2.91 per cent). Regarding type of disabilities, locomotor disability stands at the top with 32.89 per cent and multiple disabilities are second (17.31per cent).
Figure 8.3.1 Pensioners in the State
Source: Information Kerala Mission, Sevana Pension
371Chapter 8, Initiatives For Social Inclusion
State Policy for Persons with Disabilities
GoK enacted a policy for PwDs in the year 2015 recognising the necessity and inevitability of including disability dimensions in the development agenda, programmes and action plans of the State. Participation of PwDs in the developmental process, viewing disability as a human rights issue, protection from abuse and creating a positive environment and attitude for inclusive development and empowerment of PwDs are the key strategic focal dimensions of the policy. From being passive beneficiaries, the disabled have to be considered as equal stakeholders and contributors to development.
Institutions for Empowering Persons with Disabilities
National Institute of Speech and Hearing (NISH)
NISH is a premier institute in the area of disability for Disability Studies and Rehabilitation Sciences to provide an excellent environment for pursuit of higher studies for people with disabilities. The programmes of the NISH include early intervention programme and extension services, hearing and speech-language disorders programme, medical, psychology and allied services, academic programmes, training and industry placement and volunteering and Internship opportunity etc. From April 2018 to March 2019, NISH has attended to 177 students
under early intervention programmes, 13849 cases seen/sessions given under hearing and speech-language disorders programme and 3902 cases under medical, psychology and allied services. The academic programmes conducted by NISH benefited 310 students. The training and industry placement benefited 29 persons and the volunteering and internship opportunity benefited 2 persons. NISH also has facilitators trained to cater to the needs of the hearing impaired whose services are provided for meetings/conferences/functions as required.
Kerala State Handicapped Persons Welfare Corporation
The Corporation provides economic empowerment and rehabilitation to persons with disabilities. In 2018-19, the Corporation received the award for Best Channelising Agency of National Handicapped Finance and Development Corporation and also incentive for higher turnover. The Corporation supplied equipments like tricycle, wheelchair, and hearing aid to 1898 differently-abled persons. Also, the Corporation distributed loans to 213 disabled persons for self-employment from the funding provided by National Handicapped Finance and Development Corporation. In addition, the Corporation itself distributed bank loan subsidy to 54 differently-abled persons across the State for self-employment. The Corporation also assisted 500 children through the fixed deposit scheme of ₹20,000 for severely disabled children.
Box 8.3.1 National Award-2019 for the empowerment of persons with disabilities
National awards for empowerment of persons with disabilities were instituted to focus on issues concerning persons with disabilities and to promote their mainstreaming in society. These awards are conferred on outstanding persons with disabilities, individuals and institutions that are working for the empowerment of persons with disabilities. On December 3, 2019, International Day of Disabilities, five awards of the Ministry of Social Justice and Empowerment have been awarded to Kerala State for the Best State in Promoting Empowerment of Persons with Disabilities and awards for the best performance in empowerment were given to the Special Secretary, Social Justice and Women and Child Department. The other winners are Kum. S. Kanmani, Smt. Baby Girija, Sri. BalanPutheri, and Sri. C. Prashanth.
Source: Source: Social Justice Directorate
372 Economic Review 2019, Kerala State Planning Board
State Commissionerate for Persons with Disabilities
The State Commissionerate was set up as per the Persons with Disabilities Act (PwD Act) enacted by the GoI in 1995. Co-ordinating the programmes implemented by different departments and monitoring the utilisation of funds for the benefit of the disabled in the State are the functions of the Commissionerate. The other functions of the Commissionerate are conducting awareness camps, redressal of the complaints of disabled persons, and inspection of institutions for disabled. Awareness seminars conducted for District officers, LSGI secretaries, Special school teachers, LSGI Chairpersons, Advocates, Doctors, Media persons of Alappuzha and Ernakulam Districts. This reduced the petitions receiving in the directorate from 80 to 20 per day. Amma care envisages to make the pregnant mothers aware, for early identification of the disabilities of the children and measures to prevent disabilities. The matter is being discussed with the various departments. As part of the programme ‘Amma – Teacher’, training conducted for parents of disabled children regarding the care of disabled children, to identify their abilities and to promote them.
National Institute of Physical Medicine and Rehabilitation (NIPMR)
NIPMR is an institute under SJD dedicated to the assessment and therapy of children and adults with multiple disabilities especially cerebral palsy and other associated disorders. An average of 20 clients mostly children are attending the speech therapy sessions under the Audiology and Speech-Language Pathology department. The persons affected with stroke, accidents etc. are also to be treated with available facilities in NIPMR. Modernisation of prosthetic and orthopaedic department is being done and mobile intervention unit has started functioning. A comprehensive plan made on basis of evaluation, goals are set according to function level and achievement plan is made by the rehabilitation team. A program plan is also made
for home-based training and demonstrations are given to parents for carrying out the skill training or therapy program for home management. Institute for Cognitive and Communicative Disorders and Neuro Sciences (ICCONS) and Child Development Centre are the other major institutions working in this area. The particulars of these institutions are given in the section on Health of this Review.
Programmes for Persons with Disabilities
The schemes for the welfare of persons with disabilities are being implemented through Social Justice, Health and Education Departments. The schemes implemented through SJD and KSSM are listed below.
Welfare Schemes implemented for Persons with Disabilities in the State
During the 13th Five-Year Plan, new components were introduced in some of the existing Plan schemes. The new components include Pariraksha (scheme for providing emergency assistance to PwDs) which assisted 28 differently-abled persons and Vidyajyothi project (providing financial assistance for uniforms and study materials to PH) which assisted 1166 differently-abled students, Vidyakiranam project (scholarships for the students of disabled parents), which benefitted 3957 children, Swasraya(scheme for self-employment for the parents of PH/MR persons), which benefitted 243 persons, and Vijayamrutham(scheme to provide assistance to PwD students who have passed with high marks in Graduate/PG/Professional courses from Government/Aided institutions). As part of promoting Inclusive Education, a new scheme for honouring the NSS and NCC units of schools that supports PwD children named “Sahachari” was designed. A comprehensive project named “Athijeevanam” was designed for the rehabilitation of PwDs through vocational training and daycare centres through Government and NGO run institutions. Financial assistance was given to 9 differently-
373Chapter 8, Initiatives For Social Inclusion
abled for distance education. Assistance is given to 94 differently-abled to write equivalency exam. Under Parinayam scheme, marriage assistance is given to 736 beneficiaries. Medical assistance given to 889 differently-abled from the distress relief fund. In 2019-20, fund has been given to Kollam, Pathanamthitta, Alappuzha, Kottayam, Ernakulam, Thrissur, Kozhikkode and Palakkad to implement the Barrier Free scheme. Right of Persons with Disabilities (RPWD) Act 2016 came into force and State Rules were published in the Gazette and Department website for remarks of public.
Issuing Disability Certificate to Differently Abled
According to the 2015 Disability Survey, total number of disabled in Kerala is 7.9 lakh. According to the Persons with Disability Act, 1995 it is mandatory to provide disability certificate to all the disabled. From 2009 to March 2015, Kerala Social Security Mission distributed 3,49,864 identity cards through 1,875 disability certification camps across the State. In 2018-19, Mission distributed 16,245 identity cards through 117 disability certification camps. The impact of such camps is that it reduces the difficulties faced by PwDs to travel to distant places for getting medical certificates.
Aswasakiranam Scheme
The scheme is implemented to provide monthly assistance to caregivers of the following categories of patients like 100 per cent blind, bedridden patients suffering from cancer, cerebral palsy, autism, mental illness, mental retardation and bedridden due to old age, who need a full-time caregiver. The number of beneficiaries in 2018-19 was 120301.
State Initiative on Disabilities (SID)
This is a special initiative of the Government for prevention, detection, early intervention, education, employment and rehabilitation of the persons with disabilities through Social
Justice Department with the joint support of Education and Health Departments. The major achievements are:
• MMR Vaccination: MMR vaccination was started to prevent disabilities due to infection of Mumps, Measles and Rubella and given free of cost to new-borns from January 2014 onwards. In 2018-19, 4.17 lakh doses of vaccines were supplied.
• Kathoram: A life cycle approach in hearing Disability Management with interventional approach at different months as detailed below.
• Universal Hearing Screening: Hearing screening of newborn babies has been established in 63 Government delivery points. 97per cent of the babies born in these hospitals are screened for hearing impairments. About 12000 neonates are screened every month.
• Confirmation of hearing disability by 3 months: For the advanced test for identifying hearing problem, BERA equipment in each District is installed in NPPCD centres at District/General hospitals, except Palakkad. 113 babies were tested in 2018-19.
• Support with Hearing Aids and Auditory Verbal Therapy at 6 months: Auditory Verbal Therapy will be done through all Government Medical Colleges, Major hospitals and institutions like NISH, NIPMER and hearing aids will be made available through existing national programmes for prevention and control of deafness or through KSHPWC and other agencies.
• Cochlear implant at 18 months: It is done in convergence with the existing Shruthitharangam scheme. Around 1200 cochlear implant surgery conducted at free of cost.
• Post implant habilitation therapy up to 42 months: This will be provided through
374 Economic Review 2019, Kerala State Planning Board
all Government Medical Colleges, major hospitals and institutions like NISH, NIPMR.
• Early Intervention Centres: Steps have been taken for establishing full-fledged permanent DEICs with all modern facilities in all Districts for ensuring early screening of disabilities and for providing appropriate services. The construction of DEIC is progressing in 9 Districts and it will act as a Disability hub in the District. 25 Mobile intervention Centres started functioning from August 2017 onwards. An average of 2500 to 3500 children are benefitted per month. Regional Early Intervention Centres are at medical college level and have been established in 5 medical colleges(Thiruvananthapuram, Alappuzha, Kottayam, Trissur and Kozhikkode Medical Colleges). About 5100 children with developmental delay and disabilities have been supported through the DEICs.
• Establishing of Special Anganwadies for Pre-school Children with Disabilities: For providing appropriate training and remedial therapy to pre-school children with disabilities, one anganwadi in every ICDS project is designated as special anganwadi. At present, the project is implemented in Kozhikkode District. 446 children are being supported.
• M Power Incubator: A permanent magic training and performance centre for intellectually challenged children at Magic Planet. The process of establishing a Different Art Centre in progress has now started functioning. Five children from M Power team perform magic at this centre and earning an income.
State Initiative on Dementia
The Department of Social Justice has started a daycare centre in Thrissur Municipality and a full-time centre at Edavanakkad old age home for the rehabilitation of dementia patients in the State.
Insight Project
The Insight programme was started in 2007 to explore ways in which information and communication technology (ICT) can be leveraged to address challenges faced by people with disabilities. The initial phase of the programme focused on visual impairment. In 2009, it was extended to include an experimental programme for children with cognitive challenges. The programme was funded by Kerala State IT Mission and conceived and executed by SPACE, a non-profit organisation. In 2013, the programme was handed over to Department of Social Welfare with the objective of scaling it up. The execution of ‘Insight Programme’ for the visually challenged was transferred to Kerala Federation of the Blind and SPACE continued the execution of Insight programme for cognitively challenged children. It harnesses a blend of new technologies and traditional systems to train the children. New technological tools and practices are being developed and experimented at SPACE. By supporting and strengthening the activities for knowledge transfer, the benefits of the programme can reach more people.
Transgenders (TGs)
Kerala is the first State to establish a policy for Transgenders in the country. The Disability census 2015-16 estimates that there are 4,267 Transgenders in the State. Many of them are reluctant to reveal their identity and hence this number is an underestimate. Transgenders face several issues in their day-to-day life activities. This group needs more attention for acceptance into society. As per the Disability Census conducted in Kerala in 2015-16, there are 1,187 disabled transgenders in Kerala. Various schemes were implemented in 2018-19 for the welfare of transgenders. Skill development training has been given to 90 Transgenders, 62 Transgenders have been provided self-employment assistance, Beautician training has been given to 45 Transgenders., Educational scholarship given to 14 Transgender students, 10 have been given financial assistance for hostel facilities, Financial

375Chapter 8, Initiatives For Social Inclusion
assistance given to 18 Transgenders for sex reassignment surgery (SRS), 19 Transgenders given financial assistance for aftercare SRS, 21 sewing machines given for livelihood, and 4 Transgenders were given training for driving. Department was able to provide scholarship assistance to three students and also conducted District level workshops for assessing the livelihood training required and other matters relating to mainstreaming of transgenders. The scheme for transgenders in 2019-20 includes the components enumerated in Box 8.3.2.
Welfare of Women
The Department for Women and Children was carved out of the Social Justice Department for the welfare of women and children in 2017-18. This department implements all the activities related to the welfare and empowerment of
women and children in the State. In the State, Government, as well as NGOs and voluntary organisations, provide institutional care to the women and children of the population. The programmes seek to empower women and enable them to contribute as equal partners in development in an environment free from violence and discrimination, mainstream gender concerns, create awareness about their rights and facilitate institutional and legislative support for enabling them to realise their human rights and develop to their full potential.
Women constitute 52 per cent of State population and the overall sex ratio of Kerala is 1,084 females per 1,000 males. Female literacy rate is 92 per cent which is highest in India. Maternal mortality rate was much lower in Kerala when compared to the situation in India. The present status of women in Kerala is given in the section
Box 8.3.2 Scheme for transgenders
• Establishment of Shelter Homes/Safety Homes/Care Homes.• Financial assistance for vocational training and self-employment to individuals and group of
individuals from the Transgender community.• Skill development programmes for Transgenders.• Welfare schemes and programmes with NGO and CBOs working for the welfare of the
Transgender population.• Financial assistance for sex re-assignment surgery up to 2 lakh in any hospital-based on medical
advice.• Formulation and implementation of medical insurance scheme.• Providing Post SRS surgery assistance to the Transgenders.• Transgender Helpline (24x7) and crisis management centre with the help of NGOs (working in
the field of transgenders) /CBOs.• Advocacy campaign by engaging professional media agency.• Sensitisation programmes for the public at large, parents and family members of TGs, teaching
and non-teaching staff and student community of educational institutions, officers of health services, LSGD, Employment Department and Labour Department, police and all other connected departments.
• Provide financial assistance for proper education as incidence of school drop-out is high.• Scholarship for transgender students for studies.• Financial support for TG students for writing competitive exams • Transgender kalolsavam and support to various community activities by providing financial
assistance.• Pension for destitute transgender above the age of 60 years• HIV Zero surveillance centre for Transgender.• Marriage assistance to Transgender community.
Source: Budget Documents, 2019-20 GoK

376 Economic Review 2019, Kerala State Planning Board
on Gender and Development of this Review. The activities of the institutions for women empowerment and major schemes promoting social and economic rehabilitation of women are as follows.
Institutions for Welfare and Empowerment of Women
Kerala Women’s Commission
The Commission was established in 1996 to improve the status of women in Kerala and enquire into unfair practices against women and recommend remedial measures. The Commission implements gender awareness programmes and undertakes legal workshops/seminars, adalaths, and provides for conducting DNA test. In 2018-19, the Commission conducted185 seminars/legal workshops, 29 training programmes for Panchayat Jagratha Samithis on various laws related to women and other legal procedures and 114 adalaths. Under gender awareness programme, the Commission undertook 26 pre-marital counselling sessions across the State with the participation of women NGOs and conducted Kalalaya Jyothi in 218 educational institutions. In 2018-19, the Commission received 6176 complaints; the nature of complaints shows that harassment of women, domestic violence and family problems dominate. The category-wise and District-wise details of complaints received as on March 2019 are given in Appendix 8.3.5.
Kerala State Women’s Development Corporation
Self-employment schemes for women, flagship programme on gender awareness and Finishing School are the major programmes of the Corporation. The Corporation distributed ₹109 crore from National Corporations to 4407 women under self-employment loan scheme and Rs 8.10crore to 319 women in general category through Plan fund. The Corporation won ₹30 lakh from National Corporations as grant in aid for the best performance in terms of the loan disbursement and recovery and Awarded Best
SCA (Level-3 organisation) by NSFDC and won ₹10 lakh in 2017-18
Under the flagship programme on finishing schools, the Resource Enhancement Academy for Career Heights (REACH) at Thiruvananthapuram and Kannur imparted skill training to 1,314 students and Counseling wing provided counseling support to 313 students within and outside REACH. As part of gender awareness programme, KSWDC women cells are functioning in 52 women colleges with over 5,000 members. The main objective of the women cell is to make the youth aware of the issues in the society and to equip them with adequate management skills to handle day to day affairs. The Corporation proposes to start women cells in mixed colleges too, to promote the idea of gender equality and create gender-friendly campuses in the State. In 2018-19, educational scholarships were distributed to 2 women cell members from the 52 colleges. The help line service as envisaged by the Ministry of Women and Child Development, GoI is an emergency response system for women in distress. Mithra Helpline (181) was launched in Kerala on March 27, 2017, and is presently functioning successfully as a 24/7 accessible and emergency response service for women in need. Help line has provided effective intervention in over 45, 665 cases so far.
The corporation with the objective of reaching out to Scheduled Tribe (ST) women, has set up an integrated skill development centre for ST women, on a pilot basis in Chakkitappara tribal settlement in Kozhikode for developing sustainable livelihood options in the tribal hamlet. In 2018-19, 2640 women days of training was imparted through the centre. Training was imparted to 18 women in tailoring and advanced training was provided to 4 women from the group for setting up of a tailoring unit in their community. As part of Menstrual Hygiene Management (MHM) Programme, around 16 lakh packets of sanitary napkins and 1,050 incinerators in more than 1,200 schools of 241 Panchayats in the State were distributed. The programme benefitted 1.80 lakh girl students

377Chapter 8, Initiatives For Social Inclusion
in Government/Aided schools. The corporation has also implemented She PAD project in 1300 Government/Aided Schools for benefit of 2.5 lakh girl students. The project ensures supply of high-quality sanitary napkins and incinerators for safe disposal of napkins to Government schools free of cost. 250 schools and over 25000 girl students were provided MHM Awareness in FY 2018-19.
Gender Park
Gender Park, at Kozhikode, was conceptualised by the Department of Social Justice in 2013 (though its genesis goes back to 2011) as a platform for learning and research on gender equality and empowerment of women. It provides a space for all gender identities to overcome the socio-economic and political boundaries imposed on them by society and contribute to the economic, cultural, and social aspects of the State and society. The main activities envisaged are – action research for policy-making; Skill Development Centre, and a production centre which can be an outlet of the SDC or can be independent in nature; Library and documentation centre; Heritage Museum to maintain a historical legacy of women; a cultural space for women to express their creativity in drawing, painting, dance and music, martial art and other areas of culture. It also has an amphitheatre and a Convention centre that is nearing completion.
Programmes for the Welfare and Empowerment of Women run by WCD and KSSM
The schemes for the welfare and empowerment of women are being implemented through the Women and Child Department (WCD). The schemes implemented through WCD and Kerala Social Security Mission (KSSM)are listed below.
Pradhan Manthri MathruVandana Yojana/Indira Gandhi Matritva Sahyog Yojana
This Centrally Sponsored Scheme (CSS) provides financial assistance to pregnant women and
lactating mothers for the first living child. The financial assistance of ₹5,000 is given in three instalments. The total number of beneficiaries as on August 31, 2019, is 1,51,778.
Snehasparsham
This scheme implemented by KSSM aims to address the problem of unwed mothers. Monthly assistance of ₹1,000 is given to all such mothers. The assistance has been increased to ₹2,000 since July 07, 2018, and the scheme has benefited 2,044 women in 2018-19.
Women Development Programme
This is a major programme of WCD focusing on the implementation of dowry prohibition, protection of women from domestic violence and sexual abuse, rehabilitation of victims including health care and compensation, economic support to women-headed families and women belonging to BPL families and assistance to low salaried women for self-improvement through capacity building. A major programme being run by the Department is a comprehensive programme on Gender Awareness, reaching out to different population sections to create a gender-conscious society.
Nirbhaya Programme
Nirbhaya programme of Women and Child Department envisages setting up of ’Nirbhaya Homes’ for sexually abused women (now called Women and Children homes). There are 14 shelter homes in the State (except in Pathanamthitta and Kottayam) for protection of victims of sexual abuse. In 2018-19, 371 women benefited under this programme. It ensures the protection of sex crime survivors as they are the prime witnesses in prosecution cases and their safety and co-operation are indispensable to ensure the maximum punishment to perpetrators.

378 Economic Review 2019, Kerala State Planning Board
One Stop Centre
One Stop Centres (OSCs) are intended to support women affected by violence, in private and public spaces, within the family, community and at the workplace through convergence of services. The OSC scheme will be implemented by States through the Nirbhaya Fund. In 2018-19, GoI sanctioned One Stop Centre in 9 Districts (Kollam, Alappuzha, Pathanamthitta, Kottayam, Idukki, Ernakulam, Palakkad, Kasaragod, Kozhikode). Two new centres have also started at Thrissur and Wayanad.
Gender Awareness Programme
Gender awareness aims at increasing sensitivity, understanding and knowledge about gender equality. Awareness raising is a process which helps to facilitate the exchange of ideas, improve mutual understanding and develop competencies and skills necessary for social change. As a gender-mainstreaming method, gender awareness raising is crucial for integrating a gender perspective into policies, programmes, projects and services that respond to the different needs of women and men. State Government implements various programmes as part of gender awareness. Sadhairyam Munnottu programme is a major component of Gender Awareness programme. A pilot study has been conducted on the facilities and timings of the hostels of college girls with the guidance of the Principal Secretary, Higher Education and changed the timings from 7 a.m. to 9.30 p.m.. In September 2019, the Corporation has launched a scheme called “Bodhyam” for gender sensitisation of civil police officers in all the police stations numbering 523 across the State, starting with 135 police personnel in the pilot initiative. All the anganwadis in the flood-affected areas were visited and a post-flood livelihood study conducted. As part of helping the Chennamangalam textile societies, an exhibition conducted in Women’s College, Thiruvananthapuram. With the help of KSWDC, sewing machines were given to 28 women in the flood-affected area.
Welfare of Children
Well being of children is essential for country’s development as they constitute the future human resource of the country. For the poorer population, transfers for children and families, in cash or in kind, are critical for realising children’s rights by preventing them from falling into poverty, preventing child mortality, contributing to their healthy development and well-being, improving their access to essential goods and services, and reducing child labour. Social protection thus ensures that children can realise their full potential and enjoy an adequate standard of living
As per Census 2011, the children in the age group 0-18 constitute less than 30 per cent of the State’s total population and children in the age group 0-6 to State’s population is 10.4 per cent. According to the Sample Registration System (SRS) Report 2017, the under-five mortality in the State is 12 deaths per 1,000 live births.1 Kerala has achieved marked improvement in promoting survival, protection, development and participation rights of children in a holistic manner.
Major Programmes on Child Protection, Care and Development
The programmes and schemes related to protection, care and development of children are being implemented by the Department of Women and Child Development and KSSM. The major Acts, policies and programmes in addressing the rights of children are detailed below.
Children’s Right to Protection
Child protection means to create a safe and caring environment for all children, free from neglect, violence, abuse and exploitation. Kerala performs much better than other States in protecting children from all kinds of ill-treatment and violence. However, following constraints remain which prevent the State from providing social safety net for children, in particular those specifically vulnerable.
1As per the NFHS-4 Report, under-five mortality in Kerala is 7 deaths per 1000 live births.
379Chapter 8, Initiatives For Social Inclusion
Crimes Against Children
Crimes against children continue to show an upward trend, with rising figures for rape and other crimes. Child abuse cases especially incidence of sexual abuse of girl children are on the increase. The growing tendency, especially in adolescence, towards substance abuse, use of alcohol and cyber abuse is another key area of concern. As per the State Crime Records Bureau, 1204rape cases were reported in Kerala in 2018; in 2017 it was 1045. The total crimes reported against children in Kerala is 4008 in 2018 and 3543 in 2017 an increase of 13%from 2017. Girl Child
The decline in the Child Sex Ratio (0-6 years) at the all India level from 927 females per 1,000 males in 2001 to 919 in 2011 is a major indicator of women disempowerment. As per Census 2011, the child sex ratio for the State is 964 which is four points higher than in Census 2001(960); however, in the Districts of Alappuzha (951), Ernakulam (961), Kasaragod (961) and Thrissur (950) the ratio is below the State average which is worrying. Discouraging the use of sex selection techniques, rewarding the girl child and awareness creation are the interventions needed to promote the girl child.
Child Marriage
Child marriage is a violation of child rights. As per the ‘Report on India child marriage and teenage pregnancy based on NFHS-4’ of the National Commission for Protection of Child Rights (NCPCR), a comparative analysis of child marriage for 15-19 year old girls as reported in NFHS-3 and NFHS-4 reveals that it has fallen from 6.2 per cent in NFHS-3 to 2.4 per cent in NFHS-4 against the national average of 11.9 per cent
Children’s Right to Development
Early childhood is the most significant developmental period of life. Holistic development of children up to 18 years includes
all areas of growth-physical, mental, emotional and social development. Kerala has always been at the forefront for promoting the above four domains of child development. However, some lacunae in early childhood care remain. As per the NFHS-4 report, the State shows a high level of immunisation coverage, though short of 100 per cent (full immunisation coverage for 12-23 months is 82.1 per cent). Exclusive breastfeeding (first six months of infancy) rates in Kerala show decrease (exclusive breastfeeding among 0-6 months is 56.2 per cent and 53.3 per cent in NFHS-3 and NFHS-4 respectively). Unhealthy feeding practices such as pre-lacteal feeding practice, late initiation of breast milk and bottle feeding practices are noted in several research studies in Kerala. In the case of children of age 6-59 months, anaemic rates show an improvement in health status (the rate is 35.7 in NFHS-4 and 44.5 in NFHS-3). The fact that pre-school education in the State is not universalised is another major issue which requires much attention. As per Rapid Survey on Children (RSOC) 2013-14, 26.2 per cent of children in the age group 3-6 years are not attending pre-schools. The potential of convergence of preschools with anganwadis equipped with a scientifically prepared curriculum is being discussed for providing pre-school education to children.
Children’s Right to Survival
Infant mortality and prevalence of low birth weight babies are the two major determinants of child survival. The State’s Sustainable Development Goals target for IMR is to reduce it from 12 per 1,000 live births to 8 per 1,000 live births, MMR from 66 to 30 per 1 lakh live births and U5MR from 14 to 9 per 1,000 live births by 2020. Although the State has done well in above parameters, the proportion of still birth rate, 7 per 1000 live births is higher than all India figure of 5, the prevalence of malnutrition (NFHS-4, around 16.1 per cent children below 5 years are underweight and 19.7 per cent are stunted), anaemia (NFHS-4, 35.7per cent have anaemia), shortfall in full immunisation (17.9 per cent

380 Economic Review 2019, Kerala State Planning Board
of children in the State do not get all 5 vaccines in the age 12-23 months) are high in certain Districts of the State, particularly in the tribal population. All of these present a challenge for the Government to achieve the target of SDG.
Children’s Right to Participation
Right to participation provides children with an environment to participate in decision-making processes and gives them an opportunity to express their views freely. Kerala’s model of BalaSabha and BalaPanchayat as a neighbourhood network of children under the Local Governments for holistic development of children’s health has been widely acknowledged.
Protection of Children from Sexual Offences (POCSO) Act, 2012
The Act deals with child abuse and provides protection to children from the offences of sexual assault, sexual harassment and pornography. Steps have been taken in the State for the effective implementation of the Act. 14 ‘Women and Children Homes’ (erstwhile Nirbhaya Homes) have been set up to provide care and protection to children covered by this Act in all Districts. Special Juvenile Police Units are being set up in all Districts. To expedite the trial of cases registered under the Act, Special Courts have already been notified in the courts of Thiruvananthapuram, Ernakulam and Kozhikode for the trial of cases regarding sexual harassment and abuse against Women and Children. The number of cases registered under POCSO increased in the State. In 2017, the number of cases registered is 2697 and 3175 in 2018. State has now been sanctioned 28 POCSO courts under a Central Government Scheme in Kerala. Kerala State Commission for Protection of Child Rights
The Commission, functioning as a statutory body has the mandate to examine and review the existing laws for the protection of child rights, inquire into cases of violation of child rights,
look into factors inhibiting the enjoyment of those rights and suggest remedial measures. In 2018-19, 1,692 complaints were received by the Commission and 805 cases were disposed. Of the complaints received, 90 cases are related to the Protection of Children from Sexual Offences (POCSO) Act, 190 cases are related to Right to Education (RTE) Act, 4 cases related to Juvenile Justice(JJ) Act, and the remaining to child rights violation.
Adoption Services
There are 17 specialised adoption agencies, functioning in Kerala for helping the State Adoption Resource Agency. During 2013-14 to 2018-19, 883 in-country and 87 inter-country adoptions took place. In 2018-19, 132 children were adopted in Kerala, out of which 59 were females (119 in-country adoptions and 13 inter-country adoptions). Details of adopted children are given in Appendix 8.3.6.
Child Line Services
The service focuses on the needs of children living alone on the streets, child labourers, domestic workers, run away children, children of sex workers and sexually abused children. Child line system is a 24-hour toll free telephone service (1,098) for children in distress. The service is now available in 430 cities in India and 14 in Kerala. Childline service would be strengthened further in consultation with NGOs and other voluntary organisations.
Integrated Child Development Services (ICDS)
ICDS, one of the flagship programmes of GoI, aims at early childhood development by providing an integrated package of services such as Supplementary Nutrition, Immunisation, Health Check-up, Referral Service, Health and Nutrition Education and Pre School education to children less than 6 years along with pregnant and lactating mothers. In 2018-19, 33,115 Anganwadi centres are operational across the

381Chapter 8, Initiatives For Social Inclusion
State, covering 10.05 lakh beneficiaries under Supplementary Nutrition Programme and 3.16 lakh children in the age group 3-6 years under pre-school education. Of the beneficiaries of SNP, 2.74 lakh were pregnant and lactating women. District-wise coverage is given in Appendix 8.3.7.With State Government support, the LSGIs have initiated various innovative practices under ICDS. To improve nutritional status of children in the tribal areas, Kudumbasree has established production units in Wayanad for micronutrient fortification of Amrutham Nutrimix. To combat severe malnourishment, a community based nutrition rehabilitation programme has been introduced in the Attappady tribal project area with UNICEF support. GIS based Jatak and Janani for monitoring of under 5 year children on real-time basis, through mobile telephony comprising voice file, picture and location is functioning in Attappady, Mananthawady, Devikulam and Iritty. Social Audit was also done in all 33,115 AWCs in the State. Anganwadi Welfare Fund Board is constituted in Kerala for the welfare of Anganwadi Workers and Helpers. The Early Childhood Care and Education (ECCE) Scheme provides early childhood care and education for children of pre-school age through anganwadis.
Integrated Child Protection Scheme
This centrally sponsored scheme provides preventive, statutory care and rehabilitation services to children who are in need of care and protection and children in conflict with law. Child Protection Units, Child Welfare Committees, Special Juvenile Police Units, State Child Protection Society and District Child Protection Units and Juvenile Justice (JJ) Boards have already been established in the State to speed up implementation of the provisions contained in the JJ Act. The programmes related to various social legislations like Child Marriage Restraint Act, Kerala Beggary Prevention Act, programmes on Child Rights Convention, and adoption related laws are also being implemented under the scheme. Special courts have started in the State to expedite the trial cases registered under POCSO Act. In implementation of the Shafeeq Committee
report, the GoK has issued a ‘model’ protocol on Balasuraksha detailing (1) implementation of measures to prevent violence against children (2) identification of cases and intervening early (3) provide care and protection to the victim and (4) preventing reoccurrence of abuse. During 12th Plan, Social Justice Department has taken several steps to prevent child abuse under ICPS; in the 13th Plan also some innovative schemes have been proposed. Measures have been taken for identification of vulnerable families, capacity development of front line agents, prevention of child sexual abuse, programmes like capacity development of teachers, training programmes for teachers in prevention and reporting of child sexual abuse
Scheme for Adolescent Girls (Erstwhile Rajeev Gandhi Scheme for Adolescent Girls)
A centrally sponsored scheme, implemented in all the Districts, aims at empowering the nutritional and health status of the adolescent girls limited to the age group of 11-14 years who are out of school. Kerala is not able to take much advantage from this Central government scheme since very few girls of that age group are out of school in the State.
Cancer Suraksha and Thalolam Schemes for Child Patients
These schemes of KSSM give free treatment through Government approved hospitals to children below 18 years who are suffering from cancer and life threatening diseases. The Cancer Suraksha Scheme is being implemented through 12 Government hospitals and Thalolam Scheme is being implemented through 18 Government hospitals in the State. In 2018-19, the Cancer Suraksha scheme benefited 7,162 children and the Thalolam scheme benefited 16,167 children.
Snehapoorvam
Kerala Social Security Mission provides financial support to children who lost both parents or

382 Economic Review 2019, Kerala State Planning Board
either of them and the other parent is not in a position to look after the child due to financial constraints. The scheme aims to give educational assistance to children up to degree level. HIV/AIDS affected students are also included under this scheme. This programme benefited 34,952 children in 2018-19.
Snehasanthwanam
The scheme, acts as a relief measure to endosulfan victims in the State. The financial assistance under this scheme is being provided to endosulfan victims. It also provides educational assistance to children studying in class I to XII. The number of beneficiaries under the scheme in 2018-19 is 5,697.
Our Responsibility to Children Kerala (ORC)
Our Responsibility to Children (ORC) is an integral project of Integrated Child Protection Scheme (ICPS), under Department of Women and Child Development Department, Kerala. ORC is a school based partnership effort of different Government/Non-Government agencies responsible for protection and development of children such as Departments of Education, Health, Home, LSGD and Civil Society. It aims at better protection and development of children through enhancing life skills, nurturing strengths, addressing vulnerabilities, and promoting mentoring and good parenting. ORC project is now being implemented in 320 schools across the State. A new programme focusing on responsible parenting called KaruthalSparsham: Kaikorkkam kuttikalkkay has been launched recently in the context of some alarming incidents of child abuse by parents.
Kaval
It is an innovative programme implemented by Women and Child department with technical support from Dept. of Psychiatric Social Work, NIMHANS, Bengaluru to support children in conflict with law. As a result of this project
recidivism could be brought down to 3.75 per cent from the earlier 12.4 per cent. 1733 children and their family members are direct beneficiaries of the project which is implemented with the help of 28 collaborating NGOs in the State.
Psycho Social Services for Adolescent Girls
This Scheme of WCD provides counseling and guidance support to adolescent girls. The Psycho Social Counseling Centres were started in 163 selected schools in 2009-10 and now extended to 1,012 schools with the support of Education Department. Full time school counselors were posted in each school for giving counseling and guidance support to children.
Cochlear Implantation in Children
The project of KSSM provides cochlear implant to children in the age group of 0-5 years selected by regional and State level technical committees and provides financial support for Auditory Verbal Habilitation (AVH) to operated children through empanelled hospitals. In 2017-18, a new project named ‘Dhwani’ to provide free speech processor upgradation to the children with implants was launched. While 55 beneficiaries were benefited under Dhwani, the cochlear implantation project assisted a total of 113 children in 2018-19.
First 1,000 Days Programme for Infants in Attappadi
This is a special programme of the WCD for infants in Attappadi focusing on early initiation of breast feeding, timely introduction of complementary foods at six months, hygienic complementary feeding practices and full immunisation and Vitamin A supplementation with de-worming.
GIS Based Mother and Child Health Tracking System in Mananthawadi Block
This is a programme run by WCD for tracking the health status of pregnant women and children in

383Chapter 8, Initiatives For Social Inclusion
Mananthawady block of Wayanad District with the support of the JATAK and JANANI software applications.Social Support Scheme for Children Affected with Juvenile Diabetes (Mittayi)
The scheme is to provide comprehensive care to the children/adolescents with type-1 diabetes. This endocrine disorder mainly affects children of age group 5-18 years. Awareness about this illness is very little among the public and also among caregivers. Insulin is the only treatment option and frequent monitoring is the only way for good glycemic control. Mittayi centres have been established in 3 Government Medical Colleges in the State. Kerala Social Security Mission received Skoch Award for the scheme in 2018-19.
Saranabalyam
Saranabalyam is a project to ensure that State is free from child labour, child begging, trafficking and children on streets with no place to go. It provides emergency services for such children at risk. Rescue officers have been appointed under this project in all the 14 Districts. 161 children were rescued in 2018-19.
Vigjana Deepthi
The scheme provides ₹2,000 per child per month for supporting education. It helps to prevent institutionalisation and restore children in their own homes. 882 children are supported under this programme up to September 2019 in 2019-20.
BalaNidhi (Juvenile Justice Fund)
The objective is to mobilise maximum resources for the well-being of children. The programme was started in 2017-18 and financial assistance given to 5 children for medical treatment in 2018-19.
Registration of Child Care Institutions in Kerala
In Kerala, 1,154 institutions were functioning under the control of Orphanage Control Board, registered as per the Orphanage Control Act 1961 and financially assisted through Orphanage Ccontrol Board. As per the Government order to register under section 41 of JJ Act, 2015, nearly 817 including Government institutions have registered under this Act.
Mangalya
This scheme provides financial assistance of ₹25,000 to widows for their re-marriage. In 2018-19, assistance was given to 109 beneficiaries.
Welfare of Ex-Servicemen and War Widows
The Department of Sainik Welfare is looking after the welfare and rehabilitation of ex-servicemen and their dependence. The department intends to train the ex-servicemen and widows for competitive examinations for re-employment and self-employment. Rehabilitation training on vocational/professional/technical courses for equipping the ex-service men/war widows and their dependents is a major programme. In 2018-19, the computer training centres at Thiruvananthapuram, Kozhikode and Thrissur provided rehabilitation training to 286 beneficiaries.
In 2019-20, Kerala State Ex-Servicemen Development and Rehabilitation Corporation (KEXCON) has started two Uniforms and Garments manufacturing unit in Thiruvananthapuram and one in Thalassery. A total of 15 women have been given employment in these units. Solar Energy Project has also been started.

384 Economic Review 2019, Kerala State Planning Board
Hunger Free City Scheme
The scheme is to provide free food at least once in a day to those who reach cities and are in need of food. Kozhikode is the first city to introduce this scheme. The scheme is implemented in Kozhikode Medical College Hospital, District Homoeo hospital, Malappuram, Medical college and SAT hospital, Thiruvananthapuram, District and taluk hospitals, Kollam and Government General Hospital. The number of beneficiaries under this scheme in 2018-19 was 25,89,181.

ART, CULTURE AND SPORTS
09C H A P T E R

387Chapter 9, Art, Culture and Sports
ART, CULTURE AND SPORTS
9.1 Art and Culture
09C H A P T E R
Culture plays an important role in the development of any nation. It represents a set of shared attitudes, values, goals and practices. Culture and creativity manifest themselves in almost all economic, social and other activities. The impacts of culture can be both positive – through fostering an exchange of cultures and cultural enhancement, or negative through commodification of culture, deterioration in traditional systems and loss of culture.
Kerala has a rich tradition of diverse art forms. The popularity of its art forms – for example, Kathakali and Mohiniyattam – has long brought scholars and visitors to the State.
There are many institutions in the State working to promote and propagate its cultural heritage. They include academic institutions for the performing arts and the institutions for the promotion of art and culture. Financial assistance to this sector is mainly provided through the Directorate of Culture. The major implementing departments in this field are the Directorate of Culture, Department of Archaeology, Department of Archives, Department of Museum and Zoos, and the Kerala State Film Development Corporation. Important institutions coming under the Department of Cultural Affairs include the Kerala State Chalachitra Academy, Kerala Folklore Academy, Kerala Sahitya Academy, Kerala Sangeetha Nataka Academy, Kerala Lalitha Kala Academy, Margi, BharathBhavan, Kumaranasan National
Institute of Culture, Vasthuvidya Gurukulam, Kerala Kalamandalam, Vyloppilli Samskrithi Bhavan, Guru Gopinath Natana Gramam, Jawahar Balabhavan, State Institute of Languages, and Kerala Book Marketing Society. This sector requires mechanisms to coordinate and evaluate the activities of these diverse institutions. An apex body of culture will help to co-ordinate the activities, monitor and evaluate programmes and select the institutions for the distribution of financial assistance.
The major achievements in the art and culture sector in 2019-20 are the following.
Archaeology Department
There are 12 archaeological museums and 180 protected monuments under the Archaeology Department. One of the major achievements of the department is the establishment of District Heritage Museums. The work of District Heritage Museum at Thrissur has been completed and the museum has been opened to the public.
Major works done through the department are the following.
• Construction of Paalppuramalika and clock room in Padmanabhapuram Palace
• Protection activities of Chandragirikkotta• Protection and developmental activities of
Krishnapuram Palace• Protection activities of KunjaliMarakkar

388 Economic Review 2019, Kerala State Planning Board
• Protection activities of Ettu Kettu and Kalappura in Ernakulam Hill Palace Museum
• The arrangement and renovation works of Heritage Museum – Ernakulam
• Activities to protect SreePaadamKottaram• Developmental activities of Idukki Museum• Protection development and document
ation of Numismatic wing• Activities of regional conservation lab
(protection of records by using chemicals) and started the working of mobile conservation unit
• The main activity of the Department is exploration, excavation, and related academic programmes by Archaeologists in the Department to make the public aware about archaeological activities and its importance. Preparation of digital geo mapping is going on by INVIS.
Archives Department
Archives Department is the custodian of all non-current records of permanent value belonging to the State Government and its various departments, institutions, and individuals. As the custodian of records of historical value, such as Government records, palm leaf, and manuscripts, the department conserves such documents and protects them scientifically so that they are preserved for reference purposes. In 2019-20, the major achievements and performance of the department are:
• Digitisation of palm records and Cabinet records started through C-Dit
• Setting up of International Archives and Research Centre at Karyavattom
• Scientific Conservation of rare Library Books
• Setting up of Palm Leaf Manuscript Museum
• Setting up of District Heritage Centre at Idukki
• Awareness programme about the significance of collection and preservation of Archival Records
• History Quiz• Project on Conservation Records• Publication of Archival Records• Formation of Heritage Forum• Arrangement of Archival Records• Record Management Training for Staff of
Archival Department
Directorate of Culture
The Directorate was formed for effectively co-ordinating and regulating the activities of all the art, literary and cultural institutions, which were functioning under various departments. The directorate is also entrusted with the task of distribution of financial assistance/award amount to persons of art and letters, pension to indigent artists, widows of renowned artists and writers and employees of various cultural institutions and academies. Achievements of various schemes of the directorate in 2019-20 are given below.
Diamond Jubilee Fellowship for young artists
This scheme has twin objectives of encouraging young artists on the one hand and promoting local cultural development on the other. Under this scheme, diamond jubilee fellowships are issued to 1,000 young artists graduating from recognised institutions in the State. The State Government will ensure a monthly fellowship of Rs.10, 000 to the awardees. The fellowship will be operational when a local host who undertakes to provide local hospitality to the fellowship holder is identified. This programme is implemented through the cooperation of local bodies. There are 1,000 young artists included in this programme with different art forms. For co-ordinating and monitoring the activities of fellowship artists in each District, co-ordinators have been appointed in all 14 Districts. District-wise details of Diamond Jubilee Fellowship to 976 artists in 237 art forms selected across the State are given in Appendix 9.1.1.

389Chapter 9, Art, Culture and Sports
Diffusion of Culture
The scheme envisages promotion of awareness on the rich cultural heritage of Kerala and strengthens the cultural forms of Kerala. The outlay provided is for the updation of already created website touching upon the various aspects of Kerala Culture, development of a cultural map for the tangible and intangible heritage of Kerala, spreading awareness on Kerala culture, creating conservation awareness programmes among the public, conducting national and international cultural exchange programmes, workshops and seminars, paithurkolsavam, and augmented videos.
Rural art hubs
Ii is a project to help the folk artists and craftsmen enhance their skill, save them from exploitation from middlemen and strengthen their livelihood. Capacity building and direct market linkage has to be given priority for the younger generations. Collaboration with other States and countries will help to create new avenues for the artists and craftsmen.
Nattarangu
The scheme envisages to develop a cultural space in public pathways for cultural activities in villages and small cities where there is no such facilities. According to the availability of space, a small stage, make-up room, sitting facilities etc will be constructed.
Directorate of Museums and Zoos
The Directorate has its Head Office, Museums and Galleries, Zoological Park in Thiruvananthapuram City, Art Gallery and Krishna Menon Museum in Kozhikode, State museum and Zoo in Thrissur and Heritage museum in Kukichira (Wayanad). These institutions are functioning as major centres of tourist attraction. Major achievements of the department in 2019-20 include the following.
• Construction of Butterfly Park in Thiruvananthapuram Zoo
• Construction of Aquarium in State Museum and Zoo, Thrissur
• Paving granite slabs in Zoo Store, Thiruvananthapuram
• Repair works in Tiger enclosure in State Museum and Zoo, Thrissur
• AMC for Air Conditioner system installed in Anaconda enclosure
• Installation of Public Address system in Art Gallery and Krishna Menon Museum, Kozhikode
• Conservation of painting displayed in the KCS Paniker Gallery
Kerala Kalamandalam
Poet laureate Vallathol Narayana Menon founded Kerala Kalamandalam in 1930 for the preservation and promotion of Kerala’s traditional performing arts such as Kathakali, Mohiniyattam, Koodiyattam and Thullal and their music-vocal and instrumental versions. Kerala Kalamandalam, which is a centre for promoting the traditional art forms of Kerala attained the status of a Deemed University in 2007 which necessitates higher level of artistic and academic activities.
Kerala State Chalachitra Academy
The Kerala State Chalachitra Academy was established in 1998 with the aim of promoting good cinema in Malayalam. The Academy helps the Government in formulating policies regarding Cinema and Television. Three film festivals viz., International film festival of Kerala, National Film Festival of Kerala, International Documentary and Short film festival of Kerala are the main festival organised by Kerala State Chalachitra Academy. Major activities done by the Kerala State Chalachithra Academy in 2019 are the following:
• Granting of Kerala State Chalachithra Award 2018
• Chalachithra Aaswadana camp for children in Thiruvananthapuram, Ernakulam, Payyannur, Wayanad

390 Economic Review 2019, Kerala State Planning Board
• Editing Shilpashaala at CIFRA campus • Actively participated in the activities
of flood relief and rehabilitation, in connection with Kerala Flood 2019, with ‘Maanaveeyam Theruvidam Culture Collective’
• Conducted National Film Festival of Kerala at Moovattupuzha, Kerala in October, 2019.
Malayalam Mission
Malayalam Mission was started in 2009, with the aim to acquaint the children of Non Resident Keralites with Kerala culture and Malayalam language. One of the main objectives of Malayalam Mission is to institute, supervise and co-ordinate Malayalam study centres in various parts of India and abroad with the co-operation of non-resident Malayalees across the world. ‘Whereever there are Malayalees, there is Malayalam’ is the slogan of the Mission. At present, the Mission has more than 1,000 study centres in 14 regions of India. Study centres are also functioning in Singapore, Oman, UAE, Germany, Japan, Bahrain, Kuwait, UK, Australia, Ireland, Kenya, Finland, Hongkong etc. Mission started 200 libraries in India and abroad, released a magazine named Bhoomi Malayalam every month, completed a mobile application for their activities like Pookkaalam Web Magazine, Radio Malayalam, Massive open Online Malayalam Course etc.
Margi
Margi, an institution for teaching Kathakali, started functioning in the year 1970 and is a cultural centre for promoting Kathakali, Koodiyattam and Nangiarkoothu. The institution functions as a ‘Kaliyogam’ (training cum performing group). Margi gives free training in Kathakalivesham, Sangeetham, Chenda and maddalam to school students on Saturdays and Sundays. Koodiyattom section functions in collaboration with central Sangeetha Nataka Academy. Seminars and classes are conducted for the promotion of Koodiyattom. The Kerala Kalamandalam Deemed University of Art and
Culture has recognised Margi as a ‘resource centre’ for research scholars in Koodiyattam. Margi has been empanelled by the Indian Council for Cultural Relations, GoI as an institution for training foreign students.
Kerala Lalithakala Academy
The Kerala Lalithakala Academy conducts programmes for promoting the talent of artists especially painters and sculptors. It gives assistance to artists for organising exhibitions and provide scholarships to students of fine arts.
Kumaranasan National Institute of Culture
Kumaranasan National Institute of Culture was founded in 1958 to establish an appropriate memorial for this great poet and social reformer, who was in the forefront of Kerala renaissance movement. The main aim of this institute is to propagate the ideas and literary works of Kumaranasan across the world, protect the cultural heritage of India, organise university level academic programmes and promote research on diversity of Indian culture. Asia’s largest museum of mural art is situated here. The museum showcases paintings based on poems of Asan, such as Veenapoovu, Leela, Chinthavishtayaya Seetha, Chandalabhikshuki, Duravastha and Karuna.
Kerala State Jawahar Balabhavan
Jawahar Balabhavans are institutions functioning at the State and national levels to develop and encourage the creative talents of the children in the areas of art, literature, culture and science. The Kerala State Jawahar Balabhavan is located near Kanakakunnu Palace at Thiruvananthapuram. There are also District Balabhavans at Kollam, Alappuzha, Kottayam and Thrissur. In 2019, Balabhavan nursery wing was modernised with enhanced amenities.

391Chapter 9, Art, Culture and Sports
Guru Gopinath Natana Gramam, Vattiyoorkkavu
Guru Gopinath Natana Gramam was established as a centre for learning, training and research in various Indian dance forms. The institution conducts dance and musical instrument classes for children. Seminars on dance forms of Kerala are also conducted regularly.
State Central Library
The State Central Library is one of the oldest libraries in India. It is the first one of its kind in the nation which is fully computerised and has latest Radio Frequency Identification System and digital wing. There is also facility to renew books online by the members. At present the State Central Library, Thiruvananthapuram has more than 96,500 members and a collection of around 5 lakh books on various subjects. A separate block has been opened for children to cultivate reading habit. The block is in a new heritage model building. A well-furnished reference and information centre is functioning in the library. Rare and precious old books, back volumes of journals and dailies are also kept in the closed reference section for reference. Library has a digital collection in searchable format of nearly 1,200 books, including English and Malayalam books. The digital library of Kerala Government Gazettes from 1903 onwards is also available on the website.
The most important activity of the State Central Library is the Summer School. This is a one month summer vacation camp. It caters to more than 600 school children in summer vacation time every year. The summer school is conducted as a day camp inside Central Library Campus. The children are exposed to all fields of life. There will be literary fest, Music, Dance programmes, and sports. Children get opportunity to interact with dignitaries from various fields like Film, Sports, Literature, Politics etc,.
Kerala State Library Council
The Kerala State Library Council seeks to establish an integrated public library system in the State. It is one of the major public cultural organisation in Kerala. It takes up activities mentioned in the Kerala Public Libraries Act, 1989 and other activities of social importance. Universalisation of library service, facilitation of modern amenities for acquisition of knowledge, improving educational standard of low achieving students, special library service for women, children, aged and prisoners are the main activities of the Library Council.These activities make them mentally strong. Kerala State Library Council provides its services through model village libraries and academic study centres in 14 Districts of Kerala. The students and teachers of parallel college institutions and schools are the main beneficiaries of the academic study centres. It provides Jail library service at 15 jails and envisages to extent services to 3 more jails, 5 juvenile homes, 7 hospitals and 4 orphanages. The Kerala State Library Council has Film club, Braille-hearing facilities and a Digital library.
International Film Festival of Kerala (IFFK) 2019
Kerala State Chalachitra Academy, a Kerala Government Institution to promote cinema conducts International Film Festival of Kerala (IFFK) every year. A competition section for the films from Asian, African and Latin American countries is the highlight of the festival. The film festival of Kerala is also widely known for popular support and participation of people.
Thiruvananthapuram hosted the 24th International Film Festival of Kerala from December 6 to 13, 2019. In the module ‘World Cinema’ 92 films were screened. In different modules 183 films of renowned Directors’ drawn from 73 countries, were screened in the Festival. The festival was inaugurated by Hon’ble Chief Minister Sri. Pinarayi Vijayan on December 6, 2019 at Nishagandhi Open Auditorium,
392 Economic Review 2019, Kerala State Planning Board
Thiruvananthapuram. Inaugural film was ‘Passed by Sensor’ the first movie of Karaslan (Director) from Turkey.

393Chapter 9, Art, Culture and Sports
9.2 Sports and Youth Affairs
Introduction
Youth constitute about 34 per cent of the total population of India. The United Nations (UN) had declared 1985 as the International Youth Year to enable the governments to focus their attention on the promotion of the welfare of the youth in their respective countries. In 2010, the United Nations observed the International Year of Youth to harness the energy, imagination and initiative of the world’s youth in overcoming the challenges facing humankind, from enhancing peace to boosting economic development. The UN defines youth as persons between the age 15 to 24 years of age. The National Youth Policy of India, 2014 defines youth as persons aged between 15 to 29. Sports has been praised for its numerous benefits which include bridging cultural and ethnic divide, improving health and fitness, creating opportunities for employment and business to flourish, fostering teamwork and fair competition, contributing to cross cultural dialogue and ensuring peaceful-coexistence.
Kerala has been the frontrunner in many aspects related to sports such as the first State to enact a law in sports, to integrate sports in to educational curriculum, to appoint sports commission, to grant permission to local self-governments to utilise Plan fund for establishing sports infrastructure and to have a democratically elected sports council. It is no wonder why Kerala is already on the world map in the arena of sports. Today, talented youngsters from
Kerala are proving their mettle at both national and international levels in a wide spectrum of different sports ranging from athletics and volleyball to cricket.
Association football is the most popular sport in Kerala, followed by cricket. However larger number of Keralites follow sports such as Soccer, Kabbadi, Hockey, Cricket, and Badminton.
In terms of sports infrastructure, there are 22 stadiums in the State. The list of major stadiums in Kerala with their use and capacity is given in Table 9.2.1.
Major Institutions coming under the sector are Kerala State Sports Council, Kerala State Youth Welfare Board, Kerala State Bharat Scouts and Guides, Directorate of Sports and Youth Affairs, Directorate of Public Instruction and Directorate of Collegiate Education.
I. Directorate of Sports and Youth Affairs
Directorate of Sports and Youth Affairs (DSYA), established in 1986, is the torch-bearer of development and promotion of sports and games in Kerala. Its activities cover promotion and development of sports and games in the State through providing appropriate and good quality infrastructure, imparting awareness among public on the importance of sports, providing facilities for training and grooming of sports

394 Economic Review 2019, Kerala State Planning Board
Table 9.2.1 List of major stadiums in Kerala, by use and seating capacity
List of Major Stadiums
Sl No Name of Stadia UseSeating
Capacity (Appx. Nos)
1 Karyavattom Stadium Greenfield Stadium (Cricket ball/Football) 50,000
2 Squash Court, Thiruvananthapuram Indoor Stadium (Squash) 500
3 Tennis Complex, Thiruvananthapuram Outdoor/Indoor Stadium (Tennis) 480/1004 Hockey Stadium, Kollam Outdoor Stadium (Hockey) 5,0005 Medical College Stadium, Kozhikode Outdoor Stadium (Football/Athletics) 15,0006 Indoor Stadium, Kannur Indoor Stadium (Multi sports) 5,0007 Swimming Pool, Vellayambalam Swimming Pool 560
8 Jimmy George Indoor Stadium, Thiruvananthapuram Indoor Stadium (Multi sports) 2,000
9 CSN Stadium,Thiruvananthapuram Outdoor Stadium (Football/Athletics) 25,00010 LBS Stadium, Kollam Outdoor Stadium 30,00011 Corporation Stadium, Thrissur Outdoor Stadium (Football) 15,00012 Indoor Stadium, Thrissur Indoor Stadium (Boxing/Multi sports) 2,00013 Corporation Stadium, Kozhikode Outdoor Stadium (Football) 80,00014 University Stadium, Thiruvananthapuram Outdoor Stadium (Football/Athletics) 20,00015 Rajiv Gandhi Stadium, Kochi Indoor Stadium (Multi sports) 10,00016 Indoor Stadium, Kozhikode Indoor Stadium (Multi sports) 3,500
17 Indoor Stadium, Vellayani, Thiruvananthapuram Indoor Stadium (Multi sports) 2,000
18 Sreepadam Stadium, Attingal Indoor Stadium (Multi sports) 2,000
19 Swimming Pool, Pirappancode, Thiruvananthapuram Swimming Pool 5,000
20 Indoor Stadium, Thriprayar Indoor Stadium (Multi sports) 4,000
21 Indoor Stadium, Kottayam Indoor Stadium (Multi sports) 2,000
22 Municipal Stadium, Pala Outdoor Stadium (Football/Athletics) 1,000Source: Directorate of Sports and Youth Affairs Department
persons to achieve international standards. Besides this, DSYA takes up activities to bring in latest technologies and innovations in sports to provide and augment the competitive skills of sports persons from Kerala.
Hoops – Grass Root Basketball Programme
This programme is intended to propagate and promote the concept of Play for Health. The objective of the programme is to build a healthy, vibrant and responsible society, and to create a
vibrant and prosperous future for the country. This scheme has been launched in 10 schools in 5 Districts. The aim is to extend the programme to all the schools in the State. The target group will be young students in Kerala.
Sprint – Grass Root Training Programme for Athletics
Athletics is one of the prioritised sports disciplines in Kerala based on the performance at national and international level. For performance enhancement, training at grass root level across

395Chapter 9, Art, Culture and Sports
the State, with inter school and inter District tournaments has to be promoted. Hence, Athletics has to be selected as a top priority sports discipline to provide continuous training for school going children in the State, between the age group of 5-12 years which aims to bring up talented children from sub urban, rural, tribal and other less tapped areas by catching those young. Presently, the project is being implemented in 6 centres, one each in 6 Districts, viz., Kannur, Kasaragod, Idukki, Pathanamthitta, Alappuzha and Kollam.
ACE – Grass Root Tennis Programme
This programme is intended to identify the potential players from the State at a very young age and develop them into world class tennis players.
Jimmy George Sports Hub
The Jimmy George Sports Hub that offers sports facilities at par with international standards has taken the sports scenario in Kerala to an all new level. The Directorate of Sports and Youth Affairs (DSYA) has transformed this iconic stadium by revamping it with state-of-the-art facilities. Named after the legendary Volleyball player Jimmy George, this stadium holds a special place
in the hearts of sports enthusiasts across the nation.
The ideal platform for sportspersons to hone their skills, the Jimmy George Sports Hub is housed at the Jimmy George Indoor Stadium, Thiruvananthapuram. It was conceived to inspire both sports persons and the general public to ensure that sports and fitness becomes a part of their daily lives.
Indoor stadium
Constructed in the capital city of Thiruvananthapuram in 1987 in connection with the National Games, the Jimmy George Indoor Stadium has hosted numerous sporting events and has been a venue for regular practice sessions for sportspersons and enthusiasts. Promising Badminton players practice here under a coach from the Sports Authority of India. Training in Gymnastics and Taekwondo is provided here and facilities are available for playing Table Tennis, Volleyball, Basketball and Handball.
The stadium has recently been renovated and upgraded to a world-class arena capable of staging international events. It is fully air-conditioned and arena lighting is provided as
Box 9.2.1 Jimmy George Fitness Centre
The world-class facility, which has ultra-modern equipment and services of expert trainers, has been developed at an area of 337 sqmtr at the Rajiv Gandhi Sports Medicine Centre, at the Jimmy George Sports Hub, Thiruvananthapuram.
This fitness centre is a major asset for sports in the State, going by its concept, design and equipment available. The fully air conditioned facility has all the amenities including LED lighting, change rooms and restrooms. The centre is useful to all public, and most importantly for players and upcoming athletes. Special discounted rates will be given to players at the facility.
The Life Fitness Centre comes as an add-on facility for sports personalities and budding talents undergoing regular training sessions at the Jimmy George hub.
It can also be a venue for future national events to be hosted by the State.
Source: Website of Directorate of Sports and Youth Affairs Department

396 Economic Review 2019, Kerala State Planning Board
per specific needs. The renovated hall is also provided with a state-of-the-art acoustic and public address system.
Swimming Pool
The swimming pool which is now part of the Sports Hub was inaugurated in 1962 and has been a landmark in the capital city. The pool was revamped to meet international standards and the technical specifications of FINA (International Swimming Federation) in 2015.
• The size of the pool has been increased to 50m x 25m from 50m x 18m.
• A new filter plant, new toilet blocks and administrative blocks have been constructed.
• Scoreboard and time-measuring devices such as touchpads and clocks are available at the pool.
• The pool is filtered with ozone and the diving platforms have been reconstructed as per the norms of FINA.
• High-mast lighting facilities are also provided to conduct competitions at night.
Rajiv Gandhi Sports Medicine Centre
The Rajiv Gandhi Sports Medicine Centre (RGSMC) was established in 1992 by Kerala State’s Directorate of Sports and Youth Affairs. It is currently the only Sports Medicine Centre serving the medical needs of athletes in the State. The Centre provides outpatient care on all government working days from 9.00 a.m. to 1.00 p.m. free of cost to patients.
Jimmy George Gallery
The Sports Hub also has a gallery exclusively dedicated to Jimmy George, the legendary Volleyball player. Jimmy George was, without any doubt, one of the best Volleyball players that India had ever produced and was highly regarded worldwide.
Altitude Stimulated Training (ASTRA)
ASTRA, by the Directorate of Sports and Youth Affairs (DSYA), is a first-of-its-kind facility in South India. This state-of-the-art facility houses the Low Oxygen Simulator. This facility has been developed for excellence in endurance sports.
2. Kerala State Sports Council
The council which was established under Charitable Societies Registration Act was reconstituted in 1974 with an aim to promote sports in Kerala. Later, the Kerala Sports Council was dissolved and Kerala State Sports Council was formed and is functioning as per Kerala Sports Act 2000 and Kerala Sports Rules 2008. The council has several centres functioning under it such as Centralised Sports Hostels, College Sports Hostels, Sports Training Centres, Rural Coaching Centres, School Sports Hostels, and Day Boarding Centres. It has also started ‘Elite Training Centres’ for volleyball, athletics, and swimming.
Centre of excellence (Elite Training Athletics, volleyball, fencing)
Kerala State Sports Council has implemented Elite Scheme in various disciplines like athletics, volleyball and basketball in order to nourish the sports skill in young talented sports persons and to make them capable of securing medals in Asian/Common wealth/Olympic Games. Presently there are 3 centres functioning under Elite Scheme
DR. APJ Abdul Kalam Scholarship Scheme
Kerala State Sports Council had implemented Dr. APJ Abdul Kalam Scholarship Scheme for encouraging eminent sports players in our State. Under this scheme, 11 sports persons (Physically challenged) from the age group of 14 to 20 years were granted scholarship. The scholarship was started in 2015-16. In 2015-16; 10 Sports persons were selected and given scholarship.
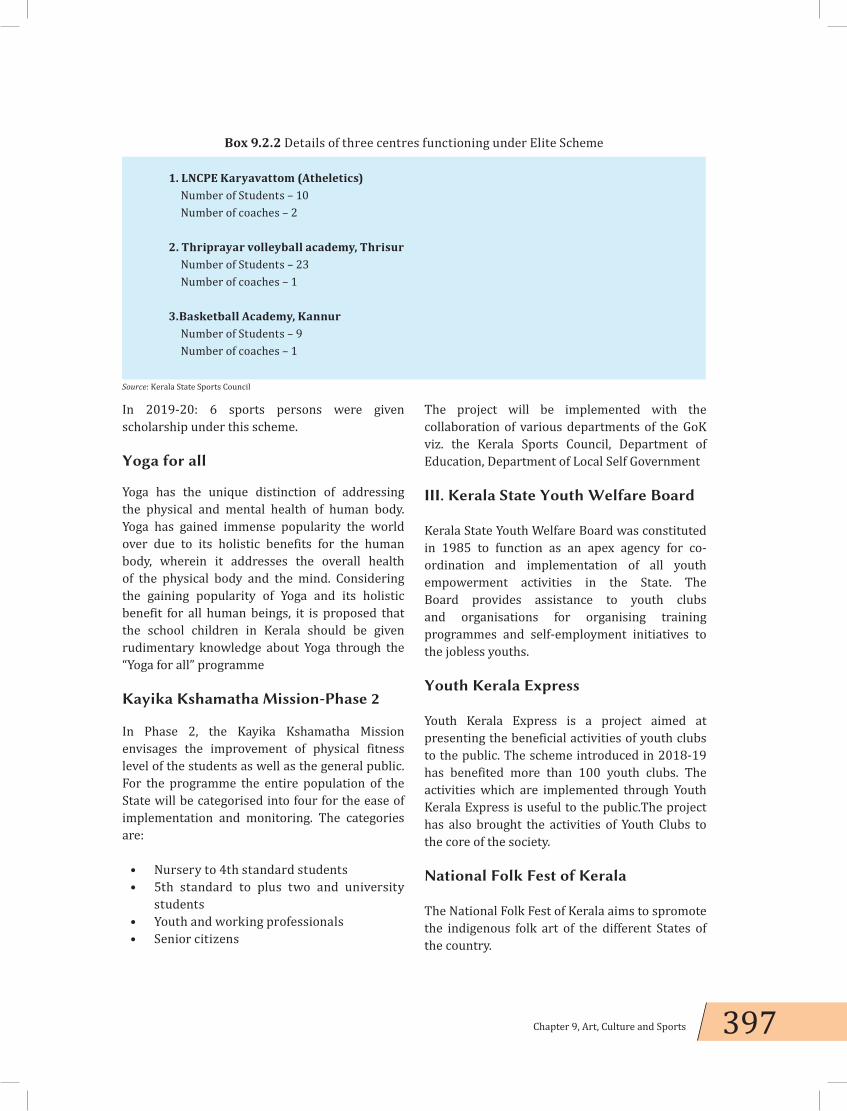
397Chapter 9, Art, Culture and Sports
In 2019-20: 6 sports persons were given scholarship under this scheme.
Yoga for all
Yoga has the unique distinction of addressing the physical and mental health of human body. Yoga has gained immense popularity the world over due to its holistic benefits for the human body, wherein it addresses the overall health of the physical body and the mind. Considering the gaining popularity of Yoga and its holistic benefit for all human beings, it is proposed that the school children in Kerala should be given rudimentary knowledge about Yoga through the “Yoga for all” programme
Kayika Kshamatha Mission-Phase 2
In Phase 2, the Kayika Kshamatha Mission envisages the improvement of physical fitness level of the students as well as the general public. For the programme the entire population of the State will be categorised into four for the ease of implementation and monitoring. The categories are:
• Nursery to 4th standard students• 5th standard to plus two and university
students• Youth and working professionals• Senior citizens
The project will be implemented with the collaboration of various departments of the GoK viz. the Kerala Sports Council, Department of Education, Department of Local Self Government
III. Kerala State Youth Welfare Board
Kerala State Youth Welfare Board was constituted in 1985 to function as an apex agency for co-ordination and implementation of all youth empowerment activities in the State. The Board provides assistance to youth clubs and organisations for organising training programmes and self-employment initiatives to the jobless youths.
Youth Kerala Express
Youth Kerala Express is a project aimed at presenting the beneficial activities of youth clubs to the public. The scheme introduced in 2018-19 has benefited more than 100 youth clubs. The activities which are implemented through Youth Kerala Express is useful to the public.The project has also brought the activities of Youth Clubs to the core of the society.
National Folk Fest of Kerala
The National Folk Fest of Kerala aims to spromote the indigenous folk art of the different States of the country.
Box 9.2.2 Details of three centres functioning under Elite Scheme
1. LNCPE Karyavattom (Atheletics)Number of Students – 10 Number of coaches – 2
2. Thriprayar volleyball academy, ThrisurNumber of Students – 23 Number of coaches – 1
3.Basketball Academy, KannurNumber of Students – 9 Number of coaches – 1
Source: Kerala State Sports Council

398 Economic Review 2019, Kerala State Planning Board
The delegation of National Folk Fest comprises delegates from outside the State, who present their unique folk arts and cultural programs, interact with young talent in the community and learn about the work of others.People from neighbouring States will have the opportunity to get acquainted with the families of Kerala and to experience the family life, culture and lifestyle of the place.
IV. Kerala State Youth Commission
Kerala State Youth Commission is a Quasi-Judicial body constituted to empower the youth in Kerala and to protect their rights. It is functioning as a Grant-in-aid institution under GoK. The main activities of Kerala State Youth Commission are awareness programmes under Project Co-ordinator in colleges/venues for youth, awareness programmes among youth in SC/ST colonies, adalaths/hearings/local sittings, District seminars/symposiums/workshops, National seminar, Youth Icon Awards, empowering the marginalised youth/health protection, Youth Legal Support Centre, EMS Memorial Inter University, elocution competition, National Youth Day Programme, Cultural Exchange Programme
for outstanding Youth, and Youth Commission Facilitation Programmes.
Box 9.2.3 Kerala Voluntary Youth Action Force
In 2018, our State witnessed an unprecedented flood in its history. In 2019 also the State suffered a similar flood. The youth of Kerala, volunteers, cultural workers, youth clubs, students, bureaucrats, people’s representatives, NGOs, workers, especially fisherfolk played a valuable role in saving many lives. The power of youth in times of adversity was demonstrated. This gave the idea of Kerala Volunteer Youth Action Force (KVYAF) in the State.
The Kerala Volunteer Youth Action Force is a volunteer force formed with the aim of preparing youth volunteers who can deal with natural disasters. It has already trained 2,000 youths and has set up a volunteer force in 14 Districts. The Kerala State Youth Welfare Board has been able to set up collection centres in 14 Districts under the aegis of the Kerala Voluntary Youth Action Force and to provide essential items to disaster affected persons.
The activities of Kerala Volunteer Youth Action Force will be further expanded in the coming years. As part of this, it is aimed to extend the force to the local government level. The aim is to set up a Youth Action Force at the Panchayat/Municipality/Corporation level and provide them with expert training and prepare for various volunteer activities.
Source: Kerala State Youth Welfare Board

KERALA DIASPORA
10C H A P T E R


401Chapter 10, Kerala Diaspora
KERALA DIASPORA
10C H A P T E R
Migration has played a significant role in Kerala economy. Migratory tendencies have been inherent in the context of Kerala, and it has been shaping the economic and social dimensions of the State. The economic boom within the Gulf countries gave migration a considerable boost, reaching its peak in terms of both numbers and remittances. Ironically, Kerala, of late, is witnessing a reverse migration of labour (Emigration and Remittances: New Evidences from The Kerala Migration Survey, 2018 S. Irudaya Rajan, K.C. Zachariah January 2019).
International Migration
The estimated number of international migrants has increased over the past five decades. The total
estimated number of people living in a country other than their countries of birth in 2019 is 272 million people, which is 119 million more than in 1990 (when it was 153 million), and over three times the estimated number in 1970 (84 million). Details are provided in Table 10.1.1.
Remittances
In 2018, India, China, Mexico, the Philippines and Egypt were (in descending order) the top five remittance recipient countries, although India and China were well above the rest, with total inward remittances exceeding USD 67 billion for each country (Figure 10.1.1 and Appendix 10.1.1.).
Table 10.1.1. International migrants, 1970-2019
Year Number of MigrantsMigrants as per cent of
world population
1970 8,44,60,125 2.31975 9,03,68,010 2.21980 10,19,83,149 2.31985 11,32,06,691 2.31990 15,30,11,473 2.91995 16,13,16,895 2.82000 17,35,88,441 2.82005 19,16,15,574 2.92010 22,07,81,909 3.22015 24,88,61,296 3.42019 27,16,42,105 3.5
Source: UN DESA, 2008, 2019a, 2019b.Note: The number of entities (such as States, territories and administrative regions) for which data were made available in the 2019 UN DESA Revision of International Migrant Stock was 232. In 1970, the number of entities was 135. In 2019, most international migrants (around 74 per cent) were of working age (20 to 64 years of age), with a slight decrease in migrants younger than 20 years old from 2000 to 2019 (from 16.4 per cent to 14 per cent), and a constant share(around 12 per cent) of international migrants 65 years of age and older since 2000.
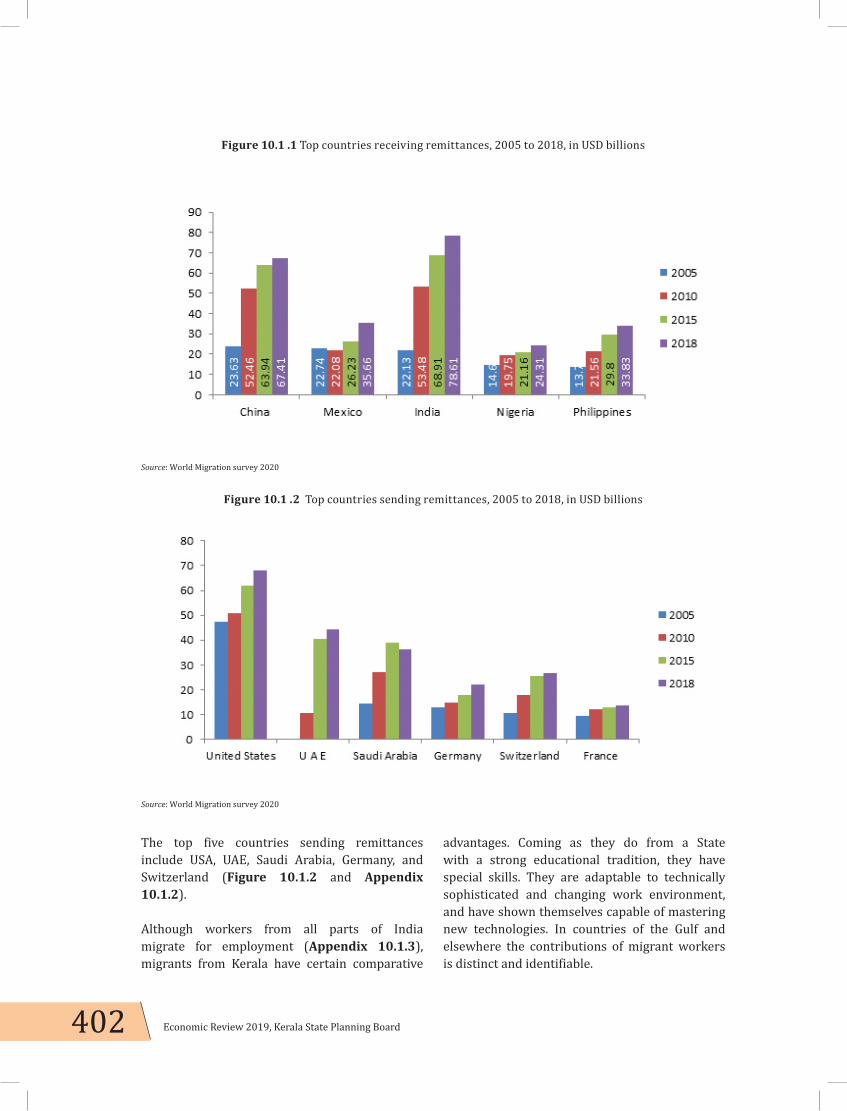
402 Economic Review 2019, Kerala State Planning Board
The top five countries sending remittances include USA, UAE, Saudi Arabia, Germany, and Switzerland (Figure 10.1.2 and Appendix 10.1.2).
Although workers from all parts of India migrate for employment (Appendix 10.1.3), migrants from Kerala have certain comparative
advantages. Coming as they do from a State with a strong educational tradition, they have special skills. They are adaptable to technically sophisticated and changing work environment, and have shown themselves capable of mastering new technologies. In countries of the Gulf and elsewhere the contributions of migrant workers is distinct and identifiable.
Figure 10.1 .1 Top countries receiving remittances, 2005 to 2018, in USD billions
Source: World Migration survey 2020
Figure 10.1 .2 Top countries sending remittances, 2005 to 2018, in USD billions
Source: World Migration survey 2020
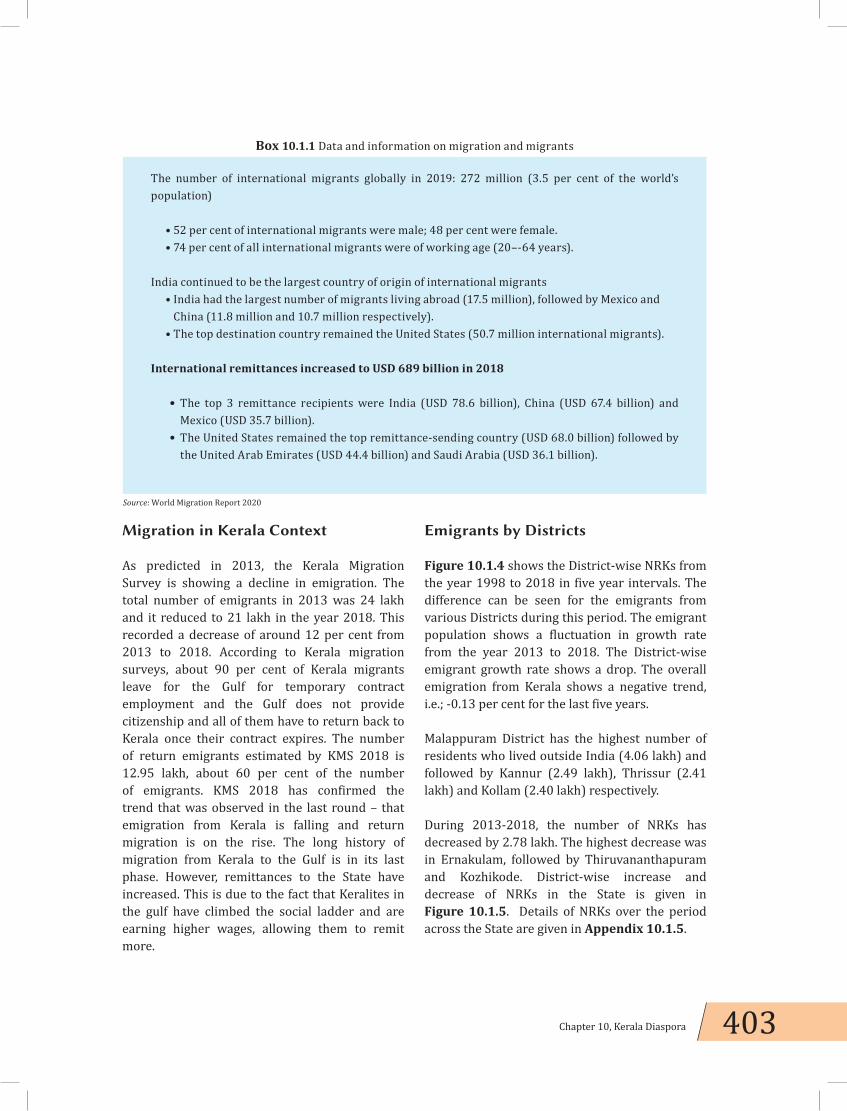
403Chapter 10, Kerala Diaspora
Migration in Kerala Context
As predicted in 2013, the Kerala Migration Survey is showing a decline in emigration. The total number of emigrants in 2013 was 24 lakh and it reduced to 21 lakh in the year 2018. This recorded a decrease of around 12 per cent from 2013 to 2018. According to Kerala migration surveys, about 90 per cent of Kerala migrants leave for the Gulf for temporary contract employment and the Gulf does not provide citizenship and all of them have to return back to Kerala once their contract expires. The number of return emigrants estimated by KMS 2018 is 12.95 lakh, about 60 per cent of the number of emigrants. KMS 2018 has confirmed the trend that was observed in the last round – that emigration from Kerala is falling and return migration is on the rise. The long history of migration from Kerala to the Gulf is in its last phase. However, remittances to the State have increased. This is due to the fact that Keralites in the gulf have climbed the social ladder and are earning higher wages, allowing them to remit more.
Emigrants by Districts
Figure 10.1.4 shows the District-wise NRKs from the year 1998 to 2018 in five year intervals. The difference can be seen for the emigrants from various Districts during this period. The emigrant population shows a fluctuation in growth rate from the year 2013 to 2018. The District-wise emigrant growth rate shows a drop. The overall emigration from Kerala shows a negative trend, i.e.; -0.13 per cent for the last five years.
Malappuram District has the highest number of residents who lived outside India (4.06 lakh) and followed by Kannur (2.49 lakh), Thrissur (2.41 lakh) and Kollam (2.40 lakh) respectively.
During 2013-2018, the number of NRKs has decreased by 2.78 lakh. The highest decrease was in Ernakulam, followed by Thiruvananthapuram and Kozhikode. District-wise increase and decrease of NRKs in the State is given in Figure 10.1.5. Details of NRKs over the period across the State are given in Appendix 10.1.5.
Box 10.1.1 Data and information on migration and migrants
The number of international migrants globally in 2019: 272 million (3.5 per cent of the world’s population)
• 52 per cent of international migrants were male; 48 per cent were female.• 74 per cent of all international migrants were of working age (20–-64 years).
India continued to be the largest country of origin of international migrants• India had the largest number of migrants living abroad (17.5 million), followed by Mexico and China (11.8 million and 10.7 million respectively).• The top destination country remained the United States (50.7 million international migrants).
International remittances increased to USD 689 billion in 2018
• The top 3 remittance recipients were India (USD 78.6 billion), China (USD 67.4 billion) and Mexico (USD 35.7 billion).
• The United States remained the top remittance-sending country (USD 68.0 billion) followed by the United Arab Emirates (USD 44.4 billion) and Saudi Arabia (USD 36.1 billion).
Source: World Migration Report 2020
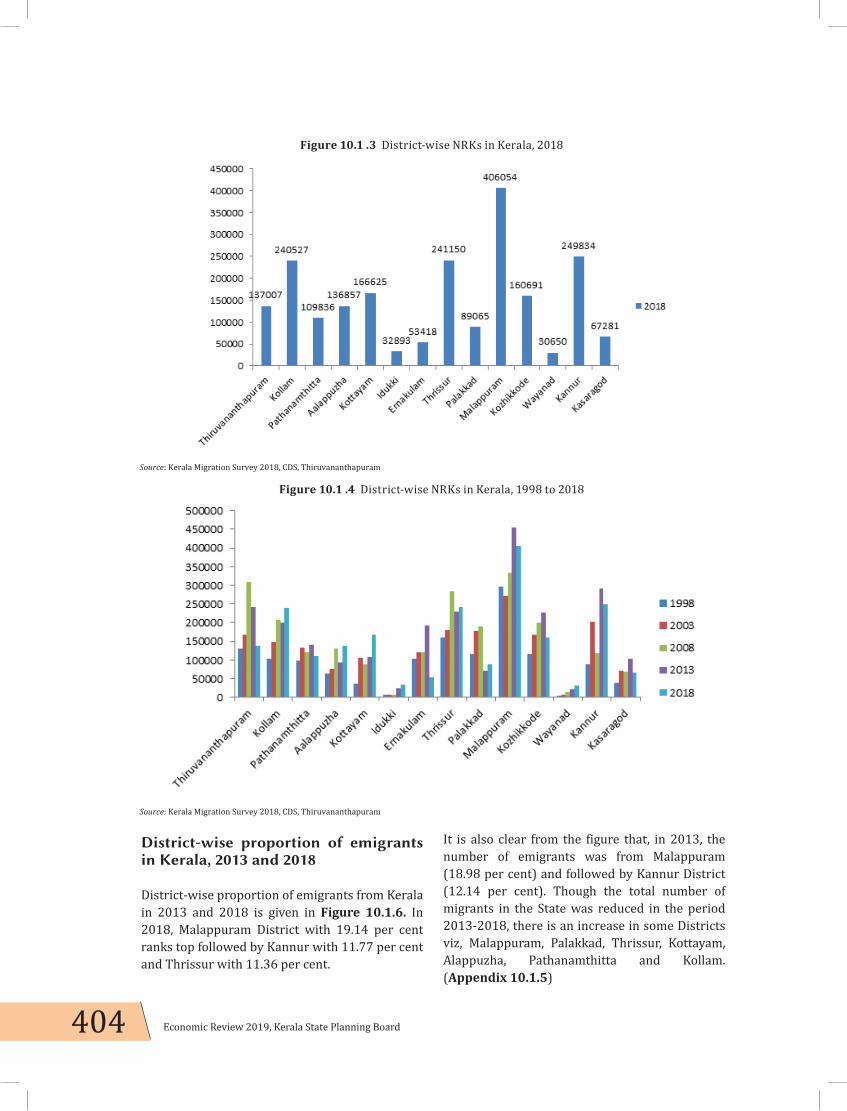
404 Economic Review 2019, Kerala State Planning Board
District-wise proportion of emigrants in Kerala, 2013 and 2018
District-wise proportion of emigrants from Kerala in 2013 and 2018 is given in Figure 10.1.6. In 2018, Malappuram District with 19.14 per cent ranks top followed by Kannur with 11.77 per cent and Thrissur with 11.36 per cent.
It is also clear from the figure that, in 2013, the number of emigrants was from Malappuram (18.98 per cent) and followed by Kannur District (12.14 per cent). Though the total number of migrants in the State was reduced in the period 2013-2018, there is an increase in some Districts viz, Malappuram, Palakkad, Thrissur, Kottayam, Alappuzha, Pathanamthitta and Kollam. (Appendix 10.1.5)
Figure 10.1 .3 District-wise NRKs in Kerala, 2018
Source: Kerala Migration Survey 2018, CDS, Thiruvananthapuram
Figure 10.1 .4 District-wise NRKs in Kerala, 1998 to 2018
Source: Kerala Migration Survey 2018, CDS, Thiruvananthapuram
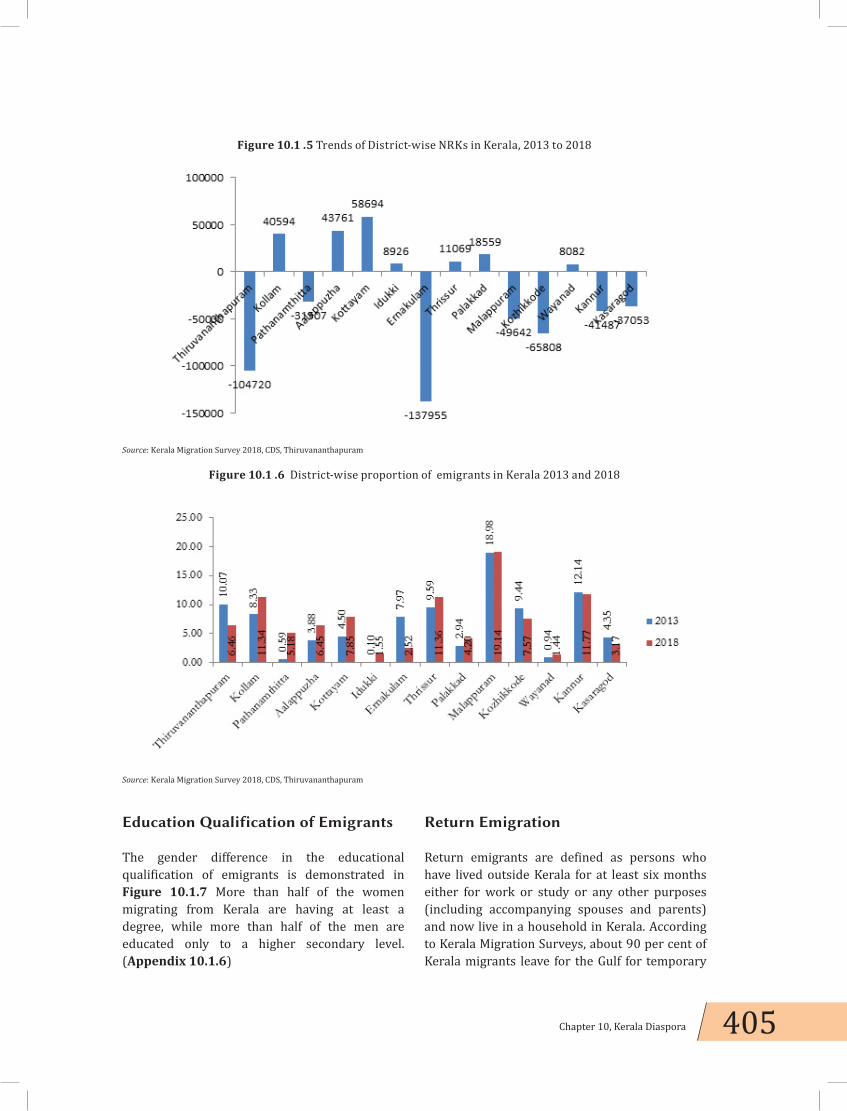
405Chapter 10, Kerala Diaspora
Education Qualification of Emigrants
The gender difference in the educational qualification of emigrants is demonstrated in Figure 10.1.7 More than half of the women migrating from Kerala are having at least a degree, while more than half of the men are educated only to a higher secondary level. (Appendix 10.1.6)
Return Emigration
Return emigrants are defined as persons who have lived outside Kerala for at least six months either for work or study or any other purposes (including accompanying spouses and parents) and now live in a household in Kerala. According to Kerala Migration Surveys, about 90 per cent of Kerala migrants leave for the Gulf for temporary
Figure 10.1 .5 Trends of District-wise NRKs in Kerala, 2013 to 2018
Source: Kerala Migration Survey 2018, CDS, Thiruvananthapuram
Figure 10.1 .6 District-wise proportion of emigrants in Kerala 2013 and 2018
Source: Kerala Migration Survey 2018, CDS, Thiruvananthapuram

406 Economic Review 2019, Kerala State Planning Board
contract employment. As the Gulf countries do not provide citizenship, all of them have to return to Kerala once their contract expires. (Emigration and Remittances: New Evidences from The Kerala Migration Survey, 2018S. IrudayaRajan, K.C. Zachariah January 2019)
Trends of Return Emigration in Kerala
The number of return emigrants estimated by Kerala Migration Survey 2018 is 12.95 lakh, about 60 per cent of the number of emigrants. The increase in return emigrants was more in 2013 than in 2018. (Appendix 10.1.7 and Figure 10.1.8)
In 2018, highest return emigration can be seen in Kollam Taluk (82,945) followed by Tirur (75,664) and Kozhikode (75,102). In 2013, highest return emigration was in Chirayinkeezhu Taluk (85,507)followed by Kozhikode (70,581) and Tirur (65,915). Among the districts, the per cent of return emigrants varies from 23.9 per cent in Malappuram to 0.5 per cent in Idukki. Around 50 per cent emigrant returned to three Districts of Kerala namely Malappuram, Kollam, and Kozhikode.
Figure 10.1 .7 Educational qualifications of the emigrants
Source: Kerala Migration Survey 2018, CDS, Thiruvananthapuram
Figure 10.1 .8 Return emigrants and inter-survey change, 1998 to 2018
Source: Kerala Migration Survey 2018, CDS, Thiruvananthapuram

407Chapter 10, Kerala Diaspora
Return Emigrants by Districts
Malappuram shows the maximum return-migrant with 3,09,881, followed by Kollam 1,65,504 and Kozhikode (1,51,417). The lowest return-migration number is reported in Idukki (6,137). (Appendix 10.1.8)
Schemes for Non Resident Keralites
Santhwana
This is a distress relief scheme intended to provide time bound financial support to returnee emigrant who have worked abroad for not less than two years and the period after return does not exceed 10 years. The scheme is available for emigrants whose annual family income does not exceed ₹1,00,000. Upto ₹1,00,000 is provided as death assistance, and ₹50,000 is provided as medical assistance. An amount of ₹15,000 is provided as marriage assistance and ₹10, 000 is provided as assistance.for wheel chair crutched and artificial limbs.
Rehabilitation of Return Emigrants – NDPREM
This is a rehabilitation package that aims to help the returnee migrants who have worked
abroad for at least two years to continue living a dignified life. Under this scheme, subsidy is extended for entrepreneurs having a seed capital of up to ₹30,00,000 and upon prompt repayment, 15 per cent subsidy on capital and 3 per cent rebate on interest of loan are offered for the first 4 years. In the current financial year, four more financial institutions have been added as partners for the scheme making the total number as 14. NORKA Roots has conducted one day field camps to facilitate speedy disbursal of loans. 567 beneficiaries have availed subsidy in the year 2019-20.
Moreover, in order to guide the entrepreneurs, with technical support, Centre for Management Development is also engaged. All these had made the scheme more attractive and hassle free.
Emergency Ambulance service at Airports
This scheme aims at providing free ambulance service from the airports in Kerala and that of Mangalore and Coimbatore Airports for the conveyance of a sick Keralite on repatriation or the mortal remains of a deceased Keralite from a foreign country to a hospital or their residence. The scheme runs with the aid of Indian Medical Association.
Figure 10.1 .9 Return emigrants by Districts from 2008 to 2018
Source: Kerala Migration Survey 2018, CDS, Thiruvananthapuram

408 Economic Review 2019, Kerala State Planning Board
Pravasi Legal Aid cell
It has been noticed for a long time that a number of Malayalees are languishing in the prisons of foreign countries especially in GCCs for minor or petty offences or the offences without their knowledge. Ignorance of Law of the Land and language problem are the major reasons for them ending up in prisons. Pravasi Legal Aid Cell is a scheme initiated to address such issues and help to save the poor from the jails. Eight Legal Consultants in six GCCs are deployed so far and cases have been forwarded to them for consideration under the scheme.
NORKA Business Facilitation Centre
NBFC is an initiative by the Government of KeralaGoK, offering comprehensive support services and advisories to prospective investors among NRKs on investment opportunities available in Kerala. The aim of NBFC is to assist NRKs to start/expand their business in Kerala.
Even though the scheme is in its initial stages, it could catch the attention of lot of investors and 27 Business Facilitations has been made so far under this scheme.
Global Contact Centre
This is the first of its kind project implemented by the Government so that the NRKs residing in any part of the world can give a missed call to the Toll Free Helpline number and get a call back. The NRKs can thereby enquire about the services provided by NORKA Roots or place their grievances for appropriate redressal. More than this, SMS and Live Chat facility are also provided. Over 1.25 lakh expatriate from 32 countries have made use of this facility to avail various services since February 2019.
New Initiatives
Norka Roots Directors scholarship scheme
This scheme aims at promoting excellence in higher education among the children of NRK’s. The scheme was constituted by the NRI Directors of the NORKA ROOTS as a goodwill gesture for extending financial help for higher education of children of poor section of the NRKs. The fund shall be utilizsed to grant financial assistance for educational purposes including professional education of children NRKs.
NORKA Roots Financial Assistance to Pravasi Sangham
The scheme is devised to support the Pravasi Sangham established for the welfare and betterment of returned emigrants. Assistance will be provided to those societies who will provide employment to atleast 10 persons through their projects or expand the projects to the effect that 10 additional job opportunities are created. ₹2 lakh will be provided as Capital Subsidy and One lakh as share parity. Applications are invited and are under process. The target number of beneficiaries is 30.
NORKA Roots aims at extending financial assistance for the promotion of Pravasi Samghams. Pravasi Samghams plays a leading role in spreading and creating awareness about the schemes and welfare activities of NORKA Department among NRKs.
INFRASTRUCTURE
11C H A P T E R


411Chapter 11, Infrastructure
INFRASTRUCTURE11.1 Transport
11C H A P T E R
INFRASTRUCTURE
Infrastructure comprises basic facilities and services that are necessary for carrying out economic activities. This sector focuses on major infrastructure like roads, railways, telecommunication systems, waterways, airways, electricity, water supply and sports. The changing infrastructure landscape in the State has generated significant interest from external investors.
Government of Kerala is striving towards achieving an integrated development of every stratum of society and sustainable growth of the economy. Special emphasis is given to industrial and infrastructure development to accelerate sustainable growth in the economy. Government has already mandated Kerala Infrastructure Investment Fund Board (KIIFB) to act as the nodal agency to scrutinise, approve and fund major infrastructure projects with its target of ₹50,000 crore, to provide investment for projects in sectors such as transport, water, sanitation, energy, social and commercial infrastructure, IT and electronic industry etc.
Infrastructure development in the State, of late, has been receiving a much needed thrust. Several major projects will become operational in the coming years. Through KIIFB, the State is aiming to address the constraints of resource availability in financing infrastructure projects. This has been one of many innovative and decisive steps taken by the State.
TRANSPORT
Transport plays a significant role in the economic development of a region. India has an extensive road network, which provides mobility to millions of people every day. India has about 58.98 lakh km of road network, which is the second largest in the world. This comprises National Highways/Expressways (1, 32,500km), State Highways (1, 56,694km), Other Roads (56, 08,477 km). According to World Bank, India’s road network carries 65 per cent of freight traffic and 85 per cent of passenger traffic. National Highways, which carries about 40 per cent of the road traffic, has grown at a rate of only 2.2 per cent over the last sixty years. Similarly, State Highways form only 3 per cent of the total road network and carries about 40 per cent of total road traffic. About 90,000 km of State Highways are only single lane (3.5m wide) roads.The vehicle population is growing at a Compound Annual Growth Rate (CAGR) of 10.8 per cent and the passenger traffic is 12,000 Billion passenger- kilometre (BPKM). The current freight traffic is growing at an annual rate of 9.7 per cent and is expected to be 13,000 BTKM by 2032.
Indian Railway is one of the largest transportation and logistics network in the world under a single management. It comprises more than 1,20,000 km track, covering more than 7,300 stations. It has an electrified route length of 29,376 km. Freight accounts for 67 per cent of total revenue of the Railways. Civil

412 Economic Review 2019, Kerala State Planning Board
aviation is gradually gaining importance in passenger movement with an increase in private participation in airlines operations and gradual improvements in airport infrastructure. In 2019-20 (April-September), all Indian airports taken together handled 1271.40 thousand aircraft movements (excluding General Aviation Movements), 170.02 million passengers and 1707.98 thousand tonnes of freight. The passenger traffic has increased by 0.3 per cent while aircraft movements and freight traffic have decreased by 1.2 per cent and 4.9 per cent respectively.
Other transport modes like inland waterways and coastal shipping are significantly used for freight transport. With an extensive coastline of 7,512 km, India has 12 major ports and 200 minor ports, of which, only 30 ports handle cargo traffic. The total traffic carried by both major and non-major ports in recent years was estimated to be 53 million tonnes. However, in terms of domestic freight movement, coastal shipping and inland water transport meet only about one per cent of the total freight traffic demand.
Major transport infrastructure of the State consists of 2.73 lakh km of road, 1588 km of railways, 1687 km of inland waterways and 18 ports with 585 km coastal route and4 airports. Roads play a prominent role in public transportation visa-vis-other modes of transportation owing to the geographic peculiarities of Kerala with a comparatively lesser rural urban divide and limited geographical area of 38,863 Sq. km. Kerala has a total fleet of 25,186 buses; of which 19,496 are private buses (77.4 per cent) and 5690 buses belonging to Kerala State Road Transport Corporation (KSRTC) comprising 22.6 per cent of the total fleet. Private buses dominate transport in all districts of Kerala except Thiruvananthapuram. The State has a rail network of 1,257 km route length with a total track length of 1,588 km, operating under the control of Palakkad and Thiruvananthapuram Railway Divisions. In Kerala, there are many water bodies like rivers, lakes, estuaries, backwaters etc. providing adequate scope for
Inland Water Transport (IWT) system having a length of 1,895 km to connect the rivers from one to another. Transportation by IWT is considered as the most efficient economic and environment friendly means of transportation. Transportation by coastal shipping is the mode for most bulk commodities and long hauling traffic. Kerala has the advantage of a 585 km coast line through which bulk cargos can be transported using multi –modal transhipment points along the coastline.
Kerala has one major port at Kochi, 17 minor ports and an upcoming international shipping terminal at Vizhinjam. Out of the 17 minor ports in Kerala, four are considered intermediate ports viz., Vizhinjam, Beypore, Azhikkal and Kollam based on berthing, cargo handling and storage facilities available in them. Kerala has four international airports viz., Thiruvananthapuram, Kochi, Kozhikode and Kannur.All civilian airports functioning in the State are international airports, a feature unique to Kerala. Kerala joined Tamil Nadu as the State with the maximum number of international airports on completion of Kannur international airport. Realising the advantages of mass transport system in meeting the intra city commuter needs of major cities, GoK has embarked on Metro Rail Project for Kochi. With the commissioning of Mass Rapid Transit System (MRTS), major urban corridors are expected to be decongested in these cities.
Transport Sector Roads are being maintained by various agencies in Kerala, like Local Governments, Public Works Department (PWD) (Roads and Bridges) and National Highways, Municipalities, Corporations, Irrigation, Forests, Railways etc. Other agencies involved in the road transport sector are National Transportation Planning and Research Centre (NATPAC), Motor Vehicles Department, KSRTC, Roads and Bridges Development Corporation of Kerala (RBDCK), Kerala State Transport Project (KSTP), Kerala Road Fund Board (KRFB) and Road Infrastructure Company Kerala (RICK) Ltd.

413Chapter 11, Infrastructure
Total road length in Kerala in 2017-18 is 2, 73,113.30 km. This includes classified and non-classified roads as stipulated by Indian Road Congress. The road traffic is growing at an average rate of 12 to 14 per cent every year, creating pressure on PWD road network. Road density in Kerala is 390 km/100 sq. km, which is roughly three times the national average. The length of road per lakh population is 686.55 km and almost 90 per cent of the road network is single lane. The National Highways, considered to be the primary network, carries 40 per cent of the total traffic, and the State Highways and Major District Roads (MDRs) – the secondary road network – carries another 40 per cent of the road traffic. Traffic has been growing at a rate of 10 to 11 per cent every year, resulting in excessive pressure on the roads of the State. Thus less than 10 per cent of the road network handles almost 80 per cent of the total traffic.
According to State Crime Records Bureau of Kerala, 4,172 deaths and 45,443 injuries were reported in Kerala in 2018 from 40,289 road accidents. NATPAC has identified 275 black spots in the State. Road traffic accidents are basically related to driver, road condition, vehicle and environment. Road Safety being a complex issue it requires consistent, prolonged and concerted efforts from various stakeholders to achieve the goals.
To create awareness about new technology transforming the future of transportation in Kerala, Government hosted an electric mobility expo and conference on June 29 and 30, 2019. 1 million electric vehicles will be launched on its
road by 2022 and a full-electric public transport system in the city of Thiruvananthapuram in 12 months as part of its ambitious target. Towards implementing charging infrastructure, the State has initiated steps to earmark e-mobility zones in popular tourist locations. The State-run Kerala Automobiles Limited (KAL) plans to manufacture up to 8,000 electric Kerala Neem-G auto rickshaws in a year and sign a contract with Swiss electric bus manufacturer HESS to assemble and manufacture e-buses.
The major development indicators of transport and communication sector in the State since 2011 are given in Appendix 11.1.1.
The outlay and expenditure in the transport sector in the Annual Plan 2018-19 and 2019-20 (expenditure up to September 2019) are given in Table 11.1.1.
Financial Performance in 2018-19 and 2019-20 (up to September 2019)
An amount of ₹1,45,432 lakh was provided as outlay in 2018-19 for roads and bridges sector and the expenditure reported in that period was ₹2, 26,061.00 (155.44 per cent). An amount of ₹9,115.00 lakh was provided as outlay in 2018-19 for road transport sector and the expenditure reported in that period was ₹2,077.88 lakh (22.80 per cent). In 2019-20, the outlay earmarked for Roads and Bridges Sector and Road Transport was ₹1, 36,713 lakh and ₹10,243 lakh. The corresponding expenditure reported was ₹95,456.09 lakh and ₹408.19 lakh respectively.
Table 11.1.1 Outlay and expenditure in the transport sector in the Annual Plan 2018-19 and 2019-20, expenditure up to September 2019, in ₹ lakh
Sl. No Sub Sectors Annual Plan 2018-19 Annual Plan 2019-20
Budgeted Outlay
Expenditure Expenditure per cent
Budgeted Outlay
Expenditure as on 9/19
Expenditure per cent
1 Port Department 12642.00 16116.72 127.49 11006.00 2963.88 26.932 Roads and Bridges 145432.00 226061 155.44 136713.00 95456.09 69.823 Road Transport 9115.00 2077.88 22.80 10243.00 408.19 3.994 Inland Waterways 12938.00 3939.75 30.45 13145.00 1620.85 12.33
Source: State Budget 2018-19 and 2019-20, Plan space
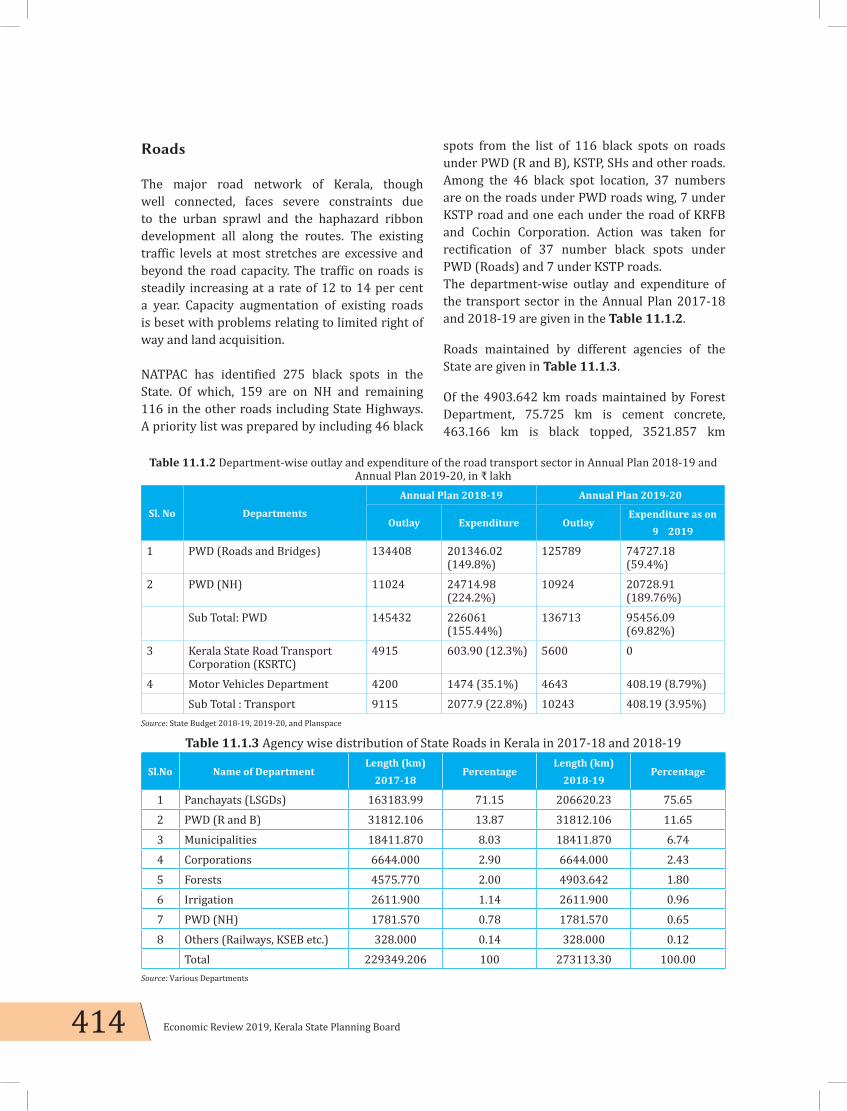
414 Economic Review 2019, Kerala State Planning Board
Roads
The major road network of Kerala, though well connected, faces severe constraints due to the urban sprawl and the haphazard ribbon development all along the routes. The existing traffic levels at most stretches are excessive and beyond the road capacity. The traffic on roads is steadily increasing at a rate of 12 to 14 per cent a year. Capacity augmentation of existing roads is beset with problems relating to limited right of way and land acquisition.
NATPAC has identified 275 black spots in the State. Of which, 159 are on NH and remaining 116 in the other roads including State Highways. A priority list was prepared by including 46 black
spots from the list of 116 black spots on roads under PWD (R and B), KSTP, SHs and other roads. Among the 46 black spot location, 37 numbers are on the roads under PWD roads wing, 7 under KSTP road and one each under the road of KRFB and Cochin Corporation. Action was taken for rectification of 37 number black spots under PWD (Roads) and 7 under KSTP roads.The department-wise outlay and expenditure of the transport sector in the Annual Plan 2017-18 and 2018-19 are given in the Table 11.1.2.
Roads maintained by different agencies of the State are given in Table 11.1.3.
Of the 4903.642 km roads maintained by Forest Department, 75.725 km is cement concrete, 463.166 km is black topped, 3521.857 km
Table 11.1.2 Department-wise outlay and expenditure of the road transport sector in Annual Plan 2018-19 and Annual Plan 2019-20, in ₹ lakh
Sl. No Departments
Annual Plan 2018-19 Annual Plan 2019-20
Outlay Expenditure OutlayExpenditure as on
9 2019
1 PWD (Roads and Bridges) 134408 201346.02 (149.8%)
125789 74727.18 (59.4%)
2 PWD (NH) 11024 24714.98 (224.2%)
10924 20728.91 (189.76%)
Sub Total: PWD 145432 226061 (155.44%)
136713 95456.09 (69.82%)
3 Kerala State Road Transport Corporation (KSRTC)
4915 603.90 (12.3%) 5600 0
4 Motor Vehicles Department 4200 1474 (35.1%) 4643 408.19 (8.79%)Sub Total : Transport 9115 2077.9 (22.8%) 10243 408.19 (3.95%)
Source: State Budget 2018-19, 2019-20, and Planspace
Table 11.1.3 Agency wise distribution of State Roads in Kerala in 2017-18 and 2018-19
Sl.No Name of DepartmentLength (km)
2017-18Percentage
Length (km) 2018-19
Percentage
1 Panchayats (LSGDs) 163183.99 71.15 206620.23 75.652 PWD (R and B) 31812.106 13.87 31812.106 11.653 Municipalities 18411.870 8.03 18411.870 6.744 Corporations 6644.000 2.90 6644.000 2.435 Forests 4575.770 2.00 4903.642 1.806 Irrigation 2611.900 1.14 2611.900 0.967 PWD (NH) 1781.570 0.78 1781.570 0.658 Others (Railways, KSEB etc.) 328.000 0.14 328.000 0.12
Total 229349.206 100 273113.30 100.00Source: Various Departments

415Chapter 11, Infrastructure
is earthen road and 842.904 km is metalled roads. The roads maintained by different Local Governments in 2018-19 is 2,06,620.23 km (75.65 per cent), of which 1,19,503.23 km (57.84 per cent) are black topped, 15,349.50 km (7.43 per cent) are cement concrete, 51,545.36 km are earthen roads (24.95 per cent), 10,547.76 km metalled roads (5.10 per cent) and others 9,675.36 km (4.68 per cent) with varying standards.
National Highways (NH)
The NH Wing of State PWD is responsible for the upkeep and development of NHs in the State, mainly through GoI assistance. There are 11 NHs comprising 1,781.50 km length within the State. Among the 11 NHs, the Walayar-Edappally NH544 (old NH47), Edappally-Aroor stretch of NH47 (new NH66) and Vallarpadam- Kalamassery NH 47C (newNH 966A) are being developed/maintained by NHAI. Upkeep of NHs, except 203 km is being done by State PWD with funds allocated by the Ministry of Road Transport and Highways (MoRTH), GoI. Maintenance of Urban links to NHs, road stretches bypassed due to NH bypasses etc. are with NH wing. Routine
maintenance, traffic safety works in National Highways, junction improvement works, bypass works, which are essential in the State, are being carried out through Kerala budgetary support. Central road fund allocation is also used for the development of State roads, i.e. State Highways and MDRs. The details are presented in Table 11.1.4.
Kollam and Alappuzha bypasses
Kollam and Alappuzha bypasses on the NH 47 are being implemented on a cost sharing basis between Central and State Governments. The total cost of the project is ₹700.48 crore and an amount of ₹350.24 crore as State share is included in the major infrastructure development project by the State Government.
The total length of Alappuzha bypasses (₹348.43 crore) is 6.8 km, of which 3.2 km is an elevated highway, from Kommady Junction to Kalarkode. The work commenced on March 16, 2015 under Engineering, Procurement and Construction (EPC) mode and is progressing. M/s RDS CVOC (JV) is the contractor of this EPC Project with a contract sum of ₹274.34 crore. The remaining
Table 11.1.4 National Highways (NH) in Kerala
Sl. No New No. Old No. From ToLength of New NH in
Kerala (km)
1 66 NH 17 Thalappadi Edappally 420.77 669.43NH 47 Edappally Kaliyikkavila 248.66
2 544 NH 47 Walayar Edappally 168.143 85 NH 49 Bodimettu Kundanoor 167.5934 744 NH 208 Kollam Kazhuthuruthy 81.2805 766 NH 212 Kozhikode Muthanga(Kerala– Karnataka
Border)117.600
6 966 NH 213 Kozhikode Palakkad 125.3007 183 NH 220 Kollam Theni(Tamil Nadu Border) 216.308 966 B NH 47 A Wellington
IslandKundanoor 5.920
9 966 A NH 47 C Vallarpadam Kalamassery 17.2010 183 A Bharanikkavu Pathanamthitta (via)
Vandipperiyar116.80
11 185 Adimaly Kumili (via) Painavu 96.00Total 1,781.50
Source: PWD (NH)

416 Economic Review 2019, Kerala State Planning Board
work is mainly related with the construction of railway over bridge for which sanction has been received from Railway Safety Commissioner. Subsequent works for removing OHE Cable are being made by the Railways. Only when this is completed, works associated with the superstructure of the railway over bridge can be continued. 98.5 per cent of the bye pass work is completed and expected to be commissioned in March, 2020.
The Kollam bypass, which starts from Kavanad and ends at Mevaram, is 13 km long with aggregate cost of ₹352.05 crore, and includes 3 major bridges, new 7 km road and widening of 4 km existing road. The work commenced on May 27, 2015 under EPC mode completed and inaugurated on January 15, 2019. The importance of Kollam bypass is that it touches 3 major National Highways-NH66, NH 183 and NH 744 passing through the State. The steps for four lining of Kollam bypass including construction of service roads have been started by NHAI. Instructions for installing bituminous hump at the connection points of the byroad to the bypass
for avoiding accidents were given. Installation of street lights from Kavanad to Mevarom is progressing. The Kerala Road safety Authority has taken steps for providing road safety measures including signals, cameras etc.
Coastal Highway
The coastal highway covers 654 kilometres from Manjeswaram in Kasaragod to Poovar in Thiruvananthapuram, passing through 9 districts. It will have connectivity with major ports such as Vallarpadam, Vizhinjam and Kollam. The cost of coastal highway, which is around ₹6,500 crore, will be allotted from the Kerala Infrastructure Investment Fund Board (KIIFB). Present status of coastal Highway is given in Table 11.1.5.
PWD Roads
Roads and Bridges wing of PWD is mandated to look after State Highways, MDRs and other District roads in the State. PWD roads constitute 18 per cent of the total road network in the State carrying nearly 80 per cent of the road
Table 11.1.5 Present status of Coastal HighwayDistrict Length (km) Stretch Present Status
Thiruvananthapuram 78.00 Kollenkode- Kappil Bridge Investigation started. Topographical sur-vey conducted with drone
Kollam 55.10 Kappil bridge- Azheekal Investigation completed. DPR being pre-pared by including market value of land
Alappuzha 82.10 Valiazheekkal- South Chellanam
Investigation started. Topographical sur-vey conducted with drone
Ernakulam 49.90 South Chellanam-Munambam Beach
Investigation started
Thrissur 63.90 Azheekode- Edakkazhiyoor DPR to be revised from 12 m to 14 m ROW
Malappuram 69.40 Singapore Palace Junction-Kadalundy
Work in progress for 15 km lemgth from Padinjarekara to Unniyal. Investigation completed for Mudiyapalam bridge, design in progress. Investigation completed for remaining stretches DPR in progress.
Kozhikode 102.45 Kadalundy- Poozhithala DPR in progress for 15 km, stretch. Re-maining in investigation stage.
Kannur 72.70 Mahe- Ramanthali DPR in progress for 23 km, remaining in investigation stage
Kasargod 80.70 Valiaparambha Beach- Thalapady
DPR in progress for 25 km, remaining in investigation stage
Total 654.25Source: PWD (NH)

417Chapter 11, Infrastructure
traffic within the State. The total length of roads maintained by PWD (Roads and Bridges) is 31,812.106 km in 2018-19, of which 4,341.651 km (13.65 per cent) is State Highways and 27,470.455 km (86.35 per cent) is Major District Roads (MDRs).
Out of the State highways of 4,341.651 km, 41.26 km is four lanes, 4,256.15 km is two lanes and remaining 44.24 km is single lane roads. Out of the 27,470.455 km of MDRs, 57.93 km is four lanes, 17,183.24 km is two lanes and remaining 10,229.17 km is single lane roads. The total length of two lane PWD roads is 21,439.39 km (67 per cent), four lane roads is 100 km (0.31 per cent) and single lane road is 10,273.41 km (32.3 per cent) of the roads owned by PWD.
Out of the total roads maintained by PWD (31,812.106 km), Kottayam District has the major share with a length of 3,456.214 km (10.86 per cent). Wayanad District has the lowest share with a length of 1,029.314 km (3.24 per cent). Details of District-wise and category-wise length of roads maintained by PWD (Roads and Bridges) as on March 31, 2019 is given in Appendix 11.1.2, 11.1.3, 11.1.4, and 11.1.5.
PWD Bridges
Bridges are the vital infrastructure elements of Roads and Highway network in all countries. 2,360 bridges in Kerala have been identified which need reconstruction/rehabilitation.
As on March 31, 2019, there are 2,360 bridges and 51,400 culverts on the PWD roads. Of them, 39 bridges need reconstruction/renovation and 1,557 culverts are not in good condition. Details are given in Appendix 11.1.6.
In 2018, a new wing for maintenance of the existing bridges and construction of new bridges has been started. There are 229 bridges identified for reconstruction, out of which 2 works are completed, 3 works nearing completion, 16 works are on-going and administrative sanction received for 25 works and in tender stage. There are 2 bridges completely damaged in flood, Kunderachollabridge in Palakkad and Periyavara bridge in Idukki. Reconstruction works of these bridges are nearing completion. At present there are 120 works sanctioned in Budget, 112 KIIFB projects and 25 NABARD works in progress and 9 works have been completed.
Major Initiatives of PWD (Roads and Bridges) in 2018-19 is given in the Box 11.1.1.
The State PWD is responsible for policy, planning, design, construction and maintenance of the State Highways, MDRs and the National Highways on behalf of the National Highway Authority of India (NHAI). State PWD performs an extremely vital role in the systemic provision of road infrastructure. However, they need to be reoriented to the current needs with emphasis on private sector participation and implementation of large scale projects through multilateral assistance from agencies like Japan Bank for International Cooperation (JBIC), World Bank and Asian Development Bank (ADB).
Box 11.1.1 Major initiatives of PWD, Roads and Bridges in 2018-19
• Initiatives to improve efficiency, quality and management of PWD• Design wing decentralised and Regional Design Offices formed.• Strengthened Investigation and Quality wing.• New units for road maintenance wing formed• With technical support from Central Road Research Institute (CRRI), 6,000 km roads (State
Highway) has been selected for implementing Road maintenance management system (RMMS) funded by World Bank
Source: PWD (Roads and Bridges), GoK

418 Economic Review 2019, Kerala State Planning Board
In 2018-19, development and improvement of roads for a total length of 2903.88 km have been carried out including 1507.426 km of BM and BC under various Plan schemes.This includes 628 km State Highways (111 km BM/BC)and 2276.19 km Major District Roads (541 km BM/BC). Construction of 3 bridges was completed under NABARD assistance.
Hill Highway
The proposed hill highway envisages the development of the much needed North- South corridor through the hilly regions by upgrading/improving the existing network optimally. The alignment of Hill Highway passes through all districts of Kerala except Alappuzha. Also, the alignment of Hill Highway passes through forest area in 8 districts and action is being taken for getting required area of forest land for the development of Hill Highway. Kerala Road Fund Board is the designated SPV of this project.
Total length of Hill highway is 1251.04 km and it is split up into different reaches for speedy implementation of the project. The DPR of 25 reaches has been prepared and submitted to KIIFB for financial sanction. The total length of these reaches is 656.576 km. Out of 25 reaches; KIIFB has accorded financial sanction for 18 reaches for a total amount of ₹1,506.24 crore. The total length of sanctioned reaches is 460.599 km. Work has been started in 7 reaches. The work of other sanctioned reaches will be taken up immediately on getting sufficient land for the project.
Kerala State Transport Project (KSTP)
KSTP-II is a World Bank assisted project and bank has approved a cost of ₹2,403 crore (US$445 million) for the project. Though the loan agreement with the Bank was signed on June 19, 2013, the effective date of the agreement was September 2013. Though the loan closure date was April 2019, it was extended to April, 2021. The disbursement ratio is 56 per cent by World Bank and 44 per cent by GoK for the eligible
items (except land acquisition and operation cost).
The objective of the project is to improve the riding quality of 363 km road section with enhanced road safety provisions. The project has three components. (1) Upgradation of 363km of road (2) road safety management and (3) institutional strengthening. The roads identified for improvement passes through about 87 villages covering eight districts. The project include innovative components like development of a demonstration safe corridor of 80 km, strengthening of Kerala Road Safety Authority and other institutions including PWD Road Safety Cell, Community Participatory Road and Asset Management Programmes, strengthening of Public Information and Grievance Redressal Cell in PWD and the pilot project on Road improvement through Public Private Partnership (PPP).
The following works are progressing under the project. The details are presented in Table 11.1.6.
Challenge Fund Program
Challenge fund falls under Component B-Road Safety Management as per the World Bank’s Project Appraisal Document (PAD) for KSTP-II programme. The objective of this programme is to develop, through local partnerships, another five “Safe Corridors/Zones” across the State. The Challenge Fund is intended to elicit innovative road safety proposals in a collaborative effort between local road user stakeholder groups and DRSCs, KRSA, PWD and KSTP. The Challenge Fund will target high risk locations with opportunities to address highly vulnerable road users (pedestrians, cyclists, motor cyclists). The evaluation criteria for the fund will be based on the accident history, innovativeness of approach and the extent of local participation and commitment.
The following works are progressing under the Challenge Fund. The details given in Table11.1.7.

419Chapter 11, Infrastructure
Reconstruction/Restoration of the roads damaged due to the floods and landslides in 2018- Rebuild Kerala Initiative (RKI)
As part of the Rebuild Kerala Initiative (RKI), KSTP had undertaken reconstruction/ restoration of the roads damaged due to the floods and landslides in 2018 and to make them traffic worthy. For this purpose, 62 roads (1,600 km) were proposed by the PWD Roads Wing with a preliminary cost estimate of ₹2,807
crore. Two roads covering the worst affected Idukki district was proposed for immediate World Bank assistance under KSTP. DPR for the Painavu-Thannikandom-Asokkavala road (21 km) and Chemmannar Gap road (29.940 km (except 10.650 km)) in Idukki district and Adoor-Chengannur road (23.80 km) were prepared and the works are now been tendered using the savings amount of KSTP Phase- II.
Table 11.1.6 List of completed and on-going projects with State fund, 2018-19, in ₹ crore
Sl.No Name of workRevised contract amount
Financial Progress as on
31.3.2019
Physical Progress
(%)Remarks
1 UG – 1 Kasaragod – Kanghangad Road (27.78 km)
114 110.50 100 Completed
2 UG – 2 Pilathara – Pap-pinisserry Road (20.90 km)
102 97.54 100 Completed
3 UG – 3A Thalassery – Kalarode Road (28.80 km) (Re-arranged)
156 86.42 60 Re arranged work in progress. Expected date of completion March 2020
4 UG – 3 B-Kalarode – Valavupara Road (25.20 km) (Re-arranged)
200 166.79 80 Re arranged work in progress. Expected date of completion December 2019 (except two bridges)
5 UG – 4-Chengannur Et-tumanoor Road (45.40 km)
288 275.47 100 Completed
6 UG – 4 A Thiruvalla bypass (2.3 km)
37.04 6.17 21.54 Re arranged work in progress. Expected date of completion- March 2020.
7 UG-4B-Thiruvalla Town (1.9 km)
7.77 0.81 21.34 Work in progress. Expected date of completion December 2019.
8 UG -5-Ettumanoor – Muvattupuzha Road (40.96 km)
159 163.67 100 Completed
9 UG – 6-Ponkunnam –Thodupuzha Road (50 km)
270 231.95 100 Completed
10 UG – 7-Perumbilavu – Perintalmanna Road (41 km)
210 7.5 100 With limited scope of overlay in existing surface – completed and expenditure is only ₹10.00 Cr and savings is ₹210.00 Cr
11 Safe Corridor Demon-stration Project Kazha-kuttam – Adoor
142.67 75.42 65.29 Work in progress. Expected date of completion December 2019.
Source: KSTP

420 Economic Review 2019, Kerala State Planning Board
Kerala Road Fund Board (KRFB)
KRFB is a statutory body under the State Government established by the Kerala Road Fund (KRF) Act 2001. The Board mainly implements the city road improvement projects on Public Private Participation (PPP) mode. The Thiruvananthapuram city road improvement project has been implemented by KRFB on PPP (annuity) mode involving the development of more than 43 km of roads in the capital city and its maintenance for 15 years after construction. The construction works under the project have been completed, and now maintained on annuity payment mode. KRFB has initiated the Kozhikode city road improvement project Phase I, which involves development of 22.251km of road (6 Corridor) at a total cost of ₹401.42 crore. The project is being taken up on Design, Build, Finance, Operate and Transfer (DBFOT) – annuity mode. The work commenced on January 5, 2016 and the Concessionaire has completed the entire works by December 15, 2017, before the scheduled project completion period. The Annuity amount is ₹46.22 crore. Other projects initiated by KRFB are Kozhikode City Road Improvement Project-Phase 1, Alappuzha City Road Improvement Project-Phase 1A, Kannur City Road Improvement Project, Kozhikode City Road Improvement Project-Phase 1B (Manachira- Vellimadukunnu road), Alappuzha City Road Improvement Project-Phase 1B(Muppalam Junction Improvement), Alappuzha City Road Improvement Project-Phase 2, Kollam City
Road Improvement Project, Kottayam City Road Improvement Project, Malappuram City Road Improvement Project, Kozhikode City Road Improvement Project-Phase 2, Thrissur City Road Improvement Project and City Road Improvement Projects in six towns.
The Thiruvananthapuram City Road Improvement Project, the first PPP project in the State has completed 42.54km length. Now the project is under O and M. Kozhikode City Road Improvement Project-Phase 1 with 22.251 km in 6 corridors was completed in December, 2017on DBFOT – Annuity basis.
Road Infrastructure Company Kerala Limited (RICK)
RICK Limited is a special purpose vehicle incorporated under Indian Companies Act, 1956 by KRFB. GoK had taken initiative to implement State Road Improvement Project (SRIP) aimed at the development of selected State Highways and MDRs. There are two packages under the SRIP-Rehabilitation under PPP annuity mode and the upgradation with funding from multilateral funding agencies. The Rehabilitation package is intended to improve 83 km of roads in two packages A and B in Thiruvananthapuram, Kottayam and Kasargod Districts at a total cost of ₹209.91 crore.
Government had approved the lowest bid of package – A (modified) and package – B at semi annuity of ₹10.73 crore and ₹18.70 crore respectively. The concessionaires are to be given
Table 11.1.7 Works progressing under Challenge Fund, in ₹ croreSl. No. Proposals received from
DRSCProject Corridor Length of
CorridorCost (₹
crore)
1 Kozhikode Pavangad- Korapuzha (civil work awarded)
5.5 km 10.00
2 Thiruvananthapuram Medical College-Kannamoola-Pettah 5.0 km 7.503 Kollam Kottiyam- Kundara PWD Road 11.6 km 5.004 Ernakulam Vypin-Munambam (e-Yatra Project) 25 km 10.025 Thrissur Thrissur-Kunnamkulam Road 24.3 km 4.00
Total 74.5 km 43.52Source: KSTP

421Chapter 11, Infrastructure
grants of ₹14.9 crore and ₹21.5 crore respectively for Package – A (Modified) and Package – B in 5 instalments during construction period according to the phase of completion of works. Major activities of RICK in 2018-19 are given in Box 11.1.2.
Research and Development in Road Sector
Research and development activities play an anchoring role in developing innovative models and techniques to address the challenges in modernising the road system in general and technology up gradation with cost effective infrastructure measures in particular. Design, Research, Investigations and Quality Control Board (DRIQ Board), Kerala Highway Research Institute (KHRI) and National Transportation Planning and Research Centre (NATPAC) are the research organisations engaged in research and development of the road sector at present.
1. PWD (Design wing)
• The main activities of the Design Wing are structural design of Bridges, Buildings, DPR preparation of Roads and Bridges, Quality Control of PWD Projects, Research and Advanced Training to staff of PWD. DPR preparation of improvement of Ottappalam- Cherpulassery Road-11 km in Palakkad,Vaikkom-Toll Chemmankari Road-7.5 km (Kottayam District) and Adoor Thumpamen Kozhenchery road- 21.89 km (Pathanamthitta District) has been completed. Designing of 160 bridges at an approximate amount of ₹2021 crore finalised.
2. Kerala Highway Research Institute (KHRI)
• KHRI, the regional office is the quality control wing mandated with the task of assuring quality in works undertaken by PWD. Quality control sub division of
Box 11.1.2 Major activities of RICK in 2018-19
1. Rehabilitation Package under DBFMT – Annuity mode
a. Package A under State Road Improvement Project Construction of two roads under Package A– Uppala – Kaniyana Road (9.4 km) and Vidya Nagar – Seenthangoli Road (15.6 km) with project cost of ₹81.00 crore. The work started on August 26, 2016 with one year construction period and 14 years of maintenance period. The scheduled date stipulated for the completion of construction work was on August 25, 2017. The Commercial Operation date commenced on June 13,2017. The Final Completion Certificate under this package was issued on November 1, 2017 and Operation and Maintenance period is in progress.
b. Package B under State Road Improvement Project Construction of two roads under Package – B, commenced on August 2016. Kanjirappally- Kanjiramkavila Road (36.10km) and Vellanad-Arynadu – Chettachel Road (21.90km) at a project cost of ₹128.91 crore). The construction period is two years and maintenance period is 13 years commenced on April 2, 2018. The Final Completion Certificate of the work was issued on October 27, 2018 and the project is undergoing Operation and Maintenanceperiod after that.
2. New Schemes in State Road Improvement Project Karamana-Vellarada Road
Source: Road Infrastructure Company Kerala Ltd.
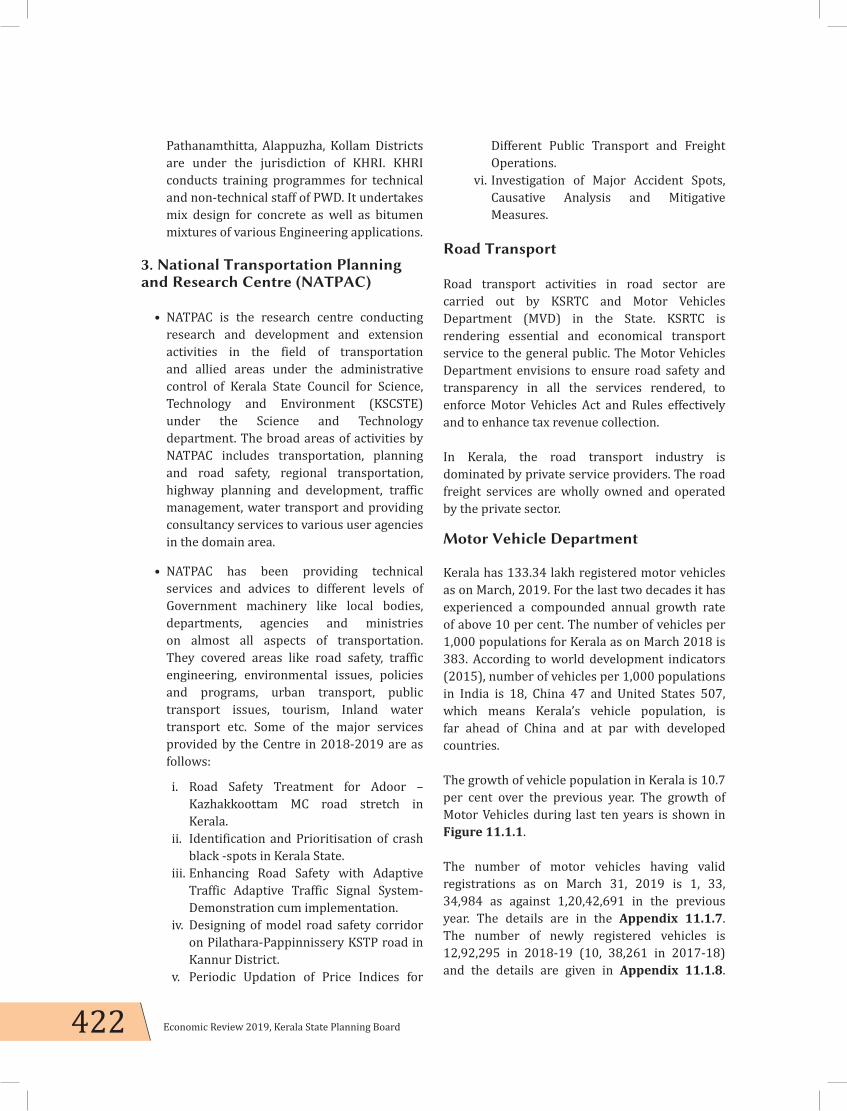
422 Economic Review 2019, Kerala State Planning Board
Pathanamthitta, Alappuzha, Kollam Districts are under the jurisdiction of KHRI. KHRI conducts training programmes for technical and non-technical staff of PWD. It undertakes mix design for concrete as well as bitumen mixtures of various Engineering applications.
3. National Transportation Planning and Research Centre (NATPAC)
• NATPAC is the research centre conducting research and development and extension activities in the field of transportation and allied areas under the administrative control of Kerala State Council for Science, Technology and Environment (KSCSTE) under the Science and Technology department. The broad areas of activities by NATPAC includes transportation, planning and road safety, regional transportation, highway planning and development, traffic management, water transport and providing consultancy services to various user agencies in the domain area.
• NATPAC has been providing technical services and advices to different levels of Government machinery like local bodies, departments, agencies and ministries on almost all aspects of transportation. They covered areas like road safety, traffic engineering, environmental issues, policies and programs, urban transport, public transport issues, tourism, Inland water transport etc. Some of the major services provided by the Centre in 2018-2019 are as follows:
i. Road Safety Treatment for Adoor – Kazhakkoottam MC road stretch in Kerala.
ii. Identification and Prioritisation of crash black -spots in Kerala State.
iii. Enhancing Road Safety with Adaptive Traffic Adaptive Traffic Signal System-Demonstration cum implementation.
iv. Designing of model road safety corridor on Pilathara-Pappinnissery KSTP road in Kannur District.
v. Periodic Updation of Price Indices for
Different Public Transport and Freight Operations.
vi. Investigation of Major Accident Spots, Causative Analysis and Mitigative Measures.
Road Transport
Road transport activities in road sector are carried out by KSRTC and Motor Vehicles Department (MVD) in the State. KSRTC is rendering essential and economical transport service to the general public. The Motor Vehicles Department envisions to ensure road safety and transparency in all the services rendered, to enforce Motor Vehicles Act and Rules effectively and to enhance tax revenue collection.
In Kerala, the road transport industry is dominated by private service providers. The road freight services are wholly owned and operated by the private sector.
Motor Vehicle Department
Kerala has 133.34 lakh registered motor vehicles as on March, 2019. For the last two decades it has experienced a compounded annual growth rate of above 10 per cent. The number of vehicles per 1,000 populations for Kerala as on March 2018 is 383. According to world development indicators (2015), number of vehicles per 1,000 populations in India is 18, China 47 and United States 507, which means Kerala’s vehicle population, is far ahead of China and at par with developed countries.
The growth of vehicle population in Kerala is 10.7 per cent over the previous year. The growth of Motor Vehicles during last ten years is shown in Figure 11.1.1.
The number of motor vehicles having valid registrations as on March 31, 2019 is 1, 33, 34,984 as against 1,20,42,691 in the previous year. The details are in the Appendix 11.1.7. The number of newly registered vehicles is 12,92,295 in 2018-19 (10, 38,261 in 2017-18) and the details are given in Appendix 11.1.8.

423Chapter 11, Infrastructure
Personal vehicles have recorded a faster growth rate over the previous year. The revenue earned by Kerala Motor Vehicles Department through vehicle tax and others has risen from ₹1,831.15 crore in 2012-13 to ₹3,625.31 crore in 2018-19 and ₹1,765.77 crore in 2019-20 till September. The percentage of category-wise motor vehicles registered in 2018-19 is shown in Figure 11.1.2.
The District-wise growth of motor vehicles numbers in Kerala is given in Appendix 11.1.9. The highest vehicle population was recorded in Ernakulam District with 19,45,451 vehicles (14.6 per cent) followed by Thiruvananthapuram with 16,64,565 (12.5 per cent). Wayanad District has the lowest number of 2,06,476 (1.5 per cent) vehicles. Category-wise growth of motor vehicle registrations in Kerala during 2011to 2019
is given in Appendix 11.1.10. The mismatch between growth in motor vehicles and the capacity augmentation of roads has resulted in increasing traffic congestion and road accidents throughout Kerala.
The slowdown in auto sector sales is given in Box 11.1.3.
Major schemes implemented by Motor Vehicles Department are road safety measures, establishment of vehicle testing stations and modernisation of check posts. The department has commissioned heavy computerised vehicle testing station at Kozhikode and driver testing tracks at Uzhavur and Muvattupuzha. Under Radar Surveillance System, with the help of Speed and Red Light Violation Detection Cameras, so
Figure 11.1 .1 Growth of motor vehicles since last ten years
Source: Motor Vehicles Department, GoK
Figure 11.1.2 Distribution of motor vehicles registered by type in 2018-19
Source: Motor Vehicles Department, GoK

424 Economic Review 2019, Kerala State Planning Board
far 17, 64,430 offences were booked and ₹16.33 crore collected. The budgetary support to Motor Vehicle Department is mainly for administrative, governance and regulatory infrastructure, road safety initiatives as well as human resource development.The scheme-wise outlay and expenditure of Motor Vehicles Department in 2018-19 and 2019-20 (expenditure up to September 2019) is given in Table 11.1.8.
Physical achievements of MVD in 2018-19
• The revenue earned by the department has fallen from ₹3651.8 crore in 2017-18 to ₹3625.31 crore in 2018-19. In 2019-20 (up to June) the revenue collection was ₹805.20 crore.
• Introduced VAHAN and SARATHY online portal for vehicle registration and driver licencing.
• Six new RTO sub offices in various districts came into effect.
• Launched GPS enabled Vehicle Tracking System.
• Launched “Safe Kerala Project” through 85 squads comprising RTO’s, MVI’s and AMVI’s totalling 368 No’s.
• Established Hi Tech Regional Transport Office at Thiruvananthapuram.
• Commissioned Heavy Computerised Vehicle Testing Station at Kozhikode, Computerised Driver Testing Tracks at Uzhavur and Muvattupuzha and Automated Enforcement Control Room at Kozhikode.
Box 11.1.3 Slowdown in Auto Sector Sales
The automobile sector registration fell into a new low in September, 2019. The passenger vehicle retail sales in September declined 20.1 per cent to 1, 57,972 units against the same period last year.
In the two-wheeler segment, the retail sales declined by 12 per cent year-on-year (YoY) to 10, 98,271 units in last month, as against 12,48,998 units in September 2018. Commercial vehicle sales dropped by 18.5 per cent, i.e., to 63,518 units against 77,980 units in September last year. Three-wheeler sales saw an increase of 1.8 per cent to 55,553 units last month from 54,560 units in the same period in the previous year. Total sales across categories declined by 12.9 per cent to 13, 75,314 units in September as against 15, 79,191 units in the same month last year.
The continued heavy monsoons in most places, the Shraddh period and the uncertainty on GST reduction contributed to this sales lag.
Source: Federation of Automobile Dealers Associations (FADA)
Table 11.1.8 Scheme-wise outlay and expenditure of Motor Vehicles Department in 2018-19 and 2019-20 (expenditure up to September 2019), in ₹ lakh
SchemesAnnual Plan 2018-19 Annual Plan 2019-20
Outlay Expenditure Outlay Expenditure
Road Transport Safety Measures 1825 707.1 1400 0Implementation of E-governance in the M.V. Dept 24 19.36 132 0Vehicle cum Driver Testing Stations 1700 733.1 675 200.61Modernisation of MV Check Posts 500 14.47 1050 0Setting up of Model Inspection and Certification Centre 1 0 1 0Motor Vehicle Department-Establishment of new Sub Offices 150 0 188 0
E- Mobility Promotion Fund 1197 207.58
Total 4200 1474 (35.1 per cent) 4643 408.19
(8.79 per cent)
Source: Planspace

425Chapter 11, Infrastructure
E-Governance Initiatives
Government aims to strengthen web based database of the vehicles and adopt E-Governance for online payment of taxes, registration, modern methods of vehicle tracking and monitoring systems, covering Electronic Road Pricing (ERP) system to decongest and reduce accident prone locations.
Automatic Driver Licensing System and Automatic Vehicle Testing System
1. All RTOs to install automatic driver licensing systems and vehicle testing systems accompanied by live road test.
2. Strict test and usage of indicators and seatbelt.
3. Piloted Vahan for Vehicle registration and Sarathy for driver licenses.
Vahan and Sarathi-Web based Software
Vahan-4 (web based application software intended to carry out the works related to Vehicle registration) and Sarathi-4 (web based application software intended to carry out the works related to Driving Licenses) are intended for use across the country. Vahan and Sarathi facilitated with Smart Card/Plastic Card based licenses and Registration certificates are far superior to current laminated cards.
Road Safety
Even though several initiatives have been taken by the Police to enforce road discipline and enforcement of rules by Motor Vehicles Department, road accidents are increasing. The increasing trend of traffic accidents is a matter of great concern. The analysis of figures from 1980-81 onwards shows that an increase in the number of accidents was steady from 7,064 in 1980-81 to 20,900 in 1990-91 and 34,387 in 2000-01 and 35,282 in 2010-11 and 39,137 in 2015-16. The number of accidents decreased to 38,734 in 2017-18. The bigger States like Uttar Pradesh,
Gujarat and Rajasthan report far less number of accidents compared to Kerala. The District-wise motor vehicle accidents in Kerala and the category-wise details of motor vehicles involved in road accidents are given in Appendix 11.1.11 and 11.1.12 respectively.
From January to September 2019, Kerala registered 31,686 accidents. Accidents due to KSRTC buses were 664 and other bus was 2,349. The number of two wheelers has increased from 77.97 lakh in 2017-18 to 86.20 lakh in 2018-19, recording average annual growth rate of 10.5 per cent. The number of traffic crashes involving two wheelers has decreased from 34,473 (94 per day) in 2018 to 16,785 (46 per day) in 2019. Bike accidents account for nearly 41 per cent and Motor Cars for 28 per cent respectively of the total accidents reported in the State. Trend of Motor Vehicle Accidents in Kerala is presented in Figure 11.1.3.
The accidents per lakh vehicles registered in the State was 322 in 2017-18 was reduced to 305 on 2018-19. Growth of accidents in the State during the last ten years is given in Table 11.1.9. It can be seen that the accident occurrences had exhibited fluctuation during various time periods although not showing any definite patterns of growth or decline. But it is to be highlighted that there is a constant decrease in accidents/lakh vehicles every year since 2010.Most of the accidents are attributable to the fault of drivers as per records available with traffic police. However, deficiencies in road design also affect motor vehicles, a fact generally overlooked as bad road conditions. Road safety training for various categories of road users, rectification in road design, deficiencies in inclusion of road safety aspects in the planning and operation stages of road construction are the primary facts to be taken up for reducing accidents. The percentage of vehicle category-wise accidents in Kerala in 2018-19 is shown in Figure 11.1.4.

426 Economic Review 2019, Kerala State Planning Board
Kerala State Road Transport Corporation (KSRTC)
KSRTC is the single largest public sector undertaking, carrying out passenger transport operations in the State. The gross revenue earning of KSRTC increased from ₹2,006.37 crore to ₹2,277.00 crore in 2018-19. The gross revenue expenditure in 2018-19 is ₹2554.00 crore compared to ₹2,621.00 crore in 2017-18 and operating loss in 2018-19 period is ₹227.00 crore compared to ₹614.93 crore in 2017-18.
Out of 5,690 buses of KSRTC, 1,693 (29.75 per cent) buses are ten or more year’s vintage. In 2019, the number of buses on wet lease basis and electric is 10 each. The age-wise details of
buses owned by KSRTC are given in Appendix 11.1.13. The average earning per vehicle per day on road of the corporation has increased from ₹11,872 in 2017-18 to ₹13,450 in 2018-19. The major indicators showing operational efficiency and District-wise operational statistics of KSRTC are given in Appendix 11.1.14 and 11.1.15 respectively.
The fares charged by KSRTC were 70 paise per km in ordinary and city buses in 2018-19. The fares of super-fast buses are 78 paise per km, 100 paise to super deluxe services, 120 paise for A/C Air bus and 145 paise for high-tech Volvo buses. The fare structure of KSRTC is given in Appendix 11.1.16.
As part of fleet renovation KSRTC has introduced
Figure 11.1.3 Trend of motor vehicle accidents in Kerala
Source: State Crime Records Bureau
Table 11.1.9 Accident trend in Kerala in 2010 -2019Year No. of Motor Vehicles No. of Accidents Accidents/lakh vehicle
2010 53,97,652 35,633 6602011 60,72,019 34,946 5762012 68,70,354 35,282 5142013 80,48,673 37,204 4622014 85,47,966 35,198 4122015 94,21,245 37,253 3952016 1,01,71,813 39,137 3852017 1,10,30,037 38,777 3512018 1,20,42,691 38,734 3222019 1,33,34,984 40,686 305
Source: Motor Vehicles Department and State Crime Record Bureau

427Chapter 11, Infrastructure
multi axle buses like Scania on wet lease basis from its dealers and operated in inter -State routes. The District-wise details of operational statistics are given in Appendix 11.1.17. Financial performance of KSRTC is not in tune with its physical achievements due to an increase in operating expenditure, hike in pension commitments, increase in interest payments, operation in uneconomic routes and the granting of concessional travels leading to increasing losses for the corporation.
Private operators are dominant in passenger transport operation in the State. Fleet utilisation of KSRTC is only 88.3 per cent. More than 29.8 per cent of the vehicles are over aged. Staff per
bus ratio is as high as 7.00. The number of buses owned by KSRTC is given in Appendix 11.1.18. The major internal indicator of KSRTC is given in Box 11.1.4. The operational efficiency of KURTC is given in Appendix 11.1.19.
Heavy losses due to operational inefficiency, high bus/staff ratio, operation in uneconomic routes and unviable depots are some of the issues/challenges faced by KSRTC. A professional techno economic study needs to be done to identify and suggest measures to deal with the critical issues/challenges faced by KSRTC.
KSRTC is looking forward a radical change in the sector which intends to provide amenities to the travelling public through implementing various
Figure 11.1.4 Details of road accident by vehicle type in Kerala in 2018-19
Source: State Crime Record Bureau
Box 11.1.4 Major internal indicators of KSRTC in 2018-19
• Average Fleet held: 5679• Average Fleet operated: 4548• Average age of Fleet (Years): 10• Over aged vehicles: 17 No’s• Staff strength: 31844• Staff per bus ratio (fleet held): 5.6• Staff per bus ratio (fleet operated): 7.00• Staff productivity (km/staff/day): 580• Fuel efficiency (km/litre of HSD): 4/Ltr.• Occupancy Ratio: 612
Source: Kerala State Road Transport Corporation

428 Economic Review 2019, Kerala State Planning Board
Plan schemes/programmes during the 13th Five Year Plan.
The scheme-wise outlay and expenditure of KSRTC in 2017-18 to2019-20 (expenditure up to October, 2019) is given in Table 11.1.10.
Achievements in 2018-19
KSRTC procured 10 electric buses on wet lease basis. Out of this 5 buses are operating from Thiruvananthapuram City depot and remaining 5 are operating from Ernakulam Depot in Ernakulam City.
Kerala on e- track
Kerala is one among the five States after Karnataka, Andhra Pradesh, Maharashtra and Telangana which announced their own electric vehicle policy to encourage e-mobility suggested by the NITI Aayog. It has also set an ambitious target of 10 lakh electric vehicles by 2022 and fully electrifying all classes of motor vehicles by 2030.
The Kerala State Electricity Board Ltd (KSEB) has already announced its plan to set up electric vehicle (EV) charging stations across the State especially in Thiruvananthapuram, Kochi
and Kozhikode in the first phase. The KSEB has identified 52 places for setting up public charging stations-Thiruvananthapuram-18 locations followed by Kochi with 17 locations and Kozhikode with 16 locations. It will cost around ₹10.92 crore for setting up these stations in the first phase.
As an emerging sector, apprehensions and concerns over the effectiveness of these electric vehicles are aplenty. The Government is giving priority for bringing in shift in the three-wheeler and two-wheeler segments in the State, which is more poised to bring in an immediate paradigm shift in the sector. The main challenge is the cost and size of the lithium-ion battery being used in electric vehicles. Though necessary charging stations are set up, it will be an uphill task considering the production of electricity and its consumption pattern in Kerala. Details of electric vehicles registered is given in Table 11.1.11.
Issues, Challenges and Way Forward in Road Transport Sector
Most of the roads in the State do not have adequate width to address the existing level of traffic, only one fourth of the roads have either two lanes or four lane capacity while most of the roads have single lane or intermediate lane
Table 11.1.10 Scheme-wise outlay and expenditure from 2017-18 to 2019-20, in ₹ lakh
Sl No Scheme/ Components ObjectivesAnnual Plan
2017-18Annual Plan
2018-19Annual Plan
2019-20
Outlay Exp. Outlay Exp. Outlay Exp.
1 Development of Infra-structure and Modernisa-tion of workshops
To improve the basic amenities in the bus depots
990 560 3464 0 3450 0
2 Total Computerisation and E-Governance in KSRTC
Intended for sustaining the IT initiatives
1210 0 1330 0 2030 0
3 Providing Training to Drivers, Technical Person-nel and Officers
Training and capacity building within the Organi-sation
110 0 120 0 120 0
4 Modernisation and Qualitative Improvement of Fleet
Purchase of new electrical CNG/LNG buses as per Euro standards
2158 0 1 0
Total 4468 560 4915 603.90 5600 0Source: Planspace
429Chapter 11, Infrastructure
capacity. In the case of National Highways, only about 12 per cent of the roads have four lane capacities while the remaining roads have only two lanes or intermediate lane capacity. Bulk of the inter-city and interstate traffic is carried out by the National and State Highways which are only 8 per cent of the total network. Considering the demand supply gap, there is a huge need for up gradation of existing road network. The existing road network has to undergo a qualitative improvement with the aim to reduce traffic congestion and delay, easy access to destinations and reduction in accident risks. Most of the PWD roads have to undergo massive upgradation with widening and incorporating road safety features.
An action plan should be made for prioritising the road works in the State. Major emphasis should be given to widening the State Highways and MDRs along with professional design and adequate drainage facilities. The new road development initiative like the National Highway 4 laning, hill highways, coastal highways, bypasses etc. needs to be completed during the 13th Five Year Plan period.
There is a need to undertake futuristic development of State Highways, important MDRs and city roads in the State, through geometrical improvement, junction improvements, covering
pedestrian facilities, utility ducts, re-laying the roads incorporating technical corrections and entering into maintenance contracts. Road side parking is another issue to be addressed to improve the level of service.
Co-ordination between the physical infrastructure providers-PWD, Railways, Inland Transport Authority, Airports and Coastal Shipping Agencies to build transport infrastructure, operate and maintain the existing ones are required. Physical infrastructure has to be designed to support an intermodal transport network.
Rail Transport
The Indian Railway system is the second largest network in the world under a single management. It provides one of the cheapest means of transport in India.The Indian Railways route length network is spread over 1,15,000 km, with 12,617 passenger trains and 7,421 freight trains each day from 7,349 stations plying 23 million travellers and 3 million tonnes (MT) of freight daily. It is the fourth largest network in the world after USA, Russia and China. Kerala occupies a significant position on the Indian Railways map with 1,257 route km and 1,588 km of total track. Thiruvananthapuram and Palakkad divisions of the Southern Railways
Table 11.1.11 Details of electric vehicles registered Sl. No. Type of vehicle Number of e-vehicle registered.
Transport Vehicle1 Electric auto Rickshaw 412 Three wheeler goods 253 E Rickshaw 644 Motor Cab 1Total 131Non Transport1 Motor Cycle 992 Motor Car 203 Three wheeler 24Total 143Grand Total 274
Source: Motor Vehicles Department

430 Economic Review 2019, Kerala State Planning Board
are the administrative Divisions. Palakkad Division has a total route length of 577.74 km. Palakkad Division operates 99mail/express and 60 passenger trains and 64 freight trains. Thiruvananthapuram division has a total route length of 623 km. It operates about 170 mail/express /passenger trains and 8 goods trains per day. All the railway lines passing through the State have been converted into broad gauge. There are about 200 railway stations in the State (95 under Palakkad Division and 105 under Thiruvananthapuram Division). In 2018-19, electrified rail route under Thiruvananthapuram Division is 1,197 km and received a revenue earnings of ₹1,703.67 crore. Doubling and electrification works are in progress in various parts of the State. Feasibility studies for some new lines are also underway in the rail sector.
Kerala Rail Development Corporation (KRDCL)
KRDCL, a joint venture (JV) company between GoI and GoK, has been formed with the objective of taking up major railway infrastructure development projects in Kerala on a cost sharing mode. The Joint Venture (JV) is registered with an equity share of 51 per cent and 49 per cent between GoK and GoI and proposes to take up
the upcoming railway projects in Kerala through project specific SPVs.
The JV Company has an initial paid up capital of ₹100 crore based on the quantum of projects to be undertaken. The authorised equity share capital and paid up capital can be enhanced from time to time with the approval of Ministry of Railways (Railway Board) and the State Government. Total land required for the project as on May 2019 was 1,226.45 Ha. Of which, 1,074.19 Ha is private land. 107.98 Ha is Government Land and 44.28 Ha is railway land along the existing line. Status of the projects identified by KRDCL is given in Table 11.1.12.
Thiruvananthapuram-Kasaragod Semi High Speed Rail
The train traffic in the existing double line between Thiruvananthapuram and Kasaragod has increased manifold and some of the sections have capacity utilisation of more than 115 per cent. In order to meet the growing demand of rail passenger traffic, the GoK has taken up the initiative to provide 3rd and 4th Railway line between Thiruvananthapuram and Kasaragod as a Semi High Speed Rail (SHSR) corridor in which the train can run with a maximum operational
Table 11.1.12 Major Initiatives of KRDCL project in 2018-19Sl.No Projects Present Status
1 Construction of New BG line between Thalassery and Mysore via Mananthavady
• Preliminary / Pre-feasibility report has been prepared by KRD-CL and was submitted to Railway Board.
• Railway Board has given approval for DPR preparation.• Proposed alignment has been submitted to Karnataka Govern-
ment.2 Construction of new BG Line
from Nilambur to Nanjangud• KRDCL has conducted a study and suggested a common gate
way across the Western Ghats in the forest areas of Kerala and Karnataka, to meet the requirements of both Nilambur-Nanjan-gud and Thalassery – Mysore.
3 Construction of 27 ROBs/ RUBs in Kerala coming under both Railway Division of Palakkad and Thiruvananthapuram
• General Arrangement Drawings (GAD) for 27 ROBs have been handed over to Southern Railway for approval. Out of which, 6 has been approved.• Estimation and DPR preparation is in progress.• Administrative sanction for land acquisition from Revenue
Department has been received for all ROBs• The administrative sanction from PWD department for land
acquisition is awaited. • The draft MoUs – between GoK and Ministry of Railways, GoK
and KRDCL, Railways and KRDCL are currently with Southern Railway for approval
Source: Kerala Rail Development Corporation Ltd

431Chapter 11, Infrastructure
speed of 200kmph and can reach north to south in4 hrs. The Kerala Rail Development Corporation Limited has prepared the feasibility study report for the above project through M/s Systra, Paris and arrived at a completion cost of ₹66,079 crore over construction period of approximately 5 years.
The Technical/ Design specification of Thiruvananthapuram-Kasaragod Semi High Speed Rail is given in Table 11.1.13. The line will reduce pollution on the roads and congestion, improve safety and reduce dependence on imported oil. The SHSR line is also expected to depend on renewable energy and also tries innovation in solar generation across corridor in trains, via-ducts, walls and energy efficient stations and depots. Planned urban development of the cities along the corridor, and development of new cities along the SHSR line can be used to drive benefits for the socio-economic development in the regions served by the line.
Kochi Metro Rail Project (KMRP)
KMRP is the flagship project of the GoK designed to address the transportation woes of Kochi City. The project is implemented through the Kochi Metro Rail Ltd (KMRL) which is a SPV
jointly owned by the GoK and GoI through equity participation. The GoI gave sanction for the project in July 2012 at a total cost of ₹5,181.79 crore for Aluva-Pettah 25.612 km stretch, on a fully elevated metro viaduct with 22 stations. KMRL has signed an agreement with GoI and Delhi Metro Rail Corporation Ltd (DMRC) for executing the project as per the tripartite agreement signed between Govt. of India, Govt. of Kerala and KMRL. The details of the on-going project are given in Table 11.1.14.
Reach I-from Aluva to Palarivattom, with a section length of 13.4 km and 11 stations was commissioned on June 19, 2017. Reach II A-from Palarivattom to Maharajas College a section length of 4.96km and 5 stations was commissioned on November 3, 2018. The work of Reach 2 B from Maharajas College to Thykoodam, with a section length of 5.65km and 5 stations was commissioned on September 3, 2019. The financial progress of phase I based on revised project cost of ₹5,687.79 crore is 98.59 per cent.
The gross revenue earning of Kochi Metro increased from ₹44.67 crore to ₹81.37 crore in 2018-19. The gross revenue expenditure in 2018-19 is ₹101.30crore compared to ₹87.96 crore in 2017-18 and operating loss in 2018-19 period is ₹19.93 crore compared to ₹43.29 crore in 2017-18.The number of passenger carried increased
Table 11.1.13 Technical/design specifications of Thiruvananthapuram-Kasaragod Semi High Speed Rail
Item Design Specification
Route Length and No. of Station 531.45 km, 10 No’sGauge Standard Gauge, 1435mmNumber of line Double track (One way)Rolling stock 9 cars initially and 12 cars later
Source: Kerala Rail Development Corporation Ltd
Table 11.1.14 Details of Kochi Metro, in ₹ croreSl.No Connected places Length (km) Project Cost (in ₹ crore)
Phase I Aluva to Pettah (22 stations) 25.6 5181.79 (original cost)5687.79 (revised cost)
Phase I (A) Pettah to S.N. Junction (Extension) 2.00 359.00Phase I (B) S.N Junction to Thripunithura 1.2 355.70Phase II JLN Stadium to the IT city Kakkanad 11 2310.00
Source: Kochi Metro Rail Limited

432 Economic Review 2019, Kerala State Planning Board
from 100.71 lakh to 126.25 lakh in 2018-19, shows 25.54 per cent increase in passenger travelling. The details are given in Appendix 11.1.20.
KMRL has presently installed PV roof top solar panels in 13 stations and all buildings of Muttom depot, constituting of 2.670 MW, giving out a Daily average generation of about 10,444 kWh. KMRL has entered into contract with AMP Solar India Pvt Ltd on December 8, 2017 for a capacity of 2.719 MWp for which solar modules will be installed as a land mounted model in Muttom Depot. AMP Solar India Pvt Ltd will supply energy for 25 years under Power Purchase Agreement. The project has been successfully commissioned on March 31, 2019 giving out a daily average generation of about 12000 kWh. M/s TUV SUD has submitted the final DPR on May 31, 2018 for the feasibility study and preparation of DPR for installation of solar plant in vacant spaces in Metro premises (Viaduct, compound wall etc.).
Light Metro Rail Projects at Thiruvananthapuram and Kozhikode
Light Metro Rail Project is a Mass Rapid Transit System (MRTS) proposed to be implemented in the cities of Thiruvananthapuram and Kozhikode through a SPV, Kerala Rapid Transit Corporation Limited (KRTL). The DPR has been prepared by DMRC. GoK has accorded administrative sanction for the light metro projects at a total cost of ₹6,728 crore in which GoK’s share is ₹1,619 crore, GoI’s share is ₹1,278 crore and loan component is ₹3,831 crore. A route length of 13.33km with 14 stations in Kozhikode is being taken up as the first phase of the project. The estimated cost of the project is ₹4,219.00 crore for Thiruvananthapuram and ₹2,509 crore for Kozhikode, totalling ₹6,728.00 crore (including central taxes and land cost).
Government accorded Administrative Sanction for Light Metro systems in Thiruvananthapuram and Kozhikode. A new metro rail policy has been announced by GoI in August 2017, which specified guidelines to be followed in the preparation of proposals for new metro projects
in the country that seek financial assistance of the GoI. These guidelines are also applicable to all existing proposals for metro rails, being processed by the GoI. The proposal for the Light Metro projects in Thiruvananthapuram and Kozhikode will also have to be revised as per the guidelines of this new policy. The project cost has been revised to ₹2,773 crore and ₹4,673 crore for Kozhikode and Thiruvananthapuram respectively. Administrative Sanction has also been accorded for widening of Mananchira – Meenchanda road, along the proposed Light Metro corridor in Kozhikode. Preliminary works i.e, construction of 3 flyovers at Thiruvananthapuram, has been taken up, with KIIFB funding. Government land has been identified and allotted for setting up the Depots of the Light Metro Projects.
For linking Technopark with the Thiruvananthapuram Light Metro, M/s UMTC, Hyderabad has been engaged to conduct the feasibility study. The study will be completed by end of February, 2020.
Water Metro Project
Kochi Water Metro Project was sanctioned by Government of Kerala in November 2015 at a total project cost of ₹748 crore envisaging a route length of 76km in 16 routes covering 38 Jetties. Administrative Sanction was accorded for ₹682.01 crore, of which ₹579.71 crore is loan component and ₹102.30 crore is State share for implementing the project. The tri party agreement between GoI, KfW (Germany) and KMRL was signed in June 2016 for 85 million Euro. General consultancy has been awarded to AECOM Consortia and agreement with the consultancy was signed on June 2, 2017. The details are given in Table 11.1.15.
Ground breaking ceremony of first terminal (Vyttila) of Kochi Water Metro Project was inaugurated on September3, 2019. LOA issued to Cochin Shipyard Limited for 100 Pax Boats on September 4, 2019. ‘Notice to Proceed’ (NTP) issued to M/s Marymatha Infrastructure Pvt. Ltd. for Lot-2 terminals. Administrative approval received from Revenue department for land

433Chapter 11, Infrastructure
acquisition of 15 terminals and is progressing. The first phase is expected to be commissioned by November, 2020.
Air Transport
The Ministry of Civil Aviation is responsible for formulation of national policies and programmes for the development and regulation of the Civil Aviation sector in the country.The DGCA is the regulatory body in the field of Civil Aviation, primarily dealing with safety issues. It is responsible for regulation of air transport services to/from/within India and for enforcement of civil air regulations, air safety, and airworthiness standards. Private operators were allowed to provide air transport services. However, no foreign airline could directly or indirectly hold equity in a domestic airline company. Today, Indian aviation industry is dominated by private airlines and these include low cost carriers, who have made air travel affordable.The regional airport development and “Regional Connectivity Scheme” (RCS) of Government of India or UDAN (Ude Deshka Aam Nagrik) programme is given in Box 11.1.5.
Unlike other States, where the capital city has the highest air traffic, in Kerala, air traffic is distributed evenly over the four airports. Despite this, three international airports of Kerala are among the top 15 busiest airports in India. More than eight lakh domestic passengers and 50 lakh international passengers are using these airports facilities in the State every year.
Kerala has four international airports viz., Thiruvananthapuram, Kochi, Kozhikode and Kannur. All civilian airports functioning in the State are international airports, a feature which is unique to Kerala. Thiruvananthapuram international airport is one of the major airports in south India. It plays a major role in the world aviation map, connecting and controlling about nine international air-routes and eight domestic air-routes and provides approach control service to eight major and minor aerodromes. Kozhikode International Airport is the twelfth busiest airport in India and the third in Kerala. On completion of Kannur International Airport, Kerala joined Tamil Nadu as the State with the most number of international airports.
Table 11.1.15 Water Metro funding pattern, ₹ in crore
Source Phase I Phase II Ancillary infrastructure Total
Loan 181.81 132.78 265.12 579.71Equity 32.08 23.43 46.79 102.30Total 213.89 156.21 311.91 682.01
Source: Kochi Metro Rail Ltd
Box 11.1.5 UDAN (Ude Deshka Aam Nagrik)
UDAN is a fulcrum under National Civil Aviation Policy (NCAP) to make air travel convenient and affordable for the common man in small cities and through this, push regional growth. UDAN works on an innovative model that cuts through the need to deploy huge resources and long gestation periods to make an airport operational. The scheme provides for revival and upgradation of existing airstrips in small cities where UDAN operations would happen. To reduce the costs of operations for airline, concessions from Centre, States and airport operators are extended. This new approach not only makes air services available for limited population bases in smaller towns, it also makes the services affordable for them. Since the launching of UDAN in 2017, 61 new sectors have been added till date enhancing the power of aviation network. New city pairs have been established by connecting smaller cities with metros jump starting the regional market.
Source: Ministry of Civil Aviation, GoI

434 Economic Review 2019, Kerala State Planning Board
Cochin International Airport Ltd. (CIAL)
CIAL was ranked the third best airport in the 50 to 150 lakh passengers category based on the 2016 Airport Service Quality (ASQ) Survey conducted by Airports Council International (ACI), Montreal, Canada. CIAL is experimenting with innovative models which are comprehensive, sustainable and cost effective. Renovated domestic terminal with State of the art facilities were inaugurated on December12, 2018.
The airport has 3,400m length with 45m wide code E runway. Total area of the new domestic terminal is 6 lakh square feet, from the existing one lakh square feet. It also has the state-of-the- art facilities which include 56 check-in counters, 11 gates, 7 aerobridges with a capacity to handle 2000 passengers during peak hours. The uniqueness of the airport is modern baggage handling facility. Recently 110 kV Electrical substations was inaugurated consequent to capacity enhancement of solar power plants to 40 Mwp. At present, the 40 MW solar power plants generate around 1.63 lakh units of power a day. The average consumption per day is 1.53 lakh unit. The annual savings in electricity bill is ₹36 crore and solar power plants avert an annual greenhouse emission of 37,200 tonnes.
In 2018-19, 41,104 domestic flights and 30,762 international flights and in 2019-20 as on 30th August 2019, 17,574 domestic flights and 12,659 international flights operated from the airport. 52,68,824 domestic passengers and 49,32,265 international passengers travelled in 2018-19 and in 2019-20 (up to 30.8.2019), 22,67,923 domestic passengers and 21,20,217 international passengers travelled to various destinations. In 2018-19, the volume of cargo handled were 14,918 tonnes through domestic services and 61,447 tonnes through international services. In 2019-20 (up to 30 August 2019), 17,574 and 12,659 tonnes of cargo were operated through domestic and international services respectively. The revenue earnings were ₹650.34 crore in 2018-19 and ₹283.20 crore in 2019-20 (up to August 30, 2019). On the other hand, the
expenditure incurred were ₹403.51 crore and ₹160.39 crore in 2018-19 and 2019-20 (up to August 30, 2019) respectively.
CIAL won the Champions of the Earth Award 2018- the highest environmental honour instituted by United Nations for showing the world deployment of green energy at Airport Council International (ACI) service quality award in the Asia Pacific Region.
As CIAL is located just 500 meters away from river Periyar, the flood severely affected the airport. From August 15 to August 29, 2018, the airport was closed.
Kannur International Airport Limited (KIAL)
Kannur International Airport Limited (KIAL) was set up by GoK to build and operate Kannur International airport. The Kannur airport project is being developed in two phases by KIAL. The first phase is envisaged to span from financial year 2016-17 to financial year 2025-26 and second phase would be from financial year 2026-27 to financial year 2045-46. In phase I, the airport would have flight movements of 39,638 numbers (peak hour’s 18 no’s) p.a with 4.67 million passengers and 60,758 tonnes of cargo.
The facilities in the airport include a runway length of 3,050 m (10,006.56 ft), with a terminal building of 96,000 sq. m, 20 parking stands (apron), and 22, 000 sq. m Car/Bus Parking, 1200 sq. m ATC/Technical Building and around 7,750 sq.m near the apron area of Ground Service Equipment Parking area. The Board of Directors decided to extend the length of runway from 3,050 m to 3,400 m and the land acquisition processes are in progress for this.
In 2018-19, 1,579 domestic flights and 578 international flights and in 2019-20 (as on September 30, 2019), 5,439 domestic flights and 2,649 international flights operated from the airport. 1, 35,251 domestic passengers and 89,134 international passengers travelled during
435Chapter 11, Infrastructure
2018-19 and in 2019-20 (Up to 30.8.2019), 4, 60,490 domestic passengers and 4, 06,899 international passengers travelled to various destinations. The revenue earnings were ₹19.36 crore in 2018-19 and ₹47.01 crore in 2019-20 up to September 30, 2019. On the other hand, the expenditure incurred were ₹76 crore and ₹83.15 crore in 2018-19 and 2019-20 up to September 30, 2019 respectively.
Water Transport
Water transport provides a cheap mode of transport, is safe and energy efficient, more environment friendly and causes least carbon emission. In Kerala, water transport is a viable supplement to road and rail transport. It has the largest carrying capacity and is most suitable for carrying bulky goods over long distances. There are three primary categorisation for water transport, namely, ocean transport, inland water transport and coastal shipping. The complex network of connections between coastal ports, inland ports, rail, air, and truck routes forms a foundation of material economic wealth worldwide. By enhancing the efficiency and sustainability of water transport, a comprehensive normative framework for the key aspects of navigation need to be established. This section deals with the review of various Government Plans and policies aimed at the overall development of ports and inland waterways facilitating and promoting coastal shipping, foreign trade and inland water transport.
Port Sector
Ports are one of the important nodal points of economic activity. Historically, ports induced the development of cities and industrial clusters. After 1980’s, since international barrier to trade started to scale down, the manufactures were able to relocate their production facilities and assembly facilities to place where cost could be the minimum. This led to huge hike in merchandise transport of raw materials and final products in either ways.
The world shipping fleet provides not only transport connectivity to global trade but also livelihood to those working in maritime business. The Review of Maritime Transport, 2019 (United Nations Conference on Trade and Development (UNCTAD) reveals that international maritime activity lost momentum in 2018. The total volume expanded only at 2.7 per cent, which was 4.1 per cent in 2017. The world trade activities got some momentum in 2017. But the trade tensions and protectionism made a dismal future. Even though, several risks existed, the total volume of global trade reached 11 billion tonnes in 2018. UNCTAD projects a growth of 3.5 per cent over 2019-2024 periods. Around 80 per cent of the volume of global trade and 70 per cent of value is transported through international shipping. As on January 2018, there were 53,732 ships. Out of this 17,000 were cargo ships, 11,562 were bulk carriers and 7,400 were oil tankers. As per the Economic Survey, 2018 around 95 per cent of India’s trade by volume and 68 per cent in terms of value are transported by sea. The world has approximately 1,300 major ports. Indian Ocean accounts for 200 major ports and India have 12 major ports.
India has a coastal line which is more than 7,500 km long. Most cargo ships that sail between East Asia and America, Europe and Africa pass through Indian territorial waters. India is the largest importer of thermal coal in the world. The GoI has initiated the National Maritime Development Programme (NMDP), an initiative to develop the maritime sector; the planned outlay in US dollar is 11.8 billion (around ₹84,116 crore as per current rate). The main aim is to create port capacity of around 3,200 Million Metric Tonnes (MMT) to handle the expected traffic of about 2,500 MMT by 2020. There are 12 major ports in the country; 6 each on the eastern and western coasts. India has about 200 non-major ports of which one third are operational. The major ports are under the jurisdiction of the Central Government and non-major ports come under the jurisdiction of the respective State Governments’ Maritime Boards (GMB). The major ports are Chennai, Kamarajar (Ennore) and V.O Chidambaranar (Tamil Nadu), Cochin

436 Economic Review 2019, Kerala State Planning Board
(Kerala), Kandla (Gujarat), Kolkata (West Bengal), Mumbai and Jawaharlal Nehru Port Trust (JNPT) ( Maharashtra), Mormugao (Goa), New Mangalore (Karnataka), Paradip (Orissa) and Vishakhapatnam (Andhra Pradesh).
Cargo handled by Major Ports in India
Major ports of India handled 405.391 lakh tonnes of cargo in the period of April to October 2019. It is only 0.44per cent higher than that of April to October 2018. The commodity group P.O.L (Crude, Products, LPG/LNG) comprises 33.21 per cent of the total cargo traffic. It was 33.11 per cent in the same period of previous year. There were positive changes in cargo traffic in some items compared to previous year such as P.O.L (2.17 per cent ), iron ore including pellets (32.74 per cent ), final fertiliser (7.88 per cent ), Cooking and other coal (14.86 per cent ) and raw fertilisers (14.65) Items such as other liquids, (-1.50), thermal and steam coal (-13.16) and miscellaneous items (-8.33) showed negative growth. Details are shown in the Table 11.1.16.
The growth in cargo handled in major ports of India is 1.85 per cent in 2019. As per the data from the Indian Ports Association, the growth
in 2018 was 4.77 per cent and in 2017 was 6.91 per cent. Cochin port recorded highest growth rate (9.00) in cargo handling in the year 2019 as was the case in 2018. The growth of cargo in eastern ports was as follows,Kolkata (6.73 per cent), Paradip (4.86per cent ), Vishakhapatnam (7.63 per cent ), Ennoor (-5.8 per cent ), Chennai (-7.2per cent ), and V.O Chidambaranar (7.29per cent ). The growth of cargo in western side ports was as follows, was Cochin port (9.00per cent), New Mangalore (-12.37per cent), Mormugao (-21.3per cent), JNPT (0.45per cent), Mumbai (2.83per cent) and Kandla (5.39).
If we look geographically, the ports near the southern tip and the ports near the main land shows considerable growth in the handling of cargo. While the ports between these show negative growth or minimal growth. Details of cargo handled by major ports are shown in Appendix 11.1.21. The Figure 11.1.5 shows location and growth of cargo in Major ports in India.
Operating Ports
India has 12 major ports and 200 non-major ports. All twelve major ports are operating. But
Table 11.1.16 Traffic handled at major ports (In ‘000Tonnes)Traffic P.O.L. Other Iron Ore Fertilisers Coal Containers O ther
TotalPeriod
(Crude, Prod. ,
LPG/LNG)Liquids Incl.
Pellets FIN RAWThermal
and Steam
Coking and
OthersTonnage Misc.
Cargo
April-Aug, 2019 97580 12526 21504 3968 2226 38690 24958 63554 28798 293804
Per cent of total 33.21 4.26 7.32 1.35 0.76 13.17 8.49 21.63 9.8 100
April-Aug, 2018 95507 12717 16200 3678 2608 44552 21730 60060 31415 288467
Per cent of total 33.11 4.41 5.62 1.28 0.9 15.44 7.53 20.82 10.89 100
Per cent Variation from previous year
2.17 -1.50 32.74 7.88 -14.65 -13.16 14.86 5.82 -8.33 1.85
Source: Indian Port Association

437Chapter 11, Infrastructure
out of 200 non major ports, only 66 are using for trade activities. The others are mainly used for activities related to fishing. The details of non-major ports are depicted in the Table 11.1.17.
Cargo handled at non-major Ports in India
The total cargo handled by non-major ports in
India, in 2017-18, had increased by 9.04 per cent. The increase was 4.15 per cent in 2016-17. At the same time, cargo handled by non-major ports in Kerala, is continuously decreasing (-2.08 in 2016-17, -2.13 in 2017-18). Details are in Table 11.1.18 and 11.1.19.
Similar is the case with non-major ports in Karnataka and Tamil Nadu. Total traffic handled
Table 11.1.17 Details of operating ports in IndiaSl. No. State No. of Non- Major Ports No. of operating Non-Major Ports
1 Gujarat 41 142 Andhra Pradesh 12 53 Maharashtra 48 154 Karnataka 11 75 Lakshadweep 10 06 Goa 5 17 Puduchery 2 28 Daman and Due 2 09 West Bengal 1 010 Tamilnadu 15 711 Kerala 17 412 Odisha 13 213 Andaman and Nicobar 23 9
Total 200 66Source: Ministry of Shipping Unstarred Question. No. 3821, Lok Sabha 09.08.2018
Figure 11.1.5 Major ports in INDIA location and cargo growth rate in 2019
Source: Source: Indian Ports Association

438 Economic Review 2019, Kerala State Planning Board
by non-major ports in Karnataka decreased by 3.82 per cent in 2017-18. It was 15.33 per cent in 2016-17. At the same time, the total cargo handled by non-major ports in Tamil Nadu o decreased by 4.25 per cent in 2017-18. Details are shown in Table 11.1.20 and 11.1.21.
Passenger Traffic in Non-Major ports
Ports are used to transport passenger as well as cargo. The details of passenger travelled through non-major ports in Kerala, Tamil Nadu and Karnataka are given in the Table 11.1.22. Tamil Nadu handles a larger number of passengers compared to Kerala and Karnataka.
Capacity utilisation of Non-major Ports in India
Government of India is moving towards enhancing the capacity of ports in the nation through SAGARMALA and Sagar projects. Gujarat has the largest capacity of 542 million tonnes and also largest amount of traffic handled in 2018-2019. Non-major ports in Kerala has a total capacity of 0.55 million tonnes and only 37.10 per cent of its capacity was utilised. Details of capacity utilisation are provided in Table 11.1.23.
Table 11.1.18 Traffic handled in non-major ports in India in ‘000 tonnes
Year OverseasPercentage
change CoastalPercentage
change TotalPercentage
change
2015-16 411836 54035 4658712016-17 418499 1.62 66715 23.47 485214 4.152017-18 450811 7.72 78278 17.33 529089 9.04
Source: Indian Ports Association
Table 11.1.20 Traffic handled in non-major ports in Karnataka in ‘000 tonnes
Year Overseas Percentage change Coastal Percentage
change Total Percentage change
2015-16 553 282 835 2016-17 373 -32.55 334 18.44 707 -15.332017-18 319 -14.48 361 8.08 680 -3.82
Source: Indian Ports Association
Table 11.1.21 Traffic handled in non-major ports in Tamil Nadu in ‘000 tonnes
Year Overseas Percentage change Coastal Percentage
change Total Percentage change
2015-16 439 417 856 2016-17 641 46.01 511 22.54 1152 34.582017-18 537 -16.22 566 10.76 1103 -4.25
Source: Indian Ports Association
Table 11.1.19 Traffic handled in non-major ports in Kerala in ‘000 tonnes
Year Overseas Percentage change Coastal Percentage
change Total Percentage change
2015-16 16 128 1442016-17 10 -37.5 131 2.34 141 -2.082017-18 6 -40 132 0.76 138 -2.13
Source: Indian Ports Association

439Chapter 11, Infrastructure
Ports in Kerala
Kerala has a coastal length of approximately 585 km. There is one major port at Cochin and 17 non-major ports. Out of 17 minor ports in Kerala, four are considered as intermediate ports based on berthing, cargo handling and storage facilities available in them. They are Vizhinjam, Beypore-Kozhikode, Azhikkal and Kollam ports. The remaining 13 minor ports in the State are Neendakara, Alappuzha, Valiyathura, Kayamkulam, Manakkodam, Munambam-Kodungallur, Ponnani, Thalasserry, Kozhikode, Kannur, Cheruvathoor-Neeleswaram, Kasaragod and Manjeswaram. Regular services connecting Lakshadweep operates from Beypore port. Vizhinjam port serves weekly vessel operations to Maldives. Ports are being developed on priority basis for coastal shipping operations.
Cochin Port
Cochin port is one of the major ports in India situated in Kerala. The port lies in two islands namely Willington and Vallarpadom. Cochin port recorded the highest growth rate in handling of cargo in 2018 and 2019 among the major ports in India.
Cargo Traffic in Cochin Port
The total cargo traffic handled by the Cochin Port in 2018-19 was 32.02 MMT as against 29.39 MMT in 2017-18. This shows an increase of 9 per cent over the previous year. The major components of import include other cargo including fertilisers and raw materials, food grains, iron, steel and machinery etc. Tea, cashew kernels, sea foods, coir products, spices, coffee and miscellaneous items are the major components of exports. 596
Table 11.1.22 Passenger handled, in ‘00 number2010-11 2011-12 2012-13 2013-14 2015-16 2016-17 2017-18
Kerala 211 11 182 247 230 173 183Tamil Nadu 19250 20380 20698 20698 0 19918 20800Karnataka 46 2 16 76 106 54 54
Source: Indian Ports Association
Table 11.1.23 Selected State-wise capacity utilisation at non-major ports in India in 2018-2019,in Million Tonnes
States/UTs Capacity Traffic* Capacity Utilization
Andaman and Nicobar lslands 3.00 1.92 64.00Andhra Pradesh 178.00 105.62 59.30Goa 0.02 0.01 75.00Gujarat 542.00 396.88 73.20Karnataka 17.80 0.72 4.10Kerala 0.55 0.20 37.10Maharashtra 102.40 44.42 43.40Odisha 47.50 19.30 40.60Puducherry 16.90 8.43 49.90Tamil Nadu 2.15 0.95 44.60India 910.32 578.50 63.50
Note : * : Provisional.Source : Lok Sabha Unstarred Question No. 954, dated on 27.06.2019.

440 Economic Review 2019, Kerala State Planning Board
cargo vessels visited the port in 2018-19 and capacity utilisation for the year is 43 per cent.
Helicopter service was introduced for cruise tourist in Kochi port from Willington Island. Cochin port is one of the well sought after tourist destinations in India. In 2018-19, 49 international cruise ships visited in Cochin Port with 62,753 passenger, and 28,828 crew members. Helicopter service was introduced on November 21, 2019 and it is aimed to operate to destinations like Munnar, Jatayu earth centre etc. New Mangalore port has already introduced helicopter services on November 3, 2019.
Cochin Shipyard
Cochin Shipyard is the largest shipyard in the country. It builds ships up to 1,10,000 DWT, and repairs every type of ships. CSL has been renowned for securing shipbuilding orders from internationally renowned companies. At present, it is nominated to build country’s first indigenous Air Defence Ship (Air Craft Carriers INS Vikrant). Basic details related to Cochin Shipyard Limited are provided in Table 11.1.24.
In order to promote procurement from MSME, CSL organised exhibitions with the support of Department of Industries and Commerce, Kerala. In 2017-18, out of total indigenous procurement, 20per cent of goods and services were from MSME. It increased to 25 per cent in 2018-19.
STATE OWNED MAJOR PORTS
Vizhinjam International Seaport Ltd (VISL)
Vizhinjam International Transshipment Terminal will be the first deep water transshipment terminal in India. The main advantage of Vizhinjam port is natural depth of 18m, proximity of 10m to the international shipping route and minimal littoral drift along the coast. Government of Kerala has constituted a special purpose vehicle namely Vizhinjam International Sea port Limited (VISL).
The first phase of the port is planned with a container handling capacity of 1 Million TEU (Twenty Foot Equivalent Units) with 800 m berth length with future expansion plans to 3 Million TEU/2,000 m berth length in successive phases. The total estimated cost of the first phase of the project is ₹7,700.00 crore with (i) ₹4,089.00 crore as PPP component (ii) ₹1,463.00 crore as funded work of breakwater (iii) ₹1,808.00 crore for external infrastructure and land acquisition (iv) ₹340.00 crore for Resettlement and Rehabilitation (R and R) for Project Affected People (PAP) and for general administration expenses.
This is the first port project in the country being executed in Public Private Partnership (PPP) model with Viability Gap Funding (VGF) from GoI and first such project in the State. Out of the PPP component of ₹4,089.00 crore, investment of ₹1,635.00 crore is the VGF part (with ₹817.8 crore from GoI and ₹817.2 crore by GoK) and the investment of ₹2,454.00 crore is by the
Table 11.1.24 Cochin shipyard limited basic details, in ₹ CroreItem 2015-16 2016-17 2017-18 2018-19
Turnover 1993.45 2058.00 2335.00 2962.00Profit After Tax 273.79 322.15 396.75 481.00Ship building turnover 1625.96 1515.82 1731.86 2130.00Ship repairing turnover 367.49 543.05 623.27 832.00No. of employees 1829.00 1671.00 1781.00 1744.00CSR- Amount Spent 6.27 7.24 8.57 10.15
Source: Cochinshipyard.com, Annual reports 2015-16, 2016-17, 2017-18, 2018-19

441Chapter 11, Infrastructure
Concessionaire, Adani Vizhinjam Port Private Ltd. (AVPPL).
The port construction works was initiated in December 2015 and construction works of 565 m length of breakwater, 800 m long berth, container yard, boundary walls and access roads are in progress. 3.3 Million Litres Per Day (MLD) water treatment plant and 11 KV power substation works are completed. The total amount invested by GoK in the project till date is ₹1,100.00 crore. Financial progress of the project is depicted in the Table 11.1.25.
The estimate for the year 2018-19 from GoK is at ₹237 crore, out of which ₹80 crore is
received and ₹20 crore is being approved for release. Additionally an amount of ₹77 crore is required for releasing advance to Konkan Railway Corporation Limited (KRCL) for starting rail construction work and an amount of ₹60 crore is estimated for R and R for PAP’s and social welfare measures. In 2018-19, an additional amount of ₹366 crore is estimated to be raised as loan from HUDCO towards payment of 1st instalment of funded work. The present status of port construction is given in Table 11.1.26.
Azhikkal Port Ltd.
Azhikkal Port Limited, an SPV formed, with Hon’ble Chief Minister as Chairman and
Table 11.1.25 Financial progress, ₹ in Crore
Sl.No ParticularsExpenditure
2016-17 2017-18 2018-19 2019-20 Total
1 Funded work – Construction of Breakwater and Fishing Harbour
146.3 146.3 292.6
2 Land 596.46 26.06 30.21 0.54 653.273 Water 7.28 - - - 7.284 Power 51 - - - 51.005 Rail Connectivity 4.09 - 10.46 - 14.556 R and R for PAP’s 20.39 11.37 49.01 2.23 83.007 Administrative and other expenses 72.93 6.2 5.80 1.37 86.30
Total amount spent 898.45 189.93 95.48 4.14 1188.00Amount received from Government 931.57 141.11 100.69 - 1173.37Interest income 19.73 0.04 0.11 - 19.88
Source: Vizhinjam International Seaport Ltd
Table 11.1.26 Status of port construction, up to October 31, 2019
Sl.No Item As on Feb 2018 Completed as on Nov 2019 Target
1 Break Water 565m length 600m length 3100m2 Land reclaimed for container yard 33 Ha 33 Ha 53 Ha3 No. of piles for 800 m berth 142 615 6154 Casting of accropode II for break water 2240 10400 170005 11 KV power supply facility Completed Completed6 Boundary wall 30 per cent 40per cent 7 3.3 MLD water treatment plant Completed Completed Water supply
to local people started
8 Land acquisition for connectivity to NH 66 Progressing 97per cent Source: Vizhinjam International Seaport Ltd.

442 Economic Review 2019, Kerala State Planning Board
Hon’ble Minister for Ports as Vice Chairman was incorporated on March 6, 2018 for the development of Azhikkal port. The Authorised Capital of the Company is ₹100 crore and the initial paid up capital is ₹25 crore. It is wholly owned by GoK registered under Companies Act 2013. The Technical Consultancy Services has been awarded to M/s HOWE Engineering projects India Pvt Limited on April 23, 2018 and the agreement was entered on May 9, 2018.
The port will have facility to cater to vessels with draft of 14.5 meter. Port shall have 2-3 berths in Phase 1 and augmented further in next phases. LNG facility shall be considered in future phases. The possibilities of developing dedicated terminals for bulk handling of food grains, cement, edible oil etc. will be explored.
The port is envisaged to develop as a Greenfield port. The DPR preparation is under progress.
Non-Major ports in Kerala
Out of the 17 non major ports, four ports were operational for trade in 2018-19. Kollam had inward and outward transport of machinery, Vizhinjam had overseas transportation of vegetables, Azhikkal and Beypore (Kozhikode) ports also had trade activities in 2018-19. Details are given in Appendix 11.1.22.
Beypore (Kozhikode) is the busiest port among the four operating ports in Kerala in terms of number of steamers and vessels. 298 steamers and sailing vessels visited the non-major ports of Kerala in 2018-19. Out of this, 222 steamers and 259 sailing vessels visited Beypore port. Details are given in Appendix 11.1.23.
The Beypore port has the largest facilities among the four operating ports in Kerala. Beypore has 310 m warf, channel width of 500m, availability of fork lift, and 1600sq. m of godown area. Details of facilities available in non-major ports of Kerala are given in Appendix 11.1.24.
In 2018-19, an amount of ₹48.41 crore is
generated from different activities related to port by intermediate and minor ports in Kerala. The largest amount of revenue was earned from dredged materials (₹43.42 Crore.). The total import export dues in 2018-19 were ₹32 lakh. Details of revenue earned by intermediate and minor ports of Kerala are given in Appendix 11.1.25.
Electronic data interface has been established in Beypore Port which will help customs clearance to be done in the port.
Port Department
The Port department under the GoK administers the non-major ports in the State. At present, there are 17 notified non-major ports in Kerala. Kerala Industrial Infrastructure Development Corporation (KINFRA), a GoK undertaking, owns 49 per cent stake in the inland port at Naattakam in Kottayam District. The main function of the Department of Ports is to conserve the assets of the non-major ports in the State. Though the State has a 585 km long coastline, the maritime activities and real time shipping operations comparable to acceptable standards and performance were concentrated at Kochi alone. Nine out of fourteen districts of the State are along the coast. The optimum and sustainable utilisation of the maritime resources of the State would unveil enormous opportunities for its economic growth. To achieve this objective, the maritime activities need to be enhanced at other locations along the entire coast. Hence, a project for the development of coastal shipping was designed and a business plan for the strategic implementation of the same was prepared. The project envisaged the diversion of significant volume of cargo/passenger from road/rail to coastal waterways through the non-major ports of Kerala. The project was planned in such a way that it would transform the transportation/logistics sector of the State. Coastal shipping project, being implemented under Department of Ports, is the first of its kind in the country and would secure cross sectoral gains by integrating it with fisheries, industries, maritime education
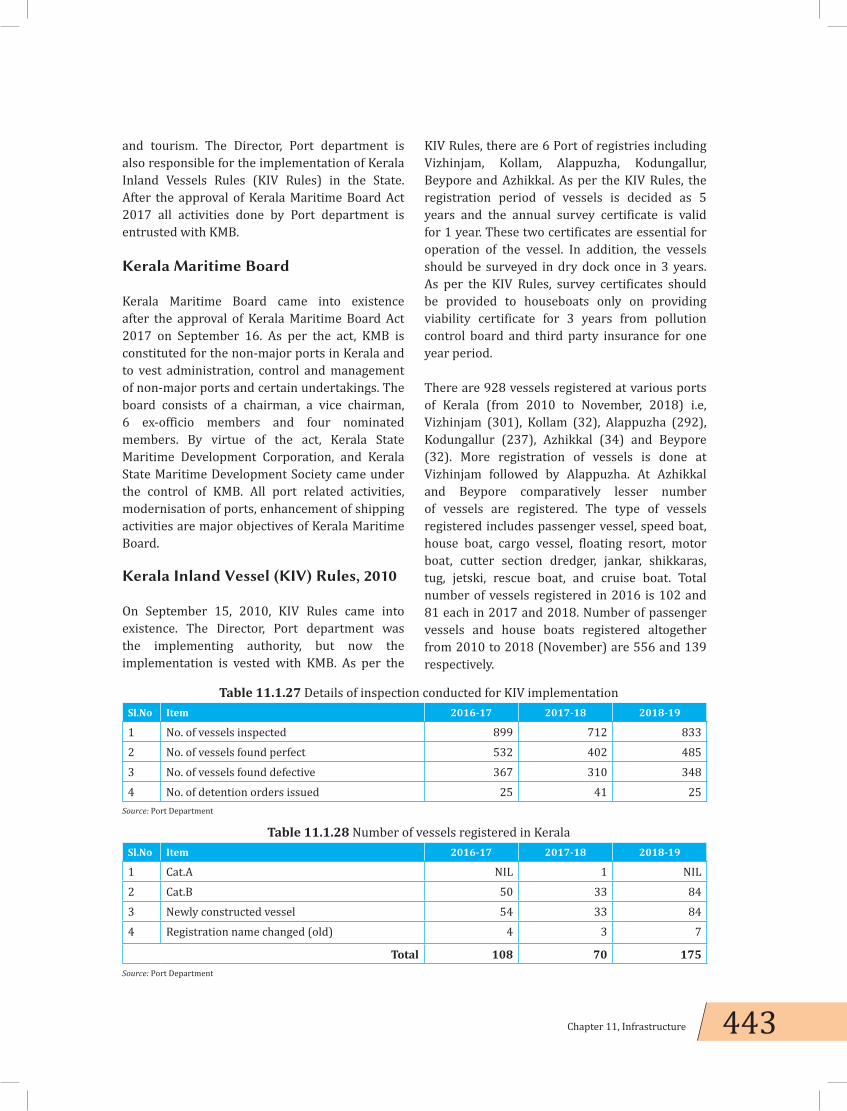
443Chapter 11, Infrastructure
and tourism. The Director, Port department is also responsible for the implementation of Kerala Inland Vessels Rules (KIV Rules) in the State. After the approval of Kerala Maritime Board Act 2017 all activities done by Port department is entrusted with KMB.
Kerala Maritime Board
Kerala Maritime Board came into existence after the approval of Kerala Maritime Board Act 2017 on September 16. As per the act, KMB is constituted for the non-major ports in Kerala and to vest administration, control and management of non-major ports and certain undertakings. The board consists of a chairman, a vice chairman, 6 ex-officio members and four nominated members. By virtue of the act, Kerala State Maritime Development Corporation, and Kerala State Maritime Development Society came under the control of KMB. All port related activities, modernisation of ports, enhancement of shipping activities are major objectives of Kerala Maritime Board.
Kerala Inland Vessel (KIV) Rules, 2010
On September 15, 2010, KIV Rules came into existence. The Director, Port department was the implementing authority, but now the implementation is vested with KMB. As per the
KIV Rules, there are 6 Port of registries including Vizhinjam, Kollam, Alappuzha, Kodungallur, Beypore and Azhikkal. As per the KIV Rules, the registration period of vessels is decided as 5 years and the annual survey certificate is valid for 1 year. These two certificates are essential for operation of the vessel. In addition, the vessels should be surveyed in dry dock once in 3 years. As per the KIV Rules, survey certificates should be provided to houseboats only on providing viability certificate for 3 years from pollution control board and third party insurance for one year period.
There are 928 vessels registered at various ports of Kerala (from 2010 to November, 2018) i.e, Vizhinjam (301), Kollam (32), Alappuzha (292), Kodungallur (237), Azhikkal (34) and Beypore (32). More registration of vessels is done at Vizhinjam followed by Alappuzha. At Azhikkal and Beypore comparatively lesser number of vessels are registered. The type of vessels registered includes passenger vessel, speed boat, house boat, cargo vessel, floating resort, motor boat, cutter section dredger, jankar, shikkaras, tug, jetski, rescue boat, and cruise boat. Total number of vessels registered in 2016 is 102 and 81 each in 2017 and 2018. Number of passenger vessels and house boats registered altogether from 2010 to 2018 (November) are 556 and 139 respectively.
Table 11.1.27 Details of inspection conducted for KIV implementation Sl.No Item 2016-17 2017-18 2018-19
1 No. of vessels inspected 899 712 8332 No. of vessels found perfect 532 402 4853 No. of vessels found defective 367 310 3484 No. of detention orders issued 25 41 25
Source: Port Department
Table 11.1.28 Number of vessels registered in Kerala Sl.No Item 2016-17 2017-18 2018-19
1 Cat.A NIL 1 NIL2 Cat.B 50 33 843 Newly constructed vessel 54 33 844 Registration name changed (old) 4 3 7
Total 108 70 175Source: Port Department

444 Economic Review 2019, Kerala State Planning Board
As the port department is implementing the KIV rules, it conducts inspections, facilitates registration of vessels and provides incentive for shipping. Details are in Table 11.1.27, 11.1.28 and 11.1.29.
Physical Achievement of Government Agencies in Port sector
There are agencies working in port sector for achieving specified objectives and for executing specific functions. They are Port department, Hydro Graphic Survey Department, Harbour Engineering Department, KSMDCL.
2017-181. Berth construction worth ₹11.00 crore
completed at Kollam port.2. Development of roads to seaward and
leeward wharf at Vizhinjam Port is in progress.
3. Acquisition of Land for Beypore Port development is in progress.
4. Procurement of tug for Beypore and Azhikkal Port is in progress.
5. Construction of KMI Neendakara nearing completion.
6. Beypore Port master Plan development in progress.
2018-19
1. Construction of Passenger cum Multi-purpose berth at Kollam Port Phase 1 (100 metre) completed
2. Tugs for Beypore and Azhikkal Port nearing completion.
3. Land acquisition (Kovilakam land) for Beypore Port worth ₹25 crore done.
4. Construction of Valiyathura Pier protection wall completed.
5. Manual dredging continuing at Ponnani, Kasaragod, Azhikkal and Beypore Ports.
6. EIA study at Alappuzha Greenfield Port is its final stage. TEFR approved.
7. Procurement of a 450HP Tugg at Azhikkal port.
8. Construction of Azhakulam Vizhinjam road completed.
9. Repairing of transit shed at Vizhinjam was completed.
10. Water connection established in Leeaward wharf at Vizhinjam.
11. Construction of staff quarters at Ponnani was completed.
12. Web portal established in Kerala Maritime Institute.
13. KMB formed.
Issues/Challenges
Kerala’s logistics sector is dominated by road and rail systems. The contribution of waterways in the transportation sector is considerably low on account of multifarious reasons like low accessibility, reliability, cost and convenience. The hurdles of this sector have been enlisted in the Costal Shipping Summit held on September 22, 2017. These include,
1. Labour issues in the Ports are one of the major problems for the successful implementation of the Coastal Shipping Project.
2. Formation of Kerala Maritime Board and issues related to clarity of employees.
3. Revenue sharing between Government and KMB
4. Lack of return cargo.5. Land acquisition (Kovilakam land) for
Beypore Port rehabilitation nearing completion.
Table 11.1.29 Details of incentive programmes by KMB/Port Department, in ₹ Sl.No Item 2016-17 2017-18 2018-19
1 Incentive given for new ships 0 0 02 Incentive given for existing ships 215876 709726 6926139
Total incentive 215876 709726 6926139Source: KMB

445Chapter 11, Infrastructure
6. Disputes with fishermen community.7. Lack of Disaster Management System.8. Inadequacy in skill updating of port staff.
Huge costs for dredging and inadequate marine/land infrastructure.
9. Disputes with local community against the development/land acquisition in certain ports.
Harbour Engineering Department
The Harbour Engineering Department acts as a service department of the Fisheries, Port and Tourism Departments. In addition, it manages all fishing harbours in the State except Munambam fishing harbour.
The major task of the department is to investigate, explore, develop and execute new methods and technology for creating infrastructure development in marine sector. It provides technical support to Fisheries Department, Port Department and Tourism Department in coastal sector.
Major Achievements of Harbour Engineering Department
2017-18
1. E-office implemented at CE’s Office for speedy and transparent administration.
2. Acquired Mike-21 Software, a Numeric Modelling Software, for model study of harbour Projects.
3. Quality Control wing started functioning with the scientific instruments and equipments.
4. Construction of Eravipuram-Paravur coastal road nearing completion.
2018-19
1. MIKE 21 software for numeric modelling Techniques/ Department conducted model study of 6 projects using this software.
2. Strengthening of main breakwater work at Thangassery from Ch.1350 to Ch.1500m is nearing completion (95per cent).
3. Construction of Type III quarters at Kamaleswaram nearing completion (95per cent).
4. Administrative Sanction obtained for Construction of new office building for Investigation and construction subdivision at Beypore in Kozhikode District.
5. Administrative Sanction obtained for Construction of staff quarters at Munambam port in Ernakulam District.
6. Construction of new wharf at Ponnani is in good progress.
Hydrographic Survey Wing (HSW)
Hydrographic Survey Wing was founded in 1967 with the objectives of investigation and collection of Hydrographic Survey data for inland navigation and development of all non-major ports in the State. Since its formation, the Wing has been conducting regular pre-dredging, post-dredging, pre-monsoon, post-monsoon surveys to ascertain various aspects such as requirement of dredging, bathymetric data required for the infrastructure development like, construction of fishing harbours, fish landing centres, small ports, and bathymetric data required for the navigational, recreational and research purposes. The Wing mainly works for Port department and harbour engineering department. The Wing also undertakes survey works for other departments such as the Irrigation, PWD, Fisheries, Tourism, Inland Navigation, other major organisations such as Kerala Water Authority, Kerala Electricity Board, Kerala State Maritime Development Corporation Ltd. and various research institutions such as Kerala Engineering Research Institute, CWRDM and CESS. The tidal and hydrographic information requested by the Naval Hydrographic Office at Dehra Dun (Indian Navy) for updating the Indian Admiralty Charts (Navigational Charts, published by Naval Hydrographic Office) are also forwarded by the Hydrographic Survey Wing.
446 Economic Review 2019, Kerala State Planning Board
Physical Achievements of Hydrographic Survey Wing
Under the scheme, pre and post dredging survey and pre and post monsoon survey, data was collected, verified, systematised, compiled and survey charts were prepared. The survey wing conducted 45, 44, 36, and 23 surveys in 2015-16, 2016-17, 2017-18 and 2018-19 (up to October 2018) respectively.
1. Hydrographic Survey Institute-The Kerala Institute for Hydrography and Advanced Studies (KIHAS), established in 2013 and registered under the Travancore Cochin Literary Scientific and Charitable Societies Registration Act 1955 has been functioning at fisheries University Campus in Kochi. The Institute conducts basic hydrographic course for a duration of six months. During this year, course for two batches were conducted. 22 students completed this course and certificates were given to them. Most of the students who have completed this basic hydrographic Survey course got employment in India and abroad. The KIHAS is also conducting course in Total Station. Steps being taken to affiliate this institution with Kerala University of Fisheries and Oceanography (KUFOS). From 2013 to 2017, 88 students completed hydrographic survey course and 46 students got job. In 2018, the course work of 6th ongoing batch with 17 students is in progress.
2. Government accorded sanction for the purchase of 1 DGPS, 2 ATGs, 3 Hypack Softwares, and 1 Echo sounder for a total amount of ₹69.11 lakh.
3. Administrative Sanction obtained for special repair of vessels M.V. Nirdheshak and M.V. Surveyor and repair work is progressing.
2018-19
1. Obtained 3 Hypack Software for Hydrographic Survey
2. Obtained Hypack Network Software for an amount for survey course.
3. Purchased one modern survey instrument DGPS for AMS Office Kannur
4. Constructed and acquired one Twin Screw Survey Vessel
5. Dredging Surveys-9 6. Private Surveys-7
Inland Water Transport (IWT)
Inland Water Transport (IWT) is a viable alternative or friendly mode of transportation in addition to road, rail transport or air counterparts. Inland Water Transport has the ability to contribute to the development of economies and bridge societies. Today, IWT can help nations to achieve Sustainable Development Goals and can act as an engine of economic development. IWT is more energy efficient than the existing transport systems, is safer, and can give relief to road traffic congestions.
Though the effect on environment is less and it is one of the most economical modes of transport, it remains largely under-exploited. By enhancing the efficiency and sustainability of inland water transport, around 20 per cent cargo movement can be shifted from roads to water ways.
In general, inland waterway systems are found in areas with large rivers. Canals extend and improve the use of those transportation systems. Navigable Water Ways in the world is estimated around 6,23,000 Kilometer. China has the largest network of navigable water ways with 18 per cent of global length, followed by Russia (16 per cent), Brazil (8 per cent) and USA (7 per cent),while Indian navigable waterways comes around 2 per cent of global length of water ways.India has nearly 14,500 km of navigable Inland Water Ways. Out of which, 9,200 km (5,200 km river, 4,000 km canal) can be used for mechanised crafts. Government of India had declared 111 Water bodies/sections throughout the country as National Water Ways. Freight transport by waterways is highly under-utilised in India compared to other parts of the world.

447Chapter 11, Infrastructure
Table 11.1.30 Cargo traffic movement in National Waterways
Sl.No Inland Water Ways April 2018 to September 2018 (Metric Tonnes)
April 2019 to September 2019 (Metric Tonnes)
1 Ganga – Bhagirathi Hoogly – NW 1 2167946 36498062 Brahmaputra NW 2 275204 1939073 West cost canal Champakara canal and
UdyogMandal canal NW 3152333 211658
4 Krishna River NW 4 166524 82226Sub Total (National Waterways 1-4 2,762,007 4,137,596
Maharashtra Waterways5 NW 10 (Amba river) 9,341,048 10,648,9636 NW 83 (Rajpuri creek) 550,174 427,8327 NW 85 (Revdanda creek and Kundalika River) 959,107 448,5508 NW 91 (Shastri River-Jaigad Fort creek) 3,140,991 66,643
Total 13,991,320 11,591,988Goa Waterways9 NW 68 (Mandovi river) - 818,98510 NW 111 (Zuari river) 2,304,798 494,009
Total 2,304,798 1,312,994Gujrat Waterways11 NW 73 (Narmada river) 31,656 49,24612 NW 100 (Tapi river) 13,256,943 15,048,526
Total 13,288,599 15,097,77213 NW 97 (Sunderbans) 1,521,409.17 1,950,19614 NW 16 (Barak river) - 119
Grand Total Metric Tonnes 33,868,133 34,090,665Source: IWAI.gov.in
The total cargo moved (in tonne kilometres) by inland waterways was 0.1 per cent of the total inland traffic in India, compared to the 21 per cent in the United States. Organised Cargo transport is developed in a few States in India such as Goa, West Bengal, Assam and Kerala.
Inland waterways in India consist of the Ganges-Bhagirathi-Hooghly rivers (1620 km), the Brahmaputra (891 km), the Barak river, the rivers in Goa, the backwaters in Kerala, inland waters in Mumbai and the deltaic regions of the Godavari-Krishna rivers (1078 km). About 44 million tonnes of cargo is moved annually through these waterways using mechanised vessels and country boats. The Inland Waterways Authority of India (IWAI) is the statutory authority in charge of National Water Ways in India constituted under
NHAI Act – 1985. The IWAI is authorised to build the necessary infrastructure in these waterways. It also examines the economic feasibility of new projects. The details of cargo movement in National Water Ways across the country for the period 2018-19 (April to September) is given in Table 11.1.30
As per the IWAI data, traffic in NW 3 in Kerala has increased by 38 per cent between April-September, 2018 to April-September, 2019.
Government of Kerala is giving top priority to develop the West Coast Canal connecting the National Waterway-III. Waterways in the State include the main arterial Waterway, West Coast Canal (WCC) and feeder canals. The total length of the potential Inland Waterways in the State is

448 Economic Review 2019, Kerala State Planning Board
1,687 km. Total length of WCC is 616 km. There are 1,100 km feeder/link canals connecting WCC and important destinations like commercial centres, ports and tourism spots. Out of the total length of 616 km, three portions between Mahe and Valapattanam having total length of 26 km are uncut portions. Further extension for 41 km from Neeleswaram to Kasaragod is also under consideration. Portion of the West coast canal from Kollam to Kottappuram was earlier declared as National Waterway-III. Portion of WCC from Kottappuram to Kozhikode and six feeder canals were also declared as part of national waterways 3. WCC can broadly be divided into five sections namely (1) Kovalam-Kollam (74.18 km), (2) Kollam-Kottappuram (Kodungallur) (168 km), (3) Kottappuram-Kozhikode (160 km), (4) Kozhikode-Neeleswaram (187.82 km) and (5) Neeleswaram-Kasaragod (41 km) respectively. Entire navigation canal system in Kerala can ensure sufficient water throughout the year and can be developed as Smart Waterways.
A road map in three phases is approved and the development of waterway system in the State is being taken up as follow.
Phase I-WCC will be developed with possible width in the available land to be completed in the year 2020.
Phase II- The rehabilitation of encroachers, land acquisition and widening of canal will be completed in 2020-22.
Phase III- The extension of WCC up to Bekal in Kasaragod District, development of feeder canals and amenities for cargo transportation and tourism facilities will be achieved during 2022-25 period. Navigation aids and signals will be positioned for Smart waterways to enable permanent and round the clock navigation.
State Water Transport Department (SWTD), Coastal Shipping and Inland Navigation Department (CSIND) and Kerala Shipping and Inland Navigation Corporation (KSINC) are the major agencies under IWT in Kerala.
The development of State Waterways is done jointly by CSIND and Kerala Waterways and Infrastructure Ltd (KWIL), a Special Purpose Vehicle formed by the State Government and Cochin International Airport Ltd (CIAL) as a major partner. With KIIFB assistance KWIL had nearly completed the development activities in Parvathi-Puthanar (Kovalam-Akkulam stretch). While the development works of Akkulam-Kollam, Kozhikode-Mahe and Valappattanam-Neeleswaram are taken up by CSIND, IWAI is the GoI agency which is in charge of the development works in Kollam-Kozhikode (declared as National Waterways) stretch and its feeder canals.
Several parts of the canals are silted up and suffer from many navigation constraints like shallow depth and narrow width, bank erosion, absence of infrastructural facilities. National waterway-III between Kollam and Kottappuram and the feeder canals of Champakkara and Udyogmandal were developed in Class-3 standard and barge services are operating in these canals. Passenger boat service is provided in Kollam, Alappuzha, Ernakulam, Kannur and Kasaragod. There are four sea opening in NW III. They are Munambam, Kochi, Kayamkulam and Neendakara. Besides that, various type of vessels including house boats, shinkar boats, speed boats, etc are plying in these canals and back waters linking tourism. Jhankar services are also being operated in certain locations.
The present status of development of various reaches of WCC is given in the Table 11.1.31.
At present, 25 terminals are also completed along various stretches of West Cost Canal.
State Water Transport Department
The State Water Transport Department was formed in 1968, with its headquarters (Directorate) in Alappuzha. During the formation, the service operation was only in the districts of Alappuzha, Kottayam and Kollam. The nerve centre of all the functions and activities back then was the Head Office at

449Chapter 11, Infrastructure
Alappuzha. Later the functions and activities were extended by establishing an office for the Mechanical Engineer and three Regional Offices in the districts of Ernakulam, Kottayam (Changanassery) and Kasaragod, headed by three Senior Superintendents. Now, the department has fourteen Station Offices.
The department caters to the traffic needs of the inhabitants in waterlogged areas for the districts of Alappuzha, Kottayam, Ernakulam, Kannur and Kasaragod. Even though it is a commercial department, its functions are similar to a service department. Ever since ‘transportation’ came under ‘essential service’, this Department has taken shape as an Essential Service Department.The Department handles about 150 Lakh of passengers per annum using wooden/steel/Solar based fiber Glass Passenger Boats. The relevance of this department is that water logged region is relying on water transport sector.
Innovative Initiatives in 2018-19
The department procured five highly advanced rescue vessels for five major stations to be used
both for rescue and ambulance purposes. During the time of floods department’s service was meritorious in evacuating people trapped in flood affected areas to safe shelters.
A high speed 120 passenger capacity AC passenger cum tourist service boat was inaugurated on November 4, 2018 in Vaikom-Ernakulam region. The main advantage of this service is that commuters both native and foreigners can reach destination with least traffic block as in road traffic, covering the shortest distance. The department has bought 60 bilge and smoke alarm, with a motive of ensuring safety of passengers and boat.
Various studies on the possibility of introducing water taxi and barge services have been made in 2018-19. Two passengers cum tourist vessel, solar cruise vessel and seven catamaran vessels are near to completion. And also the built of two solar boats is in good progress. On completion of these vessels, the tourism potential of the department shall be highly benefited and the native passengers can reach their destination within shortest time lag.
Table 11.1.31 Present status of West Coast Canal
Sl.No Reach of canal NW/SW
Chainage Length(km)
Navigable length (km)
Present status
1 Kovalam-Akkulam SW OKM-16.04 km 16.04 14 Partially navigable2 Akkulam-Kollam SW 16.04 km-74.14 km 58.10 32 Partially navigable3 Kollam-Kottappuram NW 74.14 km-242.14 km 168 168 Navigable4 Kottappuram-Kozhikode NW 242.14 km-402.00 km 160 28 Partially navigable5 Kozhikode Town portion
(Canoly canal)SW 402.14 km-412.00 km 9.86 7 Partially navigable –
depth problem6 Kozhikode-Vadakara SW 412.00 km-450.08 km 40.08 25 Partially navigable7 Vadakara-Mahe uncut
portionSW 450.08 km-467.69 km 17.61 10 Work in progress
8 Mahe-Valappattanam (26km uncut portion and 32.20km river portion)
SW 467.69 km-526.20 km 58.51 32 Not navigable
9 Valapattanam-Neeleswaram SW 526.20 km-590 km 63.80 km
58 Navigable
10 Neleswaram-Bekal Uncut portion
SW 590 km-616 km 26 0 Under Investigation
Source: CSIND

450 Economic Review 2019, Kerala State Planning Board
The department transports about 130.48 lakh passengers per annum using wooden/steel and fibre glass passenger boats. Presently 54 passenger boats and 5 rescue boats are operated including tourism services. The total revenue receipt on inland transport (collection from tourist boats + barge + jhankars) was ₹70.85 lakh.
The scheme-wise outlay and expenditure of State Water Transport Department in 2018-19 and 2019-20 (expenditure up to September 2019) is given in Table 11.1.32.
New Ventures and Vision
The department, in a drive to extract the potential of water tourism utilising their national waterways, gears up to introduce the advanced type of tourist and cruise vessels like water taxi and water bus. Besides, the department sets to convert in a phased manner some of its diesel-fuelled vessels into Electric vessels. Thus, utilising these National waterways, the department proposes to begin high-speed boat services with the shortest water routes in the future with a bid to curtail parallel road traffic congestion in a phased manner. Similarly, a study on the feasibility of cargo movement along these waterways shall also be done gradually.
Department chalks out to build more vessels with solar energy being a kick start in introducing pollution-free and eco-friendly water tourism. Department intended to renovate the five-station offices and providing special restrooms for women in Alappuzha and Ernakulam. The department has also planned to purchase safety equipment’s for passengers and boats. To introduce electrical boat service in Alappuzha region a possibility study is progressing. This project can reduce pollution and make the sector of water transport more accessible and also conducts feasibility study on electric Ro-Ro service.
Issues and Challenges
The development of waterways is affected by encroachment. Evacuation of encroachers from the banks of water ways and their rehabilitation is a challenge. Continuous silting, dumping wastes in the canal and lack of infrastructure is creating hindrance to the free movement of traffic in the water ways.
Way forward
Even though those obstacles exist, the Government is moving towards fulfilling the
Table 11.1.32 Scheme-wise review from 2017-18 to 2019-20 ₹ in lakh
Scheme
Annual Plan 2017-18 Annual Plan 2018-19 Annual Plan 2019-20
Budgeted Outlay
Revised Outlay Expenditure Budgeted
Outlay Expenditure Budgeted Outlay
Expenditure up to
September 2019
Land, Building and Terminal Facilities
110 - 46.12 400 13.51 160 9.99
Acquisition of Fleet and Augmentation of Ferry Services
1815 1745 1154.7 1600 1042.18 2110 161.5
Workshop Facilities 165 - 159.42 270 0 250 0Purchase of new Engine and Reconstruction of old Boats
110 180 179.72 150 147.84 291 68.31
Total 2200 1925 1540 (80 per cent)
2420 1203.51 (53.03 per cent)
2811 238.80 (8.5per cent)
Source: Accounts and Planspace

451Chapter 11, Infrastructure
target of sailing from Kovalam to Kasaragod. In future, with stringent R and R policies and modern technological interventions Government of Kerala is on fast track to develop infrastructure and amenities for large scale transport and tourism by 2022-25.

452 Economic Review 2019, Kerala State Planning Board
11.2 Energy
Energy has universally been recognised as one of the most important engines of economic growth and human development. It provides light and fuel to lakh of households, power to industry, agriculture, commerce and all service sectors. Electricity demand in our country has increased rapidly and is expected to rise further in the future. In order to meet the increasing demand for power in the country, massive addition to the installed generating capacity is required. Making available the required quantity of quality power at affordable price is among the prime responsibilities of Government. The energy sector must also meet the challenges of sustainability.
Electricity is the most versatile and easily controlled form of energy. Electrical energy can be converted into useful power without losses and without pollution. According to World Bank, even today, 840 million people live without electricity and hundreds of millions more live with insufficient or unreliable access to it. Electricity has become a basic need without which people cannot survive.
New Challenges and Opportunities in the Power Sector
The contemporary scenario of the power sector, globally and domestically, presents many challenges as well as opportunities, which merit careful consideration. Particularly in the context of Kerala, there is a need to chart a course
of development that takes into account such challenges and needs from the perspective of the State. At the same time, it is important to take note of the achievements and strengths of the power sector in the State, and ensure that these are preserved even while moving ahead.
One of the major challenges is of course the future transformation of the power sector in the direction of sustainability, especially in promoting the role of renewable energy. Across the country, the Govt of India is moving to ambitiously boost renewable energy installation and generation. At the same time, keeping in mind the cost of power, India will continue to depend on thermal power generation, as part of its entitlement to a fair share of global carbon space. Early exit from coal is often advocated by those concerned with sustainability. However, even the developed countries, it must be remembered, while exiting coal-based generation, have in fact ramped up gas based generation. Given the limited options for India in gas, and the high cost of dependence on imported gas, India still needs coal-based generation. This must be factored into Kerala’s power policy, keeping in mind that thermal generation will continue to develop over the medium term.
In the policy making space, renewable energy is sometimes seen as a competitor to established fossil fuel based generation. However, given the capital constraints of development in India, it would be counter-productive to consider the

453Chapter 11, Infrastructure
huge investment in large power utilities in India, especially in the public sector, as competitors to the burgeoning renewable sector. Such utilities also have enormous capital in terms of knowledge and human resources, that must not be wasted or rendered surplus by setting it to compete with renewables. A more fruitful strategy would be to consider the large utilities as partners in the transition to higher levels of renewable energy installation and generation. For Kerala, the Kerala State Electricity Board is a valuable asset that has contributed significantly to the growth and prosperity of the State. Even in the era of renewables, the KSEB has a valuable and leading role to play and has the potential to be a leader in this transition, while continuing to fulfil its mission in terms of power from established sources. This perspective is also being accepted by a number of large entities in India’s public sector in power and energy. It is from this perspective that the leading role of the KSEB in the Oorjja Kerala Mission must be considered noteworthy. The successful execution and implementation of this Mission, is of considerable value, and we particularly commend the relevant section on the Mission in this review, to the reader’s attention.
It must also be an important consideration to not lose sight of costs and the consequent impact on all categories of consumers in terms of tariff. Transition to sustainability must not be driven without careful consideration of costs which should be part of determining the timing of such
transition. The consequences of ignoring this may lead to deleterious economic and social outcomes. Constant technology up gradation and development is also critical and energy efficiency must be promoted steadfastly across all categories of energy use.
Power Sector – Indian scenario
India is the world’s third largest producer and third largest consumer of electricity. The national grid has an installed capacity of 3,64,960.14 MW as on October 31, 2019. In India, electricity from thermal energy is the dominant source of power. It constitutes nearly 62.86 per cent of the total installed capacity in the country as on October 31, 2019. Contribution of electricity generation from different sources to the national grid and the comparison to the previous years is given in Table 11.2.1. As per this, the total installed capacity for power generation in India is 3,64,960.14 MW. Of late, renewable sources have emerged as the second largest electricity source in the country leaving hydro to the third position.
In the sector-wise breakup of total energy generation as given in Table 11.2.2, the contribution of State sector is 103,814.69 MW (28.46 per cent), central sector is 91,496.93 MW (25.06 per cent) and private sector is 1,69,648.52 MW (46.48 per cent).
Table 11.2.1 All India installed capacity as on October 31, 2019
FuelInstalled Capacity (MW) as on August
31, 2017Per cent
Installed Capacity (MW) as on October
31, 2018Per cent
Installed Capacity (MW) as on
October 31, 2019Per cent
1 2 3 4 5 6 7
Thermal 2,19,490.00 66.67 2,21,768.00 64.1 229,401.42 62.86Hydro 44,653.00 13.56 45,487.00 13.1 45,399.22 12.44Nuclear 6,780.00 2.06 6,780.00 2 6,780.00 1.86Renewable Sources 58,303.00 17.71 72,013.00 20.8 83,379.50 22.84
Total 3,29,226.00 100 3,46,048.00 100 3,64,960.14 100
Source: Central Electricity Authority (CEA)

454 Economic Review 2019, Kerala State Planning Board
Power Sector in Kerala
Kerala is the first State in the country to attain 100 per cent house hold electrification. Electricity is being provided throughout the State 24x 7 x 365 without any power cut or load shedding. But Kerala, a power surplus State till late 80s, has only generated 30.49 per cent of its power requirement in 2018-19. Of the balance requirement, 68.63 per cent of the power requirement is met from outside through power purchases, while open access consumers constitute the rest 0.88 per cent.
Performance of Power Sector Agencies
Power development activities in the State are carried out mainly through four agencies, namely, Kerala State Electricity Board Limited (KSEBL), Agency for Non-conventional Energy and Rural Technology (ANERT), Electrical Inspectorate, and Energy Management Centre (EMC). The outlay and expenditure of these departments in Annual Plan 2018-19 and Annual Plan 2019-20 are shown in Table 11.2.3.
In the Annual Plan 2019-20, an amount of ₹1,78,145.00 lakh is provided for Energy sector.
Out of this, ₹1,71,237.00 lakh is for Kerala State Electricity Board Ltd. (KSEBL), ₹5,200.00 lakh for Agency for Non-conventional Energy and Rural Technology (ANERT), ₹825.00 lakh for Meter Testing and Standards Laboratory (MTSL) and ₹883.00 lakh for Energy Management Centre (EMC). As per expenditure reported in the Plan space, ₹91,522.08 lakh i.e., only 51.37 per cent of the total outlay is expended till October 2019. The expenditure reported by KSEBL is ₹91,161.14 lakh (53.24 per cent), ANERT is ₹198.12 lakh (3.81 per cent), EMC is ₹129.80 lakh (14.70 per cent) and Electrical Inspectorate is ₹33.02 lakh (4.00 per cent).
Kerala State Electricity Board Limited (KSEBL)
Kerala State Electricity Board Limited is a (power utility) company incorporated under Companies Act 1956 (Central Act 1 of 1956). It is fully owned by GoK, under provisions of section 131 of the Electricity Act 2003 by re-vesting (under sub section (2) of section 131 and 133 of the Act) the functions, properties, interest, rights, liabilities, proceedings and personnel vested in State Government from erstwhile Kerala State Electricity Board. Revesting was done on
Table 11.2.2 All India installed capacity as on October 31, 2019Sector Installed Capacity (MW) Per cent
State Sector 1,03,814.69 28.46Central Sector 91,496.93 25.06Private Sector 1,69,648.52 46.48Total 3,64,960.14 100
Source: Central Electricity Authority (CEA)
Table 11.2.3 Outlay and expenditure in the Annual Plan 2018-19 and Annual Plan 2019-20, in ₹ lakhSl No
Name of the Department/Agency
Annual Plan 2018-19 Annual Plan 2019-20
Outlay Expenditure Per cent Outlay Expenditure up
to October 2019Per cent
1 KSEBL 2,09,960.24* 1,97,594.10 94.10 1,71,237.00 91,161.14 53.242 ANERT 5300.00 1,293.01 24.40 5,200.00 198.12 3.813 EMC 895.00 464.00 51.84 883.00 129.80 14.704 Electrical Inspectorate 836.00 135.42 16.20 825.00 33.02 4.00
Total 1,78,411.00 1,99,486.52 93.10 1,78,145.00 91,522.08 51.37Source: Plan space* Outlay as per revised estimate
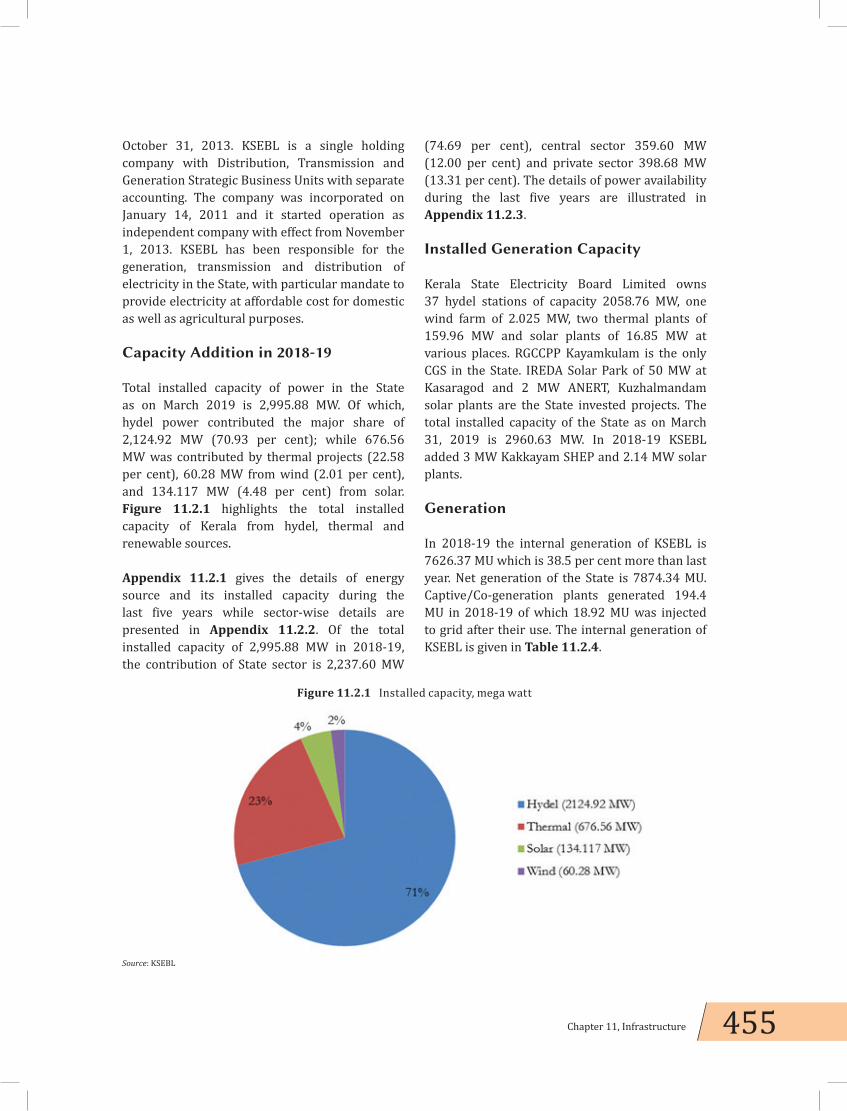
455Chapter 11, Infrastructure
October 31, 2013. KSEBL is a single holding company with Distribution, Transmission and Generation Strategic Business Units with separate accounting. The company was incorporated on January 14, 2011 and it started operation as independent company with effect from November 1, 2013. KSEBL has been responsible for the generation, transmission and distribution of electricity in the State, with particular mandate to provide electricity at affordable cost for domestic as well as agricultural purposes.
Capacity Addition in 2018-19
Total installed capacity of power in the State as on March 2019 is 2,995.88 MW. Of which, hydel power contributed the major share of 2,124.92 MW (70.93 per cent); while 676.56 MW was contributed by thermal projects (22.58 per cent), 60.28 MW from wind (2.01 per cent), and 134.117 MW (4.48 per cent) from solar. Figure 11.2.1 highlights the total installed capacity of Kerala from hydel, thermal and renewable sources.
Appendix 11.2.1 gives the details of energy source and its installed capacity during the last five years while sector-wise details are presented in Appendix 11.2.2. Of the total installed capacity of 2,995.88 MW in 2018-19, the contribution of State sector is 2,237.60 MW
(74.69 per cent), central sector 359.60 MW (12.00 per cent) and private sector 398.68 MW (13.31 per cent). The details of power availability during the last five years are illustrated in Appendix 11.2.3.
Installed Generation Capacity
Kerala State Electricity Board Limited owns 37 hydel stations of capacity 2058.76 MW, one wind farm of 2.025 MW, two thermal plants of 159.96 MW and solar plants of 16.85 MW at various places. RGCCPP Kayamkulam is the only CGS in the State. IREDA Solar Park of 50 MW at Kasaragod and 2 MW ANERT, Kuzhalmandam solar plants are the State invested projects. The total installed capacity of the State as on March 31, 2019 is 2960.63 MW. In 2018-19 KSEBL added 3 MW Kakkayam SHEP and 2.14 MW solar plants.
Generation
In 2018-19 the internal generation of KSEBL is 7626.37 MU which is 38.5 per cent more than last year. Net generation of the State is 7874.34 MU. Captive/Co-generation plants generated 194.4 MU in 2018-19 of which 18.92 MU was injected to grid after their use. The internal generation of KSEBL is given in Table 11.2.4.
Figure 11.2.1 Installed capacity, mega watt
Source: KSEBL
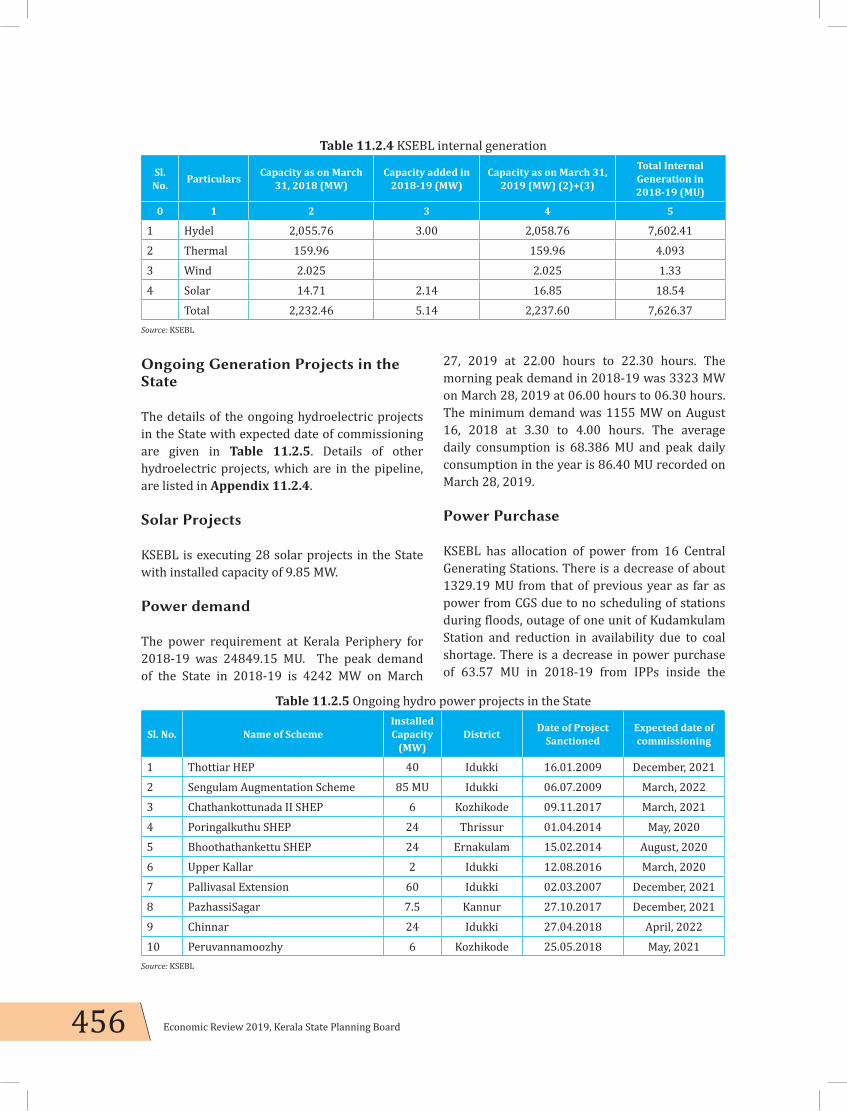
456 Economic Review 2019, Kerala State Planning Board
Ongoing Generation Projects in the State
The details of the ongoing hydroelectric projects in the State with expected date of commissioning are given in Table 11.2.5. Details of other hydroelectric projects, which are in the pipeline, are listed in Appendix 11.2.4.
Solar Projects
KSEBL is executing 28 solar projects in the State with installed capacity of 9.85 MW.
Power demand
The power requirement at Kerala Periphery for 2018-19 was 24849.15 MU. The peak demand of the State in 2018-19 is 4242 MW on March
27, 2019 at 22.00 hours to 22.30 hours. The morning peak demand in 2018-19 was 3323 MW on March 28, 2019 at 06.00 hours to 06.30 hours. The minimum demand was 1155 MW on August 16, 2018 at 3.30 to 4.00 hours. The average daily consumption is 68.386 MU and peak daily consumption in the year is 86.40 MU recorded on March 28, 2019.
Power Purchase
KSEBL has allocation of power from 16 Central Generating Stations. There is a decrease of about 1329.19 MU from that of previous year as far as power from CGS due to no scheduling of stations during floods, outage of one unit of Kudamkulam Station and reduction in availability due to coal shortage. There is a decrease in power purchase of 63.57 MU in 2018-19 from IPPs inside the
Table 11.2.4 KSEBL internal generation
Sl. No. Particulars Capacity as on March
31, 2018 (MW)Capacity added in
2018-19 (MW)Capacity as on March 31,
2019 (MW) (2)+(3)
Total Internal Generation in 2018-19 (MU)
0 1 2 3 4 5
1 Hydel 2,055.76 3.00 2,058.76 7,602.412 Thermal 159.96 159.96 4.0933 Wind 2.025 2.025 1.334 Solar 14.71 2.14 16.85 18.54
Total 2,232.46 5.14 2,237.60 7,626.37 Source: KSEBL
Table 11.2.5 Ongoing hydro power projects in the State
Sl. No. Name of SchemeInstalled Capacity
(MW)District Date of Project
SanctionedExpected date of commissioning
1 Thottiar HEP 40 Idukki 16.01.2009 December, 20212 Sengulam Augmentation Scheme 85 MU Idukki 06.07.2009 March, 20223 Chathankottunada II SHEP 6 Kozhikode 09.11.2017 March, 20214 Poringalkuthu SHEP 24 Thrissur 01.04.2014 May, 20205 Bhoothathankettu SHEP 24 Ernakulam 15.02.2014 August, 20206 Upper Kallar 2 Idukki 12.08.2016 March, 20207 Pallivasal Extension 60 Idukki 02.03.2007 December, 20218 PazhassiSagar 7.5 Kannur 27.10.2017 December, 20219 Chinnar 24 Idukki 27.04.2018 April, 202210 Peruvannamoozhy 6 Kozhikode 25.05.2018 May, 2021
Source: KSEBL

457Chapter 11, Infrastructure
State, out of which the reduction in energy from small Hydel IPP is 25.23 MU due to flood. KSEBL has entered into PPA for procuring 765 MW on design, build, finance, own and operate (DBFOO) basis for a period of 25 years. In addition to the above KSEB Ltd has entered into long term contract with various generators for 450 MW RTC power. The capacity allocated from various stations for which the PPAs have been executed is detailed in Appendix 11.2.5. To meet short term demands, power purchase through exchanges are also made on an average rate of ₹3.54/ per unit. KSEB had received a net energy of 252.45 MU from Southern grid through deviation settlement mechanism (DSM) at an average rate of ₹2.44 per unit. Considering power availability, swapping of power is also carried out in 2018-19. The total power purchase at Kerala periphery is 18046.57 MU. The abstract of generation and power purchase is graphically illustrated in Figure 11.2.2.
Sale of Power inside the State
KSEBL in 2018-19 has sold 21,536.77 MU power to 1,25,52,206 consumers including 11 bulk licences. ₹12,71,392 lakh were generated as total revenue. The total revenue from sale of power, including sales to other utilities outside the State is ₹13,053.27 crore.
Energy wheeled by open access consumers
The details of energy wheeled by open access consumers and injected by IPPs for sale for the year 2018-19 are given in Table 11.2.6.
Power sales through DEEP and exchanges
KSEB Ltd had sold the surplus power to M/s BSHPCL, 50 MW in June 2018, 100 MW during
Figure 11.2.2 Generation and power purchase
Source: KSEBL
Table 11.2.6 Comparison of energy wheeled through open access at Kerala periphery in FY 2019 with that of previous years
Particulars 2014-15 2015-16 2016-17 2017-18 2018-19
Energy (Import) 4.66 142 435.6 284.96 216.60Energy (Export) 25.43 40.44 43.06 43.07 37.40
Source: KSEBL

458 Economic Review 2019, Kerala State Planning Board
August to October 2018 during peak periods through DEEP (Discovery of Electricity Efficient Price) portal. KSEB Ltd had sold the surplus power to M/s CSPDCL, from October 1, 2018 to November 30, 2018 by participating in the tenders floated by them. The total power sold is 144.16 MU at ₹4.85 per unit at Kerala Periphery.
KSEBL has also sold excess power through exchanges. The total sale of power outside the State by KSEBL through exchanges for the year 2018-19 at Kerala periphery is 680.63 MU @ ₹3.85 per unit. 656.45 MU was sold through IEX @ ₹3.84 per unit and 24.18 MU through PXIL @₹4.07 per unit.
New proposals for Renewable power
KSEBL is considering all option to harness renewable power. Agreement has been executed with NHPC for 10 MW in the first phase of 50 MW from floating solar proposal at West Kallada, NTPC for 92 MW from floating solar proposal at Kayamkulam and 9.76 MW from Waste to Energy project at Brahmapuram. Power Supply Agreement (PSA) has been executed with Solar Energy Corporation of India (SECI) for 300 MW from Wind projects and Tehri Hydro Development Corporation India Limited (THDCIL) for 55 MW capacity additions at Kasaragod Solar Park. NHPC identified 82 MW Wind farm at Agali, NTPC identified 300 MW
floating solar project at the Idukki Reservoir, SECI identified floating solar at 100 MW at Banasurasagar reservoir and 50 MW at Kulamavu is under consideration.
Pattern of Power Consumption
Consumption of all Low Tension (LT) categories of consumers increased except decrease in agricultural category and LT Industrial category. Further the consumption of High Tension (HT) Industrial category (excluding energy drawl through OA) shows an overall increase of 4.14 per cent against 6.66 per cent of previous year. The energy sales in LT category shows an increase of 2.78 per cent only, whereas energy sales to HT and EHT category including bulk supply shows an increase of 3.79 per cent resulting in an increase of 3.05 per cent in total energy sales. There is a reduction in energy consumption in the case of bulk licensees due to switch over to REA by Electricity Department Pondicherry. The details of the pattern of power consumption and revenue collected in 2018-19 are furnished in Appendix 11.2.6.
In Kerala, electrical energy consumption has increased to 21,750.25 MU (include open access consumption) in 2018-19 from 21,159.19 MU in 2017-18, an increase of 2.72 per cent. Electrical Energy consumption in Kerala in 2012-13 to 2018-19 is depicted in Figure 11.2.3.
Figure 11.2.3 Electrical energy consumption in Kerala
Source: KSEBL

459Chapter 11, Infrastructure
Aggregate Technical and Commercial (AT & C) Losses
In 2018-19, AT&C loss has decreased to 13.14 per cent from 15.38 per cent and transmission and distribution (T&D) loss came down to 12.47 per cent from 13.07 per cent. KSEB has made significant achievement in the field of reducing AT&C loss. For Distribution SBU, the AT&C loss is 10.83 per cent and distribution loss is 9.07 per cent in 2018-19. The impact of AT&C loss reduction during the last five years is shown in Appendix 11.2.7. The AT&C loss and Distribution loss from 2013-14 is illustrated in Figure 11.2.4.
Distribution
The distribution network as on March 31, 2019 have 62,450 Ckt-km of 11 kV lines, 160.59 Ckt-Km 22kV lines, 2,89,804 Ckt-Km of LT lines and 79,876 distribution transformers with step down capacity of 9,703.9 MVA. The target and achievement of the distribution infrastructure in 2018-19 are given in Appendix 11.2.8. The infrastructure development of distribution system is included in Dyuthi 2021 project, under Oorjja Kerala Mission. KSEBL has been providing various online services to consumer like Oorjja Sauhrida the bill information system, Oorjjadooth, the Outage Management System, Centralised customer care service, Web Self
Services and online payment facility including NACH facility. In 2018-19 through Bharat Bill Payment System (BBPS) platform anywhere, anytime bill payment through variety of modes like cash, credit/debit cards, IMPS, internet banking, NEFT, prepaid card, Wallet and UPI became possible. 50 per cent of the total bill payments are now received online.
Collection of arrears
Special attention was paid to collecting arrears of electricity bill amount from time to time. Significant achievement was made in settling arrears of KWA and Health department in 2018-19. ₹1,326.69 crore of arrear of KWA up to 30-9-2018 is to be settled in four instalments from 2019-20 at ₹331.67 crore as per G.O dated January 14, 2019. An arrear of ₹5.65 crore from Health department has also been received. Arrear amounts of ₹13.32 crore have been collected from HT consumers and ₹7.14 crore from LT consumers in OTS scheme ended on December 31, 2018.
Transmission – Normal
Construction of new and up gradation of substations and lines, along with downstream works for effective utilisation of Transgrid 2.0 projects, to cater to the increasing demand for electricity are included in the scheme. To achieve
Figure 11.2.4 Aggregate Technical and Commercial losses, and transmission and distribution losses, in per cent
Source: KSEBL
460 Economic Review 2019, Kerala State Planning Board
the goal of 24x7 uninterrupted quality powers to the consumers and also for availability of power on demand, sufficient capacity of transmission network is to be developed. Also, works are necessary to satisfy the N-1 planning criteria put forth by the Central Electricity Authority. It is targeted to complete as many as 35 substation of different voltage level and 1084.64 circuit kilometre of transmission lines in coming years.
Kerala’s transmission infrastructure consisting of substations, its targets and achievements and network details as on March 31, 2019 is given in Appendix 11.2.9 and Appendix 11.2.10.
Oorjja Kerala Mission
GoK has launched ‘Oorjja Kerala Mission’ on June 14, 2018, aimed at the integrated development of electricity sector in the State. It aims at implementing five important projects detailed below in the next 3 years.
Soura
KSEB intends to achieve a cumulative capacity of 1000 MW to its renewable content through Solar Projects by 2021, 50 per cent of which is expected from Roof Tops (RTS). Another 150 MW each is expected from solar parks and floating solar projects. Remaining 200 MW is planned to be procured through reverse e-bidding, from solar projects commissioned in the country. Demand aggregation for first phase of RTS is already completed. For the first phase of 200 MW, 42,500 premises were selected from 2.78 lakh consumers who expressed interest in associating with the project. The tendering process is going on and the first phase is expected to be completed by March 2020.
Filament free Kerala
Through this project all the existing CFL and filament bulbs in domestic and street lighting sector in the State will be replaced with energy efficient and long lasting LED lamps targeting reduction in peak demand, global warming and
Hg pollution. More than 13 Lakh consumers have already registered for LED lamps in the 1st phase in which domestic sector was targeted. Tender process has already been initiated for procurement of one crore 9 watt LED lamps and the project is progressing smoothly.
Dyuthi 2021
This projects included in Oorjja Kerala mission, has commenced in FY 2018-19 with a mission to up lift the distribution grid of KSEB Ltd to international level. The total Plan outlay is ₹4,036.30 crore. GIS map preparation and DPR formulation were new experience for Distribution Works. Delay in Project Finalisation and DPR preparation has delayed the initiation of the project. Increased attention to timely completion of the centrally aided projects like DDUGJY and IPDS has also delayed the project. Devastating floods during 2018 and 2019 has also affected the progress. This necessitated some rework from the original Plan of Dyuthi 2021.
Transgrid 2.0 – 2 nd Generation Transmission network
This project aims at strengthening of transmission network to meet the future energy requirement of the State and is scheduled to be implemented in two phases. The 1st phase of the project is scheduled for execution during 2017-2022 and 2nd phase for 2019-2024. The works included in the 1st phase of the project are grouped into 13 packages and comprises construction of 12 substations and 2084 Circuit kilometre of EHT lines. Out of these 12 substations, 4 are Air Insulated Substations (AIS) and the remaining 8 are Gas Insulated Substations (GIS). 12 substations (AIS – 3 Nos. and GIS – 9 Nos.) are included in Phase II of the project which is grouped into 12 packages. Total cost for the two phases of the project is estimated at 10,000 crore. It is proposed to arrange the finance mainly from KIIFB, PSDF under CEA, MOP and Green Energy Corridor (GEC) under MNRE
461Chapter 11, Infrastructure
Implementation of the projects in Phase I are underway and are progressing as scheduled. 12 packages out of 13 in the 1st Phase have been awarded and tender is under process and for the remaining package. Out of the 12 substations targeted in the 1st phase, 7 substations (4 Nos. AIS and 3 Nos. GIS), including associated EHT lines, will be completed by July 2020. Remaining 5 substations and associated EHT lines are scheduled for commissioning by March 2021. 257.4 Ckt-Km of EHT lines have already been completed under the project. Preliminary works for the projects included in Phase-II have started. Two out of 12 packages have been tendered and DPRs for the remaining packages are under preparation.
eSafe
The eSafe project jointly mooted by Electrical Inspectorate and KSEB aims at zero electrical accidents. A massive publicity campaign will be the highlight of this project to sensitise the users of electricity on its safety aspects. The project aims at step wise modernisation of transmission and distribution sector. Bare conductor will be replaced by covered conductor and underground cables. Auto reclosures and circuit breakers will be inducted to distribution network. Procedures will be issued for each work. Work authorisation and permit to work will be issued online. Electric safety training will be given to people supervising and engaged in electrical works. In Jagratha scheme, ELCB will be installed in all household belonging to BPL consumers and rewiring, wherever necessary. Awareness campaign on safety will be done through Asha workers, Kudumbasree, and Ayalkuttam and Resident associations. Conduction of awareness classes by KSEBL safety wing are progressing.
Flagship projects of KSEBL
In addition to five projects included in Oorjja Kerala Mission cited above, the following four projects also form the flagship projects of KSEBL.
E-Mobility
Depletion of the fossil fuel stock, increasing fissure in the ozone layer, high level of atmospheric pollution has triggered measures for faster adoption of electric vehicles, globally and in India. The State of Kerala is one among the first in India, which declared its e-mobility policy. KSEBL has been designated as the State Nodal Agency to ensure deployment of e-Vehicle charging stations across the State. Under the auspices of KSEBL, the first fast charging station in the State has already been set up in Government Secretariat, Thiruvananthapuram. KSEBL will be shortly setting up one e-Vehicle charging station each in all the 6 Municipal Corporations, for which tender has been floated. Expression of Interest is sought for selecting Implementing Agencies for setting up e-Vehicle charging stations in 60 plus locations in pilot Districts of Thiruvananthapuram, Ernakulam and Kozhikode. Based on DPR submitted by KSEBL, GoK has allotted an amount of ₹8.22 crore for setting up 32 charging stations in Capital District.
Kerala Fibre Optic Network (K-FON)
The scope of the project is to build a Wide Area Network across the State in order to provide cost effective and high speed internet connection to 30,000 Govt offices and educational institutions, free internet access to 20 Lakh BPL families and non-discriminatory access to ISPs / telecom Operators to provide quality and affordable internet services to the citizens. The estimated project cost is ₹1028 crore. Implementation and maintenance of the network will be carried out by a Special Purpose Vehicle (SPV) with equity partnership of KSEBL, KSITIL and the State Government in the ratio 49:49:2. Among other benefits to KSEBL, the project ensures High Speed Internet Connectivity to all its offices. KSEB will get pole rent plus 4 fibres free of cost along the distribution line (47,289km). It will meet additional data communication requirements for Control and Protection, Smart Grids and Smart Meters and Internet of Things etc. The assets created will be vested with KSEBL.
462 Economic Review 2019, Kerala State Planning Board
Enterprise Resource Planning (ERP)
ERP will allow KSEBL to use a system of integrated applications to manage the business and automate many back office functions related to accounting, material management and human resources. The project was conceived as a Centrally Sponsored Scheme under IPDS. The project implementation period is 30 months.
Communicating Fault Pass Detectors (CFPD)
The employees of KSEB, after in-house research, developed cost effective Communicating Fault Pass Detectors which are very user friendly. This, together with Graphical User Interface (GUI) developed by KSEBL engineers, provide alert on mobile phone of the utility staff and provide visual identification of the faulty segment in a GIS map of the network. KSEBL intends to deploy 16,000 plus CFPDs in its HT network within 2022.
Central Government schemes
The details of implementation of important central Government power sector schemes in Kerala are detailed below.
Ujwal DISCOM Assurance Yojana (UDAY)
This is the financial turnaround and revival package for electricity distribution companies (DISCOMs) initiated by the GoI. Kerala Government and KSEBL signed MoU with GoI on March 15, 2017. The objective of signing MOU is improvement in internal efficiency of KSEBL. No financial assistance is included in MOU. KSEBL has achieved important operational targets or is at final stage of achievement except smart meter implementation in tendering stage and ERP in coding stage.
Deendayal Upadhyaya Gram Jyoti Yojana (DDUGJY)
Govt. of India scheme, Deendayal Upadhyaya Gram Jyoti Yojana (DDUGJY) for the rural areas, was implemented in Kerala for rural electrification and strengthening of sub-transmission and distribution infrastructure, including metering at distribution transformers, feeders and consumers end. The details of financial and physical progress of implementation of DDUGJY are shown in Appendix 11.2.11. The project is ready for closure by December 2019.
Pradhan Mantri Sahaj Bijli Har Ghar Yojana – Saubhagya”
Under Saubhagya free electricity connections to all households (both APL and poor families) in rural areas and BPL families in urban areas including single point wiring. Saubhagya as such, was not sanctioned to Kerala. ₹90 crore was sanctioned to Kerala to reconnect 3,19,171 households de-electrified in 2018 floods. Of which, ₹41.3234 crore has been received. KSEBL has already requested Nodal Agency REC to realise the balance amount. Kerala achieved greater penetration in house hold electrification in the last decade itself and completed 100 per cent household electrification in early 2017 resulting in meagre allocation under Saubhagya.
Integrated Power Development Scheme-IPDS
IPDS stage-1 was implemented in 25 distribution circles in the State to strengthen sub-transmission and distribution networks, metering of distribution transformers, feeders and consumers in urban area. The works under 21 circles out of 25 circles are completed. Cable laying works at Ernakulam, Perumbavoor, Kollam and Srekantapuram are pending due to delay in road cutting permission. Time extension was requested by KSEBL up to November 2019 for this project.

463Chapter 11, Infrastructure
IPDS stage II projects are-
i. Enterprise Resource Planning (ERP) – KSEBL is carrying out customisation/ development and implementation of ERP solution with the in-house development team under IT wing as part of partial turnkey basis execution. The supply, installation and commissioning of server, storage etc. is through turnkey execution. Two milestones in implementation process have been already achieved and now coding is in progress.
ii. Smart Meter implementation – As part of UDAY scheme 3,21,000 meters have to be installed. Only one bidder, M/s. United Electrical Industries Ltd. participated in the tender. The Board decided to proceed with re-tendering.
iii. Phase II IT Implementation in KSEB Ltd under IPDS – The project has been sanctioned covering 21 non SCADA towns. Implementation related activities like ring fencing has been completed in 21 towns. 367 modems in border meters and feeder meters of all 21 towns are installed. Modems are communicating with central server. DTR meter implementation is now progressing. Asset survey of pilot town is also progressing.
iv. Real Time Data Acquisition System (RT-DAS) for Non-SCADA Towns under IPDS – The Notice Inviting Tender for implementation was published on July 9, 2019. The technical bid was opened on September 7, 2019. Technical evaluations of the bids are progressing.
Pradhan Mantri Kisan Urja Surakshaevem Uttahan Mahabhiyan (PM KUSUM)
Ministry of New and Renewable Energy (MNRE) has launched the Pradhan Mantri Kisan Urja Suraksh aevem Utthaan Mahabhiyan (PM KUSUM) for farmers for installation of solar pumps and grid connected solar and other renewable power plants in the country. The
scheme aims to add solar and other renewable capacity of 25,750 MW by 2022 with total central financial support of ₹34,422 Crore including service charges to the implementing agencies.
The Scheme consists of three components:
Component A: Envisages installation of 10,000 MW of Decentralised Ground Mounted Grid Connected Renewable Energy Power Plants by farmers of 500 kW to 2 MW capacity within 5 km distance from sub-station primarily on barren/uncultivable land. DISCOMs will purchase power at pre-fixed tariff for which they will get PBI @ ₹0.40 per unit purchased or ₹6.6 lakh per MW of capacity installed, whichever is less, for a period of five years from the COD.
Component B: Targets Installation of 17.50 lakh standalone Solar Powered Agriculture Pumps of individual pump capacity up to 7.5 HP. GoI will provide financial support up to 30 per cent of the cost of solar pump and States to also provide at least 30 per cent of the cost of solar pump, balance cost to be shared by the beneficiary farmer. Centralised tendering for 1.75 lakh standalone Solar Powered Agriculture Pumps under Component-B has been initiated by EESL, bid closing date was 30.9.2019 and technical evaluation is under progress.
Component C: For Solarisation of 10 Lakh Grid-connected Agriculture Pumps of individual pump capacity up to 7.5 HP. GoI will provide financial support up to 30 per cent of the cost of solarisation and States to also provide at least 30 per cent of the cost of solarisation, balance cost to be shared by the beneficiary farmer.
Pilot Implementation
State Nodal Agencies (SNAs) of MNRE will coordinate with State, DISCOMs and farmers for implementation of the scheme. Components A and C of the Scheme will be implemented in Pilot mode till December 31, 2019. The Component B, which is an on-going sub-programme, will be

464 Economic Review 2019, Kerala State Planning Board
implemented in entirety without going through pilot mode.
It is understood that on successful implementation of pilot run of Components A and C of the Scheme, these components would be scaled-up, after getting necessary approval.
Decentralised Ground Mounted Grid Connected Renewable Energy Power Plants in Component-A can be setup in barren, uncultivated land by land owners themself or by leasing land to developers. KSEBL can also consider developing renewable energy plants on behalf of land owners. In case of cultivable land, solar plants can be installed on stilts, so that the farmers continue to cultivate the land, apart from getting the benefit from solar plants. This will open a stable and continuous source of income to the land owners through productive utilisation of otherwise unusable land or an additional utilisation of agriculture land.
In respect of existing agriculture consumers using agriculture pumps, the revenue realisation against electricity usage from these consumers is much below average cost of supply. In 2018-19, the average cost of supply by KSEBL is 619 paisa per unit and average realisation from tariff for agriculture consumers is only 257 paisa per unit. A Government subsidy of ₹0.85 / unit is allowed to agriculture consumers in tariff. The 5,38,918 agriculture pumps connected to grid, consumed 337.65 MU in 2018-19 aggregating a claim of ₹28.70 crore as subsidy from State exchequer. The solarisation of pumps in component-C of this scheme with 30 per cent CFA, 30 per cent State support, 10 per cent initial payment and with availability of 30 per cent balance loan (optional) will be attractive to farmers, Government and utility. This solarisation will reduce the subsidy burden of the State as well as cross subsidy burden to other categories of consumers. Moreover, the anticipated burden on farmers, in light of proposals of Central Government to eliminate cross subsidy in near future, can be averted by solarisation.
Sustainable Rooftop Implementation for Solar Transfiguration of India (SRISTI)
GoI, Phase II Grid connected rooftop solar programme, with a target for achieving cumulative capacity of 40,000 MW from Rooftop Solar (RTS) Projects by the year 2022 will be implemented with total central financial support of ₹11,814 crore with Power Distributing Companies (Discoms) as implementing agencies. Central Financial Assistance/ Subsidy will be available for the residential sector up to 10KW plants. Performance based incentives will be provided to DISCOMs based on RTS capacity achieved in a financial year, till the duration of the scheme, based on the base capacity i.e., cumulative capacity achieved at the end of previous financial year. SRISTI is a suitable project for States like Kerala were barren land is scarce. In SRISTI, timeline for implementation of first batch of allocation has been announced. KSEB was allotted 50 MW under the scheme for 2019-20. Process for floating tender has to be initiated. More allocation is expected in subsequent years.
24 x7 Power for all
Kerala has attained 24 x7 power supply status in all areas of the State including agriculture consumers. 1,100 Urban feeders and 640 rural 11kV Feeder are connected to National Power Portal (NPP) and can be monitored.
R-APDRP Scheme.
Part-A installation of SCADA completed in all three city schemes. Third party inspection has been completed. Part- B works completed on March 31, 2018. Project closure was done on June 2018.
Unnat Jyoti by Affordable LEDs for All (UJALA)
This scheme provides LED bulbs to domestic consumers with a target to replace 770 million
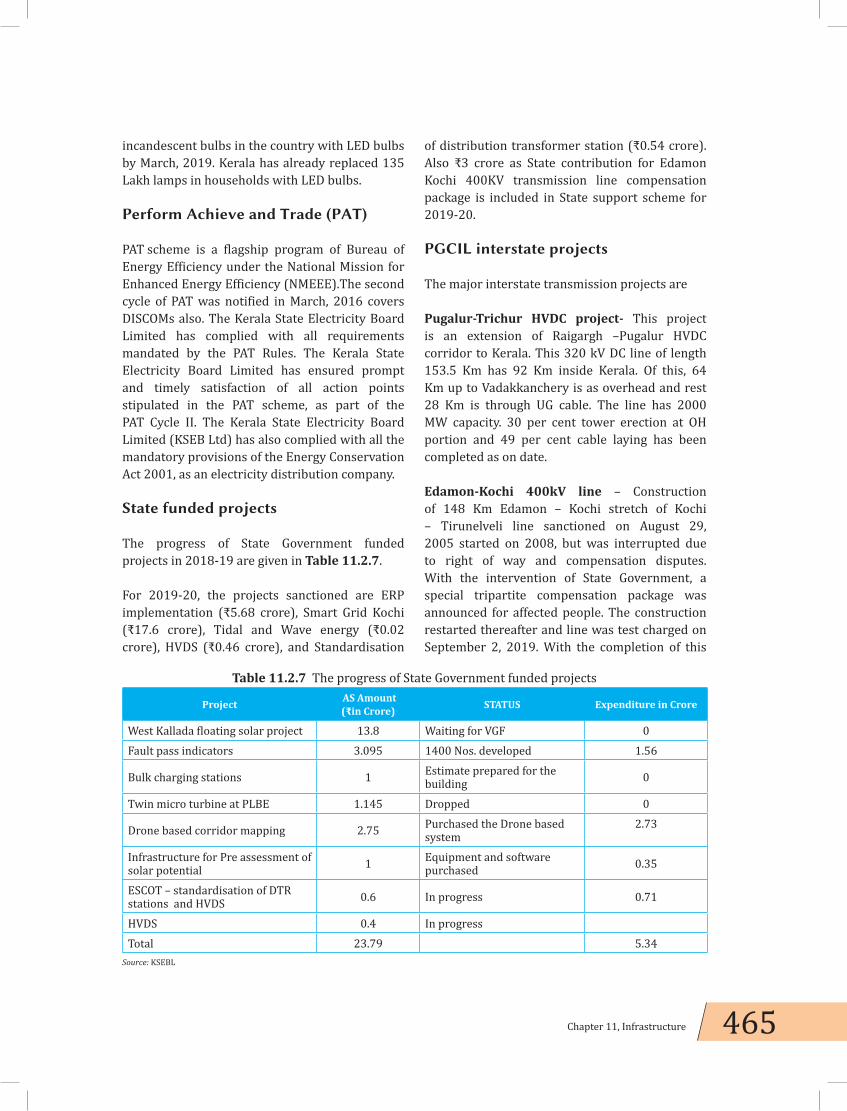
465Chapter 11, Infrastructure
incandescent bulbs in the country with LED bulbs by March, 2019. Kerala has already replaced 135 Lakh lamps in households with LED bulbs.
Perform Achieve and Trade (PAT)
PAT scheme is a flagship program of Bureau of Energy Efficiency under the National Mission for Enhanced Energy Efficiency (NMEEE).The second cycle of PAT was notified in March, 2016 covers DISCOMs also. The Kerala State Electricity Board Limited has complied with all requirements mandated by the PAT Rules. The Kerala State Electricity Board Limited has ensured prompt and timely satisfaction of all action points stipulated in the PAT scheme, as part of the PAT Cycle II. The Kerala State Electricity Board Limited (KSEB Ltd) has also complied with all the mandatory provisions of the Energy Conservation Act 2001, as an electricity distribution company.
State funded projects
The progress of State Government funded projects in 2018-19 are given in Table 11.2.7.
For 2019-20, the projects sanctioned are ERP implementation (₹5.68 crore), Smart Grid Kochi (₹17.6 crore), Tidal and Wave energy (₹0.02 crore), HVDS (₹0.46 crore), and Standardisation
of distribution transformer station (₹0.54 crore). Also ₹3 crore as State contribution for Edamon Kochi 400KV transmission line compensation package is included in State support scheme for 2019-20.
PGCIL interstate projects
The major interstate transmission projects are
Pugalur-Trichur HVDC project- This project is an extension of Raigargh –Pugalur HVDC corridor to Kerala. This 320 kV DC line of length 153.5 Km has 92 Km inside Kerala. Of this, 64 Km up to Vadakkanchery is as overhead and rest 28 Km is through UG cable. The line has 2000 MW capacity. 30 per cent tower erection at OH portion and 49 per cent cable laying has been completed as on date.
Edamon-Kochi 400kV line – Construction of 148 Km Edamon – Kochi stretch of Kochi – Tirunelveli line sanctioned on August 29, 2005 started on 2008, but was interrupted due to right of way and compensation disputes. With the intervention of State Government, a special tripartite compensation package was announced for affected people. The construction restarted thereafter and line was test charged on September 2, 2019. With the completion of this
Table 11.2.7 The progress of State Government funded projects
Project AS Amount (₹in Crore) STATUS Expenditure in Crore
West Kallada floating solar project 13.8 Waiting for VGF 0Fault pass indicators 3.095 1400 Nos. developed 1.56
Bulk charging stations 1 Estimate prepared for the building 0
Twin micro turbine at PLBE 1.145 Dropped 0
Drone based corridor mapping 2.75 Purchased the Drone based system
2.73
Infrastructure for Pre assessment of solar potential 1 Equipment and software
purchased 0.35
ESCOT – standardisation of DTR stations and HVDS 0.6 In progress 0.71
HVDS 0.4 In progress Total 23.79 5.34
Source: KSEBL

466 Economic Review 2019, Kerala State Planning Board
stretch, first 400 kV power high way through the State i.e., Tirunelveli-Kochi-Trichur-Udumalpet become reality. The line has 2000 MW Capacity.
Dam Rehabilitation and Improvement Project (DRIP)
Dam Rehabilitation and Improvement Project (DRIP) aims to improve the safety and sustainable performance of existing dams and associated structures with the assistance of World Bank through Govt. of India. 12 projects consisting of 28 numbers of dams are selected under DRIP for KSEB. The works included basic dam facilities, remedial measures and institutional strengthening. Bid for Works/Goods/Consultancy amounting to ₹153.67 crore under all the twelve hydro- electric projects, were invited. Out of these 97 packages, 79 packages amounting to ₹86.55 crore were awarded and the remaining 9 packages worth ₹36.68 crore are under various stages of bid processing. Bids for the remaining 9 packages, amounting to ₹20.44 crore is scheduled to be invited.
Power Theft
Cases of power theft and connected abnormalities are very low in the State due to strict enforcement of law and awareness in society. KSEBL has Anti Power Theft Squad (APTS) constituted to detect pilferage and misuse of electricity in all Districts. Field staff is also given monthly targets for inspection. In 2018-19, 237 theft cases were detected, from which 11,15,443 units were estimated as extracted by theft, the cost of such energy is ₹1.9867 crore. In 232 cases the loss has been realised.
Electrical Accidents
KSEBL has targeted 2018-19 as zero accident year and efforts were made to attain the objective. There were 123 fatal accidents to human beings and 56 fatal accidents to animals from KSEBL installation. There were also 211 non-fatal accidents to human beings. From consumer installations, 122 fatal accidents
occurred to human beings and 13 to animals. Non-fatal accidents in this category to human beings were 9.
Natural calamities
Floods in 2018 and 2019 were devastating natural calamities. The impact on the electricity sector was as follows.
Floods 2018
Kerala faced unprecedented and continues downpour across the State in the 2nd week of August, 2018. Landslides and Flood occurred across the State. Land area was submerged for weeks in central Districts of Kerala. Five major hydro generating stations and fourteen small Hydel stations of KSEB Ltd were affected due to the flood and subsequent landslide. 10 transmission corridors were damaged or switched off. 50 transmission substations were shut down due to submerged yards and control rooms or due to non-availability of lines.
Massive flood hit the Distribution infrastructure badly. Power Distribution in 300 odd Electrical Sections in seven Districts was shattered. 16,158 Distribution Transformers were out of service. Service to 25.60 lakh consumers was disrupted in the calamity. To restore normalcy in power Distribution, 1735 Distribution Transformer Stations and 5275.80 km Distribution lines will have to be reconstructed. Around one lakh poles were damaged. Three lakh Single Phase energy meters and Fifty thousand Three Phase energy meter were damaged due to submergence. A total damage of ₹352 crore was assessed.
Restoration (Mission Reconnect) 2018
It was realised that if the normal systems and procedures are followed, the restoration of normalcy in seriously affected Districts would take months. A program on mission mode, Mission Reconnect was launched by KSEBL to restore normalcy in minimum time period. KSEB had internally set a goal to restore all

467Chapter 11, Infrastructure
disrupted Distribution Networks and affected Service Connections by August 31, 2018. 99.99 per cent of this target was achieved. Around 720 single point connections were given to premises, where installations became faulty due to flood water. These single point connections were given free of cost. KSEBL has also extended payment period for consumers affected by flood. All transmission corridors, power houses and Sub stations were also restored according to Plan. Mission Reconnect is an exemplary model of how individual professionalism along with a strong team effort with meticulous resource management can produce great results.
Floods 2019
Most of the losses due to the monsoon in 2019 were in the northern Districts of Palakkad, Kannur, Kozhikode, Malappuram and Wayanad. The three generators of Kakkayam, seven minor hydroelectric power stations and floating solar plant on the Barapole Canal were damaged. The operation of 43 substations, including two 220 kV substations and six 110 kV substations, was disrupted. It is estimated that 50.47 Lakh consumers were affected by the 2019 floods. It is estimated that KSEBL had suffered a loss of ₹243.05 crore during this monsoon.
Mission Reconnect 2019
In light of previous experience, the Mission Connect was redesigned following Flood 2019, coordinating various teams to properly utilise the necessary equipment and manpower and take initiatives to ensure the safety of the public. Relief camps and KWA’s pump houses were able to supply electricity on a wartime basis, alleviating the hardships of the civilian population. As part of Mission Reconnect 2019, power supply was restored at all inhabitable houses and other buildings by August 20, 2019 itself. In the case of generating stations, except one generator at Kakkayam and Vellathooval SHEP, all other affected stations and generators were made operational in record time.
After floods
Emergency Action Plan (EAP) for 24 dams owned by KSEBL has been prepared with technical assistance of Central Water Commission. In addition, the rule curve, that specifies the storage or empty space to be maintained in a reservoir during different times of the year, of major dams Idukki, Idamalayar, Kakki and Banasurasagar- has been prepared and the water level in the reservoirs has been fixed according to the Rule Curve. The State Government has approved the rule curve prepared by the Central Water Commission.
De-siltation of reservoirs
In the light of unprecedented rain fall and consequent landslides and flood during August 2018 and August 2019, KSEBL accorded sanction to invite Request for Proposal (RFP) for the desiltation of reservoirs of KSEB as per the guidelines specified in the approved Standard Operating Procedure (SOP) by GoK. Action has already initiated for inviting RFP for the desiltation of reservoirs on phased manner and in the first phase desiltation of Poringalkuthu, Kallarkutty, Mattuppety and Kundala reservoirs are included.
Achievements of KSEBL in 2018-19
• Mission reconnect 2018 launched by KSEBL during floods 2018 repaired 16,158 Distribution Transformers, reconstructed 1735 Distribution Transformer Stations, restored 25.60 lakh service connections, reconstructed 5275.80 km Distribution lines including one lakh damaged poles, replaced Three lakh Single Phase energy meters and Fifty thousand Three Phase energy meter damaged due to submergence and effected 720 single point connections were existing installation were damaged in floods in 21 days.
• Kakkayam SHEP (3 MW) commissioned and 2.14 MW solar plants added.
• 3,68,673 new service connections were given and 2401 nos. of new distribution

468 Economic Review 2019, Kerala State Planning Board
transformers were installed. 1773 km of 11 kV line and 3401 km of LT line were constructed.
• Construction of three 110 kV, one 66 kV, five 33 kV substations and 117.05 km of lines in the voltage levels including 33 kV above, capacity addition of 10 MVA step up transformers and 381 MVA step down transformers are the achievements in the transmission sector.
• The revenue deficit of ₹784.09 crore in 17-18 was reduced to ₹290.01 crore in 2018-19.
• KSEBL has attained loss reduction, Transmission and Distribution losses reduced to 12.47 per cent in 2018-19 from 13.07 per cent in 2017-18 and AT&C loss of utility reduced to 13.14 per cent from 15.38 per cent. AT&C loss for Distribution Strategic Business Unit has been reduced to 10.83 per cent in 2018-19 from 12.44 per cent in 2017-18 and distribution loss to 9.07 per cent in 2018-19 from 9.39 per cent in 2017-18.
Challenges and Issues
KSEBL has been facing the challenge of Open Access regime and decentralised renewable generation as they are eroding the consumer base of the utility considerably. Capacity addition has become an issue due to limitations to develop large hydel stations and coal based stations in wake of opposition from environment groups. Scarcity of barren land to install solar plants, limited wind energy potential, inadequate power corridors to import power from Northern grid and insufficient network of intra State transmission lines are other issues faced by the State. Right of way problem and scarcity of land for drawing new transmission lines is the main hindrance for network development. Distribution network has many bottlenecks like poor networking, old and under rated lines, lack of alternate feeding facility, low HT/LT ratio and nonstandard structures. Increasing electrical accidents is another issue. Upcoming e- vehicles boom, demands adequate charging infrastructure and additional power.
Induction of multiple franchises and supply licences will lead to cherry picking and no profitable areas will be left to DISCOMs, increasing its debt and loss. The proposed amendment to Tariff Policy that cross subsidy surcharge payable by creamy consumer shall be progressively reduced every year by 25 per cent of the prevailing value without any reference to prevailing levels of cross subsidy, will adversely affect consumers with low demand and underprivileged in the society. In Kerala this may create tariff shock to most needy sections of consumers.
NON-CONVENTIONAL AND RENEWABLE SOURCES OF ENERGY
Energy can be generally classified as non- renewable and renewable. Over 85 per cent of the energy used in the world is from non-renewable supplies. Most developed nations are dependent on non-renewable energy sources like fossil fuels (coal and oil) and nuclear power. The other renewable or potentially renewable sources are solar, geothermal, hydroelectric, biomass and wind. Most developing countries have abundant renewable energy resources.
The implementing and regulating agencies associated with the non-conventional and renewable sources of energy in Kerala are (i) Agency for Non-conventional Energy and Rural Technology (ANERT), (ii) Energy Management Centre (EMC) and (iii) Meter Testing and Standards Laboratory (MTSL).
Agency for Non-Conventional Energy and Rural Technology (ANERT)
Agency for Non-conventional Energy and Rural Technology (ANERT) is an autonomous body under the Power Department, GoK. ANERT is the nodal agency for the implementation and propagation of non-conventional sources of energy in the State. It is also the nodal agency for the Ministry of New and Renewable Energy Sources (MNRE), GoI, to carry out the Central Government programmes in Kerala.

469Chapter 11, Infrastructure
Box 11.2.1 Draft Kerala Power Policy 2019
The draft power policy published by the State Government foresees more consumer-friendly initiatives, realistic summarising and futuristic steps, all in tandem with the disruptive technologies hitting the global power market with a renewed pace and energy. One of the major objectives is the possibility of establishing `grid-level energy storage system’, which would help the State to store solar power for convenient use.
Key Objectives
1. Transform Kerala power sector to provide electrical infrastructure services matching global standards living up to the expectations on ‘Nava Keralam’
2. Modern electric network that is reliable, safe, efficient and smart3. Meeting the electrical energy requirements of the State continuously without any form of
restrictions4. Balancing the need of sourcing power at the most competitive rates and at the same time
ensuring energy security of the State5. Enhancing share of renewable energy in the generation mix, addressing its variabilities using
appropriate technology with a framework for sharing associated costs6. Keeping price of electricity affordable and at the same time ensuring financial health of
electricity industry7. Improving efficiency and effectiveness of KSEB Ltd and rationalising its operational costs8. Bridging the gap between consumer expectations and actual levels of service delivery through
organisational revamping and increased utilisation of information technology9. Overcoming limitations of present electrical industry structure to offer next generation
services in areas such as renewable energy, energy efficiency, Electric Motor Vehicles, storage technologies etc
Source:
Table 11.2.8 Outlay and expenditure of ANERT in 2018-19 and 2019-20, in ₹ lakh
Sl No Schemes
Annual Plan 2018-19 Annual Plan 2019-20
Outlay Expenditure Per cent OutlayExpenditure upto October
2019Per cent
1 Programmes on Renewable Energy
3,830.00 612.36 15.9 3,500 305.96 8.7
2 Renewable Energy Public Engagement, Outreach, Studies and Development
1,470.00 577.15 39.3 1,700 192.74 11.3
Total – ANERT 5,300.00 1,189.51 22.4 5,200 498.7 9.6Source: Planspace
The scheme-wise outlay and expenditure of ANERT in 2018-19 and 2019-20 (expenditure up to September 2019) is given in Table 11.2.8.
Achievements of ANERT in 2018-19
• eGovernance – The biggest achievement was the launch of the electronic
marketplace for renewable energy systems. The portal www.buymysun.com was launched on World Environment Day (5-Jun-2018). The platform has backend linkages to workflow for approvals of vendors, products, processes, etc. and to external systems such as Aadhaar, eSMS, NGO – Darpan, MNRE-SPIN, KSEBL, online

470 Economic Review 2019, Kerala State Planning Board
payment gateway, etc. All the processes related to procurement, feasibility check and field verification using mobile-app, disbursement of subsidy through DBT, are paperless. This is the first of its kind portal in India.
• Solar Cold Storage – ANERT installed a solar cold storage system at Subicsha Coconut Producer Company Ltd, Kozhikode as a pilot project to support farmers. The system consists of a 5 hp compressor motor and solar panels with 6 kW capacity, can hold up to 5 tonnes of products. In the event of a power outage the cold storage can maintain its cold temperature for up to 30 hours. It was inaugurated on September 24, 2019.
• Installation of Solar Radiation Resource Assessment stations: ANERT had installed two Solar Radiation Resource Assessment stations at Kuzhalmannam (Palakkad) and Ramakkalmedu (Idukki) through NIWE (Govt of India). These are in addition to the existing ones at Kannur and Pulinkunnu (Alappuzha) installed by NIWE under MNRE programme.
• Solar cooking system – A parabolic-trough concentrator based steam cooking system was installed by ANERT in the Pre Matric Hostel, Neriyamangalam, Ernakulam as a deposit work. The community solar steam cooking system is designed for cooking food for 100 inmates. The system consists of parabolic trough solar concentrators of collector area 30 sq. metre, storage tank, water pump, solar tracking mechanism, cooking vessels, insulated steam pipelines, expansion tank, back up electrical heaters etc. It is the first solar community steam cooking system installed in Kerala. The system was installed in September 2019.
• Supporting R & D innovation – ANERT initiated a programme on Supporting R&D and Innovation (SRI) in 2018-19 to promote innovative ideas and technology adaptations in renewable energy. 37 project proposals from various institutions were received by ANERT. After scrutiny, 32 proposals were short-listed and were
presented before the Technical Advisory Committee (TAC) of ANERT which recommended 12 proposals for financial support.
• Accreditation of Solar Power Plant Inspectors – In order to ensure that the quality of solar power plants are ensured in the components used and also in the installation practices ANERT is developing a panel of accredited Solar Power Plant Inspectors. Training has been provided to 47 solar power plant inspectors in 2 batches.
• Accreditation of Solar Power Plant Installers (Technicians) – Considering the increased interest in renewable energy sector and to ensure quality of installations ANERT has started accrediting installers of solar power plants. 150 installers trained in 5 batches.
• Establishment of integrated renewable energy complexes in all the 14 Districts. Infrastructure facilities have been provided to 14 Districts.
• 3 training programme have been conducted under capacity building and outreach.
• Accident insurance coverage for 558 ANERT empanelled RE technicians has been provided
• Solar Power Plants in Public Buildings (on-grid and off grid)- 25kW as on grid and 41kW as off-grid
• Ramakkelmedu Solar Wind Storage Hybrid power plant installed. 500 kW modules of the 1 MW solar power plant have been installed. The work of remaining 500 kW solar and connectivity is in progress.
• Innovative RE projects: Under pilot project on solar power coir ratt, total 3 kW systems installed in 2 coir societies, which greatly reduced the number of unproductive days thus increasing wages.
• 1000 nos of solar lanterns has been distributed for vendors through Jyothi-solar lighting
• Akshaya Urja Service centres: Setting up 140 nos of Akshaya Urja Service centres across the State have been rolled out.

471Chapter 11, Infrastructure
Challenges and Issues
• Availability and accessibility of land• Resource constraints for promoting
Renewable Energy Projects.• No clear policy on Power Procurement from
Renewable Energy Sources.• Non adherence to Renewable Purchase
Obligation (RPO) targets and compensation thereon.
• Lack of SOP’s for RE Projects and relaxation on wheeling and transmission charges
As part of ANERT, a preferential tariff/generation based incentives/viability gap funding to promote RE projects meeting RPO targets, a renewable energy fund in the form of green energy cess against every unit of nonrenewable energy consumed, Policies for limiting wheeling/ transmission charges on Renewable Energy and enhanced limits on solar generators to grid, Standard operating procedures for RE projects and making RE marketing in major domestic buildings/commercial industries, Hallmarking percentage of the infra fund in various sectors for RE projects, Re-orienting ANERT as a knowledge hub for Renewable Energy are to be considered.
Energy Management Centre (EMC)
Energy Management Centre (EMC) is the State designated agency of Bureau of Energy Efficiency, MoP, GoI for promoting energy conservation, energy efficiency and enforcing
Energy Conservation Act, 2001 in the State. EMC also promotes small/mini/micro hydel schemes. SHP Cell constituted by GoK under Power Department is also attached in EMC to give impetus for development of SHPs through private participation.
The scheme-wise outlay and expenditure of EMC in 2018-19 and 2019-20 (expenditure up to September 2019) is given in Table 11.2.9.
Achievements of Energy Management Centre
Awards and recognitions
• EMC received the Future Kerala Brand Awards 2018 in the category of responsible Energy Conservation Brand on 27 March 2019 at Kochi.
• NITI Aayog with the support of BEE prepared the first State Energy Efficiency Preparedness index and Kerala topped with 77 points, followed by Rajasthan, Andra Pradesh, Maharashtra and Punjab.
• EMC bagged the First Place in the National Energy Conservation Award instituted by the Ministry of Power, GoI in the category of State Designated Agency
• The short film produced by EMC “AanayumMumbe” (Before the light goes off) received special jury Award in the 9th National Science Film Festival of India 2019 held at Mohali.
Box 11.2.2 Pilicode – the first filament free Panchayat in India
Pilicode Grama Panchayat, Kasaragod was declared as the first Filament Lamp (Incandescent lamp) free Grama Panchayat in India on April 2018. PilicodeGramaPanchayat had implemented this project with the support of Energy Management Centre (EMC), Kerala with the active participation of the public. Inthe first phase EMC had trained 600 volunteers from the Pilicode Grama Panchayat. They had conducted awareness programmes in all Domestic Consumers and conducted a survey on electrical lamps and appliances in households. Based on the survey, EMC distributed 16,500 numbers of 9 watts LED bulbs to all domestic consumes @ ₹50. Kerala State Electricity Board Ltd had distributed 20,000 numbers of 9 watts LED bulbs @₹65. Energy audits were conducted in all Government buildings and EMC distributed 9 watts LED bulbs and Five Star Rated Ceiling Fans to all Government Offices free of cost. Also supplied 250 numbers of LED street lights free of cost. Pilicode Grama Panchayat has saved 12 Lakh (Twelve Lakh) units of Electricity per Year (One Lakh units of Electricity per Month) through these efforts.
Source: EMC

472 Economic Review 2019, Kerala State Planning Board
Energy Conservation programmes
• Through energy conservation activities saved 33.754 MU of electricity and 88305 Kilolitres of oil in 2018-19.
• Implemented recommendations of energy audit report in three Civil Station Buildings – Alappuzha, Kollam and Pathanamthitta.
• Retrofitting of energy efficient equipment in 10 primary health Centres (327 LED Tube, 145 Ceiling fan, 240 LED bulb.
• Four Grama Panchayats, namely, Aryad Grama Panchayat, Vathikudy Grama Panchayat, Mangalapuram Gram Panchayat and Rajakkad Grama Panchayat were made Model Energy Efficient Panchayat.
• Completed the energy audit of all Street Lights in 17 Municipalities/Corporations.
• As part of URJA KIRAN, 280 awareness programs and 140 energy conservation rallies were conducted covering all the 140 constituencies in Kerala in association with 155 NGOs.
• As a part of Energy Clinic Programme, 372 women across 9 Districts were given training. 5000 Energy Clinics were conducted which covered about 1 Lakh consumers.
• As part of Smart Energy Program, 4530 schools from 41 Educational Districts are enrolled. 41 sensitisation camps, 45 Oorjjolsavams at revenue Districts and 14 District level programs were conducted.
• EMC participated/organised 13 numbers of exhibitions on energy conservation and 12 special energy conservation programs
• Installed 2 KW off grid solar power plant for 9 schools in association with ANERT.
• Procured energy efficient equipment for 61 flood affected schools (433 LED bulb, 385 LED tube, 329 ceiling fan).
• Developed mobile application for carbon neutral schools. 245 schools registered for carbon neutral schools program.
Small Hydro Power Development
• Installed 20 kW Vortex Micro hydroelectric Project at Kaduvetti bridge under the premises of Thiruvananthapuram Corporation.
• Completed the topographical investigations study for 3 projects in Thiruvananthapuram District (Saigramam, Maruthankuzhi and Vazhayila- Aramkallu).
Research and Development
• Completed the energy efficiency study of 25 KSEB Distribution Transformers and Agriculture Pump Sets in the State of Kerala and presented the report.
Table 11.2.9 Outlay and expenditure of EMC in 2018-19 and 2019-20, in ₹ lakh
Sl No Schemes
Annual Plan 2018-19 Annual Plan 2019-20
Outlay Expenditure per cent OutlayExpenditure up
to September 2019
per cent
1 State Energy Conservation Awards 25.00 25 100 25 0.00 0
2 Energy Conservation Activities 310.00 210 67.74 312 80.00 25.64
3Infrastructure Development and Institutional Strengthening
190.00 147 77.37 361 94.00 26.04
4 Kerala State Energy Conservation Fund 370.00 82 22.16 185 17.50 9.46
Total – EMC 895.00 464 51.84 883 191.5 21.68Source: Planspace

473Chapter 11, Infrastructure
Challenges and Issues
• Financing models based on energy saving/productivity/benchmarks in priority areas.
• Mechanism to handhold and implement energy management projects
• Emission reduction and Climate Change mitigation not mandatory
• Commercial sector activities not mandated to follow energy efficiency in design/ construction stages.
• Energy Conservation Building Code Rules (ECBC) needs adaptation through PWD, LSGD and Developers.
• Demand aggregation of existing inefficient appliances and their replacement.
• Adoption of energy efficient in the Agricultural value chain sector
• Protocols /Policies for adoption of energy efficiency in domestic sector
• High land costs and forest clearance issues in Small Hydro Power development.
Department of Electrical Inspectorate
The Electrical Inspectorate is functioning under the Department of Power, GoK. Safety inspections are carried out and sanction for energisation for all HT/EHT and other medium voltage installation in the State are issued by this inspectorate. The motto of Meter Testing and Standards Laboratory (MTSL) is to provide testing and calibration
of various types of electrical equipment. At present, calibration facilities is available for voltage, current, resistance, frequency, power, power factor and energy. The testing facilities include pre-commissioning tests for protection relays and instrument transformers. Also, pre-commissioning tests are conducted for power transformers, cables and circuit breakers. All calibrations and tests are conducted as per national and international standards. Enquiry into all electrical accidents occurring in the State, forwarding the reports to the State Government and taking actions against responsible person/authority are also done by Electrical Inspectorate.
The Electrical Inspectorate department implements three schemes namely; Meter Testing and Standards Laboratory, Effective Implementation of Quality Control Order and E-Safe Kerala. Revenue from the department for the last two years is ₹124.376 crore (excluding duties from KSEBL), which includes testing fees from Meter Testing and Standards Laboratory (MTSL), other Regional Testing laboratories and from other services. Through quality control inspection, the sale of non-standard electrical equipment can be controlled to some extent.
The scheme-wise outlay and expenditure of Electrical Inspectorate in 2018-19 and 2019-20 (expenditure upto September 2019) is given in Table 11.2.10.
Table 11.2.10 Outlay and expenditure of electrical inspectorate in 2018-19 and 2019-20, in ₹ lakh
Sl No Schemes
Annual Plan 2018-19 Annual Plan 2019-20
Outlay Expenditure Per cent OutlayExpenditure
upto September 2019
Per cent
1 Meter Testing and Standards Laboratory (MTSL)
418 92.53 22.14 470 5.36 1.14
2 Effective Implementation of QCO
220 7.63 3.47 155 1.59 1.03
3 E-safe Kerala 198 35.25 17.80 200 30.17 15.08Total 836 135.42 16.2 825 37.12 4.5
Source: Planspace

474 Economic Review 2019, Kerala State Planning Board
Achievements of Electrical Inspectorate in 2018-19
• In 2018-19, 485 electrical accidents occurred, out of which there were 327 fatalities (249 human and 78 animals affected).
• Revenue from the department for the last two years is ₹124.376 crore (excluding duties from KSEBL), which includes testing fees from Meter Testing and Standards Laboratory (MTSL), other Regional Testing laboratories and from other services.
• Successfully launched online software SURAKSHA on 1st October 2018. Now application for scheme approval and energisation are received via online.
• SKOCH award is an all India based award presented to Government institutions for different categories, services and innovative projects. Electrical Inspectorate online software Suraksha has been awarded SKOCH order of Merit award in e-governance category.
• Completed standardisation and rewiring work with Earth Leakage Circuit Breaker for 400 houses at Agali, Sholayur and Pudur, in Palakkad District and remaining work for 460 houses is under progress.
• Retained National Board for Testing and Calibration Laboratories (NABL) for electro technical calibration in Meter Testing and Standards Laboratory, Thiruvananthapuram. Also NABL Accreditation has been obtained for Regional Meter Testing Laboratories at Thrissur, Wayanad, Palakkad, Kozhikode, and Kasaragod District.
• Retained ‘SEVOTHAM CERTIFICATION’ (Service Quality Management System Certification) as per IS.15700: 2005 from the Bureau of Indian Standards
• Procured two fully automatic Energy meter Test bench (10 positions) at regional testing lab in Kozhikode and Ernakulum.
• Procured three fully automatic transformer test set for conducting pre- commissioning test as per Quality Control Order.
• Procured Power System Analysis Software ETAP and Compact LED testing equipment in MTSL
• Tested a total number of 56,504 meters/ equipments in the Meter Testing Laboratories attached to this department.
• Banned substandard ELCB of make ‘Winsor’ and ‘Supernova’.
• Conducted Electrical Safety awareness classes throughout the State.
• Short film on Electrical Safety “ Velicham” was released on June 14, 2018.
Challenges and Issues.
• Increase in Electrical shocks and accidents (mainly in BPL households) in connected loads from less than 2KW low quality electrical equipments/appliances in the market at cheap prices.
• Inspection of quality parameters of power networks and installations compacting quantity jumps capacity/scale.
The Electrical Inspectorate must take steps to address the above challenges.
Kerala State Electricity Regulatory Commission (KSERC)
KSERC, a statutory organisation of quasi-judicial nature, was established in 2002. The Commission takes efforts to maintain a fair, transparent and objective regulatory system in the power sector of the State.
Important Activities of the KSERC in 2018-19
The Commission held a number of routine internal meetings to transact business relating to administrative matters, framing and finalisation of regulations, admission of petitions, Annual Revenue Requirement and Expected Revenue Charges (ARR and ERC) of the licensees and other matter related to the day to day functioning of the Commission. The number of petitions received and disposed of by the commission in 2018-19 was 49 and 36 respectively.

475Chapter 11, Infrastructure
The Commission has issued following draft regulations for obtaining comments from the public.
• KSERC (Renewable Energy and Net metering) Regulations 2019
• KSERC (Kerala State Electricity Grid Code) Regulations 2019
• KSERC (Power Quality for Distribution system) Regulations 2018
• Kerala Electricity Supply (Amendment) Code 2019
• KSERC (Consumer Grievance Redressal Forum and Electricity Ombudsman) (Amendment) Regulations 2019
Extension of licence area of M/s KPUPL, Tariff Order for 2019 and approval of power purchase agreements were the important orders during the reporting period.
Compliance audit wing in the Commission is in charge of monitoring the compliance of the Electricity Act, Rules and the Regulations framed thereunder by the licensees and generating companies. The compliance wing conducts spot inspections in the distribution section offices of KSEBL and other licenses in the State and corrective actions to be taken are also taken up with the licensees. The Compliance Examiner is also entrusted with additional responsibilities related to consumer advocacy, consumer protection and awareness initiatives of the commission and monitoring of the Ombudsman and CGRFs.
Consumer Grievance Redressal Forum (CGRF) has been established under the Electricity Act 2003, for the redressal of the grievances of the consumers by all distribution licensees in the State. Electricity Ombudsman is a statutory authority appointed by the KSERC to settle the grievances of consumers aggrieved by non-redressal of his grievances by the Consumer Grievance Redressal Forum.
GoI as per the provisions of the Electricity Act 2003 had Forum of Regulators (FOR) comprising
of chairpersons of Central Electricity Regulatory Commission and State Electricity Regulatory Commissions. FOR has established a Technical Committee headed by the Chairperson of the KSERC for implementation of framework on renewables and formulating protocols and agreement for aggregators of renewable energy generation.
The KSERC is also a member of Forum of Indian Regulators (FOIR), which is an association of the Chairpersons and Members of the Electricity Regulatory Commissions. Other regulatory bodies like Petroleum and Natural Gas Regulatory Board (PMGRB), Competition Commission of India (CCI), Airports Economic Regulatory Authority (AERA), Tariff Authority of major Ports and Administrative Staff College of India and the Energy Resource Institute are also members. The Forum provides a venue for exchange of views and information among Indian Regulators in various fields. The 19th Annual General Body meeting of FOIR was held on June 22, 2018 at New Delhi and 45th Governing Body meeting was held on June 20, 2018 at New Delhi.
Southern Electricity Regulatory Forum (SERF) is a forum constituted for interaction among the Regulatory Commissions of the Southern States of Andhra Pradesh, Karnataka, Tamil Nadu, Telangana and Kerala. The objective of the forum is to discuss the common issues, problems and proposals of the five States. 18th meeting of SERF was held on December 6 to 8, 2018 at Trichirappalli, Tamil Nadu.
Way Forward
For the healthy growth of the power sector and to formulate agreed policies and programmes, there should be close and constant interaction and better coordination among different organisations of power industry. Better synergy between the sister concerns like KSEBL, ANERT, EMC and Electrical Inspectorate through comprehensive Plan like Oorjja Kerala Mission will develop the energy sector in the State to truly global standard by 2021. ANERT has to re-

476 Economic Review 2019, Kerala State Planning Board
orient with more stress on awareness creation in renewable energy sections and developing an eco-system suitable for the sustained use of renewable energy devices. For improving the conditions of Kerala power sector, it is proposed to complete all hydel plants that have already been started. Priority has to be given to construct mini-micro hydel plants to the extent possible.
The Government’s top most priority is to increase power generation to ensure availability of power to match the increasing demand. At the same time, quality of power is also of equal importance. The non-conventional sources of energy should be utilised to the maximum extent possible in meeting our energy requirements. Electricity generation from wind, solar photovoltaic, small and medium hydro projects should be tapped to its full potential. To ensure adequate economic and social growth in any country, it is indispensable that all available energy sources be used in the most effective and economical manner, particularly for the generation of electricity.
Regarding energy efficiency, policies/protocols/rules and regulations on energy efficiency/ management and version updation, financing energy efficiency projects highlighting benchmarks, persistence and compliance through energy audits linking outcomes, evolving right balance between standard/skilled manpower, regulators initiatives and appliance’s market approaches may be considered.

477Chapter 11, Infrastructure
11.3 Communication
Postal Network of Kerala
Indian postal system is the largest in the world with a network of 1, 55,531 Post Offices, of which 1,39,882 (89.94 per cent) are in rural areas and 15,649 (10.26 per cent) are in urban areas of the country. On an average, 8770 people are served by a post office in the country. In rural areas, a post office serves 6455 people and in urban areas, a post office serves 29,458 people. Average area served by a post office is 21.14 sq. km. The postal network consists of four categories of Post Offices namely, Head Post Offices, Sub Post Offices, Extra departmental Sub Post Offices and Extra departmental Branch Post Offices.
Kerala Postal Circle came into existence on September 1, 1974. Kerala Postal circle includes the entire State of Kerala, the Union Territory of Lakshadweep and Mahe under the Union Territory of Puducherry. Kerala is the only postal circle where every village has at least one post office. As of August 31, 2019, there are 5,063 Post Offices in the circle, of which 1,509 are Departmental Post Offices and 3,554 Extra Departmental Post Offices. On average each post office in the State serves an area of 7.70 sq. km and a population of 6,611 as against the national average of 21.14 sq. km and a population of 7,175 people. In total, 83 per cent of the Post Offices are located in rural areas. Major Activities of Kerala Postal Circle is given in Box 11.3.1.
Box 11.3.1 Major activities of Kerala postal circle
1. All the 1,509 departmental Post Offices in the circle are computerised with (e Money Order) eMO services.
2. India Post Payment bank (IPPB)-This facility offers a wide range of products such as savings account, current account, remittances, money transfer, direct benefit transfers, bills and utility payments and enterprise and merchant payments. It is proposed to extend the service to all Post Offices in Kerala Circle by December 31, 2018.
3. Introduction of International Speed Post or EMS, a facility available from India to 99 countries.4. iMO, variant of eMO, allowing remittance upto₹50,000 within India.5. Pack Post Service, an effective way to send items up to 30 kg anywhere in the world.6. Logistic Post provides transhipment of parcels of any capacity within the State and to select
locations in other States.7. Post Office Passport Seva Kendra’s (POPSK) have been established to facilitate the process of
getting passport to the customers.

478 Economic Review 2019, Kerala State Planning Board
8. Kerala Postal Circle has entered into an agreement with M/s Energy Efficiency Services Limited for sale of LED bulbs, Tube lights and Energy Efficient fans distributed under Unnat Jyoti by Affordable LEDs for All (UJALA).
9. Two new parcel products of India “Express Parcel” and “Business Parcel” introduced10. 10. Introduction of Air Logistics Post provides customers for getting end to end services on the
logistics value for faster transmission / delivery of their consignments11. Corporate My Stamp, a personalised service wherein corporate firms and institutions can get
completely customised sheets of stamps.12. New stamps and special covers were released.13. Introduction of “My Stamp”. Any individual can get their personalised stamps on it.14. Communication Implementation of Public Fund Monitoring System (PFMS) or NeFMS platform
for effective wage disbursal under MGNREGS. Under PFMS, from January 1, 2017 to August 31, 2018, ₹26 crore has been disbursed.
15. Undertook the following collaborations:- • Tie up with GoK for Corporate e-post• Commissioner for Entrance Examinations, Kerala • Director, LBS Centre for Science and Technology– e-services• Kerala Water Authority for the collection of water bills under e-payment• Adharva Associates for recharging of prepaid mobile connections• Regional Transport Office for booking and delivery of driving license and registration
Certificates• Kerala State Council for Open and Lifelong Education • APJ Abdul Kalam Technological University• Controller of Technical Examinations, Kerala• Asianet Satellite Communications Ltd• Booking of railway reservation ticket under Passenger Reservation System (PRS facility)
Source: Chief Post Master General, Kerala Circle, Thiruvananthapuram
All Post Offices in Kerala have improved their functioning as a citizen hub. Every citizen now has access to this hub close to his/her doorstep. Details are shown in Appendix 11.3.1, 11.3.2, 11.3.3 and 11.3.4.
Telecommunications
Telecommunication is one of the prime support services needed for rapid growth and modernisation of the economy. The telecommunication service in India has improved significantly since independence.
India is currently the world’s second largest telecommunications market with a subscriber base of 1,189.28 million (of which mobile telephone connections are 1,168.32 million and landline telephone connections are 20.96
million). The overall teledensity in the country is 90.23 per cent. While the rural teledensity is currently 57.01per cent, the urban teledensity stands at 160.87per cent at the end of July, 2019.
Internet and broadband penetration in the country is increasing steadily, boosting the Government’s Digital India campaign. The number of Internet subscribers (both broadband and narrowband put together) now stands at 665.31 million by the end of June 2019. The number of subscribers accessing internet via wireless phones, was 643.64 million and there were 21.67 million wired internet subscribers at the end of June, 2019, while the number of Broadband subscribers was 594.59 million.
Department of Telecommunications Single Emergency Number is given in the Box 11.3.2.

479Chapter 11, Infrastructure
Kerala Telecom circles serve the whole of Kerala State, the Union Territory of Lakshadweep and part of Union Territory of Puducherry (Mahe). The circle has 11 major Secondary Switching Areas (SSAs) and one minor SSA of Lakshadweep. The status of telecom sector in Kerala is given in Box 11.3.3. More details are given in Appendix 11.3.5.
Communication Infrastructure
Government has taken some major projects capable of creating new employment and increasing the IT exports from the State. Our focus was on expansion of the IT space in the IT parks, building roads and ramp; surface connectivity – especially to the IT hubs, power availability, promoting private projects in IT infrastructure, building social Infrastructure in IT Hubs to ensure safety and air connectivity with major cities in India and abroad for better business connects. Free WiFi in public places and IOT enabling.
Digital public services will provide services which are easier, quicker and more convenient for people to use, and at a lower cost than other methods. This will bring about public sector efficiencies and savings. The Government’s vision is to bridge the digital divide by 2020, create a digitally empowered society, and achieve sustainable economic growth.
Core infrastructure for e-governance in the State consists of Kerala State Wide Area Network (KSWAN), Secretariat Wide Area Network, State Data Centre, State Service Delivery Gateway and public WiFi project. KSWAN is the backbone of the State Information Infrastructure (SII), connecting Thiruvananthapuram, Kochi and Kozhikode and extending to 14 Districts and 152 block Panchayats of the State. The network will also connect 3,500 offices of Government departments through wireless and a large number through leased lines and Local Area Network. KSWAN is seamlessly integrated with two State Data Centres which enable the network to provide large number of Government to
Box 11.3.2 Single Emergency Number ‘112’
Department of Telecommunications (DoT) has instructed Telecommunication Service Priorities (TSPs) to map Single Emergency Number ‘112’ with existing Emergency Number ‘100’ in all States /UTs in August 2016. At present Single Emergency Number 112 is operational and mapped on existing emergency number ‘100’ in all States/UTs except Delhi. 112’ is designed to be used to replace the multiplicity of Emergency Numbers operations in India such as 100, 101, 102 and 108. The project is to be made operational by all States/UTs under the supervision of Ministry of Home Affairs through PSAP (Public Safety Answering Point). When an emergency call is received at the PSAP, it would be answered by a specially trained officer/call taker/operator of respective state/UT that will transfer the call on the type of emergency, dispatchers to police, fire medical and other response mechanisms.
Source: Department of Telecommunications(DoT), GoI
Box 11.3.3 Status of telecom sector in Kerala as on June 30, 2019
• No. of Telephone Exchanges: 1407• Equipped Capacity: 2708568• Working Connections: 12651432 {10909530 (Mobile) + 1741902 (Landline)}• Average No. of Telephone per sq. km : 320• Telephone Density: 378 per 1000 population
Source: Office of the Chief General Manager, BSNL, Kerala Circle

480 Economic Review 2019, Kerala State Planning Board
Government, Government to citizens’ services hosted in State Data Centres to the Government institutions through a secure intranet.
Kerala Fiber Optic Network (KFON)
The GoK has embarked on an ambitious journey to build a statewide optical fiber network – Kerala Fiber Optic Network (KFON), with a vision to “transform Kerala into an intelligent, innovative and inclusive society” paving way for digital life for all the residents of Kerala.
KFON network will function as a strong foundation for Digital Kerala architecture consisting of platforms for G2G, G2C, B2C interactions, enabling deployment of advanced applications for content delivery, smart cities, smart traffic management, video surveillance, financial inclusion, smart metering solutions, digital commerce, which is expected to provide wide array of opportunities for product and service incubators, a boost to the startup ecosystem in Kerala.
The GoK aims to build a dedicated Optic Fiber Network (Kerala State Fiber Network) connecting the State Head Quarters, Districts, the Block and Gram Panchayats in the state. A highly scalable network infrastructure has been envisioned for KFON which shall be accessible on a non-discriminatory basis, to provide on-demand, affordable broadband connectivity of 2 Mbps up to 100 Mbps for all households. The OFC shall be drawn with the association of the KSEB through the existing poles.
The proposed KFON network will be a forerunner to the digital transformation of Kerala by
• Planning and implementing the mega infrastructure project to establish fiber optic connectivity across the state connecting all urban and rural areas to address the digital divide. BPL families will be provided free limited internet bandwidth up to 2 Mbps.
• Creating an optical fiber backbone network connecting all Districts, Blocks, Panchayats and urban local bodies.
• Establishing connectivity to all Government Institutions including Educational institutions, Police stations, Health centers in the rural and urban areas of the state.
• Offering connectivity to households (Fiber to Home), other business entities, located in the urban and rural areas of the state.
• KFON will be made available to Telecom, Internet Service Providers, Local Cable Operators in a nondiscriminatory manner to offer various services such as high-speed Internet, IPTV, Voice, video conferencing.
• Redundant and scalable OFC network to ensure high uptime, reliability and bandwidth on demand.
• All the Government Offices, Educational institutions, Akshaya Centers, Friends Centres shall get connected under this network through integration with the State Wide Area Network (KSWAN).

481Chapter 11, Infrastructure
11.4 Drinking Water
Drinking Water
Providing safe, adequate and reliable water supply is a challenge in many parts of the world as well as in India. India has 16 per cent of the world population, but only 4 per cent of freshwater resources. Climate change, depleting groundwater level, over exploitation and deteriorating water quality are some of the major challenges to provide drinking water to all. The Government of India (GoI) has created the Ministry of Jal Shakti to consolidate interrelated functions pertaining to water management. It has strived to overcome the water challenge by launching the Jal Shakti Abhiyan-a campaign for water conservation and water security in 1592 water stressed blocks in 256 Districts, to ensure five important water conservation interventions.
The National Institution for Transforming India (NITI) Aayog has developed the Composite Water Management Index (CWMI) to enable effective water management in Indian States. As per the CWMI 2019 States are displaying progress in water management, but the overall performance remains well-below of what is required to adequately tackle India’s water challenges. 80 per cent of the States assessed on the Index over the last three years have improved their water management scores, with an average improvement of +5.2 points. But worryingly, 16 out of the 27 States still score less than 50 points on the Index (out of 100), and fall in the low-performing category. These States collectively
account for 48 per cent of the population, 40per cent of agricultural produce, and 35 per cent of economic output of India.
According to the Composite Water Management Index Report, Gujarat is in the top position in the index among non-Himalayan States followed by Andhra Pradesh, Madhya Pradesh, Goa, Karnataka, and Tamil Nadu. Kerala is in the twelfth position. Among the North east and Himalayan States, Himachal Pradesh is in the top position in the management index followed by Uttarakhand, Tripura and Assam. Among the North east and Himalayan States, Arunachal Pradesh has been ranked lowest in the index. The Composite Water Management Index is an important tool to assess and improve the performance of States/Union Territories in efficient management of water resources. CWMI findings conclude that Kerala has restored 95 per cent of the irrigation potential of identified water bodies and utilises 80 per cent of its irrigation potential. The State has mapped less than 30 per cent major groundwater recharge areas and only 5 per cent of such mapped areas are covered with recharge. More than two-third of rural population and one-third of urban population remain uncovered under drinking water supply.
In India about 48.6 per cent of the households in the rural areas and about 57.5 per cent of the households in the urban areas had exclusive access to principal source of drinking water. About 87.6 per cent of the households in the rural

482 Economic Review 2019, Kerala State Planning Board
areas and about 90.9 per cent of the households in the urban areas had sufficient drinking water throughout the year from the principal source. About 58.2 per cent of the households in the rural areas and about 80.7 per cent of the households in the urban areas had drinking water facilities within the household premises. About 42.9 per cent of the households in the rural areas used hand pump as the principal source of drinking water and about 40.9 per cent of the households in the urban areas used piped water into dwellings the principal source of drinking water. About 94.5 per cent of the households in the rural areas and about 97.4 per cent of the households in the urban areas used ‘improved source of drinking water’(Source: NSSO 76th round).
In Kerala, Kerala Water Authority (KWA) and Kerala Rural Water and Sanitation Agency (KRWSA) are the major implementing agencies in drinking water sector. Local Governments also play an important role in this.
Kerala Water Authority (KWA)
KWA was established to provide for the development and regulation of water supply and waste water collection and disposal in Kerala. Its main functions include preparation, execution, promotion, operation, maintenance and financing of the schemes of water supply and disposal of waste water. Currently the KWA undertakes projects under various heads. During the financial year 2018-19, 35 projects were completed and thereby increasing the coverage and benefitting about 15 lakh more people with safe drinking water.
In 2018-19 KWA enhanced production capacity by more than 150 million litres per day (MLD). Revenue collection from water charges was ₹633.97 crore for the year 2018-19 and ₹251.60 crore has been collected upto August 31, 2019. KWA introduced an online system named QUICK PAY to collect water bills as part of promoting digital transactions and developed an online portal for applying new water connection for public. The impact of floods of 2018 in water
sector was minimised by timely interventions. The production capacity had dropped by more than 50 per cent due to shut down of about 483 schemes. This was restored by 90 per cent in 4-5 days. About 318 lakh litres of water was supplied through tankers also as part of relief operations. Installation of solar plants as an alternate source of power has been initiated and 285 KW solar plant has been set up in partnership with ANERT.
Habitation Coverage
As per Integrated Management Information System (IMIS) data being maintained by GoI, as on April 1, 2018, out of 21,520 rural habitations (there is some discrepancy in the figures), 5,966 habitations were fully covered, 15,227 habitations were partially covered and 327 were quality affected habitations. In the financial year 2018-19, 178 habitations were also fully covered with piped water supply by commissioning the schemes. There are no arsenic affected habitations in Kerala, presently the total numbers of fluoride affected habitations to be covered have been reduced to 32 as on April 1, 2019.
Sewerage
The coverage of sewerage in the State is negligible. Thiruvananthapuram city has about 39 per cent coverage with about 53,000 connections. Ernakulam has a small system with 1,200 connections. Wastewater collection and disposal are of equal importance to that of protected water supply in maintaining public health and much attention is needed in this sector. The need for more focused attention in sewerage sector is essential. The availability of funds, public protest against sewage plants / pump houses, delay in getting land, sanctions for road cutting are some of the issues that are affecting the taking up of new sewerage projects.
Water Supply Coverage
There are 1,058 water supply schemes of KWA in operation as on August 31, 2019, with a total utilised capacity of 2838.45 MLD. The average per

483Chapter 11, Infrastructure
capita availability of piped water is 84.76 litres per day. However the litres per capita per day (lpcd) vary in different habitations in all Districts. But after accounting for the high percentage of Non-revenue water, industrial and non domestic demand, the per capita availability is much less. During the financial year 2018-19, about 35 schemes were commissioned thereby increasing coverage. Many new projects were sanctioned under KIIFB, AMRUT, State Plan and NABARD to cover the uncovered areas. As on August 31, 2019, from the existing KWA schemes, 56.38 per cent population of Kerala has been covered with piped water supply 52.10 per cent in rural sector and 70.33 per cent in urban. In the financial year 2018-19, 1,60,364 new house service connections have been given. In this financial year 96,650 new connections were also given upto August 31, 2019.
District-wise population covered by water supply schemes as on August 31, 2019 shows that Ernakulam District with coverage of 84.14 per cent population shows highest coverage among 14 districts of Kerala, followed by Alappuzha District (77.47 per cent). In Kasaragod District (28.16 per cent), the coverage is the least. Total coverage of population is 56.38 per cent. Details are given in Appendix 11.4.1. District-wise and category-wise analysis shows that Thrissur has highest number of water supply schemes (114) and Kozhikode has the highest number of Urban water supply schemes (17). District-wise and category-wise details of water supply schemes in operation shows that Wayanad (27) is the least covered District as on August 31, 2019 (Appendix 11.4.2).
KWA distributes water through House Service Connections (HSC) and street taps. The total number of domestic, non-domestic, and industrial connections are 23,59,359, 1,75,170 and 2190 respectively. Out of the total 2,03,627 street tap connections, 1,53,272 are in Panchayats, 19,244 in Corporations, and 31,111 in Municipalities (Appendix 11.4.3) as on August 31,2019. The data shows that there is an increasing trend in the house service
connections and diminishing trend in street taps when compared with the previous year. During 2018-19 and 2019-20 (upto August 31st) income from water charges of domestic, non-domestic and industrial schemes, was ₹45,108 lakh and ₹19,881 lakh respectively. And that from street taps was ₹18,289 lakh and ₹5,279 lakh (Appendix 11.4.4). Number of rural water supply schemes of KWA transferred to Local Bodies as on August 31, 2019 is 481. District-wise details of water supply schemes transferred to Local Governments are given in Appendix 11.4.5. As per District-wise water availability data as on August 31, 2019, Ernakulam District has the highest availability (188.18 lpcd)) and Kasaragod has the lowest availability (18.19 lpcd) (Appendix 11.4.6). The works being undertaken other than State Plan schemes are KIIFB, AMRUT, UIDSSMT and JNNURM. In addition KWA also executes water supply projects of various departments as deposit works.
KIIFB — Government of Kerala (GoK) had accorded in-principle sanction for 72 drinking water projects of KWA and KIIFB had so far accorded sanction and approval for funding for 69 projects for an amount of ₹4,351.55 crore. Under KIIFB funding projects are being implemented in packages and are in various stages of execution. Some works has already been completed. There are 11 projects proposals under ‘Replacement of old Transmission mains in 11 circles out of which 10 projects have been approved by KIIFB for an amount of ₹382.64 crore and the project ‘Replacements in Kochi’ circle is under appraisal by KIIFB Appraisal Division. The works are under various stages of execution.
AMRUT (Atal Mission for Rejuvenation and Urban Transformation)-Kerala Water Authority is the implementing agency to execute water supply and sewerage works under Atal Mission for Rejuvenation and Urban Transformation (AMRUT), which is funded jointly by Central, State and ULBs. Ministry of Urban Development
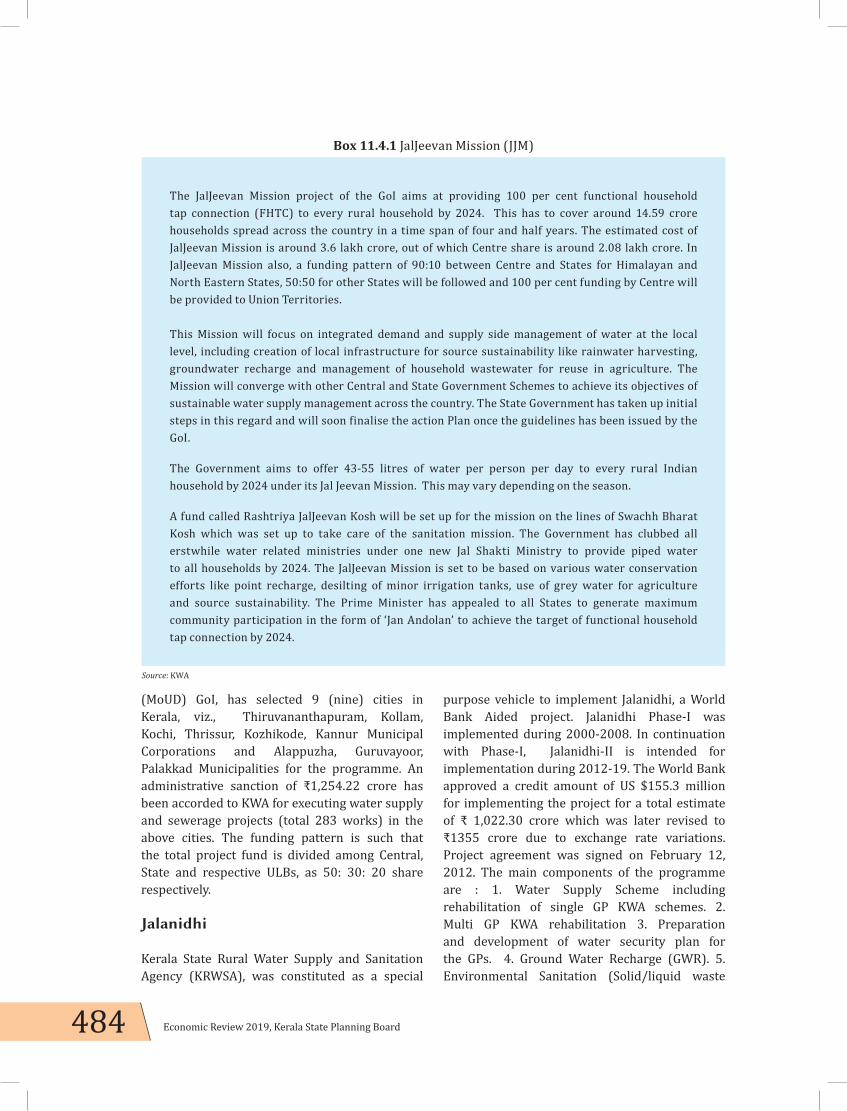
484 Economic Review 2019, Kerala State Planning Board
(MoUD) GoI, has selected 9 (nine) cities in Kerala, viz., Thiruvananthapuram, Kollam, Kochi, Thrissur, Kozhikode, Kannur Municipal Corporations and Alappuzha, Guruvayoor, Palakkad Municipalities for the programme. An administrative sanction of ₹1,254.22 crore has been accorded to KWA for executing water supply and sewerage projects (total 283 works) in the above cities. The funding pattern is such that the total project fund is divided among Central, State and respective ULBs, as 50: 30: 20 share respectively.
Jalanidhi
Kerala State Rural Water Supply and Sanitation Agency (KRWSA), was constituted as a special
purpose vehicle to implement Jalanidhi, a World Bank Aided project. Jalanidhi Phase-I was implemented during 2000-2008. In continuation with Phase-I, Jalanidhi-II is intended for implementation during 2012-19. The World Bank approved a credit amount of US $155.3 million for implementing the project for a total estimate of ₹ 1,022.30 crore which was later revised to ₹1355 crore due to exchange rate variations. Project agreement was signed on February 12, 2012. The main components of the programme are : 1. Water Supply Scheme including rehabilitation of single GP KWA schemes. 2. Multi GP KWA rehabilitation 3. Preparation and development of water security plan for the GPs. 4. Ground Water Recharge (GWR). 5. Environmental Sanitation (Solid/liquid waste
Box 11.4.1 JalJeevan Mission (JJM)
The JalJeevan Mission project of the GoI aims at providing 100 per cent functional household tap connection (FHTC) to every rural household by 2024. This has to cover around 14.59 crore households spread across the country in a time span of four and half years. The estimated cost of JalJeevan Mission is around 3.6 lakh crore, out of which Centre share is around 2.08 lakh crore. In JalJeevan Mission also, a funding pattern of 90:10 between Centre and States for Himalayan and North Eastern States, 50:50 for other States will be followed and 100 per cent funding by Centre will be provided to Union Territories.
This Mission will focus on integrated demand and supply side management of water at the local level, including creation of local infrastructure for source sustainability like rainwater harvesting, groundwater recharge and management of household wastewater for reuse in agriculture. The Mission will converge with other Central and State Government Schemes to achieve its objectives of sustainable water supply management across the country. The State Government has taken up initial steps in this regard and will soon finalise the action Plan once the guidelines has been issued by the GoI.
The Government aims to offer 43-55 litres of water per person per day to every rural Indian household by 2024 under its Jal Jeevan Mission. This may vary depending on the season.
A fund called Rashtriya JalJeevan Kosh will be set up for the mission on the lines of Swachh Bharat Kosh which was set up to take care of the sanitation mission. The Government has clubbed all erstwhile water related ministries under one new Jal Shakti Ministry to provide piped water to all households by 2024. The JalJeevan Mission is set to be based on various water conservation efforts like point recharge, desilting of minor irrigation tanks, use of grey water for agriculture and source sustainability. The Prime Minister has appealed to all States to generate maximum community participation in the form of ‘Jan Andolan’ to achieve the target of functional household tap connection by 2024.
Source: KWA

485Chapter 11, Infrastructure
management) 6. Tribal development programme.74 per cent of Jalanidhi scheme sources are open well, 12 per cent bore wells, 8 per cent Rain Water Harvesting (RWH) and the remaining are Spring /River sources. 365 schemes in Jalanidhi Phase-II was affected by the flood (2018) in Kerala. Out of this, 356 schemes have been put back to service after restoration so far. Jalanidhi PhaseII project period closed on June 28, 2019.
Jalanidhi – II Achievements up to August 31, 2019
1. 115 GPs have signed agreement with KRWSA so far, for implementing the project.
2. 3,672 Beneficiary Groups (BGs) consisting of 2,64,015 households are active for project implementation.
3. 2,167 water supply schemes out of 2176 schemes have been commissioned. 2,59,952 households (11,56,780 beneficiaries) are now getting water from the commissioned schemes.
4. 288 schemes are functioning on 24*7 mode benefitting 28,997 families which includes 7,213 SC/ST families.
5. 411 GP rehabilitation schemes out of 412 and all (56) KWA rehabilitation schemes taken up have been commissioned so far and handed over to communities for operation and maintenance.
6. 9,652 sanitation structure have been constructed so far in addition to the 36,376 individual latrines constructed under ODF programme in the project GP’s.
7. 1,899 GWR structures have been constructed so far ensuring source sustainability.
8. 8,546 training programmes participating 6,12,325 stakeholders at different levels were organised so far covering various aspects of project implementation and management.
9. E-office system “Sujalam” has been implemented in all KRWSA offices.
10. Over Ground Assets created under Jalanidhi are now mapped in GIS platform.
11. KRWSA has a Toll free call system and a web based system for complaint redressal mechanisam.
12. A mobile application for service delivery monitoring has been launched.
District-wise achievements of sanitation activities of Phase 1 and 2 shows that Malappuram District has 26,385 meters drainage coverage which is the highest among 14 Districts (Appendix 11.4.7). Total number of Ground Water Recharge (GWR) structures as on August 31, 2019 is 2,912. Most numbers of GWR structures are
Table11.4.1 Achievements of Jalanidhi – II
Sl.No Items Unit Overall Target
Taken up by theProject as on 31.08.19 Achievements/Completed
1 No. of Project GP Nos 200 115 1132 No. of Beneficiaries Groups Nos 2760 3672 35783 Households covered Lakh 2.87 2.64 2.604 Population covered WSS Lakh 13.76 11.74 11.57
5 Population covered Sanitation Lakh 3.7 3.90 3.90
6 Total number of schemes – WSS Nos 2175 2176 2167
7 No.of TDP –GPs to be covered (Tribal) Nos 22 19 19
8 No.of person days trained Lakh 6.02 6.27 6.279 Sanitation Schemes Nos - 46,028 46,02810 GWR Schemes Nos - 1,902 1,899

486 Economic Review 2019, Kerala State Planning Board
in Kottayam (988). Similarly, total number of Rain Water Harvesting (RWH) tanks installed by KRWSA in the State is 31,316 as on August 31, 2019. The highest number is Idukki (9828) and the lowest is in Wayanad (151) (Appendix 11.4.8). As per KRWSA data, as on August 31, 2019, out of 5,877 schemes, 4,539 small water supply schemes and 41 large/bulk water supply schemes are functional (Appendix 11.4.9). It is observed that nearly 35 per cent of the scheme has become partially or fully defunct since 2008. The Plan provides for ‘sustainability support to community managed water supply schemes’ for post implementation support.
Rain Centre
Rain Centre functioning as part of KRWSA was constituted in the year 2004 to promote Rain Water Harvesting and Ground Water Recharge activities in the State. Initially the Centre was focusing on promoting the concept of Rain Water Harvesting and as part of it a number of IEC activities along with training programmes were conducted throughout the State. Demo RWH tanks of various capacities were constructed in public institutions with the idea of disseminating the ferro cement technology to the general public.
Scaling up of roof top Rain Water Harvesting programme with the component of Ground Water Recharge is found suitable for the individual households as alternative method for providing drinking water and gradually improving the water table. The programme is well accepted by the people in State, especially those who are living in hilly, coastal and remote areas will limited access to potable water. During the last six years, the Centre was assisting individual households and schools to construct RWH structures with the primary objective of mitigating the drinking water issues. The secondary objective of popularising the concept of Rain Water Harvesting is also promoted among the general public and the student community. Many of the Grama Panchayats, especially the Grama Panchayats belonging to hilly and coastal
regions are seriously implementing Rain Water Harvesting as a technology option to solve the drinking water issues of their GPs.
The assistance of the programme is now extended to schools belonging to both Government and aided sector. The programme named as ‘Jala Sowhrudha Vidhayalayam’ is implemented State wide by financially assisting the selected Government/Aided schools to construct RWH structures. The selection of schools under the programme is entrusted to the Education Department. The programme is implemented on a cost sharing basis. The cost sharing pattern that is followed for the construction of RWH units in individual households is, 5 per cent of the total unit cost for BPL category and 10 per cent of the total unit cost for APL category. The estimated unit cost for the construction of 10000 litre capacity ferro cement RWH system is ₹65,600. The unit cost is likely to vary from location to location and based on the rate fluctuations of materials in the market.

487Chapter 11, Infrastructure
11.5 Housing
Housing is a basic requirement of human well-being and providing adequate housing is a social responsibility. Every household has the right to a safe, secured and decent shelter. The United Nations Committee on Economic, Social and Cultural Rights has underlined that it should be seen as a right to live somewhere in security, peace and dignity. The Constitution of India also upholds the right to shelter and right to livelihood. It becomes an indicator of social status, identity and provides the basic ground for satisfaction, employment and earning. Every government has the challenge of providing houses for all. In Kerala, the 13th Five Year Plan aims to provide comfortable, safe and dignified housing to all people living in the State. As per the latest Census, the average size, quality and investment per house are far higher in Kerala than in rest of India but a significant proportion among underprivileged and poor sections of society in Kerala still does not have a reasonable shelter. At the same time, it is seen that housing investment and building construction has turned out to be a major economic activity in the State. As a result, the average growth of housing units which was 16 per cent as against a population growth of 9.42 per cent during 1991-2001 increased to around 17 per cent 2001-2010 even when population growth declined to 4.86 per cent.
According to the NSSO 76th round report in India the housing characteristics both in rural
and urban areas are improving compared to the previous (69th) report. Among the households living in houses, about 96.7 per cent of the households in the rural areas and about 91.5 per cent of the households in the urban areas used the house for residential purpose only. Earlier this was 91.5 and 86.8 respectively. Now about 96.0 per cent of the households in the rural areas and about 63.8 per cent of the households in the urban areas had own dwelling unit. About 89.0 per cent of the households in the rural areas and about 56.4 per cent of the households in the urban areas had independent house. Among the households living in houses, about 76.7 per cent of the households in the rural areas and about 96.0 per cent of the households in the urban areas had the house of pucca structure. This was 65.8 per cent and 93.6 per cent respectively in the previous report. Among the households living in houses, average floor area of the dwelling unit was about 46.6 sq. mtr. in the rural areas and about 46.1 sq. mtr. in the urban areas. About 93.9 per cent of the households in the rural areas and about 99.1 per cent of the households in the urban areas had electricity for domestic use.
The Government of Kerala (GoK) started the Mission LIFE (Livelihood, Inclusion and Financial Empowerment) in 2016 with the aim of eradicating houselessness which envisages a comprehensive rehabilitation programme for the landless-homeless in the State covering programmes for their sustenance, social and

488 Economic Review 2019, Kerala State Planning Board
financial security and skill up gradation targeting a better livelihood. The details about the Mission are covered in a subsequent section in this chapter.
Agencies in the Housing Sector
The State Government implements housing schemes through different departments. More than 20 agencies are implementing housing schemes in the State as per the data received from the Housing Commissioner. The important agencies include Local Self Government Department (LSGD), Kudumbasree, Kerala State Housing Board (KSHB), Kerala State Nirmithi Kendra (KESNIK), Kerala State Development Corporation for SC/ST, SC/ST Development Departments. Non-Governmental agencies such as COSTFORD and Habitat Technology group, Co-operative societies and Corporations like Kerala State Co-operative Housing Federation Ltd are also involved in the activity of constructing houses. Several NGOs are also contributing significantly. Other departments like Labour, Fisheries, Sainik Welfare, Urban Affairs and Minority Welfare also implement various affordable housing schemes for the poor labourers (including migrants) and economically weaker sections. These agencies/departments have provided assistance to construct around 2,57,572 houses during the period 2015-16 to 2019-20 (up to September 2019). Achievements under major housing schemes by different housing agencies in Kerala are given in Appendix 11.5.1.
Kerala State Housing Board
Kerala State Housing Board (KSHB), the implementing agency in the housing sector under government has been providing residential facilities to prospective beneficiaries through its public housing schemes apart from cash loan assistance for house construction.
Innovative Housing Scheme for urban poor (Flats)
This is a rental housing scheme intended to provide housing facilities in urban areas to
the low waged workers who are increasingly displaced from the city limits and forced to stay away from their work place. The flats are allotted on cheaper rental basis; one third of the flats are reserved for women workers. Innovative Housing Scheme at Poojappura Phase III and Phase IV have been completed, inaugurated and allotted to the beneficiaries during the year 2018-19. 184 flats have been constructed under this scheme so far.
Grihasree Housing Scheme
Grihasree Housing Scheme is being implemented by the Board from the year 2013-14 onwards with budgetary support by providing Government subsidy of ₹2 lakh/house for the construction of house with participation of NGO/voluntary agencies/Philanthropic individuals in 2 cent / 3 cents of land owned by EWS/LIG beneficiaries. 407 houses in 2018-19 and 27 houses upto August 31, 2019 were built under this scheme. A total of 3056 houses have been constructed under this scheme so far.
Housing Technical Cell
The Housing Commissionerate was formed in the year 1980 with the objective of planning and co-ordination of the housing sector. This office is engaged in policy formulation and technical assistance to various agencies in the housing sector and also actively involved in data collection and interpretation, and facilitating decision making in the housing sector.
In 2018-19, Housing Commissionerate celebrated the World Habitat Day in association with the Kerala State Housing Board, Kerala State Nirmithi Kendra and major engineering colleges in Thiruvananthapuram. It also conducted one day seminar regarding-Rebuild Kerala, New Initiatives-at various District headquarters such as Thiruvananthapuram, Thrissur, Kasaragod, Palakkad, Kollam and Kannur in association with District Nirmithi Kendras under the scheme ‘Promotion of Innovative Building Technologies and Housing Literacy Programme’. The first meeting of experts was conducted for developing Kerala Building Code.

489Chapter 11, Infrastructure
Kerala State NirmithiKendra
Kerala State Nirmithi Kendra (KESNIK) established in 1989 is an agency set up for showcasing and disseminating the idea of cost effective, energy efficient and environment friendly construction techniques in housing sector. In 2018-19, Nirmithi Kendra organised 17 training programmes, out of which 15 were Artisan trainings and two Digital Survey trainings. 238 beneficiaries were trained in Masonry, Home Art, Carpentry, Gardening, out of which 189 were women. Four training programmes were organised at various engineering colleges to create awareness in sustainable construction practices benefiting several students. Two training programmes were organised for the staff of Nirmithi Kendra and a total of 40 persons were covered under the same. Steel and cement were issued to EWS categories throughout the State at 15per cent subsidised rate through Kalavara scheme. During the period, the production centre at Palakkad was upgraded with the purchase of new block making machines. In addition to the above, KESNIK had undertaken various deposit works for other Government organisations such as Excise, Sub Registrar Offices, Lottery Department, NHM, and Tourism Department with a turnover of ₹60.00 Crore.
Other Agencies of Housing Sector
Local Self Government Department
Prime Minister Awas Yojana (Urban) is the major housing scheme implemented by the department through Kudumbashree. It is a centrally sponsored scheme jointly implemented by State Government and Urban Local Bodies, to address the housing requirement of urban poor including slum dwellers with mandate of providing housing for all by 2022 through its programme verticals like (1) Slum rehabilitation of slum dwellers with participation of private developers using land as resource (2) Promotion of Affordable Housing for weaker section through credit linked subsidy (3) Affordable Housing in partnership with public and private sectors (4) Subsidy for beneficiary-led individual house construction.
The scheme aims to provide houses for all houseless Economically Weaker Sections (EWS) families by 2022. Identification of beneficiaries is through demand survey and field verification. The mission will support to construct the houses of maximum plinth area of 40 square meters. The amount given per unit is ₹4 lakh (of which the central government share is ₹1.5 lakh), which is disbursed in four instalments. In the year 2018-19 and upto September 2019,13,250 and 9,458 houses were constructed respectively under the scheme PMAY (Pradhan Mantri Awas Yojana) Urban–Life. (Further details are given in Chapter 12.)
Commissionerate of Rural Development
The Rural Development Department is primarily concerned with addressing the needs of the rural people in matters of sustainable economic activity, shelter and hygiene concerns, rural infrastructure and connectivity. The major housing scheme implemented by the department is the Pradhan Mantri Awas Yojana-Gramin (PMAY-G).The identification and selection of the beneficiaries of Pradhan Mantri Awas Yojana-Gramin (PMAY-G) is done through the GramSabha from SECC 2011 list, based on the housing deficiency and other social deprivation parameters. As per the guidelines, an amount of ₹1.2 lakh is the total assistance for one beneficiary. The cost of unit (house) assistance is to be shared between central and State in the ratio 60:40. The minimum unit (house) size enhanced from the existing 20 m2 (square metre) to 25 m2 (square metre) including a dedicated area for hygienic cooking. PMAY-G aims to provide a pucca house with basic amenities to all homeless households living in kutcha and dilapidated house in rural area by 2022. In the year 2018-19 and upto September 30, 2019 7356 and 787 houses were constructed respectively under the scheme PMAY (G). (Further details are given in Chapter 12.)

490 Economic Review 2019, Kerala State Planning Board
Labour Department
Bhavanam Foundation Kerala (BFK) is a public sector agency, under the Labour and Skills Department. The purpose of the company is to provide, promote, develop and establish residential accommodation, education, healthcare, other associated infrastructure and services to labourers, workers and low-waged employees in Kerala. BFK implements various housing schemes for the labourers and workers in Kerala.
At present, BFK has the following three projects – Apna Ghar, Janani and Bhavanam.Janani Housing Scheme aims to provide quality housing at affordable cost for unorganised Poor Urban Labour and low waged workers in Kerala. BFK is presently implementing the Janani project– Ponjassery Scheme in Eranakulum and Janani Project-Adimali Scheme in Idukki. 217 apartments have been constructed in Janani-Adimali Scheme and 74 in Janani–Ponjassery Scheme so far. 64 rooms with 280 sq.ft.each for the interstate migrant workers have been completed under ApnaGhar Project Palakkad Scheme.
Department of Fisheries
In 2018-19, 27 houses have been constructed in the housing Scheme under Basic Infrastructure Facilities and Human Development of Fisher folk at ₹4 lakh/unit and 192 houses under the Scheme Safe Dwelling to Landless Fisherman.
Scheduled Caste Development Department
Houses to Houseless Scheme, Development programme for vulnerable communities, Bhavana Nirmana Dhana Sahaya Padhathi are some of the major housing schemes of this Department. Under the scheme, Bhavana Nirmana Dhana sahaya Padhathi ₹4 lakh is sanctioned to the scheduled caste families. The beneficiaries should have their own land and their annual income must be below ₹50, 000. The houses proposed
for the scheme is 323 square feet as minimum and 750 square feet as maximum area. 9,929 houses have been constructed under this scheme in 2018-19 and 1756 houses in 2019 upto September 2019.
Directorate of Sainik Welfare
The Department of Sainik Welfare under GoK is formed to look after the welfare of all personnel of Armed Forces from the State both serving and retired. House Building Grant is granted to disabled and boarded out ex-servicemen before completion of terms of engagement, recruits with disability pension, war widows and widows of soldiers died in harness. In absence of above category of applicants, ex-servicemen below 60 years who had not owned a house either in his/her name or spouse name for the last five years, counting from the date of application, will be considered. The present rate of grant is ₹2 lakh and the beneficiary annual income should be less than ₹3 lakh which however is not applicable to the dependents of jawans killed or disabled or missing in action. In 2018-19, one house has been constructed under the scheme House Building Grant.
Kerala State Development Corporation for Christian Converts from Scheduled Castes and the Recommended Communities Limited, Kottayam
Kerala State Development Corporation for Christian Converts from Scheduled Castes and the Recommended Communities Limited, Kottayam was formed with the main objective to promote the social, educational, cultural and economic upliftment of the Converted Christians from Scheduled Castes and the Recommended Communities in a comprehensive manner for ameliorating their living conditions. House construction scheme, Landless houseless scheme, House revamping scheme are the housing schemes of the Corporation. 168 houses have been constructed in 2018-19 and 51 houses in 2019 (up to September 30) under the House

491Chapter 11, Infrastructure
construction scheme. Under this scheme ₹3, 00,000 is sanctioned as loan to construct a new house. The loan is repayable in 144 instalments with 6 per cent interest. 70 houses have been constructed in 2018-19 and in 2019 (upto September 2019) under the House revamping scheme. Under this scheme an amount of ₹1,00,000 is given for revamping the existing house. The amount has to be repaid in 120 monthly instalments. The rate of interest is 6per cent. The fund is disbursed in a single instalment. The beneficiaries should have the age limit of 18-55 and have income limit below ₹81,000 (in rural area) and ₹1, 03,000 (in urban area).
Kerala State Co-operative Housing Federation (HOUSEFED)
This agency provides financing facilities to the affiliated primary co-operative housing societies (PCHS) for the construction of houses and repair/extension. In 2018-19, an amount of ₹9590.08 lakh and in 2019-20 (up to September 30, 2019) an amount of ₹4118.21 lakh have been disbursed among EWS, LIG, MIG and others for constructing houses. HOUSEFED sanctioned 2294 home loans in 2018-19 and 759 home loans in 2019-20 (upto September 30, 2019). The details of home loans sanctioned and the amount disbursed by Kerala State Co-operative Housing Federation and Kerala State Co-operative Agricultural and Rural Development Bank Ltd (KSCARDB) are given in Appendix 11.5.2.
Financial Institutions
The major sources of housing finance in Kerala is own money, loans from banks or other financial institutions and government grants. A large number of financial institutions have been providing assistance for house construction along with the government agencies in the State. The financial institutions in this respect are Nationalised Banks, Kerala Gramin Bank, Private Sector Commercial Banks, Kerala State Co-operative Bank, Kerala State Co-operative Agricultural and Rural Development Bank Ltd (KSCARDB), Small Finance Banks Like ESAF, Ujjivan, HOUSEFED, HUDCO, HDFC, LIC Housing Finance Ltd, GIC Housing Finance, Canfin Homes. The Interest rates of housing loans are also changing according to the announcements by the GoI and the Reserve Bank of India. The interest rates on housing loans of various financial institutions as on July 31, 2018 are given in Appendix 11.5.3.
Livelihood, Inclusion and Financial Empowerment (LIFE) Mission
The GoK has initiated the LIFE Mission as a flagship programme for addressing the issues of homelessness in the State. It is envisioned as a time-bound programme through a multi-pronged approach of addressing the ground level real issues and aims at improving the quality of life in the State by not only providing homes and
Table 11.5.1 Advances outstanding in housing sector as on March 2019Direct Housing Loan Indirect Housing Loan
No. of A/Cs Amount(₹in Lakh) No. of A/Cs Amount( ₹in
Lakh)
Public sector commercial Banks 305828 1912718 4 2
RRB-Kerala Garmin Bank 56827 280941 0 0
Private sector commercial Banks 70175 538750 160 1822
Small finance banks 14222 4378 0 0
Co-operative Banks 163600 340675 140818 523213
Total 610652 3077463 140982 525037Source: Housing Commissionerate

492 Economic Review 2019, Kerala State Planning Board
allied facilities like anganawadis, palliative care, old age care, health care etc. but also raising the standard of living through skill development, job oriented training, employment opportunities and livelihood interventions.
The activities of the LIFE Mission is structured in three phases. In the first phase, the Mission addressed the issue of incomplete houses, the construction of which was started under various housing schemes since 2000 but could not be completed due to various reasons. Initially 54,850 houses were identified as incomplete but later the number was reduced to 54,256 on the basis of field inspection. Out of the 54,256 incomplete houses 51,851 houses (95.57 per cent) have been successfully completed as on October 31, 2019.
The second phase of the Mission provides financial assistance for constructing houses for those who have own land. LIFE Mission has conducted a survey and identified around 1.84 lakh houseless beneficiaries who have land of their own. After verification of all their documents, 97,336 beneficiaries were found eligible and 89,686 beneficiaries signed agreement with the LGs and they are provided with a financial assistance of ₹4 lakh based on the progress of construction of their houses (in 4 stages). ST beneficiaries who are living in remote ST hamlets would be provided ₹6 lakh (in 5 stages). As on October 31, 2019, 48,955 (54.58%) beneficiaries completed the construction of houses and the remaining are in progress.
The third phase of the Mission is the rehabilitation of landless homeless beneficiaries of the State. As per the survey conducted by LIFE Mission around 3.28 lakh beneficiaries have been identified as landless homeless. A thorough verification of these beneficiaries were conducted through a software for which 2,29,310 beneficiaries appeared and 1,07,393 beneficiaries were found eligible as on October 31, 2019. The Mission is planning to rehabilitate these beneficiaries into housing complexes. Besides, assistance will be given to
those beneficiaries who are able to purchase land and construct house on their own. All the housing complexes under third phase would be constructed using Prefab technology to save time and labour. As a pilot, a housing complex constructed by Bhavanam Foundation at Adimali Grma Panchayat in Idukki District was taken up by LIFE Mission for a cost of ₹24.82 crore. This is a seven storey building and has 217 independent apartments of which 163 are already occupied. Each apartment is of 460 sq.ft size and has common facilities like lift, washing area, compost plant, health sub-centre, Kudumbasree counselling centre, youth club, gender club, crèche, etc. The beneficiaries will also be provided with various livelihood training programmes.
The Mission is planning to complete a total of 84 such housing complexes across the State under its third phase by the end of October 2020. Administrative Sanction was accorded for the construction of these 84 apartment complexes. Out of this, 14 apartment complexes will be constructed as pilot in the 14 Districts. Mission is currently working on the tender documents for these complexes. Another 14 apartment complexes too would be constructed soon across the State under Care Home project of Cooperative Department. Soil test is currently being carried out in these identified locations. Apart from this, another 56 additional apartment complex would be constructed by LIFE Mission in 2020-21 for which initial steps have been already taken.
The Mission has also identified yet another 200 locations in the State for the construction of apartment complexes. By completing the construction of apartment complexes in all these locations, the Government aims to complete third phase of LIFE Mission.
When houses are constructed under LIFE Mission, 90 persondays under Mahatma Gandhi National Rural Employment Guarantee Scheme (MGNREGS) in rural areas and Ayyankali Urban Employment Creation Scheme (AUECS) in urban areas is spared for construction of houses for

493Chapter 11, Infrastructure
LIFE Mission and Kudumbashree started women construction units for the beneficiaries of LIFE Mission.In the backdrop of the recurring floods and landslides, the Mission is poised to fast track the housing for homeless through the sustainable and environment friendly construction.
High cost of construction materials is one of the most important issues faced by the LIFE beneficiaries. LIFE Mission discussed this with various vendors and made arrangements for the distribution of materials at a rate as low as 20-60 per cent of their MRP. Electrical fittings, wiring material, paint, ceramic material, tap fittings, water tanks, cement are distributed to LIFE beneficiaries at this low rate. This venture has benefitted LIFE beneficiaries by helping them to save ₹50,000 to ₹1,00,000.

494 Economic Review 2019, Kerala State Planning Board
11.6 Rebuild Kerala Initiative
Kerala is one of the most densely populated among Indian States and highly vulnerable to natural disasters, the changing climatic dynamics, and global warming. Kerala is categorised as a Multi-hazard Zone State. The Kerala State Disaster Management Plan identifies 39 natural and anthropogenic hazards in the State. Floods, landslides, seasonal drought-like conditions, lightning, forest fires, soil piping, coastal erosion, and high wind speed are major among them in the State. Floods are the most common in the State with flood prone area spreading nearly to 14.5 per cent of the State’s geographical area and the proportion is as high as 50 per cent for certain Districts. Landslides are a major hazard along Western Ghats in Wayanad, Kozhikode, Malappuram, Kottayam and Idukki.
The State experienced two consecutive floods and landslides in 2018 and 2019. The heavy downpour in Kerala in August, 2018 that caused massive floods and destruction have been categorised as the heaviest in the last nine decades. A natural calamity of comparable magnitude occurred in 1924 (in Malayalam era 1099, earning it the name ‘The Flood of 99’). The Flood of 99 was a part of folklore for the present generation until it witnessed the Flood of 2018. Kerala also experienced floods and landslides in 2019.
The Floods of 2018
The State received 2,346.6 mm of rainfall from June 1, 2018 to August 19, 2018 as against an
expected 1,649.5 mm of rainfall recoding an abnormally high rain fall of about 42.0 per cent above normal rainfall. During June, July and August (1-19), 2018 the State received above normal rainfall of 15 per cent, 18 per cent and 164 per cent respectively. But, the heavy rainfall starting from August 8, 2018 with 3 days long extremely heavy rainfall from August 15 to 17, 2018 caused massive flood in the State. Alappuzha, Ernakulam, Idukki, Kottayam, Pathanamthitta, Thrissur and Wayanad Districts were worst affected. Thirty five dams across the State were opened to release flood runoff. Heavy rains in Wayanad and Idukki caused severe landslides. The worst affected Districts were Wayanad (Kabini sub-basin), Idukki (Periyar sub-basin), Aluva and Chalakudy (Periyar and Chalakudi sub-basins), Chengannur and Pathanamthitta (Pamba sub-basin). Nearly 341 landslides were reported from 10 Districts. Idukki District was devastated by 143 landslides.
The massive flood in 2018 affected 80 per cent (1,259) villages and 54 lakh people directly in the State. The flood displaced 14 lakh people, and 433 people lost their lives. Out of the total people who lost their lives, 268 (62 per cent) were men, 98 (23 per cent) women and 67 (15 per cent) children. More than 15 lakh people were sheltered in 12,251 relief camps in State and thousands of people took shelter with relatives and friends. More than 1,700 schools in the State were used as relief camps. Over 1.75 lakh buildings were damaged either fully or partially.

495Chapter 11, Infrastructure
A total of 1,613 schools were affected by the floods. More than 332 health facilities were fully or partially destroyed. Nearly 74.5 lakh workers, 22.8 lakh migrants, 34,800 persons working in micro, small and medium enterprises, and 35,000 plantation workers were affected by the flood (PDNA 2018). A total of 6.9 lakh houses were cleaned.
The State responded swiftly with rescue and relief operations with the help of the entire government machinery and active involvement of people especially the fisher men community, the real heroes of the food 2018; nearly 669 boats that went out with 4,537 fishermen who saved more than 65,000 lives. The State Government mobilised the National and State forces; Kerala Fire and Rescue Services with 4,100 individuals and entire rescue equipment , National Disaster Response Force (NDRF) with 58 teams and 207 boats, Army with 23 columns, 104 boats, Navy with 94 rescue teams, one medical team, nine helicopters, two fixed wing aircrafts and 94 boats, Coast Guard with 36 teams, 49 boats, two helicopters, two fixed wing and 27 hired boats, Air Force with 22 helicopters from Air Force and 23 fixed wing aircrafts, Central Reserve Police Force with 10 teams, and Border Security Force with two companies and one water vehicle team engaged in rescue and relief operations in the State.
The floods and landslides in 2018 caused extensive damage and losses to houses,
roads of all type, railways, bridges, power supplies, irrigation, drinking water supplies, communications networks, and other infrastructure facilities in the State. It severely affected agriculture, fisheries and livestock. It adversely affected the lives and livelihoods of lakhs of people in the State. As per report of the Post Disaster Needs Assessment (PDNA) 2018, total estimated damage and lose(except losses and damages incurred by transportation, power, irrigation other infrastructure and losses by private traders and business units) was aggregated to ₹42,425.0 crore. The recovery needs of the various sectors of the State Economy was estimated at ₹31,000 crore by the Post Disaster Needs Assessment (PDNA) of the UNDP. Details of estimation of damage consequent to floods, 2018 are given Table 11.6.1.
The estimated recovery needs among different sectors were highest in infrastructure sector with 51 per cent of total recovery needs, followed by the social sectors (20 per cent), productive sectors (15 per cent) and cross-cutting sectors (14 per cent). It is depicted in Figure 11.6.1.
The Floods of 2019
In 2019, the State witnessed floods and landslides again in August. Normally, June and July are the ‘rainy months’ in Kerala. But the State received 32 per cent deficient rainfall till July 31, 2019. The State received rainfall of 951.4 mm as against 426.7 mm recording an excess of 123
Table 11.6.1 Estimation of damage consequent to floods, 2018, in ₹ crore
Sl. No. Sector Damage Losses Damage + Losses
Total Recovery Needs
1 Productive 2,975.0 4,180.0 7,155.0 4,498.02 Social 5,743.0 1,448.0 7,191.0 6,337.03 Infrastructure 890.0* 471.0* 1,361.0* 15,659.04 Cross cutting 10,561.0 16,159.0 26,718.0 42,21.05 Integrated water Resource Manage-
ment 24.0
Total 20,169.0 22,258.0 42,425.0 30,739.0 Total (Rounded off) 31,000.0
*except losses and damages incurred by transportation, power, irrigation other infrastructure and losses incurred by private traders and business unitsSource: PDNA Report 2018

496 Economic Review 2019, Kerala State Planning Board
per cent in August 2019, due to the influence of low-pressure area and depression formed over the Bay of Bengal and strengthening of Monsoon winds. Details District-wise actual and the long period average rainfall (normal rainfall) in August 2019 are given in Figure11.6.2.
The highest rainfall recorded in August 2019 was in Kozhikode District with 1,407.8 mm and 176 per cent excess followed by Kasaragod with 1,194.5 mm, Wayanad with 1,190.8 mm, Kannur
with 1,107.2 mm, Malappuram with1,084.2 mm, Thrissur with 1,062.0 mm Palakkad with 1,030.6 mm and Ernakulam with 957.7 mm. But the most affected Districts in North and Central Kerala were Kozhikode (176 per cent excess rain fall), Wayanad (110 per cent), Malappuram (176 per cent), Palakkad (217 per cent), Thrissur (127 per cent) Ernakulam (140 per cent)in August 2019. Details of District wise departure of rainfall August 2019 (Aug 1 - 31) is given in Figure 11.6.3.
Figure 11.6.1 Share of disaster recovery needs acrosss ectors, in per cent
Source: Post Disaster Needs Assessment Report 2018
Figure 11.6.2 District wise actual and the long period average rainfall (normal rainfall) in August 2019, rainfall in mm
Source: Memorandum, State Disaster Management Authority

497Chapter 11, Infrastructure
The very high rainfall from August 6 to 14, 2019 led to devastating flood and landslide in the State. During this period, the State received 602.2 mm rainfall which is 394 per cent excess than the normal rainfall (122.0 mm) expected. As per the Memorandum of State Disaster Management Authority, all Districts received more than 300 per cent excess rainfall for the peak period.In comparison with August 2018, number of extreme rainfall events was lesser in August 2019; however, number of rainy days was higher in August 2019 and 10 out of 14 Districts were recorded monthly cumulative rainfall higher than in August 2018. In 2019, northern Districts were affected the most in comparison to the previous years’ floods which affected mostly the southern/central Districts.
Again, the State Government responded swiftly with rescue and relief operations. Emergency operations centre was opened on August 8, 2019 with deployment from Central and State forces including NDRF, Army, Air force, Coast Guard, ETF, MRC, Kerala Police, Fire and Rescue services. Announcements to the public were made promptly. Evacuations were done quickly and carefully. Dam operations were monitored continuously. Information on dam water release
was disseminated to the public in frequent intervals. A web portal was restarted to ensure better supply chain management of goods and services to the flood affected areas. The swift response of the State Government and prompt rescue and relief operations minimised the causalities. However, lives of 125 people were lost, 42 persons injured and 6.1 lakh people sheltered in 3,151 relief camps.
The devastating flood and landslides in 2019 affected 1,030 villages in the State. It damaged 1,967 houses fully, 19,297 houses severely and 2.16 lakh houses partially (flood hit and cleaned), damaged 3,900.17 km of roads, 95 bridges, 91 school buildings, 61 primary health centres and 283 anganwadis in the State. Moreover, it severely affected agriculture, irrigation, water supply, power, fisheries and livestock, and adversely affected the lives and livelihoods of lakhs of people in the State. As per the quick assessment (Memorandum, State Disaster Management Authority) 2019, the total damage and loss and cost incurred for relief measures was estimated to ₹2,101.88 crore. Details are given in Table 11.6.2.
Figure 11.6.3 District-wise departure of average rainfall in August 1-31, 2019, in per cent
Source: Memorandum, State Disaster Management Authority

498 Economic Review 2019, Kerala State Planning Board
Post flood recovery-At a glance
The immediate task before the State was recovery and rehabilitation by ensuring restoration of lost and damaged assets and livelihoods enabling people to return to their normal lives in the shortest possible time. Since the recovery of public infrastructure, land and natural systems would require considerable fund and time. GoK decided to launch an immediate recovery programme. Despite all the financial challenges of a State reeling under this unprecedented disaster, the Government made key changes in its Annual Plan in order to divert precious resources into the task of recovery. All the major departments of the Government swung into action to deliver reconstruction and recovery projects in their sectors.
In the immediate aftermath of the disaster in 2018, keeping in mind the fact that the difficulties
of families to mobilise resources even for basic necessities, Government decided to provide financial support to all those were affected. An amount of ₹687.84 crore has been released to about 6.87 lakh families as immediate financial support at the rate of ₹10,000 per family. A total of 7,24,352 kits containing 22 essential commodities were given to those who returned home from relief camps and 10,50,838 kits containing food items worth ₹500 were supplied subsequently. An amount of ₹51.54 crore was spent on this relief measure.
The next phase is the repair and reconstruction of houses that were damaged or lost in the deluge. An extensive survey of damaged houses was conducted, involving revenue officials and Local Self Government personnel. The houses that suffered damage were categorised into five categories based on the degree of damage caused. A total of 17,623 houses were either completely
Table 11.6.2 Estimation of damage/relief consequent to floods, 2019, in ₹ lakh
Sl. No Sector/relief Estimate Amount(₹ in lakh)
1
Gratuitous relief• Ex-Gratia payment to families of deceased persons@ ₹ 4 lakh per person,• Grievous injury requiring hospitalisation@ ₹4,300 per person,• Cost of clothing and utensils for families whose houses were washed away/fully
damaged,• Relief for families whose livelihood were seriously affected
37,421.8
2Relief measures-• Temporary accommodation - cost of Running Relief Camps (₹ 200 per person
for 20 days)• Cost Emergency supply of drinking water in rural areas and urban areas
24,514.4
3Search and Rescue operations-
Cost of search and rescue measures/evacuation of people affected/likely to be affected
270.3
4 Cost of debris clearance from public land 1,272.05 Agriculture-loss 6,635.86 Housing – damages 74,858.37 Fisheries-damages to boats and nets 609.68 Animal husbandry – loss 4,470.79 Power-Electricity (cost for restoration) 10,227.210 Public works-damages to roads and bridges 20,349.411 Irrigation and water-damages 12,725.712 Damage to community owned assets 16,832.7
Total 2,10,188.1Source: Memorandum, State Disaster Management Authority

499Chapter 11, Infrastructure
lost or damaged beyond repair in the floods of August, 2018. Government has decided to provide ₹ 4 lakh relief to all who have lost their houses, and are opting for own construction. Of this, about ₹3.0 lakh are from the contributions that have poured into the Chief Ministers Distress Relief Fund (CMDRF), and the balance is out of the State Disaster Relief Fund (SDRF). Similarly, for the other categories as well, the relief to be paid to affected families have been considerably enhanced by the State Government, relying on the contributions to the CMDRF. Out of the 17,623 fully damaged houses, 9,409 houses were reconstructed till December 5, 2019. Moreover, the Government had fixed the compensation to be given to each category and released assistance, details of which are given in the Table 11.6.3.
About 2.37 lakh hectares of agricultural land suffered crop loss in the floods. A total of 3,05,964 applications were received for compensation for crops damage. Out of this, 2,38,376 persons were given compensation amounting to ₹78.43 crore utilising SDRF funds as on December 2019. The Government also distributed ₹165 crore to 3,54,810 persons from the budgetary resources of the State. An amount of ₹51.0 crore was given as compensation to 1,52,350 farmers under the State Crop Insurance Scheme. An amount of ₹197.78 crore was allotted for dewatering, bund / blocks renovation and repair to water pumping service up to December, 2019.
The Public Works Department has accorded administrative sanction for works worth ₹2,764 crore by rearranging its budgetary resources
up to November, 2019. PWD and Local Self Government Departments jointly rebuilt 7,602 km of roads. A total of 4,429 km of flood ravaged roads were rebuilt by PWD and made open to transportation. Moreover, 656 culverts and 127 bridges were reconstructed. An amount of ₹3,135 crore has already been spent on the renovation and rebuilding of roads through various funds. Apart from this, the Department of Urban Affairs spend ₹30 crore for the rebuilding of 1,274 km of roads.
An interest free loan has been provided through Kudumbashree under the Resurgent Kerala Loan Scheme for the revival of livelihood. A total of 1,65,769 beneficiaries from 24,753 ayalkkootams were benefited from the scheme, totalling to ₹1395.16 crore. As part of post flood activity, Kudumbashree initiated an innovative programme to augment the skill of flood affected people to suit the job market available in the flood hit areas. ARISE (Acquiring Resilience and Identity through Sustainable Employment) aim to provide skill training to 50,000 candidates in 10 selected areas. It includes housekeeping, plumbing, electronic repair, electrical works, day care, sales, data entry and laundry and ironing. A total of 47,105 people were registered for this project; out of which 9,116 people were trained as on May, 2019. Moreover, 246 full-fledged construction units are formed under Kudumbashree. More than 300 domestic appliances were distributed through 15 companies.
Water supply infrastructure was badly affected because of flooding of electric installations, silting
Table 11.6.3 Details of assistance given to reconstruct damaged houses in floodsas on December 5, 2019, in ₹ crore
Sl No Category of damaged houses Numberof houses
Total amount disbursed(in ₹ Crore)
1 Less than 15 per cent 1,59,283 158.6372 16 per cent to 29 per cent 1,11,354 664.5243 30 per cent to 59 per cent 47,214 585.3504 60 per cent to 74 per cent 17,781 438.775
Total 1,847.286Source: RKI, GoK
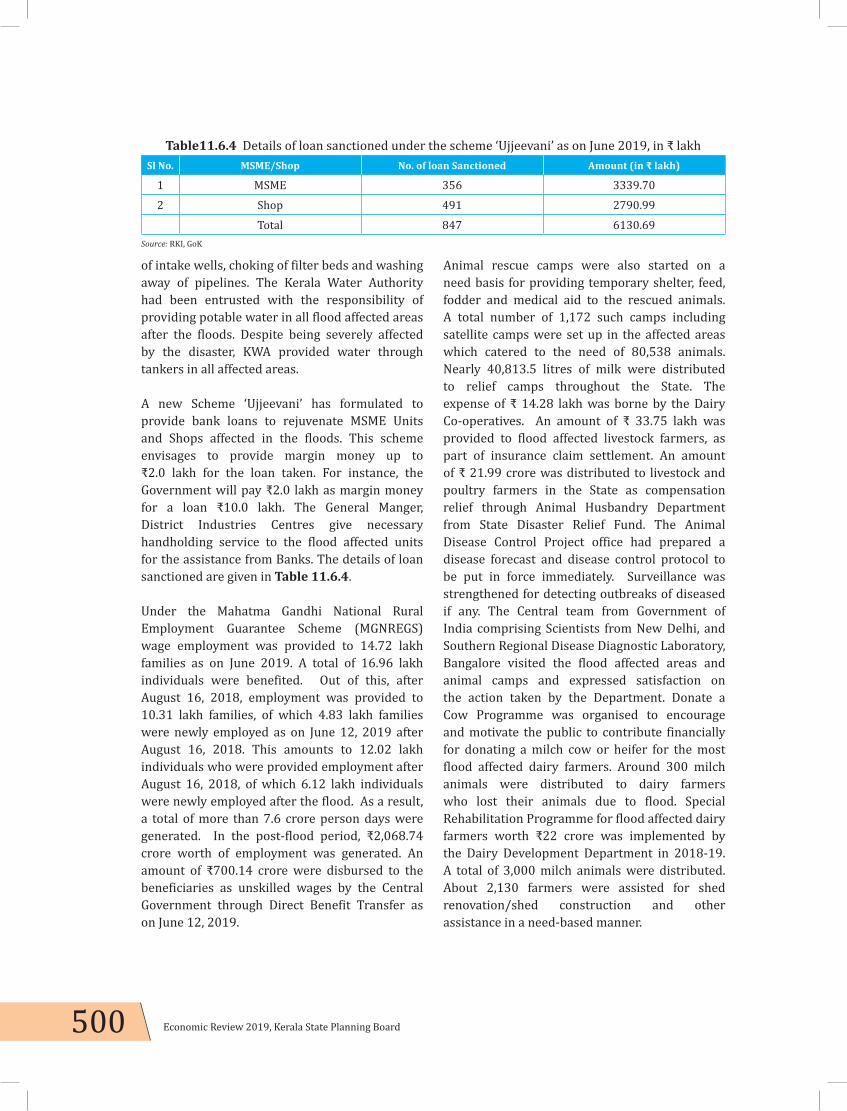
500 Economic Review 2019, Kerala State Planning Board
of intake wells, choking of filter beds and washing away of pipelines. The Kerala Water Authority had been entrusted with the responsibility of providing potable water in all flood affected areas after the floods. Despite being severely affected by the disaster, KWA provided water through tankers in all affected areas. A new Scheme ‘Ujjeevani’ has formulated to provide bank loans to rejuvenate MSME Units and Shops affected in the floods. This scheme envisages to provide margin money up to ₹2.0 lakh for the loan taken. For instance, the Government will pay ₹2.0 lakh as margin money for a loan ₹10.0 lakh. The General Manger, District Industries Centres give necessary handholding service to the flood affected units for the assistance from Banks. The details of loan sanctioned are given in Table 11.6.4.
Under the Mahatma Gandhi National Rural Employment Guarantee Scheme (MGNREGS) wage employment was provided to 14.72 lakh families as on June 2019. A total of 16.96 lakh individuals were benefited. Out of this, after August 16, 2018, employment was provided to 10.31 lakh families, of which 4.83 lakh families were newly employed as on June 12, 2019 after August 16, 2018. This amounts to 12.02 lakh individuals who were provided employment after August 16, 2018, of which 6.12 lakh individuals were newly employed after the flood. As a result, a total of more than 7.6 crore person days were generated. In the post-flood period, ₹2,068.74 crore worth of employment was generated. An amount of ₹700.14 crore were disbursed to the beneficiaries as unskilled wages by the Central Government through Direct Benefit Transfer as on June 12, 2019.
Animal rescue camps were also started on a need basis for providing temporary shelter, feed, fodder and medical aid to the rescued animals. A total number of 1,172 such camps including satellite camps were set up in the affected areas which catered to the need of 80,538 animals. Nearly 40,813.5 litres of milk were distributed to relief camps throughout the State. The expense of ₹ 14.28 lakh was borne by the Dairy Co-operatives. An amount of ₹ 33.75 lakh was provided to flood affected livestock farmers, as part of insurance claim settlement. An amount of ₹ 21.99 crore was distributed to livestock and poultry farmers in the State as compensation relief through Animal Husbandry Department from State Disaster Relief Fund. The Animal Disease Control Project office had prepared a disease forecast and disease control protocol to be put in force immediately. Surveillance was strengthened for detecting outbreaks of diseased if any. The Central team from Government of India comprising Scientists from New Delhi, and Southern Regional Disease Diagnostic Laboratory, Bangalore visited the flood affected areas and animal camps and expressed satisfaction on the action taken by the Department. Donate a Cow Programme was organised to encourage and motivate the public to contribute financially for donating a milch cow or heifer for the most flood affected dairy farmers. Around 300 milch animals were distributed to dairy farmers who lost their animals due to flood. Special Rehabilitation Programme for flood affected dairy farmers worth ₹22 crore was implemented by the Dairy Development Department in 2018-19. A total of 3,000 milch animals were distributed. About 2,130 farmers were assisted for shed renovation/shed construction and other assistance in a need-based manner.
Table11.6.4 Details of loan sanctioned under the scheme ‘Ujjeevani’ as on June 2019, in ₹ lakhSl No. MSME/Shop No. of loan Sanctioned Amount (in ₹ lakh)
1 MSME 356 3339.702 Shop 491 2790.99
Total 847 6130.69Source: RKI, GoK

501Chapter 11, Infrastructure
In August 2018, Government sanctioned free ration of 5 kg rice to all card holders in the flood affected areas. From September to December, 2018 the non priority card holders in the flood affected areas were sanctioned 5 kg of rice per month at the expense of transportation and handling charges (₹1 per kg). Free ration (15 kg of rice) was sanctioned to all the plantation workers of the State. In addition, the selected families among the flood affected (ration priority card holders, NREGA job card holders, SC/ST, women centred families, widows, differently abled and destitute) were distributed subsistence kit worth ₹500 during the months from October to December, by the Kerala State Civil Supplies Corporation. A total of 10,89,175 kits worth ₹54,45,87,500 were distributed till January 2019. An additional allotment of 12,000 kl of non-subsidised kerosene from GoI, was distributed in the State with priority to the flood affected areas at the rate at which it was allotted by GoI, with the State Government bearing the transportation and handling charges.
An amount of ₹37.57 crore was distributed to flood affected SC/ST families as relief by rearranging Annual Plan allocation of the SC/ST department in 2018-19. The department also incurred the cost of distribution of food and non-food items, cleaning the flood affected SC/ST institutions and colonies. Moreover, the department distributed gas stove worth ₹2.12 crore to 8,487 SC/ST families through sponsorship.
The Co-operation Department was quick to assess the damages caused by the deluge and formulate a strategy that culminated in the conceiving of project CARe-Kerala (Co-operative Alliance to Rebuild Kerala). The project encompasses three independent schemes viz; ‘CARe-Home’, CARe-Loan and CARe-Grace of which the ‘CARe Home’ is the most important one. Under this scheme houses are constructed for the flood affected people whose homes were lost/severely damaged with the co-operation and support of various co-operative institutions functioning in the State. The ‘CARe-Home’ project is carried out by undertaking the
construction through Co-operative Societies in the respective areas at a cost of ₹5 lakh per house utilising the funds sourced through various Co-operative Societies (₹ 44.98 crore) and the State Disaster Response Fund (SDRF-₹ 58 lakh). The implementation of the project is entrusted with the Registrar of Co-operative Societies under the guidance of State Level Implementation Committee.
The Incident command centre and control rooms were set up in Directorate of Health services and all District headquarters by the State Government. The control room contact numbers were shared with community also. Guidelines for prevention and control of communicable diseases and also for systematic functioning of relief camps were formulated and circulated. A Health inspector/Multipurpose health worker was entrusted to supervise the health and sanitation part of all relief camps. Local ASHA, AWW and Kudumbasree volunteers and members of WHSNCs instructed to involve in full scale in relief camps. Medical officers of local PHCs were instructed to provide and supervise necessary medical aid to flood victims. Daily Medical camps were organised in these camps apart from ensuring routine functioning of PHC/Hospitals in the affected areas. Advisories to Health workers, public and NGOs regarding the preventive health aspects were formulated and circulated in both English and Malayalam languages. Focus was given to prevent food borne infection, water borne diseases, leptospirosis, snake bites, and any unusual symptoms to be reported immediately to respective PHCs. When the flood water started receding, steps were initiated, for safe return of the victims of this disaster. Counselling services were arranged for those traumatised in the disaster; steps are taken to ensure continuation of case management of NCD cases. Steps were initiated to clean and super chlorinate all drinking water sources and safe disposal of carcasses as per standard guidelines with help from officers of Animal Husbandry department. Anticipating a large scale outbreak of water borne diseases all possible preventive steps was taken.
502 Economic Review 2019, Kerala State Planning Board
Rebuild Kerala
In order to address the development of an inclusive and comprehensive roadmap for a green and resilient Kerala, the State established the Rebuild Kerala Initiative (RKI) to “bring about a perceptible change in the lives and livelihoods of its citizens by adopting higher standards of infrastructure for recovery and reconstruction, and to build ecological and technical safeguards so that the restructured assets could better withstands floods in the future”. The RKI is an institutional arrangement with transparent process of decision making for the comprehensive and resilient Kerala. Government has formed Rebuild Kerala Initiative with detailed framework and separate mechanism to coordinate various activities/administrative measures that aims to rebuild Kerala in a speedy and effective manner. The institutional framework proposed for Rebuild Kerala is governed through Council of Ministers, Advisory Council, High Level Empowered Committee (HLEC), RKI Implementation Committee (RKI-IC), RKI Secretariat and Institutional Support mechanism.
Core principles underlying the Rebuild Kerala Initiative are fast, efficient and inclusive, improving resilience, build-back-better philosophy, innovative and modern technologies,
fair and equitable rehabilitation practices, capacity building, building asset management frameworks, and simplification of processes and procedures. Rebuild Kerala Initiative is guided by GoK’s vision for recovery and move towards Nava Keralam. RKI envisions a green and resilient Kerala where higher and ecologically safe standards of infrastructure, improved conditions of living and new major development projects ensure that people and assets are able to withstand the onslaught of future disasters. The RKI’s mandate is to develop, coordinate, facilitate and monitor the Rebuild Kerala Development Programme (RKDP).
Rebuild Kerala Development Programme (RKDP)
The State Government along with the United Nations agencies has prepared a comprehensive Rebuild Kerala Development Programme (RKDP) envisaging a sector based as well as cross cutting approach in policy formulation, Institutional arrangements, prioritised projects for an effective and efficient rebuilding of the State. Key sectors covered are Integrated Water Resource Management, Water Supply, Sanitation, Urban, Roads and Bridges, Transportation, Forestry, Agriculture, Animal Husbandry and Dairy Development, Fisheries, Livelihoods and Land. Apart from these key sectors, there are
Box 11.6.1 Livelihood schemes in Annual Plan 2019-20
The Kerala State Planning Board organised a two-day Conference in Thiruvananthapuram on November 1-2, 2018 to discuss post-disaster livelihood revival options with regard to wage employment, self-employment and skill development. Considering the diversity of issues related to the livelihood the State Government gave emphasis on livelihood development in Annual Plan 2019-20. It was incorporated in the Annual Plan in different ways such as encouraging projects in dairy, fishery, and sheep rearing; assistance to Co-operatives for entrepreneurship and employment generation schemes; self-employment and wage employment schemes under agriculture, poultry, and animal husbandry; employment fairs; market-driven skill training; artisan training; integrated tribal skill development programmes; assistance to MSMEs; responsible tourism; and assistance for modernisation of traditional sectors. An amount of ₹4,578.64 crore was allocated in the Annual Plan 2019-20 for livelihood development in the State. The sector wise allocation for livelihood schemes in Annual Plan 2019-20 is given in Appendix.11.6.1.
Source: Livelihood Development Package, State Planning Board

503Chapter 11, Infrastructure
four cross-cutting sectors viz., disaster risk management and resilience, environment and climate change, strengthening institutional efficiency and resilience and open data.
Financing Rebuild
The RKDP estimates an overall budget requirement to the tune of ₹36,500 crore for development period from 2019 to 2027. To meet these requirements, it is necessary to raise funds from all possible sources. Accordingly, a ‘Development Partner’s Conclave’ was organised on July 15, 2019 at Thiruvananthapuram to present the Government’s priorities under the RKDP before potential development partners so as to seek their financial support for the same. Potential development partners including World Bank, ADB, JICA, KfW, AFD, NABARD, HUDCO, UNICEF, Bill & Melinda Gates Foundation, Tata
trusts, NDB, AIIB participated in the event besides key officials of the State Government. It is commendable that the World Bank has declared Kerala State as its development partner, in the conclave and provided a Development Policy Loan (DPL) of $250 million (₹1,779.58 crore) as its first tranche for rebuilding of Kerala. In addition, the State set apart ₹1,000 crore in the Annual Plan 2019-20 for RKI.
Implementation of RKDP
The State Government has accorded Administrative Sanctions (AS) to RKDP schemes worth ₹677.92 crore as on December 10, 2019. Out of this, ₹250 crore has allocated for projects submitted by Kudumbashree and ₹266.30 crore for development of LSGD roads. Details are given in Table 11.6.5.
Table 11.6.5 Details as accorded to RKDP Schemes as on December 10, 2019, in ₹ croreSl. No Department Amount (₹in crore)
1 LSGD-Roads 266.302 Forest 130.413 Fisheries 3.204 Kudumbasree 250.005 Biodiversity Board 5.006 Animal Husbandry 23.01
Total 677.92Source: RKI, GoK
Table11.6.6 Details of in-principle approval as on December 6, 2019, in ₹ croreSl. No Department/ Agency Amount (₹ in crore)
1 PWD 654.502 Water Resources 350.003 Clean Kerala Company 53.504 Transport 30.005 Revenue 35.006 LSGD-Roads 488.007 Forest 130.418 Fisheries 3.209 Kudumbasree 250.0010 Biodiversity Board 5.0011 Animal Husbandry 23.01
Total 2022.62Source: RKI, GoK

504 Economic Review 2019, Kerala State Planning Board
In-principle approval has also been accorded for RKDP projects worth ₹2022.62 crore submitted by the following departments/agencies as on December 6, 2019. Details are given in Table 11.6.6.
To bring about a perceptible change in the key sectors, Government aims to set higher standards of infrastructure so that the restructured assets could better withstand floods in the future. A continues monitoring and evaluation is required for ensuring desired change in the lives and livelihoods of citizens as envisaged in RKI.

505Chapter 11, Infrastructure
11.7 Kerala Infrastructure Investment Fund Board (KIIFB)
Kerala Infrastructure Investment Fund Board (KIIFB), a statutory body under the Finance Department, Government of Kerala, came into existence on November 11, 1999 under the Kerala Infrastructure Investment fund Act, 1999. This has been comprehensively revised through the Kerala Infrastructure Investment Fund
(Amendment) Act 2016. The Act has modified the structure of KIIFB to enable it to finance large scale infrastructure investment in the State
As per the amendments to the KIIFB Act in 2016, the structure of the Board is revised as follows:
1. Chief Minister Chairperson2. Minister for Finance Vice-Chairperson3. Chief Secretary Member4. Vice-Chairperson, State Planning Board Member5. Secretary (Law) Member6. Secretary (Finance) Member7. Secretary (Finance Resources) Member
8.Seven independent members who are experts, who have worked in an institution of national repute in one or more of the areas of Finance, Banking, Economics
Members
9. Chief Executive Officer Member Secretary
1. Minister for Finance Chairperson2. Chief Secretary Member3. Secretary (Law) Member4. Secretary (Finance) Member5. Secretary (Finance-Resources) Member
6. Three independent members of the Board, nominated by the Government. Members
7. Chief Executive Officer Member and Fund Manager
The Board also has an Executive Committee consisting of:

506 Economic Review 2019, Kerala State Planning Board
1. Prof. C. P. Chandrasekhar, Professor, Centre for Economic Studies and Planning.
2. Prof. Sushil Khanna, Professor (Economics and Finance), Indian Institute of Manage-ment, Calcutta.
3. Sri. Salim Gangadharan, Former Regional Director, Reserve Bank of India, Thiruvanan-thapuram.
4. Sri. J. N Gupta, Former Executive Director, SEBI and Managing director at Stakeholders Empowerment Services.
5. Sri. Radhakrishnan Nair, Former Executive Director, Securities and Exchange Board of India (SEBI).
6.Dr. Supdipto Mundle, Member 14th finance Commission, Former Director, Strategy and Policy Department, Asian Development Bank (ADB), Emeritus Professor and Member of Board of Governors, National Institute of Public Finance and Policy (NIPFP)
Besides enabling various modes of financial support to projects, the amendment also provides for utilising the new infrastructure fund mobilisation structures approved by Securities Exchange Board of India (SEBI) and Reserve Bank of India (RBI).
There is a Fund Trustee and Advisory Commission to ensure that all investment of the Fund serve the purpose and intent of the Act and there is no diversion of funds. Shri Vinod Rai, former Comptroller and Auditor General of India is the Chairman of this Commission. Ms Usha Thorat, former Deputy Governor, Reserve Bank of India and Shri G Padmanabhan, Former Executive Director, Reserve Bank of India are its Members.
KIIFB intends to raise funds from outside the Budget to finance infrastructure projects especially in the sectors of Irrigation, Roads, Power, Water Supply Inland Navigation, Ports, Solid Waste Management and Drainage.
Under the KIIFB Act, KIIFB is eligible to receive a share of Motor Vehicle Tax (MVT) and petroleum cess collected by the State Government. The main source of revenue is the share of the Motor Vehicle Cess (It was 10 per cent in 2017-18 and will increase up to 50 per cent share by 2022) and a minimum of ₹1 per litre of petrol sold in the State. This comes to almost ₹1,300 crore every year. A separate wing in the State Finance
Department namely Finance (Infrastructure) Department functions as the Administrative Department of KIIFB and the wing functions along with KIIFB. KIIFB functions as the key SPVs for mobilizing and channelling the funds to the various infrastructure SPVs. The minimum total project size is required to be above ₹100 crore and that of a subproject not less than 10 crore by the guidelines for implementing schemes under KIIFB. Both social and physical infrastructure projects are considered for investment.
Several infrastructure projects have been approved by Government to be executed in Public Sector Mode with financial assistance of KIIFB. The projects are to be executed through SPVs. As these organization are under the control of State and Central Governments, they are bound to follow the rules, guidelines and norms applicable for execution of public works following PWD / CPWD guidelines and various directions by the State Government, Central Government, Comptroller and Auditor General, National Green Tribunal, Central Vigilance Commissioner, State Pollution Control Board. As per the Guidelines for KIIFB No: GO (MS) NO. 69/2018/Fin, dated. 24/02/2018, Detailed Project Report (DPR) shall be prepared by the SPV for all projects identified for implementation by availing assistance (partly/fully) from KIIFB. Separate DPR shall be prepared for sub-projects/ project components if sanctioned separately. As on December 31, 2019:
The present independent Members in the Board are:

507Chapter 11, Infrastructure
592 infrastructure development projects of total worth ₹51352.60 crore have been sanctioned under KIIFB. The sector wise details are given in Table 11. 7.1.
KIIFB harnesses resources through multiple investment avenues which include infrastructure investment trust, Infrastructure Debt Fund (IDF), Alternative Investment Fund (AIF) , Financial investments such as general obligation bonds, Land Bonds, Infra bonds, Tailor-made investment package through existing Government financial agencies like Kerala State Financial Enterprises Limited (KSFE), grants, annuities and other guaranteed payments from Government, returns
from investments, loans domestic/bilateral/ multi-lateral institutions.
Table 11. 7.1 Status of KIIFB approved projects-Department-wise
DepartmentKIIFB Approved Projects
No. of Projects Approved Approved Amount (in ₹ Crore)
PWD 279 17,670.43Power 15 5200Water Resources 80 4,753.21General Education 76 2,037.91Health and Family Welfare 24 2,035.99Information Technology 3 1,412.86Coastal Shipping and Inland Navigation 1 566.51Higher Education 26 562.02Sports and YA 35 732.53Transport 3 556.49Forest 4 441.67Culture 8 194.34SC/ST Development 9 186.1Fisheries and Ports 4 212.04Devaswom 1 141.75Registration 6 89.88Labour and Skills 5 82.5Tourism 3 72.47Home 1 50.14Local Self Government 3 31.69Agriculture 1 14.28Revenue 2 32.62Industries 3 14,275.17Total 592 51,352.6
Source: KIIFB


LOCAL GOVERNMENTS AND DECENTRALISED PLANNING
LOCAL GOVERNMENTS AND
DECENTRALISED PLANNING
12C H A P T E R

511Chapter 12, Local Governments and Decentralised Planning
LOCAL GOVERNMENTS AND DECENTRALISED PLANNING
12C H A P T E R
In an era of globalisation, decentralisation is the principal countervailing trend which can ensure that the growth process is pro-poor, pro-women, pro-nature and pro-jobs. As market integration and technological innovation renders the national frontiers more permeable, it is crucial to put in place and strengthen systems of negotiation, regulation and decentralised governance. These can ensure that the voices and concerns of the poorest of the poor, in keeping with Mahatma Gandhi’s message, are centre-stage in policy dialogue at the global, regional and national levels. (Decentralisation in India, Challenges and Opportunities, UNDP Discussion Paper)
Kerala’s decentralisation experience is unparalleled in the history of the country. It depicts the case of first State-led concerted effort for transferring powers, functions and institutions at one go to the third tier of governance – the local Governments accompanied by a simultaneous bottom up initiative for local level planning and development through the People’s Plan Campaign. Devolution of Plan resources on a formula based, non-discretionary and equitable manner to the Local Governments is another hallmark where they now get a portion of the State’s investible resources (about 25 per cent) as Development Funds for implementing projects formulated at local level. In addition, the State transfers 3.5 per cent of its State Own Tax Revenue (SOTR) as General Purpose Fund and about 6.00 per cent of SOTR as Maintenance Fund
every year. The Local Governments have absolute freedom in formulating and implementing projects based on their priorities subject to Plan guidelines issued by the State Government from time to time. It is also widely recognised that decentralisation, as practised in Kerala, has not only put it on a better development trajectory but also has had significant impact on quality, efficacy and inclusiveness of that development. For one thing, it has opened the public sphere for the hitherto socially excluded groups such as the Scheduled Castes/Scheduled Tribes and the politically excluded women in proportions never seen before.
While the first phase of Decentralised planning was initiated in Kerala in the 9th Five-Year Plan consequent to the enactment of the Kerala Panchayati Raj Act (1994) and Kerala Municipality Act (1994) and the constitutional amendments, the launching of the second phase coincides with the 13th Five-Year Plan. It emphasises deepening people’s planning through Local Governments as an important strategy for achieving higher economic growth indicating the crucial role of the Local Governments. It also lays stress on the need for restoration of District Planning Committees to their rightful place in the process of planning and in drafting District Plans. The second phase of decentralised planning focuses on empowering and enabling Local Governments in achieving the objectives outlined in the 13th Plan.

512 Economic Review 2019, Kerala State Planning Board
At present, there are 1,200 Local Governments in Kerala, which includes 941 Grama Panchayats, 152 Block Panchayats, 14 District Panchayats, 87 Municipalities and 6 Municipal Corporations. The allocation of Development Fund to Local Governments is being done under three categories – General Sector, Scheduled Caste Sub Plan (SCSP) and Tribal Sub Plan (TSP). The Plan allocation for Development Fund for Local Governments is fixed in accordance with the Action Taken Report (ATR) on the recommendations of State Finance Commission (SFC). As per the ATR on the 5th SFC report, Plan allocation for Local Governments is to be fixed as a per cent of State Plan outlay. Thus, 24 per cent (₹7,000 crore) of the State Plan outlay was earmarked as Development Fund for the year 2018-19. This includes devolution from the Union Finance Commission Award. In 2019-20, 24.5 per cent (₹7500 cr)of the State Plan Outlay has been earmarked as Development Fund.
13th PLAN – POLICY CHANGES and NEW INITIATIVES
In the first year of the 13th Plan (2017-22) a new set of guidelines for the formulation and implementation of the Local Government Plans were issued in accordance with the approach of the 13th Five-Year Plan. On account of the cumbersome procedures that existed, the Plan formulation and its approval took more time than implementation forcing Local Governments to rush through the process of implementation during the terminal months of the financial year in turn resulting in the bunching of payments in the month of March. Modification in guidelines was first initiated to address this issue but were once again modified in January 2018 on the basis of the experiences in the first year. Subsequently, some additions to basic guidelines were issued in the Annual Plan 2019-20 in the backdrop of the flood. This includes constitution of a new Working Group on Biodiversity Management, Climate Change, Environment Protection and Disaster Management to give focus on Climate resilient planning. New set of guidelines helped the Local Governments to formulate their Plans
well in advance thus enabling them to integrate their Annual Plans with Budget and also giving them one full year for implementation.
Another feature of decentralisation in the 13th Plan will be the importance given to the multi-level planning. Many problems affecting the State today considered as local/regional problems are not necessarily local and have roots outside the local boundaries of the Local Governments (Example: water shortage, waste disposal etc) and hence require multi- level planning. In the 13th Plan, emphasis will be given to developmental interventions by the Government departments such that it will complement the works of Local Governments in fulfilling their constitutional duties and responsibilities. In view of the widespread criticism of Local Governments regarding their inability to obtain the services of experts and educational research institutions, the 13th Plan will focus on bridging the gap between the local development Plans and knowledge or expertise.
Considering the emphasis given in the 13th Plan to the issues arising out of increasing urbanisation in Kerala and the need to develop appropriate strategies and programmes for coping up with challenges and opportunities thrown up by the process of urban growth, the Government issued for the first time a separate set of guidelines for Plan formulation in urban Local Governments.
Policy changes were introduced in the sectoral ceiling (the mandatory maximum or minimum allocation in the three sectors of allocation namely production, service and infrastructure) with a view to enhance production. Mandatory minimum allocation of 30 per cent for productive sector under normal share of general sector fund (General sector fund less the Finance commission award) was ensured in the case of three-tier Panchayats and 10 per cent in the case of urban Local Governments. Also 5 per cent of total allocation comprising normal share under general sector, Scheduled Caste Sub Plan (SCSP) and Tribal Sub Plan (TSP) funds for disabled and
513Chapter 12, Local Governments and Decentralised Planning
children, 5 per cent for old age and palliative population, 10 per cent for Women Component Plan (WCP) was ensured. However, in the context of the Floods that hit the State in August 2018, relaxation in sectoral norms was allowed for the year 2018-19 by reducing the minimum productive sector allocation to 20 per cent so as to enable the Local Governments to reorient and rearrange their Plans to address the critical problems that have risen as a result of the floods.
Decentralisation aims at identifying the problems for local development and Plan by devising projects according to the available resources so as to solve such problems. Projects thus identified may not be in tune with the subsidy guidelines issued by Government from time to time for the preparation of Plans by Local Governments. Hence, in the 13th Plan, the Local Governments were allowed a window of ‘Innovative Programmes’ for designing schemes that are innovative and relevant but cannot be taken up by the Local Governments as per the subsidy guidelines.
In the beginning of the 13th Plan more autonomy was given to Local Governments for project preparation and implementation by allowing more implementing officers. Until then only the senior most transferred official in a sector could be made as implementing officer in that sector. This change helped smooth and easy implementation of projects in many sectors particularly engineering projects. Another notable feature introduced in the first year of 13th Five-Year Plan was formation of Planning Committees in all Local Governments to help them in Plan formulation, implementation and monitoring. This ensured the active involvement of all stakeholders in the Plan formulation. An equally important initiative was broadening the scope of subsidies that can be disbursed through Local Government Plans.
District Plans: District Plans were formulated in 2018 in all Districts. It is a constitutional mandate (Article 243 ZD) that the District Planning Committees (DPCs) make District Plans aimed
at designing an integrated approach for the development of the District. The other objectives of District Plans are to promote multilevel planning and to ensure greater integration between the development needs and priorities of various tiers of Local Governments and different socio-economic classes in the State and District level. All the DPCs in Kerala could complete the task of making the District Plans, following the detailed guidelines issued by the State Government. The DPCs in the State have already converted some of the big project ideas that emerged in the District Plans into implementable projects so that it can be jointly implemented by Local Governments and other agencies. Government had introduced a scheme in the State Budget for promoting such integrated projects in the District Plans, with a corpus of ₹40 crore. Thus the process of aligning District Plans with the Local Government Plan has already begun. In addition, Government has decided to fund integrated and joint projects taken up by Local Governments through Rebuild Kerala Initiative.
Formation of District Resource Centre (DRC): The first two years of the 13thPlan focussed on ensuring timely completion of Plan formulation process and early beginning of the Plan implementation. This in turn helped in achieving higher utilisation of Plan funds in the first two years. After this, the emphasis is on improving the quality of Plans of the Local Governments in the remaining years. It was observed that the Projects prepared by the Local Governments suffered from certain weaknesses, namely designing projects without sufficient baseline studies, taking up of very small scale projects having little results, piece-meal preparation of projects by not providing sufficient information etc. To address these issues and to improve the knowledge content of the Plans prepared by the Local Governments, in September 2019 Government directed to form District Resource Centres in all Districts under the auspices of District Planning Committees consisting of professionals from Development-research and technical institutes as well as retired experts from Government departments. The main

514 Economic Review 2019, Kerala State Planning Board
functions of DRC are :a) to conduct studies in areas and topics required by the DPC as well as the Local Governments b)give technical advice so as to improve the knowledge content of the Local Government Plans, c) to prepare DPRs on projects as required by the Local Governments, d) to scrutinise the Plans prepared by Local Governments and point out the weaknesses and suggest measures to improve it e) to study the model projects and bring it to the attention of the State and f)revision of the District Plan every year. This will help a long way in improving the quality of Plans of the Local Governments and in turn give emphasis to areas that require core attention.
Disaster Management Plan: In light of the frequent natural disasters and climatic variations affecting the State, calamities like flood, coastal erosion, drought and landslides are posing serious challenges to the economy. To mitigate the impact of such disasters and to improve the disaster preparedness, for the first time in the country, GoK has recently directed all Local Governments to prepare local disaster management Plans. The Disaster Management Plan of the Local Government will consist of the following components, a) LSG profile b) Hazard and Vulnerability profile c) Capacity and Resources of the Local Government, d) Response Plan and e) Preparedness, mitigation and community resilience Plan. The Disaster Management Plans are proposed to be prepared by Local Governments during January to March, 2020 which will be integrated with the Annual Plan 2020-21. The Local Governments have to include projects of disaster management and mitigation in their Annual Plans considering the susceptibility of the respective Local Governments to natural disasters as well as their existing capacity to tackle it. The Government also directs all Local Governments to form four Emergency Response Team (ERTs) in each Local Government to lead the rescue and relief operations and give first aid in the wake of a disaster. They also have to find out possible community centres that can be converted into relief camps and ensure maintenance of such
centres by having necessary toilets, lights and sanitation measures. Considering the intensity, incidence and uncertainty of the natural disasters ravaging the country as well as the world over especially due to errant climatic variations, the Disaster management Plan is a novel and pertinent measure taken by the Government worth emulating all over the country.
Decentralisation round: Even though two decades has passed since the launching of decentralisation in Kerala, we have not succeeded in developing a data collection and dissemination system capable of supporting the local level planning in Kerala. Information Kerala Mission collects data on Plan schemes while the Local Governments themselves collects data on development sectors and uses it for local level planning. However, there is a huge data gap with respect to the achievements as well as effectiveness of local Plans. Considering that this is the most appropriate time for initiating such a data collection round when the period of the incumbent elected representatives will end and new representatives will assume office, the Government has initiated to conduct a data collection round called the ‘Decentralisation round’ where data regarding the achievements of Local Governments with respect to subjects dealt by them will be collected based on a questionnaire. This data collection will also help in assessing the functioning of the incumbent Local Governments and also help the new elected representatives assuming office in November 2020 to Plan future programmes and priorities. It will help in identifying model projects, learn from the functioning of exemplary Local Governments; learn from past experiences, and acquire new knowledge. The data collection and compilation responsibilities will be handed over to the Directorate of Economics Statistics personnel. It is planned to conduct this round every five years. This will be a good source of information for all the researchers and planners in future.
Special incentives for flood affected Local Governments – In the Annual Plan 2019-20, ₹250 crore was allocated for giving assistance

515Chapter 12, Local Governments and Decentralised Planning
to the Local Governments seriously affected by the floods of 2018. A committee was constituted to select the Local Governments eligible for assistance and decide on the criteria to distribute this fund among the selected Local Governments. As per the recommendation of the Committee the Government decided to keep 15 per cent of the fund i.e. ₹37.5 crore for distributing among the Local Governments seriously affected by landslips and landslides and the remaining fund of ₹212.50 crore be distributed among the selected flood affected Local Governments. Accordingly, 240 GPs, 33 Municipalities, and 3 Corporations received ₹169.04 crore, ₹35.85 crore and ₹7.61 crore respectively as special incentives for recovery and reconstruction of lost and damaged assets. Subsequently the Government also issued guidelines for the utilisation of this funds wherein it was stipulated that the fund should be primarily used for livelihood generation projects benefitting mainly those who have lost their livelihood due to the floods of 2018. It also permitted that the fund can be used for restoration of public assets lost in the floods and also for repair and maintenance of rescue shelters in the wake of floods.
Major Achievements in the 13th Plan
a. Timely preparation of Local Plans
The 13th Plan aimed at timely preparation of Plans by Local Governments and early implementation. Modification of Plan guidelines done in the beginning of 13th Plan removed
cumbersome procedures and helped Local Governments in preparing the Annual Plans sufficiently early. While for the Annual Plan 2017-18, the formulation process was completed by June 2017, for the Annual Plan 2018-19 it was completed by March end, which enabled them to integrate their Annual Plans with the Budget for the first time and also provided the Local Governments one full year for implementation. In case of Annual Plan 2019-20, the Plan formulation process could be completed by December 2018. These achievements are unprecedented in the history of decentralisation in the State. This helped in giving them one full year for implementation that is more time for implementation of projects, which in turn helped in achieving higher utilisation of Plan funds in 2017-18 and 2018-19. In 2016-17, the utilisation was 76.7 per cent whereas for 2017-18 and 2018-19 it was 85.44 and 81.36 per cent respectively.
b. Substantial increase in tender savings
The new set of guidelines introduced in the 13th Plan promotes e-tendering in the execution of public works in the place of beneficiary committees so as to ensure transparency in the system. There has been substantial increase in tender savings to the tune of ₹239.60 crore in 2017-18 and ₹212.23 crore in 2018-19 which helped the Local Governments to take up new projects. Details are given in Appendix 12.1.1.
Box 12.1.1 Grama Panchayat Development Plan
The best known feature of Kerala’s Decentralisation is planning by the people. The People’s Plan Campaign initiated in the 9th Plan succeeded in developing a participatory methodology for local level planning, which has been continuously refined over the years. Decentralisation practiced in Kerala for the last two decades has been adopted by the Union Ministry of Panchyathi Raj and has asked all the States to adopt it for the preparation of “Grama Panchayat Development Plan” with the slogan SabkiYojanaSabkaVikas. The aim is to spread the participatory planning process to all over the country. This is a significant achievement as far as Kerala is concerned.
Source:

516 Economic Review 2019, Kerala State Planning Board
c. Increase in share of productive sector expenditure in the general sector expenditure
The Local Governments are to allocate a fixed percentage of Normal share under General sector fund towards productive sector. In the beginning of 12th Five-Year Plan there was no mandatory minimum ceiling in productive sector during the first four years. The experience in the first four years was reviewed by the new Government that assumed office in May 2016 and a decision was taken to restore the mandatory minimum allocation with 20 per cent under productive sector and minimum allocation of 10 per cent for sanitation, for the Annual Plan 2016-17. This was again revised in the beginning of the 13th Plan and the mandatory minimum ceiling in the productive sector was enhanced to 30 per cent in the case of Grama Panchayats, Block Panchayats and District Panchayats whereas in the case of Urban Local Governments it was fixed at 10 per cent. This facilitated or encouraged the Local Governments in allocating and taking up more projects in the productive sector who were until then concentrating on infrastructure sector. This signifies the emphasis given to enhance production outlined in the Approach paper for the 13th Plan. Details are given in Table 12.1.1.
d. Rise of Local Governments in Kerala to ISO standards
The Approach paper for the 13th Plan States that all Local Governments in Kerala would be raised at par to the ISO standards. This has
now been almost accomplished and the Local Governments in Kerala are in the forefront in delivering quality service to the people in a time bound manner. Of the 941 Grama Panchayats in Kerala, 861 GPs and 152 Block Panchayats have achieved international quality certification ISO 9001: 2015. Remaining Grama/Block Panchayats will achieve this target this financial year itself. Municipal corporations, municipalities, and District Panchayats are expected to adopt the ISO for the next fiscal year. ISO 9001: 2015 is an international certification for quality management system. Local Governments have strived for this international recognition because they have a clear understanding that only with a high-quality system, they can provide timely services to the people. The ISO certification is given only if the system is designed such that people receive uninterrupted services by providing a public friendly and accurate front office system, a computerised record keeping system that can record records in a very short time, and an orderly office system. The work done by Local Governments to achieve international certification is a major step towards the goal of providing a quality service to the people and being a public friendly organisation.
e. Kerala tops – Mission Antyodaya Survey
Ministry of Rural Development, GoI, as a precursor to the preparation of GPDP has directed all the States to undertake the Mission Antyodaya Survey-a survey by which the Grama Panchayats all over the country are ranked based on three indicators i.e. Basic infrastructure,
Table: 12.1.1 Share of Productive sector expenditure in the total expenditure under normal share of general sector funds of Local Governments 2018-19, in ₹ crore
Year Productive sector expenditure under normal
share of General sector Funds
Total Expenditure in Normal share of general sector funds
Percentage share of productive sector expenditure in normal share under
general sector expenditure (%)
2015-16 242.43 2400.98 10.102016-17 373.42 2040.85 18.302017-18 660.46 2750.19 24.022018-19 674.26 3330.11 20.25
Source: Information Kerala Mission, 2019
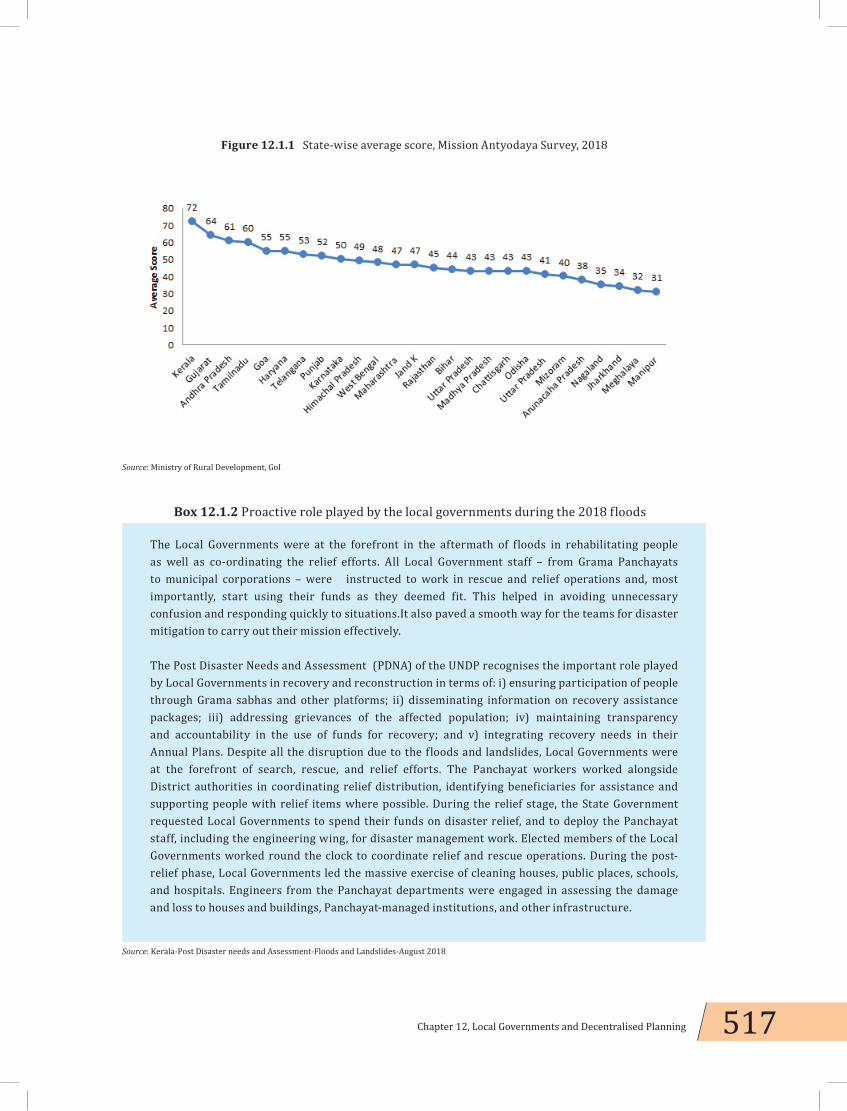
517Chapter 12, Local Governments and Decentralised Planning
Figure 12.1.1 State-wise average score, Mission Antyodaya Survey, 2018
Source: Ministry of Rural Development, GoI
Box 12.1.2 Proactive role played by the local governments during the 2018 floods
The Local Governments were at the forefront in the aftermath of floods in rehabilitating people as well as co-ordinating the relief efforts. All Local Government staff – from Grama Panchayats to municipal corporations – were instructed to work in rescue and relief operations and, most importantly, start using their funds as they deemed fit. This helped in avoiding unnecessary confusion and responding quickly to situations.It also paved a smooth way for the teams for disaster mitigation to carry out their mission effectively.
The Post Disaster Needs and Assessment (PDNA) of the UNDP recognises the important role played by Local Governments in recovery and reconstruction in terms of: i) ensuring participation of people through Grama sabhas and other platforms; ii) disseminating information on recovery assistance packages; iii) addressing grievances of the affected population; iv) maintaining transparency and accountability in the use of funds for recovery; and v) integrating recovery needs in their Annual Plans. Despite all the disruption due to the floods and landslides, Local Governments were at the forefront of search, rescue, and relief efforts. The Panchayat workers worked alongside District authorities in coordinating relief distribution, identifying beneficiaries for assistance and supporting people with relief items where possible. During the relief stage, the State Government requested Local Governments to spend their funds on disaster relief, and to deploy the Panchayat staff, including the engineering wing, for disaster management work. Elected members of the Local Governments worked round the clock to coordinate relief and rescue operations. During the post-relief phase, Local Governments led the massive exercise of cleaning houses, public places, schools, and hospitals. Engineers from the Panchayat departments were engaged in assessing the damage and loss to houses and buildings, Panchayat-managed institutions, and other infrastructure.
Source: Kerala-Post Disaster needs and Assessment-Floods and Landslides-August 2018

518 Economic Review 2019, Kerala State Planning Board
human development and economic activity. By this the development gaps needing specific intervention are identified and the Grama Panchayats prepare the Grama Panchayat Development Plan devising projects and Plans to address these gaps following a convergence mode by which the funds from central and State schemes are converged with local resources to fund such projects. In first phase 2017-18, the survey was done in 195 GPs (with Kudumbsree as the nodal agency). In 2018-19,939 GPs out of 941 GPs in the State had completed the survey.
At the national level, in 2018 the Mission Antyodaya Survey was conducted in 2,47,910 Grama Panchayats all over the country. 62 per cent of the Grama Panchayats surveyed all over the country scored in the range of below 50 and only less than 1 per cent of the Grama Panchayats scored above 80. While in Kerala, out of the 939 Grama Panchayats that have uploaded the status, 91 Grama Panchayats scored in the range of 80 to 90 while 905 Grama Panchayats (96.3 per cent) scored in the range above 60. Details are given in Appendix 12.1.2. This shows that Kerala is far ahead of other States and the nation as a whole with respect to the parametres measured in MA survey. Also, among the 29 States in the country, Kerala with an average score of 72 comes first. Gujarat, Andhra pradesh and Tamil nadu falls behind Kerala with average score of 64,61 and 60
respectively. Details are given in Figure 12.1.1. In addition Kerala comes 2nd with respect to sanitation with average score of 10 points, 5th in Agriculture, 2nd in availability of piped tap water and first with respect to Child development.
Financing Of Local Government PLANS – 2018-19
Plan allocation is devolved to Local Governments in two streams – the first stream consists of the untied Plan grant (Development Fund) and the other stream consists of Plan assistance for specific sponsored schemes. For Plan Grant, Local Governments have full autonomy in deciding their priorities, formulating the projects and implementing them subject to Plan guidelines issued by the State Government. As already mentioned, the Plan allocation for Development Fund for Local Governments is fixed in accordance with the Action Taken Report (ATR) on the recommendations of State Finance Commission (SFC) and as per the 5th SFC, the Plan allocation for Local Governments is to be fixed as a per cent of State Plan outlay. Thus, 24 per cent (₹7,000 crore) of the State Plan outlay has been earmarked as Development Fund (Plan Grant) for the year 2018-19. This consists of ₹3,777.58 crore under General Sector (Normal share), ₹1,738.1 crore under Central Finance Commission Award, ₹1,289.26 crore under
Table12.1.2 Distribution of Development Fund for different tiers of Local Governments 2018-19, in ₹ lakh
Local Governments
General Sector
Scheduled Caste Sub
Plan (SCSP)
Tribal Sub Plan (TSP) Total
Normal share 14th FC Award
Basic Grant Performance Grant
1.Grama Panchayats 1,75,264.6 80,278 10,125 64,401.89 10,619.38 3,40,688.872. Block Panchayats 64,124.42 0 0 21,467.29 3,539.79 89,131.53. District Panchayats 64,124.42 0 0 21,467.29 3,539.79 89,131.54. Municipalities 39,808.14 36,635.78 10,396.2 13,206.89 1,255.9 1,01,302.915. Corporations 34,436.42 28,448.22 8,072.8 8,382.64 405.14 79,745.22Total 3,77,758 1,45,362 28,594 1,28,926 19,360 7,00,000
Source: Appendix IV, State Budget, 2018-19

519Chapter 12, Local Governments and Decentralised Planning
Scheduled Caste Sub Plan (SCSP) and ₹193.60 crore under Tribal Sub Plan (TSP). The 14th Central Finance Commission Grant is distributed among Grama Panchayats, Municipalities and Corporations only. The inter-se distribution of funds is worked out on the basis of the ATR on the Fifth SFC Report. The distribution of Development Fund to different tiers of Local Governments under each category is given in Table 12.1.2.
The Local Governments have in addition to the development fund (fixed percentage of the State Plan), Own fund, Maintenance fund, as well as other funds to finance the projects undertaken. The total outlay of the Plans of all Local Governments together in 2018-19 was ₹19,613.05crore; whereas the expenditure for the same was ₹10,010.19 crore. A break up of the expenditure pattern of the Local Governments reveals that of the total expenditure incurred largest expenditure was incurred out of Development fund (56.9 per cent) followed by Maintenance Fund (19.26 cent) and Own Fund (5.88 per cent). Other sources of fund like CSS, loan from co-operatives, beneficiary contribution etc. contribute 17.71 per cent of the expenditure of the Local Governments. Development fund expenditure absorbed the predominant share implying that Local Governments are largely dependent on development fund to finance
their projects. A considerable amount as much as 20 per cent of the total expenditure is also expended on the maintenance of roads as well as other transferred assets. Details are given in Figure 12.1.2 and Appendix 12.1.3 and 12.1.4.
Development Fund – Tier-wise
As already mentioned, development fund is the main source of funding for the Local Governments. In 2018-19, the total budgeted outlay under Development Fund for Local Governments was ₹7,000 crore. However, only ₹6,721.90 crore was released. The expenditure was 5,696.34 crore, which was 84.74 per cent of the amount released as development fund. The tier-wise expenditure performance of Local Governments shows that barring corporations all Local Governments have showcased expenditure above 80 per cent. The tier-wise expenditure details are given in Figure 12.1.3.
Category-wise expenditure
The allocation of development fund to Local Governments falls in three categories – General, Scheduled Caste Sub Plan (SCP) and Tribal Sub Plan (TSP). Out of ₹6,721.91 crore released as development fund, 5,239.05(77.9 per cent) was released as General category, ₹1,289.26 crore (19.17 per cent) under SCP category and ₹193.60
Figure 12.1.2 Share of various sources in the total expenditure of Local Governments
Source: Information Kerala Mission, 2019

520 Economic Review 2019, Kerala State Planning Board
crore (2.88 per cent) as TSP category. The expenditure performance with regard to each of the category has been above 80 per cent for Gram Panchayats and Block Panchayats. Urban Local Governments have incurred less expenditure under SCP and TSP. This shows the reluctance of Urban Local Governments in giving due focus to SCP and TSP. The details are given in Appendix 12.1.5 and 12.1.6 and Figure 12.1.4.
Sectoral Analysis
The Annual Plan guidelines requires that the Local Governments are to allocate funds in three sectors viz; production, service and infrastructure. The sector-wise allocation is
given in figure below. The share of production sector in the total expenditure is only 13 per cent, while the largest share is for the service sector 63 per cent. There has been a decline in the share of production sector and service sector in 2018-19 over 2017-18 while the share of infrastructure sector has increased.The reason being the relaxation in sectoral norms allowed in the backdrop of Flood 2018. Detail are given in Figure 12.1.5 and Appendix 12.1.7 and Appendix 12.1.8.
Production sector
Figure 12.1.6 shows the subsector-wise expenditure of Local Governments in production
Figure 12.1.3 Expenditure performance of various Local Government against amount released
Source: Information Kerala Mission, 2019
Figure 12.1.4 Category-wise expenditure of Local Governments against release in 2018-19
Source: Information Kerala Mission, 2019

521Chapter 12, Local Governments and Decentralised Planning
sector. 38.9 per cent of the production sector expenditure was for Agriculture, followed by Animal Husbandry (20.75 per cent), Dairy Development(13.7 per cent), Irrigation (8.56 per cent), Soil and water conservation(4.91per cent).Expenditure in fisheries accounted for just 1.86 per cent while for Industry and self-employment only 9.34 per cent. Details are given in Appendix 12.1.9 and Figure 12.1.5.
In Annual Plan 2018-19, relaxation in sectoral norms was allowed in the context of the Floods of 2018 as per which rural Local Government had to allocate only 20 per cent of their normal share under General sector funds instead of 30 per cent
towards production sector activities while for the Urban Local Governments it is 10 per cent. Table 12.1.3 shows the production sector expenditure share of Local Governments in their normal share of General sector fund. Gram Panchayats, Block Panchayats and District Panchayats as well as Municipalities have incurred more than the stipulated expenditure for productive sector. Corporations however have incurred much less than the required expenditure.
Service Sector
The sub sector-wise Service sector expenditure undertaken by Local Governments is shown in
Figure 12.1.5 The share of various sectors in the total expenditure incurred by the Local Governments in 2018-19
Source: Information Kerala Mission, 2019
Figure 12.1.6 Sub sector-wise productive sector expenditure incurred by the Local Governments in 2018-19
Source: Information Kerala Mission, 2019

522 Economic Review 2019, Kerala State Planning Board
Figure 12.1.6. 41.31 per cent of the expenditure is for housing and house electrification. The mandatory allocation towards housing by all Local Governments explains the high expenditure in housing. Local Governments have to mandatorily earmark 20 per cent of the sum total of funds under Normal share of general sector, SCP, and TSP towards housing as well as expenses of PMAY etc. Expenditure figures shows that Local Governments are giving at most importance to providing housing and house electrification. 12.50 per cent of the total service sector expenditure was spent for education and 9.92 per cent for social welfare and social security and 6.86 per cent for drinking water and 5.66 per cent for sanitation. Details are given in Appendix 12.1.10 and Figure 12.1.7.
Infrastructure
In 2018-19, the Local Governments spent 24 per cent of their expenditure on infrastructure sector activities like street lighting, transportation, construction activities etc. The expenditure on infrastructure has declined compared to 25 per cent in 2017-18. Out of the total expenditure, a major portion (77 per cent) has been utilised for transport sub-sector comprising roads, bridges etc. Out of the total infrastructure expenditure of ₹1,375 crore, Grama Panchayats utilised ₹682.14 crore followed by municipalities (₹257.68 crore). Sub sector-wise expenditure details under infrastructure sector in 2017-18 are given in Appendix 12.1.11 and Figure 12.1.8.
Table :12.1.3 Annual Plan 2018-19, share of production sector expenditure in the normal share of general sector, ₹ in crore
Type of LSGs Production sector Expenditure- under normal share under
General sector
Total Expenditure under Normal share of General sector % of Exp.
Gram Panchayats 364.94 1,621.21 22.51Block Panchayats 143.37 583.73 24.56District Panchayats 108.52 535.59 20.26Municipalities 40.67 352.01 11.55Corporations 16.75 237.53 7.05Total 674.25 3,330.11 20.25
Source:
Figure 12.1.7 Sub sector-wise expenditure share of service sector in 2018-19, in per cent
Source: Information Kerala Mission, 2019

523Chapter 12, Local Governments and Decentralised Planning
Performance under Special Sector Plans
The Women Component Plan (WCP) and Plans for disadvantaged groups (aged, children, differently abled, palliative and other vulnerability) by the Local Governments are the noteworthy features of Kerala’s decentralised planning. The Local Governments have to mandatorily earmark 10 per cent of the sum total of Normal share of General sector funds, SCP and TSP towards Women Component Plan (WCP) and 5 per cent for children, differently abled, transgenders and 5 per cent for old age and palliative care projects. The expenditure on WCP in 2018-19 as per cent to total expenditure in
Normal share of general sector is 6.87 per cent. In the case of special programme for children and differently abled it comes to 3.36 per cent and 2.10 per cent respectively whereas for palliative care it is 1.61 per cent. The expenditure of Local Governments under these special sectors is not according to the required level implying that more attention is required in initiating such projects. The details of expenditure for special sector Plans in 2017-18 are given in Table 12.1.4 and the tier-wise details in 2018-19 are given in Appendix 12.1.12 and 12.1.13.
The effective interventions by Local Governments has resulted in a visible improvement in the general performance of the
Figure 12.1.8 Sub sector-wise expenditure share of infrastructure sector in 2018-19, in per cent
Source: Information Kerala Mission, 2019
Table : 12.1.4 Expenditure for Special Sector Plan 2018-19Special Sectors Share of special sectors in sum total of Normal share of
General sector fund, SCP and TSP
Women Component Plan 6.87Special programme for children 3.36Special programme for old age 2.89Differently abled 2.10Other Vulnerability 0.48Palliative 1.61
Source:

524 Economic Review 2019, Kerala State Planning Board
State which is reflected in the micro level data especially in agriculture production and milk production. This has also paved way for winning national acclaim for Kerala. Kerala has won the national Award for ‘Best State in promoting empowerment of persons with disabilities’ in the country for the year 2019. Moreover, more
than 100 model projects and model Local Governments have emerged as a result, one or two instances of the same are given below.
Box 12.1.3 Miracle with rice
Mayyil GramaPanchayat in Kannur District is now known for the miracle they have made in rice production. Not long ago, most of these fields were fallow. Growing paddy was not remunerative, so farmers looked elsewhere for an income. But even as the situation seemed hopeless, change arrived serendipitously in the past 2 years. The Grama Panchayat, worried about the steep decline in paddy farming, searched for answers. In August 2016 the Grama Panchayat launched a Total Rice Campaign or ‘SampoornaNelluKrishi’ to revive paddy farming.
Farmers, agricultural scientists, Government agencies, politicians, youth, and women pitched in to make the Total Rice Farming programme a great success. As the farmers began to think differently, a mini rice mill, which turns small quantities of paddy into rice, liberated them from the clutches of big mills. It allowed farmers to locally sell and consume the rice they grew.Mayyil today has its own farmer-producer organisation (FPO) called the Mayyil Rice Producers’ Company (MRPC), which brands, mills, and markets its own rice. The area under paddy has doubled from 300 hectares to 600 hectares — the highest in Kerala. Nearly every farmer has a happy story to tell. In fact, paddy productivity has increased a whopping 4.5 times. In 2016-17, Mayyil harvested 645 tonnes. In 2017-18, this increased to 3,000 tonnes. A mini rice mill called Maruthi emerged as a real champion. Powered with a 3 HP motor, it can convert 120 kg of paddy into rice in an hour. Thirteen mini rice mills, including a mobile one, are now churning out various types of rice and another 50 mini mills are in the pipeline. Maruthi’s success has resulted in the closing down of two big rice mills. Mayyil is now a model in its own right. It is built around local farming, local milling, local consumption, and local sales. It ensures food security and an income for farmers.
Source: State Planning Board
Box 12.1.4 Jalaraksha JeevaRaksha
Jalarakshajeevaraksha is a water conservation programme formed as part of the District Plan and being implemented under the leadership of the Thrissur District Panchayat with co-operation of other Local Governments and departments. The scheme aims at ensuring adequate water for drinking as well as agriculture purposes through comprehensive water conservation activities. The scheme is being implemented jointly by the Local Governments, Soil conservation Department, Ground water Department, Irrigation dept, Ariculture Engineering deptMGNREGS, of the District. District Soil conservation officer is the nodal officer of the scheme. This scheme has two components: namely Conservation of Manalipuzha as well as Blue army. Manalipuzha is a river that originates from the Peechi dam and flows through Ollukara, Kodakara, Cherpu Blocks and reaches Palakkadavu from where it merges with the Kurumali river and flows as the Karuvannur river.

525Chapter 12, Local Governments and Decentralised Planning
Box 12.1.5 Social audit by Nedumangad block panchayat: A pioneering experiment
Evaluation of the process and outcome of decentralization at the beneficiary end is widely performed through various internal and statutory audit mechanisms. However, among the various evaluation practices; social audit stands out for its multiple dimensions; being participatory, self-deterministic and holistic. Social Audit is a process by which citizens of the locality, who are beneficiaries of development, evaluate the performance of the various schemes and assess the spill over benefits.
Nedumangad Block Panchayat conducted a social audit of ten major sustainable and innovative projects undertaken by it over the past four years; the initiative being a pioneering effort in social auditing attempts by a block panchayath in India. The President of Nedumangad Block Panchayath coordinated the initiative with guidance from experts. The specific schemes and strategies subjected to social audit were:
• Sustainable Agricultural Management and Rural Development Initiatives (SAMRUDHI), for tapping the potential of agriculture in the block.
• Vallam nira, a project for nutritional self-sufficiency at household level• Jaivagramam, a model Bio village reiterating organic practices• Jyothirgamaya balya , ensuring preventive and curative care for children• Jyothirgamaya Kaumara, giving health education, social orientation and health care facilities
for young adults and parents.• Maramath, strengthening infrastructural base through Public works• Killiyar Protection, extending the activities of block to rejuvenate of Killi river through
participatory approach• Agri-Incubation Centre, providing training and support to women entrepreneurs in agri-food
processing sector• Projects strengthening the socio-cultural fabrics of the locality and creating sustainable
livelihoods• Public policy execution through convergence of line departments by the block
A scientific and inclusive methodology was adopted, and foremost, Social Audit committees were formed at various levels for developing appropriate tools, coordinating field visits, volunteers and experts, conducting observation walks and monitoring group discussions. The procedures and tentative findings were periodically discussed and analysed. Such groups of volunteers, beneficiaries and experts, collected data pertaining to implementation of each project, opinion on functionaries
It divides the Kole lands into two the North Kole land and South Kole lands and lands into the Kanoli Canal and later into the Lakshadweep sea. As part of this programme the distance from Peechi dam (from where the river originates) to the Karuvannur river i.e. 32 km, 64 Km in both banks have been surveyed, borders identified, survey stones established and bamboo planted. The total cost of the projects is ₹89 lakh which includes the contribution of District pnachayaths, GPs as well as share of MGNREGS. Conservation of the small wet land with an area of 10.50 ha situated in the south of Manalipuzha is also a sub component of this scheme. The contribution of three tier Panchayats, and departments as well as assistance from Nabard is there for this scheme. Inaddition blue army has been constituted at school level consisting of school students to lay emphasis on water conservation.
Source: State Planning Board

526 Economic Review 2019, Kerala State Planning Board
Review of Central and State Programmes Implemented by Local Governments
As per the 2011 census, the State has an urban population of 1.59 crore which accounts for 47.6 per cent of total population against a rural population of 1.75 crore (52.4 per cent). Unlike the other parts of India, the habitation of the State is spread continuously without much open lands or fields separating habitations. A rural area is clearly visible elsewhere in India which mainly consists of vast areas of agricultural land with hamlets distributed sporadically. However, in Kerala, a number of small and medium towns are distributed in the village background. It may also be noted that the features in rural and urban areas in Kerala are almost alike. The infrastructural initiatives of the State including setting up urban amenities and creating rural connectivity, sanitation and waste management infrastructure, housing in rural and urban areas along with employment and livelihood generation are detailed below.
I. INFRASTRUCTURE DEVELOPMENT
Creating social infrastructure plays a critical role in economic growth and improves the standard of living of people. The State implements the Centrally Sponsored Schemes (CSS) and also supplements them with funds from own programmes for critical infrastructural development.
i. Housing
Safe and secure shelter is one of the basic needs of human being with direct impact on quality of life and productivity of people. In a wider sense it is more than a structure, it includes facilities of potable water, sanitation and other basic amenities of life.
Pradhan Mantri Awaas Yojana (PMAY) is the housing scheme of the GoI with the participation of State Governments for rural and urban areas, namely PMAY-Gramin and PMAY-Urban. PMAY-G beneficiary is entitled with wages for 90 days unskilled work performed for house construction from MGNREGS and for the construction of toilets, an amount of ₹12,000 is provided from Swachh Bharat Mission (Gramin).
PMAY-G targeted to construct 32,559 new houses in 2016-17 and 9,872 new houses in 2017-18. But the target was not achieved due to the norms of beneficiary selection of GoI. In 2018-19 and 2019-20, target was not given by GoI, and houses constructed for the corresponding financial years is against the target for 2016-17 and 2017-18 (i.e. 42,431). In 2018-19, construction of 7,356 new houses were completed. The beneficiaries include 744 SC beneficiaries, 2,374 ST beneficiaries and 4,238 other beneficiaries. The financial and physical progress of PMAY-G in 2018-19 and 2019-20 (upto September 30, 2019) are given in Appendix 12.1.14 and 12.1.15 respectively.
and suggestions for change. Further, a special committee of Grama Sabha was convened and findings were presented for feedback and the draft report was presented at the Block level Jana Sabha, before a jury comprising of Aruna Roy (Social Activist) , Soumya Kidambi (Director of the Society for Social Audits Accountability and Transparency) and S.M. Vijayanand (Former Chief Secretary). The draft report analysed the level of accomplishment of each innovative scheme against its proposed vision of socio-economic and environmental sustainability and discussed the continuity, consistency and future prospects of the schemes. In addition to the apparent lessons, the exercise was an evaluation of Local Self Governance and its ability to converge different departments for grass root level interventions.
Source: State Planning Board

527Chapter 12, Local Governments and Decentralised Planning
GoI relied on Socio Economic and Caste Census (SECC) 2011 data for beneficiary selection. The GoK represented against this with the GoI as most of the eligible beneficiaries were not included in the SECC data. Later permission was accorded to include all the eligible beneficiaries excluded from the SECC data, who satisfy the same selection criteria of SECC. GoI has directed to take action to exhaust the existing Permanent Waiting List (PWL) by deleting ineligible households in Awas Soft. The GoI has also given permission to include the beneficiaries registered in ‘Awaas Plus’ to PWL after exhausting the current PWL. GoK has identified and registered 3,11,700 eligible households in ‘Awaas Plus’.
The approved total project cost for PMAY-Urban as on September 30, 2019 is ₹3,732.26 crore where the Central and State shares released as on September 30, 2019 are ₹767.09 crore and ₹218.61 crore respectively. There are four alternative components under PMAY-Urban scheme for housing solution. Under the major component, beneficiary led construction of new houses, 424 Detailed Project Reports (DPRs) of 93 Urban Local Governments including three development authorities namely, Greater Cochin Development Authority (GCDA), Goshree Islands Development Authority (GIDA) and Thiruvananthapuram Development Authority (TRIDA) were approved by the Ministry of Housing and Urban Affairs (MoHUA), GoI. Based on the DPRs, construction of 1,11,252 dwelling units was approved and construction of 71,719 houses has been started and 25,198 houses were completed as on September 30, 2019. Under the component, Affordable Housing in Partnership with public and private sectors, two Detailed Project Reports (Perinthalmanna and Greater Cochin Development Authority) consisting of 488 beneficiaries have also been approved.
Credit Linked Subsidy (CLS) component aims to expand the institutional credit flow to the housing needs of urban poor. CLS will be provided on home loans taken by eligible urban poor for acquisition or construction of house. Under CLS, 14,552 beneficiaries got assistance.
The financial and physical progress of PMAY-U in 2018-19 and 2019-20 (upto September 30, 2019) are given in Appendix 12.1.16 and Urban Local Government-wise progress of PMAY-U in 2018-19 and 2019-20 (upto September 30, 2019) are given in Appendix 12.1.17.
PMAY, being a centrally sponsored scheme, the unit assistance for house construction from GoI is ₹72,000 and ₹1.5 lakh for rural and urban areas respectively. The State Government realised that this piecemeal assistance would not be sufficient to give momentum to housing scheme in the State. The State Government adopted a comprehensive approach to the housing issues and initiated the LIFE (Livelihood, Inclusion and Financial Empowerment) Mission as a flagship programme for addressing the issues of homelessness in the State. The assistance under LIFE Mission for houseless having land is ₹6 lakh for ST beneficiaries in remote ST hamlets and ₹4 lakh for all other beneficiaries. The details are discussed in Chapter 11 of this Review.
ii. Sanitation and Waste Management
Lack of access to sanitation facilities is a basic indicator of poverty. Proper sanitation and waste management facilities leads to positive impact on the living standard of the people. As waste management is a serious issue, GoK gave more emphasis on this area. Suchitwa Mission is the nodal agency for evolving implementation strategy and providing technical support to the State Government and Local Governments in developing solid and liquid waste management projects and policies.
The State is Open Defecation Free (ODF) from November 1, 2016 onwards in rural areas and is now focusing on ODF Sustainability and ‘ODF Plus’ activities. As part of community sanitary complexes/public toilets components of Swachh Bharat Mission (Gramin), 16 sanitary complexes/public toilets have been constructed for which ₹33.52 lakh has been expended in 2018-19. During this period, an amount of ₹20.04 crore has been expended on 8,059 Solid and Liquid
528 Economic Review 2019, Kerala State Planning Board
Waste Management (SLWM) projects across the State. Various Information, Education and Communication (IEC)/capacity building activities for ODF Sustainability have been undertaken under SBM (G) in 2018-19 and ₹1.5 crore has been expended towards 1,347 IEC/capacity building activities. As part of SBM (G), State received ₹59.36 crore as 100 per cent Central grant towards Performance Based Incentive Grant in 2017-18. As per guidelines, ₹56.46 crore has been distributed among 14 Districts based on the number of households in each Grama Panchayat (GP) for undertaking various SLWM activities.
In urban areas, construction of Individual Household Latrines (IHHLs) target has been achieved by constructing 29,578 IHHLs. 77 Urban Local Governments (ULGs) in the State have been certified as ODF by Quality Council of India (QCI). ODF inspection is going on in other ULGs. 10,532 IHHL were destroyed during flood. The State Level Empowered Committee (SLEC) and Ministry of Housing and Urban Affairs (MoHUA) have given sanction to take up the construction of the damaged toilets. The ULGs are in the process of taking up projects in this regard. In the case of public toilets, the number of toilet seats undertaken for construction is 1,598. Construction was completed for 265 seats, construction of 420 seats are under progress and 913 seats are under tendering process.
Many of the Government hospitals do not have Sewage Treatment Plants (STPs) to treat the toilet waste and therefore it is proposed to establish STP in at least one hospital in each District. Suchitwa Mission issued technical sanction and partial financial assistance for eight Liquid Waste Management (LWM) projects which is proposed to be installed in hospitals and market places.
Under solid waste management, 82 ULGs have prepared the Detailed Project Report (DPR) and the Ministry of Housing and Urban Affairs (MoHUA), GoI, has approved these DPRs. For source level treatment of bio degradable waste in ULGs, composting installations including
8,37,763 composting pits and 17,260 number of biogas plants are functional at household, institutional and community level. Four Municipalities have undertaken project for source level treatment of waste with a total outlay of ₹61.35 lakh. A plastic shredding facility is functional in Neendakara Harbour to shred, bale, and forward plastic materials collected from sea by the fishermen. ₹4.5 lakh has been provided for its operation and maintenance under the component ‘Initial handholding support for SHGs/Small Scale entrepreneurs in waste management supporting services’. Suchitwa Mission also implemented pre-monsoon cleaning campaign in collaboration with Directorate of Health Services, National Health Mission and Haritha Keralam Mission.
Green protocol is being promoted in major events such as festivals, meetings etc. The Local Governments in the State formed a workforce, namely, Haritha Karma Sena for providing assistance to the households for the composting of wet-waste at source and for the collection of all dry discards for recycling. Haritha Karma Sena has been formed in 1,033 Local Governments of which 712 are functional as on September 30, 2019. Suchitwa Mission extends financial and technical support to Local Governments for establishing Resource Recovery Facility (RRF) centers and Material Collection Facility (MCF) centers. The RRF centers facilitates sorting and managing of different types of non-biodegradable waste for reuse or recycling and 128 RRF centers are functional across 14 Districts as on September 30, 2019. MCF center is the temporary storage of non-biodegradables obtained from door-to-door collection for forwarding to RRF centers. 724 MCF centers are being established of which 674 are now functional. LG wise details of Haritha Karma Sena is given in Appendix 12.1.18 and Resource Recovery Facility centers and Material Collection Facility centers are given in Appendix 12.1.19.
Capacity building activities have been conducted for stakeholders like officials, people’s
529Chapter 12, Local Governments and Decentralised Planning
representatives, resource persons, Green Task Force members etc. As part of this, 17 training programmes were held and 2,799 people participated at State level in 2018-19. 416 and 108 training programmes were held and 50,967 and 1,05,362 people participated at the District level respectively in 2018-19 and 2019-20 (upto September 30, 2019). Details of the District level training programmes in 2018-19 and 2019-20 (upto September 30, 2019) are given in Appendix 12.1.20.
Post Flood Activities Initiated by Suchitwa Mission
Sanitation activities at relief camps were initiated from the very first day of flood incidence in all the flood affected areas. In the context of post flood, Suchitwa Mission has conducted a workshop for identifying locally appropriate and technologically feasible options for toilets for the low lying and water-logged areas. The Mission prepared a project proposal for securing funds for post flood IEC and submitted to UNICEF for funding support. As per the decision of the Task Force on Sanitation and Waste Management under the Haritha Keralam Mission, the Suchitwa Mission was entrusted the task of enlisting appropriate Haritha Sahaya Sthapanam, a temporary institutional mechanism to support the Local Governments and facilitating the functioning of Haritha Karma Sena.
New Initiatives
Collectors @ School is a State wide awareness programme for school students to understand the need of segregation in waste management initiated by Suchitwa Mission in association with Local Governments. It aims to develop (1) the habit of segregation of waste in students by schools and thereby disseminate the message of judicious use of natural resources for sustainable development to the households and to the society; and (2) an understanding of Reduce, Reuse, Recycle (3 R’s) concept.
Plastic Recycling Units in Industrial Estates and KINFRA Recycling Parks
In order to address the issue of the non-biodegradable waste, it is very essential for the State to have its own recycling centres at various Districts, since the transporting of recyclable materials to the centres located in other States cannot be considered as a sustainable option. In this context, it has been directed to take necessary action to identify space in all the KINFRA Parks, industrial estates and other industrial lands to set up a recycling park/recycling unit.
iii. Urban Infrastructure
Increasing urbanisation demands more investment in urban infrastructure development. Considering the special features of urbanisation and the geographical peculiarities of Kerala, the process of urbanisation in the State requires special attention while moulding various urban infrastructure development programmes.
Urban infrastructure covers schemes such as water supply, waste management system, city sanitation plan, establishment and enhancement of public comfort facilities, implementation and improvement of sewerage schemes, storm water drainage schemes, effective parking policy and modern mechanised parking system, beautification of cities and creation of green cities and non-motorised urban conveyance. The major infrastructure development programmes being implemented in the State are discussed below.
Atal Mission for Rejuvenation and Urban Transformation (AMRUT) aims to address the basic challenges of urban physical and institutional infrastructure development covering the components of water supply and sewage, septage, storm water drainage, urban transport, green spaces and parks and capacity building. Six Municipal Corporations and three Municipalities viz; Alappuzha, Palakkad and Guruvayoor in the State have been selected under AMRUT. Project period is five years from financial year 2015-16
530 Economic Review 2019, Kerala State Planning Board
to 2019-20. Proposal has been given to extend the project period to the next one year.
The GoI has approved 1,024 sub projects (388 main projects) for nine cities in five sectors viz; water supply, sewerage/septage management, storm water drainage, urban transport, open spaces and parks worth ₹2,357.66 crore. Of the total project cost, Centre, State and ULG contributes ₹1,161.20 crore, ₹732.01 crore and ₹464.45 crore respectively. Out of 1,024 projects, 1,016 projects have been tendered, 950 projects work awarded and 291 projects were completed including 33 water supply, 38 sewerage networks, 196 storm water drainage networks, 11 urban transport projects and 13 parks. The financial progress of the AMRUT Project in 2018-19 and 2019-20 (September 30, 2019) is given in Appendix 12.1.21. The progress of AMRUT project in nine cities is shown in Appendix 12.1.22 and sector-wise progress is shown in Appendix 12.1.23.
Smart City Mission is a major infrastructure development programme launched by the MoHUA in 2015 to promote cities that provide core infrastructure and give a decent quality of life to its citizens, a clean and sustainable environment and application of smart solutions. Kochi city was selected under the Mission in the first phase and subsequently Thiruvananthapuram in the third phase. The total estimated project cost of the smart city Kochi is ₹2,076 crore and Thiruvanathapuram is ₹1,538.20 crore. Of which Central share is ₹500.00 crore and State share is ₹500.00 crore and the balance amount is adjusted through convergence, external funding and public private partnership for both Kochi and Thiruvanathapuram.
The Smart city proposal of Kochi aims at a planned and integrated development of Fort Kochi-Mattancherry area by improving the civic infrastructure. Under Smart city Kochi, 42 projects are envisaged, out of this, 18 projects works started, 22 projects are in tendering stage and two are housing projects. Public bicycle
sharing project is proposed to be done through Public Private Partnership. The initiated projects include roof top solar project, Intelligent Traffic Management system, cancer block for General Hospital, distribution of waste bins, smart roads etc.
Smart City Thiruvananthapuram Limited (SCTL) envisages 43 projects and prepared DPR for 29 projects worth ₹636.82 crore and Administrative Sanction has been issued for 28 projects amounting to ₹604.80 crore (including convergence projects). Convergence projects worth ₹89.21 crore are already under implementation under Swadesh Darshan and AMRUT.
Under Smart city Thiruvananthapuram, Development of smart bus shelters, (Ayurveda College, Panavilla and Killipalam); upgradation of public toilets (Sulabh toilets in Thampanoor bus terminal, Corporation Office compound and Putharikhandam Maidanam), construction of information kiosks (Corporation Office compound and Gandhi Park) and installation of drinking water kiosks are in the final stages of implementation. Procurement of 15 electric autos and 15 electric rickshaws are in underway. DPR for mega projects like smart road, Integrated Command and Control Centre, underground pedestrian subway at East Fort, re-development of Rajajinagar, warehousing and multilevel car parking at Chalai are in the final stage of preparation.
In the aftermath of flood, the department of Town and Country Planning started preparation of Interim Local Development Plans (ILDPs) so as to prevent such damages to both human life and property in future. The Plan focuses mainly on the protection of environmentally sensitive areas, identification of hazard prone areas and consequent changes in the settlement pattern, efficient road network pattern. The Plan also aims at creating infrastructure development especially in the context of a disaster and restoration of the developed hazard prone areas. The ILDPs will be prepared for both rural and urban Local Governments in the State.

531Chapter 12, Local Governments and Decentralised Planning
Rural Connectivity
In Kerala, rural connectivity through Pradhan Mantri Gram Sadak Yojana (PMGSY) has been very useful to the people in rural areas. Roads constructed under PMGSY are long lasting roads with high quality and durability as there exists a three-tier Quality Management System at the District Level, State Level and National Level. Kerala State Rural Roads Development Agency (KSRRDA) is the State nodal agency for implementation of the scheme. The funds provided by GoI under PMGSY have to be used only for meeting the actual estimate cost of the works. There is no provision for utilizsing the fund for tender excess, shifting of utilities and also for maintenance of completed roads. To meet these expenses, the State Government sets aside fund over and above the stipulated share of 40 per cent through the ‘State support scheme for PMGSY’.
PMGSY-III guidelines envisages consolidation of existing rural road network by upgradation of existing roads that are connected to Grameen Agricultural markets, Higher Secondary School and Hospital. The proposed length allotted for Kerala is 1,425 km. Mandatory requirements of geo-tagging of the above facilities are in progress. Based on that automatic prioritizsation and selection of eligible roads for PMGSY-III will be done.
An amount of ₹22,666.00 lakh and ₹7,011.71 lakh were utilised in 2018-19 and 2019-20 (upto September 30, 2019) under PMGSY and an amount of ₹3,000.00 lakh was utilised in 2018-19 under the scheme ‘State Support for PMGSY’. The District-wise details of laying of roads under PMGSY scheme in 2018-19 and 2019-20 (upto September 30, 2019) are given in Appendix 12.1.24.
II. EMPLOYMENT GENERATION AND LIVELIHOOD SUPPORT
Employment generation is an important indicator of poverty alleviation through increasing the
level of income. Mahatma Gandhi National Rural Employment Guarantee Scheme (MGNREGS), one of the core of the core schemes in CSS, plays a significant role in providing rural employment. It proposes to enhance the livelihood security of the households in rural areas of the country by providing at least 100 days of guaranteed wage employment in every financial year to every household whose adult members volunteer to do unskilled manual work. In Kerala, notified unskilled wage rate for this programme in 2017-18 was ₹258 per day and was enhanced to ₹271 from April 1, 2018 onwards. From 2017-18 onwards, ‘Haritha Keralam Mission’ converges MGNREGS activities in the State.
To utilise the full potential of MGNREGS through convergence with other Departmental schemes, following major initiatives are taken up in the State in 2018-19 and 2019-20.
• With the aim of contributing productive assets to agriculture, irrigation, animal husbandry, fisheries, dairy development and forest, thrust is given in generating individual as well as public assets for maximising production and development in these areas.
• Public asset generating works such as construction of compound wall and playground for schools, Anganwadi construction were taken up.
• Provided individual livelihood assets like cattle sheds, goat shed and poultry sheds
• Special assistance to Scheduled Tribes (State sponsored component)
• Tribal plus scheme – A Scheme aiming to provide additional 100 days of job to Scheduled Tribe households using special financial assistance from the State Government.
• Advance wage payment – In order to motivate the participation of ST workers under the scheme, State Government has initiated a system to give advance payment as wages to ST workers from State Plan fund of Scheduled Tribes Development Department
532 Economic Review 2019, Kerala State Planning Board
through Kudumbashree. The State Government has devised a system to pay the unskilled wages every week, to the beneficiaries using a corpus fund set apart by the Scheduled Tribes Development Department and to recoup the already paid advance amount from the beneficiaries’ bank accounts, with their consent, as soon as the wages under MGNREGS is credited to the respective bank accounts.
As a result of the above innovative programmes, there was a great improvement in the participation of ST families under MGNREGS in 2018-19. The average persondays for ST families in 2018-19 was 79 and a total of 53.55 lakh ST person days were generated. These figures are almost twice of that from the previous years. Among the 67,729 ST families who participated in the activities of MGNREGS in 2018-19, 23,042 families completed 100 days and 2,061 families completed 200 days of employment.
Special Initiatives Undertaken in the aftermath of the Flood 2018
In the post-flood restoration efforts undertaken in the State, MGNREGS played a crucial role in rebuilding Kerala through renovation of the public assets and livelihood regeneration of vulnerable sections of the society. GoI originally sanctioned to generate 5.5 crore persondays in 2018-19. Inorder to overcome the flood situation, as per the request of the State Government, GoI sanctioned to generate 7 crore person days under MGNREGS. At the end of the financial year 2018-19, 9.75 crore person days was ensured. Initially, the State got sanction for additional 50 days of employment per household in seven heavily flood affected Districts. Subsequently, an additional employment of 50 days has also been given in flood affected regions for 87 Grama Panchayat in six partially flood affected Districts. In 2018-19, after the flood (from August 16, 2018 to March 31, 2019), employment has been provided to 12.02 lakh individuals from 10.31 lakh families, of which 6.12 lakh individuals
from 4.83 lakh families were newly employed. After the flood, new job cards were issued to 82,605 families. As a result of providing 7.63 crore persondays, ₹2,068.74 crore worth of employment (i.e. ₹271 wage per day) was generated.
The expenditure under MGNREGS in 2018-19 was ₹2,990.05 crore which is 98.49 per cent of the total release during the year. As indicated earlier a total of 9.75 crore persondays were generated, of which 1.54 crore were for Scheduled Castes and 0.54 crore were Scheduled Tribes. In 2019-20 (as on September 30, 2019) an amount of ₹1,103.23 crore was expended and 3.04 crore person days was created. The financial and physical progress of MGNREGS in 2018-19 and 2019-20 (upto September 30, 2019) are given in Appendix 12.1.25, 12.1.26, 12.1.27 and 12.1.28 respectively.
MGNREGS is applicable only in rural areas. Based on its impact on rural poverty alleviation, GoK started Ayyankali Urban Employment Creation Scheme in urban areas. The State Government has launched the Ayyankali Urban Employment Creation Scheme (AUECS) in the pattern of MGNREGS in 2009-10. This is a State funded programme intended to enhance livelihood security in urban areas by providing at least 100 days of guaranteed wage employment to every household whose adult members are willing to do unskilled manual labour. The fund has to be utilised for creating durable assets in Local Governments.
In the financial year 2018-19, an amount of ₹50 crore has been earmarked for this scheme. The expenditure incurred was ₹48.91 crore and created 16,68,195 person days in various Municipalities and Corporations. During this period, job card was issued to 1,54,623; 35,766 and 3,444 persons in General, Scheduled Castes and Scheduled Tribes respectively including 15,865 male and 1,77,698 female. During this period, 85,943 households and 80,735 women were provided employment and 1,225 families completed 100 days employment.

533Chapter 12, Local Governments and Decentralised Planning
In the financial year 2019-20, the outlay for AUECS was enhanced to ₹75 crore to improve the livelihood opportunities of urban poor in the context of the flood that hit in the State in August, 2018. As on October 31, 2019 ₹28.76 crore expended and created 12,31,670 person days. Up to October 31, 2019, 94,455 households and 89,314 women were provided employment and 784 families completed 100 days employment. During this period, job card was issued to 1,81,586; 41,049 and 3,444 persons in General, Scheduled Castes and Scheduled Tribes respectively including 20,954 male and 2,04,586 female. AUECS labourers were utilised for Arogya Jagratha and pre-monsoon cleaning programme and this created 55,195 person days up to October 31, 2019. 48,574 AUECS labourers who were beneficiaries of PMAY-LIFE scheme were issued job card to get 90 days of employment. Dairy farming has also been introduced under the scheme in 2019-20 and the farmers who have more than two cattles can be given employment and wage through the scheme. as per norms. Details on the LG wise distribution of funds under AUECS in 2018-19 and 2019-20 up to October 31, 2019 are given in Appendix 12.1.29 and physical achievements of the scheme are given in Appendix 12.1.30.
While MGNREGS guarantee wage employment, due emphasis has also been given on livelihood development. Livelihood activities have direct impact on poverty eradication and employment generation and thereby increasing the standard of living of the people. The major initiative of GoI in livelihood are the Deendayal Antyodaya Yojana–National Rural Livelihood Mission (DAY-
NRLM) for rural areas and Deendayal Antyodaya Yojana–National Urban Livelihood Mission (DAY-NULM) for urban areas with a funding pattern of 60:40 ratio.
DAY-NRLM is a demand driven programme for encouraging self-employment organisation of rural poor. Deen Dayal Upadhyaya Grameen Kaushalya Yojana (DDU GKY), Start-up Village Entrepreneurship Programme (SVEP) and Mahila Kisan Sashaktikaran Pariyojana (MKSP) are the sub components of DAY– – NRLM. DDU GKY is the skill and placement initiative under DAY-NRLM. SVEP helps to start and support rural enterprises inorder to stimulate economic growth and reduce poverty and unemployment in the villages. The SVEP provides the supported enterprises with business skills, exposure, loans for starting and business support during the first critical six months of the enterprises by using the CBO network. MKSP focuses on reducing the gender gap in agriculture, by promoting drudgery reduction systems and sustainable agricultural practices to be followed by women farmers. In Kerala, MKSP project is implemented through the network of Kudumbashree Joint Liability Groups (JLGs).
In 2018-19, 4,107 Neighbourhood Groups (NHGs) were formed under DAY-NRLM and 3,30,516 farmers engaged in agricultural activities in 62,527 JLGs under MKSP. Out of the 13,702 persons trained under DDU GKY, 10,972 (80.08 per cent) persons got placement. Details about the physical achievements of DAY-NRLM are given in Table 12.1.5.
Table 12.1.5 Physical achievements of DAY-NRLM
Name of the scheme Components Physical achievements (in number)
2018-19 2019-20 (upto 30/09/2019)
DAY-NRLM NHGs 4,107 1,153DDU GKY Persons Trained 13,702 5,839
Persons Appointed 10,972 4,387MKSP JLGs 62,527 7,055
Farmers 3,30,516 35,275SVEP NHGs (Mobilizsed) 3,935 4,182
Enterprises (Mobilizsed) 3,607 4,011Source: Kudumbashree, GoK

534 Economic Review 2019, Kerala State Planning Board
DAY-NULM aims to reduce the poverty and vulnerability of the urban poor. The scheme is being implemented in all the Urban Local Governments in the State. DAY-NULM has identified 3,195 homeless persons in the shelter to the urban homeless component of the scheme. 22,722 street vendors have been identified in the ‘support to urban street vendors component’ in 2018-19 and 2019-20 (up to September 30, 2019). Identity cards were issued to 11,744 street vendors during the period. Under the component, ‘employment through skill training and placement’, 8,709 candidates have been enrolled and out of these 3,548 candidates were certified and 3,157 candidates got placement. Skill training has been imparted to the unemployed urban poor youth in 74 trades across the sectors like cyber security, accounting, health care, automation, plastic technology, electronics, electrical, Ayurveda Nursing, hospitality, telecom, food processing etc. Under the self-employment programme of DAY-NULM, 1,322 individual micro-enterprises and 245 group enterprises were established and 10,568 of NHGs have availed of NHG linkage loan. Under the ‘social mobilisation and institution development’ component of DAY-NULM, opportunities are given to set up micro enterprises. Through this, 5,410 number of new NHGs are formed, 3,607 numbers of NHGs and 247 Area Development Societies (ADSs) are supported with revolving fund and eight city livelihood centres sanctioned. Financial and physical achievement of DAY-NULM scheme is given in Appendix 12.1.31 and Appendix 12.1.32 respectively. List of District-wise micro enterprises and details of linkage banking NHGs are given in Appendix 12.1.33 and Appendix 12.1.34 respectively.
As part of DAY-NULM, specific interventions were made for Micro enterprises for marketing their goods and services such as identifying nano markets, displaying products of micro enterprises units in the web portal, setting up food kiosks and food fests etc. In all the placement linked skill development schemes, skill development agencies are not able to coordinate the placement in line with the aspirations of the unemployed youth. Many recruiters are willing to absorb
candidates only from Human resources (HR) supply agency. HR supply agencies thus formed a society called ‘Human Arm’ of the girls skilled under DAY-NULM. Annual turnover of the society during last year was ₹1.79 crore employing 187 candidates. The women employees are drawing a monthly salary of ₹14,321 and they have the benefits of PF and ESI.
Kudumbashree
Kudumbashree, the State Poverty Eradication Mission, was formed with the objective of poverty eradication through the empowerment of women. It is an innovative, women based, participatory poverty alleviation programme launched by GoK in 1998 and it has a participation of 43.93 lakh women. Kudumbashree is also the nodal agency for implementing various Centrally Sponsored Programmes namely, Deendayal Antyodaya Yojana–National Rural Livelihood Mission (DAY-NRLM), Deendayal Antyodaya Yojana-National Urban Livelihood Mission (DAY-NULM) and Pradhan Mantri Awas Yojana (Urban). In addition to this, Kudumbashree Mission enters into various activates in the State. The following are the major achievements of Kudumbashree in 2018-19 and 2019-20 (upto September 30, 2019).
For the rehabilitation of the poorest of the poor ‘Asraya’ was scaled up and renamed as ‘Agathirahitha Keralam’ (Destitute Free Kerala). In 2017-18, a survey was conducted for identifying the destitute families through geo-tagging. In 2018-19, 748 Local Governments and in 2019-20 (up to September 30, 2019) 271 Local Governments submitted the DPR and got approval. Altogether ‘Agathirahitha Keralam’ project is getting implemented in 1,019 Local Governments. BUDS institutions for differently abled children functioning under Local Governments are monitored through Kudumbashree machinery. In 2018-19, an amount of ₹25 crore was given to 200 Local Governments for establishing 200 new BUDS Institutions at the rate of ₹12.5 lakh per institutions as the first instalment. 57 and 16 BUDS Institutions were started respectively

535Chapter 12, Local Governments and Decentralised Planning
in 2018-19 and 2019-20 (upto September 30, 2019).
As part of ensuring safe journey of women, Kudumbashree developed a pool of 226 women drivers in 2018-19. The scheme ‘Prathyasha’ mainly aims at the formation of microenterprises among vulnerable women who belongs to the category of mothers of intellectually disabled children, person with disabilities, elderly, victims, widows, dependents of severely illed/bed ridden patients etc. A total of 668 women entrepreneurs got benefitted through this scheme. In 2018-19 and in 2019-20 (upto September 30, 2019), 301 and 100 prathyasha enterprises were formed, in which 194 and 35 are individual and 107 and 65 are group enterprises respectively.
Kudumbashree provides training to the members of Haritha Karma Sena in Local Governments for undertaking waste management activities. Through this, 27,988 women were trained in 2018-19.
One of the major health sector initiatives undertaken by Kudumbashree in 2018-19 was ‘Harsham-Elder Care Project’. By developing a pool of trained care givers in health care sector to meet livelihood requirement is the major goal of this programme. In 2018-19, 231 Kudumbashree members trained to work as care givers and in 2019-20 (upto September 30, 2019) 550 members were trained and 211 got job opportunities.
In order to grab the opportunities in construction sector, Kudumbashree members who are interested in construction activities will be identified, trained and registered in respective Local Governments and will be entrusted with construction projects of Local Governments. In 2019-20 (upto September 30, 2019), 318 constructions groups (251 rural units and 67 urban units), with 2,209 members have formed across the State and started training, by constructing 269 houses. In convergence with various Departments, construction groups have received house construction projects under
LIFE Mission (120 houses), PMAY-U(56 houses), Sneehaveedu (4 houses), PMAY-G (1 house), Asraya (5 houses), Care Kerala (2 houses), P. K. Kalan Family Benefit Scheme of Scheduled Tribes Development Department (12 houses).
Post Flood Activities of Kudumbashree
As part of post flood activity for resurgent Kerala, Kudumashree has started a skill campaign viz; ARISE (Acquiring Resilience and Identity through Sustainable Employment). The aim of this programme is to provide skill training to 50,000 candidates in 10 selected areas. The ten fields are housekeeping, house maid, plumbing, electronic repair, electrical work, day care, agriculture labour, sales, data entry and laundry and ironing. As on September 30, 2019, around 12,000 candidates were trained and 89 Multi Task Teams formed.
Kudumbashree started new funding scheme for enterprise sector namely ‘Sick Micro Enterprise Revival Fund’ (SMERF) as a post flood intervention. An individual sick units can avail ₹50,000 and group can avail ₹2,50,000 as SMERF fund.
Resurgent Kerala Loan Scheme
GoK introduced the ‘Resurgent Kerala Loan (RKL) Scheme’, with an aim of providing interest free loan to the flood affected families to revive livelihoods lost in the floods of 2018. The scheme provides interest free loan upto ₹1 lakh per household (female headed). Assistance is provided for purchasing domestic appliances and attaining livelihood. Interested Kudumbashree members who are the beneficiaries of the immediate flood relief of ₹10,000 are eligible to get bank loan upto ₹1 lakh. The interest of the loan at 9 per cent will be borne by the Government. Upto August 2019, interest free loan of ₹1,680.13 crore was provided to 1.95 lakh people through 28,212 NHGs. District wise details of NHGs that received Resurgent Kerala Loan are given in Appendix 12.1.35.

536 Economic Review 2019, Kerala State Planning Board
Special Livelihood Development Package
The State Planning Board has prepared a Livelihood Development Package to revive livelihoods lost in floods of 2018. As part of it, an amount of ₹75.00 crore was earmarked in the Budget 2019-20 for implementation of “Special Livelihood Development Package” by Kudumbashree.
The package addresses the issues of the flood affected in two ways. First of all to provide immediate financial assistance to the people to revive their livelihood activities like purchase of machinery, marketing etc. and the other to develop new livelihood among the interested people across the State.
An amount of ₹25.00 crore was provided to Kudumbashree as first installment of the Package, of this, ₹7.02 crore was expended (up to December 31, 2019) for the following activities.
• An amount of ₹7.00 crore was earmarked for distributing agricultural tool kit amounting to ₹5,000 for selected 14,000 JLGs and an amount of ₹2.09 crore was expended as on December 2019.
• Assistance of ₹1.42 crore were distributed to 130 flood affected units participated in the SARAS fair.
• An amount of ₹ 1.20 crore was provided to 68 flood affected micro-enterprises units from the ‘Sick Micro Enterprises Revival Fund’. In addition, ₹51.00 lakh was allotted to 16 micro enterprises units as a part of technology upgradation.
• For ensuring livelihood of nearly 4,000 people, skill development training was imparted in ten sectors as part of ARISE (Acquiring Resilience and Identity through Sustainable Employment) programme. For this, multi task teams were started at Block level and an amount of ₹1.17 crore was expended.
• An amount of ₹63.00 lakh was expended as subsidy for 15 Ksheerasagaram units (cow
rearing initiative) and 60 Aadugramam units (goat rearing initiative) in Alappuzha, Ernakulam, Palakkad, Kozhikode and Wayanad Districts.

537Glossary
Basic PriceBasic price, the amount receivable by the producer from the purchaser for a unit of a good or service produced as output minus any tax payable, and plus any subsidy receiv-able, by the producer as a consequence of its production or sale. It excludes any transport charges invoiced seperately by the producer.
Casual labourA person who was casually engaged in others‟ farm or non-farm enterprises (both household and non-house-hold) and, in return, received wages according to the terms of the daily or periodic work contract, was considered as a casual labour.
Comprehensive Health Insurance Scheme (CHIS)It extends to all families other than the BPL families (abso-lute poor) as per the Guidelines of Planning Commission who come under the RSBY.
Consumer Price Index (CPI)Consumer Price Index (CPI) is designed to measure the changes overtime in the level of retail prices of a fixed set of goods and services (consumption basket) consumed by an average family of a defined population group at a particular place. The index number of industrial and agri-cultural workers is referred.
CDSThe current daily activity status for a person is determined on the basis of his/her activity status on each day of the reference week using a priority-cum-major time criterion.
CWSCurrent Weekly Status:Here the activity status is deter-mined with reference to a period of seven days preceding the date of survey. A person who reports having worked at least for one hour on any day during the reference period of one week while pursuing a gainful occupation was deemed to be employed. A person who did not work even for one hour during the reference period of one week but was seeking or available for work was deemed to be unemployed.
Deen Dayal Upadhyay Gram Jyoti Yojana (DDUGJY)
This is a new program launched by Ministry of Power for improving the distribution infrastructure of rural areas and for ensuring 24x7 power supply to all rural house-holds.
Density of PopulationDensity of population is one of the important indices of population concentrations. It is defined as the number of persons per sq. kilometer. The geographical unit is ward, town, district and state.
GLOSSARY

538 Economic Review 2018, Kerala State Planning Board
E- procurementIt is the business to business purchasing of goods and services through the internet.
Gross National Income (GNI)It is GDP less net taxes on production and imports, less compensation of employees less property income payable to the rest of the world plus the corresponding items receivable from the rest of the world (in other words, GDP less primary incomes payable to non-resident units plus primary incomes receivable from non-resident units); an alternative approach to measuring GNI at market prices is as the aggregate value of the balances of gross primary incomes for all sectors; (note that gross national income is identical to gross national product (GNP) as previously used in national accounts generally).
Gross Value Added (GVA)GVA is the measure of the value of goods and services produced in an area, industry or sector of an economy, in economics. In national accounts GVA is output minus inter-mediate consumption; it is a balancing item of the national accounts’ production account.
GVA at Basic pricesGross value added at basic prices is defined as output valued at basic prices less intermediate consumption valued at purchasers’ prices. Here the GVA is known by the price with which the output is valued. From the point of view of the producer, purchasers’ prices for inputs and basic prices for outputs represent the prices actually paid and received. Their use leads to a measure of gross value added that is particularly relevant for the producer.
Infant MortalityDeath of a baby before his or her first birthday is called infant mortality. The infant mortality rate is an estimate of the number of infant deaths for every 1,000 live births.
Labour forcePersons who were either ‘working’ (or employed) or ‘seek-ing or available for work’ (or unemployed) constituted the labour force. Persons with activity status codes 11 – 82 constituted the labour force.
Labour Force Participation Rate (LFPR)Labour force participation rate is the ratio between the labour force and he overall size of their cohort (national population of the same age range).
Literacy RateLiteracy rate is defined as the percentage of population aged 6 years and over who can both read and write with
understanding a short simple statement on his/her every-day life.
National Family Health SurveyThe National Family Health Survey (NFHS) is a large-scale, multi-round survey conducted in a representative sample of households throughout India.
Old age dependency ratio The no. of persons in age group 60 years and more ÷ No. of persons in age group 15-59 years.
Parity IndexParity Index is a relative measure as to the gains or loss to farmers as a consequence of the price fluctuations in the economy. The index is a function of cost of farm cultivation, domestic expenditure and market rate of farm products.
Persons with Disability Act 1995The Act has been enacted under Article 253 of the Consti-tution read with item No. 13 of the Union List (WORD - -1) It effect to the proclamation on the full participation and equality of the persons with disabilities in the Asian & Pa-cific Region and provides for their education, employment, creation of barrier free environment, social security, etc.
PreraksPreraks are the authoritative of the continuing education centres for giving leadership to the informal education and local development activities.
Protection of Children from Sexual Offences Act, 2012An Act to protect children from offences of sexual assault, sexual harassment and pornography and provide for es-tablishment of Special Courts for trial of such offences and for matters connected therewith or incidental thereto.
Rashtriya Swastya Bima Yojana (RSBY) It is a Health Insurance Scheme launched by Union Government for BPL workers as defined by the Planning Commission and their families in the unorganized sector.
Retail PriceRetail Price of a commodity is defined as the price which the ultimate consumer pays for relatively small transac-tions of the commodity.
Sex RatioThe Sex ratio is one of the basic demographic character-istics of the population. It is defined as the number of females per 1000 males. The sex ratio of the population is affected by the differentials in the mortality conditions

539Glossary
of males and females, sex selective migration and the sex ratio at birth.
UDAY (Ujwal DISCOM Assurance Yojana)UDAY aims at the financial turnaround and operational revival of debt ridden Power Distribution Companies (DISCOMs) and ensures a sustainable permanent solution to the problem
UPSUsual Principal Status: Here the activity status is deter-mined with reference to a relatively longer period during a reference period of 365 days. Unemployment Rate as per this method indicates the numerical magnitude of the persons unemployed for a relatively longer period. Thus it is an indicator of chronically unemployed.
UPSSUsual Principal and Subsidiary Status: Unemployment Rate as per this method also indicates the numerical mag-nitude of the persons unemployed for a relatively longer period during a reference period of 365 days. However, here the number of unemployed is arrived at excluding those employed in a subsidiary capacity during the refer-ence period. The number arrived as per this method will be lower than the UPS approach as some persons catego-rized as unemployed according to the UPS approach might be working in a subsidiary capacity and this persons are excluded in the UPSS method.
Wholesale Price Index (WPI)Wholesale Price Index measures the average change overtime in the wholesale prices of 17 important agricul-tural commodities produced and transacted in the state (Kerala) with the agricultural year 1952-53 as the base. These indices are computed every month. Weights are assigned to the commodities in proportion to the value of production to make the index fully representative.

541Abbreviations
CBSE: Central Board of Secondary Education
CCRC: Cochin Cancer Research Centre
CDC: Child Development Centre
C-DIT: Centre for Development of Imaging Technology
CDS: Centre for Development Studies
CEPCI: Cashew Export Promotion Council of India
CERT: Computer Emergency Response Team
CFPI: Consumer Food Price Index
CFSC: Common Facility Service Centre
CHIAK: Comprehensive Health Insurance Agency
CHIS: Comprehensive Health Insurance Scheme
CIAL: Cochin International Airport Limited
CMDRF: Chief Minister’s Distress Relief Fund
CMRI: Critical Mineral Research Institute
Coirfed: The Kerala State Co-operative Coir Marketing Federation Ltd.
CPC: Centralized Processing Center
CPI: Consumer Price Index
CPSEs: Central Public Sector Enterprises
CRDP: Capital Regional Development Project
CSO: Central Statistical Organisation
CSS: Centrally Sponsored Scheme
DBFOT: Design, Built, Finance, Operate and Transfer
AABY: Aam Admi Bima Yojana
AAY: Anthyodaya Anna Yojana
ABS: Access and Benefit Sharing
AIBP: Accelerated Irrigation Benefit Programme
AMRUT: Atal Mission for Rejuvenation and Urban Trans formation
ANERT: Agency for Non-conventional Energy and Rural Technology
ANP: Annapoorna Scheme
APL: Above Poverty Line
APTS: Anti Power Theft Squad
ASAP: Additional Skill Acquisition Programme
ASCs: Agro Service Centres
ASEP: Additional Skill Enhancement Programme
ATMA: Agriculture Technology Management Agency AYUSH: Ayurveda, Yoga and Naturopathy, Siddha, Unani and Homoeopathy
BDA: Bamboo Development Agency
BE: Budget Estimate
BMC: Biodiversity Management Committees
BPL: Below Poverty Line
BSNL: Bharat Sanchar Nigam Limited
CAPEX: Kerala State Cashew Workers Apex Co-Operative Society
ABBREVIATIONS

542 Economic Review 2018, Kerala State Planning Board
DCB: District Co-operative Bank
DDU GKY: Deen Dayal Upadhyaya Grameen Kaushalya Yojana
DES: Directorate of Economics and Statistics
DGE&T: Director General of Employment and Training
DIC: Directrorate of Industries and Commerce
DMRC: Delhi Metro Rail Corporation
DRIQ Board: Design Research, Investigation and Quality Control Board
EDCs: Eco Development Committees
EMC: Energy Management Centre
EPC: Engineering Procurement and Construction
ESI: Employees’ State Insurance
ESS: Entrepreneur Support Scheme
FAO: Food and Agriculture Organization
FC: Finance Commission
FCI: Food Corporation of India
FOMIL: Foam Mattings India Limited
FSI : Forest Survey of India
GATE: Graduate Aptitude Test in Engineering
GCDA: Greater Cochin Development Authority
GOI: Government of India
GST: Goods And Service Tax
GSVA: Gross State Value Added
GVA : Gross Value Added
HDCK: Handicrafts Development Corporation of Kerala
HDI : Human Development Index
HS: High School
HSC: Higher Secondary Course PLFS
HUDCO: Housing and Urban Development Corporation
HVDC: High Voltage Direct Current
ICDS: Integrated Child Development Services
ICFOSS: International Centre for Free And Open Source Software
ICPS: Integrated Child Protection Scheme
ICSE: Indian Certificate of Secondary Education
IIHT: Indian Institute of Handloom Technology
IIITM-K : Indian Institute of Information Technology and Management Kerala
IIT: Indian Institute of Technology
ILO: International Labour Organisation
IMD: Indian Meteorological Department
IMIS : Integrated Management Information System
IPDS: Integrated Power Development Scheme
ISM: Interstate Migrant, Indian System of Medicine
IT: Information Technology
ITI: Industrial Training Institutes
IUCN: International Union for Conservation of Nature
JJ: Juvenile Justice
JJM: JalJeevan Mission
JLGs: Joint Liability Groups
JNNURM: Jawaharlal Nehru National Urban Renewal Mission
JNPT: Jawaharlal Nehru Port Trust
JNTBGRI: Jawaharlal Nehru Tropical Botanic Garden and Research Institute
KADCO: Kerala Artisans Development Corporation
KASE: Kerala Academy for Skills Excellence
KAU: Kerala Agricultural University
KCC : Kissan Credit Card
KCHR: Kerala Council for Historical Research
KCMMF: Kerala Co-operative Milk Marketing Federation
KESRU: Kerala Self Employment Scheme for the Registered Unemployed
KFC: Kerala Financial Corporation
K-FON: Kerala Fibre Optic Network
KFRI: Kerala Forest Research Institute
KFWFB : Kerala Fisherman’s Welfare Fund Board
KHRI: Kerela Highway Research Institute
KIIFB: Kerala Infrastructure Investment Fund Board
KILA: Kerala Institute of Local Administration
KILE: Kerala Institute of Labour and Employment
KINFRA: Kerala Industrial Infrastructure Development Corporation
KITTS: Kerala Institute of Tourism and Travel Studies
KLDB : Kerala Livestock Development Board
KRDCL: Kerala Rail Development Corporation
KRFB: Kerala Road Fund Board
KSBB: Kerala State Biodiversity Board
KSBCDC: Kerala State Backward Classes Development Corporation
KSBM: Kerala State Bamboo Mission
KSCADC: Kerala state coastal Area Development Corporation

543Abbreviations
KSCARDB: Kerala State Co-operative Agriculture and Rural Development Bank
KSCC: Kerala State Coir Corporation
KSCDC: Kerala State Cashew Development Corpora-
tion
KSCSTE: Kerala State Council for Science, Technology and Environment
KSDI: Kerala State Spatial Data Infrastructure
KSEBL: Kerala State Electricity Board Limited
KSERC: Kerala State Electricity RegulatoryCommission
KSIDC: Kerala State Industrial Development Corporation
KSINC: Kerala Shipping and Inland Navigation Corporation Limited
KSITIl: Kerala State Information Technology Infrastructure ltd
KSITM: Kerala State Information Technology Mission
KSoM: Kerala School of Mathematics
KSPCB: Kerala State Pollution Control Board
KSRRDA : Kerala State Rural Roads Development Agency
KSRTC: Kerala State Road Transport Corporation
KSSM: Kerala Social Security Mission
KSUDP: Kerala Sustainable Urban Development Project
KSUM: Kerala Startup Mission
KSWAN: Kerala State Wide Area Network
LED: Light Emission Diode
LFPR: Labour Force Participation Rate
LG: Local Governments
LIFE: Livelihood, Inclusion and Financial Empowerment
LPG: Liquefied Petroleum Gas
LSGs: Local Self Governments
LTRCF: Long Term Rural Credit Fund
MAH: Major Accident Hazard
MBGIPS: Malabar Botanical Garden and Institute of Plant Sciences
MGNREGS: Mahatma Gandhi National Rural Employment Guarantee Scheme
MIDH: Mission for Integrated Development of Horticulture
MoFPI: Minsitry of Food Processing Industries
MSME: Micro, Small and Medium Enterprises
MT: Metric Tonne
MVIP: Muvattupuzha Valley Irrigation Project
NABARD : National Bank for Agriculture and Rural Development
NATPAC: National Transportation Planning And Research Centre
NCRMI: The National Coir Research and Management Institute
NCVT: National Council for Vocational Training
NFHS: National Family Health Survey
NFSA: National Food Security Act
NGOs: Non-government Organizations
NHAI: National Highways Authority of India
NNI: Net National Income
NORKA: Non Resident Keralite Affairs
NRIs: Non Resident Indians
NRKs: Non Resident Keralites
NRLM : National Rural Livelihood Mission
NSS: National Sample Survey
NSSO: National Sample Survey Office
NUALS: National University of Advanced Legal Studies
NULM: National Urban Livelihood Mission
ORC: Our Responsibility to Children Kerala
OTR: Own Tax Revenue
PACS: Primary Agricultural Co-operative Societies
PDNA: Post Disaster Needs Assessment
PDS: Public Distribution System
PF : Protected Forests
PLFS: Periodic labour Force Survey
PMAY : Pradhan Mantri Awaas Yojana
PMAYG: Pradhan Mantri Awaas Yojana Gramin
PMAY-U: Pradhan Mantri Awas Yojana – Urban
PMGSY : Pradhan Mantri Gram Sadak Yojana
PMSSY: Pradhan Manthri Swasthya Suraksha Yojana
POCSO Act: Protection of Children from Sexual Offences Act
PPA: Power Purchase Agreement
PPP: Public Private Partnership
PSU: Public Sector Undertakings
PWD: Public Works Department
PwDs: Persons with Disabilities
RBDCK: Roads and Bridges Development Corporation of Kerala
RCC: Regional Cancer Centre
RIAB: Restructuring and Internal Audit Board
RICK: Road Infrastructure Company Kerala

544 Economic Review 2018, Kerala State Planning Board
RIDF: Rural Infrastructure Development Fund
RKDP: Rebuild Kerala Development Programme
RKVY : Rashtriya Krishi Vikas Yojana
RRB : Regional Rural Bank
RSBY: Rashtriya Swasthya Beema Yojana
RSPM: Respirable Suspended Particulate Matter
SAF: Society for Assistance to Fisherwomen
SAPCC: State Action Plan on Climate Change
SBM: Swachh Bharat Mission
SC/ST: Scheduled Caste/Scheduled Tribes
SCM: Smart Cities Mission
SDG: Sustainable Development Goals
SECC: Socio Economic and Caste Census
SECWAN: Secretariat Wide Area Network
SHGs: Self Help Groups
SHM: State Horticulture Mission
SID: State Initiatives on Disabilities
SI-MET: State Institute of Medical Education and Technology
SJD: Social Justice Department
SLBC : State Level Bankers Committee
SLBP : Special Livestock Breeding Programme
SONTR: State’s Own Non Tax Revenue
SOTR: State’s Own Tax Revenue
SPB: State Planning Board
SSLC: Secondary School Leaving Certificate
SUIT: Skill Updating Institute for Industrial Training
Supplyco: Kerala State Civil Supplies Corporation
SWTD: State Water Transport Department
TTI: Teacher Training Institute
UAM: Udyog Aadhar Memorandum
UNDP: United Nations Development Programme
UNICEF: United Nations International Children’s Emergency Fund
UR: Unemployment Rate
UT: Union Territory
VFPCK: Vegetable and Fruit Promotion Council Kerala
VGF: Viability Gap Funding
VHSE: Vocational Higher Secondary Education
WPI: Wholesale Price Index
WPR: Worker Population Ratio