Efficacy of simple viability models in ecological risk assessment: Does density dependence matter?
14
328 Ecology, 85(2), 2004, pp. 328–341 2004 by the Ecological Society of America EFFICACY OF SIMPLE VIABILITY MODELS IN ECOLOGICAL RISK ASSESSMENT: DOES DENSITY DEPENDENCE MATTER? JOHN L. SABO, 1,3 ELIZABETH E. HOLMES, 1 AND PETER KAREIVA 2 1 Northwest Fisheries Science Center, National Marine Fisheries Service, 2725 Montlake Blvd. E., Seattle, Washington 98115 USA 2 The Nature Conservancy of Washington, 217 Pine Street, Suite 1100, Seattle, Washington 98101 USA Abstract. One commonly used PVA (population viability analysis) approach applies a diffusion approximation (DA) of population growth to time series of abundance data to estimate population parameters and various metrics of extinction risk. The simplest versions of this PVA assume density-independent population growth, an assumption that is com- monly called into question for populations experiencing self-limitation. Using time series data generated from simulations of populations limited by three commonly used forms of density dependence (ceiling, Beverton-Holt, and Ricker) we asked the question: ‘‘When do simple density-independent PVA models provide useful guidelines for prioritizing ex- tinction risk despite density-dependence inherent in the underlying real populations?’’ Simple DA methods severely underestimated maximum growth rates ( max ) used to generate time series data for all three forms of density dependence. These methods also underestimated the intrinsic environmental variability in growth rates, or process error ( 2 ), for the ceiling model, but overestimated this parameter for the Beverton-Holt and Ricker models. Despite misestimation of the intrinsic parameters, the estimated probabilities of 50% and 75% declines were highly correlated with the observed probabilities for popu- lations growing with a ceiling (coefficients of correlation, or R 2 0.87–0.93). DA methods were less accurate for populations exhibiting more complex forms of density dependence (R 2 0.61–0.79). Although correlations between observed and estimated risks were high, bias (e.g., over- and underestimation) was extensive. Estimated probabilities of 50% declines were typically much lower (overly optimistic) than observed probabilities of the same decline. By contrast, accuracy increased substantially for predictions of 75% decline, and the ‘‘optimistic’’ bias was replaced by conservative bias (overestimates of risk). Regardless of the form of density dependence, estimates of risk were least accurate when populations were recovering rapidly but were much more accurate when most needed by conservation practitioners: when the population fluctuated near its carrying capacity, recovered slowly to this abundance level, or declined toward extinction. Finally, when we classified risk in broad categories (e.g., extremely low, low, moderate, high, and extremely high), DA methods correctly or conservatively estimated the risk of a 75% decline for 85% of the parameter combinations, regardless of the form of density dependence followed by the real population. Key words: density dependence; diffusion approximation; extinction risk; population viability analysis; time series. INTRODUCTION The limitations and challenges of population viabil- ity analysis (PVA) are widely appreciated (Boyce 1992, Reed et al. 2002). Among the challenges most exten- sively discussed in the literature are the difficulty of estimating parameters when data are sparse (Dennis and Taper 1994, Taylor 1995), the bias introduced by sampling error on estimates of process error (Meir and Fagan 1999, Holmes 2001, De Valpine and Hastings 2002), difficulty in separating demographic and envi- ronmental sources of stochasticity from count data (En- Manuscript received 22 January 2003; revised 15 May 2003; accepted 30 May 2003. Corresponding Editor: M. G. Neubert. 3 Present address: School of Life Sciences, Arizona State University, P.O. Box 874501 Tempe, Arizona 85287-4501 USA. E-mail: [email protected] gen et al. 1998, Morris and Doak 2002), and the ex- traordinarily large confidence intervals around esti- mates of risk (Ludwig 1999, Fieberg and Ellner 2000). However, most of these problems stem from insuffi- cient or imprecise observation. A more fundamental challenge to PVA is that bio- logical populations change through time according to processes that are rarely accurately captured by any population viability model. These processes include nonstationarity in environmental conditions (Beissin- ger 1995, Zeng et al. 1998, CRI 2000), individual dif- ferences in performance (Fox and Kendall 2002, Ken- dall and Fox 2002), and other forms of demographic stochasticity (Lande 1993) and self-regulation through density dependence (Dennis and Taper 1994, Foley 1994, Dennis et al. 2001). Of these complexities in population dynamics, density dependence has been
-
Upload
independent -
Category
Documents
-
view
2 -
download
0
Transcript of Efficacy of simple viability models in ecological risk assessment: Does density dependence matter?
328
Ecology, 85(2), 2004, pp. 328–341� 2004 by the Ecological Society of America
EFFICACY OF SIMPLE VIABILITY MODELS IN ECOLOGICAL RISKASSESSMENT: DOES DENSITY DEPENDENCE MATTER?
JOHN L. SABO,1,3 ELIZABETH E. HOLMES,1 AND PETER KAREIVA2
1Northwest Fisheries Science Center, National Marine Fisheries Service, 2725 Montlake Blvd. E.,Seattle, Washington 98115 USA
2The Nature Conservancy of Washington, 217 Pine Street, Suite 1100, Seattle, Washington 98101 USA
Abstract. One commonly used PVA (population viability analysis) approach appliesa diffusion approximation (DA) of population growth to time series of abundance data toestimate population parameters and various metrics of extinction risk. The simplest versionsof this PVA assume density-independent population growth, an assumption that is com-monly called into question for populations experiencing self-limitation. Using time seriesdata generated from simulations of populations limited by three commonly used forms ofdensity dependence (ceiling, Beverton-Holt, and Ricker) we asked the question: ‘‘Whendo simple density-independent PVA models provide useful guidelines for prioritizing ex-tinction risk despite density-dependence inherent in the underlying real populations?’’
Simple DA methods severely underestimated maximum growth rates (�max) used togenerate time series data for all three forms of density dependence. These methods alsounderestimated the intrinsic environmental variability in growth rates, or process error (�2),for the ceiling model, but overestimated this parameter for the Beverton-Holt and Rickermodels. Despite misestimation of the intrinsic parameters, the estimated probabilities of50% and 75% declines were highly correlated with the observed probabilities for popu-lations growing with a ceiling (coefficients of correlation, or R2 � 0.87–0.93). DA methodswere less accurate for populations exhibiting more complex forms of density dependence(R2 � 0.61–0.79). Although correlations between observed and estimated risks were high,bias (e.g., over- and underestimation) was extensive. Estimated probabilities of 50% declineswere typically much lower (overly optimistic) than observed probabilities of the samedecline. By contrast, accuracy increased substantially for predictions of 75% decline, andthe ‘‘optimistic’’ bias was replaced by conservative bias (overestimates of risk).
Regardless of the form of density dependence, estimates of risk were least accuratewhen populations were recovering rapidly but were much more accurate when most neededby conservation practitioners: when the population fluctuated near its carrying capacity,recovered slowly to this abundance level, or declined toward extinction. Finally, when weclassified risk in broad categories (e.g., extremely low, low, moderate, high, and extremelyhigh), DA methods correctly or conservatively estimated the risk of a 75% decline for�85% of the parameter combinations, regardless of the form of density dependence followedby the real population.
Key words: density dependence; diffusion approximation; extinction risk; population viabilityanalysis; time series.
INTRODUCTION
The limitations and challenges of population viabil-ity analysis (PVA) are widely appreciated (Boyce 1992,Reed et al. 2002). Among the challenges most exten-sively discussed in the literature are the difficulty ofestimating parameters when data are sparse (Dennisand Taper 1994, Taylor 1995), the bias introduced bysampling error on estimates of process error (Meir andFagan 1999, Holmes 2001, De Valpine and Hastings2002), difficulty in separating demographic and envi-ronmental sources of stochasticity from count data (En-
Manuscript received 22 January 2003; revised 15 May 2003;accepted 30 May 2003. Corresponding Editor: M. G. Neubert.
3 Present address: School of Life Sciences, Arizona StateUniversity, P.O. Box 874501 Tempe, Arizona 85287-4501USA. E-mail: [email protected]
gen et al. 1998, Morris and Doak 2002), and the ex-traordinarily large confidence intervals around esti-mates of risk (Ludwig 1999, Fieberg and Ellner 2000).However, most of these problems stem from insuffi-cient or imprecise observation.
A more fundamental challenge to PVA is that bio-logical populations change through time according toprocesses that are rarely accurately captured by anypopulation viability model. These processes includenonstationarity in environmental conditions (Beissin-ger 1995, Zeng et al. 1998, CRI 2000), individual dif-ferences in performance (Fox and Kendall 2002, Ken-dall and Fox 2002), and other forms of demographicstochasticity (Lande 1993) and self-regulation throughdensity dependence (Dennis and Taper 1994, Foley1994, Dennis et al. 2001). Of these complexities inpopulation dynamics, density dependence has been
February 2004 329FORECASTING RISK WITH SIMPLE MODELS
more frequently reported in empirical studies (e.g.,Gaston 1988, Stacey and Taper 1992, Kemp and Dennis1993, Dennis and Taper 1994, Foley 1994). In thispaper we explore whether or not a simple density-in-dependent model for population growth can summarizeuseful features of a density-dependent population pro-cess in a way that might inform conservation prioritysetting.
The simple model that we choose to analyze is aPVA based on a diffusion approximation of exponentialpopulation growth with environmental stochasticity(Lande and Orzack 1988, Dennis et al. 1991). Thisparticular diffusion approximation model (hereafter,‘‘simple DA model’’) yields maximum likelihood es-timates of the mean population growth rate (�) and thevariance in this rate, or ‘‘process error’’ (�2), via simplelinear regression (Dennis et al. 1991). These parameterscan then be used to calculate the long-term populationgrowth rate, �, and a variety of risk metrics such asthe mean time to extinction and the probability of de-cline to critical threshold levels.
Despite its simplicity and ease of use (e.g., Morriset al. 1999, Morris and Doak 2002), the simple DAmodel ignores density dependence, a potentially im-portant population dynamic for a variety of threatenedspecies (e.g., Stacey and Taper 1992, Foley 1994). Thelack of density dependence in DA risk estimation hasspurred considerable recent interest in developing moresophisticated, nonlinear models to estimate density-de-pendent population parameters (Dennis and Taper1994, Foley 1994, Constantino et al. 1997, Dennis etal. 2001, De Valpine and Hastings 2002). With highernumbers of parameters to estimate, however, these ad-vanced methods may require more data (longer timeseries) to achieve the same precision as simpler meth-ods (Hilborn and Mangel 1997). Moreover, even whendata are plentiful, density-dependent parameter esti-mation is much more numerically intensive than thesimple regression model required to estimate param-eters and risk using the DA method (Dennis et al. 2001,De Valpine and Hastings 2002).
Ultimately, advances in the ease of application ofnonlinear stochastic models may provide practitionerswith tools for predicting extinction risk that are moreaccurate, and as accessible as the linear (DA) model.Until these advances have been made, it is critical toquantify the accuracy of linear models at estimatingrisk for populations that experience nonlinear growth,not only for future analyses, but also for evaluatingprior analyses using simple viability models assumingdensity independence. Finally, even after new advanc-es, nonlinear models still require more data to achievethe same precision as linear models with fewer param-eters. It will be important to identify the types of pop-ulations for which linear models yield accurate riskestimates despite nonlinear population growth. Whenaccuracy is not sacrificed, models with fewer param-eters to estimate should be preferred. Thus, the goal of
this analysis is to quantify the accuracy of the simpleDA model at estimating risk for populations experi-encing various forms of density dependence.
Specifically, we address three questions about theuse of a simple DA model in risk classification. (1)How poor are extinction risk estimates generated fromthe simple DA model when populations experiencedensity dependence? (2) For which types of popula-tions (e.g., small but recovering vs. steadily declining)are estimates of risk from the simple DA model likelyto be most affected by density dependence? (3) Cansimple DA methods accurately rank populations inmore general categories of risk (e.g., high, medium,low) despite density-dependent growth in real popu-lations?
METHODS
To assess whether the simple DA model could stillpredict relative risk for populations experiencing den-sity dependence, we generated 40-year time series ofabundance data according to three different density-dependent processes and then estimated the parametersfrom the first half of the simulated data, assuming asimple density-independent DA model. From estimatedparameters, we predicted the expected trajectory overthe next 20 years and compared it to the trajectoryactually observed. Our results are best interpreted bycomparison to a control, in which we apply the simpleDA model to time series generated according to ex-ponential growth with lognormal process error. In thiscase, the simulated data meet all of the limiting as-sumptions of the simple DA model (Morris and Doak2002), and we would expect the predicted and observeddata to match. In each case, we compare the outcomefrom the real model (i.e., the model used to generatetime series data) to the fate of the same populations aspredicted by simple DA methods.
Models used to generate time series data
We used time series of abundance data generated byfour discrete-time models of population growth: a den-sity-independent model and three density-dependentmodels. In each case we added environmental vari-ability—or process error—as a lognormal variate (fol-lowing Dennis et al. 2001) and assumed no observationerror. The density-independent model was (followingDennis et al. 1991):
2N � N exp(� � z) z � Normal(0, � ) (1)t�1 t
where Nt is the population size at time t, � is the meanannual growth rate, and z is the process error associatedwith this rate and has variance �2. Time series datafrom this simulation model meet the assumptions forthe simple DA viability model (Morris and Doak 2002).
By contrast, time series data from populations ex-periencing density dependence violate one key as-sumption of simple DA methods: that populationgrowth is density independent. The three density-de-
330 JOHN L. SABO ET AL. Ecology, Vol. 85, No. 2
pendent models that we used to generate simulated datawere: the ceiling (Lande 1993, Akcakaya et al. 1999),Beverton-Holt (Beverton and Holt 1957, 1993, Ricker1975), and Ricker (Ricker 1954, 1975) models. Pop-ulations growing according to a ceiling model expe-rience density-independent dynamics below an upperthreshold abundance, or ceiling, K, but do not exceedthis abundance level, such that
N exp(� � z) for N exp(� � z) � Kt c t cN � (2)t�1 �K for N exp(� � z) � Kt c
where �c is the maximum growth rate achieved onlywhen the population size is lower than K. The ceilingmodel has been used extensively in conservation sci-ence to represent density-dependent population growth(Lande 1993, Middleton et al. 1995, Meir and Fagan1999) and is one of several forms of density depen-dence available in packaged PVA software (e.g., RA-MAS Space; Akcakaya et al. 1999). Models with dy-namics similar to the ceiling model (e.g., ‘‘hockeystick’’ models) also have been advocated in fisheriesscience to describe the population growth of a varietyof commercial fish species (Barrowman and Myers2000, Bradford et al. 2000).
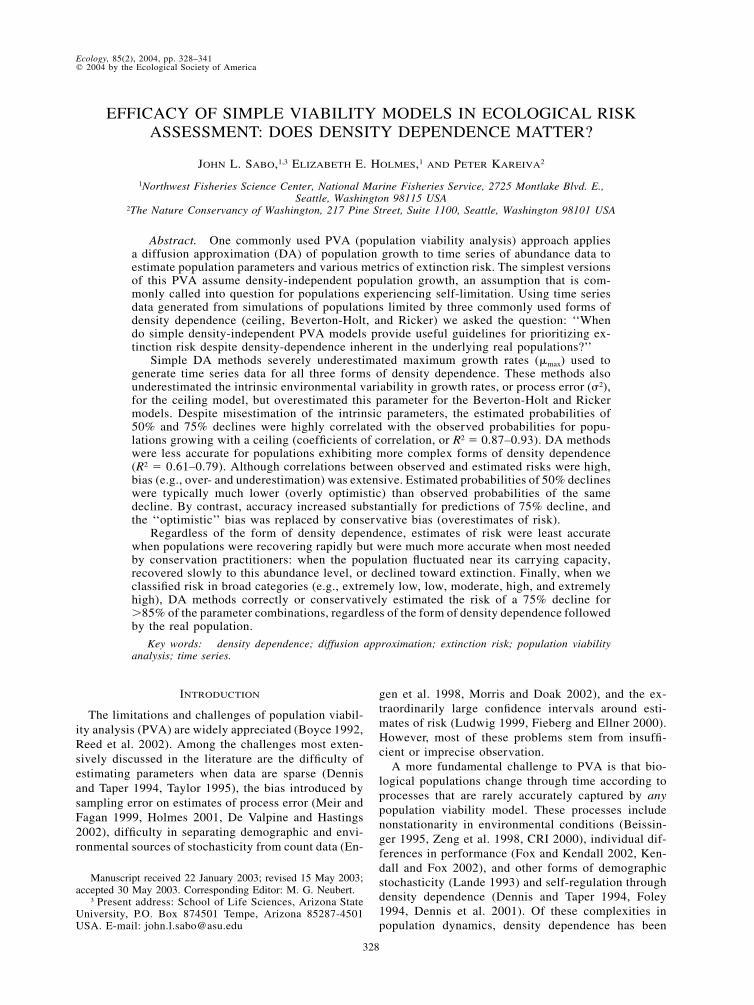
Beverton-Holt and Ricker models are more tradi-tional representations of density dependence in fish-eries stock assessment models (Hilborn and Walters1992, Burgman et al. 1993, Getz 1996, Pascual et al.1997, DeValpine and Hastings 2002). These modelsalso have been incorporated into standard PVA soft-ware, e.g., RAMAS GIS 3.0 and RAMAS Metapop 3.0(Applied Biomathematics 1998, 2001) to representdensity dependence resulting from either contest (Bev-erton-Holt) or scramble (Ricker) competition (Akcak-aya et al. 1999). These models differ from the ceilingmodel in two ways. First, the effects of density on thepopulation growth rate occur over all abundance levels(not simply those greater than K). Second, in Rickerand Beverton-Holt models, high values of process errormay force the population above its carrying capacity(K), leading to strong negative density-dependent feed-back and, consequently, abundance levels much lowerthan K in the following year. This ‘‘overcompensation’’for good years does not occur in time series generatedby a ceiling model because the population is alwaysreset to K during these good years (Fig. 1). Third, theRicker formulation of density dependence producesdamped oscillations (for 1 � � � 2) and sustained two-period oscillations (for � � 2) even in the absence ofprocess error (Fig. 1). Thus, at high growth rates, pop-ulations experiencing Ricker-type density dependencecan exhibit variability from both intrinsic (determin-istic) and extrinsic (stochastic) sources. Overcompen-sation and intrinsic cycling occur independent of pro-cess error and, therefore, should seriously corrupt riskestimates from simple DA methods that assume thatall variability arises from interannual process vari-ability (e.g., environmental stochasticity).
The Beverton-Holt model can be written as
N � exp(� � z) K N /(exp(� ) N � N � K)t�1 b t b t t (3)
where �b is the maximum growth rate experienced bypopulations growing according to Beverton-Holt dy-namics, and all other variables are defined as in Eq. 2.The Ricker model is expressed as
N � N exp(� � bN � z)t�1 t r t (4)
where �r is the maximum population growth rate forpopulations growing according to Ricker dynamics,and b � ��r�/K is the effect of density on this maximumgrowth rate. For the parameter b, the absolute value of�r is used, rather than simply �r, common in moretraditional versions of the Ricker model. The traditionalformulation produces biologically unrealistic behaviorfor �r � 0 (specifically, bNt � 0, and Nt�1/Nt higherfor populations closer to K). Because we were inter-ested in evaluating the performance of the simple DAin evaluating risk for declining populations (i.e., �r �0), we use b � ��r �/K to circumvent this pathologicalbehavior. Finally, note that the Ricker model as ex-pressed in Eq. 4 is identical to logistic models morecommonly used to represent density dependence fornoncommercial species (e.g., Stacey and Taper 1992).
We generated time series for each model using valuesof �max (e.g., �c, �b, or �r) between �0.5 and 2.0 (in-crements of 0.1), and �2 between 0 and 2.0 (incrementsof 0.1). Populations with positive underlying dynamics(increasing) have �max � 0 and declining populationshave �max � 0. In the density-independent model, allvalues of � and �2 were replicated across four startingpopulation sizes (N0 � 10, 100, 1000, and 10 000). Indensity-dependent models, we used four values of K(100, 1000, 10 000, and 100 000) and six values of N0,corresponding to 1, 10, 25, 50, 75, and 100% of theceiling or carrying capacity. This was done to assessthe contribution of both ceiling height, K, and the ratioof the starting population size to the ceiling, N0/K, toerror in risk assessment associated with density de-pendence. In all cases, parameter values used in sim-ulation models were chosen to encompass the range ofvalues estimated from a variety of representative ani-mal species (Table 1) and a range of possible modelbehavior (e.g., damped oscillations in the Ricker mod-el). For all models, we generated 1000 40-year sto-chastic realizations for each parameter combination(2080 and 12 480 parameter combinations for density-independent and density-dependent models, respec-tively).
Comparison of DA estimates for exponential vs.density-dependent processes
We divided the time series into a fitting interval(years 1–20) and an observation interval (years 21–40). We then estimated the population growth rate (�)and process error (�2) during the fitting interval usingthe simple DA model (Dennis et al. 1991, Morris et al.
February 2004 331FORECASTING RISK WITH SIMPLE MODELS
FIG. 1. Sample time series showing overcompensation (spikes in left panels) for Beverton-Holt and Ricker (but not Ceiling)models and intrinsic cycling (coupled with low levels of process error) in the Ricker (but not Beverton-Holt or Ceiling) models(right panels). Values used for the parameters �max and �2 were identical for each model but differ between columns of panels.
1999). Using our estimates of these demographic pa-rameters, we then estimated the probability of a pop-ulation declining to two threshold abundance levels(‘‘quasi-extinction thresholds’’) over the observationinterval. These thresholds were 50% ( ) and 75%P50
( ) of the population size at the end of the fittingP75
interval. Quasi-extinction thresholds are relativelystraightforward to calculate using � and �2, and theyare one of several metrics currently used to identifypopulations and species of special concern by the IUCN(2000).
Several authors provide analytical solutions for P50
and (e.g., Lande and Orzack 1988, Dennis et al.P75
1991) based on DA estimates of � and �2; however,these solutions are for a process that is observed con-tinuously. In our simulated data, we observe the pro-cess only at discrete, one-year intervals. Probabilitiesof a given decline for a process observed at discreteintervals are lower than analytical solutions for thesame probabilities for continuous observations (e.g.,Lande and Orzack 1988, Dennis et al. 1991). Analyticalsolutions for and for one discrete observationP P50 75
in the future (e.g., year 21) are relatively straightfor-
ward (E. Holmes, unpublished data), but become muchless tractable for multiple observations. To circumventthis problem, we calculate and numerically us-P P50 75
ing the DA estimates of growth parameters (e.g., viaMonte Carlo methods).
To quantify the efficacy of simple DA methods atpredicting population growth parameters for the den-sity-dependent processes, we plotted the true values ofthe vital rates—those used to generate initial time seriesdata (�max, and �2)—against the median values of theDA estimates of these parameters (� and �2) fromeach 1000 time series replicates for each parametercombination. Similarly, to evaluate the effect of densitydependence on predictions of 50% and 75% declines,we compared median estimates of these probabilities( and ) to the observed frequencies of these de-P P50 75
clines (P50 and P75) over the observation intervals(years 21–40) of the original 40-year time series. Thesecomparisons were done for all four models. Throughoutthis paper, we compare the efficacy of DA methods atestimating maximum growth rates in populations gen-erated by simulation models in which maximum ratesare always achieved (density-independent process) or
332 JOHN L. SABO ET AL. Ecology, Vol. 85, No. 2
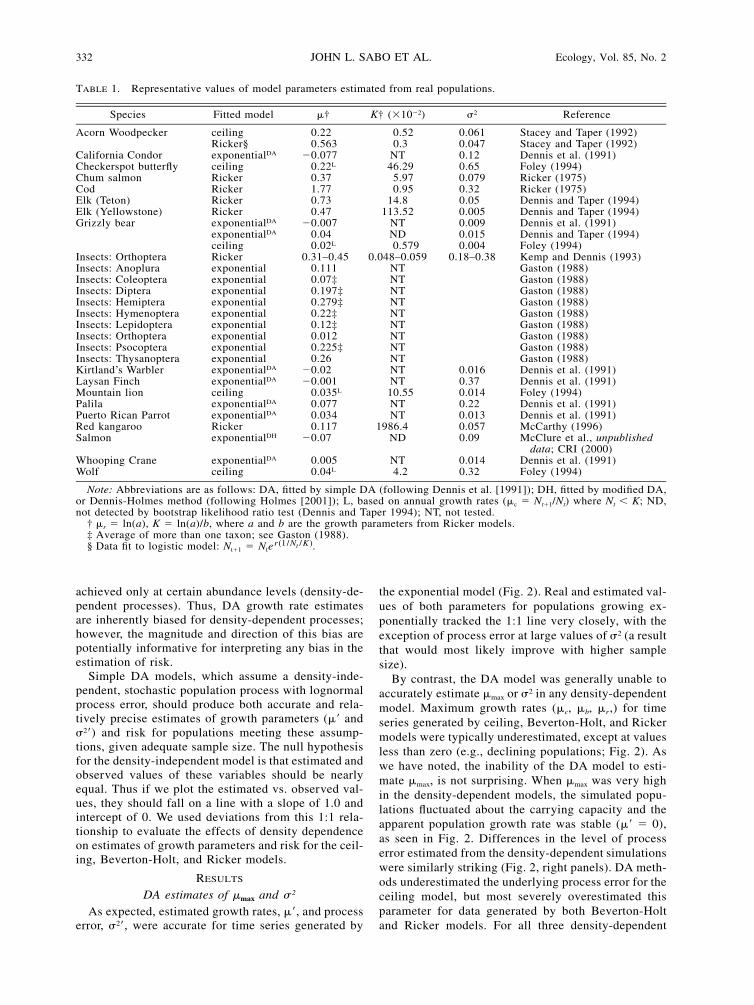
TABLE 1. Representative values of model parameters estimated from real populations.
Species Fitted model �† K† (10�2) �2 Reference
Acorn Woodpecker
California CondorCheckerspot butterflyChum salmon
ceilingRicker§exponentialDA
ceilingRicker
0.220.563
�0.0770.22L
0.37
0.520.3
NT46.29
5.97
0.0610.0470.120.650.079
Stacey and Taper (1992)Stacey and Taper (1992)Dennis et al. (1991)Foley (1994)Ricker (1975)
CodElk (Teton)Elk (Yellowstone)Grizzly bear
RickerRickerRickerexponentialDA
exponentialDA
ceiling
1.770.730.47
�0.0070.040.02L
0.9514.8
113.52NTND0.579
0.320.050.0050.0090.0150.004
Ricker (1975)Dennis and Taper (1994)Dennis and Taper (1994)Dennis et al. (1991)Dennis and Taper (1994)Foley (1994)
Insects: OrthopteraInsects: AnopluraInsects: ColeopteraInsects: DipteraInsects: HemipteraInsects: HymenopteraInsects: Lepidoptera
Rickerexponentialexponentialexponentialexponentialexponentialexponential
0.31–0.450.1110.07‡0.197‡0.279‡0.22‡0.12‡
0.048–0.059NTNTNTNTNTNT
0.18–0.38 Kemp and Dennis (1993)Gaston (1988)Gaston (1988)Gaston (1988)Gaston (1988)Gaston (1988)Gaston (1988)
Insects: OrthopteraInsects: PsocopteraInsects: ThysanopteraKirtland’s WarblerLaysan Finch
exponentialexponentialexponentialexponentialDA
exponentialDA
0.0120.225‡0.26
�0.02�0.001
NTNTNTNTNT
0.0160.37
Gaston (1988)Gaston (1988)Gaston (1988)Dennis et al. (1991)Dennis et al. (1991)
Mountain lionPalilaPuerto Rican ParrotRed kangarooSalmon
Whooping CraneWolf
ceilingexponentialDA
exponentialDA
RickerexponentialDH
exponentialDA
ceiling
0.035L
0.0770.0340.117
�0.07
0.0050.04L
10.55NTNT
1986.4ND
NT4.2
0.0140.220.0130.0570.09
0.0140.32
Foley (1994)Dennis et al. (1991)Dennis et al. (1991)McCarthy (1996)McClure et al., unpublished
data; CRI (2000)Dennis et al. (1991)Foley (1994)
Note: Abbreviations are as follows: DA, fitted by simple DA (following Dennis et al. [1991]); DH, fitted by modified DA,or Dennis-Holmes method (following Holmes [2001]); L, based on annual growth rates (�c � Nt�1/Nt) where Nt � K; ND,not detected by bootstrap likelihood ratio test (Dennis and Taper 1994); NT, not tested.
† �r � ln(a), K � ln(a)/b, where a and b are the growth parameters from Ricker models.‡ Average of more than one taxon; see Gaston (1988).§ Data fit to logistic model: � .r(1/N /K)tN N et�1 t
achieved only at certain abundance levels (density-de-pendent processes). Thus, DA growth rate estimatesare inherently biased for density-dependent processes;however, the magnitude and direction of this bias arepotentially informative for interpreting any bias in theestimation of risk.
Simple DA models, which assume a density-inde-pendent, stochastic population process with lognormalprocess error, should produce both accurate and rela-tively precise estimates of growth parameters (� and�2) and risk for populations meeting these assump-tions, given adequate sample size. The null hypothesisfor the density-independent model is that estimated andobserved values of these variables should be nearlyequal. Thus if we plot the estimated vs. observed val-ues, they should fall on a line with a slope of 1.0 andintercept of 0. We used deviations from this 1:1 rela-tionship to evaluate the effects of density dependenceon estimates of growth parameters and risk for the ceil-ing, Beverton-Holt, and Ricker models.
RESULTS
DA estimates of �max and � 2
As expected, estimated growth rates, �, and processerror, �2, were accurate for time series generated by
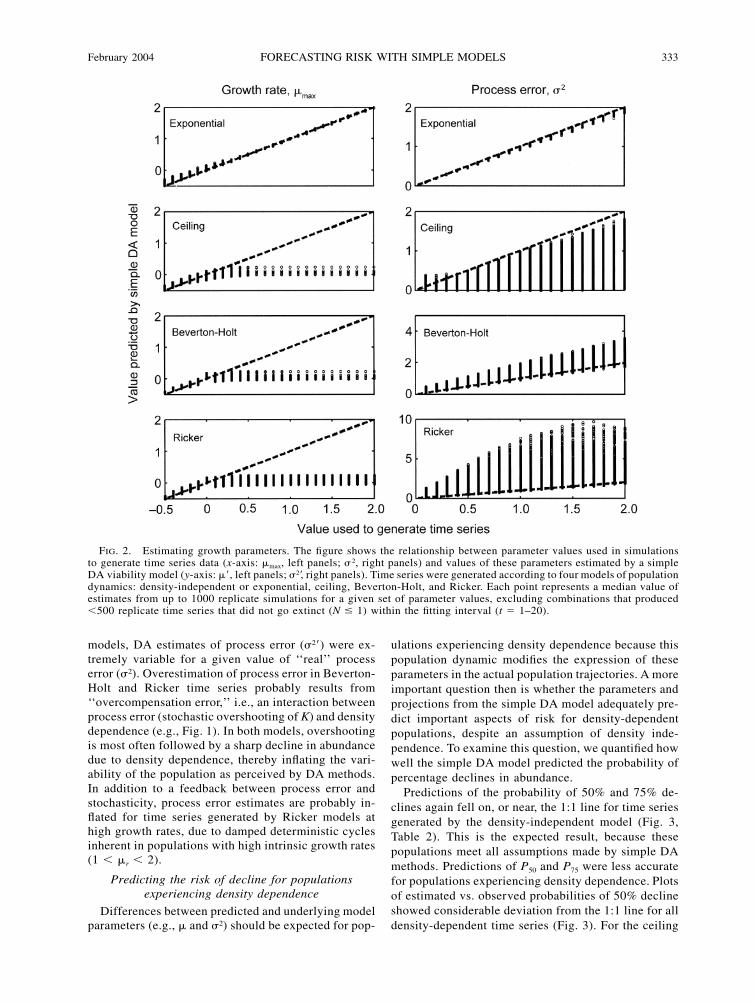
the exponential model (Fig. 2). Real and estimated val-ues of both parameters for populations growing ex-ponentially tracked the 1:1 line very closely, with theexception of process error at large values of �2 (a resultthat would most likely improve with higher samplesize).
By contrast, the DA model was generally unable toaccurately estimate �max or �2 in any density-dependentmodel. Maximum growth rates (�c, �b, �r,) for timeseries generated by ceiling, Beverton-Holt, and Rickermodels were typically underestimated, except at valuesless than zero (e.g., declining populations; Fig. 2). Aswe have noted, the inability of the DA model to esti-mate �max, is not surprising. When �max was very highin the density-dependent models, the simulated popu-lations fluctuated about the carrying capacity and theapparent population growth rate was stable (� � 0),as seen in Fig. 2. Differences in the level of processerror estimated from the density-dependent simulationswere similarly striking (Fig. 2, right panels). DA meth-ods underestimated the underlying process error for theceiling model, but most severely overestimated thisparameter for data generated by both Beverton-Holtand Ricker models. For all three density-dependent
February 2004 333FORECASTING RISK WITH SIMPLE MODELS
FIG. 2. Estimating growth parameters. The figure shows the relationship between parameter values used in simulationsto generate time series data (x-axis: �max, left panels; � 2, right panels) and values of these parameters estimated by a simpleDA viability model (y-axis: �, left panels; �2, right panels). Time series were generated according to four models of populationdynamics: density-independent or exponential, ceiling, Beverton-Holt, and Ricker. Each point represents a median value ofestimates from up to 1000 replicate simulations for a given set of parameter values, excluding combinations that produced�500 replicate time series that did not go extinct (N � 1) within the fitting interval (t � 1–20).
models, DA estimates of process error (�2) were ex-tremely variable for a given value of ‘‘real’’ processerror (�2). Overestimation of process error in Beverton-Holt and Ricker time series probably results from‘‘overcompensation error,’’ i.e., an interaction betweenprocess error (stochastic overshooting of K) and densitydependence (e.g., Fig. 1). In both models, overshootingis most often followed by a sharp decline in abundancedue to density dependence, thereby inflating the vari-ability of the population as perceived by DA methods.In addition to a feedback between process error andstochasticity, process error estimates are probably in-flated for time series generated by Ricker models athigh growth rates, due to damped deterministic cyclesinherent in populations with high intrinsic growth rates(1 � �r � 2).
Predicting the risk of decline for populationsexperiencing density dependence
Differences between predicted and underlying modelparameters (e.g., � and �2) should be expected for pop-
ulations experiencing density dependence because thispopulation dynamic modifies the expression of theseparameters in the actual population trajectories. A moreimportant question then is whether the parameters andprojections from the simple DA model adequately pre-dict important aspects of risk for density-dependentpopulations, despite an assumption of density inde-pendence. To examine this question, we quantified howwell the simple DA model predicted the probability ofpercentage declines in abundance.
Predictions of the probability of 50% and 75% de-clines again fell on, or near, the 1:1 line for time seriesgenerated by the density-independent model (Fig. 3,Table 2). This is the expected result, because thesepopulations meet all assumptions made by simple DAmethods. Predictions of P50 and P75 were less accuratefor populations experiencing density dependence. Plotsof estimated vs. observed probabilities of 50% declineshowed considerable deviation from the 1:1 line for alldensity-dependent time series (Fig. 3). For the ceiling
334 JOHN L. SABO ET AL. Ecology, Vol. 85, No. 2
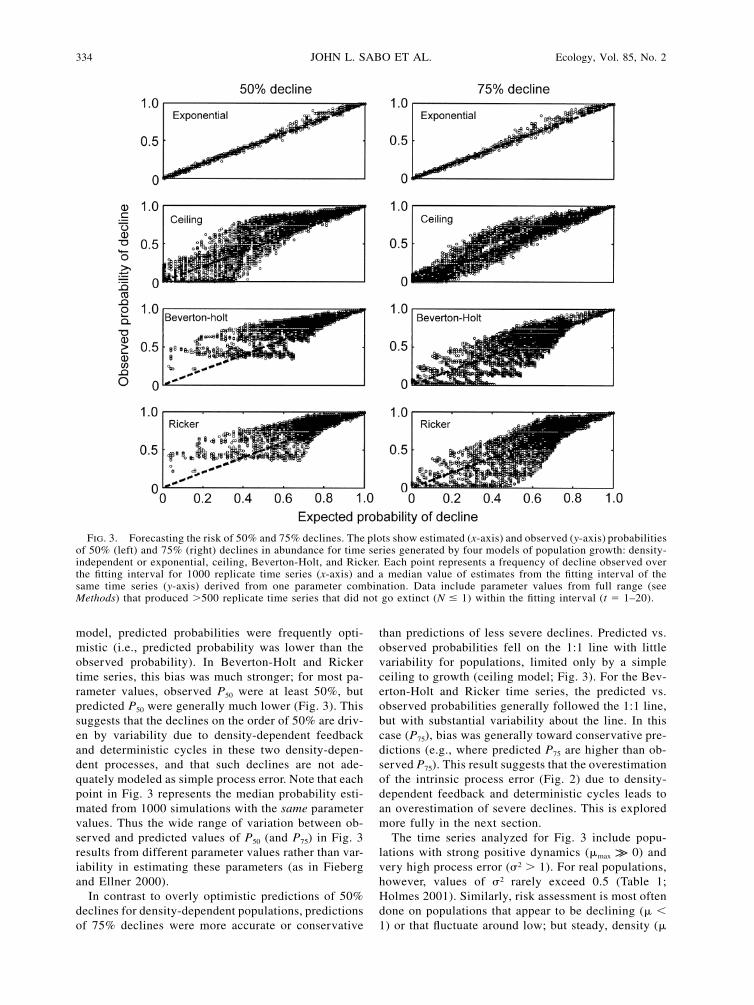
FIG. 3. Forecasting the risk of 50% and 75% declines. The plots show estimated (x-axis) and observed (y-axis) probabilitiesof 50% (left) and 75% (right) declines in abundance for time series generated by four models of population growth: density-independent or exponential, ceiling, Beverton-Holt, and Ricker. Each point represents a frequency of decline observed overthe fitting interval for 1000 replicate time series (x-axis) and a median value of estimates from the fitting interval of thesame time series (y-axis) derived from one parameter combination. Data include parameter values from full range (seeMethods) that produced �500 replicate time series that did not go extinct (N � 1) within the fitting interval (t � 1–20).
model, predicted probabilities were frequently opti-mistic (i.e., predicted probability was lower than theobserved probability). In Beverton-Holt and Rickertime series, this bias was much stronger; for most pa-rameter values, observed P50 were at least 50%, butpredicted P50 were generally much lower (Fig. 3). Thissuggests that the declines on the order of 50% are driv-en by variability due to density-dependent feedbackand deterministic cycles in these two density-depen-dent processes, and that such declines are not ade-quately modeled as simple process error. Note that eachpoint in Fig. 3 represents the median probability esti-mated from 1000 simulations with the same parametervalues. Thus the wide range of variation between ob-served and predicted values of P50 (and P75) in Fig. 3results from different parameter values rather than var-iability in estimating these parameters (as in Fiebergand Ellner 2000).
In contrast to overly optimistic predictions of 50%declines for density-dependent populations, predictionsof 75% declines were more accurate or conservative
than predictions of less severe declines. Predicted vs.observed probabilities fell on the 1:1 line with littlevariability for populations, limited only by a simpleceiling to growth (ceiling model; Fig. 3). For the Bev-erton-Holt and Ricker time series, the predicted vs.observed probabilities generally followed the 1:1 line,but with substantial variability about the line. In thiscase (P75), bias was generally toward conservative pre-dictions (e.g., where predicted P75 are higher than ob-served P75). This result suggests that the overestimationof the intrinsic process error (Fig. 2) due to density-dependent feedback and deterministic cycles leads toan overestimation of severe declines. This is exploredmore fully in the next section.
The time series analyzed for Fig. 3 include popu-lations with strong positive dynamics (�max k 0) andvery high process error (�2 � 1). For real populations,however, values of �2 rarely exceed 0.5 (Table 1;Holmes 2001). Similarly, risk assessment is most oftendone on populations that appear to be declining (� �1) or that fluctuate around low; but steady, density (�
February 2004 335FORECASTING RISK WITH SIMPLE MODELS
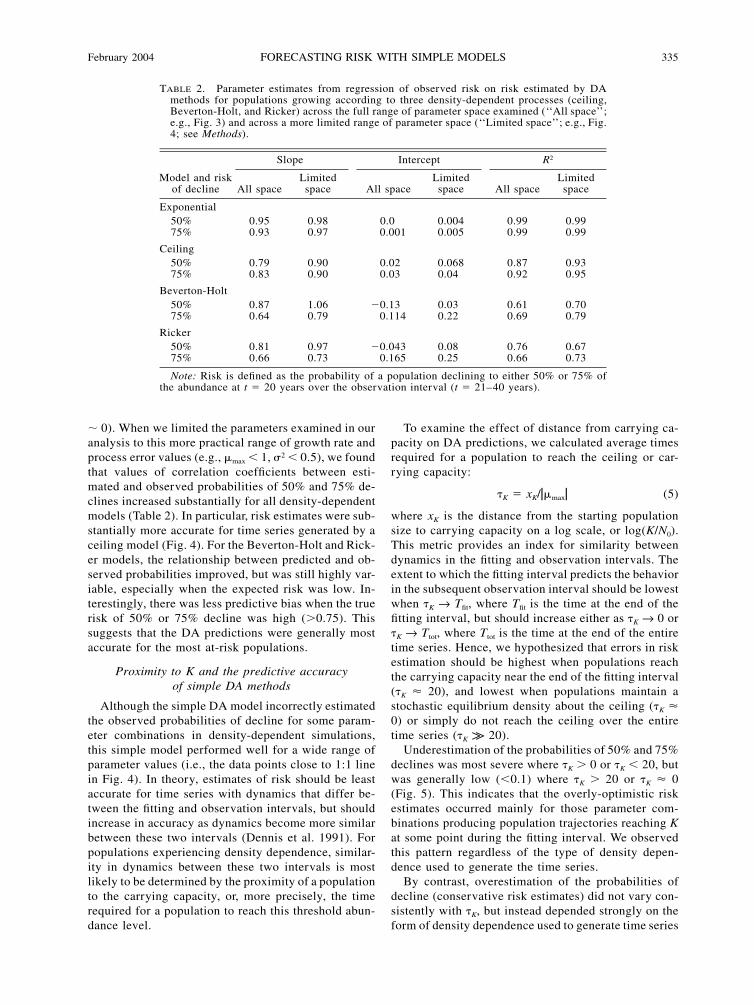
TABLE 2. Parameter estimates from regression of observed risk on risk estimated by DAmethods for populations growing according to three density-dependent processes (ceiling,Beverton-Holt, and Ricker) across the full range of parameter space examined (‘‘All space’’;e.g., Fig. 3) and across a more limited range of parameter space (‘‘Limited space’’; e.g., Fig.4; see Methods).
Model and riskof decline
Slope
All spaceLimitedspace
Intercept
All spaceLimitedspace
R2
All spaceLimitedspace
Exponential50%75%
0.950.93
0.980.97
0.00.001
0.0040.005
0.990.99
0.990.99
Ceiling50%75%
0.790.83
0.900.90
0.020.03
0.0680.04
0.870.92
0.930.95
Beverton-Holt50%75%
0.870.64
1.060.79
�0.130.114
0.030.22
0.610.69
0.700.79
Ricker50%75%
0.810.66
0.970.73
�0.0430.165
0.080.25
0.760.66
0.670.73
Note: Risk is defined as the probability of a population declining to either 50% or 75% ofthe abundance at t � 20 years over the observation interval (t � 21–40 years).
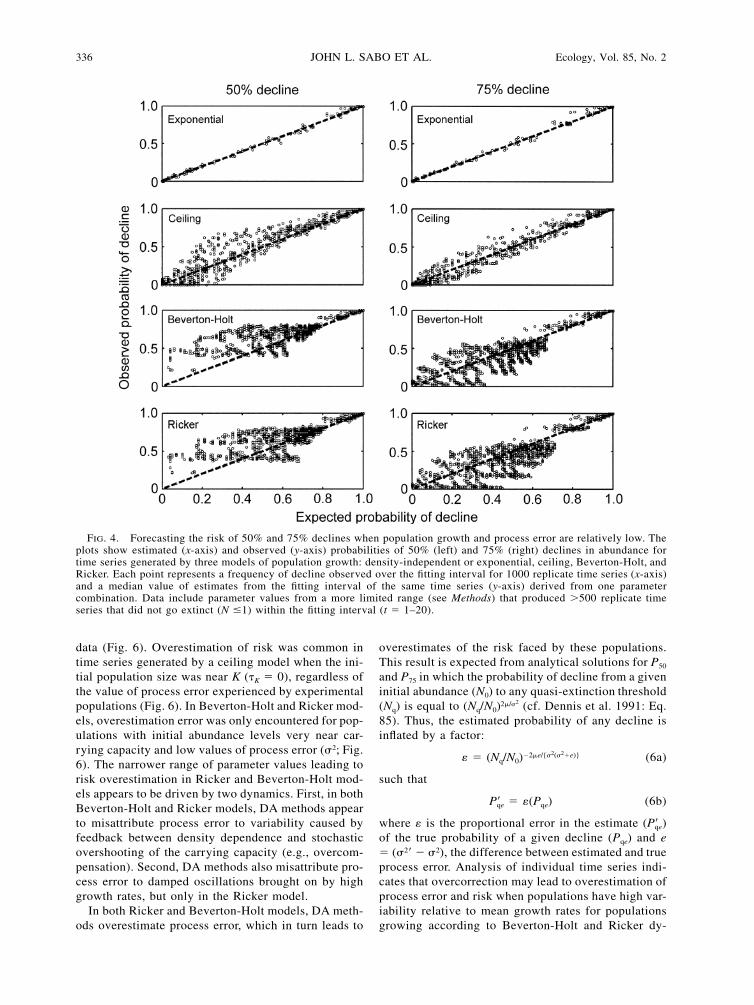
� 0). When we limited the parameters examined in ouranalysis to this more practical range of growth rate andprocess error values (e.g., �max � 1, �2 � 0.5), we foundthat values of correlation coefficients between esti-mated and observed probabilities of 50% and 75% de-clines increased substantially for all density-dependentmodels (Table 2). In particular, risk estimates were sub-stantially more accurate for time series generated by aceiling model (Fig. 4). For the Beverton-Holt and Rick-er models, the relationship between predicted and ob-served probabilities improved, but was still highly var-iable, especially when the expected risk was low. In-terestingly, there was less predictive bias when the truerisk of 50% or 75% decline was high (�0.75). Thissuggests that the DA predictions were generally mostaccurate for the most at-risk populations.
Proximity to K and the predictive accuracyof simple DA methods
Although the simple DA model incorrectly estimatedthe observed probabilities of decline for some param-eter combinations in density-dependent simulations,this simple model performed well for a wide range ofparameter values (i.e., the data points close to 1:1 linein Fig. 4). In theory, estimates of risk should be leastaccurate for time series with dynamics that differ be-tween the fitting and observation intervals, but shouldincrease in accuracy as dynamics become more similarbetween these two intervals (Dennis et al. 1991). Forpopulations experiencing density dependence, similar-ity in dynamics between these two intervals is mostlikely to be determined by the proximity of a populationto the carrying capacity, or, more precisely, the timerequired for a population to reach this threshold abun-dance level.
To examine the effect of distance from carrying ca-pacity on DA predictions, we calculated average timesrequired for a population to reach the ceiling or car-rying capacity:
� � x /�� �K K max (5)
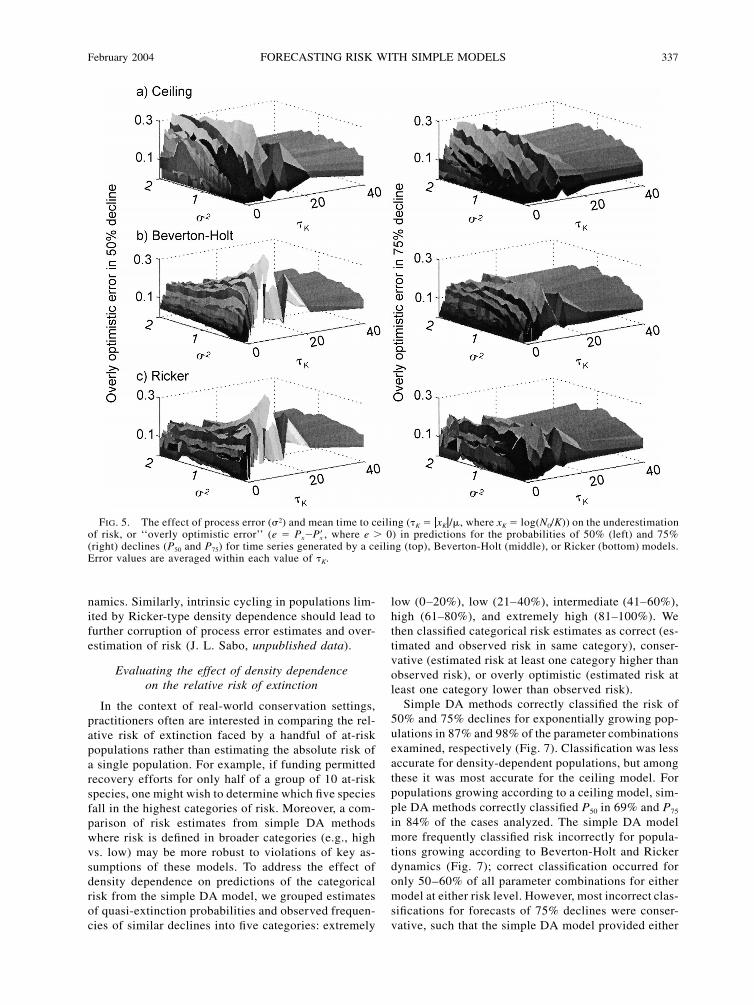
where xK is the distance from the starting populationsize to carrying capacity on a log scale, or log(K/N0).This metric provides an index for similarity betweendynamics in the fitting and observation intervals. Theextent to which the fitting interval predicts the behaviorin the subsequent observation interval should be lowestwhen �K → Tfit, where Tfit is the time at the end of thefitting interval, but should increase either as �K → 0 or�K → Ttot, where Ttot is the time at the end of the entiretime series. Hence, we hypothesized that errors in riskestimation should be highest when populations reachthe carrying capacity near the end of the fitting interval(�K � 20), and lowest when populations maintain astochastic equilibrium density about the ceiling (�K �0) or simply do not reach the ceiling over the entiretime series (�K k 20).
Underestimation of the probabilities of 50% and 75%declines was most severe where �K � 0 or �K � 20, butwas generally low (�0.1) where �K � 20 or �K � 0(Fig. 5). This indicates that the overly-optimistic riskestimates occurred mainly for those parameter com-binations producing population trajectories reaching Kat some point during the fitting interval. We observedthis pattern regardless of the type of density depen-dence used to generate the time series.
By contrast, overestimation of the probabilities ofdecline (conservative risk estimates) did not vary con-sistently with �K, but instead depended strongly on theform of density dependence used to generate time series
336 JOHN L. SABO ET AL. Ecology, Vol. 85, No. 2
FIG. 4. Forecasting the risk of 50% and 75% declines when population growth and process error are relatively low. Theplots show estimated (x-axis) and observed (y-axis) probabilities of 50% (left) and 75% (right) declines in abundance fortime series generated by three models of population growth: density-independent or exponential, ceiling, Beverton-Holt, andRicker. Each point represents a frequency of decline observed over the fitting interval for 1000 replicate time series (x-axis)and a median value of estimates from the fitting interval of the same time series (y-axis) derived from one parametercombination. Data include parameter values from a more limited range (see Methods) that produced �500 replicate timeseries that did not go extinct (N �1) within the fitting interval (t � 1–20).
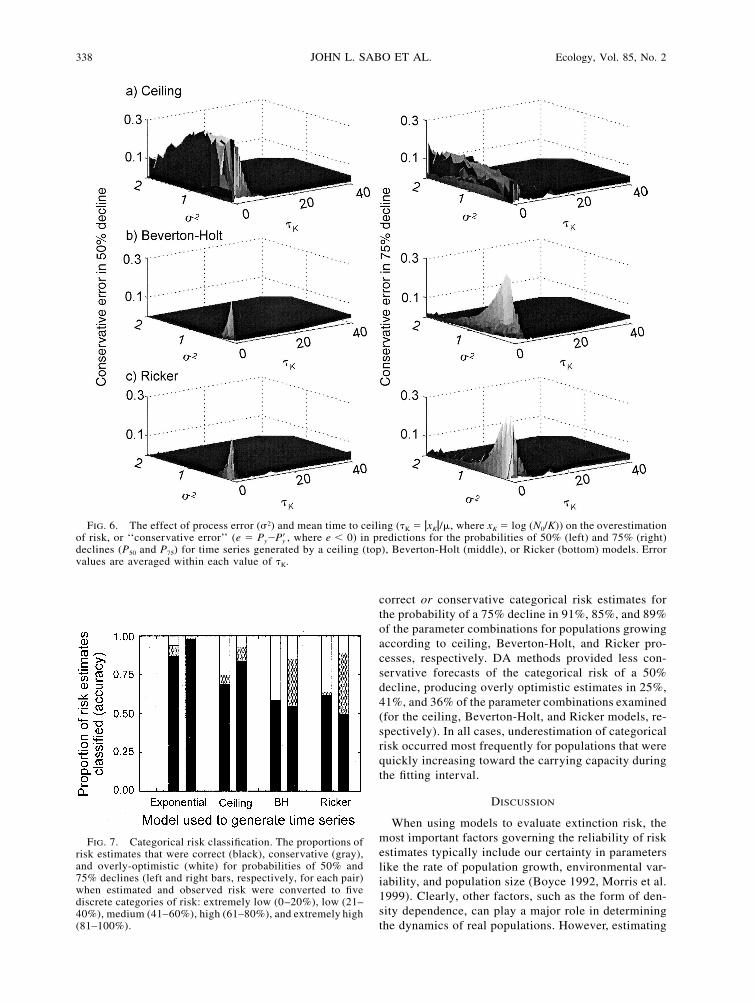
data (Fig. 6). Overestimation of risk was common intime series generated by a ceiling model when the ini-tial population size was near K (�K � 0), regardless ofthe value of process error experienced by experimentalpopulations (Fig. 6). In Beverton-Holt and Ricker mod-els, overestimation error was only encountered for pop-ulations with initial abundance levels very near car-rying capacity and low values of process error (�2; Fig.6). The narrower range of parameter values leading torisk overestimation in Ricker and Beverton-Holt mod-els appears to be driven by two dynamics. First, in bothBeverton-Holt and Ricker models, DA methods appearto misattribute process error to variability caused byfeedback between density dependence and stochasticovershooting of the carrying capacity (e.g., overcom-pensation). Second, DA methods also misattribute pro-cess error to damped oscillations brought on by highgrowth rates, but only in the Ricker model.
In both Ricker and Beverton-Holt models, DA meth-ods overestimate process error, which in turn leads to
overestimates of the risk faced by these populations.This result is expected from analytical solutions for P50
and P75 in which the probability of decline from a giveninitial abundance (N0) to any quasi-extinction threshold(Nq) is equal to (Nq/N0) (cf. Dennis et al. 1991: Eq.22�/�
85). Thus, the estimated probability of any decline isinflated by a factor:
2 2�2�e/{� (� �e)} � (N /N )q 0 (6a)
such that
P � (P )qe qe (6b)
where is the proportional error in the estimate ( )Pqe
of the true probability of a given decline (Pqe) and e� (�2 � �2), the difference between estimated and trueprocess error. Analysis of individual time series indi-cates that overcorrection may lead to overestimation ofprocess error and risk when populations have high var-iability relative to mean growth rates for populationsgrowing according to Beverton-Holt and Ricker dy-
February 2004 337FORECASTING RISK WITH SIMPLE MODELS
FIG. 5. The effect of process error (�2) and mean time to ceiling (�K � �xK�/�, where xK � log(N0/K)) on the underestimationof risk, or ‘‘overly optimistic error’’ (e � Px� , where e � 0) in predictions for the probabilities of 50% (left) and 75%Px(right) declines (P50 and P75) for time series generated by a ceiling (top), Beverton-Holt (middle), or Ricker (bottom) models.Error values are averaged within each value of �K.
namics. Similarly, intrinsic cycling in populations lim-ited by Ricker-type density dependence should lead tofurther corruption of process error estimates and over-estimation of risk (J. L. Sabo, unpublished data).
Evaluating the effect of density dependenceon the relative risk of extinction
In the context of real-world conservation settings,practitioners often are interested in comparing the rel-ative risk of extinction faced by a handful of at-riskpopulations rather than estimating the absolute risk ofa single population. For example, if funding permittedrecovery efforts for only half of a group of 10 at-riskspecies, one might wish to determine which five speciesfall in the highest categories of risk. Moreover, a com-parison of risk estimates from simple DA methodswhere risk is defined in broader categories (e.g., highvs. low) may be more robust to violations of key as-sumptions of these models. To address the effect ofdensity dependence on predictions of the categoricalrisk from the simple DA model, we grouped estimatesof quasi-extinction probabilities and observed frequen-cies of similar declines into five categories: extremely
low (0–20%), low (21–40%), intermediate (41–60%),high (61–80%), and extremely high (81–100%). Wethen classified categorical risk estimates as correct (es-timated and observed risk in same category), conser-vative (estimated risk at least one category higher thanobserved risk), or overly optimistic (estimated risk atleast one category lower than observed risk).
Simple DA methods correctly classified the risk of50% and 75% declines for exponentially growing pop-ulations in 87% and 98% of the parameter combinationsexamined, respectively (Fig. 7). Classification was lessaccurate for density-dependent populations, but amongthese it was most accurate for the ceiling model. Forpopulations growing according to a ceiling model, sim-ple DA methods correctly classified P50 in 69% and P75
in 84% of the cases analyzed. The simple DA modelmore frequently classified risk incorrectly for popula-tions growing according to Beverton-Holt and Rickerdynamics (Fig. 7); correct classification occurred foronly 50–60% of all parameter combinations for eithermodel at either risk level. However, most incorrect clas-sifications for forecasts of 75% declines were conser-vative, such that the simple DA model provided either
338 JOHN L. SABO ET AL. Ecology, Vol. 85, No. 2
FIG. 6. The effect of process error (�2) and mean time to ceiling (�K � �xK�/�, where xK � log (N0/K)) on the overestimationof risk, or ‘‘conservative error’’ (e � Py� , where e � 0) in predictions for the probabilities of 50% (left) and 75% (right)Pydeclines (P50 and P75) for time series generated by a ceiling (top), Beverton-Holt (middle), or Ricker (bottom) models. Errorvalues are averaged within each value of �K.
FIG. 7. Categorical risk classification. The proportions ofrisk estimates that were correct (black), conservative (gray),and overly-optimistic (white) for probabilities of 50% and75% declines (left and right bars, respectively, for each pair)when estimated and observed risk were converted to fivediscrete categories of risk: extremely low (0–20%), low (21–40%), medium (41–60%), high (61–80%), and extremely high(81–100%).
correct or conservative categorical risk estimates forthe probability of a 75% decline in 91%, 85%, and 89%of the parameter combinations for populations growingaccording to ceiling, Beverton-Holt, and Ricker pro-cesses, respectively. DA methods provided less con-servative forecasts of the categorical risk of a 50%decline, producing overly optimistic estimates in 25%,41%, and 36% of the parameter combinations examined(for the ceiling, Beverton-Holt, and Ricker models, re-spectively). In all cases, underestimation of categoricalrisk occurred most frequently for populations that werequickly increasing toward the carrying capacity duringthe fitting interval.
DISCUSSION
When using models to evaluate extinction risk, themost important factors governing the reliability of riskestimates typically include our certainty in parameterslike the rate of population growth, environmental var-iability, and population size (Boyce 1992, Morris et al.1999). Clearly, other factors, such as the form of den-sity dependence, can play a major role in determiningthe dynamics of real populations. However, estimating
February 2004 339FORECASTING RISK WITH SIMPLE MODELS
parameters can be difficult for stochastic density-de-pendent processes (Dennis and Taper 1994), and rarelyare we likely to have either the quantity or quality ofdata necessary to parameterize these types of nonlinearpopulation growth models in the real world. In thispaper we show that a density-independent PVA modelcan still give reasonably apt assessments of relativerisk for density-dependent population processes, andin fact can provide fairly accurate measures of absoluterisk when density-dependent populations are either atabundance levels where density effects are not strong,or when the effects of density remain constant over aspecified management time frame (e.g., across fittingand observation intervals). Interestingly, the perfor-mance of the simple DA model is best for populationsmost in need of viability assessment: highly fluctuating,declining, and slowly recovering populations.
Does density dependence affect the efficacy of simpleviability models at classifying risk?
Our results suggest that simple DA methods that as-sume a density-independent stochastic process willprovide adequate predictions about the probabilities ofpopulation decline, despite density dependence underfour sets of circumstances. First, simple DA methodsare less prone to underestimate risk when density de-pendence is manifested as a simple upper threshold(ceiling) to population growth than as a more complex,nonlinear form of population growth (e.g., Ricker andBeverton-Holt models; Figs. 2–3). Coefficients of cor-relation (R2) between estimated and observed risk weretypically 10–15% higher for the ceiling than for Rickerand Beverton-Holt models, regardless of risk level (P50
and P75) or the range of parameters analyzed (Figs. 2–3, Table 2). Thus, the efficacy of simple DA methodsat characterizing risk depends on the form of densitydependence experienced by real populations.
That risk estimates were more robust for populationslimited only by a ceiling is not surprising because theceiling model generates population trajectories thatmeet all of the limiting assumptions of simple DAmethods when the population is below the specifiedceiling. By contrast, the simple DA model more oftenprovided less reliable risk estimates for populationsthat experience other, more complex, forms of densitydependence (e.g., logistic, Ricker, and Beverton-Holt).Threshold forms of density dependence, with dynamicssimilar to the ceiling model, are most often manifestedby space limitation (e.g., nest site locations or settlingspace). For example, salmon may be limited by nestingsubstrate such that overcrowding leads to nest super-imposition and decreased egg survival (Flemming andGross 1992). Similarly, many bird species are limitedby structural features (tree hollows) needed for nesting(Møller and Erritizoe 1996). Finally, many sessile ma-rine invertebrates are limited by settling space for re-cruiting pelagic larvae (Grosberg and Levitan 1992).By contrast, population regulation by food limitation
can occur directly via scramble competition, as rep-resented by the Ricker model, or indirectly as a resultof behavioral mechanisms or contest competition, asrepresented by the Beverton-Holt model (Akcakaya etal. 1999). Simple DA methods most likely are not aseffective at classifying risk for these types of species(e.g., cod, elk, wildebeest).
Second, risk estimates are more precise for severethan for modest declines. R2 values for the relationshipbetween estimated and observed risk were higher forP75 than P50 in all cases except for the Ricker model,analyzed across the entire parameter set (Table 2).Moreover, categorical risk estimates (low, medium,high) were more frequently correct (ceiling model) orconservative (Ricker and Beverton-Holt models) forP75 than P50 (Fig. 7). These results suggest that densitydependence may have less severe effects on estimatesof the probability of extreme declines.
Third, the accuracy of risk estimates from simpleDA models declines as a result of intrinsic cycling athigh growth rates (Ricker model) or as a result of strongfeedback between stochastic overshooting of the car-rying capacity and density dependence (Ricker andBeverton-Holt models). Simple PVAs attribute all ofthe variation in population abundance to environmentalvariability and assume that there are no cycles in thepopulation process itself or interactions between en-vironmental variability and density dependence (as inovercompensation). These models will thus overesti-mate process error for populations exhibiting cycles orovercompensation, leading to overestimates of risk.This is, in fact, what we observed in this study. Overlyoptimistic estimates of risk were observed most fre-quently for populations generated by models known toexhibit overcompensation or cycling (e.g., Fig. 1; Bev-erton-Holt and Ricker). Newer methods capable of sep-arating these two sources of error (Holmes 2001, DeValpine and Hastings 2002, Holmes and Fagan 2002)would probably give better risk estimates for popula-tions with a tendency to cycle.
Finally, the efficacy of simple DA methods at esti-mating risk for density-dependent population processesdepends not only on how the population experiencesdensity effects, but also on when these effects occur.Specifically, the proximity of a population to an upperthreshold abundance level (ceiling or carrying capac-ity) can strongly influence accuracy in risk assessment.Not surprisingly, if the population reaches carrying ca-pacity near the end of the period when parameters areestimated (i.e., the fitting interval), then simple DAmethods will produce inaccurate risk estimates becausethe dynamics during the fitting period will be quitedifferent than that during the subsequent observationperiod (Boyce 1992, Beissinger 1995). Indeed, error(most notably, underestimation) in risk estimation wastypically high for populations initially below the ceil-ing but likely to reach this threshold before the end ofthe fitting interval (i.e., 0 � �K � 20; Fig. 5). By con-
340 JOHN L. SABO ET AL. Ecology, Vol. 85, No. 2
trast, when the population was fluctuating about thecarrying capacity during the fitting and observationperiods, high overestimation errors tended to occur, butonly for Beverton-Holt and Ricker type density de-pendence. Overall, estimation errors were lowest andwere within 0.1 of the true probabilities for populationsbelow carrying capacity and not likely to reach it ineither the fitting or observation intervals (�K k 20),and for populations with ceiling-type density depen-dence that were fluctuating stably near the carryingcapacity.
These results have important practical implicationsfor the use of simple PVAs in conservation planning.Assessments by simple DA methods are generally ro-bust when they are most needed: for declining or slowlyrecovering populations and for most space-limited pop-ulations fluctuating near their upper threshold abun-dance level. Thus, although DA methods that explicitlyinclude density dependence are available (e.g., Foley1994, Dennis et al. 2001, De Valpine and Hastings2002), evaluating the assumption that population dy-namics remain consistent between the prediction andforecasting intervals may be more important than usingthese more accurate PVAs to estimate extinction risk.
General recommendations about PVAsbased on simple DA methods
Based on these general findings, we recommendagainst using simple DA methods in two scenarios: (1)to estimate the probability of relatively modest declinesin abundance (e.g., �50%); and (2) to estimate the riskof decline for a threatened population showing strongsigns of recovery. We further suggest caution in fore-casting risk with simple DA methods for populationsstrongly regulated by food limitation and thus mostlikely to approximate either Ricker or Beverton-Holtdynamics. Risk estimates are more likely to be overlyoptimistic for these types of species compared to thosethat experience density dependence purely by spacelimitation, especially when forecasting a relativelymodest decline. In all three cases, blind application ofsimple DA methods to forecast risk is likely to produceerroneous estimates of viability. In these cases, we ad-vise application of multiple models (e.g., the DA andone or several density-dependent analogs) and a carefulstatistical evaluation of the appropriateness of each(Dennis et al. 1991). Finally, we note that our analysispertains to situations in which only count data are avail-able. In cases where more intensive monitoring pro-grams provide capture–recapture or demographic data,estimation of parameters in nonlinear (e.g., density-dependent) models may be more straightforward andmay provide more accurate forecasts of risk faced bythreatened populations.
Conclusion
The ability of simple models to inform conservationplanning hinges on the goal of viability modeling. Al-
though accurate estimates of risk are always desirable,many real-world applications of PVA require only anaccurate assessment of the relative risk of extinctionamong a handful of populations. These applicationsinclude identifying both the most and least at-risk pop-ulations. Identifying the most at-risk populations canhelp to prioritize conservation efforts and guide limitedresources to populations most in need of recovery. Sim-ilarly, estimates of relative risk can help to identifywhich populations are in the ‘‘best shape’’ and henceshould be placed in a conservation portfolio (Groveset al. 2000). When the desired application of a PVA isto compare levels of relative risk among multiple pop-ulations, simple PVAs assuming the wrong populationprocess may still provide a sufficiently informative an-swer in a wide variety of situations relevant to con-servation.
ACKNOWLEDGMENTS
We thank Jim Reichman and the National Center for Eco-logical Analysis and Synthesis for access to computers andlogistic support over the course of this study. P. Abrams, L.Gerber, P. McElheny, M. Neubert, H. Regan, R. Zabel, andtwo anonymous reviewers provided helpful comments thatimproved earlier versions of this manuscript. J. L. Sabothanks Dan Doak for suggesting the derivation of �K as anapproach to quantifying the effects of this density dependenceon error in parameter and risk estimation, and Perry De Val-pine for programming assistance in C. This work was per-formed while the author held a National Research CouncilResearch Associateship Award at the Northwest FisheriesSceince Center, National Marine Fisheries Service, NOAA.
LITERATURE CITED
Akcakaya, H. R., M. A. Burgman, and S. Ferson. 1999. Ap-plied population ecology: principles and computer exer-cises using RAMAS EcoLab 2.0. Sinauer Associates, Sun-derland, Massachusetts, USA.
Applied Biomathematics. 1998. RAMAS GIS 3.0. Linkinglandscape data with population viability analysis. AppliedBiomathematics, Setauket, New York, USA.
Applied Biomathematics. 2001. RAMAS Metapop 3.0. Vi-ability analysis for stage-structured metapopulations, Ap-plied Biomathematics, Setauket, New York, USA.
Barrowman, N. J., and R. A. Myers. 2000. Still more spawn-er-recruitment curves: the hockey stick and its generaliza-tions. Canadian Journal of Fisheries and Aquatic Sciences57:665–676.
Beissinger, S. R. 1995. Modeling extinction in periodic en-vironments: Everglades water levels and Snail Kite pop-ulation viability. Ecological Applications 5:618–631.
Beverton, R. J. H., and S. J. Holt. 1957. On the dynamics ofexploited fish populations. Fishery Investgation Series II19:1–533.
Beverton, R. J. H., and S. J. Holt. 1993. The dynamics ofexploited fish populations. Chapman and Hall, London,UK.
Boyce, M. S. 1992. Population viability analysis. AnnualReview of Ecology and Systematics 23:481–506.
Bradford, M. J., R. A. Myers, and J. R. Irvine. 2000. Ref-erence points for coho salmon (Oncorhynchus kisutch) har-vest rates and escapement goals based on freshwater pro-duction. Canadian Journal of Fisheries and Aquatic Sci-ences 57:677–686.
Burgman, M. A., S. Ferson, and H. R. Akcakaya. 1993. Riskassessment in conservation biology. Chapman and Hall,London, UK.
February 2004 341FORECASTING RISK WITH SIMPLE MODELS
Constantino, R. F., R. A. Desharnais, J. M. Cushing, and B.Dennis. 1997. Chaotic dynamics in an insect population.Science 275:389–391.
CRI (Cumulative Risk Initiative). 2000. A standardizedquantitative analysis of the risks faced by salmonids in theColumbia River basin. National Marine Fisheries Service,Washington, D.C., USA.
Dennis, B., R. A. Desharnais, J. M. Cushing, S. M. Henson,and R. F. Costantino. 2001. Estimating chaos and complexdynamics in an insect population. Ecological Monographs71:277–303.
Dennis, B., P. L. Munholland, and J. M. Scott. 1991. Esti-mation of growth and extinction parameters for endangeredspecies. Ecological Monographs 61:115–143.
Dennis, B., and M. L. Taper. 1994. Density dependence intime series observations of natural populations: estimationand testing. Ecological Monographs 64:205–224.
De Valpine P., and A. Hastings. 2002. Fitting populationmodels incorporating process noise and observation error.Ecological Monographs 72:57–76.
Engen, S., O. Bakke, and A. Islam. 1998. Demographic andenvironmental stochasticity: concepts and definitions. Bio-metrics 54:840–846.
Fieberg, J., and S. P. Ellner. 2000. When is it meaningful toestimate an extinction probability? Ecology 81:2040–2047.
Flemming, I. A., and M. R. Gross. 1992. Reproductive-be-havior of hatchery and wild coho salmon (Oncorhynchus-kisutch)—does it differ? Aquaculture 103:101–121.
Foley, P. 1994. Predicting extinction times from environ-mental stochasticity and carrying-capacity. ConservationBiology 8:124–137.
Fox, G. A., and B. E. Kendall. 2002. Demographic stochas-ticity and the variance reduction effect. Ecology 83:1928–1934.
Gaston, K. J. 1988. The intrinsic rates of increase of insectsof different sizes. Ecological Entomology 14:399–409.
Getz, W. M. 1996. A hypothesis regarding the abruptness ofdensity dependence and the growth rate of populations.Ecology 77:2014–2026.
Grosberg, R. K., and D. R. Levitan. 1992. For adults only:supply-side ecology and the history of larval biology.Trends in Ecology and Evolution 7:130–133.
Groves, C., L. Valutis, D. Vosick, B. Neely, K. Wheaton, J.Touval, and B. Runnels. 2000. Designing a geography ofhope: a practitioner’s handbook for ecoregional conser-vation planning. The Nature Conservancy, Arlington, Vir-ginia, USA.
Hilborn, R., and M. Mangel. 1997. The ecological detective:confronting models with data. Princeton University Press,Princeton, New Jersey, USA.
Hilborn, R., and C. J. Walters. 1992. Quantitative fisheriesstock assessment: choice, dynamics and uncertainty. Chap-man and Hall, New York, New York, USA.
Holmes, E. E. 2001. Estimating risks in declining populationswith poor data. Proceedings of the National Academy ofSciences (USA) 98:5072–5077.
Holmes, E. E., and W. F. Fagan. 2002. Validating populationviability analysis for corrupted data sets. Ecology 83:2379–2386.
IUCN (Species Survival Commission). 2000. InternationalUnion for the Conservation of Nature Red List categories.
IUCN, Gland, Switzerland. [Online, URL: �http://www.redlist.org/info/introduction.html�.]
Kemp, W. P., and B. Dennis. 1993. Density dependence inrangeland grasshoppers (Orthoptera: Acrididae). Oecologia96:1–8.
Kendall, B. E., and G. A. Fox. 2002. Variation among in-dividuals reduces demographic stochasticity. ConservationBiology 16:109–116.
Lande, R. 1993. Risks of population extinction from de-mographic and environmental stochasticity and random ca-tastrophes. American Naturalist. 142:911–927.
Lande, R., and S. H. Orzack. 1988. Extinction dynamics ofage-structured populations in a fluctuating environment.Procedings of the National Academy of Sciences (USA)85:7418–7421.
Ludwig, D. 1999. Is it meaningful to estimate a probabilityof extinction? Ecology 80:298–310.
McCarthy, M. A. 1996. Red kangaroo (Macropus rufus) dy-namics: effects of rainfall, density dependence, harvestingand environmental stochasticity. Journal of Applied Ecol-ogy 33:45–53.
Meir, E., and W. F. Fagan. 1999. Will observation error andbiases ruin the use of simple extinction models? Conser-vation Biology 14:148–154.
Middleton, D. A. J., A. R. Veitch, and R. M. Nisbet. 1995.The effect of an upper limit to population size on persis-tence time. Theoretical Population Biology 48:277–305.
Møller, A. P., and J. Erritzoe. 1996. Parasite virulence andhost immune defense: host immune response is related tonest reuse in birds. Evolution 50:2066–2072.
Morris, W. F., and D. F. Doak. 2002. Quantitative conser-vation biology: theory and practice of population viabilityanalysis. Sinauer Associates, Sunderland, Massachusetts,USA.
Morris, W., D. Doak, M. Groom, P. Kareiva, J. Feiberg, L.Gerber, P. Murphy, and D. Thomson. 1999. A practicalhandbook for population viability analysis. The NatureConservancy, Arlington, Virginia, USA.
Pascual, M. A., P. Kareiva, and R. Hilborn. 1997. The influ-ence of model structure on conclusions about the viabilityand harvesting of Serengeti wildebeest. Conservation Bi-ology 11:966–976.
Reed, J. M., L. S. Mills, J. B. Dunning, E. S. Menges, K. S.McKelvey, R. Frye, S. R. Beissinger, M. Anstett, and P.Miller. 2002. Use and emerging issues in population via-bility analysis. Conservation Biology 16:7–19.
Ricker, W. T. 1954. Stock and recruitment. Journal of theFisheries Research Board of Canada 11:559–623.
Ricker, W. T. 1975. Computation and interpretation of bio-logical statistics of fish populations. Fisheries ResearchBoard of Canada, Bulletin 191.
Stacey, P. B., and M. Taper. 1992. Environmental variationand the persistence of small populations. Ecological Ap-plications 2:18–29.
Taylor, B. L. 1995. The reliability of using population via-bility analysis for risk classification of species. Conser-vation Biology 9:551–558.
Zeng, Z., R. M. Nowiershi, M. L. Taper, B. Dennis, and W.P. Kemp. 1998. Complex population dynamics in the realworld: modeling the influence of time-varying parametersand time lags. Ecology 79:2193–2209.