Effects of Water Stress and Nitrogen Fertilizer on Multi-Cut Forage Pearl Millet Yield, Nitrogen,...
9
This article appeared in a journal published by Elsevier. The attached copy is furnished to the author for internal non-commercial research and education use, including for instruction at the authors institution and sharing with colleagues. Other uses, including reproduction and distribution, or selling or licensing copies, or posting to personal, institutional or third party websites are prohibited. In most cases authors are permitted to post their version of the article (e.g. in Word or Tex form) to their personal website or institutional repository. Authors requiring further information regarding Elsevier’s archiving and manuscript policies are encouraged to visit: http://www.elsevier.com/copyright
Transcript of Effects of Water Stress and Nitrogen Fertilizer on Multi-Cut Forage Pearl Millet Yield, Nitrogen,...
This article appeared in a journal published by Elsevier. The attachedcopy is furnished to the author for internal non-commercial researchand education use, including for instruction at the authors institution
and sharing with colleagues.
Other uses, including reproduction and distribution, or selling orlicensing copies, or posting to personal, institutional or third party
websites are prohibited.
In most cases authors are permitted to post their version of thearticle (e.g. in Word or Tex form) to their personal website orinstitutional repository. Authors requiring further information
regarding Elsevier’s archiving and manuscript policies areencouraged to visit:
http://www.elsevier.com/copyright
Author's personal copy
Agricultural Water Management 98 (2011) 1607– 1614
Contents lists available at ScienceDirect
Agricultural Water Management
j ourna l ho me page: www.elsev ier .com/ locate /agwat
Forage quality, water use and nitrogen utilization efficiencies of pearl millet(Pennisetum americanum L.) grown under different soil moisture and nitrogenlevels
Mina Rostamza ∗, Mohammad-Reza Chaichi, Mohammad-Reza Jahansouz, Ahmad AlimadadiDepartment of Agronomy and Plant Breeding, University College of Agriculture and Natural Resources, University of Tehran, Karaj, Iran
a r t i c l e i n f o
Article history:Received 20 July 2010Accepted 29 May 2011Available online 25 June 2011
Keywords:Pearl milletWater stressNitrogenWater use efficiencyNitrogen utilization efficiencyForage quality
a b s t r a c t
The increasing scarcity of water for irrigation is becoming the most important problem for producingforage in all arid and semi-arid regions. Pearl millet is a key crop in these regions which needs relativelyless water than other crops. In this research, a field study was conducted to identify the best combinationof irrigation and nitrogen (N) management to achieve acceptable pearl millet forage both in quantity andquality aspects. Pearl millet was subjected to four irrigation treatments with interaction of N fertilizer (0,75, 150 and 225 kg ha−1). The irrigation treatments were 40%, 60%, 80% and 100% of total available soilwater (I40, I60, I80 and I100, respectively). The results showed that increasing moisture stress (from I40 toI100) resulted in progressively less total dry matter (TDM), leaf area index (LAI), and nitrogen utilizationefficiency (NUzE), while water use efficiency (WUE) and the percentage of crude protein (CP%) increased.The highest TDM and LAI were found to be 21.45 t ha−1 and 8.65, in I40 treatment, respectively. TDM,WUE, CP% and profit responses to N rates were positive. The maximum WUE of 4.19 kg DM/m3 wasachieved at I100 with 150 kg N ha−1. The results of this research indicate that the maximum profit of forageproduction was obtained in plots which were fully irrigated (I40) and received 225 kg N ha−1. However,in the situation which water is often limited and not available, application of 150 kg N ha−1 can producehigh forage quality and guaranty acceptable benefits for farmers.
© 2011 Elsevier B.V. All rights reserved.
1. Introduction
Pearl millet (Pennisetum americanum L.) is one of the mostimportant grain and forage cereals in arid and semi arid regions(Yadav and Bhatnagar, 2001). It needs relatively less water thanother crops and can grow in the regions which are too hot anddry for other crops such as sorghum (Singh and Singh, 1995).In these regions, low soil nitrogen and water stress are consid-ered as the main factors limiting productivity (Diouf et al., 2004;Zegada-Lizarazu and Iijima, 2005). Evaluating the forage produc-tion response of millet to irrigation in combination with nitrogenfertilizer could help to manage the resources. The effective man-agement to enhance economical returns by applying less water isa main goal in arid regions (Panda et al., 2004).
The first impact of water stress is reducing leaf number per plant(Golombek and Al-Ramamneh, 2002) and leaf area (Nagaz et al.,2009). Diouf et al. (2004), Winkel et al. (2001) and Van Oosteromet al. (2003) reported that water stress reduces forage yield and
∗ Corresponding author. Tel.: +98 9123879482; fax: +98 2612227606.E-mail address: [email protected] (M. Rostamza).
dry matter production of millet. However, under the drought con-ditions, more production per unit of water applied is the mainconcern (Zegada-Lizarazu and Iijima, 2005). Most of researchersfound beneficial increments in WUE under water stress (Zegada-Lizarazu and Iijima, 2005; Seghatoleslami et al., 2008; Nagaz et al.,2009).
The availability of nutrients is another factor that can affectyield. Nitrogen is one of the most important nutrients in all cropproduction systems (Shapiro et al., 2003; Maman et al., 2006).Generally, pearl millet has been known for growing under low Nmanagement (Gascho et al., 1995). Several studies showed that Napplication can increase millet production efficiently (Singh et al.,2010; Ayub et al., 2009; Maman et al., 2006). Also by consumingN fertilizer, N concentration and forage quality can increase (Dioufet al., 2004; Maman et al., 2006), but nitrogen use efficiency maydecline (Diouf et al., 2004; Maman et al., 2006).
There are few studies on evaluation of forage production abilityof this crop. Due to the rising demand for animal products, there is aneed to improve the forage production in arid environments. There-fore, the objective of this study was to identify the best combinationof irrigation and N management to achieve acceptable forage bothin quantity and quality aspects. This led to a simple optimization
0378-3774/$ – see front matter © 2011 Elsevier B.V. All rights reserved.doi:10.1016/j.agwat.2011.05.014
Author's personal copy
1608 M. Rostamza et al. / Agricultural Water Management 98 (2011) 1607– 1614
Table 1Physical properties of different layers of soil.
Soil depth (cm) Particle size distribution (%) Soil type Bulk density(g/cm3)
Field capacity (%gravimetrically)
Wilting point (%gravimetrically)
Clay Silt Sand
0–30 30.4 41.6 28 Clay-loam 1.5 23.6 11.630–60 38.6 35.2 26.4 Clay-loam 1.6 23.5 11.360–90 38.6 35.2 26 Clay-loam 1.63 23.7 11.1
of the net economic value of pearl millet forage based on qualityparameters, and the costs of nitrogen and water applied.
2. Methods and materials
A one year field experiment was conducted in experimentalfarm at College of Agriculture in University of Tehran in 2007 grow-ing season. The soil type was clay loam; in the 0–90 cm soil layer, thepercentage of organic carbon was 0.89. The N content was 0.11%, theexchangeable K and available P content were 214 and 7.5 mg kg−1,respectively, and pH was equal to 8. Some physical properties ofdifferent soil layers are given in Table 1. The average field capacityof root zone soil was 23%. The climate was arid to semiarid with theaverage of 250 mm rainfall per year. There was just 9.2 mm rainfallduring the experimental period after the irrigation schedules werestarted.
2.1. Field and experimental details
In this study pearl millet hybrid Nutrifeed (P. americanum var.Nutrifeed) was used as the crop material. This hybrid has very highforage quality for livestock and can be used as hay or silage.
After field preparations, the experimental area was divided into64 plots of 6 m × 3 m size. A buffer of 1.2 m between adjacent plotsin each replication and 2 m between replications were maintained.The seeds were sown on 11th of May in 2007 at a row spacing of60 cm and the plant spacing of 5 cm on the rows. This gave a densityof 333,333 plants per hectare. Plants were thinned to the desirabledensity 15 days after emergence. Forage cuts were made each timewhen plants in the wettest treatment (I40) reached 1 m height. So,there were three harvests. First, second and third harvests occurredat 87, 120 and 165 days after sowing (DAS), respectively. The fieldexperiment was designed as a 4 × 4 factorial in a randomized blockdesign with four replications. The first and second factors were irri-gation scheduling and nitrogen (N) application, respectively, whichare described below.
2.2. Irrigation treatments and scheduling
The irrigation treatments consisted of irrigation schedulingbased on manageable allowable deficit over 90 cm soil depth (Allenet al., 1998). The four irrigation treatments consisted of 40% deple-tion of total available soil water (ASW), 60% of ASW, 80% of ASWand 100% of ASW which are abbreviated to I40, I60, I80 and I100,respectively.
The beginning and end of each plot was closed to control thevolume of water. The plot slope was reduced to zero to control runoff. All the plots received the same amount of water for germinationto establishment. The irrigation treatments started 28 DAS whenthe plants completely established and were at tillering stage with4.3 leaves on their main stem by average. By measuring the soilwater content gravimetrically, the percentage depletion of ASW inthe effective root zone was estimated by Eq. (1) (Martin et al., 1990).
D (%) = 100 × 1n
n∑1
Fci − �i
Fci − WPi(1)
where D is the depletion, n is the number of sub-divisions of theeffective rooting depth used in the soil moisture sampling, Fci is thesoil moisture at field capacity for ith layer, �i is the soil moisture inith layer and WP is the soil moisture at wilting point.
The amount of water applied base of each treatment was calcu-lated as Eq. (2):
In = (Fc − �i) × D × A
100(2)
where In is the volume of irrigation water (m3), D is the effectiverooting depth (m) and A is the plot surface area (m2). The surfacearea of each plot was 18 m2. Each plot was watered individuallythrough the furrows. For serving water to experimental plots, irri-gation setup was consisted of an electric pump and two main PVCpipes with branches. The amount of water which was estimatedthrough Eq. (2) was applied to the furrows and measured by watermeter.
2.3. Nitrogen treatments
The plants were grown at four N levels (0, 75, 150 and225 kg N ha−1). The 50% of each N treatment was used for first har-vest as urea (18% at planting time and 32% broadcast at tilleringstage). The rest of fertilizer was divided equally for second and thirdharvest. Before sowing, 125 kg ha−1 P2O5 and 125 kg ha−1 K2O wereapplied to all treatments as super phosphate triple and potassiumsulfate fertilizers, respectively.
2.4. Data collection
2.4.1. Soil water contentFor monitoring the changes in soil water status, soil water con-
tent was determined gravimetrically. Soil was sampled with anauger at 0.10 m depth intervals to 1 m every 2 days. The soil sam-ples were dried in the oven at 105 ◦C for 24 h. Then the soil moisturewas calculated.
2.4.2. Biomass samplingIn this study, pearl millet was harvested for hay usage. Because
some plants were sampled during growing of pearl millet, a wellbordered area of 2.5 m2 for each cut (the three central rows) wereharvested by a mini mover. After measuring fresh weight of thetotal sample at field, a subsample of 1.5–2 kg was taken. In labora-tory, these samples were divided to leaf and stem. After measuringleaf area by leaf area meter (Delta-T, MK2, ENGLAND), plant partswere oven dried for 2 days at 75–80 ◦C and then total dry matter(TDM) of forage was calculated. For analyzing the forage quality,leaf and stem parts were mixed again and ground. The powder wassieved with 2 mm mesh. Then 200 g was taken out and analyzedwith Near Infra Red Spectrometry (NIR). The factors of crude pro-tein (CP), total digestible nutrient (TDN), acid detergent fiber (ADF),neutral detergent fiber (NDF) and ash were measured.
2.5. Water use efficiency calculation
Water use efficiency (WUE) can be based on either transpirationor evapotranspiration and grain yield or TDM (Passioura, 1983).
Author's personal copy
M. Rostamza et al. / Agricultural Water Management 98 (2011) 1607– 1614 1609
In this experiment the WUE was calculated as the TDM per unitevapotranspiration.
WUE = TDM ET−1 (3)
ET was calculated using Eq. (4) (Garrity et al., 1982):
ET = P + I − R − Dp ± �S (4)
where ET is crop water consumption (mm), P is rainfall (mm), I isirrigation water (mm), R is surface runoff (mm), Dp is deep percola-tion (mm), and �S is soil water content variation in crop root depth(mm). Therefore, total ET were calculated by summation of all ETduring growing season.
In this study, Dp and Rf in Eq. (5) were assumed to be negligible.Since the slope of each plot was near to zero and the amount ofirrigation water was only enough to reach to field capacity, so itwas also assumed that there was no deep percolation.
2.6. Measurements of chlorophyll content (SPAD), nitrogenutilization efficiency and nitrogen uptake
There is a close relationship between SPAD value and actualchlorophyll content and leaf greenness can be estimated using aSPAD meter. Thus, chlorophyll content of the upset fully expandedleaf on the plant was measured with a Minolta SPAD-502 chloro-phyll meter. Nine SPAD chlorophyll readings were taken on eachleaf, avoiding the midrib, and then the averaged value was recordedper plant. These leaves were collected for drying at 60 ◦C and Ncontent was measured by Kjeldahl methods.
Nitrogen utilization efficiency for biomass was calculated bydividing the above ground biomass by total N present in it(Maranville et al., 1980). Nitrogen uptake was determined as fol-lows:
Nitrogen uptake (kg N ha−1) = TDM × N concentration (5)
The protein percentage determined by NIR then the CP was dividedby 6.25 (Oikeh et al., 1998) for N concentration.
2.7. Economical evaluation
The economical value of pearl millet forage was calculated basedon TDN% and CP% which are critical factors to determine nutritionalvalue. The local price of pearl millet forage is 200$/t. There is a pos-itive relation between forage price and percentage of CP and TDN,thus the rate of increase in price tends to decline as CP% and TDN%reach the lowest amount. Therefore, by increasing the percentageof CP and TDN for each treatment the price of forage increased.Thus the revenue of forage DM is calculated by multiplying priceof forage based on CP% and TDN% and TDM production for eachtreatment. The price for each treatment was calculated as follows:
P =(
(0.55 × TDN%) + (0.45 × CP%)35.9
)× 200 (6)
where P is the price ($), TDN% is the percentage of TDN for eachtreatment, CP is the the percentage of CP for each treatment, 0.55,0.45 and 35.9 are constants of eqation and 200 is the price of1000 kg DM of pearl millet.
The total costs was calculated by summing of the waterused × water price and N used × N price. The price of 50 kg ureafertilizer and 1000 m−3 of water are 8$, and 12.5$, respectively.Here in our country, water is provided in subsidized prices by gov-ernment and so its price is very low. The profit was obtained bysubtracting the costs from the revenue.
0
5
10
15
20
25
30
35
40
OctoberSeptemberAugustJulyJuneMay
Months
Tem
pera
ture
(°C
)
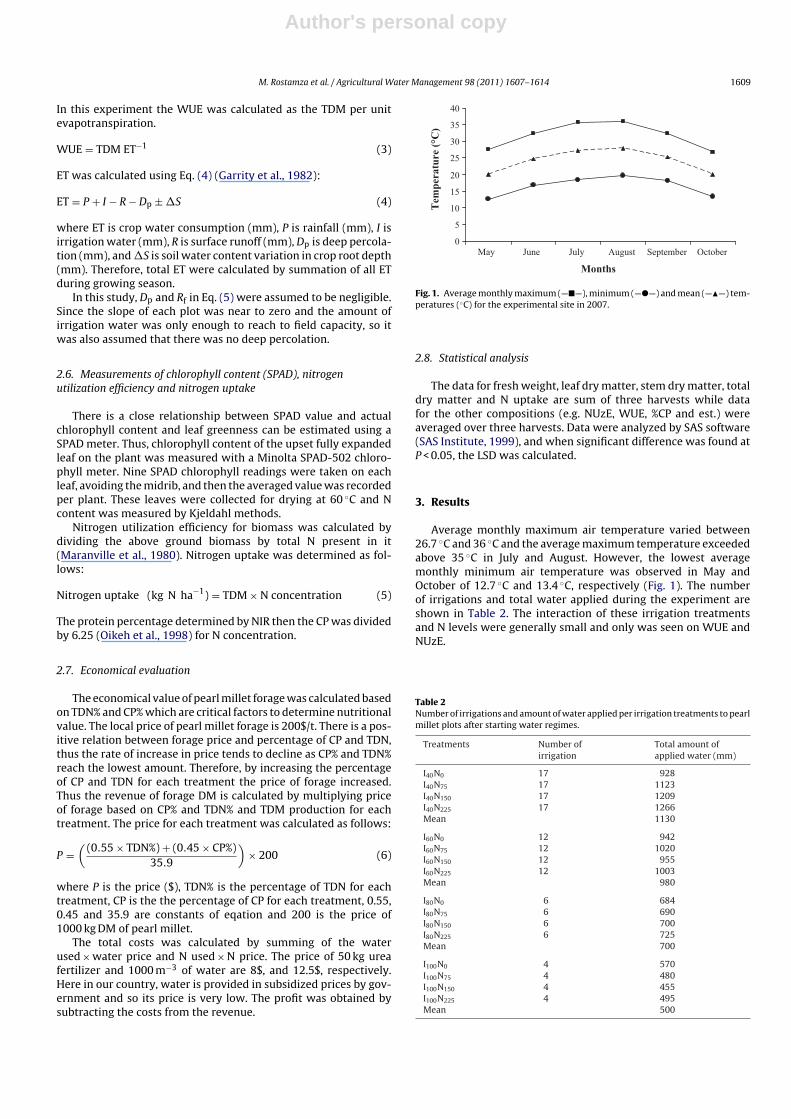
Fig. 1. Average monthly maximum (—�—), minimum (—�—) and mean (—�—) tem-peratures (◦C) for the experimental site in 2007.
2.8. Statistical analysis
The data for fresh weight, leaf dry matter, stem dry matter, totaldry matter and N uptake are sum of three harvests while datafor the other compositions (e.g. NUzE, WUE, %CP and est.) wereaveraged over three harvests. Data were analyzed by SAS software(SAS Institute, 1999), and when significant difference was found atP < 0.05, the LSD was calculated.
3. Results
Average monthly maximum air temperature varied between26.7 ◦C and 36 ◦C and the average maximum temperature exceededabove 35 ◦C in July and August. However, the lowest averagemonthly minimum air temperature was observed in May andOctober of 12.7 ◦C and 13.4 ◦C, respectively (Fig. 1). The numberof irrigations and total water applied during the experiment areshown in Table 2. The interaction of these irrigation treatmentsand N levels were generally small and only was seen on WUE andNUzE.
Table 2Number of irrigations and amount of water applied per irrigation treatments to pearlmillet plots after starting water regimes.
Treatments Number ofirrigation
Total amount ofapplied water (mm)
I40N0 17 928I40N75 17 1123I40N150 17 1209I40N225 17 1266Mean 1130
I60N0 12 942I60N75 12 1020I60N150 12 955I60N225 12 1003Mean 980
I80N0 6 684I80N75 6 690I80N150 6 700I80N225 6 725Mean 700
I100N0 4 570I100N75 4 480I100N150 4 455I100N225 4 495Mean 500
Author's personal copy
1610 M. Rostamza et al. / Agricultural Water Management 98 (2011) 1607– 1614
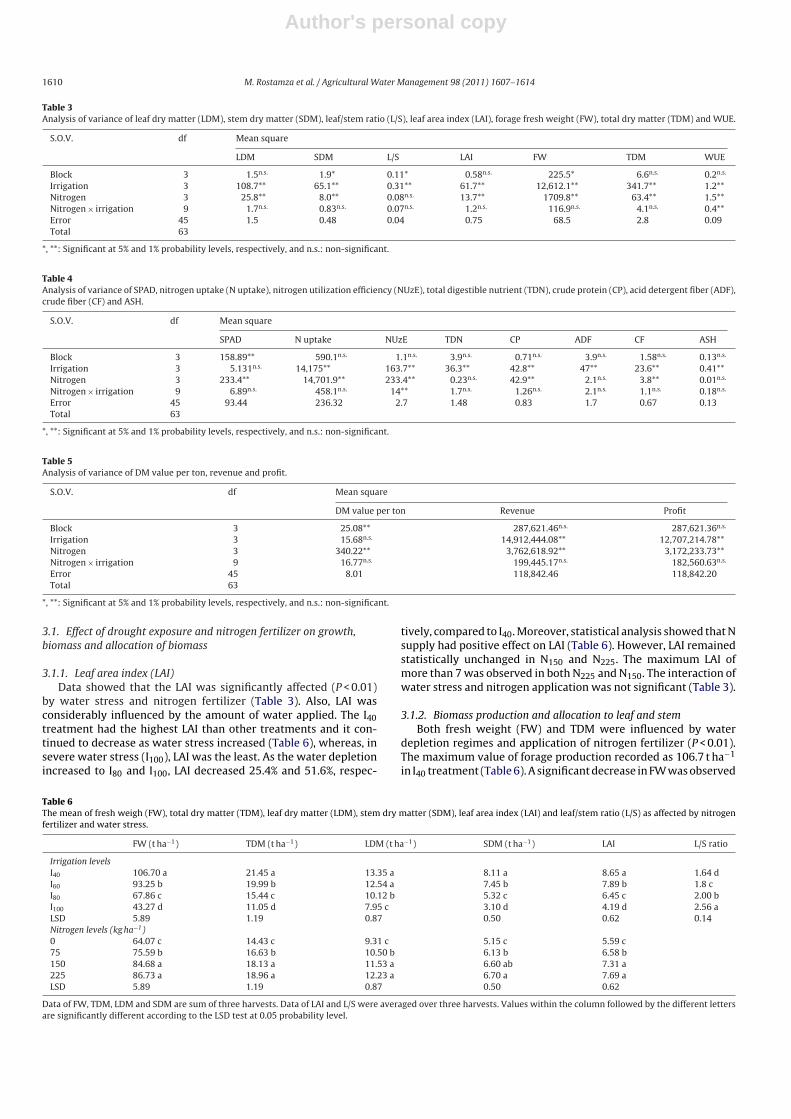
Table 3Analysis of variance of leaf dry matter (LDM), stem dry matter (SDM), leaf/stem ratio (L/S), leaf area index (LAI), forage fresh weight (FW), total dry matter (TDM) and WUE.
S.O.V. df Mean square
LDM SDM L/S LAI FW TDM WUE
Block 3 1.5n.s. 1.9* 0.11* 0.58n.s. 225.5* 6.6n.s. 0.2n.s.
Irrigation 3 108.7** 65.1** 0.31** 61.7** 12,612.1** 341.7** 1.2**Nitrogen 3 25.8** 8.0** 0.08n.s. 13.7** 1709.8** 63.4** 1.5**Nitrogen × irrigation 9 1.7n.s. 0.83n.s. 0.07n.s. 1.2n.s. 116.9n.s. 4.1n.s. 0.4**Error 45 1.5 0.48 0.04 0.75 68.5 2.8 0.09Total 63
*, **: Significant at 5% and 1% probability levels, respectively, and n.s.: non-significant.
Table 4Analysis of variance of SPAD, nitrogen uptake (N uptake), nitrogen utilization efficiency (NUzE), total digestible nutrient (TDN), crude protein (CP), acid detergent fiber (ADF),crude fiber (CF) and ASH.
S.O.V. df Mean square
SPAD N uptake NUzE TDN CP ADF CF ASH
Block 3 158.89** 590.1n.s. 1.1n.s. 3.9n.s. 0.71n.s. 3.9n.s. 1.58n.s. 0.13n.s.
Irrigation 3 5.131n.s. 14,175** 163.7** 36.3** 42.8** 47** 23.6** 0.41**Nitrogen 3 233.4** 14,701.9** 233.4** 0.23n.s. 42.9** 2.1n.s. 3.8** 0.01n.s.
Nitrogen × irrigation 9 6.89n.s. 458.1n.s. 14** 1.7n.s. 1.26n.s. 2.1n.s. 1.1n.s. 0.18n.s.
Error 45 93.44 236.32 2.7 1.48 0.83 1.7 0.67 0.13Total 63
*, **: Significant at 5% and 1% probability levels, respectively, and n.s.: non-significant.
Table 5Analysis of variance of DM value per ton, revenue and profit.
S.O.V. df Mean square
DM value per ton Revenue Profit
Block 3 25.08** 287,621.46n.s. 287,621.36n.s.
Irrigation 3 15.68n.s. 14,912,444.08** 12,707,214.78**Nitrogen 3 340.22** 3,762,618.92** 3,172,233.73**Nitrogen × irrigation 9 16.77n.s. 199,445.17n.s. 182,560.63n.s.
Error 45 8.01 118,842.46 118,842.20Total 63
*, **: Significant at 5% and 1% probability levels, respectively, and n.s.: non-significant.
3.1. Effect of drought exposure and nitrogen fertilizer on growth,biomass and allocation of biomass
3.1.1. Leaf area index (LAI)Data showed that the LAI was significantly affected (P < 0.01)
by water stress and nitrogen fertilizer (Table 3). Also, LAI wasconsiderably influenced by the amount of water applied. The I40treatment had the highest LAI than other treatments and it con-tinued to decrease as water stress increased (Table 6), whereas, insevere water stress (I100), LAI was the least. As the water depletionincreased to I80 and I100, LAI decreased 25.4% and 51.6%, respec-
tively, compared to I40. Moreover, statistical analysis showed that Nsupply had positive effect on LAI (Table 6). However, LAI remainedstatistically unchanged in N150 and N225. The maximum LAI ofmore than 7 was observed in both N225 and N150. The interaction ofwater stress and nitrogen application was not significant (Table 3).
3.1.2. Biomass production and allocation to leaf and stemBoth fresh weight (FW) and TDM were influenced by water
depletion regimes and application of nitrogen fertilizer (P < 0.01).The maximum value of forage production recorded as 106.7 t ha−1
in I40 treatment (Table 6). A significant decrease in FW was observed
Table 6The mean of fresh weigh (FW), total dry matter (TDM), leaf dry matter (LDM), stem dry matter (SDM), leaf area index (LAI) and leaf/stem ratio (L/S) as affected by nitrogenfertilizer and water stress.
FW (t ha−1) TDM (t ha−1) LDM (t ha−1) SDM (t ha−1) LAI L/S ratio
Irrigation levelsI40 106.70 a 21.45 a 13.35 a 8.11 a 8.65 a 1.64 dI60 93.25 b 19.99 b 12.54 a 7.45 b 7.89 b 1.8 cI80 67.86 c 15.44 c 10.12 b 5.32 c 6.45 c 2.00 bI100 43.27 d 11.05 d 7.95 c 3.10 d 4.19 d 2.56 aLSD 5.89 1.19 0.87 0.50 0.62 0.14Nitrogen levels (kg ha−1)0 64.07 c 14.43 c 9.31 c 5.15 c 5.59 c75 75.59 b 16.63 b 10.50 b 6.13 b 6.58 b150 84.68 a 18.13 a 11.53 a 6.60 ab 7.31 a225 86.73 a 18.96 a 12.23 a 6.70 a 7.69 aLSD 5.89 1.19 0.87 0.50 0.62
Data of FW, TDM, LDM and SDM are sum of three harvests. Data of LAI and L/S were averaged over three harvests. Values within the column followed by the different lettersare significantly different according to the LSD test at 0.05 probability level.
Author's personal copy
M. Rostamza et al. / Agricultural Water Management 98 (2011) 1607– 1614 1611
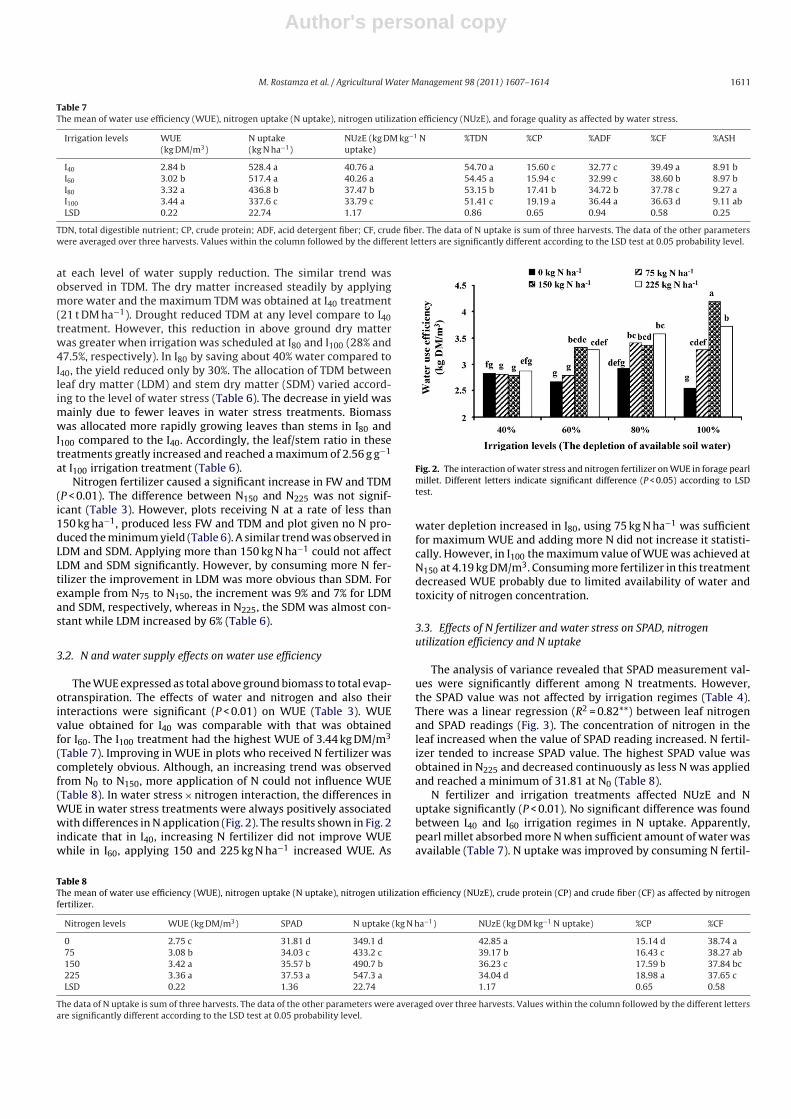
Table 7The mean of water use efficiency (WUE), nitrogen uptake (N uptake), nitrogen utilization efficiency (NUzE), and forage quality as affected by water stress.
Irrigation levels WUE(kg DM/m3)
N uptake(kg N ha−1)
NUzE (kg DM kg−1 Nuptake)
%TDN %CP %ADF %CF %ASH
I40 2.84 b 528.4 a 40.76 a 54.70 a 15.60 c 32.77 c 39.49 a 8.91 bI60 3.02 b 517.4 a 40.26 a 54.45 a 15.94 c 32.99 c 38.60 b 8.97 bI80 3.32 a 436.8 b 37.47 b 53.15 b 17.41 b 34.72 b 37.78 c 9.27 aI100 3.44 a 337.6 c 33.79 c 51.41 c 19.19 a 36.44 a 36.63 d 9.11 abLSD 0.22 22.74 1.17 0.86 0.65 0.94 0.58 0.25
TDN, total digestible nutrient; CP, crude protein; ADF, acid detergent fiber; CF, crude fiber. The data of N uptake is sum of three harvests. The data of the other parameterswere averaged over three harvests. Values within the column followed by the different letters are significantly different according to the LSD test at 0.05 probability level.
at each level of water supply reduction. The similar trend wasobserved in TDM. The dry matter increased steadily by applyingmore water and the maximum TDM was obtained at I40 treatment(21 t DM ha−1). Drought reduced TDM at any level compare to I40treatment. However, this reduction in above ground dry matterwas greater when irrigation was scheduled at I80 and I100 (28% and47.5%, respectively). In I80 by saving about 40% water compared toI40, the yield reduced only by 30%. The allocation of TDM betweenleaf dry matter (LDM) and stem dry matter (SDM) varied accord-ing to the level of water stress (Table 6). The decrease in yield wasmainly due to fewer leaves in water stress treatments. Biomasswas allocated more rapidly growing leaves than stems in I80 andI100 compared to the I40. Accordingly, the leaf/stem ratio in thesetreatments greatly increased and reached a maximum of 2.56 g g−1
at I100 irrigation treatment (Table 6).Nitrogen fertilizer caused a significant increase in FW and TDM
(P < 0.01). The difference between N150 and N225 was not signif-icant (Table 3). However, plots receiving N at a rate of less than150 kg ha−1, produced less FW and TDM and plot given no N pro-duced the minimum yield (Table 6). A similar trend was observed inLDM and SDM. Applying more than 150 kg N ha−1 could not affectLDM and SDM significantly. However, by consuming more N fer-tilizer the improvement in LDM was more obvious than SDM. Forexample from N75 to N150, the increment was 9% and 7% for LDMand SDM, respectively, whereas in N225, the SDM was almost con-stant while LDM increased by 6% (Table 6).
3.2. N and water supply effects on water use efficiency
The WUE expressed as total above ground biomass to total evap-otranspiration. The effects of water and nitrogen and also theirinteractions were significant (P < 0.01) on WUE (Table 3). WUEvalue obtained for I40 was comparable with that was obtainedfor I60. The I100 treatment had the highest WUE of 3.44 kg DM/m3
(Table 7). Improving in WUE in plots who received N fertilizer wascompletely obvious. Although, an increasing trend was observedfrom N0 to N150, more application of N could not influence WUE(Table 8). In water stress × nitrogen interaction, the differences inWUE in water stress treatments were always positively associatedwith differences in N application (Fig. 2). The results shown in Fig. 2indicate that in I40, increasing N fertilizer did not improve WUEwhile in I60, applying 150 and 225 kg N ha−1 increased WUE. As
Fig. 2. The interaction of water stress and nitrogen fertilizer on WUE in forage pearlmillet. Different letters indicate significant difference (P < 0.05) according to LSDtest.
water depletion increased in I80, using 75 kg N ha−1 was sufficientfor maximum WUE and adding more N did not increase it statisti-cally. However, in I100 the maximum value of WUE was achieved atN150 at 4.19 kg DM/m3. Consuming more fertilizer in this treatmentdecreased WUE probably due to limited availability of water andtoxicity of nitrogen concentration.
3.3. Effects of N fertilizer and water stress on SPAD, nitrogenutilization efficiency and N uptake
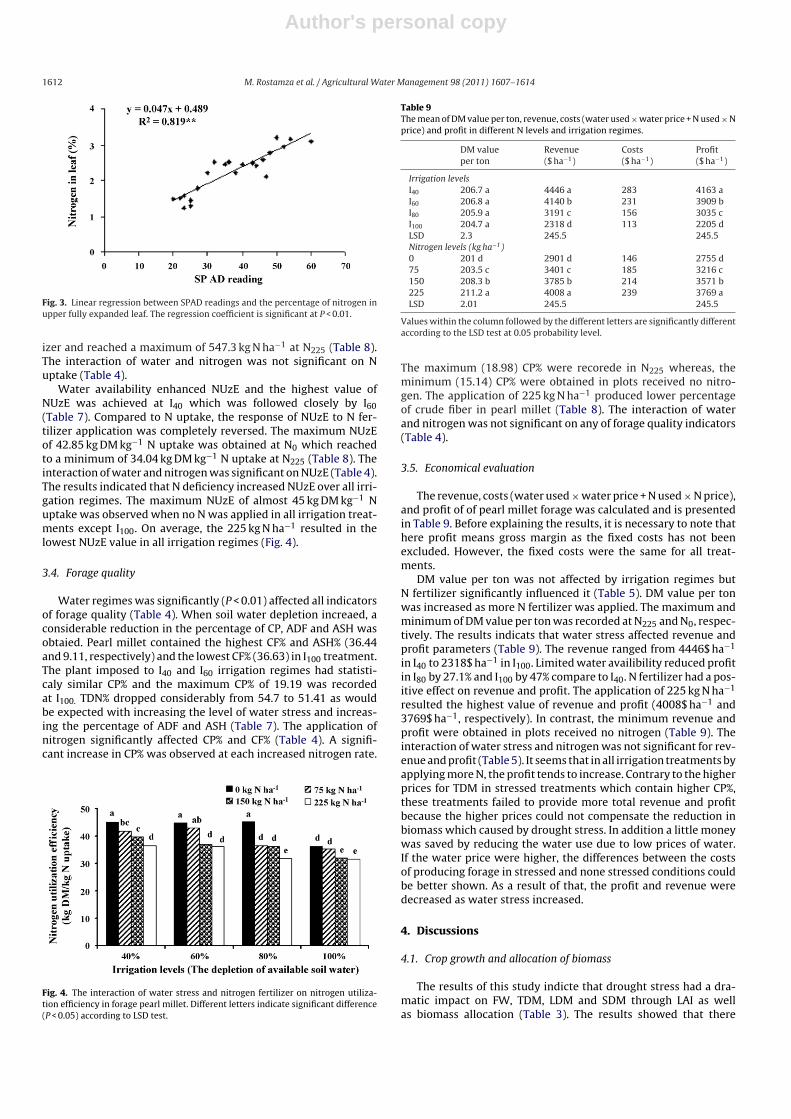
The analysis of variance revealed that SPAD measurement val-ues were significantly different among N treatments. However,the SPAD value was not affected by irrigation regimes (Table 4).There was a linear regression (R2 = 0.82**) between leaf nitrogenand SPAD readings (Fig. 3). The concentration of nitrogen in theleaf increased when the value of SPAD reading increased. N fertil-izer tended to increase SPAD value. The highest SPAD value wasobtained in N225 and decreased continuously as less N was appliedand reached a minimum of 31.81 at N0 (Table 8).
N fertilizer and irrigation treatments affected NUzE and Nuptake significantly (P < 0.01). No significant difference was foundbetween I40 and I60 irrigation regimes in N uptake. Apparently,pearl millet absorbed more N when sufficient amount of water wasavailable (Table 7). N uptake was improved by consuming N fertil-
Table 8The mean of water use efficiency (WUE), nitrogen uptake (N uptake), nitrogen utilization efficiency (NUzE), crude protein (CP) and crude fiber (CF) as affected by nitrogenfertilizer.
Nitrogen levels WUE (kg DM/m3) SPAD N uptake (kg N ha−1) NUzE (kg DM kg−1 N uptake) %CP %CF
0 2.75 c 31.81 d 349.1 d 42.85 a 15.14 d 38.74 a75 3.08 b 34.03 c 433.2 c 39.17 b 16.43 c 38.27 ab150 3.42 a 35.57 b 490.7 b 36.23 c 17.59 b 37.84 bc225 3.36 a 37.53 a 547.3 a 34.04 d 18.98 a 37.65 cLSD 0.22 1.36 22.74 1.17 0.65 0.58
The data of N uptake is sum of three harvests. The data of the other parameters were averaged over three harvests. Values within the column followed by the different lettersare significantly different according to the LSD test at 0.05 probability level.
Author's personal copy
1612 M. Rostamza et al. / Agricultural Water Management 98 (2011) 1607– 1614
Fig. 3. Linear regression between SPAD readings and the percentage of nitrogen inupper fully expanded leaf. The regression coefficient is significant at P < 0.01.
izer and reached a maximum of 547.3 kg N ha−1 at N225 (Table 8).The interaction of water and nitrogen was not significant on Nuptake (Table 4).
Water availability enhanced NUzE and the highest value ofNUzE was achieved at I40 which was followed closely by I60(Table 7). Compared to N uptake, the response of NUzE to N fer-tilizer application was completely reversed. The maximum NUzEof 42.85 kg DM kg−1 N uptake was obtained at N0 which reachedto a minimum of 34.04 kg DM kg−1 N uptake at N225 (Table 8). Theinteraction of water and nitrogen was significant on NUzE (Table 4).The results indicated that N deficiency increased NUzE over all irri-gation regimes. The maximum NUzE of almost 45 kg DM kg−1 Nuptake was observed when no N was applied in all irrigation treat-ments except I100. On average, the 225 kg N ha−1 resulted in thelowest NUzE value in all irrigation regimes (Fig. 4).
3.4. Forage quality
Water regimes was significantly (P < 0.01) affected all indicatorsof forage quality (Table 4). When soil water depletion increaed, aconsiderable reduction in the percentage of CP, ADF and ASH wasobtaied. Pearl millet contained the highest CF% and ASH% (36.44and 9.11, respectively) and the lowest CF% (36.63) in I100 treatment.The plant imposed to I40 and I60 irrigation regimes had statisti-caly similar CP% and the maximum CP% of 19.19 was recordedat I100. TDN% dropped considerably from 54.7 to 51.41 as wouldbe expected with increasing the level of water stress and increas-ing the percentage of ADF and ASH (Table 7). The application ofnitrogen significantly affected CP% and CF% (Table 4). A signifi-cant increase in CP% was observed at each increased nitrogen rate.
Fig. 4. The interaction of water stress and nitrogen fertilizer on nitrogen utiliza-tion efficiency in forage pearl millet. Different letters indicate significant difference(P < 0.05) according to LSD test.
Table 9The mean of DM value per ton, revenue, costs (water used × water price + N used × Nprice) and profit in different N levels and irrigation regimes.
DM valueper ton
Revenue($ ha−1)
Costs($ ha−1)
Profit($ ha−1)
Irrigation levelsI40 206.7 a 4446 a 283 4163 aI60 206.8 a 4140 b 231 3909 bI80 205.9 a 3191 c 156 3035 cI100 204.7 a 2318 d 113 2205 dLSD 2.3 245.5 245.5Nitrogen levels (kg ha−1)0 201 d 2901 d 146 2755 d75 203.5 c 3401 c 185 3216 c150 208.3 b 3785 b 214 3571 b225 211.2 a 4008 a 239 3769 aLSD 2.01 245.5 245.5
Values within the column followed by the different letters are significantly differentaccording to the LSD test at 0.05 probability level.
The maximum (18.98) CP% were recorede in N225 whereas, theminimum (15.14) CP% were obtained in plots received no nitro-gen. The application of 225 kg N ha−1 produced lower percentageof crude fiber in pearl millet (Table 8). The interaction of waterand nitrogen was not significant on any of forage quality indicators(Table 4).
3.5. Economical evaluation
The revenue, costs (water used × water price + N used × N price),and profit of of pearl millet forage was calculated and is presentedin Table 9. Before explaining the results, it is necessary to note thathere profit means gross margin as the fixed costs has not beenexcluded. However, the fixed costs were the same for all treat-ments.
DM value per ton was not affected by irrigation regimes butN fertilizer significantly influenced it (Table 5). DM value per tonwas increased as more N fertilizer was applied. The maximum andminimum of DM value per ton was recorded at N225 and N0, respec-tively. The results indicats that water stress affected revenue andprofit parameters (Table 9). The revenue ranged from 4446$ ha−1
in I40 to 2318$ ha−1 in I100. Limited water availibility reduced profitin I80 by 27.1% and I100 by 47% compare to I40. N fertilizer had a pos-itive effect on revenue and profit. The application of 225 kg N ha−1
resulted the highest value of revenue and profit (4008$ ha−1 and3769$ ha−1, respectively). In contrast, the minimum revenue andprofit were obtained in plots received no nitrogen (Table 9). Theinteraction of water stress and nitrogen was not significant for rev-enue and profit (Table 5). It seems that in all irrigation treatments byapplying more N, the profit tends to increase. Contrary to the higherprices for TDM in stressed treatments which contain higher CP%,these treatments failed to provide more total revenue and profitbecause the higher prices could not compensate the reduction inbiomass which caused by drought stress. In addition a little moneywas saved by reducing the water use due to low prices of water.If the water price were higher, the differences between the costsof producing forage in stressed and none stressed conditions couldbe better shown. As a result of that, the profit and revenue weredecreased as water stress increased.
4. Discussions
4.1. Crop growth and allocation of biomass
The results of this study indicte that drought stress had a dra-matic impact on FW, TDM, LDM and SDM through LAI as wellas biomass allocation (Table 3). The results showed that there
Author's personal copy
M. Rostamza et al. / Agricultural Water Management 98 (2011) 1607– 1614 1613
was a positive relationship between the drought intensity andthe reduction in LAI and dry matter. Limited water availibilitycaused reduction in TDM from 7% to 47.5% (Table 6) which issubestancially higher than this reduction reported by Kholová et al.(2010) in some pearl millet cultivars. The substantial increase ofTDM, LDM, SDM and LAI under conditions of high N availabilityindicates a pronounced N limitation for this forage crop underlow N input condition. A co-limitation of pearl millet by N avail-ability has been suggested by Singh et al. (2010), implying thatwith increasing water and N availability, above ground biomassincreased and reach the maximum of almost 10 t ha−1 under irri-gated condition with 120 kg N ha−1 at 60 DAS. Ayub et al. (2009)reported that the highest forage (67.14 t ha−1) and dry matter(19.83 t ha−1) were recorded when nitrogen was applied at rate of180 kg ha−1. The increase in TDM was mainly due to greater plantheight, number of leaves and tillers per plant (data not shown)and LAI (Ayub et al., 2009). It seems that pearl millet changed itsgrowth strategy through the biomass allocation when exposed towater stress. The low TDM in water stress conditions with less Nfertilizer appears to be due to more reduction in SDM than LDM(Kholová et al., 2010). Similar results have been reported in pearlmillet by Winkel et al. (1997) who demonstrated that droughtstress at 30 and 45 days after sowing during vegetative growthstage reduced stem and total biomass by 40% compared to con-trol. Indeed, in maize Gheysari et al. (2009) observed that SDMreduced (19%) more than LDM (11%) in droughted maize com-pare to frequently well watered ones by consuming 200 kg N ha−1.Although this reduction is less than the values found in this study,these results lend support to evidence that pearl millet is tryingto maintain LAI and LDM by reducing the height and less alloca-tion of biomass to stem. Hence, this can be associated with thefact that plants exposed to water stress served the photosyntheticsources to stay green and produce more DM. Moreover, the pros-trate growth habit by water stressed plants could be explainedby plant attempts to reduce evapotranspiration (Winkel et al.,1997).
4.2. Water use efficiency
These results clearly show that if a water stress occurred, WUEincreased. Generally, under optimum irrigation (I40) and mini-mum N fertilizer (N0), WUE was the least. The results shown inTable 7 reveal that WUE ranged from 2.84 kg DM/m3 in fully irri-gation to 3.44 kg DM/m3 in svear stress condition (I100). Theseresults support findings of Zegada-Lizarazu and Iijima (2005) whoreported WUE incresed from 3.91 kg DM/m3 in well-watered con-dition to 4.19 kg DM/m3 in drought condition. Although, waterstress increased WUE in Nagaz et al. (2009) research, the WUEvalues was much higher than our results. They found that WUEreach the maximum of 7.59 kg DM/m3 in 60% ET wich was almost15% higher than control treatment. Our founding is in contrastto Brück et al. (2000) who reported that in pearl millet noeffect of water stress on WUE was detactable. Our observationin this study showed that application of N fertilizer had a syner-gic effect on WUE indicating that consumption of 150 kg N ha−1
resulted the highest WUE in I100 of 4.19 kg DM/m3 (Table 8). Theresponse to N fertilizer got stronger as water depletion increased(Fig. 2). Increasing in WUE in rainfed condition by consuming60 kg N ha−1 have aslo been obsorved by Singh et al. (2010).Our observation also corresponds to Mustafa and Abdelmajid(1982) results, who reported that in the interrelationships ofirrigation frequencies and levels of nitrogen on forage sorghumgrowth, by applying 131 kg N ha−1 WUE was observed of 4.33,3.93 and 2.9 kg mm−1 in 7, 10 and 15 days irrigation intervals,respectively.
4.3. SPAD, NUzE and N uptake
Leaf chlorophyll content was not altered by irrigation deficit(Table 4) but decreased significantly and linearly with decreasedN supply (Schlemmer et al., 2005). As leaf greenness (SPAD value)in pearl millet was positively correlated to leaf N concentration(Fig. 3), this would indicate that leaf N content decreased withlower N treatments and leaves became progressively yellow withgreater N deficits. These results were in agreement with Buah andMwinkaara (2009) who demonestrated that increasing N levels sig-nificantly increased SPAD values and 120 kg N ha−1 had the highestSPAD value. Generally, farmers would use effectively use a SPADmeter to recommend N application rates to meet certain yield goals.
NUzE in pearl millet was considered in relation either to soilwater (Table 7) or to N availability (Table 8). In coincidence withthe findings by O’ Neill et al. (2004) NUzE increased by more wateravailability. Sarr et al. (2008) reported NUE of 45.88 in well-watermanagement which is close to our finding. The decline in N levelsresulted a linear reduction in NUzE. Although, Maman et al. (2006)reported that NUzE decreased by 0.22–0.37 kg DM kg−1 N uptakefor each kg ha−1 N applied, this reduction in our study was only0.05 to 0.04 kg DM kg−1 N uptake. In addition, Ali (2010) stated thatNUE of pearl millet dropped to the minimum of 13.35 kg DM kg−1
N by application of 150 kg N ha−1.Nitrogen uptake (Table 7) decreased as irrigation deficits were
imposed, and total uptake was dependent on amount of applied N.Similar results have been reported for pearl millet (Maman et al.,2006) and corn (Di Paolo and Rinaldi, 2008). Singh et al. (2010)reported that maximum N uptake efficiency for pearl millet grainyield was obtained in irrigated crop with 30 kg N ha−1 and it pro-gressively decreased with higher doses of N. In this study the resultsshowed that under water scarcity N uptake decreased because Ndemand by plants is reduced, as growth rate is diminished. More-over, the absorption of N by roots requires the presence of waterin the soil, as it is the agent that transports solutes to the soil-rootinterface (Garwood and Williams, 1967). Consequently, in compar-ison to other findings, NUzE and N uptake is higher in our study. Itcould be contributed mainly to physiology of crop, crop manage-ment and ability of each variety to use resources.
4.4. Chemical composition
These results clearly indicate that if a water stress occurredCP%, CF% and ASH% increased while TDN% and ADF% had a reversetrend (Table 7). These results were partially in agreement withSasani (2004) who found that digestibility of pearl millet leaf drymatter decreased in severe stress and reach 57.31 but ADF% wasunchanged through different irrigation schedules. Based on hisdata, the maximum CP% of 16.5 in leaves was obsorved at severestress. Our founding is partly in contrast to Montgomery (2008)who reported that irrigation levels did not affect CP% and TDN%in corn, while ADF% was 23.4% in hybrids subjected to water stress(50% ET) and was 20.7% in hybrids irrigated at 100% ET. Based on thedata of Ward et al. (2001), pearl millet under no water limitationhad 14.2 and 37.7 CP% and ADF%, respectively.
The observation showed that application of N fertilizer had adramatic effect on CP% and CF% (Table 8), indicating that consump-tion of 225 kg N ha−1 resulted the highest (18.89) and the lowets(37.65) CP% and CF%, respectively. Although, increasing in CP% byN application were reported in several literatures, the percentageof CP was higher in our study. For instance, CP% of 8.67 (Ayub et al.,2009), 8.5 (Abd El-Lattief, 2011) and 9.9 (Muir et al., 1999) werereported at 180 kg N ha−1 for pearl millet. The increase in N fertil-izer improved considerably N uptake (Table 8) and this, in turn,would contribute to large photosynthesic activity and synthesis ofhigher protein content.
Author's personal copy
1614 M. Rostamza et al. / Agricultural Water Management 98 (2011) 1607– 1614
5. Conclusion
This paper developed a crop eco-physiological framework toexplain the interaction of water and nitrogen on pearl millet for-age yield, quality, WUE and NUzE. Irrigation scheme managers areoften confronted with the issue of intensive (full irrigation) versusextensive (to cover more area with deficit irrigation) to providemore production for community demand. The results of this studyclearly demonstrate that FW and TDM responded positively to irri-gation and N fertilizer. Thus, Farmers who access to enough waterby applying 150 kg N ha−1 can produce high forage quality and canget acceptable benefit from their investment. However, in the sit-uation which water is often limited and not available at all cropgrowth stages, the same amount of N must be used to maximize,yield, quality and profit. Since the cost of irrigation water in thisregion is reasonably low, policies should be changed to reducewater consumption. Therefore, it could be recommended to useless irrigation on more land to increase WUE, forage quality andprofit than to use fully irrigation on less land.
Acknowledgements
We are most grateful to Prof. Dr. R.A. Fischer and Dr. W.A. Paynefor their valuable comments on the manuscript. Financial supportfor this study was provided by University of Tehran.
References
Abd El-Lattief, E.A., 2011. Growth and fodder of forage pearl millet in newly cul-tivated land as affected by date of planting and integrated use of mineral andorganic fertilizers. Asian J. Plant Sci. 3, 35–42.
Ali, E.A., 2010. Grain yield and nitrogen use efficiency of pearl millet as affected byplant density, nitrogen rate and splitting in sandy soil. Am.-Eurasian J. Agric.Environ. Sci. 7, 327–335.
Allen, R.G., Pereira, L.S., Raes, D., Smith, M., 1998. FAO Irrigation and Drainage PaperNo. 56 – Crop Evapotranspiration, Tech. Rep., FAO.
Ayub, M., Nadeem, M.A., Tahir, M., Ibrahim, M., Aslam, M.N., 2009. Effect of nitrogenapplication and harvesting intervals on forage yield and quality of pearl millet(Pennisetum americanum L.). Pak. J. Life Soc. Sci. 7, 185–189.
Buah, S.S.J., Mwinkaara, S., 2009. Response of sorghum to nitrogen fertilizer andplant density in the Guinea Savanna Zone. J. Agron. 8, 1–7.
Brück, H., Payne, W.A., Sattelmacher, B., 2000. Effects of phosphorus and watersupply on yield, transpirational water-use efficiency, and carbon isotope dis-crimination of pearl millet. Crop Sci. 40, 120–125.
Di Paolo, E., Rinaldi, M., 2008. Yield response of corn to irrigation and nitrogenfertilization in a Mediterranean environment. Field Crops Res. 105, 202–210.
Diouf, O., Brou, Y.C., Diouf, M., Sarr, B., Eyletters, M., Roy-Macauley, H., Delhaye, J.P.,2004. Response of Pearl Millet to nitrogen as affected by water deficit. Agronomie24, 77–84.
Garrity, D.P., Watts, D.G., Sullivan, C.Y., Gilley, J.R., 1982. Moisture deficits andgrain-sorghum performance evapotranspiration yield relationships. Agron. J. 74,815–820.
Gascho, G.J., Menezes, R.S.C., Hanna, W.W., Hubbard, R.K., Wilson, J.P., 1995. Nutrientrequirements of pearl millet. In: National Grain Pearl Millet Symposium ,. RuralIndustries Research and Development Corporation, Barton, ACT, Australia, pp.92–97.
Gheysari, M., Mirlatifi, S.M., Bannayan, M., Homaee, M., Hoogenboom, G., 2009. Inter-action of water and nitrogen on maize grown for silage. Agric. Water Manage.96, 809–821.
Golombek, S., Al-Ramamneh, E.A.-D., 2002. Drought Tolerance Mechanisms of PearlMillet. Challenges to Organic Farming and Sustainable Land Use in the Tropicsand Subtropics. University of Kassel, Institute of Crop Science, Germany.
Garwood, E.A., Williams, T.E., 1967. Growth, water use and nutrient uptake from thesubsoil by grass swards. J. Agric. Sci. 69, 125–130.
Kholová, J., Hash, T., Kakkera, A., Kocová, M., Vadez, V., 2010. Constitutive water-conserving mechanisms are correlated with the terminal drought tolerance ofpearl millet [Pennisetum glaucum (L.) R. Br.]. J. Exp. Bot. 61, 369–377.
Maman, N., Mason, S.C., Lyon, D.J., 2006. Nitrogen rate influence on pearl milletyield, nitrogen uptake, and nitrogen use efficiency in Nebraska. Commun. SoilSci. Plant Anal. 37, 127–141.
Maranville, J.W., Clark, R.B., Ross, W.M., 1980. Nitrogen efficiency in grain-sorghum.J. Plant Nutr. 2, 577–589.
Martin, D.L., Stegman, E.C., Freres, E., 1990. Irrigation scheduling principles. In: Hoff-man, G.L., Howell, T.A., Solomon, K.H. (Eds.), Management of Farm IrrigationSystems. American Society of Agricultural Engineers Monograph, pp. 155–372.
Montgomery, R., 2008. Influence of Corn Hybrids and Water Stress on Yield andNutritive Value. Plant and Soil Science. Texas Tech University, p. 52.
Muir, J.P., Prostko, E., Stokes, S., 1999. The Effect of Dairy Manure on Summer AnnualGrasses Grown as Alternative Silages on the Cross Timbers. Stephenville Agric.Res. and Ext. Center. University of Texas A&M, p. 8.
Mustafa, M.A., Abdelmajid, E.A., 1982. Interrelationships of irrigation frequency, ureanitrogen, and gypsum on forage sorghum growth on a saline sodic clay soil.Agron. J. 74, 447–451.
Nagaz, K., Masmoudi, M.M., Mechila, N.B., 2009. Yield and water use-efficiency ofpearl millet (Pennisetum glaucum (L.) R. Br.) under deficit irrigation with salinewater in arid conditions of Southern Tunisia. J. Agron. 3, 9–17.
O’ Neill, P.M., Shanahana, J.F., Schepersa, J.S., Caldwell, B., 2004. Agronomic responsesof corn hybrids from different areas to deficit and adequate level of water andnitrogen. Agron. J. 96, 1660–1667.
Oikeh, S.O., Kling, J.G., Okoruwa, A.E., 1998. Nitrogen fertilizer management effectson maize grain quality in the west African Moist Savanna. Crop Sci. 38,1056–1161.
Panda, R.K., Behera, S.K., Kashyap, P.S., 2004. Effective management of irrigationwater for maize under stressed conditions. Agric. Water Manage. 66, 181–203.
Passioura, J.B., 1983. Roots and drought resistance. Agric. Water Manage. 7, 265–280.Sarr, P.S., Khouma, M., Sene, M., Guisse, A., 2008. Effect of pearl millet–cowpea
cropping systems on nitrogen recovery, nitrogen use efficiency and biologicalfixation using the 15N tracer technique. Soil Sci. Plant Nutr. 54, 142–147.
SAS Institute, 1999. SAS/STAT User’s Guide, Version 8.1. SAS Institute, Cary, NC.Sasani, S., 2004. The effects of deficit irrigation on water-use efficiency, yield, and
quality of forage pearl millet. In: Agronomy and Plant Breeding. University ofTehran, p. 150.
Schlemmer, M.R., Francis, D.D., Shanahan, J.F., Schepers, J.S., 2005. Remotely measur-ing chlorophyll content in corn leaves with differing nitrogen levels and relativewater content. Agron. J. 97, 106–112.
Seghatoleslami, M.J., Kafi, M., Majidi, E., 2008. Effect of deficit irrigation on yield,WUE and some morphological and phenological traits of three millet species.Pak. J. Bot. 40, 1555–1560.
Shapiro, C.A., Ferguson, R.B., Hergert, G.W., Doberman, A.R., Wortman, C.S., 2003.Fertilizer suggestions for corn. NebGuide G74-174-A. Cooperative Extension,Institute of Agriculture and Natural Resources, University of Nebraska–Lincoln,Lincoln, NE (2001). Ext. Publ. G74-174-A. Nebraska Coop. Ext., Univ. of Nebraska,Lincoln.
Singh, B.R., Singh, D.P., 1995. Agronomic and physiological responses of sorghum,maize and pearl millet to irrigation. Field Crops Res. 42, 57–67.
Singh, R.K., Chakraborty, D., Garg, R.N., Sharmay, P.K., Sharma, U.C., 2010. Effect ofdifferent water regimes and nitrogen application on growth, yield, water useand nitrogen uptake by pearl millet (Pennisetum glaucum). Indian J. Agric. Sci.80, 213–216.
Van Oosterom, E.J., Bidinger, F.R., Weltzien, E.R., 2003. A yield architecture frame-work to explain adaptation of pearl millet to environmental stress. Field CropsRes. 80, 33–56.
Ward, J.D., Redfearn, D.D., McCormick, M.E., Cuomo, G.J., 2001. Chemical compo-sition, ensiling characteristics, and apparent digestibility of summer annualforages in a subtropical double-cropping system with annual ryegrass. J. DairySci. Plant Prod. Sci. 84, 177–182.
Winkel, T., Renno, J.F., Payne, W.A., 1997. Effect of the timing of water deficit ongrowth, phenology and yield of pearl millet (Pennisetum glaucum (L.) R. Br.)grown in Sahelian conditions. J. Exp. Bot. 48, 1001–1009.
Winkel, T., Payne, W., Renno, J.F., 2001. Ontogeny modifies the effect of water stresson stomatal control, leaf area duration and biomass partitioning of Pennisetumglaucum. New Phytol. 149, 71–82.
Yadav, O.P., Bhatnagar, S.K., 2001. Evaluation of indices for identification of pearlmillet cultivars adapted to stress and non-stress conditions. Field Crops Res. 10,201–208.
Zegada-Lizarazu, W., Iijima, M., 2005. Deep root water uptake ability and water useefficiency of pearl millet in comparison to other millet species. Plant Prod. Sci.8, 454–460.