Functional differences in the allometry of the water, carbon and nitrogen content of gelatinous...
12
Functional differences in the allometry of the water, carbon and nitrogen content of gelatinous organisms A. MOLINA-RAMI ´ REZ 1 *, C. CA ´ CERES 1 , S. ROMERO-ROMERO 1 , J. BUENO 2 , J.I. GONZA ´ LEZ-GORDILLO 3 , X. IRIGOIEN 4 , J. SOSTRES 1 , A. BODE 5 , C. MOMPEA ´ N 5 , M.L. FERNA ´ NDEZ PUELLES 6 , F. ECHEVARRIA 3 , C.M. Q1 DUARTE 4,7 AND J.L. Q2 ACUN ˜ A 1 1 DEPARTAMENTO BOS, UNIVERSIDAD DE OVIEDO, CATEDRA ´ TICO RODRIGO URI ´ A, SN, 33071 OVIEDO, SPAIN, 2 DEPARTAMENTO DE BIOLOGIA, CESAM-CENTRO DE ESTUDIOS DO AMBIENTE E DO MAR, UNIVERSIDADE DE AVEIRO, 3810-193 AVEIRO, PORTUGAL, 3 AVENIDA REPU ´ BLICA SAHARAUI, S/N, CAMPUS UNIVERSITARIO DE PUERTO REAL, UNIVERSIDAD DE CA ´ DIZ, 11510 PUERTO REAL, CA ´ DIZ, SPAIN, 4 RED SEA RESEARCH CENTER, KING ABDULLAHH UNIVERSITY OF SCIENCE AND TECHNOLOGY , 23955-6900 THUWAL, SAUDI ARABIA, 5 CENTRO OCEANOGRA ´ FICO DE A CORUN ˜ A, INSTITUTO ESPAN ˜ OL DE OCEANOGRAFI ´ A, APDO. 130, 15080 A CORUN ˜ A, SPAIN, 6 CENTRO OCEANOGRA ´ FICO DE BALEARES, MUELLE DE PONIENTE, INSTITUTO ESPAN ˜ OL DE OCEANOGRAFI ´ A, S/N APDO. 291, 07015 PALMA DE MALLORCA, SPAIN AND 7 INSTITUTO MEDITERRA ´ NEO DE ESTUDIOS AVANZADOS—CONSEJO SUPERIOR DE INVESTIGACIONES, CALLE MIQUEL MARQUE ´ S, 21, 07190 ESPORLES, ISLAS BALEARES, SPAIN *CORRESPONDING AUTHOR: [email protected] Received December 15, 2014; accepted April 19, 2015 Corresponding editor: Roger Harris We have supplemented available, concurrent measurements of fresh weight (W , g) and body carbon (C, g) (46 indivi- duals, 14 species) and nitrogen (N, g) (11individuals, 9 species) of marine gelatinous animals with data obtained during the global ocean MALASPINA 2010 expedition (totalling 267 individuals and 33 species for the W versus C data; totalling 232 individuals and 31 species for the N versus C data). We then used those datato test the allometric properties of the W versus C and N versus C relationships. Overall, gelatinous organisms contain 1.13 + 1.57% of C (by weight, mean + SD) in their bodies and show a C:N of 4.56 + 2.46, respectively, although estimations can be improved by using separate conversion coefficients for the carnivores and the filter feeders. Reduced major axis regres- sion indicates that W increases isometrically with C in the carnivores (cnidarians and ctenophores), implying that their water content can be described by a single conversion coefficient of 173.78 gW(g C) 21 , or a C content of 1.17 + 1.90% by weight, although there is much variability due to the existence of carbon-dense species. In contrast, W increases more rapidly than C in the filter feeders (salps and doliolids), according to a power relationship W ¼ 446.68C 1.54 . This exponent is not significantly different from 1.2, which is consistent with the idea that the watery bodies of gelatinous animals represent an evolutionary response towards increasing food capture surfaces, i.e. a bottom-up rather than a top-down mechanism. Thus, the available evidence negates a bottom-up mechanism in the carnivores, but supports it in the filter feeders. Last, N increases isometrically with C in both carnivores and filter feeders with C:N ratios of 3.89 + 1.34 and 4.38 + 1.21, respectively. These values are similar to those of compact, Copy Edited by: A.K. Language used: UK/ize available online at www.plankt.oxfordjournals.org # The Author 2015. Published by Oxford University Press. All rights reserved. For permissions, please email: [email protected] Journal of Plankton Research plankt.oxfordjournals.org J. Plankton Res. (2015) 0(0): 1–12. First published online Month 00, 0000 doi:10.1093/plankt/fbv037 5 10 15 20 25 30 35 40 45 50 55 60 65 70 75 80 85 90 95 100 105
Transcript of Functional differences in the allometry of the water, carbon and nitrogen content of gelatinous...

Functional differences in the allometry ofthe water, carbon and nitrogen contentof gelatinous organisms
A. MOLINA-RAMIREZ1*, C. CACERES1, S. ROMERO-ROMERO1, J. BUENO2, J.I. GONZALEZ-GORDILLO3, X. IRIGOIEN4,
J. SOSTRES1, A. BODE5, C. MOMPEAN5, M.L. FERNANDEZ PUELLES6, F. ECHEVARRIA3, C.M.Q1 DUARTE4,7 AND J.L.
Q2ACUNA1
1DEPARTAMENTO BOS, UNIVERSIDAD DE OVIEDO, CATEDRATICO RODRIGO URIA, SN, 33071 OVIEDO, SPAIN, 2DEPARTAMENTO DE BIOLOGIA, CESAM-CENTRO DE
ESTUDIOS DO AMBIENTE E DO MAR, UNIVERSIDADE DE AVEIRO, 3810-193 AVEIRO, PORTUGAL, 3AVENIDA REPUBLICA SAHARAUI, S/N, CAMPUS UNIVERSITARIO DE
PUERTO REAL, UNIVERSIDAD DE CADIZ, 11510 PUERTO REAL, CADIZ, SPAIN, 4RED SEA RESEARCH CENTER, KING ABDULLAHH UNIVERSITY OF SCIENCE AND
TECHNOLOGY, 23955-6900 THUWAL, SAUDI ARABIA, 5CENTRO OCEANOGRAFICO DE A CORUNA, INSTITUTO ESPANOL DE OCEANOGRAFIA, APDO. 130, 15080 A
CORUNA, SPAIN, 6CENTRO OCEANOGRAFICO DE BALEARES, MUELLE DE PONIENTE, INSTITUTO ESPANOL DE OCEANOGRAFIA, S/N APDO. 291, 07015 PALMA DE
MALLORCA, SPAIN AND7
INSTITUTO MEDITERRANEO DE ESTUDIOS AVANZADOS—CONSEJO SUPERIOR DE INVESTIGACIONES, CALLE MIQUEL MARQUES, 21, 07190ESPORLES, ISLAS BALEARES, SPAIN
*CORRESPONDING AUTHOR: [email protected]
Received December 15, 2014; accepted April 19, 2015
Corresponding editor: Roger Harris
We have supplemented available, concurrent measurements of fresh weight (W, g) and body carbon (C, g) (46 indivi-duals, 14 species) and nitrogen (N, g) (11individuals, 9 species) of marine gelatinous animals with data obtainedduring the global ocean MALASPINA 2010 expedition (totalling 267 individuals and 33 species for the W versus Cdata; totalling 232 individuals and 31 species for the N versus C data). We then used those data to test the allometricproperties of the W versus C and N versus C relationships. Overall, gelatinous organisms contain 1.13+ 1.57% of C(by weight, mean+SD) in their bodies and show a C:N of 4.56+ 2.46, respectively, although estimations can beimproved by using separate conversion coefficients for the carnivores and the filter feeders. Reduced major axis regres-sion indicates that W increases isometrically with C in the carnivores (cnidarians and ctenophores), implying that theirwater content can be described by a single conversion coefficient of 173.78 gW(g C)21, or a C content of 1.17+1.90% by weight, although there is much variability due to the existence of carbon-dense species. In contrast, W
increases more rapidly than C in the filter feeders (salps and doliolids), according to a power relationship W ¼
446.68C1.54. This exponent is not significantly different from 1.2, which is consistent with the idea that the waterybodies of gelatinous animals represent an evolutionary response towards increasing food capture surfaces, i.e. abottom-up rather than a top-down mechanism. Thus, the available evidence negates a bottom-up mechanism in thecarnivores, but supports it in the filter feeders. Last, N increases isometrically with C in both carnivores and filterfeeders with C:N ratios of 3.89+ 1.34 and 4.38+ 1.21, respectively. These values are similar to those of compact,
Copy Edited by: A.K.Language used: UK/ize
available online at www.plankt.oxfordjournals.org
# The Author 2015. Published by Oxford University Press. All rights reserved. For permissions, please email: [email protected]
Journal of
Plankton Research plankt.oxfordjournals.org
J. Plankton Res. (2015) 0(0): 1–12. First published online Month 00, 0000 doi:10.1093/plankt/fbv037
5
10
15
20
25
30
35
40
45
50
55
60
65
70
75
80
85
90
95
100
105

non-gelatinous organisms and reflect a predominantly herbivorous diet in the filter feeders, which is confirmed by adifference of one trophic level between filter feeders and carnivores, according to stable N isotope enrichment data.
KEYWORDS: gelatinous organisms; allometry; carbon content; water content; body weight
I N T RO D U C T I O N
Marine pelagic and neustonic animals tend to displayeither low (i.e. crustaceans, gastropods, larval fish) orhigh (i.e. ctenophores, cnidarians, tunicates) water con-tents in their bodies, with comparatively few species oc-cupying an intermediate position (i.e. chaetognaths,pteropod molluscs, polychaetes) (Vinogradov, 1953;Kiørboe, 2013). Such a gap between alternative bodyplans, and the sheer taxonomic diversity of gelatinousorganisms, points to some fundamental cause for theirevolution (Kiørboe, 2013). According to top-down expla-nations, gelatinous bodies have evolved as a strategy toevade predation, due to their transparency, low nutritivevalue and large relative size (Hamner et al., 1975; Verityand Smetacek, 1996; Johnsen and Widder, 1998;Johnsen, 2000). The alternative, bottom-up explanation,proposes the existence of a functional difference in food-gathering strategy among gelatinous and non-gelatinousanimals (Harbison, 1992; Acuna, 2001; Acuna et al.,2011; Kiørboe, 2013). While non-gelatinous animalswould be capable of remote sensorial detection of theirprey, gelatinous animals would depend upon directcontact with several types of feeding surfaces. Suchprocess may be passive, and depend solely on the motilityof the prey (as in many siphonophores, some scyphozo-ans and ctenophores), or may depend on the active gen-eration of water currents which bring the prey intocontact with the feeding surfaces (as in the filter-feedingsalps and cruising scyphozoans and ctenophores).Theoretical consideration of the costs and benefits offilter feeding (Acuna, 2001) and cruising predation(Acuna et al., 2011) suggests that the typically low preydensities of the ocean would require exceedingly largefeeding surfaces, hence a need for a large, gelatinous sus-taining structure.
A low metabolic rate has also been suggested as one ofthe main advantages of gelatinous bodies (e.g. Alldredgeand Madin, 1982). Certainly, because of their high watercontent and low concentration of metabolizing organicsubstances, gelatinous organisms exhibit much lowermetabolic rates than those of non-gelatinous animals ofsimilar linear or volumetric dimension (e.g. Acuna et al.,2011; Pitt et al., 2013). However, earlier studies showedthat carbon-specific excretion and respiration rates didnot differ significantly among gelatinous and non-gelatinous
organisms, suggesting that C may be a better proxy forbody size than W, the body volume, the dry weight or theconcentration of biological macromolecules (Schneider,1990, 1992). Further work has shown that such nor-malization works particularly well for the respiration rate(R), where the allometric power relationship R ¼ aCb
has similar coefficients for both gelatinous and non-gelatinous animals (Acuna et al., 2011; Pitt et al., 2013).Allometric regressions for the excretion and the growthrates also preserve the value of the power exponent b, al-though excretion rates are 10 times lower and growthrates 2 times higher in gelatinous than in non-gelatinousanimals (i.e. there is a difference in the coefficient a; Pittet al., 2013). Such discrepancies are likely due to funda-mental, ecophysiological differences between gelatinousand non-gelatinous organisms (Pitt et al., 2013).Consequently, C rather than W is usually the variable ofinterest when building ecophysiological, population orecosystem energy budgets.
In non-gelatinous animals, body carbon content canbe reasonably estimated from the dry weight or by CHNanalysis of dried samples (Schneider, 1992; Postel et al.,2000; Kiørboe, 2013), but dried gelatinous animals tendto contain large amounts of salt and residual water(Larson, 1986), and their preparation for CHN analysisrequires a cumbersome drying process. Furthermore, un-planned encounter with swarms of gelatinous animalsmay require tools for simple estimation of individualcarbon from measurements of the individual freshweight, which could be easily achieved with appropriateequations to estimate individual C from W. All of thestudies comparing the allometry of gelatinous and non-gelatinous animals (e.g. Schneider, 1990, 1992; Acunaet al., 2011; Kiørboe, 2013; Pitt et al., 2013) have relied onthe same set of published coefficients to transform the dif-ferent body size units to a common carbon currency foreach species or recognizable taxonomic group [a compil-ation of most of those coefficients can be visited in Lucaset al. (Lucas et al., 2011)]. Those studies have shown thatW in gelatinous organisms (or the body volume) scalesisometrically with C, that is, W ¼ aCb, where b ¼ 1(Kiørboe, 2013; Pitt et al., 2013). This means that, as inthe non-gelatinous organisms, the water content of gelat-inous organisms (or the quotient W/C) is independent ofthe body carbon C, which has been interpreted as asymptom that some evolutionary limit on the water
JOURNAL OF PLANKTON RESEARCH j VOLUME 0 j NUMBER 0 j PAGES 1–12 j 2015
2
110
115
120
125
130
135
140
145
150
155
160
165
170
175
180
185
190
195
200
205
210

content of a gelatinous body plan has been reached(Kiørboe, 2013). It also means that the body carbon canbe easily estimated for a given taxon by multiplying thebody volume or W by certain, taxon-specific coefficient(Kiørboe, 2013). Unfortunately, this important and usefulallometric generalization rests on a limited and taxonom-ically biased data set, with the tunicates as the only groupwith sufficient concurrent individual observations of bothW and C (n ¼ 38) to produce a meaningful regression(Kiørboe, 2013). In addition, a majority of those concur-rent observations of W and C rely on conversion coeffi-cients to estimate either W or C, which involves somedegree of pseudoreplication.
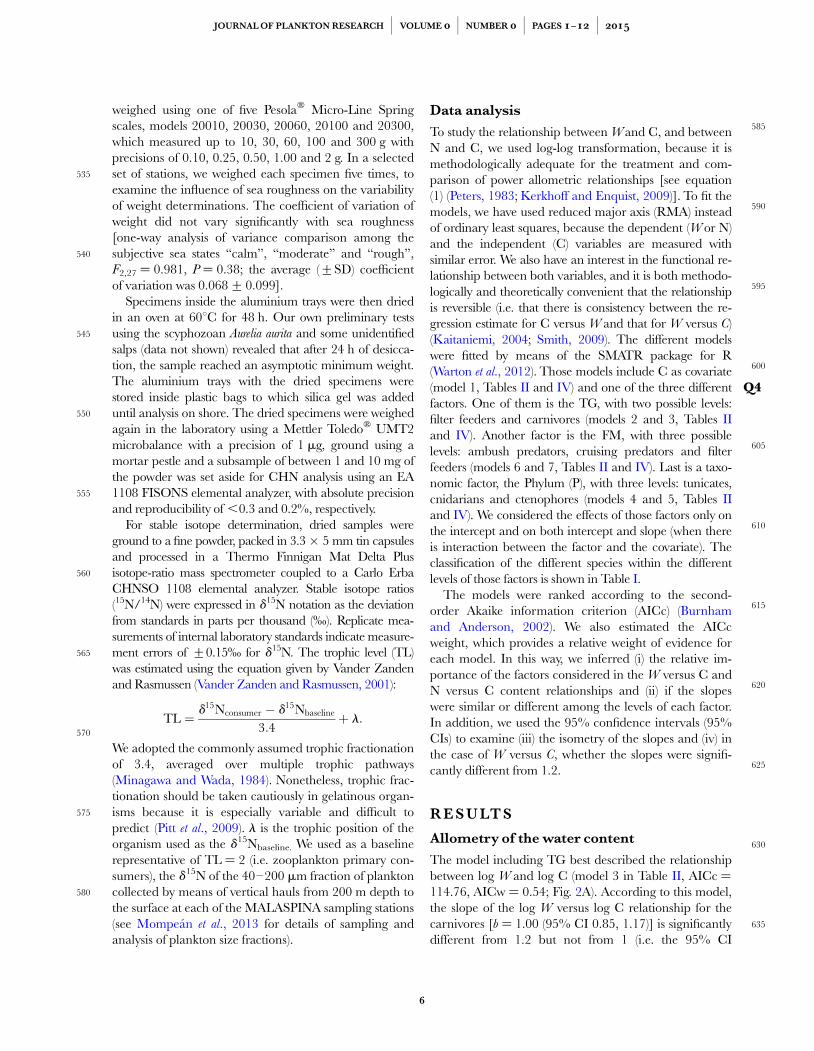
In this paper, we revise the W, C and N content of gel-atinous organisms using only those sources where bothW and C or N and C have been measured concurrently,thus not being estimated from conversion coefficients. Toincrease the sample size, and to achieve a more balancedtaxonomic representation, we have sampled gelatinousneuston and plankton along the track of the globalMALASPINA 2010 Expedition (Fig. 1Q3 ), and processedthose samples using a standard protocol. We thenfocused our analysis on examination of the allometricproperties of the W versus C and N versus C relationship.For the exploration, we partitioned the data into taxo-nomic categories (Phyla), trophic guilds (TG) (carnivoresversus filter feeders) or feeding mechanisms (FMs) (filterfeeders, ambush predators, cruising predators). Carnivorescapture larger prey using external collection surfaces,while filter feeders capture smaller prey using internalcollection filters. Since smaller prey tend to be moreabundant, and usually contain a larger proportion ofphytoplankton, we expect differences in C and N contentamong carnivores and filter feeders. At a finer functionallevel, the energy spent in prey collection depends greatlyon prey availability in the ambush predators, which waitfor the prey, and less in the cruising predators, which
swim constantly to search for prey. As a means to charac-terize differences in the trophic position among thesefunctional groups, we conducted a stable isotope analysis.Last, we tested whether the water content of these taxo-nomic or functional categories is independent of size (i.e.whether the exponent of the power functions relating W
or N with C is 1) or instead increases with size, in whichcase it would lend support to current theories on theorigin of gelatinous bodies (see next section on theoreticalconsiderations).
S O M E T H E O R E T I CA LCO N S I D E R AT I O N S O N T H EA L LO M E T RY O F T H E W V E R S U S CR E L AT I O N S H I P
We will assume that the allometry of the fresh bodyweight of gelatinous animals is adequately described bythe power relationship
W ¼ aCb; ð1Þ
where a and b are parameters. All published evidencepoints to the idea that W increases isometrically with C,that is, b ¼ 1 (Pitt et al., 2013; Kiørboe, 2013). This expo-nent is perfectly valid from an empirical point of view,but we are also concerned with its consistency withcurrent theories to explain the evolution of gelatinousbodies. In particular, the bottom-up approach contendsthat the heavily inflated bodies of gelatinous organismsmay represent a structural adaptation to support largecollection surfaces in endemically low food environments(i.e. Harbison, 1992; Acuna, 2001; Acuna et al., 2011;Kiørboe, 2013). The question is what value of b shouldwe expect if this theory were true? To follow is a briefallometric derivation showing that a value of b�1.2 iswhat best conforms to the bottom-up theory.
Fig. 1. Geographic location of the MALASPINA 2010 Expedition stations, indicating those where gelatinous neuston were (dots) and were not(crosses) collected for C, N and Wanalysis (see Table I for correspondence between species and stations).
A. MOLINA-RAMIREZ ET AL. j GELATINOUS ZOOPLANKTON ALLOMETRIC C AND N RELATIONSHIPS
3
215
220
225
230
235
240
245
250
255
260
265
270
275
280
285
290
295
300
305
310
315

According to this theory, the energy intake E is directlyproportional to the total feeding surface S, thus E / S.The feeding surface is sustained by a body structure, thuslarger bodies should sustain larger surfaces. Such depen-dence can be expressed by a power relationship betweenthe feeding surface S and the body volume Vof the kind S
/ V x. Last, in a watery organism, the body volumeshould be directly proportional to the body fresh weightW, and the body fresh weight should depend on a powerfunction of the body carbon such that V / W / Cb. Theabove considerations can be summarized as
E / S / V x /W x / Cbx: ð2Þ
In addition, previous research indicates that the metabol-ic demand, described by the respiration rate, is bestexpressed as a power function of the carbon content.
R/ C y: ð3Þ
The bottom-up theory to explain the evolution of highbody water content in gelatinous animals indicates thatthe energy intake E, given in equation (2), should at leastfulfil the metabolic demand R given in equation (3), thatis E / R. If this is true, we can combine the right-handterms of equations (2) and (3) and arrive at Cbx / C y
which, in turn, implies that bx ¼ y. Solving for b, we have
b ¼ y
x; ð4Þ
where b is the slope of the power allometric function re-lating the fresh body weight W with the body carbon C.
Thus, the actual value of b according to equation (3)will depend on the values of y and x. In principle, x couldvary between 2/3 (that is, S / V2/3) if the feeding surfaceis flat, to 1 (that is, S / V) if the feeding surface has aspace-filling, fractal geometry (Mandelbrot, 1983).However, the feeding surfaces of pelagic tunicates(Acuna, 2001), scyphozoans and ctenophores (Colinet al., 2010; Acuna et al., 2011) are typically flat, thusx�2/3. Moreover, according to reviews on the respir-ation rates of gelatinous organisms, we know that y�0.8(Acuna et al., 2011; Pitt et al., 2013). Therefore, accordingto equation (4), b ¼ y/x ¼ 0.8/(2/3) ¼ 1.2.
M E T H O D
Data set
Our data set consists of concurrent measurements suchas W, C and N in individuals or groups of individuals ofseveral species of ctenophores, tunicates and cnidarians.Table I offers a summary of data and sources, pooled forthe lowest level of taxonomic identification (the full dataset can be consulted in the Supplementary Material,
Table SI). We did not include semi-gelatinous zooplank-ton as tunicate appendicularians and thecosomate ptero-pods, because they do not have gelatinous bodies,although their strategy of expanding large, gelatinousfood collection structures is essentially the same as that oftrue gelatinous organisms (Acuna, 2001; Kiørboe, 2013).Part of the data originate from published articles anddata compilations (46 individuals, 14 species for the W
versus C data; 11 individuals, 10 species for the N versusC data), and we refer to the original articles for details onmethods (Table I). The rest of data were collected duringthe global MALASPINA 2010 Expedition, for which wenext provide detailed information (totalling 267 indivi-duals and 33 species for the W versus C data, and 232individuals and 31 species for the N versus C data).
Sampling methods
The MALASPINA 2010 Expedition took place aboardthe Spanish research vessel “BIO Hesperides” A33 from 15December 2010 to 11 July 2011 in the Atlantic, Indianand Pacific Oceans (Fig. 1, Table I). Gelatinous neustonicand planktonic specimens were sampled with a neustonnet made of a rectangular stainless-steel frame attachedto two longitudinal floats at its sides, with a mouthopening of 80 � 30 cm, of which �10 cm remainedabove sea level. The mesh had a pore size of 200 mm andwas equipped with a General OceanicsTM flowmeter toestimate the volume of water filtered. At each station, thenet was towed from a crane at 2 knots for 10 min at a dis-tance of 5 m from the starboard side of the hull. Twotows were done at each station, before sunrise (4:00 a.m.)and at noon.
Gelatinous specimens retained in the cod-end werequickly collected with a 5 mm mesh size sieve cup, trans-ferred to a jar filled with filtered seawater and placedinside a cooler for at least 1 h to allow for defecation oftheir gut contents. They were then placed on a tray andsorted into morphologically distinct categories, which weconsidered separate taxa. The first specimen of a giventaxon was preserved in formalin for taxonomic analysis.The following two, if available, were preserved in abso-lute ethanol for genetic analysis (data not presentedhere). Any remaining specimens used in a destructiveanalysis of wet weight and elemental composition. Eachof those animals was photographed on a Kaiser RE PRO5602 motorized reprography column with a Canon EOSMark III DSLR camera using a transparent polycar-bonate stands to allow inferior illumination by anElinchrome 600 W flash unit. The animal was thenplaced on a 200 mm mesh sieve which was blotted ondesiccant paper until no trace of excess water was left,placed on small pre-weighted aluminium trays, and
JOURNAL OF PLANKTON RESEARCH j VOLUME 0 j NUMBER 0 j PAGES 1–12 j 2015
4
320
325
330
335
340
345
350
355
360
365
370
375
380
385
390
395
400
405
410
415
420
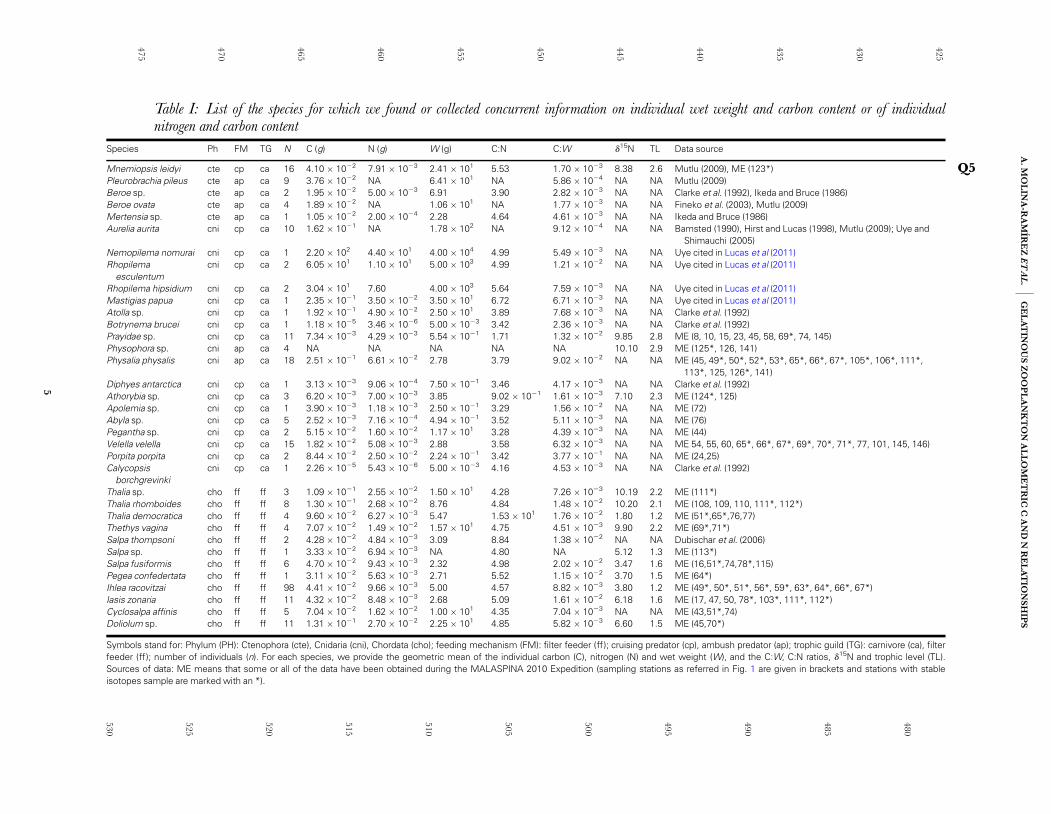
Table I: List of the species for which we found or collected concurrent information on individual wet weight and carbon content or of individualnitrogen and carbon content
Species Ph FM TG N C (g) N (g) W (g) C:N C:W d15N TL Data source
Mnemiopsis leidyi cte cp ca 16 4.10 � 1022 7.91 � 1023 2.41 � 101 5.53 1.70 � 1023 8.38 2.6 Mutlu (2009), ME (123*) Q5Pleurobrachia pileus cte ap ca 9 3.76 � 1022 NA 6.41 � 101 NA 5.86 � 1024 NA NA Mutlu (2009)Beroe sp. cte ap ca 2 1.95 � 1022 5.00 � 1023 6.91 3.90 2.82 � 1023 NA NA Clarke et al. (1992), Ikeda and Bruce (1986)Beroe ovata cte ap ca 4 1.89 � 1022 NA 1.06 � 101 NA 1.77 � 1023 NA NA Fineko et al. (2003), Mutlu (2009)Mertensia sp. cte ap ca 1 1.05 � 1022 2.00 � 1024 2.28 4.64 4.61 � 1023 NA NA Ikeda and Bruce (1986)Aurelia aurita cni cp ca 10 1.62 � 1021 NA 1.78 � 102 NA 9.12 � 1024 NA NA Bamsted (1990), Hirst and Lucas (1998), Mutlu (2009); Uye and
Shimauchi (2005)Nemopilema nomurai cni cp ca 1 2.20 � 102 4.40 � 101 4.00 � 104 4.99 5.49 � 1023 NA NA Uye cited in Lucas et al (2011)Rhopilema
esculentumcni cp ca 2 6.05 � 101 1.10 � 101 5.00 � 103 4.99 1.21 � 1022 NA NA Uye cited in Lucas et al (2011)
Rhopilema hipsidium cni cp ca 2 3.04 � 101 7.60 4.00 � 103 5.64 7.59 � 1023 NA NA Uye cited in Lucas et al (2011)Mastigias papua cni cp ca 1 2.35 � 1021 3.50 � 1022 3.50 � 101 6.72 6.71 � 1023 NA NA Uye cited in Lucas et al (2011)Atolla sp. cni cp ca 1 1.92 � 1021 4.90 � 1022 2.50 � 101 3.89 7.68 � 1023 NA NA Clarke et al. (1992)Botrynema brucei cni cp ca 1 1.18 � 1025 3.46 � 1026 5.00 � 1023 3.42 2.36 � 1023 NA NA Clarke et al. (1992)Prayidae sp. cni cp ca 11 7.34 � 1023 4.29 � 1023 5.54 � 1021 1.71 1.32 � 1022 9.85 2.8 ME (8, 10, 15, 23, 45, 58, 69*, 74, 145)Physophora sp. cni ap ca 4 NA NA NA NA NA 10.10 2.9 ME (125*, 126, 141)Physalia physalis cni ap ca 18 2.51 � 1021 6.61 � 1022 2.78 3.79 9.02 � 1022 NA NA ME (45, 49*, 50*, 52*, 53*, 65*, 66*, 67*, 105*, 106*, 111*,
113*, 125, 126*, 141)Diphyes antarctica cni cp ca 1 3.13 � 1023 9.06 � 1024 7.50 � 1021 3.46 4.17 � 1023 NA NA Clarke et al. (1992)Athorybia sp. cni cp ca 3 6.20 � 1023 7.00 � 1023 3.85 9.02 � 1021 1.61 � 1023 7.10 2.3 ME (124*, 125)Apolemia sp. cni cp ca 1 3.90 � 1023 1.18 � 1023 2.50 � 1021 3.29 1.56 � 1022 NA NA ME (72)Abyla sp. cni cp ca 5 2.52 � 1023 7.16 � 1024 4.94 � 1021 3.52 5.11 � 1023 NA NA ME (76)Pegantha sp. cni cp ca 2 5.15 � 1022 1.60 � 1022 1.17 � 101 3.28 4.39 � 1023 NA NA ME (44)Velella velella cni cp ca 15 1.82 � 1022 5.08 � 1023 2.88 3.58 6.32 � 1023 NA NA ME 54, 55, 60, 65*, 66*, 67*, 69*, 70*, 71*, 77, 101, 145, 146)Porpita porpita cni cp ca 2 8.44 � 1022 2.50 � 1022 2.24 � 1021 3.42 3.77 � 1021 NA NA ME (24,25)Calycopsis
borchgrevinkicni cp ca 1 2.26 � 1025 5.43 � 1026 5.00 � 1023 4.16 4.53 � 1023 NA NA Clarke et al. (1992)
Thalia sp. cho ff ff 3 1.09 � 1021 2.55 � 1022 1.50 � 101 4.28 7.26 � 1023 10.19 2.2 ME (111*)Thalia rhomboides cho ff ff 8 1.30 � 1021 2.68 � 1022 8.76 4.84 1.48 � 1022 10.20 2.1 ME (108, 109, 110, 111*, 112*)Thalia democratica cho ff ff 4 9.60 � 1022 6.27 � 1023 5.47 1.53 � 101 1.76 � 1022 1.80 1.2 ME (51*,65*,76,77)Thethys vagina cho ff ff 4 7.07 � 1022 1.49 � 1022 1.57 � 101 4.75 4.51 � 1023 9.90 2.2 ME (69*,71*)Salpa thompsoni cho ff ff 2 4.28 � 1022 4.84 � 1023 3.09 8.84 1.38 � 1022 NA NA Dubischar et al. (2006)Salpa sp. cho ff ff 1 3.33 � 1022 6.94 � 1023 NA 4.80 NA 5.12 1.3 ME (113*)Salpa fusiformis cho ff ff 6 4.70 � 1022 9.43 � 1023 2.32 4.98 2.02 � 1022 3.47 1.6 ME (16,51*,74,78*,115)Pegea confedertata cho ff ff 1 3.11 � 1022 5.63 � 1023 2.71 5.52 1.15 � 1022 3.70 1.5 ME (64*)Ihlea racovitzai cho ff ff 98 4.41 � 1022 9.66 � 1023 5.00 4.57 8.82 � 1023 3.80 1.2 ME (49*, 50*, 51*, 56*, 59*, 63*, 64*, 66*, 67*)Iasis zonaria cho ff ff 11 4.32 � 1022 8.48 � 1023 2.68 5.09 1.61 � 1022 6.18 1.6 ME (17, 47, 50, 78*, 103*, 111*, 112*)Cyclosalpa affinis cho ff ff 5 7.04 � 1022 1.62 � 1022 1.00 � 101 4.35 7.04 � 1023 NA NA ME (43,51*,74)Doliolum sp. cho ff ff 11 1.31 � 1021 2.70 � 1022 2.25 � 101 4.85 5.82 � 1023 6.60 1.5 ME (45,70*)
Symbols stand for: Phylum (PH): Ctenophora (cte), Cnidaria (cni), Chordata (cho); feeding mechanism (FM): filter feeder (ff ); cruising predator (cp), ambush predator (ap); trophic guild (TG): carnivore (ca), filterfeeder (ff); number of individuals (n). For each species, we provide the geometric mean of the individual carbon (C), nitrogen (N) and wet weight (W), and the C:W, C:N ratios, d15N and trophic level (TL).Sources of data: ME means that some or all of the data have been obtained during the MALASPINA 2010 Expedition (sampling stations as referred in Fig. 1 are given in brackets and stations with stableisotopes sample are marked with an *).
A.
MO
LIN
A-R
AM
IRE
ZE
TA
L.j
GE
LA
TIN
OU
SZ
OO
PL
AN
KT
ON
AL
LO
ME
TR
ICC
AN
DN
RE
LA
TIO
NS
HIP
S
5
425
430
435
440
445
450
455
460
465
470
475
480
485
490
495
500
505
510
515
520
525
530
weighed using one of five Pesolaw Micro-Line Springscales, models 20010, 20030, 20060, 20100 and 20300,which measured up to 10, 30, 60, 100 and 300 g withprecisions of 0.10, 0.25, 0.50, 1.00 and 2 g. In a selectedset of stations, we weighed each specimen five times, toexamine the influence of sea roughness on the variabilityof weight determinations. The coefficient of variation ofweight did not vary significantly with sea roughness[one-way analysis of variance comparison among thesubjective sea states “calm”, “moderate” and “rough”,F2,27 ¼ 0.981, P ¼ 0.38; the average (+SD) coefficientof variation was 0.068+ 0.099].
Specimens inside the aluminium trays were then driedin an oven at 608C for 48 h. Our own preliminary testsusing the scyphozoan Aurelia aurita and some unidentifiedsalps (data not shown) revealed that after 24 h of desicca-tion, the sample reached an asymptotic minimum weight.The aluminium trays with the dried specimens werestored inside plastic bags to which silica gel was addeduntil analysis on shore. The dried specimens were weighedagain in the laboratory using a Mettler Toledow UMT2microbalance with a precision of 1 mg, ground using amortar pestle and a subsample of between 1 and 10 mg ofthe powder was set aside for CHN analysis using an EA1108 FISONS elemental analyzer, with absolute precisionand reproducibility of ,0.3 and 0.2%, respectively.
For stable isotope determination, dried samples wereground to a fine powder, packed in 3.3� 5 mm tin capsulesand processed in a Thermo Finnigan Mat Delta Plusisotope-ratio mass spectrometer coupled to a Carlo ErbaCHNSO 1108 elemental analyzer. Stable isotope ratios(15N/14N) were expressed in d15N notation as the deviationfrom standards in parts per thousand (‰). Replicate mea-surements of internal laboratory standards indicate measure-ment errors of +0.15‰ for d15N. The trophic level (TL)was estimated using the equation given by Vander Zandenand Rasmussen (Vander Zanden and Rasmussen, 2001):
TL ¼ d15Nconsumer � d15Nbaseline
3:4þ l:
We adopted the commonly assumed trophic fractionationof 3.4, averaged over multiple trophic pathways(Minagawa and Wada, 1984). Nonetheless, trophic frac-tionation should be taken cautiously in gelatinous organ-isms because it is especially variable and difficult topredict (Pitt et al., 2009). l is the trophic position of theorganism used as the d15Nbaseline. We used as a baselinerepresentative of TL ¼ 2 (i.e. zooplankton primary con-sumers), the d15N of the 40–200 mm fraction of planktoncollected by means of vertical hauls from 200 m depth tothe surface at each of the MALASPINA sampling stations(see Mompean et al., 2013 for details of sampling andanalysis of plankton size fractions).
Data analysis
To study the relationship between Wand C, and betweenN and C, we used log-log transformation, because it ismethodologically adequate for the treatment and com-parison of power allometric relationships [see equation(1) (Peters, 1983; Kerkhoff and Enquist, 2009)]. To fit themodels, we have used reduced major axis (RMA) insteadof ordinary least squares, because the dependent (W or N)and the independent (C) variables are measured withsimilar error. We also have an interest in the functional re-lationship between both variables, and it is both methodo-logically and theoretically convenient that the relationshipis reversible (i.e. that there is consistency between the re-gression estimate for C versus W and that for W versus C)(Kaitaniemi, 2004; Smith, 2009). The different modelswere fitted by means of the SMATR package for R(Warton et al., 2012). Those models include C as covariate(model 1, Tables II and IV) and one Q4of the three differentfactors. One of them is the TG, with two possible levels:filter feeders and carnivores (models 2 and 3, Tables IIand IV). Another factor is the FM, with three possiblelevels: ambush predators, cruising predators and filterfeeders (models 6 and 7, Tables II and IV). Last is a taxo-nomic factor, the Phylum (P), with three levels: tunicates,cnidarians and ctenophores (models 4 and 5, Tables IIand IV). We considered the effects of those factors only onthe intercept and on both intercept and slope (when thereis interaction between the factor and the covariate). Theclassification of the different species within the differentlevels of those factors is shown in Table I.
The models were ranked according to the second-order Akaike information criterion (AICc) (Burnhamand Anderson, 2002). We also estimated the AICcweight, which provides a relative weight of evidence foreach model. In this way, we inferred (i) the relative im-portance of the factors considered in the W versus C andN versus C content relationships and (ii) if the slopeswere similar or different among the levels of each factor.In addition, we used the 95% confidence intervals (95%CIs) to examine (iii) the isometry of the slopes and (iv) inthe case of W versus C, whether the slopes were signifi-cantly different from 1.2.
R E S U LT S
Allometry of the water content
The model including TG best described the relationshipbetween log W and log C (model 3 in Table II, AICc ¼114.76, AICw ¼ 0.54; Fig. 2A). According to this model,the slope of the log W versus log C relationship for thecarnivores [b ¼ 1.00 (95% CI 0.85, 1.17)] is significantlydifferent from 1.2 but not from 1 (i.e. the 95% CI
JOURNAL OF PLANKTON RESEARCH j VOLUME 0 j NUMBER 0 j PAGES 1–12 j 2015
6
535
540
545
550
555
560
565
570
575
580
585
590
595
600
605
610
615
620
625
630
635

envelopes a value of 1 but not a value of 1.2, Table II).The fact that W ¼ 173.78C implies that, in the carni-vores, the individual body water content (defined as W/C) and the percentage carbon (defined as %C ¼
100�C/W) are approximately constant and independentof C (Table II). In contrast, the slope for the filter feeders[1.54 (95% CI 1.11, 2.13)] was significantly higher than1 but statistically indistinguishable from 1.2 (Table II).This implies that, in the filter feeders, the body watercontent increases with C according to the power functionW ¼ 443.68C1.54 (Fig. 2A, Table II) and therefore, thepercentage carbon decreases with C as %C ¼ 100 � C/W ¼ 100 � C/(443.68C1.54) ¼ 100 � (1/443.68)C(1 –
1.54).The model including the Phylum was the second best
model (model 4 in Table II, AICc ¼ 116.86, AICw ¼0.19; Fig. 2B). Its AICc is only ca. 2 units higher thanthat of the first model, a difference that can be explainedby a higher number of parameters, not by a lower ex-planatory power (Burnham and Anderson, 2002). Themodel has a common slope of 1.11 (95% CI 0.92, 1.33),which is statistically indistinguishable from either 1.0 or1.2, but has different intercepts for each Phylum (model4, Table II; Fig. 2B). Accordingly, the relationshipapproaches isometry, the body water content (W/C) does
not change appreciably with C, and the percentagecarbon can be described by global averages of 1.04+0.54, 0.23+ 0.14 and 1.77+ 2.44% for the tunicates,the ctenophores and the cnidarians, respectively(Table III). Models incorporating the FM (models 6 and7 in Table II) were poorer than those including the TGor the Phylum, yet better than a simple log W versus logC regression (Table II).
Allometry of the N content
As for W, the best model for the relationship between logN and log C included the TG (model 2 in Table IV,AICc ¼ 24.70, AICw ¼ 0.40; Fig. 3). In this model, theguilds shared a common slope of 0.98 which is statistical-ly undistinguishable from 1 (i.e. the 95% CI 0.95, 1.01).Therefore, the relationship is isometric, with N a
C. Accordingly, the nitrogen content (expressed as C:N)is constant and independent of C (since C:N a C/N a
C/C�constant). However, each guild has a differentintercept, which translates into a global C:N of 4.38+1.21 and 3.89+ 1.3 for filter feeders and carnivores, re-spectively (Table III). According to the d15N enrichmentobservations (Table I), there is a one trophic level differ-ence between the carnivores (trophic level ¼ 2.7+ 0.3,
Table II: Summary of the RMA models for the fresh body weight (W)
Model Model structure Factor level Rank AICc AICc w a b
1 log10W ¼ a þ b log10C 7 143.96 0.00 2.16 1.00 (0.88, 1.15)2 log10W ¼ a(TG) þ b log10C 3 117.31 0.15
Carnivores 2.35 1.07 (0.91, 1.27)Filter feeders 2.07 1.07 (0.91, 1.27)
3 log10W ¼ a(TG) � b(TG) log10C 1 114.76 0.54Carnivores 2.24 1.00 (0.85, 1.17)Filter feeders 2.65 1.54 (1.11, 2.13)
4 log10W ¼ a(PH) þ b log10C 2 116.86 0.19Chordata 2.11 1.11 (0.92, 1.33)Cnidaria 2.25 1.11 (0.92, 1.33)Ctenophora 2.90 1.11 (0.92, 1.33)
5 log10W ¼ a(PH) � b(PH) log10C 4 117.99 0.11Chordata 2.65 1.54 (1.11, 2.13)Cnidaria 2.08 0.98 (0.83, 1.17)Ctenophora 4.30 2.00 (0.88, 4.51)
6 log10W ¼ a(FM) þ b log10C 5 123.93 0.01Ambush 2.48 1.06 (0.91, 1.26)Cruising 2.29 1.06 (0.91, 1.26)Filter feeders 2.05 1.06 (0.91, 1.26)
7 log10W ¼ a(FM) � b(FM) log10C 6 130.05 0.00Ambush 20.67 21.14 (24.47, 20.29)Cruising 2.19 0.99 (0.85, 1.16)Filter feeders 2.65 1.54 (1.11, 2.13)
Model 1 is a simple RMA of log W on log C. The rest of models also include as factors either the TG (two levels: filter feeders and carnivores; models 2and 3), the FM (three levels: filter feeders, ambush predators and cruising predators; models 6 and 7) or the phylum (PH; three Phyla: tunicates,ctenophores and cnidarians; models 4 and 5). Models with factors are expressed as log10W ¼ a(factor) þ b log10C when there is a common slope (b) butdifferent intercepts [a(factor)] for each level of the factor, or log10W ¼ a(factor) þ b(factor) log10C when there are a distinct slopes [b(factor)] andintercepts [a(factor)] for each level of the factor. Where appropriate, estimates for the intercepts and the slopes are given for each level of the factor. 95%CI for the slopes are provided between parentheses for comparison with hypothesized values of 1 (isometry) and 1.2 (bottom-up theory). AICc,second-order Akaike information criteria; AICc w, second-order Akaike weight.
A. MOLINA-RAMIREZ ET AL. j GELATINOUS ZOOPLANKTON ALLOMETRIC C AND N RELATIONSHIPS
7
640
645
650
655
660
665
670
675
680
685
690
695
700
705
710
715
720
725
730
735
740

n ¼ 11) and the filter feeders (trophic level ¼ 1.6+ 0.4,n ¼ 130).
D I S C U S S I O N
Previous analyses of W and N as a function of C (Lucaset al., 2011; Kiørboe, 2013) were based largely on conver-sion coefficients to estimate C and/or W from dry weightor other body size proxies. The use of dry weight for thiskind of study is complicated by the presence of hydrationwater (Larson, 1986; Schneider, 1992; Hirst and Lucas,1998; Kiørboe, 2013). This led Schneider (Schneider,1992) to conclude that the individual biomass of gelatin-ous zooplankton is better expressed in terms of bodycarbon content. Here, we have used a data set that reliesexclusively on direct, concurrent measurements of W andC and of N and C. In our data set, the average carboncontent of the ctenophores (0.23% of the fresh bodyweight, Table III) is similar to that described by Kiørboe(Kiørboe, 2013) (0.26%). However, our average for thecnidarians is remarkably higher and more variable(1.77+ 2.44%) than that in Kiørboe (Kiørboe, 2013)(0.48+ 0.68%), due to our inclusion of some specieswhich had high body carbon contents, like the mano’war Physalia physalis [9.02%, Table I; a high carboncontent for this species was already mentioned in Beers(Beers, 1966)], the velellid Porpita porpita (3.75%), thesiphonophore Physophora sp. (3.21%) or the scyphome-dusa Rophilema sculentum (1.21%) pointing to a marked
Fig. 2. Fitted RMA regression lines for W versus C separateregressions with different slope for either TG (A) or separate regressionswith common slope for each Phylum (B). Each point corresponds toone species, from Table I.
Table III: Body nitrogen content (expressed as the ratio C:N) and body carbon content (expressed aspercentage of the wet weight, that is 100 � C/W)
Carnivores Filter feedersCtenophores Cnidarians Total carnivores Tunicates Total
C:N this work 4.68+0.81 [0.17]f4.64, 5.25–3.89g(31,3)
3.75+1.34 [0.35]f3.52, 6.72–0.9g(73,17)
3.89+1.3 [0.33]f2.6, 6.72–0.9g(104,20)
4.38+1.21 [0.27]f4.73, 16–1.5g(155,7)
4.56+2.46 [0.53]f4.36, 16–0.9g(255,30)
C:N (Steinberg and Sada, 2008) 3.86+0.33 [0.08]f3.8, 4.4–3.5g(NA,5)
4.12+1.41 [0.34]f3.8, 4.6–2.5g(NA,19)
4.08+1.23 [0.3]f3.8, 4.6–2.5g(NA,24)
4.09+1.21 [0.109]f4, 4.8–3.6g(NA,7)
4.07+1.12 [0.27]f3.9, 9.6–2.5g(NA,31)
C:N (Kiørboe, 2013) 4.4+0.5 [0.22]f3.93, 32–3.05g(45,20)
4.0+0.4 [0.77]f3.74, 12.9–1.3g(84,17)
4.5+0.51 [0.11]f3.49, 32–1.3g(129,37)
4.3+0.2 [0.10]f3.41, 11.1–2.31g(85,18)
4.23+0.2 [0.49]f3.91, 32–1.3g(214,55)
C:N (Ikeda, 2014) 3.82+0.60 [0.15]f3.75, 5–1.5g(NA,14)
4.18+2.51 [0.61]f3.63, 11.18–0.85g(NA,40)
4.07+2.16 [0.53]f3.67, 11.18–0.85g(NA,52)
NA 3.8
% C (this work) 0.23+0.14 [0.64]f0.23, 0.64–0.14g(32,4)
1.77+2.44 [1.38]f0.67, 9.01–0.09g(82,19)
1.17+1.9 [1.62]f0.58, 9.01–0.09g(114,23)
1.04+0.54 [0.52]f1.01, 1.68g(155,12)
1.13+1.57 [1.39]f0.68, 1.75–0.07g(271,36)
% C (Kiørboe, 2013) 0.26+0.5 [0.22]f0.18, 0.94–0.007g(48,12)
0.48+0.68 [0.17]f0.47,2.23–0.1g(84, 13)
0.27+0.52 [0.22]f0.19,2.23–0.007g(132, 25)
0.72+0.66 [1.37]f0.24, 3.18–0.02g(85, 11)
0.48+0.23 [0.47]f0.24, 3.18–0–02g(217,36)
The statistics reported are the average+SD, coefficient of variation (square brackets), median and range (braces) and number of individuals and numberof species (parentheses). Statistics have been calculated with one datum per species.
JOURNAL OF PLANKTON RESEARCH j VOLUME 0 j NUMBER 0 j PAGES 1–12 j 2015
8
745
750
755
760
765
770
775
780
785
790
795
800
805
810
815
820
825
830
835
840
845

heterogeneity within the Phylum. Interestingly, all exceptP. porpita have a gelatinous appearance, which suggeststhat there may be special structures in their body planthat account for such high body carbon content, similarto the statoliths described in the moon jellyfish A. aurita,which are synthesized from carbonates (Spanberg andBeck, 1968). An interesting exercise would be to test forthe presence of carbonates in jelly tissues by comparisonof the dry weight before and after acidification. A similarheterogeneity in water content is apparent in the chor-dates, whose average carbon content in our data set
(1.13%) was higher than that in Kiørboe (Kiørboe, 2013)(0.48%) due to inclusion of some carbon-dense species.The message implied is that no simple conversion coeffi-cient should be used blindly and that the most sensibleapproach in the absence of conversions for a particularspecies is to use a coefficient from the phylogeneticallyclosest relative [as was demonstrated by Lucas et al.(Lucas et al., 2014) in their analysis of gelatinous carbonbiomass], or a median (not mean) value for the Phylum ifno species identification is possible. By comparison, thebody C:N content is less variable, and a Phylum-wise ora global average seems adequate enough to estimate Nfrom C (Table III), a similar conclusion to that ofSteinberg and Saba (Steinberg and Saba, 2008) andIkeda (Ikeda, 2014) using C contents estimated from dryweight.
Inspection of the allometric trends of W versus C andN versus C also reveals some interesting differences withthe patterns found using other data sets. Perhaps themost striking signal is the existence of functional differ-ences in the allometry of W versus C and of N versus Crelationships among filter feeders and carnivores. Thebest model for the relationship W versus C was the onewhere carnivores and filter feeders had separate regres-sion lines (model 3, Table II). The slope of the regressionline for the carnivores indicates that their water contentvaries isometrically with their body carbon, that is, W ¼
aCb where b�1. This implies that W�aC, which rearran-ging leads to W/C�a. In other words, the water content
Table IV: Summary of the RMA models for the individual body nitrogen (N)
Model Model structure Factor level Rank AICc AICc w a b
1 log10N ¼ a þ b log10C 7 46.58 0.00 20.66 0.98 (0.95, 1.01)2 log10N ¼ a(TG) þ b log10C 1 23.96 0.58
Carnivores 20.62 0.98 (0.95, 1.01)Filter feeders 20.73 0.98 (0.95, 1.01)
3 log10N ¼ a(TG) � b(TG) log10C 2 24.70 0.40Carnivores 20.62 1.14 (0.94, 1.97)Filter feeders 20.53 0.97 (0.94, 1.01)
4 log10N ¼ a(PH) þ b log10C 3 30.89 0.02Chordata 20.73 0.98 (0.95, 1.01)Cnidaria 20.60 0.98 (0.95, 1.01)Ctenophora 20.73 0.98 (0.95, 1.01)
5 log10N ¼ a(PH) � b(PH) log10C 5 40.89 0.00Chordata 20.53 1.14 (0.94, 1.37)Cnidaria 20.61 0.97 (0.97, 1.01)Ctenophora 20.86 0.90 (0.09, 8.76)
6 log10N ¼ a(FM) þ b log10C 4 37.44 0.00Ambush 20.71 0.98 (0.95, 1.01)Cruising 20.60 0.98 (0.95, 1.01)Filter feeders 20.72 0.98 (0.95, 1.01)
7 log10N ¼ a(FM) � b(FM) log10C 6 46.30 0.00Ambush 20.57 1.09 (0.27, 4.38)Cruising 20.61 0.97 (0.94, 1.00)Filter feeders 20.53 1.14 (0.94, 1.37)
Same conventions as in Table II.
Fig. 3. Fitted RMA regression line for N versus C for TG with acommon slope. Each point corresponds to one species, from Table I.
A. MOLINA-RAMIREZ ET AL. j GELATINOUS ZOOPLANKTON ALLOMETRIC C AND N RELATIONSHIPS
9
850
855
860
865
870
875
880
885
890
895
900
905
910
915
920
925
930
935
940
945
950
of gelatinous carnivores can be adequately encapsulatedby a constant which is independent of the body carboncontent C, and which has a value of 173.78 gW(g C)21.Therefore, bulk measurements of the total fresh weight ofctenophores and cnidarians in a sample can be com-bined with an average of the C percentage to arrive at anestimate of the total C content in the sample. Such mea-surements of the fresh body weight can be easily con-ducted during unexpected encounters with swarms ofgelatinous organisms using affordable scales as in theMALASPINA 2010 Expedition (see the Method section).In contrast, the tunicate filter feeders exhibited a strictlyallometric relationship with C, such that W ¼ aCb whereb�1.5. This means that W/C�aC1.5 – 1�aC0.5 (model 3,Table II). In other words, the body water content in-creases with the individual body carbon (i.e. animals withlarger body carbon are more watery). Determination ofthe total tunicate carbon in a sample will thereforerequire that we measure the fresh body weight Wof everysingle individual in a subsample, use W in combinationwith a regression equation (i.e. Fig. 2) to calculate theircorresponding individual body carbon content C andthen sum up all Cs.
Here, we have attempted a test of two alternative hy-potheses for the allometry of the carbon content of gelat-inous animals. In one of them, the body water content isconstant across all sizes and the power allometric rela-tionship between W and C is isometric, with a slope of1. There is no theoretical underpinning for this hypoth-esis, but it seems to apply to the gelatinous carnivores inour analysis (see model 3 in Table II) and is consistentwith which we know from studies conducted to date (i.e.Pitt et al., 2013). In the alternative hypothesis, gelatinousanimals capture prey in proportion to their body surface,which should therefore increase with the body carbon atthe same rate as the respiration requirements, leading toa W versus C power relationship with a slope close to 1.2(see the theoretical considerations in the Introductionsection). A 1.2 slope is inconsistent with previous reportsof an isometric relationship between Wand C in the tuni-cates that is, a slope of 1 [see Table II in Kiørboe(Kiørboe, 2013)], but is consistent with our observationfor these animals (Table II). As such, the gelatinous filterfeeders lend support, while the gelatinous carnivoresnegate the bottom-up, surface limitation hypothesis. Thisis unlikely due to a contrasting geometry of the capturesurface, which seems planar in both cases and supportinga value for x ¼ 2/3 in equations (2) and (4) for both typesof organisms. However, the carnivores use an external,fixed collection structure (i.e. bell and tentacles in a me-dusoid cnidarian), while the tunicates use an internalpharyngeal filter which is continuously produced andingested (Madin and Deibel, 1998). This involves a
significant cost, which may explain why growth of the col-lection surface is more tightly coupled to the metabolicrates in the filter feeders, while other, scale-dependentfactors may be at play in the carnivores, such as structuralconstraints to withstand ocean turbulence (Pitt et al.,2013). In any case, more stringent tests of the hypothesiswill require an expanded data set.
Differences in slope are only one of the aspects of theW versus C and N versus C relationships. Our datareveal that the log W versus log C regression line for thefilter feeders is located in a lower position than the linefor the carnivores (Fig. 2A). In other words, the bodies ofgelatinous filter feeders contain slightly less water thanthe bodies of gelatinous carnivores. Tunicates exhibitmaximum retention efficiencies for particles 1–2 mm insize, and are capable of capturing significant amounts ofsubmicrometric or colloidal materials (Sutherland et al.,2010). In contrast, most ctenophores and scyphozoansfeed on prey larger than several microns in size (Purcelland Arai, 2001). We also know that the biomass of parti-cles in the ocean decreases rapidly with their size(Sheldon et al., 1972). Accordingly, gelatinous carnivoresexperience a more diluted prey field than the gelatinousfilter feeders and, potentially, a stronger selection pressureto develop larger prey capture surfaces, if we accept abottom-up theory as initially posed by Harbison(Harbison, 1992). It is also likely that the diet of gelatin-ous filter feeders has a higher proportion of autotrophicprey, because phytoplankton tend to be microns to tens ofmicrons in size, and because our stable isotope datasupport a difference of one trophic level between bothgroups of organisms (see the Results section). Autotrophicprey tend to contain less nitrogen than heterotrophic prey[see Table IV in Goni and Hedges (Goni and Hedges,1995)], which may explain why the best of our regressionmodels for the body nitrogen content (model 2, Table IV)separates the filter feeders with a slightly lower body Nthan the gelatinous carnivores.
In our analysis, a taxonomic classification among threePhyla (Chordata, Cnidaria and Ctenophora; model 4,Table II) was nearly as good as a broad functional classifi-cation (carnivores and filter feeders; model 3, Table II) inexplaining variance in body water content. This is notsurprising, since there is a marked overlap between bothclassifications: carnivores include ctenophores and cni-darians, while filter feeders correspond exactly with thetunicates in our data set. In other words, taxonomy andfunction are closely related. In addition, our limited andcoarse taxonomic and functional categories do not re-present the full existing diversity of taxa and feeding strat-egies. A proper analysis would require finer categoriesmodelled according to a hierarchical factor arrangement.In this regard, we have tried to apply mixed modelling
JOURNAL OF PLANKTON RESEARCH j VOLUME 0 j NUMBER 0 j PAGES 1–12 j 2015
10
955
960
965
970
975
980
985
990
995
1000
1005
1010
1015
1020
1025
1030
1035
1040
1045
1050
1055
1060

analysis (Van de Pol and Wright, 2009) to establish the in-fluence of different levels within the taxonomic hierarchyon the allometry of the water content, but unfortunatelythe sample size is not yet sufficient for this kind of ana-lysis. Last, a classification among TG (model 3, Table II)was markedly better than a finer functional classificationamong feeding modes (model 7, Table II). This suggeststhat it is coarse functional characteristics, like the TG orthe prey size rather than finer differences like the feedingmode, which really matters in terms of the water bodycontent.
To summarize, C:N ratios in gelatinous organisms arewell constrained and consistent among studies, withslight differences between gelatinous carnivores and filterfeeders. In contrast, C:W ratios are more variable, andmuch of that variability is related to broad functional cat-egories potentially intertwined with phylogenetic differ-ences. Appropriate tests of hypothesis on the origins ofsuch variability, and on the exact nature of the allometrybetween C and W will require expansion of the data setwith more direct measurements of C and W. This can befulfilled by incorporating relatively simple protocols pre-pared for serendipitous encounter with these organismsduring open ocean oceanographic cruises or in coastalwaters. Our experience during the MALASPINA 2010Expedition demonstrates that the approach is feasible.
S U P P L E M E N TA RY DATA
Supplementary data can be found online at: http://plankt.oxfordjournals.org.
AC K N OW L E D G E M E N T S
We thank to the crew of R/V BIO Hesperides A33 andthe Unidad de Tecnologıa Marıtima UTM, CSIC, fortheir support onboard and Reyes Sanchez-Garcıa for theadvice and support previous and during theMALASPINA 2010 Expedition. We are also grateful toFernando Gonzalez-Taboada for his advice in statisticalprocedures and the two anonymous reviewers for theirhelpful comments.
F U N D I N G
This work was supported by the MALASPINA 2010Expedition project, funded by the Spanish Ministry ofScience and Innovation (MICINN-08-CSD2008-00077)in collaboration with the Spanish Navy and the BBVAfoundation. This is a contribution of the Asturias MarineObservatory.
R E F E R E N C E S
Acuna, J. L. (2001) Pelagic tunicates: why gelatinous? Am. Nat., 158,100–107.
Acuna, J. L., Lopez-Urrutia, A. and Colin, S. (2011) Faking giants: theevolution of high prey clearance rates in jellyfishes. Science, 333,1627–1629.
Alldredge, A. and Madin, L. P. (1982) Pelagic tunicates: unique herbi-vores in the marine plankton. BioScience, 32, 655–663.
Beers, J. (1966) Studies on the chemical composition of the major zoo-plankton groups in the Sargasso Sea off Bermuda. Limnol. Oceanogr.,11, 520–528.
Burnham, K. P. and Anderson, D. R. (2002) Model Selection and
Multimodel Inference: A Practical Information-Theoretic Approach. Springer. Q6Colin, S. P., Costello, J. H., Hansson, L. J., Titelman, J. and Dabiri, J. O.
(2010) Stealth predation and the predatory success of the invasivectenophore Mnemiopsis leidyi. Proc. Natl Acad. Sci. USA, 107,17223–17227.
Condon, R. H., Graham, W. M., Duarte, C., Pitt, K. A., Lucas, C. H.,Haddock, S. H. D., Sutherland, K., Robinson, L. et al. (2012)Questioning the rise of gelatinous zooplankton in the world’s oceans.BioScience, 62, 160–169. Q7
Hamner, W. M., Alldredge, L. P. M. A. L., Gilmer, R. W. and Hamner,P. (1975) Under water observations of gelatinous zooplankton: sam-pling problems, feeding biology and behavior. Limnol. Oceanogr., 20,907–916.
Harbison, G. R. (1992) The gelatinous inhabitants of the OceanInterior. Oceanus, 35, 18–23.
Ikeda, T. (2014) Synthesis toward a global model of metabolism andchemical composition of medusae and ctenophores. J. Exp. Mar. Biol.
Ecol., 456, 50–64.
Johnsen, S. (2000) Transparent animals. Sci. Am., 282, 80–89.
Johnsen, S. and Widder, E. A. (1998) Transparency and visibility of gel-atinous zooplankton from the Northwestern Atlantic and Gulf ofMexico. Biol. Bull., 195, 337–348.
Kaitaniemi, P. (2004) Testing the allometric scaling laws. J. Theor. Biol.,228, 149–153.
Kerkhoff, A. J. and Enquist, B. J. (2009) Multiplicative by nature: whylogarithmic transformation is necessary in allometry. J. Theor. Biol.,257, 519–521.
Kiørboe, T. (2013) Zooplankton body composition. Limnol. Oceanogr., 58,1843–1850.
Larson, R. J. (1986) Water content, organic content and carbon andnitrogen composition of medusae from the northeast Pacific. J. Exp.
Mar. Biol. Ecol., 99, 107–120.
Lilley, M., Beggs, S., Doyle, T. and Hobson, V. (2011) Global patternsof epipelagic gelatinous zooplankton biomass. Mar. Biol., 158,2429–2436. Q7
Lucas, C. H., Jones, D. O. B., Hollyhead, C. J., Condon, R. H., Duarte,C. M., Graham, W. M., Robinson, K. L., Pitt, K. A. et al. (2014)Gelatinous zooplankton biomass in the global oceans: geographicvariation and environmental drivers. Global Ecol. Biogeogr., 23,701–714.
Lucas, C. H., Pitt, K. A., Purcell, J. E., Lebrato, M. and Condon, R. H.(2011) What’s in a jellyfish? Proximate and elemental compositionand biometric relationships for use in biogeochemical studies. Ecology,92, 1704.
A. MOLINA-RAMIREZ ET AL. j GELATINOUS ZOOPLANKTON ALLOMETRIC C AND N RELATIONSHIPS
11
1065
1070
1075
1080
1085
1090
1095
1100
1105
1110
1115
1120
1125
1130
1135
1140
1145
1150
1155
1160
1165
Madin, L. P. and Deibel, D. (1998) Feeding and energetics of Thaliacea.In Bone, Q. (ed.), The Biology of Pelagic Tunicates. Oxford UniversityPress, Oxford, pp. 81–103.
Mandelbrot, B. B. (1983) The Fractal Geometry of Nature. Freeman,San Francisco.
Martinussen, M. and Bamstedt, U. (1999) Nutritional ecology of gelatin-ous planktonic predators. Digestion rate in relation to type andamount of prey. J. Exp. Mar. Biol. Ecol., 232, 61–84.Q7
Minagawa, M. and Wada, E. (1984) Stepwise enrichment of 15N alongfood chains: further evidence and the relation between d15N andanimal age. Geochim. Cosmochim. Acta, 48, 1135–1140.
Mompean, C., Bode, A., Benıtez-Barrios, V. M., Domınguez-Yanes,J. F., Escanez, J. and Fraile-Nuez, E. (2013) Spatial patterns of plank-ton biomass and stable isotopes reflect the influence of the nitrogen-fixer Trichodesmium along the subtropical North Atlantic. J. Plankton
Res., 35, 513–525.
Peters, R. H. (1983) The Ecological Implications of Body Size. CambridgeUniversity Press, Cambridge.
Pickwell, G. V., Barham, E. G. and Wilton, J. W. (1964) Carbon monox-ide production by a bathypelagic siphonophore. Science, 144,860–862.Q7
Pitt, K. A., Connolly, R. M. and Meziane, T. (2009) Stable isotope andfatty acid tracers in energy and nutrient studies of jellyfish: a review.Hydrobiology, 616, 119–132.
Pitt, K. A., Duarte, C. M., Lucas, C. H., Sutherland, K. R., Condon,R. H., Mianzan, H., Purcell, J. E., Robinson, K. L. et al. (2013)Jellyfish body plans provide allometric advantages beyond lowcarbon content. PLoS One, 8, e72683.
Postel, L., Fock, H. and Hagen, W. (2000) Biomass and abundance. InHarris, R., Wiebe, P., Lenz, J., Skjoldal, H. R. and Huntley, M. (eds),ICES Zooplankton Methodology Manual. Academic Press, London, pp.83–164.
Purcell, J. (2009) Extension of methods for jellyfish and ctenophoretrophic ecology to large-scale research. Hydrobiology, 616, 23–50.Q7
Purcell, J. E. and Arai, M. N. (2001) Interactions of pelagic cnidariansand ctenophores with fish: a review. Hydrobiology, 451, 27–44.
Robinson, K. L., Ruzicka, J. J., Decker, M. B., Brodeur, R. D.,Hernandez, F. J., Quinones, J., Acha, E. M., Uye, S. I. et al. (2014)Jellyfish, forage fish, and the world’s major fisheries. Oceanography, 27,104–115. Q7
Schneider, G. (1990) A comparison of carbon based ammonia excretionrates between gelatinous and non-gelatinous zooplankton: implica-tions and consequences. Mar. Biol., 106, 219–225.
Schneider, G. (1992) A comparison of carbon-specific respiration ratesin gelatinous and non-gelatinous zooplankton: a search for generalrules in zooplankton metabolism. Helgol. Meeresunters., 46, 377–388.
Sheldon, R. W., Prakash, A. and Sutcliffe, W. H. (1972) The size distri-bution of particles in the ocean. Limnol. Oceanogr., 17, 327–340.
Smith, R. J. (2009) Use and misuse of the reduced major axis for line-fitting. Am. J. Phys. Anthropol., 140, 476–486.
Spanberg, D. B. and Beck, C. W. (1968) Calcium sulfate dihydrate stato-liths in Aurelia. T. Am. Microsc. Soc., 87, 329–335.
Steinberg, D. K. and Saba, G. K. (2008) Nitrogen Consumption andMetabolism in Marine Zooplankton. In Capone, D. G., Bronk, D. A.,Mulholland, M. R. et al. (eds), Nitrogen in the Marine Environment,2nd ed. Academic Press, pp. 1135–1196. Q6
Van de Pol, M. and Wright, J. (2009) A simple method for distinguishingwithin- versus between-subject effects using mixed models. Anim.
Behav., 77, 753–758.
Vander Zanden, M. J. and Rasmussen, J. (2001) Variation in d15N andd13C trophic fractionation: implications for aquatic food web studies.Limnol. Oceangr., 46, 2061–2066.
Verity, P. and Smetacek, V. (1996) Organism life cycles, predation, andthe structure of marine pelagic ecosystems. Mar. Ecol. Prog. Ser., 130,277–293.
Vinogradov, A. (1953) The Elementary Composition of Marine Organisms.Sears Foundation for Marine Research, Yale University.
Warton, D. I., Duursma, R. A., Falster, D. S. and Taskinen, S. (2012)smatr 3—an R package for estimation and inference about allometriclines. Methods Ecol. Evol., 3, 257–259.
Wittenberg, J. B. (1960) The source of carbon monoxide in the float ofthe Portuguese man-of-war, Physalia physalis. J. Exp. Biol., 37, 698–705. Q7
JOURNAL OF PLANKTON RESEARCH j VOLUME 0 j NUMBER 0 j PAGES 1–12 j 2015
12
1170
1175
1180
1185
1190
1195
1200
1205
1210
1215
1220
1225
1230
1235
1240
1245
1250
1255
1260
1265
1270