Motility, Manipulation and Controlling of Unicellular Organisms
115
Originaldokument gespeichert auf dem Dokumentenserver der Universität Basel edoc.unibas.ch This work by Axel Hochstetter is licensed under a Creative Commons Attribution-NonCommercial-ShareAlike 4.0 International License. Die vollständige Lizenz kann unter creativecommons.org/licenses/by-nc-nd/4.0 eingesehen werden. Motility, Manipulation and Controlling of Unicellular Organisms Using the example of Trypanosoma brucei brucei & Caulobacter crescentus Inauguraldissertation Zur Erlangung der Würde eines Doktors der Philosophie (PhD) vorgelegt der Philosophischen-Naturwissenschaftlichen Fakultät der Universität Basel von Axel Hochstetter von Deutschland Basel 2014
-
Upload
khangminh22 -
Category
Documents
-
view
3 -
download
0
Transcript of Motility, Manipulation and Controlling of Unicellular Organisms
Originaldokument gespeichert auf dem Dokumentenserver der Universität Basel edoc.unibas.ch
This work by Axel Hochstetter is licensed under a Creative Commons Attribution-NonCommercial-ShareAlike 4.0
International License. Die vollständige Lizenz kann unter creativecommons.org/licenses/by-nc-nd/4.0
eingesehen werden.
Motility, Manipulation and Controlling of Unicellular Organisms
Using the example of Trypanosoma brucei brucei & Caulobacter crescentus
Inauguraldissertation
Zur
Erlangung der Würde eines Doktors der Philosophie (PhD)
vorgelegt der
Philosophischen-Naturwissenschaftlichen Fakultät der Universität Basel
von
Axel Hochstetter
von Deutschland
Basel 2014
Axel Hochstetter 2
Genehmigt von der Philosophisch-Naturwissenschaftlichen Fakultät
auf Antrag von
Prof. Dr. Thomas Pfohl & Prof. Dr. Nico Bruns
Basel, den 11. November 2014
Prof. Dr. Jörg Schibler
Dekan der Philisophisch-
Naturwissenschaftlichen Fakultät

Axel Hochstetter 3
please find more information at http://creativecommons.org/licenses/by-nc-sa/4.0/

Axel Hochstetter 4
1 ABSTRACT ............................................................................................................................................... 8
2 INTRODUCTION .................................................................................................................................... 9
2.1 GOALS AND SPECIFIC OBJECTIVES: ................................................................................................................ 10
3 BACKGROUND KNOWLEDGE .......................................................................................................... 11
3.1 PROPULSION OF SINGLE-‐CELLED ORGANISMS ............................................................................................. 11
3.1.1 What are bacteria, amoeba and protozoa? ..................................................................................... 11
3.1.2 Means of motility ......................................................................................................................................... 13 Cilia & flagella ............................................................................................................................................................................................. 13 Pseudopods & pili ...................................................................................................................................................................................... 14
3.1.3 Diffusion and Brownian motion ............................................................................................................ 15
3.2 MODEL ORGANISMS ......................................................................................................................................... 20
3.2.1 Trypanosoma brucei brucei .................................................................................................................... 20 Taxonomy, life cycle and related disease ........................................................................................................................................ 20 Course of disease ....................................................................................................................................................................................... 21 Sheathed flagellar propulsion .............................................................................................................................................................. 23 Hydrodynamic clearing of VSG ............................................................................................................................................................ 25
3.2.2 Caulobacter crescentus ............................................................................................................................. 26 Taxonomy, live cycle and habitat ....................................................................................................................................................... 26 Caulobacter propulsion .......................................................................................................................................................................... 28
3.3 MICROFLUIDICS ................................................................................................................................................ 29
3.3.1 Definition Microfluidics ............................................................................................................................ 29
3.4 OPTICAL TWEEZERS ........................................................................................................................................ 33
3.4.1 Light and matter interactions ............................................................................................................... 33
3.4.2 Optical trap .................................................................................................................................................... 34
4 MATERIALS AND METHODS ............................................................................................................ 36
4.1 CELL CULTURE .................................................................................................................................................. 36 Cultivating caulobacter ........................................................................................................................................................................... 36 Cultivating trypanosomes ...................................................................................................................................................................... 36 Preparing cell and drug solutions ...................................................................................................................................................... 36 Storing trypanosomes ............................................................................................................................................................................. 37 Thawing trypanosomes .......................................................................................................................................................................... 37 Preparing fixated trypanosomes ........................................................................................................................................................ 37 Disposing trypanosomes ........................................................................................................................................................................ 37
4.2 MICROFLUIDICS & SOFT LITHOGRAPHY ...................................................................................................... 38
4.2.1 Master preparation .................................................................................................................................... 39
4.2.2 Device preparation ..................................................................................................................................... 39
4.2.3 Device mounting .......................................................................................................................................... 39
4.3 OPTICAL TRAPPING AND MICROSCOPY ......................................................................................................... 40
4.3.1 Calibration of the optical trap ............................................................................................................... 40

Axel Hochstetter 5
4.3.2 Image recording and analysis ................................................................................................................ 42 Tracking ......................................................................................................................................................................................................... 42 Aligning of Stacks (Registration) ........................................................................................................................................................ 43 Plot Profile .................................................................................................................................................................................................... 43 CFD Simulations: ........................................................................................................................................................................................ 43
5 OPTICAL TRAPPING OF BACTERIA ON THE EXAMPLE OF C. CRESCENTUS ...................... 45
5.1 INTRODUCTION ................................................................................................................................................. 45
5.2 MATERIALS AND METHODS ............................................................................................................................ 46
5.2.1 Device design ................................................................................................................................................. 46
5.2.2 Assessing the trap parameters for the force calculations ......................................................... 46
5.2.3 Assessment of photo-‐toxicity .................................................................................................................. 48
5.2.4 Measuring escape probability and force ........................................................................................... 48
5.2.5 Induction of holdfast formation ............................................................................................................ 49
5.3 RESULTS ............................................................................................................................................................. 50
5.3.1 Optical trap calibration for caulobacter ........................................................................................... 50
5.3.2 Photo-‐toxicity ................................................................................................................................................ 51
5.3.3 Forces generated by caulobacter ......................................................................................................... 52
5.3.4 Motility of caulobacter in the optical trap ....................................................................................... 54
5.3.5 Mechanically induced surface adhesion ............................................................................................ 55
5.4 CONCLUSIONS .................................................................................................................................................... 59
6 OPTICAL TRAPPING OF PROTOZOA, E.G. TRYPANOSOMA BRUCEI BRUCEI ...................... 60
6.1 INTRODUCTION ................................................................................................................................................. 60
6.2 METHODS ........................................................................................................................................................... 60
6.3 RESULTS ............................................................................................................................................................. 61
6.3.1 Optical trapping of trypanosomes ....................................................................................................... 61
6.3.2 Dissipative energy of trypanosomes .................................................................................................... 63
6.4 CONCLUSIONS .................................................................................................................................................... 66
7 HYDRODYNAMIC IMPACT OF TRYPANOSOMES ON THEIR ENVIRONMENT ................... 68
7.1 INTRODUCTION ................................................................................................................................................. 68
7.2 METHODS ........................................................................................................................................................... 69
7.3 RESULTS ............................................................................................................................................................. 69
7.4 CONCLUSION ...................................................................................................................................................... 71
8 HYDRODYNAMIC MANIPULATION OF TRYPANOSOMES ....................................................... 72
8.1 INTRODUCTION ................................................................................................................................................. 72
8.2 METHODS ........................................................................................................................................................... 74
8.3 RESULTS ............................................................................................................................................................. 77

Axel Hochstetter 6
8.4 DISCUSSION ....................................................................................................................................................... 80
8.5 CONCLUSION ...................................................................................................................................................... 82
9 MICROFLUIDICS-‐BASED SINGLE CELL ANALYSIS TO STUDY DRUG-‐DEPENDENT
MOTILITY CHANGES IN TRYPANOSOMES ............................................................................................ 83
9.1 INTRODUCTION ................................................................................................................................................. 83
9.2 RESULTS ............................................................................................................................................................. 85
9.2.1 Design and function of drug testing device ...................................................................................... 85
9.2.2 Device operation .......................................................................................................................................... 86
9.2.3 Drug diffusion ............................................................................................................................................... 86
9.2.4 Microfluidics single cell motility analysis with glutaraldehyde .............................................. 87
9.2.5 Microfluidics testing of 2DG on trypanosome motility ............................................................... 88
9.2.6 Impact of low dosages of 2DG on trypanosomes motility .......................................................... 90
9.2.7 Single cell analysis with suramin ......................................................................................................... 92
9.3 DISCUSSION ....................................................................................................................................................... 95
9.4 CONCLUSION ...................................................................................................................................................... 96
10 DISCUSSION .......................................................................................................................................... 97
11 OUTLOOK AND PERSPECTIVES ................................................................................................... 101
12 APPENDIX A RECIPES .................................................................................................................... 102
12.1 SOFT LITHOGRAPHY: .................................................................................................................................... 102
12.2 CELL CULTURE ............................................................................................................................................... 103
12.2.1 Media ........................................................................................................................................................ 103 HMI-‐9 culture medium (HMI-‐9; 1 litre): ....................................................................................................................................... 103 Culture medium for experiments (50 mL): .................................................................................................................................. 103 Drug solution for experiments (20 mL): ....................................................................................................................................... 103 Freezing medium (100 mL) ................................................................................................................................................................ 104 Trypanosome dilution buffer TDB ................................................................................................................................................... 104 Trypanosome fixation buffer TFB .................................................................................................................................................... 104 Trypanosome sleeping buffer TSB ................................................................................................................................................... 104
12.3 MATLAB CODES ........................................................................................................................................... 105
12.3.1 Plotting Trajectories in 3D: ............................................................................................................ 105
12.3.2 Mean squared displacement (MSD) script ............................................................................... 106
13 REFERENCES ..................................................................................................................................... 107
14 THANKS AND ACKNOWLEDGMENTS ......................................................................................... 114

Axel Hochstetter 7
List of abbreviations
2DG 2-Deoxy-D-Glucose
ACF Auto Correlation Function
BSA Bovine Serum Albumin
BSF Bloodstream form
CC Connecting Channel, between MC and chambers
caulobacter Caulobacter crescentus / C .crescentus
FCS Fetal Calf Serum (heat inactivated)
GA Gluaraldehyde
GPI Glycophosphatidylinositol
HAT Human African Trypanosomiasis
NA Numerical Aperture
MSD Mean Square Displacement
OT Optical Trap
PDMS Polydimethylsiloxan; [C2H6OSi]n
PFR Paraflagellar Rod
RT Room Temperature
trypanosomes Trypanosoma brucei brucei / T. b. brucei
VSG Variable surface Glycoprotein, a homodimeric
GPI-anchored Protein; major T.b. surface antigen
Table of units and their abbreviations
fps frames per second
mL millilitre; !!! !
mM millimolar; 6.022 x 10⁻²⁰ molecules per litre
µM micromolar; 6.022 x 10⁻¹⁷ molecules per litre
Pa pascal
pN piconewton; 10-12 N
rpm revolutions per minute
! seconds
! time
Axel Hochstetter 8
1 Abstract
Introduct ion: Motility is a measure for vitality of unicellular organisms By using a microfluidic
setup it is possible to analyse single-cell organisms and their motility. Thus it is possible to
achieve several goals, from characterising the way of movement and the forces thereby generated
to analysing drug effects and controlling pathogen displacement and spatial concentration to
facilitate diagnosis. In order to do so, the microfluidic device as well as the manipulation and
analysis tools have to be calibrated and adapted to the varying parameters as determined by the
matter under study.
Methods: Using microfluidics in combination with optical trapping of unicellular organisms and
high-speed microscopy, displacement trajectories were recorded and subsequently analysed using
computer aided image analysis to characterise the flagellar propulsion of Trypanosoma brucei brucei
and Caulobacter crescentus. Additionally, changes in the motility of T. b. brucei under the influence of
drugs and different environments were determined and holdfast formation in C. crescentis was
induced. The calibration parameters of the optical trap and the microfluidic devices were
determined for different experimental setups in order to minimise phototoxic effects and
maximise retention time of the organisms in the device.
Results : Swimming, Caulobacter crescentus generate an average force of 0.3 pN while being capable
of a maximal force of 2.6 pN. C. crescentis and Trypanosoma brucei brucei rotate when they are inside
an optical trap but for the trypanosomes this depends on the type of movement they were
exhibiting directly before being trapped. The movement of T. b. brucei around the trap has a
frequency of 15 Hz for the flagellar beat and a frequency of 1.5 Hz for the rotation itself.
The hydrodynamic interaction between swimming trypanosomes and the environment shows
characteristic flow patters around the trypanosome that reveal it to be a pusher and not a puller.
Their random-walk like migration can be directed by the geometry of the microfluidic device in
order to contain them inside the device.
In our experimental setup, Caulobacter crescentus exhibits a phototoxic reaction when trapped with a
laser of the wavelength of 808 nm.
The combination of optical traps and microfluidic devices can be furthermore used as a versatile
methodology to study the impact of drugs and chemicals on motile unicellular organisms. Due to
diffusion driven drug control, dosage-dependent effects can be determined through a motility
factor.
Conclusion: Microfluidics in combination with optical trapping of cells and high speed
microscopy can be used to analyse, manipulate, and control the motility of unicellular organisms,
thus providing us with an interdisciplinary toolset to study living soft matter in a complex fluidic
environment.
Axel Hochstetter 9
2 Introduction
As we learn more and more about our world, we start looking at it on smaller scales. Thus the
need arose to be able to investigate ever more complex systems on a smaller scale. The demand
to study matter in small, often liquid-filled systems has given rise to the field of microfluidics.
Moreover, microfluidics research has become ever more interdisciplinary, allowing us to integrate
knowledge from several fields such as biology, chemistry, and physics simultaneously into
research. With microfluidics, we are enabled to study soft matter, such as living cells, while it is
still in its natural state and interacting with its environment. By explicitly shaping and controlling
the environment we can study the matter’s reaction to, and interaction with, its environment and
thus learn more about the matter itself. Such investigations help us to better understand whole
interaction systems.1 Furthermore in combination with optical tweezers we are able to directly
capture and control the matter we are aiming to study, which additionally presents us with a
mean to examine influences generated by the matter on its environment.
However, the devices and traps have to be adapted to the matter under study. Living matter
requires especially careful thought and consideration as it is comprised of a complex system of
molecules and mechanisms that, when disturbed, can disintegrate, rendering it useless for study2.
Understanding these determinants, on the other hand, allows us to explore ways in which we can
chemically and physically manipulate and control matter. At the example of pathogenic cellular
organisms, gaining control means finding new ways to fight against them. Furthermore, the
ability to study living matter in a complex system yet outside of the animal model, is a widely
acknowledged need in various fields from biology to medicine.3 The ability to directly observe
and experiment on matter in a controlled environment, not only allows us to bridge the gap
between compound research and animal testing4 but also leaves us with the possibility to
intervene more into the system and, by manipulating, understand it - something that is not
possible in an animal model.
In order to understand the interaction of living cells with their environment, one first step is to
understand what guides their behaviour and movement. This is especially interesting for single-
cell organisms as they show a large variety of motility and behaviours, depending on the species,
despite being comprised of only one single cell.5–10 A trypanosome for example, uses its motility
not only for displacement, but also as a mechanism to clear its cell-surface of variable surface
glycoproteins.11 By making use of the flow field around its cell-body, the trypanosome manages
to move proteins towards its cellular pocket where they can be endocytosed and digested. This
enables the trypanosome to evade the host’s immune system.11 Another example of an important
behaviour pertaining to motility is the ability of certain unicellular organisms, such as caulobacter,
to form a strong bond with a surface and avoid displacement by the surrounding flow, which is

Axel Hochstetter 10
key to form biofilm colonies in food-rich environments.12,13 These examples show how the ability
to move or to remain stationary plays a complex role for the survival of unicellular organism
within their environment.
Understanding and even manipulating motility opens up the possibility for researchers to
intervene in the system. By knowing how the motility and migration of living soft matter is
determined in a given environment, it is possible to shape the circumstances so we can exert
control over it. Furthermore, the understanding of the physical determinants of the cell’s
displacement within a complex fluid (e.g. blood) might open up possibilities to develop new
methodology to find and thus diagnose pathogens within the liquids of the host body.
However, to do so we must understand the physical and methodological determinants of the
traps and manipulation devices themselves, as well as their interaction with the living matter
including variations in this interaction between different species of single cell organisms. When
setting up an experimental design, careful consideration has to be given to the dimensions and
geometry of the microfluidic device as well as to the calibration of the manipulation and
recording tools.
2.1 Goals and specific objectives:
• To assess the forces and energy generated by flagellated unicellular swimmers on the
example of Caulobacter crescentus and Trypanosome brucei brucei.
• To answer the question of whether the motility of caulobacter and trypanosomes is
influenced by the optical trap.
• To see whether holdfast formation be can induced in C. crescentus by bringing the bacteria
into close contact with a surface by an optical trap.
• To analyse the hydrodynamic flow field generated by a persistently swimming trypanosome
and to classify trypanosomes as either pusher or puller.
• To assess in how far device geometry and presence or absence of flows, affect the
detainment time of trypanosomes in confinement chambers.
• To explore the possibility for a passive cell sorting device suitable for the development into a
diagnostic tool.
• To combine existing microfluidic devices and optical tweezers in order to create a
methodology suitable for the testing of chemical substances on trypanosomes.
• To study the influence of varying doses of 2-deoxy-D-glucose and suramin on the motility of
trypanosomes.

Axel Hochstetter 11
3 Background knowledge
3.1 Propulsion of single-celled organisms
3.1.1 What are bacteria, amoeba and protozoa?
Each life-form on this planet can be set into a relation to all other life-forms. One up-to-date
system for categorizing all life forms is the system of the six kingdoms that share a common
ancestor. This taxonomic system is based on a genetic meta-analysis of Ciccarelli et al.14 shown in
Figure 3.1Figure 3.1: The six kingdoms of biology, sharing a common ancestor15.
Figure 3.1: The six kingdoms of biology, sharing a common ancestor15
The six kingdoms can be sorted into the two groups of Eukaryota (protista, fungi, plantae and
animalia), that possess a nucleus and other membrane-bound internal organelles, and Prokaryota
(eubacteria and archaebacteria) that do not possess any membrane bound organelles or nuclei
(Figure 3.2)16.

Axel Hochstetter 12
Figure 3.2: The six kingdoms in biology, assigned to Prokaryota and Eukaryota.17
For this work, where the motility of unicellular organisms is investigated, the "microscopic
swimmers" are found in the kingdoms of eubacteria (for the Caulobacter crescentus) and protista (for
the Trypanosoma brucei brucei, formerly protozoa) respectively. Throughout this work, the
taxonomy of species is based on the works of Ciccarelli et al.14 and Adl et al.18 (Figure 3.1 and
Figure 3.2).
The typical sizes for objects and organisms studied in microfluidics range from 1 and 100 µm. In
this size regime we find exemplary three prototypes of cell motility: amoebae, bacteria (propelling
themselves with pili) and flagellates.

Axel Hochstetter 13
3.1.2 Means of motility
Unicellular organisms have several structures to propel themselves, i.e. to crawl along a surface or
swim in a surrounding liquid
Cilia & flagella
Eukaryotic cilia and flagella are whiplike structures that move either the cell itself or the
surrounding medium. They share a common internal structure (Figure 3.3). From inside a basal
body (kinetosome) the cilium/flagellum extends from the cell body. Surrounded by the extended
plasma membrane, cilia/flagella consist of nine doublet microtubules that are arranged in a circle
around a central pair of singlet microtubules (axoneme). This 9+2 arrangement extends to the
distal end of the cilia/flagella. Arrays of dynein motor proteins anchored along one side of each
microtubule (MT) doublet walk along the adjacent MT doublet, thereby producing the force for
cell propulsion by MT bending.
Figure 3.3: Structure of cilia and eukaryotic flagella
Adapted from http://micro.magnet.fsu.edu/cells/ciliaandflagella/ciliaandflagella.html by Michael W. Davidson.
The major differences between flagella and cilia are their length in comparison to the cell body
(flagella are longer), their number (only one to a few flagella versus hundreds of cilia per cell), and
how they beat.19
Cilia a very fast moving structures that, like a motor, produce a rotational movement. The beating
of cilia has two phases: the effective stroke, where a cilium is elongated and moves forward, and a
recovery stroke, where the cilium is bent while moving backwards (Figure 3.4 a). Due to this
asymmetry in the beat, a net force is generated in the direction of the recovery stroke. The small
asynchrony (phase shift) in a group of cilia that beat together results in a metachronal wave
(Figure 3.4 b) that generates a net flow of the surrounding medium.20

Axel Hochstetter 14
Figure 3.4: Cilia stroke pattern
(a): Effective stroke (1-3) and recovery stroke (4-8 → 1) of an individual cilium.
(b): Metachronal wave resulting from concerted beats of cilia. Images reproduced from T. Ishikawa20.
There is no clear distinction between ciliary propulsion and eukaryotic flagellar propulsion.20
Where the assembly of cilia together create a metachronal wave to propel the ciliate, eukaryotic
flagellates swim by propagating planar or helical throughout their flagella.20 In prokaryotes that
do not have microtubules, flagella are helical filaments placed outside of the cytoplasmic
membrane. Bacterial flagella are rotated relative to the cell body like a screw, driven by force that
is produced by a basal motor complex.7 The rotation generates a helical wave that propagates to
the distal tip of the flagellum, thus propelling prokaryotic flagellates.7,20
Pseudopods & pili
Amoebae propel themselves by crawling along a surface. For each stride, they cycle through the
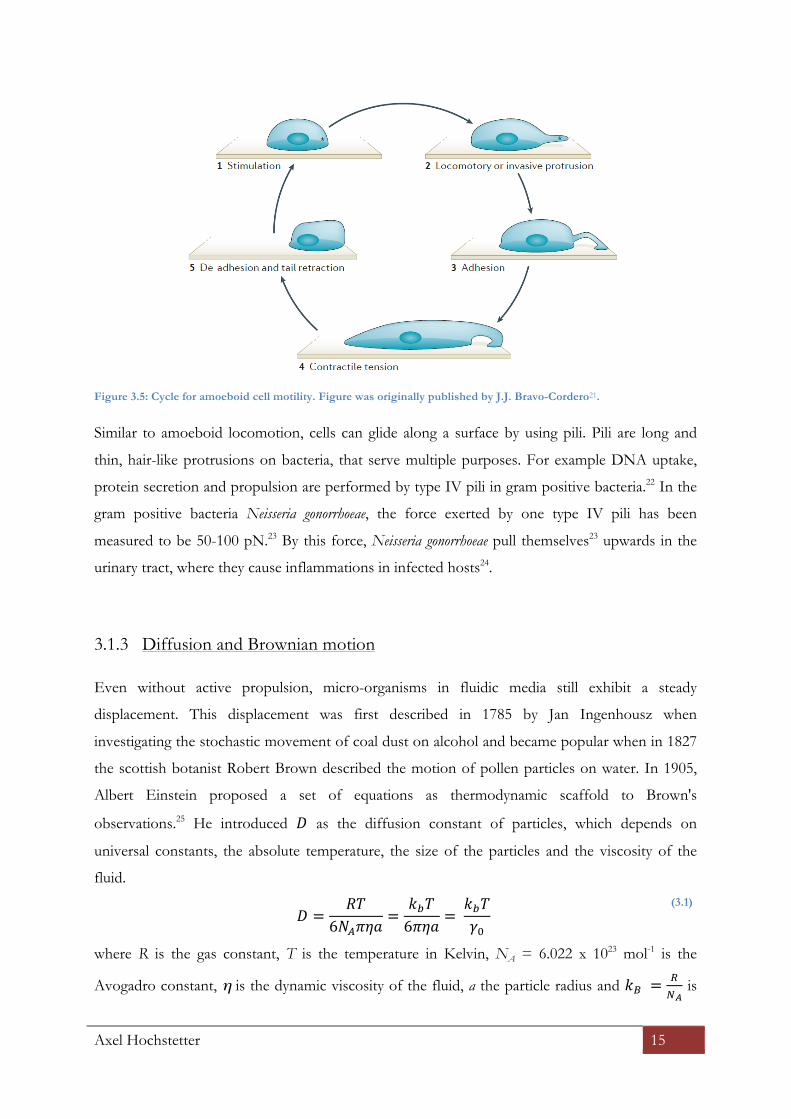
following five steps (Figure 3.5): After an internal or external stimulus (1) the cell produces a
finger-like protrusion (pseudopod) (2) that adheres to a remote spot of the substrate (3). The cell
distorts and elongates by creating a contractile tension (4) and then moves closer to the targeted
area by detaching and retracting the tail (5).
Axel Hochstetter 15
Figure 3.5: Cycle for amoeboid cell motility. Figure was originally published by J.J. Bravo-Cordero21.
Similar to amoeboid locomotion, cells can glide along a surface by using pili. Pili are long and
thin, hair-like protrusions on bacteria, that serve multiple purposes. For example DNA uptake,
protein secretion and propulsion are performed by type IV pili in gram positive bacteria.22 In the
gram positive bacteria Neisseria gonorrhoeae, the force exerted by one type IV pili has been
measured to be 50-100 pN.23 By this force, Neisseria gonorrhoeae pull themselves23 upwards in the
urinary tract, where they cause inflammations in infected hosts24.
3.1.3 Diffusion and Brownian motion
Even without active propulsion, micro-organisms in fluidic media still exhibit a steady
displacement. This displacement was first described in 1785 by Jan Ingenhousz when
investigating the stochastic movement of coal dust on alcohol and became popular when in 1827
the scottish botanist Robert Brown described the motion of pollen particles on water. In 1905,
Albert Einstein proposed a set of equations as thermodynamic scaffold to Brown's
observations.25 He introduced ! as the diffusion constant of particles, which depends on
universal constants, the absolute temperature, the size of the particles and the viscosity of the
fluid.
! =
!"6!!!"#
=!!!6!"# =
!!!!!
(3.1)
where R is the gas constant, T is the temperature in Kelvin, NA = 6.022 x 10²³ mol-1 is the
Avogadro constant, η is the dynamic viscosity of the fluid, a the particle radius and !! =!!!
is

Axel Hochstetter 16
Boltzmann's constant and !! is the drag coefficient of a spherical particle moving relative to the
surrounding fluid.
Eight years later Przibram26 reported that the trajectories of moving protozoa can be described
by Brownian motion. While the net displacement ! ! − !(0) averages to zero, its square can be
described by
!(!)! = 2!!"#!" (3.2)
where ! is time and !!"#is the number of dimensions in which the motion takes place.27
Przibram also found, that the random walks of his investigated protozoa are much more influenced
by the temperature than Einstein had stated.27
An object that moves without persistence or preferred direction can be described by the random
walk model. Popularly, this model is described as a drunken sailor trying to leave a tavern. After
each step he takes, he falls down, and forgets in which direction he was just heading. When he
gets up again, he takes one step in a random direction and falls again.
For the 1-dimensional random walker, there exist only two directions: back or forth. After one
step, he is x = 1 δ away from his origin (the tavern, x = 0). After the second step, he is either two
steps 'right' (x = 2 δ), two steps 'left' (x = -2 δ) or back at the tavern (x = 0). With a probability of
50%, he is back at the tavern, and in 25% of the cases he is either 2 steps to the left or right.
With increasing number of steps, !, the probability ! that the sailor managed to be ! steps away
from the tavern can be calculated by
!!,! =
12
! !(! −!)
2=
!!
2! !!!!
! !!!!
! (3.3)
The probability distribution for 10 steps is exemplarily plotted below in Figure 3.6. The
probability can be fitted by a Gaussian normal distribution.

Axel Hochstetter 17
Figure 3.6: Probability density distribution for displacement after 10 steps. Black line represents a Gaussian normal
distribution fit.
As illustrated by Figure 3.6, the mean displacement ! equals zero. By squaring the mean
displacement, we arrive at the mean squared displacement (MSD), which is defined by
!"#(!) ≡ !!(!) (3.4)
where! denotes the timespan in which the displacement took place. The MSD can also be seen as
a representation of the area an average random walker explores during ! timesteps.
Together with equation (3.2), which describes the same phenomenon, we can derive the
following relation between the MSD of a random walker and his diffusion constant:
!"# = !!(!) = 2!!"#!" (3.5)
While the relation in equation (3.5) holds true for model random walkers, like diffusing particles,
living organisms sometimes exhibit an anomalous random walk behaviour. For the drunken
sailor model, that might be a sailor that from time to time remembers that he left his purse in the
tavern and therefore tries to get back until he falls again, gets up, takes three random steps and
remembers again his purse...
For anomalous diffusion, equation (3.5) can be adjusted to:
∆(!)! = 2!!"#!!!! (3.6)

Axel Hochstetter 18
where K is the generalized diffusion constant and ! is the anomalous diffusion exponent which
defines the process as either subdiffusive (0 < ! < 1) or superdiffusive (1 < ! ≤ 2). Subdiffusive
motion i.e. would be that the sailor repeatedly goes back to the tavern, thus covering less area
than he randomly would. Superdiffusive in this context would be, that he tries to head to his ship.
For ! = 2, he would go straight to his ship in a ballistic motion. Here ! = 1 would denote a
normal diffusion. For three sailors each with a speed of one meter per second and a ! of 0.5,
1 and 2 respectively, the MSD would look like Figure 3.7.
Figure 3.7: MSD of normal diffusive (black), subdiffusive (magenta) and superdiffusive / ballistic behaviour (green).
With double-logarithmic scaling, MSD plots are linear and allow for direct measure of the slope,
which yields the anomalous diffusion exponent, !, and dividing the covered area by the time step
yields the diffusion constant as shown in equation (3.7)
! =
!!(∆!)2!!"#∆!
(3.7)
One microbiological concept that is connected to the random walk model is called chemotaxis. A
motile swimming cell might find itself in an area with low food supply. To avoid starvation, the
cell moves into a random direction, hoping to find a better food supply there. After swimming a
certain distance L the cell might sense an increase in food concentration. Then, the cell remains
in that area, displacing itself only little in random directions. If the food supply goes down again,
it will again swim the same distance L. If in the new spot, food is scarce as well, it remains only
briefly there, before it again swims in a randomly chosen direction the distance L. This behaviour
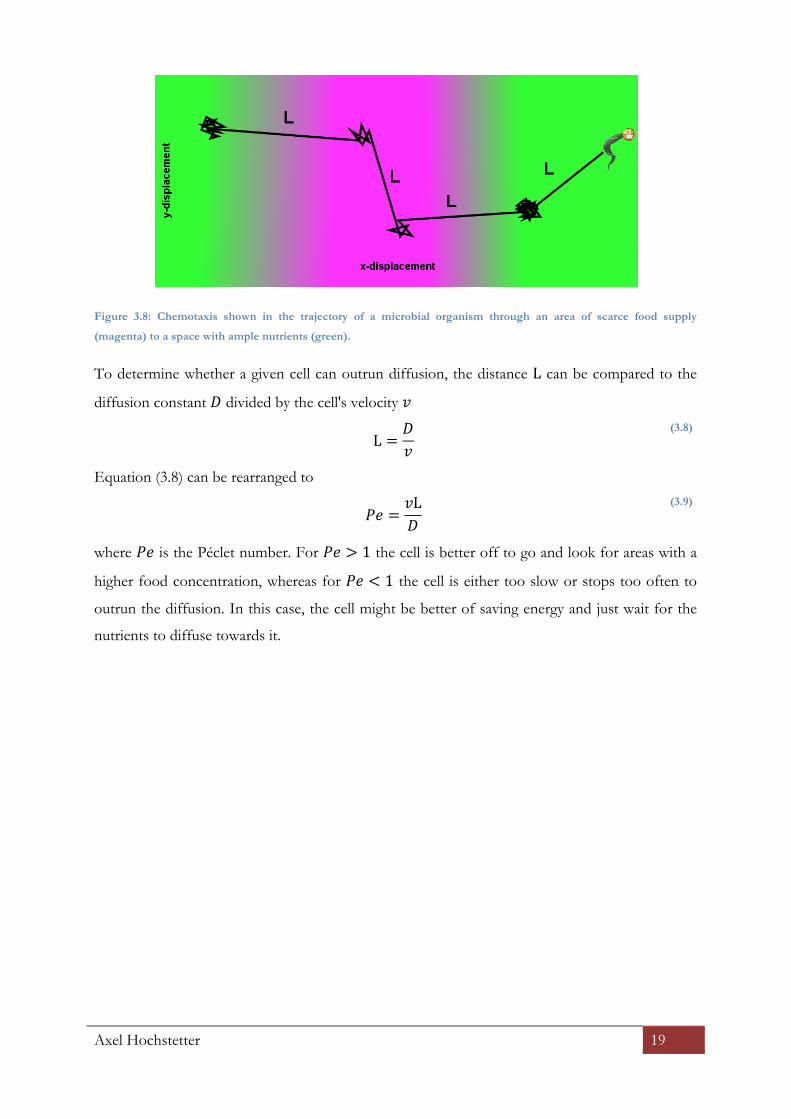
is called chemotaxis and depicted in Figure 3.8.
Axel Hochstetter 19
Figure 3.8: Chemotaxis shown in the trajectory of a microbial organism through an area of scarce food supply
(magenta) to a space with ample nutrients (green).
To determine whether a given cell can outrun diffusion, the distance L can be compared to the
diffusion constant ! divided by the cell's velocity !
L =
!!
(3.8)
Equation (3.8) can be rearranged to
!" =
!L!
(3.9)
where !" is the Péclet number. For !" > 1 the cell is better off to go and look for areas with a
higher food concentration, whereas for !" < 1 the cell is either too slow or stops too often to
outrun the diffusion. In this case, the cell might be better of saving energy and just wait for the
nutrients to diffuse towards it.

Axel Hochstetter 20
3.2 Model organisms
3.2.1 Trypanosoma brucei brucei
Taxonomy, life cycle and related disease
Trypanosoma brucei brucei (trypanosomes) is widely investigated as a model flagellate.28–32 It is a
subspecies of the family of trypanosomes (Table 3.1) that causes fatal sleeping sickness in
humans (Human African Trypanosomiasis, HAT),33–35 which is endemic in specific parts of
Africa.34–37 Moreover, as part of their live cycle, (Figure 3.10) T. brucei brucei cause the Nagana
disease in livestock.
Kingdom Protista
Super-group Excavata
Phylum Euglenozoa
Class Kinetoplastea
Order Trypanosomatida
Genus Trypanosoma
Species T. brucei
Sub-species T. b. brucei
Table 3.1: Taxonomy of Trypanosoma bruce i bruce i
Figure 3.9: Anatomy of Trypanosoma bruce i buce i BSF showing sizes and essential organelles. Image reprinted from
Uppaluri (2011)38

Axel Hochstetter 21
Course of disease
Infection of a mammalian host starts when a tsetse fly bite delivers growth-arrested metacyclic
trypomastigotes to the mammalian bloodstream8 (Figure 3.10 a). This causes a bloodstream
infection. After differentiating into proliferating slender bloodstream forms, they invade
extravascular tissues and finally the central nervous system (CNS). The infection of the CNS is
called the late stage or the second stage (Figure 3.10 c). When the concentration of slender
trypanosomes surpasses a certain concentration in the bloodstream, the differentiation into non-
proliferating stumpy forms takes place.
At this stage, a tsetse fly can take up parasites with the blood meal into the midgut. There, short
stumpy forms differentiate into procyclic trypomastigotes, which multiply and establish a midgut
infection. These midgut procyclic trypomastigotes migrate (b) through the peritrophic matrix,
along the foregut to the proventriculus. From there they migrate through the mouthparts, via
salivary ducts into the salivary gland, where they attach to the salivary gland epithelium
(Figure 3.10 b). In the proventriculus, procyclic trypomastigotes undergo extensive restructuring,
coupled to an asymmetric division, to generate one long epimastigote and one short epimastigote
(Figure 3.10 a).8 After arriving in the salivary gland, the short epimastigote attaches to epithelial
cells where it replicates before completing the life cycle via an asymmetric division. Thereby, it
generates metacyclic trypomastigotes that are freely distributed in the salivary gland lumen and
specialized to survive in the mammalian host. Forms that replicate via binary fission are depicted
with circular arrows.

Axel Hochstetter 22
Figure 3.10: Generalized life cycle of Trypanosoma bruce i
(a): Life cycle both in the mammalian host and in the vector.
(b): Journey through the tsetse fly, including stations that are important for the cell cylce.
(c): Trypanosomes crossing the blood brain barrierinto the brain and the central nervous system (CNS).Reused and
adapted from Langousis e t a l .8 under license of RightsLink

Axel Hochstetter 23
Sheathed flagellar propulsion
The flagellum of the trypanosomes is vital for the locomotion and viability of trypanosomes. It
consists of a crystalline paraflagellar rod (PFR) a microtubular axoneme and connecting
proteins39. The microtubular axoneme consists of 9 doublets of microtubules that encircle a pair
of singlet microtubuli8known as the central pair apparatus. This central pair apparatus reaches
from the basal body of the flagellum to its distal tip and does not rotate (as in similar organisms
like C. reinhardtii) but has a fixed orientation and is vital for the beat generation. Other parts of
the flagellum are important for directing, but not for generating the waves caused by the flagellar
beat.8 The trypanosome flagellum is completely different form bacterial flagella and more
complex than most other eukaryotic flagella, being equipped with a paraflagellar rod (PFR) and
ciliary necklace. Additionally, it is connected to the cell body along its entire length via the
flagellar attachment zone (FAZ) (Figure 3.12). Trypanosoma brucei is a model organism for
sheathed flagellate propulsion.28–32 They exhibit two distinct modes of propulsion: running and
tumbling.40 In running mode, trypanosomes move persistently in one direction. In tumbling mode
trypanosomes change their direction frequently without moving far (Figure 3.11). Uppaluri et al.
(2011)40 also discussed a third "intermediate" mode, which can be seen as a combination of
running and tumbling.
Figure 3.11: Motility modes in trypanosomes. Colour-coded time-lapse image of each one trypanosome in running
(upper right) and tumbling (lower left) mode over 2 minutes. Scale bar is !" !". Figure reprinted from Uppaluri e t a l .
201140

Axel Hochstetter 24
Figure 3.12: Overview of the Trypanosoma bruce i flagellum.
Reused and adapted from Langousis e t a l .8 under license of RightsLink

Axel Hochstetter 25
Hydrodynamic clearing of VSG
In the blood systems of their mammalian hosts, trypanosomes are attacked by the hosts' immune
systems. To evade these attacks, trypanosomes are equipped with a variant surface glycoprotein
(VSG) coat.11 Antibodies that bind to the VSG coat, are hydrodynamically forced into the
flagellar pocket, where VSG-bound antibodies are endocytosed (Figure 3.13) and broken down
within lysosomes.
Figure 3.13: Hydrodynamic immuno-response evasion strategy of trypanosomes
(a):Stained IgG and IgM molecules bind to the VSG coat on the trypanosome's surface. (b): VSGs are homodimers that
are attached to the surface by GPI anchors. (c): Hydrodynamic clearance of stained Anti-VSG antibodies (green)
towards the flagellar pocket (dark arrows) where, after endocytosis, a lysosome (white arrows) is formed in which the
anti-VSG antibodies are broken down. Adapted from Engstler e t a l .11

Axel Hochstetter 26
3.2.2 Caulobacter crescentus
Taxonomy, live cycle and habitat
Caulobacter crescentus (caulobacter) is a gram-negative bacterium (Table 3.2), that is widely
distributed in fresh water streams and lakes.
Kingdom Bacteria
Phylum Proteobacteria
Class Alpha Proteobacteria
Order Caulobacterales
Family Caulobacteraceae
Genus Caulobacter
Species C. crescentus
Table 3.2: Taxonomy of Caulobac t er c r e s c entus .
Caulobacter is an oligotrophic bacterium, which means it can survive on a scarce supply of
nutrients and exhibits a two phased live cycle (Figure 3.14).
During the first phase, the cell is a freely swimming swarmer cell (SW) equipped with several pili
and one prokaryotic flagellum for propulsion. If a pilus (or multiple pili) get in contact with a
solid surface, the pili are retracted and the cell adheres to the surface. Upon surface contact
caulobacter starts building a holdfast by secreting adhesins (sticky polysaccharides).41 Holdfast
formation also occurs in swarmer cells without surface contact after about 30 minutes.41 Once
the adhering proteins for the holdfast are secreted, a stalk is assembled between the holdfast and
the cell body. During the stalk assembly, the cell sheds its flagellum and becomes a immotile,
stalked cell (ST). This is the second phase of caulobacter live cycle. The stalked cell subsequently
undergoes asymmetric division. From the free pole, a daughter cell is produced. At the distal end
of this pre-divisional cell (PD) a new flagellum appears. As the daughter cell is fully developed, a
ring like contraction induces the division of the cell upon the new swarmer cell is released. Thus
the live cycle of Caulobacter crescentus (Figure 3.14) is completed.

Axel Hochstetter 27
Figure 3.14: Life cycle of Caulobac t er c r e s c entus .
Fluorescence images of synchronized C. cres c entus wild-type swarmer cells (top) and stalked cells (bottom). Cells are
labelled with fluorescin-WGA. The numbers indicate the percentage of cells bearing a holdfast at the specified times
Image reprinted from Li e t a l . (2012)41
The gram-negative caulobacter has a bean-shaped cell body, which is enveloped by a multi-layer
shell (see Figure 3.15 inset). The shell consists of S-layer of O-antigen and LPS in addition to the
outer membrane, periplasm and inner membrane that shield the cytoplasm from the surrounding.
Additionally, swarmer cells are equipped with pili and a prokaryotic flagellum on one pole, while
stalked cells possess a stalk and a holdfast instead (Figure 3.15). Inside the stalk, diffusion barriers
ensure proper nutrient supply.

Axel Hochstetter 28
Figure 3.15: Structure of Caulobac t er c r e s c entus . Taken from http://en.wikipedia.org/wiki/Caulobacter_crescentus.
Due to the dimorphic life cycle (as shown in Figure 3.14) and the readily available mutants42–44
caulobacter is the main model for the bacterial cell cycle.45
Caulobacter propulsion
Caulobacter is equipped with both pili and a prokaryotic flagellum, it propels itself in fluids by
swimming using the flagellum and can crawl on surfaces short distances prior to stalk
formation.46 The motor of a caulobacter is reported to have a swimming torque of about
350 !" ⋅ !" while consuming about 1.5 ⋅ 10!!! J for swimming one meter.46

Axel Hochstetter 29
3.3 Microfluidics
3.3.1 Definition Microfluidics
The scientific discipline investigating the behaviour and dynamics of fluids on the microscopic
length scale is known as microfluidics. Microfluidics is an emergent field on the interface of
engineering and physics, advancing fluid-dynamics and is already applied to chemical and
biological studies. The term "microfluidic" is further used for devices that consist of channels
where fluids and gasses are processed. These channels have diameters ranging from one to
hundreds of micrometers. The simplest microfluidic device is a thin cylinder, which we use as a
model to visualize basic concepts of microfluidics.
At first, viscosity. Viscosity is the property of a fluid, that offers resistance if one layer of the fluid
is moved over an adjacent layer. Two layers of fluid with a distance !" and velocities ! and
! + !" respectively. The viscosity ! and the relative velocity !" cause a shear stress ! between
the fluid layers.
! =
!! = !
!"!"
(3.10)
Figure 3.16: Viscosity and shear between two adjacent layers of fluid. Image taken from
http://www.oocities.org/venkatej/mech/fluid_mechanics/fluild_mechanics.html
If we expand our focus from two adjacent layers to our model, the cylindrical tube, we will see
that the flow inside can be either turbulent or laminar, as shown in Figure 3.17 .

Axel Hochstetter 30
Figure 3.17: Laminar and turbulent flow inside a straight, cylindrical channel. While for turbulent flow, no time
independent predictions of the flow velocity and shear can be made, laminar flow is predictable and stationary. The
velocity is highest in the centre of the channel, and decreases to almost zero at the wall. Courtesy of Nial Barker.
Turbulent flow profiles change with time and are highly influenced by the geometry of the
surrounding vessel. In contrast, laminar flow in a microfluidic device has at any time a parabolic
velocity profile (Figure 3.18), even after flowing around obstacles. The differences in velocity of
adjacent layers of fluid is the cause for shear stress, that acts upon any body that is placed across
the radius of the channel.
Figure 3.18: Shear stress � and flow velocity ! profile of laminar flow through a cylindrical tube of radius !. Image
taken from http://www.oocities.org/venkatej/mech/fluid_mechanics/fluild_mechanics.html
The total mass transport and mass conservation that happens in a microfluidic device can be
described by
!!! = −∇ ∙ (!") (3.11)
where ! is the density of the fluid and ! the velocity. For a incompressible, Newtonian liquid
(like water and most buffer solutions) Equation (3.11) can be simplified to
∇ ∙ ! = 0 (3.12)
Axel Hochstetter 31
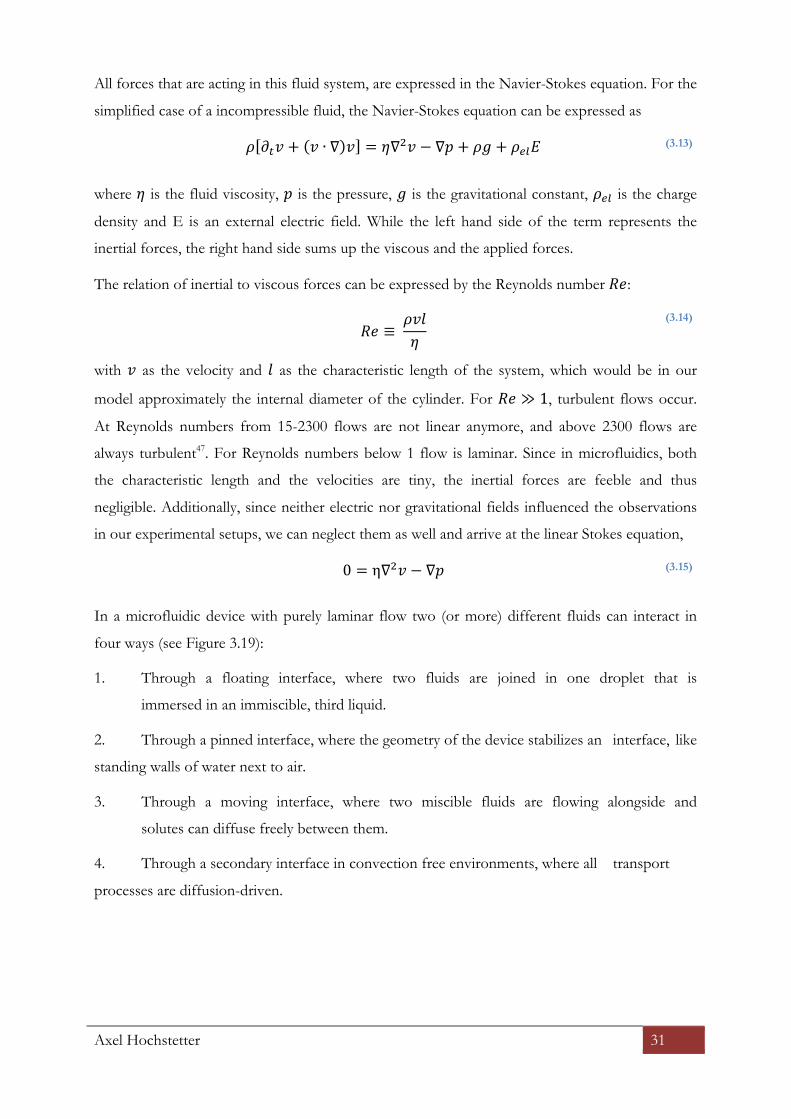
All forces that are acting in this fluid system, are expressed in the Navier-Stokes equation. For the
simplified case of a incompressible fluid, the Navier-Stokes equation can be expressed as
! !!! + ! ∙ ∇ ! = !∇!! − ∇! + !" + !!"! (3.13)
where ! is the fluid viscosity, ! is the pressure, ! is the gravitational constant, !!" is the charge
density and E is an external electric field. While the left hand side of the term represents the
inertial forces, the right hand side sums up the viscous and the applied forces.
The relation of inertial to viscous forces can be expressed by the Reynolds number !":
!" ≡
!"#!
(3.14)
with ! as the velocity and ! as the characteristic length of the system, which would be in our
model approximately the internal diameter of the cylinder. For !" ≫ 1, turbulent flows occur.
At Reynolds numbers from 15-2300 flows are not linear anymore, and above 2300 flows are
always turbulent47. For Reynolds numbers below 1 flow is laminar. Since in microfluidics, both
the characteristic length and the velocities are tiny, the inertial forces are feeble and thus
negligible. Additionally, since neither electric nor gravitational fields influenced the observations
in our experimental setups, we can neglect them as well and arrive at the linear Stokes equation,
0 = η∇!! − ∇! (3.15)
In a microfluidic device with purely laminar flow two (or more) different fluids can interact in
four ways (see Figure 3.19):
1. Through a floating interface, where two fluids are joined in one droplet that is
immersed in an immiscible, third liquid.
2. Through a pinned interface, where the geometry of the device stabilizes an interface, like
standing walls of water next to air.
3. Through a moving interface, where two miscible fluids are flowing alongside and
solutes can diffuse freely between them.
4. Through a secondary interface in convection free environments, where all transport
processes are diffusion-driven.

Axel Hochstetter 32
Figure 3.19: Interfaces in microfluidic devices and their functionalities:
(a): Floating interfaces between immiscible fluids produce droplets of precise shape and varying content.
(b): Pinned interfaces between immiscible liquids are created by selective surface patterning of a microchannel.
(c): Moving interfaces between miscible liquids are created under laminar flow, creating a diffusive interface with
predictable geometry.
(d): Secondary interfaces arise in microscale channels due to diffusion-driven transport, which can create complex but
predictable patterns (interfaces) of solutes based on the diffusivity of the solutes. Taken and adapted from Atencia e t
a l . 48
All matter that is solved or immersed in one fluid can only be transported to the other fluid by
crossing the interface. In all cases of laminar flow, cross-interfacial transport happens purely by
diffusion. This makes the evolution of concentration gradients predictable and can be used for
numerous ways. In this thesis, the diffusion in flow free environment will be of importance,
which is governed by the same basic laws of diffusion, and will be discussed then.

Axel Hochstetter 33
3.4 Optical Tweezers
3.4.1 Light and matter interactions
Light is comprised of photons and can interact with matter in four ways. Light can get diffracted
by crossing the interface between materials of different optical density (like e.g. glass and water),
it can be deflected at such an interface and change direction, light can be reflected back to where
it came from or can be absorbed (Figure 3.20).
Figure 3.20: The four types of interaction of light with matter. The path of light (black arrows) is influenced by matter
(black circle) and the resulting force on the object are shown (red arrows). Courtesy Eric Stellamans2
The direction of the resulting force is pointing opposite to the change in the path of light. The
amplitude of the force can be calculated from momentum that is transferred during the
interaction. The force !, is described by Newton's second law as
! = !" (3.16)
where ! is the mass and ! is the acceleration the mass is subjected to. The force acting on the
matter is the result of a transfer of momentum ! from the photon to the matter. The momentum
! of a moving matter is given by
! = !" (3.17)
where ! is its velocity. The relation between the force and the momentum can be stated as
! =!! ! =
!!
(3.18)
where ! is the time duration of the interaction. So now, we could calculate the force by the
momentum and the mass of the photon. Only, photons do not have rest mass, thus the classical
laws do not apply to photons. But they carry an energy !, that is defined by Einstein's famous
formula of mass-energy equivalence as
! = !!! (3.19)
Axel Hochstetter 34
where ! is the photons dynamic mass, the mass it has as long as it is in motion, and !, the speed
of light. In combination with
! = ℎ! (3.20)
where ℎ is Planck's constant (ℎ = 6.626 ∗ 10!!" Js) and ! (the frequency) can be substituted by !! , where ! is the wavelength of the photon, we can rearrange Equation (3.19) to
! =
ℎ!!!
(3.21)
In combination with Equation (3.17), we obtain
! = !" =
ℎ!! =
ℎ!
(3.22)
And finally, we can calculate the force of the light-matter interaction by combining Equations
(3.18) and (3.22) to
! = !!"
. (3.23)
While the interactions are extremely short lived, the forces on a single photon are practically
immeasurable. Only when many photos of the same wavelength can interact at the same time
with matter the force is amplified measurably. This can be achieved by using a laser or a set of
filters and lamps with a high intensity.
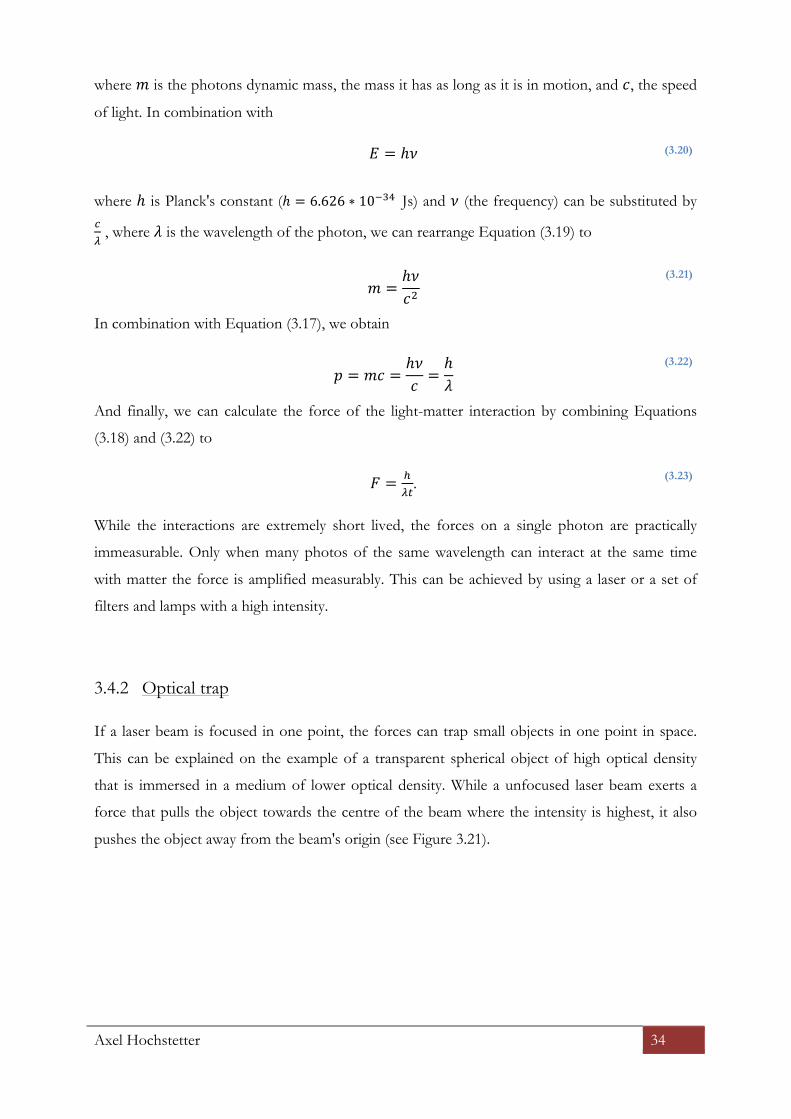
3.4.2 Optical trap
If a laser beam is focused in one point, the forces can trap small objects in one point in space.
This can be explained on the example of a transparent spherical object of high optical density
that is immersed in a medium of lower optical density. While a unfocused laser beam exerts a
force that pulls the object towards the centre of the beam where the intensity is highest, it also
pushes the object away from the beam's origin (see Figure 3.21).

Axel Hochstetter 35
Figure 3.21: Forces on a spherical object in an unfocused vs. a focused laser beam. The focused laser beam creates one
position where the object can be stably trapped. Taken and modified from Eric Stellamanns.
In contrast, a focused laser beam exhibits one point, in which all forces on the object cancel each
other out. This is the position, where the object can be stably trapped. Every dislocation from
this spot results in a force that pulls it back into the spot. The object even follow the focus,
whenever it is moved. The application of this technique is called optical trapping and the instalment
of a laser on a microscope (where the beam is focused onto an object on the microscopes sample
stage) is called optical tweezers or optical trap (OT).
This effect and the technique has been discovered by Arthur Ashkin,49,50 and has since then been
used amply in natural and life sciences. Not only dead, spherical objects have been trapped, but
also elaborate geometrical objects have been used for molecular motors51–53. Living cells have
been optically trapped and sorted54–57. The motors of motile cells have been characterized
employing optical traps.58 OTs have further been used for investigations on single molecules59–62
and rotating63–66 and holographic OTs67–69 have been developed. Yet, this is only giving a short
overview of the versatility of OTs as a tool for natural sciences, life sciences and engineering.
In this thesis, all experiments were conducted using a single gradient optical trap, as described in
Figure 3.21.

Axel Hochstetter 36
4 Materials and Methods
4.1 Cell Culture
Cultivating caulobacter
Caulobacter crescentus (caulobacter) strains (CB15 wild type, NA1000 wild type, CB15∆pilA,
NA1000∆pilA CB15∆hfsA and NA1000∆pilA∆flgA) were provided by the group of Prof. Urs
Jenal (Biozentrum, Uni Basel, Switzerland).
Frozen C. crescentus were thawed and grown on plates of peptone yeast extract (PYE) with 0.2%
glucose and 2% agar at 30 °C for 48 hours. Selected single colonies were transferred to 5 mL
liquid PYE media, supplemented with CaCl2 (5 mM) and incubated at 30 °C for 16-24 hours,
until the optimal optical density (0.8-1.0) was reached. The optical density was measured
individually, using a photo-spectrometer (Genesys6, Thermo Spectronic, WI, USA) at 660 nm.
Finally, cell cultures were supplemented with hold-fast binding lectin wheat germ agglutinin
(WGA), which was fluorescently labelled with Oregon Green 488 (1g/ml) and used for single cell
assays.
Cultivating trypanosomes
Please note that recipes for all cell culture media and solutions for trypanosomes is provided in
the Appendix A on pages 103f.
Trypanosoma brucei brucei MiTat 1.2 (trypanosomes) were a gift from the Department of Medical
Parasitlogy and Infection Biology of the Swiss Tropical and Public Health Institute.
Trypanosomes were grown in HMI-9 cell medium at 37 °C at 5% CO2. Populations were kept
below 106 cells per mL by repetitive splitting. After a maximum of 15 splittings, trypanosomes
were discarded and fresh populations were defrosted.
Preparing cell and drug solutions
For experiments, 2 mL of trypanosomes in CM were centrifuged in a Heraeus Labofuge 400 R
(Fischer Scientific, Switzerland) at 1400 rpm (237 xg) and washed once with 2mL of CM and
once with 2 mL CM with bovine serum albumin (BSA, 5 mg/mL). The supernatant was
discarded and the cells were taken up into a 1 mL syringe (Braun) in 0.7 mL of CM with BSA
(5 mg/mL). This comprised the 'cell solution', which was introduced into the device. The
Axel Hochstetter 37
solution of CM and BSA was weekly prepared and stored at 37 °C and at 5% CO2 in humid
atmosphere to ascertain optimal conditions.
For the 'drug solution', the drug was dissolved in 2 mL of CM with BSA (5mg/mL) and
polystyrene beads (1 µm diameter, Polysciences) solution 2 µL/mL. Suramin, as an exception,
was dissolved in 2 mL of CM without BSA, for it is already known, that BSA diminishes the
effect of Suramin onto trypanosomes.
Storing trypanosomes
For freezing and long-time storage, trypanosomes were grown in CM to a density of 104 to 106
per mL. Then a 10 mL aliquot was taken and centrifuged for 10 minutes at 1400 rpm. The
supernatant was discarded, the pellet of cells was taken up into 1 mL of freezing medium (see
Appendix A) in CryoTubes (VWR), which where then slowly cooled down to -80 °C in a “Mr.
Frosty” (Nalgene) and finally stored either at -80 °C or in liquid nitrogen.
Thawing trypanosomes
Frozen cells were thawed in the water bath at 37 °C, re-suspended in 9 mL CM, centrifuged at
1400 rpm (≈ 237 x g) and the supernatant discarded. The cell pellet was re-suspended in 1 mL of
fresh cell media and split into fractions of 50-500 µL and put in 10 mL of fresh culture medium.
Preparing fixated trypanosomes
The desired amount of trypanosomes was washed twice with TDB, then taken up in 2.5%
glutaraldehydic solution of TFB at RT for 2 hours. Afterwards, it was washed twice with TDB,
and then re-suspend in pure water.
For on-slide-fixation a drop of this solution was air-dry on a cleaned glass-slide. For SAXS the
fixed trypanosomes were taken up in pure water into a suitable glass capillary.
Disposing trypanosomes
All liquid waste containing trypanosomes was autoclaved at 121 °C for 20 minutes and were then,
after cooling to RT, disposed according to federal and cantonal regulations.

Axel Hochstetter 38
4.2 Microfluidics & Soft Lithography
All devices were produces by standard soft lithography procedures. Soft lithography describes the
replication of designs and structures from a mask onto a device. This happens in two steps, the
generation of a master (Figure 4.1.a), and the subsequent production of a usable microfluidic
device (Figure 4.1.b).
Figure 4.1: Production process of a microfluidic device. Specifications are in accordance to the supplier of the
photoresist and lead to structures of about 9 µm height, when using SU8 3010 photoresist (MicroChem, USA). Image
adapted from70
(a): Preparation of the master from a silicon waver and spin coated photoresist that is developed using a chromium
mask bearing the desired design
(b): Preparation of the microfluidic device from a PDMS cast of the master that is cured and bonded with a glass cover.

Axel Hochstetter 39
4.2.1 Master preparation
The architectures of devices are designed using QCAD software (RibbonSoft, version 3.3) and
manufactured as chromium masks on quartz glass (ML&C GmbH, Germany). The master, which
serves as a re-usable mould for the structures of the devices, is created under cleanroom
conditions (Figure 4.1). On a clean silicon waver (Si-Mat, Germany), SU8 negative photoresist
(Microchem, USA) is spin-coated according to supplier specifications to obtain the desired
coating thickness. The coated waver is soft baked and then the structures are written into the
photoresist through the applied chromium mask (ML&C GmbH, Germany) or foil mask (JD
Photo-tools, UK) by exposition to UV light (365 nm) on a MJB4 mask aligner (SUSS MicroTec
AG, Germany). After exposure, the waver undergoes post-exposure baking and development in
SU8 developer, where unexposed photoresist is solved off of the waver. After rinsing with
propan-2-ol and drying with nitrogen the master is finished. Please note that a standard recipe for
a device of 8 !m height is provided in the Appendix A on page 102.
4.2.2 Device preparation
The obtained master serves as a mould from which multiple casts can be taken (see Figure 4.1.b).
Therefore, PDMS monomer and cross-linker (Sylguard 184, Dow Corning GmbH, Germany) are
mixed in a mass ratio of 10:1, vigorously stirred, degassed and poured over the master. After
curing the polymer by baking at 80 °C for at least 4 hours, the cast is cut and peeled from the
mould. To later connect the inlets and outlets to tubing, holes are punched through the cast. To
complete the device, the cast and a clean glass slide (VWR, outer diameter 50 mm) are exposed to
reactive plasma of air at 2 mbar for 30 seconds in a plasma cleaner (Harris Plasma, USA), which
creates highly reactive radicals on the surfaces of both glass and PDMS cast. The glass is gently
pressed against the open structures of the cast. The activated surfaces then bind covalently and
the device is sealed.
4.2.3 Device mounting
The finished devices were allowed at least 20 minutes to fully covalently bind and for all
remaining radicals to react with ambient water and air. Then tubings (polytetrafluorethylene
microtube, outer diameter 0.78 mm) were inserted into the holes and supplied with cannulas
(Braun, Germany, internal diameter 0.4 mm). Afterwards, the device was mounted on a BX61
microscope (Olympus, Germany) and syringes delivered any medium and cells into the device.

Axel Hochstetter 40
4.3 Optical trapping and microscopy
The optical trap that was used for all the experiments mentioned herein consisted of a
parallelized Laser beam (l = 808 nm, Schäfter + Kirchhoff GmbH, Germany) that was coupled
into the optical pathway of an upright optical microscope (BX61, Olympus, Germany). The laser
emitter was held in an in-house crafted adapter that fixed it onto an extension module for the
microscope (UL2, Olympus, Germany). The extension module was fitted with a dichroic mirror
(Cat.-Nr. F76-720, AHF, Germany) that reflected the laser beam into the optical pathway and
towards the sample. To avoid overcasting of the optical signal by reflected laser light, the
reflexion module was equipped with an additional glass filter (GPX10-30 DB5, Olympus,
Germany) with a DBAR 808/940 coating.
The parallelized and collimated laser beam was focused by the objective. The focal point of the
optical trap lay in the focal plane of the microscope and was calibrated to be in the centre of the
field of view.
Images were recorded on a Sensicam (PCO, Germany) or a Phantom Miro 3 (Vision Research,
USA).
4.3.1 Calibration of the optical trap
An object that is optically trapped in a microfluidic device mainly experiences two different
forces. The stall force of the optical trap that holds the object in one position and the drag forces
caused by the flow of surrounding fluid. The stall force depends on the objects geometry, the
refractive indices of both the object and the surrounding fluid and on the power of the laser
effective on the object. Since cells vary locally in their refractive index and geometry, calculations
of the stall force can be inexact. The drag force, on the other hand can be exactly calculated (see
Equation (4.1), below). Thus, the optical trap was calibrated in a setup, where both the stall force
of the optical trap and the drag force of the viscous fluid were equal.
After positioning the beads in the middle of the channel with rectangular geometry, the flow
velocity was increased until the drag forces of the liquid tore the sphere from the optical trap.
The drag force is the force any object experiences when moving inside a viscous fluid can be calculated by !!"#$ = !!"#$ ⋅ ! (4.1)
with !!"#$ as drag force, !!"#$ as the drag force coefficient and ! the velocity of the object
relative to the fluid.

Axel Hochstetter 41
The drag force coefficient depends on the geometry of the object and the viscosity of the
surrounding fluid and is given for a spherical object as
!!"#$ = 6!"# (4.2)
where ! is the viscosity of the fluid and ! the speed of the fluid relative to the spherical object.
Thus, the drag force can be calculated by:
!!"#$ = 6!"# ⋅ ! (4.3)
As long as the force of the optical trap is stronger than the drag force, the bead is held inside the
optical trap. At a point, where the drag force equals the optical force, the tiniest additional forces
(like from Brownian motion) will push the spherical object form the optical trap.
In order to calibrate the optical trap, polystyrene beads polystyrene beads of 1 !m diameter
(Polybead® Microspheres, Cat.-Nr. 07310-15, Polysciences, Germany) have been optically
trapped in the middle of a microfluidic channel of 8 !" height and 40 !" width. Then a flow
has been slowly ramped up using syringe pumps (neMESYS, Cetoni, Germany). When the
particle left the trap, the flow velocity was measured by recording images with a set exposure
time. during this time, the particle travelled a certain way !". By multiplying the displacement !"
with the exposure time, the flow velocity was obtained (Figure 4.2).
Figure 4.2: Experimental setup for optical trap force calibration: The polystyrene bead (blue) was trapped at the focal
point of the optical trap (red dot). With increasing flow velocity (red arrows) the beads were pulled from the optical
trap. This was recorded at long exposure times resulting in blurred beads on the recorded images. By multiplying the
displacement(Δx, which equals the length of the blurred beads minus their diameter) with the exposition time of one
image the flow velocities were calculated. Image is a courtesy of Benjamin Banusch.
This measurement was repeated several times at different laser powers show that there is a linear
relationship between the laser power P and the velocity ! at which the beads leave the optical
trap. In combination with equation (4.3) and taking into account that ! of the surrounding fluid
(aqueous solution at RT) was 0.001 !" ⋅ !, we found that each Watt in laser power corresponds
to 35.7 pN of stall force (Figure 4.3).

Axel Hochstetter 42
Figure 4.3: Drag force plotted over the laser power of the optical trap. The red circles show the
averaged forces that were exerted by the optical trap at the given lasing currents. According to
the linear fit (red dashed line) the stall force increases by 35.7 pico-Newton per Watt.
4.3.2 Image recording and analysis
Images were recorded on a Miro 3 (Phantom) and a Sensicam (PCO) respectively.
The images were analysed using ImageJ (version 1.48g, Wayne Rasband, National Institutes of
Health,USA) and MATLAB (R2011a and R2013b, The MathWorks Inc.). All MATLAB scripts
used herein are self-written and can be found under section 12.1 on page 102ff.)
Tracking
Trajectories of trypanosomes were recorded using the "Manual Tracking" plug-in for Fiji71. For
trajectories of optically trapped trypanosomes, the position of the flagellar tip was recorded. For
experiments investigating the drug impact of chemicals on trypanosomes, the position of the
flagellar pocket was followed, and all other experiments were based on the centre of mass-
measurements of the motile trypanosomes.
Polystyrene spheres of 1 !" diameter (Polybead® Microspheres, Cat.-Nr. 07310-15,
Polysciences, Germany) were used for the particle image velocimetry. The same polystyrene
spheres were also used to measure flow rates inside channels and micro chambers and to
optically distinguish translucent fluids inside the device like culture medium and drug solutions.

Axel Hochstetter 43
Aligning of Stacks (Registration)
To obtain the trajectories, series of images have been recorded. Due to vibrations within the
microscope-stage-complex, these images were not entirely aligned over each other. This
misalignment was mended using the StackReg plugin72 for Fiji.
Plot Profile
Plot profiles give the grey value (= brightness) of an image along a line that is manually drawn
over the image. It is an inherent feature of the Fiji software.71
CFD Simulations:
For the CFD simulations we used the CFD module from the software COMSOL 4.3a. The
microfluidic device was modelled in 3D using 54,167 finite elements. At first, the stationary
laminar flow was calculated, whereas in a second step the time dependent material transport of
the diluted species were calculated by using the beforehand obtained stationary flow fields.

Axel Hochstetter 44
RESULTS I:
OPTICAL TRAPPING OF LIVING CELLS

Axel Hochstetter 45
5 Optical trapping of bacteria on the example of C. cres c entus
5.1 Introduction
Optical tweezers and microfluidics have already been employed for the sorting and stretching of
cells, as well as for the measurement of forces, elasticity, and cell stiffness of unicellular
organisms.53,55,73 The advantage of the combination between microfluidics and optical traps is the
possibility for touch-less administration and measurement of miniscule forces. Yet, for a reliable
quantification of the measured force, any optical trap has to be calibrated depending on the
respective organism under study. The optical trap exerts stall forces onto a trapped object which
can be assessed by pushing the trapped object out of the trap, using the drag force of the
surrounding, moving medium (see 5.2.2 Assessing the trap parameters for the force calculations).
The forces exerted by optical traps can be used to move, manipulate and study cells, such as
Caulobacter crescentus. During their live cycle, caulobacter undergo metamorphosis from freely
swimming swarmer cells to stalked cells, which have the ability to firmly attach to a surface via
holdfast induction The surface adhesion is a key point for the formation of a biofilm,13 The
process of surface adhesion in caulobacter is divided in three steps. At first, pili attach to the
surface which are then retracted in order to pull the entire cell towards the surface whereby the
flagellum bearing cell pole touches the surface. At this pole, holdfast is either pre-existing or
produced to increase the attachment, and the flagellum is ejected. Finally, a stalk is formed
between the holdfast and the cell body41,45. The holdfast has already been analysed in respect to
its composition and elastic properties74 and its formation in stalked41 and swarmer cells12. The
formation of a biofilm has also been studied over days for various wild-types and mutants13.
Using an optical trap calibrated for caulobacter, we aim to directly measure the forces generated
by a swimming caulobacter, to induce surface adhesion and to analyse the surface attachment
process for caulobacter on the single-cell level. By including mutants lacking either pili (CBΔpilA,
NA1000ΔpilA), holdfast (CBΔhfsA) or both pili and flagellum (NA1000ΔpilAΔflgA), we aim to
investigate their role during induced surface attachment.
Additionally the forces generated by the swimming caulobacter as well as the motility within and
outside of the optical confinement were assessed.

Axel Hochstetter 46
5.2 Materials and methods
5.2.1 Device design
The device was designed in order to create a no-flow condition within the experimental micro
chambers. The device consisted of one main channel (height 8 !m, width 40 !m) between an
inlet and an outlet with adjacent square micro chambers (100 !m by 200 !m) protruding from
the main channel via narrow connecting channels (length: 10 !m, width 6 !m).
5.2.2 Assessing the trap parameters for the force calculations
The force of the optical trap was measured on immotile caulobacter swarmer cells at variable
laser strengths in order to know at which power the laser exerts which force. After positioning
the cell in the middle of a main channel with a rectangular geometry (height: 8 !m, width 40 !m),
the flow velocity was linearly increased using syringe pumps (neMESYS, Cetoni, Germany) until
the drag forces of the liquid flow tore the cell out the optical trap. Flow velocity at the moment
of escape from the trap, was assessed using images recorded with high exposure time (about 100
ms). When cells were leaving the trap, they left a trace on the image. The length of this trace
minus the cell radius corresponds to the displacement of the cell by !" (Figure 5.1). Dividing the
displacement !" by the exposure time results in the flow velocity.
Figure 5.1: Experimental setup for the force calibration of the optical trap: the particle or cell (blue) was trapped at the
focal point of the optical trap (red dot). With increasing flow velocity (red arrows) the beads were pulled from the
optical trap. This was recorded at long exposure times resulting in blurred traces on the recorded images. By dividing
the displacement ∆! by the exposition time of one image the flow velocities were calculated. Image by courtesy of
Benjamin Banusch.
From the obtained velocities, the drag force can then be calculated by
!!"#$ = !!"#$ ⋅ ! (5.1)
whereby !!"#$ is the drag force, !!"#$ is the drag coefficient and ! is velocity of the object
relative to the fluid.

Axel Hochstetter 47
The drag coefficient is a function of the viscosity of the surrounding fluid and the size and shape
of the object. The shape of a caulobacter can be approximated by a prolate ellipsoid (Figure 5.2)
with a width of 2! and a length of 2!.46 The thin flagellum at the posterior pole of the immotile
cell can be neglected for the purpose of this calculation. It was assumed that an immotile
flagellum would align with the flow, thus experiencing little to no drag force.
Figure 5.2: A prolate ellipsoid can be created by rotating an ellipsis of length 2! and width 2! along the major axis
(green). Image by courtesy of User Amit6 (modifications by James B Watson) and Sam Derbyshire respectively, taken
from wikicomons, http://en.wikipedia.org/wiki/Prolate_spheroid (2014-08-17)
Using the equation for the translational drag coefficient of such prolate ellipsoids of:75
!!"#$%∥ = 6!"# ⋅
!!!! − 1
!!!!!!!!!
!" ! + !! − 1 − !
(5.2)
as well as the lengths of ! = 0.8 !m, and ! = 0.25 !m for Caulobacter cresentus46, a drag coefficient
of !!"#$%∥ = 5.46 ⋅ 10!! ! !
! can be computed for C. crescentus.
However, it has to be considered that a prolate ellipsoid within the beam of a strong optical trap
will always aligns perpendicular to the flow (see Figure 5.3), whereas it will align parallel to the
flow when outside of the trap. Thus the drag coefficient within the trap has to be calculated
differently.
Figure 5.3: Orientation of a swarmer cell before and during optical trapping. Inside the optical trap the swarmer cell
aligns itself along the propagation of the beam. Image by courtesy of Benjamin Banusch.
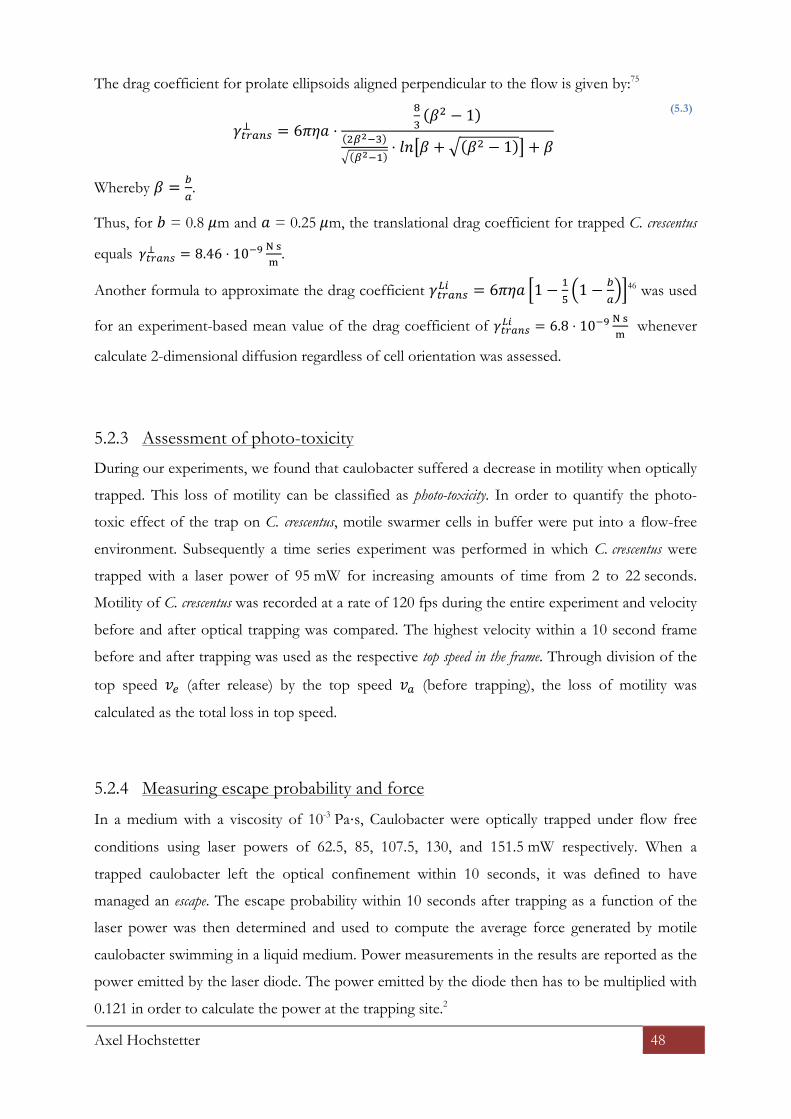
Axel Hochstetter 48
The drag coefficient for prolate ellipsoids aligned perpendicular to the flow is given by:75
!!"#$%! = 6!"# ⋅
!!!! − 1
!!!!!!!!!
⋅ !" ! + !! − 1 + !
(5.3)
Whereby ! = !!.
Thus, for ! = 0.8 !m and ! = 0.25 !m, the translational drag coefficient for trapped C. crescentus
equals !!"#$%! = 8.46 ⋅ 10!! ! !!
.
Another formula to approximate the drag coefficient !!"#$%!" = 6!"# 1− !!1− !
!46 was used
for an experiment-based mean value of the drag coefficient of !!"#$%!" = 6.8 ⋅ 10!! ! !!
whenever
calculate 2-dimensional diffusion regardless of cell orientation was assessed.
5.2.3 Assessment of photo-toxicity
During our experiments, we found that caulobacter suffered a decrease in motility when optically
trapped. This loss of motility can be classified as photo-toxicity. In order to quantify the photo-
toxic effect of the trap on C. crescentus, motile swarmer cells in buffer were put into a flow-free
environment. Subsequently a time series experiment was performed in which C. crescentus were
trapped with a laser power of 95 mW for increasing amounts of time from 2 to 22 seconds.
Motility of C. crescentus was recorded at a rate of 120 fps during the entire experiment and velocity
before and after optical trapping was compared. The highest velocity within a 10 second frame
before and after trapping was used as the respective top speed in the frame. Through division of the
top speed !! (after release) by the top speed !! (before trapping), the loss of motility was
calculated as the total loss in top speed.
5.2.4 Measuring escape probability and force
In a medium with a viscosity of 10-3 Pa⋅s, Caulobacter were optically trapped under flow free
conditions using laser powers of 62.5, 85, 107.5, 130, and 151.5 mW respectively. When a
trapped caulobacter left the optical confinement within 10 seconds, it was defined to have
managed an escape. The escape probability within 10 seconds after trapping as a function of the
laser power was then determined and used to compute the average force generated by motile
caulobacter swimming in a liquid medium. Power measurements in the results are reported as the
power emitted by the laser diode. The power emitted by the diode then has to be multiplied with
0.121 in order to calculate the power at the trapping site.2
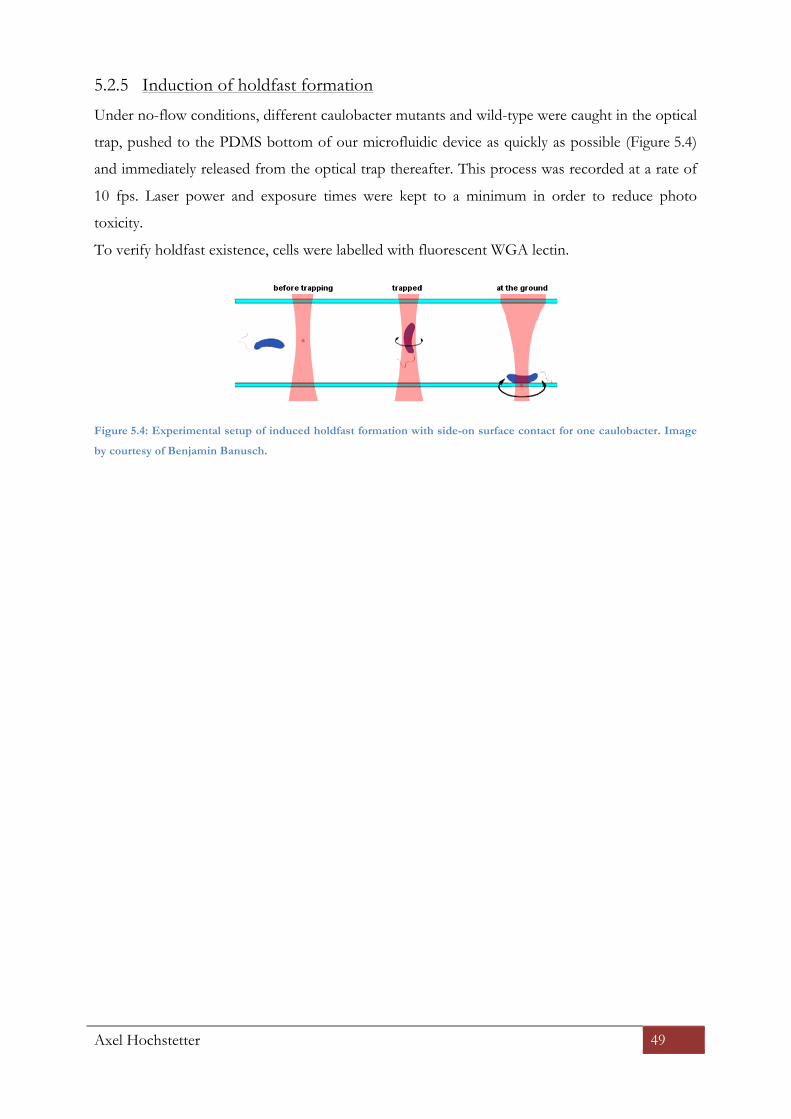
Axel Hochstetter 49
5.2.5 Induction of holdfast formation
Under no-flow conditions, different caulobacter mutants and wild-type were caught in the optical
trap, pushed to the PDMS bottom of our microfluidic device as quickly as possible (Figure 5.4)
and immediately released from the optical trap thereafter. This process was recorded at a rate of
10 fps. Laser power and exposure times were kept to a minimum in order to reduce photo
toxicity.
To verify holdfast existence, cells were labelled with fluorescent WGA lectin.
Figure 5.4: Experimental setup of induced holdfast formation with side-on surface contact for one caulobacter. Image
by courtesy of Benjamin Banusch.

Axel Hochstetter 50
5.3 Results
5.3.1 Optical trap calibration for caulobacter
As described before, the optical trap was calibrated by trapping immotile caulobacter cells and
measuring the drag forces of the medium used to subsequently push them dead cells out of the
trap. The recorded flow velocities for cells escaping the trap show a linear correlation to the laser
powers of the optical trap thus enabling us to know the stall forces in relation to the power of the
laser.
The following calibration parameters for forces exerted on caulobacter by the optical trap have
been found
Between laser powers of 85 mW to 151.5 mW, the velocities for caulobacter escaping the optical
trap can be calculated by: !!"#$%! = (3 ⋅ ! − 21) ⋅ 10!!m/s , where ! is the power of the laser in
Watt (Figure 5.5).
Figure 5.5: Calibration curve for caulobacter escape velocities over laser current of the optical trap. The fit (blue dashed
line) shows a linear dependence of the flow velocity to the current with a slope of ! !!!⋅!"
.
For the interval of 85 mW to 151.5 mW, the stall force of the optical trap on caulobacter can be
calculated by !!"#$$ = (26 ⋅ ! − 180) ⋅ 10!!"N , where ! is the power of the laser in Watt
(Figure 5.6). It can be assumed that the stall force of the optical trap equals the drag force of the
surrounding flow at the moment when the caulobacter is pushed out of the trap.
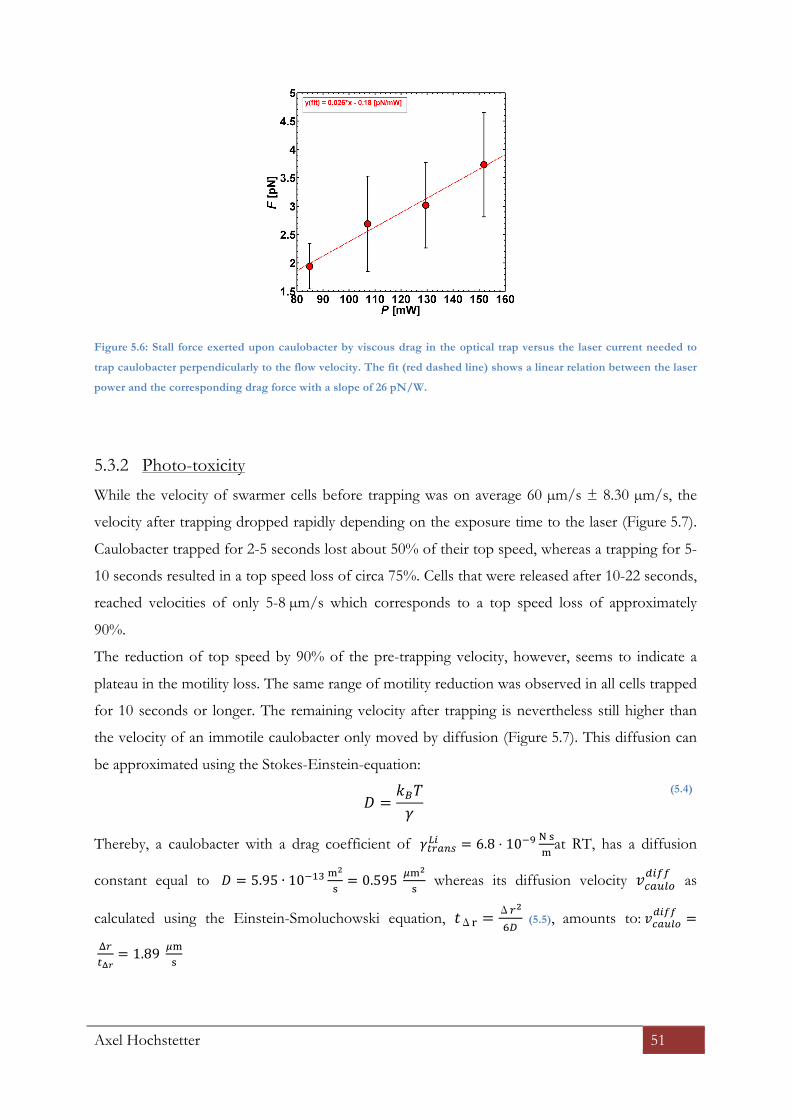
Axel Hochstetter 51
Figure 5.6: Stall force exerted upon caulobacter by viscous drag in the optical trap versus the laser current needed to
trap caulobacter perpendicularly to the flow velocity. The fit (red dashed line) shows a linear relation between the laser
power and the corresponding drag force with a slope of 26 pN/W.
5.3.2 Photo-toxicity
While the velocity of swarmer cells before trapping was on average 60 µm/s ± 8.30 µm/s, the
velocity after trapping dropped rapidly depending on the exposure time to the laser (Figure 5.7).
Caulobacter trapped for 2-5 seconds lost about 50% of their top speed, whereas a trapping for 5-
10 seconds resulted in a top speed loss of circa 75%. Cells that were released after 10-22 seconds,
reached velocities of only 5-8 µm/s which corresponds to a top speed loss of approximately
90%.
The reduction of top speed by 90% of the pre-trapping velocity, however, seems to indicate a
plateau in the motility loss. The same range of motility reduction was observed in all cells trapped
for 10 seconds or longer. The remaining velocity after trapping is nevertheless still higher than
the velocity of an immotile caulobacter only moved by diffusion (Figure 5.7). This diffusion can
be approximated using the Stokes-Einstein-equation:
! =
!!!!
(5.4)
Thereby, a caulobacter with a drag coefficient of !!"#$%!" = 6.8 ⋅ 10!! ! !!
at RT, has a diffusion
constant equal to ! = 5.95 ∙ 10!!" !!
!= 0.595 !!
!
! whereas its diffusion velocity !!"#$%
!"## as
calculated using the Einstein-Smoluchowski equation, !Δ! =Δ!!
!! (5.5), amounts to: !!"#$%
!"## =
!!!!!
= 1.89 !!!

Axel Hochstetter 52
The thus calculated diffusion velocity !!"#$%!"## = 1.89 !!
! for immotile caulobacter is indeed lower
than the average velocity of the formerly trapped caulobacter which amounts to a minimum of
4.4 !!!
.
Figure 5.7: Decrease of velocity of caulobacter due to optical trapping.
The blue dots show the swimming speed after trapping in relation to the swimming speed before trapping versus the
time spent in the optical trap. Each dot denotes one caulobacter.
The average top speed before trapping (green) and the velocities measured for individual caulobacter after release
(black stars) are shown in the inset. The velocity of a diffusing caulobacter is shown as a reference (magenta line).
This indicates that caulobacter trapped for up to 22 seconds in an optical trap with a wavelength
of !=808 nm and a power of 95 mW, are partially incapacitated yet not killed. Nevertheless, this
rapidly occurring photo-toxic effect, drastically reduces the viability of motile caulobacter and has
to be taken into account when handling caulobacter with an optical trap.
5.3.3 Forces generated by caulobacter
When trapped with optical tweezers, caulobacter can generate forces through the flagellar
motion. If these forces are strong enough, they can overcome the stall forces of the trap itself
and enable the caulobacter to escape.
For stall forces up to 1.8 pN, all caulobacter cells managed to escape within 10 seconds, while at
stall forces of 3.4 pN and more, none of the caulobacter cells escaped. In the regime between
1.8 pN and 3.4 pN, however a fast, near linear decrease in escape probability can be observed.
The 10-second escape probability of caulobacter reached 50% with a stall force of 2.6 pN
(Figure 5.8). Since the force needed to escape equals the stall force of the trap, it can be
concluded that 2.6 pN is the average maximum force !!"# caulobacter generates in optical
confinement.

Axel Hochstetter 53
Figure 5.8: Escape probability for caulobacter over the stall force of the optical trap including the conversion to the
laser power (upper x-axis).
In contrast, the force generated by caulobacter swimming freely in the same medium can be
calculated by
!!"#! = !!"#$%∥ !!"#! (5.6)
Outside the optical trap, caulobacter reach an averaged top speed of about 60 µm/s. Thus, the
average propulsion force would be !!"#! = 3.28 ⋅ 10!!" N = 0.328 pN for motile caulobacter
There is one order of magnitude between the average propulsion force !!"#! of free-swimming
caulobacter and the average maximum force !!"#.of trapped caulobacter. This shows that in a
liquid surrounding with a viscosity of 10-3 Pa⋅s, a force of 0.328 pN is all that is needed to drive
this unicellular flagellated prokaryote forward. However, if need be, caulobacter is able to
generate much higher forces with their flagellar movement. A fact that would indeed be useful
when faced with the higher drag forces caused by flowing water in their natural habitat. A force
of 2.6 pN would enable caulobacter to counter flow velocities of up to 0.3 mm/s in a medium
with a viscosity of 10-3 Pa⋅s, such as water. Furthermore, our findings on the phototoxic effect of
laser beams on caulobacter have to be taken into account as well. It seems conceivable that the
force measured in our experimental setup is reduced through phototoxic incapacitation of the
caulobacter and that the real !!"# could indeed be even higher.

Axel Hochstetter 54
5.3.4 Motility of caulobacter in the optical trap
When caulobacter swarmer cells are trapped with optical tweezers, they align with the laser beam
as discussed before. However, during this optical confinement they also exhibit a rotational
movement around their longitudinal axis and thus around the axis of the laser beam. The bean-
like form of the caulobacter accounts for the darker colour-value on one side of the cell body
that can always be seen when recording images or videos of trapped caulobacter (Figure 5.9).
This difference in colour allows us to trace the position of a certain point on the caulobacter thus
enabling us to compute the rotational frequency of caulobacter around its axis. The frequency of
this rotation was around 50 Hz, a finding that is in line with the works of Liu (2009)58.
-
Figure 5.9: Rotation of an optically trapped caulobacter. Due to the bean-like structure of the caulobacter, the rotation
(magenta arrow) can be seen by the darker spot (marked with green dot), caused by the curved protrusion. The time
lapse between two images is 0.06 s. Image by courtesy of Benjamin Banusch.
Free-swimming caulobacter outside of the optical trap likewise rotate around their longitudinal
axis. Indeed, the frequency with which free-swimming caulobacter rotate around their axis is,
with 50 Hz46, the same as for caulobacter in the trap. The similarity in the rotation frequency
between confined and free-swimming caulobacter indicates that optical confinement does not
generally influence the propulsion of caulobacter. However, after some time in optical
confinement, movement can be hampered by photo-toxicity as discussed before, leading to a
rapid decrease in the rotational frequency over time with our setup.

Axel Hochstetter 55
5.3.5 Mechanically induced surface adhesion
After having analysed the movement and generated forces of caulobacter, we next tried to induce
the metamorphosis from swarmer cells to stalked cells with the help of optical tweezers. During
this metamorphosis, motile cells shed their flagellum and adhere to a suitable surface with their
flagellar pole by the formation of a holdfast. Since chromosome replication and cell division can
only take place in stalked cells, his metamorphosis is key for the progression of the cell cycle and
the proliferation of the caulobacter41. Holdfast formation and subsequent cell differentiation is
induced by surface contact.
By optically trapping and lowering caulobacter to the PDMS bottom of the device, we aimed to
introduce holdfast formation as an indicator for imminent or completed cell differentiation from
swarmer cells to stalked cells.
Since the flagellar pole, as the adhering side of an optically trapped caulobacter, can either face
towards the ground or away from it, the chances of inducing holdfast formation is at maximum
50% or lower, depending on the escape probability of caulobacter from the trap.
Figure 5.10: Experimental setup of induced holdfast formation with side-on surface contact for one caulobacter.
(a): Schematic representation, (b): micrographs and (c): false-coloured 3D-images based on the grey values of (b).
Image by courtesy of Benjamin Banusch.
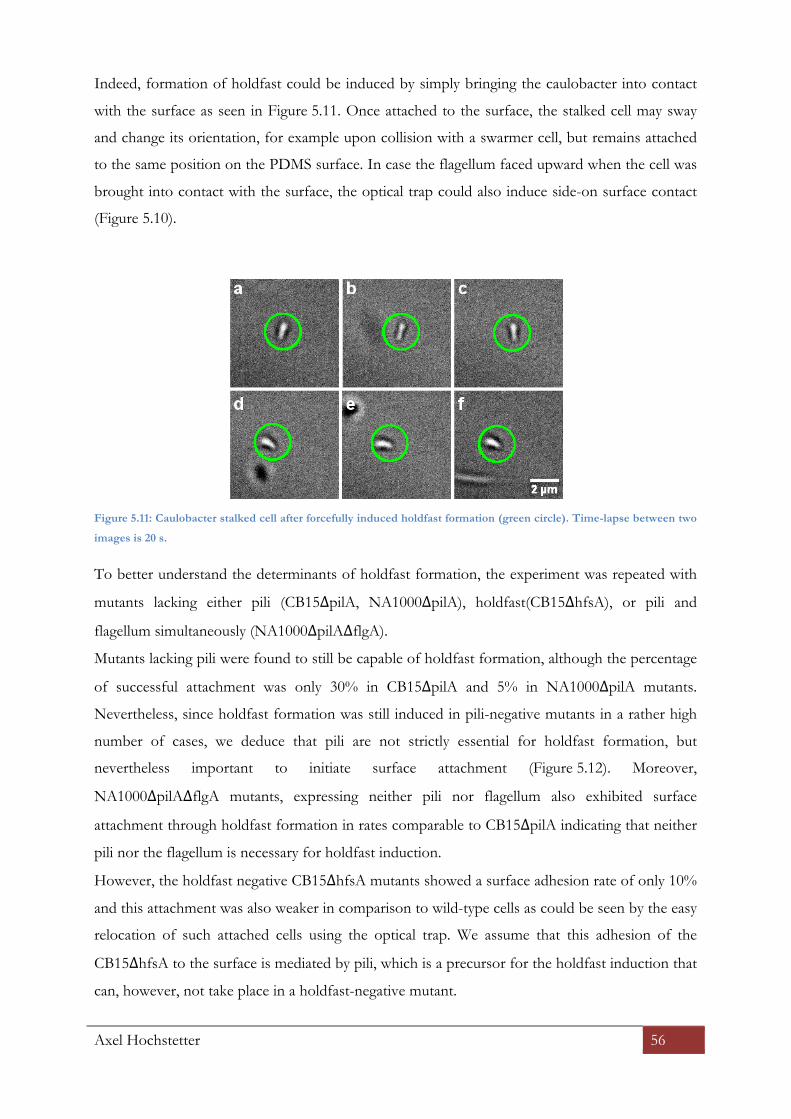
Axel Hochstetter 56
Indeed, formation of holdfast could be induced by simply bringing the caulobacter into contact
with the surface as seen in Figure 5.11. Once attached to the surface, the stalked cell may sway
and change its orientation, for example upon collision with a swarmer cell, but remains attached
to the same position on the PDMS surface. In case the flagellum faced upward when the cell was
brought into contact with the surface, the optical trap could also induce side-on surface contact
(Figure 5.10).
Figure 5.11: Caulobacter stalked cell after forcefully induced holdfast formation (green circle). Time-lapse between two
images is 20 s.
To better understand the determinants of holdfast formation, the experiment was repeated with
mutants lacking either pili (CB15∆pilA, NA1000∆pilA), holdfast(CB15∆hfsA), or pili and
flagellum simultaneously (NA1000∆pilA∆flgA).
Mutants lacking pili were found to still be capable of holdfast formation, although the percentage
of successful attachment was only 30% in CB15∆pilA and 5% in NA1000∆pilA mutants.
Nevertheless, since holdfast formation was still induced in pili-negative mutants in a rather high
number of cases, we deduce that pili are not strictly essential for holdfast formation, but
nevertheless important to initiate surface attachment (Figure 5.12). Moreover,
NA1000∆pilA∆flgA mutants, expressing neither pili nor flagellum also exhibited surface
attachment through holdfast formation in rates comparable to CB15∆pilA indicating that neither
pili nor the flagellum is necessary for holdfast induction.
However, the holdfast negative CB15∆hfsA mutants showed a surface adhesion rate of only 10%
and this attachment was also weaker in comparison to wild-type cells as could be seen by the easy
relocation of such attached cells using the optical trap. We assume that this adhesion of the
CB15∆hfsA to the surface is mediated by pili, which is a precursor for the holdfast induction that
can, however, not take place in a holdfast-negative mutant.
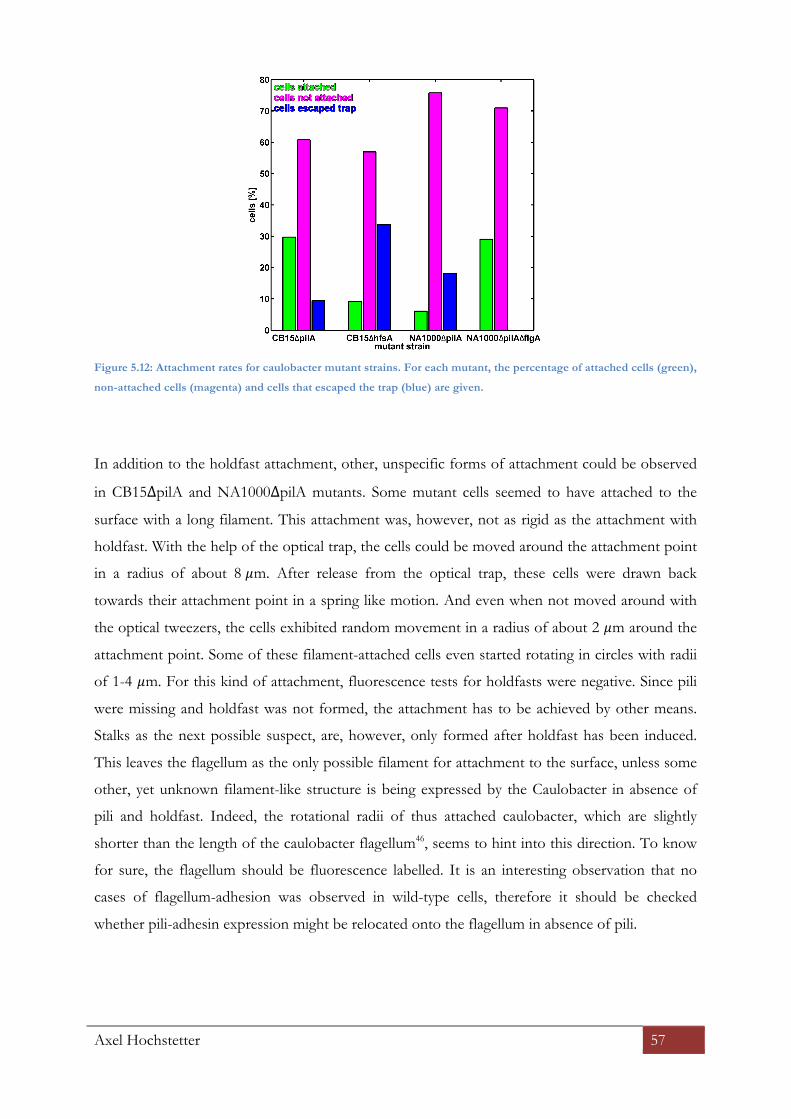
Axel Hochstetter 57
Figure 5.12: Attachment rates for caulobacter mutant strains. For each mutant, the percentage of attached cells (green),
non-attached cells (magenta) and cells that escaped the trap (blue) are given.
In addition to the holdfast attachment, other, unspecific forms of attachment could be observed
in CB15∆pilA and NA1000∆pilA mutants. Some mutant cells seemed to have attached to the
surface with a long filament. This attachment was, however, not as rigid as the attachment with
holdfast. With the help of the optical trap, the cells could be moved around the attachment point
in a radius of about 8 !m. After release from the optical trap, these cells were drawn back
towards their attachment point in a spring like motion. And even when not moved around with
the optical tweezers, the cells exhibited random movement in a radius of about 2 !m around the
attachment point. Some of these filament-attached cells even started rotating in circles with radii
of 1-4 !m. For this kind of attachment, fluorescence tests for holdfasts were negative. Since pili
were missing and holdfast was not formed, the attachment has to be achieved by other means.
Stalks as the next possible suspect, are, however, only formed after holdfast has been induced.
This leaves the flagellum as the only possible filament for attachment to the surface, unless some
other, yet unknown filament-like structure is being expressed by the Caulobacter in absence of
pili and holdfast. Indeed, the rotational radii of thus attached caulobacter, which are slightly
shorter than the length of the caulobacter flagellum46, seems to hint into this direction. To know
for sure, the flagellum should be fluorescence labelled. It is an interesting observation that no
cases of flagellum-adhesion was observed in wild-type cells, therefore it should be checked
whether pili-adhesin expression might be relocated onto the flagellum in absence of pili.

Axel Hochstetter 58
Figure 5.13: Filamentous attachment of ∆pilA mutants
(a): The attached cell (blue circle) at its attachment point.
(b): The attached cell (blue circle) can be displaced by about 8 !m (green x) using the optical trap.
(c): After release from the optical trap, the filament pulls the cell (blue circle) back towards the attachment point in a
spring-like fashion. Then, the cell shows random walking in a radius of about 2 !m around the attachment point
(green dx). Scale bar is 5 !m. Image by courtesy of Benjamin Banusch.
Yet another, unspecific form of attachment was found in CB15 wild-type and NA1000ΔhfsA
mutants. Attached cells exhibited a tumbling or elliptical rotational motion, with a radius of less
than 1 !m around their attachment point. This is most likely explained by the attachment of pili
to the surface when holdfast was not (yet) induced. The tumbling motion in this unspecific
adhesion most likely arose because the beating flagellum was not shed since no holdfast could be
formed. In CB15 wild-type cells, which were unable to form holdfast attachment at this specific
moment, this form of attachment probably occurs due to a side-on surface contact, in which pili
attach but cannot bring the holdfast bearing pole in contact to the surface.

Axel Hochstetter 59
5.4 Conclusions
Optical traps can be calibrated and used as a tool to quantify forces generated by motile
unicellular organisms, like Caulobacter crescentus. However, optical traps, like any form of high
intensity light, can induce photo damage and even render cells incapacitated within seconds,
depending on the wavelength and power of the optical trap. This has to be taken into account
and assessed when working with living cells.
Using an optical trap, we were able to induce holdfast formation by bringing the caulobacter into
close contact with the surface. Using pili-lacking mutant strains, we could even demonstrate
other forms of surface attachment not frequently displayed by wild-type caulobacter. In mutants
that did not express holdfast but still attached to the surface with pili, we observed a tumbling
motion and elliptic rotation, which indicates that even after surface contact has been established
by the pili, the flagellum was not shed. A possible explanation for this could be that the shedding
of the caulobacter flagellum would only happen after holdfast formation, and was independent of
pili-surface-contact. Further research is warranted in order to shed more light on this mechanism.
Filament mediated attachment was also observed in pili-negative mutants but could never be
observed in pili-positive wild-type caulobacter. The reason for this is unclear and one can only
speculate which side-effect of the pili inhibition causes the flagellum, usually responsible for
displacement of the caulobacter, to suddenly act as an anchor for surface adherence.

Axel Hochstetter 60
6 Optical trapping of protozoa, e.g. Trypanosoma bruce i bruce i a
6.1 Introduction
Trypanosoma brucei brucei, a widely used model organism, exhibits mainly two distinct swimming
modes, a random-walk-like movement called tumbling, and a ballistic motion, also called persistent
motion.2,40 The propulsion of trypanosomes requires beating of the sheathed eukaryotic flagellum
alongside the body which wiggles in helical waves and pushes the trypanosome forward.76 In
addition to the directed movement, the cell body rotates approximately 60° around its major axis
during each beat of the flagellum, 77 The forces it thereby generates deform the shape of the cell
body2,78. In this work we present a model to characterize and quantify the torque and power of
the trypanosome flagellar movement.
6.2 Methods
Optical tweezers with a wavelength of ! = 808 nm and a power of 10-27 mW were employed to
dislocate and manipulate Trypanosoma brucei brucei (trypanosomes) in its wild-type bloodstream
form (BSF) in spatial confinement.
Moving trypanosomes were optically trapped and the trajectories of trapped trypanosomes was
recorded using a Phantom Miro 3 high-speed camera (Vision Research, USA) at 150 fps. The
position of the flagellar tip was than traced in each frame using the manual tracking plugin for
Fiji. The obtained trajectories were plotted and analysed using MATLAB software.
The laser power mentioned denotes the power of the laser at the trapping point.
Power spectra of the trajectories were obtained by determining the Fourier transform of the
temporal autocorrelation functions of the flagellar tip displacement.
a Parts of this chapter have been published in: Stellamanns, E., Uppaluri, S., Hochstetter, A., Heddergott, N., Engstler, M. & Pfohl, T. Optical trapping reveals propulsion forces, power generation and motility efficiency of the unicellular parasites Trypanosoma brucei brucei. Sci. Rep. 4, 6515:1–6515–7 (2014).78

Axel Hochstetter 61
6.3 Results
6.3.1 Optical trapping of trypanosomes
While optically trapped, trypanosome vitality remains unaffected over long periods of time.
Trypanosomes survive up to 60 minutes inside optical traps, rendering possible photo-toxicity
negligible for trapping times of less than 15 minutes.78 A time span of 15 minutes is by far
enough to study trypanosomal motility, as this exceeds the longest reported movement patterns
in trypanosome motility by two orders of magnitude.40
Within the optical trap, only a small part of the trypanosome is actually optically confined in the
focus of the trap (see Figure 6.1a). Thus trypanosomes remain fully mobile, whereas their
movement is limited. The location of this trapping point varies between persistent swimmer and
tumbling walkers. The main trapping point for persistent trypanosomes coincides with the
kinetoplast, around the flagellar pocket. This is consistent with the fact that the optical trap
would react to the relative high refractive index of DNA, which is the primary component of the
kinetoplast78. For tumbling trypanosomes, the trapping points show a broader distribution over
the posterior half of the cell body (Figure 6.1b).
Trypanosomes in optical confinement exhibit two forms of motion. They either rotate around
the focus of the optical trap or twist and turn irregularly. Trypanosomes that twist and writhe
irregularly when inside an optical confinement are tumbling when outside the optical trap,40
whereas Trypanosomes characterized as persistent walker40 outside the trap exhibit periodic
motility patterns and rotation when trapped.
Figure 6.1: Optical trapping of trypanosomes
(a): Schematic representation of the setup for optically trapping motile trypanosomes. Within the optical trap, the
motility is limited, whereas the mobility is unaffected.
(b): Histograms of trapping loci of persistent walker and tumbling cells versus the position from the posterior end
relative to their contour length. Main trapping loci (arrows) are at the posterior end close to the flagellar pocket and
internal structures around the nucleus. Adapted from Stellamanns e t a l .78

Axel Hochstetter 62
The periodic rotation of the trypanosome cell body is overlaid by a zigzagging movement pattern
of the flagellar tip. The frequency of the rotation around the trapping point, !!, amounts to
about 1.5 Hz (Figure 6.2)
Figure 6.2: 2-D-time-trajectoryof the flagellar tip of an optically trapped trypanosome
(a): The x- and y-position of the flagellar tip is shown versus time. The colours represent time points (colour bar).
(b-d): 2-D-projections of the flagellar tip's trajectory in the x-y-plane (b), the x-t-plane (c), and the y-t-plane (d).
The power spectrum of a trapped, rotating trypanosome, exhibits two main peaks, corresponding
to the frequencies !!~ 1.5 Hz and !!~ 15 Hz (Figure 6.3). The frequency !! represents the
beating of the flagellum, whereas !!~ 1.5 Hz is the earlier mentioned rotational frequency.
The frequency of 15 Hz for the flagellar beat is consistent with the reported flagellar beat
frequency for freely swimming trypanosomes77, which serves to demonstrate that optical
confinement did indeed not alter the cell's mobility.
Figure 6.3: Power spectrum of the displacement of the trypanosomes' flagellar tip. The two peaks denote re-occurring
frequencies in the trypanosome motion, here !! = 1.5 Hz and !! = 15 Hz.
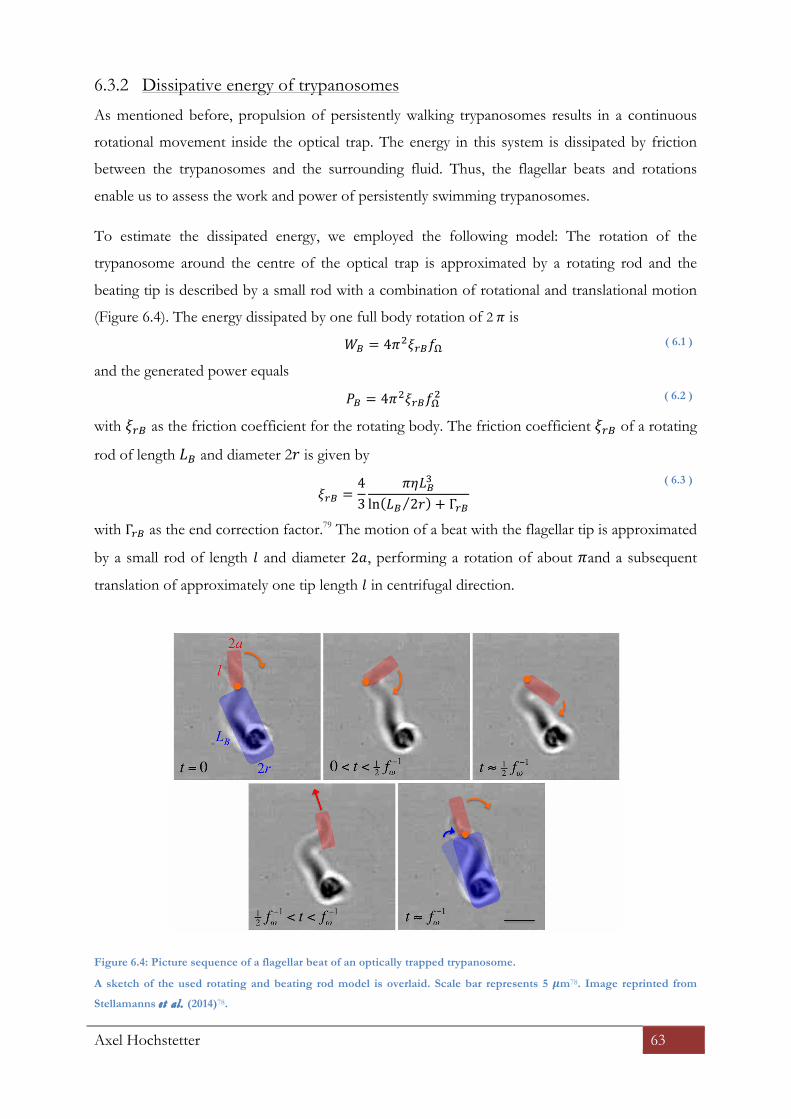
Axel Hochstetter 63
6.3.2 Dissipative energy of trypanosomes
As mentioned before, propulsion of persistently walking trypanosomes results in a continuous
rotational movement inside the optical trap. The energy in this system is dissipated by friction
between the trypanosomes and the surrounding fluid. Thus, the flagellar beats and rotations
enable us to assess the work and power of persistently swimming trypanosomes.
To estimate the dissipated energy, we employed the following model: The rotation of the
trypanosome around the centre of the optical trap is approximated by a rotating rod and the
beating tip is described by a small rod with a combination of rotational and translational motion
(Figure 6.4). The energy dissipated by one full body rotation of 2 ! is
!! = 4!!!!"!! ( 6.1 )
and the generated power equals
!! = 4!!!!"!!! ( 6.2 )
with !!" as the friction coefficient for the rotating body. The friction coefficient !!" of a rotating
rod of length !! and diameter 2! is given by
!!" =
43
!"!!!
ln !! 2! + Γ!"
( 6.3 )
with Γ!" as the end correction factor.79 The motion of a beat with the flagellar tip is approximated
by a small rod of length ! and diameter 2!, performing a rotation of about !and a subsequent
translation of approximately one tip length ! in centrifugal direction.
Figure 6.4: Picture sequence of a flagellar beat of an optically trapped trypanosome.
A sketch of the used rotating and beating rod model is overlaid. Scale bar represents 5 !m78. Image reprinted from
Stellamanns e t a l . (2014)78.

Axel Hochstetter 64
The time intervals of the rotation and translational steps were almost equal with the beat time
! ≈ !!!!!"# =
!!!!!!. The energy corresponding to one flagellar beat equals the sum of the energy
for the rotation of about ! and the translation of the tip by ! with a velocity !! = ! ⋅ 2!!:
!!"#$! = !!"#$
! +!!"#$! = 2!!(2!!!!" + !!!!"! ) ( 6.4 )
For rotating the friction coefficient rod is !!" =!!
!"!!
!" (!/!!)!!! and the parallel translational friction
coefficient equals !!"! = !!"#!" ! !! !!!
with the end correction factor Γ! . The power generated by the
flagellar is given by
!!"#$ = 2!!!(2!!!!" + !!!!"! ) ( 6.5 )
From the recorded trajectories, we can visually estimate the lengths of both the trypanosome cell
body and the flagellar tip, according to our model. The length of a rotating trypanosome, is the
sum of the cell body and the flagellar tip and defines the radius of the recorded trajectory. The
trajectory exhibits also an inner radius, where no flagellar tip can reach. The ring between the inner
radius and the outer radius shows the range in which the flagellar tip can be located. Thus, by
subtracting the inner radius from the outer radius, we arrive at twice the length of the
flagellum, 2 !. The length of the cell body can then be obtained by subtracting the length of the
flagellar tip ! from the outer radius (Figure 6.5). From this visual inspection, we obtain a length of
the cell body of !! = 8 !m, and for the flagellar tip ! = 2.5 !m.

Axel Hochstetter 65
Figure 6.5: Visual model to estimate the lengths of cell body and flagellar tip.
The trajectory of the flagellar tip positions of an optically trapped trypanosome (black) is overlaid with markers for the
cell body length (!!, blue)and the flagellar tip (!, red). The green area denote the inner radius, where the flagellar tip
does not reach to.
The power which a rotating and persistently walking cell generates is the sum of the power
generated by both the cell body and the flagellar tip, !! + !!"#$ = !. Since 2!!!!" ≫ !!!!"! , the
power calculation can be simplified to ! ∝ !!!!!" + !!!!!" . The torque of the trypanosome
propulsion can be approximated by the torque of a flagellar beat ! ≈ 2!!!!!".
Using our experimental values, we calculate !!" = 1.9 ⋅ 10!!" kg ⋅m!/s, !!" = 5.8 ⋅ 10!!" kg ⋅
m!/s and !!"! = 1.4 ⋅ 10!! kg/s for a persistent walker cell. The torque of the flagellar motor thus
equals ! = 5.5 ⋅ 10!!" N ⋅m. The energies that are dissipated during one body rotation are
!! = 1.1 ⋅ 10!!" J and !!"#$! = 3.7 ⋅ 10!!" J for one stroke of the flagellar tip. The power of a
beat and a rotation are !!"#$! = 5.6 ⋅ 10!!" W and !! = 1.6 ⋅ 10!!" W, respectively, and sum up to
a total power generation of ! = 7.2 ⋅ 10!!" W. These findings are in good agreement with
measurements we published previously.78 The ratio of the power needed for the rotation and the
power generated !!/! may be used to measure the motility efficiency. We found that only one
sixth to one quarter of the power generated (!!/! = 0.15 − 0.25) is actually needed to rotate the
body. This rather low power efficiency might be explained by the fact, that the motility
mechanism of trypanosomes also serves other reasons apart from self-propulsion. The removal
of antibodies attached to VSGs to evade the immune responses of their hosts is one well known
example for such another use .11

Axel Hochstetter 66
6.4 Conclusions
Combining microfluidics and optical trapping, we were able to stably trap trypanosomes and
analyse their motility inside the optical confinement. By introducing a motility model for rotating
trypanosomes, we determined the dissipated energy, power generation, torque and propulsion
efficiency of trypanosomes. On the basis of the low propulsion efficiency, we suggest that the
motility mechanism of trypanosomes is not only used for propulsion, but also essential in
surviving the immune responses of their mammalian hosts.
The presented methodology to study motility patterns and dissipated energy of trypanosomes
may also be applicable to other species of trypanosomes, e.g. Trypanosoma cruzi or other unicellular
organisms.

Axel Hochstetter 67
RESULTS II:
MICROFLUIDICS APPLIED ON CELL STUDIES

Axel Hochstetter 68
7 Hydrodynamic impact of trypanosomes on their environment
7.1 Introduction
Unicellular organisms developed multiple swimming strategies. According to Ishikawa (2009)20
these swimming strategies can be classified by the flows generated around the swimmer. A cell
that pulls itself through the surrounding fluid and presses the fluid aside is called a puller.
Whereas, a cell that attracts the surrounding fluid from the side and subsequently pushes it
behind the moving body is classified as a pusher (Figure 7.1)
Figure 7.1: Hydrodynamic classification of motile cells. Black bent arrows illustrate flows in the surrounding fluid,
straight grey arrows show net movement of the bodies and flagella respectively.
(a): A puller pushes the surrounding fluid sideways while it pulls itself forward.
(b): A pusher pushes the fluid backwards in swimming direction. Image reprinted from Ishikawa (2009)20.
Such hydrodynamic flow fields are analysed using particle image velocimetry (PIV), where the
displacement of particles over time is used to reveal flows in the surrounding fluid. This
technique has been wildly used within the field of microfluidics for the last 15 years80.
Trypanosoma brucei brucei is a model flagellate, that has been known and studied for over 160
years.81 In terms of trypanosome motility, it has been shown by Heddergott et al. (2012) that
persistently swimming trypanosomes propel themselves with flagellar beats from the tip to the
base whereby each beat of the flagellum rotates a trypanosome 60° around their major axis.
However, the question whether trypanosomes are to be classified as pusher or puller among the
unicellular swimmers, remains open. We therefore aim to describe the hydrodynamic flow field
around the trypanosome cell body in order to classify them into one of the two swimmer types.

Axel Hochstetter 69
7.2 Methods
The flow field around swimming trypanosomes was analysed in a quasi-2-dimensional
environment by introducing polystyrene spheres of 1 !m diameter (Polybead® Microspheres,
Cat.-Nr. 07310-15, Polysciences, Germany) into a quadratic chamber (62.5 !m x 62.5 !m x 2 !m)
containing culture medium and polybeads solution (2% solids in water) in equal aliquots.
The subsequently generated flow field around the trypanosomes was thus visualized and analysed
using particle image velocimetry (PIV).
Videos of the movement for the PIV analysis were recorded at 120 fps.
The data analysis of the obtained frames was performed using PIVLab for Matlab82.
7.3 Results
Swimming trypanosomes generated a hydrodynamic flow field extending up to 5 !m around
themselves. Within the predominant flow field, polystyrene particles travelled from the anterior
end, along the trypanosome body to the posterior end and beyond. A second flow field attracts
particles from the environment around the trypanosome's mid-section towards the cell body and
further to the posterior end (Figure 7.2). The interplay of these two flows generates vortices in
the vicinity of the flagellar tip as well as between the midsection and the posterior end. These
vortices vary in intensity during one flagellar beat, but the direction of the flow is not reversed.
The velocity of the flow ranges between 0-‐4 ⋅ 10!!m/s around the midsection, and up to
10!! m/s around the flagellar tip and posterior end of the trypanosome (Figure 7.3). As
described by Ishikawa (2009) this flow field is characteristic for a pushing locomotion by a
unicellular flagellated organism 20.
During a time-lapse of 58 ms, where the flagellar beat travels from the flagellar tip to the flagellar
pocket, the trypanosome moves about one micrometer in the direction of the flagellar tip. These
flagellar beats did not induce any abrupt changes in the flow field surrounding the trypanosome,
even when several beats were performed consecutively with a frequency of around 17 Hz.

Axel Hochstetter 70
Figure 7.2: Hydrodynamic flow field around a swimming trypanosome.
(a): Micrograph showing the trypanosome (brown) surrounded by beads and the flow field during one flagellar beat.
(b): Velocity map of the averaged vectors generated during one flagellar beat, (average over 6 frames, total time lapse
58 ms)
(c): Velocity map in one frame (9 ms).
Figure 7.3: Flow field around a trypanosome during one flagellar beat. Time-lapse is 58 ms.
Based on our results, we were able to classify trypanosomes as pusher, which generate a
hydrodynamic flow-field attracting the surrounding fluid from the sides (perpendicular to the
direction of motion) and pushing it backwards in direction of motion. The knowledge that
trypanosomes are pushers helps to better understand other findings, such as the highly effective

Axel Hochstetter 71
hydrodynamic surface clearance of trypanosomes, which is assisted by the force of the flow field
pushing the VCGs in the direction of the flagellar pocket as discussed in an earlier chapter.
The fact that no changes in the surrounding flow field of trypanosomes are induced by the
flagellar beat, disproves the elsewhere proposed kink-based propulsion of trypanosomes83
Indeed, the continuality in the flow field in or experiment, supports the motility model of
trypanosomes as proposed by Heddergott et al. (2012)77. Additionally the fact that we found
almost no trypanosomes exhibiting tumbling motion in our setup, is in line with the finding of
Heddergott et al. (2012) that trypanosomes in a crowded environment exhibit mostly directed
motion.77
7.4 Conclusion
With the help of a straightforward experiment, we could not only classify trypanosomes as pusher,
but also show that the hydrodynamic field around them extends up to 5 !m away from the cell
body, wherein surrounding particles are accelerated to velocities of up to 100 !m/s. The
knowledge about the flow field generated by trypanosomes and their classification as pusher
sheds new light on the complex way in which trypanosomes move about in their crowded
environment.

Axel Hochstetter 72
8 Hydrodynamic manipulation of Trypanosomes
8.1 Introduction
In the field of microfluidics, geometry of micro chambers and connecting channels can be used
to sort self-propelling cells. Generally, the microfluidic environment does not favour one
swimming direction over another as can be seen by the homogeneous distribution of cell-
position over time in the device.
However by employing specific structures that favour cell migration in one direction over the
other – so called ratchets – it is possible to concentrate motile cells in a predefined space.84
The directional migration within the device as well as cell concentration can thus be altered and
controlled. There are several possibilities to achieve this, either by funnel-like structures that
guide motile cells in one direction while inhibiting passage in the other direction85, or by
asymmetric constrictions in the chamber shape itself86 (see Figure 8.1).
Figure 8.1: Two sample structures designed to induce self-concentrating of motile cells to the left (top) and in the
middle (bottom) respectively. Multicoloured arrows show sample paths directed by the ratchets in the sorting channels
over time.
In these ratchets, the flow velocities must be kept at a minimum, so cell concentration is only
driven by self-propulsion. This no-flow condition can be established in chambers adjacent to the
main flow channel.
Indeed, such ratchets have already been used to concentrate bacteria in a device and sort them
according to their size, deformability or motility84–88.
In the light of these findings, we explore the possibility to develop a device design which would
enable us to separate Trypanosoma brucei spp. from a matrix of immotile cells such as red and white
blood cells without external manipulation. Within such a device, the active propulsion of the
trypanosomes itself would lead to their concentration in a predefined position, whereas immotile
cells would diffuse randomly through the whole device without any concentration (Figure 8.2).

Axel Hochstetter 73
Figure 8.2: Ratchets to concentrate trypanosomes in blood.
The capability to concentrate trypanosomes from a sufficient amount of blood or spinal liquor
would be highly useful as a diagnostic approach for trypanosome infection.
To date, diagnosis of Trypanosoma brucei spp. in humans remains inefficient.89 However, in the fight
against this neglected tropical disease, new improved diagnostic approaches are needed which
should be cheap while, at the same time, easy to use even in resource-poor settings by untrained
personnel.89 A hand-held microfluidic device enabling passive cell-sorting and concentration
without external manipulation would, when produced in large quantities, fulfil these
requirements.

Axel Hochstetter 74
8.2 Methods
8.2.1 Influence of device geometry and flow on the confinement of trypanosomes
With the help of optical tweezers, trypanosomes were placed inside different devices comprised
of a combination of the following parameters:
− Chamber geometry: round (Ø30 !m x8 !m) vs. squared (37.5 !m x 37.5 !m x 8 !m)
− Connecting-channel size: narrow (5 !m x 6 !m x 8 !m) vs. broad (10 !m x6 !m x 8 !m)
Additionally, flow velocity in the main channel was varied between < 1 !m/s and ≥ 10 mm/s.
The resulting flow-profiles inside the chambers were computed for both types of connecting
channel with the computational fluid dynamics (CFD) module from the software COMSOL
multiphysics (version 4.3a).
Upon release from the optical tweezers, trajectories in the confinement were recorded at a frame
rate of 10-15 fps and analysed for movement patterns within the specific
geometry/channel size/flow combination.
Likewise, dwelling time until escape from the chamber was measured for a maximum time of
8 minutes. The retain probabilities were calculated and fitted to an exponential decay function
according to the equation
!!"#$%& = 100% ∙ (!!! !) (8.1)
were the detainment time ! equals the time elapsed until the probability of detainment decreases
by a factor of !.
Figure 8.3: Experimental setup: Trypanosomes are put in circular micro chambers with 30 mm diameter and the time
is recorded till trypansomes escape. The discriminating parameter is the width of the connecting channel of either 5
!! (a) or 10 !! (b).
By exposing trypanosomes in the micro chambers to various flows, we investigated if the
presence of flow has any measurable impact on trypanosome escape times.
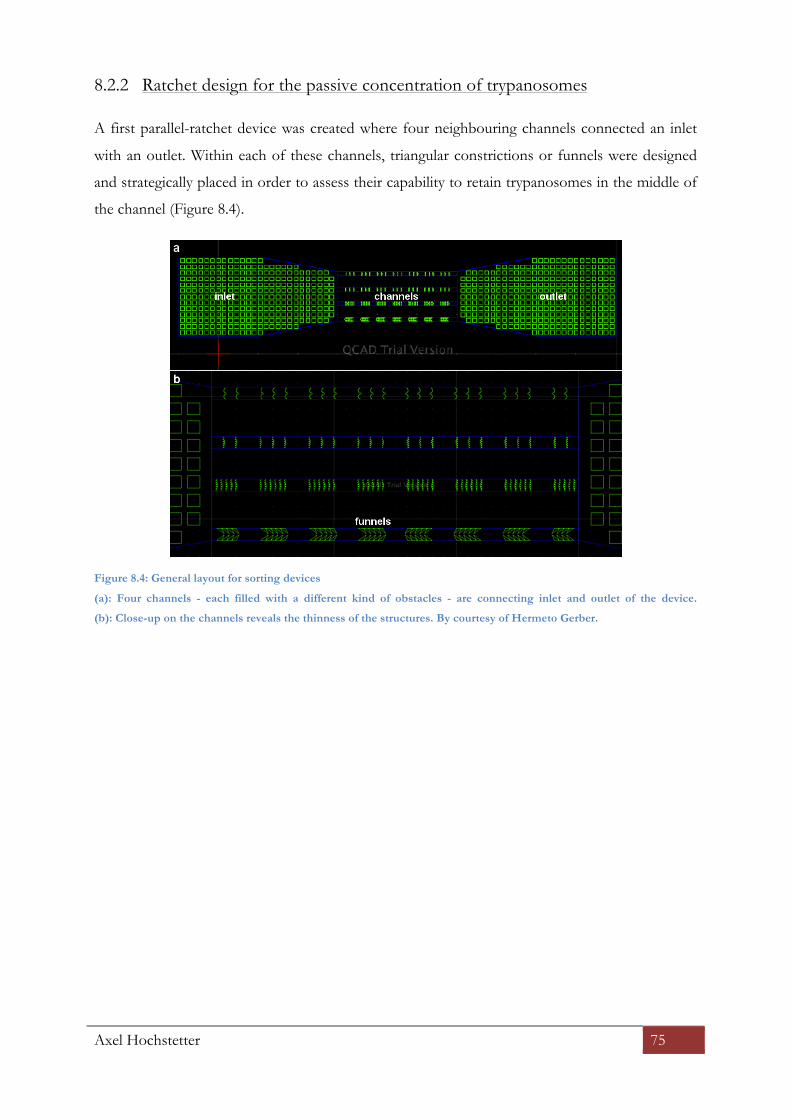
Axel Hochstetter 75
8.2.2 Ratchet design for the passive concentration of trypanosomes
A first parallel-ratchet device was created where four neighbouring channels connected an inlet
with an outlet. Within each of these channels, triangular constrictions or funnels were designed
and strategically placed in order to assess their capability to retain trypanosomes in the middle of
the channel (Figure 8.4).
Figure 8.4: General layout for sorting devices
(a): Four channels - each filled with a different kind of obstacles - are connecting inlet and outlet of the device.
(b): Close-up on the channels reveals the thinness of the structures. By courtesy of Hermeto Gerber.
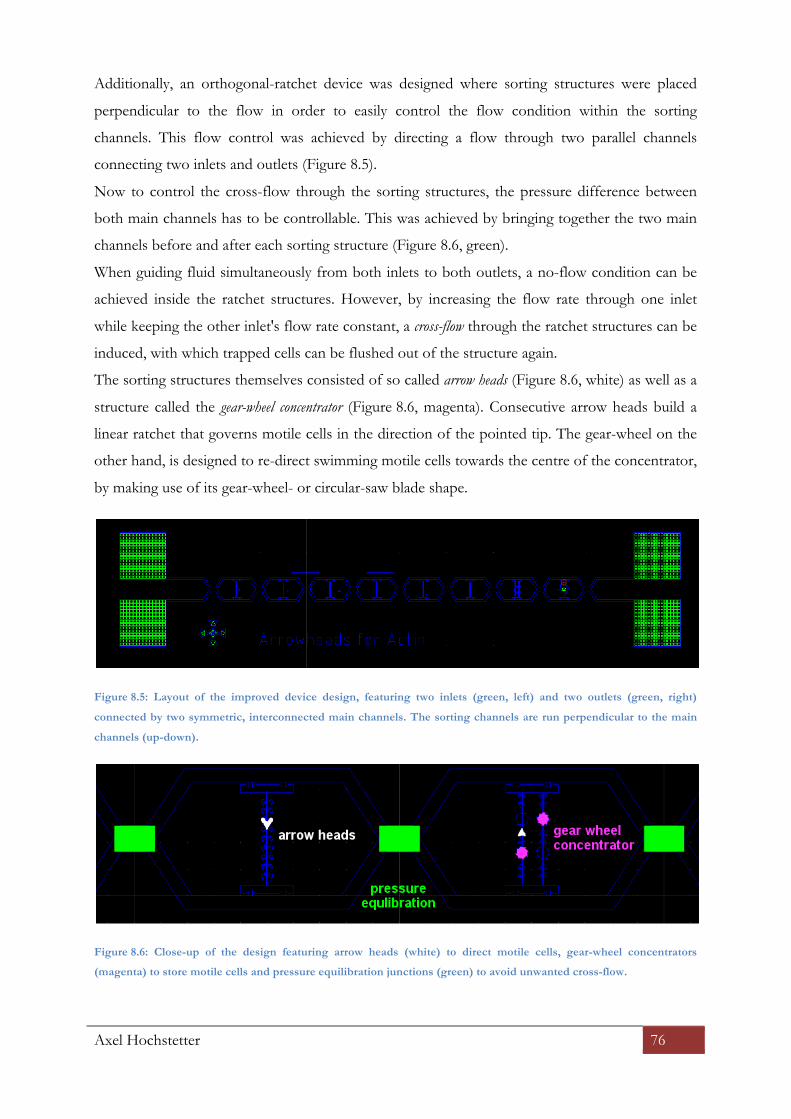
Axel Hochstetter 76
Additionally, an orthogonal-ratchet device was designed where sorting structures were placed
perpendicular to the flow in order to easily control the flow condition within the sorting
channels. This flow control was achieved by directing a flow through two parallel channels
connecting two inlets and outlets (Figure 8.5).
Now to control the cross-flow through the sorting structures, the pressure difference between
both main channels has to be controllable. This was achieved by bringing together the two main
channels before and after each sorting structure (Figure 8.6, green).
When guiding fluid simultaneously from both inlets to both outlets, a no-flow condition can be
achieved inside the ratchet structures. However, by increasing the flow rate through one inlet
while keeping the other inlet's flow rate constant, a cross-flow through the ratchet structures can be
induced, with which trapped cells can be flushed out of the structure again.
The sorting structures themselves consisted of so called arrow heads (Figure 8.6, white) as well as a
structure called the gear-wheel concentrator (Figure 8.6, magenta). Consecutive arrow heads build a
linear ratchet that governs motile cells in the direction of the pointed tip. The gear-wheel on the
other hand, is designed to re-direct swimming motile cells towards the centre of the concentrator,
by making use of its gear-wheel- or circular-saw blade shape.
Figure 8.5: Layout of the improved device design, featuring two inlets (green, left) and two outlets (green, right)
connected by two symmetric, interconnected main channels. The sorting channels are run perpendicular to the main
channels (up-down).
Figure 8.6: Close-up of the design featuring arrow heads (white) to direct motile cells, gear-wheel concentrators
(magenta) to store motile cells and pressure equilibration junctions (green) to avoid unwanted cross-flow.

Axel Hochstetter 77
8.3 Results
8.3.1 Influence of device geometry and flow on the confinement of trypanosomes
The width of the connecting channel decisively influences the propagation of flow from the main
channel into the micro chambers.
For narrow connecting channels (5 !m x 6 !mx 8 !m), the reduction in flow velocity from the
main channel to the chamber was reduced by 5 orders of magnitude, whereas broader connecting
channels (10 !m x 6 !mx 8 !m) reduced the flow velocities by about 3 orders of magnitude
(Figure 8.7).
Figure 8.7: CFD calculations of flow velocities in devices with a height of 8 !m, consisting of circular chambers
(diameter: 30 !m) alongside a main channel (width: 40 !m)
(a-c): Connecting channel size 5 by 6 !m, (d-f): Connecting channel size 10 by 6 !m. The images show the relative flow
velocities on linear scale (a,d) and on logarithmic scale (b,c,e,f). The flow fields are also shown in top view for the
central height of the device (c,f).
Under no-flow conditions, round micro chambers with broad connecting channels retained
about 25% of all cells within the time span of 8 minutes, whereas with strong flows in the main
channel, only 10% of cells were retained within 8 minutes.
In contrast, in round-chamber devices with narrow connecting channels almost 60% of all cells
remained inside the chamber during the 8 minute time span when there was no flow in the main
channel. However, like for broad connecting channels, a strong flow in the main channel of
chambers with narrow connecting channels, lead to a mere 10% retention of cells during
8 minutes (Figure 8.8).

Axel Hochstetter 78
Within the square-chamber set up, none of the observed trypanosomes was able to escape the
confinement within the time span of 8 minutes.
Figure 8.8: Remaining cells over time, fitted with exponential decay curves. Narrow connecting channels (squares)
retain cells longer than broad connecting channels (circles). In the presence of flow (filled green markers)
trypanosomes escape from faster than in the absence of flow (open magenta markers). While narrow connecting
channels increase the detainment of cells, the presence of flow is decreases detainment time drastically.
For circular chambers and in the presence of a strong flow in the main channel the detainment
time ! is about 125 s for both narrow and broad connecting channels. Conversely, under a no-
flow condition, it ranged from 173 s for broad connecting channels, to 1072 s for narrow
connecting channels (Table 8.1)
Details on the calculated detainment time ! of trypanosomes for each experimental combination,
can be seen in Table 8.1.
Upon analysing the recorded trajectories, we observed that trypanosomes placed into the middle
of the chamber swim into a general direction until they hit the wall of the micro chamber. After
having hit the wall, the trypanosomes continue moving forwards alongside the wall in either
direction (Figure 8.11).
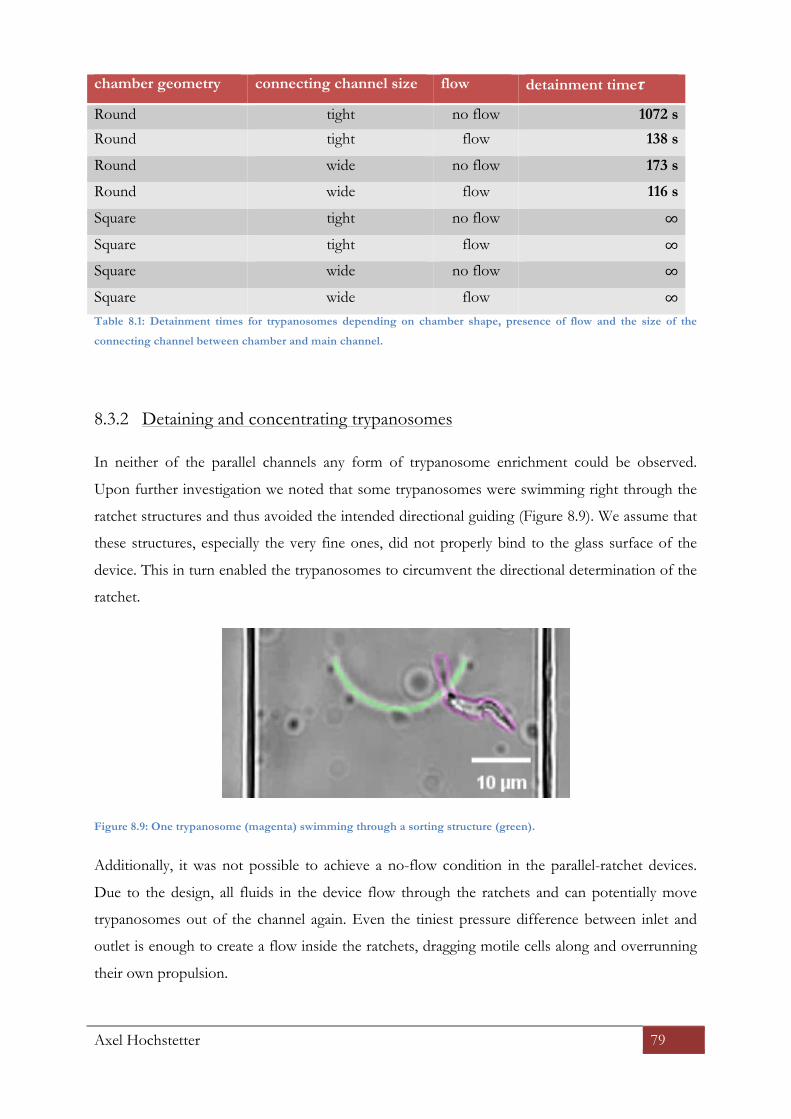
Axel Hochstetter 79
chamber geometry connecting channel size flow detainment time!
Round tight no flow 1072 s
Round tight flow 138 s
Round wide no flow 173 s
Round wide flow 116 s
Square tight no flow ∞
Square tight flow ∞
Square wide no flow ∞
Square wide flow ∞ Table 8.1: Detainment times for trypanosomes depending on chamber shape, presence of flow and the size of the
connecting channel between chamber and main channel.
8.3.2 Detaining and concentrating trypanosomes
In neither of the parallel channels any form of trypanosome enrichment could be observed.
Upon further investigation we noted that some trypanosomes were swimming right through the
ratchet structures and thus avoided the intended directional guiding (Figure 8.9). We assume that
these structures, especially the very fine ones, did not properly bind to the glass surface of the
device. This in turn enabled the trypanosomes to circumvent the directional determination of the
ratchet.
Figure 8.9: One trypanosome (magenta) swimming through a sorting structure (green).
Additionally, it was not possible to achieve a no-flow condition in the parallel-ratchet devices.
Due to the design, all fluids in the device flow through the ratchets and can potentially move
trypanosomes out of the channel again. Even the tiniest pressure difference between inlet and
outlet is enough to create a flow inside the ratchets, dragging motile cells along and overrunning
their own propulsion.

Axel Hochstetter 80
In the orthogonal-ratchet device with arrow heads and gear-wheel contractors however, it was
possible to force trypanosomes to swim towards a predefined space and remain there as long as
flow conditions stray the same. With this design we were able to keep motile trypanosomes
confined for more than 4 minutes. Upon inducing a cross-flow through the ratchets, we could
then remove the trypanosomes again from the ratchet (Figure 8.10).
Figure 8.10: Trypanosomes can be stored (blue - green t = 0 - 4 min) in the new devices and pushed out again upon
inducing a flow (t > 4 min).
8.4 Discussion
We observed that trypanosomes manage to escape quicker from micro chambers when there is a
strong flow in the main channel that propagates into the micro chambers. However, with this
experimental setup we cannot deduct whether the trypanosomes are able to sense flows and
adapt their taxis accordingly, or whether they are merely guided out of the micro chambers by the
flow field. Both explanations seem conceivable. Indeed, the shear forces that arise from the
circular flow inside the micro chambers could cause the unsymmetrical trypanosome body to
align along the velocity gradient of the flow during its locomotion. Such a self-alignment in shear
forces has been reported for trypanosomes swimming inside a Poiseuille flow (!!"# = 1.6 mm/s
within straight channels90. This alignment along the velocity gradient would then cause the
trypanosome to predominantly dwell in places where they have a higher probability to be guided
out of the chamber by the flow.

Axel Hochstetter 81
In terms of the influence of chamber geometry on the escape probability of trypanosomes, we
found that square chambers where much more likely to retain trypanosomes over a time span of
8 minutes. These findings are probably explained by simple geometrical factors. Starting in the
centre of a micro chamber, a directionally swimming trypanosome will hit the wall of the micro
chamber at some point. From there it continues persistently moving forward by gliding alongside
the wall of the chamber in either direction. Circular walls will eventually lead the trypanosome to
the exit of the micro chamber. In squared chambers, however, trypanosomes will most likely hit a
corner instead. Constituting an obstacle, the orthogonal wall in the corner will likely cause the
trypanosome to change direction. Furthermore, even when a trypanosome in a square chamber
swims along the wall toward the exit, the right-angled nature of the connecting channel would
make it very difficult for the trypanosome to actually detect the exit because it approaches the
channel in a very shallow angle (see Figure 8.11, right).
Figure 8.11: Sample trajectories for persistently swimming cells depending on confinement geometry. Trajectories
leading out of confinement (magenta) are outnumbered in squared confinements by trajectories retaining the cells in
confinement (green).
These findings about the geometrical determinants of detainment chambers can be considered as
one factor when designing devices with which motile cells can be captured. Another factor would
be the employment of suitable ratchet structures. Indeed we could show that it was possible to
passively guide trypanosomes into a wanted direction and trap them at a predefined space with
the help of arrow-head and gear-wheel ratchets. Our attempt to create ratchet channels parallel to
the flow within the device, served to show that care has to be taken when designing very fine
PDMS structures, as it may be difficult to sufficiently attach these structures to the glass surface
of the device.

Axel Hochstetter 82
Nevertheless, through this prove of principle, we show that it is indeed possible to create a
device with which living trypanosomes can be caught and concentrated. Further research is
warranted in order to transform these findings into a usable diagnostic tool for African
Trypanosomiasis, apt for cheap production and easy use in resource-poor settings.
8.5 Conclusion
We could show that trypanosomes react to flow and their motility can be manipulated by shaping
their environment accordingly, which enables control over trypanosomes that does not require
optical traps or other external manipulation with magnetic or electric fields. Thus, concentrating
trypanosomes from blood seems feasible and might help to improve diagnosis of this neglected,
yet fatal pathogen in developing countries.
Axel Hochstetter 83
9 Microfluidics-based single cell analysis to study drug-
dependent motility changes in trypanosomesb
9.1 Introduction
The discovery of drugs that are effective in the battle against rapidly adapting pathogens requires
concerted efforts with respect to developing improved screening assays and understanding of the
mode of action of drugs on the target cell. To economize these efforts, pharmaceutical research
increasingly employs cell culture assays that bridge the gap between molecular and animal drug
testing.4 In many instances, analysis of whole cells allows for more accurate predictions of drug
responses than molecular assays because the complex molecular interactions and the cellular
compartments that significantly influence the host's reaction to a drug are retained.4 Cell culture-
based drug discovery commonly involves cell chips, high throughput screenings, and cell viability
assays using fluorescence or luminescent transgenic target organisms.4,91–93 Often, these assay
systems are unable to distinguish between drugs that kill the target cells (cytocidals) and drugs
that merely inhibit cell growth (cytostatics).94
In recent years, microfluidics has emerged as a powerful tool for the discovery of drugs, as well
as for elucidating their effects on cells, cell secretions, and signaling pathways.4,95–97 Moreover,
microfluidics has proven useful for exploring individual cells in a heterogeneous population.95
The range of applications in single cell analysis is increased manifold by combining microfluidics
with optical tweezers that allow the manipulation of cells by miniscule forces without
touching.98,55 Examples include the sorting of motile cells57 and the characterization of cell
motility99, but also specific placing of cells into defined environments.57,100,101
In single cell assays, the effects of environmental parameters are frequently assessed through
analyzing cell lysates. 95,102,103 However, this type of endpoint analysis excludes further
investigations of downstream effects. On the other hand, physical or biophysical properties of
living cells so far are very rarely used as readout. The few published examples include monitoring
bioelectrical impedance104 in response to drug treatment or migratory behavior.97 Highly motile
cells or pathogenic unicellular organisms have not yet been studied by single cell assays.
Trypanosoma brucei, a unicellular organism belonging to the genus of trypanosomes, is one of the
most rapidly adapting pathogens.28–32 The subspecies T. brucei brucei is endemic in sub-Saharan
Africa where it causes Nagana disease in livestock105, whereas T. brucei rhodesiense and T. brucei
b This chapter is currently being submitted in collaboration with Stellamanns, E., Deshpande, S., Uppaluri, S., Engstler, M., & Pfohl, T. Please note that supplementary information can be found on the CD-ROM.
Axel Hochstetter 84
gambiense are responsible for the acute and chronic form of the fatal sleeping sickness in humans
(Human African Trypanosomiasis, HAT), respectively.33–37
Trypanosomes are extensively studied model flagellates.11,31,106 The flagellum is structurally
different from bacterial flagella and more complex than most other eukaryotic flagella.39
Nonetheless, it is essential for locomotion and viability. Moreover, the flagellum is key to evading
the immune response of the infected mammalian host.11
Present screening procedures for trypanocidal compounds involve either in vitro assays that take
several hours93,94,107 or in vivo experiments that are based on establishing mutant trypanosomes
that take weeks108 and therefore, are even more time-consuming.
Here, we introduce a real-time motility analysis system that is based on a straightforward
microfluidic device in combination with time-resolved microscopy and optical tweezers. In the
device, the concentration of drugs and chemicals is diffusion-controlled and can be changed
gradually, while simultaneously observing single cells. This setup allows us to physically
characterize and quantify how drugs and chemicals affect trypanosome motility. Specifically, we
quantify drug-induced reversible paralysis and irreversible chemical fixation of trypanosomes in a
dose-dependent manner.

Axel Hochstetter 85
9.2 Results
9.2.1 Design and function of drug testing device
Figure 9.1: Schematic representation of the experimental design at the level of (a) the device and (b) the micro chamber
(a,b): The device consists of micro chambers along a main channel that connects the cell side with the drug side. Both
sides have an inlet and an outlet at the end of the respective Y-split. Panels (I-VI) illustrate individual operational steps
in (a) and the resulting relative concentrations of solutions in (b). (I) Channels and micro chambers are filled with
culture medium, (II) in the absence of applied flow, individual cells are trapped by optical tweezers and moved into a
micro chamber. (III) Cell movements in a drug-free confinement are recorded while the drug side is flushed with drug-
containing solution (Drug) to remove culture medium. (IV) Drug is pumped through the main channel and drug
molecules diffuse into the chambers while cell movements are recorded. (V) At maximum drug concentration, the cell
side is flushed with culture medium. (VI) Culture medium is pumped from the inlet on the cell-side through the main
channel and recording can be stopped.
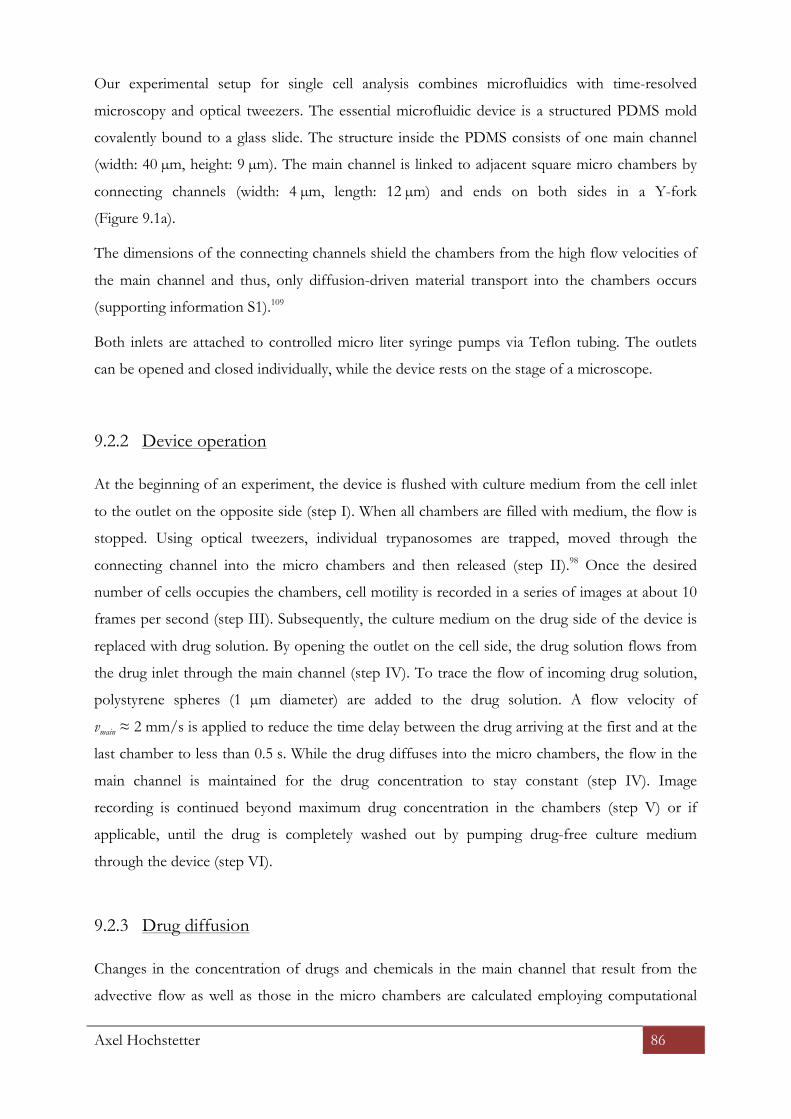
Axel Hochstetter 86
Our experimental setup for single cell analysis combines microfluidics with time-resolved
microscopy and optical tweezers. The essential microfluidic device is a structured PDMS mold
covalently bound to a glass slide. The structure inside the PDMS consists of one main channel
(width: 40 µm, height: 9 µm). The main channel is linked to adjacent square micro chambers by
connecting channels (width: 4 µm, length: 12 µm) and ends on both sides in a Y-fork
(Figure 9.1a).
The dimensions of the connecting channels shield the chambers from the high flow velocities of
the main channel and thus, only diffusion-driven material transport into the chambers occurs
(supporting information S1).109
Both inlets are attached to controlled micro liter syringe pumps via Teflon tubing. The outlets
can be opened and closed individually, while the device rests on the stage of a microscope.
9.2.2 Device operation
At the beginning of an experiment, the device is flushed with culture medium from the cell inlet
to the outlet on the opposite side (step I). When all chambers are filled with medium, the flow is
stopped. Using optical tweezers, individual trypanosomes are trapped, moved through the
connecting channel into the micro chambers and then released (step II).98 Once the desired
number of cells occupies the chambers, cell motility is recorded in a series of images at about 10
frames per second (step III). Subsequently, the culture medium on the drug side of the device is
replaced with drug solution. By opening the outlet on the cell side, the drug solution flows from
the drug inlet through the main channel (step IV). To trace the flow of incoming drug solution,
polystyrene spheres (1 µm diameter) are added to the drug solution. A flow velocity of
vmain ≈ 2 mm/s is applied to reduce the time delay between the drug arriving at the first and at the
last chamber to less than 0.5 s. While the drug diffuses into the micro chambers, the flow in the
main channel is maintained for the drug concentration to stay constant (step IV). Image
recording is continued beyond maximum drug concentration in the chambers (step V) or if
applicable, until the drug is completely washed out by pumping drug-free culture medium
through the device (step VI).
9.2.3 Drug diffusion
Changes in the concentration of drugs and chemicals in the main channel that result from the
advective flow as well as those in the micro chambers are calculated employing computational

Axel Hochstetter 87
fluid dynamics (CFD) simulations. We used the CFD module from the software COMSOL
multiphysics version 4.3a to calculate the evolution of concentration gradients in the microfluidic
device. CFD simulations of the distribution of a drug with a diffusion coefficient of
Ddrug = 5.7.10-10 m2/s are shown in supplementary video S1 and S2 and Figure S1. The chosen
diffusion coefficient is representative for a small molecule, such as 2-deoxy-D-glucose (2DG),
glutaraldehyde (GA) and the drug suramin, all of which have been used in our experiments.
9.2.4 Microfluidics single cell motility analysis with glutaraldehyde
We tested the feasibility of single cell analysis in microfluidic devices by exposing confined
trypanosomes to GA, which is widely used to fix cells for microscopy.110,111 GA was diluted with
culture medium (final concentration 1M) in this control experiment to maintain maximal
similarity with subsequent experiments. Following the procedure described above, GA solution
was administered from the drug side. The effects of GA on trypanosome motility were recorded
with a frame rate of 10 Hz before and during the inflow of GA.
Based on sequential images, we determined the center of mass trajectories of the trypanosomes
(Figure 9.2) and calculated their velocity, ! ! =! !!!! !! !
!
!!, where ! is the position, ! is the
time and ∆! is the interval between two consecutive images. Furthermore, the mean square
displacement of the trajectories, MSD ≡ ! ! ! = ! ! + ! − ! ! ! c, where � is the time
interval, was computed. MSD is a common measure for cellular motion98 and can be interpreted
as the space which is covered over time. In two dimensions, the time dependence of the MSD
can be described by the following equation: ! ! ! = 4 ∙!! ∙ !! ,where ! is the scaling
exponent and !! the motility coefficient.40 For � > 1, the motion is super-diffusive, for � < 1
sub-diffusive and for � = 1 diffusive or random walk-like.40,112
Figure 9.2 shows the color-coded time-lapse trajectories of two confined trypanosomes over six
minutes in culture medium (Figure 9.2a,b) and after GA inflow (Figure 9.2c; see also
supplementary video S3). At the onset of the experiment, when the device is filled with culture
medium, trypanosomes in micro chambers were highly motile (Figure 9.2b). Exposure to GA led
to a rapid fixation of trypanosomes (Figure 9.2c). Velocity analyses revealed that their initial
velocity of about 3.5 !m/s(green) decreased within 1 second to almost zero (Figure 9.2d,e and
supplementary video S3) after contact with GA (magenta). The MSD of trypanosomes moving in
a micro chamber for 500 s prior to fixation (green) and after fixation (magenta) are shown in c Please note that, the MATLAB script used to calculate MSDs can be found in the Appendix A on page105.

Axel Hochstetter 88
Figure 9.2f. The MSD of motile cells show that trypanosome motility is a random walk (! ≈ 1).
At much longer time scales, the confinement by the micro chamber walls drives the MSD into a
plateau.
Conversely, GA-fixed trypanosomes exhibited Brownian rather than self-propelled motion. This
difference results in a downshifting of the MSD of fixed cells by about two orders of magnitude.
The fixation process was – as expected – irreversible since the trypanosomes did not regain
motility after the GA drug solution in the device had been replaced by culture medium
(Figure 9.2c).
Figure 9.2: In situ cell fixation
(a) Bright-field micrograph of two trypanosomes confined to a micro chamber. (b) Overlaid colour-coded time-lapse
trajectories of trypanosomes over 6 min in culture medium. (c) Time-lapse trajectories over 6 min after the addition of
GA. (d) Velocity vs. time plot of a trypanosome before (green), during (black) and after (magenta) fixation with GA. (e)
Velocity histogram of several trypanosomes before (green) and after (magenta) fixation with GA. (f) MSD of several
trypanosomes in confinement before (green) and after GA fixation (magenta).
9.2.5 Microfluidics testing of 2DG on trypanosome motility
2DG is a glucose analogue that has previously been used to investigate trypanosome metabolism
and motility.28,98,113,114 For our experiments, a small number of trypanosomes were placed in the
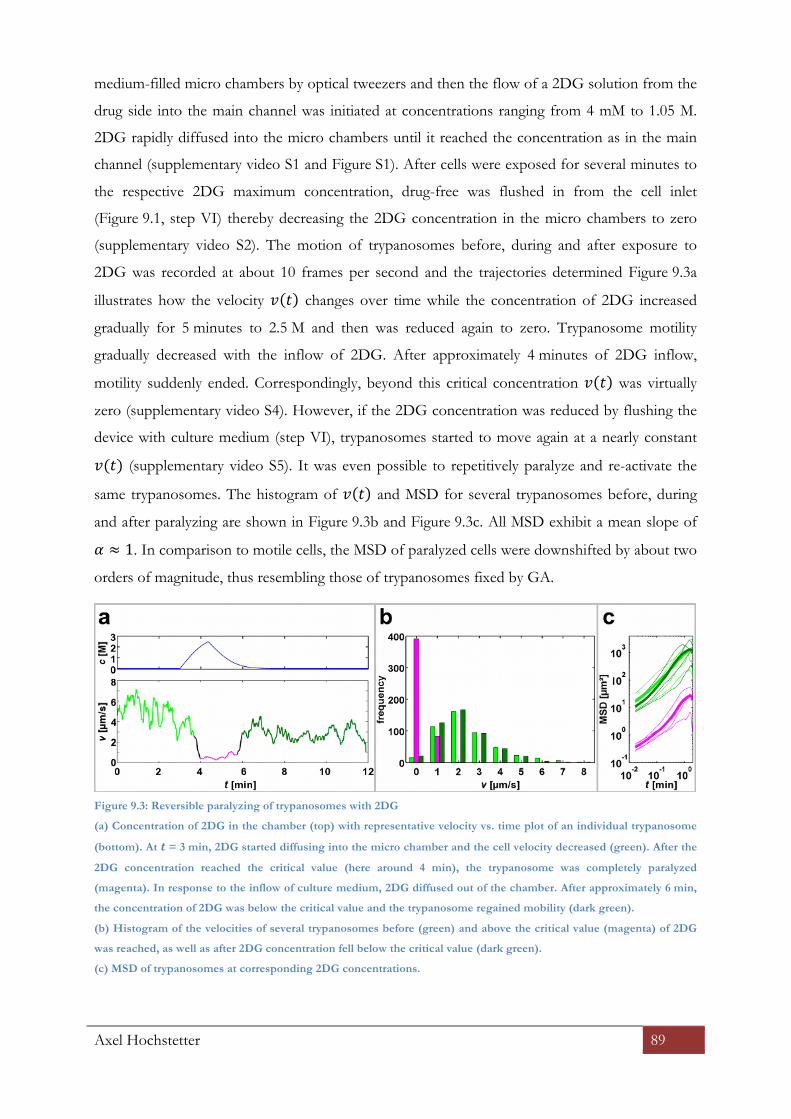
Axel Hochstetter 89
medium-filled micro chambers by optical tweezers and then the flow of a 2DG solution from the
drug side into the main channel was initiated at concentrations ranging from 4 mM to 1.05 M.
2DG rapidly diffused into the micro chambers until it reached the concentration as in the main
channel (supplementary video S1 and Figure S1). After cells were exposed for several minutes to
the respective 2DG maximum concentration, drug-free was flushed in from the cell inlet
(Figure 9.1, step VI) thereby decreasing the 2DG concentration in the micro chambers to zero
(supplementary video S2). The motion of trypanosomes before, during and after exposure to
2DG was recorded at about 10 frames per second and the trajectories determined Figure 9.3a
illustrates how the velocity ! ! changes over time while the concentration of 2DG increased
gradually for 5 minutes to 2.5 M and then was reduced again to zero. Trypanosome motility
gradually decreased with the inflow of 2DG. After approximately 4 minutes of 2DG inflow,
motility suddenly ended. Correspondingly, beyond this critical concentration ! ! was virtually
zero (supplementary video S4). However, if the 2DG concentration was reduced by flushing the
device with culture medium (step VI), trypanosomes started to move again at a nearly constant
!(!) (supplementary video S5). It was even possible to repetitively paralyze and re-activate the
same trypanosomes. The histogram of ! ! and MSD for several trypanosomes before, during
and after paralyzing are shown in Figure 9.3b and Figure 9.3c. All MSD exhibit a mean slope of
! ≈ 1. In comparison to motile cells, the MSD of paralyzed cells were downshifted by about two
orders of magnitude, thus resembling those of trypanosomes fixed by GA.
Figure 9.3: Reversible paralyzing of trypanosomes with 2DG
(a) Concentration of 2DG in the chamber (top) with representative velocity vs. time plot of an individual trypanosome
(bottom). At ! = 3 min, 2DG started diffusing into the micro chamber and the cell velocity decreased (green). After the
2DG concentration reached the critical value (here around 4 min), the trypanosome was completely paralyzed
(magenta). In response to the inflow of culture medium, 2DG diffused out of the chamber. After approximately 6 min,
the concentration of 2DG was below the critical value and the trypanosome regained mobility (dark green).
(b) Histogram of the velocities of several trypanosomes before (green) and above the critical value (magenta) of 2DG
was reached, as well as after 2DG concentration fell below the critical value (dark green).
(c) MSD of trypanosomes at corresponding 2DG concentrations.

Axel Hochstetter 90
From the simulations of the evolution of the 2DG concentrations in the micro chambers applied
to the corresponding motility analysis, we calculated at what concentration 2DG paralyzes the
trypanosomes. The percentage of trypanosomes found to be paralyzed at specific concentrations
is plotted in Figure 9.4. Full paralysis in trypanosomes occurred at 2DG concentrations of
400 mM and higher. At around 515 mM, 50% of the trypanosomes were paralyzed, resulting in
the paralyzing dosage, PD50 = 515 mM. This paralyzing dosage of 515 mM has been confirmed
by experiments with steady concentrations of 2DG.
Moreover, our method allowed for the direct observation of the evolution of the paralyzing
effect on trypanosomes. With increasing dosage of 2DG, the trypanosomes moved slower, and at
concentrations close to PD50, the flagellum was still moving whereas the cell body was
immobilized (supplementary videos S4 & S5).
Figure 9.4: Paralyzing dosage PD50
Percentage of trypanosomes paralyzed vs. concentration of 2DG. PD50 denotes the concentration of 2DG at which 50%
of trypanosomes are paralyzed.
9.2.6 Impact of low dosages of 2DG on trypanosomes motility
We examined the effects of 2DG on trypanosome motility at concentrations more than two
orders of magnitude lower than PD50.For these low concentrations the recorded videos showed
no obvious impact on trypanosome motility. But an increase of 2DG correlated with a downshift
of MSD curves even at low concentrations (Figure 9.5a).
For a more quantitative description of the impact of 2DG on the motility of trypanosomes we
used a simple hydrodynamic model. Whereas paralyzed cells exclusively exhibited Brownian
motion, the motile cells at different 2DG concentrations were characterized by a random walk
(! ≈ 1). Using the Stokes-Einstein relation, the motility coefficient of paralyzed cells, !!"#", can
be related to the thermal energy, !!!. The friction factor of a paralyzed trypanosome, !!"#", is
Axel Hochstetter 91
linked to its diffusion coefficient, !!"#" , by !!"#" =! ! !
!"#"
!!= !!"#" =
!!!!!"#"
. By analogy,
the motility coefficient of the motile, randomly walking cells (! = 1), !!"#$%& ≈ !!!! =! ! !
!"#$%&!!
, can be described as !!"#$%& ≅!!!!!!"#$%&
, using a virtual temperature, !!, or an
apparent motility energy, !!!!, where ! is a dimensionless factor. Taking into account that the
friction factors of motile and paralyzed cells are almost identical, !!"#" ≈ !!"#$%& , the motility
factor, !, can be obtained by ! ≅ !!"#$%&!!"#"
= ! ! !!"#$%&
! ! ! !"#". The motility factor ! ! in dependence
of the 2DG concentration, which is a coarse estimate of the motility energy in multiple of !!!, is
presented in Figure 9.5b. A motile trypanosome in culture medium utilizes a motility energy that
is approximately 130 times greater than the thermal energy. The motility factor ! ! shows a
strong, exponential-like decay with increasing concentration of 2DG (0 - 400 mM). However, for
! ! ≫ 1, the trypanosomes were still motile. At 400 to 680 mM 2DG, the trypanosomes
became paralyzed with a PD50 = 515 mM (Figure 9.4). For a motility factor ! ! = 1 the motility
energy of a trypanosome equals the thermal energy, !!!. Thus, propulsion is arrested and only
Brownian motion occurs.

Axel Hochstetter 92
Figure 9.5 Analysis of the impact of 2DG on trypanosome propulsion
(a) MSD of trypanosomes in identical chambers but at different concentrations of 2DG in the medium (bright green:
drug-free culture medium, dark green: !!"#° = 4 mM, blue: !!"#° =40 mM black: !!"#° = 300 mM, magenta: fixed with
GA, red: paralyzed; !!"#° = 700 mM). Thin lines are MSD of individual cells, bold lines are averages of a number of
cells at the same 2DG concentration.
(b) The motility factor ! plotted against the concentration of 2DG in the medium. The dashed black line represents a
motility factor ! = 1, which means that the propulsion energy of a trypanosome equals the thermal energy, kBT. The
area shaded in red corresponds to the concentration range shown in Figure 9.4. Dashed blue line serves as a guide to
the eye.
9.2.7 Single cell analysis with suramin
Suramin was introduced almost a century ago, and despite its severe side effects, still is the drug
of choice in treating early stages of Eastern African sleeping sickness in humans.115–117 The route
of entry into the trypanosomes as well as the mode of action remain enigmatic. Suramin
presumably associates with different serum proteins in the bloodstream, e.g. low-density
lipoproteins (LDL).117,118 It has been proposed that suramin’s trypanocidal activity arises from its
by interference with endocytic uptake of LDL.118 While it has been indicated, that suramin might
inhibit several enzymes and receptors promiscuously117, a more recent study suggests that
suramin undergoes receptor-mediated endocytosis to the lysosome where it escapes to the
cytoplasm and may inhibit cellular processes119.

Axel Hochstetter 93
To gain a better understanding on the effects of suramin, we tested the response of
trypanosomes to the drug in our single cell analysis. Similar to 2DG, suramin induced a paralysis
of confined cells at a critical concentration of PD50 = 123 mM, (Figure 9.6a). Moreover, when the
drug was flushed out of the device by culture medium, paralyzed trypanosomes regained motility.
We quantitatively assessed the impact of suramin on the motility of trypanosomes on the basis of
MSDs that largely exhibit a mean slope of ! ≈ 1 (Figure 9.6c). At a concentration of 3.5 mM
suramin, which is significantly below PD50, the motility factor ! was reduced to about one third
as compared to trypanosomes in a drug-free environment. Between 35 mM and 80 mM suramin,
a steady state with ! ! ≈ 35 was reached, while between 80 and 170 mM, paralysis resulted in
! ! of 1 (Figure 9.6d).
Besides the reversible reduction in cell motility, suramin exhibited trypanocidal effects. At
dosages above 35 mM, trypanosomes were found to start rupturing and disintegrating after about
6 minutes of exposure to suramin (supplementary video S6). The percentage of trypanosomes
that disintegrated at the end of a time lapse of 14 min increases with the concentration of
suramin at steady state (Figure 9.6b).
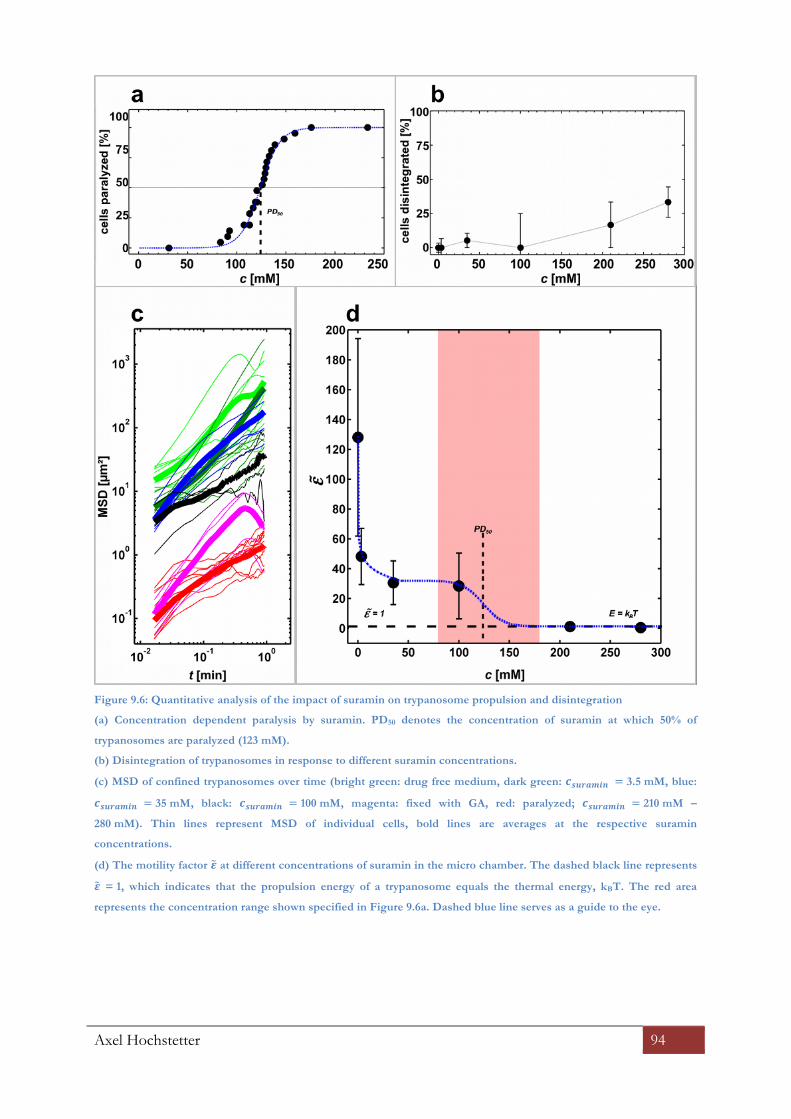
Axel Hochstetter 94
Figure 9.6: Quantitative analysis of the impact of suramin on trypanosome propulsion and disintegration
(a) Concentration dependent paralysis by suramin. PD50 denotes the concentration of suramin at which 50% of
trypanosomes are paralyzed (123 mM).
(b) Disintegration of trypanosomes in response to different suramin concentrations.
(c) MSD of confined trypanosomes over time (bright green: drug free medium, dark green: !!"#$%&' = 3.5 mM, blue:
!!"#$%&' = 35 mM, black: !!"#$%&' = 100 mM, magenta: fixed with GA, red: paralyzed; !!"#$%&' = 210 mM –
280 mM). Thin lines represent MSD of individual cells, bold lines are averages at the respective suramin
concentrations.
(d) The motility factor ! at different concentrations of suramin in the micro chamber. The dashed black line represents
! = 1, which indicates that the propulsion energy of a trypanosome equals the thermal energy, kBT. The red area
represents the concentration range shown specified in Figure 9.6a. Dashed blue line serves as a guide to the eye.

Axel Hochstetter 95
9.3 Discussion
The quantitative assessment of reversible and irreversible paralysis of trypanosomes shows that
microfluidics in combination with microscopy is a versatile tool for single cell analysis and
pharmaceutical testing. Our straightforward microfluidic-based method allows not only for an in
situ analysis of single cells in defined, gradually changeable environments but also for a rapid
evaluation of the impact of chemicals and drugs by analysing cell motility. Moreover, this
approach eradicates the error of concentration inhomogeneity that arises from adding drug
solutions drop-wise into a cell-laden well, that can lead to false results in commonly used micro-
assays.
The rapid fixation of trypanosomes with GA represents an excellent model for a highly cytocidal
drug. We found that exposure to GA immediately and irreversibly ended active motion. This is
most likely a result of cross-linking proteins involved in flagellum-dependent parasite motility,
e.g. dynein120. In contrast, paralysis of trypanosomes was reversible when trypanosomes were
exposed to respective concentrations of 2DG, which is a competitive inhibitor of glycolysis114.
Based on the precise and rapid control of drug concentrations in the confinements, we were able
to determine the dosage at which 50% of the trypanosomes are paralyzed (PD50). Furthermore,
our data reveal an impact of 2DG on the motility of the cells at doses that are significantly lower
than PD50.
We introduced a simple random walk model to derive the propulsion energy from cell
trajectories. According to this model, we noted a reduction of propulsion energy with increasing
concentration of 2DG. This finding is consistent with the decrease in cell motility and with
reports of 2DG as inhibitor of glycolysis in Trypanosoma brucei bloodstream forms. It is
conceivable, that the resulting depletion of ATP might cause a decrease in flagellar motor activity
and thereby reduce cell motility and hence vitality.
As the cytolysis-free, microfluidics-based single cell analysis revealed effects of 2DG at
concentrations significantly lower than those used in common drug testing systems and had a
much faster assessment than regularly used assays,92,94 we examined the response of
trypanosomes to suramin, which is still the most commonly used drug in early-stage
Trypanosomiasis. Our data show that suramin and 2DG have comparable effects with respect to
cell motility, which is likely due to suramin blocking endocytosis in trypanosomes. Unlike 2DG,
suramin also caused individual trypanosomes to rupture and disintegrate after exposure to
concentrations of 35 mM and higher. Interestingly, the suramin-triggered disintegration occurred
even after suramin removal, indicating that suramin either accumulates in trypanosomes or
irreversibly alters cell regulations. The cytocidal effect of suramin suggests that the suramin might
Axel Hochstetter 96
affect cellular mechanisms that ultimately result in cell lysis in addition to the inhibition of
glycolysis, also exhibited by 2DG.
The concentration of suramin in a human patient, treated for Trypanosomiasis can accumulate to
about 0.1 mM116 (based on the current chemotherapy105, a volume of distribution VD of
31-46 litres and a terminal half-life of 50 days). The dosages investigated herein are much higher
but show the impact of suramin onto trypanosomes within minutes instead of weeks. From the
drastic reduction of motility at low suramin dosages, a reduction in trypanosome propulsion
energy of 10-25% at 0.1 mM seems plausible and might result in reduced immune evasion, and
thus explain the therapeutic effect of suramin.
9.4 Conclusion
While we characterized our microfluidics-based method with established drugs and chemicals
that affect Trypanosoma brucei brucei, the system lends itself to numerous adaptations, like finding
and characterizing new drugs against trypanosomes or any other pathogenic cell. Further
versatility can be easily accomplished by integrating additional methodologies, such as screening
for mutants or fluorescence imaging – live as well as after fixation. Moreover, by applying our
device to human cells and to pathogens simultaneously, effective drug doses could be determined
in a single experiment.
Axel Hochstetter 97
10 Discussion
This doctoral thesis provides new insight into the motility of both prokaryotic (on the example of
Caulobacter crescentus) and eukaryotic (on the example of Trypanosoma brucei brucei) flagellated single-
cell organisms, as well as on the methodology with which they can be manipulated physically and
chemically.
Even after over 160 years of research, some aspects of trypanosomal motility are still unknown.
However, their way of locomotion is key in understanding how trypanosomes manage to evade
the host immune system, how their pathogenicity is explained and why there is no inoculation
against trypanosomes.
Trypanosomes that performed a directed motion before optical trapping, entered into a
rotational movement with an average rotation frequency of 1.5 Hz during trapping. This
rotational movement was overlaid by a zigzagging oscillation of 15 Hz caused by the beating of
the flagellum. Similar beat frequencies of 15 and 18 Hz, respectively were also reported for
untrapped, free swimming trypanosomes by Stellamanns et al. (2014)78 and Heddergott et al.
(2012)77. This similarity in beat frequency, shows that optical confinement does not alter the
flagellar beat of trypanosomes. It can therefore be assumed that the force generated by the
flagellar movement will be the same for both trapped and free swimming trypanosomes. Thus we
can conclude that the torque of 5.5 ⋅ 10!!" N ⋅m, the energy, and power of 3.7 ⋅ 10!!" J and
5.6 ⋅ 10!!" W respectively, corresponds to the torque, power, and energy actually generated by a
freely swimming trypanosome in the same liquid medium.
The finding, that only about 20% of the energy generated by the flagellar beat is translated into
the actual propulsion of trypanosomes, might at first sight be surprising. Such huge energy
expenditure seems a rather inefficient way to move for a highly adapted parasite. However this
perceived inefficiency could be mitigated by the fact, that a trypanosome’s flagellum is not merely
used for propulsion, but also to transport VSGs to the flagellar pocket, where they are
endocytosed and consumed. These VSGs are subsequently replaced by new proteins to counter
the host-immune reaction. Such hydrodynamic clearing of the cell surface as described by
Engstler et al. 200711, thus warrants the high energy consumption of the trypanosomal flagellum
by enabling a high adaptability to the hostile environment of the trypanosome.
Studying the hydrodynamic flow field around trypanosomes swimming in a liquid containing
polystyrene beads, we observed that the surrounding particles were being actively pushed along
the cell body from the anterior to the posterior end of the trypanosome. Through this
observation we could classify trypanosomes as pushers among the unicellular swimmers. This
further strengthens the model of hydrodynamically mediated surface-clearing and host-immune

Axel Hochstetter 98
evasion of trypanosomes, since the flow field helps to push the variable surface proteins back to
the flagellar pocket at the anterior end where endocytosis takes place.
Like for Trypanosoma brucei brucei, the force generated by the flagellar beat of Caulobacter crescentus
swarmer cells was assessed with a combination of microfluidics and optical trapping. Other than
trypanosomes, caulobacter as free living, unicellular organisms do not have the need to evade a
hostile immune system. However, surface adhesion is of paramount importance for caulobacter
to form biofilms121. In order to proliferate, caulobacter cells need to differentiate into stalked
cells. These stalked cells are then able to produce holdfast to adhere to a surface.41
In our experiments, we managed to induce this holdfast formation by quickly bringing wild-type
Caulobacter into contact with a surface. When using mutants lacking pili, we found that some
caulobacter still managed to induce holdfast adhesion. However, pili-negative caulobacter that
did not form holdfast attachment, nevertheless adhered to the surface with some kind of sticky
filament. In this filament-mediated adhesion, the caulobacter were rotating around the adhesion
site with a radius of 1-4 !m which is slightly shorter than the length of the caulobacter flagellum
(6 !m)46. Mutants lacking both pili and flagella still exhibited some sort of unspecific surface
adhesion, which did however not show any form of rotational movement. The rotational radius
in the pili-negative but flagellum-positive mutant and the lack thereof in the flagellum-negative
caulobacter, could potentially indicate that the adhesion filament in the pili-negative mutant is
indeed the flagellum. Yet to know for sure, this would have to be investigated in further
experiments, for example by labelling the flagellum in order to see whether the flagellum is
indeed the filament that adheres to the surface in absence of pili and holdfast.
The above mentioned findings show that microfluidics in combination with other tools such as
high-speed microscopy and optical traps, is indeed a powerful tool to answer many questions.
But in order to do so, the trap has to be adequately calibrated and the device accordingly
designed depending on the matter under study and the research question. Phototoxic and other
influencing factors have to be taken into account when working with living matter.
In our work we found that optical traps have to be adapted in order to minimize phototoxic
effects on caulobacter. Caulobacter within the optical trap were incapacitated after only 10
seconds when using a laser with a wavelength of 808 nm, even with the relatively low power used
in our experimental setup. This is an important parameter to account for, when manipulating
caulobacter in an optical trap. Our findings are surprising in the light of the works of Liu (2009)58
who reported to have optically trapped caulobacter for longer periods of time with wavelengths
between 633 and 1064 nm and powers the same and higher as the one used by our setup, without
having observed any noteworthy phototoxic effects. Nevertheless, it is advisable to first assess

Axel Hochstetter 99
any possible influences of the specific experimental setup on the organism under study before
attempting to manipulate it with optical means
One applied use for our microfluidic setup in combination with high speed microscopy and
unicellular pathogens, is studying the influence of chemical substances on the viability of the
study organism. Colleagues from our research group have already demonstrated that microfluidic
devices can be built in a way that they contain micro chambers with a no-flow condition, even in
the presence of high flow velocities in the rest of the device.109 We used this finding to create a
device with which it was possible to test the influence of chemical substances on trypanosomes.
Due to the lack of flow within the chamber, the concentration of the chemical substance
introduced into the system, is determined purely by diffusion and can thus be very exactly
controlled. This experimental setup was used in our work to demonstrate the effect of 2-deoxy-
D-glucose, a known glycolysis inhibitor, and of suramin, the hallmark drug against early stage
HAT, on Trypanosoma brucei brucei. With 2-deoxy-D-glucose, trypanosomes were fully paralyzed at
a concentration of 515 mM, whereas for suramin, a concentration of 123 mM was sufficient to
reduce the trypanosome’s displacement to a level where it equalled mere brownian motion.
Furthermore we were able to observe trypanocidal effects of suramin, leading trypanosomes to
disintegrate once exposed to a drug concentration of 35 mM. Trypanosomes that had been
exposed to this drug concentration, disintegrated independent of whether suramin concentration
remained the same or dropped back down to zero again. Creating an experimental tool wherein it
is possible to directly observe the effects of chemical substances on the viability and structure of
living cellular pathogens in complex fluids, narrows the gap between compound research for new
drugs and animal testing.
The geometry of the microfluidic devices itself also plays a role in the control and manipulation
of study matter. The layout and size of the micro chambers influences, for example, the dwelling
time of trypanosomes within the chamber. We observed that escape from round chambers was
much quicker (from 2-12 minutes depending on flow and channel size) than escape from square
chambers (retained throughout the whole observation) in our experiments. Analyzing the
trajectories of the trypanosomes, we could observe that once trypanosomes hit a wall, they will
follow this wall in one direction until they encounter a barrier. In a round chamber this following
of the wall will inevitably lead the trypanosomes to an exit, whereas in a square chamber the
trypanosome will hit another wall and then change direction randomly. Furthermore, ratchet
devices can be used to hinder trypanosomes to exit the chamber once they are inside it. Through
a combination of ratchet design and device geometry it should be possible to passively sort and
concentrate trypanosomes in a suitable setup. By subsequently introducing a simple cross-flow

Axel Hochstetter 100
through the ratchet devices, the thus concentrated trypanosomes could then be evacuated from
the device again for further use. A first attempt to design such a concentration device has been
made in this work, leaving us with a preliminary knowledge-base of what to consider when
designing cell-sorting devices for living trypanosomes. We learned that material properties and
size of the structures have to be adjusted in order to ensure that the ratchets adhere to the
surface and enable a concentration of trypanosomes. Yet, by employing arrow-head and gear-
wheel ratchet structures, we were able to confine trypanosomes at a predefined place, and
subsequently flush them out of the device again for further use. With some additional work, a
microfluidic device for the passive concentration of trypanosomes from infected blood or spinal
liquor samples is conceivable and would indeed be much wanted in the current search for new
diagnostic devices for the sleeping sickness89.

Axel Hochstetter 101
11 Outlook and Perspectives
As we did for Trypanosoma brucei brucei and Caulobacter crescentus, microfluidic devices in
combination with optical traps can be used to analyse, manipulate and control the motility of
different unicellular organisms.
Based on the results in this work, the combination of microfluidic devices with optical tweezers
and high-speed microscopy can be further adapted for standardised testing of the effects of
miniscule changes in drug concentrations on pathogenic microorganisms.
The knowledge about the motility of model organisms within a liquid medium deepens our
understanding of how locomotion of microscopic organisms in the human blood circulation
works. This knowledge is the basis needed by nano-engineers in their attempt to create artificial
swimmers that could be used for the delivery of a drug to difficult to reach destinations.
Additionally, with a little more work, a cell sorting device can be created to passively sort and
concentrate trypanosomes from infected blood or liquor samples and can be used as a diagnostic
tool.

Axel Hochstetter 102
12 Appendix A Recipes
12.1 Soft Lithography:
Photoresist SU-8 3010 is spread on the waver in a spin coater using the following program: 1. 500 rpm for 10 seconds fast ramping (1)
2. 4000 rpm for 30 seconds slow ramping (8)
3. soft baking on a heat plate for 3 minutes @ 95 °C and cool down to R.T.
4. align under the chrome mask. 5. expose to UV (! = !"# !") 4.8-6 seconds @ 33 mW/mm2
6. post-Exposure baking for 1 minute @ 65 °C
6.b for 4 minutes @ 95 °C
7. cool down to R.T. 8. rinse with SU-8 developer for 20-30 seconds
9. immerse in SU-8 developer for 4 minutes
10. spray wash with 2-propanol for 30 seconds
11. blow dry using nitrogen.
Figure 12.1: Side-on view through a device. The device height (8 !m) is visible as the size of the step between the wall
(left) and a square micro chamber (right), resulting from the recipe above.
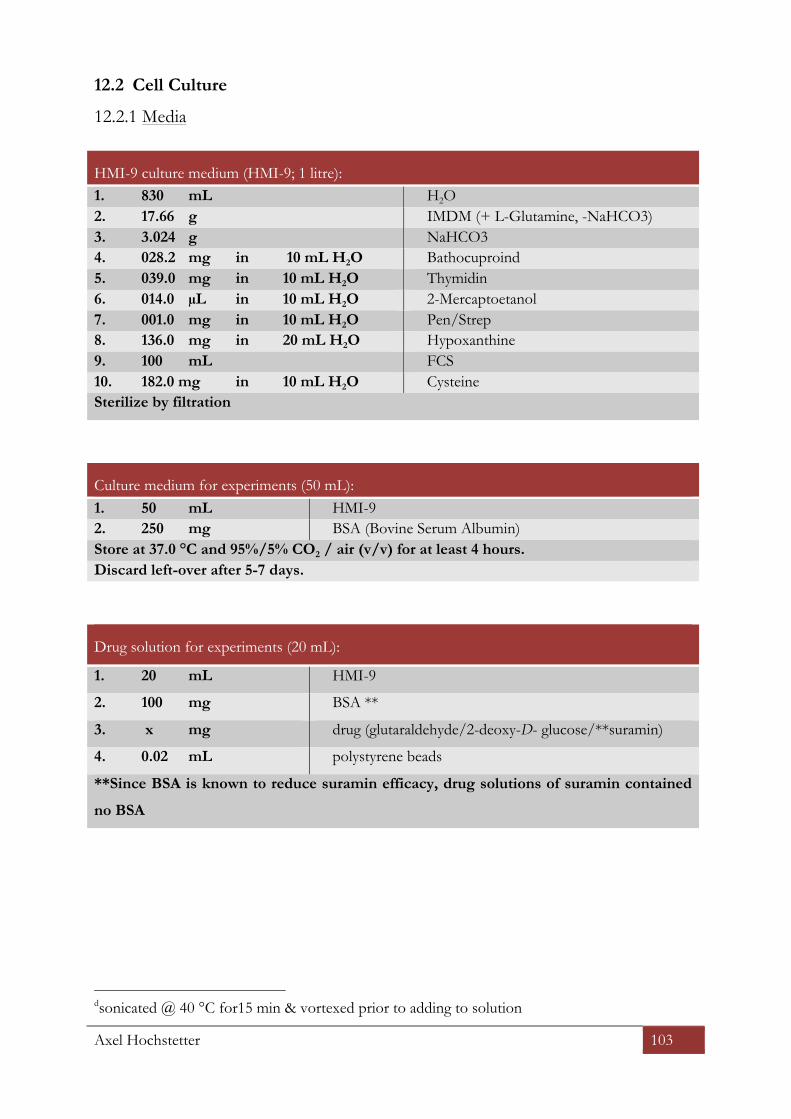
Axel Hochstetter 103
12.2 Cell Culture
12.2.1 Media
HMI-9 culture medium (HMI-9; 1 litre): 1. 830 mL H2O 2. 17.66 g IMDM (+ L-Glutamine, -NaHCO3) 3. 3.024 g NaHCO3 4. 028.2 mg in 10 mL H2O Bathocuproind 5. 039.0 mg in 10 mL H2O Thymidin 6. 014.0 µL in 10 mL H2O 2-Mercaptoetanol 7. 001.0 mg in 10 mL H2O Pen/Strep 8. 136.0 mg in 20 mL H2O Hypoxanthine 9. 100 mL FCS 10. 182.0 mg in 10 mL H2O Cysteine Sterilize by filtration
Culture medium for experiments (50 mL): 1. 50 mL HMI-9 2. 250 mg BSA (Bovine Serum Albumin) Store at 37.0 °C and 95%/5% CO2 / air (v/v) for at least 4 hours. Discard left-over after 5-7 days.
Drug solution for experiments (20 mL):
1. 20 mL HMI-9
2. 100 mg BSA **
3. x mg drug (glutaraldehyde/2-deoxy-D- glucose/**suramin)
4. 0.02 mL polystyrene beads
**Since BSA is known to reduce suramin efficacy, drug solutions of suramin contained
no BSA
dsonicated @ 40 °C for15 min & vortexed prior to adding to solution

Axel Hochstetter 104
Freezing medium (100 mL) 1. 50 mL FCS 2. 40 mL CM culture medium 3. 10 mL Glycerol Sterilize by filtration
Trypanosome dilution buffer TDB 1. 1000 mL of pure water 2. 0.37 g KCl 3. 4.68 g NaCl 4. 0.62 g MgSO4 5. 3.56 g Na2HPO4•2 H2O 6. 0.28 g NaH2PO4•1 H2O 7. 3.96 g Glucose Sterilize by filtration
Trypanosome fixation buffer TFB 1. 90 mL of pure water 2. 0.037 g KCl 3. 0.468 g NaCl 4. 0.062 g MgSO4 5. 0.356 g Na2HPO4•2 H2O 6. 0.028 g NaH2PO4•1 H2O 7. 10 mL Glutaraldehyde (25% solution in H2O) Sterilize by filtration
Trypanosome sleeping buffer TSB
1. 1000 mL pure water, pH 7.7 2. 0.37 g KCl 3. 4.68 g NaCl 4. 0.62 g MgSO4 5. 3.56 g Na2HPO4•2 H2O 6. 0.28 g NaH2PO4•1 H2O 7. 3.61 g 2-Deoxy-D-glucose Sterilize by filtration

Axel Hochstetter 105
12.3 MATLAB codes
12.3.1 Plotting Trajectories in 3D:
To plot the recorded trajectories in 3D, the MATLAB inherent method “plot3” was modified :
Figure; plot3(Xm,Ym,Ts,'color','black'); A=[Xm Ym Ts]; L=size(A,1); L2=(round(L/4)); L3=(round(L/2)); L4=(round(L•3/4)); for k=1:L2 hold on plot3(A(k,1),A(k,2),A(k,3),'marker','o','color',[0,0.8,(k/L2)]) end for k=L2:L3 plot3(A(k,1),A(k,2),A(k,3),'marker','o','color',[0,0.8•(1-(k/L3)),1]) end for k=L3:L4 plot3(A(k,1),A(k,2),A(k,3),'marker','o','color',[.8•(k/L4),0,1]) end for k=L4:L plot3(A(k,1),A(k,2),A(k,3),'marker','o','color',[.8,0,1-((k-L4)/(L2))]) end
Figure 12.2: This 3-D-trajectory exhibits the rotation of an optically trapped trypanosome. Each dot denotes the
position of the flagellar tip. This trajectory was recorded at 150 fps.

Axel Hochstetter 106
12.3.2 Mean squared displacement (MSD) script
The MSDs were calculated and plotted using the x- and y-positions of recorded trajectories
employing the following MATLAB script:
%% Data Input
Fs=(58.3); %Frequency of frames l = length(x); a=x'; b=y'; ts=1; te=l-1; %% x- MSD xd1=a(1:(end-1)); xd2=(diag(xd1')•hankel(ones(1,length(xd1))))'; xd3=hankel(a(2:end)); msdx=xd3-xd2; %% y-MSD yd1=b(1:(end-1)); yd2=(diag(yd1')•hankel(ones(1,length(yd1))))'; yd3=hankel(b(2:end)); msdy=yd3-yd2; %% total MSD meansd=(msdx.^2 + msdy.^2); factor = (size(meansd)):-1:1; msdav2 = ones(1,length(meansd))•(meansd'); msdav = msdav2./factor; msdav=msdav(1:te); %% Timescale incr=1/Fs; %your time increment time=0:incr:(size(msdav,2))-1; %% Fitting & Plotting Data te=0.9•te; %cutting off the 10% with least statistical significance; B=polyfit(log(time(ts:te)),log(msdav(ts:te)),1); loglog(time(ts:te),msdav(ts:te));
Figure 12.3: MSD of a random walker. The slope is approximately one.

Axel Hochstetter 107
13 References
1. Pfohl, T., Mugele, F., Seemann, R. & Herminghaus, S. Trends in microfluidics with complex fluids. Chemphyschem 4, 1291–8 (2003).
2. Stellamanns, E. Cell motility in microfluidic environments. Georg–August–Universität, Göttingen, Germany (2010). at <http://ediss.uni-goettingen.de/bitstream/handle/11858/00-1735-0000-0006-B548-9/stellamanns.pdf?sequence=1>
3. Kitano, H. Systems biology: a brief overview. Science (80-. ). 295, 1662–4 (2002). 4. Zheng, X. T. et al. On-chip investigation of cell-drug interactions. Adv. Drug Deliv. Rev. 65,
1556–74 (2013). 5. Shahapure, R., Driessen, R. P. C., Haurat, M. F., Albers, S.-V. & Dame, R. T. The
archaellum: a rotating type IV pilus. Mol. Microbiol. 91, 716–23 (2014). 6. Banusch, B. Motility and Surface Adsorption of Caulobacter Crescentus. 1–19 (2012). 7. Bardy, S. L. Prokaryotic motility structures. Microbiology 149, 295–304 (2003). 8. Langousis, G. & Hill, K. L. Motility and more: the flagellum of Trypanosoma brucei. Nat.
Rev. Microbiol. 12, 505–18 (2014). 9. Rottner, K. & Stradal, T. E. B. Actin dynamics and turnover in cell motility. Curr. Opin.
Cell Biol. 23, 569–78 (2011). 10. Ziebert, F. & Aranson, I. S. Modular approach for modeling cell motility. Eur. Phys. J. Spec.
Top. 223, 1265–1277 (2014). 11. Engstler, M. et al. Hydrodynamic flow-mediated protein sorting on the cell surface of
trypanosomes. Cell 131, 505–515 (2007). 12. Levi, A. & Jenal, U. Holdfast formation in motile swarmer cells optimizes surface
attachment during Caulobacter crescentus development. J. Bacteriol. 188, 5315–8 (2006). 13. Entcheva-Dimitrov, P. & Spormann, A. M. Dynamics and Control of Biofilms of the
Oligotrophic Bacterium Caulobacter crescentus. J. Bacteriol. 186, 8254–8266 (2004). 14. Ciccarelli, F. D. et al. Toward automatic reconstruction of a highly resolved tree of life.
Science 311, 1283–7 (2006). 15. Degeneraas, G. The kingdom of life, science hq. Ed. Rod Pierce. accessed: 2014–08–17
(2013). at <http://www.sciencehq.com/biology/kingdoms-life.html> 16. Lighthill, J. Flagellar hydrodynamics. SIAM Rev. 18, 161–230 (1976). 17. Maulucioni & Doridí. Phylogenetic-symbiogenetic tree of living organisms. accessed:
2014–10–25 (2013). at <http://en.wikipedia.org/wiki/Protist#mediaviewer/File:Tree_of_Living_Organisms_2.png>
18. Adl, S. M. et al. The new higher level classification of eukaryotes with emphasis on the taxonomy of protists. J. Eukaryot. Microbiol. 52, 399–451 (2005).
19. Dauptain, A., Favier, J. & Bottaro, A. Hydrodynamics of ciliary propulsion. J. Fluids Struct. 24, 1156–1165 (2008).
20. Ishikawa, T. Suspension biomechanics of swimming microbes. J. R. Soc. Interface 6, 815–34 (2009).
21. Bravo-Cordero, J. J., Magalhaes, M. a O., Eddy, R. J., Hodgson, L. & Condeelis, J. Functions of cofilin in cell locomotion and invasion. Nat. Rev. Mol. Cell Biol. 14, 405–15 (2013).
22. Melville, S. & Craig, L. Type IV pili in Gram-positive bacteria. Microbiol. Mol. Biol. Rev. 77, 323–41 (2013).
23. Biais, N., Ladoux, B., Higashi, D., So, M. & Sheetz, M. Cooperative retraction of bundled type IV pili enables nanonewton force generation. PLoS Biol. 6, e87:0907–13 (2008).
24. Curran, J. W. Gonorrhea and the Urethral Syndrome. Sex. Transm. Dis. 4, 119–121 (1977).

Axel Hochstetter 108
25. Einstein, A. Über die von der molekularkinetischen Theorie der Wärme geforderte Bewegung von in ruhenden Flüssigkeiten suspendierten Teilchen. Ann. d. Phys. 17, 549–560 (1905).
26. Przibram, K. Über die ungeordnete Bewegung niederer Tiere. Pflüger, Arch. für die Gesammte Physiol. des Menschen und der Thiere 153, 401–405 (1913).
27. Selmeczi, D. et al. Cell motility as random motion: A review. Eur. Phys. J. Spec. Top. 157, 1–15 (2008).
28. Seed, J. R., Baquero, M. A. & Duda, J. F. Inhibition of hexose and glycerol utilization by 2-deoxy-d-glucose in Trypanosoma gambiense and Trypanosoma rhodesiense. Exp. Parasitol. 16, 363–368 (1965).
29. Fenn, K. & Matthews, K. R. The cell biology of Trypanosoma brucei differentiation. Curr. Opin. Microbiol. 10, 539–46 (2007).
30. Matthews, K. R., Ellis, J. R. & Paterou, A. Molecular regulation of the life cycle of African trypanosomes. Trends Parasitol. 20, 40–47 (2004).
31. Bakker, B. M. et al. The silicon trypanosome. Parasitology 137, 1333–41 (2010). 32. Rusk, N. How parasites do it. Nat. Methods 2, 572–572 (2005). 33. Welburn, S., Picozzi, K., Fevre, E. & Coleman, P. Identification of human-infective
trypanosomes in animal reservoir of sleeping sickness in Uganda by means of serum-resistance-associated (SRA) gene. Lancet 358, 2017–2019 (2001).
34. Fèvre, E. M. et al. The origins of a new Trypanosoma brucei rhodesiense sleeping sickness outbreak in eastern Uganda. Lancet 358, 625–8 (2001).
35. Picozzi, K. et al. Sleeping sickness in Uganda: a thin line between two fatal diseases. BMJ 331, 1238–41 (2005).
36. Welburn, S., Fèvre, E. & Coleman, P. Sleeping sickness: a tale of two diseases. Trends Parasitol. 17, 19–24 (2001).
37. Welburn, S. C. et al. Crisis, what crisis? Control of Rhodesian sleeping sickness. Trends Parasitol. 22, 123–8 (2006).
38. Uppaluri, S. Unicellular parasite motility: a quantitative perspective. Georg–August–Universität, Göttingen, Germany (2011).
39. Koyfman, A. Y. et al. Structure of Trypanosoma brucei flagellum accounts for its bihelical motion. Proc. Natl. Acad. Sci. U. S. A. 108, 11105–8 (2011).
40. Uppaluri, S. et al. Impact of microscopic motility on the swimming behavior of parasites: straighter trypanosomes are more directional. PLoS Comput. Biol. 7, e1002058:1–8 (2011).
41. Li, G. et al. Surface contact stimulates the just-in-time deployment of bacterial adhesins. Mol. Microbiol. 83, 41–51 (2012).
42. Johnson, R. C. & Ely, B. Isolation of Sponatneously Derived Mutants of Caulobacter Crescentus. Genetics 86, 25–32 (1977).
43. Poindexter, J. S. Selection for Nonbuoyant Morphological Mutants of Caulobacter crescentus. J. Bacteriol. 135, 1141–1145 (1978).
44. Johnson, R. C. & Ely, B. Analysis of Nonmotile Mutants of the Dimorphic Bacterium Caulobacter crescentus. J. Bacteriol. 137, 627–634 (1979).
45. Skerker, J. M. & Laub, M. T. Cell-cycle progression and the generation of asymmetry in Caulobacter crescentus. Nat. Rev. Microbiol. 2, 325–37 (2004).
46. Li, G. & Tang, J. X. Low flagellar motor torque and high swimming efficiency of Caulobacter crescentus swarmer cells. Biophys. J. 91, 2726–34 (2006).
47. Gravesen, P., Branebjerg, J. & Jensen, O. S. Microfluidics - a review. J. Micromech. Microeng. 3, 168–182 (1993).
48. Atencia, J. & Beebe, D. J. Controlled microfluidic interfaces. Nature 437, 648–55 (2005). 49. Ashkin, a. Optical Levitation by Radiation Pressure. Appl. Phys. Lett. 19, 283–285 (1971). 50. Ashkin, A., Dziedzic, J. M., Bjorkholm, J. E. & Chu, S. Observation of a single-beam
gradient force optical trap for dielectric particles. 11, 288–290 (1986).

Axel Hochstetter 109
51. Galajda, P. & Ormos, P. Complex micromachines produced and driven by light. Appl. Phys. Lett. 78, 249 (2001).
52. Asavei, T. et al. Optical angular momentum transfer to microrotors fabricated by two-photon photopolymerization. New J. Phys. 11, 093021 (2009).
53. Marchington, R. F. Applications of Microfluidic Chips in Optical Manipulation & Photoporation. Library (Lond). University of St Andrews, St Andrews, Scottland (2010). at <http://hdl.handle.net/10023/1633>
54. Singer, W., Bernet, S. & Ritsch-Marte, M. 3D-Force Calibration of Optical Tweezers for Mechanical Stimulation of Surfactant-Releasing Lung Cells. Laser Phys. 11, 1217–1223 (2001).
55. Zhang, H. & Liu, K.-K. Optical tweezers for single cells. J. R. Soc. Interface 5, 671–90 (2008).
56. Chien, Y.-S., Lin, C.-H., Kao, F.-J. & Ko, C.-W. Micro-flow-cytometer integrated with optical tweezer and DIP technique for cell/particle sorting and manipulation. Nanosci. Technol. Pts 1 2 121-123, (2007).
57. Wang, M. M. et al. Microfluidic sorting of mammalian cells by optical force switching. Nat. Biotechnol. 23, 83–7 (2005).
58. Liu, Y. MT Striped Birefringence Pattern Formation and Application of Laser Tweezers in Microrheology , Bacterial Motility and Adhesion. Diss. Thesis Brown University, Providence, Rhode Island, USA (2009).
59. Van Mameren, J., Wuite, G. J. L. & Heller, I. in Single Mol. Anal. (Peterman, E. J. G. & Wuite, G. J. L.) 783, 1–20 (Humana Press, 2011).
60. Neuman, K. C. & Nagy, A. Single-molecule force spectroscopy: optical tweezers , magnetic tweezers and atomic force microscopy. Nat. Methods 5, 491–505 (2008).
61. Visscher, K., Gross, S. P. & Block, S. M. Construction of multiple-beam optical traps with nanometer-resolution position sensing. IEEE J. Sel. Top. Quantum Electron. 2, 1066–1076 (1996).
62. Batters, C. & Veigel, C. Single Molecule Enzymology. 778, 97–109 (2011). 63. Ahluwalia, B., Yuan, X. & Tao, S. Transfer of “pure” on-axis spin angular momentum to
the absorptive particle using self-imaged bottle beam optical tweezers system. Opt. Express 12, 5172–7 (2004).
64. Ambrosio, A., Marrucci, L., Borbone, F., Roviello, A. & Maddalena, P. Light-induced spiral mass transport in azo-polymer films under vortex-beam illumination. Nat. Commun. 3, 989 (2012).
65. Padgett, M. & Bowman, R. Tweezers with a twist. Nat. Photonics 5, 343–348 (2011). 66. Litvin, I. A., Dudley, A. & Forbes, A. Poynting vector and orbital angular momentum
density of superpositions of Bessel beams. Opt. Express 19, 16760–71 (2011). 67. Padgett, M. & Di Leonardo, R. Holographic optical tweezers and their relevance to lab on
chip devices. Lab Chip 11, 1196–205 (2011). 68. Hesseling, C., Woerdemann, M., Hermerschmidt, A. & Denz, C. Controlling ghost traps
in holographic optical tweezers. Opt. Lett. 36, 3657–9 (2011). 69. Farré, A. et al. Positional stability of holographic optical traps. Opt. Express 19, 21370–84
(2011). 70. Deshpande, S. Dynamics of Emerging Actin Networks. Diss. Thesis Universität Basel,
Basel, Switzerland (2013). 71. Schindelin, J. et al. Fiji: an open-source platform for biological-image analysis. Nat. Methods
9, 676–82 (2012). 72. Th, P., Ruttimann, U. E. & Unser, M. A Pyramid Approach to Subpixel Registration
Based on Intensity. IEEE Trans. Image Process. 7, 27–41 (1998). 73. Ramser, K. & Hanstorp, D. Optical manipulation for single-cell studies. J. Biophotonics 3,
187–206 (2010).
Axel Hochstetter 110
74. Li, G., Smith, C. S., Brun, Y. V & Tang, J. X. The Elastic Properties of the Caulobacter crescentus Adhesive Holdfast Are Dependent on Oligomers of N -Acetylglucosamine. 187, 257–265 (2005).
75. Ahmadi, G. Hydrodynamic forces. Pers. Commun. 1–11 (2005). 76. Hill, K. L. Parasites in motion: flagellum-driven cell motility in African trypanosomes.
Curr. Opin. Microbiol. 13, 459–65 (2010). 77. Heddergott, N. et al. Trypanosome motion represents an adaptation to the crowded
environment of the vertebrate bloodstream. PLoS Pathog. 8, e1003023:1–17 (2012). 78. Stellamanns, E. et al. Optical trapping reveals propulsion forces, power generation and
motility efficiency of the unicellular parasites Trypanosoma brucei brucei. Sci. Rep. 4, 6515:1–6515–7 (2014).
79. Tirado, M. M., Garcia, J. & Torre, D. Rotational dynamics of rigid, symmetric top macromolecules. Application to circular cylinders. J. Chem. Phys. 73, 1986–1993 (1980).
80. Meinhart, C. D., Wereley, S. T. & Santiago, J. G. PIV measurements of a microchannel flow. Exp. Fluids 27, 414–419 (1999).
81. Valentin, G. Ueber ein Entozoon im Blute von Salmo fario. Arch. für Anat. Physiol. und wissenschaftliche Med. 435–436 (1841).
82. Thielicke, W. & Stamhuis, E. J. PIVlab - Time-Resolved Digital Particle Image Velocimetry Tool for MATLAB (version: 1.35). at <http://dx.doi.org/10.6084/m9.figshare.1092508>
83. Rodríguez, J. A. et al. Propulsion of African trypanosomes is driven by bihelical waves with alternating chirality separated by kinks. Proc. Natl. Acad. Sci. 106, 19322–19327 (2009).
84. Park, S., Kim, D., Mitchell, R. J. & Kim, T. A microfluidic concentrator array for quantitative predation assays of predatory microbes. Lab Chip 11, 2916–23 (2011).
85. Galajda, P. et al. Funnel ratchets in biology at low Reynolds number: choanotaxis. J. Mod. Opt. 55, 3413–3422 (2008).
86. Mahmud, G. et al. Directing cell motions on micropatterned ratchets. Nat. Phys. 5, 606–612 (2009).
87. Elizabeth Hulme, S. et al. Using ratchets and sorters to fractionate motile cells of Escherichia coli by length. Lab Chip 8, 1888–95 (2008).
88. Beech, J. P., Holm, S. H., Adolfsson, K. & Tegenfeldt, J. O. Sorting cells by size, shape and deformability. Lab Chip 12, 1048–51 (2012).
89. Simarro, P. P., Jannin, J. & Cattand, P. Eliminating human African trypanosomiasis: where do we stand and what comes next? PLoS Med. 5, e55:0174–80 (2008).
90. Steinhauser, D., Köster, S. & Pfohl, T. Mobility Gradient Induces Cross-Streamline Migration of Semiflexible Polymers. ACS Macro Lett. 1, 541–545 (2012).
91. Neu�i, P., Giselbrecht, S., Länge, K., Huang, T. J. & Manz, A. Revisiting lab-on-a-chip technology for drug discovery. Nat. Rev. Drug Discov. 11, 620–32 (2012).
92. Canavaci, A. M. C. et al. In vitro and in vivo high-throughput assays for the testing of anti-Trypanosoma cruzi compounds. PLoS Negl. Trop. Dis. 4, e87:0907–13 (2010).
93. Van Reet, N., Pyana, P., Rogé, S., Claes, F. & Büscher, P. Luminescent multiplex viability assay for Trypanosoma brucei gambiense. Parasit. Vectors 6, 207 (2013).
94. De Rycker, M. et al. A static-cidal assay for Trypanosoma brucei to aid hit prioritisation for progression into drug discovery programmes. PLoS Negl. Trop. Dis. 6, e1932:1–7 (2012).
95. Yin, H. & Marshall, D. Microfluidics for single cell analysis. Curr. Opin. Biotechnol. 23, 110–9 (2012).
96. Brouzes, E. et al. Droplet microfluidic technology for single-cell high-throughput screening. Proc. Natl. Acad. Sci. U. S. A. 106, 14195–200 (2009).
97. Junkin, M. & Tay, S. Microfluidic single-cell analysis for systems immunology. Lab Chip 14, 1246–60 (2014).
98. Engstler, M. et al. in Nature-inspired Fluid Mech. (Tropea, C. & Bleckmann, H.) 43–61 (2012).

Axel Hochstetter 111
99. Min, T. L. et al. High-resolution, long-term characterization of bacterial motility using optical tweezers. Nat. Methods 6, 831–5 (2009).
100. Groisman, A. et al. A microfluidic chemostat for experiments with bacterial and yeast cells. Nat. Methods 2, 685–689 (2005).
101. Hsieh, C.-C., Huang, S.-B., Wu, P.-C., Shieh, D.-B. & Lee, G.-B. A microfluidic cell culture platform for real-time cellular imaging. Biomed. Microdevices 11, 903–13 (2009).
102. Ryan, D., Ren, K. & Wu, H. Single-cell assays. Biomicrofluidics 5, 21501–1 – 21501–9 (2011).
103. Wang, D. & Bodovitz, S. Single cell analysis: the new frontier in “omics”. Trends Biotechnol. 28, 281–90 (2010).
104. Asphahani, F. et al. Single-cell bioelectrical impedance platform for monitoring cellular response to drug treatment. Phys. Biol. 8, 015006 (2011).
105. Brun, R., Blum, J., Chappuis, F. & Burri, C. Human African trypanosomiasis. Lancet 375, 148–59 (2010).
106. Overath, P. & Engstler, M. Endocytosis, membrane recycling and sorting of GPI-anchored proteins: Trypanosoma brucei as a model system. Mol. Microbiol. 53, 735–44 (2004).
107. Mackey, Z. B. et al. Discovery of trypanocidal compounds by whole cell HTS of Trypanosoma brucei. Chem. Biol. Drug Des. 67, 355–63 (2006).
108. Myburgh, E. et al. In vivo imaging of trypanosome-brain interactions and development of a rapid screening test for drugs against CNS stage trypanosomiasis. PLoS Negl. Trop. Dis. 7, e2384:1–12 (2013).
109. Deshpande, S. & Pfohl, T. Hierarchical self-assembly of actin in micro-confinements using microfluidics. Biomicrofluidics 6, 34120 (2012).
110. Chao, Y. & Zhang, T. Optimization of fixation methods for observation of bacterial cell morphology and surface ultrastructures by atomic force microscopy. Appl. Microbiol. Biotechnol. 92, 381–92 (2011).
111. Moloney, M., McDonnell, L. & O’Shea, H. Atomic force microscopy of BHK-21 cells: an investigation of cell fixation techniques. Ultramicroscopy 100, 153–61 (2004).
112. Han, Y. et al. Brownian motion of an ellipsoid. Science 314, 626–30 (2006). 113. Lamour, N. et al. Proline metabolism in procyclic Trypanosoma brucei is down-regulated
in the presence of glucose. J. Biol. Chem. 280, 11902–10 (2005). 114. Parsons, M. & Nielsen, B. Active transport of 2-deoxy-D-glucose in Trypanosoma brucei
procyclic forms. Mol. Biochem. Parasitol. 42, 197–203 (1990). 115. Legros, D. et al. Treatment of human African trypanosomiasis — present situation and
needs for research and development. Lancet 2, 437–440 (2002). 116. Nok, A. J. Arsenicals (melarsoprol), pentamidine and suramin in the treatment of human
African trypanosomiasis. Parasitol. Res. 90, 71–9 (2003). 117. Fairlamb, A. H. Chemotherapy of human African trypanosomiasis: current and future
prospects. Trends Parasitol. 19, 488–494 (2003). 118. Vansterkenburg, E. L. M. et al. The uptake of the trypanocidal drug suramin in
combination with low-density lipoproteins by Trypanosoma brucei and its possible mode of action. Acta Trop. 54, 237–250 (1993).
119. Alsford, S., Field, M. C. & Horn, D. Receptor-mediated endocytosis for drug delivery in African trypanosomes: fulfilling Paul Ehrlich’s vision of chemotherapy. Trends Parasitol. 29, 207–12 (2013).
120. Hughes, L. C., Ralston, K. S., Hill, K. L. & Zhou, Z. H. Three-dimensional structure of the Trypanosome flagellum suggests that the paraflagellar rod functions as a biomechanical spring. PLoS One 7, e25700:1–10 (2012).
121. Hughes, V. & Jiang, C. Quick guide Caulobacter crescentus. Curr. Biol. 22, R507–R509

Axel Hochstetter 112
Curriculum Vitae ..
Personal Information
Name Axel Hochstetter Date of birth 9 October 1985 Place of birth Aalen, Germany Nationality German Current address Lothringerplatz 2, 4056 Basel, Switzerland
Education and Employment history
2010 - 2014 PhD in Biophysics University of Basel, Switzerland
2005 - 2010 Diploma in Chemistry Ulm University, Germany 2004 - 2005 Military Service 9. / Transport Battalion 10 Ellwangen (Jagst), Germany 30.06.2004 Abitur Parler Gymnasium Schwäbisch Gmünd, Germany

Axel Hochstetter 113
Publications, Meetings & Awards .
Selected Publications
Hochstetter, A., Stellamanns, E., Deshpande, S., Uppaluri, S., Engstler, M. & Pfohl, T. Microfluidics-based single cell analysis revelas drug-dependent motility changes in trypanosomes. Submitted (2014). Stellamanns, E., Uppaluri, S., Hochstetter, A., Heddergott, N., Engstler, M. & Pfohl, T. Optical trapping reveals propulsion forces, power generation and motility efficiency of the unicellular parasites Trypanosoma brucei brucei. Sci. Rep. 4, 6515:1–6515–7 (2014). Hochstetter, A., Stellamanns, E., Uppaluri, S., Heddergott, N., Engstler, M. & Pfohl, T. Tracing the microscopic motility of unicellular parasites. Eur. Biophys. J. 42 Suppl 1, S35-235 (2013).
Selected Meetings
2014 Deutsche Physikalische Gesellschaftstagung, Dresden, Germany (Poster)
2014 WiBioSE, Arandjelovac, Serbia (Talk)
2013 European Biophysical Societies Assosiation, Lisbon, Portugal (Talk + Grant)
2013 SmBioSE, Sheffield, UK, (Talk and Poster)
2013 Deutsche Physikalische Gesellschaftstagung, Regensburg, Germany (Talk)
2013 Swiss Soft Days X, PSI Villingen, Switzerland (Talk)
2013 Swiss Snow Sympoisum, Saas Fee, Switzerland (Talk + Prize)
2013 Rigiworkshop Akademie der Naturwissenshaften, Rigi-Kulm, Switzerland (Poster)
2012 Swiss Soft Days IX, Lausanne, Switzerland (Poster)
2012 SymBioSE, Szeged & Gödölö, Hungary (Talk, Workshop and Poster)
2012 Swiss Soft Days VIII, Geneva, Switzerland (Poster + Prize)
2011 European Biophysical Societies Assosiation, Budapest, Hungary (Poster)
Awards
Poster Prize (by Givaudan Schweiz AG, at the Swiss Soft Days VIII 2012 in Geneva)
Best Oral Presentation (by Actelion, at the Swiss Snow Symposium 2013 in Saas-Fee)
Travel Grant : Nachwuchs Reisefonds (by the University of Basel for partitipation in
EBSA 2013 in Lisbon)

Axel Hochstetter 114
14 Thanks and Acknowledgments
While a dissertation thesis is the product of a single person, it is the effort of more than just that
one person. Without support from others, so I believe, no one can nowadays manage to create
such a piece of work (and art) as it has to be to pass the examination. So, at first, I want to shout
out a great THANK YOU to my parents, Waltraud und Jochen, who made it possible for me to
walk this path I chose in my life; to Steffi, Janice, Kai & Yvonne, to Oma, my family and friends,
thank you all for being (in) my life!
Thomas, I am so very grateful that you granted me this amazing chance to do research with you
and in your group. You literally gave me carte blanch, introduced me to curiosity-driven research
and let me find my way. You really empowered me to find my way, my style to experiment, learn,
teach, write and to present my findings. You actually let me hereby show everyone that I am able
to conduct scientific research myself. For me, you were the perfect boss and supervisor, by never
tell me which way I had to go, yet you were always there for me to give me advice show me
alternatives and even made me defend my ideas and setups. On top of that huge pile, you are also
a collegial, social person who knows how to handle a group and how to enjoy a good after-work
drink...yet, somehow, that one rum Benni promised never came around, did it ?
Raphael, my Götti, you showed me around in Basel, Switzerland and even the Mensa =). Believe
it or not, but you defined "swiss guy" for me: always helpful, a talent in organizing, always on
time, friendly, but also sometimes a bit reserved and grumpy if tired. I will never forget how you
missed Adriana in Budapest. Or our literally breath-taking hostel in Budapest. All the dust, and
mold both in the washing machine and fridge. The electrical cord running along the bath-tub... I
still am gratefull we made it out of there alive, you, me and Siddharth.
Siddharth, also called, Sweet-heart, Siddhu, "turkish pimp" or now: Dr. of Panda-nation. I always
awed your knowledge of Beatles and books, your escapistic love for books, films and Audrey
Hepburn. By bringing your food to our parties at Thomas place and our hikes, you sparked the
flame that now burns as afire for indian food, both in my heart and - occasionally - in my throat.
I still know your recipe for green curry and make good use of it (along with the about two
kilograms of eye- and mouth-watering spices you left me).
Nora, you took Siddharth's place in the office and you took to the task of rebuilding and
improving "Eric". Always, you come up with a smile and always se the good side of anything.
Natalja, you are a charming and modest person. You were as eager to learn german as you were
to teach me russian. ������� ������! By joining me in "my" office you made work so
much more fun. In our group you found friends and even love, right, Michi? =). It was so much
fun to see you two find together, even though you fought in the beginning like cats and dogs.

Axel Hochstetter 115
Cora, you are an inspiring person, always helpful, friendly and with an incredible treasure of
experience. It is always a pleasure and an honour to work with you. I am thankful beyond words
for your input on scientific writing and I hope we will have some more future projects =).
Zoe Swank, you charming, warm-hearted girl. It was really fun to work and discuss with you.
Michael, tell me, how is it working only one and a half days per week? Just kidding ;)
Liebetanz, you were my first "student", one of many in all the years. Teaching was a very
rewarding experience that I was happy to make a lot of times over the last years. From all of my
students, very special thanks go to Benjamin Banusch, who not only joined our (and Urs Jenal's)
group for almost half a year, but who also assisted me greatly in calibrating the optical trap and
basically carried out all the experiments with caulobacter and was drawing the nice Figures. And
he - had just as whacky working times as I had during the weekends =).
I also wish to thank all my other students, Joel, Serena, Laura, Reto, Cedric, SM & SM and all the
others.
And my friends here in Basel: Silvia, Angi, Flo, Andi, Franzi, Selma, Timo, Urs, Daniel, Peiling &
Martin,... you made my life here so much more colorful.
Special thanks go to the Swiss tropical and Public Health Institute in Basel for their support, their
gift of Trypanosomes after the -80 °C fridge malfunctioned and thawed, as well as to the many
friends I could make there.
...and a special "Thank you!" goes to the Bands Sabaton, Van Canto, Manowar, Blind Guardian
and to Lindsey Sterling and Alex "ASP" Spreng (and many more...) for their unbreaking moral
support during the long shifts of coding, composing Figures and writing the texts, from their first
points to the final version. You guys and girls created acoustic miracles that make endorphins
dance tango and waltz with adrenalin in my blood, letting me push on and on and on.
And finally; my heart, my beloved Steffi. Your copious amounts of love, support and friendship
empowered me, whenever I needed a boost of energy, motivation or just another point of view.
You did more than just help me, you changed me. You made me a more understanding,
compassionate, trusting and - hardly imaginable - a more relaxed person. Whether we danced
together on Peiling and Martins wedding, or took the transsiberian railway for a week and
9288 km, or realized, that there are different ways to communicate, we had fun, and we came a
long way :). You also helped me understand the differences between the journalistic way to write
(to which I still am accustomed) and the scientific way, that I still have to learn loads about. And
also, for your never fading understanding for the very egoistic needs, that arise during the hot-
time of a PhD.
Thank You !