Development of adherence metrics for caloric restriction interventions
Upload
independentCategory
view
0download
0
Effects of restriction of fetal jaw movement on prenataldevelopment of the temporalis muscle
Esrat Jahan a,b, Akihiro Matsumoto a, Jun Udagawa a, Ashiq Mahmood Rafiq a,b,Ryuju Hashimoto a, Omar Ibna Faizur Rahman c, Hasina Habib b,c,Joji Sekine b, Hiroki Otani a,*aDepartment of Developmental Biology, Faculty of Medicine, Shimane University, 89-1 Enya-cho, Izumoshi, Shimane 693-8501, JapanbDepartment of Oral & Maxillofacial Surgery, Faculty of Medicine, Shimane University, 89-1 Enya-cho, Izumoshi, Shimane 693-8501, JapancYamagata Dhaka Friendship Hospital, Lalmatia, Dhaka, Bangladesh
a r c h i v e s o f o r a l b i o l o g y 5 5 ( 2 0 1 0 ) 9 1 9 – 9 2 7
a r t i c l e i n f o
Article history:
Accepted 27 July 2010
Keywords:
Temporalis muscle
exo utero
Mechanical stress
Fetal jaw movement
Mouse
a b s t r a c t
Jaw movement affects masticatory muscles during the postnatal period. Prenatal jaw
movement has also been implicated in the development of the temporomandibular joint;
however, its effect on prenatal development of the masticatory muscles has not been
extensively analysed. In the present study, we examined the effects of the restriction of
fetal jaw movement on the temporalis muscle, a major masticatory muscle, in mice by
suturing the maxilla and mandible (sutured group) using an exo utero development system.
We compared the morphology of the temporalis muscle between sutured, sham-operated
and normal in utero groups. At embryonic day (E) 18.5, the volume of muscle fibres, but not
that of connective tissue, in the temporalis muscle was decreased in the sutured group. The
E18.5 temporalis muscle in the sutured group appeared morphologically similar to that of
the E17.5 in utero group, except for frequent muscle fibre irregularities. By transmission
electron microscopy, in the sutured group, the myofibrils were immature and scattered, the
nuclei appeared comparatively immature, the mitochondria were expanded in volume with
fewer cristae, and cytoplasmic inclusion bodies were frequently observed. Expression of
Myf-6, a late myogenic transcription factor, by real-time RT-PCR was not significantly
different between the sutured and sham-operated groups. These findings demonstrated
approximately 1-day delay in the morphological development of the temporalis muscle in
the sutured group, and some abnormalities were observed, although Myf-6 level was not
affected in the sutured group. The present study revealed that the prenatal jaw movement
influences the development of the temporalis muscle.
# 2010 Elsevier Ltd. All rights reserved.
avai lab le at www.sc iencedi rec t .com
journal homepage: http://www.elsevier.com/locate/aob
1. Introduction
The temporalis muscle is one of the three main jaw-closing
muscles (masseter, temporalis, medial pterygoid muscles).1
The combination of its broad origin on the temporal fossa and
the inner surface of the temporal fascia and its limited
insertion on the anterior border and medial surface of the
* Corresponding author. Tel.: +81 853 20 2102; fax: +81 853 20 2100.E-mail address: [email protected] (H. Otani).
0003–9969/$ – see front matter # 2010 Elsevier Ltd. All rights reservedoi:10.1016/j.archoralbio.2010.07.010
coronoid process allows differential activation and variation
in the line of action.2,3 The influence of masticatory functions
of the masticatory muscles on craniofacial and dentofacial
growth has been investigated widely.3–5 Mechanical strain
regulates cell proliferation, differentiation and maturation,6
all of which are related to growth and development, therefore,
masticatory activity and jaw movement is thought to be
d.
a r c h i v e s o f o r a l b i o l o g y 5 5 ( 2 0 1 0 ) 9 1 9 – 9 2 7920
related to the morphology of the jaw and jaw-related muscles.
It has been reported in adults that the jaw movement is
responsible for changes in both the volume of masticatory
muscles (masseter, medial and lateral pterygoid)7 as well as
length (masseter),8 as determined by direct measurements of
muscle and jaw movements. We previously reported that
prenatal jaw movement is an important mechanical factor in
the development of the mandibular condyle and articular
disc.9,10 Myogenesis begins when cells acquire myogenic
potential prior migration to muscle-forming regions. There
are four myogenic regulatory factors (MRFs)—namely, MyoD1,
Myf-5, myogenin, and MRF4/herculin/Myf-6, all of which have
been certified to convert non-muscle cells into myoblasts.11–14
It has also been reported that the expression of MyoD1 (palatal
muscle),15 MyoD, myogenin, and Myf-5 (masseter and tongue
muscle)16,17 mRNAs increased with development up to birth
(from embryonic day (E) 10 to 11 to birth).
The masticatory muscle is known to have several unique
developmental characteristics as compared with other skeletal
muscles, such as trunk and limb muscles (reviewed in Ref. 16).
First, myoblasts of the masticatory muscles originate from non-
somitic paraxial head mesoderm,18 whereas myoblasts of the
trunk and limb muscles are derived from somatic mesoderm.19
Second, Pax3/Myf-5 homozygous mutant mice induce MyoD in
the masticatory muscles as well as in the other craniofacial
muscles, but in the trunk and limb muscles, they fail to induce
MyoD and therefore do not generate trunk and limb muscles.20
Third, adult human and murine masseter muscles contain the
neonatal isoforms of the myosin heavy chain,21,22 and delayed
MyoD family expression correlates with the delayed embryonic
development of the mouse masseter muscle.16 Despite these
unique biochemical and molecular characteristics of the
developing masticatory muscles, prenatal development of the
temporalis muscle has not been morphologically analysed in
detail, and changes in the muscle related to the prenatal jaw
movement have not yet been examined.
In the present study, to elucidate the development of the
temporalis muscle related with the jaw movement, we
examined the effects of prenatal jaw movement restriction
on the temporalis muscle development.
2. Materials and methods
2.1. Animals
Jcl:ICR female mice aged 8–20 weeks (CLEA, Tokyo, Japan) were
used and maintained at the Institute of Experimental Animals
of Shimane University, Faculty of Medicine. This study was
approved by the Ethical Committee for Animal Research of
Shimane University, and all experimental procedures were
performed according to the institutional guidelines. We use
different embryos from different dams in each and every
experiment.
2.2. Exo utero surgery
A female mouse was housed with a male overnight, and noon
of the day when the vaginal plug was found was designated as
the E0.5. For exo utero surgery, the procedure followed as
described previously.9,10,23–26 Briefly, at E15.5, the pregnant
dams were anaesthetised with 50 mg/kg body weight (BW) of
pentobarbital (Somnopentyl, Kyoritsu Seiyaku, Tokyo, Japan).
The abdominal wall was incised at the mid-line, and then a
longitudinal incision was made along the uterine wall on the
side opposite to the entrance of the uterine artery and the site
of the placenta. This exposed the fetuses covered by the
embryonic membrane. The mandible and maxilla of the
embryos were fixed using an 8–0 nylon suture (Fig. 1 in Ref. 9)
and they were designated as the sutured group. We also
performed a sham operation by passing the needle from the
mandible through the maxilla of some embryos without
creating a knot and defined them as the sham-operated group.
After the operation, the embryos were placed back in the
abdominal cavity of the dam and were allowed to develop exo
utero till E18.5.
We confirmed that the jaw movements of the embryos
were restricted. Briefly, at E15.5 we observed the embryonic
jaw movement clearly by the naked eye and more clearly by an
operation microscope. When we restricted the jaw movement
by suturing the maxilla and mandible over the amniotic
membrane, we checked very carefully whether the knot was
tight or loose. After confirming that the knot was tight, the
sutured embryos were placed back in the abdominal cavity
and left there for exo utero development. When we opened the
abdominal cavity of the dam at E18.5, we checked whether
the knot at the jaw of the embryo was tight or loose under the
operation microscope. If it was tight, we stimulated the
embryo very carefully to observe whether it moved its jaw or
not. When it did not move its jaw, we considered it a
successfully sutured embryo.
We prepared E18.5 and E17.5 in utero developed control
embryos to confirm that the exo utero experience itself did not
influence muscle development.
2.3. Tissue preparation for histological examination
At E18.5 and E17.5, the dams (n = 5) were sacrificed by cervical
dislocation under anaesthesia with pentobarbital. The embryos
(n = 5, one from each dam) were obtained, and their BW and
crown rump length (CRL) were measured. The heads, including
the temporomandibular joint (TMJ), were fixed in Bouin’s
solution (75 ml of saturated picric acid, 25 ml of formalin and
5 ml of glacial acetic acid) for 48–72 h at room temperature for
the histological analysis. The samples were dehydrated in a
graded series of alcohol and embedded in paraffin, and 5 mm-
thick serial sagittal sections were made and stained with
hematoxylin and eosin (HE). These sections were used for the
histological examination and morphometric analysis.
2.4. Computerised histomorphometric analysis oftemporalis muscle
For the morphometric study of the temporalis muscle in the
E18.5 in utero control (n = 5), E18.5 sham-operated (n = 5), E18.5
sutured (n = 5), and E17.5 in utero control (n = 3) groups, the
volume of the temporalis muscle was calculated from the HE
stained serial sections of the embryo’s head containing the
temporalis muscle. The initial section was determined in
which the temporalis muscle first appeared, and this section
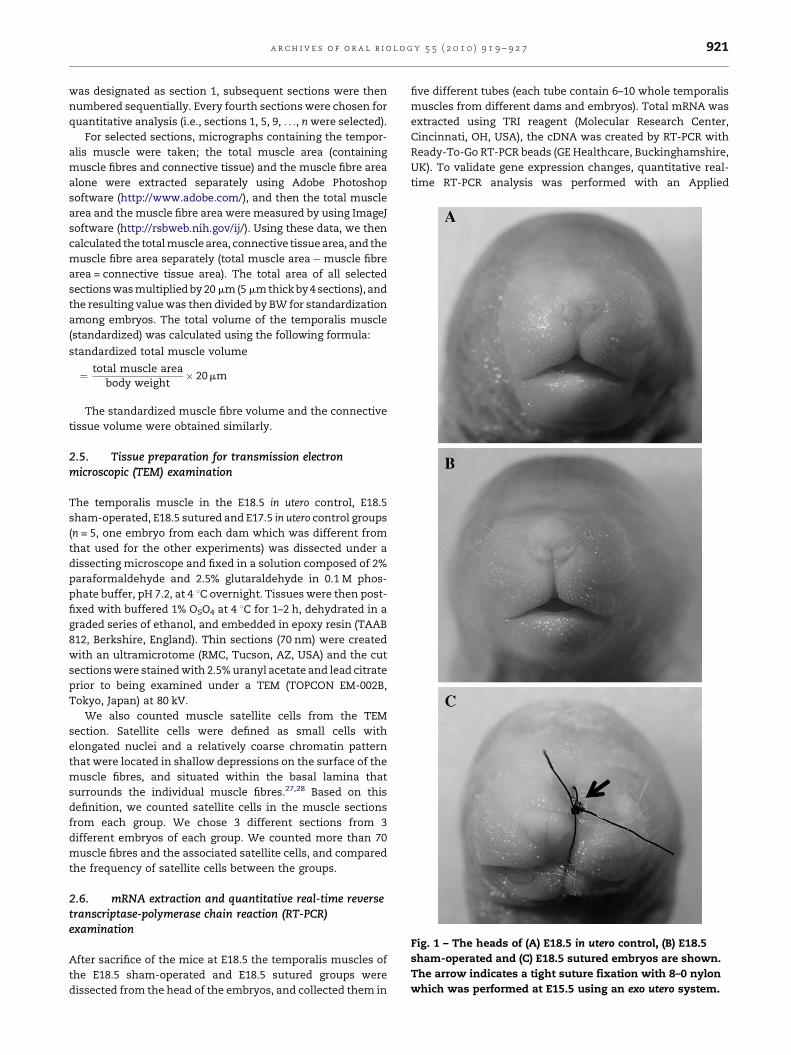
Fig. 1 – The heads of (A) E18.5 in utero control, (B) E18.5
sham-operated and (C) E18.5 sutured embryos are shown.
The arrow indicates a tight suture fixation with 8–0 nylon
which was performed at E15.5 using an exo utero system.
a r c h i v e s o f o r a l b i o l o g y 5 5 ( 2 0 1 0 ) 9 1 9 – 9 2 7 921
was designated as section 1, subsequent sections were then
numbered sequentially. Every fourth sections were chosen for
quantitative analysis (i.e., sections 1, 5, 9, . . ., n were selected).
For selected sections, micrographs containing the tempor-
alis muscle were taken; the total muscle area (containing
muscle fibres and connective tissue) and the muscle fibre area
alone were extracted separately using Adobe Photoshop
software (http://www.adobe.com/), and then the total muscle
area and the muscle fibre area were measured by using ImageJ
software (http://rsbweb.nih.gov/ij/). Using these data, we then
calculated the total muscle area, connective tissue area, and the
muscle fibre area separately (total muscle area�muscle fibre
area = connective tissue area). The total area of all selected
sections was multiplied by 20 mm (5 mm thick by 4 sections), and
the resulting value was then divided by BW for standardization
among embryos. The total volume of the temporalis muscle
(standardized) was calculated using the following formula:
standardized total muscle volume
¼ total muscle areabody weight
� 20 mm
The standardized muscle fibre volume and the connective
tissue volume were obtained similarly.
2.5. Tissue preparation for transmission electronmicroscopic (TEM) examination
The temporalis muscle in the E18.5 in utero control, E18.5
sham-operated, E18.5 sutured and E17.5 in utero control groups
(n = 5, one embryo from each dam which was different from
that used for the other experiments) was dissected under a
dissecting microscope and fixed in a solution composed of 2%
paraformaldehyde and 2.5% glutaraldehyde in 0.1 M phos-
phate buffer, pH 7.2, at 4 8C overnight. Tissues were then post-
fixed with buffered 1% OSO4 at 4 8C for 1–2 h, dehydrated in a
graded series of ethanol, and embedded in epoxy resin (TAAB
812, Berkshire, England). Thin sections (70 nm) were created
with an ultramicrotome (RMC, Tucson, AZ, USA) and the cut
sections were stained with 2.5% uranyl acetate and lead citrate
prior to being examined under a TEM (TOPCON EM-002B,
Tokyo, Japan) at 80 kV.
We also counted muscle satellite cells from the TEM
section. Satellite cells were defined as small cells with
elongated nuclei and a relatively coarse chromatin pattern
that were located in shallow depressions on the surface of the
muscle fibres, and situated within the basal lamina that
surrounds the individual muscle fibres.27,28 Based on this
definition, we counted satellite cells in the muscle sections
from each group. We chose 3 different sections from 3
different embryos of each group. We counted more than 70
muscle fibres and the associated satellite cells, and compared
the frequency of satellite cells between the groups.
2.6. mRNA extraction and quantitative real-time reversetranscriptase-polymerase chain reaction (RT-PCR)examination
After sacrifice of the mice at E18.5 the temporalis muscles of
the E18.5 sham-operated and E18.5 sutured groups were
dissected from the head of the embryos, and collected them in
five different tubes (each tube contain 6–10 whole temporalis
muscles from different dams and embryos). Total mRNA was
extracted using TRI reagent (Molecular Research Center,
Cincinnati, OH, USA), the cDNA was created by RT-PCR with
Ready-To-Go RT-PCR beads (GE Healthcare, Buckinghamshire,
UK). To validate gene expression changes, quantitative real-
time RT-PCR analysis was performed with an Applied[(Fig._1)TD$FIG]

a r c h i v e s o f o r a l b i o l o g y 5 5 ( 2 0 1 0 ) 9 1 9 – 9 2 7922
Biosystems Prism 7000HT Sequence Detection System using
the TaqMan1 Gene Expression PCR master mix according to
the manufacturer’s specifications (Applied Biosystems Inc.,
Foster City, CA, USA) for the Myf-6 gene, for which validated
TaqMan Gene Expression Assays are available. The TaqMan
probes and primers for Myf-6 (assay identification number
Mm00435126_m1) and, b-actin (assay identification number
Mm00607939_s1) were assay-on-demand gene expression
products (Applied Biosystems). The mouse b-actin gene was
used as an endogenous control. The gene-specific probes were
labelled by using the reporter dye FAMTM at the 50 end, and a
nonfluorescent quencher was used at the 30 end of the probe.
The thermal cycler conditions were as follows: hold for 10 min
at 95 8C, followed by two-step PCR for 40 cycles of 95 8C for 15 s
followed by 60 8C for 1 min. All experiments were performed in[(Fig._2)TD$FIG]
Fig. 2 – Representative histological sections of the HE staining. T
and E18.5 sham-operated (B) groups were thicker, straight, cond
of the E18.5 sutured group at E18.5 were thin, curly or wavy, less
extracellular space. (D) Similar findings to those in (C) were als
magnification, the curly and wavy muscle fibres (black arrow he
(G), whereas these curly and wavy fibres were not observed in
quardruplicate. Amplification data were analysed using an
Applied Biosystems Prism Sequence Detection Software
version 1.1 (Applied Biosystems). When the efficiency of the
target gene amplification and the efficiency of b-actin
amplification were approximately equal, as verified by
determination of the absolute value (less than 0.1) of the
slope of the log input amount versus DCT, the DDCT method
recommended by the manufacturer was used to compare the
relative expression levels of the E18.5 sutured and control
groups using endogenous control b-actin as the standard.
2.7. Statistical analysis
We applied an analysis of variance (ANOVA) to compare the
groups. All data in this study are presented as mean � stan-
he temporalis muscle fibres of the E18.5 in utero control (A)
ensed and arranged in bundles, while (C) the muscle fibres
condensed and arranged in a scattered manner with more
o observed in the E17.5 in utero control group. At higher
ads) were more clearly observed in the E18.5 sutured group
the E17.5 in utero control group (H). (Scale bars = 100 mm.)

[(Fig._3)TD$FIG]
Fig. 3 – Comparison of the total muscle volume, muscle
fibre volume, and connective tissue volume of the E18.5 in
utero control, E18.5 sham-operated, E18.5 sutured and
E17.5 in utero control groups. No significant differences
were observed between the E18.5 in utero control and E18.5
sham-operated groups, but the muscle fibre volume was
significantly higher in these groups than in the E17.5 in
utero control group. On day E18.5, both the total muscle
volume and the muscle fibre volume, but not the
connective tissue volume, were significantly lower in the
E18.5 sutured group than in the E18.5 in utero control or
E18.5 sham-operated groups. *p < 0.05, **p < 0.01.
a r c h i v e s o f o r a l b i o l o g y 5 5 ( 2 0 1 0 ) 9 1 9 – 9 2 7 923
standard deviation. In this study, significant variance between
groups was detected. A p-value of less than 0.05 was
considered to indicate statistical significance.
3. Results
Using the exo utero surgery as described in Section 2, we
obtained a reliable restriction of jaw movement in mouse
embryos (Fig. 1C), as previously reported.9,10 Also as reported
in our previous studies,9,10,29 this type of surgical procedures
caused no general growth retardation, and neither the CRL nor
the BW of the E18.5 sutured embryos was significantly
different from those of the E18.5 sham-operated animals, or
those of the E18.5 in utero control group (data not shown).
3.1. Histological observation of the temporalis muscle
The HE staining of the histological section of the temporalis
muscle at E18.5 revealed that in the in utero control (Fig. 2A)
and the E18.5 sham-operated (Fig. 2B) groups, the muscle
fibres were generally thick, straight, and homogenous, and
the muscle fibres were arranged in groups or bundles, while in
the E18.5 sutured group the muscle fibres were thin and not
straight (i.e., curly or wavy), and muscle fibres pattern
appeared scattered (Fig. 2C). Higher magnification of the
E18.5 in utero control (Fig. 2E) and E18.5 sham-operated (Fig. 2F)
groups revealed, spindle-shaped nuclei that were peripher-
ally placed, while in the E18.5 sutured group (Fig. 2G), the
nuclei were large and round, and were generally centrally
situated. When we observed the temporalis muscle of the
E17.5 in utero control group (Fig. 2D and H), the developmental
characteristics of the muscle fibres were generally similar to
those of the E18.5 sutured group (Fig. 2C and G), i.e., with a
thin, centrally situated, large and round nucleus, with more
extracellular space, and not arranged in bundles. However,
curly and/or wavy muscle fibres were frequently observed in
the E18.5 sutured muscles, whereas all muscle fibres of the
E17.5 in utero control group were straight (Fig. 2C and G vs. D
and H).
3.2. Histomorphometric analysis of the temporalis muscle
To quantitatively analyse changes in the temporalis muscle,
the muscle volume was measured. There were no significant
differences in the total muscle volume, the muscle fibre
volume and the connective tissue volume between the E18.5 in
utero control and the E18.5 sham-operated groups (Fig. 3). In
the E18.5 in utero control and E18.5 sham-operated groups, the
muscle fibre volume was significantly increased compared to
that in the E17.5 in utero control group. At 3 days after the
operation (E18.5), the volume of the temporalis muscle from
E18.5 sutured embryos was significantly different from that of
the E18.5 in utero control and the E18.5 sham-operated
embryos, as determined by repeated measures ANOVA. The
total volume of the temporalis muscle (Fig. 3, p < 0.05) and the
muscle fibre volume (Fig. 3, p < 0.01) were significantly smaller
in the E18.5 sutured group than in the E18.5 in utero control and
E18.5 sham-operated groups. On the other hand, there was no
significant difference in the volume of the connective tissue of
the E18.5 in utero control, E18.5 sham-operated and E18.5
sutured groups (Fig. 3). The reduced volume of the temporalis
muscle in the E18.5 sutured group further supported that the
jaw movement affected the development of the temporalis
muscle.
3.3. TEM analysis of the muscle fibre
The temporalis muscle was examined by TEM to evaluate the
maturity of the muscle fibres at the subcellular level. As can be
seen in the representative images shown in Fig. 4, in the cross
sections the muscle fibres exhibited a bundle-like arrange-
ment with fewer fibroblasts between them, and myofibril
density was generally high in the E18.5 in utero control and
E18.5 sham-operated groups (Fig. 4A and B). Most of the muscle
fibre characteristics were similar between the two groups;
however, in the E18.5 sutured group, the muscle fibres were
arranged more sparsely, with a larger number of fibroblasts
between them, and the myofibril density was generally low
(Fig. 4G). In the E17.5 in utero control group, the muscle fibres
were arranged more sparsely, the muscle fibres were less
mature, and there were fewer myofibrils and more extracel-
lular gaps (Fig. 4F). The muscle fibre characteristics of the E17.5
in utero control group were similar to those of the E18.5 sutured
group, but in the E18.5 sutured group there were some
abnormalities. In the longitudinal sections the muscle fibres
again appeared more mature, with more myofibrils in the
E18.5 in utero control (data not shown) and E18.5 sham-
operated group (Fig. 4C), while in the E18.5 sutured group, the
muscle fibres were less mature and had fewer myofibrils

[(Fig._4)TD$FIG]
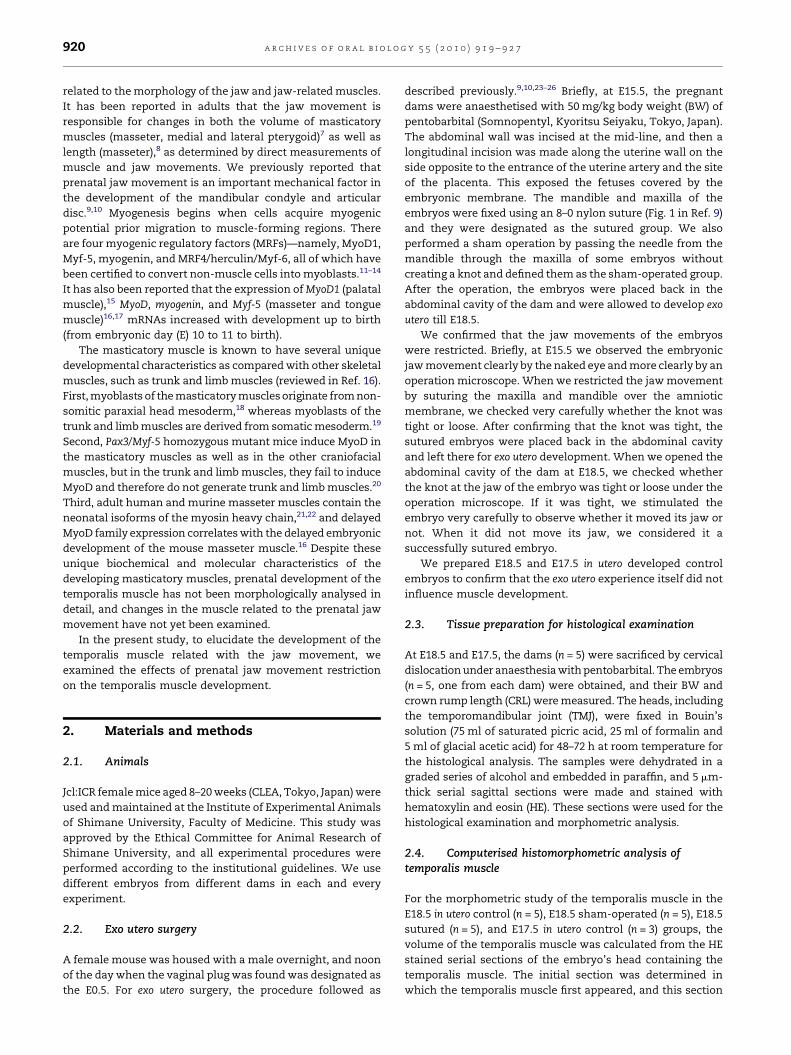
Fig. 4 – Representative electron micrographs of the temporalis muscle. In the cross sections, muscle fibres were condensed,
arranged in bundle, contained few fibroblasts in-between and there was less extracellular matrix/space in the muscles of
the E18.5 in utero control (A) and E18.5 sham-operated (B) groups. In the E17.5 in utero control (F) and E18.5 sutured (G)
groups muscle fibres density was low, a scattered arrangement was seen, and there were more fibroblasts, as well as more
extracellular matrix/space. In the longitudinal sections, myofibrils were more densely arranged in the E18.5 in utero control
(data not shown) and E18.5 sham-operated (C) groups, whereas the muscle fibres contained comparatively fewer myofibrils
in the E18.5 sutured group (H). (G and H) In the E18.5 sutured group, muscle cell nuclei were centrally situated, large in size,
a r c h i v e s o f o r a l b i o l o g y 5 5 ( 2 0 1 0 ) 9 1 9 – 9 2 7924

a r c h i v e s o f o r a l b i o l o g y 5 5 ( 2 0 1 0 ) 9 1 9 – 9 2 7 925
(Fig. 4H). The extracellular spaces were wider in the E18.5
sutured group than in the E18.5 in utero control (data not
shown) and E18.5 sham-operated group (Fig. 4A and B vs. G and
C vs. H) which corresponded to the light-microscopic
observation (Fig. 2). We also observed that in the E18.5 sutured
group, the nuclei of muscle cells were centrally localised, were
round in shape and large in size, and their electron density
was relatively low, and the muscle cells frequently contained
generally electron-dense inclusion bodies of unknown origin
(Fig. 4G–I). In contrast, in the E18.5 in utero control (data not
shown) and E18.5 sham-operated group, the muscle cell nuclei
were placed at the periphery of the cells, and the nuclei were
rather spindle-shaped and had a relatively high electron
density (Fig. 4A–C). Thus, the nuclei in the E18.5 sutured group
appeared comparatively immature. Very few (if any), and
much smaller inclusion bodies were found in the muscle cells
in the E18.5 in utero control (data not shown) and E18.5 sham-
operated group (Fig. 4A–E). Distances between the cell
membrane and the outermost myofibrils in the muscle cells
were generally wider in the E18.5 sutured (Fig. 4I) than in the
E18.5 in utero control (data not shown) and E18.5 sham-
operated (Fig. 4D) muscle cells. At higher magnification, the
mitochondria in the E18.5 sutured group were expanded in
volume and contained fewer cristae, and their electron density
was low (Fig. 4J), whereas in the E18.5 in utero control (data not
shown) and E18.5 sham-operated group, the mitochondria
were normal in terms of size and shape, contained more
numerous and parallel cristae, and generally exhibited higher
electron density (Fig. 4E).
We observed and counted the numbers of satellite cells to
further assess the differentiation status of the temporalis
muscle. The number of satellite cells in the E18.5 in utero
control group was significantly higher than that in the E17.5 in
utero control group, corresponding to the differentiation of the
muscle fibres. However, there were no significant differences
among the E18.5 in utero control, E18.5 sham-operated, and
E18.5 sutured groups (data not shown).
3.4. Quantitative real-time RT-PCR analysis of Myf-6
We used RT-PCR analysis to examine the relative expression of
Myf-6 in E18.5 sham-operated and E18.5 sutured groups,
expecting that the relative expression of Myf-6 might be lower
in the E18.5 sutured group than in the E18.5 sham-operated
group, based on the relatively immature morphology of the
temporalis muscle in the E18.5 sutured group. However, in this
respect, we found no significant differences between the two
groups (data not shown).
and their electron density was low, and muscle cells frequently
heads). In the E18.5 in utero control (data not shown) and E18.5
peripherally situated, spindle shaped, and exhibited greater ele
and much smaller, inclusion bodies. At higher magnification, w
membrane and the outer most myofibrils of the muscle cells we
in utero control (data not shown) and E18.5 sham-operated (D) gr
volume, contained fewer cristae, and lower electron density wa
the E18.5 in utero control (data not shown) and E18.5 sham-opera
and shape, and contained more and parallel cristae, and the elec
H), and 1 mm for (D, E, I and J).
4. Discussion
Our present study using the mouse exo utero development
system9,10,23–26 demonstrated that prenatal jaw movement
restriction affected the development of the temporalis muscle.
This restriction of jaw movement clearly led to histological
changes in the temporalis muscle in the E18.5 embryo in the
E18.5 sutured group; histomorphometric study in particular
revealed a significant decrease in the temporalis muscle
volume in the E18.5 sutured group. In addition, TEM observa-
tion further supported the relative immaturity of muscle fibres
in the E18.5 sutured group, and also revealed potential
abnormalities at the subcellular level in this group.
In humans, the masticatory muscles (i.e., temporalis and
masseter) play an important role in jaw movement during
opening and closing of the jaw.30,31 It has been reported that the
masticatory muscle movement and function influence cranio-
facial growth, as well as mandibular4 and articular disc32
growth. Mechanical stress plays a fundamental role in regulat-
ing cellular activities during tissue morphogenesis.33,34 As
regards influences on the growth and differentiation of
masticatory muscles, it has been shown that mechanical
stimulation is an important factor in muscle development; as
such stimulation directly acts on cells.35 The development of
masticatory muscles has been observed in terms of the
relationship between masticatory function and muscle proper-
ties in postnatal mice.36 It has also been suggested that delayed
MyoD family gene expression is related to delayed develop-
ment, differentiation, and maturation of the masticatory
muscles during the prenatal period in mice.16 The temporalis
muscle has been shown to play an important role in marked
functional changes in the oral cavity from lactation to
mastication, which contributes to oral function in cooperation
with other masticatory muscles.37 Intrauterine jaw movement
starts on E14 in mice,38 on E16 in rats39 and in humans
intrauterine mandibular movements have been detected at
midterm by ultrasonography.40 These findings suggest a
potential role for fetal jaw movements in TMJ development,
aswellas that of relatedmuscles.However, no investigation has
yet been undertaken in order to elucidate the precise effects of
prenatal jaw movement on the development of the temporalis
muscle. Our previous studies demonstrated that a restriction of
fetal movement of the TMJ in mice9,10 as well as that of the hip
joint in rats41,42 caused abnormal morphological changes in the
mandibular condyle and articular disc, and the femoral head,
respectively. Several studies have predicted that mechanical
forces are initial factors for tissue morphogenesis31,32 and
morphological changes in cartilaginous structures.43,44
contained inclusion bodies of various sizes (white arrow
sham-operated groups (A–C), the nuclei (arrows) were
ctron density, the muscle cells contained very few (if any),
ider gaps (double-ended arrows) between the cell
re observed in the E18.5 sutured group (I) than in the E18.5
oups. Mitochondria (black arrow heads) were expanded in
s observed in the E18.5 sutured group (I and J), whereas in
ted (E and G) groups, the mitochondria were of regular size
tron density was higher. Scale bars = 10 mm for (A–C and F–

a r c h i v e s o f o r a l b i o l o g y 5 5 ( 2 0 1 0 ) 9 1 9 – 9 2 7926
Our present histological observations suggested that the
development of the temporalis muscle was more delayed in
the E18.5 sutured group with respect of the timeline of
development than in the E18.5 in utero control and the E18.5
sham-operated groups. Developmental characteristics of the
muscle in the E18.5 sutured group were generally similar to
those of the E17.5 in utero control group. However, curly or
wavy muscle fibres were frequently observed in the E18.5
sutured group, whereas such muscle fibres were observed in
both neither E17.5, E18.5 in utero control nor E18.5 sham-
operated groups. Histomorphometric study revealed that the
muscle fibre volume of the temporalis muscle, but not that of
connective tissue, was decreased in the E18.5 sutured group. A
TEM study revealed that in the E18.5 sutured group, the
muscles tended to be less mature than those of the E18.5 in
utero control and the E18.5 sham-operated groups, although
some immature muscle fibres were also identified in those
groups. It has been reported that certain experimental
treatments of the masticatory muscles can initiate cellular
changes, particularly changes in intercellular and extracellu-
lar organelles, in muscle cells.45–47 In addition to obtaining
findings suggestive of the immaturity of muscle cells, we also
observed abnormalities in the mitochondria and inclusion
bodies of unknown origin inside the muscle cells in the E18.5
sutured group; such changes also appeared to be related to the
restriction of jaw movement. These findings, taken together,
suggested that jaw movement restriction might have delayed
muscle differentiation and progress to maturity, and might
possibly have had other abnormal effects on the E18.5 sutured
group.
We therefore examined whether or not myogenic regulatory
factors might have been affected by the jaw-restrictive
treatment. We selected Myf-6 from among a number of
candidate factors, because MRF4/Mfy-6 mRNA begins to be
expressed in the masticatory muscles of the mouse embryo
from E13 to 15 (i.e., at a later time point than that of other
factors), and its expression increases steeply until to the time of
birth,16,17 this time frame roughly corresponds to the period,
from E15.5 to 18.5, when we restricted fetal jaw movement by
the suturing technique described above. However, in the
present study, Myf-6 expression in the temporalis muscle did
not significantly differ between the E18.5 sutured and E18.5
sham-operated groups, suggesting that the genetic commit-
ment to myogenesis was not affected by the present procedure.
Satellite cells are a type of stem cells related to the
differentiation of muscle fibres from the late gestation.27,28 In
the present study, we used TEM analysis of muscle fibres to
observe and count the satellite cells. We found that the number
of satellite cells was significantly greater in the E18.5 in utero
control group than in the E17.5 in utero control group, which is
consistent with the finding that these cells started to appear as
undifferentiated stem cells at the end of the second wave of
myogenesis at E17.5.28 However, we found no significant
differences between the E18.5 in utero control, E18.5 sham-
operated andE18.5suturedgroup.Therefore, these findingsmay
correspond to the result regarding Myf-6 expression, although
our TEM observations were limited to a very small area.
Although no significant changes were observed at theMyf-6
level or in the frequency of satellite cells in the E18.5 sutured
group, the present morphological findings suggested that the
development of the temporalis muscle was delayed by
approximately 1 day. Certain abnormalities were observed
in the muscle fibres of the E18.5 sutured group, which suggests
that jaw movement restriction indeed induced developmental
differences from the E18.5 in utero control and the E18.5 sham-
operated groups.
In conclusion, the histological, histomorphometric analy-
ses and TEM findings from the present in vivo study using the
exo utero method suggested that the fetal jaw movement plays
a role in the proper development of the temporalis muscle in
the prenatal period.
Conflict on interest
None.
Acknowledgements
We are grateful to Ms. Yumiko Takeda for her help with the
histological preparation and to Mr. T. Yoneyama of the Central
Research Laboratories of Shimane Medical University, for his
technical assistance with the preparation of the TEM speci-
mens.
Funding: A grant KAKENHI from the Japanese Ministry of
Education, Science, Sports and Culture through the Faculty of
Medicine, Shimane University.
Competing interest: None declared.
Ethical approval: This study was approved by the Ethical
Committee for Animal Research of Shimane University, and
all experimental procedures were performed according to the
institutional guidelines.
r e f e r e n c e s
1. Zwijnenburg AJ, Kroon GW, Verbeeten Jr B, Naeije M. Jawmovement responses to electrical stimulation of differentparts of the human temporalis muscle. J Dent Res1996;75:1798–803.
2. Schumacher G-H. Funktionelle morphologie der kaumuskulatur.Jena: VEB Gustav Fischer Verlag; 1961.
3. Hannam AG, McMillan AS. Internal organization in thehuman jaw muscles. Crit Rev Oral Biol Med 1994;5:55–89.
4. Kiliaridis S. Masticatory muscle influence on craniofacialgrowth. Acta Odontol Scand 1995;53:196–202.
5. Kiliaridis S. The importance of masticatory muscle functionin dentofacial growth. Semin Orthod 2006;12:110–9.
6. Mao JJ, Nah HD. Growth and development: hereditary andmechanical modulations. Am J Orthod Dentofacial Orthop2004;125:676–89.
7. Goto TK, Tokumori K, Nakamura Y, Yahagi M, Yuasa K,Okamura K, et al. Volume changes in human masticatorymuscles between jaw closing and opening. J Dent Res2002;81:428–32.
8. Goto TK, Langenbach GE, Hannam AG. Length changes inthe human masseter muscle after jaw movement. Anat Rec2001;262:293–300.
9. Habib H, Hatta T, Udagawa J, Zhang L, Yoshimura Y, OtaniH. Fetal jaw movement affects condylar cartilagedevelopment. J Dent Res 2005;84:474–9.
a r c h i v e s o f o r a l b i o l o g y 5 5 ( 2 0 1 0 ) 9 1 9 – 9 2 7 927
10. Habib H, Hatta T, Rahman OIF, Yoshimura Y, Otani H. Fetaljaw movement affects development of articular disk in thetemporomandibular join. Congenit Anom 2007;47:53–7.
11. Davis RL, Weintraub H, Lassar AB. Expression of a singletransfected cDNA converts fibroblasts to myoblasts. Cell1987;51:987–1000.
12. Braun T, Buschhausen-Denker G, Bober E, Tannich E, ArnoldHH. A novel human muscle factor related to but distinctfrom MyoD1 induces myogenic conversion in 1OT1/2fibroblasts. EMBO J 1989;8:701–9.
13. Wright WE, Sassoon DA, Lin VK. Myogenin, a factorregulating myogenesis, has a domain homologous toMyoD1. Cell 1989;56:607–17.
14. Rhodes SJ, Konieczny SF. Identification of MRF4: a newmember of the muscle regulatory factor gene family. GenesDev 1989;3:2050–61.
15. Zhang L, Yoshimura Y, Hatta T, Otani H. Myogenicdetermination and differentiation of the mouse palatalmuscle in relation to the developing mandibular nerve. JDent Res 1999;78:1417–25.
16. Yamane A, Ohnuki Y, Saeki Y. Delayed embryonicdevelopment of mouse masseter muscle correlates withdelayed MyoD family expression. J Dent Res 2000;79:1933–6.
17. Yamane A, Takahashi K, Mayo M, Vo H, Shum L, Zeichner-David M. Induced expression of MyoD, myogenin anddesmin during myoblast differentiation in embryonicmouse tongue development. Arch Oral Biol 1998;43:407–16.
18. Noden DM, Marcucio R, Borycki A-G, Emerson Jr CP.Differentiation of avian craniofacial muscles: I. Patterns ofearly regulatory gene expression and myosin heavy chainsynthesis. Dev Dyn 1999;216:96–112.
19. Wachtler F, Christ B. The basic embryology of skeletalmuscle formation in vertebrates: the avian model. Semin DevBiol 1992;3:217–27.
20. Tajbakhsh S, Rocancourt D, Cossu G, Buckingham M.Redefining the genetic hierarchies controlling skeletalmyogenesis: Pax-3 and Myf-5 act upstream of MyoD. Cell1997;89:127–38.
21. D’Albis A, Janmot C, Bechet JJ. Comparison of myosins fromthe masseter muscle of adult rat, mouse and guinea-pig.Persistence of neonatal-type isoforms in the murinemuscle. Eur J Biochem 1986;156:291–6.
22. Soussi-Yanicostas N, Barbet JP, Laurent-Winter C, Barton P,Butler-Browne GS. Transition of myosin isozymes duringdevelopment of human masseter muscle. Persistence ofdevelopmental isoforms during postnatal stage. Development1990;108:239–49.
23. Hatta T, Naora H, Udagawa J, Tanaka O. In: Szabo Z, editor.Embryo manipulation after mid-gestation stages in mice, vol. III.San Francisco: Universal Medical Press; 1994. p. 95–8.
24. Hatta T, Moriyama K, Nakashima K, Taga T, Otani H. Therole of gp130 in cerebral cortical development: In vivofunctional analysis in a mouse exo utero system. J Neurosci2002;22:5516–24.
25. Hatta T, Matsumoto A, Otani H. Application of the mouseexo utero development system in the study of developmentalbiology and teratology. Congenit Anom 2004;44:2–8.
26. Yamada M, Hatta T, Otani H. Mouse exo utero developmentsystem: protocol and troubleshooting. Congenit Anom2008;48:183–7.
27. Fawcett DW, Bloom. Fawcett. A textbook of histology: musculartissue. 12th ed. New York: Champman and Hall; 1994. p. 268.
28. Messina G, Cossu G. The origin of embryonic and fetalmyoblasts: a role of Pax3 and Pax7. Genes Dev 2009;23:902–5.
29. Zhang H, Hatta T, Udagawa J, Moriyama K, Hashimoto R,Otani H. Induction of ectopic corticotropic tumor in mouseembryos by exo utero cell transplantation and its effects onthe fetal adrenal gland. Endocrinology 1998;139:3306–15.
30. Blanksma NG, Van Eijden TMGJ. Electromyographicheterogeneity in the human temporalis muscle. J Dent Res1990;69:1686–90.
31. Blanksma NG, Van Eijden TMGJ. Electromyographicheterogeneity in the human temporalis and massetermuscles during static biting, open\close excursions, andchewing. J Dent Res 1995;74:1318–27.
32. Sakurai M, Yonemitsu I, Muramoto T, Soma K. Effects ofmasticatory muscle force on temporomandibular joint discgrowth in rats. Arch Oral Biol 2007;52:1186–93.
33. Ingber D. Integrins as mechanochemical transducers. CurrOpin Cell Biol 1991;3:841–8.
34. Ruoslahti E. Stretching is good for a cell. Science1997;276:1345–6.
35. Abe S, Sakiyama K, Ide Y. Muscle plasticity: changes in oralfunction of muscle fiber characteristics. J Oral Biosci2007;49:219–23.
36. Abe S, Hiroki E, Iwanuma O, Sakiyama K, Shirakura Y,Hirose D, et al. Relationship between function ofmasticatory muscle in mouse and properties of musclefibers. Bull Tokyo Dent Coll 2008;49:53–8.
37. Suzuki K, Abe S, Kim HJ, Usami A, Iwanuma O, Okubo H,et al. Changes in the muscle fibre properties of the mousetemporal muscle after weaning. Anat Histol Embryol2007;36:103–6.
38. Tsunekawa N, Arata A, Obata K. Development ofspontaneous mouth/tongue movement and related neuralactivity, and their repression in fetal mice lacking glutamatedecarboxylase 67. Eur J Neurosci 2005;21:173–8.
39. Narayanan CH, Fox MW, Hamburger V. Prenataldevelopment of spontaneous and evoked activity in the rat(Rattus norvegicus albinus). Behaviour 1971;40:100–34.
40. Petrikovsky B, Kaplan G, Holsten N. Fetal yawning activity innormal and high-risk fetuses: a preliminary observation.Ultrasound Obstet Gynecol 1999;13:127–30.
41. Kihara I, Hashimoto R, Otani H. Effects of restrained fetalmovement on the development of the rat hip joint. CongenitAnom 1998;38:259–70.
42. Hashimoto R, Kihara I, Otani H. Perinatal development ofthe rat hip joint with restrained fetal movement. CongenitAnom 2002;42:135–42.
43. Tuominen M, Kantomaa T, Pirttiniemi P, Poikela A. Growthand type-II collagen expression in the glenoid fossa of thetemporomandibular joint during altered loading: a study inthe rat. Eur J Orthodont 1996;18:3–9.
44. Mao JJ, Rahemtulla F, Scott PG. Proteoglycan expression inthe rat temporomandibular joint in response to unilateralbite raise. J Dent Res 1998;77:1520–8.
45. Iyomasa MM, Issa JP, Siesser S, Regalo SC, Watanabe IS.Effect of unilateral extraction of molar teeth on suprahyoidmuscles: macroscopic and ultrastructural aspects. Micron2008;39:1111–8.
46. Iyomasa MM, Issa JP, Sosthines MC, Oliveira AM, Stuani MB,Motoyama AA, et al. Ultrastructural characteristics of thegerbil pterygoid medial muscle after experimental occlusalalteration. Micron 2009;40:206–11.
47. Iyomasa DM, Garavelo I, Iyomasa MM, Watanabe IS, Issa JP.Ultrastructural analysis of the low level laser therapy effectson the lesioned anterior tibial muscle in the Gerbil. Micron2009;40:413–8.
Copyright © 2022 FDOKUMEN